Attached files
| file | filename |
|---|---|
| EX-32.1 - EX-32.1 - ELECTRONICS FOR IMAGING INC | d457728dex321.htm |
| EX-31.2 - EX-31.2 - ELECTRONICS FOR IMAGING INC | d457728dex312.htm |
| EX-31.1 - EX-31.1 - ELECTRONICS FOR IMAGING INC | d457728dex311.htm |
| EX-23.1 - EX-23.1 - ELECTRONICS FOR IMAGING INC | d457728dex231.htm |
| EX-21 - EX-21 - ELECTRONICS FOR IMAGING INC | d457728dex21.htm |
| EX-12.1 - EX-12.1 - ELECTRONICS FOR IMAGING INC | d457728dex121.htm |
Table of Contents
UNITED STATES
SECURITIES AND EXCHANGE COMMISSION
Washington, D.C. 20549
FORM 10-K/A
Amendment No. 1
(Mark One)
| ☒ | ANNUAL REPORT PURSUANT TO SECTION 13 OR 15(d) OF THE SECURITIES EXCHANGE ACT OF 1934 |
For the fiscal year ended December 31, 2017
| ☐ | TRANSITION REPORT PURSUANT TO SECTION 13 OR 15(d) OF THE SECURITIES EXCHANGE ACT OF 1934 |
Commission File Number: 000-18805
ELECTRONICS FOR IMAGING, INC.
(Exact name of registrant as specified in its charter)
| Delaware | 94-3086355 | |
| (State or other Jurisdiction of incorporation or organization) |
(I.R.S. Employer Identification No.) |
6750 Dumbarton Circle, Fremont, CA 94555
(Address of principal executive offices) (Zip Code)
(650) 357-3500
(Registrant’s telephone number, including area code)
Securities registered pursuant to Section 12(b) of the Act:
| Title of Each Class |
Name of Exchange on which Registered | |
| Common Stock, $.01 Par Value | The NASDAQ Stock Market LLC |
Securities registered pursuant to Section 12(g) of the Act: None
Indicate by check mark if the registrant is a well-known seasoned issuer, as defined in Rule 405 of the Securities Act. Yes ☒ No ☐
Indicate by check mark if the registrant is not required to file reports pursuant to Section 13 or Section 15(d) of the Act. Yes ☐ No ☒
Indicate by check mark whether the registrant (1) has filed all reports required to be filed by Section 13 or 15(d) of the Securities Exchange Act of 1934 during the preceding 12 months (or for such shorter period that the registrant was required to file such reports) and (2) has been subject to such filing requirements for the past 90 days. Yes ☒ No ☐
Indicate by check mark whether the registrant has submitted electronically and posted on its corporate Web site, if any, every Interactive Data File required to be submitted and posted pursuant to Rule 405 of Regulation S-T (§ 232.405 of this chapter) during the preceding 12 months (or for such shorter period that the registrant was required to submit and post such files). Yes ☒ No ☐
Indicate by check mark if disclosure of delinquent filers pursuant to Item 405 of Regulation S-K (§ 229.405 of this chapter) is not contained herein, and will not be contained, to the best of registrant’s knowledge, in definitive proxy or information statements incorporated by reference in Part III of this Form 10-K or any amendment to this Form 10-K. ☐
Indicate by check mark whether the registrant is a large accelerated filer, an accelerated filer, a non-accelerated filer, or a smaller reporting company. See the definitions of “large accelerated filer”, “accelerated filer” and “smaller reporting company” in Rule 12b-2 of the Exchange Act.
| Large accelerated filer | ☒ | Accelerated filer | ☐ | |||||
| Non-accelerated filer | ☐ | Smaller reporting company | ☐ | |||||
| Emerging growth company | ☐ |
If an emerging growth company, indicate by check mark if the registrant has elected not to use the extended transition period for complying with any new or revised financial accounting standards provided pursuant to Section 13(a) of the Exchange Act. ☐
Indicate by check mark whether the registrant is a shell company (as defined in Rule 12b-2 of the Exchange Act). Yes ☐ No ☒
The aggregate market value of the voting and non-voting common stock held by non-affiliates computed by reference to the price at which the common stock was last sold on June 30, 2017 was $2,168,108,942 *
The number of shares outstanding of the registrant’s common stock, $.01 par value per share, as of February 28, 2018 was 45,007,892.
DOCUMENTS INCORPORATED BY REFERENCE
Portions of the definitive Proxy Statement to be delivered to stockholders in connection with the 2018 Annual Meeting of Stockholders are incorporated by reference into Part III hereof.
* Based on the last trade price of the registrant’s common stock reported on The NASDAQ Global Select Market on June 30, 2017, the last business day of the registrant’s second quarter of the 2017 fiscal year.
Table of Contents
EXPLANATORY NOTE
This Amendment No. 1 on Form 10-K/A (Amendment No. 1) is being filed to amend our Annual Report on Form 10-K for the fiscal year ended December 31, 2017 (Original Filing), filed with the U.S. Securities and Exchange Commission on March 16, 2018 (Original Filing Date). The sole purpose of this Amendment No. 1 is to amend the following:
| • | Item 7: Management’s Discussion and Analysis of Financial Condition and Results of Operations, in the explanation of the fluctuation in Industrial Inkjet Gross Profit on page 57 which inadvertently stated “gross profit increased to 35.5% (35.7% ex-currency using 2015 exchange rates) in 2016 from 34.2% in 2015” which should have stated “gross profit increased to 35.4% (35.6% ex-currency using 2015 exchange rates) in 2016 from 33.7% in 2015” |
| • | Item 7: Management’s Discussion and Analysis of Financial Condition and Results of Operations, Liquidity and Capital Resources, in the explanation of the fluctuation in Accounts Payable, Accrued and Other Liabilities, and Income Taxes Receivable/Payable, Net on page 86 which inadvertently stated working capital as $454.5 million, which should have been $456.7 million |
| • | Item 8. Financial Statements and Supplementary Data, specifically to revise the information included in the Consolidated Balance Sheet as of December 31, 2017 on page 97, which inadvertently stated “Total current liabilities” as $278,167, which should have been $283,167 (amounts are stated in thousands) |
| • | Note 4 to the Consolidated Financial Statements on page 130, which inadvertently stated “Contingent consideration—current” as $14,992, which should have been $14,922 (amounts are stated in thousands) |
Except as described above, no changes have been made to the Original Filing and this Amendment No. 1 does not modify, amend or update any of the financial or other information contained in the Original Filing. This Amendment No. 1 does not reflect events that may have occurred subsequent to the Original Filing Date.
Table of Contents
Table of Contents
FORWARD-LOOKING STATEMENTS
Certain of the information contained in this Annual Report on Form 10-K, including, without limitation, statements made under this Part I, Item 1, “Business,” Part II, Item 7, “Management’s Discussion and Analysis of Financial Condition and Results of Operations,” and Part II Item 7A, “Quantitative and Qualitative Disclosures about Market Risk,” which are not historical facts, may include “forward-looking statements” within the meaning of Section 27A of the Securities Act of 1933, as amended (“Securities Act”), and Section 21E of the Securities Exchange Act of 1934, as amended (“Exchange Act”), and is subject to risks and uncertainties and actual results or events may differ materially. When used herein, words such as “address,” “anticipate,” “believe,” “consider,” “continue,” “develop,” “estimate,” “expect,” “further,” “goal,” “intend,” “may,” “plan,” “potential,” “project,” “seek,” “should,” “target,” “will,” variations of such words, and similar expressions as they relate to the Company or its management are intended to identify such statements as “forward-looking statements.” Such statements reflect the current views of the Company and its management with respect to future events and are subject to certain risks, uncertainties, and assumptions. Should one or more of these risks or uncertainties materialize, or should underlying assumptions prove incorrect, the Company’s actual results, performance, or achievements could differ materially from the results expressed in, or implied by, these forward-looking statements. Important factors that could cause the Company’s actual results to differ materially from those included in the forward-looking statements made herein include, without limitation, those factors discussed in Item 1, “Business,” in Item 1A, “Risk Factors,” and elsewhere in this Annual Report on Form 10-K and in the Company’s other filings with the Securities and Exchange Commission (“SEC”), including the Company’s most recent Quarterly Report on Form 10-Q and Current Reports on Form 8-K, and any amendments thereto. The Company assumes no obligation to revise or update these forward-looking statements to reflect actual results, events, or changes in factors or assumptions affecting such forward-looking statements.
PART I
References to “EFI,” the “Company,” “we,” “us,” and “our” mean Electronics For Imaging, Inc. and its subsidiaries, unless the context indicates otherwise.
Filings
We file Annual Reports on Form 10-K, Quarterly Reports on Form 10-Q, Current Reports on Form 8-K, proxy statements, and other documents with the SEC under the Exchange Act. The public may read and copy any materials that we file with the SEC at the SEC’s Public Reference Room at Room 1580, 100 F Street, N.E., Washington, D.C. 20549. The public may obtain information on the operation of the Public Reference Room by calling the SEC at 1-800-SEC-0330. The SEC also maintains an internet website that contains reports, proxy statements, information statements, and other information regarding issuers, including EFI, that file electronically with the SEC. The public can obtain any documents that we file with the SEC at http://www.sec.gov.
We also make available free of charge through our internet website (http://www.efi.com) our Annual Reports on Form 10-K, Quarterly Reports on Form 10-Q, Current Reports on Form 8-K, proxy statements, and if applicable, amendments to those reports filed or furnished pursuant to the Exchange Act as soon as reasonably practicable after we electronically file such material with, or furnish it to, the SEC. None of the information on our website is incorporated by reference into our reports filed with, or furnished to, the SEC.
General
EFI was incorporated in Delaware in 1988 and commenced operations in 1989. Our initial public offering of common stock was completed in 1992. Our common stock is traded on The NASDAQ Global Select Market under the symbol EFII. Our corporate headquarters are located at 6750 Dumbarton Circle, Fremont, California 94555.
1
Table of Contents
We are a world leader in customer-centric digital printing innovation focused on the transformation of the printing, packaging, ceramic tile decoration, and textile industries from the use of traditional analog based printing to digital on-demand printing.
Our products include industrial super-wide and wide format display graphics, corrugated packaging and display, textile, and ceramic tile decoration digital inkjet printers that utilize our digital ink, industrial digital inkjet printer parts, and professional services; print production workflow, web-to-print, cross-media marketing, fashion design, and business process automation solutions; and color printing digital front ends (“DFEs”) creating an on-demand digital printing ecosystem. Our ink includes digital ultra-violet (“UV”) curable, light emitting diode (“LED”) curable, ceramic, water-based, thermoforming, and specialty ink, as well as a variety of textile ink including dye sublimation, pigmented, reactive dye, acid dye, pure disperse dye, water-based dispersed printing ink, and coatings. Our award-winning business process automation solutions are integrated from creation to print and are vertically integrated with our industrial digital inkjet printers and products produced by the leading production digital color page printer manufacturers that are driven by our Fiery DFEs.
Our product portfolio includes industrial super-wide and wide format digital inkjet products (“Industrial Inkjet”) including VUTEk display graphics super-wide and wide format, Nozomi corrugated packaging, Reggiani textile, Cretaprint ceramic tile decoration and building material industrial digital inkjet printers and ink; print production workflow, web-to-print, cross-media marketing, Optitex textile two-dimensional (“2D”) and three-dimensional (“3D”) computer aided fashion design (“CAD”) applications, and business process automation software (“Productivity Software”), which provides corporate printing, packaging, corrugated packaging, publishing, and mailing and fulfillment solutions for the printing and packaging industry; Fiery DFEs (“Fiery”), including the FreeFlow Print Server DFE, and Generation Digital print and fabric design software. Our integrated solutions and award-winning technologies are designed to automate print and business processes, streamline workflow, provide profitable value-added services, and produce accurate digital output.
Products and Services
Industrial Inkjet
Our Industrial Inkjet products address the high-growth industrial digital inkjet markets where significant conversion of production from analog to digital inkjet printing is occurring. The Industrial Inkjet operating segment consists of our VUTEk super-wide and wide format display graphics, Nozomi corrugated packaging and display, Reggiani textile, and Cretaprint ceramic tile decoration and building material industrial digital inkjet printers; digital UV curable, LED curable, ceramic, water-based, thermoforming, and specialty ink, as well as a variety of textile ink including dye sublimation, pigmented, reactive dye, acid dye, pure disperse dye, water-based dispersed printing ink, and coatings; digital inkjet printer parts; and professional services. Printing surfaces include paper, vinyl, corrugated, textile, glass, plastic, aluminum composite, ceramic tile, wood, and many other flexible and rigid substrates.
Customer Base. Our industry-leading VUTEk display graphics super-wide and wide format UV, LED, and thermoforming industrial digital inkjet printers and ink are used by commercial photo labs, large sign shops, graphic screen printers, specialty commercial printers, and digital and billboard graphics providers serving the out-of-home advertising and industrial specialty print segments by printing banners, signage, building wraps, flags, point of purchase and exhibition signage, backlit displays, fleet graphics, photo-quality graphics, art exhibits, customized architectural elements, billboards, thermoplastic decoration, and other large graphic displays. We launched the Nozomi single-pass industrial digital inkjet platform in 2017, which is sold to the corrugated, paper packaging, display graphics, and other markets. We sell EFI hybrid, roll to roll, and flatbed UV wide format graphics printers and ink to the industrial digital inkjet display graphics printer market. We sell Reggiani textile digital inkjet printers and textile ink to the display graphics soft signage market and textile contract printers serving major textile brand owners and fashion designers, the home furnishings market, as well as the global printed textile industry. We sell Cretaprint ceramic tile decoration and building material digital inkjet printers and ceramic digital ink to the ceramic tile and building materials manufacturing industries.
2
Table of Contents
Our VUTEk display graphics super-wide and wide format, and Nozomi corrugated packaging and display industrial digital inkjet printers incorporate “cool cure” LED printing technology. LED technology uses less heat than the traditional curing process resulting in increased uptime and greater reliability. Energy assessments conducted by the Fogra Graphic Technology Research Association have shown that our super-wide format printers with LED curing can reduce energy consumption by up to 82% when compared with printers that use conventional mercury arc lamps, as well as enabling printing on thinner and heat sensitive substrates.
Super-wide Format. We launched next generation printer models and new finishing modules of our high-speed, high-resolution super-wide format industrial digital inkjet printers in 2017, 2016, and 2015, as well as new super-wide format industrial digital inkjet roll-to-roll printers in 2017 and 2016.
Our HS series of printers are alternatives to analog presses used by high volume graphic producers and are based on pin & cure printing technology. We launched the HS125 Pro digital inkjet printer in 2016, which is a 3.2 meter hybrid flatbed/roll-fed printer that prints on flexible and rigid materials up to two inches thick utilizing UltraFX Technology that enhances the visual impact of the printed image and reduces the appearance of unwanted visual artifacts.
The GS/LX family of super-wide format industrial digital inkjet printers offers the highest quality in a super-wide format. The LX models incorporate LED technology. We launched the 3.2 meter hybrid flatbed/roll-to-roll LX3 Pro digital inkjet printer in 2015, which prints on flexible and rigid materials up to two inches thick utilizing UltraFX Technology. The LX3 is well suited for the point-of-purchase printing environment. Our GS3250LX and GS2000LX offer smaller drop sizes and more precise control.
The H/QS family of super-wide format industrial digital inkjet printers offers high quality and productivity for the mid-range market in a super-wide format. The two meter H2000 Pro printer provides a more affordable entry point into high-end production printing for signage and graphics companies with the option to add features as their business grows. H2000 Pro users can run flexible, rigid, and sheet media up to two inches thick.
VUTEk super-wide format industrial digital inkjet roll-to-roll printers include advanced material handling features such as in-line cutting and slitting. In 2017, we launched the VUTEk 3r and 5r LED roll-to-roll printers, which print at speeds up to 4,896 square feet per hour, with resolutions up to 1,200 dpi, and incorporating 7-picoliter Ultra-Drop technology. In 2016, we launched the Quantum LXr 3.5 and 5.2 meter LED roll-to-roll printer, which is an alternative to latex printers featuring 7-picoliter imaging and resolution up to 1,200 dpi.
Corrugated Packaging and Display. In 2017, we launched the Nozomi C18000 single-pass industrial digital inkjet platform. The Nozomi C18000 is a 1.8 meter, single pass, high speed LED industrial digital inkjet corrugated packaging press for the corrugated, paper packaging, display printing, and other markets that prints up to 75 linear meters (246 linear feet) per minute.
Label Printing. On November 1, 2017 (“Effective Date”) we entered into a Support Services and License Agreement (“Agreement”) with Xeikon, N.V. (“Xeikon”), which is a division of the Flint Group headquartered in Luxembourg. Pursuant to the Agreement, we provided Xeikon access to the Jetrion customer list, which enabled Xeikon to sell Jetrion printers and re-sell our UV and LED label ink. Xeikon will purchase UV and LED label ink exclusively from us and resell to both our current customer base as well as new Xeikon inkjet customers. We will not sell Jetrion printers for four years after the Effective Date.
Wide Format. Our EFI hybrid flatbed/roll-to-roll and dedicated roll-to-roll entry level, overflow, and specialty production UV wide format digital inkjet printers are developed, manufactured, and marketed to the entry-level and mid-range industrial digital inkjet printer market. In 2017, we launched our wide format Pro 24f flatbed and Pro 16h LED hybrid roll-to-roll / flatbed printers. The Pro 24f LED flatbed wide format printer utilizes a moving gantry and a vacuum system to hold media stationary on a flat surface. This wide format printer has a 32 square-foot bed, prints in four colors plus white ink, and is appropriate for specialty applications up to 2 inches thick.
3
Table of Contents
The Pro 16h LED hybrid wide format printer prints up to 29 square meters per hour in four colors plus white ink up to 2 inches thick We launched our wide format H1625 SD 1.6 meter hybrid roll-to-roll /flatbed printer in 2015. The H1625 SD utilizes thermoforming ink, which enables sign makers and printing companies to print directly onto thermoplastic sheet materials, which can then be formed into deep draw, high elongation parts while retaining hue and opacity. We launched our wide format H1625 RS printer in 2015, which prints 1.6 meter widths directly to 3M reflective media in roll, sheeted, and mounted to rigid forms. The H1625 includes LED technology enabling printing on a broad range of substrates, including media that cannot withstand the high-heat drying or curing methods used in other inkjet platforms.
Textile. Reggiani industrial digital inkjet textile printers address the full scope of advanced textile printing with versatile printers suitable for pigmented, reactive dye, acid dye, and water-based dispersed printing ink. Reggiani is at the forefront of digital printing as an alternative to either analog printing or single color (dyed) garments. Reggiani provides an overall solution for the entire textile printing process from yarn treatment to fabric printing and finishing for a wide variety of substrates and applications (fashion, home textile, sportswear, signage, flooring, automotive, and outdoor).
A significant driver for the adoption of digital textile printing is the growth of “fast fashion,” which is a term used by fashion retailers to express the need for designs to move quickly from the catwalk to the retailer to capture current fashion trends. The digital textile printing market has also benefitted from sports apparel with short run production quantities, closer geographic proximity to end-use markets, and environmental awareness.
Reggiani industrial digital inkjet textile printing systems use water-based ink and advanced streamlined automation that provide a total solution for textile businesses. The TOP digital inkjet textile printer is a fast throughput machine that can be used with reactive, acid, disperse, dye sublimation, and pigmented ink. The Essetex 2 meter wide washing box is the ideal system for knitted and light fabrics, particularly where print washing is beneficial for delicate textiles and for post-dyeing of printed cloth. The NEXT printer prints on fabrics and paper using the same ink set with a 1.8 meter beltless digital printing system and offers simplified material handling, a compact footprint, and a lower acquisition cost, making it an ideal entry-level textile printing production device.
In 2017, we launched the 5.2 meter VUTEk FabriVU printer, which runs at speeds up to 455 square meters per hour in resolutions up to 1,200 dpi. In 2017, we also launched the Flexy and Vogue industrial digital textile printers. The 1.8 meter Flexy printer offers our Dynaplast sticky belt technology, printing with up to 2,400 dpi resolution with a speed of 400 square meters per hour. The Vogue printer includes new printing software, integrated environmental sensors and a new printing server, with 16 print heads, up to 2,400 dpi resolution, and printing up to 325 square meters per hour. In 2016, we launched the 1.8 and 3.4 meter VUTEk FabriVU super-wide format industrial digital inkjet soft signage printers, which utilize water-based sublimation ink and are manufactured in our Reggiani facility. The 1.8 and 3.4 meter FabriVU printers offer print speeds up to 464 square meters per hour at 600 dpi and resolution up to 2,400 dpi and utilize water-based sublimation ink.
Ceramic Tile Decoration. Our Cretaprint ceramic tile decoration digital inkjet printers are utilized by the ceramic tile and building material manufacturing industries. The ceramic tile decoration market is transitioning from analog to digital inkjet printing technology.
In 2017, we launched the Cretaprint C4 Twin, featuring a dual print head approach with up to four double print bars with widths up to 0.7 meters. We also launched the Cretaprint P4 in 2017 featuring up to 12 print bars, 1.4 meter print widths, and resolution of 360 dpi. We launched the Cretaprint D4 in 2016, which features up to 12 print bars, and gives users the ability to incorporate a full range of ceramic ink and digital print effects. We also launched the Cretaprint M4 and M4 SOL printer platforms in 2016, which allow customers to print on larger tile sizes up to 1.2 meters wide and offers enhanced imaging quality with variable-drop grayscale imaging. The Cretaprint M4 SOL is a soluble salt inkjet printer.
4
Table of Contents
We launched the Cretaprint C4, which is our next generation ceramic tile decoration digital inkjet printer, in 2015. Electronics and ink systems were upgraded to maximize accuracy in a broad range of production conditions. The Cretaprint C4 printer allows the use of different print heads and digital applications on the same machine.
In 2017, we launched the Cubik printer for the building materials industry, offering up to 8 print bars, with a printing width up to 1.8 meters and a print speed up to 75 linear m/min. The Cubik printer can apply a variety of decoration effects to building materials, supporting both short run and variable prints as well as high volume runs.
Ink. Our ink provides a recurring revenue stream generated from sales to our existing customer base of installed printers.
VUTEk printers primarily use digital UV and LED curable ink, although our solvent ink printers remain in use in the field. We were first to market with digital UV curable ink incorporating “cool cure” LED technology for use in high-end production super-wide, wide format, and corrugated packaging and display digital inkjet printing systems. We sell a variety of third party branded textile ink to users of our textile digital inkjet printers, including dye sublimation, pigmented, reactive dye, acid dye, water-based dispersed printing ink, and coatings. We launched our internal formulation of our reactive dye ink in 2016. In 2016, we introduced our soluble salt-based ceramic digital ink formulation and we introduced AquaEndure acqueous ink, which is a water-based inkjet ink that will be used across many of our printers in the future.
We acquired Rialco Limited (“Rialco”) in 2016, which supplies dye powders and color products for the textile, digital print, and other decorating industries. Rialco’s pure disperse dyes are particularly important in the manufacture of high-quality dye sublimation inkjet ink for textile applications, which is a key growth area in the global migration from analog to digital print. Rialco’s technical and commercial capabilities benefit the Industrial Inkjet operating segment in the sourcing, specification, and purification of high quality dyes and expand our research, development, and innovation base to develop ink for the signage, ceramic, and packaging markets.
5
Table of Contents
Our industrial digital inkjet printers and their related features are as follows:
| Printer Type |
Models |
Capabilities |
Application Examples | |||
| Nozomi | EFI Nozomi C18000 | High-quality, high-speed digital LED printing up to 75 linear meters per minute on substrates up to 1.8 meters wide |
Corrugated packaging and merchandise display printing | |||
| VUTEk super-wide format |
HS, GS/LX, H/QS, and FabriVU Series printers EFI and 3M(R) co-branded Digital UV and LED, AquaEndure aqueous, and thermoforming UV ink |
Printing widths of 2 to 5 meters; up to two inch thickness; 6, 7, and 8 colors, plus white and greyscale; up to 2400 dpi; flexible and rigid substrates; 1.8-meter and 3.4-meter wide aqueous-based soft signage printer models with speeds up to 500 square meters per hour; UV curable, LED “cool cure,” aqueous, and thermoforming digital UV inks | Super-wide format banners, signage, building wraps, flags, point of purchase and exhibition signage, backlit displays, fleet graphics, photo-quality graphics, art exhibits, customized architectural elements, billboards, and thermoplastic decoration. | |||
| VUTEk super-wide roll-to-roll |
VUTEk 3r and 5r, Quantum series, Q series, and Flex series printers Quantum LED curable ink Matan UV curable ink MatanFlex stretchable ink |
Speeds up to 455 square meters per hour Printing widths of 3 to 5 meters; up to two inch thickness; 4, 7, and 8 colors, plus white and greyscale; up to 1200 dpi; flexible and rigid substrates; UV curable and LED “cool cure” ink | Fleet graphics, traffic signage, labels, tags, decals, membranes, license plates, and sign printing | |||
| EFI wide format |
EFI Pro hybrid and flatbed EFI H1625 LED 3M™ ink SD thermoforming ink | Speeds up to 107 square meters per hour (flatbed) and 91 square meters per hour (hybrid), up to 1200 dpi, 4 colors plus white and greyscale, up to 2 inch thickness, flexible and rigid substrates, UV curable, and LED “cool cure” ink | Wide format indoor and outdoor graphics with photographic image quality. Entry-level and mid-range markets. Overflow and specialty markets | |||
| Reggiani textile | Reggiani textile printers Dye sublimation, pigmented, reactive dye, acid dye, and water-based dispersed printing ink |
Speeds up to 325 square meters per hour Substrates from ultra-light to heavy, up to 2400 dpi; dye sublimation, pigmented, reactive dye, acid dye, and water-based dispersed printing ink | Contract printers serving major textile brand owners and fashion designers Textile soft signage market Global printed textile industry | |||
| Cretaprint ceramic tile decoration |
Cretaprint C4 and C4 twin; Cretaprint P4 and D4; Cretaprint M4 and SOL; Cretaprint ink; and |
Single chassis accomodates up to 8 print bars.1,000 customizable settings controlling printer widths up to 1.4 meters, speed, direction, and discharge. | Ceramic tile industry Construction materials industry | |||
| Cubik building materials |
Cubik: printing width up to 1.8 meters print speed up to 75 linear m/min, up to 8 printing bars |
|||||
6
Table of Contents
Productivity Software
To provide our customers with solutions to manage and streamline their printing operations, we have developed technology that enhances printing workflow and makes printing operations more powerful, productive, cost-effective, and easier to manage. Most of our software solutions have been developed with the express goal of automating print processes and streamlining workflow via open, integrated, and interoperable products, services, and solutions.
The Productivity Software operating segment consists of a complete software suite that enables efficient and automated end-to-end business and production workflows for the print and packaging industry. This Productivity Suite also provides tools to enable revenue growth, efficient scheduling, and optimization of processes, equipment, and personnel. Customers are provided the financial and technical flexibility to deploy locally within their business or to be hosted in the cloud. The Productivity Suite addresses all segments of the print industry and consists of the: (i) Packaging Suite, with Radius at its core, for tag & label, cartons, and flexible packaging businesses; (ii) Corrugated Packaging Suite, with CTI at its core, for corrugated packaging businesses, including corrugated control capability using EFI Escada; (iii) Enterprise Commercial Print Suite with Monarch at its core, for enterprise print businesses; (iv) Publication Print Suite, with Monarch or Technique at its core, for publication print businesses; (v) Midmarket Print Suite, with Pace at its core, for medium size print businesses; (vi) Quick Print Suite, with PrintSmith Vision and essential capabilities of Digital StoreFront at its core, for small printers and in-plant sites; and (vii) Value Added Products, available with the suite and standalone, such as web-to-print, e-commerce, cross media marketing, warehousing, fulfillment, shop floor data collection, and shipping to reduce costs, increase profits, and offer new products and services to their existing and future customers. We also market Optitex fashion CAD software, which facilitates fast fashion increased efficiency in the textile and fashion industries.
Customer Base. We sell the Packaging Suite to the label, cartons, and flexible packaging industry; the Corrugated Packaging Suite to the corrugated packaging industry; the Enterprise Commercial Print Suite to large and multi-national commercial print businesses; the Publication Print Suite to publication and direct mail print businesses; the Midmarket Print Suite to medium size commercial print businesses, display graphics providers, and government printing operations; the Quick Print Suite to small printers and in-plant printing operations; Value Added Products including Digital StoreFront and DirectSmile to customers desiring e-commerce, web-to-print, and cross-media marketing solutions; and Optitex to the leading fashion brands and manufacturers.
Our enterprise resource planning and collaborative supply chain business process automation software solutions are designed to enable printers and print buyers to improve productivity and customer service while reducing costs. Web-to-print applications for print buyers and print producers facilitate web-based collaboration across the print supply chain. Customers recognize that business process automation is essential to improving their business practices and profitability. We are focused on making our business process automation solutions the global industry standard. We provide consulting and support services, as well as warranty support for our software products. We typically sell an annual full-service maintenance agreement with each license that provides warranty protection from date of shipment. The sale and renewal of annual maintenance agreements provide a recurring revenue stream.
The acquisition of Escada Innovations Limited and Escada Systems, Inc. (collectively “Escada”) provides corrugator control systems for the corrugated packaging market, which provide comprehensive control and traceability for the entire corrugation process. The acquisition of Optitex Ltd. (“Optitex”) in 2016 expanded our presence in the digital inkjet textile printing market through the synergy of Optitex technology with the Reggiani digital inkjet textile printer business. Optitex markets integrated 2D and 3D CAD software that shortens the design cycle, reduces our customers’ costs, and accelerates the adoption of fast fashion.
New Version Releases and Product Offerings. Integration among our software offerings is achieved through the end-to-end automation including certified workflows and synchronized releases across multiple products
7
Table of Contents
afforded by our Productivity Suite consisting of the Packaging Suite, Corrugated Packaging Suite, Enterprise Commercial Print Suite, Publication Print Suite, Midmarket Print Suite, Quick Print Suite, and Value Added Products. Integration of our software product offerings provides:
| • | Out-of-the-box, end-to-end optimized workflows; |
| • | Certified integration and automation; |
| • | Global visibility that makes effective and proactive decision making possible; and |
| • | Solid modular, flexible, and scalable software foundation supporting product and customer diversification. |
New versions have been released for each of our significant software components and new product offerings have resulted from strategic business acquisitions. New product offerings that have resulted from strategic business acquisitions are described under “Growth and Expansion Strategies” below.
The Packaging Suite includes 22 certified workflows that provide unprecedented levels of business and production automation geared toward folding carton, tag and label, and flexible package converting environments. Enhancements integrate Radius software, intelligent estimating and planning with iQuote software, automated planning optimization with Metrix software, and key third party
software such as the Esko Automation Engine. The Corrugated Packaging Suite was enhanced with the acquisition of Escada Innovations Limited and Escada Systems, Inc., (collectively, “Escada”) in 2017, a leading provider of corrugator control systems for the corrugated packaging market. The Enterprise Commercial Print Suite includes improvements in inventory and purchasing, support for Digital StoreFront web-to-print services, stronger customer relationship management tools including the ability to add attachments to forms and expanded reporting capabilities and extended capabilities in dynamic estimating and planning. The Midmarket Print Suite includes web-to-print, cross-media marketing, estimating, scheduling, accounting, and fulfillment applications. Enhancements include easier access to quotes, improved estimating, and more advanced filtering tools to drive efficiency in job estimating and production. Product-specific applications unique to the super-wide format print space, such as fleet and vehicle wraps, point-of-purchase signage and outdoor graphics. The Quick Print Suite includes a cloud-based platform for in-plant and quick print operations to reduce the customer deployment and maintenance burden. The Optitex Collaborate Application was released in early 2017 and is driven by cloud-based textile design technology that enables instant sharing among pattern makers, designers, and print teams for faster and more accurate apparel prototyping.
8
Table of Contents
Our primary software offerings include:
| Software Suite |
Description |
Users | ||
| Packaging Suite: with Radius at its core |
Business and production workflows for tag & label, cartons, and flexible packaging companies | All users with a production facility assocated with the sales, item specification, production, material purchasing, billing and shipping of packaging related products | ||
| Corrugated Packaging Suite: with CTI at its core, including corrugated control capability using EFI Escada |
Business and production workflows for corrugated board and packaging manufacturers | Administration, sales, production and logistics employees producing corrugated sheets and/or corrugated boxes | ||
| Enterprise Commercial Print Suite; with Monarch at its core |
Business and production workflows for Enterprise commercial print businesses, (offset, digital, large format, direct mail, specialty printing and shipping / logistics companies) | Front office sales, management and finance and shop floor production, inventory controllers, mailing and logistics employees involved in the production of various commercial print products | ||
| Publication Print Suite: with Monarch or Technique at its core |
Business and production workflows for Publication Print companies (books and periodicals) | Sales, contract administrators, production planners and shop floor personnel associated production of books, catalogs, magazines, and peridicals | ||
| Midmarket Print Suite: with Pace at its core |
Business and production workflows for mid size Print companies (including commercial, digital, display graphics, in-plant, and print for pay printing companies; government printing operations) | Business & Production personnel, e.g., sales, estimators, customer service, production schedulers, finance and floor personnel & logistics | ||
| Quick Print Suite: with PrintSmith Vision and essential capabilities of Digital StoreFront at its core |
Hosted and modular, web-enabled digital printing and business management | Owners, managers, sales, estimators, customer service and accounting | ||
| Value Added Products | Web-to-print, e-commerce, cross media marketing, imposition solutions, warehousing, fulfillment, shop floor data collection, and logistics | Marketing professionals, production planners, production floor staff, warehouse and inventory managers, shipping and logistics | ||
| Optitex Textile 3D Design Software | Development and production software that builds patterns, visualize in 3D, streamlines marker making and cut order workflow, and cloud-based applications for show case design | Leading fashion brands, fashion retailers, and manufacturers in commercial and apparel industries | ||
9
Table of Contents
Fiery
Our Fiery brand consists of Fiery and the FreeFlow print server business (“FFPS”), which was recently acquired from Xerox Corporation (“Xerox”) that transform digital copiers and printers into high performance networked printing devices for the office, commercial, and industrial printing markets. Once networked, Fiery-powered printers and copiers can be shared across workgroups, departments, the enterprise, and the internet to quickly and economically produce high-quality color products. We have direct relationships with several leading printer manufacturers. We work closely together to design, develop, and integrate Fiery DFE and software technology to maximize the capability of each print engine. The printer manufacturers act as distributors and sell Fiery products to end customers through reseller channels. End customer and reseller channel preference for the Fiery DFE and software solutions drives demand for Fiery products through the printer manufacturers.
Fiery products are comprised of (i) stand-alone DFEs connected to digital printers, copiers, and other peripheral devices, (ii) embedded DFEs and design-licensed solutions used in digital copiers and multi-functional devices, (iii) optional software integrated into our DFE solutions such as Fiery Central and Graphics Arts Package, (iv) Fiery Self Serve, our self-service and payment solution, and (v) stand-alone software-based solutions such as our proofing, textile, and scanning solutions.
Fiery and FFPS DFEs. The Fiery NX Pro was launched in 2017, providing faster views of job status and easier device management. The Fiery FS300 Pro was launched in 2017, enabling enhanced functionality with throughput up to 2,400 ppm. The latest Fiery proServer features a highly advanced FAST (Fiery Accelerated System Technology) HyperRIP engine for quick file processing on super-wide hybrid, flatbed, and roll-to-roll printers. The new FS300 features supported by the Fiery NX Premium hardware station include the ability to over-print up to 127 spot colors per page. The Fiery XB DFE was released in 2016 incorporating a scalable high-volume blade server technology for high speed inkjet presses processing at 100 meters per minute of 1.8 meter wide corrugated boards or in excess of 13,000 sheets per hour. The Fiery FS200 Pro DFE was released in 2015 incorporating higher speed processing, expanded color offerings, shop automation, and connectivity.
Fiery XF 6.3 is a DFE and color management workflow for super-wide and wide format printing and proofing, featuring real WYSIWYG tiling preview, the Fiery Dynamic Smoothing function, and the Fogra Process Standard Digital. The Fogra Graphic Technology Research Association establishes process standards for the digital printing industry. Fiery proServer is a DFE and color management workflow for the super-wide format and ceramic tile decoration digital inkjet printer market.
Fiery proServer 7.0 was released in 2015 and processes complex vector data up to seven times faster than its predecessor. Fiery proServer is compatible with 540 super-wide, wide format, and ceramic printers from numerous major manufacturers.
In 2017, we acquired certain assets comprising the FFPS business from Xerox. The FFPS business manufactures and markets the FFPS DFE, which previously competed with our Fiery DFEs and is now included in our Fiery operating segment.
Software Solutions. Fiery Command WorkStation 6.0 job management interface software was released in 2017 featuring automated job presets, faster job searching capabilities, new user interface, advanced tools for printing multi-bank and bleed-edge tabbed documents, and the Home integrated interface, which is a new feature that provides at-a-glance status information for all connected Fiery servers and a snapshot of key print production statistics.
Fiery Workflow Suite is an integrated set of Fiery products, including Fiery Central, Fiery JobFlow, and Fiery JobMaster, among others, to deliver a fully integrated workflow from job submission and business management to scheduling, preparation, and production.
Fiery Navigator is a cloud-based digital printing business intelligence tool for digital production presses that was launched in 2016. Fiery Navigator provides printers with more insight into their production data to optimize
10
Table of Contents
resource allocation, ensure compliance with operating procedures, and make equipment decisions by capturing key operational data points and displaying production analytics in a comprehensive, customizable dashboard.
Fiery Self Serve. is a leading provider of self-service and payment solutions that allows service providers to offer access to business machines including printers, copiers, computers/internet access, fax machines, and photo printing kiosks from mobile phones, iPad®, USB drives, and cloud accounts such as Google Drive TM Dropbox. The M500 is a flexible and scalable system, which addresses demands for printing from any mobile device as well as from popular cloud storage services, and accepts credit cards, campus cards, and cash cards at the device, thereby eliminating the need for coin-operated machines. The M500 integrates with campus identification card systems and campus card solutions such as CBORD, Odyssey, and Blackboard. Self-Serve AdminCentral is a cloud-based management system for the M500 product.
Generation Digital. The 2017 acquisition of Generation Digital strengthens our fast fashion offerings, with design software for the textile and fashion industries. The Generation Digital textile design workflow combines with our Fiery textile DFEs and Reggiani digital textile printers linking textile design and production,
Our DFE platforms, primary printer manufacturer customers, and end user environments are as follows:
| Platform |
Printer Manufacturers or Customers |
User Environments | ||
| Fiery and FFPS external DFEs | Canon, Fuji Xerox, Konica Minolta, Kyocera Document Solutions, Landa, Ricoh, RISO, Sharp, Toshiba, Xerox | Print for pay, corporate reprographic departments, graphic arts, advertising agencies, and transactional & commercial printers | ||
| Fiery embedded DFEs and design-licensed solutions | Canon, Epson, Fuji Xerox, Intec, Kodak, Konica Minolta, Kyocera Document Solutions, Oki Data, Ricoh, Sharp, Toshiba, Xerox | Office, print for pay, and quick turnaround printers | ||
| Fiery Central, MicroPress Fiery Navigator Fiery Workflow Suite | Canon, Konica Minolta, Kyocera Document Solutions, Ricoh, Sharp, Xerox | Corporate reprographic departments, commercial printers, and production workflow solutions | ||
| Fiery Self Serve | Canon, FedEx Office, Konica Minolta, Ricoh, Staples, Xerox | ExpressPay self-service and payment solutions for retail copy and print stores, hotel business centers, college campuses, and convention centers | ||
| Production Inkjet and Proofing software: ColorProof XF, Pro, Fiery XF, Fiery proServer, textile | Digital color proofing and inkjet production print solutions offering fast, flexible workflow, power, and expandability; creation and design of prints, patterns, and color palettes | Digital, commercial and hybrid printers, prepress providers, publishers, creative agencies and photographers, ceramic tile, decoration, and super-wide & wide format print providers; fashion and textile designers | ||
Sales, Marketing, and Distribution
We have assembled, internally and through acquisitions, an experienced team of technical support, sales, and marketing personnel with backgrounds in color reproduction, digital pre-press, image processing, business process automation systems, networking, and software and hardware engineering, as well as market knowledge of enterprise printing, packaging, graphic arts, fulfillment systems, cross-media marketing, imposition solutions, textile printing, fashion design, ceramic tile decoration, building materials and nonconventional materials, and commercial printing. We expect to continue to expand the scope and sophistication of our products and gain access to new markets and channels of distribution by applying our expertise in these areas.
11
Table of Contents
Industrial Inkjet
Our Industrial Inkjet products are sold primarily through our direct sales force augmented by some select distributors. Any interruption of either of these distribution channels could negatively impact us in the future. See Item 1A: Risk Factors—We rely on our distribution channels to ensure sales growth.
We entered the corrugated inkjet printer market with the introduction of our Nozomi digital inkjet corrugated printer in 2017. We are leveraging our existing display graphics sales team together with dedicated packaging specialists and participation in corrugated packaging trade shows in most major markets around the globe. The market for corrugated digital printers is new and our team will be building market demand for this approach as well as selling our printers. See Item 1A: Risk Factors—If we fail to continue to introduce new products that achieve market acceptance on a timely basis, we will not be able to compete effectively and we will be unable to increase or maintain net revenue and gross margins.
Textile digital printing is an alternative to either analog printing or dyed garments. Widespread adoption of digital textile printing depends on the willingness and ability of businesses in the printed textile industry to replace their existing analog printing systems and dyed garments with digital printing systems.
The adoption of digital textile printing is dependent to some extent on the growth of “fast fashion,” and has also benefitted from sports apparel with shorter production runs, closer geographic proximity to end-use markets, and environmental awareness. A key element of our inkjet textile printing growth strategy is to market digital inkjet printing systems to contract printers that serve major textile brand owners and fashion designers.
The ceramic tile industry has undergone a shift from southern Europe (e.g., Spain and Italy) to the emerging markets of China, India, Brazil, and Indonesia. As a result, we operate a Cretaprint sales and support center in Foshan, Guangdong, China, in addition to our facilities in Spain. Foshan is home to the largest concentration of ceramic tile manufacturers in China.
We promote our Industrial Inkjet products through public relations, direct mail, advertising, promotional material, trade shows, and ongoing customer communication programs. The majority of sales leads for our inkjet printer sales are generated from trade shows. There were approximately 1,300 attendees from 37 countries at our 2017 EFI Connect User Conference, which generates leads for the Industrial Inkjet and Productivity Software operating segments and generates end user demand for the Fiery segment. We promoted our Cretaprint products, including the new P4 and C4 Twin, at the 2017 Ceramics China tradeshow in Guangzhou.
In 2016, we entered into an agreement with a third party that facilitates our European customers’ equipment financing. The agreement provides customers with new leasing opportunities for EFI’s industrial digital inkjet printers in many European countries.
Productivity Software
Our enterprise resource planning and collaborative supply chain business process automation software solutions within our Productivity Software portfolio are primarily sold directly to end users by our direct sales force. An additional distribution channel for our Productivity Software products is through sales to a mix of distribution channels consisting of authorized distributors, dealers, and resellers who in turn sell the software solutions to end users either stand-alone or bundled with other solutions they offer.
We have distribution agreements with some customers, including Canon, Konica Minolta, Ricoh, Xerox, Esko, and Veritiv (formerly xpedx). There are a number of small private resellers of our business process automation software in different geographic regions throughout the world where a direct sales force is not cost-effective.
We have established a new e-commerce platform specifically for fabric soft signage production operations and ink. The on-line ordering technology offers a new level of turnkey flexibility for increasingly popular fabric graphics applications, including outdoor, trade show, and point-of-purchase displays.
12
Table of Contents
We sell Optitex directly to the leading fashion brands and manufacturers through a direct sales force and distribution channels consisting of authorized distributors, dealers, and resellers.
Fiery
The primary distribution channel for our Fiery products is through our direct relationships with several leading printer manufacturers. We work closely together to design, develop, and integrate Fiery DFE and software technology to maximize the capability of each print engine. The printer manufacturers act as distributors and sell Fiery products to end customers through reseller channels. End customer and reseller channel preference for our Fiery DFE and software solutions drives demand for Fiery products through the printer manufacturers.
Although end customer and reseller channel preference for Fiery products drives demand, most Fiery revenue relies on these significant printer manufacturers/distributors to integrate Fiery technology into the design and development of their print engine as described above. See Item 1A: Risk Factors—We do not typically have long-term purchase commitments with the printer manufacturer customers that purchase our Fiery DFE and software solutions. They have in the past reduced or ceased, and could at any time in the future reduce or cease, to purchase products from us, thereby harming our operating results and business. Our relationships with the leading printer and copier industry companies are among our most important assets. We have established relationships with leading printer and copier industry companies, including Canon, Seiko Epson, Fuji Xerox, Kodak, Konica Minolta, Kyocera Document Solutions, Landa, OKI Data, Ricoh, Riso Global Network, Sharp, Toshiba, and Xerox. These relationships are based on business relationships that have been established over time. Our agreements generally do not require them to make any future purchases from us as of December 31, 2017. They are generally free to purchase and offer products from our competitors, or build their own products for sale to the end customer, or cease purchasing our products at any time, for any reason, or no reason.
Fiery Self Serve is our self-service and payment solution that is sold to Canon, FedEx Office, Konica Minolta, Ricoh, Staples, and Xerox. Fiery Self Serve is also marketed to college campuses and libraries.
We sell our proofing products primarily to authorized distributors, dealers, and resellers who in turn sell the solutions to end users either stand-alone or bundled with other solutions they offer. Primary customers with whom we have established distribution agreements include Canon, Xerox, and Heidelberg. We sell color matching, color palette creation, and print design software to the fashion industry. There can be no assurance that we will continue to successfully distribute our products through these channels.
Growth and Expansion Strategies
The growth and expansion of our revenue will be derived from (i) product innovation through internal development efforts or business acquisition, (ii) increasing market coverage through internal efforts or business acquisition, (iii) expanding the addressable market, and (iv) establishing enterprise coherence and leveraging industry standardization.
Product Innovation. We achieve product innovation through internal research and development efforts, as well as by acquiring businesses with technology that is synergistic with our product lines and may be attractive to our customers. We expect to expand and improve our offerings of new generations of Industrial Inkjet products, including super-wide and wide format, textile, corrugated packaging and display, and ceramic tile decoration industrial digital inkjet printers. We expect to expand and improve our Productivity Software offerings, including new product lines related to digital printing, graphic arts, fulfillment systems, cross-media marketing, image personalization, workflow, packaging, 3D textile design, print management, and building materials.
We have established relationships with many leading distribution companies in the graphic arts and commercial print industries such as Nazdar, 3M, and Veritiv, as well as significant printer manufacturing companies including Xerox, Ricoh, Canon, and Konica Minolta. We have also established global relationships with many of
13
Table of Contents
the leading print providers, such as R.R. Donnelley, Donnelley Financial Solutions, FedEx Office, and Staples. These direct sales relationships, along with dealer arrangements, are important for our understanding of the end markets for our products and serve as a source of future product development ideas. In many cases, our products are customized for the needs of large customers, yet maintain the common intuitive interfaces that we are known for around the world.
The development of our Productivity Suite provides tools to facilitate customer revenue growth, efficient scheduling, and optimization of processes, equipment, and personnel. Customers are provided the financial and technical flexibility to deploy locally within their business or to be hosted in the cloud.
Increasing Market Coverage. We are increasing our market coverage through penetration of our sales and distribution networks, expansion into emerging markets in China, India, Latin America and Asia Pacific (“APAC”), and acquisitions that are synergistic with our other businesses such as the Generation Digital and Escada acquisitions. The Generation Digital textile design workflow is integrated with our Fiery textile DFEs and Reggiani digital textile printers linking textile design and production. Escada provides corrugator control systems for the corrugated packaging market, which provide comprehensive control and traceability for the entire corrugation process.
Expanding the Addressable Market. We are expanding our addressable market by extending into new markets within each of our operating segments such as textile digital inkjet printing, textile 3D design, ceramic tile decoration, thermoplastic pre-decoration, image personalization, imposition solutions, various cloud-based software solutions, self-service and payment solutions, and mobile printing. Further growth in the addressable markets for Industrial Inkjet, Productivity Software, and Fiery has been driven by our integration of the production workflow among these operating segments. Growth in the addressable market for corrugated packaging and building materials has resulted from our new Nozomi and Cubik products.
Establishing Enterprise Coherence and Leveraging Industry Standardization. Our goal is to offer best in class solutions that are interoperable and conform to open standards, which will allow customers to configure the most efficient solution for their business by establishing enterprise coherence and leveraging industry standardization.
We establish coherence across our product lines by designing products and platforms that provide a consistent “look and feel” to the end user. Cross-product coherence creates higher productivity levels as a result of shortened learning curves. The integrated coherence that end users can achieve using our products for all of their digital printing and imaging needs leads to a lower total cost of ownership. Open architecture utilizing industry-established standards to provide interoperability across a range of digital printing devices and software applications ultimately provides end users with more choice and flexibility in their selection of products. For example, integration between our cloud-based Digital StoreFront application, our Pace business process automation application, and our Fiery XF Production Color RIP including integration to our Fiery or VUTEk product lines, is achieved by leveraging the industry standard Job Definition Format. Our Productivity Suite has taken this integration further through end-to-end automation including certified workflows and synchronized releases across multiple products consisting of our Packaging Suite, Corrugated Packaging Suite, Enterprise Commercial Print Suite, Publication Print Suite, Midmarket Print Suite, Quick Print Suite, and Value Added Products.
14
Table of Contents
Recent Business Acquisitions. We achieve product innovation through internal research and development efforts, as well as by acquiring businesses with technology that is synergistic with our product lines and may be attractive to our customers. We also acquire businesses to expand our market coverage and customer base. The impact of our business acquisitions on product innovation, market coverage, and addressable market during 2017, 2016, and 2015 is summarized as follows:
| Year |
Acquired Business |
Acquired Product Line or Customer Base | ||
| 2017 |
Free Flow Print Server (“FFPS”) | FFPS servers and customer base | ||
| CRC Information Systems (“CRC”) | North America customer base | |||
| Generation Digital Solutions, Inc. (“Generation Digital”) |
Software for textile and fashion designers | |||
| Escada Innovations Limited and Escada Systems, Inc. (collectively, “Escada”) | Corrugated packaging systems | |||
| 2016 |
Rialco Limited (“Rialco”) | Dye powders and color products for digital printing and industrial manufacturing | ||
| Optitex Ltd. (“Optitex”) | Integrated 3D design software | |||
| 2015 |
Reggiani Macchine SpA (“Reggiani”) | Textile digital inkjet printers | ||
| Matan Digital Printers (“Matan”) | Super-wide format digital inkjet printers | |||
| Corrugated Technologies, Inc. (“CTI”) | Corrugated packaging software | |||
| Shuttleworth Business Systems Limited and CDM Solutions Limited (collectively, “Shuttleworth”) | European customer base | |||
We will continue to be acquisitive in the future in an opportunistic way supporting our product innovation, market coverage, and total addressable market expansion strategies.
Backlog
Although we obtain firm purchase orders from our significant printer manufacturer customers in our Fiery operating segment, these customers typically do not issue such purchase orders until 30 to 90 days before shipment. The non-linear nature of our Industrial Inkjet and Productivity Software operating segments results in customer contracts and purchase orders that are not shipped at the end of the year, which are not material and are not a meaningful indicator of future business prospects.
Significant Relationships
We have established and continue to build and expand relationships with the leading printer manufacturers and distributors of digital printing technology to benefit from their products, distribution channels, and marketing resources. Our customers include domestic and international manufacturers, distributors, and sellers of digital printers. We work closely with the leading printer manufacturers to develop solutions that incorporate leading technology and work optimally in conjunction with their products. The top revenue-generating printer manufacturers, that we sold products to in 2017, in alphabetical order, were Canon, Fuji Xerox, Konica Minolta, Kyocera Document Solutions, Landa, OKI Data, Ricoh, RISO Global Network, Seiko Epson, Sharp, Toshiba, and Xerox (“leading printer manufacturers”). Because sales of our printer and copier-related products constitute a significant portion of our Fiery revenue and there are a limited number of printer manufacturers producing copiers and printers in sufficient volume to be attractive customers for us, we expect to continue to depend on a relatively small number of printer manufacturers for a significant portion of our revenue in future periods.
15
Table of Contents
Revenue from the leading printer manufacturers was 26%, 28%, and 33% of our consolidated revenue, during 2017, 2016, and 2015, respectively. Although end customer and reseller channel preference for Fiery products drives demand, most Fiery revenue relies on the leading printer manufacturer / distributors to integrate Fiery technology into the design and development of their print engines. Accordingly, if we experience reduced sales or lose an important printer manufacturing customer, we will have difficulty replacing the revenue with sales to new or existing customers.
We customarily enter into development and distribution agreements with our significant printer manufacturer customers. These agreements can be terminated under a range of circumstances and often on relatively short notice. The circumstances under which an agreement can be terminated vary from agreement to agreement and there can be no assurance that these significant printer manufacturers will continue to purchase products from us in the future, despite such agreements. Our agreements generally do not commit such customers to make future purchases from us. They could decline to purchase products from us in the future and could purchase and offer products from our competitors, or develop their own products for sale to the end customer. We recognize the importance of, and strive to maintain, our relationships with the leading printer manufacturers. Relationships with these companies are affected by a number of factors including, among others: competition from other suppliers, competition from their own internal development efforts, and changes in general economic, competitive, or market conditions including changes in demand for our products, changes in demand for the printer manufacturers’ products, industry consolidation, or fluctuations in currency exchange rates. There can be no assurance that we will continue to maintain or build the relationships we have developed to date. See Item 1A: Risk Factors—We do not typically have long-term purchase commitments with the printer manufacturer customers that purchase our Fiery DFE and software solutions. They have in the past reduced or ceased, and could at any time in the future reduce or cease, to purchase products from us, thereby harming our operating results and business.
We have a continuing relationship pursuant to a license agreement with Adobe Systems, Inc. (“Adobe”), as amended. We license PostScript® software from Adobe for use in many of our Fiery solutions under the OEM Distribution and License Agreement entered into in September 2005, as amended from time to time. Under our agreement with Adobe, we have a non-exclusive, non-transferable license to use the Adobe deliverables (including any software, development tools, utilities, software development kits, fonts, drivers, documentation, or related materials). The scope of additional licensing terms varies depending on the type of Adobe deliverable. Our agreement with Adobe was amended on February 1, 2018, to automatically renew annually. The agreement can be terminated by either party upon 120 days prior written notice. All royalties due to Adobe under the agreement are payable within 45 days after the end of each calendar quarter.
Each Fiery solution requires page description language software provided by Adobe, which is a leader in providing page description software. Adobe’s PostScript® software is widely used to manage the geometry, shape, and typography of hard copy documents. Adobe can terminate our current PostScript® software license agreement without cause. Although to date we have successfully obtained licenses to use Adobe’s PostScript® software when required, Adobe is not required to, and we cannot be certain that Adobe will, grant future licenses to Adobe PostScript® software on reasonable terms, in a timely manner, or at all. In addition, to obtain licenses from Adobe, Adobe requires that we obtain quality assurance approvals from them for our products that use Adobe software. If Adobe does not grant us such licenses or approvals, if the Adobe licenses are terminated, or if our relationship with Adobe is otherwise materially impaired, we would likely be unable to sell products that incorporate Adobe PostScript® software. If that occurred, we would have to license, acquire, develop, or re-establish our own competing software as a viable alternative for Adobe PostScript® software and our financial condition and results of operations could be significantly harmed for a period of time. See Item 1A: Risk Factors—We license software used in most of our Fiery products and certain Productivity Software products from Adobe and the loss of these licenses would prevent shipment of these products.
Our industrial inkjet printers require inkjet print heads that are manufactured by a limited number of suppliers. If we experience difficulty obtaining print heads, our inkjet printer production would be limited. In addition, we
16
Table of Contents
manufacture UV curable and ceramic digital ink for use in our printers and rely on a limited number of suppliers for certain pigments used in our ink. Our ink sales would decline significantly if we were unable to obtain the pigments when needed. See Item 1A: Risk Factors—We depend on a limited group of suppliers for key components in our products. The loss of any of these suppliers, the inability of any of these suppliers to meet our requirements, or delays or shortages of supply of these components could adversely affect our business.
Human Resources
As of December 31, 2017, we employed 3,366 full time employees. Approximately 989 were in sales and marketing (including 416 in customer service), 442 were in general and administrative, 706 were in manufacturing, and 1,229 were in research and development. Of the total number of employees, 1,485 employees were located in the Americas (primarily the U.S. and Brazil) and 1,881 were located outside of the Americas.
Research and Development
Research and development expense was $157.4, $151.4, and $141.4 million for the years ended December 31, 2017, 2016, and 2015, respectively. As of December 31, 2017, 1,229 of our 3,366 full-time employees were involved in research and development. We believe that development of new products and enhancement of existing products are essential to our continued success. We intend to continue to devote substantial resources to research and new product development. We expect to continue to make significant expenditures to support research and development in the foreseeable future. New platforms and ink formulations will continue to be developed for Industrial Inkjet print technologies and ceramic tile decoration as the industry accelerates its transition from analog to digital technology, from solvent-based printing to UV curable ink printing, and adopts digital textile printing due to the growth of “fast fashion.” We are developing new software applications designed to maximize work flow efficiencies and meet the needs of graphic arts and commercial print professions, including business process automation, web-to-print, e-commerce, cross-media marketing, imposition, proofing solutions, and 3D textile CAD applications. We are developing products to support additional printing devices including high-end color copiers and multi-functional devices. We have research and development sites in 15 U.S. locations, as well as in India, Europe, Israel, the United Kingdom (“U.K.”), Brazil, and Canada. Substantial additional expense is required to complete and bring to market products that are currently under development.
Manufacturing
We are leveraging efficiencies in our worldwide digital inkjet printer manufacturing operations by centralizing super-wide format textile digital inkjet printer production in Italy and transferring production of super-wide format roll-to-roll digital inkjet printers to Israel to leverage the lower cost platform in this manufacturing facility.
We utilize subcontractors to manufacture our Fiery products and, to a lesser extent, our super-wide and wide format industrial digital inkjet printers. These subcontractors work closely with us to promote low cost and high quality while manufacturing our products. Subcontractors purchase components needed for our products from third parties. We are dependent on the ability of our subcontractors to produce the products we sell. Although we supervise our subcontractors, there can be no assurance that such subcontractors will perform efficiently or effectively. We have outsourced our Fiery production with Avnet, Inc. (“Avnet”), formulation of ceramic ink to two subcontractors, and formulation of textile ink to third party branded suppliers, with the exception of reactive dye textile ink, which we formulate in our Bedford, U.K. facility.
Should our subcontractors experience inability or unwillingness to manufacture or deliver our products, then our business, financial condition, and operations could be harmed. Since we generally do not maintain long-term agreements with our subcontractors and such agreements may be terminated with relatively short notice, any of our subcontractors could terminate their relationship with us and/or enter into agreements with our competitors that might restrict or prohibit them from manufacturing our products or could otherwise lead to an inability or
17
Table of Contents
unwillingness to fill our orders in a timely manner or at all. See Item 1A: Risk Factors—We are dependent on a limited number of subcontractors, with whom we do not have long-term contracts, to manufacture and deliver products to our customers. The loss of any of these subcontractors could adversely affect our business.
Our VUTEk display graphics super-wide format industrial digital inkjet printers are primarily manufactured in a single location in our Meredith, New Hampshire facility. In 2016, we transferred VUTEk roll-to-roll printer production to our Rosh Ha’Ayin, Israel, facility, our FabriVu textile digital inkjet printer production to our Bergamo, Italy, facility, and certain wide format industrial digital inkjet printers to our Castellon, Spain, facility.
We have encountered difficulties in hiring and retaining adequate skilled labor and management because Meredith is not located in a major metropolitan area. In 2016, we entered into a six-year lease with Bank of Tokyo—Mitsubishi UFJ Leasing & Finance LLC (“BTMU”) whereby a 225,000-square foot manufacturing and warehouse facility is under construction in Manchester, New Hampshire, related to our super-wide and wide format printer business in the Industrial Inkjet operating segment, which is scheduled to be completed in the first half of 2018. The new manufacturing center will allow consolidation of operations into a single facility and include research & development, manufacturing, warehousing, training, and service for super-wide and wide format printers, along with worldwide sales and marketing management for our broader portfolio of industrial digital inkjet printers and presses.
Our VUTEk roll-to-roll super-wide format industrial digital inkjet printers are manufactured in a single location in our Rosh Ha’Ayin, Israel facility. Our Reggiani textile industrial digital inkjet printers are manufactured in a single location in our Bergamo, Italy facility. Our Cretaprint ceramic tile decoration and Nozomi corrugated packaging digital inkjet printers are manufactured in a single location in our Castellon, Spain facility. Our UV curable and LED curable digital ink that is used in our display graphics super-wide and wide-format industrial digital inkjet printers are formulated in a single location in our Ypsilanti, Michigan facility. Our reactive dye ink that is used in our textile digital inkjet printers is formulated in a single location in our Bedford, U.K., facility.
Most components used to manufacture our printers and ink are available from multiple suppliers, except for inkjet print heads, branded textile ink, and certain key ingredients (primarily pigments and photoinitiators) for our digital UV curable ink. Although typically in low volumes, many key components are sourced from single vendors. If we were unable to obtain the print heads currently used, we would be required to redesign our printers to use different print heads. If we were unable to obtain the branded textile ink or the pigments required for our digital UV curable ink, we would have to qualify other sources, if possible, or reformulate and test the new ink formulations. In our Industrial Inkjet facilities, we use hazardous materials to formulate digital UV curable and ceramic digital ink, as well as store internally formulated and third-party ink. The storage, use, and disposal of those materials must meet the requirements of various environmental regulations.
See Item 1A: Risk Factors—If we are not able to hire and retain skilled employees, we may not be able to develop and manufacture products, or meet demand for our products, in a timely fashion; We manufacture super-wide and wide format industrial digital inkjet printers and formulate UV curable, LED curable, and reactive dye ink primarily in single locations. Any significant interruption in the manufacturing process at these facilities could adversely affect our business; We depend on a limited group of suppliers for key components in our products. The loss of any of these suppliers, the inability of any of these suppliers to meet our requirements, or delays or shortages of supply of these components, could adversely affect our business; and We may be subject to environmental-related liabilities due to our use of hazardous materials and solvents.
18
Table of Contents
Significant components necessary for manufacturing our products are obtained from a sole supplier or a limited group of suppliers. We depend largely on the following sole and limited source suppliers for our components and manufacturing services:
| Supplier |
Components | |
| Intel | Central processing units (“CPUs”); chip sets | |
| Toshiba | Application-specific integrated circuits (“ASIC”) & inkjet print heads | |
| Open Silicon | ASICs | |
| Altera | ASICs & programmable devices | |
| Tundra | Chip sets | |
| Avnet Adobe |
Contract manufacturing (Fiery) PostScript® (Fiery and Productivity Software) | |
| Dell Electronics | Contract manufacturing (FFPS) | |
| HCL Technologies | Sustaining engineering (FFPS) | |
| Third party branded | Textile ink | |
| (DuPont, Huntsman, Sensient) |
||
| Ink pigment suppliers | UV curable ink pigments and photoinitiators | |
| Columbia Tech | Inkjet sub-assemblies | |
| Schneider Electric | Inkjet electrical sub-assemblies | |
| Phoseon | LED lamps | |
| Shenzhen Runtianzhi Tech | Inkjet sub-assemblies | |
| Seiko | Inkjet print heads | |
| Xaar | Inkjet print heads | |
| Ricoh | Inkjet print heads | |
| Kyocera Mita | Inkjet print heads | |
| Progress Software | Monarch and Radius operating system | |
| Printable Enabling Technologies Ltd |
Digital StoreFront modular offering Sensor interface and electronics |
We generally do not maintain long-term agreements with our component suppliers. We primarily conduct business with such suppliers largely on a purchase order basis. If any of our sole or limited source suppliers were unwilling or unable to supply us with the components for which we rely on them, we may be unable to continue manufacturing our products utilizing such components.
The absence of agreements with many of our suppliers also subjects us to pricing fluctuations, which is a factor we believe is partially offset by the desire of our suppliers to sell a high quantity of components. Many of our components are similar to those used in personal computers; consequently, the demand and price fluctuations of personal computer components could affect our component costs. In the event of unanticipated volatility in demand for our products, we may be unable to manufacture certain products in quantities sufficient to meet end user demand or we may hold excess quantities of inventory due to their long lead times. We maintain an inventory of components for which we are dependent on sole or limited source suppliers and of components with prices that fluctuate significantly. We cannot ensure that at any given time we will have sufficient inventory to enable us to meet demand for our products, which would harm our financial results. See Item 1A: Risk Factors—We depend on a limited group of suppliers for key components in our products. The loss of any of these suppliers, the inability of any of these suppliers to meet our requirements, or delays or shortages of supply of these components could adversely affect our business.
Competition
Competition in our markets is significant and involves rapidly changing technologies and frequent new product introductions. To maintain and improve our competitive position, we must continue to develop and introduce
19
Table of Contents
new products and features on a timely and cost-effective basis to keep pace with the evolving needs of our customers. We believe the principal competitive factor affecting our markets is the market acceptance rates for new printing technology.
Industrial Inkjet
Our super-wide and wide format industrial digital inkjet printers compete with printers produced by Agfa, Durst, Canon, Hewlett-Packard (“HP”), Inca, Mimaki, Roland, and Mutoh throughout most of the world. There are Chinese and Korean printer manufacturers in the marketplace, but their products are typically sold in their domestic markets and are not currently perceived as viable alternatives in most other markets. Our UV and LED curable ink is sold to users of our UV industrial inkjet printers, which have advanced quality control systems to ensure that correct color and non-expired ink is used to prevent damage to the printer. This results in most ink used in our printers being sold by us. While third party ink is available, its use may compromise the printer’s quality control system and also voids certain provisions of our printer warranty and service contracts. Our Nozomi corrugated packaging digital inkjet printers compete with printers offered by Barberan, Durst, HP, and Sun Automation.
Our Reggiani industrial digital inkjet textile printers compete with Dover, Durst, Mimaki, Roland, Epson, Konica Minolta, Robustelli, Atexco, Shenzhen Homer Textile, Kornit, Ricoh, and Digital Graphics. Competitive digital inkjet textile printers are manufactured in Italy, Japan, China, and smaller emerging markets such as Indonesia. Key competitors driving digitalization of the textile printer market include Dover and Kornit. Reggiani also competes with other digital inkjet textile printing technologies including pre-washing and post-washing printing techniques.
Our Cretaprint ceramic tile decoration digital inkjet printers compete with ceramic tile decoration printers manufactured in Spain (KERAjet), Austria (Durst), Italy (Technoferrari, Projecta, Intesa, and System), China (Flora, Hope, Meijia, and Teckwin), and smaller emerging competition in other markets such as Indonesia. The ceramic tile industry has experienced a relocation from southern Europe to the emerging markets of China, India, Brazil, and Indonesia. Competition in the Chinese market consists of small Chinese ceramic tile decoration digital inkjet printers and European manufacturers that are reducing prices to gain market share. In addition to our facility in Spain, we operate a Cretaprint sales and support center in Foshan, Guangdong, China, which is home to the largest concentration of ceramic tile manufacturers in China.
Productivity Software
Our Productivity Software operating segment, which includes our business process automation, cloud-based order entry and order management systems, cross media marketing, and imposition solution systems faces competition from software application vendors that specifically target the printing industry. These vendors are typically small, privately-owned companies. We also face competition from larger vendors that currently offer, or are seeking to develop, business process automation printing products including HP, Epicor, and SAP. We face competition from Oracle, SAP, Kiwiplan, and Heidelberg in the packaging software market.
Our Optitex 3D CAD software competes with Lectra, Assyst, CLO, Browzwear, and Gerber. Optitex provides 2D CAD design and 3D CAD visualization in the same application. Therefore, the CAD information and the 3D information are tightly integrated. Furthermore, the incremental learning curve from using 2D to using 3D is minimal.
Fiery
The principal competitive factors affecting the market for our Fiery solutions include customer service and support, product reputation, quality, performance, price, and product features such as functionality, scalability, ease of use, and ability to interface with products produced by the significant printer manufacturers.
20
Table of Contents
Although we have direct relationships with each of the leading printer manufacturers and work closely with them to integrate Fiery DFE and software technology into the design and development of their print engines to maximize their quality and capability, our primary competitors for stand-alone color DFEs, embedded DFEs, and design-licensed solutions are these same leading printer manufacturing companies. They each maintain substantial investments in research and development. Some of this investment is targeted at integrating products and technology that we have designed and some of this investment is targeted at developing products and technology that compete with our Fiery brand. Our acquisition of certain assets of the FFPS business from Xerox may mitigate this competition from one of our Fiery customers. We are the largest third party DFE developer, although our market compared with DFEs developed internally by the leading printer manufacturers is small. We believe that our advantages include continuously advancing technology, short time-to-market, brand recognition, end user loyalty, sizable installed base, number of products supported, price driven by lower development costs, and market knowledge. We intend to continue to develop new DFEs with capabilities that meet the changing needs of the printer manufacturers’ product development roadmaps. Although we do not directly control the distribution channels, we provide a variety of features as well as unique “look and feel” to the printer manufacturers’ products to differentiate our customers’ products from those of their competitors. Ultimately, we believe that end customer and reseller channel preference for the Fiery DFE and software solutions drives demand for Fiery products through the printer manufacturers.
Intellectual Property Rights
We rely on a combination of patent, copyright, trademark, and trade secret laws; non-disclosure agreements; and other contractual provisions to establish, maintain, and protect our intellectual property rights. Although we believe that our intellectual property rights are important to our business, no single patent, copyright, trademark, or trade secret is solely responsible for the development and manufacturing of our products.
We are currently pursuing patent applications in the U.S. and certain foreign jurisdictions to protect various inventions. Over time, we have accumulated a portfolio of patents issued in these jurisdictions. We own or have rights to the copyrights to the software code in our products and the rights to the trademarks under which our products are marketed. We have registered certain trademarks in the U.S. and certain foreign jurisdictions and will continue to evaluate the registration of additional trademarks as appropriate.
Certain of our products include intellectual property licensed from our customers. We have also granted and may continue to grant licenses to our intellectual property, when and as we deem appropriate. For a discussion of risks relating to our intellectual property, see Item 1A: Risk Factors—We may be unable to adequately protect our proprietary information and may incur expenses to defend our proprietary information.
Financial Information about Foreign and Domestic Operations and Export Sales
See Note 14—Segment Information, Geographic Regions, and Major Customers and Note 11—Income Taxes of the Notes to Consolidated Financial Statements. See also Item 1A: Risk Factors—We face risks from our international operations and We face risks from currency fluctuations.
If we fail to continue to introduce new products that achieve market acceptance on a timely basis, we will not be able to compete effectively and we will be unable to increase or maintain net revenue and gross margins.
We operate in a highly competitive and quickly changing environment. Our future success depends in large part upon our ability to identify demand trends and quickly develop or acquire, and manufacture and sell, products that satisfy these demands in a cost-effective manner. In order to differentiate our products from our competitors’ products, we must continue to increase our focus and capital investment in research and development. For
21
Table of Contents
example, we have committed substantial resources expressed in both man-hours and financial investment to the development of our Nozomi single-pass industrial digital inkjet platform, which was launched in the third quarter of 2017, for the corrugated, paper packaging, display printing, and other related markets. We have invested significantly in the research and development, sales and marketing, and manufacturing processes required to successfully launch this product. While we have sold a limited number of printers, we are unable to predict the actual level of demand for this product because Nozomi is a new product. If this product is not successful in the market, then our consolidated financial position and results of operations could be materially impacted.
Successfully predicting demand trends is difficult, and it is very difficult to predict the effect introducing a new product will have on existing product sales. We will also need to respond effectively to new product announcements by our competitors and quickly introduce competitive products. Any delays in product development and introduction, or product introductions that do not meet broad market acceptance, or unsuccessful launches of new product lines, could result in:
| • | loss of or delay in revenue and loss of market share; |
| • | negative publicity and damage to our reputation and brands; |
| • | a decline in the average selling price of our products; |
| • | adverse reactions in our sales channels, such as reduced online product visibility, or loss of a sales channel; |
| • | product returns; or |
| • | failure to recover amounts invested. |
The market for our super-wide and wide format industrial digital inkjet printers is extremely competitive.
Our super-wide and wide format industrial digital inkjet products compete against several companies that market industrial digital inkjet printing systems based on electrostatic, drop-on-demand, and continuous drop-on-demand inkjet, and other technologies and printers utilizing UV curable ink including Agfa, Durst, Canon, HP, Inca, Mimaki, Roland, and Mutoh. Certain competitors have greater resources to develop new products and technologies and market those products, as well as acquire or develop critical components at lower costs, which would provide them with a competitive advantage. They could also exert downward pressure on product pricing to gain market share.
Reggiani industrial digital inkjet textile printers address the full scope of advanced textile printing with versatile printers suitable for water-based dispersed, acid, pigment, and reactive dye printing ink. Our Reggiani textile printers compete with printers offered by Dover, Durst, Mimaki, Roland, Epson, Konica Minolta, Robustelli, Atexco, Shenzhen Homer Textile, Kornit, and Digital Graphics. Competitive digital inkjet textile printers are manufactured in Italy, Japan, China, and smaller emerging markets such as Indonesia. Reggiani also competes with other digital inkjet textile printing technologies including pre-washing and post-washing printing techniques.
The local competitors in the Chinese and Korean markets are developing, manufacturing, and selling inexpensive printers mainly to the local markets. Our ability to compete depends on factors both within and outside of our control, including the price, performance, and acceptance of our current printers and any products we develop in the future.
We also face competition from existing conventional and digital inkjet super-wide and wide format printing methods, including screen printing and offset printing. Our competitors could develop new products, with existing or new technology, that could be more competitive in our market than our printers.
The market for our ceramic tile decoration digital inkjet printers is very competitive.
Our Cretaprint ceramic tile decoration digital inkjet printer competes with ceramic tile decoration printers manufactured in Spain, Austria, Italy, Brazil, China, and smaller emerging competitors in other markets such as
22
Table of Contents
Indonesia. The ceramic tile industry has experienced relocation from southern Europe to the emerging markets of China, India, Brazil, and Indonesia. Competition in the Chinese market consists of small Chinese ceramic tile decoration digital inkjet printers and European manufacturers that are reducing prices to gain market share. In addition to our facility in Spain, we operate a Cretaprint sales and support center in Foshan, Guangdong, China, which is home to the largest concentration of ceramic tile manufacturers in China.
Our ceramic tile decoration imaging competitors are a mix of large, medium, and small ceramic tile decoration printer manufacturers, which are primarily privately-owned. Our competitors could develop new products, with existing or new technology, that could be more competitive in our market than our ceramic tile decoration digital inkjet printers.
We face strong competition for printing supplies such as ink.
We compete with independent manufacturers in the ink market consisting of smaller vendors, as well as larger vendors such as DuPont Digital Printing.
Our UV curable ink is sold to users of our super-wide and wide format UV industrial inkjet printers, which have advanced quality control systems to ensure that correct color and non-expired ink is used to prevent damage to the printer. This results in most ink used in our super-wide and wide format printers being sold by us. While third party ink is available, its use compromises the printer’s quality control system and voids most provisions of our printer warranty and service contracts. Nevertheless, we cannot guarantee we will be able to remain the principal ink supplier for our super-wide and wide format UV industrial digital inkjet printers. We could experience an overall price reduction within the ink market, which would also adversely affect our gross profit.
We sell third party branded textile ink to users of our textile digital inkjet printer. We offer a strong value proposition with our third party branded ink, but cannot guarantee that we will be the primary supplier of textile digital ink to the users of our printers as these branded ink are available on the market.
Our solvent-based ceramic digital ink is sold to users of our ceramic tile decoration digital inkjet printers. The ceramic ink market is generally an open system for ink and therefore customers may change between suppliers. Although we are focused on developing this recurring revenue stream, we cannot guarantee that we will become the primary supplier of ceramic digital ink to the users of our printers.
If the market for digital textile printing does not develop as we anticipate, we may not be able to grow our digital inkjet textile printing business.
If the global printed textile industry does not broadly accept digital printing as an alternative to either analog printing or single color (dyed) garments, our revenue may not grow as quickly as expected. Widespread adoption of digital textile printing depends on the willingness and ability of businesses in the printed textile industry to replace their existing analog printing systems and single color (dyed) garments with digital printing systems. The adoption of digital textile printing is dependent to some extent on the growth of “fast fashion.”
A key element of our digital inkjet textile printing growth strategy is to market digital inkjet printing systems to contract printers that serve major textile brand owners and fashion designers. If leading textile brand owners and fashion designers are not convinced of the benefits of digital inkjet textile printing or if there is a significant reduction in the popularity of printed textiles, especially those that are customized or personalized, among the consumers to whom such brand owners and fashion designers cater, or if these businesses decide that digital inkjet printing processes are less reliable, less cost-effective, lower quality, or otherwise less suitable for their commercial needs than analog printing processes and single color (dyed) garments, then the market for digital textile printers and software may not develop as we anticipate and we may not be able to grow our inkjet textile printing business.
23
Table of Contents
We face strong competition in our Productivity Software operating segment.
Our Productivity Software operating segment, which includes our business process automation, cloud-based order entry and order management, cross media marketing, and imposition solution systems faces competition from software application vendors that specifically target the printing industry. These vendors are typically small and privately-owned companies. We also face competition from larger vendors that currently offer, or are seeking to develop, business process automation printing products including HP, Epicor, and SAP. We face competition from Oracle, SAP, SolarSoft, and Heidelberg in the packaging software market. Our Optitex 3D CAD software competes with Lectra, Assyst, CLO, Browzwear, and Gerber. There can be no assurance that we will continue to advance our technology and products or compete effectively against other companies’ product offerings.
We do not typically have long-term purchase commitments with the printer manufacturer customers that purchase our Fiery DFE and software solutions. They have in the past reduced or ceased, and could at any time in the future reduce or cease, to purchase products from us, thereby harming our operating results and business.
Although end customer and reseller channel preference for Fiery DFE and software solutions drives demand, most Fiery revenue relies on printer manufacturers to integrate Fiery technology into the design and development of their print engines. We have established direct relationships with several leading printer manufacturers and work closely with them to design, develop, and integrate Fiery DFE and software technology to maximize the capability of their print engines. These manufacturers act as distributors and sell Fiery products to end customers through reseller channels. A significant portion of our revenue is, and has been, generated by sales of our Fiery DFE and software solutions to a relatively small number of leading printer manufacturers. Our reliance on revenue from the leading printer manufacturers was 26%, 28%, and 33% of our consolidated revenue, during 2017, 2016, and 2015, respectively. Because sales of our Fiery products constitute a significant portion of our revenue and there are a limited number of printer manufacturers producing printers in sufficient volume to be attractive customers for us, we expect that we will continue to depend on a relatively small number of printer manufacturers for a significant portion of our Fiery revenue in future periods. Accordingly, if we lose or experience reduced sales to one of these printer manufacturer customers, we will have difficulty replacing that revenue with sales to new or existing customers.
With the exception of certain minimum purchase obligations, we typically do not have long-term volume purchase contracts with our significant printer manufacturer customers, including Konica Minolta, Ricoh, and Canon, and they are not obligated to purchase products from us. Accordingly, our printer manufacturer customers could at any time reduce their purchases from us or cease purchasing our products altogether. For example, in 2017, two of our significant printer manufactures purchased less inventory from us and this reduction may occur in 2018 and future years, which could impact revenue from our Fiery segment. In the past, these printer manufacturer customers have elected to develop products on their own for sale to end customers, incorporated technologies developed by other companies into their products, and have directly sold third party competitive products, rather than rely solely or partially on our products. We expect that these printer manufacturer customers will continue to make such elections in the future, although our acquisition of the FFPS business partially mitigates this risk with respect to one of these leading printer manufacturer / distributors.
Many of the products and technologies we are developing require that we coordinate development, quality testing, marketing, and other tasks with these printer manufacturers. We cannot control their development efforts or the timing of these efforts. We rely on these printer manufacturers to develop new printer and copier solutions, applications, and product enhancements that utilize our Fiery DFE technologies and software solutions in a timely and cost-effective manner. Our success in the DFE industry depends on the ability of these printer manufacturers to utilize our technologies to develop the right solutions with the right features to meet ever changing customer requirements and responding to emerging industry standards and other technological changes.
24
Table of Contents
Because our printer manufacturer customers incorporate our products into products they manufacture and sell, any decline in demand for copiers or laser printers or any other negative developments affecting our major customers or the computer industry in general, including reduced end user demand, would likely harm our results of operations. Certain printer manufacturer customers have experienced serious financial difficulties in the past, which led to a decline in sales of our products. If any significant customers face such difficulties in the future, our operating results could be harmed through, among other things, decreased sales volume, write-off of accounts receivable, and write-off of inventories related to products we have manufactured for these customers’ products.
Economic uncertainty has negatively affected our business in the past and may negatively affect our business in the future.
Our revenue and profitability depend significantly on the overall demand for information technology products that enable printing of digital data, which in turn depends on a variety of macro- and micro-economic conditions. In addition, revenue growth and profitability in our Industrial Inkjet operating segment depends on demand and spending for advertising and marketing products and programs, which also depends on a variety of macro-and micro-economic conditions.
Uncertainty about current global economic conditions poses a risk as our customers may delay purchases of our products in response to tighter credit, negative financial news, and/or declines in income or asset values. Any financial turmoil affecting the banking system and financial markets and the possibility that financial institutions may consolidate or terminate their activities have resulted in a tightening in the credit market, a low level of liquidity in many financial markets, and extreme volatility in fixed income, credit, currency, and equity markets. There could be a number of follow-on effects from a credit crisis on our business, including insolvency of key suppliers resulting in product delays; inability of customers and distributors to obtain credit to finance purchases of our products and/or customer and distributor insolvencies; increased difficulty in managing inventories; and other financial institutions negatively impacting our treasury operations.
Although economic uncertainty has recently abated in Europe, uncertainty remains in the “southern European” countries (primarily Italy, Spain, and Portugal) due to uncertainty in Spain related to Brexit and Catalonia and uncertainty in Italy related to significant public debt and uncollectible loans in the banking system. We have no European sovereign debt investments. Our European debt investments consist of non-sovereign corporate debt securities of $6.6 million, which represents 8% of our corporate debt instruments (4% of our short-term investments) at December 31, 2017. European debt investments are with corporations domiciled in the northern and central European countries of Netherlands, Sweden, and France. We do not have any short-term investments with corporations domiciled in the higher risk “southern European” countries (i.e., Italy, Spain, and Portugal). We believe that we do not have significant exposure with respect to our money market and corporate debt investments in Europe, although we do have some exposure due to the interdependencies among the European Union countries.
Since Europe is composed of varied countries and regional economies, our European risk profile is somewhat more diversified due to the varying economic conditions among the countries. Approximately 32% of our receivables are with European customers as of December 31, 2017. Of this amount, 30% of our European receivables (10% of consolidated gross receivables) are in the higher risk southern European countries (mostly Italy, Spain, and Portugal) and Ireland, which are adequately reserved.
Our business, results of operations and financial condition may be negatively impacted by conditions abroad, including local economies, political environments, fluctuating foreign currencies, and shifting regulatory schemes.
A significant amount of our revenue is generated from operations outside the U.S. Approximately $505.3 (51%), $491.7 (50%), and $408.9 (46%) million of revenue for the years ended December 31, 2017, 2016, and 2015, respectively, shipped to locations outside the Americas, primarily to Europe, Middle East, and Africa (“EMEA”)
25
Table of Contents
and APAC. We expect that sales outside of the U.S. will continue to represent a significant portion of our total revenue. We maintain significant operations and acquire or manufacture many of our products and/or their components outside the U.S. Our future revenue, costs, and results of operations could be significantly affected by changes in each country’s economic conditions, foreign currency exchange rates relative to the U.S. dollar, political conditions, trade protection measures, licensing requirements, local tax issues, capitalization, and other related legal matters. If our future revenue, costs, and results of operations are significantly affected by economic conditions abroad, our results of operations and financial condition could be negatively impacted. Specifically, the deceleration of the economy in China has negatively impacted, and may continue to negatively impact, our results of operations. The Chinese government continues to rebalance the country’s economic model with tightening real estate and environmental regulation.
We face risks from currency fluctuations.
Given the significance of non-U.S. sales to our total revenue, we face a continuing risk from the fluctuation of the U.S. dollar versus foreign currencies. Although the majority of our receivables are invoiced and collected in U.S. dollars, we have exposure from non-U.S. dollar-denominated sales (consisting of the Euro, British pound sterling, Brazilian real, Chinese renminbi, Israeli shekel, and Australian dollar). We have a substantial number of international employees, resulting in material operating expenses denominated in foreign currencies. We have exposure from non-U.S. dollar-denominated operating expenses in foreign countries (primarily the Euro, British pound sterling, Chinese renminbi, Israeli shekel, Indian rupee, Brazilian real, and Australian dollar).
We can benefit from or be adversely affected by either a weaker or stronger U.S. dollar relative to major currencies worldwide with respect to our consolidated financial statements. Accordingly, we can benefit from a stronger U.S. dollar due to the corresponding reduction in our foreign operating expenses translated into U.S. dollars and at the same time we can be adversely affected by a stronger U.S. dollar due to the corresponding reduction in foreign revenue translated into U.S. dollars. We hedge our operating expense exposure in Indian rupees. The notional amount of our Indian rupee cash flow hedge was $3.9 million at December 31, 2017.
Forward contracts not designated as hedging instruments consist of hedges of British pounds sterling, Brazilian real, Israeli shekel, Japanese yen, Chinese renminbi, and Euro-denominated intercompany balances with notional amounts of $144.5 million; Brazilian real, British pounds sterling, Australian dollar, Israeli shekel, and Euro-denominated trade receivables with notional amounts of $44.4 million; and hedges of British pounds sterling, Indian rupee, Israeli shekel, and Euro-denominated other net monetary assets with notional amounts of $46.6 million at December 31, 2017. These forward contracts are not designated for hedge accounting treatment since there is a natural offset for the remeasurement of the underlying foreign currency denominated asset or liability.
As of December 31, 2017, we had not entered into hedges against any other currency exposures, but we may consider hedging against movements in other currencies in the future. Our efforts to reduce risk from our international operations and from fluctuations in foreign currencies or interest rates may not be successful, which could harm our financial condition and operating results.
We face risks from our international operations.
We are subject to certain risks because of our international operations as follows:
| • | restrictions on our ability to access cash generated by international operations, especially in China and Brazil, due to restrictions on the repatriation of dividends, distribution of cash to shareholders outside such countries, foreign exchange control, and other restrictions; |
| • | security concerns, such as armed conflict and civil or military unrest, crime, political instability, and terrorist activity; |
26
Table of Contents
| • | customer credit risk, especially in emerging or economically challenged regions, with accompanying challenges to enforce our legal rights should collection issues arise; |
| • | changes in governmental regulation, including labor regulations, and our inability or failure to obtain required approvals, permits, or registrations could harm our international and domestic sales and adversely affect our revenue, business, and operations; |
| • | violations of governmental regulation, including labor regulations, could result in fines and penalties, including prohibiting us from exporting our products to one or more countries, and could materially adversely affect our business; |
| • | international labor regulations may be substantially different than the regulations we are accustomed to in the U.S., which may negatively impact labor efficiency and workforce relations; |
| • | trade legislation in either the U.S. or other countries, such as a change in the current tariff structures, export compliance laws, or other trade policies, could adversely affect our ability to sell or manufacture in international markets; |
| • | adverse tax consequences, including imposition of withholding or other taxes on payments by subsidiaries, and |
| • | some of our sales to international customers are made under export licenses that must be obtained from the U.S. Department of Commerce (“DOC”) and certain transactions require prior approval of the DOC or other governmental agencies. |
We incur additional legal compliance costs associated with our international operations and could become subject to legal penalties in foreign countries if we do not comply with local laws and regulations, which may be substantially different from those in the U.S. In many foreign countries, particularly those with developing economies, it may be common to engage in business practices that are prohibited by U.S. regulations such as the Foreign Corrupt Practices Act of 1977, as amended. Although we implement policies and procedures designed to ensure compliance with these laws, there can be no assurance that all of our employees, contractors, and agents, as well as outsourced business operations, including those based in or from countries where practices that violate such U.S. laws may be customary, will not take actions in violation of our policies. Furthermore, there can be no assurance that employees, contractors, and agents of acquired companies did not take actions in violation of such laws and regulations prior to the date they were acquired by us, although we perform due diligence procedures to endeavor to discover any such actions prior to the acquisition date.
We license software used in most of our Fiery products and certain Productivity Software products from Adobe and the loss of these licenses would prevent shipment of these products.
We are required to obtain separate licenses from Adobe for the right to use Adobe PostScript® software in each copier or printer model that uses a Fiery DFE, and other Adobe software for certain Productivity Software products. Although to date we have successfully obtained licenses to use Adobe PostScript ® and other Adobe software when required, Adobe is not required to, and we cannot be certain that Adobe will, grant future licenses to Adobe PostScript® and other Adobe software on reasonable terms, in a timely manner, or at all. To obtain licenses from Adobe, Adobe requires that we obtain quality assurance approvals from them for our products that use Adobe software. Although to date we have successfully obtained such quality assurance approvals from Adobe, we cannot be certain they will grant us such approvals in the future. If Adobe does not grant us such licenses or approvals, if the Adobe licenses are terminated, or if our relationship is otherwise materially impaired, we would likely be unable to sell products that incorporate Adobe PostScript ® or other Adobe software and our financial condition and results of operations would be significantly harmed.
27
Table of Contents
We manufacture super-wide and wide format industrial digital inkjet printers and formulate UV curable, LED curable, and reactive dye ink in single locations. Any significant interruption in the manufacturing process at these facilities could adversely affect our business.
Our VUTEk super-wide and wide format industrial digital inkjet printers are primarily manufactured in a single location in our Meredith, New Hampshire facility. In 2016, we transferred VUTEk roll-to-roll printer production to our Rosh Ha’Ayin, Israel, facility, our FabriVu textile digital inkjet printer production to our Bergamo, Italy, facility, and certain wide format industrial digital inkjet printers to our Castellon, Spain, facility.
Our VUTEk roll-to-roll super-wide format industrial digital inkjet printers are manufactured in a single location in our Rosh Ha’Ayin, Israel facility. Our Reggiani industrial digital inkjet textile printers are manufactured in a single location in our Bergamo, Italy facility. Our Cretaprint ceramic tile decoration and Nozomi corrugated packaging digital inkjet printers are manufactured in a single location in our Castellon, Spain facility. We formulate our UV curable and LED curable digital ink that is used in our display graphics super-wide and wide-format industrial digital inkjet printers in a single location in our Ypsilanti, Michigan facility. We formulate our reactive dye ink that is used in our textile digital inkjet printers in a single location in our Bedford, U.K., facility. Any significant interruption in the manufacturing process at any of these facilities could affect the supply of our products, our ability to meet customer demand, and our ability to maintain market share.
We are developing contingency plans utilizing our manufacturing facilities in multiple locations and the capabilities of certain contract manufacturers in the event of a significant interruption in the manufacturing process at any of the aforementioned facilities. Until those plans are complete, disruptions in the manufacturing process at any of our sole source internal facilities could adversely affect our business.
We depend on a limited group of suppliers for key components in our products. The loss of any of these suppliers, the inability of any of these suppliers to meet our requirements, or delays or shortages of supply of these components, could adversely affect our business.
Certain components necessary for the manufacture of our products are obtained from a sole supplier or a limited group of suppliers. These include CPUs, chip sets, ASICs, and other related semiconductor components; inkjet print heads for our super-wide and wide format, corrugated packaging, textile, and ceramic tile decoration industrial digital inkjet printers; branded textile ink; and certain key ingredients (primarily pigments and photoinitiators) for our digital UV curable ink. We generally do not maintain long-term agreements with our component suppliers and conduct business with such suppliers largely on a purchase order basis. If we are unable to continue to procure these sole or limited sourced components from our current suppliers in the required quantities, we will have to qualify other sources, if possible, or redesign our products. If we were unable to obtain the branded textile ink or the pigments required for our digital UV curable ink, we would have to qualify other sources, if possible, or reformulate and test the new ink formulations. These suppliers may be concentrated within similar industries or geographic locations, which could potentially exacerbate these risks. We cannot provide assurance that other sources of these components exist or will be willing to supply us on reasonable terms or at all, or that we will be able to design around these components. Any unavailability, delays, or shortages of these components or any inability of our suppliers to meet our requirements, could harm our business.
Because the purchase of certain key components involves long lead times, in the event of unanticipated volatility in demand for our products, we have in the past been, and may in the future be, unable to manufacture certain products in a quantity sufficient to meet demand. Further, as has occurred in the past, in the event that anticipated demand does not materialize, we may hold excess quantities of inventory that could become obsolete. To meet projected demand, we maintain an inventory of components for which we are dependent on sole or limited source suppliers and components with prices that fluctuate significantly. As a result, we are subject to risk of inventory obsolescence, which could adversely affect our operating results and financial condition.
Market prices and availability of certain components, particularly memory subsystems and Intel-designed components, which collectively represent a substantial portion of the total manufactured cost of our products,
28
Table of Contents
have fluctuated significantly in the past. Such fluctuations could have a material adverse effect on our operating results and financial condition including reduced gross profit.
We are dependent on a limited number of subcontractors, with whom we generally do not have long-term contracts, to manufacture and deliver products to our customers. The loss of any of these subcontractors could adversely affect our business.
We subcontract with other companies to manufacture certain of our products and we generally do not have long-term agreements with these subcontractors. While we closely monitor our subcontractors’ performance, we cannot be assured that such subcontractors will continue to manufacture our products in a timely and effective manner. In the past, a weakened economy led to the dissolution, bankruptcy, or consolidation of some of our subcontractors, which decreased the available number of subcontractors. If the available number of subcontractors were to decrease in the future, it is possible that we would not be able to secure appropriate subcontractors to fulfill our demand in a timely manner, or at all, particularly if demand for our products increases.
The existence of fewer subcontractors may reduce our negotiating leverage, thereby potentially resulting in higher product costs. Financial problems resulting in the inability of our subcontractors to make or ship our products, could harm our business, operating results, and financial condition. If we change subcontractors, we could experience delays in finding, qualifying, and commencing business with new subcontractors, which would result in delayed delivery of our products and potentially the cancellation of orders for our products.
We have outsourced our Fiery production with Avnet, FFPS production with Dell, FFPS sustaining engineering with HCL, ceramic ink formulation with subcontractors in China and Italy, and formulation of certain textile ink with third party branded suppliers. Certain Industrial Inkjet sub-assemblies are manufactured by subcontractors. Should our subcontractors experience any inability, or unwillingness, to manufacture or deliver our products, then our business, financial condition, and operations could be harmed. Since we generally do not maintain long-term agreements with our subcontractors, any of our subcontractors could enter into agreements with our competitors that might restrict or prohibit them from manufacturing our products or could otherwise lead to an inability to fill our orders in a timely manner. In such event, we may not be able to find suitable replacement subcontractors, in which case our financial condition and operations would likely be harmed.
We may face increased risk of inventory obsolescence, excess, or shortages related to our Industrial Inkjet printers and ink.
We procure raw materials and internally manufacture our super-wide and wide format, textile, and ceramic tile decoration industrial digital inkjet printers and formulate digital UV curable and reactive dye ink based on our sales forecasts. If we do not accurately forecast demand for our products, we may produce or purchase excess inventory, which may result in our inventory becoming obsolete. We might not produce the correct mix of products to match actual demand if our sales forecast is not accurate, resulting in lost sales. If we have excess printers, ink, or other products, we may need to lower prices to stimulate demand.
Our ink products have a defined shelf life. If we do not sell the ink before the end of its shelf life, it will have to be written off. We have also experienced UV curable ink shortages in the past and may continue to experience such shortages in the future. UV curable ink shortages may require that we incur additional costs to respond to increased demand and overcome such shortages.
If we are not able to hire and retain skilled employees, we may not be able to develop and manufacture products, or meet demand for our products, in a timely fashion.
We depend on skilled employees, such as software and hardware engineers, quality assurance engineers, chemists, chemical engineers, and other technical professionals with specialized skills. We are headquartered in
29
Table of Contents
the Silicon Valley and have research and development employees in facilities in 15 U.S. locations. We also have research and development employees in facilities in India, Europe, Israel, the U.K., Brazil, and Canada. Competition has historically been intense among companies hiring engineering and technical professionals. In times of professional labor imbalances, it has in the past and is likely in the future, to be difficult to locate and hire qualified engineers and technical professionals and to retain these employees. There are many technology companies located near our corporate offices in the Silicon Valley and our operations in India that may attempt to hire our employees.
Our VUTEk printers are manufactured at our Meredith, New Hampshire facility, which is not located in a major metropolitan area. We have encountered difficulties in hiring and retaining adequately skilled labor and management at this location. We have entered into a six-year lease with BTMU whereby a 225,000 square foot manufacturing and warehouse facility is under construction in Manchester, New Hampshire, related to our super-wide and wide format industrial digital inkjet printer business in the Industrial Inkjet operating segment, which is scheduled to be completed in the first half of 2018.
The movement of our stock price may also impact our ability to hire and retain employees. If we do not offer competitive compensation, we may not be able to recruit or retain employees, which may have an adverse effect on our ability to develop products in a timely fashion, which could harm our business, financial condition, and operating results.
We rely on our distribution channels to ensure sales growth.
The leading printer manufacturers, which comprise the majority of the customer base in our Fiery operating segment, are typically large profitable customers with little credit risk to us. Our Productivity Software and Industrial Inkjet operating segments sell primarily through a direct sales force, augmented by some select distributors, to a broader base of customers than Fiery. Any interruption of these distribution channels could negatively impact us in the future.
Growing market share in the Productivity Software and Industrial Inkjet operating segments increases the possibility that we will experience increased bad debt expense and increased accounts receivable.
Many of the Productivity Software and Industrial Inkjet customers are smaller and potentially less creditworthy. Our ceramic tile decoration digital inkjet customer base is primarily located in geographic regions, which have recently been subject to economic challenges including southern Europe (primarily Spain and Italy) and emerging markets in APAC. Furthermore, if we increase the percentage of Productivity Software and Industrial Inkjet products that are sold internationally, it may be challenging to enforce our legal rights should collection issues arise. Due to these and other factors, growing Industrial Inkjet and Productivity Software market share may cause us to experience an increase in bad debt expense and an increase in days sales outstanding (“DSOs”).
DSOs increased during the year ended December 31, 2017, compared with December 31, 2016, primarily due to increased Industrial Inkjet and Productivity Software revenue as a percentage of consolidated revenue, sales with extended payment terms, and a non-linear sales cycle resulting in significant billings at the end of the quarter. Industrial Inkjet and Productivity Software were 73% of consolidated revenue during the year ended December 31, 2017, compared with 72% and 66% of consolidated revenue during the years ended December 31, 2016 and 2015, respectively. We calculate DSO by dividing net accounts receivable at the end of the quarter by revenue recognized during the quarter, multiplied by the total days in the quarter, which is a measure of the relationship between sales and accounts receivable.
30
Table of Contents
Acquisitions may result in unanticipated accounting charges or otherwise adversely affect our results of operations and result in difficulties assimilating and integrating operations, personnel, technologies, products, and information systems of acquired businesses.
We seek to develop new technologies and products from both internal and external sources. We have also purchased companies and businesses for the primary purpose of acquiring their customer base. As part of this effort, we have in the past made, and will likely continue to make, acquisitions of other businesses.
Acquisitions involve numerous risks, such as:
| • | difficulties integrating operations, employees, technologies, products, information systems, and the required focus of management attention, time, and effort to accomplish successful integration; |
| • | information systems may be inadequate to operate the business of the acquired company until we are able to integrate the acquired business into our information technology system; |
| • | integration of acquired business into our information system may be delayed, which may limit our ability to manage the acquired business and implement financial and operational controls; |
| • | information systems may be poorly maintained by the acquired business; |
| • | risk of entering markets in which we have little or no prior experience, or entering markets where competitors have stronger market positions; |
| • | possible write-downs of impaired assets; |
| • | changes in the fair value of contingent consideration; |
| • | possible restructuring of personnel or leased facilities; |
| • | potential loss of key employees of the acquired company; |
| • | possible overruns (compared to expectations) relative to the expense levels and cash outflows of the acquired business; |
| • | adverse reactions by customers, suppliers, or parties transacting business with the acquired company or us; |
| • | risk of negatively impacting stock analyst ratings; |
| • | potential litigation or any administrative proceedings arising from prior transactions or prior actions of the acquired company; |
| • | inability to protect or secure technology rights; |
| • | possible overruns of direct acquisition and integration costs; and |
| • | equity securities issued in connection with acquisitions may be dilutive to our existing stockholders unless mitigating actions are taken such as treasury stock purchases; alternatively, acquisitions made entirely or partially for cash will reduce cash reserves. |
Mergers and acquisitions of companies are inherently risky. We cannot provide assurance that previous or future acquisitions will be successful or will not harm our business, operating results, financial condition, or stock price.
We face risks relating to the potential impairment of goodwill and long-lived assets.
We complete a review of the carrying value of our goodwill and long-lived assets annually and, based on a combination of factors (i.e., triggering events), we may be required to perform an interim analysis.
Given the uncertainty of the economic environment and its potential impact on our business, there can be no assurance that our estimates and assumptions regarding the duration of any economic downturn, or the period or
31
Table of Contents
strength of any subsequent recovery, made for purposes of our goodwill impairment testing at December 31, 2017 will prove to be accurate predictions of the future. If our assumptions regarding forecasted revenue or gross profit rates are not achieved, we may be required to record additional goodwill impairment charges in future periods relating to any of our reporting units, whether in connection with the next annual impairment testing in the fourth quarter of 2018 or prior to that, if an interim triggering event were to occur. It is not possible to determine if any such future impairment charge would result or, if it does, whether such charge would be material. No foreshadowing events have occurred as of December 31, 2017.
During the fourth quarter of 2017, management approved a plan to sell approximately 31.5 acres of land and two related manufacturing buildings located in Meredith, New Hampshire (“Meredith facility”). The fair value of the Meredith facility, based on expected sales proceeds less cost to sell, is estimated to be less than the carrying amount of the assets. As a result, we incurred an impairment loss of approximately $0.9 million in our consolidated results of operations for the year ended December 31, 2017. We may be required to record additional impairment charges if the sales proceeds for the Meredith facility do not meet our expectations. We may also need to record impairment charges if we decide to sell or dispose of other long-term assets.
We are currently subject to securities lawsuits and we may be subject to similar or other litigation in the future, which may divert management’s attention and have a material adverse effect on our business, financial condition, and results of operations.
The market price of our common stock declined significantly following our August 3, 2017 announcement concerning our assessment of the timing of recognition of revenue and the effectiveness of our current and historical disclosure controls and internal control over financial reporting. On August 10, 2017, a purported class action lawsuit was filed alleging, among other things, that we and certain of our officers violated federal securities laws by making allegedly false and misleading statements concerning our financial reporting, revenue recognition, internal controls, and disclosure controls and procedures, prior to our August 3, 2017 announcement. The plaintiffs seek unspecified monetary damages on behalf of the putative class and an award of costs and expenses, including attorney’s fees. In addition, on August 22, 2017, a shareholder derivative complaint was filed alleging, among other things that certain of our officers and our directors had breached fiduciary duties and had been unjustly enriched and had made allegedly false and misleading statements concerning our financial reporting, revenue recognition, internal controls, and disclosure controls and procedures. The complaint alleges that the Company has suffered damages and seeks an unspecified amount of damages, restitution, and declaratory and other relief.
We cannot predict the outcome of these lawsuits and we may be subject to other similar litigation in the future. Monitoring and defending against legal actions, whether or not meritorious, is time-consuming for our management and detracts from our ability to fully focus our internal resources on our business activities. In addition, we may incur substantial legal fees and costs in connection with litigation. Although we maintain insurance coverage, recovery could be denied or prove to be insufficient. We are not currently able to estimate the possible cost to us from the currently pending lawsuits, and we cannot be certain how long it may take to resolve these matters or the possible amount of any damages that we may be required to pay. We have not established any reserves for any potential liability relating to these or future lawsuits. It is possible that we could, in the future, incur judgments or enter into settlements of claims for monetary damages. A decision adverse to our interests on these actions could result in the payment of substantial damages and could have a material adverse effect on our business, results of operations, and financial condition. In addition, the uncertainty of the currently pending lawsuits could lead to more volatility in our stock price.
We are subject to numerous federal, state, and foreign employment laws and may face claims in the future under such laws.
We are subject to numerous federal, state, and foreign employment laws and from time to time face claims by our employees and former employees under such laws. There are no material claims pending or threatened
32
Table of Contents
against us under federal, state, or foreign employment laws, but we cannot be sure that material claims under such laws will not be made in the future against us, nor can we predict the likely impact of any such claims on us, or that, if asserted, we would be able to successfully resolve any such claims without incurring significant expense.
We may be unable to adequately protect our proprietary information and may incur expenses to defend our proprietary information.
We rely on copyright, patent, trademark, and trade secret protection, in addition to nondisclosure agreements, licensing, and cross-licensing arrangements to establish, maintain, and protect our intellectual property rights, all of which afford only limited protection. We have patents and pending patent applications in the U.S. and various foreign countries. There can be no assurance that patents will issue from our pending applications or from any future applications, or that, if issued, any claims allowed will be sufficiently broad to protect our technology. Any failure to adequately protect our proprietary information could harm our financial condition and operating results. We cannot be certain that any patents that have been, or may in the future be issued to us, or which we license from third parties, or any other proprietary rights will not be challenged, invalidated, or circumvented. In addition, we cannot be certain that any rights granted to us under any patents, licenses, or other proprietary rights will provide adequate protection of our proprietary information.
Many countries in which we derive revenue do not have comprehensive and highly developed legal systems, particularly with respect to the protection of intellectual property rights, which, among other things, can result in a prevalence of infringing products and counterfeit goods in certain countries, which could harm our business and reputation.
As different areas of our business change or mature, from time to time we evaluate our patent portfolio and decide to either pursue or not pursue specific patents and patent applications related to such areas. Choosing not to pursue certain patents, patentable applications, and failing to file applications for potentially patentable inventions, may harm our business by, among other things, enabling our competitors to more effectively compete with us, reducing potential claims we can bring against third parties for patent infringement, and limiting our potential defenses to intellectual property claims brought by third parties.
Litigation has been, and may continue to be, necessary to defend and enforce our proprietary rights. Such litigation, whether or not concluded successfully, could involve significant expense and the diversion of our attention and other resources, which could harm our financial condition and operating results.
We face risks from third party claims of infringement and potential litigation.
Third parties have claimed in the past, and may claim in the future, that our products infringe, or may infringe, their proprietary rights. Such claims have resulted in lengthy and expensive litigation in the past and could have a similar result in the future. Such claims and any related litigation, whether or not we are successful in the litigation, could result in substantial costs and diversion of our resources, which could harm our financial condition and operating results. Although we may seek licenses from third parties covering intellectual property that we are allegedly infringing, we cannot assure that any such licenses could be obtained on acceptable terms, if at all.
We may be subject to risk of loss due to fire because certain materials we use in our ink formulation process are flammable.
We use flammable materials in the digital UV curable and ceramic digital ink formulation process; therefore, we may be subject to risk of loss resulting from fire. The risk of fire associated with these materials cannot be completely eliminated. We own certain facilities that manufacture or warehouse our ink, which increases our exposure to such risk. We maintain insurance policies to cover losses caused by fire, including business
33
Table of Contents
interruption insurance. If one or more of these facilities is damaged or otherwise ceases operations as a result of fire, it would reduce our digital UV curable and ceramic digital ink manufacturing capacity, which may reduce revenue and adversely affect our business.
The location and concentration of our facilities subject us to risk of earthquakes, floods, or other natural disasters.
Our corporate headquarters, including a significant portion of our research and development facilities, are located in the San Francisco Bay Area, which is known for seismic activity. This area has also experienced flooding in the past. Many of the components necessary for our products are purchased from suppliers based in areas that are subject to risk from natural disasters including the San Francisco Bay Area, China, and Japan. A significant natural disaster, such as an earthquake, flood, tsunami, hurricane, typhoon, or other business interruptions due, for example, to power shortages and other interruptions have harmed our business, financial condition, and operating results in the past and could do so again in the future.
We may be subject to environmental-related liabilities due to our use of hazardous materials and solvents.
Our business operations involve the use of certain hazardous materials at eight locations. We formulate UV curable, reactive dye, and ceramic ink at four locations and store UV curable, ceramic, solvent, and thermoforming ink, as well as a variety of textile ink including dye sublimation, pigmented, reactive dye, acid dye, and water-based dispersed printing ink at eight locations. We formulate and market ceramic solvent-based ink at our facility in Ypsilanti, Michigan. The solvents used in ceramic digital ink formulation have low volatility by design. As a result, ceramic digital ink poses less environmental risk compared with true solvent ink. We launched internal formulation of reactive dye ink during 2016 at our facility in Bedford, U.K. Reactive dye is a water-based dye.
The hazardous materials and solvents that we use are subject to various governmental regulations relating to their transfer, handling, packaging, use, and disposal. We store ink at warehouses worldwide, including Europe, China, Israel, the U.K., and the U.S., and shipping companies distribute ink at our direction. We face potential liability for problems such as large spills or fires that may arise at ink manufacturing locations. While we customarily obtain insurance coverage typical for this kind of risk, such insurance may not be sufficient. If we fail to comply with these laws or an accident involving our ink waste or chemicals occurs, or if our insurance coverage is not sufficient, then our business and financial results could be harmed.
Future sales of our products could be limited if we do not comply with current and future environmental and chemical content regulations.
We believe that our products are currently compliant with RoHS, WEEE, REACH, and other regulations for the European Union as well as with China RoHS and other applicable international, U.S., state, and local environmental regulations. We monitor environmental compliance regulations to ensure that our products are fully compliant prior to the implementation of any potential new requirements. However, new unforeseen legislation could require us to re-engineer our products, complete costly analyses, or perform supplier surveys, which could harm our business and negatively impact our financial results. We could also incur additional costs, sanctions, and liabilities in connection with non-compliant product recalls, regulatory fines, and exclusion of non-compliant products from certain markets.
Environmental regulations and their enforcement have tightened in China, which has resulted in the closure of facilities without notice. Although such closures have not occurred with respect to our suppliers, the unexpected shutdown of supplier factories in China may impact our supply of raw material for digital inkjet ink. Some of our ceramic printing customers in China have experienced plant closures due to stricter environmental enforcement, which has impacted our sales of ceramic ink and may impact our sales in the future.
34
Table of Contents
Our products may contain defects, which are not discovered until after shipping, which could subject us to warranty claims in excess of our warranty reserves.
Our products consist of hardware and software developed by ourselves and others, which may contain undetected defects. We have in the past discovered software and hardware defects in certain of our products after their introduction, resulting in warranty expense and other expenses incurred in connection with rectifying such defects or, in certain circumstances, replacing the defective product, which may damage our relationships with our customers. Defects could be found in new versions of our products after commencement of commercial shipment and any such defects could result in a loss or delay in market acceptance of such products and thus harm our reputation and revenue. Defects in our products (including defects in licensed third-party software) detected prior to new product releases could result in delays in the introduction of new products and the incurrence of additional expense, which could harm our operating results. We generally provide a thirteen-month hardware limited warranty commencing upon installation for certain Industrial Inkjet printers, which may cover both parts and labor. Our Fiery DFE limited warranty is 12 to 15 months.
Our standard warranties contain limits on damages and exclusions, including but not limited to alteration, modification, misuse, mishandling, and storage or operation in improper environments. While we recorded an accrual of $16.3 million at December 31, 2017, for estimated warranty costs that are estimable and probable based on historical experience, we may incur additional costs of revenue and operating expenses if our warranty provision does not reflect adequately the cost to resolve or repair defects in our products or if our liability limitations are declared enforceable, which could harm our business, financial condition, and operating results.
Actual or perceived security vulnerabilities in our products could adversely affect our revenue.
Maintaining the security of our software and hardware products is an issue of critical importance to our customers and for us. There are individuals and groups who develop and deploy viruses, worms, and other malicious software programs that could attack our products. Although we take preventive measures to protect our products, and we have a response team that is notified of high risk malicious events, these procedures may not be sufficient to mitigate damage to our products. Actual or perceived security vulnerabilities in our products could lead some customers to seek to return products, reduce or delay future purchases, or purchase competitive products. Customers may also increase their expenditures to protect their computer systems from attack, which could delay or reduce purchases of our products. Any of these actions or responses by customers could adversely affect our revenue.
System failures, or system unavailability, could harm our business.
We rely on our network infrastructure, internal and external technology systems and websites for our operations, development, marketing, support, and sales activities. These systems are also subject to potential disruptions and acts of vandalism. Any event that causes failures or interruption in our hardware or software systems could harm our business, financial condition, and operating results.
Our business could be adversely impacted in the event of a failure of our information technology infrastructure or adversely impacted by a successful cyber-attack.
We have experienced cyber security threats, threats to our information technology infrastructure and unauthorized attempts to gain access to our sensitive information. Prior cyber-attacks directed at us have not had a material impact on our business or financial results; however, this may not continue to be the case in the future. Cyber security assessment analyses undertaken by us have identified and prioritized steps to enhance our cyber security safeguards. We are in the process of implementing these recommendations. Nevertheless, there can be no assurance that we will adequately protect our information or that we will not experience any future successful attacks. Due to the evolving nature of security threats, the impact of any future incident cannot be predicted, and we may be required to expend significant additional resources to modify our cyber security protective measures,
35
Table of Contents
to investigate and remediate vulnerabilities or other exposures or to make required notifications. In addition, we may be subject to litigation and financial losses. These costs related to cyber or other security threats or disruptions may not be fully insured or indemnified by other means. Occurrence of any of these events could adversely affect our operations, the services we provide to our customers, our financial results or our reputation; or such events could result in the loss of competitive advantages derived from our research and development efforts or other intellectual property or early obsolescence of our products and services.
We identified material weaknesses in our internal control over financial reporting as of December 31, 2017 and 2016, and the occurrence of these or any other material weaknesses could have a material adverse effect on our ability to report accurate financial information in a timely manner.
As described in “Item 9A, Controls and Procedures”, our management concluded that we had material weaknesses in our internal control over financial reporting as of December 31, 2017 and 2016 related to operational changes, which may impact revenue recognition, insufficient staffing levels, and inventory valuation practices at our Italian manufacturing location. Therefore, we did not maintain effective internal control over financial reporting or effective disclosure controls and procedures, both of which are requirements of the Exchange Act, as of that date. A material weakness is a deficiency, or a combination of deficiencies, in internal control over financial reporting, such that there is a reasonable possibility that a material misstatement of our annual or interim financial statements will not be prevented or detected on a timely basis. Following the identification of the material weaknesses, management implemented remediation plans, which were ongoing as of December 31, 2017. Because there was insufficient time as of December 31, 2017, to demonstrate that the new controls implemented as part of the remediation plan were operating effectively as of that date, management concluded that the material weaknesses described in “Item 9A, Controls and Procedures”, still existed as of December 31, 2017.
The remedial measures we are undertaking may not be adequate to prevent future misstatements or avoid other control deficiencies or material weaknesses. The effectiveness of our internal control over financial reporting is subject to various inherent limitations, including cost limitations, judgments used in decision making, assumptions about the likelihood of future events, the soundness of our systems, the possibility of human error, and the risk of fraud. Moreover, projections of any evaluation of effectiveness to future periods are subject to the risk that controls may become inadequate because of changes in conditions and the risk that the degree of compliance with policies or procedures may deteriorate over time. Because of these limitations, there can be no assurance that any system of disclosure controls and procedures or internal control over financial reporting will be successful in preventing all errors or fraud or in making all material information known in a timely manner to the appropriate levels of management.
Our stock price has been volatile historically and may continue to be volatile.
The market price for our common stock has been and may continue to be volatile. During the twelve months ended December 31, 2017, the price of our common stock as reported on The NASDAQ Global Select Market ranged from a low of $25.54 to a high of $51.15. We expect our stock price to be subject to fluctuations as a result of a variety of factors, including factors beyond our control. These factors include:
| • | actual or anticipated variations in our quarterly or annual operating results; |
| • | ability to initiate or complete stock repurchase programs; |
| • | announcements of technological innovations or new products or services by our competitors or by us; |
| • | announcements relating to strategic relationships, acquisitions, or investments; |
| • | announcements by our customers regarding their businesses or the products in which our products are included; |
| • | changes in financial estimates or other statements by securities analysts; |
36
Table of Contents
| • | any failure to meet security analyst expectations; |
| • | changes in the securities analysts’ rating of our securities; |
| • | terrorist attacks and the affects of military engagements or natural disasters; |
| • | commencement of litigation or adverse results of pending litigation; |
| • | changes in the financial performance and/or market valuations of other software and high technology companies; and |
| • | changes in general economic conditions. |
Because of this volatility, we may fail to meet the expectations of our stockholders or of securities analysts from time to time and the trading price of our securities could decline as a result. The stock market has experienced significant price and volume fluctuations that have particularly affected the trading prices of equity securities of many high technology companies. These fluctuations have often been unrelated or disproportionate to the operating performance of these companies. Any negative change in the public’s perception of high technology companies could depress our stock price regardless of our operating results.
The value of our investment portfolio is subject to interest rate volatility.
We maintain an investment portfolio of fixed income debt securities classified as available-for-sale securities. As a result, our investment portfolio is subject to counterparty risk and volatility if market interest rates fluctuate.
We attempt to limit our exposure to interest rate risk by investing in securities with maturities of less than three years; however, we may be unable to successfully limit our risk to interest rate fluctuations. This may cause volatility in our investment portfolio value.
We are partially self-insured for certain losses related to employee medical and dental coverage. Our self-insurance reserves may not be adequate to cover our medical and dental claim liabilities.
We are partially self-insured for certain losses related to employee medical and dental coverage, excluding employees covered by health maintenance organizations. We generally have a stop loss deductible of $0.5 million per enrollee. We have accrued a contingent liability of $0.9 million as of December 31, 2017, which is not discounted, based upon examination of historical trends, historical actuarial analysis, our claims experience, total plan enrollment (including employee contributions), population demographics, and other various estimates. Although we do not expect that we will ultimately pay claims significantly different from our estimates, self-insurance reserves, net income (loss), and cash flows could be materially affected if future claims differ significantly from our historical trends and assumptions.
Our stock repurchase program could affect our stock price and add volatility.
In November 2015, our board of directors authorized $150 million for the repurchase of our outstanding common stock. This authorization expires December 31, 2018. On September 11, 2017, the board of directors approved the repurchase of an additional $125 million for our share repurchase program commencing September 11, 2017. At that time, $28.8 million remained available for repurchase under the 2015 authorization. The 2017 authorization thereby increased the repurchase authorization to $153.8 million of our common stock. As of December 31, 2017, $109.4 million remained available for repurchase under this authorization.
Any repurchases pursuant to our stock repurchase program could affect our stock price and add volatility. There can be no assurance that repurchases will be made at the best possible price. Potential risks and uncertainties also include, but are not necessarily limited to, the amount and timing of future stock repurchases and the origin of funds used for such repurchases. The existence of a stock repurchase program could also cause our stock price to
37
Table of Contents
be higher than it would be in the absence of such a program and could potentially reduce the market liquidity for our stock. Depending on market conditions and other factors, these repurchases may be commenced or suspended from time to time. Any such suspension could cause the market price of our stock to decline.
Our profitability may be affected by unanticipated changes in our tax provisions, the adoption of new U.S. or foreign tax legislation, or exposure to additional income tax liabilities.
We are subject to income taxes in the U.S. and many foreign countries. Intercompany transaction pricing can impact our tax liabilities. We are potentially subject to tax audits in various countries and tax authorities may disagree with our tax treatments, including intercompany pricing or other matters, and assess additional taxes. We regularly review the likely outcomes of these audits to determine whether our tax provisions are sufficient. However, there can be no assurance that we will accurately predict the outcomes of these audits, and the final assessments of these audits can have a material impact on our net income (loss).
Our effective tax rate in the future may be impacted by changes in the mix of earnings in countries with differing statutory tax rates, changes in the valuation of deferred tax assets and liabilities, changes in tax laws, new information discovered during the preparation of our tax returns, deemed repatriation of foreign earnings, and enactment of future U.S. and foreign tax legislative initiatives, such as tax reform legislation (“2017 Tax Act”) enacted on December 22, 2017 in the United States (“U.S.”) or multi-jurisdictional actions to address “base erosion and profit-shifting” by multinational companies. The Organisation for Economic Co-operation and Development, or OECD, issued a series of reports on October 5, 2015 recommending changes to numerous well-established tax principles. These recommendations, if adopted by various OECD countries in which we do business, could adversely affect our effective tax rate.
The 2017 Tax Act will have a broad range impact on our tax liability, current business deductions, and the U.S. taxation of income earned by our foreign subsidiaries. Many of the provisions significantly differ from current U.S. tax law resulting in changes to tax reporting and potentially increasing tax liabilities incurred.
On December 22, 2017, the 2017 Tax Act was enacted, which includes a broad range of changes affecting businesses, including corporate tax rates, business deductions, and international tax provisions. Many of the provisions significantly differ from current U.S. tax law. The enactment of the 2017 Tax Act requires companies to recognize the effects of changes in tax law and rates on deferred tax assets and liabilities and the retroactive effects of changes in tax laws in the period in which the new legislation is enacted in accordance with Accounting Standards Codification (“ASC”) 740, Income Taxes. These effects of changes in tax law are recorded as a discrete item and part of tax expense or benefit in continuing operations, regardless of the category of income or loss to which the deferred taxes relate.
In accordance with SEC Staff Accounting Bulletin (“SAB”) 118, we determined that measurement of certain income tax effects can be reasonably estimated at December 31, 2017, and we recorded a $27.5 million charge in the fourth quarter of 2017 as a provisional estimate. While we have calculated a reasonable estimate of the impact of the U.S. tax rate reduction and the amount of the deemed repatriation transition tax, we are still gathering additional information to refine and finalize our calculation of the impacts on our U.S. deferred tax assets and liabilities, the deemed repatriation transition tax, and other provisions associated with the 2017 Tax Act. Changes to these estimates and provisional amounts may affect our financial results.
The 2017 Tax Act also will also significantly impact the year ending December 31, 2018, including, but not limited to the reduction of the U.S. federal corporate tax rate from 35% to 21%, a minimum tax to address base erosion and profit shifting from the U.S., the elimination of U.S. federal income taxes on dividends from foreign subsidiaries, a new tax on global intangible low-tax income (“GILTI”), a limitation of deductible interest expense, and the repeal of the domestic production activity deduction. There are additional limitations imposed on the deductibility of certain executive compensation, the use of foreign tax credits to reduce U.S. income tax
38
Table of Contents
liabilities, and the utilization of net operating losses generated after December 31, 2017. These changes in tax law may affect both our financial results and our taxes paid.
We may not have the ability to raise the funds necessary to settle conversions of our 0.75% Convertible Senior Notes due 2019 (“Notes”) in cash, repay the Notes at maturity, or repurchase the Notes upon a fundamental change.
In September 2014, we completed a private placement of $345 million principal amount of Notes. Holders of the Notes will have the right to require us to repurchase all or a portion of their Notes upon the occurrence of a fundamental change at a repurchase price equal to 100% of the principal amount of the Notes to be repurchased, plus accrued and unpaid interest, if any, as described in Note 7—Convertible Senior Notes, Note Hedges, and Warrants of the Notes to Consolidated Financial Statements.
Upon conversion of the Notes, we will be required to make conversion payments in cash, unless we elect to deliver solely shares of our common stock to settle such conversion, as described in Note 7—Convertible Senior Notes, Note Hedges, and Warrants of the Notes to Consolidated Financial Statements. Moreover, we will be required to repay the Notes in cash at their maturity, unless earlier converted or repurchased. However, we may not have enough available cash or be able to obtain financing when the Notes are to be repurchased, converted, or at their maturity.
The conditional conversion feature of the Notes, if triggered, may adversely affect our financial condition and results of operations.
In the event the conditional conversion feature of the Notes is triggered, holders of Notes will be entitled to convert the Notes at any time during specified periods at their option. If one or more holders elect to convert their Notes, unless we elect to satisfy our conversion obligation by delivering solely shares of our common stock, we would be required to settle all or a portion of the conversion obligation through the payment of cash, which could adversely affect our liquidity. Even if holders do not elect to convert their Notes, we could be required under applicable accounting rules to reclassify all or a portion of the outstanding principal of the Notes as a current liability, which would result in a material reduction of our net working capital.
The accounting method for convertible debt securities that may be settled in cash (such as the Notes) could have a material effect on our reported financial results.
Financial Accounting Standards Board (“FASB”) ASC 470-20, Debt with Conversion and Other Options, requires us to separately account for the liability and equity components of the Notes that may be settled entirely or partially in cash upon conversion in a manner that reflects our non-convertible debt interest rate. Accordingly, the equity component of the Notes is included in additional paid-in capital within stockholders’ equity in our Consolidated Balance Sheet and the value of the equity component is treated as original issue discount for purposes of accounting for the debt component of the Notes. As a result, we are required to recognize non-cash interest expense in our Consolidated Statement of Operations in current and future periods as a result of the amortization of the discounted carrying value of the Notes to their principal amount over their term. We will report lower net income (loss) because ASC 470-20 requires interest to include both the current period’s amortization of the original issue discount and the Notes’ non-convertible interest rate. This could adversely affect our future consolidated financial results, the trading price of our common stock, and the trading price of the Notes.
Under certain circumstances, in calculating earnings per share, convertible debt instruments (such as the Notes) that may be settled entirely or partially in cash are accounted for utilizing the treasury stock method. The effect of the treasury stock method is that the shares of common stock issuable upon conversion of the Notes, if any, are not included in the calculation of diluted earnings per share except to the extent that the conversion value of the Notes exceeds their principal amount. Under the treasury stock method, diluted earnings per share is calculated
39
Table of Contents
as if the number of shares of common stock that would be necessary to settle such excess were issued, if we elected to settle such excess in shares. We cannot be sure that accounting standards will continue to permit the use of the treasury stock method in the future. If we are unable to use the treasury stock method in accounting for the shares issuable upon conversion of the Notes, if any, then our diluted consolidated earnings per share would be adversely affected.
Certain provisions contained in our amended and restated certificate of incorporation, our amended and restated bylaws, and under Delaware law could delay or impair a change in control.
Certain provisions in our amended and restated certificate of incorporation and amended and restated bylaws could have the effect of rendering more difficult or discouraging an acquisition of the Company deemed undesirable by our board of directors. Our amended and restated certificate of incorporation allows the board of directors to issue preferred stock, which may include powers, preferences, privileges, and other rights superior to our common stock, thereby limiting our stockholders’ ability to transfer their shares and may affect the price they are able to obtain. Our amended and restated bylaws do not allow stockholders to call special meetings and include, among other things, procedures for advance notification of stockholder nominations and proposals, which may have the effect of delaying or impairing attempts by our stockholders to remove or replace management, to commence proxy contests, or to effect changes in control or hostile takeovers of the Company.
As a Delaware corporation, we are subject to Delaware law, including Section 203 of the Delaware General Corporation Law, which imposes restrictions on certain transactions between a corporation and certain significant stockholders. These provisions could also have the effect of delaying or impairing the removal or replacement of management, proxy contests, or changes in control. Any provision of our amended and restated certificate of incorporation and amended and restated bylaws that has the effect of delaying or impairing a change in control of the Company could limit the opportunity for our stockholders to receive a premium for their shares of our common stock and could affect the price that certain investors may be willing to pay for our common stock.
Item 1B: Unresolved Staff Comments:
None.
40
Table of Contents
As of December 31, 2017, we owned or leased a total of approximately 1.7 million square feet worldwide. The following table sets forth the location, size, and use of our principal facilities (square footage in thousands):
| Location |
Square Footage |
Leased or Owned |
Operating Segment | Principal Uses | ||||||
| Fremont, California (6750 Dumbarton Circle) |
119 | Owned | Corporate & Fiery | Corporate offices, design engineering, product testing, sales, marketing, customer service | ||||||
| Fremont, California (6700 Dumbarton Circle) |
59 | Leased | Fiery | Administrative offices, design engineering, product testing | ||||||
| Manchester, New Hampshire |
225 | Leased * | Industrial Inkjet | Manufacturing (VUTEk), design engineering, sales, customer service | ||||||
| Bergamo, Italy |
168 | Leased | Industrial Inkjet | Manufacturing (Reggiani textile printers), design engineering, sales, customer service | ||||||
| Meredith, New Hampshire |
163 | Owned ** | Industrial Inkjet | Manufacturing (Industrial Inkjet printers), design engineering, sales, customer service | ||||||
| Castellon, Spain |
127 | Leased *** | Industrial Inkjet | Manufacturing, (Cretaprint), administrative, design engineering, sales, customer service | ||||||
| Bangalore, India |
118 | Leased | All | Administrative, design engineering, customer service, software engineering | ||||||
| Ypsilanti, Michigan |
106 | Leased | Industrial Inkjet | Manufacturing (digital UV & ceramic ink), design engineering, sales, customer service | ||||||
| Ossipee, New Hampshire |
53 | Leased | Industrial Inkjet | Warehouse (90% dedicated space - fixed fee) | ||||||
| Eagan, Minnesota |
44 | Owned | Fiery & Productivity Software |
Administrative, design engineering, customer service, software engineering | ||||||
| Belmont, New Hampshire |
40 | Leased | Industrial Inkjet | Warehouse | ||||||
| Brussels, Belgium |
39 | Leased | Industrial Inkjet | Sales, Industrial Inkjet demonstration center | ||||||
| Laconia, New Hampshire |
34 | Leased | Industrial Inkjet | Warehouse | ||||||
| Tempe, Arizona |
32 | Leased | Fiery & Productivity Software |
Manufacturing, (Fiery), distribution, customer service | ||||||
| Bradford, UK |
32 | Owned | Industrial Inkjet | Manufacturing (dye powders and color products for Industrial Inkjet printers), design engineering, sales, customer service | ||||||
| Rosh Ha’Ayin, Israel |
31 | Leased | Industrial Inkjet | Manufacturing (Industrial Inkjet printers), design engineering, sales, customer service | ||||||
| Norcross, Georgia |
29 | Leased | Fiery & Productivity Software |
Design engineering, sales, customer service, quality assurance, and software engineering | ||||||
| Ratingen, Germany |
27 | Leased | Fiery & Productivity Software |
Software engineering, sales, customer service | ||||||
| Schiphol-Rijk, The Netherlands |
19 | Leased | Industrial Inkjet | EMEA corporate offices, sales, support services | ||||||
| Pittsburgh, Pennsylvania |
18 | Leased | Productivity Software |
EPS corporate offices, design engineering, sales | ||||||
| Shanghai, China |
16 | Leased | Industrial Inkjet | APAC corporate offices, Industrial Inkjet demonstration center | ||||||
| Rosh Ha’Ayin, Israel |
14 | Leased | Productivity Software |
3D textile design and production | ||||||
| San Diego, California |
12 | Leased | Productivity Software |
Software engineering, sales, customer service | ||||||
| Foshan, China |
10 | Leased | Industrial Inkjet | Administrative, sales, customer service | ||||||
| Richmond Hill, Ontario, Canada |
10 | Leased | Fiery | Design engineering, sales, customer service | ||||||
| * | We entered into a six-year lease with BTMU whereby a 225,000 square foot manufacturing and warehouse facility is under construction in Manchester, New Hampshire, related to our super-wide and wide format industrial digital inkjet printer business, which is scheduled to be completed in the first half of 2018. |
The lease commenced on August 26, 2016. We leased 16.9 acres of land related to this manufacturing and warehouse lease. See Note 15—Property and Equipment, net, of the Notes to Consolidated Financial Statements.
| ** | During the fourth quarter of 2017, management adopted a plan to sell approximately 31.5 acres of land and the related manufacturing building located in Meredith, New Hampshire. Assets previously recorded within Property and equipment, net, with a net book value of $5.1 million have been reclassified to assets held for sale in our Consolidated Balance Sheet as of December 31, 2017. |
| *** | Includes an additional 65,000 square feet expansion of our ceramic tile decoration industrial digital inkjet printer manufacturing and warehouse facility in Castellon, Spain, which was completed during January 2018. The expansion was built and fully financed by the lessor. We do not have any obligations related to this additional space other than rent payments that commenced upon completion of construction. |
41
Table of Contents
In addition to the facilities listed above, we leased 49 additional domestic and international regional operations and sales offices, excluding facilities that have been fully reserved and subleased, and we own an additional international sales office building. We believe that our facilities, in general, are adequate for our present needs. We do not expect that we would experience difficulties in obtaining additional space at fair market rates, if the need arose.
We may be involved, from time to time, in a variety of claims, lawsuits, investigations, or proceedings relating to contractual disputes, securities laws, intellectual property rights, employment, or other matters that may arise in the normal course of business. We assess our potential liability in each of these matters by using the information available to us. We develop our views on estimated losses in consultation with inside and outside counsel, which involves a subjective analysis of potential results and various combinations of appropriate litigation and settlement strategies. We accrue estimated losses from contingencies if a loss is deemed probable and can be reasonably estimated.
As of December 31, 2017, we are subject to the matters discussed below.
Matan Digital Printing Ltd. (“MDG”) Matter
EFI acquired Matan in 2015 from sellers (the “2015 Sellers”) that acquired MDG from other sellers in 2001 (the “2001 Sellers”). The 2001 Sellers have asserted a claim against the 2015 Sellers and Matan asserting that they are entitled to a portion of the 2015 Sellers’ proceeds from EFI’s acquisition. The 2015 Sellers dispute this claim and have agreed to indemnify EFI against the 2001 Sellers’ claim.
Although we are fully indemnified and we do not believe that it is probable that we will incur a loss, it is reasonably possible that our financial statements could be materially affected by the unfavorable resolution of this matter. Accordingly, it is reasonably possible that we could incur a material loss in this matter. We estimate the range of loss to be between one dollar and $10.1 million. If we incur a loss in this matter, it will be offset by a receivable of an equal amount representing a claim for indemnification against the escrow account established in connection with the Matan acquisition.
Purported Class Action Lawsuit
On August 10, 2017, a putative class action was filed against the Company and its two named executive officers in the United States District Court for the District of New Jersey, captioned Pipitone v. Electronics For Imaging, Inc., No. 2:17-cv-05992 (D.N.J.) and a first amended complaint was filed on February 20, 2018. The complaint alleges, among other things, that statements by the Company and its officers about the Company’s financial reporting, revenue recognition, internal controls, and disclosure controls and procedures were false or misleading. The complaint seeks an unspecified amount of damages, interest, attorneys’ fees, and other costs, on behalf of a putative class of individuals and entities that purchased or otherwise acquired EFI securities from February 22, 2017 through August 3, 2017.
At this time, we do not believe it is probable that we will incur a material loss in this matter. However, it is reasonably possible that our financial statements could be materially affected by an unfavorable resolution of this matter. Because this matter is in the preliminary stages, we are not yet in a position to estimate the amount or range of reasonably possible loss that may be incurred.
Shareholder Derivative Lawsuit
On August 22, 2017, a shareholder derivative complaint was filed in the Superior Court of the State of California for the County of Alameda captioned Schiffmiller v. Gecht, No. RG17873197. The complaint makes claims derivatively and on behalf of the Company as nominal defendant against the Company’s named executive officers and directors for alleged breaches of fiduciary duties and unjust enrichment, and alleges, among other
42
Table of Contents
things, that statements by the Company and its officers about the Company’s financial reporting, revenue recognition, internal controls, and disclosure controls and procedures were false or misleading. The complaint alleges the Company has suffered damage as a result of the individual defendants’ alleged actions, and seeks an unspecified amount of damages, restitution, and declaratory and other relief. The derivative action has been stayed pending the resolution of the Pipitone class action described above.
At this time, we do not believe it is probable that we will incur a material loss in this matter. However, it is reasonably possible that our financial statements could be materially affected by an unfavorable resolution of this matter. Because this matter has been stayed pending resolution of the Pipitone class action described above, we are not yet in a position to estimate the amount or range of reasonably possible loss that may be incurred.
Other Matters
As of December 31, 2017, we were subject to various other claims, lawsuits, investigations, and proceedings in addition to the matters discussed above. There is at least a reasonable possibility that additional losses may be incurred in excess of the amounts that we have accrued. However, we believe that these claims are not material to our financial statements or the range of reasonably possible losses is not reasonably estimable. Litigation is inherently unpredictable, and while we believe that we have valid defenses with respect to legal matters pending against us, our financial statements could be materially affected in any particular period by the unfavorable resolution of one or more of these contingencies or because of the diversion of management’s attention and the incurrence of significant expenses.
Item 4: Mine Safety Disclosures
Not applicable.
PART II
Item 5: Market for Registrant’s Common Equity, Related Stockholder Matters and Issuer Purchases of Equity Securities
Our common stock has traded on The NASDAQ Global Select Market (formerly The NASDAQ National Market) under the symbol EFII since October 2, 1992. The table below lists the high and low sales price during each quarter the stock was traded in 2017 and 2016.
| 2017 | 2016 | |||||||||||||||||||||||||||||||
| Q1 | Q2 | Q3 | Q4 | Q1 | Q2 | Q3 | Q4 | |||||||||||||||||||||||||
| High |
$ | 49.38 | $ | 51.15 | $ | 49.76 | $ | 43.89 | $ | 46.17 | $ | 46.26 | $ | 50.09 | $ | 49.72 | ||||||||||||||||
| Low |
$ | 43.08 | $ | 43.53 | $ | 25.54 | $ | 26.76 | $ | 35.88 | $ | 38.00 | $ | 40.34 | $ | 40.72 | ||||||||||||||||
As of January 29, 2018, there were 103 stockholders of record, excluding a substantially greater number of “street name” holders or beneficial holders of our common stock, whose shares are held of record by banks, brokers, and other financial institutions.
We did not declare or pay cash dividends on our common stock in either 2017 or 2016. We currently anticipate that we will retain all available funds for the operation of our business and do not plan to pay any cash dividends in the foreseeable future. We believe that the most strategic uses of our cash resources include business acquisitions, strategic investments to gain access to new technologies, repurchases of shares of our common stock, and working capital.
43
Table of Contents
Equity Compensation Plan Information
Information regarding our equity compensation plans may be found in Note 12—Employee Benefit Plans of the Notes to Consolidated Financial Statements and Item 12—Security Ownership of Certain Beneficial Owners and Management and Related Stockholder Matters of this Annual Report on Form 10-K and is incorporated herein by reference.
Repurchases of Equity Securities
Repurchases of equity securities during the year ended December 31, 2017 were as follows (in thousands except per share amounts):
| Fiscal month |
Total number of shares purchased (2) |
Average price paid per share |
Total number of shares purchased as part of publicly announced plans |
Approximate dollar value of shares that may yet be purchased under the plans (1) |
||||||||||||
| January 2017 |
178 | $ | 44.30 | 170 | $ | 68,262 | ||||||||||
| February 2017 |
253 | 46.17 | 163 | 60,795 | ||||||||||||
| March 2017 |
62 | 46.63 | 54 | 58,299 | ||||||||||||
| April 2017 |
158 | 48.22 | 148 | 51,145 | ||||||||||||
| May 2017 |
204 | 45.94 | 182 | 42,800 | ||||||||||||
| June 2017 |
40 | 47.24 | 32 | 41,302 | ||||||||||||
| July 2017 |
172 | 48.51 | 164 | 33,344 | ||||||||||||
| August 2017 |
159 | 39.70 | 107 | 28,802 | ||||||||||||
| September 2017 |
27 | 35.25 | — | 153,802 | ||||||||||||
| October 2017 |
248 | 41.48 | 246 | 143,599 | ||||||||||||
| November 2017 |
593 | 31.55 | 580 | 125,303 | ||||||||||||
| December 2017 |
520 | 30.62 | 519 | 109,415 | ||||||||||||
|
|
|
|
|
|
|
|
|
|||||||||
| Total |
2,614 | $ | 38.97 | 2,365 | $ | 109,415 | ||||||||||
|
|
|
|
|
|
|
|
|
|||||||||
| (1) | On September 11, 2017, the board of directors approved the repurchase of an additional $125 million for our share repurchase program commencing September 11, 2017 in addition to the $150 million previously authorized in November 2015. At that time, $28.8 million remained available for repurchase under the 2015 authorization. The 2017 authorization thereby increased the repurchase authorization to $153.8 million of our common stock. This authorization expires December 31, 2018. Under this publicly announced plan, we repurchased 2.4 million shares for an aggregate purchase price of $91.4 million during the year ended December 31, 2017. |
| (2) | Includes 0.2 million shares purchased from employees to satisfy the exercise price of certain stock options and any tax withholding obligations incurred in connection with such exercises and minimum tax withholding obligations that arose on the vesting of restricted stock units (“RSUs”). |
Comparison of Cumulative Total Return among Electronics For Imaging, Inc., NASDAQ Composite, and NASDAQ Computer Manufacturers Index
The stock price performance graph below includes information required by the SEC and shall not be deemed incorporated by reference by any general statement incorporating by reference in this Annual Report on Form 10-K into any filing under the Securities Act or under the Exchange Act, except to the extent the Company specifically incorporates this information by reference, and shall not otherwise be deemed soliciting material or filed under the Securities Act or the Exchange Act, or subject to the liabilities of Section 18 of the Exchange Act.
44
Table of Contents
The following graph compares cumulative total returns based on an initial investment of $100 in our common stock to the NASDAQ Composite and the NASDAQ Computer Manufacturers Index. The stock price performance shown on the graph below is not indicative of future price performance and only reflects the Company’s relative stock price for the five-year period ending on December 31, 2017. All values assume reinvestment of dividends and are calculated at December 31 of each year.
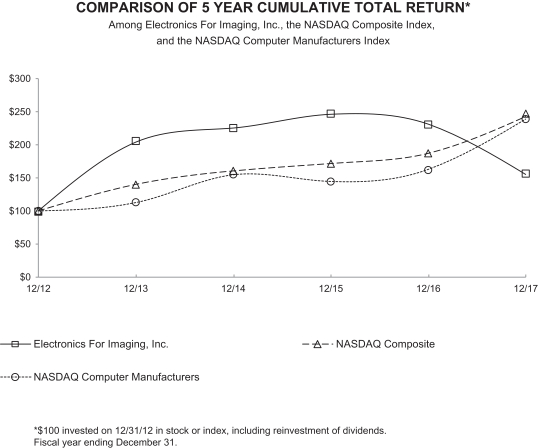
45
Table of Contents
Item 6: Selected Financial Data
The following table summarizes selected consolidated financial data as of and for the five years ended December 31, 2017. This information should be read in conjunction with Item 7, “Management’s Discussion and Analysis of Financial Condition and Results of Operations” and the audited consolidated financial statements and related notes thereto. For a more detailed description, see Part II, Item 7, “Management’s Discussion and Analysis of Financial Condition and Results of Operations.”
| For the years ended December 31, | ||||||||||||||||||||
| (in thousands, except per share amounts) |
2017 | 2016 | 2015 | 2014 | 2013 | |||||||||||||||
| Operations (1) |
||||||||||||||||||||
| Revenue |
$ | 993,260 | $ | 992,065 | $ | 882,513 | $ | 790,427 | $ | 727,693 | ||||||||||
|
|
|
|
|
|
|
|
|
|
|
|||||||||||
| Gross profit |
506,456 | 508,165 | 457,430 | 429,737 | 395,166 | |||||||||||||||
|
|
|
|
|
|
|
|
|
|
|
|||||||||||
| Income from operations (2) |
27,547 | 55,819 | 54,689 | 53,439 | 174,648 | |||||||||||||||
|
|
|
|
|
|
|
|
|
|
|
|||||||||||
| Net income (loss) (2) (3) (4) |
$ | (15,345 | ) | $ | 44,949 | $ | 32,199 | $ | 33,714 | $ | 109,107 | |||||||||
|
|
|
|
|
|
|
|
|
|
|
|||||||||||
| Earnings per share |
||||||||||||||||||||
| Net income (loss) per basic common share |
$ | (0.33 | ) | $ | 0.96 | $ | 0.68 | $ | 0.72 | $ | 2.34 | |||||||||
|
|
|
|
|
|
|
|
|
|
|
|||||||||||
| Net income (loss) per diluted common share |
$ | (0.33 | ) | $ | 0.94 | $ | 0.67 | $ | 0.70 | $ | 2.26 | |||||||||
|
|
|
|
|
|
|
|
|
|
|
|||||||||||
| Shares used in basic per-share calculation |
46,281 | 46,900 | 47,217 | 46,866 | 46,643 | |||||||||||||||
|
|
|
|
|
|
|
|
|
|
|
|||||||||||
| Shares used in diluted per-share calculation |
46,281 | 47,797 | 48,150 | 48,406 | 48,359 | |||||||||||||||
|
|
|
|
|
|
|
|
|
|
|
|||||||||||
| December 31, | ||||||||||||||||||||
| (in thousands) |
2017 | 2016 | 2015 | 2014 | 2013 | |||||||||||||||
| Financial Position |
||||||||||||||||||||
| Cash, cash equivalents, and short-term investments |
$ | 319,042 | $ | 459,741 | $ | 497,367 | $ | 616,732 | $ | 355,041 | ||||||||||
| Working capital (4) (5) (6) |
456,668 | 549,668 | 584,782 | 666,405 | 378,763 | |||||||||||||||
| Total assets (4) (5) |
1,458,001 | 1,478,929 | 1,448,246 | 1,297,422 | 1,026,384 | |||||||||||||||
| Convertible senior notes, net (5) (7) |
318,957 | 304,484 | 290,734 | 277,670 | — | |||||||||||||||
| Stockholders’ equity |
781,311 | 826,015 | 822,902 | 788,689 | 767,450 | |||||||||||||||
| (1) | Includes acquired company results of operations beginning on the date of each acquisition. See Note 3—Business Acquisitions of the Notes to Consolidated Financial Statements for a summary of recent acquisitions during the years ended December 31, 2017, 2016, and 2015. |
46
Table of Contents
| (2) | Income from operations includes the following: |
| December 31, | ||||||||||||||||||||
| (in thousands) |
2017 | 2016 | 2015 | 2014 | 2013 | |||||||||||||||
| Amortization of acquisition-related intangibles |
$ | 47,339 | $ | 39,560 | $ | 26,510 | $ | 20,673 | $ | 19,438 | ||||||||||
| Stock-based compensation expense |
26,532 | 31,826 | 34,071 | 36,061 | 25,770 | |||||||||||||||
| Restructuring and other costs |
7,562 | 6,731 | 5,731 | 6,578 | 4,834 | |||||||||||||||
| Revenue recognition and accounting review costs (9) |
6,443 | — | — | — | — | |||||||||||||||
| Litigation settlement expenses (recoveries) |
436 | 1,027 | 584 | 897 | (3,081 | ) | ||||||||||||||
| Change in fair value of contingent consideration |
6,472 | 6,939 | (2,135 | ) | (3,810 | ) | (5,742 | ) | ||||||||||||
| Acquisition-related transaction costs |
2,058 | 2,241 | 5,494 | 1,501 | 1,434 | |||||||||||||||
| Gain on sale of building and land (8) |
— | — | — | — | (117,216 | ) | ||||||||||||||
|
|
|
|
|
|
|
|
|
|
|
|||||||||||
| Total charges, net of recoveries |
$ | 96,842 | $ | 88,324 | $ | 70,255 | $ | 61,900 | $ | (74,563 | ) | |||||||||
|
|
|
|
|
|
|
|
|
|
|
|||||||||||
| (3) | Net income (loss) includes the following: |
| • | Tax provisional estimate of $27.5 million tax provision during the year ended December 31, 2017, resulting from the enactment of 2017 Tax Act, of which $17.0 million related to the deemed repatriation transition tax and $10.5 million related to the re-measurement of U.S. deferred tax assets and liabilities. ASC 740-10-45-15, requires the effects of a change in tax law or rates be recognized in the period that includes the enactment date |
| • | Tax benefits of $3.5, $16.6, $7.4, $2.9, and $5.8 million for the years ended December 31, 2017, 2016, 2015, 2014, and 2013, respectively, resulting from the release of previously unrecognized tax benefits due to the expiration of U.S. federal, state, and foreign statutes of limitations. |
| • | Tax benefit of $3.1 million during the year ended December 31, 2014 resulting from the increased valuation of intangible assets for Brazilian tax reporting. |
| • | Tax provision of $19.4 million during the year ended December 31, 2013 to establish a valuation allowance related to the realization of tax benefits from existing California deferred tax assets. |
| • | Tax benefit of $3.2 million during the year ended December 31, 2013, resulting from the renewal of the U.S. federal research and development tax credit on January 2, 2013, retroactive to 2012, pursuant to the American Taxpayer Relief Act of 2012. |
| (4) | During the year ended December 31, 2017, we identified certain errors at our Italian manufacturing subsidiary attributable to the valuation and classification of certain finished goods inventory. The errors related to finished goods that should have been impaired and expensed in 2015, inventory utilized in research and development projects that expired and should have been expensed in 2016, and certain assets included in inventory that should have been capitalized and depreciated over their estimated useful lives. The preceding resulted in an understatement of cost of revenue in 2015 and operating expenses in 2016 due to failure to properly impair and expense certain items, properly classify certain amounts included in inventories on the balance sheet, and appropriately depreciate those amounts. The impact to net income for the years ended December 31, 2016 and 2015 for this correction is a decrease of $0.6 and $1.3 million, respectively, from amounts previously reported of $45.5 and $33.5 million, respectively, and related decreases in working capital and total assets. |
| (5) | In April 2015, the FASB issued Accounting Standards Update (“ASU”) 2015-03, Simplifying the Presentation of Debt Issuance Costs, which became effective in the first quarter of 2016. ASU 2015-03 requires that debt issuance costs related to a recognized debt liability be presented in the balance sheet as a direct deduction from the carrying amount of that debt, which is consistent with the presentation of debt discounts and premiums. Retrospective application is required, which resulted in the reclassification of $5.8 and $7.1 million of debt issuance costs from other current assets and other assets to a direct reduction of our |
47
Table of Contents
| 0.75% Convertible Senior Notes, net, due 2019 (“Notes”) in our Consolidated Balance Sheet as of December 31, 2015 and 2014, respectively. |
| (6) | ASU 2015-17, Balance Sheet Classification of Deferred Taxes, issued in November 2015 and effective in the first quarter of 2016, removes the requirement to classify the current and noncurrent amounts of deferred income tax assets and liabilities and requires noncurrent classification. Under prior guidance, the current and noncurrent classification of deferred income tax assets and liabilities was generally determined by reference to the classification of the related asset or liability unless there is no associated asset or liability that will cause the temporary timing difference to reverse. In that situation, the expected reversal date of the timing difference is used for classification purposes. We have elected to apply this guidance retrospectively to all prior periods to maintain the comparability of presentation between periods. We elected to early adopt this standard in 2015, which retroactively reduced working capital by $17.1 and $20.9 million as of December 31, 2014 and 2013, respectively. |
| (7) | In September 2014, we completed a private placement of $345 million principal amount of the Notes. Holders of the Notes will have the right to require us to repurchase all or a portion of their Notes upon the occurrence of a fundamental change at a repurchase price equal to 100% of the principal amount of the Notes, plus accrued and unpaid interest, if any, as described in Note 7—Convertible Senior Notes, Note Hedges, and Warrants of the Notes to Consolidated Financial Statements. |
| (8) | On November 1, 2012, we sold the 294,000 square foot building located in Foster City, California, which at that time served as our corporate headquarters, along with approximately four acres of land and certain other assets related to the property, for $179.7 million. We used the facility until October 31, 2013, while searching for a new facility, building it out, and relocating our corporate headquarters, for which period rent was not required to be paid. Because we vacated the facility on October 31, 2013, we have no continuing involvement with the property and accounted for the transaction as a property sale during the fourth quarter of 2013, thereby recognizing a gain of approximately $117.2 million on the sale of the property. |
| (9) | As described in “Item 9A, Controls and Procedures”, our management concluded that we had material weaknesses in our internal control over financial reporting as of December 31, 2016 related to revenue recognition practices and the valuation of certain textile digital inkjet printer inventories. Therefore, we did not maintain effective internal control over financial reporting or effective disclosure controls and procedures, both of which are requirements of the Securities Exchange Act of 1934, as of that date. The review of our revenue recognition practices has required that we expend significant management time and incur significant accounting, legal, and other expenses of $6.4 million in 2017, and we expect to incur additional costs in future periods. |
48
Table of Contents
Item 7: Management’s Discussion and Analysis of Financial Condition and Results of Operations
The following discussion and analysis should be read in conjunction with the audited consolidated financial statements and related notes thereto included in this Annual Report on Form 10-K.
All assumptions, anticipations, expectations, and forecasts contained herein are forward-looking statements within the meaning of Section 27A of the Securities Act and Section 21E of the Exchange Act that involve risks and uncertainties. Forward-looking statements include, among others, those statements including words such as “address,” “anticipate,” “believe,” “consider,” “continue,” “develop,” “estimate,” “expect,” “further,” “goal,” “intend,” “may,” “plan,” “potential,” “project,” “seek,” “should,” “target,” “will,” variations of such words, and similar expressions. Our actual results could differ materially from those discussed here. For a discussion of the factors that could impact our results, readers are referred to Item 1A, “Risk Factors,” in Part I of this Annual Report on Form 10-K and to our other reports filed with the SEC, including the Company’s most recent Quarterly Report on Form 10-Q and Current Reports on Form 8-K, and any amendments thereto. We do not assume any obligation to update the forward-looking statements provided to reflect events that occur or circumstances that exist after the date on which they were made.
Overview
Out-of-Period Adjustments. As discussed more fully in Note 1—The Company and its Significant Accounting Policies of our Notes to Consolidated Financial Statements, during the year ended December 31, 2017, we recorded out-of-period adjustments related to certain bill and hold transactions, which decreased revenue by $3.4 million, decreased gross profit by $0.5 million, and increased net loss by $0.3 million (or $0.01 per diluted share).
Correction of Prior Period Financial Information. As discussed more fully in Note 1—The Company and Its Significant Accounting Policies of our Notes to Consolidated Financial Statements, during the year ended December 31, 2017, we identified certain errors at our Italian manufacturing subsidiary attributable to the valuation and classification of certain finished goods inventory. The errors relating to prior year comparative financial information decreased gross profit, operating expenses, and net income for the years ended December 31, 2016 and 2015 resulting in a decrease in net income of $0.6 and $1.3 million, respectively, from amounts previously reported of $45.5 and $33.5 million, respectively.
Key financial results for the year ended December 31, 2017 were as follows:
| • | Our results of operations for the year ended December 31, 2017 compared with the prior year reflect slight revenue growth, stable gross profit, and increased operating expenses as a percentage of revenue. We completed our acquisitions of FFPS, Generation Digital, CRC, and Escada in 2017. Post-acquisition revenue was $27.1 million in 2017 related to these four acquisitions. We completed our acquisitions of Rialco and Optitex in 2016. Post-acquisition revenue was $19.8 million in 2016 related to these two acquisitions. We completed our acquisitions of Reggiani, Matan, CTI, and Shuttleworth in 2015. Post-acquisition revenue was $88.4 million in 2015 related to these four acquisitions. Their results are included in our results of operations commencing on their respective acquisition dates. |
| • | Our consolidated revenue increased by less than 1%, or $1.2 million to $993.3 million for the year ended December 31, 2017 from $992.1 million for the year ended December 31, 2016. Industrial Inkjet and Productivity Software revenue increased by $8.1 and $4.8 million, respectively, while Fiery revenue decreased by $11.7 million during the year ended December 31, 2017, compared with 2016. Recurring ink and maintenance revenue increased by 7% during the year ended December 31, 2017 compared with 2016 and represented 33% and 31% of consolidated revenue for the years ended December 31, 2017 and 2016, respectively. |
49
Table of Contents
| • | Our gross profit percentage was 51% during the year ended December 31, 2017, which was comparable to 51% during the year ended December 31, 2016. The comparable gross profit percentage was primarily due to an increase in the Industrial Inkjet operating segment gross profit percentage as a result of improvements in manufacturing efficiency, reduced warranty costs due to improved printer quality, and higher margin ink revenue representing an increased percentage of product mix, which was offset by decreased Productivity Software and Fiery gross profit percentages. |
| • | Operating expenses increased by $26.6 million to $478.9 million during the year ended December 31, 2017, from $452.3 million during the year ended December 31, 2016, and increased as a percentage of revenue to 48% during the year ended December 31, 2017, compared with 46% during the year ended December 31, 2016. The increase in operating expenses was primarily due to head count and consulting increases related to our business acquisitions, FFPS sustaining engineering, prototype and non-recurring engineering expenses related to future product launches, amortization of intangible assets, restructuring and other, asset impairment, legal and accounting revenue recognition review and assessment and fair value of contingent consideration, partially offset by decreased trade show and marketing and stock-based compensation expenses. |
| • | Interest expense increased by $1.8 million, to $19.5 million for the year ended December 31, 2017 from $17.7 million for the year ended December 31, 2016 primarily due to interest accretion related to the FFPS purchase liability, long-term warranties, the Reggiani non-compete agreement liability, and our Notes. |
| • | Interest income and other income (expense), net, increased to $4,1 million for the year ended December 31, 2017 from $0.5 million during the year ended December 31, 2016, primarily due to increased investment income and decreased foreign currency exchange losses. |
| • | We recorded a tax provision of $27.5 million in 2017 on pre-tax income of $12.1 million compared to a tax benefit of $6.3 million in 2016 on pre-tax income of $38.6 million. The increase in the income tax provision is primarily due to the $27.5 million tax charge recorded in 2017 as a result of the 2017 Tax Act. |
Results of Operations
The following table presents items in our consolidated statements of operations as a percentage of total revenue for 2017, 2016, and 2015. These operating results are not necessarily indicative of results for any future period.
| For the years ended December 31, | ||||||||||||
| 2017 | 2016 | 2015 | ||||||||||
| Revenue |
100 | % | 100 | % | 100 | % | ||||||
|
|
|
|
|
|
|
|||||||
| Gross profit |
51 | 51 | 52 | |||||||||
| Operating expenses (gains): |
||||||||||||
| Research and development |
16 | 15 | 16 | |||||||||
| Sales and marketing |
17 | 17 | 18 | |||||||||
| General and administrative |
9 | 9 | 8 | |||||||||
| Amortization of identified intangibles |
5 | 4 | 3 | |||||||||
| Restructuring and other |
1 | 1 | 1 | |||||||||
|
|
|
|
|
|
|
|||||||
| Total operating expenses |
48 | 46 | 46 | |||||||||
|
|
|
|
|
|
|
|||||||
| Income from operations |
3 | 5 | 6 | |||||||||
| Interest expense |
(2 | ) | (1 | ) | (2 | ) | ||||||
| Interest income and other income (expense), net |
— | — | — | |||||||||
|
|
|
|
|
|
|
|||||||
| Income before income taxes |
1 | 4 | 4 | |||||||||
| Benefit from (provision for) income taxes |
(3 | ) | 1 | — | ||||||||
|
|
|
|
|
|
|
|||||||
| Net income (loss) |
(2 | )% | 5 | % | 4 | % | ||||||
|
|
|
|
|
|
|
|||||||
50
Table of Contents
Revenue
We classify our revenue, gross profit, assets, and liabilities in accordance with our three operating segments as follows:
Industrial Inkjet, which consists of our VUTEk super-wide and wide format display graphics, Nozomi corrugated packaging and display, Reggiani textile, and Cretaprint ceramic tile decoration and building material industrial digital inkjet printers; digital UV curable, LED curable, ceramic, water-based, and thermoforming and specialty ink, as well as a variety of textile ink including dye sublimation, pigmented, reactive dye, acid dye, pure disperse dye, water-based dispersed printing ink, and coatings; digital inkjet printer parts; and professional services. Printing surfaces include paper, vinyl, corrugated, textile, glass, plastic, aluminum composite, ceramic tile, wood, and many other flexible and rigid substrates.
Productivity Software, which consists of a complete software suite that enables efficient and automated end-to-end business and production workflows for the print and packaging industry. This Productivity Suite also provides tools to enable revenue growth, efficient scheduling, and optimization of processes, equipment, and personnel. Customers are provided the financial and technical flexibility to deploy locally within their business or to be hosted in the cloud. The Productivity Suite addresses all segments of the print industry and consists of the: (i) Packaging Suite, with Radius at its core, for tag & label, cartons, and flexible packaging businesses; (ii) Corrugated Packaging Suite, with CTI at its core, for corrugated packaging businesses, including corrugated control capability using EFI Escada; (iii) Enterprise Commercial Print Suite, with Monarch at its core, for enterprise print businesses; (iv) Publication Print Suite, with Monarch or Technique at its core, for publication print businesses; (v) Midmarket Print Suite, with Pace at its core, for medium size print businesses; (vi) Quick Print Suite, with PrintSmith Vision and essential capabilities of Digital StoreFront at its core, for small printers and in-plant sites; and (vii) Value Added Products, available with the suite and standalone, such as web-to-print, e-commerce, cross media marketing, warehousing, fulfillment, shop floor data collection, and shipping to reduce costs, increase profits, and offer new products and services to their existing and future customers. We also market Optitex fashion CAD software, which facilitates fast fashion and increased efficiency in the fashion and textile industries.
Fiery, which consists of Fiery and FFPS, which was recently acquired from Xerox, that transform digital copiers and printers into high performance networked printing devices for the office, industrial, and commercial printing markets. This operating segment is comprised of (i) stand-alone DFEs connected to digital printers, copiers, and other peripheral devices, (ii) embedded DFEs and design-licensed solutions used in digital copiers and multi-functional devices, (iii) optional software integrated into our DFE solutions such as Fiery Central and Graphics Arts Package, (iv) Fiery Self Serve, our self-service and payment solution, and (v) stand-alone software-based solutions such as our proofing, textile, and scanning solutions.
Ex-Currency. To better understand trends in our business, we believe it is helpful to adjust our statement of operations to exclude the impact of year-over-year changes in the translation of foreign currencies into U.S. dollars. This is a non-GAAP measure that is calculated by adjusting revenue, gross profit, and operating expenses by using historical exchange rates in effect during the comparable prior period and removing the balance sheet currency remeasurement impact from interest income and other income (expense), net, including removal of any hedging gains and losses. We refer to these adjustments as “ex-currency.” The year-over-year currency impact can be determined as the difference between year-over-year actual growth rates and year-over-year ex-currency growth rates.
Management believes the ex-currency measures provide investors with an additional perspective on year-over-year financial trends and enables investors to analyze our operating results in the same way management does. A reconciliation of the ex-currency adjustments to GAAP results for the years ended December 31, 2017, 2016, and 2015 and an explanation of how management uses non-GAAP financial information to evaluate its business, the substance behind management’s decision to use this non-GAAP financial information, the material limitations
51
Table of Contents
associated with the use of non-GAAP financial information, the manner in which management compensates for those limitations, and the substantive reasons management believes that this non-GAAP financial information provides useful information to investors is included under “Unaudited Non-GAAP Financial Information” below.
Revenue by Operating Segment
Our revenue by operating segment for the years ended December 31, 2017, 2016, and 2015 was as follows (in thousands):
| For the years ended December 31, | % change | |||||||||||||||||||||||||||||||
| 2017 | 2016 | 2015 | 2017 over 2016 |
2016 over 2015 |
||||||||||||||||||||||||||||
| Industrial Inkjet |
$ | 570,688 | 57 | % | $ | 562,583 | 57 | % | $ | 447,705 | 51 | % | 1 | % | 26 | % | ||||||||||||||||
| Productivity Software |
156,561 | 16 | 151,737 | 15 | 135,350 | 15 | 3 | 12 | ||||||||||||||||||||||||
| Fiery |
266,011 | 27 | 277,745 | 28 | 299,458 | 34 | (4 | ) | (7 | ) | ||||||||||||||||||||||
|
|
|
|
|
|
|
|
|
|
|
|
|
|
|
|
|
|||||||||||||||||
| Total revenue |
$ | 993,260 | 100 | % | $ | 992,065 | 100 | % | $ | 882,513 | 100 | % | — | % | 12 | % | ||||||||||||||||
|
|
|
|
|
|
|
|
|
|
|
|
|
|
|
|
|
|||||||||||||||||
Overview
Revenue was $993.3, $992.1, and $882.5, million for the years ended December 31, 2017, 2016, and 2015, respectively, resulting in an increase of less than 1% (decrease of less than 1% ex-currency) in 2017 compared with 2016 and a 12% increase (14% ex-currency) in 2016 compared with 2015.
The $1.2 million increase in 2017 compared with 2016 was primarily due to increased Industrial Inkjet and Productivity Software revenue, partially offset by decreased Fiery revenue.
The $109.5 million increase in 2016 compared with 2015 was primarily due to increased digital inkjet printer revenue, a full year of Reggiani and Matan revenue, increased ink revenue, and post-acquisition Rialco revenue in the Industrial Inkjet operating segment and post-acquisition Optitex, CTI, and Shuttleworth revenue in the Productivity Software operating segment, partially offset by decreased Fiery revenue.
Industrial Inkjet
Industrial Inkjet revenue increased by $8.1 million, or 1% (also 1% ex-currency) in 2017 compared with 2016. Industrial Inkjet revenue increased primarily due to:
| • | the launch of our Nozomi single-pass industrial digital inkjet platform in 2017, |
| • | a full year of post-acquisition Rialco ink products revenue, which closed in March 2016, |
| • | increased ink revenue due to the increase in our installed printer base and the high utilization that our industrial digital inkjet printers are experiencing in the field, and |
| • | increased revenue from parts and service, partially offset by |
| • | decreased digital inkjet printer revenue due to reduced demand in anticipation of future product launches and |
| • | printer revenue, which would have been higher by $3.4 million when considering out-of-period adjustments related to certain bill and hold transactions, which were recorded during the year ended December 31, 2017. |
52
Table of Contents
Industrial Inkjet revenue increased by $114.9 million, or 26% (27% ex-currency) in 2016 compared with 2015. Industrial Inkjet revenue is benefiting from the ongoing analog to digital technology and solvent to UV curable ink migrations primarily due to:
| • | the complementary impact of the Industrial Inkjet business acquisitions, |
| • | increased revenue resulted from a full year of Reggiani textile and Matan super-wide format industrial digital inkjet roll—to-roll printer revenue in 2016 compared with six months in 2015, |
| • | post-acquisition Rialco ink products revenue, |
| • | increased digital inkjet printer revenue primarily due to the launch of new products, and |
| • | increased ink revenue as a result of the high utilization that our UV printers are experiencing in the field. |
Productivity Software
Productivity Software revenue increased by $4.8 million, or 3% (also 3% ex-currency) in 2017 compared with 2016 primarily due to post-acquisition Optitex revenue, which was acquired in June 2016, post-acquisition CRC revenue, which was acquired in May 2017, post-acquisition Escada revenue, which was acquired in October 2017, increased service revenue, and annual price increases related to our maintenance contracts, partially offset by decreased license revenue.
Productivity Software revenue increased by $16.4 million, or 12% (14% ex-currency), in 2016 compared with 2015, primarily due to post-acquisition Optitex revenue, a full year of CTI and Shuttleworth revenue in 2016 compared with three and two months, respectively, in 2015; increased license revenue; and annual price increases related to our maintenance contracts.
Fiery
Fiery revenue decreased by $11.7 million, or 4% (also 4% ex-currency) in 2017 compared with 2016. Although end customer and reseller preference for Fiery products drives demand, most Fiery revenue relies on printer manufacturers to design, develop, and integrate Fiery technology into their print engines. The leading printer manufacturers tightly managed their inventory levels in the first half of 2017, which decreased demand, partially offset by increased inventory levels and increased demand in the second half of 2017. This decrease was partially offset by post-acquisition FFPS revenue, which was acquired in January 2017, and post-acquisition Generation Digital revenue, which was acquired in August 2017.
Fiery revenue decreased by $21.7 million, or 7% (also 7% ex-currency), in 2016 compared with 2015. Fiery revenue decreased in 2016 primarily due to:
| • | reduced end user demand associated with the Drupa trade show in June 2016, which occurs every four years, caused by end users delaying purchasing decisions until new printer models are available, |
| • | one significant printer manufacturer purchasing less inventory, and |
| • | weak demand in the APAC region. |
Revenue by Geographic Area
Shipments to some of our significant printer manufacturer customers are made to centralized purchasing and manufacturing locations, which in turn ship to other locations, making it difficult to obtain accurate geographical shipment data. Accordingly, we believe that export sales of our products into each region may differ from what is reported.
53
Table of Contents
Our revenue by geographic region for the years ended December 31, 2017, 2016, and 2015 was as follows (in thousands):
| For the years ended December 31, | % change | |||||||||||||||||||||||||||||||
| 2017 | 2016 | 2015 | 2017 over 2016 |
2016 over 2015 |
||||||||||||||||||||||||||||
| Americas |
$ | 487,968 | 49 | % | $ | 500,411 | 50 | % | $ | 473,599 | 54 | % | (2 | )% | 6 | % | ||||||||||||||||
| EMEA |
369,610 | 37 | 360,305 | 37 | 291,103 | 33 | 3 | 24 | ||||||||||||||||||||||||
| APAC |
135,682 | 14 | 131,349 | 13 | 117,811 | 13 | 3 | 11 | ||||||||||||||||||||||||
|
|
|
|
|
|
|
|
|
|
|
|
|
|
|
|
|
|||||||||||||||||
| Total revenue |
$ | 993,260 | 100 | % | $ | 992,065 | 100 | % | $ | 882,513 | 100 | % | — | % | 12 | % | ||||||||||||||||
|
|
|
|
|
|
|
|
|
|
|
|
|
|
|
|
|
|||||||||||||||||
Overview
Our consolidated revenue increased by $1.2 million or less than 1% (decrease of less than 1% ex-currency), in 2017 compared with 2016 primarily due to increased revenue in EMEA and APAC, partially offset by decreased revenue in the Americas.
Our consolidated revenue increase of $109.5 million, or 12% (14% ex-currency) in 2016 compared with 2015, resulted from increased revenue in the Americas, EMEA, and APAC. EMEA increased by 24% primarily due to acquisitions.
Americas
Americas revenue decreased by $12.4 million, or 2% (3% ex-currency), in 2017 compared with 2016 primarily due to decreased industrial digital inkjet printer revenue resulting from reduced demand in anticipation of future product launches, industrial digital inkjet revenue that would have been higher by $3.4 million when considering out-of-period adjustments related to certain bill and hold transactions, and decreased Fiery revenue, partially offset by increased ink revenue.
Americas revenue increased by $26.8 million, or 6% (also 6% ex-currency), in 2016 compared with 2015 resulting from increased ink revenue; increased industrial digital inkjet printer revenue; and increased Productivity Software revenue; partially offset by decreased Fiery revenue. Increased Industrial Inkjet is primarily due to a full year of Reggiani and Matan revenue, which were acquired in July 2015. Increased Productivity Software revenue resulted primarily from our 2016 acquisition of Optitex; our 2015 acquisition of CTI, and increased license revenue. Fiery revenue decreased primarily due to reduced end user demand associated with the Drupa trade show in June 2016, which occurs every four years, caused by end users delaying purchasing decisions until new printer models are available and one significant printer manufacturer purchasing less inventory.
EMEA
EMEA revenue increased by $9.3 million, or 3% (2% ex-currency), in 2017 compared with 2016 primarily due to increased industrial digital inkjet printer revenue due to the Nozomi industrial digital inkjet corrugated packaging printer, ink revenue, post-acquisition Optitex revenue, and post-acquisition Escada revenue, partially offset by decreased Fiery revenue.
EMEA revenue increased by $69.2 million, or 24% (26% ex-currency), in 2016 compared with 2015 primarily due to increased industrial digital inkjet printer revenue; full year of Reggiani and Matan revenue, which were acquired in July 2015; post-acquisition revenue from our 2016 acquisitions of Rialco and Optitex; revenue from our 2015 acquisition of Shuttleworth; and increased license revenue; partially offset by decreased Fiery revenue
54
Table of Contents
due to reduced end user demand associated with the Drupa trade show in June 2016, which occurs every four years, caused by end users delaying purchasing decisions until new printer models are available and one significant printer manufacturer purchasing less inventory.
APAC
APAC revenue increased by $4.3 million, or 3% (2% ex-currency), in 2017 compared with 2016 primarily due to increased industrial digital inkjet printer and ink revenue and post-acquisition Optitex revenue, partially offset by decreased Fiery revenue.
APAC revenue increased by $13.5 million, or 11% (13% ex-currency), in 2016 compared with 2015 primarily due to increased industrial digital inkjet printer revenue; and Optitex post-acquisition revenue; partially offset by decreased Fiery revenue primarily due to weak demand in the APAC.
Revenue Concentration
A substantial portion of our revenue over the years has been attributable to sales of products through the leading printer manufacturers and independent distributor channels. We have a direct relationship with several leading printer manufacturers and work closely to design, develop, and integrate Fiery technology into their print engines. The printer manufacturers act as distributors and sell our DFE products to end customers through reseller channels. End customer and reseller channel preference for our DFE and software solutions drives demand for Fiery products through the printer manufacturers.
Although end customer and reseller channel preference for Fiery products drives demand, most Fiery revenue relies on printer manufacturers to design, develop, and integrate Fiery technology into their print engines. A significant portion of our revenue is, and has been, generated by sales of our Fiery DFE products to a relatively small number of leading printer manufacturers. During the years ended December 31, 2017 and 2015, Xerox provided 11% and 12% of our consolidated revenue, respectively. None of these printer manufacturers accounted for more than 10% of our revenue for the year ended December 31, 2016. We expect that if we increase our revenue in the Industrial Inkjet and Productivity Software operating segments in the future, the percentage of our revenue from the leading printer manufacturer customers will decrease.
Our reliance on revenue from the leading printer manufacturers was 26%, 28%, and 33% during 2017, 2016, and 2015, respectively. Over time, we expect our revenue from the leading printer manufacturers to decline as a percentage of our consolidated revenue. Because sales of our printer and copier-related products constitute a significant portion of our revenue and there are a limited number of printer manufacturers producing copiers and printers in sufficient volume to be attractive customers for us, we expect that we will continue to depend on a relatively small number of printer manufacturers for a significant portion of our Fiery DFE revenue in future periods. Accordingly, if we lose or experience reduced sales to one of these printer manufacturer/distributors, we will have difficulty replacing that revenue with sales to new or existing customers.
55
Table of Contents
Gross Profit
Gross profit by operating segment, excluding stock-based compensation, for the years ended December 31, 2017, 2016, and 2015 was as follows (in thousands):
| 2017 | 2016 | 2015 | ||||||||||
| Industrial Inkjet |
||||||||||||
| Revenue |
$ | 570,688 | $ | 562,583 | $ | 447,705 | ||||||
| Gross profit |
208,620 | 198,923 | 150,964 | |||||||||
| Gross profit percentages |
36.6 | % | 35.4 | % | 33.7 | % | ||||||
| Productivity Software |
||||||||||||
| Revenue |
$ | 156,561 | $ | 151,737 | $ | 135,350 | ||||||
| Gross profit |
114,460 | 114,179 | 99,278 | |||||||||
| Gross profit percentages |
73.1 | % | 75.2 | % | 73.3 | % | ||||||
| Fiery |
||||||||||||
| Revenue |
$ | 266,011 | $ | 277,745 | $ | 299,458 | ||||||
| Gross profit |
185,937 | 198,322 | 210,140 | |||||||||
| Gross profit percentages |
69.9 | % | 71.4 | % | 70.2 | % | ||||||
A reconciliation of operating segment gross profit to the consolidated statements of operations for the years ended December 31, 2017, 2016, and 2015 is as follows (in thousands):
| 2017 | 2016 | 2015 | ||||||||||
| Segment gross profit |
$ | 509,017 | $ | 511,424 | $ | 460,382 | ||||||
| Stock-based compensation expense |
(2,561 | ) | (2,784 | ) | (2,837 | ) | ||||||
| Other items excluded from segment profit |
— | (475 | ) | (115 | ) | |||||||
|
|
|
|
|
|
|
|||||||
| Gross profit |
$ | 506,456 | $ | 508,165 | $ | 457,430 | ||||||
|
|
|
|
|
|
|
|||||||
The Fiery gross profit percentage is impacted by $1.4 million during the year ended December 31, 2017, charged to cost of revenue, which reflects the cost of manufacturing plus a portion of the expected profit margin related to the acquired FFPS inventories. Inventory acquired in the acquisition of FFPS was required to be recorded at fair value rather than historical cost in accordance with ASC 805, Business Combinations. This amount is not included in the financial information regularly reviewed by management as this acquisition-related charge is not indicative of the gross margin trends in the FFPS business. Excluding this charge, the Fiery gross profit percentage would have been 70.4% during the year ended December 31, 2017.
Overview
Our gross profit percentage was 51% (also 51% ex-currency using 2016 exchange rates) during the year ended December 31, 2017, which was comparable to 51% during the year ended December 31, 2016. The comparable gross profit percentage was primarily due to an increase in the Industrial Inkjet operating segment gross profit percentage as a result of improvements in manufacturing efficiency, reduced warranty costs due to improved printer quality, and higher margin ink revenue representing an increased percentage of product mix, which was offset by decreased Productivity Software and Fiery gross profit percentages.
Our gross profit percentage decreased to 51% (52% ex-currency using 2015 exchange rates) during the year ended December 31, 2016, compared to 52% during the year ended December 31, 2015, primarily due to increased Industrial Inkjet revenue mix at a gross profit percentage of 35.4% compared with Productivity Software and Fiery gross profit percentages of 75.2% and 71.4%, respectively. Industrial Inkjet revenue increased as a percentage of revenue to 56.7% during the year ended December 31, 2016, from 50.7%, during the year ended December 31, 2015.
56
Table of Contents
Industrial Inkjet Gross Profit
The Industrial Inkjet gross profit percentage increased to 36.6% (36.5% ex-currency using 2016 exchange rates) in 2017 from 35.4% in 2016. Gross profit percentages improved in ink, parts, and service, while digital inkjet printer gross profit percentages were comparable. The digital inkjet printer gross profit percentage continued to benefit from manufacturing efficiencies related to super-wide format industrial digital inkjet production, reduced warranty expense due to engineering and quality improvements, and increased ink revenue at a higher gross profit percentage, partially offset by lower gross profit during the launch of our Nozomi single-pass industrial digital inkjet platform and inventory writedowns as a result of the Xeikon transaction.
The Industrial Inkjet gross profit percentage increased to 35.4% (35.6% ex-currency using 2015 exchange rates) in 2016 from 33.7% in 2015. Gross profit percentages improved by leveraging efficiencies in our worldwide digital inkjet printer manufacturing operations, centralizing super-wide format textile digital inkjet printer production in Italy, transferring production of super-wide format roll-to-roll digital inkjet printers to Israel to leverage the lower cost platform that location provides, reducing warranty expense as a percentage of revenue due to engineering and quality improvements, and increasing ink revenue as a percentage of consolidated Industrial Inkjet revenue. Our ink business generates a higher gross profit percentage than other elements of our Industrial Inkjet operating segment.
Productivity Software Gross Profit
The Productivity Software gross profit percentages decreased to 73.1% (73.0% ex-currency using 2016 exchange rates) in 2017 from 75.2% in 2016 primarily due to decreased license revenue and increased product maintenance costs, partially offset by price increases on annual maintenance renewal contracts.
The Productivity Software gross profit percentage increased to 75.2% (75.0% ex-currency using 2015 exchange rates) in 2016 from 73.3% in 2015 primarily due to efficiencies gained through increased revenue on a relatively fixed cost base, achievement of certain post-acquisition cost synergies, and price increases on annual maintenance renewal contracts.
Fiery Gross Profit
The Fiery gross profit percentage decreased to 69.9% (also 69.9% ex-currency using 2016 exchange rates) in 2017 from 71.4% in 2016. The Fiery gross profit percentage, excluding the fair value adjustment related to acquired FFPS inventories of $1.4 million, decreased to 70.4% (also 70.4% ex-currency) during the year ended December 31, 2017 from 71.4% during the year ended December 31, 2016. The revenue mix between standalone and embedded DFEs, which have a lower margin compared with higher margin software options, accounts for this margin fluctuation between the periods.
The Fiery gross profit percentage increased to 71.4% (also 71.4% ex-currency using 2015 exchange rates) in 2016 from 70.2% in 2015. The revenue mix between lower margin DFEs and software solutions compared with higher margin professional services accounted for this margin fluctuation between the periods.
57
Table of Contents
Operating Expenses
Operating expenses for the years ended December 31, 2017, 2016, and 2015 were as follows (in thousands):
| For the years ended December 31, | % change | |||||||||||||||||||
| 2017 | 2016 | 2015 | 2017 over 2016 |
2016 over 2015 |
||||||||||||||||
| Research and development |
$ | 157,358 | $ | 151,395 | $ | 141,364 | 4 | % | 7 | % | ||||||||||
| Sales and marketing |
173,697 | 169,042 | 156,339 | 3 | 8 | |||||||||||||||
| General and administrative |
92,953 | 85,618 | 72,797 | 9 | 18 | |||||||||||||||
| Amortization of identified intangibles |
47,339 | 39,560 | 26,510 | 20 | 49 | |||||||||||||||
| Restructuring and other |
7,562 | 6,731 | 5,731 | 12 | 17 | |||||||||||||||
|
|
|
|
|
|
|
|
|
|
|
|||||||||||
| Total operating expenses |
$ | 478,909 | $ | 452,346 | $ | 402,741 | 6 | % | 12 | % | ||||||||||
|
|
|
|
|
|
|
|
|
|
|
|||||||||||
Operating expenses increased by $26.6 million, or 6% (5% ex-currency) in 2017 compared with 2016 and increased by $49.6 million, or 12% (13% ex-currency) in 2016 compared with 2015.
Operating expenses increased by $26.6 million to $478.9 million during the year ended December 31, 2017, from $452.3 million during the year ended December 31, 2016. The increase in operating expenses was primarily due to head count and consulting increases related to our business acquisitions, prototype and non-recurring engineering expenses related to future product launches, FFPS sustaining engineering, amortization of intangible assets, restructuring and other, asset impairment, legal and accounting fees related to the revenue recognition review and assessment, and fair value of contingent consideration, partially offset by decreased stock-based compensation, and trade show and marketing expenses.
Operating expenses increased by $49.6 million to $452.3 million during the year ended December 31, 2016, from $402.7 million during the year ended December 31, 2015, but was comparable as a percentage of revenue at 46% to the year ended December 31, 2015. The increase in operating expenses was primarily due to head count increases related to our business acquisitions, prototype and non-recurring engineering expenses related to future product launches, trade show and marketing program expenses, amortization of intangible assets, increased expenses related to litigation and uncollectible accounts, restructuring and other charges, and increased fair value of contingent consideration.
Research and Development
Research and development expenses include personnel, consulting, travel, research and development facilities, prototype materials, and non-recurring engineering expenses.
Research and development expenses for the years ended December 31, 2017, 2016, and 2015 were $157.4 million, or 16% of revenue, $151.4 million, or 15% of revenue, and $141.4 million, or 16% of revenue, respectively.
Research and development expenses increased by $6.0 million, or 4% (3% ex-currency) in 2017 compared with 2016. Personnel-related expenses decreased by $4.2 million primarily due to reduced variable compensation expense. Prototypes and non-recurring engineering, consulting, contractors, supplies, freight, and related travel expenses increased by $7.6 million related to future product launches and FFPS sustaining engineering. Stock-based compensation expense increased by $0.2 million primarily due to increased ESPP participation by employees compared to the prior year, partially offset by reduced probability of achieving certain performance based awards and delayed annual award grants. The remaining increase of $2.4 million is primarily due to facilities and information technology expenses related to our research and development activities.
58
Table of Contents
Research and development expenses increased by $10.0 million, or 7% (8% ex-currency) in 2016 compared with 2015. Personnel-related expenses increased by $9.9 million primarily due to head count increases related to our business acquisitions and variable compensation expense. Stock-based compensation expense decreased by $0.4 million because actual forfeitures were greater than the previous forfeiture estimate that was used prior to implementation of ASU 2016-09, as more fully explained in Note 1—Basis of Presentation and Significant Accounting Policies, reduced probability of achieving performance awards, and decreased Employee Stock Purchase Plan (“ESPP”) participation by employees compared to the prior year. The remaining increase of $0.5 million is primarily due to facility and information technology expenses related to our research and development activities.
Research and development head count was 1,229, 1,209, and 1,196 as of December 31, 2017, 2016, and 2015, respectively.
We expect that if the U.S. dollar remains volatile against the Indian rupee, Euro, British pound sterling, Israeli shekel, or Brazilian real, research and development expenses reported in U.S. dollars could fluctuate, although we hedge our operating expense exposure to the Indian rupee, which partially mitigates this risk.
Sales and Marketing
Sales and marketing expenses include personnel, trade shows, marketing programs and promotional materials, sales commissions, travel and entertainment, depreciation, and worldwide sales office expenses.
Sales and marketing expenses for the years ended December 31, 2017, 2016, and 2015 were $173.7 million, or 17% of revenue, $169.0 million, or 17% of revenue, and $156.3 million, or 18% of revenue, respectively.
Sales and marketing expenses increased by $4.7 million, or 3% (2% ex-currency) in 2017 compared with 2016. Personnel-related expenses increased by $4.8 million primarily due to increased head count related to our business acquisitions. Trade show and marketing program spending, including consulting, contractor, travel, and freight, decreased by $0.2 million as the prior year included Drupa trade show costs. Drupa is an international printing trade show that is held every four years. Stock-based compensation expense decreased by $1.1 million primarily due to reduced probability of achieving certain performance based awards and delayed annual award grants, partially offset by increased ESPP participation by employees compared to the prior year. The remaining increase of $1.2 million is primarily due to facilities and information technology expenses related to our sales and marketing activities.
Sales and marketing expenses increased by $12.7 million, or 8% (9% ex-currency), in 2016 compared with 2015. Personnel-related expenses increased by $8.0 million primarily due to head count increases related to our business acquisitions and increased commissions due to increased revenue. Trade show and marketing program spending, including consulting, contractor, travel, and freight, increased by $4.8 million primarily due to the Drupa trade show.
Sales and marketing head count was 989, 950, and 892 as of December 31, 2017, 2016, and 2015, respectively, including 416, 398, and 360 in customer service head count for each of the years presented.
Over time, our sales and marketing expenses may increase in absolute terms if revenue increases in future periods as we continue to actively promote our products and introduce new services and products. We expect that if the U.S. dollar remains volatile against the Euro, British pound sterling, Brazilian real, Israeli shekel, Chinese renminbi, and other currencies, sales and marketing expenses reported in U.S. dollars could fluctuate.
59
Table of Contents
General and Administrative
General and administrative expenses consist primarily of human resources, legal, and finance expenses. General and administrative expenses for the years ended December 31, 2017, 2016, and 2015 were $93.0 million, or 9% of revenue, $85.6 million, or 9% of revenue, and $72.8 million, or 8% of revenue, respectively.
General and administrative expenses increased by $7.3 million, or 9% (8% ex-currency) in 2017 compared with 2016. Personnel-related expenses increased by $2.3 million primarily due to head count increases related to our business acquisitions. Professional services fees increased by $1.2 million. Reserves for litigation and doubtful accounts increased by $0.6 million. Legal and accounting fees related to the revenue recognition and accounting review were $6.4 million. Other legal fees increased by $0.2 million. Acquisition-related expenses decreased by $0.4 million. Stock-based compensation expense decreased by $4.2 million primarily due to reduced probability of achieving certain performance based awards and delayed annual award grants. The remaining increase of $0.7 million is primarily due to facilities and information technology expenses related to general and administrative activities.
The fair value of contingent consideration increased by $6.5 million, including earnout interest accretion of $1.7 million related to all acquisitions during the year ended December 31, 2017. The Optitex, CTI, and Rialco earnout performance probabilities increased while the Shuttleworth earnout performance probability decreased during 2017. The estimated probabilities of achieving the Optitex, Reggiani, DirectSmile, and CTI earnout performance targets increased during the year ended December 31, 2016, partially offset by reduced probabilities of achieving the DIMS and Shuttleworth earnout performance targets, resulting in an increase in the associated liability and a charge to general and administrative expense of $6.9 million, including accretion of interest related to all acquisitions.
We recorded an impairment loss of $0.9 million during the year ended December 31, 2017 related to the Meredith manufacturing facility and related land. For additional information, please refer to Note 15—Property and Equipment, net, for details. There were no asset impairment charges recognized during the years ended December 31, 2016 and 2015.
General and administrative expenses increased by $12.8 million, or 18% (19% ex-currency) in 2016 compared with 2015. Personnel-related expenses increased by $2.6 million primarily due to head count increases related to our business acquisitions. Acquisition costs decreased by $3.2 million primarily due to lower expenses in 2016 related to the Optitex, Rialco, and anticipated acquisitions compared with acquisition costs related to the Reggiani, Matan, CTI, and Shuttleworth acquisitions, which closed in 2015. Expenses related to litigation and uncollectible accounts increased by $2.8 million. Stock-based compensation expense decreased by $1.8 million because actual forfeitures were greater than the previous forfeiture estimate that was used prior to implementation of ASU 2016-09 as more fully explained in Note 1—Basis of Presentation and Significant Accounting Policies, reduced probability of achieving performance awards, and decreased ESPP participation by employees compared to the prior year. The remaining increase of $3.5 million is primarily due to facilities and information technology expenses related to general and administrative activities.
The estimated probabilities of achieving the Rialco, Optitex, Reggiani, DirectSmile, and CTI earnout performance targets increased during the year ended December 31, 2016, partially offset by reduced probabilities of achieving the DIMS and Shuttleworth earnout performance targets, resulting in an increase in the associated liability and general and administrative expense of $6.9 million, including earnout interest accretion. The estimated probability or actual achievement of several earnout performance targets decreased during the year ended December 31, 2015 resulted in a reduction of the associated liability and general and administrative expense of $2.1 million in the prior year, net of earnout interest accretion.
We expect that if the U.S. dollar remains volatile against the Euro, British pound sterling, Indian rupee, Israeli shekel, Brazilian real, or other currencies, general and administrative expenses reported in U.S. dollars could fluctuate.
60
Table of Contents
Stock-based Compensation
Stock-based compensation expense for the years ended December 31, 2017, 2016, and 2015 was $26.5 million, or 3% of revenue, $31.8 million, or 3% of revenue, and $34.1 million, or 4% of revenue, respectively.
We account for stock-based payment awards in accordance with ASC 718, Stock Compensation, which requires stock-based compensation expense to be recognized based on the fair value of such awards on the date of grant. We amortize compensation cost on a graded vesting basis over the vesting period, after assessing the probability of achieving requisite performance criteria with respect to performance-based awards. Stock-based compensation cost is recognized over the requisite service period for each separately vesting tranche of the award as though the award were, in substance, multiple awards. This has the impact of greater stock-based compensation expense recognized during the initial years of the vesting period for awards with multiple tranches.
Stock-based compensation expenses decreased by $5.3 million, or 17% in 2017 compared with 2016 primarily due to reduced probability of achieving certain performance based awards and delayed annual award grants, partially offset by increased ESPP expense resulting from higher employee participation compared to the prior year.
Stock-based compensation expense decreased by $2.2 million, or 7% in 2016 compared with 2015 because forfeitures were greater than the previous forfeiture estimate that was used prior to implementation of ASU 2016-09, prior year forfeitures resulting from the resignation of our chief financial officer in January 2015, reduced probability of achieving performance awards, and decreased ESPP participation by employees compared to the prior year.
Amortization of Identified Intangibles
Amortization of identified intangibles for the years ended December 31, 2017, 2016, and 2015 was $47.3 million, or 5% of revenue, $39.6 million, or 4% of revenue, and $26.5 million, or 3% of revenue, respectively.
Amortization of identified intangibles increased by $7.7 million, or 20% in 2017 compared with 2016 primarily due to amortization of identified intangibles resulting from the Escada, Generation Digital, CRC, and FFPS acquisitions as well as full year amortization expense recognized on 2016 acquisitions, partially offset by decreased amortization due to certain intangible assets from prior year acquisitions becoming fully amortized.
Amortization of identified intangibles increased by $13.0 million, or 49% in 2016 compared with 2015 primarily due to intangible amortization of identified intangibles resulting from the Reggiani, Matan, CTI, Shuttleworth, Rialco, and Optitex acquisitions, partially offset by decreased amortization due to certain intangible assets from prior year acquisitions becoming fully amortized.
Restructuring and Other
Restructuring and other costs for the years ended December 31, 2017, 2016, and 2015 were $7.6, $6.7, and $5.7 million, respectively. Restructuring and other charges include severance costs of $4.7, $4.1, and $3.0 million related to head count reductions of 144, 128, and 99 for the years ended December 31, 2017, 2016, and 2015, respectively. Severance costs include severance payments, related employee benefits, retention bonuses, outplacement fees, recruiting, and relocation costs.
Facilities relocation and downsizing expenses for the years ended December 31, 2017, 2016, and 2015 were $0.6, $0.5, and $0.9 million, respectively. Facilities restructuring and other expenses are primarily related to the relocation of certain manufacturing and administrative locations to accommodate decreased space requirements in 2017 and additional space requirements in 2016 and 2015. Integration expenses for the years ended December 31, 2017, 2016, and 2015 of $2.3, $2.1, and $1.8 million, respectively, were required to integrate our business acquisitions.
61
Table of Contents
Interest Expense
Interest expense for the years ended December 31, 2017, 2016, and 2015 was $19.5, $17.7, and $17.4 million, respectively.
Interest expense increased by $1.8 million in 2017 compared with 2016 primarily due to interest accretion related to the FFPS purchase liability, long-term warranties, the Reggiani non-compete agreement liability, and our Notes. Interest expense increased by $0.3 million in 2016 compared with 2015 primarily due to increased interest accretion on our Notes. Please refer to Note 7—Convertible Senior Notes, Note Hedges, and Warrants of the Notes to Consolidated Financial Statements for the terms and conditions of our Notes.
Interest Income and Other Income (Expense), Net
Interest income and other income (expense), net, includes interest income on our cash equivalents and short-term investments, gains and losses from sales of our cash equivalents and short-term investments, and net foreign currency exchange gains and losses. Interest income and other income (expense), net, for the years ended December 31, 2017, 2016, and 2015 was $4.1, $0.5, and $(1.8) million, respectively.
Interest income and other income (expense), net, increased to $4.1 million in 2017 from $0.5 million in 2016, primarily due to increased investment income of $0.8 million resulting from increased market interest rates, decreased foreign currency exchange losses of $2.2 million, and $0.3 million related to the Xeikon transaction.
Interest income and other income (expense), net, was a gain of $0.5 million in 2016 compared with a loss of $1.8 million in 2015 primarily due to increased investment income of $1.7 million in 2016 resulting from increased interest rates and decreased foreign exchange losses of $0.4 million during 2016 resulting primarily from revaluation of foreign currency denominated net assets (mainly denominated in Euros, British pounds sterling, and Chinese renminbi).
Goodwill Assessment
We perform our annual goodwill impairment analysis in the fourth quarter of each year according to the provisions of ASC 350-20-35, Goodwill—Subsequent Measurement. A two-step impairment test of goodwill is required, unless the simplified method is elected. In the first step, the fair value of each reporting unit is compared to its carrying value. If the fair value exceeds carrying value, goodwill is not impaired and further testing is not required. If the carrying value exceeds fair value, then the second step of the impairment test is required to determine the implied fair value of the reporting unit’s goodwill. The implied fair value of goodwill is calculated by deducting the fair value of all tangible and intangible net assets of the reporting unit, excluding goodwill, from the fair value of the reporting unit as determined in the first step. If the carrying value of the reporting unit’s goodwill exceeds its implied fair value, then an impairment loss must be recorded equal to the difference.
Our goodwill valuation analysis is based on our respective reporting units (Industrial Inkjet, Productivity Software, and Fiery), which are consistent with our operating segments identified in Note 14—Segment Information, Geographic Regions, and Major Customers of the Notes to Consolidated Financial Statements. We determined the fair value of our reporting units as of December 31, 2017 by equally weighting the market and income approaches. Under the market approach, we estimated fair value based on market multiples of revenue or earnings of comparable companies. Under the income approach, we estimated fair value based on a discounted projected cash flow method using a discount rate determined by our management to be commensurate with the risk inherent in our current business model. Based on our valuation results, we have determined that the fair values of our Industrial Inkjet, Productivity Software, and Fiery reporting units exceed their carrying values by $398.1, $78.7, and $207.9 million, respectively, or 90%, 43%, and 197%, respectively, as of December 31, 2017.
62
Table of Contents
Since fair values were determined using a weighting of the market and income approaches, we reviewed the sensitivity of the market multiple and discount rate to evaluate the sensitivity of the Industrial Inkjet, Productivity Software, and Fiery valuations. The impact of a change in the market multiple of 10% results in an increase or decrease in Industrial Inkjet, Productivity Software, and Fiery fair values of 5%. Likewise, the impact of a change in the discount rate of one percentage point results in an increase in the Industrial Inkjet, Productivity Software, and Fiery fair values of 9%, 12%, and 7%, respectively, or a decrease of 7%, 9%, and 6%, respectively. Consequently, we have concluded that no reasonably possible changes would reduce the fair value of the reporting units to such a level that it would cause a failure in step one of the impairment analysis.
Income (Loss) before Income Taxes
Income (loss) before income taxes for the years ended December 31, 2017, 2016, and 2015 was as follows (in thousands):
| 2017 | 2016 | 2015 | ||||||||||
| U.S. |
$ | (27,926 | ) | $ | 8,254 | $ | 9,311 | |||||
| Foreign |
40,056 | 30,394 | 26,257 | |||||||||
|
|
|
|
|
|
|
|||||||
| Total |
$ | 12,130 | $ | 38,648 | $ | 35,568 | ||||||
|
|
|
|
|
|
|
|||||||
For the year ended December 31, 2017, income before income taxes of $12.1 million consisted of U.S. loss before income taxes of $27.9 million and foreign income before income taxes of $40.0 million, respectively. Loss before income taxes attributable to U.S. operations included amortization of identified intangible assets of $13.6 million, stock-based compensation of $26.5 million, restructuring and other of $5.5 million, legal and accounting fees related to the revenue recognition review and assessment of $6.4 million, asset impairment of $0.9 million, acquisition-related costs of $1.8 million, cost of revenue resulting from the fair value adjustment of FFPS inventory of $0.6 million, increased fair value of contingent consideration of $0.7 million, and interest expense related to our Notes of $17.1 million. Income before income taxes attributable to foreign operations included amortization of identified intangible assets of $33.7 million, restructuring and other of $2.1 million, cost of revenue resulting from the fair value adjustment of FFPS inventory of $0.8 million, litigation settlement expense of $0.3 million, earnout interest accretion of $1.7 million, acquisition-related costs of $0.3 million, and increased fair value of contingent consideration of $4.1 million. The exclusion of these items from income before income taxes would result in U.S. and foreign income before income taxes of $45.2 and $83.0 million, respectively, during the year ended December 31, 2017.
For the year ended December 31, 2016, income before income taxes of $38.6 million consisted of U.S. and foreign income before income taxes of $8.2 and $30.4 million, respectively. The income before income taxes attributable to U.S. operations included amortization of identified intangibles of $7.6 million, stock-based compensation of $31.8 million, restructuring and other costs of $3.8 million, acquisition-related costs of $0.6 million, litigation settlement expense of $1.0 million, and interest expense and amortization of debt issuance costs related to our Notes of $16.3 million, and the change in fair value of contingent consideration of $0.6 million. The income before income taxes attributable to foreign operations included amortization of identified intangibles of $31.9 million, restructuring and other costs of $2.9 million, acquisition-related costs of $1.6 million, earnout interest accretion of $2.7 million, and the change in fair value of contingent consideration of $3.7 million. The exclusion of these items from income before income taxes would result in a U.S. and foreign income before income taxes of $69.9 and $73.2 million, respectively, for the year ended December 31, 2016.
For the year ended December 31, 2015, income before income taxes of $35.6 million consisted of U.S. and foreign income before income taxes of $9.3 and $26.3 million, respectively. The income before income taxes attributable to U.S. operations included amortization of identified intangibles of $7.8 million, stock-based compensation of $34.1 million, restructuring and other costs of $2.4 million, acquisition-related costs of $1.0 million, litigation settlement expense of $0.6 million, and interest expense and amortization of debt issuance
63
Table of Contents
costs related to our Notes of $15.7 million, partially offset by the change in fair value of contingent consideration of $0.2 million. The income before income taxes attributable to foreign operations included amortization of identified intangibles of $18.7 million, restructuring and other costs of $3.3 million, acquisition-related costs of $4.5 million, and earnout interest accretion of $1.4 million, partially offset by the change in fair value of contingent consideration of $3.3 million. The exclusion of these items from income before income taxes would result in a U.S. and foreign before income taxes income of $70.7 and $50.9 million, respectively, for the year ended December 31, 2015.
Provision for (Benefit from) Income Taxes
We recognized a tax provision of $27.5 million on pre-tax income of $12.1 million in 2017, a tax benefit of $6.3 million on pre-tax income of $38.6 million in 2016, and a tax provision of $3.4 million on pre-tax income of $35.6 million in 2015.
The provisions for income taxes before significant items were $5.1, $11.9, and $9.7 million for the years ended December 31, 2017, 2016, and 2015 respectively. The decrease in the provision for income taxes before significant items during the year ended December 31, 2017, compared with the prior year, is primarily due to decreased profitability before income taxes. The increase in the provision for income taxes before significant items during the year ended December 31, 2016, compared with the prior year, is primarily due to increased profitability before income taxes. Primary differences between our tax provision before significant items and a tax provision using a U.S. statutory rate of 35% include lower taxes on permanently reinvested foreign earnings, the tax effects of stock-based compensation expense pursuant to ASC 718-740, Stock Compensation—Income Taxes, which are non-deductible for tax purposes, and tax benefits related to research and development tax credits.
Our provision for income taxes before significant items is reconciled to our provision for (benefit from) income taxes for the years ended December 31, 2017, 2016, and 2015 as follows (in millions):
| 2017 | 2016 | 2015 | ||||||||||
| Provision for income taxes before significant items |
$ | 5.1 | $ | 11.9 | $ | 9.7 | ||||||
| Interest related to unrecognized tax benefits |
0.3 | 0.4 | 0.3 | |||||||||
| Benefit related to stock based compensation, including ESPP dispositions |
(1.9 | ) | (2.5 | ) | (0.5 | ) | ||||||
| Benefit related to reversals of uncertain tax positions |
(3.3 | ) | (15.7 | ) | (5.5 | ) | ||||||
| Benefit from reversals of accrued interest related to uncertain tax positions |
(0.2 | ) | (0.4 | ) | (0.6 | ) | ||||||
| Provision for deemed repatriation transition tax |
17.0 | — | — | |||||||||
| Provision for remeasuring deferred tax balances |
10.5 | — | — | |||||||||
|
|
|
|
|
|
|
|||||||
| Provision for (benefit from) income taxes |
$ | 27.5 | $ | (6.3 | ) | $ | 3.4 | |||||
|
|
|
|
|
|
|
|||||||
On December 22, 2017, the U.S enacted the 2017 Tax Act which will have wide ranging impacts including, but not limited to, a deemed repatriation transition tax and the revaluation of U.S. deferred tax assets and liabilities. The SEC issued SAB 118 which allows us to record a provisional estimate of the income tax effects of the 2017 Tax Act in the period in which we can make a reasonable estimate of its effects. We have recorded a $27.5 million tax charge in the year ended December 31, 2017 as a provisional estimate. This includes an estimated charge of $17.0 million related to the deemed repatriation transition tax, which is comprised of a gross transition tax of $27.0 million offset by foreign tax credits of $10.0 million. In addition, we have recorded a $10.5 million charge related to the remeasurement of U.S. deferred tax assets and liabilities. While we have calculated a reasonable estimate of the impact of the U.S. tax rate reduction and the amount of the deemed repatriation transition tax, we are gathering additional information to refine and finalize our calculation of the impacts on our U.S. deferred tax assets and liabilities, the deemed repatriation transition tax, and other provisions associated with the 2017 Tax Act. As we obtain additional information, we will record adjustments in subsequent periods, and will finalize the calculation of the income tax effects of the 2017 Tax Act in the fourth quarter of 2018, or in an earlier quarter if our analysis is complete.
64
Table of Contents
The 2017 Tax Act also created a minimum tax on certain foreign earnings, also known as the GILTI provision, commencing in the year ending December 31, 2018. Because whether we expect to have future U.S. inclusions in taxable income related to GILTI depends on not only our current structure and estimated future results of global operations, but also our intent and ability to modify our structure and/or our business, we are not yet able to provide a reasonable estimate of the effect of this provision of the 2017 Tax Act. Any subsequent adjustment to the deferred tax amounts related to GILTI (or other computations) will be recorded to current tax expense in the quarter of 2018 when the analysis is complete.
During the year ended December 31, 2016, we recognized a $16.6 million tax benefit (including state tax benefit) from the release of previously unrecognized tax benefits due to the expiration of U.S. federal, state, and foreign statutes of limitations, of which $10.3 million related to the 2012 gain on sale of our Foster City building and land.
We earn a significant amount of our operating income outside the U.S., which is permanently reinvested in foreign jurisdictions. Of the income generated in foreign jurisdictions with tax rates materially lower than the statutory U.S. tax rate of 35%, most is earned in the Netherlands, Spain, U.K., Italy, Israel, and the Cayman Islands. In 2017, 2016 and 2015, we realigned the ownership of certain intellectual property to augment operational synergies and parallel both our worldwide intellectual property ownership and our worldwide supply chain. Our effective tax rate could fluctuate significantly and be adversely impacted if anticipated earnings in the Netherlands, Spain, Italy, U.K., Israel, and the Cayman Islands are proportionally lower than current projections and earnings in all other jurisdictions are proportionally higher than current projections.
While we currently do not foresee a need to repatriate the earnings of foreign operations, should we require more capital in the U.S. than our cash and cash equivalents and short-term investments located in the U.S., along with cash generated by our U.S. operations, we may elect to repatriate funds held in our foreign jurisdictions or raise capital in the U.S. through debt or equity issuances. These alternatives could result in higher effective tax rates, the cash payment of taxes and/or increased interest expense, and foreign income and withholding taxes. As of December 31, 2017, we have permanently reinvested $214.9 million of unremitted foreign earnings. Due to the enactment of the 2017 Tax Act, we will not be subject to U.S. federal income tax on dividends received from our foreign subsidiaries commencing January 1, 2018. We are evaluating the potential foreign and U.S. state income tax liabilities that would result from future repatriations, if any, and how the 2017 Tax Act will impact our current permanent reinvestment assertion. We expect to complete this analysis and the impact, if any, which the 2017 Tax Act may have on our indefinite reinvestment assertion in the fourth quarter of 2018, or in an earlier quarter if our analysis is complete.
As of December 31, 2017, and 2016, gross unrecognized tax benefits that would affect the effective tax rate if recognized were $33.9 and $32.0 million, respectively, which would affect the effective tax rate, if recognized. Over the next twelve months, our existing tax positions will continue to generate increased liabilities for unrecognized tax benefits. It is reasonably possible that our gross unrecognized tax benefits will decrease up to $5.5 million in the next twelve months. These adjustments, if recognized, would positively impact our effective tax rate, and would be recognized as additional tax benefits in our Consolidated Statement of Operations. The reduction in unrecognized tax benefits relates primarily to a lapse of the statute of limitations for federal and state tax purposes.
In accordance with ASU 2013-11, we recorded $16.9 million of gross unrecognized tax benefits as an offset to deferred tax assets as of December 31, 2017, and the remaining $17.0 million has been recorded as noncurrent income taxes payable.
We recognize potential accrued interest and penalties related to unrecognized tax benefits in income tax expense. As of December 31, 2017, and 2016, we have accrued $0.7 and $0.5 million, respectively, for potential payments of interest and penalties.
65
Table of Contents
As of December 31, 2017, we were subject to examination by the Internal Revenue Service (“IRS”) for the 2014-2016 tax years, state tax jurisdictions for the 2013-2016 tax years, the Netherlands tax authority for the 2014-2016 tax years, the Spanish tax authority for the 2013-2016 tax years, the Israel tax authority for the 2014-2016 tax years, and the Italian tax authority for the 2013-2016 tax years.
In Altera Corp. v. Commissioner, the U.S Tax Court issued an opinion on July 27, 2015, related to the treatment of stock-based compensation expense in an intercompany cost-sharing arrangement. To date, the U.S. Department of the Treasury has not withdrawn the requirement to include stock-based compensation in intercompany cost-sharing arrangements from its regulations. Due to the uncertainty related to the status of the current regulations and the basis of the appeal that has been filed by the Internal Revenue Service, we have not recorded any benefit as of December 31, 2017, in our Consolidated Statement of Operations. We will continue to monitor ongoing developments and potential impacts to our consolidated financial statements.
We assess the likelihood that our deferred tax assets will be recovered from future taxable income by considering both positive and negative evidence relating to their recoverability. If we believe that recovery of these deferred tax assets is not more likely than not, we establish a valuation allowance.
Significant judgment is required in determining any valuation allowance recorded against deferred tax assets. In assessing the need for a valuation allowance, we considered all available evidence, including recent operating results, projections of future taxable income, our ability to utilize loss and credit carryforwards, and the feasibility of tax planning strategies. Other than valuation allowances on deferred tax assets related to California, Luxembourg, Israel, Netherlands, and Turkey deferred tax assets that are likely to not be realized based on the size of the net operating loss and research and development credits being generated, we have determined that it is more likely than not that we will realize the benefit related to all other deferred tax assets. To the extent we increase a valuation allowance, we will include an expense in the Consolidated Statement of Operations in the period in which such determination is made. The valuation allowance is $45.5 and $42.4 million as of December 31, 2017 and 2016, respectively.
Unaudited Non-GAAP Financial Information
To supplement our consolidated financial results prepared in accordance with GAAP, we use non-GAAP measures of net income and earnings per diluted share that are GAAP net income (loss) and earnings per diluted share adjusted to exclude certain costs, expenses, and gains.
We believe the presentation of non-GAAP net income and non-GAAP earnings per diluted share provides important supplemental information regarding certain costs, expenses, gains, and significant items that we believe are important to understanding financial and business trends relating to our financial condition and results of operations. Non-GAAP net income and non-GAAP earnings per diluted share are among the primary indicators used by management as a basis for planning and forecasting future periods and by management and our Board of Directors to determine whether our operating performance has met specified targets and thresholds. Management uses non-GAAP net income and non-GAAP earnings per diluted share when evaluating operating performance because it believes the exclusion of the items described below, for which the amounts and/or timing may vary significantly depending on our activities and other factors, facilitates comparability of our operating performance from period to period. We have chosen to provide this information to investors so they can analyze our operating results in the same way that management does and use this information in their assessment of our business and the valuation of our Company.
Use and Economic Substance of Non-GAAP Financial Measures
We compute non-GAAP net income and non-GAAP earnings per diluted share by adjusting GAAP net income (loss) and GAAP earnings per diluted share to remove the impact of the amortization of acquisition-related
66
Table of Contents
intangibles, stock-based compensation expense, non-cash settlement of vacation liabilities, restructuring and other expense, acquisition-related transaction expenses, costs to integrate such acquisitions into our business, asset impairment, incremental cost of revenue due to the fair value adjustment to inventories acquired in business acquisitions, changes in the fair value of contingent consideration including accretion and the related foreign exchange fluctuation impact, revenue recognition review costs and litigation settlement charges, and non-cash interest expense related to our Notes. We use a constant non-GAAP tax rate of 19%, which we believe reflects the long-term average tax rate based on our international structure and geographic distribution of revenue and profit.
Ex-Currency. To better understand trends in our business, we believe it is helpful to adjust our Consolidated Statements of Operations to exclude the impact of year-over-year changes in the translation of foreign currencies into U.S. dollars. This is a non-GAAP measure that is calculated by adjusting revenue, gross profit, and operating expenses by using historical exchange rates in effect during the comparable prior period and removing the balance sheet currency remeasurement impact from interest income and other income (expense), net, including removal of any hedging gains and losses. We refer to these adjustments as “ex-currency.” Management believes the ex-currency measures provide investors with an additional perspective on year-over-year financial trends and enables investors to analyze our operating results in the same way management does. The year-over-year currency impact can be determined as the difference between year-over-year actual growth rates and year-over-year ex-currency growth rates.
These excluded items are described below:
| • | Inventory acquired in the acquisition of FFPS is required to be recorded at fair value rather than historical cost in accordance with ASC 805 Business Combination. The fair value of FFPS inventory reflects the manufacturing cost plus a portion of the expected gross profit. We have adjusted our cost of revenue to reflect the expected gross profit that was included in the inventory valuation under ASC 805. We believe this adjustment is useful to investors to understand the gross profit trends of our ongoing business. |
| • | Intangible assets acquired to date are being amortized on a straight-line basis. |
| • | Stock-based compensation expense recognized in accordance with ASC 718. |
| • | Non-cash settlement of vacation liabilities through the issuance of RSUs, which is not included in the GAAP presentation of our stock-based compensation expense. |
| • | Restructuring and other consists of: |
| ¡ | Restructuring charges incurred as we consolidate the number and size of our facilities and, as a result, reduce the size of our workforce. |
| ¡ | Expenses incurred to integrate businesses acquired of $2.2, $2.1, and $1.8 million during the years ended December 31, 2017, 2016, and 2015, respectively. |
| ¡ | Integration depreciation related to integrate businesses acquired of $0.3 million were recognized during the year ended December 31, 2017. We have acquired 18 businesses in the last 5 years, which have required significant information technology investment to integrate them into our business. Depreciation related to assets purchased to integrate businesses acquired during the periods reported have been included in the integration expenses that we have excluded from our non-GAAP operating results. |
| • | Acquisition-related transaction costs associated with businesses acquired during the periods reported and anticipated transactions of $2.1, $2.2, and $5.5 million during the years ended December 31, 2017, 2016, and 2015, respectively. |
| • | Changes in fair value of contingent consideration. Our management determined that we should analyze the total return provided by the investment when evaluating operating results of an acquired entity. The |
67
Table of Contents
| total return consists of operating profit generated from the acquired entity compared to the purchase price paid, including the final amounts paid for contingent consideration without considering any post-acquisition adjustments related to changes in the fair value of the contingent consideration. Because our management believes the final purchase price paid for the acquisition reflects the accounting value assigned to contingent consideration, we exclude the GAAP impact of any adjustments to the fair value of acquisition-related contingent consideration from the operating results of an acquisition in subsequent periods, including accretion and the related foreign exchange fluctuation impact. We believe this approach is useful in understanding the long-term return provided by our acquisitions and that investors benefit from a supplemental non-GAAP financial measure that excludes the impact of this adjustment. |
| • | Non-cash interest expense on our Notes. Our Notes may be settled in cash on conversion. We are required to separately account for the liability (debt) and equity (conversion option) components of the Notes in a manner that reflects our non-convertible debt borrowing rate. Accordingly, for GAAP purposes, we are required to amortize a debt discount equal to the fair value of the conversion option as interest expense on our $345 million of 0.75% convertible senior notes that were issued in a private placement in September 2014 over the term of the Notes. |
| • | Revenue Recognition and Accounting Review Costs. As described in “Item 9A, Controls and Procedures”, our management concluded that we had material weaknesses in our internal control over financial reporting as of December 31, 2016 related to revenue recognition practices and the valuation of certain textile digital inkjet printer inventories. Therefore, we did not maintain effective internal control over financial reporting or effective disclosure controls and procedures, both of which are requirements of the Securities Exchange Act of 1934, as of that date. The review of our revenue recognition practices has required that we expend significant management time and incur significant accounting, legal, and other expenses of $6.4 million in 2017, and we expect to incur additional costs in future periods. |
| • | Litigation Settlements. We settled or accrued reserves related to litigation claims in 2017, 2016, and 2015 in aggregate amounts of $0.4, $1.0, and $0.6 million, respectively. |
| • | Asset impairment. During the fourth quarter of 2017, management approved a plan to sell approximately 31.5 acres of land and the related buildings located in Meredith, New Hampshire. Assets previously recorded within property and equipment, net, of $5.1 million have been reclassified to assets held for sale in our consolidated balance sheet as of December 31, 2017. The fair value of the Meredith facility based on the expected sales proceeds, less cost to sell, is estimated to be less than the carrying amount of the assets. As a result, an impairment loss of $0.9 million was recognized during the year ended December 31, 2017. |
| • | Tax effect of non-GAAP adjustments. We use a constant non-GAAP tax rate of 19%, which we believe reflects the long-term average tax rate based on our international structure and geographic distribution of revenue and profit. The long-term average tax rate is calculated in accordance with the principles of ASC 740, after excluding the tax effect of the non-GAAP items described above, $10.3 million of previously unrecognized tax benefits associated with the 2012 sale of our Foster City building and land, which we recognized in the year ended December 31, 2016, and $27.5 million of tax charges associated with the 2017 Tax Act, which we recognized in the year ended December 31, 2017. |
Usefulness of Non-GAAP Financial Information to Investors
These non-GAAP measures, including ex-currency, are not in accordance with or an alternative to GAAP and may be materially different from other non-GAAP measures, including similarly titled non-GAAP measures, used by other companies. The presentation of this additional information should not be considered in isolation from, as a substitute for, or superior to, revenue, gross profit, operating expenses, net income (loss), or earnings per diluted share prepared in accordance with GAAP. Non-GAAP financial measures have limitations in that
68
Table of Contents
they do not reflect certain items that may have a material impact upon our reported financial results. We expect to continue to incur expenses of a nature similar to the non-GAAP adjustments described above, and exclusion of these items from our non-GAAP net income and non-GAAP earnings per diluted share should not be construed as an inference that these costs are unusual, infrequent, or non-recurring.
2017 Reconciliation of GAAP Net Income (Loss) to Non-GAAP Net Income
using 2016 Exchange Rates
(unaudited)
| For the years ended December 31, | ||||||||||||||||
| 2017 | 2016 | 2015 | Ex-Currency | |||||||||||||
| (in millions, except per share data) |
2017 | |||||||||||||||
| Net income (loss) |
$ | (15.3 | ) | $ | 44.9 | $ | 32.2 | $ | (15.3 | ) | ||||||
|
|
|
|
|
|
|
|
|
|||||||||
| Cost of revenue adjustment—FFPS inventory valuation |
1.4 | — | — | 1.4 | ||||||||||||
| Amortization of identified intangible assets |
47.3 | 39.6 | 26.5 | 47.3 | ||||||||||||
| Ex-currency adjustment |
— | — | — | 0.1 | ||||||||||||
| Stock-based compensation expense |
26.5 | 31.8 | 34.1 | 26.5 | ||||||||||||
| Non-cash settlement of vacation liabilities by issuing RSUs |
— | 3.1 | 1.3 | — | ||||||||||||
| Restructuring and other |
7.6 | 6.7 | 5.7 | 7.6 | ||||||||||||
| General and administrative: |
||||||||||||||||
| Acquisition-related transaction costs |
2.1 | 2.2 | 5.5 | 2.1 | ||||||||||||
| Change in fair value of contingent consideration |
6.5 | 6.9 | (2.1 | ) | 6.5 | |||||||||||
| Revenue recognition and accounting review costs |
6.4 | — | — | 6.4 | ||||||||||||
| Litigation settlements |
0.4 | 1.0 | 0.6 | 0.4 | ||||||||||||
| Asset impairment |
0.9 | — | — | 0.9 | ||||||||||||
| Interest income and other income (expense), net: |
||||||||||||||||
| Non-cash interest expense related to our Notes |
13.1 | 12.4 | 11.8 | 13.1 | ||||||||||||
| Foreign exchange fluctuation related to contingent consideration |
— | 1.1 | — | — | ||||||||||||
| Balance sheet currency remeasurement impact |
— | — | — | 1.6 | ||||||||||||
| Tax effect of non-GAAP net income |
3.8 | (33.6 | ) | (19.2 | ) | 3.5 | ||||||||||
|
|
|
|
|
|
|
|
|
|||||||||
| Non-GAAP net income |
$ | 100.7 | $ | 116.2 | $ | 96.4 | $ | 102.1 | ||||||||
|
|
|
|
|
|
|
|
|
|||||||||
| Non-GAAP net income per diluted share |
$ | 2.14 | $ | 2.43 | $ | 2.00 | $ | 2.17 | ||||||||
|
|
|
|
|
|
|
|
|
|||||||||
| Shares for purposes of computing diluted non-GAAP net income per share |
47.1 | 47.8 | 48.2 | 47.1 | ||||||||||||
|
|
|
|
|
|
|
|
|
|||||||||
69
Table of Contents
2017 RECONCILIATION OF GAAP REVENUE BY OPERATING SEGMENT & GEOGRAPHIC AREA TO NON-GAAP EX-CURRENCY using 2016 Exchange Rates
(unaudited)
| For the years ended December 31, | ||||||||||||||||||||||||||||||||||||||||||||
| GAAP | Ex-Currency | GAAP | Ex-Currency | |||||||||||||||||||||||||||||||||||||||||
| GAAP 2017 |
Percent of total |
Ex-Currency | 2017 | Percent of total |
GAAP 2016 |
Percent of total |
Change from 2016 GAAP |
Change from 2016 GAAP |
||||||||||||||||||||||||||||||||||||
| (in thousands) |
$ | % | $ | % | ||||||||||||||||||||||||||||||||||||||||
| Industrial Inkjet |
$ | 570,688 | 57 | % | $ | (4,975 | ) | $ | 565,713 | 57 | % | $ | 562,583 | 57 | % | $ | 8,105 | 1 | % | $ | 3,130 | 1 | % | |||||||||||||||||||||
| Productivity Software |
156,561 | 16 | (701 | ) | 155,860 | 16 | 151,737 | 15 | 4,824 | 3 | 4,123 | 3 | ||||||||||||||||||||||||||||||||
| Fiery |
266,011 | 27 | (17 | ) | 265,994 | 27 | 277,745 | 28 | (11,734 | ) | (4 | ) | (11,751 | ) | (4 | ) | ||||||||||||||||||||||||||||
|
|
|
|
|
|
|
|
|
|
|
|
|
|
|
|
|
|
|
|
|
|
|
|||||||||||||||||||||||
| Total revenue |
$ | 993,260 | 100 | % | $ | (5,693 | ) | $ | 987,567 | 100 | % | $ | 992,065 | 100 | % | $ | 1,195 | — | % | $ | (4,498 | ) | — | % | ||||||||||||||||||||
|
|
|
|
|
|
|
|
|
|
|
|
|
|
|
|
|
|
|
|
|
|
|
|||||||||||||||||||||||
| For the years ended December 31, | ||||||||||||||||||||||||||||||||||||||||||||
| GAAP | Ex-Currency | GAAP | Ex-Currency | |||||||||||||||||||||||||||||||||||||||||
| GAAP 2017 |
Percent of total |
Ex-Currency | 2017 | Percent of total |
GAAP 2016 |
Percent of total |
Change from 2016 GAAP |
Change from 2016 GAAP |
||||||||||||||||||||||||||||||||||||
| (in thousands) |
$ | % | $ | % | ||||||||||||||||||||||||||||||||||||||||
| Americas |
$ | 487,968 | 49 | % | $ | (950 | ) | $ | 487,018 | 49 | % | $ | 500,411 | 50 | % | $ | (12,443 | ) | (2 | )% | $ | (13,393 | ) | (3 | )% | |||||||||||||||||||
| EMEA |
369,610 | 37 | (3,372 | ) | 366,238 | 37 | 360,305 | 37 | 9,305 | 3 | 5,933 | 2 | ||||||||||||||||||||||||||||||||
| APAC |
135,682 | 14 | (1,372 | ) | 134,310 | 14 | 131,349 | 13 | 4,333 | 3 | 2,961 | 2 | ||||||||||||||||||||||||||||||||
|
|
|
|
|
|
|
|
|
|
|
|
|
|
|
|
|
|
|
|
|
|
|
|||||||||||||||||||||||
| Total revenue |
$ | 993,260 | 100 | % | $ | (5,694 | ) | $ | 987,566 | 100 | % | $ | 992,065 | 100 | % | $ | 1,195 | — | % | $ | (4,499 | ) | — | % | ||||||||||||||||||||
|
|
|
|
|
|
|
|
|
|
|
|
|
|
|
|
|
|
|
|
|
|
|
|||||||||||||||||||||||
2017 RECONCILIATION OF GAAP REVENUE & GROSS PROFIT BY OPERATING SEGMENT TO
NON-GAAP EX-CURRENCY using 2016 Exchange Rates
(unaudited)
| For the years ended December 31, | ||||||||||||||||
| GAAP | Ex-Currency Adjustments |
Ex-Currency | GAAP | |||||||||||||
| (in thousands) |
2017 | 2017 | 2016 | |||||||||||||
| Industrial Inkjet |
||||||||||||||||
| Revenue |
$ | 570,688 | $ | (4,975 | ) | $ | 565,713 | $ | 562,583 | |||||||
| Gross profit |
208,620 | (2,137 | ) | 206,483 | 198,923 | |||||||||||
| Gross profit percentages |
36.6 | % | 36.5 | % | 35.4 | % | ||||||||||
| Productivity Software |
||||||||||||||||
| Revenue |
$ | 156,561 | $ | (701 | ) | $ | 155,860 | $ | 151,737 | |||||||
| Gross profit |
114,460 | (680 | ) | 113,780 | 114,179 | |||||||||||
| Gross profit percentages |
73.1 | % | 73.0 | % | 75.2 | % | ||||||||||
| Fiery |
||||||||||||||||
| Revenue |
$ | 266,011 | $ | (17 | ) | $ | 265,994 | $ | 277,745 | |||||||
| Gross profit |
185,937 | (3 | ) | 185,934 | 198,322 | |||||||||||
| Gross profit percentages |
69.9 | % | 69.9 | % | 71.4 | % | ||||||||||
A reconciliation of operating segment gross profit to the consolidated statements of operations for the years ended December 31, 2017 and 2016 is as follows:
| For the years ended December 31, | ||||||||||||||||
| GAAP | Ex-Currency Adjustments |
Ex-Currency | GAAP | |||||||||||||
| (in thousands) |
2017 | 2017 | 2016 | |||||||||||||
| Segment gross profit |
$ | 509,017 | $ | (2,817 | ) | $ | 506,200 | $ | 511,424 | |||||||
| Stock-based compensation expense |
(2,561 | ) | — | (2,561 | ) | (2,784 | ) | |||||||||
| Other items excluded from segment profit |
— | — | — | (475 | ) | |||||||||||
|
|
|
|
|
|
|
|
|
|||||||||
| Gross profit |
$ | 506,456 | $ | (2,817 | ) | $ | 503,639 | $ | 508,165 | |||||||
|
|
|
|
|
|
|
|
|
|||||||||
70
Table of Contents
2017 RECONCILIATION OF GAAP OPERATING EXPENSES TO
NON-GAAP EX-CURRENCY using 2016 Exchange Rates
(unaudited)
| For the years ended December 31, | ||||||||||||||||||||||||||||||||
| (in thousands) |
GAAP | Ex-Currency | GAAP | Ex-Currency | ||||||||||||||||||||||||||||
| 2017 | Ex-Currency Adjustments |
2017 | 2016 | Change from 2016 GAAP |
Change from 2016 GAAP |
|||||||||||||||||||||||||||
| $ | % | $ | % | |||||||||||||||||||||||||||||
| Research and development |
$ | 157,358 | $ | (1,111 | ) | $ | 156,247 | $ | 151,395 | $ | 5,963 | 4 | % | $ | 4,852 | 3 | % | |||||||||||||||
| Sales and marketing |
173,697 | (952 | ) | 172,745 | 169,042 | 4,655 | 3 | 3,703 | 2 | |||||||||||||||||||||||
| General and administrative |
92,953 | (733 | ) | 92,220 | 85,618 | 7,335 | 9 | 6,602 | 8 | |||||||||||||||||||||||
| Amortization of identified intangibles |
47,339 | (834 | ) | 46,505 | 39,560 | 7,779 | 20 | 6,945 | 18 | |||||||||||||||||||||||
| Restructuring and other |
7,562 | 1 | 7,563 | 6,731 | 831 | 12 | 832 | 12 | ||||||||||||||||||||||||
|
|
|
|
|
|
|
|
|
|
|
|
|
|
|
|
|
|||||||||||||||||
| Total operating expenses |
$ | 478,909 | $ | (3,629 | ) | $ | 475,280 | $ | 452,346 | $ | 26,563 | 6 | % | $ | 22,934 | 5 | % | |||||||||||||||
|
|
|
|
|
|
|
|
|
|
|
|
|
|
|
|
|
|||||||||||||||||
2016 Reconciliation of GAAP Net Income to Non-GAAP Net Income
using 2015 Exchange Rates
(unaudited)
| For the years ended December 31, | ||||||||||||||||
| 2016 | 2015 | 2014 | Ex-Currency | |||||||||||||
| (in millions, except per share data) |
2016 | |||||||||||||||
| Net income |
$ | 44.9 | $ | 32.2 | $ | 33.7 | $ | 44.9 | ||||||||
|
|
|
|
|
|
|
|
|
|||||||||
| Amortization of identified intangible assets |
39.6 | 26.5 | 20.7 | 39.6 | ||||||||||||
| Ex-currency adjustment |
— | — | — | 1.7 | ||||||||||||
| Stock-based compensation expense |
31.8 | 34.1 | 36.1 | 31.8 | ||||||||||||
| Non-cash settlement of vacation liabilities by issuing RSUs |
3.1 | 1.3 | — | 3.1 | ||||||||||||
| Restructuring and other |
6.7 | 5.7 | 6.6 | 6.7 | ||||||||||||
| General and administrative: |
||||||||||||||||
| Acquisition-related transaction costs |
2.2 | 5.5 | 1.5 | 2.2 | ||||||||||||
| Change in fair value of contingent consideration |
6.9 | (2.1 | ) | (3.8 | ) | 6.9 | ||||||||||
| Litigation reserve provisions, net of releases |
1.0 | 0.6 | 0.9 | 1.0 | ||||||||||||
| Interest income and other income (expense), net: |
||||||||||||||||
| Non-cash interest expense related to our Notes |
12.4 | 11.8 | 3.5 | 12.4 | ||||||||||||
| Foreign exchange fluctuation related to contingent consideration |
1.1 | — | — | 1.1 | ||||||||||||
| Balance sheet currency remeasurement impact |
— | — | — | 2.8 | ||||||||||||
| Tax effect of non-GAAP net income |
(33.6 | ) | (19.2 | ) | (12.1 | ) | (34.4 | ) | ||||||||
|
|
|
|
|
|
|
|
|
|||||||||
| Non-GAAP net income |
$ | 116.2 | $ | 96.4 | $ | 87.1 | $ | 119.9 | ||||||||
|
|
|
|
|
|
|
|
|
|||||||||
| Non-GAAP net income per diluted share |
$ | 2.43 | $ | 2.00 | $ | 1.80 | $ | 2.51 | ||||||||
|
|
|
|
|
|
|
|
|
|||||||||
| Shares for purposes of computing diluted non-GAAP |
47.8 | 48.2 | 48.4 | 47.8 | ||||||||||||
|
|
|
|
|
|
|
|
|
|||||||||
71
Table of Contents
2016 RECONCILIATION OF GAAP REVENUE BY OPERATING SEGMENT & GEOGRAPHIC AREA TO NON-GAAP EX-CURRENCY using 2015 Exchange Rates
(unaudited)
| For the years ended December 31, | ||||||||||||||||||||||||||||||||||||||||||||
| GAAP | Ex-Currency | GAAP | Ex-Currency | |||||||||||||||||||||||||||||||||||||||||
| GAAP 2016 |
Percent of total |
Ex-Currency | 2016 | Percent of total |
GAAP 2015 |
Percent of total |
Change from 2015 GAAP |
Change from 2015 GAAP |
||||||||||||||||||||||||||||||||||||
| (in thousands) |
$ | % | $ | % | ||||||||||||||||||||||||||||||||||||||||
| Industrial Inkjet |
$ | 562,583 | 57 | % | $ | 7,735 | $ | 570,318 | 57 | % | $ | 447,705 | 51 | % | $ | 114,878 | 26 | % | $ | 122,613 | 27 | % | ||||||||||||||||||||||
| Productivity Software |
151,737 | 15 | 2,109 | 153,846 | 15 | 135,350 | 15 | 16,387 | 12 | 18,496 | 14 | |||||||||||||||||||||||||||||||||
| Fiery |
277,745 | 28 | 84 | 277,829 | 28 | 299,458 | 34 | (21,713 | ) | (7 | ) | (21,629 | ) | (7 | ) | |||||||||||||||||||||||||||||
|
|
|
|
|
|
|
|
|
|
|
|
|
|
|
|
|
|
|
|
|
|
|
|||||||||||||||||||||||
| Total revenue |
$ | 992,065 | 100 | % | $ | 9,928 | $ | 1,001,993 | 100 | % | $ | 882,513 | 100 | % | $ | 109,552 | 12 | % | $ | 119,480 | 14 | % | ||||||||||||||||||||||
|
|
|
|
|
|
|
|
|
|
|
|
|
|
|
|
|
|
|
|
|
|
|
|||||||||||||||||||||||
| For the years ended December 31, | ||||||||||||||||||||||||||||||||||||||||||||
| GAAP | Ex-Currency | GAAP | Ex-Currency | |||||||||||||||||||||||||||||||||||||||||
| GAAP 2016 |
Percent of total |
Ex-Currency | 2016 | Percent of total |
GAAP 2015 |
Percent of total |
Change from 2015 GAAP |
Change from 2015 GAAP |
||||||||||||||||||||||||||||||||||||
| (in thousands) |
$ | % | $ | % | ||||||||||||||||||||||||||||||||||||||||
| Americas |
$ | 500,411 | 50 | % | $ | 388 | $ | 500,799 | 50 | % | $ | 473,599 | 54 | % | $ | 26,812 | 6 | % | $ | 27,200 | 6 | % | ||||||||||||||||||||||
| EMEA |
360,305 | 37 | 7,283 | 367,588 | 37 | 291,103 | 33 | 69,202 | 24 | 76,485 | 26 | |||||||||||||||||||||||||||||||||
| APAC |
131,349 | 13 | 2,257 | 133,606 | 13 | 117,811 | 13 | 13,538 | 11 | 15,795 | 13 | |||||||||||||||||||||||||||||||||
|
|
|
|
|
|
|
|
|
|
|
|
|
|
|
|
|
|
|
|
|
|
|
|||||||||||||||||||||||
| Total revenue |
$ | 992,065 | 100 | % | $ | 9,928 | $ | 1,001,993 | 100 | % | $ | 882,513 | 100 | % | $ | 109,552 | 12 | % | $ | 119,480 | 14 | % | ||||||||||||||||||||||
|
|
|
|
|
|
|
|
|
|
|
|
|
|
|
|
|
|
|
|
|
|
|
|||||||||||||||||||||||
2016 RECONCILIATION OF GAAP REVENUE & GROSS PROFIT BY OPERATING SEGMENT TO
NON-GAAP EX-CURRENCY using 2015 Exchange Rates
(unaudited)
| For the years ended December 31, | ||||||||||||||||
| GAAP | Ex-Currency Adjustments |
Ex-Currency | GAAP | |||||||||||||
| (in thousands) |
2016 | 2016 | 2015 | |||||||||||||
| Industrial Inkjet |
||||||||||||||||
| Revenue |
$ | 562,583 | $ | 7,735 | $ | 570,318 | $ | 447,705 | ||||||||
| Gross profit |
198,923 | 4,205 | 203,128 | 150,964 | ||||||||||||
| Gross profit percentages |
35.4 | % | 35.6 | % | 33.7 | % | ||||||||||
| Productivity Software |
||||||||||||||||
| Revenue |
$ | 151,737 | $ | 2,109 | $ | 153,846 | $ | 135,350 | ||||||||
| Gross profit |
114,179 | 1,255 | 115,434 | 99,278 | ||||||||||||
| Gross profit percentages |
75.2 | % | 75.0 | % | 73.3 | % | ||||||||||
| Fiery |
||||||||||||||||
| Revenue |
$ | 277,745 | $ | 84 | $ | 277,829 | $ | 299,458 | ||||||||
| Gross profit |
198,322 | 82 | 198,404 | 210,140 | ||||||||||||
| Gross profit percentages |
71.4 | % | 71.4 | % | 70.2 | % | ||||||||||
A reconciliation of operating segment gross profit to the consolidated statements of operations for the years ended December 31, 2016 and 2015 is as follows:
| For the years ended December 31, | ||||||||||||||||
| GAAP | Ex-Currency Adjustments |
Ex-Currency | GAAP | |||||||||||||
| (in thousands) |
2016 | 2016 | 2015 | |||||||||||||
| Segment gross profit |
$ | 511,424 | $ | 5,460 | $ | 516,884 | $ | 460,382 | ||||||||
| Stock-based compensation expense |
(2,784 | ) | — | (2,784 | ) | (2,837 | ) | |||||||||
| Other items excluded from segment profit |
(475 | ) | — | (475 | ) | (115 | ) | |||||||||
|
|
|
|
|
|
|
|
|
|||||||||
| Gross profit |
$ | 508,165 | $ | 5,460 | $ | 513,625 | $ | 457,430 | ||||||||
|
|
|
|
|
|
|
|
|
|||||||||
72
Table of Contents
2016 RECONCILIATION OF GAAP OPERATING EXPENSES TO
NON-GAAP EX-CURRENCY using 2015 Exchange Rates
(unaudited)
| For the years ended December 31, | ||||||||||||||||||||||||||||||||
| (in thousands) |
GAAP | Ex-Currency | GAAP | Ex-Currency | ||||||||||||||||||||||||||||
| 2016 | Ex-Currency Adjustment |
2016 | 2015 | Change from 2015 GAAP |
Change from 2015 GAAP |
|||||||||||||||||||||||||||
| $ | % | $ | % | |||||||||||||||||||||||||||||
| Research and development |
$ | 151,395 | $ | 1,283 | $ | 152,678 | $ | 141,364 | $ | 10,031 | 7 | % | $ | 11,314 | 8 | % | ||||||||||||||||
| Sales and marketing |
169,042 | 1,884 | 170,926 | 156,339 | 12,703 | 8 | 14,587 | 9 | ||||||||||||||||||||||||
| General and administrative |
85,618 | 1,206 | 86,824 | 72,797 | 12,821 | 18 | 14,027 | 19 | ||||||||||||||||||||||||
| Amortization of identified intangibles |
39,560 | 237 | 39,797 | 26,510 | 13,050 | 49 | 13,287 | 50 | ||||||||||||||||||||||||
| Restructuring and other |
6,731 | 122 | 6,853 | 5,731 | 1,000 | 17 | 1,122 | 20 | ||||||||||||||||||||||||
|
|
|
|
|
|
|
|
|
|
|
|
|
|
|
|
|
|||||||||||||||||
| Total operating expenses |
$ | 452,346 | $ | 4,732 | $ | 457,078 | $ | 402,741 | $ | 49,605 | 12 | % | $ | 54,337 | 13 | % | ||||||||||||||||
|
|
|
|
|
|
|
|
|
|
|
|
|
|
|
|
|
|||||||||||||||||
Critical Accounting Policies
The preparation of consolidated financial statements requires estimates and judgments that affect the reported amounts of assets, liabilities, revenue, expenses, and related disclosure of contingent assets and liabilities. We evaluate our estimates, including those related to revenue recognition, bad debts, inventory valuation and purchase commitment reserves, warranty obligations, litigation, restructuring activities, fair value of financial instruments, stock-based compensation, income taxes, valuation of goodwill and intangible assets, business combinations, build-to-suit leases, and contingencies on an ongoing basis. Estimates are based on historical and current experience, the impact of the current economic environment, and various other assumptions believed to be reasonable under the circumstances at the time of the estimate, the results of which form the basis for making judgments about the carrying values of assets and liabilities that are not readily apparent from other sources. Actual results may differ from these estimates under different assumptions or conditions.
Our critical accounting policies and estimates are as follows:
| • | revenue recognition; |
| • | allowances for doubtful accounts, |
| • | inventory valuation and purchase commitment reserves, |
| • | warranty reserves, |
| • | litigation accruals, |
| • | restructuring reserves, |
| • | fair value of financial instruments; |
| • | accounting for stock-based compensation; |
| • | accounting for income taxes; |
| • | valuation analyses of goodwill and intangible assets; |
| • | business combinations; |
| • | build-to-suit leases; and |
| • | determination of functional currencies for consolidating international operations. |
73
Table of Contents
Revenue recognition. Significant management judgments and estimates must be made and used in connection with the revenue recognized in any accounting period. Please refer to Note 1—The Company and its Significant Accounting Policies of the Notes to Consolidated Financial Statements for a more thorough and complete description of our revenue recognition accounting policy. For purposes of evaluating and understanding the judgments required, our revenue recognition policy is summarized below.
Product revenue includes hardware (industrial digital inkjet printers including components placed under maintenance agreements, ink required for industrial digital inkjet printers, design-licensed solutions including upgrades, and DFEs), software licensing and development, and royalties. Service revenue includes software license maintenance agreements, industrial digital inkjet printer maintenance and service, customer support, training, and consulting. The timing of revenue recognition for each of these categories is discussed below.
We recognize revenue on the sale of printers, ink, and DFEs in accordance with the provisions of SEC SAB 104, Revenue Recognition, and when applicable, ASC 605-25, Revenue Recognition—Multiple-Element Arrangements. We recognize revenue when persuasive evidence of an arrangement exists, delivery has occurred, the fee is fixed or determinable, and collection is reasonably assured. Products generally must be shipped against written purchase orders. We use either a binding purchase order or signed contract as evidence of an arrangement. Sales to some of the leading printer manufacturers are evidenced by a master agreement governing the relationship together with a binding purchase order. Sales to our resellers are also evidenced by binding purchase orders or signed contracts and do not generally contain rights of return or price protection.
We hold certain products manufactured by us on a “bill and hold” basis for our customers’ convenience. We recognized these “bill and hold” arrangements in accordance with SAB 104, which requires consideration of, among other things, whether the customer has made a fixed commitment to purchase; the existence of a substantial business purpose for the arrangement; the “bill and hold” arrangement is at the request of the customer; the scheduled delivery date must be reasonable and consistent with the buyer’s business purpose; title and risk of ownership must pass to the customer, including any decline in the market value of the product; the product is complete and ready for shipment; the product has been segregated from our inventory; payment terms for such arrangements have not been modified from our normal billing and credit terms; our custodial risks must be insurable and insured; and no further performance obligations exist. Extended procedures are not necessary to assure that there are no exceptions to the customer’s commitment to accept and pay for the product. There are no bill-and-hold arrangements outstanding as of December 31, 2017.
For multiple element arrangements, we allocate revenue to the software deliverables and the non-software deliverables as a group based on the relative selling prices of all of the deliverables in the arrangement. For non-software deliverables, we allocate the arrangement consideration based on the relative selling price of the deliverables using best estimate of the sales price (“BESP”). For software deliverables (including post-contract customer support, professional services, hosting, and training), we generally use vendor-specific objective evidence of the fair value of the sales price (“VSOE”), when available. The selling price for each element is based upon the following hierarchy: VSOE if available, third party evidence (“TPE”) if VSOE is not available, or BESP if neither VSOE nor TPE are available.
We have established our ability to produce estimates sufficiently dependable to require adoption of the percentage of completion method with respect to certain fixed price contracts where we provide information technology system development and implementation services. Revenue on such contracts is recognized over the contract term based on the percentage of development and implementation services that are provided during the period compared with the total estimated development and implementation services to be provided over the entire contract. These services require that we perform significant, extensive, and complex design, development, modification, or implementation activities of our customers’ systems. Performance will often extend over long periods, and our right to receive future payment depends on our future performance in accordance with these agreements.
74
Table of Contents
The key estimates and assumptions and corresponding uncertainties for recognizing revenue are summarized as follows:
| Key Estimates and Assumptions |
Key Uncertainties | |
| We establish VSOE of selling price using the price charged for a deliverable when sold separately and generally evidenced by a substantial majority of historical stand-alone transactions falling within a reasonably narrow range. In addition, we consider major service type, customer type, and other variables in determining VSOE. Our revenue estimates and assumptions are based on our ability to assert and maintain VSOE.
BESP is generally evidenced by a majority of historical transactions falling within a reasonable price range. We also consider multiple factors, including, but not limited to, cost of products, gross margin objectives, historical pricing practices, customer type, and distribution channels. Our revenue estimates and assumptions are based on our ability to maintain consistent BESP.
Distributors and resellers participate in various marketing and other programs, and we maintain estimated accruals and allowances for these programs based on contractual terms and historical experience.
If the arrangement includes a customer-negotiated refund or right of return relative to the delivered item and the delivery and performance of the undelivered item is considered probable and substantially in our control, the delivered element constitutes a separate unit of accounting. We limit revenue recognition for delivered elements to the amount that is not contingent on the future delivery of products or services, future performance obligations, or subject to customer-specified return or refund privileges.
The percentage of completion method involves recognizing probable and reasonably estimable revenue using the percentage of services completed based on the current cumulative cost as a percentage of the estimated total cost, using a reasonably consistent profit margin over the period. |
As our business and offerings evolve over time, modifications to our pricing and discounting methodologies, changes in the scope and nature of service offerings and/or changes in customer segmentation may result in a lack of consistency required to establish and/or maintain VSOE or to maintain consistent BESP. Additionally, technological changes resulting in variability in product costs and gross margins may require changes to our BESP model. Changes in BESP may result in a different allocation of revenue to the deliverables in multiple-element arrangements. These factors, among others, may adversely impact the amount of revenue and gross margins we report in a particular period.
If we experience changes in market or competitive conditions resulting in credits issued to our distributors and partners deviating significantly from our estimates, our revenue may be adversely impacted.
Revenue recognition is dependent on proper identification of the separate units of accounting in an arrangement and determining whether they have stand-alone value. Significant contract interpretation can be required to determine the appropriate accounting, including whether the deliverables specified in a multiple element arrangement should be treated as separate units of accounting for revenue recognition purposes, and, if so, how the price should be allocated among the elements and when to recognize revenue for each element.
Due to the long-term nature of these projects, developing the estimates of costs often requires significant judgment. Factors that must be considered in estimating the progress of work completed and ultimate cost of the projects include, but are not limited to, the availability of labor and labor productivity, the nature and complexity of the work to be performed, and the impact of delayed performance. If changes occur in delivery, productivity, or other factors used in developing the estimates of costs or revenue, we revise our cost and revenue estimates, which may result in increases or decreases in revenue and costs. Such revisions are reflected in net income (loss) in the period in which the facts that give rise to that revision become known. | |
75
Table of Contents
Allowances for doubtful accounts. We establish an allowance for doubtful accounts to ensure that trade receivables are not overstated due to uncollectibility. Our accounts receivable balance was $244.4 million, net of allowance for doubtful accounts and revenue reserves of $32.2 million, as of December 31, 2017. To ensure that we have established an adequate allowance for doubtful accounts, management analyzes accounts receivable and historical bad debts, customer concentrations, customer creditworthiness, current economic trends and macroeconomic conditions, changes in customer payment terms, the length of time receivables are past due, and significant one-time events. We record specific reserves for individual accounts when we become aware of specific customer circumstances, such as bankruptcy filings, deterioration in the customer’s operating results or financial position, or potential unfavorable outcomes from disputes with customers or vendors.
Inventory valuation. Management estimates potential future inventory obsolescence and noncancellable purchase commitments to properly value inventory and establish adequate reserves for potential losses on purchase commitments. Significant management judgment and estimates must be made related to inventory valuation including the evaluation of current economic trends, changes in customer demand, product design changes, product life and demand, and the acceptance of our products.
Warranty reserves. Our Industrial Inkjet printer products are generally accompanied by a 13-month limited warranty, which covers both parts and labor. Our Fiery DFE products are generally accompanied by a 12 to 15-month limited warranty. In accordance with ASC 450-30, Loss Contingencies, an accrual is established when the warranty liability is estimable and probable based upon historical experience. A provision for estimated future warranty work is recorded in cost of revenue when revenue is recognized. As a result of the 2017 acquisition of FFPS, we have agreed to provide warranty coverage for certain expired FFPS warranties for five years subsequent to the acquisition.
The warranty liability is reviewed regularly and periodically adjusted to reflect changes in warranty estimates. Significant management judgments and estimates must be made in connection with establishing and updating warranty reserves including estimated potential inventory return rates and replacement or repair costs. Warranty reserves were $16.3 million as of December 31, 2017.
Litigation accruals. We may be involved, from time to time, in a variety of claims, lawsuits, investigations, or proceedings relating to contractual disputes, securities laws, intellectual property rights, employment, or other matters that may arise in the normal course of business. We assess our potential liability in each of these matters by using the information available to us. We develop our views on estimated losses in consultation with inside and outside counsel, which involves a subjective analysis of potential results and various combinations of appropriate litigation and settlement strategies. We accrue estimated losses from contingencies if a loss is deemed probable and can be reasonably estimated.
The material assumptions used by management to estimate the required litigation accrual include:
| • | communication with our external attorneys regarding the expected duration of the lawsuit, the potential outcome of the lawsuit, and the likelihood of settlement; |
| • | likelihood of assertion of unasserted claims and assessments; |
| • | our strategy regarding the lawsuit; |
| • | deductible amounts under our insurance policies; and |
| • | past experiences with similar lawsuits. |
Litigation is inherently unpredictable, and while we believe that we have valid defenses with respect to legal matters pending against us, our financial statements could be materially affected in any particular period by the unfavorable resolution of one or more of these contingencies or because of the diversion of management’s attention and the incurrence of significant expenses.
76
Table of Contents
Restructuring reserves. We have engaged, and may continue to engage, in restructuring actions, which require management to utilize significant estimates related to the timing and the expense for severance and other employee separation costs, realizable values of assets made obsolete, lease cancellation, facility downsizing, and other exit costs. If actual amounts differ from our estimates, the amount of the restructuring charges could be materially impacted.
Fair value of financial instruments. We invest our excess cash on deposit with major banks in money market, U.S. Treasury and government-sponsored entity, corporate debt, municipal, asset-backed, and mortgage-backed residential securities. By policy, we invest primarily in high-grade marketable securities. We are exposed to credit risk in the event of default by the financial institutions or issuers of these investments to the extent of amounts recorded in the Consolidated Balance Sheets.
As a basis for considering market participant assumptions in fair value measurements, ASC 820 establishes a three-tier fair value hierarchy as more fully defined in Note 6—Investments and Fair Value Measurements of the Notes to Consolidated Financial Statements. We utilize the market approach to measure fair value of our fixed income securities. The “market approach” is a valuation technique that uses prices and other relevant information generated by market transactions involving identical or comparable assets or liabilities. The fair value of our fixed income securities is obtained using readily-available market prices from a variety of industry standard data providers, large financial institutions, and other third-party sources for the identical underlying securities.
As part of this process, we engaged pricing services to assist management in its analysis. All estimates, key assumptions, and forecasts were either provided by or reviewed by us. While we chose to utilize third party pricing services, the impairment analysis and related valuations represent the conclusions of management and not the conclusions or statements of any third party.
Specifically, we obtain the fair value of our Level 2 financial instruments from third party asset managers, the custodian bank, and the accounting service provider. Independently, these service providers use professional pricing services to gather pricing data, which may include quoted market prices for identical or comparable instruments or inputs other than quoted prices that are observable either directly or indirectly.
The validation procedures performed by management include the following:
| • | obtaining an understanding of the pricing service’s valuation methodologies, including the timing and frequency, |
| • | evaluating the type, nature, and complexity of our investments in financial instruments, |
| • | evaluating the activity level in the market for the type of securities in which we have invested including the volatility of price movements requiring analysis, and |
| • | validating the quoted market prices provided by our service providers by completing a three-way reconciliation, comparing the assessment of the fair values provided by the asset manager, the custody bank, and the accounting book of record provider for each portfolio. |
Obtaining an understanding of these valuation risks allows us to respond by developing internal controls that appropriately mitigate any risks identified. If material discrepancies are noted when comparing the valuations on a security-by-security basis, then we conduct detailed pricing analysis, search alternative pricing sources, or require the service provider to provide an in-depth price analysis prior to recording the fair value in our financial statements. If we determine that a price provided by the third party pricing services is not reflective of the fair value of the security, we require the custodian bank or accounting service provider to update their price file accordingly.
At least annually, we review the pricing practices followed by the various entities involved in determining the fair value of our securities. Also, at least annually, we review the internal controls provided in place at the custodian bank and the accounting service provider.
77
Table of Contents
Accounting for stock-based compensation. We account for stock-based compensation in accordance with ASC 718, which requires stock-based compensation expense to be recognized based on the fair value of such awards on the date of grant. We amortize stock-based compensation expense on a graded vesting basis over the vesting period, after assessing the probability of achieving the requisite performance criteria with respect to performance-based awards. Stock-based compensation expense is recognized over the requisite service period for each separately vesting tranche as though the award were, in substance, multiple awards. We account for forfeitures when they occur. Prior to adoption of ASU 2016-09, Stock Compensation—Improvements to Employee Share Based Payment Accounting, in 2016, forfeitures were estimated at the grant date and revised on a cumulative basis, if necessary, in subsequent periods if actual forfeitures differ from those estimates. We used historical data and future expectations of employee turnover to estimate forfeitures. We must use our judgment in determining and applying the assumptions needed for the valuation of employee stock options, RSUs, and issuance of common stock under our ESPP.
We use the Black-Scholes-Merton (“BSM”) option pricing model to value stock-based compensation for all equity awards, except market-based awards. Market-based awards are valued using a Monte Carlo valuation model. Option pricing models were developed to estimate the value of traded options that have no vesting or hedging restrictions and are fully transferable. The BSM model determines the fair value of stock-based payment awards based on the stock price on the date of grant and is affected by assumptions regarding a number of highly complex and subjective variables. These variables include, but are not limited to, our expected stock price volatility over the term of the awards, expected term, interest rates, and actual and projected employee stock option exercise behavior. Expected volatility is based on the historical volatility of our stock over a preceding period commensurate with the expected term of the option. The expected term is based on management’s consideration of the historical life, vesting period, and contractual period of the options granted. The risk-free interest rate for the expected term of the option is based on the U.S. Treasury yield curve in effect at the time of grant. Expected dividend yield was not considered in the option pricing formula since we do not pay dividends and have no current plans to do so in the future.
Accounting for income taxes. Significant management judgment is required to determine our provision for income taxes, our deferred tax assets and liabilities, and any valuation allowance recorded against our deferred tax assets. We estimate our actual current tax expense, including permanent charges and benefits, and temporary differences resulting from differing treatment of items, such as deferred revenue for tax and book accounting purposes. These temporary differences result in deferred tax assets and liabilities, which are included within our Consolidated Balance Sheets. Tax reform legislation was enacted on December 22, 2017 (“2017 Tax Act”). Under ASC 740, we are required to recognize the effects of changes in tax law and rates on deferred tax assets and liabilities and the retroactive effects of changes in tax laws in the period in which the new legislation is enacted. In some cases, provisional amounts were recorded based on reasonable estimates. We will record the provisional amounts of the tax effects of the 2017 Tax Act in the first reporting period in which a reasonable estimate can be determined. SAB 118 provides that the measurement period may not extend beyond one year from the enactment date.
We assess the likelihood that our deferred tax assets will be recovered from future taxable income by considering both positive and negative evidence relating to their recoverability. If we believe that recovery of these deferred tax assets is not more likely than not, we establish a valuation allowance. To the extent that we increase a valuation allowance in a period, we include an expense in the Consolidated Statement of Operations in the period in which such determination is made.
In assessing the need for a valuation allowance, we considered all available evidence, including recent operating results, projections of future taxable income, our ability to utilize loss and credit carryforwards, and the feasibility of tax planning strategies. A significant piece of objective positive evidence evaluated for jurisdictions in a net deferred tax asset position was cumulative pre-tax income over the three years ended December 31, 2017. In addition, we considered that loss and credit carryforwards have not expired unused and a majority of our loss and credit carryforwards will not expire prior to 2022.
78
Table of Contents
As of December 31, 2017, we have determined that it is more likely than not that we will realize the benefit related to our deferred tax assets, except for a valuation allowance related to the realization of existing California, Luxembourg, Israel, Netherlands, and Turkey deferred tax assets.
Deferred tax assets, net of deferred tax liabilities, as of December 31, 2017 were $33.4 million, net of our valuation allowance of $45.5 million.
In accordance with ASC 740-10-25-5 through 17, Income Taxes—Basic Recognition Threshold, we account for uncertainty in income taxes by recognizing a tax position only when it is more likely than not that the tax position, based on its technical merits, will be sustained upon ultimate settlement with the applicable tax authority. The tax benefit to be recognized is the largest amount of tax benefit that is greater than fifty percent likely of being realized upon ultimate settlement with the applicable tax authority that has full knowledge of all relevant information.
Significant management judgment is required in evaluating our uncertain tax positions. Our gross unrecognized benefits are $38.2 million as of December 31, 2017. Our evaluation of uncertain tax positions is based on factors including, but not limited to, changes in facts or circumstances, changes in tax law, effectively settled issues under audit, and new audit activity. If actual settlements differ from these estimates, or we adjust these estimates in future periods, we may need to recognize additional tax benefits or charges that could materially impact our financial position and results of operations.
As of December 31, 2017, we have permanently reinvested $214.9 million of unremitted foreign earnings. Due to the changes resulting from the enactment of the 2017 Tax Act, we will not be subject to U.S. federal income tax on dividends received from our foreign subsidiaries commencing January 1, 2018. We are evaluating the potential foreign and U.S. state income tax liabilities that would result from future repatriations, if any, and how the 2017 Tax Act will impact our current permanent reinvestment assertion. We expect to complete this analysis and the impact, if any, which the 2017 Tax Act may have on our indefinite reinvestment assertion in the fourth quarter of 2018, or in an earlier quarter if our analysis is complete.
Valuation analyses of goodwill and intangible assets. We perform our annual goodwill impairment analysis in the fourth quarter of each year according to the provisions of ASC 350-20-35. A two-step impairment test of goodwill is required, unless the simplified method is elected. In the first step, the fair value of each reporting unit is compared to its carrying value. If the fair value exceeds carrying value, goodwill is not impaired and further testing is not required. If the carrying value exceeds fair value, then the second step of the impairment test is required to determine the implied fair value of the reporting unit’s goodwill. The implied fair value of goodwill is calculated by deducting the fair value of all tangible and intangible net assets of the reporting unit, excluding goodwill, from the fair value of the reporting unit as determined in the first step. If the carrying value of the reporting unit’s goodwill exceeds its implied fair value, then an impairment loss must be recorded equal to the difference.
Our goodwill valuation analysis is based on our respective reporting units (Industrial Inkjet, Productivity Software, and Fiery), which are consistent with our operating segments identified in Note 14—Segment Information, Geographic Regions, and Major Customers of the Notes to Consolidated Financial Statements. We determined the fair value of our reporting units as of December 31, 2017 by equally weighting the market and income approaches. Under the market approach, we estimated fair value based on market multiples of revenue or earnings of comparable companies. Under the income approach, we estimated fair value based on a discounted projected cash flow method using a discount rate determined by our management to be commensurate with the risk inherent in our current business model.
79
Table of Contents
The key estimates and assumptions and corresponding uncertainties for goodwill impairment analysis are summarized as follows:
| • | identification of comparable companies to benchmark under the market approach giving due consideration to the following factors: |
| ¡ | financial condition and operating performance of the reporting unit being evaluated relative to companies operating in the same or similar businesses, |
| ¡ | economic, environmental, and political factors faced by such companies, and |
| ¡ | companies that are considered to be reasonable investment alternatives. |
| • | impact of goodwill impairments recognized in prior years, |
| • | susceptibility of each of our reporting units to fair value fluctuations, |
| • | reporting unit revenue, gross profit, and operating expense growth rates, |
| • | six-year financial forecast, |
| • | discount rate to apply to estimated cash flows, |
| • | terminal values based on the Gordon growth methodology, |
| • | appropriate market comparables, |
| • | estimated multiples of revenue and earnings before interest expense and taxes (“EBIT”) that a willing buyer is likely to pay, |
| • | reasonable gross profit levels, |
| • | estimated control premium a willing buyer is likely to pay, including consideration of the following: |
| ¡ | the most similar transactions in relevant industries and determined the average premium indicated by the transactions deemed to be most similar to a hypothetical transaction involving our reporting units |
| ¡ | weighted average and median control premiums offered in relevant industries, |
| ¡ | industry specific control premiums, and |
| ¡ | specific transaction control premiums. |
| • | significant events or changes in circumstances including the following: |
| ¡ | significant negative industry or economic trends, |
| ¡ | significant decline in our stock price for a sustained period, |
| ¡ | our market capitalization relative to net book value, |
| ¡ | significant changes in the manner of our use of the acquired assets, |
| ¡ | significant changes in the strategy for our overall business, and |
| ¡ | our assessment of growth and profitability in each reporting unit over the coming years. |
Given the uncertainty of the economic environment and the potential impact on our business, there can be no assurance that our estimates and assumptions regarding the duration of the ongoing economic downturn in some regions, or the period or strength of recovery, made for purposes of our goodwill impairment testing at December 31, 2017 will prove to be accurate predictions of the future. If our assumptions regarding forecasted revenue or gross profit rates are not achieved, we may be required to record goodwill impairment charges in future periods relating to any of our reporting units, whether in connection with the next annual impairment
80
Table of Contents
testing in the fourth quarter of 2018 or prior to that, if any such change constitutes an interim triggering event. It is not possible to determine if any such future impairment charge would result or, if it does, whether such charge would be material.
As part of this process, we engaged a third party valuation firm to assist management in its analysis. All estimates, key assumptions, and forecasts were either provided by or reviewed by us. While we chose to utilize a third party valuation firm, the impairment analysis and related valuations represent the conclusions of management and not the conclusions or statements of any third party
Business combinations. We account for business acquisitions as purchase business combinations in accordance with ASC 805, which requires that the acquisition method of accounting be used for all business combinations. Please refer to Note 1—The Company and its Significant Accounting Policies of the Notes to Consolidated Financial Statements for our accounting policy with respect to accounting for business combinations.
We allocate the purchase price of acquired companies to the tangible and intangible assets acquired, including in-process research & development (“IPR&D”), and liabilities assumed based on their estimated fair values. Such a valuation requires management to make significant estimates and assumptions, especially with respect to intangible assets. The results of operations for each acquisition are included in our financial statements from the date of acquisition.
81
Table of Contents
The key estimates and assumptions and corresponding uncertainties to account for business acquisitions are summarized as follows:
| Key Estimates and Assumptions |
Key Uncertainties | |
| Management estimates fair value based on assumptions believed to be reasonable. These estimates are based on historical experience and information obtained from the management of the acquired companies. Critical estimates in valuing certain intangible assets include, but are not limited to: future expected cash flows; acquired developed technologies and patents; expected costs to develop IPR&D into commercially viable products and estimating cash flows from the projects when completed; the acquired company’s brand awareness and market position, as well as assumptions about the period of time the acquired brand will continue to be used in our product portfolio; and discount rates.
We estimate fair value of acquisition-related contingent consideration based on the probability of realization of the performance targets. This estimate is based on significant inputs that are not observable in the market, which ASC 820-10-35 refers to as Level 3 inputs, reflecting our assessment of the assumptions market participants would use to value these liabilities. The fair value of contingent consideration is measured at each reporting period, with any changes in the fair value recognized as a component of general and administrative expense.
Other estimates associated with the accounting for acquisitions include severance costs and the costs to vacate or downsize facilities, including the future costs to operate and eventually abandon or relinquish duplicate facilities. These costs are recognized as restructuring and other expenses (i.e., not included in purchase accounting), are based on management estimates, and are subject to refinement. |
Our financial projections may ultimately prove to be inaccurate and unanticipated events and circumstances may occur. As a result, these estimates are inherently uncertain and unpredictable, assumptions may be incomplete or inaccurate, and unanticipated events and circumstances may occur, which may affect the accuracy or validity of such assumptions, estimates or other actual results. Therefore, no assurance can be given that the underlying assumptions used to establish the valuation for these acquired businesses will prove to be correct.
We typically engage a third party valuation firm to assist management in its analysis. All estimates, key assumptions, and forecasts were either provided by or reviewed by us. While we chose to utilize a third party valuation firm, the valuations represent the conclusions of management and not the conclusions or statements of any third party.
Estimated costs may change as additional information becomes available regarding assets acquired and liabilities assumed and as management continues its assessment of the pre-merger operations. |
Acquisition-related costs of $2.1, $2.2, and $5.5 million were expensed during the years ended December 31, 2017, 2016, and 2015, respectively, associated with businesses acquired during the periods reported and anticipated transactions. The significant decrease in acquisition costs incurred during the year ended December 31, 2016 is primarily due to the Reggiani and Matan acquisitions, which closed on July 1, 2015.
Build-to-Suit leases. If we are deemed to be the accounting owner of a facility in accordance with the requirements of AC 840-40-55, Leases, then we are required to account for the property as a depreciable asset and the related lease agreement must be accounted for as an imputed financing obligation. If we are not deemed to be the accounting owner, then we are required to account for the property as an operating lease. Significant judgments are required to make this determination, which relate to actions, guarantees, and investments that we make as a lessee that may be considered to be actions that only an owner would take. In addition, our potential investments in these facilities must comply with the required maximum guarantee test to ensure that potential investments cannot exceed 90% of the fair value of each facility
82
Table of Contents
We have four leases subject to these accounting requirements in California, New Hampshire, Spain, and the Netherlands. ASC 840-40-55, Sale-Leaseback Transactions, applies to “construction projects,” but does not define this term. The New Hampshire and Spain facilities consist of construction of new facilities. The facilities in Fremont, California, and the Netherlands were existing facilities, but were not functional in their then current forms; thus, these assets represented construction projects subject to the guidance. When leasing an existing facility, we must consider whether the leased asset is fully functional and may be occupied by any lessee in its current form without requiring improvement (commonly referred to as the “second tenant scope exception”).
On August 26, 2016, we entered into a six-year lease with BTMU whereby a 225,000 square foot manufacturing and warehouse facility is under construction related to our super-wide format industrial digital inkjet printer business in the Industrial Inkjet operating segment at a projected cost of $40 million and a construction period of 20 months. Minimum lease payments during the entire initial six-year term are $1.8 million. Upon completion of the initial six-year term, we have the option to renew the lease, purchase the facility, or return the facility to BTMU subject to an 89% residual value guarantee under which we would recognize additional rent expense in the form of a variable rent payment. We have assessed our exposure in relation to the residual value guarantee and believe that there is no deficiency to the guaranteed value with respect to funds expended by BTMU as of December 31, 2017. We are not deemed to be the accounting owner of this facility as we do not have responsibility for actions, guarantees, or investments for which only an owner would accept responsibility.
We are not deemed to be the accounting owner of the leased facilities in the Netherlands or Spain as we only have responsibility for normal tenant improvement costs in each of these facilities. Similarly, we are not responsible for actions, guarantees, or investments for which only an owner would accept responsibility.
We are deemed to be the accounting owner of the 6700 Dumbarton Circle facility in Fremont, California. The critical factor relating to this conclusion is that we were responsible for cost over-runs during construction, if any, related to force majeure events including strikes, war, and material availability. The landlord is responsible for any costs related to force majeure events that result in any damage to the facility. Since we are responsible for cost overruns related to certain force majeure events, we are in substance offering an indemnification to the landlord for events outside of our control. As such, we are deemed to be the accounting owner of the facility. See Note 15—Property and Equipment, net of the Notes to Consolidated Financial Statements.
We have applied the accounting and disclosure requirements set forth in ASC 810-10, Consolidation, for variable interest entities (“VIEs”). We have evaluated each facility lease agreement to determine if the arrangement qualifies as a VIE under ASC 810-10. We have determined that our facility lease agreements do not qualify as VIEs, and as such, they are not required to be included in our consolidated financial statements.
Determining functional currencies for the purpose of consolidating our international operations. We have a number of foreign subsidiaries, which together account for approximately 56% of our net revenue, approximately 38% of our total assets, and approximately 32% of our total liabilities as of December 31, 2017.
In preparing our consolidated financial statements, for subsidiaries that operate in a U.S. dollar functional currency environment, we must remeasure balance sheet monetary items into U.S. dollars. Foreign currency assets and liabilities are remeasured from the transaction currency into the functional currency at current exchange rates, except for non-monetary assets, liabilities, and capital accounts, which are remeasured at historical exchange rates. Revenue and expenses are recorded at monthly exchange rates, which approximate average exchange rates in effect during each period. Gains or losses from foreign currency remeasurement are included in interest income and other income (expense), net.
For those subsidiaries that operate in a local functional currency environment, all assets and liabilities are translated into U.S. dollars using current exchange rates, while revenue and expenses are translated using monthly exchange rates, which approximate the average exchange rates in effect during each period. Resulting translation adjustments are reported as a separate component of accumulated other comprehensive income (“OCI”), adjusted for deferred income taxes.
83
Table of Contents
Consequently, determination of the functional currency of each entity has a material impact on our financial position and results of operations. Management assesses the salient economic factors, both individually and collectively when determining the functional currency. The economic factors that must be evaluated include cash flows, sales price, sales market, expense, financing, and intercompany transaction indicators.
Recent Accounting Pronouncements
See Note 1—The Company and Its Significant Accounting Policies of the Notes to Consolidated Financial Statements for a full description of recent accounting pronouncements including the respective expected dates of adoption.
Liquidity and Capital Resources
Overview
Cash, cash equivalents, and short-term investments decreased by $140.7 million to $319.0 million as of December 31, 2017 from $459.7 million as of December 31, 2016. The decrease was primarily due to cash consideration paid for the acquisitions of Escada, Generation Digital, CRC and FFPS, net of cash acquired, of $28.6 million, repurchases under our stock repurchase program of $91.4 million, net settlement of shares for employee common stock related tax liabilities and the stock option exercise price of certain stock options of $10.4 million, cash payments for property and equipment of $13.8 million, restricted cash equivalent funding of $26.3 million related to the lease of the Manchester construction project, acquisition-related contingent consideration payments of $30.9 million, and debt repayments assumed through business acquisitions of $11.1 million, partially offset by cash flows provided by operating activities of $51.3 million, proceeds from ESPP purchases and stock option exercises of $12.1 million, and the impact of foreign exchange rate changes of $4.2 million.
Cash, cash equivalents, and short-term investments decreased by $37.6 million to $459.7 million as of December 31, 2016 from $497.4 million as of December 31, 2015. The decrease was primarily due to cash consideration paid for the acquisition of Optitex and Rialco, net of cash acquired, of $20.0 million, repayment of debt assumed through business acquisitions of $8.8 million, treasury stock purchases of $74.2 million, settlement of shares for employee common stock related tax liabilities and the stock option exercise price of certain stock options of $9.1 million, cash payments for property and equipment of $22.4 million, restricted investment and cash equivalent funding of $6.3 million related to the lease of the Manchester construction project, acquisition-related contingent consideration payments of $28.1 million, partially offset by cash flows provided by operating activities of $121.0 million, proceeds from ESPP purchases and stock option exercises of $11.1 million, and the impact of foreign exchange rate changes of $0.4 million.
| (in thousands) |
2017 | 2016 | 2015 | |||||||||
| Cash and cash equivalents |
$ | 170,345 | $ | 164,313 | $ | 164,091 | ||||||
| Short-term investments |
148,697 | 295,428 | 333,276 | |||||||||
|
|
|
|
|
|
|
|||||||
| Total cash, cash equivalents, and short-term investments |
$ | 319,042 | $ | 459,741 | $ | 497,367 | ||||||
|
|
|
|
|
|
|
|||||||
| Net cash provided by operating activities |
$ | 51,295 | $ | 121,004 | $ | 68,357 | ||||||
| Net cash provided by (used for) investing activities |
76,423 | (12,050 | ) | (110,618 | ) | |||||||
| Net cash used for financing activities |
(125,882 | ) | (109,106 | ) | (91,682 | ) | ||||||
| Effect of foreign exchange rate changes on cash and cash equivalents |
4,196 | 374 | (99 | ) | ||||||||
|
|
|
|
|
|
|
|||||||
| Increase (decrease) in cash and cash equivalents |
$ | 6,032 | $ | 222 | $ | (134,042 | ) | |||||
|
|
|
|
|
|
|
|||||||
84
Table of Contents
As of December 31, 2017, we have approximately $214.9 million of unremitted earnings, which are not available to meet our operating and working capital requirements in the U.S. as these amounts have been permanently reinvested. Cash, cash equivalents, and short-term investments held outside of the U.S. in various foreign subsidiaries were $88.4 and $94.2 million as of December 31, 2017 and 2016, respectively. Cash, cash equivalents, and short-term investments held outside of the U.S will be used to fund local operations and finance international acquisitions. Due to the enactment of the 2017 Tax Act, we are not able to estimate the foreign income and withholding taxes that would be incurred as a result of a repatriation to the U.S.
Based on past performance and current expectations, we believe that our cash, cash equivalents, short-term investments, and cash generated from operating activities will satisfy our working capital, capital expenditure, investment, stock repurchase, commitments (see Note 8—Commitments and Contingencies and Note 15—Property and Equipment, net of the Notes to Consolidated Financial Statements), and other liquidity requirements associated with our existing operations through at least the next twelve months. We believe that the most strategic uses of our cash resources include business acquisitions, strategic investments to gain access to new technologies, repurchases of shares of our common stock, and working capital. At December 31, 2017, cash, cash equivalents, and short-term investments available were $319.0 million.
Operating Activities
Net cash provided by operating activities was $51.3, $121.0, and $68.4 million for the years ended December 31, 2017, 2016, and 2015, respectively.
Net cash provided by operating activities in 2017 consists primarily of net loss of $15.3 million and non-cash charges and credits of $141.3 million adjusted by the net change in operating asset and liabilities of $74.8 million. Non-cash charges and credits of $141.3 million consist primarily of $65.6 million in depreciation and amortization, $26.5 million of stock-based compensation expense, non-cash accretion of interest expense of $15.0 million primarily related to our Notes and imputed financing obligation, provision for bad debts and sales-related allowances of $12.4 million, provision for inventory obsolescence of $6.3 million, deferred tax provisions of $8.8 million, and other non-cash charges and credits of $12.5 million, partially offset by acquisition-related contingent consideration payments of $5.9 million. The net change in operating assets and liabilities of $74.8 million consists primarily of increased gross accounts receivable of $29.2 million, increased gross inventories of $24.4 million, increased other current assets of $9.2 million, decreased accounts payable and accrued liabilities of $6.2 million, and decreased income taxes receivable/payable, net, of $5.8 million.
Accounts Receivable
Our primary source of operating cash flow is the collection of accounts receivable from our customers. One measure of the effectiveness of our collection efforts is average days sales outstanding for accounts receivable (“DSO”). DSOs were 84, 76, and 69 days at December 31, 2017, 2016, and 2015, respectively. We calculate DSO by dividing net accounts receivable at the end of the quarter by revenue recognized during the quarter, multiplied by the total days in the quarter.
DSOs increased during the year ended December 31, 2017, compared with December 31, 2016, primarily due to sales with extended payment terms and a non-linear sales cycle resulting in significant billings at the end of the quarter. Industrial Inkjet and Productivity Software were 73% of consolidated revenue during the year ended December 31, 2017. By comparison, Industrial Inkjet and Productivity Software were 72% and 66% of consolidated revenue during the years ended December 31, 2016 and 2015, respectively.
85
Table of Contents
We expect DSOs to vary from period to period because of changes in the mix of business between direct customers and end user demand driven through the leading printer manufacturers, the effectiveness of our collection efforts both domestically and overseas, and variations in the linearity of our sales. As the percentage of Industrial Inkjet and Productivity Software related revenue increases, we expect DSOs will trend higher. Our DSOs related to the Industrial Inkjet and Productivity Software operating segments are traditionally higher than those related to the significant printer manufacturer customers / distributors in our Fiery operating segment as, historically, these Fiery customers have been granted shorter payment terms and have paid on a more timely basis.
We have facilities in the U.S. and Italy that enable us to sell to third parties, on an ongoing basis, certain trade receivables with recourse. Trade receivables sold with recourse are generally short-term receivables with payment due dates of less than 10 days from date of sale, which are subject to a servicing obligation. We also have facilities in Spain and Italy that enable us to sell to third parties, on an ongoing basis, certain trade receivables without recourse. Trade receivables sold without recourse are generally short-term receivables with payment due dates of less than one year, which are secured by international letters of credit.
Trade receivables sold cumulatively under these facilities were $21.4 and $5.9 million throughout 2017 on a recourse and nonrecourse basis, respectively, which approximates the cash received. The receivables that were sold to third parties were removed from the Consolidated Balance Sheets and were reflected as cash provided by operating activities in the Consolidated Statements of Cash Flows.
Inventories
Our inventories are procured primarily in support of the Industrial Inkjet and Fiery operating segments. The majority of our Industrial Inkjet products are manufactured internally, while Fiery production is primarily outsourced. The result is lower inventory turnover for Industrial Inkjet inventories compared with Fiery inventories.
Our net inventories increased by $29.5 million to $125.8 million at December 31, 2017 from $96.3 million at December 31, 2016 primarily due to the increase in Industrial Inkjet inventories, including our Nozomi product line, which was launched in the third quarter of 2017, and the acquisition of FFPS and Escada inventories. Inventory turnover was 4.4 during the quarter ended December 31, 2017 compared with 5.2 turns during the quarter ended December 31, 2016. We calculate inventory turnover by dividing annualized current quarter cost of revenue by ending inventories.
Accounts Payable, Accrued and Other Liabilities, and Income Taxes Receivable/Payable, Net
Our operating cash flows are impacted by the timing of payments to our vendors for accounts payable and by our accrual of liabilities. The change in accounts payable, accrued and other liabilities, and income taxes receivable/payable, net, decreased our cash flows provided by operating activities by $12.0, $1.8, and $10.6 million in 2017, 2016, and 2015, respectively. Our working capital, defined as current assets minus current liabilities, was $456.7 and $549.7 million at December 31, 2017 and 2016, respectively.
86
Table of Contents
Investing Activities
Net cash provided by (used for) investing activities was $76.4, $12.1, and $110.6 million for the years ended December 31, 2017, 2016, and 2015, respectively.
| (in thousands) |
2017 | 2016 | 2015 | |||||||||
| Purchases of short-term investments |
$ | (87,623 | ) | $ | (216,349 | ) | $ | (328,911 | ) | |||
| Proceeds from sales and maturities of short-term investments |
233,633 | 252,856 | 311,508 | |||||||||
| Purchases of restricted cash equivalents and investments |
(26,274 | ) | (6,252 | ) | — | |||||||
| Purchases, net of proceeds from sales, of property and equipment |
(13,754 | ) | (22,373 | ) | (18,449 | ) | ||||||
| Businesses and technology purchased, net of cash acquired and disposition |
(29,559 | ) | (19,932 | ) | (74,766 | ) | ||||||
|
|
|
|
|
|
|
|||||||
| Net cash provided by (used for) investing activities |
$ | 76,423 | $ | (12,050 | ) | $ | (110,618 | ) | ||||
|
|
|
|
|
|
|
|||||||
Acquisitions
On October 1, 2017, we acquired Escada for cash consideration of $11.9 million, net of cash acquired, plus an additional potential future cash earnout, which is contingent on achieving certain revenue and operating profit performance targets. Escada provides corrugator control systems for the corrugated packaging market, which provide comprehensive control and traceability for the entire corrugated packaging process.
On August 14, 2017, we acquired Generation Digital for cash consideration of $3.2 million, net of cash acquired, plus an additional potential future cash earnout, which is contingent on achieving certain revenue and operating profit performance targets. Generation Digital provides software to textile and fashion designers for the creation and design of prints and patterns, color matching, and color palette creation and management.
On May 8, 2017, we acquired CRC from Reynolds for cash consideration of $7.6 million. CRC provides business process automation software for commercial label and packaging printers.
On January 31, 2017, we purchased the FFPS business from Xerox for cash consideration of $5.9 million, plus $18.0 million of future cash payments, of which $9.0 million was paid in July 2017 and $9.0 million is payable in July 2018. The FFPS business manufactures and markets the FFPS DFE, which previously competed with our Fiery DFE.
On June 16, 2016, we purchased Optitex for cash consideration of $11.6 million, net of cash acquired, plus an additional potential future cash earnout, which is contingent on achieving revenue and operating profit performance targets. We received a $0.2 million purchase price adjustment payment in 2017. Optitex has developed and markets integrated 2D and 3D CAD software that is shortening the design cycle, reducing our customers’ costs, and accelerating the adoption of fast fashion.
On March 1, 2016, we purchased Rialco for cash consideration of $8.4 million, net of cash acquired, plus an additional potential future cash earnout, which is contingent on achieving revenue and gross profit targets. Rialco is a leading European supplier of dye powders and color products for the textile, digital print, and other decorating industries.
A tax recovery liability of $1.0 million related to the Creta Print S.L. “(Cretaprint”) acquisition was paid during the year ended December 31, 2016.
87
Table of Contents
The escrow of $1.5 million related to the Reggiani acquisition was remitted to us in return for the issuance of shares of common stock for the year ended December 31, 2016. We also purchased additional intellectual property related to the Reggiani business for $0.2 and $0.3 million in 2017 and 2016, respectively. We paid $1.4 million, which was the first payment related to a four-year non-compete agreement with the sellers of the Reggiani business in 2017.
We acquired privately-held CTI and Shuttleworth during the fourth quarter of 2015, which have been included in our Productivity Software operating segment, for aggregate cash consideration of $9.3 million, net of cash acquired, $9.7 million in shares of EFI stock, plus a potential future cash earnout, which is contingent on achieving certain performance targets.
On July 1, 2015, we acquired Matan for approximately $38.9 million in cash, net of cash acquired. Matan is a leading manufacturer of super-wide format roll-to-roll industrial digital inkjet printers.
On July 1, 2015, we acquired Reggiani for approximately $26.6 million in cash, net of cash acquired, $26.9 million in shares of EFI stock, plus an additional future potential cash earnout contingent on achieving certain performance targets. Reggiani is a leading manufacturer of industrial inkjet printers serving the textile market.
License Agreement
On November 1, 2017, we entered into an Agreement with Xeikon to license the right to the manufacturing, technology, marketing, and support of the Jetrion product line. During 2017, pursuant to the Agreement, we received $1.5 million of royalty payments, which are reflected as operating cash inflows, and $0.5 million of intellectual property payments, which are reflected as investing cash inflows.
Property and Equipment
Net purchases of property and equipment were $13.8, $22.3, and $18.5 million in 2017, 2016, and 2015, respectively, including the purchase of ceramic digital ink formulation equipment and research and development equipment.
Our property and equipment additions have historically been funded from operating activities. We anticipate that we will continue to purchase necessary property and equipment in the normal course of our business. The amount and timing of these purchases and the related cash outflows in future periods is difficult to predict and is dependent on a number of factors including the hiring of employees, the rate of change in computer hardware / software used in our business, and our business outlook.
Investments
Proceeds from sales and maturities, net of purchases, of marketable securities were $146.0 and $36.5 million in 2017 and 2016, respectively. Purchases of marketable securities, net of proceeds from sales and maturities, were $17.4 million in 2015. We have classified our investment portfolio as “available for sale.” Our investments are made with a policy of capital preservation and liquidity as primary objectives. We may hold investments in fixed income debt securities to maturity; however, we may sell an investment at any time if the quality rating of the investment declines, the yield on the investment is no longer attractive, or we have better uses for the cash. Since we invest primarily in investment securities that are highly liquid with a ready market, we believe the purchase, maturity, or sale of our investments has no material impact on our overall liquidity.
88
Table of Contents
Restricted Cash and Investments
We have restricted cash equivalents that are required to be maintained by the lease related to our Manchester, New Hampshire, construction project, which is described more fully in Note 15—Property and Equipment, net, of the Notes to Consolidated Financial Statements. The funds pledged as collateral are invested in cash equivalents as of December 31, 2017, and U.S. government securities and cash equivalents as of December 31, 2016. These investments are classified as Level 1 in the fair value hierarchy as more fully defined in Note 6—Investments and Fair Value Measurements of the Notes to Condensed Consolidated Financial Statements.
The funds are invested in $32.5 million of cash equivalents with a third party trustee as of December 31, 2017, and are restricted during the construction period. Upon completion of construction, the funds will be released as cash and cash equivalents. The portion of released funds that represents 100% of the total expenditures made by BTMU will be deposited with BTMU and restricted as collateral until the end of the underlying lease period.
The funds pledged as collateral are invested in cash equivalents as of December 31, 2017, and cash equivalents and short-term investments as of December 31, 2016, and are classified as restricted cash equivalents and investments on our Consolidated Balance Sheets.
Financing Activities
Net cash used for financing activities was $125.9, $109.1 and $91.7 million for the years ended December 31, 2017, 2016 and 2015, respectively.
Stock Option and ESPP Proceeds
Historically, our recurring cash flows provided by financing activities have been from the receipt of cash from the issuance of common stock through the exercise of stock options and employee purchases of ESPP shares. We received proceeds from the exercise of stock options of $2.1, $1.3, and $2.0 million and employee purchases of ESPP shares of $10.0, $9.8, and $9.5 million in 2017, 2016, and 2015, respectively. While we may continue to receive proceeds from these plans in future periods, the timing and amount of such proceeds are difficult to predict and are contingent on a number of factors including the price of our common stock, the timing and number of stock options exercised by employees that had participated in these plans, net settlement options, employee participation in our ESPP, and general market conditions. We anticipate that cash provided from the exercise of stock options will decline over time as we have shifted to issuance of RSUs, rather than stock options. Although we may grant stock option awards from time to time, the granting of stock options is no longer our usual practice.
Treasury Stock Purchases
The most significant use of funds for financing activities in 2017, 2016, and 2015 was $101.8, $83.3, and $76.4 million, respectively, of cash used to repurchase outstanding shares of our common stock. These treasury stock purchases included $10.5, $9.1, and $10.7 million of cash used for net settlement of shares for the exercise price of certain stock options and any tax withholding obligations incurred connected with such exercises and tax withholding obligations that arose on the vesting of RSUs in 2017, 2016, and 2015, respectively.
On November 6, 2013, the board of directors approved an authorization to repurchase up to $200 million of outstanding common stock. Under this publicly announced plan, we repurchased 1.5 million shares for an aggregate purchase price of $65.7 million during the year ended December 31, 2015.
On November 9, 2015, the board of directors cancelled $55 million, effective December 31, 2015, remaining for repurchase under the 2013 authorization and approved a new authorization to repurchase $150 million of outstanding common stock commencing January 1, 2016. Under this publicly announced plan, we repurchased 1.8 million shares for an aggregate purchase price of $74.2 million during the year ended December 31, 2016.
89
Table of Contents
On September 11, 2017, the board of directors approved an additional $125 million for our share repurchase program commencing September 11, 2017. At that time, $28.8 million remained available for repurchase under the 2015 authorization. The 2017 authorization thereby increased the repurchase authorization to $153.8 million of our common stock as of September 11, 2017. This authorization expires December 31, 2018. Under this publicly announced plan, we repurchased 2.4 million shares for an aggregate purchase price of $91.4 million during the year ended December 31, 2017.
See Item 5—Market for Registrant’s Common Equity, Related Stockholder Matters, and Issuer Purchases of Equity Securities for further discussion of our common stock repurchase programs.
Earnout Payments
Cash payments related to earnouts during the year ended December 31, 2017 of $21.5, $6.8, $1.3, and $1.2 million are primarily related to the previously accrued Reggiani, Optitex, Rialco, and Shuttleworth contingent consideration liabilities. The portion of the Reggiani earnout representing performance targets achieved in excess of the fair value recorded in the opening balance sheet as of the acquisition date was $5.9 million and is reflected as cash used for operating activities in the Consolidated Statement of Cash Flows. The remaining $15.6 million related to the Reggiani earnout is included in cash used for financing activities at December 31, 2017.
Earnout payments during the year ended December 31, 2016 of $23.8, $3.6, $0.4, and $0.2 million are primarily related to the previously accrued Reggiani, DirectSmile, SmartLinc, Inc. (SmartLinc), and Metrix Software (“Metrix”) contingent consideration liabilities, respectively. Earnout payments during the year ended December 31, 2015 of $2.0, $1.1, $0.6, and $0.3 million are primarily related to the previously accrued Technique, Inc. and Technique Business Systems Limited (collectively, “Technique”), GamSys Software SPRL, Metrix, and SmartLinc contingent consideration liabilities, respectively.
Acquisition-related Debt Payments
We paid approximately $11.1 million of indebtedness during the year ended December 31, 2017, which was primarily related to the FFPS acquisition and assumed in the Rialco acquisition, as well as imputed financing obligation related to the build-to-suit. We paid approximately $8.8 million of indebtedness, which was assumed in the Optitex and Matan acquisitions, during the year ended December 31, 2016. We paid approximately $22.5 million of indebtedness, which was assumed in the Reggiani acquisition, during the year ended December 31, 2015.
Other Commitments
Our Industrial Inkjet inventories consist of materials required for our internal manufacturing operations and finished goods and sub-assemblies purchased from third party contract manufacturers. Raw materials and finished goods, print heads, frames, digital UV curable ink, ceramic digital ink, various textile printing ink, and other components are required to support our internal manufacturing operations. Ceramic ink, branded textile ink, and certain industrial digital inkjet sub-assemblies are purchased from third party contract manufacturers and branded third party ink manufacturers.
Our Fiery inventory consists primarily of raw materials and finished goods, memory subsystems, processors, and ASICs, which are sold to third party contract manufacturers responsible for manufacturing our products. Should we decide to purchase components and manufacture Fiery DFEs internally, or should it become necessary for us to purchase and sell components other than memory subsystems, processors, and ASICs to our contract manufacturers, inventory balances and potentially property and equipment would increase significantly, thereby reducing our available cash resources. Further, the inventories we carry could become obsolete, thereby negatively impacting our financial condition and results of operations.
90
Table of Contents
We are also reliant on several sole source suppliers for certain key components and could experience a significant negative impact on our financial condition and results of operations if such supplies were reduced or not available. We may be required to compensate our subcontract manufacturers for components purchased for orders subsequently cancelled by us. We periodically review the potential liability and the adequacy of the related allowance.
We may be required to compensate our subcontract manufacturers for components purchased for orders subsequently cancelled by us. We periodically review the potential liability and the adequacy of the related allowance.
Legal Proceedings
Please refer to Item 3, Legal Proceedings, in this Annual Report on Form 10-K for more information regarding our legal proceedings.
Contractual Obligations and Off-Balance Sheet Financing
The impact of contractual obligations on our liquidity and capital resources in future periods should be analyzed in conjunction with the factors that impact our cash flows from operating activities discussed previously. The following table summarizes our significant contractual obligations at December 31, 2017 and the effect that such obligations are expected to have on our liquidity and cash flows in future periods. This table does not include amounts already recorded on our balance sheet as liabilities at December 31, 2017, with the exception of acquisition-related contingent consideration liabilities, unrecognized tax benefits, and our Notes.
| Payments due by period | ||||||||||||||||||||
| (in thousands) |
Total | Less than 1 year |
Between 1-3 years |
Between 3-5 years |
More than 5 years |
|||||||||||||||
| Operating lease obligations |
$ | 66,624 | $ | 9,114 | $ | 14,989 | $ | 10,253 | $ | 32,269 | ||||||||||
| Contingent consideration liabilities (1) |
35,702 | 14,922 | 20,780 | — | — | |||||||||||||||
| Purchase obligations (2) |
67,878 | 60,278 | 7,600 | — | — | |||||||||||||||
| Convertible senior notes (3) |
350,176 | 2,588 | 347,588 | — | — | |||||||||||||||
| Unrecognized tax benefits (4) |
33,928 | — | — | — | — | |||||||||||||||
|
|
|
|
|
|
|
|
|
|
|
|||||||||||
| Total (2) |
$ | 554,308 | $ | 86,902 | $ | 390,957 | $ | 10,253 | $ | 32,269 | ||||||||||
|
|
|
|
|
|
|
|
|
|
|
|||||||||||
| (1) | Represents the fair value of acquisition-related contingent consideration liabilities. The current fair value is reflected in our Consolidated Balance Sheets under the caption “accrued and other liabilities” and represents the fair value of the contingent consideration liabilities that are payable within one year. The noncurrent fair value is reflected in our Consolidated Balance Sheets under the caption “noncurrent contingent and other liabilities” and represents the fair value of the contingent consideration liabilities that are payable beyond one year. |
| (2) | Excludes contractual obligations recorded on the balance sheet as current liabilities and cancellable purchase orders as discussed below. |
| (3) | Obligations related to the $345 million principal amount of our Notes, which is due in 2019 and estimated remaining interest payments, assuming no early retirement of debt obligations, are $5.2 million through 2019. |
| (4) | As of December 31, 2017, our liability for unrecognized tax benefits, including interest and penalties, is reflected in our Consolidated Balance Sheet as $17.0 million of “noncurrent income taxes payable” and $16.9 million as a reduction of “deferred tax assets.” Due to the uncertainty of the timing of future payments, unrecognized tax benefits are presented in the total column on a separate line in this table. Please refer to Note 11—Income Taxes of the Notes to the Consolidated Financial Statements for additional discussion of unrecognized tax benefits. |
91
Table of Contents
Purchase obligations in the table above include agreements to purchase goods or services that are enforceable, noncancellable, and legally binding that specify all significant terms including fixed or minimum quantities to be purchased; fixed, minimum, or variable price provisions; and the approximate timing of the transaction. Purchase obligations exclude purchase orders for raw materials and other goods and services that are cancelable without penalty. Our purchase orders are based on current manufacturing needs and are generally fulfilled by our vendors within short time horizons. We also enter into contracts for outsourced services; however, the obligations under these contracts were not significant and the contracts generally contain clauses allowing for cancellation without significant penalty. Accordingly, such contracts are not included in the preceding table.
The expected timing of payment for the obligations listed above is estimated based on current information. Timing of payments and actual amounts paid may be different depending on when the goods or services are received or changes to agreed-upon amounts for some obligations.
Off-Balance Sheet Financing
On August 26, 2016, we entered into a lease agreement and have accounted for a lease term of 48.5 years, inclusive of two renewal options of 5.0 and 3.5 years, with the City of Manchester to lease 16.9 acres of land adjacent to the Manchester Regional Airport. The land is subleased to BTMU during the term of the lease related to the manufacturing facility that is being constructed on the site which is described below. Minimum lease payments are $13.3 million during the entire 48.5 year term of the land lease, excluding six months of the land lease that is financed into the manufacturing facility lease.
On August 26, 2016, we entered into a six-year lease with BTMU whereby a 225,000 square foot manufacturing and warehouse facility is under construction related to our super-wide format industrial digital inkjet printer business in the Industrial Inkjet operating segment at a projected cost of $40 million and a construction period of 20 months. Minimum lease payments during the entire initial six-year term are $1.8 million. Upon completion of the initial six-year term, we have the option to renew the lease, purchase the facility, or return the facility to BTMU subject to an 89% residual value guarantee under which we would recognize additional rent expense in the form of a variable rent payment. We have assessed our exposure in relation to the residual value guarantee and believe that there is no deficiency to the guaranteed value with respect to funds expended by BTMU as of December 31, 2017. We are treated as the owner of the facility for federal income tax purposes.
Restricted funds are invested in cash equivalents with a third party trustee and will be restricted during the construction period. Upon completion of construction, the funds will be released as cash and cash equivalents. The portion that represents 100% of the total expenditures made by BTMU will be deposited with BTMU and restricted as collateral until the end of the underlying lease period.
Item 7A: Quantitative and Qualitative Disclosures about Market Risk
The following discussion of our risk management activities includes “forward-looking statements” that involve risks and uncertainties. Actual results could differ materially from those projected in the forward-looking statements. Please refer to the discussion of Forward-Looking Statements preceding Part I of this Annual Report on Form 10-K.
92
Table of Contents
Market Risk
We are exposed to various market risks. Market risk is the potential loss arising from adverse changes in market rates and prices, general credit, foreign currency exchange rate fluctuations, liquidity, and interest rate risks, which may be exacerbated by the tight global credit market and increase in economic uncertainty that have affected various sectors of the financial market and continue to cause credit and liquidity issues. We do not enter into derivatives or other financial instruments for trading or speculative purposes. We may enter into financial instrument contracts to manage and reduce the impact of changes in foreign currency exchange rates on earnings and cash flows. The counterparties to such contracts are major financial institutions. We hedge our operating expense exposure in Indian rupees. Please refer to the additional discussion included in Foreign Currency Exchange Risk below.
Since Europe represents a significant portion of our revenue and cash flow, SEC encourages disclosure of our European concentrations of credit risk regarding gross receivables, related reserves, and aging on a region or country basis, and the impact on liquidity with respect to estimated timing of receivable payments. Since Europe is composed of varied countries and regional economies, our European risk profile is somewhat more diversified due to the varying economic conditions among the countries. Approximately 32% of our receivables are with European customers as of December 31, 2017. Of this amount, 30% of our European receivables (10% of consolidated gross receivables) are in the higher risk southern European countries (mostly Italy, Spain, and Portugal) and Ireland, which are adequately reserved.
Marketable Securities
We maintain an investment portfolio of short-term fixed income debt securities of various holdings, types, and maturities. These short-term investments are generally classified as available-for-sale and, consequently, are recorded on our Consolidated Balance Sheets at fair value with unrealized gains and losses reported as a separate component of OCI. We attempt to limit our exposure to interest rate risk by investing in securities with maturities of less than three years; however, we may be unable to successfully limit our risk to interest rate fluctuations. At any time, a sharp rise in interest rates could have a material adverse impact on the fair value of our investment portfolio. Conversely, declines in interest rates could have a material favorable impact on the fair value of our investment portfolio. Increases or decreases in interest rates could have a material impact on interest earnings related to new investments during the period. We do not currently hedge these interest rate exposures.
Interest Rate Risk
Hypothetical changes in the fair values of financial instruments held by us at December 31, 2017 that are sensitive to changes in interest rates are presented below. The modeling technique measures the change in fair value arising from selected potential changes in interest rates. Market changes reflect immediate hypothetical parallel shifts in the yield curve of plus or minus 100 basis points over a twelve month time horizon (in thousands):
| Valuation
of |
No change in |
Valuation of | ||
| $ 160,577 |
$ 158,594 | $ 156,610 |
93
Table of Contents
We have no European sovereign debt investments. Our European debt investments consist of non-sovereign corporate debt securities of $6.6 million, which represents 8% of our corporate debt instruments (4% of our short-term investments) at December 31, 2017. European debt investments are with corporations domiciled in the northern and central European countries of the Netherlands, Sweden, and France. We do not have any short-term investments with corporations domiciled in the higher risk “southern European” countries (i.e., Italy, Spain, Greece, and Portugal) or in Ireland. We believe that we do not have significant exposure with respect to our money market and corporate debt investments in Europe.
As of December 31, 2017, we have $345 million principal amount of Notes outstanding. We carry these instruments at face value less unamortized discount on our Consolidated Balance Sheets. Since these instruments bear interest at fixed rates, we have no financial statement risk associated with changes in interest rates. Although the fair value of these instruments fluctuates when interest rates change, a substantial portion of the market value of our Notes in excess of the outstanding principal amount relates to the conversion premium. Please refer to Note 6—Investments and Fair Value Measurements and Note 7—Convertible Senior Notes, Note Hedges, and Warrants of the Notes to Consolidated Financial Statements.
Foreign Currency Exchange Risk
A large portion of our business is conducted in countries other than the U.S. We are primarily exposed to changes in exchange rates for the Euro, British pound sterling, Indian rupee, Japanese yen, Brazilian real, Chinese renminbi, Israeli shekel, and Australian dollar. Although the majority of our receivables are invoiced and collected in U.S. dollars, we have exposure from non-U.S. dollar-denominated sales (consisting of the Euro, British pound sterling, Brazilian real, Chinese renminbi, Israeli shekel, and Australian dollar) and operating expenses (primarily the Euro, British pound sterling, Chinese renminbi, Israeli shekel, Japanese yen, Indian rupee, and Australian dollar) in foreign countries. We can benefit from or be adversely affected by either a weaker or stronger U.S. dollar relative to major currencies worldwide with respect to our consolidated financial statements. Accordingly, we can benefit from a stronger U.S. dollar due to the corresponding reduction in our foreign operating expenses translated into U.S. dollars and at the same time we can be adversely affected by a stronger U.S. dollar due to the corresponding reduction in foreign revenue translated into U.S. dollars.
We hedge our operating expense exposure in Indian rupees. The notional amount of our Indian rupee cash flow hedge was $3.9 million at December 31, 2017. We hedge balance sheet remeasurement exposures using forward contracts not designated as hedge accounting treatment with notional amounts of $235.5 million at December 31, 2017 consisting of hedges of British pound sterling, Brazilian real, Israeli shekel, Japanese yen, Chinese renminbi, and Euro-denominated intercompany balances with notional amounts of $144.5 million, hedges of Brazilian real, British pound sterling, Australian dollar, Israeli shekel, and Euro-denominated trade receivables with notional amounts of $44.4 million, and hedges of British pounds sterling, Indian rupee, Israeli shekel, and Euro-denominated other net monetary assets with notional amounts of $46.6 million.
The impact of hypothetical changes in foreign exchanges rates on revenue and income from operations are presented below. The modeling technique measures the change in revenue and income from operations resulting from changes in selected foreign exchange rates with respect to the Euro, British pound sterling and Chinese renminbi of plus or minus one percent during the year ended December 31, 2017 as follows (in thousands):
| Impact of a foreign exchange rate decrease of one percent |
No change in foreign exchange rates |
Impact of a foreign exchange rate increase of one percent |
||||||||||
| Revenue |
$ | 995,919 | $ | 993,260 | $ | 990,593 | ||||||
|
|
|
|
|
|
|
|||||||
| Income from operations |
$ | 28,268 | $ | 27,547 | $ | 26,825 | ||||||
|
|
|
|
|
|
|
|||||||
94
Table of Contents
Item 8: Financial Statements and Supplementary Data
INDEX TO CONSOLIDATED FINANCIAL STATEMENTS
95
Table of Contents
REPORT OF INDEPENDENT REGISTERED PUBLIC ACCOUNTING FIRM
To the stockholders and the Board of Directors of Electronics for Imaging, Inc.
Opinion on the Financial Statements
We have audited the accompanying consolidated balance sheets of Electronics for Imaging, Inc. and subsidiaries (the “Company”) as of December 31, 2017 and 2016, and the related consolidated statements of operations, comprehensive income, cash flows, and stockholders’ equity for each of the three years in the period ended December 31, 2017, and the related notes and schedule listed in the Index at Item 15 (collectively referred to as the “financial statements”). In our opinion, the financial statements present fairly, in all material respects, the financial position of the Company as of December 31, 2017 and 2016, and the results of its operations and its cash flows for each of the three years in the period ended December 31, 2017, in conformity with accounting principles generally accepted in the United States of America.
We have also audited, in accordance with the standards of the Public Company Accounting Oversight Board (United States) (PCAOB), the Company’s internal control over financial reporting as of December 31, 2017, based on criteria established in Internal Control—Integrated Framework (2013) issued by the Committee of Sponsoring Organizations of the Treadway Commission and our report dated March 16, 2018, expressed an adverse opinion on the Company’s internal control over financial reporting because of material weaknesses.
Basis for Opinion
These financial statements are the responsibility of the Company’s management. Our responsibility is to express an opinion on the Company’s financial statements based on our audits. We are a public accounting firm registered with the PCAOB and are required to be independent with respect to the Company in accordance with the U.S. federal securities laws and the applicable rules and regulations of the Securities and Exchange Commission and the PCAOB.
We conducted our audits in accordance with the standards of the PCAOB. Those standards require that we plan and perform the audit to obtain reasonable assurance about whether the financial statements are free of material misstatement, whether due to error or fraud. Our audits included performing procedures to assess the risks of material misstatement of the financial statements, whether due to error or fraud, and performing procedures that respond to those risks. Such procedures included examining, on a test basis, evidence regarding the amounts and disclosures in the financial statements. Our audits also included evaluating the accounting principles used and significant estimates made by management, as well as evaluating the overall presentation of the financial statements. We believe that our audits provide a reasonable basis for our opinion.
/s/ DELOITTE & TOUCHE LLP
San Jose, CA
March 16, 2018
We have served as the Company’s auditor since 2014.
96
Table of Contents
Consolidated Balance Sheets
| December 31, | ||||||||
| (in thousands) | 2017 | 2016 | ||||||
| Assets |
||||||||
| Current assets: |
||||||||
| Cash and cash equivalents |
$ | 170,345 | $ | 164,313 | ||||
| Short-term investments, available for sale |
148,697 | 295,428 | ||||||
| Accounts receivable, net of allowances of $32.2 and $23.3 million, respectively |
244,416 | 220,813 | ||||||
| Inventories |
125,813 | 96,338 | ||||||
| Income taxes receivable |
4,565 | 975 | ||||||
| Assets held for sale |
4,200 | 3,781 | ||||||
| Other current assets |
41,799 | 31,881 | ||||||
|
|
|
|
|
|||||
| Total current assets |
739,835 | 813,529 | ||||||
| Property and equipment, net |
98,762 | 103,474 | ||||||
| Restricted cash equivalents and investments |
32,531 | 6,252 | ||||||
| Goodwill |
403,278 | 359,841 | ||||||
| Intangible assets, net |
123,008 | 122,997 | ||||||
| Deferred tax assets |
45,083 | 58,477 | ||||||
| Other assets |
15,504 | 14,359 | ||||||
|
|
|
|
|
|||||
| Total assets |
$ | 1,458,001 | $ | 1,478,929 | ||||
|
|
|
|
|
|||||
| Liabilities and Stockholders’ Equity |
||||||||
| Current liabilities: |
||||||||
| Accounts payable |
$ | 123,935 | $ | 114,287 | ||||
| Accrued and other liabilities |
98,090 | 85,505 | ||||||
| Deferred revenue |
55,833 | 53,813 | ||||||
| Income taxes payable |
5,309 | 10,256 | ||||||
|
|
|
|
|
|||||
| Total current liabilities |
283,167 | 263,861 | ||||||
| Convertible senior notes, net |
318,957 | 304,484 | ||||||
| Imputed financing obligation related to build-to-suit lease |
13,944 | 14,152 | ||||||
| Noncurrent contingent and other liabilities |
28,801 | 42,786 | ||||||
| Deferred tax liabilities |
11,652 | 15,601 | ||||||
| Noncurrent income taxes payable |
20,169 | 12,030 | ||||||
|
|
|
|
|
|||||
| Total liabilities |
676,690 | 652,914 | ||||||
|
|
|
|
|
|||||
| Commitments and contingencies (Note 8) |
||||||||
| Stockholders’ equity: |
||||||||
| Preferred stock, $0.01 par value; 5,000 shares authorized; none issued and outstanding |
— | — | ||||||
| Common stock, $0.01 par value; 150,000 shares authorized; 54,249 and 53,038 shares issued, respectively |
542 | 530 | ||||||
| Additional paid-in capital |
745,661 | 705,901 | ||||||
| Treasury stock, at cost; 9,070 and 6,457 shares, respectively |
(375,574 | ) | (273,730 | ) | ||||
| Accumulated other comprehensive gain (loss) |
8,138 | (24,575 | ) | |||||
| Retained earnings |
402,544 | 417,889 | ||||||
|
|
|
|
|
|||||
| Total stockholders’ equity |
781,311 | 826,015 | ||||||
|
|
|
|
|
|||||
| Total liabilities and stockholders’ equity |
$ | 1,458,001 | $ | 1,478,929 | ||||
|
|
|
|
|
|||||
See accompanying notes to consolidated financial statements.
97
Table of Contents
Consolidated Statements of Operations
| For the years ended December 31, | ||||||||||||
| (in thousands, except per share amounts) | 2017 | 2016 | 2015 | |||||||||
| Revenue |
$ | 993,260 | $ | 992,065 | $ | 882,513 | ||||||
| Cost of revenue (1) |
486,804 | 483,900 | 425,083 | |||||||||
|
|
|
|
|
|
|
|||||||
| Gross profit |
506,456 | 508,165 | 457,430 | |||||||||
| Operating expenses: |
||||||||||||
| Research and development (1) |
157,358 | 151,395 | 141,364 | |||||||||
| Sales and marketing (1) |
173,697 | 169,042 | 156,339 | |||||||||
| General and administrative (1) |
92,953 | 85,618 | 72,797 | |||||||||
| Amortization of identified intangibles |
47,339 | 39,560 | 26,510 | |||||||||
| Restructuring and other (Note 13) |
7,562 | 6,731 | 5,731 | |||||||||
|
|
|
|
|
|
|
|||||||
| Total operating expenses |
478,909 | 452,346 | 402,741 | |||||||||
|
|
|
|
|
|
|
|||||||
| Income from operations |
27,547 | 55,819 | 54,689 | |||||||||
| Interest expense |
(19,505 | ) | (17,716 | ) | (17,364 | ) | ||||||
| Interest income and other income (expense), net |
4,088 | 545 | (1,757 | ) | ||||||||
|
|
|
|
|
|
|
|||||||
| Income before income taxes |
12,130 | 38,648 | 35,568 | |||||||||
| Benefit from (provision for) income taxes |
(27,475 | ) | 6,301 | (3,369 | ) | |||||||
|
|
|
|
|
|
|
|||||||
| Net income (loss) |
$ | (15,345 | ) | $ | 44,949 | $ | 32,199 | |||||
|
|
|
|
|
|
|
|||||||
| Net income (loss) per basic common share |
$ | (0.33 | ) | $ | 0.96 | $ | 0.68 | |||||
|
|
|
|
|
|
|
|||||||
| Net income (loss) per diluted common share |
$ | (0.33 | ) | $ | 0.94 | $ | 0.67 | |||||
|
|
|
|
|
|
|
|||||||
| Shares used in basic per-share calculation |
46,281 | 46,900 | 47,217 | |||||||||
|
|
|
|
|
|
|
|||||||
| Shares used in diluted per-share calculation |
46,281 | 47,797 | 48,150 | |||||||||
|
|
|
|
|
|
|
|||||||
|
(1) Includes stock-based compensation expense as follows: |
||||||||||||
| 2017 | 2016 | 2015 | ||||||||||
| Cost of revenue |
$ | 2,561 | $ | 2,784 | $ | 2,837 | ||||||
| Research and development |
9,177 | 8,968 | 9,406 | |||||||||
| Sales and marketing |
6,583 | 7,690 | 7,602 | |||||||||
| General and administrative |
8,211 | 12,384 | 14,226 | |||||||||
See accompanying notes to consolidated financial statements.
98
Table of Contents
Consolidated Statements of Comprehensive Income
| (in thousands) | For the years ended December 31, | |||||||||||
| 2017 | 2016 | 2015 | ||||||||||
| Net income (loss) |
$ | (15,345 | ) | $ | 44,949 | $ | 32,199 | |||||
| Net unrealized investment losses: |
||||||||||||
| Unrealized holding losses, net of tax benefits of less than $0.1 million for the years ended December 31, 2017 and 2016, and $0.1 million for the year ended December 31, 2015 |
(84 | ) | (97 | ) | (169 | ) | ||||||
| Reclassification adjustments included in net income, net of tax benefit of less than $0.1 million for the years ended December 31, 2017 and 2015, and no tax benefit for the year ended December 31, 2016 |
(140 | ) | — | (66 | ) | |||||||
|
|
|
|
|
|
|
|||||||
| Net unrealized investment losses |
(224 | ) | (97 | ) | (235 | ) | ||||||
| Currency translation adjustments, net of $0.6 and $0.5 million tax benefit for the years ended December 31, 2017 and 2016, respectively, and no tax provision for the year ended December 31, 2015 |
32,905 | (7,111 | ) | (9,823 | ) | |||||||
| Unrealized gains on cash flow hedges |
32 | 8 | 40 | |||||||||
|
|
|
|
|
|
|
|||||||
| Comprehensive income |
$ | 17,368 | $ | 37,749 | $ | 22,181 | ||||||
|
|
|
|
|
|
|
|||||||
See accompanying notes to consolidated financial statements.
99
Table of Contents
Consolidated Statements of Stockholders’ Equity
|
Common stock |
Additional paid-in capital |
Treasury stock | Accumulated Other comprehensive income (loss) |
Retained earnings |
Total stockholders’ equity |
|||||||||||||||||||||||||||
| (in thousands) | Shares | Amount | Shares | Amount | ||||||||||||||||||||||||||||
| Balances as of December 31, 2014 |
49,671 | $ | 497 | $ | 568,896 | (2,736 | ) | $ | (113,992 | ) | $ | (7,357 | ) | $ | 340,645 | $ | 788,689 | |||||||||||||||
|
|
|
|
|
|
|
|
|
|
|
|
|
|
|
|
|
|||||||||||||||||
| Comprehensive income (loss), net of tax |
(10,018 | ) | 32,199 | 22,181 | ||||||||||||||||||||||||||||
| Exercise of common stock options |
123 | 1 | 1,901 | 1,902 | ||||||||||||||||||||||||||||
| Restricted stock vested |
925 | 9 | (9 | ) | — | |||||||||||||||||||||||||||
| Common stock issued in connection with business acquisitions |
787 | 8 | 36,559 | 36,567 | ||||||||||||||||||||||||||||
| Stock-based compensation, net of cash settlements |
33,741 | 33,741 | ||||||||||||||||||||||||||||||
| Non-cash settlement of vacation liabllities by issuing RSUs |
1,353 | 1,353 | ||||||||||||||||||||||||||||||
| Stock repurchases |
(1,740 | ) | (76,447 | ) | (76,447 | ) | ||||||||||||||||||||||||||
| Stock issued pursuant to ESPP |
302 | 3 | 9,544 | 9,547 | ||||||||||||||||||||||||||||
| Tax benefit from employee stock plans |
5,369 | 5,369 | ||||||||||||||||||||||||||||||
|
|
|
|
|
|
|
|
|
|
|
|
|
|
|
|
|
|||||||||||||||||
| Balances as of December 31, 2015 |
51,808 | $ | 518 | $ | 657,354 | (4,476 | ) | $ | (190,439 | ) | $ | (17,375 | ) | $ | 372,844 | $ | 822,902 | |||||||||||||||
|
|
|
|
|
|
|
|
|
|
|
|
|
|
|
|
|
|||||||||||||||||
| Comprehensive income (loss), net of tax |
(7,200 | ) | 44,949 | 37,749 | ||||||||||||||||||||||||||||
| Exercise of common stock options |
116 | 1 | 1,344 | 1,345 | ||||||||||||||||||||||||||||
| Restricted stock vested |
787 | 8 | (8 | ) | — | |||||||||||||||||||||||||||
| Common stock issued in connection with business acquisition |
30 | — | (73 | ) | (73 | ) | ||||||||||||||||||||||||||
| Cumulative effect adjustment upon adoption of ASU 2016-09 |
2,743 | 96 | 2,839 | |||||||||||||||||||||||||||||
| Stock-based compensation, net of cash settlements |
31,726 | 31,726 | ||||||||||||||||||||||||||||||
| Non-cash settlement of vacation liabllities by issuing RSUs |
3,059 | 3,059 | ||||||||||||||||||||||||||||||
| Stock repurchases |
(1,981 | ) | (83,291 | ) | (83,291 | ) | ||||||||||||||||||||||||||
| Stock issued pursuant to ESPP |
297 | 3 | 9,756 | 9,759 | ||||||||||||||||||||||||||||
|
|
|
|
|
|
|
|
|
|
|
|
|
|
|
|
|
|||||||||||||||||
| Balances as of December 31, 2016 |
53,038 | $ | 530 | $ | 705,901 | (6,457 | ) | $ | (273,730 | ) | $ | (24,575 | ) | $ | 417,889 | $ | 826,015 | |||||||||||||||
|
|
|
|
|
|
|
|
|
|
|
|
|
|
|
|
|
|||||||||||||||||
| Comprehensive income (loss), net of tax |
32,713 | (15,345 | ) | 17,368 | ||||||||||||||||||||||||||||
| Exercise of common stock options |
166 | 2 | 2,064 | 2,066 | ||||||||||||||||||||||||||||
| Restricted stock vested |
761 | 7 | (7 | ) | — | |||||||||||||||||||||||||||
| Stock-based compensation |
26,532 | 26,532 | ||||||||||||||||||||||||||||||
| Non-cash settlement of employee-related liabilities by issuing RSUs |
1,166 | 1,166 | ||||||||||||||||||||||||||||||
| Stock repurchases |
(2,613 | ) | (101,844 | ) | (101,844 | ) | ||||||||||||||||||||||||||
| Stock issued pursuant to ESPP |
284 | 3 | 10,005 | 10,008 | ||||||||||||||||||||||||||||
|
|
|
|
|
|
|
|
|
|
|
|
|
|
|
|
|
|||||||||||||||||
| Balances as of December 31, 2017 |
54,249 | $ | 542 | $ | 745,661 | (9,070 | ) | $ | (375,574 | ) | $ | 8,138 | $ | 402,544 | $ | 781,311 | ||||||||||||||||
|
|
|
|
|
|
|
|
|
|
|
|
|
|
|
|
|
|||||||||||||||||
See accompanying notes to consolidated financial statements.
100
Table of Contents
Consolidated Statements of Cash Flows
| For the years ended December 31, | ||||||||||||
| (in thousands) | 2017 | 2016 | 2015 | |||||||||
| Cash flows from operating activities: |
||||||||||||
| Net income (loss) |
$ | (15,345 | ) | $ | 44,949 | $ | 32,199 | |||||
| Adjustments to reconcile net income (loss) to net cash provided by operating activities: |
|
|||||||||||
| Depreciation and amortization |
65,647 | 55,081 | 40,124 | |||||||||
| Deferred taxes |
8,753 | (11,091 | ) | (7,997 | ) | |||||||
| Tax benefit from employee stock plans |
— | — | 5,369 | |||||||||
| Provision for bad debts and sales-related allowances |
12,416 | 10,678 | 7,536 | |||||||||
| Provision for inventory obsolescence |
6,312 | 5,716 | 7,147 | |||||||||
| Stock-based compensation, net of cash settlements |
26,532 | 31,726 | 33,741 | |||||||||
| Contingent consideration payments related to businesses acquired |
(5,906 | ) | — | — | ||||||||
| Non-cash accretion of interest expense on convertible notes and imputed financing obligation |
14,981 | 13,489 | 12,957 | |||||||||
| Other non-cash charges and credits |
12,536 | 5,443 | 3,844 | |||||||||
| Changes in operating assets and liabilities, net of effect of acquired businesses: |
||||||||||||
| Accounts receivable |
(29,189 | ) | (31,221 | ) | (34,355 | ) | ||||||
| Inventories |
(24,398 | ) | 4,510 | (6,758 | ) | |||||||
| Other current assets |
(9,218 | ) | (6,498 | ) | (14,863 | ) | ||||||
| Accounts payable and accrued liabilities |
(6,235 | ) | 651 | (6,371 | ) | |||||||
| Income taxes receivable/payable, net |
(5,591 | ) | (2,429 | ) | (4,216 | ) | ||||||
|
|
|
|
|
|
|
|||||||
| Net cash provided by operating activities |
51,295 | 121,004 | 68,357 | |||||||||
|
|
|
|
|
|
|
|||||||
| Cash flows from investing activities: |
||||||||||||
| Purchases of short-term investments |
(87,623 | ) | (216,349 | ) | (328,911 | ) | ||||||
| Proceeds from sales and maturities of short-term investments |
233,633 | 252,856 | 311,508 | |||||||||
| Purchases of restricted cash equivalents and investments |
(26,274 | ) | (6,252 | ) | — | |||||||
| Purchases, net of proceeds from sales, of property and equipment |
(13,754 | ) | (22,373 | ) | (18,449 | ) | ||||||
| Businesses and technology purchased, net of cash acquired and disposition |
(29,559 | ) | (19,932 | ) | (74,766 | ) | ||||||
|
|
|
|
|
|
|
|||||||
| Net cash provided by (used for) investing activities |
76,423 | (12,050 | ) | (110,618 | ) | |||||||
|
|
|
|
|
|
|
|||||||
| Cash flows from financing activities: |
||||||||||||
| Proceeds from issuance of common stock |
12,074 | 11,100 | 11,450 | |||||||||
| Purchases of treasury stock and net share settlements |
(101,844 | ) | (83,292 | ) | (76,447 | ) | ||||||
| Repayment of debt assumed through business acquisitions and debt issuance costs |
(11,094 | ) | (8,803 | ) | (22,592 | ) | ||||||
| Contingent consideration payments related to businesses acquired |
(25,018 | ) | (28,111 | ) | (4,093 | ) | ||||||
|
|
|
|
|
|
|
|||||||
| Net cash used for financing activities |
(125,882 | ) | (109,106 | ) | (91,682 | ) | ||||||
|
|
|
|
|
|
|
|||||||
| Effect of foreign exchange rate changes on cash and cash equivalents |
4,196 | 374 | (99 | ) | ||||||||
|
|
|
|
|
|
|
|||||||
| Increase (decrease) in cash and cash equivalents |
6,032 | 222 | (134,042 | ) | ||||||||
| Cash and cash equivalents at beginning of year |
164,313 | 164,091 | 298,133 | |||||||||
|
|
|
|
|
|
|
|||||||
| Cash and cash equivalents at end of year |
$ | 170,345 | $ | 164,313 | $ | 164,091 | ||||||
|
|
|
|
|
|
|
|||||||
See accompanying notes to consolidated financial statements.
101
Table of Contents
Notes to Consolidated Financial Statements
Note 1: The Company and Its Significant Accounting Policies
The Company
We are a world leader in customer-centric digital printing innovation focused on the transformation of the printing, packaging, ceramic tile decoration, and textile industries from the use of traditional analog based printing to digital on-demand printing.
Our products include industrial super-wide and wide format display graphics, corrugated packaging and display, textile, and ceramic tile decoration digital inkjet printers that utilize our digital ink, industrial digital inkjet printer parts, and professional services; print production workflow, web-to-print, cross-media marketing, fashion design, and business process automation solutions; and color printing DFEs creating an on-demand digital printing ecosystem. Our ink includes digital UV curable, LED curable, ceramic, water-based, thermoforming, and specialty ink, as well as a variety of textile ink including dye sublimation, pigmented, reactive dye, acid dye, pure disperse dye, water-based dispersed printing ink, and coatings. Our award-winning business process automation solutions are integrated from creation to print and are vertically integrated with our industrial digital inkjet printers and products produced by the leading production digital color page printer manufacturers that are driven by our Fiery DFEs.
Our product portfolio includes Industrial Inkjet including VUTEk display graphics super-wide and wide format, Nozomi corrugated packaging, Reggiani textile, Cretaprint ceramic tile decoration and building material industrial digital inkjet printers and ink; print production workflow, web-to-print, cross-media marketing, Optitex textile 2D and 3D fashion CAD applications, and Productivity Software, which provides corporate printing, corrugated packaging, publishing, and mailing and fulfillment solutions for the printing and packaging industry; Fiery DFEs, including the FFPS DFE, and Generation Digital color matching, color palette creation and print design software. Our integrated solutions and award-winning technologies are designed to automate print and business processes, streamline workflow, provide profitable value-added services, and produce accurate digital output.
Correction of Prior Period Financial Information
We identified certain errors at our Italian manufacturing subsidiary attributable to the valuation and classification of certain finished goods inventory during the year ended December 31, 2017. The errors related to finished goods that should have been impaired and expensed in 2015, inventory utilized in research and development projects that expired and should have been expensed in 2016, and certain assets included in inventory that should have been capitalized and depreciated over their estimated useful lives. The preceding resulted in an understatement of cost of revenue in 2015 and operating expenses in 2016 due to failure to properly impair and expense certain items, properly classify certain amounts included in inventories on the balance sheet, and appropriately depreciate those amounts.
As a result, we have corrected the accompanying consolidated balance sheet as of December 31, 2016 as follows:
| December 31, 2016 | ||||||||||||
| (in thousands) | As Previously Reported |
Adjustments | As Adjusted | |||||||||
| Inventories |
$ | 99,075 | $ | (2,737 | ) | $ | 96,338 | |||||
| Property and equipment, net |
103,304 | 170 | 103,474 | |||||||||
| Total assets |
1,481,496 | (2,567 | ) | 1,478,929 | ||||||||
| Deferred tax liabilities |
16,351 | (750 | ) | 15,601 | ||||||||
| Total liabilities |
653,664 | (750 | ) | 652,914 | ||||||||
| Accumulated other comprehensive loss |
(24,694 | ) | 119 | (24,575 | ) | |||||||
| Retained earnings |
419,825 | (1,936 | ) | 417,889 | ||||||||
| Total shareholders’ equity |
827,832 | (1,817 | ) | 826,015 | ||||||||
102
Table of Contents
Electronics For Imaging, Inc.
Notes to Consolidated Financial Statements—(Continued)
We consider this correction to previously issued financial statements to be immaterial.
The impact to net income for the years ended December 31, 2016 and 2015 for this correction is a decrease of $0.6 and $1.3 million, respectively, from amounts previously reported of $45.5 and $33.5 million, respectively.
Out-of-Period Adjustments
During the year ended December 31, 2017, we recorded out-of-period adjustments related to certain bill and hold transactions, which decreased revenue by $3.4 million, decreased gross profit by $0.5 million, and increased net loss by $0.3 million (or $0.01 per diluted share). We evaluated these adjustments considering both qualitative and quantitative factors and the impact of these adjustments in relation to each period, as well as the periods in which they originated. The impact of recognizing these adjustments in prior years was not material to any individual period. Management believes these adjustments are immaterial to these consolidated financial statements and all previously issued financial statements. Such out-of-period adjustments are not part of the Correction of Prior Period Financial Information described above.
Significant Accounting Policies
Basis of Presentation
The accompanying consolidated financial statements include the accounts of EFI and our subsidiaries. All intercompany accounts and transactions have been eliminated in consolidation.
Use of Estimates
The preparation of consolidated financial statements requires estimates and judgments that affect the reported amounts of assets, liabilities, revenue, expenses, comprehensive income, cash flows, and related disclosure of contingent assets and liabilities. We evaluate our estimates, including those related to revenue recognition, bad debts, inventory valuation and purchase commitment reserves, warranty obligations, litigation expenses, restructuring activities, fair value of financial instruments, stock-based compensation, income taxes, valuation of goodwill and intangible assets, business combinations, build-to-suit lease accounting, functional currency determination, and contingencies on an ongoing basis. Estimates are based on historical and current experience, the impact of the current economic environment, and various other assumptions believed to be reasonable under the circumstances at the time of the estimate, the results of which form the basis for making judgments about the carrying values of assets and liabilities that are not readily apparent from other sources. Actual results may differ from these estimates under different assumptions or conditions.
Cash, Cash Equivalents, and Short-term Investments
We invest our excess cash on deposit with major banks in money market, U.S. Treasury and government-sponsored entity, corporate, municipal government, asset-backed, and mortgage-backed residential securities. By policy, we invest primarily in high-grade marketable securities. We are exposed to credit risk in the event of default by the financial institutions or issuers of these investments to the extent of amounts recorded in our Consolidated Balance Sheets.
We consider all highly liquid investments with an original maturity of three months or less at the time of purchase to be cash equivalents. Typically, the cost of these investments has approximated fair value. Marketable investments with a maturity greater than three months are classified as available-for-sale short-term investments. Available-for-sale securities are stated at fair value with unrealized gains and losses reported as a separate
103
Table of Contents
Electronics For Imaging, Inc.
Notes to Consolidated Financial Statements—(Continued)
component of OCI, adjusted for deferred income taxes. The credit portion of any other-than-temporary impairment is included in net income (loss). Realized gains and losses on sales of financial instruments are recognized upon sale of the investments using the specific identification method.
We review investments in debt securities for other-than-temporary impairment whenever the fair value is less than the amortized cost and evidence indicates the investment’s carrying amount is not recoverable within a reasonable period of time. We assess the fair value of individual securities as part of our ongoing portfolio management. Our other-than-temporary assessment includes reviewing the length of time and extent to which fair value has been less than amortized cost; the seniority and durations of the securities; adverse conditions related to a security, industry, or sector; historical and projected issuer financial performance, credit ratings, issuer specific news; and other available relevant information. To determine whether an impairment is other-than-temporary, we consider whether we have the intent to sell the impaired security or if it will be more likely than not that we will be required to sell the impaired security before a market price recovery and whether evidence indicating the cost of the investment is recoverable outweighs evidence to the contrary.
In determining whether a credit loss existed, we used our best estimate of the present value of cash flows expected to be collected from each debt security. For these cash flow estimates, including prepayment assumptions, we rely on data from widely accepted third party data sources or internal estimates. In addition to prepayment assumptions, cash flow estimates vary based on assumptions regarding the underlying collateral including default rates, recoveries, and changes in value. Expected cash flows were discounted using the effective interest rate implicit in the securities.
Based on this analysis, there were no other-than-temporary impairments, including credit-related impairments, during the years ended December 31, 2017, 2016, and 2015. We have determined that gross unrealized losses on short-term investments at December 31, 2017 and 2016 are temporary in nature because each investment meets our investment policy and credit quality requirements. We have the ability and intent to hold these investments until they recover their unrealized losses, which may not be until maturity. Evidence that we will recover our investments outweighs evidence to the contrary.
We classify our investments as current or noncurrent based on the nature of the investments and their availability for use in current operations.
Restricted Cash Equivalents and Investments
As explained further in Note 15—Property and Equipment, net, we have restricted cash equivalents and investments of $32.5 and $6.3 million as of December 31, 2017 and 2016 related to a lease with BTMU related to the construction of manufacturing and warehouse facilities in Manchester, New Hampshire, in our Industrial Inkjet operating segment.
The funds pledged under the lease represent 115% of the total expenditures made by BTMU through December 31, 2017 and 2016. The funds are invested in $32.5 million of cash equivalents at December 31, 2017, and $5.1 and $1.2 million of U.S. government securities and cash equivalents at December 31, 2016, respectively, with a third party trustee, which are restricted during the construction period. Upon completion of construction, the funds will be released as cash and cash equivalents. The portion of released funds representing 100% of the total expenditures made by BTMU will be deposited with BTMU and restricted as collateral until the end of the underlying lease period.
Fair Value of Financial Instruments
We assess the fair value of our financial instruments each reporting period. The carrying amounts of cash, cash equivalents, accounts receivable, accounts payable, and accrued and other liabilities, approximate their respective
104
Table of Contents
Electronics For Imaging, Inc.
Notes to Consolidated Financial Statements—(Continued)
fair values due to the short maturities of these financial instruments and because accounts receivable are reduced by an allowance for doubtful accounts. The fair value of our available-for-sale securities, contingent acquisition-related liabilities, self-insurance liability, derivative instruments, and convertible senior notes are disclosed in Note 6—Investments and Fair Value Measurements of the Notes to Consolidated Financial Statements.
Revenue Recognition
We derive our revenue primarily from product revenue, which includes hardware (DFEs, design-licensed solutions including upgrades, industrial digital inkjet printers including components replaced under maintenance agreements, and ink), software licensing and development, and royalties. We receive service revenue from software license and printer maintenance agreements, customer support, training, and consulting.
We recognize revenue on the sale of DFEs, printers, and ink in accordance with the provisions of SAB 104, Revenue Recognition, and when applicable, ASC 605-25. As such, revenue is generally recognized when persuasive evidence of an arrangement exists, the product has been delivered or services have been rendered, the fee is fixed or determinable, and collection is reasonably assured.
Products generally must be shipped against written purchase orders. We use either a binding purchase order or signed contract as evidence of an arrangement. Sales to the leading printer manufacturers are generally evidenced by a master agreement governing the relationship together with a binding purchase order. Sales to our resellers are also evidenced by binding purchase orders or signed contracts and do not generally contain rights of return or price protection. Our arrangements generally do not include product acceptance clauses. When acceptance is required and not considered perfunctory, revenue is recognized when the product is accepted by the customer.
Delivery of hardware generally is complete when title and risk of loss is transferred at point of shipment from manufacturing facilities, or when the product is delivered to the customer’s local common carrier. We also sell products and services using sales arrangements with terms resulting in different timing for revenue recognition as follows:
| • | if the title and/or risk of loss is transferred at a location other than our manufacturing facility, revenue is recognized when title and risk of loss transfers to the customer, per the terms of the agreement; |
| • | if title is retained until payment is received, revenue is recognized when title is passed upon receipt of payment; |
| • | if the sales arrangement is classified as an operating lease, revenue is recognized ratably over the lease term; |
| • | if the sales arrangement is classified as a sales-type lease, revenue is recognized upon shipment; |
| • | if the sales arrangement is a fixed price for performance extending over a long period and our right to receive future payment depends on our future performance in accordance with these agreements, revenue is recognized under the percentage of completion method. |
We assess whether the fee is fixed or determinable based on the terms of the contract or purchase order. We assess collectibility based on various factors, including past transaction history with the customer, the creditworthiness of the customer, customer concentrations, current economic trends and macroeconomic conditions, changes in customer payment terms, the length of time receivables are past due, and significant one-time events. We may not request collateral from our customers, although down payments or letters of credit are generally required from Industrial Inkjet and Productivity Software customers to ensure payment. If we determine that collection of a fee is not reasonably assured, we defer the fee and recognize revenue when collection becomes reasonably assured, which is generally upon receipt of cash.
105
Table of Contents
Electronics For Imaging, Inc.
Notes to Consolidated Financial Statements—(Continued)
We hold certain products manufactured by us on a “bill and hold” basis for our customers’ convenience. Revenue is recognized for these “bill and hold” arrangements in accordance with SAB 104, which requires consideration of, among other things, whether the customer has made a fixed commitment to purchase the product; the existence of a substantial business purpose for the arrangement; the “bill and hold” arrangement is at the request of the customer; the scheduled delivery date must be reasonable and consistent with the buyer’s business purpose; title and risk of ownership must pass to the customer, including any decline in the market value of the product; the product is complete and ready for shipment; the product has been segregated from our inventory; payment terms for such arrangements have not been modified from our normal billing and credit terms; our custodial risks must be insurable and insured; and no further performance obligations by us exist. Extended procedures are not necessary to assure that there are no exceptions to the customer’s commitment to accept and pay for the product. There are no bill-and-hold arrangements outstanding as of December 31, 2017.
We license our software primarily under perpetual licenses. Software revenue consists of licensing, post-contract customer support, and professional consulting. We apply the provisions of ASC 985-605, Software—Revenue Recognition, and if applicable, SAB 104, and ASC 605-25, to all transactions involving the sale of software products and hardware transactions where the software is not incidental.
We enter into contracts to sell our products and services. While the majority of our sales agreements contain standard terms and conditions, there are agreements containing multiple elements or non-standard terms and conditions. As a result, significant contract interpretation is sometimes required to determine the appropriate accounting, including whether the deliverables specified in a multiple element arrangement should be treated as separate units of accounting for revenue recognition purposes, and, if so, how the price should be allocated among the elements and when to recognize revenue for each element. We recognize revenue for delivered elements only when the delivered elements have stand-alone value, uncertainties regarding customer acceptance are resolved, and there are no customer-negotiated refund or return rights for the delivered elements. If the arrangement includes a customer-negotiated refund or right of return relative to the delivered item and the delivery and performance of the undelivered item is considered probable and substantially in our control, the delivered element constitutes a separate unit of accounting. We limit revenue recognition for delivered elements to the amount that is not contingent on the future delivery of products or services, future performance obligations, or subject to customer-specified return or refund privileges. Changes in the allocation of the sales price between elements may impact the timing of revenue recognition, but will not change the total revenue recognized on the contract.
Multiple-Deliverable Arrangements
We recognize revenue in multiple element arrangements involving tangible products containing software and non-software components that function together to deliver the product’s essential functionality by applying the relative sales price method of allocation in accordance with ASC 605-25. The sales price for each element is determined using VSOE when available (including post-contract customer support, professional services, hosting, and training). When VSOE is not available, then TPE is used. If VSOE or TPE are not available, then BESP is used when applying the relative sales price method for each unit of accounting. When the arrangement includes software and non-software elements, revenue is first allocated to the non-software and software elements as a group based on their relative sales price. Thereafter, the relative sales price allocated to the software elements as a group is further allocated to each unit of accounting in accordance with ASC 985-605. We then defer revenue with respect to the relative sales price that was allocated to any undelivered element.
We have calculated BESP for software licenses and non-software deliverables. We considered several different methods of establishing BESP including cost plus a reasonable margin, stand-alone sales price of the same or similar products, and if available, targeted rate of return, list price less discount, and company published list
106
Table of Contents
Electronics For Imaging, Inc.
Notes to Consolidated Financial Statements—(Continued)
prices to identify the most appropriate representation of the estimated sales price of our products. Due to the wide range of pricing offered to our customers, we determined that sales price of the same or similar products, list price less discount, and company published list prices were not appropriate methods to determine BESP for our products. Cost plus a reasonable margin and targeted rate of return were eliminated due to the difficulty in determining the cost associated with the intangible elements of each product’s cost structure. As a result, management believes that the best estimate of the sales price of an element is the median sales price of deliverables sold in stand-alone transactions and/or separately priced deliverables contained in bundled arrangements. Elements sold as stand-alone transactions and in bundled arrangements during the four quarters immediately preceding the end of each reporting period were included in the calculation of BESP.
When historical data is unavailable to calculate and support the determination of BESP on a newly launched or customized product, then BESP of similar products is substituted for revenue allocation purposes. We offer customization for some of our products. Customization does not have a significant impact on the discounting or pricing of our products.
We have insignificant transactions where tangible and software products are sold together in a bundled arrangement. Tangible products containing software and non-software components that function together to deliver the product’s essential functionality are not required to follow the software revenue recognition guidance in ASC 985-605 as long as the hardware components of the tangible product substantively contribute to its functionality. In addition, hardware components of tangible products containing software components shall always be excluded from the guidance in ASC 985-605. Non-software elements are accounted for in accordance with SAB 104.
Multiple element arrangements containing only software elements remain subject to the provisions of ASC 985-605 and must follow the residual method. When several elements of a multiple element arrangement, including software licenses, post-contract customer support, hosting, and professional services, are sold to a customer through a single contract, the revenue from such multiple element arrangements are allocated to each element using the residual method in accordance with ASC 985-605. Revenue is allocated to the support elements and professional service elements of an agreement using VSOE and to the software license elements of the agreement using the residual method. We have established VSOE for professional services and hosting based on the rates charged to our customers in stand-alone orders. We have also established VSOE for post-contract customer support based on substantive renewal rates. Accordingly, software license fees are recognized under the residual method for arrangements in which the software was licensed with maintenance and/or professional services, and where the maintenance and professional services were not essential to the functionality of the delivered software.
Subscription Arrangements
We have subscription arrangements where the customer pays a fixed fee and receives services over a period of time. We recognize subscription revenue ratably over the service period. Any up front setup fees associated with our subscription arrangements are recognized ratably, generally over one year. Any up front setup fees that are not associated with our subscription arrangements are recognized upon completion.
Leasing Arrangements
If the sales arrangement is classified as a sales-type lease, then revenue is recognized upon shipment. Leases that are not classified as sales-type leases are accounted for as operating leases with revenue recognized ratably over the lease term.
107
Table of Contents
Electronics For Imaging, Inc.
Notes to Consolidated Financial Statements—(Continued)
A lease is classified as a sales-type lease with revenue recognized upon shipment if the lease is determined to be collectible and has no significant uncertainties and if any of the following criteria are satisfied:
| • | present value of all minimum lease payments is greater than or equal to 90% of the fair value of the equipment at lease inception, |
| • | noncancellable lease term is greater than or equal to 75% of the economic life of the equipment, |
| • | bargain purchase option that allows the lessee to purchase the equipment below fair value, or |
| • | transfer of ownership to the lessee upon termination of the lease. |
Long-term Contracts Involving Substantial Customization
We have established our ability to produce estimates sufficiently dependable to require that we follow the percentage of completion method with respect to fixed price contracts where we provide information technology system development and implementation services.
Revenue on such fixed price contracts is recognized over the contract term based on the percentage of development and implementation services that are provided during the period compared with the total estimated development and implementation services to be provided over the entire contract using guidance from ASC 605-35, Revenue Recognition—Construction-Type and Production-Type Contracts. These services require that we perform significant, extensive, and complex design, development, modification, or implementation activities of our customers’ systems. Performance will often extend over long periods, and our right to receive future payment depends on our future performance in accordance with these agreements.
We recognize losses on long-term fixed price contracts in the period that the contractual loss becomes probable and estimable. We record amounts invoiced to customers in excess of revenue recognized as deferred revenue until the revenue recognition criteria are met. We record revenue that is earned and recognized in excess of amounts invoiced on fixed price contracts as trade receivables.
Deferred Revenue and Related Deferred Costs
Deferred revenue represents amounts received in advance for product support contracts, software customer support contracts, consulting and integration projects, or product sales. Product support contracts include stand-alone product support packages, routine maintenance service contracts, and upgrades or extensions to standard product warranties. We defer these amounts when we invoice the customer and then generally recognize revenue either ratably over the support contract life, upon performing the related services, under the percentage of completion method, or in accordance with our revenue recognition policy. Deferred cost of revenue related to unrecognized revenue on shipments to customers was $3.5 and $3.4 million as of December 31, 2017 and 2016, respectively, and is included in other current assets in our Consolidated Balance Sheets.
Shipping and Handling Costs
Amounts billed to customers for shipping and handling costs are included in revenue. Shipping and handling costs are charged to cost of revenue as incurred.
Allowance for Doubtful Accounts and Sales-related Allowances
We establish an allowance for doubtful accounts to ensure that trade receivables are not overstated due to uncollectibility. We record specific reserves for individual accounts when we become aware of specific customer circumstances, such as bankruptcy filings, deterioration in the customer’s operating results or financial position, or potential unfavorable outcomes from disputes with customers or vendors.
108
Table of Contents
Electronics For Imaging, Inc.
Notes to Consolidated Financial Statements—(Continued)
We perform ongoing credit evaluations of the financial condition of our printer manufacturer, third-party distributor, reseller, and other customers and require collateral, such as letters of credit and bank guarantees, in certain circumstances. The past due or delinquency status of a receivable is based on the contractual payment terms of the receivable. The need to write off a receivable balance depends on the age, size, and determination of collectibility of the receivable. Balances are written off when we deem it probable that the receivable will not be recovered.
We make provisions for sales rebates and revenue adjustments based on analysis of current sales programs and revenue in accordance with our revenue recognition policy.
Financing Receivables
ASC 310, Receivables, requires disclosures regarding the credit quality of our financing receivables and allowance for credit losses including disclosure of credit quality indicators, past due information, and modifications of our financing receivables. Our financing receivables were $28.7 and $31.0 million consisting of $16.6 and $17.8 million of sales-type lease receivables, included within other current assets and other assets at December 31, 2017 and 2016, respectively, and $12.1 and $13.2 million of trade receivables having an original contractual maturity in excess of one year, included within accounts receivable, net of allowance, at December 31, 2017 and 2016, respectively. The trade receivables of $12.1 and $13.2 million having an original total contractual maturity in excess of one year, at December 31, 2017 and 2016, include $4.4 and $7.1 million, respectively, which are scheduled to be received in less than one year. The credit quality of financing receivables is evaluated on the same basis as trade receivables. We do not have material past due financing receivables.
Concentration of Risk
We are exposed to credit risk in the event of default by any of our customers to the extent of amounts recorded in the Consolidated Balance Sheet. We perform ongoing evaluations of the collectibility of accounts receivable balances for our customers and maintain allowances for estimated credit losses. Actual losses have not historically been significant, but have risen over the past several years as our customer base has grown through acquisitions.
Our Fiery products, which constitute approximately 27% of revenue for the year ended December 31, 2017, are primarily sold to a limited number of leading printer manufacturers. Although end customer and reseller channel preference for Fiery products drives demand, most Fiery revenue relies on these significant printer manufacturer / distributors to integrate Fiery technology into the design and development of their print engines. We expect that we will continue to depend on a relatively small number of leading printer manufacturers for a significant portion of our revenue, although their significance is expected to decline in future periods as our revenue increases from Industrial Inkjet and Productivity Software products. We generally have experienced longer accounts receivable collection cycles in our Industrial Inkjet and Productivity Software operating segments compared to our Fiery operating segment as, historically, the leading printer manufacturers have paid on a more timely basis. Down payments are generally required from Industrial Inkjet and Productivity Software customers as a means to ensure payment.
Since Europe is composed of varied countries and regional economies, our European risk profile is somewhat more diversified due to the varying economic conditions among the countries. Approximately 32% of our receivables are with European customers as of December 31, 2017. Of this amount, 30% of our European receivables (10% of consolidated gross receivables) are in the higher risk southern European countries (mostly Italy, Spain, and Portugal) and Ireland.
109
Table of Contents
Electronics For Imaging, Inc.
Notes to Consolidated Financial Statements—(Continued)
We rely on a limited number of suppliers for certain key components, including textile ink, and a few key contract manufacturers for our Fiery DFEs, and certain Industrial Inkjet subassemblies. Any disruption or termination of these arrangements could materially adversely affect our operating results.
Many of our current Fiery and Productivity Software products include software that we license from Adobe. To obtain licenses from Adobe, Adobe requires that we obtain quality assurance approvals from them for our products that use Adobe software.
Accounts Receivable Sales Arrangements
In accordance with ASC 860-20, Transfers and Servicing, trade receivables are derecognized from our Consolidated Balance Sheet when sold to third parties upon determining that such receivables are presumptively beyond the reach of creditors in a bankruptcy proceeding. Any recourse obligation is measured using market data from similar transactions and the servicing liability is determined based on the fair value that a third party would charge to service these receivables. These liabilities were determined to not be material at December 31, 2017 and 2016.
We have facilities in the U.S. and Italy that enable us to sell to third parties, on an ongoing basis, certain trade receivables with recourse. The trade receivables sold with recourse are generally short-term receivables with payment due dates of less than 10 days from the date of sale, which are subject to a servicing obligation. Trade receivables sold under these facilities were $21.4 and $19.8 million during the years ended December 31, 2017 and 2016, respectively, which approximates the cash received.
We have facilities in Spain and Italy that enable us to sell to third parties, on an ongoing basis, certain trade receivables without recourse. Trade receivables sold without recourse are generally short-term receivables with payment due dates of less than one year, which are secured by international letters of credit. Trade receivables sold under these facilities were $5.9 and $3.5 million during the years ended December 31, 2017 and 2016, respectively, which approximates the cash received.
We report collections from the sale of trade receivables to third parties as operating cash flows in the Consolidated Statements of Cash Flows.
Inventories
Inventories are generally stated at standard cost, which approximates the lower of actual cost, using the first-in, first-out (“FIFO”) cost flow assumption, or market. Reggiani inventories are stated at weighted average cost, which approximates the FIFO cost flow assumption, or market. We periodically review our inventories for potential excess or obsolete items and write down specific items to net realizable value as appropriate. Work-in-process inventories consist of our product at various levels of assembly and include materials, labor, and manufacturing overhead. Finished goods inventory represents completed products awaiting shipment.
We estimate potential future inventory obsolescence and purchase commitments to evaluate the need for inventory reserves. Current economic trends, changes in customer demand, product design changes, product life, demand, and the acceptance of our products are analyzed to evaluate the adequacy of such reserves.
Property and Equipment, Net
Property and equipment is recorded at cost. Depreciation is computed using the straight-line method over the estimated useful lives of the assets as follows: desktop and laptop computers (two years), computer server
110
Table of Contents
Electronics For Imaging, Inc.
Notes to Consolidated Financial Statements—(Continued)
equipment (three years), software under perpetual licenses (three to five years), manufacturing equipment (seven years), testing and other equipment (three years), tooling (lesser of three years or the product life), research and development equipment with alternative future uses (three years), equipment leased to customers on operating leases (greater of three years or the lease term), furniture (five years), land improvements such as parking lots or sidewalks (seven years), leasehold improvements (the lease term), building improvements (five to ten years), building and improvements under a build-to-suit lease (forty years), and purchased buildings (forty years).
When assets are disposed, the asset and accumulated depreciation are removed from our records and the related gain or loss is recognized in our results of operations.
Repairs and maintenance expenditures are expensed as incurred, unless they are considered to be improvements and extend the useful life of the property and equipment.
Internal Use Software
In accordance with ASC 350-40, Intangibles—Goodwill and Other—Internal-Use Software, software development costs, including costs incurred to purchase third party software, are capitalized during the application development stage when certain factors are present including, among others, that technology exists to achieve the performance requirements, management has committed to funding the project, and conceptual formulation, design, and testing of possible software alternatives (preliminary project phase) have all been completed. Costs incurred during the preliminary project phase, post-implementation / operational phase, process re-engineering, training, and maintenance are expensed as incurred. The accumulation of software costs to be capitalized ceases when the software is substantially developed and is ready for its intended use. Capitalized internal use software is amortized over an estimated useful life of three to five years using the straight-line method.
Goodwill
Goodwill is recorded when the consideration paid for an acquisition exceeds the fair value of net tangible and intangible assets acquired. We perform our annual goodwill impairment analysis in the fourth quarter of each year or more frequently if we believe indicators of impairment exist. Triggering events that may require an interim impairment analysis include indicators such as adverse industry or economic trends, restructuring actions, significant changes in the manner of our use of the acquired assets, significant changes in the strategy for our overall business, lower projections of profitability, significant decline in our stock price for a sustained period, or a sustained decline in our market capitalization.
According to the provisions of ASC 350-20-35, a two-step impairment test of goodwill is required, unless the simplified method is elected. In the first step, the fair value of each reporting unit is compared to its carrying value. If the fair value exceeds carrying value, goodwill is not impaired and further testing is not required. If the carrying value exceeds fair value, then the second step of the impairment test is required to determine the implied fair value of the reporting unit’s goodwill. The implied fair value of goodwill is calculated by deducting the fair value of all tangible and intangible net assets of the reporting unit, excluding goodwill, from the fair value of the reporting unit as determined in the first step. If the carrying value of the reporting unit’s goodwill exceeds its implied fair value, then an impairment loss must be recorded equal to the difference. We have not been required to perform this second step of the process because the fair value of our reporting units have exceeded their carrying value as of December 31, 2017, 2016, and 2015.
Long-lived Assets, including Intangible Assets
Purchased intangible assets are amortized on a straight-line basis over their economic lives of two to six years for developed technology, three to nine years for customer contracts/relationships, four to five years for covenants
111
Table of Contents
Electronics For Imaging, Inc.
Notes to Consolidated Financial Statements—(Continued)
not to compete, and three to sixteen years for trademarks and trade names as we believe this method most closely reflects the pattern in which the economic benefits of the assets will be consumed. The useful lives of certain amortizable identifiable intangible assets were reduced during 2017 and 2016, respectively, based on a re-assessment of their useful lives, with a $0.2 and $1.6 million impact on amortization expense. No changes were made to the useful lives of amortizable identifiable intangible assets in 2015. Intangible amortization expense was $47.3, $39.6, and $26.5 million for the years ended December 31, 2017, 2016, or 2015, respectively.
We review the carrying values of long-lived assets whenever events and circumstances, such as reductions in demand, lower projections of profitability, significant changes in the manner of our use of acquired assets, or significant negative industry or economic trends, indicate that the net book value of an asset may not be recovered through expected future cash flows from its use and eventual disposition. An asset is considered impaired if its carrying amount exceeds the undiscounted future cash flow the asset is expected to generate. If this review indicates that an impairment has occurred, the impaired asset is written down to its fair value, which is typically calculated using quoted market prices and/or discounted expected future cash flows. Our estimates regarding future anticipated net revenue and cash flows, the remaining economic life of the products and technologies, or both, may differ from those used to assess the recoverability of assets. In that event, impairment charges or shortened useful lives of certain long-lived assets may be required, resulting in charges to our Consolidated Statements of Operations when such determinations are made.
An impairment loss is recorded for long-lived assets held-for-sale when the carrying amount of the asset exceeds its fair value less cost to sell. A long-lived asset is not depreciated while it is classified as held-for-sale.
We recorded an impairment loss of $0.9 million during the year ended December 31, 2017 related to the Meredith facility. For additional information, please refer to Note 15—Property and Equipment, net, for details. There were no asset impairment charges recognized during the years ended December 31, 2016 and 2015.
Warranty Reserves
Our Industrial Inkjet printers are generally accompanied by a 13-month limited warranty commencing on the installation date, which covers both parts and labor. Our Fiery DFE limited warranty is 12 to 15 months. Estimated future hardware and software warranty costs are recorded as a cost of product revenue when the related revenue is recognized based on historical and projected warranty claim rates, historical and projected cost-per-claim, and knowledge of specific product failures that are outside our typical experience. Factors that affect our warranty liability include the number of installed units subject to warranty protection, product failure rates, estimated material costs, estimated distribution costs, and estimated labor costs. We have agreed to continue to provide warranty coverage for certain expired FFPS warranties for five years subsequent to the acquisition of the FFPS business.
Warranty reserves were $16.3 and $10.3 million as of December 31, 2017 and 2016, respectively.
Litigation Accruals
We may be involved, from time to time, in a variety of claims, lawsuits, investigations, or proceedings relating to contractual disputes, securities laws, intellectual property rights, employment, or other matters that may arise in the normal course of business. We assess our potential liability in each of these matters by using the information available to us. We develop our views on estimated losses in consultation with inside and outside counsel, which involves a subjective analysis of potential results and various combinations of appropriate litigation and settlement strategies. We accrue estimated losses from contingencies if a loss is deemed probable and can be reasonably estimated.
112
Table of Contents
Electronics For Imaging, Inc.
Notes to Consolidated Financial Statements—(Continued)
Restructuring Reserves
Restructuring liabilities are established when the costs have been incurred. Severance and other employee separation costs are incurred when management commits to a plan of termination identifying the number of employees impacted, their termination dates, and the terms of their severance arrangements. The liability is accrued at the employee notification date unless service is required beyond the greater of 60 days or the legal notification period, in which case the liability is recognized ratably over the service period. Facility downsizing and closure costs are accrued at the earlier of the lessor notification date, if the lease agreement allows for early termination, or the cease use date. Relocation costs are incurred when the related relocation services are performed. Costs related to contracts without future benefit are incurred at the earlier of the cease use date or the contract cancellation date.
Research and Development
Research and development costs were $157.4, $151.4, and $141.4 million for the years ended December 31, 2017, 2016, and 2015, respectively. Research and development costs include salaries and benefits of employees performing research and development activities, supplies, and other expenses incurred from research and development efforts. We expense research and development costs associated with new software products as incurred until technological feasibility is established. To date, we have not capitalized research and development costs associated with software development as products and enhancements have generally reached technological feasibility, as defined by U.S. GAAP, and have been released for sale at substantially the same time. We have capitalized research and development equipment that has been acquired or constructed for research and development activities and has alternative future uses (in research and development projects or otherwise). Such research and development equipment is depreciated on a straight-line basis with a three year useful life.
Advertising
Advertising costs are expensed as incurred. Total advertising and promotional expenses were $5.9, $4.6, and $4.3 million for the years ended December 31, 2017, 2016, and 2015, respectively.
Income Taxes
We account for income taxes in accordance with the provisions of ASC 740, which requires that deferred tax assets and liabilities be determined based on the differences between the financial statement and tax bases of assets and liabilities by using enacted tax rates in effect for the year in which the differences are expected to reverse. Accordingly, the tax bases of assets and liabilities reflect the impact of the tax reform legislation that was enacted on December 22, 2017. We estimate our actual current tax expense including permanent charges and benefits and the temporary differences resulting from differing treatment of items for tax and financial accounting purposes such as deferred revenue. These temporary differences result in deferred tax assets and liabilities, which are included in our Consolidated Balance Sheets. In some cases, provisional amounts were recorded based on reasonable estimates. We record the provisional amounts of the tax effects of the 2017 Tax Act in the first reporting period in which a reasonable estimate can be determined. SAB 118 provides that the measurement period may not extend beyond one year from the enactment date.
We assess the likelihood that our deferred tax assets will be recovered from future taxable income by considering both positive and negative evidence relating to their recoverability. If we believe that recovery of these deferred tax assets is not more likely than not, we establish a valuation allowance. Significant judgment is required in determining any valuation allowance recorded against deferred tax assets.
In assessing the need for a valuation allowance, we considered all available evidence, including recent operating results, projections of future taxable income, our ability to utilize loss and credit carryforwards, and the
113
Table of Contents
Electronics For Imaging, Inc.
Notes to Consolidated Financial Statements—(Continued)
feasibility of tax planning strategies. Other than a valuation allowance related to realization of existing California, Luxembourg, Israel, Netherlands, and Turkey deferred tax assets, we have determined that it is more likely than not that we will realize the benefit related to all other deferred tax assets. To the extent we increase a valuation allowance, we include an expense in the Consolidated Statement of Operations in the period in which such determination is made.
We account for uncertainty in income taxes by recognizing a tax position only when it is more likely than not that the tax position, based on its technical merits, will be sustained upon ultimate settlement with the applicable tax authority. The tax benefit to be recognized is the largest amount of tax benefit that is greater than fifty percent likely of being realized upon ultimate settlement with the applicable tax authority that has full knowledge of all relevant information. Tax benefits that are deemed to be less than fifty percent likely of being realized are recorded in noncurrent income taxes payable until the uncertainty has been resolved through either examination by the relevant taxing authority or expiration of the pertinent statutes of limitations.
Business Combinations
We allocate the purchase price of acquired companies to the tangible and intangible assets acquired, including IPR&D, and liabilities assumed based on their estimated fair values. Such a valuation requires management to make significant estimates and assumptions, especially with respect to intangible assets. The results of operations for each acquisition are included in our financial statements from the date of acquisition.
Our acquisitions are accounted for as purchase business combinations using the acquisition method of accounting in accordance with ASC 805. Key provisions of the acquisition method of accounting include the following:
| • | one hundred percent of assets and liabilities of the acquired business, including goodwill, are recorded at fair value, regardless of the percentage of the business acquired; |
| • | contingent assets and liabilities are recognized at fair value at the acquisition date; |
| • | contingent consideration is recognized at fair value at the acquisition date with changes in fair value recognized in earnings as assumptions are updated or upon settlement; |
| • | IPR&D is recognized at fair value at the acquisition date subject to amortization after product launch or otherwise assessed for impairment; |
| • | acquisition-related transaction and restructuring costs are expensed as incurred; |
| • | reversals of valuation allowances related to acquired deferred tax assets and liabilities and changes to acquired income tax uncertainties are recognized in earnings; |
| • | when making adjustments to finalize preliminary accounting during the measurement period, which may be up to one year, we recognize measurement period adjustments in the reporting period in which the adjustment amounts are determined as required by ASU 2015-16, Simplifying the Accounting for Measurement Period Adjustments; and |
| • | upon final determination of the fair value of assets acquired and liabilities assumed during the measurement period, any subsequent adjustments are recorded in our Consolidated Statements of Operations. |
Stock-Based Compensation
We account for stock-based compensation in accordance with ASC 718, which requires stock-based compensation expense to be recognized based on the fair value of such awards on the date of grant. We amortize
114
Table of Contents
Electronics For Imaging, Inc.
Notes to Consolidated Financial Statements—(Continued)
stock-based compensation expense on a graded vesting basis over the vesting period after assessing the probability of achieving the requisite performance criteria with respect to performance-based awards. Stock-based compensation expense is recognized over the requisite service period for each separately vesting tranche as though the award were, in substance, multiple awards.
We account for forfeitures when they occur. Prior to adoption of ASU 2016-09 in 2016, forfeitures were estimated at the grant date and revised on a cumulative basis, if necessary, in subsequent periods if actual forfeitures differ from those estimates. We used historical data and future expectations of employee turnover to estimate forfeitures.
Our determination of the fair value of stock-based payment awards on the date of grant using an option pricing model is affected by volatility, expected term, and interest rate assumptions. Expected volatility is based on the historical volatility of our stock over a preceding period commensurate with the expected term of the option. The expected term is based on management’s consideration of the historical life of the options, the vesting period of the options granted, and the contractual period of the options granted. The risk-free interest rate for the expected term of the option is based on the U.S. Treasury yield curve in effect at the time of grant. Expected dividend yield was not considered in the option pricing formula since we do not pay dividends and have no current plans to do so in the future.
Foreign Currency Translation
In preparing our consolidated financial statements, for subsidiaries that operate in a U.S. dollar functional currency environment, we remeasure balance sheet monetary items into U.S. dollars. Foreign currency assets and liabilities are remeasured from the transaction currency into the functional currency at current exchange rates, except for non-monetary assets, liabilities, and capital accounts, which are remeasured at historical exchange rates. Revenue and expenses are remeasured at monthly exchange rates, which approximate average exchange rates in effect during each period. Gains or losses from foreign currency remeasurement are included in interest income and other income (expense), net. Net losses resulting from foreign currency transactions, including hedging gains and losses, are reported in interest income and other income (expense), net, of $1.6, $3.8, and $4.2 million for the years ended December 31, 2017, 2016, and 2015, respectively.
For subsidiaries that operate in a local functional currency environment, all assets and liabilities are translated into U.S. dollars using current exchange rates, while revenue and expenses are translated using monthly exchange rates, which approximate the average exchange rates in effect during each period. Resulting translation adjustments are reported as a separate component of OCI, adjusted for deferred income taxes. The cumulative translation adjustment balance, net of tax, was an unrealized gain of $8.8 million at December 31, 2017, and an unrealized loss of $24.1 million at December 31, 2016.
Based on our assessment of the salient economic indicators discussed in ASC 830-10-55-5, Foreign Currency Matters, we consider the U.S. dollar to be the functional currency for each of our international subsidiaries except for our Brazilian subsidiary, Metrics, for which we consider the Brazilian real to be the subsidiary’s functional currency; our German subsidiaries, EFI GmbH and Alphagraph, for which we consider the Euro to be the subsidiaries’ functional currency; our Italian subsidiary, Reggiani, for which we consider the Euro to be the functional currency; our Spanish subsidiary, Cretaprint, for which we consider the Euro to be the subsidiary’s functional currency; our U.K. subsidiaries, Electronics For Imaging United Kingdom Limited, Escada, Shuttleworth, and Rialco, for which we consider the British pound sterling to be the subsidiaries’ functional currency; our Israeli subsidiaries, Matan and Optitex, for which we consider the Israeli shekel to be the functional currency; our Japanese subsidiary, Electronics For Imaging Japan KK, for which we consider the Japanese yen to be the subsidiary’s functional currency; our New Zealand subsidiary contains the Prism Group
115
Table of Contents
Electronics For Imaging, Inc.
Notes to Consolidated Financial Statements—(Continued)
Holdings Limited (“Prism”) operations in New Zealand for which we consider the New Zealand dollar to be the functional currency; our Australian subsidiary contains the Prism, OPS, and Metrix operations in Australia for which we consider the Australian dollar to be the functional currency; and our subsidiary in the People’s Republic of China, which contains the operations of our Cretaprint sales and support center and our Industrial Inkjet demonstration center for which we consider the Chinese renminbi to be the functional currency.
Net Income (Loss) per Common Share
Net income (loss) per basic common share is computed using the weighted average number of common shares outstanding during the period. Net income (loss) per diluted common share is computed using the weighted average number of common shares and dilutive potential common shares outstanding during the period. Potential common shares result from the assumed exercise of outstanding common stock options having a dilutive effect using the treasury stock method, non-vested shares of restricted stock having a dilutive effect, non-vested restricted stock for which the performance criteria have been met, shares to be purchased under our ESPP having a dilutive effect, the assumed issuance at the beginning of 2017 of shares potentially released from escrow related to the acquisition of CTI, the assumed issuance at the beginning of 2016 of shares issued from escrow during 2016 related to the acquisition of Reggiani, the assumed conversion of our Notes having a dilutive effect using the treasury stock method when the stock price exceeds the conversion price of the Notes, as well as the dilutive effect of our warrants when the stock price exceeds the warrant strike price. Any potential shares that are anti-dilutive as defined in ASC 260, Earnings Per Share, are excluded from the effect of dilutive securities.
Performance-based and market-based restricted stock and stock options that would be issuable if the end of the reporting period were the end of the vesting period, if the result would be dilutive, are assumed to be outstanding for purposes of determining net income (loss) per diluted common share as of the later of the beginning of the period or the grant date in accordance with ASC 260-10-45-48.
Derivative Instruments and Risk Management
Our derivative instruments consist of foreign currency exchange contracts as described below:
Cash Flow Hedges
We utilize foreign currency exchange forward contracts to hedge foreign currency exchange exposures related to forecasted operating expenses denominated in Indian rupees. These derivative instruments are designated and qualify as cash flow hedges and in general, closely match the underlying forecasted transactions in duration. The changes in fair value of these contracts are reported as a component of OCI and reclassified to operating expense in the periods of payment of the hedged operating expenses. We measure the effectiveness of hedges of forecasted transactions by comparing the fair value of the designated foreign currency exchange forward purchase contracts with the fair values of the forecasted transactions. The ineffective portion of the derivative hedging gain or loss, as well as changes in the derivative time value (which is excluded from the assessment of hedge effectiveness), are recognized as a component of interest income and other income (expense), net.
Balance Sheet Hedges
We utilize foreign currency exchange forward and option contracts to hedge against the short-term impact of foreign currency exchange rate fluctuations related to certain foreign-currency-denominated monetary assets and liabilities, primarily consisting of hedges of British pound sterling, Brazilian real, Israeli shekel, Japanese yen, Chinese renminbi, and Euro-denominated intercompany balances; hedges of Brazilian real, British pound sterling, Australian dollar, Israeli shekel, and Euro-denominated trade receivables; and hedges of British pound
116
Table of Contents
Electronics For Imaging, Inc.
Notes to Consolidated Financial Statements—(Continued)
sterling, Indian rupee, Israeli shekel, and Euro-denominated other net monetary assets. These derivative instruments are not designated for hedge accounting treatment since there is a natural offset for the remeasurement of the underlying foreign currency denominated asset or liability. We recognize changes in the fair value of non-designated derivative instruments in earnings in the period of change. Gains and losses on foreign currency forward contracts used to hedge balance sheet exposures are recognized in interest income and other income (expense), net, in the same period as the remeasurement gain or loss of the related foreign currency denominated assets and liabilities.
Factors that could have an impact on the effectiveness of our balance sheet and cash flow hedging program include the accuracy of forecasts and the volatility of foreign currency markets. These programs reduce, but do not entirely eliminate, the impact of currency exchange movements. The maturities of these instruments are generally less than one year. Currently, we do not enter into any foreign exchange forward contracts to hedge exposures related to firm commitments or nonmarketable investments. We do not have any leveraged derivatives, nor do we use derivative contracts for speculative purposes. The related cash flow impacts of our derivative contracts are reflected as cash flows from operating activities in the Consolidated Statements of Cash Flows.
Variable Interest Entities
In accordance with the Variable Interest Entities (“VIE”) sub-section of ASC 810, Consolidation, we perform a formal assessment at each reporting period regarding whether any consolidated entity is considered the primary beneficiary of a VIE based on the power to direct activities that most significantly impact the economic performance of the entity and the obligation to absorb losses or rights to receive benefits that could be significant to us. We do not have any arrangements that meet the definition of a VIE.
Recent Accounting Pronouncements
Income Taxes. SAB 118 provides guidance for the application of ASC 740 in the reporting period that includes December 22, 2017, which is the date the Act to provide for reconciliation pursuant to titles II and V of the concurrent resolution on the budget for fiscal year 2018 (“2017 Tax Act”) was signed into law. SAB 118 requires that we recognize those income tax effects in our financial statements for which the accounting can be completed, as might be the case for the effect of rate changes on deferred tax assets and deferred tax liabilities. For matters that have not been completed, we are required to recognize provisional amounts to the extent that they are reasonably estimable, adjust them during a measurement period when more information becomes available, and report this information in our financial statements in that period. The measurement period is defined as up to one year from the enactment date, which will expire on December 22, 2018.
Inventory Valuation. In July 2015, the Financial Accounting Standards Board (“FASB”) issued (“ASU”) 2015-11, Simplifying the Measurement of Inventory, which became effective in the first quarter of 2017. ASU 2015-11 requires that inventory be valued at the lower of cost and net realizable value, which is defined as the estimated selling price in the ordinary course of business, less reasonably predictable costs of completion, disposal, and transportation. We previously valued inventory at the lower of cost or net realizable value less a reasonable profit margin as allowed by previous inventory valuation guidance. The adoption of ASU 2015-11 increased our inventory valuation by $1.2 million as of December 31, 2017.
Revenue Recognition. ASU 2014-09, Revenue from Contracts with Customers, issued in May 2014, ASU 2016-10, Revenue from Contracts with Customers: Identifying Performance Obligations and Licensing, and subsequent amendments, enhance the comparability of revenue recognition practices across entities, industries, jurisdictions, and capital markets. The principles-based guidance provides a framework for addressing revenue recognition issues comprehensively. The standards require that revenue be recognized that reflects the
117
Table of Contents
Electronics For Imaging, Inc.
Notes to Consolidated Financial Statements—(Continued)
consideration the entity expects to be entitled to in exchange for goods or services, which are referred to as performance obligations.
ASU 2014-09 will be effective in the first quarter of 2018. Two adoption methods are allowed under ASU 2014-09: the full retrospective method and modified retrospective method. We elected to use the modified retrospective method by applying the revised guidance to contracts that have not been completed as of January 1, 2018. Retained earnings will be adjusted for the cumulative effect of the change on January 1, 2018, estimated to be between $1.7 to $2.3 million (pre-tax) offset by a credit to deferred revenue. The key changes in the guidance that impact our revenue recognition relate to the timing of revenue recognition and allocation of contract revenue between services and software licenses. The requirement to defer incremental contract acquisition costs (e.g., commissions) and recognize them over the contract period or expected customer life will result in the recognition of a deferred charge on our balance sheet, estimated to be between $7.5 and $8.5 million (pre-tax) offset by a credit to retained earnings. The cumulative retained earnings adjustment, estimated to be between $4.3 and $5.3 million on January 1, 2018, after considering the income tax effect.
The new standard requires comprehensive annual and interim disclosures regarding the nature, amount, timing, and uncertainty of recognized revenue, which will be provided in the year of adoption along with the impact on recognized revenue compared with revenue that would have been recognized under prior guidance. Qualitative and quantitative disclosures will be required regarding:
| • | disaggregation of our current disclosures of revenue by segment and geographic area into categories that depict how revenue and cash flows are impacted by economic factors, |
| • | timing of recognition, contract duration, and sales channel, |
| • | billed and unbilled contracts with customers, including revenue and impairments recognized, disaggregation, and information about contract balances and performance obligations, |
| • | significant judgments and changes in judgments required to determine the transaction price, amounts allocated to performance obligations, and the timing for recognizing revenue resulting from the satisfaction of performance obligations, |
| • | assets recognized from the costs to obtain or fulfill a contract (e.g., commissions), and |
| • | bad debt provisions related to billed and unbilled receivables. |
We are assessing the full impact on our consolidated financial statements, systems, and controls upon adoption.
Financial Instruments. ASU 2016-13, Measurement of Credit Losses on Financial Instruments, issued in June 2016, amends current guidance regarding other-than-temporary impairment of available-for-sale debt securities. The new guidance requires an estimate of expected credit loss when fair value is below the amortized cost of the asset without regard for the length of time that the fair value has been below the amortized cost or the historical or implied volatility of the asset. Credit losses on available-for-sale debt securities will be limited to the difference between the security’s amortized cost basis and its fair value. The use of an allowance to record estimated credit losses (and subsequent recoveries) will also be required under the new guidance.
ASU 2016-13 will be effective in the first quarter of 2020. We are evaluating its impact on the carrying value of our available-for-sale securities and results of operations.
Settlement of Convertible Debt. ASU 2016-15, Statement of Cash Flows: Classification of Certain Cash Receipts and Cash Payments, issued in August 2016, requires that cash settlements of principal amounts of debt instruments with coupon interest rates that are insignificant in relation to the effective interest rate of the debt
118
Table of Contents
Electronics For Imaging, Inc.
Notes to Consolidated Financial Statements—(Continued)
must classify the portion of the principal payment attributable to the accreted interest related to the debt discount as cash outflows from operating activities. This is consistent with the classification of the coupon interest payments.
ASU 2016-15 will be effective in the first quarter of 2018. Accordingly, $63.6 million debt discount attributable to the difference between the 0.75% coupon interest rate on our Notes and the 4.98% effective interest rate will be classified as an operating cash outflow in the Consolidated Statement of Cash Flows upon cash settlement. If we settle the conversion of the Notes in cash on or prior to the maturity date of September 1, 2019, the cash outflow of $63.6 million will be reported in operating activities in the Consolidated Statement of Cash Flows. Debt issuance costs were reported as operating activities in the Consolidated Statement of Cash Flows when they were previously paid.
Restricted Cash. In November 2016, the FASB issued ASU 2016-18, Statement of Cash Flows: Restricted Cash, requiring that the statement of cash flows explain the change in cash, cash equivalents, and amounts generally described as restricted cash or restricted cash equivalents. Therefore, amounts generally described as restricted cash and restricted cash equivalents will be included with cash and cash equivalents when reconciling the beginning-of-period and end-of-period total amounts shown on the statement of cash flows. Under current guidance, changes in restricted cash and restricted cash equivalents are included in operating or investing activities in the Consolidated Statements of Cash Flows.
ASU 2016-18 will be effective in the first quarter of 2018. Changes in restricted cash related to the off-balance sheet financing arrangement described in Note 15—Property and Equipment, net of the Notes to Consolidated Financial Statements will no longer be presented as an investing cash outflow, but will instead be presented as a component of the beginning and ending balance of cash, cash equivalents, and restricted cash in the Consolidated Statements of Cash Flows.
Lease Arrangements. Under current guidance, the classification of a lease by a lessee as either an operating or capital lease determines whether an asset and liability is recognized on the balance sheet. ASU 2016-02, Leases, issued in February 2016 and effective in the first quarter of 2019, requires that a lessee recognize an asset and liability on its balance sheet related to all leases with terms in excess of one year. For all leases, a lessee will be required to recognize a right-of-use asset and a lease liability, initially measured at the present value of the lease payments, in the statement of financial position. The right-to-use asset represents the right to use the underlying asset during the lease term.
The recognition, measurement, and presentation of expenses and cash flows by a lessee will not be significantly changed from previous guidance. There will continue to be a differentiation between finance leases and operating leases. The criteria for determining whether a lease is a financing or operating lease will be substantially the same as existing guidance except that the “bright line” percentages have been removed.
| • | For finance leases, interest is recognized on the lease liability separately from depreciation of the right-of-use asset in the statement of operations. Principal repayments are classified within financing activities and interest payments are classified as operating activities in the statement of cash flows. |
| • | For operating leases, a lessee is required to recognize lease expense generally on a straight-line basis. All operating lease payments are classified as operating activities in the statement of cash flows. |
The current build-to-suit lease accounting guidance will be rescinded by the new guidance, although this guidance will be replaced with guidance restricting lessee control during the construction period. Consequently, the accounting for build-to-suit leases will be the same as operating leases unless the lessee control provisions are applicable.
119
Table of Contents
Electronics For Imaging, Inc.
Notes to Consolidated Financial Statements—(Continued)
We have not quantified the impact, but the requirement to recognize a right-of-use asset and a lease liability related to operating leases will have a material impact on our consolidated financial position as reflected in our Consolidated Balance Sheets. As stated above, the recognition, measurement, and presentation of expenses and cash flows by a lessee will not significantly change from previous guidance; accordingly, the impact on our results of operations as reflected in our Consolidated Statements of Operations is not expected to be material.
Definition of a Business. ASU 2017-01, Business Combinations: Clarifying the Definition of a Business, was issued in January 2017, and significantly narrows how businesses are defined. Under current guidance, a business is defined as an integrated set of assets and activities that usually consists of business processes and their related inputs and outputs. However, business process outputs are not required to be present and only some business process inputs and business processes must be present if the acquiring entity can produce outputs by integrating the acquired set of assets and activities with its own inputs and processes. Essentially, existing guidance only requires that business processes and inputs be present in order to constitute a business.
Under ASU 2017-01, when substantially all of the fair value of the gross assets acquired is concentrated in a single asset or group of similar identifiable assets, then the assets acquired do not constitute a business. If substantially all of the fair value of the gross assets acquired is not concentrated in a single asset or group of similar assets, then the assets acquired may constitute a business if certain criteria are met. We must determine whether the acquired gross assets and activities include an input and a “substantive” process that together “significantly” contribute to the ability to create an output. A framework and specific criteria are provided to assist with the evaluation of whether a process is “substantive” and “significantly contributes” to the ability to create an output. “Output” is narrowly defined to be consistent with the description of a performance obligation in the new revenue guidance. Missing inputs and processes may not be replaced by integration with our own inputs and processes under the new guidance.
Our consolidated financial statements may be impacted if an acquisition does not qualify as a business combination after ASU 2017-01 is effective in the first quarter of 2018. Such acquisitions would be accounted for as asset purchases.
Nonfinancial Asset Derecognition. In February 2017, the FASB issued ASU 2017-05, Other Income—Gains and Losses from the Derecognition of Nonfinancial Assets: Clarifying the Scope of Asset Derecognition and Accounting for Partial Sales of Nonfinancial Assets, which clarifies the scope of recent guidance as it relates to nonfinancial asset derecognition and the accounting for partial sales of nonfinancial assets. The ASU conforms the derecognition guidance as it relates to nonfinancial assets with the derecognition guidance in the new revenue standard (ASU 2014-09) and is expected to have a material impact on the accounting for real estate dispositions.
ASU 2017-05 will be effective in the first quarter of 2018. We have elected to adopt the modified retrospective method of implementation.
Stock Compensation Modification. In May 2017, the FASB issued ASU 2017-09, Stock Compensation—Scope of Modification Accounting, which clarifies the scope of modification accounting for share-based payment arrangements. Specifically, an entity would not apply modification accounting if the fair value, vesting conditions, and classification of the awards are the same immediately before and after the modification.
ASU 2017-09 will be effective in the first quarter of 2018. We will adopt this guidance prospectively to awards modified on or after the adoption date. We do not believe this guidance will materially impact our results of operations.
Hedge Accounting. In August 2017, the FASB issued ASU 2017-12, Targeted Improvements to Accounting for Hedging Activities, which amends the hedge accounting recognition and presentation requirements in ASC 815, Derivatives and Hedging.
120
Table of Contents
Electronics For Imaging, Inc.
Notes to Consolidated Financial Statements—(Continued)
Our foreign currency derivative contracts include notional amounts of $3.9 million that have been designated as cash flow hedges of our Indian rupee operating expense exposure at December 31, 2017. Under current guidance, changes in the fair value of the effective portion of these contracts are reported as a component of OCI and reclassified to operating expense in the periods of payment of the hedged cash flows. The ineffective portion is recognized as a component of interest income and other income, net. Under the new guidance, the entire change in the fair value of hedging instruments designated as cash flow hedges that are included in the assessment of hedge effectiveness will be recorded in OCI. Those amounts are reclassified to earnings in the periods of payment in the same income statement line item as the hedged operating expenses. Upon adoption, a cumulative-effect adjustment will be required to charge the ineffective portion of derivative contracts designated as cash flow hedges existing at the date of adoption to accumulated OCI with a corresponding adjustment to the retained earnings as of the beginning of the fiscal year of the adoption.
The new guidance continues to require an initial prospective quantitative hedge effectiveness assessment unless the hedging relationship qualifies for the critical-terms-match method or facts and circumstances method, which permit an assumption of perfect hedge effectiveness. After the initial quantitative assessment, the new guidance permits a qualitative ongoing effectiveness assessment for certain hedges if we can reasonably support an expectation of high effectiveness throughout the term of the hedge. The new guidance also requires additional disclosure related to the effect on the income statement of cash flow hedges.
ASU 2017-12 will be effective in the first quarter of 2019. We do not believe this guidance will materially impact our results of operations.
Supplemental Disclosure of Cash Flow Information
| For the years ended December 31, | ||||||||||||
| (in thousands) | 2017 | 2016 | 2015 | |||||||||
| Net cash paid for income taxes |
$ | 23,279 | $ | 6,812 | $ | 8,512 | ||||||
|
|
|
|
|
|
|
|||||||
| Cash paid for interest expense |
$ | 3,174 | $ | 2,975 | $ | 2,945 | ||||||
|
|
|
|
|
|
|
|||||||
| Acquisitions of businesses and technology: |
||||||||||||
| Cash paid for businesses and technology purchased, excluding contingent consideration |
$ | 30,230 | $ | 21,560 | $ | 82,446 | ||||||
| Cash acquired in business acquisitions |
(671 | ) | (1,628 | ) | (7,680 | ) | ||||||
|
|
|
|
|
|
|
|||||||
| Net cash paid for business acquisitions |
$ | 29,559 | $ | 19,932 | $ | 74,766 | ||||||
|
|
|
|
|
|
|
|||||||
| Common stock issued in connection with business acquisitions |
$ | — | $ | 73 | $ | 36,567 | ||||||
|
|
|
|
|
|
|
|||||||
| Non-cash investing and financing activities: |
||||||||||||
| Non-cash settlement of employee-related liabilities by issuing RSUs |
$ | 1,171 | $ | 3,059 | $ | 1,353 | ||||||
| Property and equipment received, but not paid |
681 | 1,257 | 1,684 | |||||||||
|
|
|
|
|
|
|
|||||||
| $ | 1,852 | $ | 4,316 | $ | 3,037 | |||||||
|
|
|
|
|
|
|
|||||||
Note 2: Earnings Per Share
Net income (loss) per basic common share is computed using the weighted average number of common shares outstanding during the period. Net income (loss) per diluted common share is computed using the weighted average number of common shares and dilutive potential common shares outstanding during the period. Potential common shares result from the assumed exercise of outstanding common stock options having a dilutive effect using the treasury stock method, non-vested shares of restricted stock having a dilutive effect, non-vested
121
Table of Contents
Electronics For Imaging, Inc.
Notes to Consolidated Financial Statements—(Continued)
restricted stock for which the performance criteria have been met, shares to be purchased under our ESPP having a dilutive effect, the assumed release at the beginning of 2017 of shares potentially issued from escrow related to the acquisition of CTI, the assumed issuance at the beginning of 2016 of shares issued from escrow during 2016 related to the acquisition of Reggiani, the assumed conversion of our Notes having a dilutive effect using the treasury stock method when the stock price exceeds the conversion price of the Notes, as well as the dilutive effect of our warrants when the stock price exceeds the warrant strike price. Any potential shares that are anti-dilutive as defined in ASC 260 are excluded from the effect of dilutive securities.
Performance-based and market-based restricted stock and stock options that would be issuable if the end of the reporting period were the end of the vesting period, if the result would be dilutive, are assumed to be outstanding for purposes of determining net income (loss) per diluted common share as of the later of the beginning of the period or the grant date in accordance with ASC 260-10-45-48. Accordingly, performance-based RSUs, which vested on various dates during the years ended December 31, 2017, 2016, and 2015 based on achievement of specified performance criteria related to revenue, cash flows from operating activities, and non-GAAP operating income targets; market-based RSUs, which vested during the year ended December 31, 2015 based on achievement of specified stock prices for defined periods; and performance-based stock options, which vested during the year ended December 31, 2016 based on achievement of specified targets related to non-GAAP return on equity, are included in the determination of net income (loss) per diluted common share as of the beginning of each respective year.
Basic and diluted earnings per share for the years ended December 31, 2017, 2016, and 2015 are reconciled as follows (in thousands, except for per share amounts):
| 2017 | 2016 | 2015 | ||||||||||
| Basic net income (loss) per share: |
||||||||||||
| Net income (loss) available to common shareholders |
$ | (15,345 | ) | $ | 44,949 | $ | 32,199 | |||||
|
|
|
|
|
|
|
|||||||
| Weighted average common shares outstanding |
46,281 | 46,900 | 47,217 | |||||||||
| Basic net income (loss) per share |
$ | (0.33 | ) | $ | 0.96 | $ | 0.68 | |||||
|
|
|
|
|
|
|
|||||||
| Dilutive net income (loss) per share: |
||||||||||||
| Net income (loss) available to common shareholders |
$ | (15,345 | ) | $ | 44,949 | $ | 32,199 | |||||
|
|
|
|
|
|
|
|||||||
| Weighted average common shares outstanding |
46,281 | 46,900 | 47,217 | |||||||||
| Dilutive stock options, restricted stock, and ESPP purchase rights |
— | 897 | 933 | |||||||||
|
|
|
|
|
|
|
|||||||
| Weighted average common shares outstanding for purposes of computing diluted net income (loss) per share |
46,281 | 47,797 | 48,150 | |||||||||
|
|
|
|
|
|
|
|||||||
| Dilutive net income (loss) per share |
$ | (0.33 | ) | $ | 0.94 | $ | 0.67 | |||||
|
|
|
|
|
|
|
|||||||
122
Table of Contents
Electronics For Imaging, Inc.
Notes to Consolidated Financial Statements—(Continued)
Potential shares of common stock that were not included in the determination of diluted net income (loss) per share for the periods presented because the impact of including them would have been anti-dilutive or because their performance conditions have not been met, consisted of the following (in thousands):
| For the years ended December 31, | ||||||||||||
| 2017 | 2016 | 2015 | ||||||||||
| Options |
138 | — | — | |||||||||
| RSUs & PSUs |
692 | 183 | 489 | |||||||||
| ESPP purchase rights |
160 | 10 | 12 | |||||||||
|
|
|
|
|
|
|
|||||||
| Total potential shares of common stock excluded from the computation of diluted earnings per share |
990 | 193 | 501 | |||||||||
|
|
|
|
|
|
|
|||||||
The weighted-average number of common shares outstanding does not include the effect of the potential common shares from conversion of our Notes and exercise of our Warrants, which were issued in September 2014. The effects of these potentially outstanding shares were not included in the calculation of diluted net income (loss) per share because the effect would have been anti-dilutive since the conversion price of the Notes and the strike price of the Warrants exceeded the average market price of our common stock. We have the option to pay cash, issue shares of common stock, or any combination thereof for the aggregate amount due upon conversion of the Notes. Our intent is to settle the principal amount of the Notes in cash upon conversion. As a result, only amounts payable in excess of the principal amount of the Notes are considered in diluted net income (loss) per share under the treasury stock method. The Note Hedges are also not included in the calculation of diluted net income (loss) per share because the effect of any exercise of the Note Hedges would be anti-dilutive. Please refer to Note 7—Convertible Senior Notes, Note Hedges, and Warrants of the Notes to Consolidated Financial Statements for additional information.
Note 3: Business Acquisitions
We acquired FFPS and Generation Digital during 2017, which have been included in our Fiery operating segment, and two business process automation businesses, CRC and Escada, which have been included in our Productivity Software operating segment. Post-acquisition revenue was $27.1 million in 2017 related to these four acquisitions. We acquired Optitex and Rialco during 2016, which have been included in our Productivity Software and Industrial Inkjet operating segments, respectively. Post-acquisition revenue was $19.8 million in 2016 related to these two acquisitions. We acquired Reggiani and Matan during 2015, which have been included in our Industrial Inkjet operating segment, and two business process automation businesses, which have been included in our Productivity Software operating segment. Post-acquisition revenue was $88.4 million in 2015 related to these four acquisitions. Acquisition-related transaction costs were $2.1, $2.2, and $5.5 million during the years ended December 31, 2017, 2016, and 2015, respectively.
These acquisitions were accounted for as purchase business combinations. We allocated the purchase price to the tangible and identifiable intangible assets acquired and liabilities assumed on the basis of their estimated fair value on their respective acquisition dates. Excess purchase consideration was recorded as goodwill. Factors contributing to a purchase price that results in goodwill include, but are not limited to, the retention of research and development personnel with skills to develop future technology, manufacturing capacity in the Industrial Inkjet operating segment, support personnel to provide maintenance services related to the products, a trained sales force capable of selling current and future products, the opportunity to cross-sell products of the acquired businesses to existing customers, the positive reputation of each of these businesses in the market, the opportunity to integrate acquired technology into our products, integration of Generation Digital’s digital textile design workflow with our Fiery textile DFEs and Reggiani digital textile printers linking textile design and
123
Table of Contents
Electronics For Imaging, Inc.
Notes to Consolidated Financial Statements—(Continued)
production, the opportunity to sell Fiery DFEs to FFPS customers, and the opportunity to expand our presence in the DFE market through the synergy of FFPS technology with existing Fiery products, the opportunity to sell our Productivity Software Suite to customers of the acquired businesses, the opportunity to expand our presence in the digital inkjet textile printing market through the acquisition of the Reggiani digital inkjet textile printer business, and the synergy of Optitex technology with Reggiani digital inkjet textile printers. Rialco’s technical and commercial capabilities benefit the Industrial Inkjet operating segment in the sourcing, specification, and purification of high quality dyes and expand our research, development, and innovation base to develop ink for the signage, ceramic, and packaging markets.
We engaged a third party valuation firm to aid management in its analyses of the fair value of these acquired businesses. All estimates, key assumptions, and forecasts were either provided by or reviewed by us. While we chose to utilize a third party valuation firm, the fair value analyses and related valuations represent the conclusions of management and not the conclusions or statements of any third party.
The purchase price allocations for the 2017 purchase business combinations are preliminary and subject to change within the respective measurement periods as valuations are finalized. We expect to continue to obtain information to assist us in finalizing the fair value of the net assets acquired during the respective measurement periods, which end at various dates in 2018. Measurement period adjustments will be recognized in the reporting period in which the adjustment amounts, if any, are determined.
2017 Acquisitions
Fiery Operating Segment
We acquired certain assets comprising the FFPS business from Xerox, a New York corporation headquartered in Norwalk, Connecticut, on January 31, 2017 for cash consideration of $23.9 million consisting of $5.9 million paid at closing, $9.0 million paid in July 2017, and $9.0 million payable in July 2018, which have been discounted at our incremental borrowing rate of 4.98%, resulting in a purchase price of $23.1 million. The FFPS business manufactures and markets the FFPS DFE, which is a DFE that previously competed with our Fiery DFEs and is included in our Fiery operating segment.
We acquired privately held Generation Digital, which is a New York corporation headquartered in New York City, on August 14, 2017 for cash consideration of $3.2 million, net of cash acquired, plus an additional potential future cash earnout, which is contingent on achieving certain revenue and operating profit performance targets during a six-month period followed sequentially by a 12-month period. Generation Digital provides software to textile and fashion designers for the creation and design of prints and patterns, color matching, and color palette creation and management. Generation Digital will be integrated into the Fiery operating segment.
The fair value of the earnout related to the Generation Digital acquisition is currently estimated to be $3.6 million at December 31, 2017, by applying the income approach in accordance with ASC 805-30-25-5. Key assumptions include a risk-free discount rate of 2.83% and probability-adjusted revenue and operating profit levels. Probability-adjusted revenue and operating profit are significant inputs that are not observable in the market, which ASC 820-10-35 refers to as a Level 3 inputs. This contingent liability is reflected in our Consolidated Balance Sheet as of December 31, 2017, as a current and noncurrent liability of $1.0 and $2.6 million, respectively, with the first payment due in the third quarter of 2018, if earned. In accordance with ASC 805-30-35-1, changes in the fair value of contingent consideration subsequent to the acquisition date are recognized in general and administrative expenses.
124
Table of Contents
Electronics For Imaging, Inc.
Notes to Consolidated Financial Statements—(Continued)
Productivity Software Operating Segment
We acquired privately held CRC and Escada, which have been included in our Productivity Software operating segment, for cash consideration of approximately $19.5 million, net of cash acquired, plus an additional potential future cash earnout related to Escada, which is contingent on Escada achieving certain revenue and operating profit performance targets over two consecutive 12-month periods.
CRC is a Michigan corporation headquartered in Scottsdale, Arizona, which was acquired from Reynolds, an Ohio corporation headquartered in Dayton, Ohio, on May 8, 2017. CRC provides business process automation software for label and packaging printers for commercial businesses and is included in the Midmarket Print Suite within our Productivity Software operating segment.
Escada Innovations Limited, a private limited company incorporated in England and Wales and Escada Systems, Inc., a Delaware corporation headquartered in Decatur, Georgia (collectively, “Escada”) was acquired on October 1, 2017. Escada provides corrugator control systems for the corrugated packaging market, which provide comprehensive control and traceability for the entire corrugated packaging process. Escada will be integrated into the Productivity Software operating segment.
The fair value of the earnout related to the Escada acquisition is currently estimated to be $2.1 million at December 31, 2017, by applying the income approach in accordance with ASC 805-30-25-5, Business Combinations. Key assumptions include a risk-free discount rate of 2.97% and probability-adjusted revenue and operating profit levels. Probability-adjusted revenue and operating profit are significant inputs that are not observable in the market, which ASC 820-10-35 refers to as Level 3 inputs. This contingent liability is reflected in our Consolidated Balance Sheet as of December 31, 2017, as a noncurrent liability with the first payment due in the first quarter of 2019, if earned. In accordance with ASC 805-30-35-1, changes in the fair value of contingent consideration subsequent to the acquisition date are recognized in general and administrative expenses.
2016 Acquisitions
Industrial Inkjet Operating Segment
Rialco, a private limited liability company incorporated in England and Wales and headquartered in Bradford, U.K., was acquired on March 1, 2016 for cash consideration of $8.4 million, net of cash acquired, plus an additional potential future cash earnout, which is contingent on achieving certain revenue and gross profit performance targets over three consecutive 12-month periods. Rialco is a leading European supplier of dye powders and color products for the textile, digital print, and other decorating industries. Rialco’s pure disperse dyes are particularly important in the manufacture of high-quality dye sublimation inkjet ink for textile applications, which is a key growth area in the global migration from analog to digital print. Rialco has been included in the Industrial Inkjet operating segment.
The fair value of the earnout related to the Rialco acquisition is estimated to be $3.4 million at December 31, 2017, by applying the income approach in accordance with ASC 805-30-25-5, adjusted for the impact of post-acquisition foreign currency translation changes. Key assumptions include a risk-free discount rate of 0.8% and probability-adjusted revenue and gross profit levels. Probability-adjusted revenue and gross profit are significant inputs that are not observable in the market, which ASC 820-10-35 refers to as Level 3 inputs. This contingent liability is reflected in the Consolidated Balance Sheet as of December 31, 2017, as a current and noncurrent liability of $1.3 and $2.1 million, respectively, if earned. In accordance with ASC 805-30-35-1, changes in the fair value of contingent consideration subsequent to the acquisition date are recognized in general and administrative expenses.
125
Table of Contents
Electronics For Imaging, Inc.
Notes to Consolidated Financial Statements—(Continued)
Productivity Software Operating Segment
Optitex, a privately-held Israeli company headquartered in Rosh Ha’Ayin, Israel, was acquired on June 16, 2016 for cash consideration of $11.6 million, net of cash acquired, plus an additional potential future cash earnout, which is contingent on achieving certain revenue and operating profit performance targets over three consecutive 12-month periods. Optitex has developed and markets integrated 2D and 3D CAD software that is shortening the design cycle, reducing our customers’ costs, and accelerating the adoption of fast fashion. Optitex has been included in the Productivity Software operating segment.
The fair value of the earnout related to the Optitex acquisition is estimated to be $20.9 million at December 31, 2017, by applying the income approach in accordance with ASC 805-30-25-5, adjusted for the impact of post-acquisition foreign currency translation changes. Key assumptions include a risk-free discount rate of 3.39% and probability-adjusted revenue and operating profit levels. Probability-adjusted revenue and operating profit are significant inputs that are not observable in the market, which ASC 820-10-35 refers to as Level 3 inputs. This contingent liability is reflected in the Consolidated Balance Sheet as of December 31, 2017, as a current and noncurrent liability of $9.1 and $11.8 million, respectively, if earned. In accordance with ASC 805-30-35-1, changes in the fair value of contingent consideration subsequent to the acquisition date are recognized in general and administrative expenses.
2015 Acquisitions
Industrial Inkjet Operating Segment
On July 1, 2015, we acquired privately-held Reggiani, a societa per azioni headquartered in Bergamo, Italy, and privately-held Matan, an Israeli company headquartered in Rosh Ha’Ayin, Israel, which have been included in the Industrial Inkjet operating segment.
We purchased Matan for cash consideration of approximately $38.9 million, net of cash acquired. Matan super-wide format digital inkjet roll-to-roll printers, including advanced material handling features such as in-line cutting and slitting, expand our offerings in this market.
We purchased Reggiani for cash consideration of approximately $26.6 million, net of cash acquired, the issuance of 0.6 million shares of EFI common stock valued at $26.9 million, plus a potential future cash earnout, which is contingent on achieving certain revenue and EBIT performance targets over consecutive 18 and 12-month periods. Reggiani industrial digital inkjet textile printers address the full scope of advanced textile printing with versatile printers suitable for pigmented, reactive dye, acid dye, water-based dispersed printing ink, and coatings. This acquisition expanded our presence in the digital inkjet textile printing market.
The fair value of the earnout related to the Reggiani acquisition was fully settled during 2017. Earnout payments of $21.5 and $23.8 million were accelerated into 2017 and 2016, respectively.
Productivity Software Operating Segment
We acquired privately-held CTI and Shuttleworth, which have been included in our Productivity Software operating segment, for aggregate cash consideration of $9.3 million, net of cash acquired, the issuance of 0.2 million shares of EFI common stock valued at $9.7 million, plus a potential future cash earnout, which is contingent on achieving certain performance targets.
CTI, a California limited liability company headquartered in San Diego, California, was acquired on October 6, 2015 and provides manufacturing execution software for the corrugated packaging industry, including business and management capabilities, with a customer base including sheet feeders, sheet plants, and full corrugated box plants.
126
Table of Contents
Electronics For Imaging, Inc.
Notes to Consolidated Financial Statements—(Continued)
Shuttleworth, a private limited liability company incorporated in England and Wales and headquartered in Kettering, U.K., was acquired on November 4, 2015, and provides business process automation solutions to the signage and packaging digital print industries. Support and operations of Shuttleworth were included in the Productivity Software operating segment, which provides Pace, Monarch, and Radius products to the Shuttleworth customer base, while continuing to support existing Shuttleworth customers.
The fair value of the CTI and Shuttleworth earnouts are estimated to be $5.6 million at December 31, 2017, by applying the income approach in accordance with ASC 805-30-25-5. Key assumptions include risk-free discount rates of 0.6% to 1.3% and probability-adjusted revenue levels. Probability-adjusted revenue is a significant input that is not observable in the market, which ASC 820-10-35, refers to as a Level 3 input. This contingent liability is reflected in the Consolidated Balance Sheet as of December 31, 2017, as a current and noncurrent liability of $3.4 and $2.2 million, respectively.
Valuation Methodologies
Intangible assets acquired in 2017, 2016, and 2015 consist of customer relationships, the Master Purchasing Agreement (the “Purchasing Agreement”) with Xerox, “take-or-pay” contractual penalty with Xerox, trade names, existing technology, backlog, and IPR&D. The intangible asset valuation methodologies for each acquisition assumes discount rates between 14% and 30%.
Customer Relationships and Backlog were valued using the excess earnings method, which is an income approach. The value of customer relationships lies in the generation of a consistent and predictable revenue source and the avoidance of costs associated with developing the relationships. Customer relationships were valued by estimating the revenue attributable to existing customer relationships and probability-weighting each forecast year to reflect the uncertainty of maintaining existing relationships based on historical attrition rates.
Backlog represents unfulfilled customer purchase orders at the acquisition date that will provide a relatively secure revenue stream, subject only to potential customer cancellation.
Trade Names were valued using the relief from royalty method, which is an income approach, with royalty rates based on various factors including an analysis of market data, comparable trade name agreements, and historical advertising dollars spent supporting the trade name.
Existing Technology was generally valued using the relief from royalty method based on royalty rates for similar technologies. The value of existing technology is derived from consistent and predictable revenue, including the opportunity to cross-sell to existing customers and the avoidance of the costs associated with developing the technology. Revenue related to existing technology was adjusted in each forecast year to reflect the evolution of the technology and the cost of sustaining research and development required to maintain the technology.
Rialco existing technology was valued using the cost approach. The value of existing technology is estimated based on the historical time and cost to develop the technology, the estimated man-years required to recreate the technology, historical employee compensation and benefits, and a reasonable mark-up based on profit for companies with similar operations.
Purchasing Agreement was valued using the excess earnings method, which is an income approach. The Purchasing Agreement entered into with Xerox states that we will be Xerox’s preferred supplier of DFEs provided that we meet quality, cost, delivery, and services requirements. The value of the Purchasing Agreement lies in the generation of a consistent and predictable revenue source without incurring the costs normally required
127
Table of Contents
Electronics For Imaging, Inc.
Notes to Consolidated Financial Statements—(Continued)
to acquire the Purchasing Agreement. The Purchasing Agreement was valued by estimating the revenue attributable to the Purchasing Agreement and probability-weighting each forecast year to reflect the uncertainty of maintaining the existing relationship with Xerox beyond the initial five-year term of the agreement.
Take-or-pay Contract was valued using the Monte Carlo method, which is an income approach. If Xerox’s purchases of Fiery and FFPS DFEs during each of four consecutive 12-month periods is less than the minimum level defined for each purchase period, then Xerox shall make a one-time payment in an amount equal to a percentage of such shortfall compared to the minimum level, subject to the maximum payment amount agreed between the parties for each purchase period. Key assumptions include a risk-free discount rate of 4.98%, asset volatility of 27%, and probability-adjusted DFE revenue. If Xerox’s purchases of Fiery and FFPS DFEs exceed the minimum purchase levels defined for each purchase period, then we will pay a percentage of such excess to Xerox.
IPR&D was valued using the relief from royalty method by estimating the cost to develop purchased IPR&D into commercially viable products, estimating the net cash flows resulting from the sale of those products, and discounting the net cash flows back to their present value. Project schedules were based on management’s estimate of tasks completed and tasks to be completed to achieve technical and commercial feasibility.
| FFPS | Matan | Reggiani | CTI | Shuttleworth | ||||||||||||||||
| Discount rate for IPR&D |
20 | % | 16 | % | 21 | % | 18 | % | 20 | % | ||||||||||
| IPR&D percent complete at acquisition date |
63 | % | 33 | % | 70 | % | 75 | % | 17 | % | ||||||||||
| IPR&D percent complete at December 31, 2017 |
100 | % | 100 | % | 100 | % | 100 | % | 100 | % | ||||||||||
| Acquisition-date valuation (in thousands) |
$ | 70 | $ | 3,190 | $ | 10,879 | $ | 150 | $ | 555 | ||||||||||
IPR&D is subject to amortization after product completion over the product life or otherwise assessed for impairment in accordance with acquisition accounting guidance. Additional costs incurred to complete IPR&D after the acquisition are expensed.
The allocation of the purchase price to the assets acquired and liabilities assumed (in thousands) with respect to each of these acquisitions at their respective acquisition dates is summarized as follows:
| 2017 Acquisitions | ||||||||||||||||||||||||
| Fiery | Productivity Software | |||||||||||||||||||||||
| FFPS | Generation Digital | CRC and Escada | ||||||||||||||||||||||
| Weighted average useful life |
Purchase Price Allocation |
Weighted average useful life |
Purchase Price Allocation |
Weighted average useful life |
Purchase Price Allocation |
|||||||||||||||||||
| Purchasing agreement |
10 years | $ | 9,330 | — | $ | — | — | $ | — | |||||||||||||||
| Take-or-pay contract |
4 years | 9,000 | — | — | — | — | ||||||||||||||||||
| Customer relationships |
— | — | 8 years | 3,030 | 7-9 years | 5,240 | ||||||||||||||||||
| Existing technology |
2 years | 2,570 | 5 years | 890 | 4-6 years | 5,870 | ||||||||||||||||||
| Trade names |
5 years | 1,020 | 5 years | 290 | 4-5 years | 850 | ||||||||||||||||||
| IPR&D |
< one year | 70 | — | — | — | — | ||||||||||||||||||
| Backlog |
— | — | — | — | one year | 191 | ||||||||||||||||||
| Goodwill |
— | 6,590 | — | 3,012 | — | 11,632 | ||||||||||||||||||
|
|
|
|
|
|
|
|||||||||||||||||||
| 28,580 | 7,222 | 23,783 | ||||||||||||||||||||||
| Net tangible assets (liabilities) |
(5,537 | ) | (298 | ) | (3,738 | ) | ||||||||||||||||||
|
|
|
|
|
|
|
|||||||||||||||||||
| Total purchase price |
$ | 23,043 | $ | 6,924 | $ | 20,045 | ||||||||||||||||||
|
|
|
|
|
|
|
|||||||||||||||||||
128
Table of Contents
Electronics For Imaging, Inc.
Notes to Consolidated Financial Statements—(Continued)
| 2016 Acquisitions | 2015 Acquisitions | |||||||||||||||||||||||||||||||||||||||
| Industrial Inkjet | Productivity Software |
Industrial Inkjet | Productivity Software |
|||||||||||||||||||||||||||||||||||||
| Rialco | Optitex | Matan | Reggiani | CTI and Shuttleworth |
||||||||||||||||||||||||||||||||||||
| Weighted average useful life |
Purchase Price Allocation |
Weighted average useful life |
Purchase Price Allocation |
Weighted average useful life |
Purchase Price Allocation |
Weighted average useful life |
Purchase Price Allocation |
Weighted average useful life |
Purchase Price Allocation |
|||||||||||||||||||||||||||||||
| Customer relationships |
6 years | $ | 2,512 | 3-4 years | $ | 8,890 | 6 years | $ | 6,630 | 4 years | $ | 12,187 | 3-4 years | $ | 5,001 | |||||||||||||||||||||||||
| Existing technology |
5 years | 846 | 5 years | 7,760 | 5 years | 8,790 | 4 years | 33,118 | 5 years | 5,634 | ||||||||||||||||||||||||||||||
| Trade names |
5 years | 763 | 4 years | 2,020 | 5 years | 2,570 | 5 years | 11,964 | 4 years | 1,357 | ||||||||||||||||||||||||||||||
| IPR&D |
— | — | — | — | — | 3,190 | — | 10,879 | — | 705 | ||||||||||||||||||||||||||||||
| Backlog |
< one year | 56 | < one year | 370 | < one year | 70 | < one year | 704 | < one year | 132 | ||||||||||||||||||||||||||||||
| Goodwill |
1,426 | 28,147 | 26,609 | 61,341 | 17,790 | |||||||||||||||||||||||||||||||||||
|
|
|
|
|
|
|
|
|
|
|
|||||||||||||||||||||||||||||||
| 5,603 | 47,187 | 47,859 | 130,193 | 30,619 | ||||||||||||||||||||||||||||||||||||
| Net tangible assets (liabilities) |
5,177 | (11,924 | ) | (4,945 | ) | (32,571 | ) | (3,611 | ) | |||||||||||||||||||||||||||||||
|
|
|
|
|
|
|
|
|
|
|
|||||||||||||||||||||||||||||||
| Total purchase price |
$ | 10,780 | $ | 35,263 | $ | 42,914 | $ | 97,622 | $ | 27,008 | ||||||||||||||||||||||||||||||
|
|
|
|
|
|
|
|
|
|
|
|||||||||||||||||||||||||||||||
The initial preliminary purchase price allocations were adjusted by $0.7, $0.8, and $3.8 million during 2017, 2016, and 2015, respectively, primarily related to certain current assets and deferred tax liabilities. Pro forma results of operations have not been presented because they are not material to our Consolidated Statements of Operations for the years ended December 31, 2017 and 2016.
Goodwill represents the excess of the purchase price over the net tangible and intangible assets acquired. Goodwill that was generated by our acquisitions of Reggiani, CTI, Shuttleworth, Rialco, CRC and Escada is not deductible for tax purposes. Goodwill that was generated by our acquisitions of FFPS and Generation Digital is deductible for tax purposes. Goodwill that was generated by our acquisitions of Optitex and Matan is deductible for U.S. tax purposes, but is not deductible for tax purposes in Israel.
Escada and Rialco generate revenue and incur operating expenses primarily in British pounds sterling. Upon consideration of the salient economic indicators discussed in ASC 830-10-55-5, we consider British pounds sterling to be the functional currency for Escada and Rialco. Optitex generates revenue and incurs operating expenses primarily in Israeli shekels. Upon consideration of the salient economic indicators, we consider the Israeli shekel to be the functional currency for Optitex.
Note 4: Balance Sheet Components
Inventories
Inventories as of December 31, 2017 and 2016 are as follows (in thousands):
| 2017 | 2016 | |||||||
| Raw materials |
$ | 57,061 | $ | 45,798 | ||||
| Work in process |
9,792 | 7,362 | ||||||
| Finished goods |
58,960 | 43,178 | ||||||
|
|
|
|
|
|||||
| Total |
$ | 125,813 | $ | 96,338 | ||||
|
|
|
|
|
|||||
129
Table of Contents
Electronics For Imaging, Inc.
Notes to Consolidated Financial Statements—(Continued)
Accrued and Other Liabilities
Accrued and other liabilities as of December 31, 2017 and 2016 are as follows (in thousands):
| 2017 | 2016 | |||||||
| Accrued compensation and benefits |
$ | 29,113 | $ | 31,714 | ||||
| Contingent consideration—current |
14,922 | 19,244 | ||||||
| Warranty provision—current |
12,931 | 10,054 | ||||||
| Debt assumed through business acquisitions |
11,101 | 98 | ||||||
| Accrued royalty payments |
4,903 | 4,994 | ||||||
| Accrued litigation and consulting |
4,277 | 1,916 | ||||||
| Technology transfer |
3,593 | 3,822 | ||||||
| Hedging liability |
3,281 | 258 | ||||||
| Deferred rent |
2,846 | 2,938 | ||||||
| Sales tax liabilities |
2,574 | 1,997 | ||||||
| Restructuring and other |
2,452 | 1,824 | ||||||
| Other accrued liabilities |
6,097 | 6,646 | ||||||
|
|
|
|
|
|||||
| Total |
$ | 98,090 | $ | 85,505 | ||||
|
|
|
|
|
|||||
Accumulated Other Comprehensive Income (Loss) (“OCI”)
OCI classified within stockholders’ equity in our Consolidated Balance Sheets as of December 31, 2017 and 2016 are as follows (in thousands):
| 2017 | 2016 | |||||||
| Net unrealized investment losses |
$ | (697 | ) | $ | (473 | ) | ||
| Currency translation gains (losses) |
8,794 | (24,111 | ) | |||||
| Net unrealized gains on cash flow hedges |
41 | 9 | ||||||
|
|
|
|
|
|||||
| Total |
$ | 8,138 | $ | (24,575 | ) | |||
|
|
|
|
|
|||||
There were $0.1 and less than $0.1 million, net of tax, reclassified out of OCI for the years ended December 31, 2017 and 2015, respectively, consisting of unrealized gains and losses from investments in debt securities reported within interest income and other income (expense), net, in our Consolidated Statements of Operations. There were no amounts reclassified out of OCI for the year ended December 31, 2016.
130
Table of Contents
Electronics For Imaging, Inc.
Notes to Consolidated Financial Statements—(Continued)
Note 5: Goodwill and Long-Lived Intangible Assets
Purchased Intangible Assets
Our purchased intangible assets resulting from acquisitions are as follows (in thousands, except for weighted average useful life):
| December 31, 2017 | December 31, 2016 | |||||||||||||||||||||||||||||||
| Weighted average useful life (years) |
Gross carrying amount |
Accumulated amortization |
Weighted remaining average useful life (years) |
Net carrying amount |
Gross carrying amount |
Accumulated amortization |
Net carrying amount |
|||||||||||||||||||||||||
| Goodwill |
— | $ | 403,278 | $ | — | — | $ | 403,278 | $ | 359,841 | $ | — | $ | 359,841 | ||||||||||||||||||
|
|
|
|
|
|
|
|
|
|
|
|
|
|
|
|
|
|||||||||||||||||
| Customer relationships and other |
4.6 | $ | 95,862 | $ | (45,862 | ) | 3.6 | $ | 50,000 | $ | 88,557 | $ | (49,527 | ) | $ | 39,030 | ||||||||||||||||
| Existing technology |
4.1 | 196,693 | (149,300 | ) | 2.9 | 47,393 | 173,543 | (122,654 | ) | 50,889 | ||||||||||||||||||||||
| Trademarks and trade names |
4.9 | 72,048 | (46,822 | ) | 5.5 | 25,226 | 67,701 | (38,300 | ) | 29,401 | ||||||||||||||||||||||
| IPR&D |
— | 389 | — | — | 389 | 3,677 | — | 3,677 | ||||||||||||||||||||||||
|
|
|
|
|
|
|
|
|
|
|
|
|
|
|
|
|
|||||||||||||||||
| Amortizable intangible assets |
4.4 | $ | 364,992 | $ | (241,984 | ) | 3.8 | $ | 123,008 | $ | 333,478 | $ | (210,481 | ) | $ | 122,997 | ||||||||||||||||
|
|
|
|
|
|
|
|
|
|
|
|
|
|
|
|
|
|||||||||||||||||
Acquired customer relationships and other, existing technology, and trademarks and trade names are amortized over their estimated useful lives of two to sixteen years using the straight-line method, which approximates the pattern in which the economic benefits of the identified intangible assets are realized. The useful lives of certain amortizable identifiable intangible assets were reduced based on a re-assessment of their useful lives with a $0.2 and $1.6 million impact on amortization expense during 2017 and 2016, respectively. No changes have been made to the useful lives of amortizable identifiable intangible assets in 2015. Aggregate amortization expense was $47.3, $39.6, and $26.5 million for the years ended December 31, 2017, 2016, and 2015, respectively.
IPR&D is subject to amortization after product completion over the product life or otherwise assessed for impairment in accordance with acquisition accounting guidance. There were no impairments of IPR&D recognized during the years ended December 31, 2017, 2016, or 2015.
As of December 31, 2017, future estimated amortization expense for each of the next five years and thereafter related to the amortization of identified intangible assets is as follows (in thousands):
| For the years ended December 31, |
Future amortization expense |
|||
| 2018 |
$ | 43,652 | ||
| 2019 |
35,770 | |||
| 2020 |
19,331 | |||
| 2021 |
7,253 | |||
| 2022 |
5,003 | |||
| Thereafter |
11,999 | |||
|
|
|
|||
| $ | 123,008 | |||
|
|
|
|||
131
Table of Contents
Electronics For Imaging, Inc.
Notes to Consolidated Financial Statements—(Continued)
Goodwill Rollforward
The goodwill rollforward for the years ended December 31, 2017 and 2016 is as follows (in thousands):
| Industrial Inkjet |
Productivity Software |
Fiery | Total | |||||||||||||
| Ending Balance, December 31, 2015 |
$ | 142,183 | $ | 133,128 | $ | 63,482 | $ | 338,793 | ||||||||
|
|
|
|
|
|
|
|
|
|||||||||
| Additions (Rialco and Optitex acquisitions) |
$ | 1,426 | $ | 28,147 | $ | — | $ | 29,573 | ||||||||
| Opening balance sheet adjustments |
(171 | ) | (663 | ) | — | (834 | ) | |||||||||
| Foreign currency adjustments |
(2,370 | ) | (5,137 | ) | (184 | ) | (7,691 | ) | ||||||||
|
|
|
|
|
|
|
|
|
|||||||||
| Ending Balance, December 31, 2016 |
$ | 141,068 | $ | 155,475 | $ | 63,298 | $ | 359,841 | ||||||||
|
|
|
|
|
|
|
|
|
|||||||||
| Additions (FFPS, Generation Digital, CRC, and Escada acquisitions) |
$ | — | $ | 11,632 | $ | 9,602 | $ | 21,234 | ||||||||
| Opening balance sheet adjustments |
— | 10 | 679 | 689 | ||||||||||||
| Foreign currency adjustments |
13,305 | 7,527 | 682 | 21,514 | ||||||||||||
|
|
|
|
|
|
|
|
|
|||||||||
| Ending Balance, December 31, 2017 |
$ | 154,373 | $ | 174,644 | $ | 74,261 | $ | 403,278 | ||||||||
|
|
|
|
|
|
|
|
|
|||||||||
| Accumulated Impairment as of December 31, 2017, recognized in 2008 |
$ | 103,991 | $ | — | $ | — | $ | 103,991 | ||||||||
|
|
|
|
|
|
|
|
|
|||||||||
Goodwill Assessment
ASU 2011-08, Intangibles—Goodwill and Other (ASC 350): Testing Goodwill for Impairment, provides that a simplified analysis of goodwill impairment may be performed consisting of a qualitative assessment to determine whether further impairment testing is necessary. Due to the significant additions to goodwill resulting from the business combinations completed during 2017 and 2016 and because our reporting units are susceptible to fair value fluctuations, we determined that the quantitative analysis should be performed.
A two-step impairment test of goodwill is required by ASC 350-20-35. In the first step, the fair value of each reporting unit is compared to its carrying value. If the fair value exceeds carrying value, goodwill is not impaired and further testing is not required. If the carrying value exceeds fair value, then the second step of the impairment test is required to determine the implied fair value of the reporting unit’s goodwill. The implied fair value of goodwill is calculated by deducting the fair value of all tangible and intangible net assets of the reporting unit, excluding goodwill, from the fair value of the reporting unit as determined in the first step. If the carrying value of the reporting unit’s goodwill exceeds its implied fair value, then an impairment loss must be recorded equal to the difference.
Our goodwill valuation analysis is based on our respective reporting units (Industrial Inkjet, Productivity Software, and Fiery), which are consistent with our operating segments identified in Note 14—Segment Information, Geographic Regions, and Major Customers of the Notes to Consolidated Financial Statements. We determined the fair value of our reporting units as of December 31, 2017 by equally weighting the market and income approaches. Under the market approach, we estimated fair value based on market multiples of revenue or earnings of comparable companies. Under the income approach, we estimated fair value based on a projected cash flow method using a discount rate determined by our management to be commensurate with the risk inherent in our current business model. Based on our valuation results, we have determined that the fair values of our Industrial Inkjet, Productivity Software, and Fiery reporting units exceed their carrying values as of December 31, 2017, by $398.1, $78.7 and $207.9 million, respectively, or 90%, 43%, and 197%, respectively.
132
Table of Contents
Electronics For Imaging, Inc.
Notes to Consolidated Financial Statements—(Continued)
To identify suitable comparable companies under the market approach, consideration was given to the financial condition and operating performance of the reporting unit being evaluated relative to companies operating in the same or similar businesses, potentially subject to corresponding economic, environmental, and political factors and considered to be reasonable investment alternatives. Consideration was given to the investment characteristics of the subject companies relative to those of similar publicly traded companies (i.e., guideline companies), which are actively traded. In applying the Public Company Market Multiple Method, valuation multiples were derived from historical and projected operating data of guideline companies and applied to the appropriate operating data of our reporting units to arrive at an indication of fair value. Five suitable guideline companies were identified for the Industrial Inkjet, reporting unit. Six suitable guideline companies were identified for the Productivity Software and Fiery reporting units, respectively.
As part of this process, we engaged a third party valuation firm to assist management in its analysis. All estimates, key assumptions, and forecasts were either provided by or reviewed by us. While we chose to utilize a third party valuation firm, the impairment analysis and related valuations represent the conclusions of management and not the conclusions or statements of any third party.
Solely for purposes of establishing inputs for the income approach to assess the fair value of the Industrial Inkjet, Productivity Software, and Fiery reporting units, we made the following assumptions:
| • | Industrial Inkjet revenue was comparable in 2017 with 2016. Industrial Inkjet revenue would have been higher by $3.4 million when considering out-of-period adjustments related to certain bill and hold transactions, which were recorded during the year ended December 31, 2017. Industrial Inkjet revenue is assumed to return to historical normalized growth rates during the forecast horizon. |
| • | Productivity Software revenue growth was 3% in 2017 compared with 2016. Productivity Software revenue is assumed to return to historical normalized growth rates during the forecast horizon. |
| • | Fiery revenue declined by 4% in 2017 primarily due to the leading printer manufacturers tightly managing their inventory levels in the first half of 2017, which decreased demand, partially offset by increased inventory levels and increased demand during the second half of 2017. This decrease was partially offset by post-acquisition FFPS revenue, which was acquired in January 2017, and a small amount of Generation Digital revenue, which was acquired in August 2017. Fiery revenue growth of 2% per year is assumed in the forecast horizon commencing in 2019 as printer distributor / manufacturer inventories and end user demand return to normal levels and APAC demand recovers. |
| • | Despite ongoing economic uncertainty, our reporting units’ revenue is assumed to grow at historical normalized rates between 2018 and 2023 for the following primary reasons: |
| ¡ | Our Industrial Inkjet revenue is positioned to outpace the market due to launch of the Nozomi corrugated packaging industrial digital inkjet printer and the ongoing transition from solvent-based to UV curable-based printing and from UV curing to UV/LED curing. This transition is expected to continue through the forecast horizon. |
| ¡ | Our acquisitions of Rialco in 2016 and Reggiani and Matan in 2015 will enable us to continue to achieve historical normalized Industrial Inkjet revenue growth rates through the forecast horizon. |
| ¡ | Our acquisitions of Escada and CRC in 2017, Optitex in 2016, and CTI and Shuttleworth in 2015 will enable us to continue to achieve historical normalized Productivity Software revenue growth rates through the forecast horizon. |
| ¡ | Our acquisition strategy in the Productivity Software reporting unit will enable us to achieve historical normalized revenue growth rates through the forecast horizon. Our intention is to continue to explore additional acquisition opportunities in this operating segment to further |
133
Table of Contents
Electronics For Imaging, Inc.
Notes to Consolidated Financial Statements—(Continued)
| consolidate the business process automation and cloud-based order entry and order management software industries. |
| • | Other assumptions include: |
| ¡ | Long-term industry growth after 2023. |
| ¡ | Gross profit percentages will approximate historical average levels in the Industrial Inkjet, Productivity Software and Fiery reporting units. |
Our discounted cash flow projections are six-year financial forecasts, which were based on annual financial forecasts developed internally by management for use in managing our business and through discussions with the valuation firm engaged by us. The significant assumptions utilized in these six-year financial forecasts included consolidated annual revenue growth rates ranging from 4% to 12% which equates to a consolidated compound annual growth rate of 6%. The upper end of the range exceeds our historical normalized growth rates due to the addition of the Nozomi printer, Reggiani textile, and Optitex software businesses to our portfolio. Future cash flows were discounted to present value using a mid-year convention and a consolidated discount rate of 10.8%. Terminal values were calculated using the Gordon growth methodology with a consolidated long-term growth rate of 4% for Industrial Inkjet and Productivity Software and 2.5% for Fiery. The sum of the fair values of the Industrial Inkjet, Productivity Software, and Fiery reporting units was reconciled to our current market capitalization (based on our stock price) plus an estimated control premium. Percentages of revenue over the six-year forecast horizon were compared to approximate percentages realized by the guideline companies. To assess the reasonableness of the estimated control premium of 8.8%, we examined the most similar transactions in relevant industries and determined the average premium indicated by the transactions deemed to be most similar to a hypothetical transaction involving our reporting units. We examined the weighted average and median control premiums offered in relevant industries, industry specific control premiums, and specific transaction control premiums to conclude that our estimated control premium is reasonable.
We assess the impairment of identifiable intangibles and long-lived assets whenever events or changes in circumstances indicate the carrying value may not be recoverable or the life of the asset may need to be revised. Factors considered important that could trigger an impairment review include:
| • | significant negative industry or economic trends, |
| • | significant decline in our stock price for a sustained period, |
| • | our market capitalization relative to net book value, |
| • | significant changes in the manner of our use of the acquired assets, |
| • | significant changes in the strategy for our overall business, and |
| • | our assessment of growth and profitability in each reporting unit over the coming years. |
Given the uncertainty of the economic environment and the potential impact on our business, there can be no assurance that our estimates and assumptions regarding the duration of the ongoing economic downturn, or the period or strength of recovery, made for purposes of our goodwill impairment testing at December 31, 2017 will prove to be accurate predictions of the future. If our assumptions regarding forecasted revenue or gross profit rates are not achieved, we may be required to record additional goodwill impairment charges in future periods relating to any of our reporting units, whether in connection with the next annual impairment testing in the fourth quarter of 2018 or prior to that, if any such change constitutes an interim triggering event. It is not possible to determine if any such future impairment charge would result or, if it does, whether such charge would be material.
134
Table of Contents
Electronics For Imaging, Inc.
Notes to Consolidated Financial Statements—(Continued)
Long-Lived Assets
We evaluate potential impairment with respect to long-lived assets whenever events or changes in circumstances indicate their carrying amount may not be recoverable. An asset is considered impaired if its carrying amount exceeds the undiscounted future cash flow the asset is expected to generate. An impairment loss is recorded for long-lived assets held-for-sale when the carrying amount of the asset exceeds its fair value less cost to sell. A long-lived asset is not depreciated while it is classified as held-for-sale.
We recorded an impairment loss of $0.9 million during the year ended December 31, 2017 related to the Meredith manufacturing facility and related land, For additional information, please refer to Note 15 – Property and Equipment, net, for details. There were no asset impairment charges recognized during the years ended December 31, 2016 and 2015.
Note 6: Investments and Fair Value Measurements
We invest our excess cash on deposit with major banks in money market, U.S. Treasury and government-sponsored entity, corporate, municipal government, asset-backed, and mortgage-backed residential securities. By policy, we invest primarily in high-grade marketable securities. We are exposed to credit risk in the event of default by the financial institutions or issuers of these investments to the extent of amounts recorded in our Consolidated Balance Sheets.
We consider all highly liquid investments with an original maturity of three months or less at the time of purchase to be cash equivalents. Typically, the cost of these investments has approximated fair value. Marketable investments with a maturity greater than three months are classified as available-for-sale short-term investments. Available-for-sale securities are stated at fair value with unrealized gains and losses reported as a separate component of OCI, adjusted for deferred income taxes. The credit portion of any other-than-temporary impairment is included in net income (loss). Realized gains and losses on sales of financial instruments are recognized upon sale of the investments using the specific identification method.
Our available-for-sale short-term investments as of December 31, 2017 and 2016 are as follows (in thousands):
| Amortized cost | Gross unrealized gains |
Gross unrealized losses |
Fair value | |||||||||||||
| December 31, 2017 |
||||||||||||||||
| U.S. Government and sponsored entities |
$ | 59,824 | $ | — | $ | (660 | ) | $ | 59,164 | |||||||
| Corporate debt securities |
79,356 | — | (450 | ) | 78,906 | |||||||||||
| Municipal securities |
382 | — | (2 | ) | 380 | |||||||||||
| Asset-backed securities |
9,808 | 44 | (47 | ) | 9,805 | |||||||||||
| Mortgage-backed securities—residential |
445 | — | (3 | ) | 442 | |||||||||||
|
|
|
|
|
|
|
|
|
|||||||||
| Total short-term investments |
$ | 149,815 | $ | 44 | $ | (1,162 | ) | $ | 148,697 | |||||||
|
|
|
|
|
|
|
|
|
|||||||||
| December 31, 2016 |
||||||||||||||||
| U.S. Government and sponsored entities |
$ | 70,893 | $ | 49 | $ | (348 | ) | $ | 70,594 | |||||||
| Corporate debt securities |
198,166 | 102 | (621 | ) | 197,647 | |||||||||||
| Municipal securities |
1,278 | — | (1 | ) | 1,277 | |||||||||||
| Asset-backed securities |
24,233 | 79 | (17 | ) | 24,295 | |||||||||||
| Mortgage-backed securities—residential |
1,615 | 3 | (3 | ) | 1,615 | |||||||||||
|
|
|
|
|
|
|
|
|
|||||||||
| Total short-term investments |
$ | 296,185 | $ | 233 | $ | (990 | ) | $ | 295,428 | |||||||
|
|
|
|
|
|
|
|
|
|||||||||
135
Table of Contents
Electronics For Imaging, Inc.
Notes to Consolidated Financial Statements—(Continued)
The fair value and duration that investments, including cash equivalents, have been in a gross unrealized loss position as of December 31, 2017 and 2016 are as follows (in thousands):
| Less than 12 Months | More than 12 Months | TOTAL | ||||||||||||||||||||||
| December 31, 2017 |
Fair Value |
Unrealized Losses |
Fair Value |
Unrealized Losses |
Fair Value |
Unrealized Losses |
||||||||||||||||||
| U.S. Government and sponsored entities |
$ | 23,023 | $ | (206 | ) | $ | 35,989 | $ | (454 | ) | $ | 59,012 | $ | (660 | ) | |||||||||
| Corporate debt securities |
45,857 | (207 | ) | 32,634 | (243 | ) | 78,491 | (450 | ) | |||||||||||||||
| Municipal securities |
378 | (2 | ) | — | — | 378 | (2 | ) | ||||||||||||||||
| Asset-backed securities |
6,779 | (31 | ) | 2,947 | (16 | ) | 9,726 | (47 | ) | |||||||||||||||
| Mortgage-backed securities—residential |
162 | (2 | ) | 142 | (1 | ) | 304 | (3 | ) | |||||||||||||||
|
|
|
|
|
|
|
|
|
|
|
|
|
|||||||||||||
| Total |
$ | 76,199 | $ | (448 | ) | $ | 71,712 | $ | (714 | ) | $ | 147,911 | $ | (1,162 | ) | |||||||||
|
|
|
|
|
|
|
|
|
|
|
|
|
|||||||||||||
| December 31, 2016 |
||||||||||||||||||||||||
| U.S. Government and sponsored entities |
$ | 39,810 | $ | (348 | ) | $ | — | $ | — | $ | 39,810 | $ | (348 | ) | ||||||||||
| Corporate debt securities |
133,382 | (581 | ) | 13,158 | (40 | ) | 146,540 | (621 | ) | |||||||||||||||
| Municipal securities |
1,268 | (1 | ) | — | — | 1,268 | (1 | ) | ||||||||||||||||
| Asset-backed securities |
4,540 | (7 | ) | 4,611 | (10 | ) | 9,151 | (17 | ) | |||||||||||||||
| Mortgage-backed securities—residential |
428 | (1 | ) | 153 | (2 | ) | 581 | (3 | ) | |||||||||||||||
|
|
|
|
|
|
|
|
|
|
|
|
|
|||||||||||||
| Total |
$ | 179,428 | $ | (938 | ) | $ | 17,922 | $ | (52 | ) | $ | 197,350 | $ | (990 | ) | |||||||||
|
|
|
|
|
|
|
|
|
|
|
|
|
|||||||||||||
For fixed income securities that have unrealized losses as of December 31, 2017, we have determined that we do not have the intent to sell any of these investments and it is not more likely than not that we will be required to sell any of these investments before recovery of the entire amortized cost basis. We have evaluated these fixed income securities and determined that no credit losses exist. Accordingly, management has determined that the unrealized losses on our fixed income securities as of December 31, 2017 were temporary in nature.
Amortized cost and estimated fair value of investments at December 31, 2017 are summarized by maturity date as follows (in thousands):
| Amortized cost | Fair value | |||||||
| Mature in less than one year |
$ | 43,862 | $ | 43,741 | ||||
| Mature in one to three years |
105,953 | 104,956 | ||||||
|
|
|
|
|
|||||
| Total short-term investments |
$ | 149,815 | $ | 148,697 | ||||
|
|
|
|
|
|||||
For the years ended December 31, 2017 and 2016, net realized gains of $0.3 and $0.4 million were recognized, which were comprised of $0.3 and $0.4 million in realized gains from sales of investments, respectively, partially offset by less than $0.1 million in realized losses. For the year ended December 31, 2015, net realized gains of $0.1 million were recognized. As of December 31, 2017, and 2016, net unrealized losses of $1.1 and $0.8 million, respectively, were included in OCI in the accompanying Consolidated Balance Sheets.
Fair Value Measurements
ASC 820 identifies fair value as the exchange price, or exit price, representing the amount that would be received to sell an asset or paid to transfer a liability in an orderly transaction between market participants. As a basis for considering market participant assumptions in fair value measurements, ASC 820 establishes a three-tier fair value hierarchy as follows:
Level 1: Inputs that are quoted prices in active markets for identical assets or liabilities that the reporting entity has the ability to access at the measurement date;
136
Table of Contents
Electronics For Imaging, Inc.
Notes to Consolidated Financial Statements—(Continued)
Level 2: Inputs that are other than quoted prices included within Level 1, that are either directly or indirectly observable for the asset or liability through correlation with market data at the measurement date for the duration of the instrument’s anticipated life or by comparison to similar instruments; and
Level 3: Inputs that are unobservable or that reflect management’s best estimate of what market participants would use in pricing the asset or liability at the measurement date. These include management’s own judgments about market participant assumptions developed based on the best information available in the circumstances.
We utilize the market approach to measure the fair value of our fixed income securities. The market approach is a valuation technique that uses prices and other relevant information generated by market transactions involving identical or comparable assets or liabilities. The fair value of our fixed income securities is obtained using readily-available market prices from a variety of industry standard data providers, large financial institutions, and other third-party sources for the identical underlying securities. The fair value of our investments in certain money market funds is expected to maintain a Net Asset Value of $1 per share and, as such, is priced at the expected market price.
We obtain the fair value of our Level 2 financial instruments from several third party asset managers, custodian banks, and accounting service providers. Independently, these service providers use professional pricing services to gather pricing data, which may include quoted market prices for identical or comparable instruments or inputs other than quoted prices that are observable either directly or indirectly. As part of this process, we utilized these pricing services to assist management in its pricing analysis and assessment of other-than-temporary impairment. All estimates, key assumptions, and forecasts were either provided by or reviewed by us. While we chose to utilize a third party pricing service, the impairment analysis and related valuations represent conclusions of management and not conclusions or statements of any third party.
137
Table of Contents
Electronics For Imaging, Inc.
Notes to Consolidated Financial Statements—(Continued)
Our investments and liabilities measured at fair value have been presented in accordance with the fair value hierarchy specified in ASC 820 as of December 31, 2017 and 2016 in order of liquidity as follows (in thousands):
| Total | Quoted Prices in Active Markets for Identical Assets (Level 1) |
Significant other Observable Inputs (Level 2) |
Unobservable Inputs (Level 3) |
|||||||||||||
| December 31, 2017 |
||||||||||||||||
| Assets: |
||||||||||||||||
| Money market funds |
$ | 9,897 | $ | 9,897 | $ | — | $ | — | ||||||||
| U.S. Government and sponsored entities |
59,164 | 33,261 | 25,903 | — | ||||||||||||
| Corporate debt securities |
78,906 | — | 78,906 | — | ||||||||||||
| Municipal securities |
380 | — | 380 | — | ||||||||||||
| Asset-backed securities |
9,805 | — | 9,754 | 51 | ||||||||||||
| Mortgage-backed securities—residential |
442 | — | 442 | — | ||||||||||||
|
|
|
|
|
|
|
|
|
|||||||||
| $ | 158,594 | $ | 43,158 | $ | 115,385 | $ | 51 | |||||||||
|
|
|
|
|
|
|
|
|
|||||||||
| Liabilities: |
||||||||||||||||
| Contingent consideration, current and noncurrent |
$ | 35,702 | $ | — | $ | — | $ | 35,702 | ||||||||
| Self-insurance |
902 | — | — | 902 | ||||||||||||
|
|
|
|
|
|
|
|
|
|||||||||
| $ | 36,604 | $ | — | $ | — | $ | 36,604 | |||||||||
|
|
|
|
|
|
|
|
|
|||||||||
| December 31, 2016 |
||||||||||||||||
| Assets: |
||||||||||||||||
| Money market funds |
$ | 23,575 | $ | 23,575 | $ | — | $ | — | ||||||||
| U.S. Government and sponsored entities |
70,594 | 51,870 | 18,724 | — | ||||||||||||
| Corporate debt securities |
197,647 | — | 197,647 | — | ||||||||||||
| Municipal securities |
1,277 | — | 1,277 | — | ||||||||||||
| Asset-backed securities |
24,295 | — | 24,228 | 67 | ||||||||||||
| Mortgage-backed securities—residential |
1,615 | — | 1,615 | — | ||||||||||||
|
|
|
|
|
|
|
|
|
|||||||||
| $ | 319,003 | $ | 75,445 | $ | 243,491 | $ | 67 | |||||||||
|
|
|
|
|
|
|
|
|
|||||||||
| Liabilities: |
||||||||||||||||
| Contingent consideration, current and noncurrent |
$ | 56,463 | $ | — | $ | — | $ | 56,463 | ||||||||
| Self-insurance |
1,542 | — | — | 1,542 | ||||||||||||
|
|
|
|
|
|
|
|
|
|||||||||
| $ | 58,005 | $ | — | $ | — | $ | 58,005 | |||||||||
|
|
|
|
|
|
|
|
|
|||||||||
Money market funds have been classified as cash equivalents on the Consolidated Balance Sheets as of December 31, 2017 and 2016, respectively.
Investments are generally classified within Level 1 or Level 2 of the fair value hierarchy because they are valued using quoted market prices or alternative pricing sources with reasonable levels of price transparency. Investments in U.S. Treasury obligations and overnight money market mutual funds have been classified as Level 1 because these securities are valued based on quoted prices in active markets or are actively traded at $1.00 Net Asset Value. There have been no transfers between Level 1 and 2 during the years ended December 31, 2017 and 2016.
Government agency investments and corporate debt instruments, including investments in asset-backed and mortgage-backed securities, have generally been classified as Level 2 because markets for these securities are
138
Table of Contents
Electronics For Imaging, Inc.
Notes to Consolidated Financial Statements—(Continued)
less active or valuations for such securities utilize significant inputs which are directly or indirectly observable. We hold asset-backed securities with income payments derived from and collateralized by a specified pool of underlying assets. Asset-backed securities in the portfolio are predominantly collateralized by credit cards and auto loans. We also had two asset-backed securities collateralized by residential mortgage loans, which have been fully reserved.
Liabilities for Contingent Consideration
Acquisition-related liabilities for contingent consideration (i.e., earnouts) are related to the purchase business combinations of Generation Digital and Escada in 2017; Optitex and Rialco in 2016; Shuttleworth, CTI, and Reggiani in 2015; DIMS, DirectSmile, and SmartLinc in 2014; Metrix and PrintLeader Software (“PrintLeader”) in 2013.
The fair value of these earnouts is estimated to be $35.7 and $56.5 million as of December 31, 2017 and 2016, respectively, by applying the income approach in accordance with ASC 805-30-25-5. Key assumptions include risk-free discount rates between 0.6% and 4.98% (Monte Carlo valuation method) and discount rates between 4.7% and 6.0% (probability-adjusted method), as well as probability-adjusted revenue and EBIT levels. Probability-adjusted revenue, gross margin, and EBIT are significant inputs that are not observable in the market, which ASC 820-10-35 refers to as Level 3 inputs. These contingent liabilities have been reflected in the Consolidated Balance Sheet as of December 31, 2017 as current and noncurrent liabilities of $14.9 and $20.8 million, respectively.
The fair value of contingent consideration increased by $6.5 million, including $1.7 million of earnout interest accretion, related to all acquisitions during the year ended December 31, 2017. The Optitex, CTI and Rialco earnout performance probabilities increased while the Shuttleworth earnout performance probability decreased in 2017. The fair value of contingent consideration increased by $6.8 million, including $2.7 million of earnout interest accretion related to all acquisitions during the year ended December 31, 2016. The Rialco, Optitex, Reggiani, DirectSmile, and CTI earnout performance probabilities increased while the DIMS and Shuttleworth earnout performance probabilities decreased or were not achieved in 2016. In accordance with ASC 805-30-35-1, changes in the fair value of contingent consideration subsequent to the acquisition date have been recognized in general and administrative expense.
Earnout payments and settlements during the year ended December 31, 2017 of $21.5, $6.8, $1.3, and $1.2 million are primarily related to the previously accrued Reggiani, Optitex, Rialco, and Shuttleworth contingent consideration liabilities, respectively. Earnout payments during the year ended December 31, 2016 of $23.8, $3.6, $0.4, and $0.2 million are primarily related to the previously accrued Reggiani, DirectSmile, SmartLinc, and Metrix contingent consideration liabilities, respectively.
139
Table of Contents
Electronics For Imaging, Inc.
Notes to Consolidated Financial Statements—(Continued)
Changes in the contingent liability for contingent consideration during the years ended December 31, 2017 and 2016 are summarized as follows
| Amount | ||||
| Fair value of contingent consideration at December 31, 2015 |
$ | 54,796 | ||
| Fair value of Rialco contingent consideration at March 1, 2016 |
2,109 | |||
| Fair value of Optitex contingent consideration at June 16, 2016 |
22,300 | |||
| Changes in valuation |
6,813 | |||
| Payments |
(28,111 | ) | ||
| Foreign currency adjustment |
(1,444 | ) | ||
|
|
|
|||
| Fair value of contingent consideration at December 31, 2016 |
$ | 56,463 | ||
| Fair value of Generation Digital contingent consideration at August 14, 2017 |
3,600 | |||
| Fair value of Escada contingent consideration at October 1, 2017 |
2,049 | |||
| Escrow adjustment for Reggiani acquisition |
(4,711 | ) | ||
| Changes in valuation |
6,472 | |||
| Payments and settlements |
(30,924 | ) | ||
| Foreign currency adjustment |
2,753 | |||
|
|
|
|||
| Fair value of contingent consideration at December 31, 2017 |
$ | 35,702 | ||
|
|
|
|||
A narrative description of the sensitivity of recurring fair value measurements to changes in unobservable inputs is required if a change in those inputs might result in a significantly higher or lower fair value measurement. Since the primary inputs to the fair value measurement of the contingent consideration liability are the probability-adjusted revenue and discount rate, we reviewed the sensitivity of the fair value measurement to changes in these inputs. We assessed the probability of achieving the revenue performance targets for the contingent consideration associated with each acquisition at percentage levels between 50% and 100% as of each respective acquisition date based on an assessment of the historical performance of each acquired entity, our current expectations of future performance, and other relevant factors. A change in probability-adjusted revenue of five percentage points from the level assumed in the current valuations would result in an increase in the fair value of contingent consideration of $2.0 million or a decrease of $2.5 million resulting in a corresponding adjustment to general and administrative expense. A change in the discount rate of one percentage point would result in an increase or decrease in the fair value of contingent consideration of $0.4 million. The potential undiscounted amount of future contingent consideration cash payments that we could be required to make related to our business acquisitions, beyond amounts currently accrued, is $12.0 million as of December 31, 2017.
Fair Value of Derivative Instruments
We utilize the income approach to measure the fair value of our derivative assets and liabilities. The income approach uses pricing models that rely on market observable inputs such as yield curves, currency exchange rates, and forward prices, and are therefore classified as Level 2 measurements. The notional amount of our derivative assets and liabilities was $239.4 and $161.8 million as of December 31, 2017 and 2016, respectively. The fair value of our derivative assets and liabilities that were designated for cash flow hedge accounting treatment having notional amounts of $3.9 and $3.2 million as of December 31, 2017 and 2016, respectively, was not material.
Fair Value of Convertible Senior Notes
In September 2014, we issued $345 million aggregate principal amount of Notes. The Notes are carried at their original issuance value, net of unamortized debt discount, and are not marked to market each period. The fair
140
Table of Contents
Electronics For Imaging, Inc.
Notes to Consolidated Financial Statements—(Continued)
value of the Notes as of December 31, 2017 was approximately $335 million and was considered a Level 2 fair value measurement. Fair value was estimated based upon actual quotations obtained at the end of the reporting period or the most recent date available. A substantial portion of the market value of our Notes in excess of the outstanding principal amount relates to the conversion premium.
Note 7: Convertible Senior Notes, Note Hedges, and Warrants
0.75% Convertible Senior Notes Due 2019
In September 2014, we completed a private placement of $345 million principal amount of 0.75% Convertible Senior Notes due 2019 (“Notes”). The Notes were sold to the initial purchasers for resale to qualified institutional buyers pursuant to Rule 144A under the Securities Act of 1933, as amended. The net proceeds from this offering were approximately $336.3 million, after deducting the initial purchasers’ commissions and the offering expenses paid by us. We used approximately $29.4 million of the net proceeds to purchase the Note Hedges described below, net of the proceeds from the Warrant transactions also described below.
The Notes are senior unsecured obligations of EFI with interest payable semiannually in arrears on March 1 and September 1 of each year, commencing March 1, 2015. The Notes are not callable and will mature on September 1, 2019, unless previously purchased or converted in accordance with their terms prior to such date. Holders of the Notes who convert in connection with a “fundamental change,” as defined in the indenture governing the Notes (“Indenture”), may require us to purchase for cash all or any portion of their Notes at a purchase price equal to 100 percent of the principal amount of the Notes to be repurchased, plus accrued and unpaid interest, if any.
The initial conversion rate is 18.9667 shares of common stock per $1,000 principal amount of Notes, which is equivalent to an initial conversion price of approximately $52.72 per share of common stock. Upon conversion of the Notes, holders will receive cash, shares of common stock or a combination thereof, at our election. Our intent is to settle the principal amount of the Notes in cash upon conversion. If the conversion value exceeds the principal amount, we would deliver shares of our common stock for our conversion obligation in excess of the aggregate principal amount. As of December 31, 2017, none of the conditions allowing holders of the Notes to convert had been met.
Throughout the term of the Notes, the conversion rate may be adjusted upon the occurrence of certain events. Holders of the Notes will not receive any cash payment representing accrued and unpaid interest upon conversion of a Note. Holders may convert their Notes only under the following circumstances:
| • | if the last reported sale price of our common stock for at least 20 trading days (whether or not consecutive) during a period of 30 consecutive trading days ending on the last trading day of the immediately preceding calendar quarter is greater than or equal to 130% of the conversion price on each applicable trading day; |
| • | during the five business day period after any five consecutive trading day period (“Notes Measurement Period”) in which the “trading price” (as the term is defined in the Indenture) per $1,000 principal amount of notes for each trading day of such Notes Measurement Period was less than 98% of the product of the last reported stock price on such trading day and the conversion rate on each such trading day; |
| • | upon the occurrence of specified corporate events; or |
| • | at any time on or after March 1, 2019 until the close of business on the second scheduled trading day immediately preceding the maturity date. |
141
Table of Contents
Electronics For Imaging, Inc.
Notes to Consolidated Financial Statements—(Continued)
We separated the Notes into liability and equity components. The carrying amount of the liability component was calculated by measuring the estimated fair value of a similar liability that does not have an associated convertible feature. The carrying amount of the equity component representing the conversion option was determined by deducting the fair value of the liability component from the face value of the Notes as a whole. The excess of the principal amount of the liability component over its carrying amount (“debt discount”) is amortized to interest expense over the term of the Notes using the effective interest method with an effective interest rate of 4.98% per annum (5.46% inclusive of debt issuance costs). The equity component is not remeasured as long as it continues to meet the conditions for equity classification.
We allocated the total transaction costs incurred by the Notes issuance to the liability and equity components based on their relative values. Issuance costs of $7.0 million attributable to the $281.4 million liability component are being amortized to expense over the term of the Notes, and issuance costs of $1.6 million attributable to the $63.6 million equity component were offset against the equity component in stockholders’ equity. Additionally, we recorded a deferred tax liability of $23.7 million on the debt discount, which is not deductible for tax purposes.
The Notes consist of the following at December 31, 2017 and 2016 (in thousands):
| 2017 | 2016 | |||||||
| Liability component |
$ | 345,000 | $ | 345,000 | ||||
| Debt discount, net of amortization |
(23,178 | ) | (36,115 | ) | ||||
| Debt issuance costs, net of amortization |
(2,865 | ) | (4,401 | ) | ||||
|
|
|
|
|
|||||
| Net carrying amount |
$ | 318,957 | $ | 304,484 | ||||
|
|
|
|
|
|||||
| Equity component |
$ | 63,643 | $ | 63,643 | ||||
| Less: debt issuance costs allocated to equity |
(1,582 | ) | (1,582 | ) | ||||
|
|
|
|
|
|||||
| Net carrying amount |
$ | 62,061 | $ | 62,061 | ||||
|
|
|
|
|
|||||
Interest expense recognized related to the Notes during the years ended December 31, 2017, 2016, and 2015 was as follows (in thousands):
| 2017 | 2016 | 2015 | ||||||||||
| 0.75% coupon |
$ | 2,580 | $ | 2,588 | $ | 2,595 | ||||||
| Amortization of debt issuance costs |
1,536 | 1,350 | 1,396 | |||||||||
| Amortization of debt discount |
12,937 | 12,400 | 11,667 | |||||||||
|
|
|
|
|
|
|
|||||||
| Interest expense on Convertible Senior Notes |
$ | 17,053 | $ | 16,338 | $ | 15,658 | ||||||
|
|
|
|
|
|
|
|||||||
Note Hedges
We paid an aggregate of $63.9 million in convertible note hedge transactions with respect to our common stock (“Note Hedges”) in September 2014. The Note Hedges will expire upon maturity of the Notes. The Note Hedges are intended to offset the potential dilution upon conversion and/or offset any cash payments we are required to make in excess of the principal amount upon conversion of the Notes in the event that the market value per share of our common stock, as measured under the terms of the Note Hedges, is greater than the strike price of the Note Hedges. The strike price of the Note Hedges initially corresponds to the conversion price of the Notes and is subject to anti-dilution adjustments substantially similar to those applicable to the conversion price of the Notes. The Note Hedges are separate transactions and are not part of the Notes. Holders of the Notes will not have any rights with respect to the Note Hedges.
142
Table of Contents
Electronics For Imaging, Inc.
Notes to Consolidated Financial Statements—(Continued)
Warrants
Concurrently with entering into the Note Hedges, we separately entered into warrant transactions (“Warrants”), whereby we sold warrants to acquire shares of our common stock at a strike price of $68.86 per share. We received aggregate proceeds of $34.5 million from the sale of the Warrants. If the average market value per share of our common stock for the reporting period, as measured under the Warrants, exceeds the strike price of the Warrants, the Warrants will have a dilutive effect on our earnings per share. The Warrants are separate transactions and are not part of the Notes or the Note Hedges and are accounted for as a component of additional paid-in capital. Holders of the Notes and Note Hedges will not have any rights with respect to the Warrants.
Note 8: Commitments and Contingencies
Contingent Consideration
We are required to make payments to the former stockholders of acquired companies based on the achievement of specified performance targets as more fully explained in Note 6—Investments and Fair Value Measurements.
Purchase Commitments
We subcontract with other companies to manufacture our products. During the normal course of business, our subcontractors procure components based on orders placed by us. If we cancel all or part of our orders, we may still be liable to the subcontractors for the cost of the components they purchased to manufacture our products. We periodically review the potential liability compared to the adequacy of the related allowance.
Lease Commitments
As of December 31, 2017, we lease certain of our current facilities and vehicles under noncancellable operating lease agreements. We are required to pay property taxes, insurance, and nominal maintenance costs for certain of these facilities and vehicles and any increases over the base year of these expenses on the remainder of our facilities and vehicle leases.
Future minimum lease payments under noncancellable operating leases, including build-to-suit leases, and future minimum sublease receipts, for each of the next five years and thereafter as of December 31, 2017 are as follows (in thousands):
| Fiscal Year |
Future Minimum Lease Payments |
Future Minimum Sublease Receipts |
||||||
| 2018 |
$ | 9,114 | $ | 434 | ||||
| 2019 |
7,574 | 231 | ||||||
| 2020 |
7,415 | 27 | ||||||
| 2021 |
6,028 | — | ||||||
| 2022 |
4,225 | — | ||||||
| Thereafter |
32,268 | — | ||||||
|
|
|
|
|
|||||
| Total |
$ | 66,624 | $ | 692 | ||||
|
|
|
|
|
|||||
Facilities rent expense was approximately $8.1, $8.8, and $8.0 million for the years ended December 31, 2017, 2016, and 2015, respectively. Vehicle rent expense was approximately $2.8, $2.8, and $2.5 million for the years ended December 31, 2017, 2016, and 2015, respectively.
143
Table of Contents
Electronics For Imaging, Inc.
Notes to Consolidated Financial Statements—(Continued)
Guarantees and Product Warranties
Guarantees must be disclosed upon issuance and a liability recognized for the fair value of obligations we assume under such guarantees in accordance with ASC 460, Guarantees, which applies to both general guarantees and product warranties.
Our Industrial Inkjet printers are generally accompanied by a 13-month limited warranty, commencing on the installation date, which covers both parts and labor. Our Fiery DFE products limited warranty is generally 12 to 15 months. In accordance with ASC 450-30, an accrual is established when the warranty liability is estimable and probable based on historical experience. A provision for the estimated warranty costs relating to products that have been sold is recorded in cost of revenue upon recognition of revenue and the resulting accrual is reviewed regularly and periodically adjusted to reflect changes in warranty estimates. We have agreed to continue to provide warranty coverage for certain expired FFPS warranties for five years subsequent to the acquisition of the FFPS business.
The changes in product warranty reserve for the years ended December 31, 2017 and 2016 were as follows (in thousands):
| 2017 | 2016 | |||||||
| Balance at January 1, |
$ | 10,319 | $ | 9,635 | ||||
| Liability assumed upon acquiring FFPS |
10,362 | — | ||||||
| Provisions, net of releases |
13,487 | 12,715 | ||||||
| Settlements |
(17,833 | ) | (12,031 | ) | ||||
|
|
|
|
|
|||||
| Balance at December 31, |
$ | 16,335 | $ | 10,319 | ||||
|
|
|
|
|
|||||
Indemnifications
In the normal course of business and in an effort to facilitate the sales of our products, we sometimes indemnify other parties, including customers, lessors, and parties to other transactions with us. When we indemnify these parties, typically those provisions protect other parties against losses arising from our infringement of third party intellectual property rights or other claims made by third parties arising from the use or distribution of our products. Those provisions often contain various limitations including limits on the amount of protection provided.
As permitted under Delaware law, pursuant to our bylaws, charter, and indemnification agreements with our current and former executive officers, directors, and general counsel, we are required, subject to certain limited qualifications, to indemnify our executive officers, directors, and general counsel for certain events or occurrences while the executive officer, director, or general counsel is or was serving at our request in such capacity. The indemnification period covers all pertinent events and occurrences during the executive officer’s, director’s, or general counsel’s lifetime. The maximum potential future payments we may be obligated to make under these indemnification agreements is unlimited; however, we have director and officer insurance coverage that limits our exposure and may enable us to recover a portion of any future amounts paid.
Legal Proceedings
We may be involved, from time to time, in a variety of claims, lawsuits, investigations, or proceedings relating to contractual disputes, securities laws, intellectual property rights, employment, or other matters that may arise in the normal course of business. We assess our potential liability in each of these matters by using the information available to us. We develop our views on estimated losses in consultation with inside and outside counsel, which
144
Table of Contents
Electronics For Imaging, Inc.
Notes to Consolidated Financial Statements—(Continued)
involves a subjective analysis of potential results and various combinations of appropriate litigation and settlement strategies. We accrue estimated losses from contingencies if a loss is deemed probable and can be reasonably estimated.
As of December 31, 2017, we are subject to the matters discussed below.
MDG Matter
EFI acquired Matan in 2015 from sellers (the “2015 Sellers”) that acquired MDG from other sellers in 2001 (the “2001 Sellers”). The 2001 Sellers have asserted a claim against the 2015 Sellers and Matan asserting that they are entitled to a portion of the 2015 Sellers’ proceeds from EFI’s acquisition. The 2015 Sellers dispute any such claim and have fully indemnified EFI against the 2001 Sellers’ claim.
Although we are fully indemnified and we do not believe that it is probable that we will incur a loss, it is reasonably possible that our financial statements could be materially affected by an unfavorable resolution of this matter. Accordingly, it is reasonably possible that we could incur a material loss in this matter. We estimate the range of loss to be between one dollar and $10.1 million. If we incur a loss in this matter, it will be offset by a receivable of an equal amount representing a claim for indemnification against the escrow account established in connection with the Matan acquisition.
Purported Class Action Lawsuit
On August 10, 2017, a putative class action was filed against the Company and its two named executive officers in the United States District Court for the District of New Jersey, captioned Pipitone v. Electronics For Imaging, Inc., No. 2:17-cv-05992 (D.N.J.) and a first amended complaint was filed on February 20, 2018. The complaint alleges, among other things, that statements by the Company and its officers about the Company’s financial reporting, revenue recognition, internal controls, and disclosure controls and procedures were false or misleading. The complaint seeks an unspecified amount of damages, interest, attorneys’ fees, and other costs, on behalf of a putative class of individuals and entities that purchased or otherwise acquired EFI securities from February 22, 2017 through August 3, 2017.
At this time, we do not believe it is probable that we will incur a material loss in this matter. However, it is reasonably possible that our financial statements could be materially affected by an unfavorable resolution of this matter. Because this matter is in the preliminary stages, we are not yet in a position to estimate the amount or range of reasonably possible loss that may be incurred.
Shareholder Derivative Lawsuit
On August 22, 2017, a shareholder derivative complaint was filed in the Superior Court of the State of California for the County of Alameda captioned Schiffmiller v. Gecht, No. RG17873197. The complaint makes claims derivatively and on behalf of the Company as nominal defendant against the Company’s named executive officers and directors for alleged breaches of fiduciary duties and unjust enrichment, and alleges, among other things, that statements by the Company and its officers about the Company’s financial reporting, revenue recognition, internal controls, and disclosure controls and procedures were false or misleading. The complaint alleges the Company has suffered damage as a result of the individual defendants’ alleged actions, and seeks an unspecified amount of damages, restitution, and declaratory and other relief. The derivative action has been stayed pending the resolution of the Pipitone class action described above.
At this time, we do not believe it is probable that we will incur a material loss in this matter. However, it is reasonably possible that our financial statements could be materially affected by an unfavorable resolution of this
145
Table of Contents
Electronics For Imaging, Inc.
Notes to Consolidated Financial Statements—(Continued)
matter. Because this matter has been stayed pending resolution of the Pipitone class action described above, we are not yet in a position to estimate the amount or range of reasonably possible loss that may be incurred.
Other Matters
As of December 31, 2017, we were subject to various other claims, lawsuits, investigations, and proceedings in addition to the matters discussed above. There is at least a reasonable possibility that additional losses may be incurred in excess of the amounts that we have accrued. However, we believe that these claims are not material to our financial statements or the range of reasonably possible losses is not reasonably estimable. Litigation is inherently unpredictable, and while we believe that we have valid defenses with respect to legal matters pending against us, our financial statements could be materially affected in any particular period by the unfavorable resolution of one or more of these contingencies or because of the diversion of management’s attention and the incurrence of significant expenses.
Note 9: Common Stock Repurchase Programs
On November 9, 2015, the board of directors approved the repurchase of $150 million of outstanding common stock commencing January 1, 2016. On September 11, 2017, the board of directors approved the repurchase of an additional $125 million for our share repurchase program commencing September 11, 2017. At that time, $28.8 million remained available for repurchase under the 2015 authorization. The 2017 authorization thereby increased the repurchase authorization to $153.8 million of our common stock. This authorization expires December 31, 2018. Under these publicly announced plans, we repurchased 2.4 and 1.8 million shares for an aggregate purchase price of $91.4 and $74.2 million during the years ended December 31, 2017 and 2016, respectively.
Our employees have the option to surrender shares of common stock to satisfy their tax withholding obligations that arise on the vesting of RSUs. In connection with stock option exercises, certain employees can surrender shares to satisfy the exercise price of certain stock options and any tax withholding obligations incurred in connection with such exercises. Employees surrendered 0.2 million shares for an aggregate purchase price of $10.5 and $9.1 million during the years ended December 31, 2017 and 2016, respectively
These repurchased and surrendered shares reduce shares outstanding and are recorded as treasury stock under the cost method thereby reducing stockholders’ equity by the cost of the repurchased shares. Our buyback program is limited by SEC regulations and is subject to compliance with our insider trading policy.
Note 10: Derivatives and Hedging
We are exposed to market risk and foreign currency exchange risk from changes in foreign currency exchange rates, which could affect operating results, financial position, and cash flows. We manage our exposure to these risks through our regular operating and financing activities and, when appropriate, through the use of derivative financial instruments. These derivative financial instruments are used to hedge monetary assets and liabilities, intercompany balances, trade receivables, anticipated cash flows, and to reduce earnings and cash flow volatility resulting from shifts in foreign currency exchange rates. Our objective is to offset gains and losses resulting from these exposures with losses and gains on the derivative contracts used to hedge them, thereby reducing volatility of earnings or protecting fair values of assets and liabilities. We do not have any leveraged derivatives, nor do we use derivative contracts for speculative purposes. ASC 815 requires the fair value of all derivative instruments, including those embedded in other contracts, to be recorded as assets or liabilities in our Consolidated Balance Sheet. The related cash flow impacts of our derivative contracts are reflected as cash flows from operating activities.
146
Table of Contents
Electronics For Imaging, Inc.
Notes to Consolidated Financial Statements—(Continued)
Our exposures are primarily related to non-U.S. dollar-denominated revenue in Europe, the U.K., Latin America, China, Israel, and Australia, and to non-U.S. dollar-denominated operating expenses in Europe, India, Japan, the U.K., China, Israel, Brazil, and Australia. We hedge our operating expense cash flow exposure in Indian rupees. We hedge balance sheet remeasurement exposure associated with British pound sterling, Brazilian real, Israeli shekel, Japanese yen, Chinese renminbi, and Euro-denominated intercompany balances; Brazilian real, British pound sterling, Australian dollar, Israeli shekel, and Euro-denominated trade receivables; and British pound sterling, Indian rupee, Israeli shekel, and Euro-denominated-denominated net monetary assets.
By their nature, derivative instruments involve, to varying degrees, elements of market and credit risk. The market risk associated with these instruments resulting from currency exchange movement is expected to offset the market risk of the underlying transactions, assets, and liabilities being hedged (i.e., operating expense exposure in Indian rupees; the collection of trade receivables denominated in currencies other than their respective reporting entity’s functional currency, and the settlement of intercompany balances denominated in currencies other than their functional currency). Under our master netting agreements with our foreign currency derivative counterparties, we are allowed to net transactions of the same currency with a single net amount payable by one party to the other. The derivatives held by us are not subject to any credit contingent features negotiated with these counterparties. We are not required to pledge cash collateral related to these foreign currency derivatives because, by policy, we deal with counterparties having a minimum investment grade or better credit rating. Credit risk is managed through the continuous monitoring of exposures to such counterparties.
Cash Flow Hedges
Foreign currency derivative contracts with notional amounts of $3.9 and $3.2 million and net asset/liability amounts that are immaterial have been designated as cash flow hedges of our Indian rupee operating expense exposure at December 31, 2017 and 2016. The changes in fair value of these contracts are reported as a component of OCI and reclassified to operating expense in the periods of payment of the hedged operating expenses. The ineffective portion of the derivative hedging gain or loss, as well as changes in the derivative time value (which is excluded from the assessment of hedge effectiveness), are recognized as a component of interest income and other income (expense), net.
Balance Sheet Hedges
Forward contracts not designated as hedging instruments with notional amounts of $235.5 and $158.7 million are used to hedge foreign currency balance sheet exposures at December 31, 2017 and 2016, respectively. They are not designated for hedge accounting treatment since there is a natural offset for the remeasurement of the underlying foreign currency denominated asset or liability. We recognize changes in the fair value of non-designated derivative instruments in earnings in the period of change. Gains and losses on foreign currency forward contracts used to hedge balance sheet exposures are recognized in interest income and other income (expense), net, in the same period as the remeasurement gain or loss of the related foreign currency denominated assets and liabilities. Forward contracts not designated for hedge accounting treatment consist of hedges of British pound sterling, Brazilian real, Israeli shekel, Japanese yen, Chinese renminbi, and Euro-denominated intercompany balances with notional amounts of $144.5 and $90.7 million at December 31, 2017 and 2016, respectively, hedges of Brazilian real, British pound sterling, Australian dollar, Israeli shekel, and Euro-denominated trade receivables with notional amounts of $44.4 and $39.8 million at December 31, 2017 and 2016, respectively, and hedges of British pounds sterling, Indian rupee, Israeli shekel, and Euro-denominated other net monetary assets with notional amounts of $46.6 and $28.2 million at December 31, 2017 and 2016, respectively.
147
Table of Contents
Electronics For Imaging, Inc.
Notes to Consolidated Financial Statements—(Continued)
Note 11: Income Taxes
The components of income (loss) before income taxes for the years ended December 31, 2017, 2016, and 2015 are as follows (in thousands):
| 2017 | 2016 | 2015 | ||||||||||
| U.S. |
$ | (27,926 | ) | $ | 8,254 | $ | 9,311 | |||||
| Foreign |
40,056 | 30,394 | 26,257 | |||||||||
|
|
|
|
|
|
|
|||||||
| Total |
$ | 12,130 | $ | 38,648 | $ | 35,568 | ||||||
|
|
|
|
|
|
|
|||||||
The provision for (benefit from) income taxes for the years ended December 31, 2017, 2016, and 2015 is summarized as follows (in thousands):
| 2017 | 2016 | 2015 | ||||||||||
| Current: |
||||||||||||
| U.S. Federal |
$ | 6,897 | $ | (7,593 | ) | $ | 3,755 | |||||
| State |
(2,926 | ) | 662 | 1,813 | ||||||||
| Foreign |
14,751 | 11,721 | 5,798 | |||||||||
|
|
|
|
|
|
|
|||||||
| Total current |
18,722 | 4,790 | 11,366 | |||||||||
|
|
|
|
|
|
|
|||||||
| Deferred: |
||||||||||||
| U.S. Federal |
15,304 | (4,276 | ) | (3,119 | ) | |||||||
| State |
732 | (567 | ) | (583 | ) | |||||||
| Foreign |
(7,283 | ) | (6,248 | ) | (4,295 | ) | ||||||
|
|
|
|
|
|
|
|||||||
| Total deferred |
8,753 | (11,091 | ) | (7,997 | ) | |||||||
|
|
|
|
|
|
|
|||||||
| Provision for (benefit from) income taxes |
$ | 27,475 | $ | (6,301 | ) | $ | 3,369 | |||||
|
|
|
|
|
|
|
|||||||
The reconciliation of the income tax provision (benefit) computed at the federal statutory rate to the actual tax provision (benefit) for the years ended December 31, 2017, 2016, and 2015 is as follows (in thousands):
| 2017 | 2016 | 2015 | ||||||||||||||||||||||
| Tax provision at federal statutory rate |
$ | 4,246 | 35.0 | % | $ | 13,527 | 35.0 | % | $ | 12,449 | 35.0 | % | ||||||||||||
| State income taxes, net of federal benefit |
(1,426 | ) | (11.8 | ) | 62 | 0.2 | 800 | 2.2 | ||||||||||||||||
| Research and development credits |
(1,508 | ) | (12.4 | ) | (2,627 | ) | (6.8 | ) | (4,217 | ) | (11.9 | ) | ||||||||||||
| Effect of foreign operations |
(1,344 | ) | (11.1 | ) | (3,320 | ) | (8.5 | ) | (3,412 | ) | (9.5 | ) | ||||||||||||
| Deemed repatriation transition tax |
16,976 | 139.8 | — | — | — | — | ||||||||||||||||||
| Provision for remeasuring deferred tax balances |
10,450 | 86.1 | — | — | — | — | ||||||||||||||||||
| Reduction in accrual for estimated potential tax assessments |
(1,676 | ) | (13.7 | ) | (15,404 | ) | (39.9 | ) | (4,808 | ) | (13.4 | ) | ||||||||||||
| Non-deductible stock-based compensation pursuant to ASC 718-740 |
1,249 | 10.3 | 1,288 | 3.3 | 3,244 | 9.1 | ||||||||||||||||||
| Domestic manufacturing deduction |
— | — | (831 | ) | (2.2 | ) | (878 | ) | (2.5 | ) | ||||||||||||||
| Meals and entertainment |
500 | 4.1 | 475 | 1.2 | 474 | 1.3 | % | |||||||||||||||||
| Other |
8 | 0.1 | 529 | 1.4 | (283 | ) | (0.8 | ) | ||||||||||||||||
|
|
|
|
|
|
|
|
|
|
|
|
|
|||||||||||||
| Provision for (benefit from) income taxes |
$ | 27,475 | 226.4 | % | $ | (6,301 | ) | (16.3 | )% | $ | 3,369 | 9.5 | % | |||||||||||
|
|
|
|
|
|
|
|
|
|
|
|
|
|||||||||||||
On December 22, 2017, the 2017 Tax Act was enacted by the U.S. government. The 2017 Tax Act made broad and complex changes to the U.S. tax code that impact the year ended December 31, 2017, including, but not
148
Table of Contents
Electronics For Imaging, Inc.
Notes to Consolidated Financial Statements—(Continued)
limited to the deemed repatriation transition tax and the remeasurement of U.S. deferred tax assets and liabilities as a result of the reduction of the U.S. corporate rate from 35% to 21%. The enactment of the 2017 Tax Act requires companies, under ASC 740, to recognize the effects of changes in tax law and rates on deferred tax assets and liabilities and the retroactive effects of changes in tax laws in the period in which the new legislation is enacted. The effects of these changes in tax law are recorded as a component of our tax provision, regardless of the category of pre-tax income or loss to which the deferred taxes relate.
The SEC issued SAB 118, which allows us to record a provisional estimate of the income tax effects of the 2017 Tax Act in the period in which we can make a reasonable estimate of its effects. We have recorded a $27.5 million tax charge in the year ended December 31, 2017 as a provisional estimate. This includes an estimated charge of $17.0 million related to the deemed repatriation transition tax, which is comprised of a gross transition tax of $27.0 million offset by foreign tax credits of $10.0 million. In addition, we have recorded a $10.5 million charge related to the remeasurement of U.S. deferred tax assets and liabilities. While we have calculated a reasonable estimate of the impact of the U.S. tax rate reduction and the amount of the deemed repatriation transition tax, we are gathering additional information to refine and finalize our calculation of the impacts of the 2017 Tax Act on our U.S. deferred tax assets and liabilities, the deemed repatriation transition tax, and other provisions associated with the 2017 Tax Act. As we obtain additional information, we will record adjustments in subsequent periods, and will finalize the calculation of the income tax effects of the 2017 Tax Act in the fourth quarter of 2018, or in an earlier quarter if our analysis is complete.
The 2017 Tax Act also created a minimum tax on certain foreign earnings, also known as the GILTI provision, commencing in the year ending December 31, 2018. Because whether we expect to have future U.S. inclusions in taxable income related to GILTI depends on not only our current structure and estimated future results of global operations, but also our intent and ability to modify our structure and/or our business, we are not yet able to provide a reasonable estimate of the effect of this provision of the 2017 Tax Act. Any subsequent adjustment to the deferred tax amounts related to GILTI (or other computations) will be recorded to current tax expense in the quarter of 2018 when the analysis is complete.
During the year ended December 31, 2017, we recognized a $3.5 million tax benefit (including state tax benefit) from the release of previously unrecognized tax benefits due to the expiration of U.S. federal, state, and foreign statutes of limitations.
We earn a significant amount of our operating income outside the U.S., which is deemed to be permanently reinvested in foreign jurisdictions. Of the income generated in foreign jurisdictions with tax rates materially lower than the statutory U.S. tax rate of 35%, most is earned in the Netherlands, Spain, U.K., Italy, Israel, and the Cayman Islands. Our effective tax rate could fluctuate significantly and be adversely impacted if anticipated earnings in the Netherlands, Spain, U.K., Italy, Israel, and the Cayman Islands are proportionally lower than current projections and earnings in all other jurisdictions are proportionally higher than current projections.
While we currently do not foresee a need to repatriate the earnings of foreign operations, should we require more capital in the U.S. than is generated by our U.S. operations, we may elect to repatriate funds held in our foreign jurisdictions or raise capital in the U.S. through debt or equity issuances. These alternatives could result in higher effective tax rates, the cash payments of taxes and/or increased interest expense. As of December 31, 2017, we have permanently reinvested $214.9 million of unremitted foreign earnings. Due to the changes resulting from the enactment of the 2017 Tax Act, we will not be subject to U.S. federal income tax on dividends received from our foreign subsidiaries commencing January 1, 2018. We are evaluating the potential foreign and U.S. state income tax liabilities that would result from future repatriations, if any, and how the 2017 Tax Act will impact our current permanent reinvestment assertion. We expect to complete this analysis and the impact, if any, which the 2017 Tax Act may have on our indefinite reinvestment assertion in the fourth quarter of 2018, or in an earlier quarter if our analysis is complete.
149
Table of Contents
Electronics For Imaging, Inc.
Notes to Consolidated Financial Statements—(Continued)
In Altera Corp.v. Commissioner, the U.S Tax Court issued an opinion on July 27, 2015, related to the treatment of stock-based compensation expense in an intercompany cost-sharing arrangement. To date, the U.S. Department of the Treasury has not withdrawn the requirement to include stock-based compensation in intercompany cost-sharing arrangements from its regulations. Due to the uncertainty related to the status of the current regulations and the ultimate outcome of the appeal, we have not recorded any benefit as of December 31, 2017 in our Consolidated Statement of Operations. We will continue to monitor ongoing developments and potential impacts to our consolidated financial statements.
The tax effects of temporary differences that give rise to deferred tax assets (liabilities) as of December 31, 2017 and 2016 are as follows (in thousands):
| 2017 | 2016 | |||||||
| Tax credit carryforwards |
$ | 62,096 | $ | 63,985 | ||||
| Net operating loss carryforwards |
9,066 | 10,055 | ||||||
| Reserves and accruals not currently deductible for tax purposes |
8,785 | 14,079 | ||||||
| Stock-based compensation |
3,432 | 8,487 | ||||||
| Deferred revenue |
1,332 | 1,642 | ||||||
| Other |
6,374 | 6,971 | ||||||
|
|
|
|
|
|||||
| Gross deferred tax assets |
91,085 | 105,219 | ||||||
|
|
|
|
|
|||||
| Depreciation and amortization |
(11,075 | ) | (17,845 | ) | ||||
| State Taxes |
(1,073 | ) | (2,092 | ) | ||||
|
|
|
|
|
|||||
| Gross deferred tax liabilities |
(12,148 | ) | (19,937 | ) | ||||
|
|
|
|
|
|||||
| Deferred tax valuation allowance |
(45,506 | ) | (42,406 | ) | ||||
|
|
|
|
|
|||||
| Net deferred tax assets |
$ | 33,431 | $ | 42,876 | ||||
|
|
|
|
|
|||||
We have $13.7 million ($49.5 million for state tax purposes) and $36.3 million ($38.0 million for state tax purposes) of loss and credit carryforwards at December 31, 2017 for U.S. federal tax purposes. A majority of these federal and state losses and credits will expire between 2022 and 2027. A significant portion of these net operating loss and credit carryforwards relate to recent acquisitions. Utilization of these loss and credit carryforwards will be subject to an annual limitation under the Internal Revenue Code (“IRC”). We also have a valuation allowance related to California and Luxembourg deferred tax assets.
We assess the likelihood that our deferred tax assets will be recovered from future taxable income by considering both positive and negative evidence relating to their recoverability. If we believe that recovery of these deferred tax assets is not more likely than not, we establish a valuation allowance. Significant judgment is required in determining any valuation allowance recorded against deferred tax assets. In assessing the need for a valuation allowance, we considered all available evidence, including recent operating results, projections of future taxable income, our ability to utilize loss and credit carryforwards, and the feasibility of tax planning strategies. Other than valuation allowances on deferred tax assets related to California, Luxembourg, Israel, Netherlands, and Turkey deferred tax assets that are not likely to be realized based on the size of the net operating loss and research and development credits being generated, we have determined that it is more likely than not that we will realize the benefit related to all other deferred tax assets. To the extent we increase a valuation allowance, we will include an expense within the tax benefit in the Consolidated Statement of Operations in the period in which such determination is made.
150
Table of Contents
Electronics For Imaging, Inc.
Notes to Consolidated Financial Statements—(Continued)
A reconciliation of the change in the gross unrecognized tax benefits from January 1, 2015 to December 31, 2017 is as follows (in millions):
| Federal, State, and Foreign Tax |
Accrued Interest and Penalties |
Gross Unrecognized Income Tax Benefits |
||||||||||
| Balance at January 1, 2015 |
$ | 34.2 | $ | 0.8 | $ | 35.0 | ||||||
| Additions for tax positions of prior years |
14.1 | 0.2 | 14.3 | |||||||||
| Additions for tax positions related to 2015 |
4.7 | — | 4.7 | |||||||||
| Reductions due to lapse of applicable statute of limitations |
(6.9 | ) | (0.5 | ) | (7.4 | ) | ||||||
|
|
|
|
|
|
|
|||||||
| Balance at December 31, 2015 |
$ | 46.1 | $ | 0.5 | $ | 46.6 | ||||||
|
|
|
|
|
|
|
|||||||
| Additions for tax positions of prior years |
1.8 | 0.2 | 2.0 | |||||||||
| Additions for tax positions related to 2016 |
3.9 | — | 3.9 | |||||||||
| Reductions due to lapse of applicable statute of limitations |
(16.4 | ) | (0.2 | ) | (16.6 | ) | ||||||
|
|
|
|
|
|
|
|||||||
| Balance at December 31, 2016 |
$ | 35.4 | $ | 0.5 | $ | 35.9 | ||||||
|
|
|
|
|
|
|
|||||||
| Additions for tax positions of prior years |
1.7 | 0.3 | 2.0 | |||||||||
| Additions for tax positions related to 2017 |
4.5 | — | 4.5 | |||||||||
| Reductions due to lapse of applicable statute of limitations |
(4.1 | ) | (0.1 | ) | (4.2 | ) | ||||||
|
|
|
|
|
|
|
|||||||
| Balance at December 31, 2017 |
$ | 37.5 | $ | 0.7 | $ | 38.2 | ||||||
|
|
|
|
|
|
|
|||||||
As of December 31, 2017, 2016, and 2015, gross unrecognized benefits that would affect the effective tax rate if recognized were $33.9, $32.0, and $43.5 million, respectively, offset by deferred tax benefits of $0.4, $1.1, and $1.0 million related to the federal tax effect of state income taxes for the same periods. Over the next twelve months, our existing tax positions will continue to generate increased liabilities for unrecognized tax benefits. It is reasonably possible that our gross unrecognized tax benefits will decrease up to $5.5 million in the next twelve months. These adjustments, if recognized, would positively impact our effective tax rate, and would be recognized as additional tax benefits in our Consolidated Statements of Operations.
In accordance with ASU 2013-11, we recorded $16.9 million of gross unrecognized tax benefits as an offset to deferred tax assets as of December 31, 2017, and the remaining $17.0 million has been recorded as noncurrent income taxes payable.
We recognize potential accrued interest and penalties related to unrecognized tax benefits in income tax expense. At December 31, 2017, 2016, and 2015, we have accrued $0.7, $0.5, and $0.5 million, respectively, for potential payments of interest and penalties.
In accordance with ASU 2016-09, which was adopted in the second quarter of 2016, we recorded $2.2 million of deferred tax assets related to excess tax benefits for federal research and development income tax credits not previously benefitted and $0.6 million of deferred tax assets for the tax benefit on the cumulative effect adjustment associated with the change in accounting for RSU forfeitures.
151
Table of Contents
Electronics For Imaging, Inc.
Notes to Consolidated Financial Statements—(Continued)
We are subject to examination by the Internal Revenue Service (“IRS”) for the 2014-2016 tax years, state tax jurisdictions for the 2013-2016 tax years, the Netherlands tax authority for the 2014-2016 tax years, the Spanish tax authority for the 2013-2016 tax years, the Israel tax authority for the 2014-2016 tax years, and the Italian tax authority for the 2013-2016 tax years
Note 12: Employee Benefit Plans
Equity Incentive Plans
As of December 31, 2017, we had outstanding equity awards under our 2017 Equity Incentive Plan and our 2009 Stock Plan. No awards may be granted under our 2009 Stock Plan after June 7, 2017. Our primary equity incentive plans are summarized as follows:
2017 Equity Incentive Plan
Our stockholders approved the 2017 Equity Incentive Plan (“2017 Plan”) on June 7, 2017, which includes:
| • | 1,200,000 shares of our common stock reserved for issuance pursuant to such plan; |
| • | 1,593,660 common stock shares that were available for future grants under the 2009 Equity Incentive Award Plan (“Prior Plan”) immediately prior to termination of authority to grant new awards under the Prior Plan on June 7, 2017; |
| • | shares subject to stock options granted under the Prior Plan and outstanding as of June 7, 2017, which expire, or for any reason are cancelled or terminated, after that date without being exercised; and |
| • | shares subject to restricted stock unit awards granted under the 2009 Plan that are outstanding and unvested as of June 7, 2017 which are forfeited, terminated, cancelled, or otherwise reacquired after that date without having become vested. |
The 2017 Plan provides for grants of stock options (both incentive and nonqualified stock options), restricted stock, stock units, stock bonuses, performance stock, stock appreciation rights, performance stock units, phantom stock, dividend equivalent rights or cash awards. Options and awards generally vest over a period of one to four years from the date of grant and generally expire seven to ten years from the date of the grant. The terms of the 2017 Plan provide that an option price shall not be less than 100% of fair value on the date of the grant. Our board of directors may grant a stock bonus or stock unit award under the 2017 Plan in lieu of all or a portion of any cash bonus that a participant would have otherwise received for the related performance period.
The shares of common stock covered by the 2017 Plan may be treasury shares, authorized but unissued shares, or shares purchased in the open market. If an award under the 2017 Plan is forfeited (including a reimbursement of a non-vested award upon a participant’s termination of employment at a price equal to the par value of the common stock subject to the award) or expired, any shares of common stock subject to the award may be used again for new grants under the 2017 Plan.
The 2017 Plan is administered by the Compensation Committee of the Board of Directors (“Committee”). The Committee has the exclusive authority to administer the 2017 Plan, including the power to (i) designate participants under the 2017 Plan, (ii) determine the types of awards granted to participants under the 2017 Plan, the number of such awards, and the number of shares of our common stock that is subject to such awards, (iii) determine and interpret the terms and conditions of any awards under the 2017 Plan, including the vesting schedule, exercise price, whether to settle or accept the payment of any exercise price, in cash, common stock, other awards, or other property, and whether an award may be cancelled, forfeited, or surrendered, (iv) prescribe the form of each award agreement, and (v) adopt rules for the administration, interpretation, and application of the 2017 Plan.
152
Table of Contents
Electronics For Imaging, Inc.
Notes to Consolidated Financial Statements—(Continued)
Persons eligible to participate in the 2017 Plan include all of our employees, directors, and consultants, as determined by the Committee. As of December 31, 2017, approximately 3,900 employees and consultants and 5 non-employee directors were eligible to participate in the 2017 Plan.
There were 1.0 million shares outstanding and 1.9 million shares available for grant under the 2017 Plan as of December 31, 2017.
2009 Stock Plan
With the adoption of the 2017 Plan, no additional awards may be granted under the 2009 Stock Plan (“2009 Plan”).
The 2009 Plan provided for grants of stock options (both incentive and nonqualified stock options), restricted stock awards, stock appreciation rights, performance shares, performance stock units, dividend equivalents, stock payments, deferred stock, RSUs, and performance-based awards. Options and awards generally vest over a period of one to four years from the date of grant and generally expire seven to ten years from the date of the grant. The terms of the 2009 Plan provide that an option price shall not be less than 100% of fair value on the date of the grant. Our board of directors could grant a stock bonus or stock unit award under the 2009 Plan in lieu of all or a portion of any cash bonus that a participant would have otherwise received for the related performance period.
The shares of common stock covered by the 2009 Plan may be treasury shares, authorized but unissued shares, or shares purchased in the open market. If an award under the 2009 Plan is forfeited, terminated, cancelled, or otherwise reacquired, any shares of common stock subject to the award may be used again for new grants under the 2017 Plan.
There were 1.3, 2.4, and 2.3 million shares outstanding under the 2009 Plan as of December 31, 2017, 2016, and 2015, respectively.
Amended and Restated 2000 Employee Stock Purchase Plan
As most recently amended on June 4, 2013, our stockholders approved the Amended and Restated 2000 Employee Stock Purchase Plan that increased the number of shares authorized for issuance pursuant to such plan by 2 million shares. The share increase was intended to ensure that we continue to have a sufficient reserve of common stock available under the ESPP to provide our eligible employees with the opportunity to acquire our common stock through participation in a payroll deduction-based ESPP designed to operate in compliance with Section 423 of the IRC. The ESPP does not provide for an automatic increase in the number of shares reserved for issuance under the ESPP.
The ESPP is qualified under Section 423 of the IRC. Eligible employees may contribute from one to ten percent of their base compensation. Employees are not able to purchase more than the number of shares having a value greater than $25,000 in any calendar year, as measured at the beginning of the offering period under the ESPP. The purchase price shall be the lesser of 85% of the fair value of the stock, either on the offering date or on the purchase date. The offering period shall not exceed 27 months beginning with the offering date. The ESPP provides for offerings of four consecutive, overlapping six-month offering periods, with a new offering period commencing on the first trading day on or after February 1 and August 1 of each year.
There were 0.3 million shares issued under the ESPP at an average purchase price of $35.18, $32.88, and $31.66 during each of the years ended December 31, 2017, 2016, and 2015, respectively. As of December 31, 2017,
153
Table of Contents
Electronics For Imaging, Inc.
Notes to Consolidated Financial Statements—(Continued)
there was $1.9 million of total unrecognized compensation cost related to stock-based compensation arrangements granted under the ESPP, which is expected to be recognized over a period of 1.8 years. At December 31, 2017, 2016, and 2015, there were 0.9, 1.2, and 1.5 million shares, respectively, of our common stock reserved for issuance under the ESPP.
Employee 401(k) Plan
We sponsor a 401(k) Savings Plan (“401(k) Plan”) that provides retirement and incidental benefits for our U.S. employees. Employees may contribute from 1% to 75% of their annual compensation to the 401(k) Plan, limited to a maximum annual amount as set periodically by the IRS. We match 50% of U.S. employee contributions, up to a maximum of the first 4% of the employee’s compensation contributed to the plan, subject to IRS limitations. All matching contributions vest over four years starting with the hire date of the individual employee. Our matching contributions to the 401(k) Plan totaled $2.3, $2.2, and $2.3 million during the years ended December 31, 2017, 2016, and 2015, respectively. The employees’ contributions and our contributions are invested in mutual funds managed by a fund manager, or in self-directed retirement plans.
Valuation and Expense Information under ASC 718
We account for stock-based payment awards in accordance with ASC 718, which requires the measurement and recognition of compensation expense for all equity awards granted to our employees and directors, including employee stock options, RSUs, and ESPP purchase rights related to all stock-based compensation plans based on the fair value of such awards on the date of grant. We amortize stock-based compensation cost on a graded vesting basis over the vesting period reduced by actual forfeitures, after assessing the probability of achieving the requisite performance criteria with respect to performance-based awards. Stock-based compensation cost is recognized over the requisite service period for each separately vesting tranche of the award as though the award were, in substance, multiple awards. Prior to adoption of ASU 2016-09 in the first quarter of 2016 as explained more fully in Note 1—The Company and Its Significant Accounting Policies, stock-based compensation expense was reduced by estimated forfeitures.
We use the BSM option pricing model to value stock-based compensation for stock options. We value market-based awards using a Monte Carlo valuation model. We value RSUs at the market price on the date of grant.
Stock-based compensation expense related to stock options, RSUs, ESPP purchase rights, and stock options under ASC 718 for the years ended December 31, 2017, 2016, and 2015 is summarized as follows (in thousands):
| 2017 | 2016 | 2015 | ||||||||||
| RSUs |
$ | 21,887 | $ | 28,952 | $ | 29,671 | ||||||
| ESPP purchase rights |
4,645 | 2,795 | 4,003 | |||||||||
| Employee stock options |
— | 79 | 397 | |||||||||
|
|
|
|
|
|
|
|||||||
| Total stock-based compensation |
26,532 | 31,826 | 34,071 | |||||||||
| Income tax benefit |
(8,188 | ) | (10,342 | ) | (9,436 | ) | ||||||
|
|
|
|
|
|
|
|||||||
| Stock-based compensation expense, net of tax |
$ | 18,344 | $ | 21,484 | $ | 24,635 | ||||||
|
|
|
|
|
|
|
|||||||
Valuation Assumptions for Stock Options and ESPP Purchases
The BSM model determines the fair value of stock options based on the stock price on the date of grant and assumptions including volatility, expected term, and interest rates. Expected volatility is based on the historical volatility of our stock over a preceding period commensurate with the expected term of the stock option. The
154
Table of Contents
Electronics For Imaging, Inc.
Notes to Consolidated Financial Statements—(Continued)
expected term is based on management’s consideration of the historical life of the stock options, the vesting period of the stock options granted, and the contractual period of the stock options granted. The risk-free interest rate for the expected term of the stock options is based on the U.S. Treasury yield curve in effect at the time of grant. Expected dividend yield was not considered in the option pricing formula since we do not pay dividends and have no current plans to do so in the future.
Stock options were not granted during the years ended December 31, 2017, 2016, and 2015. The estimated weighted average fair value per share of ESPP purchase rights issued and the assumptions used to estimate fair value for the years ended December 31, 2017, 2016, and 2015 are as follows:
| 2017 | 2016 | 2015 | ||||||||||
| Weighted average fair value per share |
$ | 12.09 | $ | 10.69 | $ | 10.28 | ||||||
| Expected volatility |
24% - 28 | % | 22% - 32 | % | 19% - 28 | % | ||||||
| Risk-free interest rate |
0.7% - 1.3 | % | 0.4% - 0.8 | % | 0.1% - 0.7 | % | ||||||
| Expected term (in years) |
0.5 - 2.0 | 0.5 - 2.0 | 0.5 - 2.0 | |||||||||
Stock Option Activity
Stock options outstanding and exercisable, including performance-based and market-based options, as of December 31, 2017, 2016, and 2015 and activity for each of the years then ended are summarized as follows (in thousands, except weighted average exercise price and remaining contractual term):
| Shares | Weighted average exercise price |
Weighted average remaining contractual term (years) |
Aggregate intrinsic value |
|||||||||||||
| Options outstanding at January 1, 2015 |
566 | $ | 13.67 | |||||||||||||
|
|
|
|
|
|||||||||||||
| Options exercised |
(124 | ) | 15.35 | |||||||||||||
|
|
|
|
|
|||||||||||||
| Options outstanding at December 31, 2015 |
442 | $ | 13.20 | |||||||||||||
|
|
|
|
|
|||||||||||||
| Options forfeited and expired |
(12 | ) | 10.77 | |||||||||||||
| Options exercised |
(115 | ) | 11.64 | |||||||||||||
|
|
|
|
|
|||||||||||||
| Options outstanding at December 31, 2016 |
315 | $ | 13.86 | 1.46 | $ | 9,480 | ||||||||||
|
|
|
|
|
|
|
|
|
|||||||||
| Options exercised |
(165 | ) | 12.45 | |||||||||||||
|
|
|
|
|
|||||||||||||
| Options outstanding at December 31, 2017 |
150 | $ | 15.43 | 1.27 | $ | 2,116 | ||||||||||
|
|
|
|
|
|
|
|
|
|||||||||
| Options vested and expected to vest at December 31, 2017 |
150 | $ | 15.43 | 1.27 | $ | 2,116 | ||||||||||
|
|
|
|
|
|
|
|
|
|||||||||
| Options exercisable at December 31, 2017 |
150 | $ | 15.43 | 1.27 | $ | 2,116 | ||||||||||
|
|
|
|
|
|
|
|
|
|||||||||
Aggregate stock option intrinsic value represents the difference between the closing price per share of our common stock on the last trading day of the fiscal period and the exercise price of the underlying awards for the options that were in the money at December 31, 2017, 2016, and 2015. The total intrinsic value of options exercised, determined as of the date of option exercise, was $5.3, $3.8, and $3.7 million for the years ended December 31, 2017, 2016, and 2015, respectively. There was no unrecognized compensation cost related to stock options expected to vest as of December 31, 2017. The weighted average exercise price ranges between $14.28
155
Table of Contents
Electronics For Imaging, Inc.
Notes to Consolidated Financial Statements—(Continued)
and $16.57. The weighted average remaining contractual term ranges between 0.86 and 1.68 years as of December 31, 2017.
Non-vested RSUs
Non-vested RSUs were awarded to employees under our equity incentive plans. Non-vested RSUs do not have the voting rights of common stock and the shares underlying non-vested RSUs are not considered issued and outstanding. Non-vested RSUs generally vest over a service period of one to four years. The compensation expense incurred for these service-based awards is based on the closing market price of our stock on the date of grant and is amortized on a graded vesting basis over the requisite service period. The weighted average fair value of RSUs granted during the years ended December 31, 2017, 2016, and 2015 were $35.89, $43.35, and $41.61, respectively.
Non-vested RSUs, including performance-based and market-based RSUs, as of December 31, 2017, 2016, and 2015, and activity for each of the years then ended, are summarized as follows (shares in thousands):
| Shares | Weighted average grant date fair value |
|||||||
| Non-vested at January 1, 2015 |
2,003 | $ | 35.91 | |||||
|
|
|
|
|
|||||
| Restricted stock granted |
1,104 | 41.61 | ||||||
| Restricted stock vested |
(925 | ) | 32.39 | |||||
| Restricted stock forfeited |
(368 | ) | 39.08 | |||||
|
|
|
|
|
|||||
| Non-vested at December 31, 2015 |
1,814 | $ | 40.53 | |||||
|
|
|
|
|
|||||
| Restricted stock granted |
1,359 | 43.35 | ||||||
| Restricted stock vested |
(787 | ) | 38.34 | |||||
| Restricted stock forfeited |
(303 | ) | 39.54 | |||||
|
|
|
|
|
|||||
| Non-vested at December 31, 2016 |
2,083 | $ | 43.34 | |||||
|
|
|
|
|
|||||
| Restricted stock granted |
1,467 | 35.89 | ||||||
| Restricted stock vested |
(761 | ) | 42.74 | |||||
| Restricted stock forfeited |
(510 | ) | 41.51 | |||||
|
|
|
|
|
|||||
| Non-vested at December 31, 2017 |
2,279 | $ | 39.16 | |||||
|
|
|
|
|
|||||
Vested RSUs
Performance-based RSUs that vested based on annual financial results are expensed in the period that the performance criteria were met. The grant date fair value of RSUs that vested during the years ended December 31, 2017, 2016, and 2015 were $42.74, $38.34, and $32.39 million, respectively. Aggregate intrinsic value of RSUs vested and expected to vest at December 31, 2017 was $62.7 million calculated as the closing price per share of our common stock on the last trading day of the fiscal period multiplied by 2.1 million RSUs vested and expected to vest at December 31, 2017. RSUs expected to vest represent time-based RSUs unvested and outstanding at December 31, 2017, and performance-based RSUs for which the requisite service period has not been rendered, but are expected to vest based on the achievement of performance conditions. There was approximately $34.3 million of unrecognized compensation costs related to RSUs expected to vest as of December 31, 2017. That cost is expected to be recognized over a weighted average period of 1.15 years.
156
Table of Contents
Electronics For Imaging, Inc.
Notes to Consolidated Financial Statements—(Continued)
Performance-based and Market-based RSUs and Stock Options
Performance-based and market-based RSUs included in the tables above as of December 31, 2017, 2016, and 2015, and activity for each of the years then ended, are summarized below (in thousands):
| Performance-based | Market-based | |||||||||||
| RSUs | Stock Options |
RSUs | ||||||||||
| Non-vested at January 1, 2015 |
852 | 16 | 34 | |||||||||
|
|
|
|
|
|
|
|||||||
| Granted |
569 | — | 18 | |||||||||
| Vested |
(284 | ) | — | (3 | ) | |||||||
| Forfeited |
(217 | ) | — | (26 | ) | |||||||
|
|
|
|
|
|
|
|||||||
| Non-vested at December 31, 2015 |
920 | 16 | 23 | |||||||||
|
|
|
|
|
|
|
|||||||
| Granted |
821 | — | — | |||||||||
| Vested |
(226 | ) | (4 | ) | — | |||||||
| Forfeited |
(250 | ) | (12 | ) | — | |||||||
|
|
|
|
|
|
|
|||||||
| Non-vested at December 31, 2016 |
1,265 | — | 23 | |||||||||
|
|
|
|
|
|
|
|||||||
| Granted |
675 | — | — | |||||||||
| Vested |
(284 | ) | — | — | ||||||||
| Forfeited |
(447 | ) | — | — | ||||||||
|
|
|
|
|
|
|
|||||||
| Non-vested at December 31, 2017 |
1,209 | — | 23 | |||||||||
|
|
|
|
|
|
|
|||||||
Approximately 2% of the non-vested performance-based RSUs at December 31, 2017 subsequently vested during the first quarter of 2018 based on achievement of specified performance criteria related to revenue and non-GAAP operating income targets.
We use the BSM option pricing model to value performance-based awards. We use a Monte Carlo option pricing model to value market-based awards. The estimated grant date fair value per share of performance-based and market-based RSUs granted and the assumptions used to estimate grant date fair value for the years ended December 31, 2017, 2016, and 2015 are as follows:
| Performance-based | Market-based | |||||||||||
| RSUs | RSUs | |||||||||||
| Short-term | Long-term |
|
||||||||||
| Year ended December 31, 2017 Grants |
||||||||||||
| Grant date fair value per share |
$ | 47.18 | $ | 33.43 | ||||||||
| Service period (years) |
1.0 | 2.0 - 3.0 | ||||||||||
| Year ended December 31, 2016 Grants |
||||||||||||
| Grant date fair value per share |
$ | 39.79 | $ | 45.76 | ||||||||
| Service period (years) |
1.0 | 2.0 - 3.0 | ||||||||||
| Year ended December 31, 2015 Grants |
||||||||||||
| Grant date fair value per share |
$ | 38.77 | $ | 42.82 | $ | 33.84 | ||||||
| Service period (years) |
1.0 | 2.0 - 3.0 | ||||||||||
| Derived service period (years) |
1.60 | |||||||||||
| Implied volatility |
30.0 | % | ||||||||||
| Risk-free interest rate |
1.7 | % | ||||||||||
157
Table of Contents
Electronics For Imaging, Inc.
Notes to Consolidated Financial Statements—(Continued)
Our performance-based RSUs generally vest when specified performance criteria are met based on bookings, revenue, cash provided by operating activities, non-GAAP operating income, non-GAAP earnings per share, revenue growth compared to market comparables, non-GAAP earnings per share growth compared to cash flows from operating activities growth, or other targets during the service period; otherwise, they are forfeited. Non-GAAP operating income is defined as operating income determined in accordance with GAAP, adjusted to remove the impact of certain expenses as defined in Unaudited Non-GAAP Financial Information. Non-GAAP earnings per share is defined as net income (loss) determined in accordance with GAAP, adjusted to remove the impact of certain expenses, and the related tax effects, divided by the weighted average number of common shares and dilutive potential common shares outstanding during the period as more fully defined in Note 2—Earnings Per Share of the Notes to Consolidated Financial Statements.
The grant date fair value per share determined in accordance with the BSM valuation model is being amortized over the service period of the performance-based awards. The probability of achieving the awards was determined based on review of the actual results achieved thus far by each business unit compared with the operating plan during the pertinent service period as well as the overall strength of the business unit. Stock-based compensation expense was adjusted based on this probability assessment. As actual results are achieved during the service period, the probability assessment is updated and stock-based compensation expense adjusted accordingly. Our stock compensation expense could change significantly in future periods if our probability assessments change significantly.
Market-based awards that were granted in prior periods vest when our average closing stock price exceeds defined multiples of the closing stock price for 90 consecutive trading days. If these multiples were not achieved by the expiration date, the awards are forfeited. The grant date fair value is being amortized over the average derived service period of the awards. The average derived period and total fair value were determined using a Monte Carlo valuation model based on our assumptions, which include a risk-free interest rate and implied volatility.
Note 13: Restructuring and Other
During the years ended December 31, 2017, 2016, and 2015, we continue to analyze our cost structure and re-align our cost structure following our business acquisitions. These charges primarily relate to integrating recently acquired businesses, consolidating facilities, eliminating redundancies, and lowering our operating expense run rate. Restructuring and other consists primarily of restructuring, severance, short-term retention costs, facility downsizing and relocation, and acquisition integration expenses. Our restructuring and other plans are accounted for in accordance with ASC 420, ASC 712, and ASC 820.
Restructuring and other costs for the years ended December 31, 2017, 2016, and 2015 were $7.6, $6.7, and $5.7 million, respectively. Restructuring and other costs include severance costs of $4.7, $4.1, and $3.0 million related to head count reductions of 144, 128, and 99 for the years ended December 31, 2017, 2016, and 2015, respectively. Severance costs include severance payments, related employee benefits, outplacement fees, recruiting, and employee relocation costs.
Facilities relocation and downsizing expenses for the years ended December 31, 2017, 2016, and 2015 were $0.6, $0.5, and $0.9 million, respectively. Facilities restructuring and other expenses are primarily related to the relocation of certain manufacturing and administrative locations to consolidate, streamline, or improve operations. Integration expenses for the years ended December 31, 2017, 2016, and 2015 of $2.3, $2.1, and $1.8 million, respectively, were required to integrate our business acquisitions.
158
Table of Contents
Electronics For Imaging, Inc.
Notes to Consolidated Financial Statements—(Continued)
Restructuring and other reserve activities for the years ended December 31, 2017 and 2016 are summarized as follows (in thousands):
| 2017 | 2016 | |||||||
| Reserve balance at January 1 |
$ | 1,824 | $ | 3,019 | ||||
| Restructuring charges |
5,136 | 2,808 | ||||||
| Other charges |
2,424 | 3,921 | ||||||
| Non-cash restructuring and other |
(264 | ) | (403 | ) | ||||
| Cash payments |
(6,668 | ) | (7,521 | ) | ||||
|
|
|
|
|
|||||
| Reserve balance at December 31 |
$ | 2,452 | $ | 1,824 | ||||
|
|
|
|
|
|||||
Note 14: Segment Information, Geographic Regions, and Major Customers
Operating Segments
Operating segment information is required to be presented based on the internal reporting used by the chief operating decision making group (“CODM”) to allocate resources and evaluate operating segment performance. Our CODM is comprised of our Chief Executive Officer and Chief Financial Officer (“CODM group”). The CODM group is focused on assessment and resource allocation among the Industrial Inkjet, Productivity Software, and Fiery operating segments.
Our operating segments are integrated through their reporting and operating structures, shared technology and practices, shared sales and marketing, shared back office support functions, and combined production facilities. Our enterprise management processes use financial information that is closely aligned with our three operating segments at the gross profit level. Relevant discrete financial information is prepared at the gross profit level for each of our three operating segments, which is used by the CODM group to allocate resources and assess the performance of each operating segment.
We classify our revenue, operating segment profit (i.e., gross profit), assets, and liabilities in accordance with our operating segments as follows:
Industrial Inkjet, which consists of our VUTEk super-wide and wide format display graphics, Nozomi corrugated packaging and display, Reggiani textile, and Cretaprint ceramic tile decoration and building material industrial digital inkjet printers; digital UV curable, LED curable, ceramic, water-based, and thermoforming and specialty ink, as well as a variety of textile ink including dye sublimation, pigmented, reactive dye, acid dye, pure disperse dye, water-based dispersed printing ink, and coatings; digital inkjet printer parts; and professional services. Printing surfaces include paper, vinyl, corrugated, textile, glass, plastic, aluminum composite, ceramic tile, wood, and many other flexible and rigid substrates.
Productivity Software, which consists of a complete software suite that enables efficient and automated end-to-end business and production workflows for the print and packaging industry. This Productivity Suite also provides tools to enable revenue growth, efficient scheduling, and optimization of processes, equipment, and personnel. Customers are provided the financial and technical flexibility to deploy locally within their business or to be hosted in the cloud. The Productivity Suite addresses all segments of the print industry and consists of the: (i) Packaging Suite, with Radius at its core, for tag & label, cartons, and flexible packaging businesses; (ii) Corrugated Packaging Suite, with CTI at its core, for corrugated packaging businesses, including corrugated control capability using EFI Escada; (iii) Enterprise Commercial Print Suite, with Monarch at its core, for enterprise print businesses; (iv) Publication Print Suite, with Monarch or Technique at its core, for publication print businesses; (v) Midmarket Print Suite, with Pace at its core, for medium size print businesses; (vi) Quick
159
Table of Contents
Electronics For Imaging, Inc.
Notes to Consolidated Financial Statements—(Continued)
Print Suite, with PrintSmith Vision and essential capabilities of Digital StoreFront at its core, for small printers and in-plant sites; and (vii) Value Added Products, available with the suite and standalone, such as web-to-print, e-commerce, cross media marketing, warehousing, fulfillment, shop floor data collection, and shipping to reduce costs, increase profits, and offer new products and services to their existing and future customers. We also market Optitex fashion CAD software, which facilitates fast fashion and increased efficiency in the textile and fashion industries.
Fiery, which consists of Fiery and FFPS, which was recently acquired from Xerox, that transform digital copiers and printers into high performance networked printing devices for the office, commercial, and industrial printing markets. This operating segment is comprised of (i) stand-alone DFEs connected to digital printers, copiers, and other peripheral devices, (ii) embedded DFEs and design-licensed solutions used in digital copiers and multi-functional devices, (iii) optional software integrated into our DFE solutions such as Fiery Central and Graphics Arts Package, (iv) Fiery Self Serve, our self-service and payment solution, and (v) stand-alone software-based solutions such as our proofing, textile, and scanning solutions.
Our CODM group evaluates the performance of our operating segments based on net sales and gross profit. Gross profit for each operating segment includes revenue from sales to third parties and related cost of revenue attributable to the operating segment. Cost of revenue for each operating segment excludes certain expenses managed outside the operating segments consisting primarily of stock-based compensation expense.
Operating income is not reported by operating segment because operating expenses include significant shared expenses and other costs that are managed outside of the operating segments. Such operating expenses include various corporate expenses such as stock-based compensation, corporate sales and marketing, research and development, amortization of identified intangibles, various non-recurring charges, and other separately managed general and administrative expenses.
Operating segment profit (i.e., gross profit), excluding stock-based compensation expense, for the years ended December 31, 2017, 2016, and 2015 is summarized as follows (in thousands):
| 2017 | 2016 | 2015 | ||||||||||
| Industrial Inkjet |
||||||||||||
| Revenue |
$ | 570,688 | $ | 562,583 | $ | 447,705 | ||||||
| Gross profit |
208,620 | 198,923 | 150,964 | |||||||||
| Gross profit percentages |
36.6 | % | 35.4 | % | 33.7 | % | ||||||
| Productivity Software |
||||||||||||
| Revenue |
$ | 156,561 | $ | 151,737 | $ | 135,350 | ||||||
| Gross profit |
114,460 | 114,179 | 99,278 | |||||||||
| Gross profit percentages |
73.1 | % | 75.2 | % | 73.3 | % | ||||||
| Fiery |
||||||||||||
| Revenue |
$ | 266,011 | $ | 277,745 | $ | 299,458 | ||||||
| Gross profit |
185,937 | 198,322 | 210,140 | |||||||||
| Gross profit percentages |
69.9 | % | 71.4 | % | 70.2 | % | ||||||
160
Table of Contents
Electronics For Imaging, Inc.
Notes to Consolidated Financial Statements—(Continued)
Operating segment profit (i.e., gross profit) for the years ended December 31, 2017, 2016, and 2015 is reconciled to the Consolidated Statements of Operations as follows (in thousands):
| 2017 | 2016 | 2015 | ||||||||||
| Segment gross profit |
$ | 509,017 | $ | 511,424 | $ | 460,382 | ||||||
| Stock-based compensation expense |
(2,561 | ) | (2,784 | ) | (2,837 | ) | ||||||
| Other items excluded from segment profit |
— | (475 | ) | (115 | ) | |||||||
|
|
|
|
|
|
|
|||||||
| Gross profit |
$ | 506,456 | $ | 508,165 | $ | 457,430 | ||||||
|
|
|
|
|
|
|
|||||||
The Fiery gross profit percentage is impacted by $1.4 million during the year ended December 31, 2017, charged to cost of revenue, which reflects the cost of manufacturing plus a portion of the expected profit margin related to the acquired FFPS inventories. Inventory acquired in the acquisition of FFPS is required to be recorded at fair value rather than historical cost in accordance with ASC 805. This amount is not included in the financial information regularly reviewed by the CODM group as this acquisition-related charge is not indicative of the gross margin trends in the FFPS business. Excluding this charge, the Fiery gross profit percentage would be 70.4% for the year ended December 31, 2017.
Tangible and intangible assets, net of liabilities, are summarized by operating segment as of December 31, 2017 and 2016 as follows (in thousands):
| Industrial Inkjet |
Productivity Software |
Fiery | Corporate and Unallocated Net Assets |
Total | ||||||||||||||||
| December 31, 2017 |
||||||||||||||||||||
| Goodwill |
$ | 154,373 | $ | 174,644 | $ | 74,261 | $ | — | $ | 403,278 | ||||||||||
| Identified intangible assets, net |
66,547 | 36,379 | 20,082 | — | 123,008 | |||||||||||||||
| Tangible assets, net of liabilities |
221,933 | (27,755 | ) | 11,286 | 49,561 | 255,025 | ||||||||||||||
|
|
|
|
|
|
|
|
|
|
|
|||||||||||
| Net tangible and intangible assets |
$ | 442,853 | $ | 183,268 | $ | 105,629 | $ | 49,561 | $ | 781,311 | ||||||||||
|
|
|
|
|
|
|
|
|
|
|
|||||||||||
| December 31, 2016 |
||||||||||||||||||||
| Goodwill |
$ | 141,068 | $ | 155,475 | $ | 63,298 | $ | — | $ | 359,841 | ||||||||||
| Identified intangible assets, net |
84,465 | 38,440 | 92 | — | 122,997 | |||||||||||||||
| Tangible assets, net of liabilities |
153,699 | (27,646 | ) | 33,966 | 183,158 | 343,177 | ||||||||||||||
|
|
|
|
|
|
|
|
|
|
|
|||||||||||
| Net tangible and intangible assets |
$ | 379,232 | $ | 166,269 | $ | 97,356 | $ | 183,158 | $ | 826,015 | ||||||||||
|
|
|
|
|
|
|
|
|
|
|
|||||||||||
Corporate and unallocated assets consist of cash and cash equivalents, short-term investments, restricted investments and cash equivalents, corporate headquarters facility, convertible senior notes, net, imputed financing obligation related to build-to-suit lease, income taxes receivable, and income taxes payable.
Geographic Regions
Our revenue originates in the U.S., China, the Netherlands, Germany, Italy, France, the U.K., Spain, Israel, Brazil, and Australia. We report revenue by geographic region based on ship-to destination. Shipments to some of our significant printer manufacturer/distributor customers are made to centralized purchasing and manufacturing locations, which in turn sell through to other locations. As a result of these factors, we believe that sales to certain geographic locations might be higher or lower, as the ultimate destinations are difficult for us to ascertain.
161
Table of Contents
Electronics For Imaging, Inc.
Notes to Consolidated Financial Statements—(Continued)
Our revenue by ship-to destination for the years ended December 31, 2017, 2016, and 2015 was as follows (in thousands):
| 2017 | 2016 | 2015 | ||||||||||
| Americas |
$ | 487,968 | $ | 500,411 | $ | 473,599 | ||||||
| EMEA |
369,610 | 360,305 | 291,103 | |||||||||
| APAC |
135,682 | 131,349 | 117,811 | |||||||||
|
|
|
|
|
|
|
|||||||
| Total Revenue |
$ | 993,260 | $ | 992,065 | $ | 882,513 | ||||||
|
|
|
|
|
|
|
|||||||
Our tangible long-lived assets consist primarily of property and equipment, net, of $98.8 million. Of this amount, $77.7 million resides in the Americas, $19.1 million resides in EMEA, consisting primarily of Cretaprint and Reggiani equipment and leasehold improvements, and $2.0 million resides in APAC, consisting primarily of India leasehold improvements and equipment.
Major Customers
One customer, Xerox, provided 11% and 12% of our consolidated revenue for the years ended December 31, 2017 and 2015, respectively. No customer accounted for more than 10% of our revenue for the year ended December 31, 2016. No customer accounted for more than 10% of our net consolidated accounts receivables at December 31, 2017 and 2016.
Note 15: Property and Equipment, net
Property and equipment, net, as of December 31, 2017 and 2016 are as follows (in thousands):
| 2017 | 2016 | |||||||
| Land, buildings, and improvements (including build-to-suit lease) |
$ | 68,404 | $ | 67,841 | ||||
| Equipment and purchased software |
93,849 | 86,665 | ||||||
| Furniture and leasehold improvements |
20,270 | 18,713 | ||||||
|
|
|
|
|
|||||
| 182,523 | 173,219 | |||||||
| Less accumulated depreciation and amortization |
(83,761 | ) | (69,745 | ) | ||||
|
|
|
|
|
|||||
| Property and equipment, net |
$ | 98,762 | $ | 103,474 | ||||
|
|
|
|
|
|||||
Depreciation expense was $16.8, $14.1, and $12.2 million for the years ended December 31, 2017, 2016, and 2015, respectively.
Fremont, California. We entered into a 15-year lease agreement pursuant to which we leased approximately 59,000 square feet of a building located in Fremont, California. The lease commenced on September 1, 2013. Minimum lease payments are $18.5 million, net of full abatement of rent for the first three years of the lease term. During the initial lease term, we also have certain rights of first refusal to (i) lease the remaining portion of the facility and/or (ii) purchase the facility. This location contains the engineering, marketing, and administrative operations for our Fiery operating segment. We relocated our former corporate headquarters to the adjacent building, which we purchased during the fourth quarter of 2013.
The leased facility was a cold shell requiring additional build-out and tenant improvements. The landlord paid the costs of the build-out up to $4.5 million, including all structural improvements, and we paid the costs of tenant improvements beyond that amount. We paid $5.3 million of tenant improvements, including furniture and
162
Table of Contents
Electronics For Imaging, Inc.
Notes to Consolidated Financial Statements—(Continued)
equipment and capitalized interest. The landlord is responsible for costs related to force majeure events that result in any damage to the facility. We were responsible for cost over-runs, if any, related to force majeure events including strikes, war, and material availability. Since we were responsible for cost overruns related to certain force majeure events, we were in substance offering an indemnification for events outside of our control. As such, we are deemed to be the accounting owner of the portion of the facility that we occupy. As of December 31, 2017, and 2016, we have capitalized $10.0 and $10.3 million, respectively, in property and equipment based on the estimated replacement cost of the portion of the building that we occupy, including capitalized interest, reduced by accumulated depreciation.
Monthly lease payments are allocated between the land element of the lease, which is accounted for as an operating lease, and the imputed financing obligation. The imputed financing obligation is being amortized in accordance with the effective interest method using the interest rate determined in accordance with the requirements of sale leaseback accounting. The imputed interest cost incurred during the construction period was capitalized as a component of the construction cost. As of December 31, 2017, the imputed financing obligation in connection with the facility was $13.9 million, including accrued interest, which is classified as a noncurrent imputed financing obligation in our Consolidated Balance Sheet. If the requirements of sale leaseback accounting are satisfied, or at the end of the initial lease term, we will reverse the net book value of the building and the corresponding imputed financing obligation.
Eagan, Minnesota. In 2016, management approved a plan to sell approximately 5.6 acres and the office building located at 1340 Corporate Center Curve, Eagan, Minnesota, consisting of 43,682 square feet, and the related improvements were classified as held for sale. On April 13, 2017, we entered into an agreement under which we agreed to sell the office building, improvements, and related land, subject to completion of a 150-day due diligence period, which expired on September 7, 2017 without the transaction closing. Accordingly, assets previously recorded as held for sale of $3.8 million, which consisted of $2.9 million net book value of the facility and $0.9 million of related land as of December 31, 2016, have been classified as assets held for use within property and equipment, net, in our Consolidated Balance Sheet as of December 31, 2017.
Manchester, New Hampshire. On August 26, 2016, we entered into a lease agreement and have accounted for a lease term of 48.5 years, inclusive of two renewal options of 5.0 and 3.5 years, with the City of Manchester to lease 16.9 acres of land adjacent to the Manchester Regional Airport. The land is subleased to BTMU during the term of the lease related to the manufacturing facility that is being constructed on the site, which is described below. Minimum lease payments are $13.3 million during the entire 48.5 year term of the land lease, excluding six months of the land lease that is financed into the manufacturing facility lease.
On August 26, 2016, we entered into a six-year lease with BTMU whereby a 225,000 square foot manufacturing and warehouse facility is under construction related to our super-wide format industrial digital inkjet printer business at a projected cost of $40 million and a construction period of 20 months. Minimum lease payments during the entire initial six-year term are $1.8 million. Upon completion of the initial six-year term, we have the option to renew the lease, purchase the facility, or return the facility to BTMU subject to an 89% residual value guarantee under which we would recognize additional rent expense in the form of a variable rent payment. We have assessed our exposure in relation to the residual value guarantee and believe that there is no deficiency to the guaranteed value with respect to funds expended by BTMU as of December 31, 2017. We are treated as the owner of the facility for federal income tax purposes.
The funds pledged under the lease represent 115% of the total expenditures made by BTMU through December 31, 2017. The funds are invested in $32.5 million of cash and cash equivalents at December 31, 2017; and $5.1 and $1.2 million of U.S. government securities and cash equivalents, respectively at December 31, 2016, with a third party trustee and will be restricted during the construction period. Upon completion of
163
Table of Contents
Electronics For Imaging, Inc.
Notes to Consolidated Financial Statements—(Continued)
construction, the funds will be released as cash and cash equivalents. The portion of released funds that represents 100% of the total expenditures made by BTMU will be deposited with BTMU and restricted as collateral until the end of the underlying lease period.
The funds pledged as collateral are invested in cash equivalents as of December 31, 2017, and cash equivalents and short-term investments as of December 31, 2016, and are classified as restricted cash equivalents and investments on our Consolidated Balance Sheets.
We have applied the accounting and disclosure requirements set forth in ASC 810-10 for VIEs. We have evaluated the BTMU lease agreement to determine if the arrangement qualifies as a VIE under ASC 810-10. We have determined that the lease agreement does not qualify as a VIE and, as such, we are not required to consolidate the VIE in our consolidated financial statements.
Meredith, New Hampshire. During the fourth quarter of 2017, management approved a plan to sell approximately 31.5 acres of land and two manufacturing buildings located at One Vutek Place and 189 Waukewan Street, Meredith, New Hampshire, consisting of 163,000 total square feet. Assets previously recorded within property and equipment, net, of $5.1 million consisting of $4.5 million net book value of the facility and $0.6 million of related land have been reclassified as assets held for sale in our Consolidated Balance Sheet as of December 31, 2017. Management expects the sale to be completed by December 31, 2018.
The fair value of the Meredith facility, based on expected sales proceeds, less cost to sell, is expected to be less than the carrying amount of the assets. As a result, we incurred an impairment loss of approximately $0.9 million, which has been recognized on our Consolidated Statements of Operations in the year ended December 31, 2017.
Note 16: License Agreement
On November 1, 2017 (“Effective Date”), we entered into an Agreement with Xeikon, which is a division of the Flint Group headquartered in Luxembourg to license the rights to the manufacturing, technology, marketing, and support of the Jetrion business. Pursuant to the Agreement, we provided Xeikon access to the Jetrion customer list and enabled Xeikon to assume the relationship with the third-party outsourcing company that manufactured Jetrion printers for us and resell the printers to our current customer base. Xeikon will purchase UV label ink exclusively from us and resell to both our current customer base as well as new Xeikon inkjet customers. Per the terms of the Agreement, we agreed to cease sales of Jetrion products for four years after the Effective Date. We received cash consideration of $2.0 million during 2017 followed by annual volume-based royalty payments based on Xeikon’s ink purchases from us through October 31, 2021.
We determined the amount of the actual payments received in 2017 related to Jetrion customer list access, Jetrion trade name, and volume-based royalty payments. Access to the customer list is recognized immediately as other income in our Consolidated Statement of Operations. Trade name is recognized ratably over four years as other income in our Consolidated Statements of Operations. Volume-based royalty payments from Xeikon’s ink purchases are recognized as revenue ratably over four years. For the year ended December 31, 2017, we recognized $0.1 and $0.3 million of revenue and other income in our Consolidated Statements of Operations from the Agreement.
164
Table of Contents
SUPPLEMENTARY DATA
Unaudited Quarterly Consolidated Financial Information
The following table presents our operating results for each of the quarters in the years ended December 31, 2017 and 2016. The information for each of these quarters is unaudited, but has been prepared on the same basis as our audited consolidated financial statements appearing elsewhere in this Annual Report on Form 10-K. In the opinion of management, all necessary adjustments (consisting of normal recurring adjustments and retroactive adjustments in the fourth quarter of 2016) have been included that are required to state fairly our unaudited quarterly results when read in conjunction with our audited consolidated financial statements and the notes thereto appearing in this Annual Report on Form 10-K. These operating results are not necessarily indicative of the results for any future period.
| 2017 | ||||||||||||||||
| (in thousands except per share data) |
Q1 | Q2 | Q3 | Q4 | ||||||||||||
| Revenue |
$ | 228,691 | $ | 247,047 | $ | 248,359 | $ | 269,163 | ||||||||
| Gross profit |
123,530 | 127,252 | 127,458 | 128,216 | ||||||||||||
| Income from operations |
8,143 | 7,991 | 7,397 | 4,016 | ||||||||||||
| Net income (loss) |
4,787 | 2,759 | 3,454 | (26,345 | ) | |||||||||||
| Net income (loss) per basic common share |
$ | 0.10 | $ | 0.06 | $ | 0.07 | $ | (0.58 | ) | |||||||
| Net income (loss) per diluted common share |
$ | 0.10 | $ | 0.06 | $ | 0.07 | $ | (0.58 | ) | |||||||
| 2016 | ||||||||||||||||
| (in thousands except per share data) |
Q1 | Q2 | Q3 | Q4 | ||||||||||||
| Revenue |
$ | 234,133 | $ | 245,650 | $ | 245,575 | $ | 266,707 | ||||||||
| Gross profit |
118,397 | 125,047 | 125,194 | 139,527 | ||||||||||||
| Income from operations |
6,969 | 11,709 | 9,410 | 27,731 | ||||||||||||
| Net income |
2,103 | 5,235 | 17,662 | 19,949 | ||||||||||||
| Net income per basic common share |
$ | 0.04 | $ | 0.11 | $ | 0.38 | $ | 0.43 | ||||||||
| Net income per diluted common share |
$ | 0.04 | $ | 0.11 | $ | 0.37 | $ | 0.42 | ||||||||
Income from operations decreased by $3.4 million during the quarter ended December 31, 2017, primarily because the estimated probability of achieving the Optitex earnout performance targets was increased, resulting in a $2.0 million increase in the related accrual during the quarter. Net loss during the quarter ended December 31, 2017, was further impacted by the $27.5 million tax charge related to the provisional estimate of the impact of the 2017 Tax Act as more fully explained in Note 11—Income Taxes.
We identified certain errors at our Italian manufacturing subsidiary attributable to the valuation and classification of certain finished goods inventory during the year ended December 31, 2017. These errors resulted in an understatement of operating expenses during the quarter ended December 31, 2016, due to failure to properly impair and expense certain items, properly classify certain amounts included in inventories on the balance sheet, and appropriately depreciate those amounts. As a result, we corrected the accompanying unaudited quarterly consolidated financial information for the fourth quarter of 2016. The impact to gross margin, income from operations, and net income for the three months ended December 31, 2016 for this correction is a decrease of $0.5, $0.7, and $0.6 million, respectively, from amounts previously reported of $140.0, $28.5, and $20.5 million, respectively. Net income per diluted common share decreased by $0.01 per share.
Item 9: Changes in and Disagreements with Accountants on Accounting and Financial Disclosure
None.
Item 9A: Controls and Procedures
| (a) | Evaluation of Disclosure Controls and Procedures |
We maintain “disclosure controls and procedures,” as this term is defined in Rule 13a-15(e) and 15d-15(e) under the Exchange Act, that are designed to provide reasonable assurance that information required to be disclosed by
165
Table of Contents
us in reports that we file or submit under the Exchange Act is recorded, processed, summarized, and reported within the time periods specified in SEC rules and forms, and that such information is accumulated and communicated to our management, including our Chief Executive Officer and Chief Financial Officer, as appropriate, to allow timely decisions regarding required disclosure.
Under the supervision and with the participation of our Chief Executive Officer and Chief Financial Officer, our management has evaluated the effectiveness of our disclosure controls and procedures as of December 31, 2017.
Based on that evaluation, our Chief Executive Officer and Chief Financial Officer concluded that our disclosure controls and procedures were not effective as of December 31, 2017, due to material weaknesses in our internal control over financial reporting. Our internal control over financial reporting is the process designed by and under the supervision of our Chief Executive Officer and Chief Financial Officer to provide reasonable assurance regarding the reliability of our financial reporting and the preparation of our financial statements for external reporting in accordance with accounting principles generally accepted in the United States of America.
We have begun implementing various changes in our internal control over financial reporting to remediate the material weaknesses described below. The implementation of our remediation plan was ongoing as of December 31, 2017.
| (b) | Management’s Report on Internal Control over Financial Reporting |
Our management is responsible for establishing and maintaining adequate internal control over financial reporting as defined in Rule 13a-15(f) of the Exchange Act. Because of its inherent limitations, internal control over financial reporting may not prevent or detect misstatements. Also, projections of any evaluation of effectiveness to future periods are subject to the risk that controls may become inadequate because of changes in conditions, or that the degree of compliance with the policies or procedures may deteriorate. Our management, with the participation of our Chief Executive Officer and Chief Financial Officer, assessed the effectiveness of the Company’s internal control over financial reporting as of December 31, 2017. In making this assessment, we used the criteria set forth by the Committee of Sponsoring Organizations of the Treadway Commission (“COSO”) in Internal Control—Integrated Framework (2013). Based on our assessment using those criteria, due to the material weaknesses described below, we have concluded that our internal control over financial reporting was not effective as of December 31, 2017.
Our management excluded the internal control over financial reporting at FFPS, CRC, Generation Digital, and Escada from its assessment of internal control over financial reporting as of December 31, 2017 because they were acquired in purchase business combinations during 2017. FFPS, CRC, Generation Digital and Escada represent approximately 4.1% and 2.7% of the total consolidated assets and total consolidated revenue, respectively, of the Company as of and for the year ended December 31, 2017.
Our management determined that, as of December 31, 2017, the following material weaknesses existed in our internal control over financial reporting.
| 1. | Our internal controls were not designed effectively to ensure that operational changes, which may impact revenue recognition, were appropriately and timely evaluated to determine the accounting impact. |
| 2. | We did not sufficiently staff, with appropriate levels of experience and training, to allow for the adequate monitoring and timely communication of operational changes, including those which may impact revenue recognition on an ongoing basis. |
| 3. | Our internal control over excess and obsolete finished goods printer inventory reserves at our Italian manufacturing subsidiary was not designed effectively to conduct a sufficiently precise evaluation of the classification, condition, and salability of each printer and the cost accounting department was not staffed sufficiently to mitigate limitations relating to these reserves in the ERP system used solely at this subsidiary. |
166
Table of Contents
Items #1 and #2 resulted in management not timely identifying and evaluating the appropriate period of recognition for certain revenue transactions related to printers distributed from a single location, which should have been evaluated in accordance with the bill and hold revenue recognition guidance. Item #3 resulted in management not timely evaluating the appropriate period of de-recognition of certain printer inventory manufactured at our Italian manufacturing subsidiary, which should have been subject to an excess and obsolescence impairment or reclassification and depreciation.
A material weakness is a deficiency, or combination of deficiencies, in internal control over financial reporting such that there is a reasonable possibility that a material misstatement of our annual or interim financial statements will not be prevented or detected in a timely basis. Because the deficiencies identified could result in a misstatement of revenue, inventory, and related accounts and associated disclosures that could be material to the annual or interim consolidated financial statements, such deficiencies represent material weaknesses in our internal control over financial reporting as of December 31, 2017.
| (c) | Material Weakness Discussion and Remediation |
Management analyzed the impacts resulting from the material weaknesses identified above and concluded that it did not have a material impact on our previously issued consolidated financial statements. However, management has determined to prospectively restate our financial statements to give effect to the correction related to the excess and obsolescence and related Italian inventory immaterial misstatements as disclosed in our accompanying consolidated financial statement elsewhere in this filing.
Notwithstanding the material weaknesses in our internal control over financial reporting, we have concluded that the consolidated financial statements and other financial information fairly present in all material respects our financial condition, results of operations, and cash flows as of, and for, the periods presented. The foregoing has been approved by our management, including our Chief Executive Officer and Chief Financial Officer, who have been involved with the assessment and analysis of our internal control over financial reporting.
Plan for Remediation of Material Weaknesses
Following the identification of the foregoing material weaknesses, management commenced implementation of a remediation plan, which is ongoing. Management believes that the implementation of this plan will remediate the material weaknesses described above. The following steps of the remediation plan are currently in process, and management may determine to enhance existing controls and/or implement additional controls as the implementation progresses:
| • | Design and implement controls to properly identify, evaluate and monitor operational changes which may impact revenue recognition; |
| • | Evaluate the sufficiency, experience, and training of our internal personnel and hire additional personnel or use external resources; |
| • | Design and implement controls related to the approval and accounting for any bill and hold transactions; |
| • | Design and implement controls to evaluate excess and obsolete inventory reserves at our Italian subsidiary; |
| • | Direct our internal auditors to perform additional testing of revenue transactions to ensure the sufficiency of our remediation efforts. |
We are in the process of further reviewing, documenting, and testing our internal controls over financial reporting, and we may from time to time make changes aimed at enhancing existing controls and/or implementing additional controls. Because the implementation of our remediation plan was ongoing as of
167
Table of Contents
December 31, 2017, and because there was insufficient time as of December 31, 2017, to demonstrate that the new controls implemented as part of the remediation plan were operating effectively as of that date, management concluded that the material weaknesses described above remain unremediated as of December 31, 2017.
Important Considerations
The effectiveness of our disclosure controls and procedures and our internal control over financial reporting is subject to various inherent limitations, including cost limitations, judgments used in decision making, assumptions about the likelihood of future events, the soundness of our systems, the possibility of human error, and the risk of fraud. Moreover, projections of any evaluation of effectiveness to future periods are subject to the risk that controls may become inadequate because of changes in conditions and the risk that the degree of compliance with policies or procedures may deteriorate over time. Because of these limitations, there can be no assurance that any system of disclosure controls and procedures or internal control over financial reporting will be successful in preventing all errors or fraud or in making all material information known in a timely manner to the appropriate levels of management.
| (d) | Changes in Internal Control Over Financial Reporting |
There has been no change in our internal control over financial reporting identified in connection with our evaluation that occurred during the fourth quarter of 2017 that has materially affected or is reasonably likely to materially affect our internal control over financial reporting.
168
Table of Contents
| (e) | Report of Independent Registered Public Accounting Firm |
REPORT OF INDEPENDENT REGISTERED PUBLIC ACCOUNTING FIRM
To the stockholders and the Board of Directors of Electronics for Imaging, Inc.
Opinion on Internal Control over Financial Reporting
We have audited the internal control over financial reporting of Electronics for Imaging, Inc. and subsidiaries (the “Company”) as of December 31, 2017, based on criteria established in Internal Control—Integrated Framework (2013) issued by the Committee of Sponsoring Organizations of the Treadway Commission (COSO). As described in Management’s Report on Internal Control over Financial Reporting, management excluded Free Flow Print Server (“FFPS”), CRC Information Systems (“CRC”), Generation Digital Solutions, Inc. (“Generation Digital”), and Escada Innovations Limited and Escada Systems, Inc. (collectively. “Escada”) from its assessment of internal control over financial reporting as of December 31, 2017, because they were acquired in purchase business combinations during 2017. FFPS, CRC, Generation Digital, and Escada represent approximately 4.1% and 2.7% of the total consolidated assets and total consolidated revenue, respectively, of the Company as of and for the year ended December 31, 2017. Accordingly, our audit did not include the internal control over financial reporting at FFPS, CRC, Generation Digital and Escada. In our opinion, because of the effect of the material weaknesses identified below on the achievement of the objectives of the control criteria, the Company has not maintained effective internal control over financial reporting as of December 31, 2017, based on criteria established in Internal Control—Integrated Framework (2013) issued by COSO.
We have also audited, in accordance with the standards of the Public Company Accounting Oversight Board (United States) (PCAOB), the consolidated financial statements as of and for the year ended December 31, 2017, of the Company and our report dated March 16, 2018 expressed an unqualified opinion on those consolidated financial statements.
Basis for Opinion
The Company’s management is responsible for maintaining effective internal control over financial reporting and for its assessment of the effectiveness of internal control over financial reporting, included in the accompanying Management’s Report on Internal Control over Financial Reporting. Our responsibility is to express an opinion on the Company’s internal control over financial reporting based on our audit. We are a public accounting firm registered with the PCAOB and are required to be independent with respect to the Company in accordance with the U.S. federal securities laws and the applicable rules and regulations of the Securities and Exchange Commission and the PCAOB.
We conducted our audit in accordance with the standards of the PCAOB. Those standards require that we plan and perform the audit to obtain reasonable assurance about whether effective internal control over financial reporting was maintained in all material respects. Our audit included obtaining an understanding of internal control over financial reporting, assessing the risk that a material weakness exists, testing and evaluating the design and operating effectiveness of internal control based on the assessed risk, and performing such other procedures as we considered necessary in the circumstances. We believe that our audit provides a reasonable basis for our opinion.
Definition and Limitations of Internal Control over Financial Reporting
A company’s internal control over financial reporting is a process designed to provide reasonable assurance regarding the reliability of financial reporting and the preparation of financial statements for external purposes in accordance with generally accepted accounting principles. A company’s internal control over financial reporting includes those policies and procedures that (1) pertain to the maintenance of records that, in reasonable detail,
169
Table of Contents
accurately and fairly reflect the transactions and dispositions of the assets of the company; (2) provide reasonable assurance that transactions are recorded as necessary to permit preparation of financial statements in accordance with generally accepted accounting principles, and that receipts and expenditures of the company are being made only in accordance with authorizations of management and directors of the company; and (3) provide reasonable assurance regarding prevention or timely detection of unauthorized acquisition, use, or disposition of the company’s assets that could have a material effect on the financial statements.
Because of its inherent limitations, internal control over financial reporting may not prevent or detect misstatements. Also, projections of any evaluation of effectiveness to future periods are subject to the risk that controls may become inadequate because of changes in conditions, or that the degree of compliance with the policies or procedures may deteriorate.
Material Weaknesses
A material weakness is a deficiency, or a combination of deficiencies, in internal control over financial reporting, such that there is a reasonable possibility that a material misstatement of the company’s annual or interim financial statements will not be prevented or detected on a timely basis. The following material weaknesses have been identified and included in management’s assessment:
| 1. | The Company’s internal controls were not designed effectively to ensure that operational changes, which may impact revenue recognition, were appropriately and timely evaluated to determine the accounting impact. |
| 2. | The Company did not sufficiently staff, with appropriate levels of experience and training, to allow for the adequate monitoring and timely communication of operational changes, including those which may impact revenue recognition on an ongoing basis. |
| 3. | The Company’s internal control over excess and obsolete finished goods printer inventory reserves at its Italian manufacturing subsidiary was not designed effectively to conduct a sufficiently precise evaluation of the classification, condition, and salability of each printer and the cost accounting department was not staffed sufficiently to mitigate limitations relating to these reserves in the ERP system used solely at this subsidiary. |
Items #1 and #2 resulted in management not timely identifying and evaluating the appropriate period of recognition for certain revenue transactions related to printers distributed from a single location, which should have been evaluated in accordance with the bill and hold revenue recognition guidance. Item #3 resulted in management not timely evaluating the appropriate period of de-recognition of certain printer inventory manufactured at their Italian manufacturing subsidiary, which should have been subject to an excess and obsolescence impairment or reclassification and depreciation.
These material weaknesses were considered in determining the nature, timing, and extent of audit tests applied in our audit of the consolidated financial statements as of and for the year ended December 31, 2017, of the Company, and this report does not affect our report on such financial statements.
/s/ Deloitte & Touche LLP
San Jose, CA
March 16, 2018
None.
170
Table of Contents
PART III
Item 10: Directors, Executive Officers and Corporate Governance
Information regarding our directors is incorporated by reference from the information contained under the caption “Election of Directors” in our Proxy Statement for our 2018 Annual Meeting of Stockholders (the “2018 Proxy Statement”). Information regarding our current executive officers is incorporated by reference from information contained under the caption “Executive Officers” in our 2018 Proxy Statement. Information regarding Section 16 reporting compliance is incorporated by reference from information contained under the caption “Section 16(a) Beneficial Ownership Reporting Compliance” in our 2018 Proxy Statement. Information regarding the Audit Committee of our Board of Directors and information regarding an Audit Committee financial expert is incorporated by reference from information contained under the caption “Meetings and Committees of the Board of Directors” in our 2018 Proxy Statement. Information regarding our code of ethics is incorporated by reference from information contained under the caption “Meetings and Committees of the Board of Directors” in our 2018 Proxy Statement. Information regarding our implementation of procedures for stockholder nominations to our Board of Directors is incorporated by reference from information contained under the caption “Meetings and Committees of the Board of Directors” in our 2018 Proxy Statement.
We intend to disclose any amendment to our code of ethics, or waiver from, certain provisions of our code of ethics as applicable for our directors and executive officers, including our principal executive officer, principal financial and accounting officer, chief accounting officer and controller, or persons performing similar functions, by posting such information on our website at www.efi.com.
Item 11: Executive Compensation
The information required by this item is incorporated by reference from the information contained under the captions “Compensation Discussion and Analysis” and “Executive Compensation” in our 2018 Proxy Statement.
Item 12: Security Ownership of Certain Beneficial Owners and Management and Related Stockholder Matters
Other than information regarding securities authorized for issuance under equity compensation plans, which is set forth below, the information required by this item is incorporated by reference from the information contained under the caption “Security Ownership” in our 2018 Proxy Statement.
Securities Authorized for Issuance Under Equity Compensation Plans
The following table sets forth information as of December 31, 2017 concerning securities that are authorized under equity compensation plans:
| Plan category | Number of securities to be issued upon exercise of outstanding options, warrants and rights |
Weighted-average exercise price of outstanding options, warrants and rights |
Number of securities remaining available for future issuance under equity compensation plans (excluding securities reflected in column 1) |
|||||||||
| Equity compensation plans approved by stockholders |
2,433,701 | $ | 15.43 | (1) | 2,805,120 | (2) | ||||||
| Equity compensation plans not approved by |
— | — | — | |||||||||
|
|
|
|
|
|
|
|||||||
| Total |
2,433,701 | $ | 15.43 | 2,805,120 | ||||||||
|
|
|
|
|
|
|
|||||||
| (1) | Calculated without taking into account 2,283,701 RSUs that will become issuable as those units vest, without any cash consideration or other payment required for such shares. |
| (2) | Includes 901,883 shares available under the ESPP. |
171
Table of Contents
Item 13: Certain Relationships and Related Transactions, and Director Independence
The information required by this item is incorporated by reference from the information contained under the caption “Certain Relationships and Related Transactions, and Director Independence” in our 2018 Proxy Statement.
Item 14: Principal Accountant Fees and Services
The information required by this item is incorporated by reference from the information contained under the caption “Principal Accountant Fees and Services” in our 2018 Proxy Statement.
PART IV
Item 15: Exhibits and Financial Statement Schedules
| (a) | Documents Filed as Part of this Report |
| (1) | Index to Financial Statements |
The Financial Statements required by this item are submitted in Item 8 of this Annual Report on Form 10-K as follows:
| (2) | Financial Statement Schedule |
| 177 | ||||
(All other schedules are omitted because of the absence of conditions under which they are required or because the necessary information is provided in the consolidated financial statements or notes thereto in Item 8 of this Annual Report on Form 10-K.)
172
Table of Contents
| (3) | Exhibits |
173
Table of Contents
| Exhibit No. |
Description | |
| 12.1 | Computation of Ratios of Earnings to Fixed Charges | |
| 21 | List of Subsidiaries | |
| 23.1 | Consent of Deloitte & Touche LLP, Independent Registered Public Accounting Firm | |
| 31.1 | Certification of Chief Executive Officer pursuant to Section 302 of the Sarbanes-Oxley Act of 2002 | |
| 31.2 | Certification of Chief Financial Officer pursuant to Section 302 of the Sarbanes-Oxley Act of 2002 | |
| 32.1 | Chief Executive Officer Certification pursuant to 18 U.S.C. Section 1350 as adopted pursuant to Section 906 of the Sarbanes-Oxley Act of 2002 and Chief Financial Officer Certification pursuant to 18 U.S.C. Section 1350 as adopted pursuant to Section 906 of the Sarbanes-Oxley Act of 2002 | |
| 101.INS | XBRL Instance Document | |
| 101.SCH | XBRL Taxonomy Extension Schema Document | |
| 101.CAL | XBRL Taxonomy Calculation Linkbase Document | |
| 101.DEF | XBRL Taxonomy Extension Definition Linkbase Document | |
| 101.LAB | XBRL Taxonomy Label Linkbase Document | |
| 101.PRE | XBRL Taxonomy Extension Presentation Linkbase Document | |
| (P) | Paper exhibit |
| * | Management contracts or compensatory plan or arrangement |
| + | The Company has received confidential treatment with respect to portions of these documents |
| (1) | Filed as an exhibit to the Company’s Annual Report on Form 10-K for the year ended December 31, 2016 (File No. 18805) and incorporated herein by reference. |
| (2) | Filed as an exhibit to the Company’s Current report on Form 8-K filed on August 17, 2009 (File No. 18805) and incorporated herein by reference. |
| (3) (P) | Filed as an exhibit to the Company’s Registration Statement on Form S-1 (No. 33-50966) and incorporated herein by reference. |
| (4) | Filed as an exhibit to the Company’s Current Report on Form 8-K filed on September 9, 2014 (File No. 18805) and incorporated herein by reference. |
| (5) | Filed as an exhibit to the Company’s Annual Report on Form 10-K for the year ended December 31, 2000 (File No. 18805) and incorporated herein by reference. |
| (6) | Filed as an exhibit to the Company’s Current Report on Form 8-K filed on June 13, 2017 (File No. 18805) and incorporated herein by reference. |
| (7) | Filed as an exhibit to the Company’s Quarterly Report on Form 10-Q for the quarter ended September 30, 2017. (File No. 18805) and incorporated herein by reference. |
| (8) (P) | Filed as an exhibit to the Company’s Registration Statement on Form S-1 (No. 33-50966) and incorporated herein by reference. |
| (9) | Filed as an exhibit to the Company’s Current Report on Form 8-K filed on August 17, 2009 (File No. 18805) and incorporated herein by reference. |
| (10) | Filed as an exhibit to the Company’s Annual Report on Form 10-K for the year ended December 31, 2005. (File No. 18805) and incorporated herein by reference. |
| (11) | Filed as an exhibit to the Company’s Annual Report on Form 10-K for the year ended December 31, 2005. (File No. 18805) and incorporated herein by reference. |
| (12) | Filed as an exhibit to the Company’s Quarterly Report on Form 10-Q for the quarter ended March 31, 2006. (File No. 18805) and incorporated herein by reference. |
| (13) | Filed as an exhibit to the Company’s Quarterly Report on Form 10-Q for the quarter ended June 30, 2013. (File No. 18805) and incorporated herein by reference. |
174
Table of Contents
| (14) | Filed as an exhibit to the Company’s Quarterly Report on Form 10-Q filed on June 30, 2013 (File No. 000-18805) and incorporated herein by reference. |
| (15) | Filed as an exhibit to the Company’s Quarterly Report on Form 10-Q for the quarter ended March 31, 2017. (File No. 18805) and incorporated herein by reference. |
| (16) | Filed as an exhibit to the Company’s Current Report on Form 8-K filed on January 28, 2014 (File No. 000-18805) and incorporated herein by reference. |
| (17) | Filed as an exhibit to the Company’s Annual Report on Form 10-K filed on December 31, 2015 (File No. 000-18805) and incorporated herein by reference. |
| (18) | Filed as an exhibit to the Company’s Current Report on Form 8-K filed on September 9, 2014 (File No. 000-18805) and incorporated herein by reference. |
| (19) | Filed as an exhibit to the Company’s Current Report on Form 8-K filed on September 9, 2014 (File No. 000-18805) and incorporated herein by reference. |
| (20) | Filed as an exhibit to the Company’s Annual Report on Form 10-K filed on March 16, 2018 (File No. 000-18805) and incorporated herein by reference. |
175
Table of Contents
We are filing the following documents as exhibits to this Form 10-K/A:
|
Exhibit No. |
Description | |
| 12.1 | Computation of Ratios of Earnings to Fixed Charges | |
| 21 | List of Subsidiaries | |
| 23.1 | Consent of Independent Registered Public Accounting Firm—Deloitte & Touche LLP | |
| 31.1 | Certification of Chief Executive Officer pursuant to Section 302 of the Sarbanes-Oxley Act of 2002 | |
| 31.2 | Certification of Chief Financial Officer pursuant to Section 302 of the Sarbanes-Oxley Act of 2002 | |
| 32.1 | Chief Executive Officer Certification pursuant to 18 U.S.C. Section 1350 as adopted pursuant to Section 906 of the Sarbanes-Oxley Act of 2002 and Chief Financial Officer Certification pursuant to 18 U.S.C. Section 1350 as adopted pursuant to Section 906 of the Sarbanes-Oxley Act of 2002 | |
| 101.INS | XBRL Instance Document | |
| 101.SCH | XBRL Taxonomy Extension Schema Document | |
| 101.CAL | XBRL Taxonomy Calculation Linkbase Document | |
| 101.DEF | XBRL Taxonomy Extension Definition Linkbase Document | |
| 101.LAB | XBRL Taxonomy Label Linkbase Document | |
| 101.PRE | XBRL Taxonomy Extension Presentation Linkbase Document | |
(b) List of Exhibits
See Item 15(a).
(c) Consolidated Financial Statement Schedule II for the years ended December 31, 2017, 2016, and 2015.
None.
176
Table of Contents
Schedule II
Valuation and Qualifying Accounts
| (in thousands) |
Balance at beginning of period |
Charged to revenue and expenses |
Charged to (from) other accounts |
Deductions | Balance at end of period |
|||||||||||||||
| Year Ended December 31, 2017 |
||||||||||||||||||||
| Allowance for bad debts and sales-related allowances |
$ | 23,330 | $ | 12,416 | $ | — | $ | (3,410 | ) | $ | 32,336 | |||||||||
| Year Ended December 31, 2016 |
||||||||||||||||||||
| Allowance for bad debts and sales-related allowances |
21,993 | 10,678 | $ | — | (9,341 | ) | 23,330 | |||||||||||||
| Year Ended December 31, 2015 |
||||||||||||||||||||
| Allowance for bad debts and sales-related allowances |
17,517 | 7,536 | — | (3,060 | ) | 21,993 | ||||||||||||||
177
Table of Contents
Pursuant to the requirements of Section 13 or 15(d) of the Securities Exchange Act of 1934, the registrant has duly caused this report to be signed on its behalf by the undersigned, thereunto duly authorized.
| ELECTRONICS FOR IMAGING, INC. | ||
| By: | /s/ Guy Gecht | |
| Guy Gecht | ||
| Chief Executive Officer (Principal Executive Officer) | ||
March 19, 2018
178