Attached files
| file | filename |
|---|---|
| EX-99.1 - EXHIBIT 99.1 - Lument Finance Trust, Inc. | tv488666_ex99-1.htm |
| 8-K - FORM 8-K - Lument Finance Trust, Inc. | tv488666_8k.htm |
Exhibit 99.2

Investment Corp. Fourth Quarter 2017 Earnings and Performance Highlights Presentation March 16, 2017

Safe Harbor Statement 2 This presentation includes "forward - looking statements" within the meaning of Section 27 A of the Securities Act of 1933 , as amended, or the Securities Act, and Section 21 E of the Exchange Act and, as such, may involve known and unknown risks, uncertainties and assumptions . These forward - looking statements include information about possible or assumed future results of the Company's business, financial condition, liquidity, results of operations, plans and objectives . You can identify forward - looking statements by use of words such as "believe," "expect," "anticipate," "estimate," "plan," "continue," "intend," "should," "may" or similar expressions or other comparable terms, or by discussions of strategy, plans or intentions . Statements regarding the following subjects, among others, may be forward - looking : the return on equity ; the yield on investments ; the ability to borrow to finance assets ; and risks associated with investing in real estate assets, including changes in business conditions, interest rates, the general economy and political conditions and related matters . Forward - looking statements are based on the Company's beliefs, assumptions and expectations of its future performance, taking into account all information currently available to the Company . Actual results may differ from expectations, estimates and projections and, consequently, you should not rely on these forward looking statements as predictions of future events . Forward - looking statements are subject to substantial risks and uncertainties, many of which are difficult to predict and are generally beyond the Company's control . Additional information concerning these and other risk factors are contained in the Company's most recent filings with the Securities and Exchange Commission, which are available on the Securities and Exchange Commission's website at www . sec . gov . All subsequent written and oral forward - looking statements that the Company makes, or that are attributable to the Company, are expressly qualified in their entirety by this cautionary notice . Any forward - looking statement speaks only as of the date on which it is made . Except as required by law, the Company is not obligated to, and does not intend to, update or revise any forward - looking statements, whether as a result of new information, future events or otherwise .
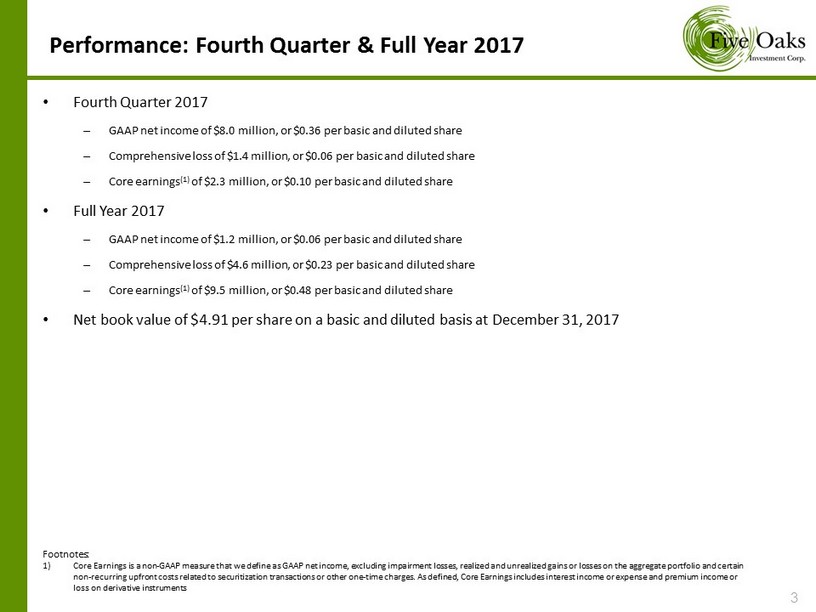
Performance: Fourth Quarter & Full Year 2017 3 Footnotes: 1) Core Earnings is a non - GAAP measure that we define as GAAP net income, excluding impairment losses, realized and unrealized gains or losses on the aggregate portfolio and certain non - recurring upfront costs related to securitization transactions or other one - time charges. As defined, Core Earnings includes interest income or expense and premium income or loss on derivative instruments • Fourth Quarter 2017 – GAAP net income of $ 8 . 0 million, or $ 0 . 36 per basic and diluted share – Comprehensive loss of $ 1 . 4 million, or $ 0 . 06 per basic and diluted share – Core earnings ( 1 ) of $ 2 . 3 million, or $ 0 . 10 per basic and diluted share • Full Year 2017 – GAAP net income of $ 1 . 2 million, or $ 0 . 06 per basic and diluted share – Comprehensive loss of $ 4 . 6 million, or $ 0 . 23 per basic and diluted share – Core earnings ( 1 ) of $ 9 . 5 million, or $ 0 . 48 per basic and diluted share • Net book value of $ 4 . 91 per share on a basic and diluted basis at December 31 , 2017

2017 Highlights 4 • Realized a negative economic return on our common stock of 8 . 2 % for the year accounting for dividends of $ 0 . 60 ( 1 ) • Continued the reduction of our credit risk MBS exposure – Reduced Non - Agency RMBS from $ 12 . 8 million at December 31 , 2016 to $ 4 . 4 million at December 31 , 2017 (on a non - GAAP combined basis) – Reduced Multi - Family MBS from $ 91 . 5 million at December 31 , 2016 to $ 27 . 4 million at December 31 , 2017 (on a non - GAAP combined basis) – Since year end, we have sold $ 5 . 9 million of the remaining Multi - Family MBS exposure – We also completed the sale of all remaining residential mortgage loans prior to year - end • Redeployed capital released from selling down our credit exposure into Agency RMBS – Agency RMBS hybrid - ARMs increased from $ 790 . 2 million at December 31 , 2016 to $ 1 , 285 . 1 million at December 31 , 2017 • On June 16 , 2017 , we issued 4 , 600 , 000 shares of common stock, inclusive of the underwriters’ overallotment option, for $ 4 . 60 per share, raising net proceeds of approximately $ 19 . 8 million Footnotes: 1) Economic return is a non - GAAP measure that we define as the sum of the change in net book value per common share and dividends declared o n our common stock during the period over the beginning net book value per common share

Hunt Transaction: 1 of 2 5 • On January 18 , 2018 , we announced a new strategic direction, and entry into a new external management agreement with Hunt Investment Management, LLC, an affiliate of the Hunt Companies Inc . and the concurrent mutual termination of our management agreement with Oak Circle Capital Partners, LLC . • Management by Hunt is expected to provide Five Oaks with a new strategic direction through the reallocation of capital into new investment opportunities focused in the commercial real estate mortgage space and direct access to Hunt’s significant pipeline of transitional floating - rate multi - family and commercial real estate loans • Hunt and its affiliates have extensive experience in the origination, servicing, risk management and financing of this asset class and the floating - rate nature of the loans should reduce or eliminate the need for complex interest - rate hedging • The new management agreement is expected to better align our interests with those of our new manager through an incentive fee arrangement and agreed upon limitations on manager expense reimbursements from us • Pursuant to the terms of the termination agreement between Five Oaks and Oak Circle, the termination of the prior management agreement did not trigger, and Oak Circle was not paid, a termination fee by us • Hunt separately agreed to pay Oak Circle a negotiated payment

Hunt Transaction: 2 of 2 6 • In connection with the transaction, an affiliate of Hunt purchased 1 , 539 , 406 shares of our common stock in a private placement, at a purchase price of $ 4 . 77 per share resulting in an aggregate capital raise of $ 7 , 342 , 967 • An affiliate of Hunt also purchased 710 , 495 Five Oaks shares from our largest shareholder, XL Investments Ltd . , for the same price per share – The purchase price per share represents a 56 . 9 % premium over the Five Oaks common share price as of the closing on January 17 , 2018 – In connection with the acquisition of shares from XL Investments, XL Investments agreed to terminate all of its currently held Five Oaks warrants • After completion of these share purchases, Hunt and its affiliates own approximately 9 . 5 % of Five Oaks common shares • David Carroll resigned as a director, Chairman and CEO of the Company, and the Five Oaks board appointed James C . Hunt as a director and Chairman of the board and named James P . Flynn as CEO of Five Oaks and Michael P . Larsen as President of Five Oaks

Portfolio Analysis: Fourth Quarter 2016 vs. 2017 7 0.16% 87.72% 0.26% 0.86% 10.17% 0.32% 0.51% 4Q 2016 Agency Fixed Agency ARMs Legacy Non-Agency RMBS 2.0 Multi-Family MBS Residential Whole Loans Mortgage Servicing Rights 0.06% 97.22% 0.33% 2.08% 0.00% 0.30% 4Q 2017 Agency Fixed Agency ARMs RMBS 2.0 Multi-Family MBS Residential Whole Loans Mortgage Servicing Rights

Capital Allocations & ARM Portfolio 8 • Our 4 Q 17 Agency ARM Portfolio has a three month CPR of 9 . 0 % • Our weighted average coupon is 2 . 67 % • Our weighted average purchase price is $ 101 . 83 • Lower coupon and dollar price hybrids benefit from “roll down the curve” Months to Reset Avg. MTR % of ARM Portfolio Current Face Value Weighted Avg. Coupon Weighted Avg. Amortized Purchase Price Amortized Cost Weighted Avg. Market Price Market Value 0 -36 31 3.3% $ 41,892,780 2.11% 102.61 $ 42,987,417 101.26 $ 42,421,640 37-72 67 50.9% $ 648,389,289 2.53% 101.37 $ 657,301,983 100.49 $ 651,569,932 73-84 77 37.0% $ 471,783,215 2.85% 102.32 $ 482,715,195 101.23 $ 477,602,166 85-120 115 8.7% $ 111,422,094 2.97% 102.13 $ 113,790,027 101.10 $ 112,643,931 Total ARMs 74 100.0% $ 1,273,487,378 2.67% 101.83 $ 1,296,794,622 100.84 $ 1,284,237,669 Agency ARM Portfolio: 12/31/2017 As of 12.31.17 Agency MBS Multi-Family MBS (1)(2) Non-Agency RMBS (1)(2) Residential Loans (3) Unrestricted Cash (4) Total Amortized Cost 1,297,656,984 21,777,547 11,063,922 4,951,539 34,347,339 1,369,797,331 Market Value 1,285,083,648 27,437,098 4,399,779 3,977,804 34,347,339 1,355,245,668 Repurchase Agreements (5) (1,228,349,000) (3,618,000) (2,555,000) - - (1,234,522,000) Hedges 5,349,613 - - - - 5,349,613 Other (5) 9,972,992 (3,286) 47,841 - (451,351) 9,566,196 Restricted Cash 10,151,800 - - - - 10,151,800 Equity Allocated 82,209,053 23,815,812 1,892,620 3,977,804 33,895,988 145,791,277

Core Earnings Analysis: Fourth Quarter 2017 9 GAAP to Core Earnings Reconciliation Year Ended Year Ended December 31, 2017 December 31, 2016 Reconciliation of GAAP to non-GAAP Information Net Income (loss) attributable to common shareholders $ 1,184,925 $ (11,511,991) Adjustments for non-core earnings Realized (Gain) Loss on sale of investments, net $ 14,054,164 $ 7,216,137 Unrealized (Gain) Loss on fair value option securities $ (9,448,270) $ 4,683,410 Realized (Gain) Loss on derivative contracts, net $ (2,219,719) $ 3,089,001 Unrealized (Gain) Loss on derivative contracts, net $ 2,704,413 $ (5,495,463) Realized (Gain) Loss on mortgage loans held-for-sale $ 221,620 $ (94,187) Unrealized (Gain) Loss on mortgage loans held-for-sale $ (17,727) $ 151,023 Unrealized (Gain) Loss on mortgage servicing rights $ 487,856 $ 827,864 Unrealized (Gain) Loss on multi-family loans held in securitization trusts $ (3,353,365) $ 5,219,530 Unrealized (Gain) Loss on residential loans held in securitization trusts $ 96,100 $ (404,720) Other income (Loss) $ (46,262) $ (32,276) Subtotal $ 3,343,810 $ 15,160,319 Other-than-temporary impairments: Increase (decrease) in credit reserves $ - $ 183,790 Additional other-than-temporary credit impairment losses $ - $ 541,342 Net other-than-temporary impairments $ - $ 725,132 Other Adjustments Recognized compensation expense related to restricted common stock $ 20,581 $ 35,785 Adjustment for consolidated securities/securitization costs $ 4,840,471 $ 4,107,787 Adjustment for one-time charges $ 152,322 $ 2,402,189 Core Earnings $ 9,542,109 $ 10,919,221 Weighted average shares outstanding - Basic and Diluted 20,048,128 14,641,701 Core Earnings per weighted average shares outstanding - Basic and Diluted $ 0.48 $ 0.75

End of Presentation 10 Investment Corp.