Attached files
| file | filename |
|---|---|
| EX-10.7 - EX-10.7 - Exela Technologies, Inc. | a2234859zex-10_7.htm |
| EX-31.1 - EX-31.1 - Exela Technologies, Inc. | a2234859zex-31_1.htm |
| EX-32.2 - EX-32.2 - Exela Technologies, Inc. | a2234859zex-32_2.htm |
| EX-32.1 - EX-32.1 - Exela Technologies, Inc. | a2234859zex-32_1.htm |
| EX-31.2 - EX-31.2 - Exela Technologies, Inc. | a2234859zex-31_2.htm |
| EX-23.1 - EX-23.1 - Exela Technologies, Inc. | a2234859zex-23_1.htm |
| EX-21.1 - EX-21.1 - Exela Technologies, Inc. | a2234859zex-21_1.htm |
| EX-10.9 - EX-10.9 - Exela Technologies, Inc. | a2234859zex-10_9.htm |
| EX-10.8 - EX-10.8 - Exela Technologies, Inc. | a2234859zex-10_8.htm |
| EX-10.6 - EX-10.6 - Exela Technologies, Inc. | a2234859zex-10_6.htm |
Use these links to rapidly review the document
TABLE OF CONTENTS
ITEM 8. FINANCIAL STATEMENTS AND SUPPLEMENTARY DATA
UNITED STATES
SECURITIES AND EXCHANGE COMMISSION
WASHINGTON, D.C. 20549
FORM 10-K
| (Mark One) | ||
ý |
ANNUAL REPORT PURSUANT TO SECTION 13 OR 15(d) OF THE SECURITIES EXCHANGE ACT OF 1934 |
|
For the fiscal year ended December 31, 2017 |
||
or |
||
o |
TRANSITION REPORT PURSUANT TO SECTION 13 OR 15(d) OF THE SECURITIES EXCHANGE ACT OF 1934 |
|
For the transition period from to |
||
Commission File Number: 001-36788
EXELA TECHNOLOGIES, INC.
(Exact Name of Registrant as Specified in its Charter)
| Delaware (State of or other Jurisdiction Incorporation or Organization) |
47-1347291 (I.R.S. Employer Identification No.) |
|
2701 E. Grauwyler Rd. Irving, TX (Address of Principal Executive Offices) |
75061 (Zip Code) |
Registrant's Telephone Number, Including Area Code: (844) 935-2832
Securities Registered Pursuant to Section 12(b) of the Act:
| Title of Each Class | Name of Each Exchange On Which Registered | |
|---|---|---|
| Common Stock, Par Value $0.0001 per share | The Nasdaq Stock Market LLC |
Indicate by check mark if the Registrant is a well-known seasoned issuer, as defined in Rule 405 of the Securities Act. o Yes ý No
Indicate by check mark if the Registrant is not required to file reports pursuant to Section 13 or Section 15(d) of the Act. o Yes ý No
Indicate by check mark whether the Registrant (1) has filed all reports required by Section 13 or 15(d) of the Securities Exchange Act of 1934 during the preceding 12 months (or for such shorter period that the Registrant was required to file such reports), and (2) has been subject to such filing requirements for the past 90 days. ý Yes o No
Indicate by check mark whether the Registrant has submitted electronically and posted on its corporate Web site, if any, every Interactive Data File required to be submitted and posted pursuant to Rule 405 of Regulation S-T during the preceding 12 months (or for such shorter period that the Registrant was required to submit and post such files). ý Yes o No
Indicate by check mark if disclosure of delinquent filers pursuant to Item 405 of Regulation S-K is not contained herein, and will not be contained, to the best of Registrant's knowledge, in definitive proxy or information statements incorporated by reference in Part III of this Form 10-K or any amendment to this Form 10-K. ý
Indicate by check mark whether the Registrant is a large accelerated filer, an accelerated filer, a non-accelerated filer, or a smaller reporting company. See definitions of "large accelerated filer", "accelerated filer", "smaller reporting company" and "emerging growth company" in Rule 12b-2 of the Exchange Act.
| Large accelerated filer o | Accelerated filer ý | Non-accelerated filer o (Do not check if a smaller reporting company) |
Smaller reporting company o Emerging growth company o |
Indicate by check mark whether the Registrant is a shell company (as defined in Rule 12b-2 of the Act). o Yes ý No
The aggregate market value of the Registrant's voting common equity held by non-affiliates of the Registrant, computed by reference to the price at which such voting common equity was last sold as of June 30, 2017, was approximately $201,313,414.72 (based on a closing price of $9.92). As a result, the Registrant is an accelerated filer as of December 31, 2017. For purposes of this computation, shares of the voting common equity beneficially owned by each executive officer and director of the Registrant disclosed in the Registrant's Definitive Proxy Statement on Schedule 14A, filed with the SEC on June 26, 2017 were deemed to be owned by affiliates of the Registrant as of June 30, 2017. Such determination should not be deemed an admission that such executive officers and directors are, in fact, affiliates of the Registrant or affiliates as of the date of this Annual Report on Form 10-K. As of March 16, 2018, the Registrant had 152,565,218 shares of Common Stock outstanding.
2
SPECIAL NOTE REGARDING FORWARD-LOOKING STATEMENTS
Certain statements included in this Annual Report on Form 10-K are not historical facts but are forward-looking statements for purposes of the safe harbor provisions under The Private Securities Litigation Reform Act of 1995. Forward-looking statements generally are accompanied by words such as "may", "should", "would", "plan", "intend", "anticipate", "believe", "estimate", "predict", "potential", "seem", "seek", "continue", "future", "will", "expect", "outlook" or other similar words, phrases or expressions. These forward-looking statements include statements regarding our industry, future events, the estimated or anticipated future results and benefits of the Business Combination, future opportunities for the combined company, and other statements that are not historical facts. These statements are based on the current expectations of Exela management and are not predictions of actual performance. These statements are subject to a number of risks and uncertainties regarding Exela's businesses, and actual results may differ materially. The factors that may affect our results include, among others: the impact of political and economic conditions on the demand for our services; the impact of a data or security breach; the impact of competition or alternatives to our services on our business pricing and other actions by competitors; our ability to address technological development and change in order to keep pace with our industry and the industries of our customers; the impact of terrorism, natural disasters or similar events on our business; the effect of legislative and regulatory actions in the United States and internationally; the impact of operational failure due to the unavailability or failure of third-party services on which we rely; the effect of intellectual property infringement; and other factors discussed in this report under the headings "Risk Factors", "Legal Proceedings", "Management's Discussion and Analysis of Financial Condition and Results of Operations" and otherwise identified or discussed in this Annual Report on Form 10-K. You should consider these factors carefully in evaluating forward-looking statements and are cautioned not to place undue reliance on such statements, which speak only as of the date of this report. It is impossible for us to predict new events or circumstances that may arise in the future or how they may affect us. We undertake no obligation to update forward-looking statements to reflect events or circumstances occurring after the date of this report. We are not including the information provided on the websites referenced herein as part of, or incorporating such information by reference into, this Annual Report on Form 10-K. In addition, forward-looking statements provide Exela's expectations, plans or forecasts of future events and views as of the date of this report. Exela anticipates that subsequent events and developments will cause Exela's assessments to change. These forward-looking statements should not be relied upon as representing Exela's assessments as of any date subsequent to the date of this report.
References to the "Company", "we", "us", or "our" in this Annual Report on Form 10-K refer to Exela Technologies, Inc. and its consolidated subsidiaries, and where applicable, our predecessors SourceHOV and Novitex prior to the closing of the Business Combination. "Following is a glossary of other abbreviations and acronyms that are found in this Annual Report on Form 10-K."
"Annual Report on Form 10-K" means this annual report on Form 10-K filed by the Company with the SEC pursuant to the Exchange Act.
"Apollo" means Apollo Global Management, LLC, together with its subsidiaries and affiliates, as applicable
"BPA" means business process automation.
"BPO" means business process outsourcing
"Business Combination" means the transactions contemplated by the Business Combination Agreement, which closed on July 12, 2017 and resulted in SourceHOV and Novitex becoming our wholly-owned subsidiaries and the financing transactions in connection therewith.
3
"Business Combination Agreement" means that certain Business Combination Agreement, dated February 21, 2017, among Quinpario Merger Sub I, Inc. ("SourceHOV Merger Sub"), the Company, Quinpario Merger Sub II, Inc. ("Novitex Merger Sub"), SourceHOV, Novitex, HOVS LLC, HandsOn Fund 4 I, LLC and Novitex Parent, L.P., as amended by that certain Consent, Waiver and Amendment, dated June 15, 2017, by and among the Company, SourceHOV Merger Sub, Novitex Merger Sub, SourceHOV, Novitex, Novitex Parent, Ex-Sigma LLC, HOVS LLC and HandsOn Fund 4 I, LLC.
"Code" means the Internal Revenue Code of 1986, as amended.
"Common Stock" means the common stock of the Company, par value $0.0001.
"EIM" means enterprise information management,
"Exchange Act" means the Securities Exchange Act of 1934, as amended.
"GAAP" means generally accepted accounting principles in the United States.
"HGM Group" means, collectively, HOVS LLC and HandsOn Fund 4 I, LLC and certain of their respective affiliates.
"HITECH Act of 2009" means the Health Information Technology for Economic and Clinical Health Act, enacted under Title XIII of the American Recovery and Reinvestment Act of 2009.
"HIPAA" means the Health Insurance Portability and Accountability Act of 1996.
"IT" mean information technology.
"JOBS Act" means the Jumpstart our Business Startups Act.
"MegaCenter" means the Company's Tier-III document processing and outsourcing centers in Windsor, Connecticut, and Austin, Texas.
"Nasdaq" means The Nasdaq Stock Market.
"Novitex" means Novitex Holdings, Inc., a Delaware corporation.
"Novitex Holdings" means Apollo Novitex Holdings, L.P., a Delaware limited partnership, which is owned and controlled by certain funds managed by affiliates of Apollo.
"Novitex Parent" means Novitex Parent, L.P., a Delaware limited partnership, which is owned and controlled by certain funds managed by affiliates of Apollo.
"PCIDSS" means the Payment Card Industry Data Security Standard.
"PIPE Investment" means the sale of shares of Common Stock in the private placement transaction of Common Stock entered into in connection with the Business Combination.
"Quinpario" means Quinpario Acquisition Corp. 2, a Delaware corporation.
"SEC" means the United States Securities and Exchange Commission.
"Securities Act" means the Securities Act of 1933, as amended.
"SourceHOV" means SourceHOV Holdings, Inc., a Delaware corporation.
"TCJA" means the Tax Cut and Jobs Act.
"TPS" means transaction processing solutions.
4
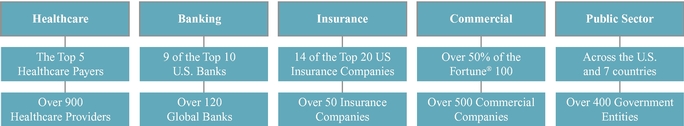
Exela Technologies, Inc. ("Exela") is a global business process automation leader combining industry-specific and industry-agnostic enterprise software and solutions (deployed on premise or on the cloud) with decades of experience. We enable our customers' organizations to more efficiently and effectively execute transactions, make decisions, drive revenue and profitability, and communicate critical information to their employees, customers, partners, and vendors. We serve over 60% of the Fortune® 100 and our solutions are deployed in banking, healthcare, insurance and other industries to support mission-critical environments. With the increased scale resulting from our Business Combination in July 2017, we are poised to expand relationships with existing customers and realize substantial synergies.
As part of the broader business process outsourcing ("BPO") industry, our technology-enabled solutions allow global organizations to address the challenges resulting from the massive amounts of data obtained and created through their daily operations. That data, and the supporting technology architecture, have become increasingly complex to manage as the volume, velocity, and variety continue to increase, requiring aggregation and integration across disparate parts of our customers' organizations. To effectively execute transactions and manage mission-critical processes, decisions need to be executed accurately, with rapid turn-around time, and often subject to various regulatory and compliance requirements. We believe our process expertise, information technology capabilities and operational insights enable our customers' organizations to more efficiently and effectively execute transactions, make decisions, drive revenue and profitability, and communicate critical information to their employees, customers, partners, and vendors. With solutions focused on enhancing the user experience, quality, and efficiency of our customers' most critical processes, we believe our value proposition positions us to be a core operations and technology partner to our customers.
We have approximately 22,000 employees as of December 31, 2017 that provide solutions and services to over 3,500 customers worldwide. For the fiscal year ended December 31, 2017, we generated $1,152.3 million of revenue of which approximately 90% is recurring in nature and supported by long-term customer contracts.
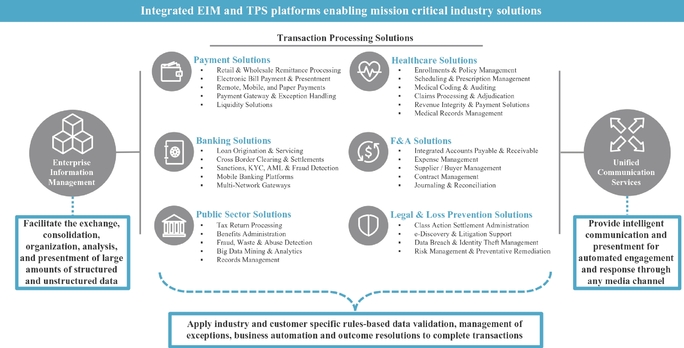
Our solutions address the life cycle of transaction processing and enterprise information management, from enabling multi-channel payment gateways and digital mailrooms with data exchanges across siloed systems, to matching inputs against contracts and handling exceptions, to ultimately depositing payments and distributing communications. As a leader in complex information processing, we specialize in transactions that require multiple layers of validation, supporting documentation processing, and reconciliation. Our suite of offerings combines platform modules across information management, payments, finance & accounting, legal & loss prevention, and unified communication services to provide both industry specific solutions, and solutions which span across multiple industries.
At the foundation of our industry-specific solution offerings, we use a combination of data-driven processes, technology, and human capital, delivered through integrated enterprise information management ("EIM") and transaction processing solutions ("TPS") platforms:
- •
- our proprietary EIM platforms facilitate the exchange, consolidation, organization, and analysis of large amounts of structured and
unstructured data that are crucial to an enterprise's ability to effectively manage decisions, and enable the presentment of critical information through our unified communication solutions. These
platforms can be hosted on customer premises, within our data centers, and/or in a cloud hosting and computing environment.
- •
- our TPS offerings then use the structured data output from our EIM platforms and apply industry and customer specific rules-based data validation, management of exceptions, business
5
- •
- our model is to provide integrated EIM and TPS platforms as industry-specific solutions, with reliable information workflows through data aggregation, seamless connectivity, and automated processes that significantly reduce cycle times and improve quality. As a result, we believe we can execute a wide range of business processes, across multiple industries that are deeply embedded in, and essential to, our customers' most critical organizational workflows.
automation, and outcome resolutions to complete transactions, customer interactions, and other operational processes.
We seek to develop long-term relationships with organizations that are information-intensive and require specialized processing or subject matter expertise. We offer solutions to highly regulated and information sensitive industries such as healthcare, banking and financial services, insurance, public, legal, and commercial sectors.
We believe that our global presence benefits our customers with a balance of proximity, solutions, and cost to meet their needs. We use a global delivery model to serve multi-national customers in over 50 countries, where we provide solutions from a network of over 1,100 onsite customer facilities and approximately 150 delivery centers, strategically located throughout the Americas, Europe, and Asia. We believe our global delivery model uniquely positions us to offer multi-lingual capabilities, optimize logistical requirements, access a large employee pool, and provide a flexible "right-shoring" solution for our customers.
Overview of Revenues
Our business consists of the following three reportable segments:
Information and Transaction Processing Solutions ("ITPS"). The ITPS segment is our largest segment, with $827.1 million of revenues for the fiscal year ended December 31, 2017, representing 72% of our revenues. ITPS provides industry-specific solutions for banking and financial services, including lending solutions for mortgages and auto loans, and banking solutions for clearing, anti-money laundering, sanctions, and cross-border settlement; property and casualty insurance solutions for enrollments, claims processing, and communications; public sector solutions for income tax processing, benefits administration, and records management; industry-agnostic solutions for payment
6
processing and reconciliation, integrated receivable and payables management, document logistics and location services, records management, and electronic storage of data/documents; and software, hardware, and maintenance related to information and transaction processing automation, among others. We generate ITPS revenues primarily from a transaction-based pricing model for the various types of volumes processed, licensing and maintenance fees for technology sales, and a mix of fixed management fee and transactional revenue for document logistics and location services.
Healthcare Solutions ("HS"). The HS segment generated $233.6 million of revenues for the fiscal year ended December 31, 2017, representing 20% of our revenues. Our HS offerings include revenue cycle solutions, integrated accounts payable and accounts receivable, and information management for both the healthcare payer and provider markets. Our payer service offerings include claims processing, claims adjudication and auditing services, enrollment processing and policy management, and scheduling and prescription management. Our provider service offerings include medical coding and insurance claim generation, underpayment audit and recovery, and medical records management. As a leader in complex claims processing, we specialize in transactions that require multiple layers of validation, supporting documentation processing, reconciliation, and management of exceptions. We generate HS revenues primarily from a transaction-based pricing model for the various types of volumes processed for healthcare payers and providers.
Legal & Loss Prevention Services ("LLPS"). The LLPS segment generated $91.6 million of revenues for the fiscal year ended December 31, 2017, representing 8% of our revenues. Our LLPS solutions include processing of legal claims for class action and mass action settlement administrations, involving project management support, notification, and outreach to claimants; and collection, analysis, and distribution of settlement funds. Additionally, we provide data and analytical services in the context of litigation consulting, economic and statistical analysis, expert witness services, and revenue recovery services for delinquent accounts receivable. We generate LLPS revenues primarily based on time and materials pricing as well as through transactional services priced on a per item basis.
Additional financial information for our three business segments is included in Note 17 within our consolidated financial statements.
We provide services to our customers on a global basis. In 2017, our revenues by geography were as follows: $1,001.8 million in the United States (86.9% of total revenues), $135.6 million in Europe (11.8% of total revenues), and $15.0 million from the rest of the world (1.3% of total revenues). We present additional geographical financial information in Note 17 within our consolidated financial statements.
Our revenues can be affected by various factors such as our customers' demand pattern for our services. These factors have historically resulted in higher revenues and profits in the fourth quarter. Backlog is not a metric that we use to measure our business.
History and Development of Our Company
Exela is a Delaware corporation that was formed through the strategic combination of SourceHOV Holdings, Inc. ("SourceHOV") a leading global transaction processing company, and Novitex Holding, Inc. ("Novitex"), a cloud-based document outsourcing company, pursuant to a business combination agreement dated February 21, 2017. Formerly known as Quinpario Acquisition Corp. 2 ("Quinpario"), Exela was originally formed as a blank check company on July 15, 2014 and completed its initial public offering on January 22, 2015. In conjunction with the completion of the Business Combination in July 2017, Quinpario was renamed "Exela Technologies, Inc." Exela began trading under the ticker "XELA" on the Nasdaq stock market on July 13, 2017.
The Business Combination was accounted for as a reverse merger for which SourceHOV was determined to be the accounting acquirer. The acquisition of Novitex was accounted for using the acquisition method. As a result, the financial information presented in this Annual Report on
7
Form 10-K is not pro forma (unless labeled as such); it includes the financial information and activities for SourceHOV for the entire year ending December 31, 2017, but only reflects the financial information and activities of Novitex for the period following the Business Combination from July 13, 2017 to December 31, 2017.
Key Business Strategies
The key elements of our growth strategy are described below:
Pursue meaningful revenue synergy opportunities. We believe we have a number of meaningful revenue synergy opportunities, including expanding the scope of our existing customer relationships, pursuing new customer opportunities, and utilizing our combined platform to develop new process capabilities and industry expertise.
- •
- Leverage BPA suite across on-site services.
Approximately 6,000 of our employees currently work at customers in an on-site capacity. We believe this on-site presence is a competitive differentiator and a valuable asset as we
pursue future growth opportunities. We aim to deploy our BPA software across these customer locations, and we believe that by offering our customers enhanced productivity and quality through our
onsite employees, we will create additional opportunities to expand our footprint and wallet share across the organization. For example, in customers where we provide underwriting support and claims
processing, we can enable our onsite employees to accelerate the aggregation and analysis of datasets while also increasing accuracy and automatically flagging deficiencies. By enhancing the
productivity and quality of our onsite employees, we believe we will increase the demand from our customers to replicate our processes across the organization, bolstering our cross-sell/up-sell
initiatives. By having our BPA suite already approved and deployed within existing onsite engagements, we believe our ability to expand into new lines of business will be streamlined and accelerated.
- •
- Expand relationships with existing customers.
We intend to aggressively pursue cross-sell and up-sell opportunities within our existing customer base. With an installed base of over 3,500 customers, we believe we have meaningful
opportunities to offer a bundled suite of services and be a "one-stop-shop" for our customers' information and transaction processing needs. Our sales force will continue to be organized on an
industry basis and will be re-deployed to remove duplication, and utilize solutions and relationships to better serve our customers across all levels of their organizations. Our sales force will be
incentivized to drive additional revenue opportunities across our bases while also driving higher-margin bundled solutions. As an example, we now offer a full suite of healthcare-focused solutions by
bundling enrollments, policy and plan management, claims processing, audit and recovery services, payment solutions, integrated accounts payable and receivable, medical records management, and unified
communication services for payers and providers.
- •
- Pursue new customer opportunities. We plan to
continue to develop new long-term, strategic customer relationships, especially where we have an opportunity to deliver a wide range of our capabilities and can have a meaningful impact on our
customers' business outcomes. For example, we plan to dedicate resources within the legal industry in order to pursue opportunities in e-discovery and contract management services.
- •
- Develop additional process capabilities and industry expertise. We will focus on developing additional process capabilities and market expertise for our core industries. We will continue to invest in technology and innovation that will accelerate the build-out of our portfolio of next-generation solutions, such as platform-based descriptive and predictive analytics services for processing flows of "Big Data" to help customers gain better insight into their processes and businesses. As an example, on behalf of our customers, we are deploying Big Data automation platforms to analyze individual consumer behavior and interaction patterns to identify
8
opportunities for revenue enhancement and loss prevention, and configure optimal outreach campaigns to drive sales, loyalty, and profitability.
Pursue meaningful cost synergy opportunities and accelerate long-term profitability. We have identified significant cost synergies that may result from the closing of the Business Combination. Due to similar operating infrastructures between SourceHOV and Novitex, we continue to believe we have opportunities across information technology, operations, facilities, and corporate functions to achieve cost savings executable over the course of 2 years from the closing of the Business Combination. We believe these cost savings are in the following categories:
- •
- Information Technology. We have opportunities
for consolidation of Information Technology ("IT") management, insourcing of third-party vendors, and savings related to consolidation of IT services and software license replacement with in-house
platforms.
- •
- Operations. We have opportunities for data
entry offshoring, regional management rationalization, and broader implementation and adoption of our own technology across our organization to replace vendor spend.
- •
- Facilities. We have opportunities for lease
and headcount savings resulting from facilities consolidation.
- •
- Corporate and Shared Services. We have opportunities for cost savings primarily across shared services, including the finance, accounting, legal, and human resources departments, in addition to vendor savings from consolidation of costs such as audit and tax, insurance, and enterprise resource planning.
Additionally, we intend to further improve our margins through increased focus on operational best practices and cost efficiency through further process standardization, increasing use of automation, and increased focus on quality. Our strategy is that over time this will result in margin expansion and enhanced productivity.
Capitalize on our enhanced scale and operating capacity. We intend to utilize our increased global scale and brand recognition to strengthen our ability to bid on new opportunities. We plan to dedicate more resources to pursue whitespace coverage to expand our range of service offerings and pursue additional cross-selling opportunities. We will also look to use our increased scale and operations expertise to improve utilization of our assets. As an example, we will pursue a strategy of consolidating smaller regional document processing centers to our two Tier-III document processing and outsourcing centers in Windsor, Connecticut, and Austin, Texas that we call "MegaCenters," which will increase efficiency through economies of scale. By driving utilization up from the current levels of the MegaCenters, we will benefit from high flow through margins from increased revenues with minimal incremental investment.
Customers
We serve over 3,500 customers across a variety of industries, including over 60% of the Fortune® 100. We believe our customers are among the leading players in their respective industries, and many of them are recurring customers that have maintained long-term relationships with us and our predecessor companies.
We have successfully leveraged our relationships with customers to offer extended value chain services, creating stickier customer relationships and increasing overall margins. Customers are increasingly turning to us due to a demonstrated ability to work on large-scale projects, past performance and record of delivery, and deep domain expertise accumulated from years of experience in key verticals. As a result, our stable base of customers and sticky, long-term relationships lead to highly predictable revenues.
9
Customer and Industry Highlights
We maintain a strong mix of diversified customers with low customer concentration. No customer accounts for more than 10% of 2017 revenue. The diversity of our customer base has contributed to the stability and predictability of our revenue streams and cash flows. We have been able to effectively balance our customer mix and reduce dependency on any single customer or vertical by penetrating a diverse set of end markets.
Research and Development
Our ability to continue to compete successfully depends heavily upon our ability to ensure a timely flow of competitive products, services and technologies to the marketplace while also leveraging our domain expertise to demonstrate our understanding in implementing solutions across the industries we serve. Through regular and sustained investment, licensing of intellectual property and acquisition of third-party businesses and technology, we continue to develop new knowledge platforms, applications and supporting service bundles that enhance and expand our existing suite of services. Additional financial information regarding our R&D expense is included in Note 2 within our consolidated financial statements.
Intellectual Property
We deploy a combination of internally-developed proprietary knowledge platforms, applications and generally available third-party licensed software as part of our scalable and flexible solutions and services. Our intellectual property is our competitive strength.
Our platforms aim to enhance information management and workflow processes through automation and process optimization to minimize labor requirements or improve labor performance. Our decisioning engines have been built with years of deep domain expertise, incorporating hundreds of thousands of customer and industry specific rules which enable the most efficient and lowest cost preparation and decisioning of transactions. Our business processes and implementation methodologies are confidential and proprietary and include trade secrets that are important to our business. We own a variety of trademarks and patents, which are registered or in the application process.
We regularly enter into nondisclosure agreements with customers, business partners, employees, and contractors that require confidential treatment of our information to establish, maintain and enforce our intellectual property rights. Our licensed intellectual properties are generally governed by written agreements of varying durations, including some with fixed terms that are subject to renewal based on mutual agreement. Generally, each agreement may be further extended and we have historically been able to renew existing agreements before they expire. We expect these and other similar agreements to be extended so long as it is mutually advantageous to both parties at the time of renewal.
Competition
We believe that the principal competitive factors in providing our solutions include proprietary platforms, industry specific knowledge, quality, reliability and security of service, and price. We are differentiated competitively given our scale of operations, reputation as a trusted partner with deep
10
domain expertise, innovative solutions, and highly integrated technology platforms that provide customers with end-to-end services addressing many aspects of their mission-critical operational processes. We continue to integrate best practice delivery processes into our service-delivery capabilities to improve its quality and service levels and to increase operational efficiencies. The markets in which we serve are competitive with both large and small businesses, as well as global companies:
- •
- Multi-national companies that provide EIM and TPS services, such as Fiserv, Jack Henry, First Data, FIS, Black Knight Financial, Open Text,
Broadridge Financial Solutions, Computershare, DST Systems and Iron Mountain;
- •
- Multi-shore BPO companies, such as Genpact, Capita, Cognizant, Exlservice, Conduent, Wipro, and WNS; and
- •
- Smaller, niche service providers in specific verticals or geographic markets.
Regulation and Compliance
We handle, directly or indirectly through customer contracts and business associate agreements, a significant amount of information, including personal and health-related information, which results in our being subject to federal, state and local privacy laws, including the Gramm-Leach-Bliley Act, HIPAA and the HITECH Act of 2009. Further, we are subject to the local rules and regulations in the other countries in which we operate, including those relating to the handling of information. In addition, services in our LLPS segment, though not directly regulated, must be provided in a manner consistent with the relevant legal framework. For example, our bankruptcy claims administration services must be provided in accordance with the requirements and deadlines of the United States Bankruptcy Code and Federal Rules of Civil Procedure. In addition, some of our customers are subject to regulatory oversight, which may result in our being reviewed from time to time by such oversight bodies. Further, as a government contractor, we are subject to associated regulations and requirements.
Other laws apply to our processing of individually identifiable information. These laws have been subject to frequent changes, and new legislation in this area may be enacted at any time. Changes to existing laws, introduction of new laws in this area, or failure to comply with existing laws that are applicable to us may subject us to, among other things, additional costs or changes to our business practices, liability for monetary damages, fines and/or criminal prosecution, unfavorable publicity, restrictions on our ability to obtain and process information and allegations by our customers and customers that we have not performed our contractual obligations, any of which may have a material adverse effect on profitability and cash flow.
Privacy and Information Security Regulations
The processing and transfer of personal information is required to provide certain of our services. Data privacy laws and regulations in the U.S. and foreign countries apply to the access, collection, transfer, use, storage, and destruction of personal information. In the U.S., our financial institution customers are required to comply with privacy regulations imposed under the Gramm-Leach-Bliley Act, in addition to other regulations. As a processor of personal information in our role as a provider of services to financial institutions, we are required to comply with privacy regulations and are bound by similar limitations on disclosure of the information received from our customers as apply to the financial institutions themselves. We also perform services for healthcare companies and are, therefore, subject to compliance with laws and regulations regarding healthcare information, including in the U.S., HIPAA. We also perform credit-related services and agree to comply with payment card standards, including the PCIDSS. In addition, federal and state privacy and information security laws, and consumer protection laws, which apply to businesses that collect or process personal information, also apply to our businesses.
11
Privacy laws and regulations may require notification to affected individuals, federal and state regulators, and consumer reporting agencies in the event of a security breach that results in unauthorized access to, or disclosure of, certain personal information. Privacy laws outside the U.S. may be more restrictive and may require different compliance requirements than U.S. laws and regulations, and may impose additional duties on us in the performance of our services.
There has been increased public attention regarding the use of personal information and data transfer, accompanied by legislation and regulations intended to strengthen data protection, information security and consumer and personal privacy. The law in these areas continues to develop and the changing nature of privacy laws in the U.S., the European Union and elsewhere could impact our processing of personal information of our employees and on behalf of our customers. The European Union adopted a comprehensive General Data Privacy Regulation (the "GDPR") in May 2016 that will replace the current EU Data Protection Directive and related country-specific legislation. The GDPR will become fully effective in May 2018. While we believe that we are compliant with its regulatory responsibilities, information security threats continue to evolve resulting in increased risk and exposure. In addition, legislation, regulation, litigation, court rulings, or other events could expose us to increased costs, liability, and possible damage to our reputation.
Employees
The continued success of our business is driven by our people. Our senior leadership team has extensive experience within the larger BPO as well as the BPA industry. As we were formed through a series of acquisitions, we have retained an experienced and cohesive leadership team. The combination of our employees with our technology is the backbone of our ability to provide customers with holistic solutions designed to meet the rapidly evolving needs of our customers.
As of December 31, 2017, we had approximately 22,000 total employees, which included approximately 20,700 full-time and 1,300 part-time employees. We have a global workforce with a majority of our employees located in the United States, and the remainder located in Europe, India, the Philippines, Mexico, and China. Our employee count fluctuates from time to time based upon the timing and duration of our engagements. We consider our relationship with our employees to be good.
We locate our operation centers in areas where the value proposition it offers is attractive to the employees in the area relative to other local opportunities, resulting in an engaged workforce that is able to make a meaningful global contribution from their local marketplace. To supplement the skills available in certain markets, we offer our employees a focused set of training programs to increase their skills and leadership capabilities with the goal of creating a long-term funnel of talent to support the Company's continued growth. Additionally, our proprietary platforms enable rapid learning and facilitate knowledge transfer among employees, reducing training time.
Available Information
Our website address is www.exelatech.com. We are not including the information provided on our website as a part of, or incorporating it by reference into, this Annual Report on Form 10-K. We make available free of charge (other than an investor's own internet access charges) through our website our annual reports on Form 10-K, quarterly reports on Form 10-Q, current reports on Form 8-K, and amendments to these reports, as soon as reasonably practicable after we electronically file such material with, or furnish such material to, the Securities and Exchange Commission (the "SEC"). In addition, we make available our code of ethics entitled "Global Code of Ethics and Business Conduct" free of charge through our website. We intend to post on our website all disclosures that are required by law or Nasdaq listing standards concerning any amendments to, or waivers from, any provision of our code of ethics.
The public may read and copy any materials filed by us with the SEC at the SEC's Public Reference Room at 100 F Street, NE, Room 1580, Washington, DC 20549. The public may obtain information on the operation of the Public Reference Room by calling the SEC at 1-800-SEC-0330. The SEC maintains an internet site that contains reports, proxy and information statements and other information regarding issuers that file electronically with the SEC at www.sec.gov. The information contained on the websites referenced in this Form 10-K is not incorporated by reference into this filing.
12
In addition to the other information contained in this Annual Report on Form 10-K, the following risks impact our business and operations. These risk factors are not exhaustive and all investors are encouraged to perform their own investigation with respect to our business, financial condition and prospects. Unless otherwise indicated or the context otherwise requires, references in this "Risk Factors" section to "Exela," "we," "our," "us" and other similar terms refer to Exela Technologies, Inc. and its consolidated subsidiaries.
Risks Related to our Business
Our results of operations could be adversely affected by economic and political conditions, creating complex risks, many of which are beyond our control.
Our business depends on the continued demand for our services, and, if current global economic conditions worsen, our business could be adversely affected by our customers' financial condition and level of business activity. Along with our customers we are subject to global political, economic and market conditions, including inflation, interest rates, energy costs, the impact of natural disasters, military action and the threat of terrorism. In particular, we currently derive, and are likely to continue to derive, a significant portion of revenues from customers located in the U.S. Any future decreases in the general level of economic activity, such as decreases in business and consumer spending and increases in unemployment rates, could result in a decrease in demand for our services, thus reducing our revenue. For example, certain customers may decide to reduce or postpone their spending on the services we provide, and we may be forced to lower our prices. Other developments in response to economic events, such as consolidations, restructurings or reorganizations, particularly involving our customers, could also cause the demand for our services to decline, negatively affecting the amount of business that we are able to obtain or retain. We may not be able to predict the impact such conditions will have on the industries we serve and may be unable to plan effectively for or respond to such impact. In response to economic and market conditions, from time to time we have undertaken or may undertake initiatives to reduce our cost structure where appropriate, such as consolidation of resources to provide functional region-wide support to our international subsidiaries in a centralized fashion. These initiatives, as well as any future workforce and facilities reductions we may implement, may not be sufficient to meet current and future changes in economic and market conditions and allow us to continue to achieve the growth rates expected. In addition, costs actually incurred in connection with certain restructuring actions may be higher than our estimates of such costs and/or may not lead to the anticipated cost savings.
In addition, any future disruptions or turbulence in the global credit markets may adversely affect our liquidity and financial condition, and the liquidity and financial condition of our customers. Such disruptions may limit our ability to access financing, increase the cost of financing needed to meet liquidity needs and affect the ability of our customers to use credit to purchase our services or to make timely payments to us, adversely affecting our financial condition and results of operations.
Cybersecurity issues, vulnerabilities, and criminal activity resulting in a data or security breach could result in risks to our systems, networks, products, solutions and services resulting in liability or reputational damage.
We collect and retain large volumes of internal and customer data, including personally identifiable information and other sensitive data both physically and electronically, for business purposes, and our various information technology systems enter, process, summarize and report such data. We also maintain personally identifiable information about our employees. Safeguarding customer, employee and our own data is a key priority for us, and our customers and employees have come to rely on us for the protection of their personal information. Augmented vulnerabilities, threats and more sophisticated and targeted cyber-related attacks pose a risk to our security and the security of our customers, partners, suppliers and third-party service providers, and to the confidentiality, availability
13
and integrity of data owned by us or our customers. Despite our efforts to protect sensitive, confidential or personal data or information, we may be vulnerable to material security breaches, theft, misplaced or lost data, programming errors, employee errors and/or malfeasance that could potentially lead to the compromising of sensitive, confidential or personal data or information, improper use of our systems, software solutions or networks, unauthorized access, use, disclosure, modification or destruction of information, defective products, production downtimes and operational disruptions. Despite protective measures, we may not be successful in preventing security breaches which compromise the confidentiality and integrity of this data. While an attempt is made to mitigate these risks by employing a number of measures, including employee training, monitoring and testing, and maintenance of protective systems and contingency plans, we remain vulnerable to such threats.
The sensitive, confidential or personal data or information that we have access to is also subject to privacy and security laws, regulations or customer-imposed controls. The regulatory environment, as well as the requirements imposed on us by the industries we serve governing information, security and privacy laws is increasingly demanding. Maintaining compliance with applicable security and privacy regulations may increase our operating costs and/or adversely impact our ability to provide services to our customers. Furthermore, a compromised data system or the intentional, inadvertent or negligent release or disclosure of data could result in theft, loss, fraudulent or unlawful use of customer, employee or our data which could harm our reputation or result in remedial and other costs, fines or lawsuits. In addition, a cyber-related attack could result in other negative consequences, including damage to our reputation or competitiveness, remediation or increased protection costs, litigation or regulatory action. Fraud, employee negligence, unauthorized access, including, without limitation, malfunctions, viruses and other events beyond our control, may lead to the misappropriation or unauthorized disclosure of sensitive or confidential information we process, store and transmit, including personal information, for our customers, failure to prevent or mitigate data loss or other security breaches, including breaches of our vendors' technology and systems, could expose us or our customers to a risk of loss or misuse of such information, adversely affect our operating results, result in litigation or potential liability for us and otherwise harm our business. As a result, we may be subject to monetary damages, regulatory enforcement actions or fines under federal legislation, such as, the Gramm-Leach-Bliley Act and HIPAA, as well as various states laws. Similarly, regulations such as the Health Information Technology for Economic and Clinical Health Act provisions of the American Recovery and Reinvestment Act of 2009 expand the obligations of "covered entities" and their business associates, including certain mandatory breach notification requirements. In addition to any legal liability, data or security breaches may lead to negative publicity, reputational damage and otherwise adversely affect the results of our operations.
Our industry may be adversely impacted by a negative public reaction in the U.S. and elsewhere to providing certain of our services from outside the U.S. and recently proposed related legislation.
We have based our strategy of future growth on certain assumptions regarding our industry and future demand in the market for the provision of business process solutions in part using offshore resources. However, providing services from offshore locations is a politically sensitive topic in the U.S. and elsewhere, and many organizations and public figures have publicly expressed concern about a perceived association between offshore service providers and the loss of jobs in their home countries. In addition, there has been limited publicity about the negative experience of certain companies that provide their services offshore, particularly in India. The trend of providing business process solutions offshore may not continue and could reverse if companies elect to develop and perform their business processes internally or are discouraged from transferring these services to offshore service providers. Any slowdown or reversal of existing industry trends could negatively affect the amount of business that we are able to obtain or retain.
14
A variety of U.S. federal and state legislation has been proposed that, if enacted, could restrict or discourage U.S. companies from providing their services from outside the U.S., including recently introduced proposals for providing tax and other economic incentives for companies that create jobs in the U.S. by reducing their reliance on offshore locations. Other state bills have proposed requiring offshore service providers to disclose their geographic locations, requiring notice to individuals whose personal information is disclosed to non-U.S. affiliates or subcontractors, requiring disclosures of companies' foreign outsourcing practices or restricting U.S. private sector companies that have government contracts, grants or guaranteed loan programs from providing their services. Because most of our customers are located in the U.S., any expansion of existing laws or the enactment of new legislation that constrains our ability to provide our solutions from offshore or otherwise makes using our services unappealing or impractical for our customers could have a material and adverse effect on our business, results of operations, financial condition and cash flows.
The HGM Group has significant influence over us and our corporate governance.
The HGM Group beneficially owns over 50% of our Common Stock. As long as the HGM Group owns or controls a significant percentage of outstanding voting power, it will have the ability to strongly influence all corporate actions requiring stockholder approval, including the election and removal of directors and the size of our board of directors, any amendment of our certificate of incorporation or bylaws, or the approval of any merger or other significant corporate transaction, including a sale of substantially all of our assets. In addition, pursuant to the terms of the Director Nomination Agreement, the HGM Group (as well as Novitex Holdings) have certain nomination rights with respect to our board of directors and consent rights over certain of our corporate actions.
Additionally, the HGM Group's interests may not align with the interests of our other stockholders. The HGM Group is in the business of making investments in companies and may acquire and hold interests in businesses that compete directly or indirectly with us. The HGM Group may also pursue acquisition opportunities that may be complementary to our business, and, as a result, those acquisition opportunities may not be available to us. In addition, our certificate of incorporation provides that we renounce any interest or expectancy in the business opportunities of the HGM Group and that it shall not have any obligation to offer to us those opportunities unless presented to one of our directors or officers in his or her capacity as a director or officer.
Certain services we provide to customers in our public sector vertical may be subject to additional restrictions or limitations.
Our engagements with entities in the public sector, including educational institutions, may be subject to compliance with additional legislative or regulatory requirements. Certain state and local governments and agencies have adopted, or may in the future adopt, legislation or rules imposing additional requirements on services provided to the public sector, including restrictions as to where certain services can be performed or where certain data can be stored, even within the U.S. Additionally, our employees who are staffed on certain public sector engagements may be subject to strict background checks or other certifications. These additional requirements may make it more difficult to staff large public sector engagements, require us to turn down new engagements, affect our ability to meet customer expectations, deadlines or other specifications and otherwise increase our costs or decrease our revenues. Further, there can be no assurances that a public sector entity will not face funding shortages or reallocate funding for our services to other priorities, either prior to or after we have begun to perform our services, which could impact whether we are fully compensated for our services and could have a material adverse effect on our business, results of operations, financial condition and cash flows.
15
Certain of our contracts are subject to termination rights, audits and/or investigations, which, if exercised, could negatively impact our reputation and reduce our ability to compete for new contracts and have an adverse effect on our business, results of operations and financial condition.
Many of our customer contracts may be terminated by our customers without cause and without any fee or penalty, with only limited notice. Any failure to meet a customer's expectations, as well as factors beyond our control, including a customer's financial condition, strategic priorities, or mergers and acquisitions, could result in a cancellation or non-renewal of such a contract or a decrease in business provided to us and cause our actual results to differ from our forecasts. We may not be able to replace any customer that elects to terminate or not renew its contract with us, which would reduce our revenues.
In addition, a portion of our revenues is derived from contracts with the U.S. federal and state government and their agencies and from contracts with foreign governments and their agencies. Government entities typically finance projects through appropriated funds. While these projects are often planned and executed as multi-year projects, government entities usually reserve the right to change the scope of or terminate these projects for lack of approved funding and/or at their convenience. Changes in government or political developments, including budget deficits, shortfalls or uncertainties, government spending reductions (e.g., Congressional sequestration of funds under the Budget Control Act of 2016 or during a government shutdown) or other debt or funding constraints, such as those recently experienced in the U.S. and Europe, could result in lower governmental sales and in our projects being reduced in price or scope or terminated altogether, which also could limit our recovery of incurred costs, reimbursable expenses and profits on work completed prior to the termination. The federal procurement environment is unpredictable and this could adversely affect our ability to perform work under new and existing contracts. Also, our government business is subject to the risk that one or more of our potential contracts or contract extensions may be diverted by the contracting agency to a small or disadvantaged or minority-owned business pursuant to set-aside programs administered by the Small Business Administration, or may be bundled into large multiple award contracts for very large businesses. These risks can potentially have an adverse effect on our revenue growth and profit margins.
If the government finds that it inappropriately charged any costs to a contract, the costs are not reimbursable or, if already reimbursed, the cost must be refunded to the government. Additionally, if the government discovers improper or illegal activities or contractual non-compliance (including improper billing), we may be subject to various civil and criminal penalties and administrative sanctions, which may include termination of contracts, forfeiture of profits, suspension of payments, fines and suspensions or debarment from doing business with the government. Any resulting penalties or sanctions could materially adversely affect our results of operations and financial condition. Moreover, government contracts are generally subject to audits and investigations by government agencies. Further, the negative publicity that could arise from any such penalties, sanctions or findings in such audits or investigations could have an adverse effect on our reputation in the industry and reduce our ability to compete for new contracts and could materially adversely affect our results of operations and financial condition.
Our services and facilities may be impacted by terrorism, natural disasters and other disruptions, resulting in an adverse effect on our profitability and financial condition.
Our ability to provide services may be impacted or disrupted as a result of natural disasters, technical disruptions (including power outage and telecommunications failure), man-made events (including cyber-attacks, war and terrorist attacks), and global health risks or pandemics, as well as the threat or perceived threat of any of these events in the U.S. or any of the locations in which we operate. A significant portion of our employees and key operations centers are located in India and the Philippines, with, particularly in India, limited diversification or redundancy. India and the Philippines
16
are particularly susceptible to natural disasters, including typhoons, tsunamis, floods and earthquakes, and the Philippines is additionally susceptible to volcanic eruptions. Our operations in these locations, as well as certain other countries outside of the U.S., are also at greater risk of disruptions in electricity, other public utilities or network services due to substandard infrastructure. Although all of our operations centers have disaster management plans, certain disaster management facilities, particularly in India, may not be adequate to protect against potential disruptions due to natural or other disasters. Damage, destruction or disruptions, including to our MegaCenters, could make it difficult or impossible for employees to reach our business locations or otherwise interrupt our ability to provide our services. Sustained periods of interruption in our services could adversely affect our reputation and relationships with our customers, cause us to incur substantial expenses and expose us to liability. Our insurance coverage may not be sufficient to cover all of our potential losses and our business, results of operation and financial condition could be adversely affected.
Any disruption related to our U.S. data centers or MegaCenters due to any of the foregoing events may cause significant disruptions in our ability to provide our services to our customers and result in a material adverse effect on our reputation, results of operations and financial condition and our business, results of operations and financial condition could be adversely affected.
Although we believe that our insurance coverage with respect to disruptive events is reasonable, significant events such as acts of war and terrorism, economic conditions, judicial decisions, legislation, natural disasters and large losses could materially affect our insurance obligations and future expense.
Our executives, senior management team and other key personnel are critical to our continued success and the loss of such personnel, or an inability to attract, engage, retain and integrate our executives and other key employees could harm our business.
Our future success substantially depends on the continued service and performance of our executives, senior management team, as well as other key individuals in senior leadership positions. These personnel possess business and technical capabilities that are difficult to replace. The loss of any of our key personnel, particularly to competitors, may adversely affect our ability to effectively manage our current operations or meet ongoing and future business challenges. Further, identifying, developing internally or hiring externally, training and retraining highly-skilled managerial, technical, sales and services, finance and marketing personnel are critical to our future. Failure to successfully hire executives and key employees or the loss of any executives and key employees could have a significant impact on our operations.
Our business, financial position, and results of operations could be harmed by adverse rating actions by credit rating agencies.
If the credit ratings of our outstanding indebtedness are downgraded, or if rating agencies indicate that a downgrade may occur, our business, financial position, and results of operations could be adversely affected and perceptions of our financial strength could be damaged. A downgrade would have the effect of increasing our borrowing costs, and could decrease the availability of funds we are able to borrow, adversely affecting our business, financial position, and results of operations. In addition, a downgrade could adversely affect our relationships with our customers.
Our management team has limited experience managing a public company.
Most members of our management team have limited experience managing a publicly traded company, interacting with public company investors and complying with the increasingly complex laws pertaining to public companies. Our management team may not successfully or efficiently manage the next stages of our transition to being a public company subject to significant regulatory oversight and reporting obligations under the federal securities laws and the scrutiny of securities analysts and
17
investors. These new obligations and constituents will require significant attention from our management team and could divert their attention away from the day-to-day management of our business, which could materially adversely affect our business, financial condition and operating results.
The requirements of being a public company may strain our resources, divert management's attention and affect our ability to attract and retain qualified board members.
As a public company, we are subject to the reporting requirements of the Exchange Act, the listing requirements of the Nasdaq and other applicable securities rules and regulations. Compliance with these rules and regulations will increase our legal and financial compliance costs, make some activities more difficult, time-consuming or costly, and increase demand on our systems and resources, particularly as we are no longer an emerging growth company. Among other things, the Exchange Act requires that we file annual, quarterly and current reports with respect to our business and operating results and maintain effective disclosure controls and procedures and internal control over financial reporting. In order to maintain and, if required, improve our disclosure controls and procedures and internal control over financial reporting to meet this standard, significant resources and management oversight may be required. As a result, management's attention may be diverted from other business concerns, which could harm our business and operating results. Although we have already hired additional employees to comply with these requirements, we may need to hire even more employees in the future, which will increase our costs and expenses.
We are currently evaluating our internal controls, identifying and remediating any deficiencies in those internal controls and documenting the results of our evaluation, testing and remediation. We may not be able to complete our evaluation, testing and any required remediation in a timely fashion. During the evaluation and testing process, if we identify one or more material weaknesses in our internal control over financial reporting that we are unable to remediate before the end of the same fiscal year in which the material weakness is identified, we will be unable to assert that our internal controls are effective. If we are unable to assert that our internal control over financial reporting is effective, or if our auditors are unable to attest to management's report on the effectiveness of our internal controls, we could lose investor confidence in the accuracy and completeness of our financial reports, which would cause the price of our Common Stock to decline.
In addition, changing laws, regulations and standards relating to corporate governance and public disclosure are creating uncertainty for public companies, increasing legal and financial compliance costs and making some activities more time consuming. These laws, regulations, and standards are subject to varying interpretations, in many cases due to their lack of specificity, and, as a result, their application in practice may evolve over time as new guidance is provided by regulatory and governing bodies. This could result in continuing uncertainty regarding compliance matters and higher costs necessitated by ongoing revisions to disclosure and governance practices. We intend to invest resources to comply with evolving laws, regulations and standards, and this investment may result in increased general and administrative expense and a diversion of management's time and attention from revenue-generating activities to compliance activities. If our efforts to comply with new laws, regulations and standards differ from the activities intended by regulatory or governing bodies, regulatory authorities may initiate legal proceedings against us and our business may be harmed.
As a result of being a public company and these new rules and regulations, it is more expensive for us to obtain director and officer liability insurance, and in the future we may be required to accept reduced coverage or incur substantially higher costs to obtain coverage. These factors could also make it more difficult for us to attract and retain qualified members of our board of directors, particularly to serve on our audit committee and compensation committee, and qualified executive officers.
18
Failure to establish and maintain effective internal controls in accordance with Section 404 of the Sarbanes-Oxley Act could have a material adverse effect on our business and stock price.
For purposes of this annual report, we are not required to comply with the rules of the SEC implementing Section 404 of the Sarbanes-Oxley Act and are therefore not required to make a formal assessment of the effectiveness of our internal control over financial reporting for that purpose. As a newly public company, we are required to comply with the SEC's rules implementing Sections 302 and 404 of the Sarbanes-Oxley Act, which requires management to certify financial and other information in our quarterly and annual reports and provide an annual management report on the effectiveness of controls over financial reporting. Though we are required to disclose changes made in our internal controls and procedures on a quarterly basis, we are not required to make our first annual assessment of our internal control over financial reporting pursuant to Section 404 until the year following our first annual report required to be filed with the SEC. Our independent registered public accounting firm will not be required to formally attest to the effectiveness of our internal control over financial reporting pursuant to Section 404 until the year following our first annual report required to be filed with the SEC. At such time, our independent registered public accounting firm, and management, may issue a report that is adverse in the event it is not satisfied with the level at which our controls are documented, designed or operating.
To comply with the requirements of being a public company, we have undertaken various actions, and may need to take additional actions, such as implementing new internal controls and procedures and hiring additional accounting staff. Testing and maintaining internal control can divert our management's attention from other matters that are important to the operation of our business. Additionally, when evaluating our internal control over financial reporting, we may identify material weaknesses that we may not be able to remediate in time to meet the applicable deadline imposed upon us for compliance with the requirements of Section 404. If we identify any material weaknesses in our internal control over financial reporting or are unable to comply with the requirements of Section 404 in a timely manner or assert that our internal control over financial reporting is effective, or if our independent registered public accounting firm is unable to express an opinion as to the effectiveness of our internal control over financial reporting once we are no longer an emerging growth company, investors may lose confidence in the accuracy and completeness of our financial reports and the market price of our Common Stock could be materially adversely affected, and we could become subject to investigations by the stock exchange on which our securities are listed, the SEC or other regulatory authorities, which could require additional financial and management resources.
Elevated levels of leverage may harm our financial condition and results of operations.
As of December 31, 2017, we had approximately $1.276 billion of long-term debt, excluding current maturities. We and our subsidiaries may incur additional indebtedness in the future. Our indebtedness could: decrease our ability to obtain additional financing for working capital, capital expenditures, general corporate or other purposes; limit our flexibility to make acquisitions; increase our cash requirements to support the payment of interest; limit our flexibility in planning for, or reacting to, changes in our business and our industry; and increase our vulnerability to adverse changes in general economic and industry conditions. Our ability to make payments of principal and interest on our indebtedness depends upon our future performance, which will be subject to general economic conditions and financial, business and other factors affecting our consolidated operations, many of which are beyond our control. In addition, if our outstanding senior notes are downgraded to below investment grade, we may incur additional interest expense. If we are unable to generate sufficient cash flow from operations in the future to service our debt and meet our other cash requirements, we may be required, among other things: to seek additional financing in the debt or equity markets; to refinance or restructure all or a portion of our indebtedness; or to reduce or delay planned capital or operating expenditures. Such measures might not be sufficient to enable us to service our debt and
19
meet our other cash requirements. In addition, any such financing, refinancing or sale of assets might not be available at all or on economically favorable terms.
If more stringent labor laws become applicable to us or if a significant number of our employees unionize, our profitability may be adversely affected.
Increased labor costs due to competition, increased minimum wage or employee benefits costs (including various federal, state and local actions to increase minimum wages), unionization activity or other factors would adversely impact our cost of sales and operating expenses. For example, the State of California has passed regulations which increased minimum wage rates from $10.50 per hour to $11.00 per hour, effective January 1, 2018, and will gradually increase to $15.00 per hour by 2022. In addition, the federal government and a number of other states are evaluating various proposals to increase their respective minimum wage. As minimum wage rates increase, we may need to increase not only the wages of our minimum wage employees but also the wages paid to employees at wage rates that are above minimum wage. As a result, we anticipate that our labor costs will continue to increase.
We are subject to applicable rules and regulations relating to our relationship with our employees, including minimum wage and break requirements, health benefits, unemployment and sales taxes, overtime, and working conditions and immigration status. Legislated increases in the minimum wage and increases in additional labor cost components, such as employee benefit costs, workers' compensation insurance rates, compliance costs and fines, as well as the cost of litigation in connection with these regulations, would increase our labor costs. Unionizing and collective bargaining efforts have received increased attention nationwide in recent periods. While a small number of our employees belong to unions, should our employees become represented by unions, we would be obligated to bargain with those unions with respect to wages, hours, and other terms and conditions of employment, which is likely to increase our labor costs. Moreover, as part of the process of union organizing and collective bargaining, strikes and other work stoppages may occur, which would cause disruption to our business. Similarly, many employers nationally in similar environments have been subject to actions brought by governmental agencies and private individuals under wage-hour laws on a variety of claims, such as improper classification of workers as exempt from overtime pay requirements and failure to pay overtime wages properly, with such actions sometimes brought as class actions. These actions can result in material liabilities and expenses. Should we be subject to employment litigation, such as actions involving wage-hour, overtime, break, and working time, we may distract our management from business matters and result in increased labor costs. If costs of labor increase significantly, our business, results of operations, and financial condition may be adversely affected.
We may not always offset increased costs with increased fees under long-term contracts.
The pricing and other terms of our customer contracts, particularly our long-term contact center agreements, are based on estimates and assumptions we make at the time we enter into these contracts. These estimates reflect our best judgments regarding the nature of the engagement and our expected costs to provide the contracted services and could differ from actual results. Not all our larger long-term contracts allow for escalation of fees as our cost of operations increase and those that allow for such escalations do not always allow increases at rates comparable to increases that we experience due to rising minimum wage costs and related payroll cost increases. If we cannot negotiate long-term contract terms that provide for fee adjustments to reflect increases in our cost of service delivery, our business, financial conditions, and results of operation would be materially impacted.
20
Our business process solutions often require long selling cycles and long implementation periods that may result in significant upfront expenses that may not be recovered.
We often face long selling cycles to secure new contracts for our business process solutions. If we are successful in obtaining an engagement, the selling cycle can be followed by a long implementation period during which we plan our services in detail and demonstrate to the customer our ability to successfully integrate our solutions with the customer's internal operations. Our customers may experience delays in obtaining internal approvals or delays associated with technology or system implementations which can further lengthen the selling cycle or implementation period, and certain engagements may also require a ramping up period after implementation before we can commence providing our services. Even if we succeed in developing a relationship with a potential customer and begin to discuss the services in detail, the potential customer may choose a competitor or decide to retain the work in-house prior to the time a contract is signed. In addition, once a contract is signed, we sometimes do not begin to receive revenue until completion of the implementation period and our solution is fully operational. The extended lengths of our selling cycles and implementation periods can result in the incurrence of significant upfront expenses that may never result in profits or may result in profits only after a significant period of time has elapsed, which may negatively impact our financial performance. For example, we generally hire new employees to provide services in connection with certain large engagements once a new contract is signed. Accordingly, we may incur significant costs associated with these hires before we collect corresponding revenues. Our inability to obtain contractual commitments after a selling cycle, maintain contractual commitments after the implementation period or limit expenses prior to the receipt of corresponding revenue may have a material adverse effect on our business, results of operations and financial condition.
We face significant competition from U.S.-based and non-U.S.-based companies and from our customers who may elect to perform their business processes in-house.
Our industry is highly competitive, fragmented and subject to rapid change. We compete primarily against large multi-national information technology companies, focused BPO companies based in offshore locations, BPO divisions of information technology companies located in India, other BPO and consulting providers that focus on the legal sector and the in-house capabilities of our customers and potential customers. These competitors may include entrants from adjacent industries or entrants in geographic locations with lower costs than those in which we operate.
We believe that the principal competitive factors in our markets are breadth and depth of process expertise, knowledge of industries served, service quality, scalability of solutions, the ability to attract, train and retain qualified people, compliance rigor, global delivery capabilities, outcome-based pricing and sales and customer management capabilities. Some of our competitors have greater financial, marketing, technological or other resources, larger customer bases and more established reputations or brand awareness than we do. In addition, some of our competitors who do not have, or have limited, global delivery capabilities may expand their delivery centers to the countries in which we operate or increase our capacity in lower cost geographies, which could result in increased competition. Some of our competitors may also enter into strategic or commercial relationships among themselves or with larger, more established companies in order to benefit from increased scale and enhanced scope capabilities or enter into similar arrangements with potential customers. Further, we expect competition to intensify in the future as more companies enter our markets and customers consolidate the services they require among fewer vendors. Increased competition, our inability to compete successfully against competitors, pricing pressures or loss of market share could result in reduced operating margins, which could adversely affect our business, results of operations and financial condition.
21
Our industry is characterized by rapid technological change and failure to compete successfully within the industry and address rapid technological change could adversely affect our results of operations and financial condition.
The process of developing new services and solutions is inherently complex and uncertain. It requires accurate anticipation of customers' changing needs and emerging technological trends. We must make long-term investments and commit significant resources before knowing whether these investments will eventually result in services that achieve customer acceptance and generate the revenues required to provide desired returns. If we fail to accurately anticipate and meet our customers' needs through the development of new technologies and service offerings or if our new services are not widely accepted, we could lose market share and customers to our competitors and that could materially adversely affect our results of operations and financial condition.
More specifically, the business process solutions industry is characterized by rapid technological change, evolving industry standards and changing customer preferences. The success of our business depends, in part, upon our ability to develop technology and solutions that keep pace with changes in our industry and the industries of our customers. Although we have made, and will continue to make, significant investments in the research, design and development of new technology and platforms-driven solutions, we may not be successful in addressing these changes on a timely basis or in marketing the changes we implement. In addition, products or technologies developed by others may render our services uncompetitive or obsolete. Failure to address these developments could have a material adverse effect on our business, results of operations and financial condition.
In addition, existing and potential customers are actively shifting their businesses away from paper-based environments to electronic environments with reduced needs for physical document management and processing. This shift may result in decreased demand for the physical document management services we provide such that our business and revenues may become more reliant on technology-based services in electronic environments, which are typically provided at lower prices compared to physical document management services. Though we have solutions for customers seeking to make these types of transitions, a significant shift by our customers away from physical documents to non-paper based technologies, whether now existing or developed in the future, could adversely affect our business, results of operation and financial condition.
Also, some of the large international companies in the industry have significant financial resources and compete with us to provide document processing services and/or business process services. We compete primarily on the basis of technology, performance, price, quality, reliability, brand, distribution and customer service and support. Our success in future performance is largely dependent upon our ability to compete successfully, to promptly and effectively react to changing technologies and customer expectations and to expand into additional market segments. To remain competitive, we must develop services and applications; periodically enhance our existing offerings; remain cost efficient; and attract and retain key personnel and management. If we are unable to compete successfully, we could lose market share and important customers to our competitors and that could materially adversely affect our results of operations and financial condition.
We rely, in some cases, on third-party hardware and software, which could cause errors or failures of our services and could also result in adverse effects for our business and reputation if these third-party services fail to perform properly or are no longer available.
Although we developed our platform-driven solutions internally, we rely, in some cases, on third-party hardware and software in connection with our service offerings which we either purchase or lease from third-party vendors. We are generally able to select from a number of competing hardware and software applications, but the complexity and unique specifications of the hardware or software makes design defects and software errors difficult to detect. Any errors or defects in third-party hardware or
22
software incorporated into our service offerings, may result in a delay or loss of revenue, diversion of resources, damage to our reputation, the loss of the affected customer, loss of future business, increased service costs or potential litigation claims against us.
Further, this hardware and software may not continue to be available on commercially reasonable terms or at all. Any loss of the right to use any of this hardware or software could result in delays in the provisioning of our services, which could negatively affect our business until equivalent technology is either developed by us or, if available, is identified, obtained and integrated. In addition, it is possible that our hardware vendors or the licensors of third-party software could increase the prices they charge, which could have a material adverse impact on our results of operations. Further, changing hardware vendors or software licensors could detract from management's ability to focus on the ongoing operations of our business or could cause delays in the operations of our business.
Some of the work we do involves greater risks than other types of claims processing or document management engagements.
We provide certain business process solutions for customers that, for financial, legal or other reasons, may present higher risks compared to other types of claims processing or document management engagements. Examples of higher risk engagements include, but are not limited to:
- •
- class action and other legal distributions involving significant sums of money;
- •
- economic analysis and expert testimony in high stakes legal matters; and
- •
- engagements where we receive or process sensitive data, including personal consumer or private health information.
While we attempt to identify higher risk engagements and customers and mitigate our exposure by taking certain preventive measures and, where necessary, turning down certain engagements, these efforts may be ineffective and an actual or alleged error or omission on our part, the part of our customer or other third parties or possible fraudulent activity in one or more of these higher-risk engagements could result in the diversion of management resources, damage to our reputation, increased service costs or impaired market acceptance of our services, any of which could negatively impact our business and our financial condition.
We encounter professional conflicts of interest.
We encounter professional conflicts of interest, particularly in our provision of expert witness testimony in certain of our legal engagement services. Although we have systems and procedures to identify potential conflicts of interest prior to accepting a new engagement, there is no guarantee that all potential conflicts of interest will be identified, and undetected conflicts may result in damage to our reputation and result in professional liability, which may adversely impact our business and results of operations. If we are unable to accept new engagements for any reason, including business and legal conflicts, our professionals may become underutilized or discontented, which may adversely affect our future revenues and results of operations, as well as our ability to retain these professionals.
New, more stringent privacy and data security regulations may have a negative impact on our business.
Any inability to adequately address privacy and security concerns could result in expenses and liability, and adverse impact on us. Every country in which we provide services has established its own data security and privacy legal framework and in many jurisdictions, enforcement actions and consequences for noncompliance are also rising (e.g., in Europe, the Data Protection Directive, with each country enacting data protection legislation in accordance with European Union guidelines). Some of these countries, such as Canada, limit the transfer of information of their residents outside of the country, which may impact the way we provide services in those locations. Other countries, such as
23
China, limit the kind of information that may be processed inside the country. Personal privacy and data security are increasingly the focus of expanded regulation in Europe, and many other jurisdictions where we provide services to our customers.
Industry groups impose self-regulatory standards that bind us by their incorporation into the contracts we execute. For example, should we fail to be compliant with the PCIDSS we may be subject to fines and other penalties.
Our business could be materially and adversely affected if we do not protect our intellectual property or if our services are found to infringe on the intellectual property of others.
Our success depends in part on certain methodologies and practices we utilize in developing and implementing applications and other proprietary intellectual property rights. In order to protect such rights, we rely upon a combination of nondisclosure and other contractual arrangements, as well as trade secret, copyright, trademark and patent laws. We also generally enter into confidentiality agreements with our employees, customers and potential customers and limit access to and distribution of our proprietary information. There can be no assurance that the laws, rules, regulations and treaties in effect in the U.S., India and the other jurisdictions in which we operate and the contractual and other protective measures we take are adequate to protect us from misappropriation or unauthorized use of our intellectual property, or that such laws will not change. There can be no assurance that the resources invested by us to protect our intellectual property will be sufficient or that our intellectual property portfolio will adequately deter misappropriation or improper use of our technology, and our intellectual property rights may not prevent competitors from independently developing or selling products and services similar to or duplicative of ours. We may not be able to detect unauthorized use and take appropriate steps to enforce our rights, and any such steps may be costly and unsuccessful. Infringement by others of our intellectual property, including the costs of enforcing our intellectual property rights, may have a material adverse effect on our business, results of operations and financial condition. We could also face competition in some countries where we have not invested in an intellectual property portfolio. If we are not able to protect our intellectual property, the value of our brand and other intangible assets may be diminished, and our business may be adversely affected. Further, although we believe that we are not infringing on the intellectual property rights of others, claims may nonetheless be successfully asserted against us in the future, and we may be the target of enforcement of patents by third parties, including aggressive and opportunistic enforcement claims by non-practicing entities. Regardless of the merit of such claims, responding to infringement claims can be expensive and time-consuming. If we are found to infringe any third-party rights, we could be required to pay substantial damages or we could be enjoined from offering some of our products and services. The costs of defending any such claims could be significant, and any successful claim may require us to modify our services. The value of, or our ability to use, our intellectual property may also be negatively impacted by dependencies on third parties, such as our ability to obtain or renew on reasonable terms licenses that we need in the future, or our ability to secure or retain ownership or rights to use data in certain software analytics or services offerings. Any such circumstances may have a material adverse effect on our business, results of operations and financial condition.
We generate a significant portion of our revenues from a small number of customers, and any loss of business from these customers could materially reduce our revenues.
We have derived, and believe that in the foreseeable future we will continue to derive, a significant portion of our revenues from a small number of customers. While we have no one customer that accounts for more than 10% of our revenue, for each of the years ended December 31, 2017 and 2016, our ten largest customers accounted for less than 30% of our revenues.
24
Our ability to maintain close relationships with these and other major customers is essential to the growth and profitability of our business. However, the volume of work performed for a specific customer is likely to vary from year to year. A major customer in one year may not provide the same level of revenues for us in any subsequent year and there can be no assurance that any customer will extend or renew its contract with us. The business process solutions we provide to our customers, and the revenues and net income from those services, may decline or vary as the type and quantity of services we provide change over time. Furthermore, our reliance on any individual customer for a significant portion of our revenues may give that customer a certain degree of pricing leverage against us when negotiating contracts and terms of service.
In addition, a number of factors other than our performance could cause the loss of or reduction in business or revenues from a customer, and these factors are not predictable. For example, a customer may decide to reduce spending on business process solutions from us due to a challenging economic environment or other factors, both internal and external, relating to our business. These factors may include corporate restructuring, pricing pressure, changes to our outsourcing strategy, switching to another BPO provider or returning work in-house or other changes in a customer's prospects or profitability. The loss of any of our major customers, or a significant decrease in the volume of work they give to us or the price at which we are able to provide our services to them, could materially adversely affect our revenues and thus our results of operations.
Our revenues are highly dependent on a limited number of industries, and any decrease in demand for business process solutions in these industries could reduce our revenues and adversely affect the results of operations.
A substantial portion of our revenues are derived from three specific industry-based segments: ITPS, HS, and LLPS. Customers in ITPS accounted for 71.8% and 55.7% of our revenues in 2017 and 2016, respectively. Customers in HS accounted for 20.3% and 31.4% of our revenues in 2017 and 2016, respectively. Customers in LLPS accounted for 7.9% and 12.9% of our revenues in 2017 and 2016, respectively.
Our success largely depends on continued demand for our services from customers in these segments, and a downturn or reversal of the demand for business process solutions in any of these segments, or the introduction of regulations that restrict or discourage companies from engaging our services, could materially adversely affect our business, financial condition and results of operations. For example, consolidation in any of these industries or combinations or mergers, particularly involving our customers, may decrease the potential number of customers for our services. We have been affected by the worsening of economic conditions and significant consolidation in the financial services industry, and continuation of this trend may negatively affect our revenues and profitability.
Our future profitability and ability to sustain positive cash flow is uncertain.
Our future profitability depends on, among other things, our ability to generate revenue in excess of our expenses. However, we have significant and continuing fixed costs relating to the maintenance of our assets and business, including debt service requirements, which we may not be able to reduce adequately to sustain our profitability if our revenue decreases. Our profitability also may be impacted by non-cash charges such as stock-based compensation charges and potential impairment of goodwill, which will negatively affect our reported financial results. Even if we achieve profitability on an annual basis, we may not be able to achieve profitability on a quarterly basis. You should not consider prior revenue growth as indicative of our future performance. In fact, in future quarters, we may not have any revenue growth or our revenue could decline. We may incur significant losses in the future for a number of reasons and risks described elsewhere herein and we may encounter unforeseen expenses, difficulties, complications, delays and other unknown events.
25
Our ability to continue to generate positive cash flow depends on our ability to generate collections from sales in excess of our cash expenditures. Our ability to generate and collect on sales can be negatively affected by many factors, including but not limited to our inability to convince new customers to use our services or existing customers to renew their contracts or use additional services; the lengthening of our sales cycles and implementation periods; changes in our customer mix; a decision by any of our existing customers to cease or reduce using our services; failure of customers to pay our invoices on a timely basis or at all; a failure in the performance of our solutions or internal controls that adversely affects our reputation or results in loss of business; the loss of market share to existing or new competitors; the failure to enter or succeed in new markets; regional or global economic conditions or regulations affecting perceived need for or value of our services; or our inability to develop new offerings, expand our offerings or drive adoption of our new offerings on a timely basis and thus potentially not meeting evolving market needs.
We anticipate that we will incur increased sales and marketing and general and administrative expenses as we continue to diversify our business into new industries and geographic markets. Our business will also require significant amounts of working capital to support our growth. We may not achieve collections from sales to offset these anticipated expenditures sufficient to maintain positive future cash flow. In addition, we may encounter unforeseen expenses, difficulties, complications, delays and other unknown events that cause our costs to exceed our expectations. An inability to generate positive cash flow may decrease our long-term viability.
We have a significant amount of intangible assets that could be materially impacted.
Goodwill and other intangible assets that have indefinite useful lives are not amortized but rather are evaluated annually for impairment and more frequently if a triggering event occurs. The valuation of goodwill for impairment involves a high degree of judgment. Based on our estimates and assumptions underlying the valuation, impairment is determined by estimating the fair value of a reporting unit and comparing that value to the reporting unit's book value. If economic events occur that cause us to revise our estimates and assumptions used in determining the fair value of our goodwill, such revisions could result in an impairment charge that could have a material adverse impact on our financial statements during the period incurred.
We derive significant revenue and profit from commercial and government contracts awarded through competitive bidding processes, including renewals, which can impose substantial costs on us, and we will not achieve revenue and profit objectives if we fail to accurately and effectively bid on such projects.
Many of these contracts are extremely complex and require the investment of significant resources in order to prepare accurate bids and proposals. Competitive bidding imposes substantial costs and presents a number of risks, including: (i) the substantial cost and managerial time and effort that we spend to prepare bids and proposals for contracts that may or may not be awarded to us; (ii) the need to estimate accurately the resources and costs that will be required to implement and service any contracts we are awarded, sometimes in advance of the final determination of their full scope and design; (iii) the expense and delay that may arise if our competitors protest or challenge awards made to us pursuant to competitive bidding and the risk that such protests or challenges could result in the requirement to resubmit bids and in the termination, reduction or modification of the awarded contracts; and (iv) the opportunity cost of not bidding on and winning other contracts we might otherwise pursue. If our competitors protest or challenge an award made to us on a government contract, the costs to defend such an award may be significant and could involve subsequent litigation that could take years to resolve.
26
Our profitability is dependent upon our ability to obtain adequate pricing for our services and to improve our cost structure.
Our success depends on our ability to obtain adequate pricing for our services. Depending on competitive market factors, future prices we obtain for our services may decline from previous levels. If we are unable to obtain adequate pricing for our services, it could materially adversely affect our results of operations and financial condition. In addition, our contracts are increasingly requiring tighter timelines for implementation as well as more stringent service level metrics. This makes the bidding process for new contracts much more difficult and requires us to adequately consider these requirements in the pricing of our services.
We regularly review our operations with a view towards reducing our cost structure, including, without limitation, reducing our employee base, exiting certain businesses, improving process and system efficiencies and outsourcing some internal functions. We, from time to time, engage in restructuring actions to reduce our cost structure. If we are unable to continue to maintain our cost base at or below the current level and maintain process and systems changes resulting from prior restructuring actions or to realize the expected cost reductions in the ongoing strategic transformation program, it could materially adversely affect our results of operations and financial condition.
In addition, in order to meet the service requirements of our customers, which often includes 24/7 service, and to optimize our employee cost base, including our back-office support, we often locate our delivery service and back-office support centers in lower-cost locations, including several developing countries. Concentrating our centers in these locations presents a number of operational risks, many of which are beyond our control, including the risks of political instability, natural disasters, safety and security risks, labor disruptions, excessive employee turnover and rising labor rates. Additionally, a change in the political environment in the U.S. or the adoption and enforcement of legislation and regulations curbing the use of such centers outside of the U.S. could materially adversely affect our results of operations and financial condition. These risks could impair our ability to effectively provide services to our customers and keep our costs aligned to our associated revenues and market requirements.
Our ability to sustain and improve profit margins is dependent on a number of factors, including our ability to continue to improve the cost efficiency of our operations through such programs as robotic process automation, to absorb the level of pricing pressures on our services through cost improvements and to successfully complete information technology initiatives. If any of these factors adversely materialize or if we are unable to achieve and maintain productivity improvements through restructuring actions or information technology initiatives, our ability to offset labor cost inflation and competitive price pressures would be impaired, each of which could materially adversely affect our results of operations and financial condition.
We are subject to regular customer and third-party security reviews and failure to pass these may have an adverse impact on our operations.
Many of our customer contracts require that we maintain certain physical and/or information security standards, and, in certain cases, we permit a customer to audit our compliance with these contractual standards. Any failure to meet such standards or pass such audits may have a material adverse impact on our business. Further, customers from time to time may require stricter physical and/or information security than they negotiated in their contracts, and may condition continued volumes and business on the satisfaction of such additional requirements. Some of these requirements may be expensive to implement or maintain, and may not be factored into our contract pricing. Further, on an annual basis we obtain third-party audits of certain of our locations in accordance with Statement on Standards for Attestation Engagements No. 16 (SSAE 16) put forth by the Auditing Standards Board (ASB) of the American Institute of Certified Public Accountants (AICPA). SSAE 16 is the current standard for reporting on controls at service organizations, and many of our customers
27
expect that we will perform an annual SSAE 16 audit, and report to them the results. Negative findings in such an audit and/or the failure to adequately remediate in a timely fashion such negative findings may cause customers to terminate their contracts or otherwise have a material adverse effect on our reputation, results of operation and financial condition.
Failure to adhere to the regulations that govern our business could have an adverse impact on our operations.
Our customers are often subject to regulations that may require that we comply with certain rules and regulations in performing services for them that would not otherwise apply to us. U.S. federal laws and regulations that apply to certain portions of our business include the Gramm-Leach-Bliley Act, HIPAA, and the HITECH Act of 2009. We must also comply with applicable regulations relating to healthcare and other personal information that we processes as part of our services. Due to our global delivery model, we are also subject to the burden and expense of complying with the laws and regulations of various jurisdictions and changes thereto which are beyond our control. In addition, our contracts with some of our customers require us to remain knowledgeable about and comply with a number of additional relevant consumer protection laws and other regulatory requirements. Failure to perform our services in a manner that complies with any such requirement could result in breaches of contracts with our customers. Our failure to comply with any applicable laws and regulations could subject us to civil fines and criminal penalties.
A significant portion of our assets and operations are located in India, the Philippines, China and Mexico, and we are subject to regulatory, economic and political uncertainties in those locations.
A significant number of our operations centers are located in India, the Philippines and China and a majority of our assets and our professionals are located in those locations. We intend to continue to develop and expand our facilities in these areas. Our financial performance may be adversely affected by general economic conditions and economic and fiscal policy in these countries, including changes in exchange rates and controls, interest rates and taxation policies, as well as social stability and political, economic or diplomatic developments affecting those countries in the future. These countries have experienced significant economic growth over the last several years, but face major challenges in sustaining that growth in the years ahead. These challenges include the need for substantial infrastructure development and improving access to healthcare and education. Our ability to recruit, train and retain qualified employees, develop and operate our operations centers, and attract and retain customers could be adversely affected if these countries do not successfully meet these challenges.
In the early 1990s, India experienced significant inflation, low growth in gross domestic product and shortages of foreign currency reserves. The Indian government, however, has exercised and continues to exercise significant influence over many aspects of the Indian economy. India's government has provided significant tax incentives and relaxed certain regulatory restrictions in order to encourage foreign investment in specified sectors of the economy, including the BPO industry. Certain of those programs that have benefited us include tax holidays, liberalized import and export duties and preferential rules on foreign investment and repatriation. We cannot assure you that liberalization policies will continue. Various factors, such as changes in the current federal government, could trigger significant changes in India's economic liberalization and deregulation policies and disrupt business and economic conditions in India generally and our business in particular.
The Philippines has experienced significant inflation, currency declines and shortages of foreign exchange. In addition, the Philippines has experienced and may continue to experience civil unrest, terrorism and political turmoil, resulting in temporary work stoppages and technology outages. These instabilities and any adverse changes in the political environment in the Philippines could increase our operational costs, increase our exposure to legal and business risks and make it more difficult for us to operate our business in the Philippines.
28
Our business operations in China may be adversely affected by our current and future political environment. The Chinese government can exert substantial influence and control over the manner in which companies in China conduct business. Under the current government leadership, the government of China has been pursuing economic reform policies that encourage private economic activity and greater economic decentralization. There is no assurance, however, that the government of China will continue to pursue these policies, or that it will not significantly alter these policies from time to time without notice.
Our ability to efficiently conduct our business activities in Mexico is subject to changes in government policy or shifts in political attitudes that are beyond our control. Government policy may change to discourage foreign investment, nationalization of industries may occur or other government limitations, restrictions or requirements not currently foreseen may be implemented. In addition, Mexico may experience political instability, which may result in outbreaks of civil unrest, drug-related violence, terrorist attacks or threats or acts of war in the affected areas, any of which could materially and adversely affect our business, prospects, financial condition and results of operations.
Introduction of tax legislation and disputes with tax authorities may have an adverse effect on our operations and our overall tax rate.
Governments in countries in which we operate or provide services could enact new tax legislation that could have a material adverse effect on our overall effective tax rate. In addition, our ability to repatriate surplus earnings, if any, from our operations centers in a tax-efficient manner is dependent upon interpretations of local laws, possible changes in such laws and the renegotiation of existing double tax avoidance treaties. Changes to any of these may adversely affect our overall tax rate, which could have a material adverse effect on our business, results of operations and financial condition.
In addition, the transfer pricing regulations of the U.S. and certain foreign jurisdictions, including India, require that any cross-border transaction involving related parties be at an arm's-length price. Accordingly, we base our pricing between our foreign subsidiaries and related parties on a functional and economic analysis involving benchmarking against transactions among entities that are not related. However, the tax authorities have jurisdiction to review our transfer-pricing policy. If they conclude the policy was not applied appropriately, we may incur additional tax liability, including accrued interest and penalties. As an example, we have previously received an adverse order from the Indian Tax Tribunal over the application of some of our transfer pricing policies. This decision may be overturned only by appeal to India's Supreme Court. However, it is highly uncertain the matter would ultimately be decided in our favor. Based on the adverse Indian tax tribunal's decision, advice from tax advisors, and the noted trend of Indian tax authorities aggressively pursuing higher transfer prices from multi-national companies, we believe it is probable that we may experience future assessments of tax, penalty and interest in connection with our Indian transfer-pricing policy. Accordingly, reserves have been established on our balance sheet. However, these reserves may not be sufficient. As we continue to expand our operations, we may be subject to similar liability/exposure in additional geographies/jurisdictions.
We may have increases in tax expenses and uncertain future tax liabilities due to enactment of the Tax Cuts and Jobs Act.
On December 22, 2017, new U.S. federal income tax legislation was enacted (the "Tax Cuts and Jobs Act" or "TCJA") that made significant changes to U.S. tax law, generally effective for tax years beginning after December 31, 2017. Among other changes, the TCJA reduces the U.S. corporate income tax rate to 21 percent from a maximum rate of 35 percent; implements a new system of taxation for non-U.S. earnings, including by imposing a one-time tax on the deemed repatriation of undistributed earnings of non-U.S. subsidiaries, permitting deductions for certain dividends from non-U.S. subsidiaries and expanding income inclusions from controlled foreign corporations; imposes
29
significant additional limitations on the deductibility of interest; and allows for the expensing of certain capital expenditures. In the absence of guidance on various ambiguities in the application of certain provisions of the TCJA, we will use what we believe are reasonable interpretations and assumptions in applying the TCJA. It is possible, however, that the U.S. Internal Revenue Service will issue subsequent guidance or take positions on audit that differ from our prior interpretations and assumptions, which could have a material adverse effect on our cash tax liabilities, results of operations, and financial condition.
Sales tax laws in the U.S. may change resulting in service providers having to collect sales taxes in states where the current laws do not require us to do so. This could result in substantial tax liabilities.
Our U.S. subsidiaries collect and remit sales tax in states in which the subsidiaries have physical presence or in which we believe sufficient nexus exists which obligates us to collect sales tax. Other states may, from time to time, claim that we have state-related activities constituting physical nexus to require such collection. Additionally, many other states seek to impose sales tax collection or reporting obligations on companies that sell goods to customers in their state, or directly to the state and its political subdivisions, regardless of physical presence. Such efforts by states have increased recently, as states seek to raise revenues without increasing the income tax burden on residents. We rely on U.S. Supreme Court decisions which hold that, without Congressional authority, a state may not enforce a sales tax collection obligation on a company that has no physical presence in the state. We cannot predict whether the nature or level of contacts we have with a particular state will be deemed enough to require us to collect sales tax in that state nor can we be assured that Congress or individual states will not approve legislation authorizing states to impose tax collection or reporting obligations on our activities. A successful assertion by one or more states that we should collect sales tax could result in substantial tax liabilities related to past sales and would result in considerable administrative burdens and costs for us.
Restrictions on entry visas may affect our ability to compete for and provide services to customers in the U.S., which could have a material adverse effect on future revenues.
A significant number of our employees are foreign nationals, including from India, the Philippines and China. Certain members of our development team based in India travel to the U.S. on a regular basis to facilitate new project development, including the implementation of new contracts and to meet our U.S. customers. The ability of these employees to travel to the U.S. and other countries in which we do business depends on the ability to obtain the necessary visas and entry permits.
In response to political forces, terrorist attacks, the global economic downturn, public sentiments of high unemployment rates in certain parts of the U.S. and other events, U.S. immigration authorities have increased the level of scrutiny in granting visas and applicable immigration laws may be subject to legislative change and varying standards of application and enforcement. We cannot predict the political or economic events that could affect immigration laws or any restrictive impact those events could have on obtaining or monitoring entry visas for our professionals.
Investors may have difficulty effecting service of process or enforcing judgments obtained in the U.S. against our non-U.S. subsidiaries.
We have significant operating subsidiaries that are organized outside the U.S. A portion of our assets are located in India, the Philippines, China, Mexico, and Canada. As a result, you may be unable to effect service of process upon our affiliates who reside in these jurisdictions. In addition, you may be unable to enforce against these persons outside the jurisdiction of their residence judgments obtained in U.S. courts, including judgments predicated solely upon U.S. federal securities laws.
30
Currency fluctuations among the Euro, British Pound, Indian rupee, the Philippine Peso, the Mexican Peso, the Canadian Dollar, the Chinese Yuan and the U.S. Dollar could have a material adverse effect on our results of operations.
We operate internationally and as a result, are subject to risks associated with doing business globally, such as risks related to the differing legal, political and regulatory requirements and economic conditions of many jurisdictions. Risks inherent to operating internationally include changes in a country's economic or political conditions, in foreign currency exchange rates, regulatory requirements and enforcement of intellectual property rights.
The functional currencies of our businesses outside of the U.S. are the local currencies. Changes in exchange rates between these foreign currencies and the U.S. Dollar will affect the recorded levels of our assets, liabilities, net sales, cost of goods sold and operating margins and could result in exchange gains or losses. The primary foreign currencies to which we have exposure are the European Union Euro, Swedish Krona, British Pound Sterling, Canadian Dollar and Indian rupees. Exchange rates between these currencies and the U.S. Dollar in recent years have fluctuated significantly and may do so in the future. Our operating results and profitability may be affected by any volatility in currency exchange rates and our ability to manage effectively currency transaction and translation risks. To the extent the U.S. Dollar strengthens against foreign currencies, our foreign revenues and profits will be reduced when translated into U.S. Dollars.
Although the vast majority of our revenues are denominated in U.S. dollars, a significant portion of our expenses are incurred and paid in Euros, British Pound Sterling, Swedish Krona, Indian rupees, and to a lesser extent in other currencies, including the Philippine Peso, the Mexican Peso, the Canadian dollar and the Chinese Yuan. We report our financial results in U.S. Dollars. The exchange rate between the Indian rupee and the U.S. Dollar has changed substantially in recent years and may fluctuate substantially in the future. Our results of operations may be adversely affected if such fluctuations continue, or increase, or other currencies fluctuate significantly against the U.S. Dollar.
Although we do not currently take steps to hedge our foreign currency exposures, should we choose in the future to implement a hedging strategy, there can be no assurance that our hedging strategy will be successful or that the hedging markets would have sufficient liquidity or depth to allow us to implement such a hedging strategy in a cost-effective manner. Further, the success of any potential hedging strategy could be impacted by any failure by the hedging counterparties to meet their contractual obligations.
Failure to comply with the U.S. Foreign Corrupt Practices Act, or the FCPA, economic and trade sanctions, regulations, and similar laws could subject us to penalties and other adverse consequences.
We operate our business in several foreign countries with developing economies, where companies often engage in business practices that are prohibited by U.S. and other regulations applicable to us. We are subject to anti-corruption laws and regulations, including the FCPA, the U.K. Bribery Act and other laws that prohibit the making or offering of improper payments to foreign government officials and political figures, including antibribery provisions enforced by the Department of Justice and accounting provisions enforced by the SEC. These laws prohibit improper payments or offers of payments to foreign governments and their officials and political parties by the U.S. and other business entities for the purpose of obtaining or retaining business. We have implemented policies to identify and address potentially impermissible transactions under such laws and regulations; however, there can be no assurance that all of our and our subsidiaries' employees, consultants, and agents, including those that may be based in or from countries where practices that violate U.S. or other laws may be customary, will not take actions in violation of our policies, for which we may be ultimately responsible.
We are also subject to certain economic and trade sanctions programs that are administered by the Department of Treasury's Office of Foreign Assets Control, or OFAC, which prohibit or restrict transactions to or from or dealings with specified countries, their governments, and in certain
31
circumstances, their nationals, and with individuals and entities that are specially-designated nationals of those countries, narcotics traffickers, and terrorists or terrorist organizations. Our subsidiaries may be subject to additional foreign or local sanctions requirements in other relevant jurisdictions.
Fluctuations in the costs of paper, ink, energy, by-products and other raw materials may adversely impact the results of our operations.
Purchases of paper, ink, energy and other raw materials represent a large portion of our costs. Increases in the costs of these inputs may increase our costs and we may not be able to pass these costs on to customers through higher prices. In addition, we may not be able to resell waste paper and other print-related by-products or may be adversely impacted by decreases in the prices for these by-products. Increases in the cost of materials may adversely impact customers' demand for our printing and printing-related services.
We may be required to take write downs or write-offs, restructuring and impairment or other charges that could have a significant negative effect on our financial condition, results of operations and stock price, which could cause you to lose some or all of your investment.
Although we conducted due diligence before the consummation of the Business Combination with respect to SourceHOV and Novitex, we cannot assure you that this diligence revealed all material issues that may be present in our current businesses, that it would be possible to uncover all material issues through a customary amount of due diligence, or that factors outside of our control will not later arise. As a result, we may be forced to write down or write off assets, restructure our operations, or incur impairment or other charges that could result in losses. Unexpected risks may arise and previously known risks may materialize in a manner not consistent with our risk analysis with respect to the Business Combination. Even though these charges may be non-cash items and may not have an immediate impact on our liquidity, the fact that we report charges of this nature could contribute to negative market perceptions about us or our securities, including, without limitation, our Common Stock.
The market for our securities remains volatile and may not continue, which would adversely affect the liquidity and price of our securities.
The price of our securities, including, without limitation, our Common Stock, may continue to fluctuate significantly due to the market's reaction to the Business Combination and general market and economic conditions. An active trading market for our securities following the Business Combination may not further develop or be sustained. In addition, the price of our securities can fluctuate due to general economic conditions and forecasts, our general business condition and the release of our financial reports. Additionally, if our Common Stock become delisted from Nasdaq (as has already occurred with our publicly traded warrants and units, which consist of one share of Common Stock and one warrant) for any reason, and are quoted on the OTC Bulletin Board, an inter-dealer automated quotation system for equity securities that is not a national securities exchange, the liquidity and price of our securities may be more limited than if they were quoted or listed on Nasdaq or another national securities exchange.
Changes in laws or regulations, or a failure to comply with any laws and regulations, may adversely affect our business, investments and results of operations.
We are subject to laws, regulations and rules enacted by national, regional and local governments and Nasdaq. In particular, we are required to comply with certain SEC, Nasdaq and other legal or regulatory requirements. Compliance with, and monitoring of, applicable laws, regulations and rules may be difficult, time consuming and costly. Those laws, regulations and rules and their interpretation and application may also change from time to time and those changes could have a material adverse effect on our business, investments and results of operations. In addition, a failure to comply with applicable laws, regulations and rules, as interpreted and applied, could have a material adverse effect on our business and results of operations.
32
ITEM 1B. UNRESOLVED STAFF COMMENTS
None.
We lease and own numerous facilities worldwide with larger concentrations of space in Texas, Michigan, Connecticut, California, India, Mexico, the Philippines, and China. The size of our active property portfolio as of December 31, 2017 was approximately 4.0 million square feet (square feet) and comprised 159 leased properties and 8 owned properties.
Our owned and leased facilities house general offices, sales offices, service locations, and production facilities. Many of our operating facilities are equipped with fiber connectivity and have access to other power sources. Substantially all of our operations facilities are leased under long-term leases with varying expiration dates, except for the following owned locations: (i) three operations facilities in India with a combined building area of approximately 91,500 sq. ft., respectively, (ii) an operating facility in Georgiana, Alabama with an approximate building area of 20,000 sq. ft., (iii) an operating facility in Tallahassee, Florida consisting of four buildings with a combined building area of approximately 21,000 sq. ft., (iv) an operating facility in Upper Marlboro, Maryland with an approximate building area of 30,000 sq. ft., (v) an operating facility in Troy, Michigan that will serve as the Company's primary data center with an approximate building area of 66,000 sq. ft. and (vi) an operating facility in Egham, England with an approximate building area of 11,000 sq. ft. We also maintain an operating presence at approximately 1,100 customer sites.
Our properties are suitable to deliver services to our customers for each of our business segments. Our management believes that all of our properties and facilities are well maintained.
Appraisal Demand
On September 21, 2017, former stockholders of SourceHOV, who allege combined ownership of 10,304 shares of SourceHOV common stock, filed a petition for appraisal pursuant to 8 Del. C. § 262 in the Delaware Court of Chancery, captioned Manichaean Capital, LLC, et al. v. SourceHOV Holdings, Inc., C.A. No. 2017-0673-JRS (the "Appraisal Action"). The Appraisal Action arises out of the Business Combination, which gave rise to appraisal rights pursuant to 8 Del. C. § 262. In the Appraisal Action, the petitioners seek, among other things, a determination of the fair value of their shares at the time of the Business Combination; an order that SourceHOV pay that value to the petitioners, together with interest at the statutory rate; and an award of costs, attorneys' fees, and other expenses.
On October 12, 2017, SourceHOV filed its answer to the petition and a verified list pursuant to 8 Del. C. § 262(f). The parties have commenced discovery. At this stage of the litigation, the Company is unable to predict the outcome of the Appraisal Action or estimate any loss or range of loss that may arise from the Appraisal Action. Pursuant to the terms of the Business Combination Agreement, if such appraisal rights are perfected, a corresponding portion of shares of our Common Stock issued to Ex-Sigma 2 LLC, our principal stockholder, will be forfeited at such time as the PIPE Financing (as defined in the Consent, Waiver and Amendment dated June 15, 2017) is repaid. The Company intends to vigorously defend against the Appraisal Action.
Other
We are, from time to time, involved in other legal proceedings, inquiries, claims and disputes, which arise in the ordinary course of business. Although our management cannot predict the outcomes of these matters, our management believes these actions will not have a material, adverse effect on our financial position, results of operations or cash flows.
ITEM 4. MINE SAFETY DISCLOSURES
Not applicable
33
ITEM 5. MARKET FOR REGISTRANT'S COMMON EQUITY, RELATED STOCKHOLDER MATTERS AND ISSUER PURCHASES OF EQUITY SECURITIES
Market Information
Our Common Stock is traded on the Nasdaq composite under the symbol "XELA." Set forth below is the high and low sales price of our Common Stock during the periods presented.
| |
Sales Price | ||||||
|---|---|---|---|---|---|---|---|
| |
High | Low | |||||
Year Ended December 31, 2017 |
|||||||
Fourth Quarter |
$ | 6.10 | $ | 4.37 | |||
Third Quarter(1) |
$ | 10.00 | $ | 4.40 | |||
Second Quarter |
$ | 10.03 | $ | 7.66 | |||
First Quarter |
$ | 10.15 | $ | 9.93 | |||
Year Ended December 31, 2016 |
|||||||
Fourth Quarter |
$ | 9.98 | $ | 9.90 | |||
Third Quarter |
$ | 10.24 | $ | 9.85 | |||
Second Quarter |
$ | 9.95 | $ | 9.75 | |||
First Quarter |
$ | 9.85 | $ | 9.66 | |||
- (1)
- Our Common Stock began trading on the Nasdaq under the symbol "XELA" on July 13, 2017, the day following the closing of the Business Combination. From March 9, 2015 until the July 12, 2017 closing of the Business Combination common equity of Quinpario was traded on the Nasdaq under the symbol "QPAC." Unlike our Common Stock, the common equity traded under the symbol QPAC had cash redemption rights and other features that ceased upon the filing of a new certificate of incorporation in connection with the closing of the Business Combination. Information provided above includes data for QPAC for the period prior to July 13, 2017.
Stockholders
As of March 16, 2018 we had 67 record holders of our Common Stock.
Dividends
We have not paid any cash dividends on shares of our Common Stock to date and do not intend to pay cash dividends in the foreseeable future. The payment of cash dividends in the future will be dependent upon our revenues and earnings, capital requirements and general financial condition and is within the discretion of our board of directors. It is the present intention of the board of directors to retain all earnings for use in our business operations and, accordingly, the board does not anticipate declaring any dividends in the foreseeable future.
34
Equity Compensation Plan Information
The following table provides information as of December 31, 2017, with respect to the shares of our Common Stock that may be issued under our existing equity compensation plans.
Plan Category
|
Number of Securities to be Issued Upon Exercise of Outstanding Options, RSU, Warrants and Rights (a) |
Weighted Average Exercise Price of Outstanding Options, Warrants and Rights (b) |
Number of Securities Remaining Available for Future Issuance Under Equity Compensation Plans(1) (Excluding Securities Reflected in Column (a)) (c) |
|||||||
|---|---|---|---|---|---|---|---|---|---|---|
Equity compensation plans approved by stockholders |
— | — | — | |||||||
Equity compensation plans not approved by stockholders |
— | — | — | |||||||
| | | | | | | | | | | |
Total |
— | — | — | |||||||
- (1)
- The Company currently maintains the 2018 Stock Incentive Plan, which was approved by our board of directors on December 19, 2017 and subsequently approved by a majority of our stockholders by written consent on December 20, 2017. The 2018 Stock Incentive Plan became effective on January 17, 2018 and there are 8,323,764 shares of our Common Stock reserved for issuance under our 2018 Stock Incentive Plan.
Sale of Unregistered Securities
There were no unregistered sales of equity securities in 2017 that have not been previously reported in a Quarterly Report on Form 10-Q or Current Report on Form 8-K.
Issuer Purchases of Equity Securities
The table below sets forth information with respect to purchases made by or on behalf of us or any "affiliated purchaser" (as defined in Rule 10b-18(a)(3) under the Securities Exchange Act of 1934) of shares of our Common Stock during the period of November 8, 2017 through the year ended December 31, 2017:
Period
|
Total Number of Shares Purchased |
Average Price Paid per Share |
Total Number of Shares Purchased as Part of Publicly Announced Plans or Programs(1) |
Maximum Number of Shares that May Yet Be Purchased Under the Plans or Programs(1) |
|||||||||
|---|---|---|---|---|---|---|---|---|---|---|---|---|---|
October, 2017 |
— | $ | — | — | — | ||||||||
November, 2017 |
49,300 | $ | 4.97 | 49,300 | 4,950,700 | ||||||||
December, 2017 |
— | $ | — | — | 4,950,700 | ||||||||
| | | | | | | | | | | | | | |
Total |
49,300 | $ | 4.97 | 49,300 | 4,950,700 | ||||||||
- (1)
- On November 8, 2017, the Company's board of directors authorized a share buyback program (the "Share Buyback Program"), pursuant to which the Company may, from time to time, purchase up to 5,000,000 shares of its Common Stock. Share repurchases may be executed through various means, including, without limitation, open market transactions, privately negotiated transactions or otherwise. The decision as to whether to purchase any shares and the timing of purchases, if any, will be based on the price of the Company's Common Stock, general business and market conditions and other investment considerations and factors. The Share Buyback Program does not
35
obligate the Company to purchase any shares and expires 24 months after authorized. The Share Buyback Program may be terminated or amended by the Company's board of directors in its discretion at any time. As of December 31, 2017, 49,300 shares had been repurchased under the Share Buyback Program. The Company records treasury stock using the cost method.
Stock Performance Graph
The stock performance graph and related information is not deemed to be "soliciting material" or to be "filed" with the Securities and Exchange Commission or subject to Regulation 14A or 14C under the Securities Exchange Act of 1934 or to the liabilities of Section 18 of the Securities Exchange Act of 1934 and will not be deemed to be incorporated by reference into any filing under the Securities Act of 1933 or the Securities Exchange Act of 1934, except to the extent we specifically incorporate it by reference into such a filing.
The graph and table set forth below compares the cumulative stockholder return from July 13, 2017 (the date our Common Stock began trading on Nasdaq) through December 31, 2017, for our Common Stock, the Nasdaq composite, and a peer group. Measurement points are the last trading day of each month and we assumed that dividends have been reinvested. The selected peer group for the period is comprised of four companies that we believe are our closest reporting issuer competitors: Cognizant Technology Solutions Corp., ExlService Holdings, Inc., Genpact Ltd., and WNS (Holdings). The returns of the component entities of our peer index are weighted according to the market capitalization of each company as of the beginning of each period for which a return is presented. The returns assume that $100 was invested on July 13, 2017. The performance shown in the graph and table is historical and should not be considered indicative of future price performance.
36
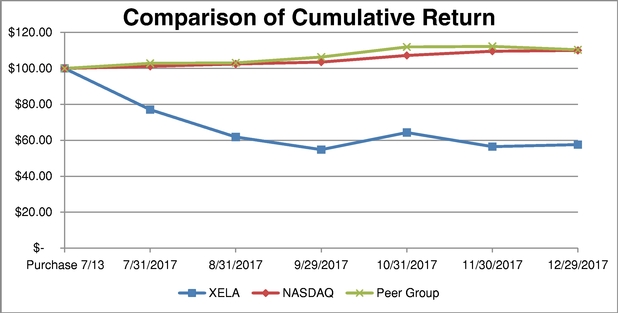
| |
Exela Technologies, Inc. |
NASDAQ | Peer Group | |||||||
|---|---|---|---|---|---|---|---|---|---|---|
Commence Trading as XELA 7/13/2017(1) |
$ | 100.00 | $ | 100.00 | $ | 100.00 | ||||
7/31/2017 |
$ | 77.07 | $ | 101.17 | $ | 102.83 | ||||
8/31/2017 |
$ | 61.86 | $ | 102.46 | $ | 103.09 | ||||
9/29/2017 |
$ | 54.81 | $ | 103.53 | $ | 106.33 | ||||
10/31/2017 |
$ | 64.32 | $ | 107.22 | $ | 111.95 | ||||
11/30/2017 |
$ | 56.49 | $ | 109.56 | $ | 112.26 | ||||
12/29/2017 |
$ | 57.61 | $ | 110.02 | $ | 110.39 | ||||
- (1)
- From March 9, 2015 until the July 12, 2017 closing of the Business Combination common equity of Quinpario was traded on the Nasdaq under the symbol "QPAC." QPAC stock had cash redemption rights and other features that ceased upon the filing of a new certificate of incorporation in connection with the closing of the Business Combination. A vast majority of the holders of QPAC stock exercised their redemption rights. QPAC common equity and XELA's Common Stock are so different, we believe it would be misleading to present QPAC data from March 9, 2015 until the Business Combination as if it were XELA stock.
ITEM 6. SELECTED FINANCIAL DATA
The following selected consolidated financial data should be read in conjunction with Item 7, "Management's Discussion and Analysis of Financial Condition and Results of Operations" and Item 8, "Financial Statements and Supplementary Data" of this Annual Report. Additionally, increases in revenue of $154.3 million, cost of revenue of $232.5 million, and selling, general and administrative expenses of $57.3 million from 2014 to 2015 relate to the acquisition of BancTec which occurred on October 31, 2014. Due to this acquisition the company acquired new debt and paid down existing debt in 2014. This resulted in an increase in long-term debt of $450.1 million in 2014, an increase of interest expense of $60.7 million in 2015 and a loss on extinguishment of debt in 2014 of $18.5 million. Finally, in 2014 the company impaired $154.5 million of goodwill and trade names.
37
| |
|
|
|
|
2013 | ||||||||||||||||
|---|---|---|---|---|---|---|---|---|---|---|---|---|---|---|---|---|---|---|---|---|---|
| |
|
|
|
|
Successor |
|
Predecessor | ||||||||||||||
| |
Year Ended December 31, | Period From May 1 to December 31 |
|
Period From January 1 to April 30 |
|||||||||||||||||
| |
|
||||||||||||||||||||
| (in thousands, except share and per share data) |
2017 | 2016 | 2015 | 2014 |
|
||||||||||||||||
|
|
|||||||||||||||||||||
Statements of Operations Information: |
|||||||||||||||||||||
Revenue |
$ | 1,152,324 | $ | 789,926 | $ | 805,232 | $ | 650,918 | $ | 449,569 | $ | 229,619 | |||||||||
Cost of revenue (exclusive of depreciation and amortization) |
829,143 | 519,121 | 559,846 | 451,539 | 327,320 | 166,026 | |||||||||||||||
Selling, general and administrative expenses |
220,955 | 130,437 | 120,691 | 131,864 | 63,360 | 44,810 | |||||||||||||||
Depreciation and amortization |
98,890 | 79,639 | 75,408 | 65,227 | 39,217 | 15,357 | |||||||||||||||
Impairment of goodwill and other intangible assets |
69,437 | — | — | 154,454 | — | — | |||||||||||||||
Related party expense |
33,431 | 10,493 | 8,977 | 19,080 | — | — | |||||||||||||||
| | | | | | | | | | | | | | | | | | | | | | |
Operating (loss) income |
(99,532 | ) | 50,236 | 40,310 | (171,246 | ) | 19,672 | 3,426 | |||||||||||||
Other expense (income), net: |
|||||||||||||||||||||
Interest expense, net |
128,489 | 109,414 | 108,779 | 48,045 | 24,659 | 17,428 | |||||||||||||||
Loss on extinguishment of debt |
35,512 | — | — | 18,548 | — | 24,889 | |||||||||||||||
Sundry expense, net |
2,295 | 712 | 3,247 | (2,201 | ) | — | — | ||||||||||||||
Other income, net |
(1,297 | ) | — | — | — | — | — | ||||||||||||||
| | | | | | | | | | | | | | | | | | | | | | |
Net loss before income taxes |
(264,531 | ) | (59,890 | ) | (71,716 | ) | (235,638 | ) | (4,987 | ) | (38,891 | ) | |||||||||
Income tax benefit |
60,246 | 11,787 | 26,812 | 38,003 | 1,661 | 13,551 | |||||||||||||||
| | | | | | | | | | | | | | | | | | | | | | |
Net loss |
(204,285 | ) | (48,103 | ) | (44,904 | ) | (197,635 | ) | (3,326 | ) | (25,340 | ) | |||||||||
| | | | | | | | | | | | | | | | | | | | | | |
| | | | | | | | | | | | | | | | | | | | | | |
| | | | | | | | | | | | | | | | | | | | | | |
Dividend equivalent on Series A Preferred Stock related to beneficial conversion feature |
(16,375 | ) | — | — | — | — | — | ||||||||||||||
Cumulative dividends for Series A Preferred Stock |
(2,489 | ) | — | — | — | — | — | ||||||||||||||
| | | | | | | | | | | | | | | | | | | | | | |
Net loss attributable to common stockholders |
(223,149 | ) | (48,103 | ) | (44,904 | ) | (197,635 | ) | (3,326 | ) | (25,340 | ) | |||||||||
| | | | | | | | | | | | | | | | | | | | | | |
| | | | | | | | | | | | | | | | | | | | | | |
| | | | | | | | | | | | | | | | | | | | | | |
Loss per share: |
|||||||||||||||||||||
Basic |
(2.08 | ) | (0.75 | ) | (0.70 | ) | (3.09 | ) | (0.14 | ) | N/A | ||||||||||
Diluted |
(2.08 | ) | (0.75 | ) | (0.70 | ) | (3.09 | ) | (0.14 | ) | N/A | ||||||||||
Weighted average number of shares outstanding: |
|||||||||||||||||||||
Basic |
107,068,262 | 64,024,557 | 64,024,557 | 64,024,557 | 24,228,683 | N/A | |||||||||||||||
Diluted |
107,068,262 | 64,024,557 | 64,024,557 | 64,024,557 | 24,228,683 | N/A | |||||||||||||||
| |
As of December 31, | |||||||||||||||
|---|---|---|---|---|---|---|---|---|---|---|---|---|---|---|---|---|
| (in thousands) |
2017 | 2016 | 2015 | 2014 | 2013 | |||||||||||
Balance Sheet Data: |
||||||||||||||||
Cash and cash equivalents |
$ | 39,000 | $ | 8,361 | $ | 16,619 | $ | 22,667 | $ | 17,412 | ||||||
Accounts receivable, net of allowance for doubtful accounts |
229,704 | 138,421 | 145,162 | 157,853 | 147,186 | |||||||||||
Working capital |
(26,049 | ) | (41,404 | ) | 18,162 | 42,583 | 102,124 | |||||||||
Total Assets |
1,714,838 | 969,486 | 960,048 | 1,009,797 | 1,046,184 | |||||||||||
Long-term debt, net of current maturities |
1,276,094 | 983,502 | 975,142 | 952,071 | 501,962 | |||||||||||
Total liabilities |
1,724,844 | 1,309,387 | 1,251,537 | 1,266,169 | 729,092 | |||||||||||
Total stockholders' deficit |
(10,006 | ) | (339,901 | ) | (291,489 | ) | (256,372 | ) | 317,092 | |||||||
38
ITEM 7. MANAGEMENT'S DISCUSSION AND ANALYSIS OF FINANCIAL CONDITION AND RESULTS OF OPERATIONS
Forward Looking Statements
The following Management's Discussion and Analysis of Financial Condition and Results of Operations should be read in conjunction with a review of the other Items included in this Form 10-K and our December 31, 2017 Consolidated Financial Statements included elsewhere in this report. Certain statements contained in this "Management's Discussion and Analysis of Financial Condition and Results of Operations" may be deemed to be forward-looking statements. See "Special Note Regarding Forward-Looking Statements."
Overview
We are a global provider of transaction processing solutions, enterprise information management, document management and digital business process services. Our technology-enabled solutions allow global organizations to address critical challenges resulting from the massive amounts of data obtained and created through their daily operations. Our solutions address the life cycle of transaction processing and enterprise information management, from enabling payment gateways and data exchanges across multiple systems, to matching inputs against contracts and handling exceptions, to ultimately depositing payments and distributing communications. We believe our process expertise, information technology capabilities and operational insights enable our customers' organizations to more efficiently and effectively execute transactions, make decisions, drive revenue and profitability, and communicate critical information to their employees, customers, partners, and vendors.
History
We are a former blank check company that completed our initial public offering on January 22, 2015. In July 2017, Exela Technologies, Inc. ("Exela"), formerly known as Quinpario Acquisition Corp. 2 ("Quinpario"), completed its acquisition of SourceHOV Holdings, Inc. ("SourceHOV") and Novitex Holdings, Inc. ("Novitex") pursuant to the business combination agreement dated February 21, 2017 ("Business Combination"). In conjunction with the completion of the Business Combination, Quinpario was renamed Exela Technologies, Inc.
The Business Combination was accounted for as a reverse merger for which SourceHOV was determined to be the accounting acquirer. Outstanding shares of SourceHOV were converted into our Common Stock, presented as a recapitalization, and the net assets of Quinpario were acquired at historical cost, with no goodwill or other intangible assets recorded. The acquisition of Novitex was treated as a business combination under ASC 805 and was accounted for using the acquisition method. The strategic combination of SourceHOV and Novitex formed Exela, which is one of the largest global providers of information processing solutions based on revenues.
Basis of Presentation
This analysis is presented on a consolidated basis. In addition, a description is provided of significant transactions and events that have an impact on the comparability of the results being analyzed. Due to our specific situation, the presented financial information for the year ended December 31, 2017 is only partially comparable to the financial information for the year ended December 31, 2016. Since SourceHOV was deemed the accounting acquirer in the Business Combination consummated on July 12, 2017, the presented financial information for the year ended December 31, 2016 reflects the financial information and activities of SourceHOV only. The presented financial information for the year ended December 31, 2017 includes the financial information and activities for SourceHOV for the period January 1, 2017 to December 31, 2017 (365 days) as well as the financial information and activities of Novitex for the period July 13, 2017 to December 31, 2017
39
(172 days). This lack of comparability needs to be taken into account when reading the discussion and analysis of our results of operations and cash flows. Furthermore, the presented financial information for the year ended December 31, 2017 also contains other one-time costs that are directly associated with the Business Combination, such as professional fees, to support the our new and complex legal, tax, statutory and reporting requirements following the Business Combination.
Our Segments
Our three reportable segments are Information & Transaction Processing Solutions ("ITPS"), Healthcare Solutions ("HS"), and Legal & Loss Prevention Services ("LLPS"). These segments are comprised of significant strategic business units that align our TPS and EIM products and services with how we manage our business, approach our key markets and interact with our customers based on their respective industries.
ITPS: Our largest segment, ITPS, provides a wide range of solutions and services designed to aid businesses in information capture, processing, decisioning and distribution to customers primarily in the financial services, commercial, public sector and legal industries. Our major customers include 9 of the top 10 U.S. banks, 7 of the top 10 U.S. insurance companies, 5 of the top U.S. telecom companies, over 40 utility companies, over 30 state and county departments, and over 80 government entities. Our ITPS offerings enable companies to increase availability of working capital, reduce turnaround times for application processes, increase regulatory compliance and enhance consumer engagement.
HS: HS operates and maintains a consulting and outsourcing business specializing in both the healthcare provider and payer markets. We serve the top 5 healthcare insurance payers and over 900 healthcare providers.
LLPS: Our LLPS segment provides a broad and active array of support services in connection with class action, bankruptcy labor, claims adjudication and employment and other legal matters. Our customer base consists of corporate counsel, government attorneys, and law firms.
Acquisitions
In July 2017, we completed the Business Combination. SourceHOV was deemed to be the accounting acquirer, and is a leading provider of platform-based enterprise information management and transaction processing solutions primarily for the healthcare, banking and financial services, commercial, public sector and legal industries. Through the acquisition of SourceHOV and Novitex, we expect to realize revenue synergies, leverage brand awareness, strengthen margins, generate greater free cash flow, expand the existing Novitex sales channels, and increase utilization of the existing workforce. We anticipate opportunities for growth through the ability to leverage additional future services and capabilities.
Prior to the Business Combination, SourceHOV transformed into an industry-agnostic solution provider and acquired key technology through the acquisition of TransCentra, Inc. ("TransCentra") in September 2016, a provider of integrated outsourced billing, remittance processing and imaging software and consulting services. The addition of TransCentra increased SourceHOV's footprint in the remittance transaction processing and presentment area, expanded its mobile banking offering and enabled significant cross-selling and up-selling opportunities.
Revenues
ITPS revenues are primarily generated from a transaction-based pricing model for the various types of volumes processed, licensing and maintenance fees for technology sales, and a mix of fixed management fee and transactional revenue for document logistics and location services. HS revenues are primarily generated from a transaction-based pricing model for the various types of volumes
40
processed for healthcare payers and providers. LLPS revenues are primarily based on time and materials pricing as well as through transactional services priced on a per item basis.
People
We draw on the business and technical expertise of our talented and diverse global workforce to provide our customers with high-quality services. Our business leaders bring a strong diversity of experience in our industry and a track record of successful performance and execution.
As of December 31, 2017, we had approximately 22,000 employees globally, with 52% located in the United States and the remainder located primarily in Europe, India, the Philippines, Canada, Mexico, and China.
Costs associated with our employees represent the most significant expense for our business. We incurred personnel costs of $532.3 million, $373.2 million, and $388.3 million for the years ended December 31, 2017, 2016 and 2015, respectively. The majority of our personnel costs are variable and are incurred only while we are providing our services.
Facilities
We lease and own numerous facilities worldwide with larger concentrations of space in Texas, Michigan, Connecticut, California, India, Mexico, the Philippines, and China. Our owned and leased facilities house general offices, sales offices, service locations, and production facilities.
The size of our active property portfolio as of December 31, 2017 was approximately 4.0 million square feet at an annual operating cost of approximately $48.3 million and comprised 159 leased properties and 8 owned properties.
We believe that our current facilities are suitable and adequate for our current businesses. Because of the interrelation of our business segments, each of the segments uses substantially all of these properties at least in part.
Key Performance Indicators
We use a variety of operational and financial measures to assess our performance. Among the measures considered by our management are the following:
- •
- Revenue by segment;
- •
- EBITDA; and
- •
- Adjusted EBITDA.
Revenue
We analyze our revenue by comparing actual monthly revenue to internal projections and prior periods across our operating segments in order to assess performance, identify potential areas for improvement, and determine whether segments are meeting management's expectations.
EBITDA and Adjusted EBITDA
We view EBITDA and Adjusted EBITDA as important indicators of performance. We define EBITDA as net income, plus taxes, interest expense, and depreciation and amortization. We define Adjusted EBITDA as EBITDA plus optimization and restructuring charges, including severance and retention expenses; transaction and integration costs; other non-cash charges, including non-cash compensation, (gain) or loss from sale or disposal of assets, and impairment charges; and management fees and expenses. See "—Other Financial Information (Non-GAAP Financial Measures)" for more
41
information and a reconciliation of EBITDA and Adjusted EBITDA to net loss, the most directly comparable financial measure calculated and presented in accordance with GAAP.
Results of Operations
Year Ended December 31, 2017, Compared to Year Ended December 31, 2016
| |
Year ended December 31, | ||||||
|---|---|---|---|---|---|---|---|
| |
2017 | 2016 | |||||
Revenue: |
|||||||
ITPS |
$ | 827,110 | $ | 439,924 | |||
HS |
233,595 | 247,796 | |||||
LLPS |
91,619 | 102,206 | |||||
| | | | | | | | |
Total revenue |
1,152,324 | 789,926 | |||||
Cost of revenue: |
|||||||
ITPS |
620,719 | 296,848 | |||||
HS |
152,864 | 158,800 | |||||
LLPS |
55,560 | 63,473 | |||||
| | | | | | | | |
Total cost of revenue (exclusive of depreciation and amortization) |
829,143 | 519,121 | |||||
Selling, general and administrative expenses |
220,955 | 130,437 | |||||
Depreciation and amortization |
98,890 | 79,639 | |||||
Impairment of goodwill and other intangible assets |
69,437 | — | |||||
Related party expense |
33,431 | 10,493 | |||||
| | | | | | | | |
Operating income |
(99,532 | ) | 50,236 | ||||
Interest expense, net |
128,489 | 109,414 | |||||
Loss on extinguishment of debt |
35,512 | — | |||||
Sundry expense, net |
2,295 | 712 | |||||
Other (income), net |
(1,297 | ) | — | ||||
| | | | | | | | |
Net loss before income taxes |
(264,531 | ) | (59,890 | ) | |||
Income tax benefit |
60,246 | 11,787 | |||||
| | | | | | | | |
Net loss |
(204,285 | ) | (48,103 | ) | |||
| | | | | | | | |
| | | | | | | | |
| | | | | | | | |
Revenue
Our revenue increased $362.4 million, or 45.9%, to $1,152.3 million for the year ended December 31, 2017 compared to $789.9 million for the year ended December 31, 2016. This increase is primarily related to an increase in our ITPS segment revenues of $387.2 million, which was primarily attributable to the acquisition of TransCentra in 2016 and Novitex in 2017. The increase was partially offset by a decrease in revenues in the HS segment and LLPS segment of $14.2 million and $10.6 million, respectively. Our ITPS, HS, and LLPS segments constituted 71.8%, 20.3%, and 7.9% of our total revenue, respectively, for the year ended December 31, 2017, compared to 55.7%, 31.4%, and 12.9%, respectively, for the year ended December 31, 2016. The revenue changes by reporting segment was as follows:
ITPS—Revenues increased $387.2 million, or 88.0%, to $827.1 million for the year ended December 31, 2017 compared to $439.9 million for the year ended December 31, 2016. The increase was primarily attributable to the acquisition of Novitex, which contributed $292.1 million of the increase. Additionally, the acquisition of TransCentra contributed $94.1 million of the increase. The remaining increase in revenue was the result of net increases in services provided to ITPS customers.
42
HS—Revenues decreased $14.2 million, or 5.7%, to $233.6 million for the year ended December 31, 2017 compared to $247.8 million for the year ended December 31, 2016. The decrease was primarily attributable to a surge in demand from healthcare provider customers in early 2016 as a result of a change in regulatory coding requirements beginning in the fourth quarter of 2015, resulting in a decline in revenue of $17.9 million for the year ended December 31, 2017 compared to the year ended December 31, 2016. We have since experienced a normalization of demand as healthcare provider customers have reduced outsourcing of the service. The decrease was partially offset by an increase in revenues of $3.7 million from the Payer business during the period.
LLPS—Revenues decreased $10.6 million, or 10.4%, to $91.6 million for the year ended December 31, 2017 compared to $102.2 million for the year ended December 31, 2016. The decrease was primarily attributable to lower revenue resulting from the sale of Meridian Consulting Group, LLC of approximately $4.4 million, lower revenue from the legal claims administration services of $4.3 million, and lower revenue from labor and employment practice of $1.9 million, during the year ended December 31, 2017, compared to the year ended December 31, 2016.
Cost of Revenue
Cost of revenue increased $310.0 million, or 59.7%, to $829.1 million for the year ended December 31, 2017 compared to $519.1 million for year ended December 31, 2016. The increase was primarily attributable to an increase in the ITPS segment of $323.9 million, offset by decreases in the HS and LLPS segments of $5.9 million and $7.9 million, respectively. The cost of revenue decrease by operating segment was as follows:
ITPS—Cost of revenue increased $323.9 million, or 109.1%, to $620.7 million for the year ended December 31, 2017 compared to $296.8 million for year ended December 31, 2016. The increase was primarily attributable to the acquisition of Novitex, which contributed $248.6 million. The acquisition of TransCentra contributed approximately $75.4 million. The increase was partially offset by various cost savings initiatives implemented during the year ended December 31, 2017.
HS—Cost of revenue decreased $5.9 million, or 3.7%, to $152.9 million for the year ended December 31, 2017 compared to $158.8 million for year ended December 31, 2016. This was primarily attributable to normalization of demand for coding during the year ended December 31, 2017 after the surge we experienced in early 2016 as a result of the increased healthcare coding requirements, resulting in a decrease of $4.5 million, along with an associated decrease in revenue. Additionally, there was a decrease of $1.4 million due to various cost savings initiatives from the Payer business during the year ended December 31, 2017.
LLPS—Cost of revenue decreased $7.9 million, or 12.4%, to $55.6 million for the year ended December 31, 2017 compared to $63.5 million for year ended December 31, 2016. The decrease was primarily attributable to a decrease in revenues of $2.7 million as a result of the sale of Meridian Consulting Group, LLC, a decrease from the legal claims administration of $2.6 million, and a decrease of $2.6 million due to lower revenues from labor and employment practice.
Selling, General and Administrative Expenses ("SG&A")
Selling, general, and administrative expenses increased $90.6 million, or 69.5%, to $221.0 million for the year ended December 31, 2017 compared to $130.4 million for the year ended December 31, 2016. The increase was primarily attributable to the expenses for professional fees related to the Business Combination, which contributed $60.0 million in expense for the year ended December 31, 2017. Additionally, the increase is attributable to acquisitions of Novitex and TransCentra, which contributed $25.2 million and $8.3 million, respectively, in expense for the year ended December 31, 2017. The increases were partially offset by a decrease due to cost saving initiatives we implemented, including reduced medical insurance expenditures and administrative personnel costs.
43
Depreciation & Amortization
Depreciation and amortization expense increased $19.3 million, or 24.2%, to $98.9 million for the year ended December 31, 2017 compared to $79.6 million for the year ended December 31, 2016. The increase was primarily attributable to higher balances of customer relationships, developed technology, and outsourced contract costs, resulting in higher amortization expense for the year ended December 31, 2017 compared to the year ended December 31, 2016.
Impairment of Goodwill and Other Intangible Assets
Impairment of goodwill and other intangible assets for the year ended December 31, 2017 was $69.4 million. There was no impairment recorded in 2016. As a result of declining revenue and a change in our branding and marketing strategy, we quantitatively assessed goodwill and other intangible assets as part of our annual impairment test. This assessment resulted in an impairment charge of $30.1 million for goodwill for the LLPS reporting unit, and $39.3 million related to our trade names intangible assets.
Related Party Expense
Related party expense increased $22.9 million to $33.4 million for the year ended December 31, 2017 compared to $10.5 million for the year ended December 31, 2016. The increase was primarily attributable to contract termination and advising fees as a result of the Business Combination.
Interest Expense
Interest expense increased $19.1 million, or 17.5%, to $128.5 million for the year ended December 31, 2017 compared to $109.4 million for the year ended December 31, 2016. The increase was primarily attributable to the issuance of new debt in conjunction with the Business Combination.
Loss on Extinguishment of Debt
Loss on extinguishment of debt for the year ended December 31, 2017 was $35.5 million relating to the restructuring and Business Combinations. There was no loss on extinguishment in 2016.
Sundry Expense
Sundry expense increased by $1.6 million to $2.3 million for the year ended December 31, 2017 compared to $0.7 million for the year ended December 31, 2016. The increase was mainly attributable to higher foreign currency transaction losses associated with exchange rate fluctuations.
Other Income
Other income for the year ended December 31, 2017 was $1.3 million. There was no other income in 2016 as this item relates solely to the interest rate swap entered into in 2017. The interest rate swap was not designated as a hedge. As such, changes in the fair value of the derivative are recorded directly in earnings.
Income Tax Benefit
Income tax benefit increased $48.4 million to $60.2 million for the year ended December 31, 2017 compared to $11.8 million for the year ended December 31, 2016. The increase in the income tax benefit was primarily due to net deferred tax liabilities assumed in the acquisition of Novitex which reduced the valuation allowance.
44
Results of Operations
Year Ended December 31, 2016, Compared to Year Ended December 31, 2015
| |
Year ended December 31, |
||||||
|---|---|---|---|---|---|---|---|
| |
2016 | 2015 | |||||
Revenue: |
|||||||
ITPS |
$ | 439,924 | $ | 421,409 | |||
HS |
247,796 | 251,685 | |||||
LLPS |
102,206 | 132,138 | |||||
| | | | | | | | |
Total revenue |
789,926 | 805,232 | |||||
Cost of revenue: |
|||||||
ITPS |
296,848 | 303,067 | |||||
HS |
158,800 | 174,380 | |||||
LLPS |
63,473 | 82,399 | |||||
| | | | | | | | |
Total cost of revenue (exclusive of depreciation and amortization) |
519,121 | 559,846 | |||||
Selling, general and administrative expenses |
130,437 |
120,691 |
|||||
Depreciation and amortization |
79,639 | 75,408 | |||||
Related party expense |
10,493 | 8,977 | |||||
| | | | | | | | |
Operating income |
50,236 | 40,310 | |||||
Interest expense, net |
109,414 | 108,779 | |||||
Loss on extinguishment of debt |
— | — | |||||
Sundry expense, net |
712 | 3,247 | |||||
| | | | | | | | |
Net loss before income taxes |
(59,890 | ) | (71,716 | ) | |||
Income tax benefit |
11,787 | 26,812 | |||||
| | | | | | | | |
Net loss |
(48,103 | ) | (44,904 | ) | |||
| | | | | | | | |
| | | | | | | | |
| | | | | | | | |
Revenue
Our revenue decreased $15.3 million, or 1.9%, to $789.9 million for the year ended December 31, 2016 compared to $805.2 million for the year ended December 31, 2015. This decrease is primarily related to a decrease in our LLPS segment revenues of $29.9 million. For the year ended December 31, 2016, our ITPS, HS, and LLPS segments constituted 55.7%, 31.4%, and 12.9% of our total revenue, respectively, compared to 52.3%, 31.3%, and 16.4%, respectively, for the year ended December 31, 2015. The revenue changes by reporting segment was as follows:
ITPS—Revenues increased $18.5 million, or 4.4%, to $439.9 million for the year ended December 31, 2016 compared to $421.4 million for the year ended December 31, 2015. The increase is primarily attributable to the acquisition of TransCentra which contributed approximately $33.3 million in revenue. The increase was partially offset by a $7.5 million decrease resulting from the impact of the devaluation of GBP and EUR against the USD in our European business due to the potential exit of the United Kingdom from the European Union. Additional offsets were a decrease of $4.4 million in pass through revenue and decrease of $3.9 million from shifts in customer volumes in the unified communication service lines.
HS—Revenues decreased $3.9 million, or 1.5%, to $247.8 million for the year ended December 31, 2016 compared to $251.7 million for the year ended December 31, 2015. The revenue decrease was primarily driven by an $11.4 million decline in a federal contract due to volume constraints resulting
45
from a site consolidation project executed in mid-2016, partially offset by a $9.7 million increase in revenue due to higher volumes from existing customers and the on-boarding of new customers.
LLPS—Revenues decreased $29.9 million, or 22.7%, to $102.2 million for the year ended December 31, 2016 compared to $132.1 million for the year ended December 31, 2015. The decrease was primarily due to declines of $24.0 million in the legal claims administration services including the winding down of the outsourced contract costs mortgage mega-case settlement. The legal claims administration market has shifted from major restitutions to fines and settlements from the regulatory authorities. The market remains steady with a supply of small settlements and cases in the absence of any mega-cases for settlement. The remaining decrease was primarily attributable to the labor and employment practice as the Company continues to right-size the employee base to improve utilization metrics per full time equivalent and reduce fixed costs.
Cost of Revenue
Cost of revenue decreased $40.7 million, or 7.3%, to $519.1 million for the year ended December 31, 2016 compared to $559.8 million for year ended December 31, 2015. The decrease was primarily attributable to decreases in the ITPS, HS and LLPS segments of $6.3 million, $15.6 and $18.9 million, respectively. The cost of revenue decrease by operating segment was as follows:
ITPS—Cost of revenue decreased $6.3 million, or 2.1%, to $296.8 million for the year ended December 31, 2016 compared to $303.1 million for year ended December 31, 2015. The decrease was primarily attributable to $27.8 million in cost saving initiatives implemented during the year for various service offerings, a decrease of $4.4 million in pass-through expenses and a decrease of $2.3 million in the unified communication service lines due to the shift in customer volumes. These decreases were partially offset by an increase in cost of revenue of $27.2 million related to the acquisition of TransCentra.
HS—Cost of revenue decreased $15.6 million, or 8.9%, to $158.8 million for the year ended December 31, 2016 compared to $174.4 million for year ended December 31, 2015. The decrease was primarily attributable to $13.6 million in cost saving initiatives implemented during the year for various service offerings and a $2.0 million decrease related to changes in revenue mix.
LLPS—Cost of revenue decreased $18.9 million, or 23.0%, to $63.5 million for the year ended December 31, 2016 compared to $82.4 million for year ended December 31, 2015. The decrease was primarily related to the changes in revenue mix. The cost of revenues declined by $11.8 million primarily due to lower revenue in the legal claims administration service lines including the winding down of the outsourced contract costs mortgage settlement. Additionally, a decrease of $5.6 million was driven by the labor and employment practice as it scaled down during the year.
Selling, General and Administrative Expenses
Selling, general, and administrative expenses increased $9.7 million, or 8.1%, to $130.4 million for the year ended December 31, 2016 compared to $120.7 million for the year ended December 31, 2015. The increase was primarily due to increases in personnel costs and professional fees.
Depreciation & Amortization
Depreciation and amortization expense increased $4.2 million, or 5.6%, to $79.6 million for the year ended December 31, 2016 compared to $75.4 million for the year ended December 31, 2015. The increase was primarily related to the write-off of outsourced contract costs during the year ended December 31, 2016.
46
Related Party Expense
Related party expense increased $1.5 million, or 16.9%, to $10.5 million for the year ended December 31, 2016 compared to $9.0 million for the year ended December 31, 2015.
Interest Expense
Interest expense increased $0.6 million, or 0.6%, to $109.4 million for the year ended December 31, 2016 compared to $108.8 million for the year ended December 31, 2015.
Sundry Expense
Sundry expense decreased by $2.5 million, or 78.1%, to $0.7 million for the year ended December 31, 2016 compared to $3.2 million for the year ended December 31, 2015. The decrease was mainly attributable to higher foreign currency transaction losses associated with exchange rate fluctuations during 2015.
Income Tax Benefit
Income tax benefit decreased $15.0 million to $11.8 million for the year ended December 31, 2016 compared to $26.8 million for the year ended December 31, 2015. The decrease was due to a decrease in the effective tax rate of 17% resulting from a partial valuation allowance being recorded against certain U.S. federal and state net operating loss carryforwards. At December 31, 2016, we concluded it was not "more likely than not" that a portion of its net operating loss and tax credit carryforwards will be realized.
Other Financial Information (Non-GAAP Financial Measures)
We view EBITDA and Adjusted EBITDA as important indicators of performance. We define EBITDA as net income, plus taxes, interest expense, and depreciation and amortization. We define Adjusted EBITDA as EBITDA plus optimization and restructuring charges, including severance and retention expenses; transaction and integration costs; other non-cash charges, including non-cash compensation, (gain) or loss from sale or disposal of assets, and impairment charges; and management fees and expenses.
We present EBITDA and Adjusted EBITDA because we believe they provide useful information regarding the factors and trends affecting our business in addition to measures calculated under GAAP. Additionally, our credit agreement requires us to comply with certain EBITDA related metrics. Refer to "—Liquidity and Capital Resources—Indebtedness."
Note Regarding Non-GAAP Financial Measures
EBITDA and Adjusted EBITDA are not financial measures presented in accordance with GAAP. We believe that the presentation of these non-GAAP financial measures will provide useful information to investors in assessing our financial performance and results of operations as our board of directors and management use EBITDA and Adjusted EBITDA to assess our financial performance, because it allows them to compare our operating performance on a consistent basis across periods by removing the effects of our capital structure (such as varying levels of interest expense), asset base (such as depreciation and amortization) and items outside the control of our management team. Net loss is the GAAP measure most directly comparable to EBITDA and Adjusted EBITDA. Our non-GAAP financial measures should not be considered as alternatives to the most directly comparable GAAP financial measure. Each of these non-GAAP financial measures has important limitations as analytical tools because they exclude some but not all items that affect the most directly comparable GAAP financial measures. These non-GAAP financial measures are not required to be uniformly applied, are
47
not audited and should not be considered in isolation or as substitutes for results prepared in accordance with GAAP. Because EBITDA and Adjusted EBITDA may be defined differently by other companies in our industry, our definitions of these non-GAAP financial measures may not be comparable to similarly titled measures of other companies, thereby diminishing their utility.
The following tables present a reconciliation of EBITDA and Adjusted EBITDA to our net loss, the most directly comparable GAAP measure, for the years ended December 31, 2017, 2016, and 2015:
| |
Year ended December 31, | |||||||||
|---|---|---|---|---|---|---|---|---|---|---|
| |
2017 | 2016 | 2015 | |||||||
Net Loss |
$ | (204,285 | ) | $ | (48,103 | ) | $ | (44,904 | ) | |
Taxes |
(60,246 | ) | (11,787 | ) | (26,812 | ) | ||||
Interest expense |
128,489 | 109,414 | 108,779 | |||||||
Depreciation and amortization |
98,890 | 79,639 | 75,408 | |||||||
| | | | | | | | | | | |
EBITDA |
(37,152 | ) | 129,163 | 112,471 | ||||||
Optimization and restructuring expenses(1) |
42,524 | 7,559 | 5,210 | |||||||
Transaction and integration costs(2) |
88,935 | 18,848 | 18,466 | |||||||
Non-cash equity compensation(3) |
6,743 | 7,085 | 8,122 | |||||||
Other non-cash charges(4) |
518 | 471 | 1,881 | |||||||
Loss on sale of assets(5) |
40 | 2,274 | 284 | |||||||
Gain on sale of Meridian(6) |
(588 | ) | — | — | ||||||
Management, board fees and expenses(7) |
4,153 | 7,837 | 6,897 | |||||||
Loss on extinguishment of debt(8) |
35,512 | — | — | |||||||
Gain / loss on derivative instruments(9) |
(1,297 | ) | — | — | ||||||
Impairment of intangible assets(10) |
39,370 | — | — | |||||||
Impairment of Goodwill(11) |
30,067 | — | — | |||||||
| | | | | | | | | | | |
Adjusted EBITDA |
208,825 | 173,237 | 153,331 | |||||||
| | | | | | | | | | | |
| | | | | | | | | | | |
| | | | | | | | | | | |
- (1)
- Adjustment
represents compensation expense associated with positions that were terminated, including severance, retention bonuses, and related fees and expenses.
Additionally, the adjustment includes charges incurred by us to terminate existing lease contracts as part of facility consolidation initiatives.
- (2)
- Represents
costs incurred related to transactions and integration for completed or contemplated transactions during the period. For the year ended
December 31, 2017, only transaction costs were incurred.
- (3)
- Represents
the non-cash expenses related to restricted stock units granted by Ex-Sigma, LLC to our employees that vested during the year.
- (4)
- Represents
fair value adjustments to deferred revenue and deferred rent accounts established as part of purchase accounting.
- (5)
- Represents
a loss recognized on the disposal of property, plant and equipment and other assets.
- (6)
- Represents
a gain recognized on the disposal of Meridian Consulting Group, LLC.
- (7)
- Amount
represents management fees paid to HGM and TransCentra's prior owner, board of directors' fees and corresponding travel, and other expenses
(e.g., rating agency fees, chargebacks) which are not expected to continue.
- (8)
- Represents a loss recognized due to restructuring of debt facilities in connection with the Business Combination.
48
- (9)
- Represents
the impact of changes in the fair value of an interest rate swap entered into during the fourth quarter of 2017.
- (10)
- Represents
impairment charges recorded for indefinite lived intangible assets during the fourth quarter of 2017.
- (11)
- Represents impairment charges recorded for goodwill during the fourth quarter of 2017.
Year Ended December 31, 2017 compared to the Year Ended December 31, 2016
EBITDA and Adjusted EBITDA
EBITDA was $(37.2) million for the year ended December 31, 2017 compared to $129.2 million for the year ended December 31, 2016. Adjusted EBITDA was $208.8 million for the year ended December 31, 2017 compared to $173.2 million for the year ended December 31, 2016. The decrease in EBITDA was primarily due to a higher net loss amount for the year ended December 31, 2017 resulting from an increase in selling, general and administrative expenses, related party expense, and loss on extinguishment of debt compared to the year ended December 31, 2016. The increase in Adjusted EBITDA was primarily due higher overall gross profit for the year ended December 31, 2017 compared to the year ended December 31, 2016, along with lower recurring expenses as part of on-going operations.
Year Ended December 31, 2016 compared to the Year Ended December 31, 2015
EBITDA and Adjusted EBITDA
EBITDA was $129.2 million for the year ended December 31, 2016 compared to $112.5 million for the year ended December 31, 2015. Adjusted EBITDA was $173.2 million for the year ended December 31, 2016 compared to $153.3 million for the year ended December 31, 2015. The increase in EBITDA and Adjusted EBITDA resulted from an increase in gross profit, offset partially by an increase in SG&A expenses, as discussed above. Additionally, the increase was partially due to a decrease in the income tax benefit amount compared to 2015.
Liquidity and Capital Resources
Overview
Our primary source of liquidity is principally cash generated from operating activities supplemented as necessary on a short-term basis by borrowings against our senior secured revolving credit facility. We believe our current level of cash and short term financing capabilities along with future cash flows from operations are sufficient to meet the needs of the business.
We currently expect to spend approximately $40.0 to $45.0 million on total capital expenditures over the next twelve months. We believe that our operating cash flow and available borrowings under our credit facility will be sufficient to fund our operations for at least the next twelve months.
At December 31, 2017, cash and cash equivalents totaled $39.0 million, and we had availability of $79.1 million under our senior secured revolving credit facility.
In connection with the Business Combination, we acquired debt facilities and issued notes totaling $1.4 billion. Proceeds from the acquired debt were used to refinance the existing debt of SourceHOV, settle the outstanding debt facilities for Novitex, and pay fees and expenses incurred in connection with the Business Combination. We entered into a Credit Agreement with a $350.0 million senior secured term loan, a $100.0 million senior secured revolving facility, and $1.0 billion in First Priority Senior Secured Notes (the "Senior Secured Notes"). The $100.0 million revolver remained undrawn (net of letters of credit) at the time of compilation of this report.
49
On November 8, 2017, the Company's board of directors authorized a share buyback program (the "Share Buyback Program"), pursuant to which the Company may, from time to time, purchase up to 5,000,000 shares of its Common Stock. Share repurchases may be executed through various means, including, without limitation, open market transactions, privately negotiated transactions or otherwise. The decision as to whether to purchase any shares and the timing of purchases, if any, will be based on the price of the Company's Common Stock, general business and market conditions and other investment considerations and factors. The Share Buyback Program does not obligate the Company to purchase any shares and expires 24 months after authorization. The Share Buyback Program may be terminated or amended by the Company's board of directors in its discretion at any time. As of December 31, 2017, 49,300 shares had been repurchased under the Share Buyback Program.
Cash Flows
The following table summarizes our cash flows for the periods indicated:
| |
Year ended December 31, | |||||||||
|---|---|---|---|---|---|---|---|---|---|---|
| |
2017 | 2016 | 2015 | |||||||
Cash flow from operating activities |
$ | 42,369 | $ | 68,658 | $ | 7,438 | ||||
Cash flow used in investing activities |
(452,374 | ) | (31,602 | ) | (34,432 | ) | ||||
Cash flows (used in) provided by financing activities |
440,215 | (43,255 | ) | 21,618 | ||||||
| | | | | | | | | | | |
Subtotal |
30,210 | (6,199 | ) | (5,376 | ) | |||||
Effect of exchange rates on cash |
429 | (2,059 | ) | (672 | ) | |||||
| | | | | | | | | | | |
Net increase/(decrease) in cash |
30,639 | (8,258 | ) | (6,048 | ) | |||||
| | | | | | | | | | | |
| | | | | | | | | | | |
| | | | | | | | | | | |
Analysis of Cash Flow Changes between the years ended December 31, 2017, December 31, 2016, and December 31, 2015
Operating Activities—Net cash provided by operating activities was $42.4 million for the year ended December 31, 2017, compared to $68.7 million for the year ended December 31, 2016. The decrease of $26.3 million in cash flow from operating activities was primarily due to decreases in operating results, greater cash outflows from accounts payable and accrued liabilities due to timing of payments, and lower cash inflows from accounts receivable due to the timing of collections.
Net cash provided by operating activities was $68.7 million for the year ended December 31, 2016, compared to $7.4 million for the year ended December 31, 2015. The increase of $61.3 million in cash from operating activities was primarily due to increases in operating results, lower cash outflows from accounts payable due to timing of payments, and greater cash inflow from accounts receivable due to the timing of collections, partially offset by decreases in prepaid expenses.
Investing Activities—Net cash used in investing activities was $452.4 million for the year ended December 31, 2017, compared to $31.6 million for the year ended December 31, 2016. The increase of $420.8 million in cash used in investing activities was primarily due to cash paid to acquire Novitex, partially offset by proceeds received from the sale of Meridian Consulting Group, LLC during the year ended December 31, 2017, as well as higher additions to intangible assets during the year ended December 31, 2016.
Net cash used in investing activities was $31.6 million for the year ended December 31, 2016, compared to $34.4 million for the year ended December 31, 2015. The decrease of $2.8 million in cash used in investing activities was primarily due to increases in cash utilized for capitalized software costs and outsourced contract costs, offset by the strategic cash payment in 2015 for the option to acquire TransCentra, net of the cash acquired in 2016 from the acquisition of TransCentra.
50
Financing Activities—Net cash provided by financing activities was $440.2 million for the year ended December 31, 2017, compared to cash used in financing activities of $43.3 million for the year ended December 31, 2016. The increase of $483.5 million in cash provided by financing activities was primarily due to proceeds from issuance of stock and cash received from Quinpario in the amount of $231.4 million, as well as proceeds from a new credit facility of $1,320.5 million during the year ended December 31, 2017, which was partially offset by the retirement of the previous credit facilities of $1,055.7 million.
Net cash used in financing activities was $43.3 million for the year ended December 31, 2016, compared to net cash provided by financing activities of $21.6 million for the year ended December 31, 2015. The change in cash used in financing activities was primarily due to a decrease in borrowings from the revolvers, as well as an increase in principal payments on the long-term obligations.
Indebtedness
As noted, in connection with the Business Combination on July 12, 2017, we acquired debt facilities and issued notes totaling $1.4 billion. Proceeds from the indebtedness were used to pay off credit facilities existing immediately before the Business Combination.
Senior Credit Facilities
On July 12, 2017, the Company entered into a First Lien Credit Agreement with Royal Bank of Canada, Credit Suisse AG, Cayman Islands Branch, Natixis, New York Branch and KKR Corporate Lending LLC (the "Credit Agreement") providing Exela Intermediate LLC, a wholly owned subsidiary of the Company, upon the terms and subject to the conditions set forth in the Credit Agreement, (i) a $350.0 million senior secured term loan maturing July 12, 2023 with an original issue discount of $7.0 million, and (ii) a $100.0 million senior secured revolving facility maturing July 12, 2022, none of which is currently drawn. The Credit Agreement provides for the following interest rates for borrowings under the senior secured term facility and senior secured revolving facility: at the Company's option, either (1) an adjusted LIBOR, subject to a 1.0% floor in the case of term loans, or (2) a base rate, in each case plus an applicable margin. The initial applicable margin for the senior secured term facility is 7.5% with respect to LIBOR borrowings and 6.5% with respect to base rate borrowings. The initial applicable margin for the senior secured revolving facility is 7.0% with respect to LIBOR borrowings and 6.0% with respect to base rate borrowings. The applicable margin for borrowings under the senior secured revolving facility is subject to step-downs based on leverage ratios. The senior secured term loan is subject to amortization payments, commencing on the last day of the first full fiscal quarter of the Company following the closing date, of 0.6% of the aggregate principal amount for each of the first eight payments and 1.3% of the aggregate principal amount for payments thereafter, with any balance due at maturity. As of December 31, 2017 the interest rate applicable for the first lien senior secured term loan was 9.064%.
Senior Secured Notes
Upon the closing of the Business Combination on July 12, 2017, the Company issued $1.0 billion in aggregate principal amount of 10.0% First Priority Senior Secured Notes due 2023 (the "Notes"). The Notes are guaranteed by certain subsidiaries of the Company. The Notes bear interest at a rate of 10.0% per year. The Company pays interest on the Notes on January 15 and July 15 of each year, commencing on January 15, 2018. The Notes will mature on July 15, 2023.
Letters of Credit
As of December 31, 2017 and December 31, 2016, we had outstanding irrevocable letters of credit totaling approximately $20.9 million and $9.3 million, respectively, under the revolving credit facility.
51
Contractual Obligations
The table below provides estimates of the timing of future payments that we are obligated to make based on agreements in place at December 31, 2017.
| |
Payments Due by Period | |||||||||||||||
|---|---|---|---|---|---|---|---|---|---|---|---|---|---|---|---|---|
| |
Less than 1 Year | 1 - 3 Years | 3 - 5 Years | More than 5 Years | Total | |||||||||||
| |
(in millions) |
|||||||||||||||
Credit Facilities |
8.8 | 28.4 | 35.0 | 1,275.6 | 1,347.8 | |||||||||||
Interest payments |
132.6 | 262.2 | 255.5 | 66.5 | 716.8 | |||||||||||
Capital lease obligations |
18.3 | 17.9 | 7.7 | 4.9 | 48.8 | |||||||||||
Operating lease obligations |
36.9 | 48.9 | 27.4 | 16.4 | 129.6 | |||||||||||
Other obligations |
11.8 | 3.3 | 2.4 | — | 17.5 | |||||||||||
Pension related obligations(1) |
2.5 | — | — | — | 2.5 | |||||||||||
| | | | | | | | | | | | | | | | | |
Total |
210.9 | 360.7 | 328.0 | 1,363.4 | 2,263.0 | |||||||||||
| | | | | | | | | | | | | | | | | |
| | | | | | | | | | | | | | | | | |
| | | | | | | | | | | | | | | | | |
- (1)
- We sponsor pension related obligations that require periodic cash distributions. In 2018, based on current actuarial calculations, we expect to make additional contributions of approximately $2.5 million to our worldwide pension related obligations. Contributions to our pension related obligations in subsequent years will depend on a number of factors, including the investment performance of plan assets and discount rates as well as potential legislative and plan changes.
Potential Future Transactions
We may, from time to time explore and evaluate possible strategic transactions, which may include joint ventures, as well as business combinations or the acquisition or disposition of assets. In order to pursue certain of these opportunities, additional funds will likely be required. Subject to applicable contractual restrictions, to obtain such financing, we may seek to use cash on hand, borrowings under our revolving credit facility, or we may seek to raise additional debt or equity financing through private placements or through underwritten offerings. There can be no assurance that we will enter into additional strategic transactions or alliances, nor do we know if we will be able to obtain the necessary financing for transactions that require additional funds on favorable terms, if at all. In addition, pursuant to the Registration Rights Agreement that we entered into in connection with the closing of the Business Combination, certain of our stockholders have the right to demand underwritten offerings of our Common Stock. We are exploring, and may from time to time in the future explore, with certain of those stockholders the possibility of an underwritten public offering of our Common Stock held by those stockholders. There can be no assurance as to whether or when an offering may be commenced or completed, or as to the actual size or terms of the offering.
Critical Accounting Policies and Estimates
The preparation of financial statements requires the use of judgments and estimates. Our critical accounting policies are described below to provide a better understanding of how we develop our assumptions and judgments about future events and related estimations and how they can impact our financial statements. A critical accounting estimate is one that requires subjective or complex estimates and assessments, and is fundamental to our results of operations. We base our estimates on historical experience and on various other assumptions we believe to be reasonable according to the current facts and circumstances, the results of which form the basis for making judgments about the carrying values of assets and liabilities that are not readily apparent from other sources. We believe the current assumptions, judgments and estimates used to determine amounts reflected in our consolidated financial statements are appropriate; however, actual results may differ under different conditions. This
52
discussion and analysis should be read in conjunction with our consolidated financial statements and related notes included in this document.
Goodwill and other intangible assets: Goodwill and other intangible assets are initially recorded at their fair values. Goodwill represents the excess of the purchase price of acquisitions over the fair value of the net assets acquired. Our goodwill at December 31, 2017 and December 31, 2016 was $747.3 million and $373.3 million, respectively. Goodwill and other intangible assets not subject to amortization are tested for impairment annually or more frequently if events or changes in circumstances indicate that the asset might be impaired. Intangible assets with finite useful lives are amortized either on a straight-line basis over the asset's estimated useful life or on a basis that reflects the pattern in which the economic benefits of the intangible assets are realized.
Outsourced contract costs: In connection with services arrangements, we incur and capitalize costs to originate long-term contracts. Certain initial direct costs of an arrangement are capitalized and amortized over the contractual service period of the arrangement to cost of services. We regularly review costs to determine appropriateness for deferral in accordance with the relevant accounting guidance. Key estimates and assumptions that we must make include projecting future cash flows in order to assess the recoverability of deferred costs. To assess recoverability, cash flows are projected over the remaining life and compared to the carrying amount of contract related assets, including the unamortized deferred cost balance. Such estimates require judgment and assumptions, which are based upon the professional knowledge and experience of our personnel. A significant change in an estimate or assumption on one or more contracts could have a material effect on our results of operations.
Impairment of goodwill, long-lived and other intangible assets: Long-lived assets, such as property and equipment and finite-lived intangible assets are evaluated for impairment whenever events or changes in circumstances indicate that their carrying value may not be recoverable. Recoverability is measured by a comparison of their carrying amount to the estimated undiscounted cash flows to be generated by those assets. If the undiscounted cash flows are less than the carrying amount, we record impairment losses for the excess of the carrying value over the estimated fair value. Fair value is determined, in part, by the estimated cash flows to be generated by those assets. Our cash flow estimates are based upon, among other things, historical results adjusted to reflect our best estimate of future market rates, and operating performance. Development of future cash flows also requires us to make assumptions and to apply judgment, including timing of future expected cash flows, using the appropriate discount rates, and determining salvage values. The estimate of fair value represents our best estimates of these factors, and is subject to variability. Assets are generally grouped at the lowest level of identifiable cash flows, which is the reporting unit level for us. Changes to our key assumptions related to future performance and other economic factors could adversely affect our impairment valuation.
We test our indefinite lived intangible assets on October 1st of each year, or more frequently if events or changes in circumstances indicate that the assets may be impaired. When performing the impairment test, we have the option of performing a qualitative or quantitative assessment to determine if an impairment has occurred. A quantitative assessment requires comparison of fair value of the asset to its carrying value. We utilize the Income Approach, specifically the Relief-from-Royalty method, which has the basic tenet that a user of that intangible asset would have to make a stream of payments to the owner of the asset in return for the rights to use that asset. By acquiring the intangible asset, the user avoids these payments. Application of the indefinite lived intangible asset impairment test requires judgment, including determination of royalty rates, and projecting revenue attributable to the assets in order to determine fair value. On October 1, 2017, we elected to bypass the qualitative assessment and perform a quantitative assessment of the carrying value of our indefinite-lived intangible assets as of our annual impairment testing date. As a result of this analysis, $6.3 million of impairment was recorded due to the decline in the valuation of trade names. Additionally, later during
53
the fourth quarter of 2017, due to a change in our anticipated marketing strategy for 2018 and expected use of certain names, we performed another quantitative impairment test as of December 31, 2017. As a result of this analysis, $33.0 million of additional impairment was recorded due to the decline in the valuation of trade names. As part of the analysis, we also reconsidered the expected useful lives of certain indefinite-lived trade names. We reduced the estimated useful lives of those trade names to one year, and will commence amortization over the remaining useful life beginning in 2018.
We conduct our annual goodwill impairment tests on October 1st of each year, or more frequently if indicators of impairment exist. When performing the annual impairment test, we have the option of performing a qualitative or quantitative assessment to determine if an impairment has occurred. If a qualitative assessment indicates that it is more likely than not that the fair value of a reporting unit is less than its carrying amount, we would be required to perform a quantitative impairment test for goodwill. A quantitative test requires comparison of fair value of the reporting unit to its carrying value, including goodwill. We use a combination of the Guideline Public Company Method of the Market Approach and the Discounted Cash Flow Method of the Income Approach to determine the reporting unit fair value. For the Guideline Public Company Method, our annual impairment test utilizes discounted cash flow projections using weighted average cost of capital calculations based on capital structures of publicly traded peer companies. For the Discounted Cash Flow Method, our annual impairment test utilizes discounted cash flow projections using our weighted average cost of capital calculation. If the fair value of goodwill at the reporting unit level is less than its carrying value, an impairment loss is recorded for the amount by which a reporting unit's carrying amount exceeds its fair value, limited to the total amount of goodwill allocated to that reporting unit. During the year ended December 31, 2017, due to a decline in revenues and operations in our LLPS reporting unit, we elected to bypass the qualitative assessment and perform a quantitative impairment assessment of the carrying value of our goodwill. As a result of the analysis, we recorded an impairment charge of $30.1 million for the LLPS reporting unit's goodwill. As of the annual impairment testing date in 2017, the fair values of the ITPS and HS reporting units exceeded the carrying value by 61.7% and 130.9%, respectively.
Application of the goodwill impairment test requires judgment, including the identification of reporting units, allocation of assets and liabilities to reporting units, and determination of fair value. The determination of reporting unit fair value is sensitive to the amount of EBITDA generated by us, as well as the EBITDA multiple used in the calculation. Unanticipated changes, including immaterial revisions, to these assumptions could result in a provision for impairment in a future period. Given the nature of these evaluations and their application to specific assets and time frames, it is not possible to reasonably quantify the impact of changes in these assumptions.
Revenue: Application of the various accounting principles in GAAP related to the measurement and recognition of revenue requires us to make judgments and estimates. Complex arrangements with nonstandard terms and conditions may require significant contract interpretation to determine the appropriate accounting. Refer to Note 2—Basis of Presentation and Summary of Significant Accounting Policies for additional information regarding our revenue recognition policy.
If a contract involves the provision of a single element, revenue is generally recognized when the product or service is provided and the amount earned is not contingent upon any future event. Revenue from time and materials arrangements is recognized as the services are performed.
Multiple element arrangements
We also enter into multiple element arrangements involving various combinations. The deliverables within these arrangements are evaluated at contract inception to determine whether they represent separate units of accounting, and if so, contract consideration is allocated to each deliverable based on relative selling price. With respect to arrangements including tangible products containing both software
54
and non-software components that function together to deliver the product's essential functionality, the relative selling price is determined using vendor specific objective evidence ("VSOE") of fair value, third-party evidence or best estimate of selling price. For our multiple element arrangements that are comprised solely of software and software elements, revenue is allocated to the various elements based on VSOE of fair value and the residual method to allocate the arrangement consideration. Revenue is then recognized in accordance with the appropriate revenue recognition guidance applicable to the respective elements.
If the multiple element arrangements criteria are not met, the arrangement is accounted for as one unit of accounting which would result in revenue being recognized on a straight-line basis over the period of delivery or being deferred until the earlier of when such criteria are met or when the last element is delivered.
Income Taxes: We account for income taxes by using the asset and liability method. We account for income taxes regarding uncertain tax positions and recognize interest and penalties related to uncertain tax positions in income tax benefit/ (expense) in the consolidated statements of operations.
The Tax Cuts and Jobs Act ("TCJA") was signed by the President of the United States and enacted into law on December 22, 2017. The TCJA significantly changes U.S. tax law by reducing the U.S. corporate income tax rate to 21% from 35%, adopting a territorial tax regime, creating new taxes on certain foreign sourced earnings and imposing a one-time transition tax on the undistributed earnings of certain non-U.S. subsidiaries.
Accounting Standards Codification Topic 740, Income Taxes ("ASC 740") requires companies to account for the tax effects of changes in income tax rates and laws in the period in which legislation is enacted (December 22, 2017). ASC 740 does not specifically address accounting and disclosure guidance in connection with the income tax effects of the TCJA. Consequently, on December 22, 2017, the Securities and Exchange Commission staff issued Staff Accounting Bulletin No. 118 ("SAB 118"), to address the application of ASC 740 in the reporting period that includes the date the TCJA was enacted. SAB 118 allows companies a reasonable period of time to complete the accounting for the income tax effects of the TCJA.
At December 31, 2017, the Company has not completed the accounting for the income tax effects of the TCJA. However, pursuant to SAB 118, the Company has made provisional estimates of the effects of existing deferred tax assets and liabilities and the one-time transition tax.
Deferred income taxes are recognized on the tax consequences of temporary differences by applying enacted statutory tax rates applicable in future years to differences between the financial statement carrying amounts and the tax bases of existing assets and liabilities, as determined under tax laws and rates. A valuation allowance is provided when it is more likely than not that all or some portion of the deferred tax assets will not be realized. Due to numerous ownership changes, we are subject to limitations on existing net operating losses under Section 382 of the Internal Revenue Code (the Code). In the event we determine that we would be able to realize deferred tax assets that have valuation allowances established, an adjustment to the deferred tax assets would be recognized as a component of income tax expense through continuing operations.
We engage in transactions (such as acquisitions) in which the tax consequences may be subject to uncertainty and examination by the varying taxing authorities. Significant judgment is required by us in assessing and estimating the tax consequences of these transactions. While our tax returns are prepared and based on our interpretation of tax laws and regulations, in the normal course of business the tax returns are subject to examination by the various taxing authorities. Such examinations may result in future assessments of additional tax, interest and penalties. For purposes of our income tax provision, a tax benefit is not recognized if the tax position is not more likely than not to be sustained based solely
55
on its technical merits. Considerable judgment is involved in determining which tax positions are more likely than not to be sustained.
Business Combinations: We allocate the total cost of an acquisition to the underlying assets based on their respective estimated fair values. Determination of fair values involves significant estimates and assumptions about highly subjective variables, including future cash flows, discount rates, and asset lives. The estimates of the fair values of assets and liabilities acquired are based upon assumptions believed to be reasonable and, when appropriate, include assistance from independent third-party valuation firms.
Because we are primarily a services business, our acquisitions typically result in significant amounts of goodwill and other intangible assets. Fair value estimates and calculations for these acquisitions will affect the amount of amortization expense, or possible impairment related charges recognized in future periods. We base our fair value estimates on assumptions we believe are reasonable, but recognize that the assumptions are inherently uncertain.
JOBS Act
On April 5, 2012, the JOBS Act was signed into law. The JOBS Act contains provisions that, among other things, relax certain reporting requirements for qualifying public companies. We had previously elected to delay the adoption of new or revised accounting standards as an emerging growth company; however, we no longer qualify as an emerging growth company and will be required to comply with new or revised accounting standards using public company effective dates.
Recently Adopted and Recently Issued Accounting Pronouncements
See Note 2 to the consolidated financial statements.
Internal Controls and Procedures
As a publicly traded company, we are required to comply with the SEC's rules implementing Section 302 and 404 of the Sarbanes-Oxley Act, which require management to certify financial and other information in our quarterly and annual reports and provide an annual management report on the effectiveness of controls over financial reporting. However, as we completed the Business Combination on July 12, 2017, it was not possible for us to conduct an assessment of the accounting acquirer's internal control over financial reporting in the period between the consummation date of the reverse acquisition and the date of management's assessment of internal control over financial reporting required by Item 308(a) of Regulation S-K. As such, in accordance with the guidance provided in Section 215.02 of the SEC's Compliance and Disclosure Interpretations, we have not included management's report on internal controls over financial reporting in this report. We will be required to provide such a report in our annual report for the year ending December 31, 2018.
Off Balance Sheet Arrangements
At December 31, 2017, we had no material off balance sheet arrangements, except for operating leases. As such, we are not materially exposed to any financing, liquidity, market or credit risk that could arise if we had engaged in such financing arrangements. Our operating leases are composed of various office and industrial buildings, machinery, equipment, and vehicles. As of December 31, 2017, our total future minimum lease payments under non-cancelable operating leases were $129.6 million.
56
ITEM 7A. QUANTITATIVE AND QUALITATIVE DISCLOSURE ABOUT MARKET RISK
Quantitative and Qualitative Disclosure About Market Risk
Interest Rate Risk
At December 31, 2017, we had $1,350.0 million of debt outstanding, with a weighted average interest rate of 9.7585%. Interest is calculated under the terms of our credit agreement based on the greatest of certain specified base rates plus an applicable margin that varies based on certain factors. Assuming no change in the amount outstanding, the impact on interest expense of a 1% increase or decrease in the assumed weighted average interest rate would be approximately $13.5 million per year. In order to mitigate interest rate fluctuations with respect to term loan borrowings under the Credit Agreement, in November 2017, we entered into a three year, one-month LIBOR interest rate swap contract with a notional amount of $347.8 million, which is the remaining principal balance of the term loan. The swap contract will swap out the floating rate interest risk related to the LIBOR with a fixed interest rate of 1.9275% and will be effective on January 12, 2018.
The interest rate swap, which is used to manage our exposure to interest rate movements and other identified risks, was not designated as a hedge. As such, changes in the fair value of the derivative are recorded directly in earnings and were equal to $1.3 million for the year ended December 31, 2017.
Foreign Currency Risk
We are exposed to foreign currency risks that arise from normal business operations. These risks include transaction gains and losses associated with intercompany loans with foreign subsidiaries and transactions denominated in currencies other than a location's functional currency. Contracts are denominated in currencies of major industrial countries.
Market Risk
We are exposed to market risks primarily from changes in interest rates and foreign currency exchange rates. We do not use derivatives for trading purposes, to generate income or to engage in speculative activity.
57
ITEM 8. FINANCIAL STATEMENTS AND SUPPLEMENTARY DATA
FINANCIAL STATEMENTS AND SUPPLEMENTARY DATA
The following financial statements and schedules are included herein:
58
Report of Independent Registered Public Accounting Firm
To
the Stockholders and Board of Directors
Exela Technologies, Inc.:
Opinion on the Consolidated Financial Statements
We have audited the accompanying consolidated balance sheets of Exela Technologies, Inc. and subsidiaries (the Company) as of December 31, 2017 and 2016, the related consolidated statements of operations, comprehensive loss, stockholders' deficit, and cash flows for each of the years in the three-year period ended December 31, 2017, and the related notes (collectively, the consolidated financial statements). In our opinion, the consolidated financial statements present fairly, in all material respects, the financial position of the Company as of December 31, 2017 and 2016, and the results of its operations and its cash flows for each of the years in the three-year period ended December 31, 2017, in conformity with U.S. generally accepted accounting principles.
Basis for Opinion
These consolidated financial statements are the responsibility of the Company's management. Our responsibility is to express an opinion on these consolidated financial statements based on our audits. We are a public accounting firm registered with the Public Company Accounting Oversight Board (United States) (PCAOB) and are required to be independent with respect to the Company in accordance with the U.S. federal securities laws and the applicable rules and regulations of the Securities and Exchange Commission and the PCAOB.
We conducted our audits in accordance with the standards of the PCAOB. Those standards require that we plan and perform the audit to obtain reasonable assurance about whether the consolidated financial statements are free of material misstatement, whether due to error or fraud. Our audits included performing procedures to assess the risks of material misstatement of the consolidated financial statements, whether due to error or fraud, and performing procedures that respond to those risks. Such procedures included examining, on a test basis, evidence regarding the amounts and disclosures in the consolidated financial statements. Our audits also included evaluating the accounting principles used and significant estimates made by management, as well as evaluating the overall presentation of the consolidated financial statements. We believe that our audits provide a reasonable basis for our opinion.
![]()
We have served as the Company's auditor since 2013.
Dallas,
Texas
March 16, 2018
59
Exela Technologies, Inc. and Subsidiaries
Consolidated Balance Sheets
For the years ended December 31, 2017 and 2016
(in thousands of United States dollars except share and per share amounts)
| |
December 31, | ||||||
|---|---|---|---|---|---|---|---|
| |
2017 | 2016 | |||||
Assets |
|||||||
Current assets |
|||||||
Cash and cash equivalents |
$ | 39,000 | $ | 8,361 | |||
Restricted cash |
42,489 | 25,892 | |||||
Accounts receivable, net of allowance for doubtful accounts of $3,725 and $3,219 respectively |
229,704 | 138,421 | |||||
Inventories, net |
11,922 | 11,195 | |||||
Prepaid expenses and other current assets |
24,596 | 12,202 | |||||
| | | | | | | | |
Total current assets |
347,711 | 196,071 | |||||
Property, plant and equipment, net |
132,908 | 81,600 | |||||
Goodwill |
747,325 | 373,291 | |||||
Intangible assets, net |
464,984 | 298,739 | |||||
Deferred income tax assets |
9,019 | 9,654 | |||||
Other noncurrent assets |
12,891 | 10,131 | |||||
| | | | | | | | |
Total assets |
$ | 1,714,838 | $ | 969,486 | |||
| | | | | | | | |
Liabilities and Stockholders' Equity (Deficit) |
|||||||
Liabilities |
|||||||
Current liabilities |
|||||||
Accounts payable |
$ | 81,263 | $ | 42,212 | |||
Related party payables |
14,445 | 9,344 | |||||
Income tax payable |
3,612 | 1,031 | |||||
Accrued liabilities |
104,485 | 29,492 | |||||
Accrued compensation and benefits |
46,925 | 31,200 | |||||
Customer deposits |
31,656 | 18,729 | |||||
Deferred revenue |
12,709 | 17,235 | |||||
Obligation for claim payment |
42,489 | 25,892 | |||||
Current portion of capital lease obligations |
15,611 | 6,507 | |||||
Current portion of long-term debt |
20,565 | 55,833 | |||||
| | | | | | | | |
Total current liabilities |
373,760 | 237,475 | |||||
| | | | | | | | |
Long-term debt, net of current maturities |
1,276,094 | 983,502 | |||||
Capital lease obligations, net of current maturities |
25,958 | 18,439 | |||||
Pension liability |
25,496 | 28,712 | |||||
Deferred income tax liabilities |
5,362 | 26,223 | |||||
Long-term income tax liability |
3,470 | 3,063 | |||||
Other long-term liabilities |
14,704 | 11,973 | |||||
| | | | | | | | |
Total liabilities |
1,724,844 | 1,309,387 | |||||
| | | | | | | | |
Commitment and Contingencies(Note 12) |
|||||||
Stockholders' equity (deficit) |
|||||||
Common stock, par value of $0.0001 per share; 1,600,000,000 shares authorized; 150,578,451 shares issued and 150,529,151 outstanding at December 31, 2017 and 64,024,557 shares issued and outstanding at December 31, 2016; |
15 | 6 | |||||
Preferred stock, par value of $0.0001 per share; 20,000,000 shares authorized and 6,194,233 shares issued and outstanding at December 31, 2017 and no shares issued or outstanding at December 31, 2016 |
1 | — | |||||
Additional paid in capital |
482,018 | (57,395 | ) | ||||
Less: common stock held in treasury, at cost; 49,300 shares at December 31, 2017 and no shares at December 31, 2016 |
(249 | ) | — | ||||
Equity-based compensation |
34,085 | 27,342 | |||||
Accumulated deficit |
(514,628 | ) | (293,968 | ) | |||
Accumulated other comprehensive loss: |
|||||||
Foreign currency translation adjustment |
(194 | ) | (3,547 | ) | |||
Unrealized pension actuarial losses, net of tax |
(11,054 | ) | (12,339 | ) | |||
| | | | | | | | |
Total accumulated other comprehensive loss |
(11,248 | ) | (15,886 | ) | |||
| | | | | | | | |
Total stockholders' deficit |
(10,006 | ) | (339,901 | ) | |||
| | | | | | | | |
Total liabilities and stockholders' deficit |
$ | 1,714,838 | $ | 969,486 | |||
| | | | | | | | |
| | | | | | | | |
| | | | | | | | |
The accompanying notes are an integral part of these consolidated financial statements.
60
Exela Technologies, Inc. and Subsidiaries
Consolidated Statement of Operations
For the years ended December 31, 2017, 2016 and 2015
(in thousands of United States dollars except share and per share amounts)
| |
Year ended December 31, | |||||||||
|---|---|---|---|---|---|---|---|---|---|---|
| |
2017 | 2016 | 2015 | |||||||
Revenue |
$ | 1,152,324 | $ | 789,926 | $ | 805,232 | ||||
Cost of revenue (exclusive of depreciation and amortization) |
829,143 | 519,121 | 559,846 | |||||||
Selling, general and administrative expenses |
220,955 | 130,437 | 120,691 | |||||||
Depreciation and amortization |
98,890 | 79,639 | 75,408 | |||||||
Impairment of goodwill and other intangible assets |
69,437 | — | — | |||||||
Related party expense |
33,431 | 10,493 | 8,977 | |||||||
| | | | | | | | | | | |
Operating (loss) income |
(99,532 | ) | 50,236 | 40,310 | ||||||
Other expense (income), net: |
||||||||||
Interest expense, net |
128,489 | 109,414 | 108,779 | |||||||
Loss on extinguishment of debt |
35,512 | — | — | |||||||
Sundry expense, net |
2,295 | 712 | 3,247 | |||||||
Other income, net |
(1,297 | ) | — | — | ||||||
| | | | | | | | | | | |
Net loss before income taxes |
(264,531 | ) | (59,890 | ) | (71,716 | ) | ||||
Income tax benefit |
60,246 | 11,787 | 26,812 | |||||||
| | | | | | | | | | | |
Net loss |
$ | (204,285 | ) | $ | (48,103 | ) | $ | (44,904 | ) | |
| | | | | | | | | | | |
| | | | | | | | | | | |
| | | | | | | | | | | |
Dividend equivalent on Series A Preferred Stock related to beneficial conversion feature |
(16,375 | ) | — | — | ||||||
Cumulative dividends for Series A Preferred Stock |
(2,489 | ) | — | — | ||||||
| | | | | | | | | | | |
Net loss attributable to common stockholders |
$ | (223,149 | ) | $ | (48,103 | ) | $ | (44,904 | ) | |
| | | | | | | | | | | |
| | | | | | | | | | | |
| | | | | | | | | | | |
Loss per share: |
||||||||||
Basic and diluted |
$ | (2.08 | ) | $ | (0.75 | ) | $ | (0.70 | ) | |
The accompanying notes are an integral part of these consolidated financial statements.
61
Exela Technologies, Inc. and Subsidiaries
Consolidated Statements of Comprehensive Loss
For the years ended December 31, 2017, 2016 and 2015
(in thousands of United States dollars)
| |
Years ended December 31, | |||||||||
|---|---|---|---|---|---|---|---|---|---|---|
| |
2017 | 2016 | 2015 | |||||||
Net Loss |
$ | (204,285 | ) | $ | (48,103 | ) | $ | (44,904 | ) | |
Other comprehensive income (loss), net of tax |
||||||||||
Foreign currency translation adjustments |
3,353 | (132 | ) | (1,990 | ) | |||||
Unrealized pension actuarial gains (losses), net of tax |
1,285 | (7,263 | ) | 3,655 | ||||||
| | | | | | | | | | | |
Total other comprehensive loss, net of tax |
$ | (199,647 | ) | $ | (55,498 | ) | $ | (43,239 | ) | |
| | | | | | | | | | | |
| | | | | | | | | | | |
| | | | | | | | | | | |
The accompanying notes are an integral part of these consolidated financial statements.
62
Exela Technologies, Inc. and Subsidiaries
Consolidated Statements of Stockholders' Deficit
December 31, 2017, 2016 and 2015
(in thousands of United States dollars except share and per share amounts)
| |
|
|
|
|
|
|
|
|
Accumulated Other Comprehensive Loss |
|
|
||||||||||||||||||||||||||
|---|---|---|---|---|---|---|---|---|---|---|---|---|---|---|---|---|---|---|---|---|---|---|---|---|---|---|---|---|---|---|---|---|---|---|---|---|---|
| |
|
|
|
|
|
|
|
|
|
Unrealized Pension Actuarial Losses, net of tax |
|
|
|||||||||||||||||||||||||
| |
Common Stock | Preferred Stock | Treasury Stock | |
|
Foreign Currency Translation Adjustment |
|
|
|||||||||||||||||||||||||||||
| |
Additional Paid in Capital |
Equity-Based Compensation |
Accumulated Deficit |
Total Stockholders' Deficit |
|||||||||||||||||||||||||||||||||
| |
Shares | Amount | Shares | Amount | Shares | Amount | |||||||||||||||||||||||||||||||
Balances at January 1, 2015 (as previously reported) |
144,400 | $ | — | — | $ | — | — | $ | — | $ | (57,389 | ) | $ | 12,134 | $ | (1,425 | ) | $ | (8,731 | ) | $ | (200,961 | ) | $ | (256,372 | ) | |||||||||||
Conversion of shares |
63,880,157 | 6 | — | — | — | — | (6 | ) | — | — | — | — | — | ||||||||||||||||||||||||
| | | | | | | | | | | | | | | | | | | | | | | | | | | | | | | | | | | | | | |
Balances at January 1, 2015, effect of reverse acquisition (refer to Note 2) |
64,024,557 | $ | 6 | — | $ | — | — | $ | — | $ | (57,395 | ) | $ | 12,134 | $ | (1,425 | ) | $ | (8,731 | ) | $ | (200,961 | ) | $ | (256,372 | ) | |||||||||||
| | | | | | | | | | | | | | | | | | | | | | | | | | | | | | | | | | | | | | |
Net loss January 1 to December 31, 2015 |
— | — | — | — | — | — | — | — | — | — | (44,904 | ) | (44,904 | ) | |||||||||||||||||||||||
Equity-based compensation |
— | — | — | — | — | — | — | 8,122 | — | — | — | 8,122 | |||||||||||||||||||||||||
Foreign currency translation adjustment |
— | — | — | — | — | — | — | — | (1,990 | ) | — | — | (1,990 | ) | |||||||||||||||||||||||
Net realized pension actuarial gains, net of tax |
— | — | — | — | — | — | — | — | — | 3,655 | — | 3,655 | |||||||||||||||||||||||||
| | | | | | | | | | | | | | | | | | | | | | | | | | | | | | | | | | | | | | |
Balances at December 31, 2015 |
64,024,557 | $ | 6 | — | — | — | — | $ | (57,395 | ) | $ | 20,256 | $ | (3,415 | ) | $ | (5,076 | ) | $ | (245,865 | ) | $ | (291,489 | ) | |||||||||||||
| | | | | | | | | | | | | | | | | | | | | | | | | | | | | | | | | | | | | | |
| | | | | | | | | | | | | | | | | | | | | | | | | | | | | | | | | | | | | | |
| | | | | | | | | | | | | | | | | | | | | | | | | | | | | | | | | | | | | | |
The accompanying notes are an integral part of these consolidated financial statements.
63
Exela Technologies, Inc. and Subsidiaries
Consolidated Statements of Stockholders' Deficit (Continued)
December 31, 2017, 2016 and 2015
(in thousands of United States dollars except share and per share amounts)
| |
|
|
|
|
|
|
Accumulated Other Comprehensive Loss | ||||||||||||||||||||||||||||||
|---|---|---|---|---|---|---|---|---|---|---|---|---|---|---|---|---|---|---|---|---|---|---|---|---|---|---|---|---|---|---|---|---|---|---|---|---|---|
| |
|
|
|
|
|
|
|
|
|
Unrealized Pension Actuarial Losses, net of tax |
|
|
|||||||||||||||||||||||||
| |
Common Stock | Preferred Stock | Treasury Stock | |
|
Foreign Currency Translation Adjustment |
|
|
|||||||||||||||||||||||||||||
| |
Additional Paid in Capital |
Equity-Based Compensation |
Accumulated Deficit |
Total Stockholders' Deficit |
|||||||||||||||||||||||||||||||||
| |
Shares | Amount | Shares | Amount | Shares | Amount | |||||||||||||||||||||||||||||||
Balances at January 1, 2016 |
64,024,557 | $ | 6 | — | — | — | — | $ | (57,395 | ) | $ | 20,256 | $ | (3,415 | ) | $ | (5,076 | ) | $ | (245,865 | ) | $ | (291,489 | ) | |||||||||||||
Net loss January 1 to December 31, 2016 |
— | — | — | — | — | — | — | — | — | — | (48,103 | ) | (48,103 | ) | |||||||||||||||||||||||
Equity-based compensation |
— | — | — | — | — | — | — | 7,086 | — | — | 7,086 | ||||||||||||||||||||||||||
Foreign currency translation adjustment |
— | — | — | — | — | — | — | — | (132 | ) | — | — | (132 | ) | |||||||||||||||||||||||
Net realized pension actuarial gains, net of tax |
— | — | — | — | — | — | — | — | — | (7,263 | ) | — | (7,263 | ) | |||||||||||||||||||||||
| | | | | | | | | | | | | | | | | | | | | | | | | | | | | | | | | | | | | | |
Balances at December 31, 2016 |
64,024,557 | $ | 6 | — | — | — | — | $ | (57,395 | ) | $ | 27,342 | $ | (3,547 | ) | $ | (12,339 | ) | $ | (293,968 | ) | $ | (339,901 | ) | |||||||||||||
| | | | | | | | | | | | | | | | | | | | | | | | | | | | | | | | | | | | | | |
| | | | | | | | | | | | | | | | | | | | | | | | | | | | | | | | | | | | | | |
| | | | | | | | | | | | | | | | | | | | | | | | | | | | | | | | | | | | | | |
The accompanying notes are an integral part of these consolidated financial statements.
64
Exela Technologies, Inc. and Subsidiaries
Consolidated Statements of Stockholders' Deficit (Continued)
December 31, 2017, 2016 and 2015
(in thousands of United States dollars except share and per share amounts)
| |
|
|
|
|
|
|
Accumulated Other Comprehensive Loss | ||||||||||||||||||||||||||||||
|---|---|---|---|---|---|---|---|---|---|---|---|---|---|---|---|---|---|---|---|---|---|---|---|---|---|---|---|---|---|---|---|---|---|---|---|---|---|
| |
|
|
|
|
|
|
|
|
|
Unrealized Pension Actuarial Losses, net of tax |
|
|
|||||||||||||||||||||||||
| |
Common Stock | Preferred Stock | Treasury Stock | |
|
Foreign Currency Translation Adjustment |
|
|
|||||||||||||||||||||||||||||
| |
Additional Paid in Capital |
Equity-Based Compensation |
Accumulated Deficit |
Total Stockholders' Deficit |
|||||||||||||||||||||||||||||||||
| |
Shares | Amount | Shares | Amount | Shares | Amount | |||||||||||||||||||||||||||||||
Balances at January 1, 2017 |
64,024,557 | $ | 6 | — | $ | — | — | $ | — | $ | (57,395 | ) | $ | 27,342 | $ | (3,547 | ) | $ | (12,339 | ) | $ | (293,968 | ) | $ | (339,901 | ) | |||||||||||
Net loss January 1 to December 31, 2017 |
(204,285 | ) | (204,285 | ) | |||||||||||||||||||||||||||||||||
Equity-based compensation |
6,743 | 6,743 | |||||||||||||||||||||||||||||||||||
Foreign currency translation adjustment |
3,353 | 3,353 | |||||||||||||||||||||||||||||||||||
Net realized pension actuarial gains, net of tax |
1,285 | 1,285 | |||||||||||||||||||||||||||||||||||
Merger recapitalization |
16,575,443 | 2 | 20,546 | 20,548 | |||||||||||||||||||||||||||||||||
Shares issued to acquire Novitex (refer to Note 3) |
30,600,000 | 3 | 244,797 | 244,800 | |||||||||||||||||||||||||||||||||
Issuance\Conversion of Quinpario shares |
12,093,331 | 1 | 22,358 | 22,359 | |||||||||||||||||||||||||||||||||
Sale of common shares at July 12, 2017 |
18,757,942 | 3 | 130,860 | 130,863 | |||||||||||||||||||||||||||||||||
Issuance of Series A Preferred Stock |
— | — | 9,194,233 | 1 | 73,553 | 73,554 | |||||||||||||||||||||||||||||||
Shares issued for advisory services and underwriting fees |
3,609,375 | — | 28,573 | 28,573 | |||||||||||||||||||||||||||||||||
Conversion of Series A Preferred Stock to common shares |
3,667,803 | — | (3,000,000 | ) | — | — | — | ||||||||||||||||||||||||||||||
Shares issued for HandsOn Global Management contract termination fee |
1,250,000 | 10,000 | 10,000 | ||||||||||||||||||||||||||||||||||
Equity issuance expenses |
(7,649 | ) | (7,649 | ) | |||||||||||||||||||||||||||||||||
Adjustment for beneficial conversion feature of Series A Preferred Stock (refer to Note 2) |
16,375 | (16,375 | ) | — | |||||||||||||||||||||||||||||||||
Treasury stock purchases |
(49,300 | ) | 49,300 | (249 | ) | (249 | ) | ||||||||||||||||||||||||||||||
| | | | | | | | | | | | | | | | | | | | | | | | | | | | | | | | | | | | | | |
Balances at December 31, 2017 |
150,529,151 | $ | 15 | 6,194,233 | $ | 1 | 49,300 | $ | (249 | ) | $ | 482,018 | $ | 34,085 | $ | (194 | ) | $ | (11,054 | ) | $ | (514,628 | ) | $ | (10,006 | ) | |||||||||||
| | | | | | | | | | | | | | | | | | | | | | | | | | | | | | | | | | | | | | |
| | | | | | | | | | | | | | | | | | | | | | | | | | | | | | | | | | | | | | |
| | | | | | | | | | | | | | | | | | | | | | | | | | | | | | | | | | | | | | |
The accompanying notes are an integral part of these consolidated financial statements.
65
Exela Technologies, Inc. and Subsidiaries
Consolidated Statements of Cash Flows
For the years ended December 31, 2017, 2016 and 2015
(in thousands of United States dollars unless otherwise stated)
| |
Years ended December 31, | |||||||||
|---|---|---|---|---|---|---|---|---|---|---|
| |
2017 | 2016 | 2015 | |||||||
Cash flows from operating activities |
||||||||||
Net loss |
$ | (204,285 | ) | $ | (48,103 | ) | $ | (44,904 | ) | |
Adjustments to reconcile net loss |
||||||||||
Depreciation and amortization |
98,890 | 79,639 | 75,408 | |||||||
Fees paid in stock |
23,875 | — | — | |||||||
HGM contract termination fee paid in stock |
10,000 | — | — | |||||||
Original issue discount and debt issuance cost amortization |
12,280 | 13,684 | 12,974 | |||||||
Loss on extinguishment of debt |
35,512 | — | — | |||||||
Impairment of goodwill and other intangible assets |
69,437 | — | — | |||||||
Provision (recovery) for doubtful accounts |
500 | 756 | 1,105 | |||||||
Deferred income tax benefit |
(66,723 | ) | (15,729 | ) | (27,177 | ) | ||||
Share-based compensation expense |
6,743 | 7,086 | 8,122 | |||||||
Foreign currency remeasurement |
1,382 | 193 | 150 | |||||||
Gain on sale of Meridian |
(588 | ) | — | — | ||||||
Loss on sale of property, plant and equipment |
987 | 2,245 | 632 | |||||||
Fair value adjustment of swap derivative |
(1,297 | ) | — | — | ||||||
Change in operating assets and liabilities, net of effect from acquisitions |
||||||||||
Accounts receivable |
(4,832 | ) | 20,801 | 11,583 | ||||||
Prepaid expenses and other assets |
2,628 | 4,969 | 892 | |||||||
Accounts payable and accrued liabilities |
52,953 | 5,544 | (28,644 | ) | ||||||
Related party payables |
4,907 | (2,427 | ) | (2,703 | ) | |||||
| | | | | | | | | | | |
Net cash provided by operating activities |
42,369 | 68,658 | 7,438 | |||||||
| | | | | | | | | | | |
Cash flows from investing activities |
||||||||||
Purchase of property, plant and equipment |
(14,440 | ) | (7,926 | ) | (10,669 | ) | ||||
Additions to internally developed software |
(7,843 | ) | (13,017 | ) | (3,279 | ) | ||||
Additions to outsourcing contract costs |
(10,992 | ) | (14,636 | ) | (7,882 | ) | ||||
Cash paid for TransCentra |
— | — | (12,810 | ) | ||||||
Cash acquired in TransCentra acquisition |
— | 3,351 | — | |||||||
Proceeds from sale of Meridian |
4,582 | — | — | |||||||
Cash acquired in Quinpario reverse merger |
91 | — | — | |||||||
Cash paid in Novitex acquisition, net of cash received |
(423,428 | ) | — | — | ||||||
Other acquisitions, net of cash received |
(369 | ) | — | — | ||||||
Proceeds from sale of property, plant and equipment |
25 | 626 | 208 | |||||||
| | | | | | | | | | | |
Net cash used in investing activities |
(452,374 | ) | (31,602 | ) | (34,432 | ) | ||||
| | | | | | | | | | | |
Cash flows from financing activities |
||||||||||
Change in bank overdraft |
(210 | ) | (1,331 | ) | 938 | |||||
Proceeds from issuance of stock |
204,417 | — | — | |||||||
Cash received from Quinpario |
27,031 | — | — | |||||||
Repurchase of Common Stock |
(249 | ) | — | — | ||||||
Proceeds from financing obligation |
3,116 | 5,429 | 5,554 | |||||||
Contribution from Shareholders |
20,548 | — | — | |||||||
Proceeds from new credit facility |
1,320,500 | — | — | |||||||
Retirement of previous credit facilities |
(1,055,736 | ) | — | — | ||||||
Cash paid for debt issuance costs |
(39,837 | ) | — | — | ||||||
Cash paid for equity issue costs |
(149 | ) | — | — | ||||||
Borrowings from revolver and swing-line loan |
72,600 | 53,700 | 157,400 | |||||||
Repayments from revolver and swing line loan |
(72,500 | ) | (53,200 | ) | (108,800 | ) | ||||
Principal payments on long-term obligations |
(39,316 | ) | (47,853 | ) | (33,474 | ) | ||||
| | | | | | | | | | | |
Net cash provided by (used in) financing activities |
440,215 | (43,255 | ) | 21,618 | ||||||
| | | | | | | | | | | |
Effect of exchange rates on cash |
429 | (2,059 | ) | (672 | ) | |||||
| | | | | | | | | | | |
Net increase (decrease) in cash and cash equivalents |
30,639 | (8,258 | ) | (6,048 | ) | |||||
Cash and cash equivalents |
||||||||||
Beginning of period |
8,361 | 16,619 | 22,667 | |||||||
| | | | | | | | | | | |
End of period |
$ | 39,000 | $ | 8,361 | $ | 16,619 | ||||
| | | | | | | | | | | |
| | | | | | | | | | | |
| | | | | | | | | | | |
Supplemental cash flow data: |
||||||||||
Income tax payments, net of refunds received |
$ | 5,711 | $ | 3,771 | $ | 1,784 | ||||
Interest paid |
69,622 | 96,166 | 87,302 | |||||||
Noncash investing and financing activities: |
||||||||||
Assets acquired through capital lease arrangements |
6,973 | 11,925 | 6,021 | |||||||
Leasehold improvements funded by lessor |
146 | 5,186 | 665 | |||||||
Issuance of common stock as consideration for Novitex |
244,800 | — | — | |||||||
Accrued capital expenditures |
1,621 | 580 | 878 | |||||||
Dividend equivalent on Series A Preferred Stock |
16,375 | — | — | |||||||
Liability assumed of Quinpario |
4,672 | — | — | |||||||
The accompanying notes are an integral part of these consolidated financial statements.
66
1. Description of the Business
Organization
Exela Technologies, Inc. (the "Company" or "Exela") is a global provider of transaction processing solutions, enterprise information management, document management and digital business process services. The Company provides mission-critical information and transaction processing solutions services to customers across three major industry segments: (1) Information & Transaction Processing, (2) Healthcare Solutions, and (3) Legal and Loss Prevention Services. The Company manages information and document driven business processes and offers solutions and services to fulfill specialized knowledge-based processing and consulting requirements, enabling customers to concentrate on their core competencies. Through its outsourcing solutions, the Company enables businesses to streamline their internal and external communications and workflows.
The Company was originally incorporated in Delaware on July 15, 2014 as a special purpose acquisition company under the name Quinpario Acquisition Corp 2 ("Quinpario") for the purpose of effecting a merger, capital stock exchange, asset acquisition, stock purchase, reorganization or similar business combination involving Quinpario and one or more businesses or entities. On July 12, 2017 (the "Closing"), the Company consummated its business combination with SourceHOV Holdings, Inc. ("SourceHOV") and Novitex Holdings, Inc. ("Novitex") pursuant to the Business Combination Agreement and Consent, Waiver and Amendment to the Business Combination Agreement, dated February 21, 2017 and June 15, 2017, respectively (the "Business Combination"). In connection with the Closing, the Company changed its name from Quinpario Acquisition Corp 2 to Exela Technologies, Inc. Unless the context otherwise requires, the "Company" refers to the combined company and its subsidiaries following the Business Combination, "Quinpario" refers to the Company prior to the closing of the Business Combination, "SourceHOV" refers to SourceHOV prior to the Business Combination and "Novitex" refers to Novitex prior to the Business Combination. Refer to Note 3 for further discussion of the Business Combination.
2. Basis of Presentation and Summary of Significant Accounting Policies
The following is a summary of the significant accounting policies consistently applied in the preparation of the accompanying consolidated financial statements.
Basis of Presentation
The accompanying consolidated financial statements and related notes to the consolidated financial statements have been prepared in accordance with generally accepted accounting principles in the United States ("U.S. GAAP") and in accordance with the rules and regulations of the Securities and Exchange Commission ("SEC"). The consolidated financial statements reflect all normal and recurring adjustments that are, in the opinion of the Company's management, necessary for the fair presentation of the results of operations for the periods.
The Business Combination has been accounted for as a reverse merger in accordance with U.S. GAAP. For accounting purposes, SourceHOV was deemed to be the accounting acquirer, Quinpario was the legal acquirer, and Novitex is considered the acquired company. In conjunction with the Business Combination, outstanding shares of SourceHOV were converted into Common Stock of the Company, par value $0.0001 per share, shown as a recapitalization, and the net assets of Quinpario were acquired at historical cost, with no goodwill or other intangible assets recorded. The consolidated assets and liabilities as of December 31, 2016, and results of operations for the years ended December 31, 2016 and 2015 are those of SourceHOV. Quinpario's assets and liabilities, which include net cash from the trust of $27.0 million and accrued fees payable of $4.8 million, and results of operations are consolidated with SourceHOV beginning on the Closing. The shares and corresponding capital amounts and earnings per share available to holders of the Company's Common Stock, prior to
67
the Business Combination, have been retroactively restated as shares reflecting the exchange ratio established in the Business Combination. The presented financial information for the year ended December 31, 2017 includes the financial information and activities for SourceHOV for the period January 1, 2017 to December 31, 2017 (365 days) as well as the financial information and activities of Novitex for the period July 13, 2017 to December 31, 2017 (172 days).
Principles of Consolidation
The accompanying consolidated financial statements and related notes to the consolidated financial statements include the accounts of the Company and its wholly-owned subsidiaries. All significant intercompany balances and transactions have been eliminated in consolidation. In addition, the Company evaluates its relationships with other entities to identify whether they are variable interest entities as defined by the Financial Accounting Standards Board ("FASB") Accounting Standards Codification ("ASC") 810-10, Consolidation and whether the Company is the primary beneficiary. Consolidation is required if both of these criteria are met.
Use of Estimates
The preparation of consolidated financial statements in conformity with U.S. GAAP requires management to make estimates and assumptions that affect the reported amounts of assets and liabilities and disclosure of contingent assets and liabilities at the date of the financial statements and the reported amounts of revenues and expenses during the reporting period.
Estimates and judgments relied upon in preparing these consolidated financial statements include revenue recognition for multiple element arrangements, allowance for doubtful accounts, income taxes, depreciation, amortization, employee benefits, equity-based compensation, contingencies, goodwill, intangible assets, fair value of assets and liabilities acquired in acquisitions, and asset and liability valuations. The Company regularly assesses these estimates and records changes in estimates in the period in which they become known. The Company bases its estimates on historical experience and various other assumptions that the Company believes to be reasonable under the circumstances. Actual results could differ from those estimates.
Segment Reporting
The Company consists of the following three segments:
1. Information & Transaction Processing Solutions ("ITPS"). ITPS provides industry-specific solutions for banking and financial services, including lending solutions for mortgages and auto loans, and banking solutions for clearing, anti-money laundering, sanctions, and interbank cross-border settlement; property and casualty insurance solutions for origination, enrollments, claims processing, and benefits administration communications; public sector solutions for income tax processing, benefits administration, and record management; industry-agnostic solutions for payment processing and reconciliation, integrated receivables and payables management, document logistics and location services, records management and electronic storage of data, documents; and software, hardware, professional services and maintenance related to information and transaction processing automation, among others.
2. Healthcare Solutions ("HS"). HS offerings include revenue cycle solutions, integrated accounts payable and accounts receivable, and information management for both the healthcare payer and provider markets. Payer service offerings include claims processing, claims adjudication and auditing services, enrollment processing and policy management, and scheduling and prescription management. Provider service offerings include medical coding and insurance claim generation, underpayment audit and recovery, and medical records management.
68
3. Legal and Loss Prevention Services ("LLPS"). LLPS solutions include processing of legal claims for class action and mass action settlement administrations, involving project management support, notification and outreach to claimants, collection, analysis and distribution of settlement funds. Additionally, LLPS provides data and analytical services in the context of litigation consulting, economic and statistical analysis, expert witness services, and revenue recovery services for delinquent accounts receivable.
Cash and Cash Equivalents
Cash and cash equivalents include cash deposited with financial institutions and liquid investments with original maturity dates equal to or less than three months. All bank deposits and money market accounts are considered cash and cash equivalents. The Company holds cash and cash equivalents at major financial institutions, which often exceed Federal Deposit Insurance Corporation insured limits. Historically, the Company has not experienced any losses due to such bank depository concentration.
Certificates of deposit and fixed deposits whose original maturity is greater than three months and is one year or less are classified as short-term investments and certificates of deposit and fixed deposits whose maturity is greater than one year at the balance sheet date are classified as non-current assets in the consolidated balance sheets. The purchase of any certificates of deposit or fixed deposits that are classified as short-term investments or non-current assets appear in the investing section of the consolidated statements of cash flows.
Restricted Cash
As part of the Company's legal claims processing service, the Company holds cash for various settlement funds once the fund is in the wind down stage and claims have been paid. The cash is used to pay tax obligations and other liabilities of the settlement funds. The Company has recorded an offsetting liability for the settlement funds received, which is included in Obligation for claim payment in the consolidated balance sheets of $42.5 million and $25.9 million at December 31, 2017 and December 31, 2016, respectively. Of the total amount of settlement funds received, $22.9 million and $17.1 million were not subject to legal restrictions on use as of December 31, 2017 and December 31, 2016, respectively.
Accounts Receivable and Allowance for Doubtful Accounts
Accounts receivable are carried at the original invoice amount less an estimate made for doubtful accounts. Revenue that has been earned but remains unbilled at the end of the period is recorded as a component of accounts receivable, net. The Company specifically analyzes accounts receivable and historical bad debts, customer credit-worthiness, current economic trends, and changes in customer payment terms and collection trends when evaluating the adequacy of its allowance for doubtful accounts. The Company writes off accounts receivable balances against the allowance for doubtful accounts, net of any amounts recorded in deferred revenue, when it becomes probable that the receivable will not be collected.
Inventories
Inventories are valued using the lower of cost and net realizable value method and include the cost of raw materials, labor, and purchased subassemblies. Cost is determined using the weighted average method. Net Inventory as of December 31, 2017 and 2016 were $11.9 million and $11.2 million, respectively.
69
Property, Plant and Equipment
Property, plant, and equipment are recorded at cost less accumulated depreciation. Depreciation is computed using the straight-line method (which approximates the use of the assets) over the estimated useful lives of the assets. When these assets are sold or otherwise disposed of, the asset and related depreciation is relieved, and any gain or loss is included in the consolidated statements of operations for the period of sale or disposal. Leasehold improvements are amortized over the lease term or the useful life of the asset, whichever is shorter. Assets under capital leases are amortized over the lease term unless ownership is transferred by the end of the lease or there is a bargain purchase option, in which case assets are amortized normally on a straight-line basis over the useful life that would be assigned if the assets were owned. The amortization of these capital lease assets is recorded in depreciation expense in the consolidated statements of operations. Repair and maintenance costs are expensed as incurred.
Intangible Assets
Customer Relationships
Customer relationship intangible assets represent customer contracts and relationships obtained as part of acquired businesses. Customer relationship values are estimated by evaluating various factors including historical attrition rates, contractual provisions and customer growth rates, among others. The estimated average useful lives of customer relationships range from 4 to 16 years depending on facts and circumstances. These intangible assets are primarily amortized based on undiscounted cash flows. The Company evaluates the remaining useful life of intangible assets on an annual basis to determine whether events and circumstances warrant a revision to the remaining useful life.
Trade Names
The Company has determined that its trade name intangible assets are indefinite-lived assets and therefore are not subject to amortization. The Company performed a quantitative analysis as part of the annual impairment test on October 1, 2017, and recorded an impairment charge. Subsequently, late in the fourth quarter of 2017, the Company implemented a strategy to transition to a unified Exela brand beginning in 2018. As a result, the Company performed a quantitative analysis as of December 31, 2017, and recorded another impairment charge. The Company's valuation of trade names at the reporting unit level utilizes the Relief-from-Royalty method that represents the present value of the future economic benefits generated by ownership of the trade names and approximates the amount that the Company would have to pay as a royalty to a third party to license such names.
Trademarks
The Company has determined that its trademark intangible assets resulting from acquisitions are definite-lived assets and therefore are subject to amortization. The Company has historically amortized trademarks on a straight-line basis over the estimated useful life, which is typically 10 years. As part of the impairment analysis completed as of December 31, 2017, and due to the Company's strategy to transition to a unified Exela brand beginning in 2018, the Company reduced the estimated useful lives of its trademarks and will amortize the trademarks over a one year period.
Developed Technology
The Company has various developed technologies embedded in its technology platform. Developed technology is an integral asset to the Company in providing solutions to customers and is recorded as an intangible asset. The Company amortizes developed technology on a straight-line basis over the estimated useful life, which is typically 5-8.5 years.
70
Capitalized Software Costs
The Company capitalizes certain costs incurred to develop software products to be sold, leased or otherwise marketed after establishing technological feasibility in accordance with ASC section 985-20, Software—Costs of Software to Be Sold, Leased, or Marketed, and the Company capitalizes costs to develop or purchase internal-use software in accordance with ASC section 350-40, Intangibles—Goodwill and Other—Internal-Use Software. Significant estimates and assumptions include determining the appropriate period over which to amortize the capitalized costs based on estimated useful lives and estimating the marketability of the commercial software products and related future revenues. The Company amortizes capitalized software costs on a straight-line basis over the estimated useful term, which is typically 1-5 years.
Outsourced Contract Costs
Costs of outsourcing contracts, including costs incurred for bid and proposal activities, are generally expensed as incurred. However, certain costs incurred upon initiation of an outsourcing contract are deferred and expensed on a straight-line basis over the estimated contract term. These costs represent incremental external costs or certain specific internal costs that are directly related to the contract acquisition or transition activities and can be separated into two principal categories: contract commissions and transition/set-up costs. Examples of such capitalized costs include hourly labor and related fringe benefits and travel costs.
Non-compete Agreements
The Company acquired certain non-compete agreements in connection with the Business Combination. These were related to four Novitex executives that were terminated following the acquisition. The Company has determined that the agreements have a definite useful life of one year.
Impairment of Indefinite-Lived Assets
The Company conducts its annual indefinite-lived assets impairment tests on October 1st of each year for its indefinite-lived trade names, or more frequently if indicators of impairment exist. When performing the impairment test, the Company has the option of performing a qualitative or quantitative assessment to determine if an impairment has occurred. A quantitative assessment requires comparison of fair value of the asset to its carrying value. The Company utilizes the Income Approach, specifically the Relief-from-Royalty method, which has the basic tenet that a user of that intangible asset would have to make a stream of payments to the owner of the asset in return for the rights to use that asset. Refer to Note 7—Intangibles Assets and Goodwill for additional discussion of impairment of trade names.
Impairment of Long-Lived Assets
The Company reviews the recoverability of its long-lived assets, including finite-lived trade names, trademarks, customer relationships, developed technology, capitalized software costs, outsourced contract costs and property, plant and equipment, when events or changes in circumstances occur that indicate that the carrying value of the asset may not be recoverable. The assessment of possible impairment is based on the ability to recover the carrying value of the asset from the expected future pre-tax cash flows (undiscounted and without interest charges) of the related operations. If these cash flows are less than the carrying value of such asset, an impairment loss is recognized for the difference between estimated fair value and carrying value. The primary measure of fair value is based on discounted cash flows based in part on the financial results and the expectation of future performance.
The Company did not record any material impairment related to its property, plant, and equipment, customer relationships, trademarks, developed technology, capitalized software, or outsourced contract costs for the years ended December 31, 2017, 2016, and 2015.
71
Goodwill
Goodwill represents the excess purchase price over tangible and intangible assets acquired less liabilities assumed arising from business combinations. Goodwill is generally allocated to reporting units based upon relative fair value (taking into consideration other factors such as synergies) when an acquired business is integrated into multiple reporting units. The Company's reporting units are at the operating segment level, which discrete financial information is prepared and regularly reviewed by management. When a business within a reporting unit is disposed of, goodwill is allocated to the disposed business using the relative fair value method.
The Company conducts its annual goodwill impairment tests on October 1st of each year, or more frequently if indicators of impairment exist. When performing the annual impairment test, the Company has the option of performing a qualitative or quantitative assessment to determine if an impairment has occurred. If a qualitative assessment indicates that it is more likely than not that the fair value of a reporting unit is less than its carrying amount, the Company would be required to perform a quantitative impairment analysis for goodwill. The quantitative analysis requires a comparison of fair value of the reporting unit to its carrying value, including goodwill. If the carrying value of the reporting unit exceeds its fair value, an impairment loss is recognized in an amount equal to that excess, limited to the total amount of goodwill allocated to that reporting unit. The Company uses a combination of the Guideline Public Company Method of the Market Approach and the Discounted Cash Flow Method of the Income Approach to determine the reporting unit fair value. Refer to Note 7—Intangibles Assets and Goodwill for additional discussion of impairment of goodwill.
Derivative Instruments and Hedging Activities
As required by ASC 815—Derivatives and Hedging, the Company records all derivatives on the balance sheet at fair value. The accounting for changes in the fair value of derivatives depends on the intended use of the derivative, whether the Company has elected to designate a derivative in a hedging relationship and apply hedge accounting and whether the hedging relationship has satisfied the criteria necessary to apply hedge accounting. Hedge accounting generally provides for the matching of the timing of gain or loss recognition on the hedging instrument with the recognition of the changes in the fair value of the hedged asset or liability that are attributable to the hedged risk in a fair value hedge or the earnings effect of the hedged forecasted transactions in a cash flow hedge. The Company may enter into derivative contracts that are intended to economically hedge certain of its risk, even though hedge accounting does not apply or the Company elects not to apply hedge accounting.
The Company's objective in using interest rate derivatives is to manage its exposure to variable interest rates related to its term loan under the Credit Agreement. In order to accomplish this objective, in November 2017, the Company entered into a three year, one-month LIBOR interest rate contract with a notional amount of $347.8 million. The contract will mitigate the variable interest rate risk related to the LIBOR with a fixed interest rate paid semi-annually starting January 12, 2018.
The following table summarizes the Company's interest rate swap positions as of December 31, 2017:
| |
|
December 31, 2017 | |||||||
|---|---|---|---|---|---|---|---|---|---|
| Effective date |
Maturity date |
(In Millions) Notional Amount |
Weighted Average Interest Rate |
||||||
| 1/12/2018 | 1/12/2021 | $ | 347.8 | 1.9725 | % | ||||
The interest rate swap, which is used to manage the Company's exposure to interest rate movements and other identified risks, was not designated as a hedge. As such, the change in the fair value of the derivative is recorded directly in earnings and was $1.3 million for the year ended December 31, 2017.
72
Benefit Plan Accruals
The Company has defined benefit plans in the U.K and Germany, under which participants earn a retirement benefit based upon a formula set forth in the plan. The Company records expense related to this plan using actuarially determined amounts that are calculated under the provisions of ASC 715, Compensation—Retirement Benefits. Key assumptions used in the actuarial valuations include the discount rate, the expected rate of return on plan assets and the rate of increase in future compensation levels. Refer to Note 11—Employee Benefit Plans.
Leases
Leases are classified as capital leases whenever the terms of the lease transfer substantially all of the risks and rewards of ownership to the lessee. All other leases are classified as operating leases. Assets held under a capital lease are initially recognized as assets of the Company at their fair value at the inception of the lease, or if lower, at the present value of the minimum lease payments. The corresponding liability to the lessor is included in the other long-term obligations in the consolidated balance sheets. Operating lease payments are initially recognized as an expense on a straight-line basis over the lease term, except where another systematic basis is more representative of the time pattern in which the economic benefits from the leased asset are consumed.
Stock-Based Compensation
The Company accounts for stock based compensation in accordance with ASC 718, Compensation- Stock Compensation. ASC 718 requires generally that all equity awards be accounted for at their "fair value." This fair value is measured at the fair value of value of the awards at the grant date and recognized as compensation expense on a straight-line basis over the vesting period. The fair value of the awards on the grant date is determined using the Enterprise Value model. The expense resulting from share-based payments is recorded in general and administrative expense in the accompanying consolidated statements of operations. Refer to Note 14—Stock-Based Compensation.
Revenue Recognition
The majority of the Company's revenues are comprised of: (1) ITPS, (2) HS offerings, (3) LLPS solutions, and (4) some combination thereof. Revenue is realized or realizable and earned when persuasive evidence of an arrangement exists, delivery has occurred, the sales price is fixed or determinable and collectability is probable. Delivery does not occur until services have been provided to the customer, risk of loss has transferred to the customer, and either customer acceptance has been obtained, customer acceptance provisions have lapsed, or the Company has objective evidence that the criteria specified in the customer acceptance provisions have been satisfied. The sales price is not considered to be fixed or determinable until all contingencies related to the sale have been resolved.
ITPS revenues are primarily generated under service arrangements from a transaction-based pricing model for the various types of volumes processed, licensing and maintenance fees for technology sales, and a mix of fixed management fee and transactional revenue for document logistics and location services. HS revenues are primarily generated under service arrangements from a transaction-based pricing model for the various types of volumes processed for healthcare payers and providers. LLPS revenues are primarily based on a time and materials pricing as well as through transactional services priced on a per item basis.
If a contract involves the provision of a single element, revenue is generally recognized when the product or service is provided and the amount earned is not contingent upon any future event. Revenue from time and materials arrangements is recognized as the services are performed.
73
Sales commissions determined to be incremental direct costs incurred related to the successful acquisition of new customer revenues are deferred and amortized over the length of the initial contract period.
The Company records deferred revenue when it receives payments or invoices in advance of the delivery of products or the performance of services. The deferred revenue is recognized into earnings when underlying performance obligations are achieved.
The Company includes reimbursements from customers, such as postage costs, in revenue, while the related costs are included in cost of revenue in the consolidated statement of operations.
Multiple Element Arrangements
Certain of the Company's revenue is generated from multiple element arrangements involving various combinations. The deliverables within these arrangements are evaluated at contract inception to determine whether they represent separate units of accounting, and if so, contract consideration is allocated to each deliverable based on relative selling price. The relative selling price of each deliverable within these arrangements is determined using vendor specific objective evidence ("VSOE") of fair value, third-party evidence or best estimate of selling price. Revenue is then recognized in accordance with the appropriate revenue recognition guidance applicable to the respective elements.
If the multiple element arrangements criteria are not met, the arrangement is accounted for as one unit of accounting which would result in revenue being recognized on a straight-line basis over the period of delivery or being deferred until the earlier of when such criteria are met or when the last element is delivered.
Research and Development
Research and development costs are expensed as incurred. Research and development costs expensed for the years ended December 31, 2017, 2016, and 2015 were $2.3 million, $2.3 million, and $1.7 million, respectively.
Advertising
Advertising costs are expensed as incurred. Advertising expense for the years ended December 31, 2017, 2016, and 2015, were $0.7 million, $1.1 million, and $0.8 million, respectively.
Income Taxes
The Company accounts for income taxes by using the asset and liability method. The Company accounts for income taxes regarding uncertain tax positions and recognized interest and penalties related to uncertain tax positions in income tax benefit/ (expense) in the consolidated statements of operations.
Deferred income taxes are recognized on the tax consequences of temporary differences by applying enacted statutory tax rates applicable in future years to differences between the financial statement carrying amounts and the tax bases of existing assets and liabilities, as determined under tax laws and rates. A valuation allowance is provided when it is more likely than not that all or some portion of the deferred tax assets will not be realized. Due to numerous ownership changes, the Company is subject to limitations on existing net operating losses under Section 382 of the Internal Revenue Code (the Code). Accordingly, valuation allowances have been established against a portion of the net operating losses to reflect estimated Section 382 limitations. The Company also considered the realizability of net operating losses not limited by Section 382. The Company did not consider future book income as a source of taxable income when assessing if a portion of the deferred tax assets are more likely than not to be realized. However, scheduling the reversal of existing deferred tax liabilities
74
indicated that only a portion of the deferred tax assets are likely to be realized. Therefore, partial valuation allowances were established against a portion of the Company's deferred tax assets. In the event the Company determines that it would be able to realize deferred tax assets that have valuation allowances established, an adjustment to the deferred tax assets would be recognized as component of income tax expense through continuing operations.
The Company engages in transactions (i.e. acquisitions) in which the tax consequences may be subject to uncertainty and examination by the varying taxing authorities. Significant judgment is required by the Company in assessing and estimating the tax consequences of these transactions. While the Company's tax returns are prepared and based on the Company's interpretation of tax laws and regulations, in the normal course of business the tax returns are subject to examination by the various taxing authorities. Such examinations may result in future assessments of additional tax, interest and penalties. For purposes of the Company's income tax provision, a tax benefit is not recognized if the tax position is not more likely than not to be sustained based solely on its technical merits. Considerable judgment is involved in determining which tax positions are more likely than not to be sustained. Refer to Note 10—Income Taxes for further information.
Loss Contingencies
The Company reviews the status of each significant matter, if any, and assess its potential financial exposure considering all available information including, but not limited to, the impact of negotiations, settlements, rulings, advice of legal counsel and other updated information and events pertaining to a particular matter. If the potential loss from any claim or legal proceeding is considered probable and the amount can be reasonably estimated, the Company accrues a liability for the estimated loss. Significant judgment is required in both the determination of probability and the determination as to whether an exposure is reasonably estimable. Because of uncertainties related to loss contingencies, accruals are based only on the best information available at the time. As additional information becomes available, the Company reassesses the potential liability related to its pending claims and litigation, and may revise its estimates. These revisions in the estimates of the potential liabilities could have a material impact on the results of operations and financial position. The Company's liabilities exclude any estimates for legal costs not yet incurred associated with handling these matters.
Operations
A portion of the Company's labor and operations is situated outside of the United States in India and other locations. The carrying value of long-lived assets that are situated outside of the United States is approximately $26.2 million and $26.3 million as of December 31, 2017 and 2016, respectively.
Foreign Currency Translation
The functional currency for the Company's production operations located in India, Philippines, China, and Mexico is the United States dollar. Included in other expense as "Sundry expense (income), net" in the consolidated statements of operations are net exchange losses of $2.3 million, $0.7 million, and $3.2 million for the years ended December 31, 2017, 2016, and 2015, respectively.
The Company has determined all other international subsidiaries' functional currency is the local currency. These assets and liabilities are translated at exchange rates in effect at the balance sheet date while income and expense amounts are translated at average exchange rates during the period. The resulting foreign currency translation adjustments are disclosed as a separate component of other comprehensive loss.
75
Beneficial Conversion Feature
The Company's Series A Perpetual Convertible Preferred Stock, par value $0.0001 per share (the "Series A Preferred Stock") contains a beneficial conversion feature, which arises when a debt or equity security is issued with an embedded conversion option that is beneficial to the investor or in the money at inception because the conversion option has an effective strike price that is less than the market price of the underlying stock at the commitment date. The Company recognized the beneficial conversion feature by allocating the intrinsic value of the conversion option, which is the number of shares of Common Stock available upon conversion multiplied by the difference between the effective conversion price per share and the fair value of Common Stock per share on the commitment date, to additional paid-in capital, resulting in a discount on the Series A Preferred Stock. As a result of the occurrence of events meeting the definition of a "Fundamental Change" as defined in the Certificate of Designations, Preferences, Rights and Limitations of Series A Perpetual Convertible Preferred Stock of the Company during the period, the Company recognized the entire dividend equivalent of $16.4 million as of December 31, 2017.
Net Loss per Share
Earnings per share ("EPS") is computed by dividing net loss available to holders of the Company's Common Stock by the weighted average number of shares of Common Stock outstanding during the period, excluding the effects of any potentially dilutive securities. Diluted EPS gives effect to the potential dilution that could occur if securities or other contracts to issue Common Stock were exercised or converted into Common Stock, using the more dilutive of the two-class method or if-converted method in periods of earnings. The two class method is an earnings allocation method that determines earnings per share for Common Stock and participating securities. As the Company experienced net losses for the periods presented, the impact of participating Series A Preferred Stock was calculated based on the if-converted method. Diluted EPS excludes all dilutive potential of shares of Common Stock if their effect is anti-dilutive.
For the year ended December 31, 2017, shares of the Company's Series A Convertible Preferred Stock ("Series A Preferred Stock"), if converted would have resulted in an additional 7,573,066 shares of Common Stock outstanding, but were not included in the computation of diluted loss per share as their effects were anti-dilutive.
The Company has not included the effect of 35,000,000 warrants sold in the Quinpario Initial Public Offering ("IPO") in the calculation of net income (loss) per share. Warrants are considered anti-dilutive and excluded when the exercise price exceeds the average market value of the Company's Common Stock price during the applicable period.
The components of basic and diluted EPS are as follows:
| |
Year Ended December 31, | |||||||||
|---|---|---|---|---|---|---|---|---|---|---|
| |
2017 | 2016 | 2015 | |||||||
Net loss attributable to common stockholders (A) |
$ | (223,149 | ) | $ | (48,103 | ) | $ | (44,904 | ) | |
Weighted average common shares outstanding—basic and diluted (B) |
107,068,262 | 64,024,557 | 64,024,557 | |||||||
| | | | | | | | | | | |
Loss Per Share: |
||||||||||
Basic and diluted (A/B) |
$ | (2.08 | ) | $ | (0.75 | ) | $ | (0.70 | ) | |
76
Business Combinations
The Company includes the results of operations of the businesses acquired as of the respective dates of acquisition. The Company allocates the fair value of the purchase price of acquisitions to the assets acquired and liabilities assumed based on their estimated fair values. The excess of the fair value of the purchase price over the fair values of these identifiable assets and liabilities is recorded as goodwill.
Fair Value Measurements
The Company records the fair value of assets and liabilities in accordance with ASC 820, Fair Value Measurement ("ASC 820"). ASC 820 defines fair value as the price received to sell an asset or paid to transfer a liability in an orderly transaction between market participants at the measurement date and in the principal or most advantageous market for that asset or liability. The fair value should be calculated based on assumptions that market participants would use in pricing the asset or liability, not on assumptions specific to the entity.
In addition to defining fair value, ASC 820 expands the disclosure requirements around fair value and establishes a fair value hierarchy for valuation inputs. The hierarchy prioritizes the inputs into three levels based on the extent to which inputs used in measuring fair value are observable in the market. Each fair value measurement is reported in one of the three levels, which is determined by the lowest level input that is significant to the fair value measurement in its entirety. These levels are:
Level 1—quoted prices (unadjusted) in active markets for identical assets or liabilities.
Level 2—quoted prices for similar assets and liabilities in active markets or inputs that are observable for the asset or liability, either directly or indirectly through market corroboration, for substantially the full term of the financial instrument.
Level 3—unobservable inputs reflecting Management's own assumptions about the inputs used in pricing the asset or liability at fair value.
Refer to Note 13—Fair Value Measurement for further discussion.
Recently Adopted Accounting Pronouncements
Effective January 1, 2017, the Company adopted Accounting Standards Update ("ASU") no. 2015-11, Inventory (Topic 330): Simplifying the Measurement of Inventory. This amendment replaced the method of measuring inventories at lower of cost or market with a lower of cost and net realizable value method. The adoption had no material impact on the Company's financial position, results of operations and cash flows.
Effective January 1, 2017, the Company adopted ASU no. 2016-09, Compensation—Stock Compensation (Topic 718): Improvements to Employee Share-Based Payment Accounting (ASU 2016-09). The ASU changes how companies account for certain aspects of equity-based payment awards to employees, including the accounting for income taxes, forfeitures, and statutory tax withholding requirements, as well as classification in the statement of cash flows. The standard requires that all tax effects related to share-based payments be recorded as income tax expense or benefit in the income statement at settlement or expiration and, accordingly, excess tax benefits and tax deficiencies be presented as operating activities in the statement of cash flows. Upon adoption of this standard, the Company elected to continue its current practice of estimating expected forfeitures. The adoption had no material impact on the Company's financial position, results of operations and cash flows.
In January 2017, the FASB issued ASU no. 2017-04, Intangibles Goodwill and Other (Topic 350): Simplifying the Test for Goodwill Impairment, which eliminates Step 2 of the goodwill impairment test that had required a hypothetical purchase price allocation. Rather, entities should apply the same
77
impairment assessment to all reporting units and recognize an impairment loss for the amount by which a reporting unit's carrying amount exceeds its fair value, without exceeding the total amount of goodwill allocated to that reporting unit. Entities will continue to have the option to perform a qualitative assessment for a reporting unit to determine if the quantitative impairment test is necessary. The Company early adopted ASU 2017-04 as of October 1, 2017. The Company conducted its annual impairment test for 2017 and recorded an impairment loss for goodwill under the provisions of ASU 2017-04.
Recently Issued Accounting Pronouncements
In May 2014, the FASB issued ASU no. 2014-09, Revenue from Contracts with Customers (ASC 606). Under the update, revenue will be recognized based on a five-step model. The core principle of the model is that revenue will be recognized when the transfer of promised goods or services to customers is made in an amount that reflects the consideration to which the entity expects to be entitled in exchange for those goods or services. Subsequent updates have been issued primarily to provide implementation guidance related to the initial guidance issued in May 2014. The guidance is effective for annual reporting periods beginning after December 15, 2017 and may be adopted using either (a) a full retrospective method, whereby comparative periods would be restated to present the impact of the new standard, with the cumulative effect of applying the standard recognized as of the earliest period presented, or (b) a modified retrospective method, under which comparative periods would not be restated and the cumulative effect of applying the standard would be recognized at the date of initial adoption, January 1, 2018. The Company is adopting this standard in the first quarter of fiscal 2018 and will use the modified retrospective approach. The Company is evaluating the impact of the new revenue recognition standard and has assigned internal resources and engaged a third party service provider to assist in its evaluation. As part of its preliminary evaluation, the Company is assessing the impact of capitalizing and amortizing incremental costs associated with obtaining and fulfilling customer contracts, specifically set-up costs and commission and incentive payments. Under the updated guidance, the Company anticipates that these payments will be deferred on the Company's consolidated balance sheets and amortized over the estimated useful life which can include anticipated renewals of the original contract. Currently, these payments are deferred and amortized over the contract term. The Company also currently believes ASC 606 will impact the Company's accounting for arrangements that include variable consideration and multiple performance obligations. While the Company continues to assess the potential impacts of the new standard, including the areas described above, it does not know or cannot reasonably estimate quantitative information related to the impact of the new standard on its consolidated financial statements and related notes.
In February 2016, the FASB issued ASU no. 2016-02, Leases (842) This ASU increases transparency and comparability among organizations by recognizing lease assets and lease liabilities on the balance sheet and disclosing key information about leasing arrangements. Since the issuance of the original standard, the FASB has issued a subsequent update that provides a practical expedient for land easements (ASU 2018-01). The amendments in this ASU are effective for fiscal years beginning after December 15, 2018 and interim periods within those fiscal years and early application is permitted. The Company is currently evaluating the impact that adopting this standard will have on the consolidated financial statements.
In June 2016, the FASB issued ASU no. 2016-13, Financial Instruments—Credit Losses (Topic 326): Measurement of Credit Losses on Financial Instruments, to replace the incurred loss impairment methodology under current U.S. GAAP with a methodology that reflects expected credit losses and requires consideration of a broader range of reasonable and supportable information to inform credit loss estimates. The Company will be required to use a forward-looking expected credit loss model for accounts receivables, loans, and other financial instruments. Credit losses relating to available-for-sale debt securities will also be recorded through an allowance for credit losses rather than as a reduction in
78
the amortized cost basis of the securities. The standard will be effective for fiscal years beginning after December 15, 2019, and interim periods within those fiscal years. Adoption of the standard will be applied using a modified retrospective approach through a cumulative-effect adjustment to retained earnings as of the effective date. The Company is currently in the early stages of evaluating the impact that adopting this standard will have on the consolidated financial statements.
In August 2016, the FASB issued ASU no. 2016-15, Statement of Cash Flows: Classification of Certain Cash Receipts and Cash Payments (Topic 230), which adds or clarifies guidance on the presentation and classification of eight specific types of cash receipts and cash payments in the statement of cash flows such as debt prepayment or extinguishment costs, settlement of contingent consideration arising from a business combination, insurance settlement proceeds, and distributions from certain equity method investees, with the intent of reducing diversity in practice. For public entities, ASU 2016-15 is effective for fiscal years, including interim periods within those fiscal years, beginning after December 15, 2017 and interim periods within those fiscal years. Entities must apply the guidance retrospectively to all periods presented unless retrospective application is impracticable. The Company is adopting this standard in the first quarter of fiscal 2018 and is currently evaluating the impact that adopting this standard will have on the consolidated financial statements.
In October 2016, the FASB issued ASU no. 2016-16, Income Taxes: Intra-Entity Transfers of Assets Other Than Inventory (Topic 740), which eliminates the current prohibition on immediate recognition of the current and deferred income tax effects of intra-entity transfers of assets other than inventory, with the intent of reducing complexity and diversity in practice. Under ASU 2016-16, entities must recognize the income tax consequences when the transfer occurs rather than deferring recognition. For public entities, ASU 2016-16 is effective for fiscal years beginning after December 15, 2017 including interim reporting periods within those annual periods. Entities must apply the guidance on a modified retrospective basis though a cumulative effect adjustment to retained earnings as of the beginning of the period of adoption. The Company is adopting this standard in the first quarter of fiscal 2018 and is currently evaluating the impact that adopting this standard will have on the consolidated financial statements.
In November 2016, the FASB issued ASU no. 2016-18, Statement of Cash Flows: Restricted Cash (Topic 230). The ASU addresses diversity in practice that exists in the classification and presentation of changes in restricted cash and requires that a statement of cash flows explain the change during the period in the total of cash, cash equivalents, and amounts generally described as restricted cash or restricted cash equivalents. The ASU is effective beginning after December 15, 2017, and interim periods within those fiscal years. The Company is adopting this standard in the first quarter of fiscal 2018 and is currently evaluating the impact that adopting this standard will have on the consolidated financial statements.
In January 2017, the FASB issued ASU no. 2017-01, Business Combinations: Clarifying the Definition of a Business (Topic 805). The ASU clarifies the definition of a business and provides guidance on evaluating as to whether transactions should be accounted for as acquisitions (or disposals) of assets or business combinations. The definition clarification as outlined in this ASU affects many areas of accounting including acquisitions, disposals, goodwill, and consolidation. The amendments of the ASU are effective for annual periods beginning after December 15, 2017, and interim periods within those annual periods. The Company is adopting this standard in the first quarter of fiscal 2018 and would apply this standard for business combinations consummated subsequent to January 1, 2018.
In March 2017, the FASB issued ASU no. 2017-07, Compensation Retirement Benefits (Topic 715); Improving the Presentation of Net Periodic Pension Cost and Net Periodic Postretirement Benefit Cost. The amendments to this ASU require the service cost component of net periodic benefit cost be reported in the same income statement line or lines as other compensation costs for employees. The other components of net periodic benefit cost are required to be reported separately from service costs and
79
outside a subtotal of income from operations. Only the service cost component is eligible for capitalization. The guidance is effective for annual periods beginning after December 15, 2017, and interim periods within those annual periods. The amendments should be applied retrospectively for the income statement presentations and prospectively for the capitalization of service costs. The Company is adopting this standard in the first quarter of fiscal 2018 and is currently evaluating the impact that adopting this standard will have on the consolidated financial statements.
In May 2017, the FASB issued ASU no. 2017-09, Compensation—Stock Compensation (Topic 718): Scope of Modification Accounting. The amendments in ASU 2017-09 provide guidance about which changes to the terms or conditions of a share-based payment award require an entity to apply modification accounting in Topic 718. ASU 2017-09 is effective for annual periods beginning after December 15, 2017, and interim periods within those annual periods. The amendments in this update will be applied on a prospective basis to an award modified on or after the adoption date. The Company is adopting this standard in the first quarter of fiscal 2018.
In July 2017, the FASB issued ASU 2017-11, Earnings Per Share (Topic 260), Distinguishing Liabilities from Equity (Topic 480) and Derivatives and Hedging (Topic 815): I. Accounting for Certain Financial Instruments with Down Round Features; II. Replacement of the Indefinite Deferral for Mandatorily Redeemable Financial Instruments of Certain Nonpublic Entities and Certain Mandatorily Redeemable Noncontrolling Interests with a Scope Exception. Part I of this update addresses the complexity of accounting for certain financial instruments with down round features. Down round features are features of certain equity-linked instruments (or embedded features) that result in the strike price being reduced on the basis of the pricing of future equity offerings. Current accounting guidance creates cost and complexity for entities that issue financial instruments (such as warrants and convertible instruments) with down round features that require fair value measurement of the entire instrument or conversion option. Part II of this update addresses the difficulty of navigating Topic 480, Distinguishing Liabilities from Equity, because of the existence of extensive pending content in the FASB Accounting Standards Codification. This pending content is the result of the indefinite deferral of accounting requirements about mandatorily redeemable financial instruments of certain nonpublic entities and certain mandatorily redeemable noncontrolling interests. The amendments in Part II of this update do not have an accounting effect. This ASU is effective for fiscal years, and interim periods within those years, beginning after December 15, 2018. The Company is currently in the early stages of evaluating the impact that adopting this standard will have on the consolidated financial statements.
In August 2017, the FASB issued ASU No. 2017-12, Derivatives and Hedging (Topic 815); Targeted Improvements to Accounting for Hedging Activities. The amendments in this ASU better align the risk management activities and financial reporting for these hedging relationships through changes to both the designation and measurement guidance for qualifying hedging relationships and presentation of hedge results. The guidance is effective for fiscal years beginning after December 15, 2018, and interim periods within those fiscal years. The company is currently in the early stages of evaluating the impact that adopting this standard will have on the consolidated financial statements.
Concentration of Credit Risk
Financial instruments that potentially subject the Company to concentration of credit risk consist primarily of cash and cash equivalents and trade receivables. The Company maintains its cash and cash equivalents and certain other financial instruments with highly rated financial institutions and limits the amount of credit exposure with any one financial institution. From time to time, the Company assesses the credit worthiness of its customers. Credit risk on trade receivables is minimized because of the large number of entities comprising the Company's customer base and their dispersion across many industries and geographic areas. The Company generally has not experienced any material losses related to receivables from any individual customer or groups of customers. The Company does not require collateral. Due to these factors, no additional credit risk beyond amounts provided for
80
collection losses is believed by management to be probable in the Company's accounts receivable, net. The Company does not have any significant customers that account for 10% or more of the total consolidated revenues.
3. Business Combinations
On July 12, 2017, the Company consummated its business combination with SourceHOV and Novitex pursuant to the Business Combination Agreement and Consent, Waiver and Amendment to the Business Combination Agreement, dated February 21, 2017 and June 15, 2017, respectively. In connection with the Business Combination, the Company acquired debt facilities and issued notes totaling $1.4 billion (refer to Note 9—Long Term Debt and Credit Facilities). Proceeds from the acquired debt were used to refinance the existing debt of SourceHOV, settle the outstanding debt of Novitex, and pay fees and expenses incurred in connection with the Business Combination. Immediately following the Business Combination, there were 146,910,648 shares of Common Stock, 9,194,233 shares of Series A Preferred Stock, and 35,000,000 warrants outstanding. Refer to Note 15—Stockholders' Equity.
Under ASC 805, Business Combinations, SourceHOV was deemed the accounting acquirer based on the following predominate factors: its former owners have the largest portion of voting rights in the Company, the board and Management has more individuals coming from SourceHOV than either Quinpario or Novitex, SourceHOV was the largest entity by revenue and by assets, and the headquarters was moved to the SourceHOV headquarters location.
The Company acquired 100% of the equity of Novitex pursuant to the Business Combination Agreement by issuing 30,600,000 shares of Common Stock of Exela to Novitex Parent, L.P., the sole stockholder of Novitex. Total value of equity for the transaction was $244.8 million. Additionally, as noted, the Company used proceeds from acquired debt to settle the outstanding debt of Novitex in the amount of $420.5 million, and pay transaction related costs and interest on behalf of Novitex in the amount of $10.3 million and $1.0 million, respectively, which was accounted for as part of consideration.
The acquired assets and assumed liabilities of Novitex were recorded at their estimated fair values. The purchase price allocation for the Novitex business combination is preliminary and subject to change within the respective measurement period which will not extend beyond one year from the acquisition date. Measurement period adjustments will be recognized in the reporting period in which the adjustment amounts are determined.
The following table summarizes the consideration paid for Novitex and the fair value of the assets acquired and liabilities assumed at the acquisition date on July 12, 2017. Certain estimated values for the acquisition, including goodwill, intangible assets, property, plant and equipment, and deferred income taxes, are not yet finalized and are subject to revision as additional information becomes available and more detailed analyses are completed. The purchase price was allocated based on information available at acquisition date. During the fourth quarter of 2017, the Company recorded
81
measurement period adjustments which increased goodwill by $0.9 million, primarily related to updated information related to income taxes.
Assets acquired: |
||||
Cash and equivalents |
$ | 8,428 | ||
Accounts receivable |
87,474 | |||
Inventory |
1,245 | |||
Prepaid expenses & other |
13,974 | |||
Property, plant and equipment, net |
60,657 | |||
Identifiable intangible assets, net |
251,060 | |||
Deferred charges and other assets |
2,723 | |||
Other noncurrent assets |
93 | |||
Goodwill |
406,060 | |||
| | | | | |
Total identifiable assets acquired |
$ | 831,714 | ||
| | | | | |
Liabilities assumed: |
||||
Accounts payable |
(29,444 | ) | ||
Short-term borrowings and current portion of long-term debt |
(11,335 | ) | ||
Accrued liabilities |
(30,432 | ) | ||
Advanced billings and customer deposits |
(18,926 | ) | ||
Long term debt |
(15,704 | ) | ||
Deferred taxes |
(46,991 | ) | ||
Other liabilities |
(2,226 | ) | ||
| | | | | |
Total liabilities assumed |
$ | (155,058 | ) | |
| | | | | |
Total consideration |
$ | 676,656 | ||
| | | | | |
The identifiable intangible assets include customer relationships, non-compete agreements, internally developed software, and a trademark. Customer relationships and non-compete agreements were valued using the Income Approach, specifically the Multi-Period Excess Earnings method. The trademark was valued using the Income Approach, specifically the Relief-from-Royalty method. Internally developed software was valued based on costs incurred related to Connect Platform. All of these intangibles acquired represent a Level 3 measurement as they are based on unobservable inputs reflecting the Company's management's own assumptions about the inputs used in pricing the asset or liability at fair value.
| |
Weighted Average Useful Life (in years) |
Fair value | |||||
|---|---|---|---|---|---|---|---|
Trademark—Novitex |
9.5 | $ | 18,000 | ||||
Customer relationships |
16.0 | 230,000 | |||||
Internally developed software—Connect Platform |
5.0 | 1,710 | |||||
Non-compete agreements |
1.0 | 1,350 | |||||
| | | | | | | | |
|
$ | 251,060 | |||||
| | | | | | | | |
| | | | | | | | |
| | | | | | | | |
As of the date of the Business Combination, the weighted-average useful life of total identifiable intangible assets acquired in the Business Combination, excluding goodwill, is 15.4 years.
The Company expects to realize revenue synergies, leverage, brand awareness, stronger margins, greater free cash flow generation, and expand the existing Novitex sales channels, and utilize the existing workforce. The Company also anticipates opportunities for growth through the ability to leverage additional future solutions and capabilities. These factors, among others, contributed to a
82
purchase price in excess of the estimated fair value of Novitex's identifiable net assets assumed, and as a result, the Company has recorded goodwill in connection with this acquisition. The Company engaged a third party valuation firm to aid management in its analyses of the fair value of the assets and liabilities. All estimates, key assumptions, and forecasts were either provided by or reviewed by the Company. Approximately $14.0 million of the goodwill recorded was tax deductible, which was carried over from the tax basis of the seller. Since the acquisition date of July 12, 2017, $292.1 million of revenue and $17.5 million of net loss are included in consolidated revenues and net loss, respectively, for Novitex. These results are included in the ITPS segment.
Transaction Costs
The Company incurred approximately $60.0 million in advisory, legal, accounting and management fees in conjunction with the Business Combination as of December 31, 2017, excluding contract cancellation and advising fees to HGM of $23.0 million described in Note 16. Additionally, $7.6 million was incurred related to equity issuance costs and $40.9 million was incurred in debt issuance costs.
Restructuring Charges
In February 2017, management performed a strategic review of human resources at Novitex for the purpose of assessing the business need for their employment and for the purpose of quantifying the synergies resulting from the acquisition. As a result, in July 2017, the Company communicated the termination of certain executives and non-executive Novitex employees.
The Company determined that costs associated with termination benefits should be accounted for separately from the acquisition, as a post-combination expense of the combined entity because the expense was incurred for the benefit of the combined entity. As of July 12, 2017, the Company recorded severance expense in the amount of $4.6 million related to the impacted executives and $0.1 million related to other terminations in the statement of operations.
The Company does not expect to incur additional charges for these terminations in future periods. Severance charges associated with the terminations were included in Selling, general, and administrative expenses on the consolidated statement of operations and were included in the ITPS segment.
Pro-Forma Information
Following are the supplemental consolidated results of the Company on an unaudited pro forma basis, as if the acquisition had been consummated on January 1, 2016:
| |
December 31, | ||||||
|---|---|---|---|---|---|---|---|
| |
2017 | 2016 | |||||
Net Revenue |
$ | 1,456,225 | $ | 1,333,089 | |||
Net Loss |
$ | (121,172 | ) | $ | (121,232 | ) | |
These pro forma results were based on estimates and assumptions, which the Company believes are reasonable. They are not the results that would have been realized had the Company been a combined company during the periods presented and are not necessarily indicative of consolidated results of operations in future periods. The pro forma results include adjustments primarily related to purchase accounting adjustments. Acquisition costs and other non-recurring charges incurred are included in the earliest period presented.
Additionally, the pro forma results are inclusive of the acquisition of TransCentra by SourceHOV in 2016 for the year ended December 31, 2016. These pro forma results were based on estimates and assumptions, which the Company believes are reasonable. They are not the results that would have been realized had the Company been a combined company during the periods presented and are not necessarily indicative of the Company's consolidated results of operations in future periods.
83
4. Accounts Receivable
Accounts receivable, net consist of the following:
| |
December 31, | ||||||
|---|---|---|---|---|---|---|---|
| |
2017 | 2016 | |||||
Billed receivables |
$ | 199,201 | $ | 116,148 | |||
Unbilled receivables |
28,449 | 20,982 | |||||
Other |
5,779 | 4,510 | |||||
Less: Allowance for doubtful accounts |
(3,725 | ) | (3,219 | ) | |||
| | | | | | | | |
|
$ | 229,704 | $ | 138,421 | |||
| | | | | | | | |
| | | | | | | | |
| | | | | | | | |
Unbilled receivables represent balances recognized as revenue that have not been billed to the customer. The Company's allowance for doubtful accounts is based on a policy developed by historical experience and management judgment. Adjustments to the allowance for doubtful accounts may occur based on market conditions or specific customer circumstances.
5. Prepaid Expenses and Other Current Assets
Prepaid expenses and other current assets consist of the following:
| |
December 31, | ||||||
|---|---|---|---|---|---|---|---|
| |
2017 | 2016 | |||||
Prepaids |
$ | 22,869 | $ | 10,906 | |||
Deposits |
1,727 | 1,296 | |||||
| | | | | | | | |
|
$ | 24,596 | $ | 12,202 | |||
| | | | | | | | |
| | | | | | | | |
| | | | | | | | |
6. Property, Plant and Equipment, Net
Property, plant, and equipment, which include assets recorded under capital leases, are stated at cost less accumulated depreciation and amortization, and consist of the following:
| |
|
December 31, | |||||||
|---|---|---|---|---|---|---|---|---|---|
| |
Estimated Useful Lives (in Years) |
||||||||
| |
2017 | 2016 | |||||||
Land |
N/A | $ | 7,744 | $ | 7,637 | ||||
Buildings and improvements |
7 - 40 | 18,726 | 16,989 | ||||||
Leasehold improvements |
3 - 12 | 51,257 | 31,342 | ||||||
Vehicles |
5 - 7 | 870 | 784 | ||||||
Machinery and equipment |
5 - 15 | 62,249 | 23,297 | ||||||
Computer equipment and software |
3 - 8 | 116,580 | 98,544 | ||||||
Furniture and fixtures |
5 - 15 | 7,136 | 5,007 | ||||||
| | | | | | | | | | |
|
264,562 | 183,600 | |||||||
Less: Accumulated depreciation and amortization |
(131,654 | ) | (102,000 | ) | |||||
| | | | | | | | | | |
Property, plant and equipment, net |
$ | 132,908 | $ | 81,600 | |||||
| | | | | | | | | | |
| | | | | | | | | | |
| | | | | | | | | | |
Depreciation expense related to property, plant and equipment was $31.7 million, $22.8 million, and $27.4 million for the years ended December 31, 2017, 2016, and 2015, respectively.
84
7. Intangibles Assets and Goodwill
Intangibles
Intangible assets are stated at cost or acquisition-date fair value less accumulated amortization and consists of the following:
| |
December 31, 2017 | |||||||||
|---|---|---|---|---|---|---|---|---|---|---|
| |
Gross Carrying Amount(a) |
Accumulated Amortization |
Intangible Asset, net |
|||||||
Customer relationships |
$ | 504,643 | $ | (135,962 | ) | $ | 368,681 | |||
Developed technology |
89,076 | (77,103 | ) | 11,973 | ||||||
Trade names(b) |
13,100 | — | 13,100 | |||||||
Outsource contract costs |
40,456 | (17,526 | ) | 22,930 | ||||||
Internally developed software |
28,254 | (2,597 | ) | 25,657 | ||||||
Trademarks |
23,370 | (1,446 | ) | 21,924 | ||||||
Non compete agreements |
1,350 | (631 | ) | 719 | ||||||
| | | | | | | | | | | |
|
$ | 700,249 | $ | (235,265 | ) | $ | 464,984 | |||
| | | | | | | | | | | |
| | | | | | | | | | | |
| | | | | | | | | | | |
| |
December 31, 2016 | |||||||||
|---|---|---|---|---|---|---|---|---|---|---|
| |
Gross Carrying Amount |
Accumulated Amortization |
Intangible Asset, net |
|||||||
Customer relationships |
$ | 274,643 | $ | (100,172 | ) | $ | 174,471 | |||
Developed technology |
89,076 | (59,539 | ) | 29,537 | ||||||
Trade names |
53,370 | — | 53,370 | |||||||
Outsource contract costs |
27,619 | (7,378 | ) | 20,241 | ||||||
Internally developed software |
16,742 | (858 | ) | 15,884 | ||||||
Trademarks |
5,370 | (134 | ) | 5,236 | ||||||
| | | | | | | | | | | |
|
$ | 466,820 | $ | (168,081 | ) | $ | 298,739 | |||
| | | | | | | | | | | |
| | | | | | | | | | | |
| | | | | | | | | | | |
- (a)
- Amounts
include intangibles acquired in the Business Combination. See Note 3—Business
Combinations.
- (b)
- The carrying amount of trade names for 2017 is net of accumulated impairment losses of $39.3 million. The carrying amount of trade names includes $10.0 million of indefinite-lived trade names that are not amortizable.
In connection with the completion of the annual impairment test as of October 1, 2017, the Company recorded an impairment charge to trade names of $6.3 million. Additionally, later in the fourth quarter of 2017, subsequent to the annual impairment test, the Company implemented a one year strategy to transition to a unified Exela brand beginning in 2018. As a result, the Company performed a quantitative analysis of its trade names as of December 31, 2017, and recorded an additional impairment charge of $33.0 million. As part of the impairment analysis completed on December 31, 2017, the Company reconsidered the estimated useful lives of certain trade names and trademarks, and reduced the estimated useful life to one year. The fair value of the trade names was determined using the Relief from Royalty Method of the Income Approach. The impairment charges resulted in decreases to the carrying values of the ITPS, HS, and LLPS trade names of $23.1 million, $9.6 million, and $6.6 million, respectively, and are included within Impairment of intangible assets in the consolidated statement of operations for the year ended December 31, 2017. The Company did not record any impairment related to its trade names for the year ended December 31, 2016.
85
Aggregate amortization expense related to intangibles was $67.2 million, $56.8 million, and $48.0 million for the years ended December 31, 2017, 2016, and 2015, respectively.
Estimated intangibles amortization expense for the next five years and thereafter consists of the following:
| |
Estimated Amortization Expense |
|||
|---|---|---|---|---|
2018 |
$ | 102,865 | ||
2019 |
59,953 | |||
2020 |
51,441 | |||
2021 |
43,616 | |||
2022 |
39,658 | |||
Thereafter |
157,451 | |||
| | | | | |
|
$ | 454,984 | ||
| | | | | |
Goodwill
Goodwill by reporting segment consists of the following:
| |
Goodwill | Additions | Reductions | Currency translation adjustments |
Goodwill(a) | |||||||||||
|---|---|---|---|---|---|---|---|---|---|---|---|---|---|---|---|---|
ITPS |
$ | 145,562 | $ | 13,558 | $ | — | $ | 274 | $ | 159,394 | ||||||
HS |
86,786 | — | — | — | 86,786 | |||||||||||
LLPS |
127,111 | — | — | — | 127,111 | |||||||||||
| | | | | | | | | | | | | | | | | |
Balance as of December 31, 2016 |
$ | 359,459 | $ | 13,558 | $ | — | $ | 274 | $ | 373,291 | ||||||
| | | | | | | | | | | | | | | | | |
| | | | | | | | | | | | | | | | | |
| | | | | | | | | | | | | | | | | |
ITPS |
$ | 159,394 | $ | 406,522 | (c) | $ | — | $ | 299 | $ | 566,215 | |||||
HS |
86,786 | — | — | — | 86,786 | |||||||||||
LLPS |
127,111 | — | (32,787) | (b) | — | 94,324 | ||||||||||
| | | | | | | | | | | | | | | | | |
Balance as of December 31, 2017 |
$ | 373,291 | $ | 406,522 | $ | (32,787 | ) | $ | 299 | $ | 747,325 | |||||
| | | | | | | | | | | | | | | | | |
| | | | | | | | | | | | | | | | | |
| | | | | | | | | | | | | | | | | |
- (a)
- The
carrying amount of goodwill for all periods presented is net of accumulated impairment losses of $137.9 million.
- (b)
- The
reduction in goodwill is due to $30.1 million for impairment recorded in the fourth quarter of 2017 and $2.7 million for the sale of Meridian
Consulting Group, LLC in the first quarter of 2017. Refer to Note 2—Basis of Presentation and Summary of Significant Accounting Policies for details of the impairment of goodwill.
- (c)
- Addition to goodwill is primarily the result of the Business Combination, which resulted in $406.1 million of goodwill. Refer to Note 3—Business Combinations.
The Company recorded $406.1 million of goodwill as a result of the allocation of the purchase price between assets acquired and liabilities assumed in the Business Combination. Of the total amount of goodwill recorded, $47.0 million of goodwill is associated with net deferred tax liabilities recorded in connection with amortizable intangible assets acquired in the Business Combination. As of the annual impairment testing date in 2017, due to a decline in revenues and operations for the LLPS reporting unit, the Company recorded an impairment charge of $30.1 million to the reporting unit's goodwill. No impairment charges were recorded for the year ended December 31, 2016.
86
8. Accrued Liabilities and Other Long-Term Liabilities
Accrued liabilities consist of the following:
| |
December 31, | ||||||
|---|---|---|---|---|---|---|---|
| |
2017 | 2016 | |||||
Accrued taxes (exclusive of income taxes) |
$ | 9,310 | $ | 3,309 | |||
Accrued lease exit obligations |
2,207 | 3,949 | |||||
Accrued professional and legal fees |
16,529 | 8,289 | |||||
Deferred rent |
1,204 | 989 | |||||
Accrued interest |
55,102 | 8,459 | |||||
Accrued transaction costs |
18,232 | 2,750 | |||||
Other accruals |
1,901 | 1,747 | |||||
| | | | | | | | |
|
$ | 104,485 | $ | 29,492 | |||
| | | | | | | | |
| | | | | | | | |
| | | | | | | | |
Other Long-term liabilities consist of the following:
| |
December 31, | ||||||
|---|---|---|---|---|---|---|---|
| |
2017 | 2016 | |||||
Deferred revenue |
$ | 424 | $ | 235 | |||
Deferred rent |
7,112 | 6,110 | |||||
Accrued lease exit obligations |
1,144 | 672 | |||||
Accrued compensation expense |
2,776 | 3,783 | |||||
Other |
3,248 | 1,173 | |||||
| | | | | | | | |
|
$ | 14,704 | $ | 11,973 | |||
| | | | | | | | |
| | | | | | | | |
| | | | | | | | |
9. Long-Term Debt and Credit Facilities
Senior Secured Notes
Upon the closing of the Business Combination on July 12, 2017, the Company issued $1.0 billion in aggregate principal amount of 10.0% First Priority Senior Secured Notes due 2023 (the "Notes"). The Notes are guaranteed by certain subsidiaries of the Company. The Notes bear interest at a rate of 10.0% per year. The Company pays interest on the Notes on January 15 and July 15 of each year, commencing on January 15, 2018. The Notes will mature on July 15, 2023.
Debt Refinancing
Upon the closing of the Business Combination on July 12, 2017, the $1,050.7 million outstanding balance of SourceHOV related debt facilities and the $420.5 million outstanding balance of Novitex related debt facilities were paid off using proceeds from the Credit Agreement and issuance of the Notes.
In accordance with ASC 470—Debt—Modifications and Extinguishments, as a result of certain lenders that participated in SourceHOV's debt structure prior to the refinancing and the Company's debt structure after the refinancing, it was determined that a portion of the refinancing of SourceHOV's first lien secured term loan and second lien secured term loan ("Original SourceHOV Term Loans") would be accounted for as a debt modification, and the remaining would be accounted for as an extinguishment. The Company incurred $28.9 million in debt issuance costs related to the new secured term loan, of which $2.8 million was third party costs. The Company recorded $7.0 million of original issue discount as part of the refinancing. The Company expensed $1.1 million of costs related to the modified debt and capitalized the remaining $27.8 million. The Company wrote off $30.5 million
87
of the unamortized issuance costs and discounts associated with the retirement of SourceHOV's credit facilities. The Company retained approximately $3.3 million and $3.5 million of debt issuance costs and debt discounts, respectively, associated with the modified portion of the Original SourceHOV Term Loans that will be amortized over the term of the new term loan, which are presented on the balance sheet as a contra-debt liability. The Company incurred a $5.0 million prepayment penalty related to the Original SourceHOV Term Loans that was recorded as a loss on extinguishment of debt.
The proceeds of the new debt financing were also used to pay fees and expenses incurred in connection with the Business Combination and for general corporate purposes.
Senior Credit Facilities
On July 12, 2017, the Company entered into a First Lien Credit Agreement with Royal Bank of Canada, Credit Suisse AG, Cayman Islands Branch, Natixis, New York Branch and KKR Corporate Lending LLC (the "Credit Agreement") providing Exela Intermediate LLC, a wholly owned subsidiary of the Company, upon the terms and subject to the conditions set forth in the Credit Agreement, (i) a $350.0 million senior secured term loan maturing July 12, 2023 with an original issue discount of $7.0 million, and (ii) a $100.0 million senior secured revolving facility maturing July 12, 2022, none of which is currently drawn. The Credit Agreement provides for the following interest rates for borrowings under the senior secured term facility and senior secured revolving facility: at the Company's option, either (1) an adjusted LIBOR, subject to a 1.0% floor in the case of term loans, or (2) a base rate, in each case plus an applicable margin. The initial applicable margin for the senior secured term facility is 7.5% with respect to LIBOR borrowings and 6.5% with respect to base rate borrowings. The initial applicable margin for the senior secured revolving facility is 7.0% with respect to LIBOR borrowings and 6.0% with respect to base rate borrowings. The applicable margin for borrowings under the senior secured revolving facility is subject to step-downs based on leverage ratios. The senior secured term loan is subject to amortization payments, commencing on the last day of the first full fiscal quarter of the Company following the closing date, of 0.6% of the aggregate principal amount for each of the first eight payments and 1.3% of the aggregate principal amount for payments thereafter, with any balance due at maturity. As of December 31, 2017 the interest rate applicable for the first lien senior secured term loan was 9.064%.
88
Long-Term Debt Outstanding
As of December 31, 2017 and 2016, the following long-term debt instruments were outstanding:
| |
December 31, | ||||||
|---|---|---|---|---|---|---|---|
| |
2017 | 2016 | |||||
First lien revolving credit facility(a) |
$ | — | $ | 63,337 | |||
First lien secured term loan(b) |
— | 687,884 | |||||
Second lien secured term loan(c) |
— | 236,344 | |||||
Transcentra revolving credit facility |
— | 5,000 | |||||
Transcentra term loan |
— | 19,250 | |||||
FTS unsecured term loan |
— | 15,911 | |||||
Other(d) |
17,534 | 11,609 | |||||
First lien credit agreement(e) |
308,825 | — | |||||
Senior secured notes(f) |
970,300 | — | |||||
Senior secured revolving credit facility(g) |
— | — | |||||
| | | | | | | | |
Total debt |
1,296,659 | 1,039,335 | |||||
Less: Current portion of long-term debt |
(20,565 | ) | (55,833 | ) | |||
| | | | | | | | |
Long-term debt, net of current maturities |
$ | 1,276,094 | $ | 983,502 | |||
| | | | | | | | |
| | | | | | | | |
| | | | | | | | |
- (a)
- Net
of unamortized debt issuance costs of $2.3 million as of December 31, 2016.
- (b)
- Net
of unamortized original issue discount and debt issuance costs of $14.6 million and $14.2 million as of December 31, 2016.
- (c)
- Net
of unamortized original issue discount and debt issuance costs of $7.3 million and $6.3 million as of December 31, 2016.
- (d)
- Other
debt represents outstanding loan balances associated with various hardware and software purchases along with loans entered into by subsidiaries of the Company.
- (e)
- Net
of unamortized original issue discount and debt issuance costs of $9.9 million and $29.1 million as of December 31, 2017.
- (f)
- Net
of unamortized debt discount and debt issuance costs of $21.2 million and $8.5 million as of December 31, 2017.
- (g)
- Debt issuance costs of $3.0 million were capitalized as an asset and will be amortized ratably over the term of the facility. Debt issuance costs are included in Other Non Current Assets on the balance sheet.
89
As of December 31, 2017, maturities of long-term debt are as follows:
| |
Maturity | |||
|---|---|---|---|---|
2018 |
$ | 20,565 | ||
2019 |
12,547 | |||
2020 |
19,190 | |||
2021 |
19,865 | |||
2022 |
17,555 | |||
Thereafter |
1,275,625 | |||
| | | | | |
Total long-term debt |
1,365,347 | |||
Less: Unamortized discount and debt issuance costs |
(68,688 | ) | ||
| | | | | |
|
$ | 1,296,659 | ||
| | | | | |
| | | | | |
| | | | | |
As of December 31, 2017 and 2016, the Company had outstanding irrevocable letters of credit totaling approximately $20.9 million and $9.3 million, respectively, under a revolving credit facility.
10. Income Taxes
The Company provides for income taxes using an asset and liability approach, under which deferred income taxes are provided based upon enacted tax laws and rates applicable to periods in which the taxes become payable.
For financial reporting purposes, income/ (loss) before income taxes includes the following components:
| |
Year Ended December 31, | |||||||||
|---|---|---|---|---|---|---|---|---|---|---|
| |
2017 | 2016 | 2015 | |||||||
United States |
$ | (279,822 | ) | $ | (71,171 | ) | $ | (79,054 | ) | |
Foreign |
15,291 | 11,281 | 7,338 | |||||||
| | | | | | | | | | | |
|
$ | (264,531 | ) | $ | (59,890 | ) | $ | (71,716 | ) | |
| | | | | | | | | | | |
| | | | | | | | | | | |
| | | | | | | | | | | |
The provision for federal, state, and foreign income taxes consists of the following:
| |
Year Ended December 31, | |||||||||
|---|---|---|---|---|---|---|---|---|---|---|
| |
2017 | 2016 | 2015 | |||||||
Federal |
||||||||||
Current |
$ | (722 | ) | $ | — | $ | (63 | ) | ||
Deferred |
(59,425 | ) | (8,961 | ) | (27,931 | ) | ||||
State |
||||||||||
Current |
1,405 | 830 | 1,203 | |||||||
Deferred |
(7,176 | ) | (2,740 | ) | (2,696 | ) | ||||
Foreign |
||||||||||
Current |
5,794 | 3,112 | (774 | ) | ||||||
Deferred |
(122 | ) | (4,028 | ) | 3,449 | |||||
| | | | | | | | | | | |
Income Tax Benefit |
$ | (60,246 | ) | $ | (11,787 | ) | $ | (26,812 | ) | |
| | | | | | | | | | | |
| | | | | | | | | | | |
| | | | | | | | | | | |
90
The differences between income taxes expected by applying the U.S. federal statutory tax rate of 35% and the amount of income taxes provided are as follows:
| |
Year Ended December 31, | |||||||||
|---|---|---|---|---|---|---|---|---|---|---|
| |
2017 | 2016 | 2015 | |||||||
Tax at statutory rate |
$ | (92,586 | ) | $ | (20,962 | ) | $ | (25,101 | ) | |
Add (deduct) |
||||||||||
State income taxes |
(4,219 | ) | 1,483 | 905 | ||||||
Foreign income taxes |
(565 | ) | (1,356 | ) | 2,654 | |||||
Nondeductible transaction costs |
27,311 | — | — | |||||||
Nondeductible goodwill impairment |
10,497 | — | — | |||||||
Permanent differences |
438 | 4,405 | (172 | ) | ||||||
Changes in valuation allowance |
(6,159 | ) | 6,075 | (6,880 | ) | |||||
Unremitted earnings |
— | 1,686 | — | |||||||
Changes in U.S. tax rates |
(4,784 | ) | — | — | ||||||
Deemed mandatory repatriation |
7,441 | — | — | |||||||
Other |
2,380 | (3,118 | ) | 1,782 | ||||||
| | | | | | | | | | | |
Income Tax Benefit |
$ | (60,246 | ) | $ | (11,787 | ) | $ | (26,812 | ) | |
| | | | | | | | | | | |
| | | | | | | | | | | |
| | | | | | | | | | | |
The Tax Cuts and Jobs Act ("TCJA") was signed by the President of the United States and enacted into law on December 22, 2017. The TCJA significantly changes U.S. tax law by reducing the U.S. corporate income tax rate to 21.0% from 35.0%, adopting a territorial tax regime, creating new taxes on certain foreign sourced earnings and imposing a one-time transition tax on the undistributed earnings of certain non-U.S. subsidiaries.
Accounting Standards Codification Topic 740, Income Taxes ("ASC 740") requires companies to account for the tax effects of changes in income tax rates and laws in the period in which legislation is enacted (December 22, 2017). ASC 740 does not specifically address accounting and disclosure guidance in connection with the income tax effects of the TCJA. Consequently, on December 22, 2017, the Securities and Exchange Commission staff issued Staff Accounting Bulletin No. 118 ("SAB 118"), to address the application of ASC 740 in the reporting period that includes the date the TCJA was enacted. SAB 118 allows companies a reasonable period of time to complete the accounting for the income tax effects of the TCJA.
At December 31 2017, the Company has not completed the accounting for the income tax effects of the TCJA. However, pursuant to SAB 118, the Company has made provisional estimates of the effects of existing deferred tax assets and liabilities and the one-time transition tax. The Company recognized a $9.4 million provisional tax benefit to Continuing Operations on revaluing its existing net deferred tax liability at the reduced corporate tax rate of 21.0%. Also, the Company determined that a $9.1 million provisional tax was due on estimated earnings and profits subject to the deemed mandatory repatriation. However, a payable was not recorded by the Company since the Company's net operating loss carryforward at December 31, 2017 can be used to offset the mandatory repatriation tax.
The TCJA subjects US stockholders to tax on global intangible low-taxed income ("GILTI") earned by certain foreign subsidiaries. Pursuant to FASB Staff Q&A, Topic 740, No. 5, Accounting for Global Intangible Low-Taxed Income, the Company can make an accounting policy election to either recognize deferred taxes for temporary basis differences expected to reverse as GILTI in subsequent periods or recognize the tax expense related to GILTI as a period cost in the year the tax is incurred. The GILTI provisions are complex and the Company expects additional clarification and interpretive guidance to be released by the Treasury subsequent to the issuance of the Company's annual financial statements. The Company has not elected an accounting policy related to GILTI but will continue evaluating the application of the GILTI provisions during the SAB 118 measurement period.
91
The provisional tax effects reflected in the financial statements are subject to change due to, among other things, additional analysis and receipt of final data as well as the release of new authoritative and interpretive guidance. The Company expects to complete its accounting for the effects of the TCJA after the filing of the U.S. federal consolidated and state tax returns in 2018.
The components of deferred income tax liabilities and assets are as follows:
| |
Year Ended December 31, | ||||||
|---|---|---|---|---|---|---|---|
| |
2017 | 2016 | |||||
Deferred income tax liabilities: |
|||||||
Book over tax basis of intangible and fixed assets |
$ | (113,844 | ) | $ | (108,419 | ) | |
Unremitted foreign earnings |
— | (1,686 | ) | ||||
Other, net |
$ | (2,684 | ) | $ | (7,781 | ) | |
| | | | | | | | |
Total deferred income tax liabilities |
(116,528 | ) | (117,886 | ) | |||
Deferred income tax assets: |
|||||||
Allowance for doubtful accounts and receivable adjustments |
$ | 1,401 | $ | 2,112 | |||
Inventory |
1,807 | 3,076 | |||||
Accrued liabilities |
9,586 | 9,554 | |||||
Net operating loss and tax credit carryforwards |
196,633 | 232,226 | |||||
Tax deductible goodwill |
3,862 | 6,806 | |||||
Other, net |
15,518 | 18,364 | |||||
| | | | | | | | |
Total deferred income tax assets |
$ | 228,807 | $ | 272,138 | |||
Valuation allowance |
(108,622 |
) |
(170,821 |
) |
|||
| | | | | | | | |
Total net deferred income tax assets (liabilities) |
$ | 3,657 | $ | (16,569 | ) | ||
| | | | | | | | |
| | | | | | | | |
| | | | | | | | |
Gross deferred tax assets are reduced by valuation allowances to the extent the Company determines it is not more-likely-than-not the deferred tax assets are expected to be realized. At December 31, 2017, the Company recognized $108.6 million of valuation allowances against gross deferred tax assets primarily related to net operating loss and tax credit carryforwards. Of this amount, approximately $84.6 million and $8.7 million of the total valuation allowance was related to U.S. federal and state limitations on the utilization of net operating loss carryforwards due to numerous changes in ownership. The remaining $15.3 million of the valuation allowance was related to non-limited U.S. federal and non-US net operating losses and tax credits that are not expected to be realizable. In connection with the Novitex acquisition, the Company recorded additional taxable temporary differences that provided support for reducing $14.0 million of valuation allowance established in the prior period, and resulted in an income tax benefit. The remaining reduction in the valuation allowance attributable to net deferred tax liabilities acquired in the Novitex acquisition was offset by an increase in valuation allowance on current year losses that are not more-likely-than-not to be realized.
The net change during the year in the total valuation allowance was a decrease of $62.2 million primarily related to the revaluation of deferred tax assets and liabilities at the reduced corporate rate of 21.0%. The reduction of net deferred tax assets due to the rate revaluation also decreased the amount of the valuation allowance by the same amount resulting in no overall net impact to the Company's income tax provision.
Section 382 of the Internal Revenue Code of 1986, as amended (the Code), limits the amount of U.S. tax attributes (net operating loss and tax credit carryforwards) following a change in ownership. The Company has determined that an ownership change occurred under Section 382 on April 3, 2014 and October 31, 2014 for the Pangea group and on October 31, 2014 for the SourceHOV Holdings
92
group. The Section 382 limitations significantly limit the pre-acquisition Pangea net operating losses. Accordingly, upon the October 31, 2014 change in control, most of the historic Pangea federal net operating losses were limited and a valuation allowance has been established against the related deferred tax asset. Following the filing of the October 31, 2014, Pangea federal tax returns and further Section 382 analysis, management finalized the amount of the limitation and as a result, approximately $3.5 million of the valuation allowance was released in 2015. Management has concluded that the U.S. tax attributes after Section 382 limitations were applied are more likely than not to be realized. With regard to Pangea's foreign subsidiaries, it was determined that most deferred tax assets are not likely to be realized and valuation allowances have been established. The Section 382 limit that applied to the historic SourceHOV LLC group is greater than the net operating losses and tax credits generated in the predecessor periods. Therefore, no additional valuation allowances were established relating to Section 382 limitations other than the pre-2011 Section 382 limitations that applied.
Included in deferred tax assets are federal, foreign and state net operating loss carryforwards, federal general business credit carryforwards and state tax credit carryforwards due to expire beginning in 2018 through 2037. As of December 31, 2017, the Company has federal and state income tax net operating loss (NOL) carryforwards of $756.6 million and $465.9 million, which will expire at various dates from 2018 through 2037. Such NOL carryforwards expire as follows:
| |
Federal NOL | State and Local NOL |
|||||
|---|---|---|---|---|---|---|---|
2018 - 2021 |
$ | 116,285 | $ | 30,400 | |||
2022 - 2026 |
117,314 | 79,355 | |||||
2027 - 2037 |
523,025 | 356,172 | |||||
| | | | | | | | |
|
$ | 756,624 | $ | 465,927 | |||
| | | | | | | | |
| | | | | | | | |
| | | | | | | | |
As of December 31, 2017, the Company has foreign net operating loss carryforwards of $28.8 million, $7.8 million of which were generated by BancTec Holding N.V. and BancTec B.V., and will expire at various dates from 2018 through 2026, and the rest of which can be carried forward indefinitely.
Since the 2014 Reorganization did not result in a new tax basis of assets and liabilities for the Company, some of the goodwill continues to be deductible over the remaining amortization period for tax purposes. At December 31, 2017, approximately $63.9 million of the Company's goodwill is tax deductible, $25.4 million of which is carried over from the 2014 Reorganization. Additionally, the Company has tax deductible goodwill of $26.5 million in connection with the TransCentra acquisition, and $12.0 million in connection with the Novitex acquisition as of December 31, 2017. These amounts were related to the tax basis carried over from the seller.
The Company adopted the provision of accounting for uncertainty in income taxes in the Topic of the ASC 740. ASC 740 clarifies the accounting for uncertain tax positions in the Company's financial statements and prescribes a recognition threshold and measurement attribute for financial statement disclosure of tax positions taken or expected to be taken on tax returns. The total amount of unrecognized tax benefits at December 31, 2017 is $1.0 million, and if recognized $0.5 million would benefit the effective tax rate. Total accrued interest and penalties recorded on the Consolidated Balance Sheet were $3.0 million and $2.6 million at December 31, 2017 and 2016, respectively. The total amount of interest and penalties recognized in the Consolidated Statement of Operations at December 31, 2017 was $0.4 million. The Company does not anticipate a significant change in the amount of unrecognized tax benefits during 2017.
93
The following is a tabular reconciliation of the total amounts of unrecognized tax benefits:
| |
Year Ended December 31, | |||||||||
|---|---|---|---|---|---|---|---|---|---|---|
| |
2017 | 2016 | 2015 | |||||||
Unrecognized tax benefits—January 1 |
$ | 999 | $ | 1,287 | $ | 2,760 | ||||
Gross increases—tax positions in prior period |
9 | — | — | |||||||
Gross decreases—tax positions in prior period |
39 | (31 | ) | (916 | ) | |||||
Gross increases—tax positions in current period |
— | 45 | 70 | |||||||
Settlement |
— | (103 | ) | (110 | ) | |||||
Lapse of statute of limitations |
— | (199 | ) | (517 | ) | |||||
| | | | | | | | | | | |
Unrecognized tax benefits—December 31 |
$ | 1,047 | $ | 999 | $ | 1,287 | ||||
| | | | | | | | | | | |
| | | | | | | | | | | |
| | | | | | | | | | | |
The Company files income tax returns in the U.S. and various state and foreign jurisdictions. The statute of limitations for U.S. purposes is open for tax years ending on or after December 31, 2013, However, NOLs generated in years prior to 2013 and utilized in future periods may be subject to examination by U.S. tax authorities. State jurisdictions that remain subject to examination are not considered significant. The Company has significant foreign operations in India and Europe. The Company may be subject to examination by the India tax authorities for tax periods ending on or after March 31, 2011.
The Company recorded a provisional amount for the deemed mandatory repatriation of its total post-1986 earnings and profits that were previously deferred from US income taxes. The deemed mandatory repatriation was based in part on the amount of untaxed earnings held in cash and other specified assets. The Company notes the final amount of earnings and profits may change based on the completion of the Company's US federal tax return and the actual amounts held in cash and other specified assets. At December 31, 2017, the Company has not changed its prior indefinite reinvestment assertion on undistributed earnings related to certain foreign subsidiaries. As such, no additional taxes including foreign withholding taxes have been provided on these undistributed earnings. Additionally, the Company does not indefinitely reinvest earnings in Canada, China, India, Mexico and Philippines.
11. Employee Benefit Plans
German Pension Plan
The Company's subsidiary in Germany provides pension benefits to eligible retirees. Employees eligible for participation includes all employees who started working for the Company prior to September 30, 1987 and have finished a qualifying period of at least 10 years. The Company accrues the cost of these benefits over the service lives of the covered employees based on an actuarial calculation. The Company uses a December 31 measurement date for this plan.
U.K. Pension Plan
The Company's subsidiary in the United Kingdom provides pension benefits to eligible retirees and eligible dependents. Employees eligible for participation included all full-time regular employees who were more than three years from retirement prior to October 2001. A retirement pension or a lump-sum payment may be paid dependent upon length of service at the mandatory retirement age. The Company accrues the cost of these benefits over the service lives of the covered employees based on an actuarial calculation. The Company uses a December 31 measurement date for this plan.
The German pension plan is an unfunded plan and therefore has no plan assets. The expected rate of return assumptions for plan assets relate solely to the UK plan and are based mainly on historical performance achieved over a long period of time (15 to 20 years) encompassing many business and
94
economic cycles. The Company assumed a weighted average expected long-term rate on plan assets of 4.25%.
Funded Status
The change in benefit obligations, the change in the fair value of the plan assets and the funded status of the Company's pension plans (except for the German pension plan which is unfunded) and the amounts recognized in the Company's consolidated financial statements are as follows:
| |
Year ended December 31, |
||||||
|---|---|---|---|---|---|---|---|
| |
2017 | 2016 | |||||
Change in Benefit Obligation: |
|||||||
Benefit obligation at beginning of period |
$ | 82,320 | $ | 76,569 | |||
Service cost |
8 | 11 | |||||
Interest cost |
2,288 | 2,667 | |||||
Plan participants' contributions |
— | — | |||||
Actuarial loss |
1,021 | 19,330 | |||||
Plan curtailment |
— | — | |||||
Benefits paid |
(1,797 | ) | (2,042 | ) | |||
Foreign-exchange rate changes |
7,674 | (14,215 | ) | ||||
| | | | | | | | |
Benefit obligation at end of year |
$ | 91,514 | $ | 82,320 | |||
| | | | | | | | |
| | | | | | | | |
| | | | | | | | |
Change in Plan Assets: |
|||||||
Fair value of plan assets at beginning of period |
$ | 52,538 | $ | 55,909 | |||
Actual return on plan assets |
6,579 | 6,790 | |||||
Employer contributions |
2,297 | 1,770 | |||||
Plan participants' contributions |
— | — | |||||
Benefits paid |
(1,782 | ) | (2,031 | ) | |||
Foreign-exchange rate changes |
5,254 | (9,900 | ) | ||||
| | | | | | | | |
Fair value of plan assets at end of year |
64,886 | 52,538 | |||||
| | | | | | | | |
Funded status at end of year |
$ | (26,628 | ) | $ | (29,782 | ) | |
| | | | | | | | |
| | | | | | | | |
| | | | | | | | |
Net amount recognized in the Consolidated Balance Sheets: |
|||||||
Accrued compensation and benefits(a) |
$ | (1,551 | ) | (1,479 | ) | ||
Pension liability(b) |
$ | (25,077 | ) | $ | (28,303 | ) | |
Amounts recognized in accumulated other comprehensive loss, net of tax consist of: |
|||||||
Net actuarial loss |
(11,054 | ) | (12,339 | ) | |||
| | | | | | | | |
Net amount recognized in accumulated other comprehensive loss, net of tax |
$ | (11,054 | ) | $ | (12,339 | ) | |
| | | | | | | | |
| | | | | | | | |
| | | | | | | | |
Plans with underfunded or non-funded accumulated benefit obligation: |
|||||||
Aggregate projected benefit obligation |
$ |
91,514 |
$ |
82,320 |
|||
Aggregate accumulated benefit obligation |
$ | 91,514 | $ | 82,320 | |||
Aggregate fair value of plan assets |
$ | 64,886 | $ | 52,538 | |||
- (a)
- Germany
pension represents only a portion of the accrued compensation and benefits balance presented in the consolidated balance sheet.
- (b)
- Consolidated balance of $25,496 and $28,712 includes UK pension of $25,077 and $28,303, for the years ended December 31, 2017 and 2016, respectively, and minimum regulatory benefit for a Philippines legal entity.
95
Amounts in Accumulated Other Comprehensive Loss Expected to be Recognized in Net Periodic Benefit Costs in 2017
The liability recorded on the Company's consolidated balance sheets representing the net unfunded status of this plan is different than the cumulative expense recognized for this plan. The difference relates to losses that are deferred and that will be amortized into periodic benefit costs in future periods. These unamortized amounts are recorded in Accumulated Other Comprehensive Loss in the consolidated balance sheets.
As of December 31, 2017, the estimated pre-tax amount that will be amortized from accumulated other comprehensive loss into net periodic benefit cost over the next year will be net actuarial loss of $3.1 million and prior service cost of $0.1 million.
Tax Effect on Accumulated Other Comprehensive Loss
As of December 31, 2017 and 2016, the Company recorded actuarial losses of $11.1 million and $12.3 million, respectively, which is net of a deferred tax benefit of $2.0 million and $2.5 million, respectively.
Pension and Postretirement Expense
The components of the net periodic benefit cost are as follows:
| |
Year ended December 31, | |||||||||
|---|---|---|---|---|---|---|---|---|---|---|
| |
2017 | 2016 | 2015 | |||||||
Service cost |
$ | 8 | $ | 11 | $ | 735 | ||||
Interest cost |
2,288 | 2,667 | 2,926 | |||||||
Expected return on plan assets |
(2,392 | ) | (2,623 | ) | (2,696 | ) | ||||
Curtailment recognized |
— | — | (258 | ) | ||||||
Amortization: |
— | — | ||||||||
Amortization of prior service cost |
(134 | ) | (141 | ) | (159 | ) | ||||
Amortization of net (gain) loss |
2,063 | 891 | 1,426 | |||||||
| | | | | | | | | | | |
Net periodic benefit cost |
$ | 1,833 | $ | 805 | $ | 1,974 | ||||
| | | | | | | | | | | |
| | | | | | | | | | | |
| | | | | | | | | | | |
Valuation
The Company uses the corridor approach and projected unit credit method in the valuation of its defined benefit plans for the UK and Germany, respectively. The corridor approach defers all actuarial gains and losses resulting from variances between actual results and economic estimates or actuarial assumptions. For defined benefit pension plan, these unrecognized gains and losses are amortized when the net gains and losses exceed 10% of the greater of the market-related value of plan assets or the projected benefit obligation at the beginning of the year. The amount in excess of the corridor is amortized over 15 years. Similarly, the Company used the Projected Unit Credit Method for the German Plan, and evaluated the assumptions used to derive the related benefit obligations consisting primarily of financial and demographic assumptions including commencement of employment, biometric decrement tables, retirement age, staff turnover. The projected unit credit method determines the present value of the Company's defined benefit obligations and related service costs by taking into account each period of service as giving rise to an additional unit of benefit entitlement and measures each unit separately in building up the final obligation. Benefit is attributed to periods of service using the plan's benefit formula, unless an employee's service in later years will lead to a materially higher of benefit than in earlier years, in which case a straight-line basis is used.
96
The following tables set forth the principal actuarial assumptions used to determine benefit obligation and net periodic benefit costs:
| |
December 31, | ||||||||||||
|---|---|---|---|---|---|---|---|---|---|---|---|---|---|
| |
2017 | 2016 | 2017 | 2016 | |||||||||
| |
UK |
Germany |
|||||||||||
Weighted-average assumptions used to determine benefit obligations: |
|||||||||||||
Discount rate |
2.50 | % | 2.70 | % | 2.40 | % | 2.45 | % | |||||
Rate of compensation increase |
N/A | N/A | 1.00 | % | 1.00 | % | |||||||
Weighted-average assumptions used to determine net periodic benefit cost: |
|||||||||||||
Discount rate |
2.70 | % | 3.90 | % | N/A | N/A | |||||||
Expected asset return |
4.34 | % | 5.15 | % | N/A | N/A | |||||||
Rate of compensation increase |
N/A | N/A | N/A | N/A | |||||||||
The Germany plan is an unfunded plan and therefore has no plan assets. The expected rate of return assumptions for plan assets relates solely to the UK plan and are based mainly on historical performance achieved over a long period of time (15 to 20 years) encompassing many business and economic cycles. Adjustments, upward and downward, may be made to those historical returns to reflect future capital market expectations; these expectations are typically derived from expert advice from the investment community and surveys of peer company assumptions.
The Company assumed a weighted average expected long-term rate of return on plan assets for the overall scheme of 4.25%. The Company's expected rate of return for equities is derived by applying an equity risk premium to the expected yield on the fixed-interest 15-year U.K. government gilts. The Company evaluated a number of indicators including prevailing market valuations and conditions, corporate earnings expectations, and the estimates of long-term economic growth and inflations to derive the equity risk premium. The expected return on the gilts and corporate bonds typically reflect market conditions at the balance sheet date, and the nature of the bond holdings.
The discount rate assumption was developed considering the current yield on an investment grade non-gilt index with an adjustment to the yield to match the average duration of the index with the average duration of the plan's liabilities. The index utilized reflected the market's yield requirements for these types of investments.
The inflation rate assumption was developed considering the difference in yields between a long-term government stocks index and a long-term index-linked stocks index. This difference was modified to consider the depression of the yield on index-linked stocks due to the shortage of supply and high demand, the premium for inflation above the expectation built into the yield on fixed-interest stocks and the UK government's target rate for inflation (CPI) at 2.0%.The assumptions used are the best estimates chosen from a range of possible actuarial assumptions which, due to the time scale covered, may not necessarily be borne out in practice.
Plan Assets
The investment objective for the plan is to earn, over moving fifteen to twenty year periods, the long-term expected rate of return, net of investment fees and transaction costs, to satisfy the benefit obligations of the plan, while at the same time maintaining sufficient liquidity to pay benefit obligations and proper expenses, and meet any other cash needs, in the short-to medium-term.
The Company's investment policy related to the defined benefit plan is to continue to maintain investments in government gilts and highly rated bonds as a means to reduce the overall risk of assets held in the fund. No specific targeted allocation percentages have been set by category, but are at the direction and discretion of the plan trustees. During 2017 and 2016, all contributions made to the fund were in these categories.
97
The weighted average allocation of plan assets by asset category is as follows:
| |
December 31, | |||||||||
|---|---|---|---|---|---|---|---|---|---|---|
| |
2017 | 2016 | 2015 | |||||||
U.S. and international equities |
45.0 | % | 42.0 | % | 41.0 | % | ||||
UK government and corporate bonds |
20.0 | % | 21.0 | % | 20.0 | % | ||||
Diversified growth fund |
35.0 | % | 37.0 | % | 39.0 | % | ||||
| | | | | | | | | | | |
Total |
100.0 | % | 100.0 | % | 100.0 | % | ||||
| | | | | | | | | | | |
| | | | | | | | | | | |
| | | | | | | | | | | |
The following tables set forth, by category and within the fair value hierarchy, the fair value of the Company's pension assets at December 31, 2017 and 2016:
| |
December 31, 2017 | ||||||||||||
|---|---|---|---|---|---|---|---|---|---|---|---|---|---|
| |
Total | Level 1 | Level 2 | Level 3 | |||||||||
Asset Category: |
|||||||||||||
Cash |
$ | 256 | $ | 256 | $ | — | $ | — | |||||
Equities: |
— | ||||||||||||
U.S. |
17,307 | 17,307 | — | — | |||||||||
International |
11,539 | 11,539 | — | — | |||||||||
Fixed Income Securities: |
— | ||||||||||||
Corporate bonds |
12,884 | 12,884 | — | — | |||||||||
Other investments: |
— | ||||||||||||
Diversified growth fund |
22,900 | 22,900 | — | — | |||||||||
| | | | | | | | | | | | | | |
Total fair value |
$ | 64,886 | $ | 64,886 | $ | — | $ | — | |||||
| | | | | | | | | | | | | | |
| | | | | | | | | | | | | | |
| | | | | | | | | | | | | | |
| |
December 31, 2016 | ||||||||||||
|---|---|---|---|---|---|---|---|---|---|---|---|---|---|
| |
Total | Level 1 | Level 2 | Level 3 | |||||||||
Asset Category: |
|||||||||||||
Cash |
$ | 315 | $ | 315 | $ | — | $ | — | |||||
Equities: |
|||||||||||||
U.S. |
13,171 | 13,171 | — | — | |||||||||
International |
8,781 | 8,781 | — | — | |||||||||
Fixed Income Securities: |
|||||||||||||
UK Gilts |
10,962 | 10,962 | — | — | |||||||||
Other investments: |
|||||||||||||
Diversified growth fund |
19,309 | 19,309 | — | — | |||||||||
| | | | | | | | | | | | | | |
Total fair value |
$ | 52,538 | $ | 52,538 | $ | — | $ | — | |||||
| | | | | | | | | | | | | | |
| | | | | | | | | | | | | | |
| | | | | | | | | | | | | | |
The plan assets for the UK are categorized as follows, as applicable:
Level 1: Any asset for which a unit price is available and used without adjustment, cash balances, etc.
Level 2: Any asset for which the amount disclosed is based on market data, for example a fair value measurement based on a present value technique (where all calculation inputs are based on data).
Level 3: Other assets. For example, any asset value with a fair value adjustment made not based on available indices or data.
98
Employer Contributions
The Company's funding is based on governmental requirements and differs from those methods used to recognize pension expense. The Company made contributions of $2.3 million to its pension plans during the year ended December 31, 2017. The Company has fully funded the pension plans for 2017 based on current plan provisions. The Company expects to contribute $2.5 million to the pension plans during 2018, based on current plan provisions.
Estimated Future Benefit Payments
The estimated future pension benefit payments expected to be paid to plan participants are as follows:
| |
Estimated Benefit Payments |
|||
|---|---|---|---|---|
Year ended December 31, |
||||
2018 |
$ | 1,126 | ||
2019 |
1,364 | |||
2020 |
1,578 | |||
2021 |
1,739 | |||
2022 |
1,937 | |||
2023 - 2027 |
13,284 | |||
| | | | | |
Total |
$ | 21,028 | ||
| | | | | |
| | | | | |
| | | | | |
12. Commitments and Contingencies
Litigation
The Company is, from time to time, involved in certain legal proceedings, inquiries, claims and disputes, which arise in the ordinary course of business. Although management cannot predict the outcomes of these matters, management does not believe these actions will have a material, adverse effect on the Company's consolidated balance sheets, consolidated statements of operations or consolidated statements of cash flows.
Appraisal Demand
On September 21, 2017, former stockholders of the wholly-owned subsidiary SourceHOV, who allege combined ownership of 10,304 shares of SourceHOV Common Stock, filed a petition for appraisal pursuant to 8 Del. C. § 262 in the Delaware Court of Chancery, captioned Manichaean Capital, LLC, et al. v. SourceHOV Holdings, Inc., C.A. No. 2017-0673-JRS (the "Appraisal Action"). The Appraisal Action arises out of the Business Combination, which gave rise to appraisal rights pursuant to 8 Del. C. § 262. In the Appraisal Action, the petitioners seek, among other things, a determination of the fair value of their shares at the time of the Business Combination; an order that SourceHOV pay that value to the petitioners, together with interest at the statutory rate; and an award of costs, attorneys' fees, and other expenses.
On October 12, 2017, SourceHOV filed its answer to the petition and a verified list pursuant to 8 Del. C. § 262(f). At this early stage of the litigation, the Company is unable to predict the outcome of the Appraisal Action or estimate any loss or range of loss that may arise from the Appraisal Action.
99
Lease Commitments
The Company leases various office buildings, machinery, equipment, and vehicles. Future minimum lease payments under capital leases, included in long-term obligations, and non-cancelable operating leases at December 31, 2017 are as follows:
| |
Capital Leases |
Operating Lease |
Total | |||||||
|---|---|---|---|---|---|---|---|---|---|---|
2018 |
$ | 18,268 | $ | 36,945 | $ | 55,213 | ||||
2019 |
11,260 | 27,143 | 38,403 | |||||||
2020 |
6,637 | 21,786 | 28,423 | |||||||
2021 |
5,611 | 15,970 | 21,581 | |||||||
2022 |
2,070 | 11,424 | 13,494 | |||||||
Thereafter |
4,880 | 16,361 | 21,241 | |||||||
| | | | | | | | | | | |
Total minimum lease payments |
$ | 48,726 | $ | 129,629 | $ | 178,355 | ||||
| | | | | | | | | | | |
Less: Amounts representing interest |
(7,157 | ) | ||||||||
| | | | | | | | | | | |
Total net minimum lease payments |
41,569 | |||||||||
| | | | | | | | | | | |
Less: Current portion of obligations under capital leases |
(15,611 | ) | ||||||||
| | | | | | | | | | | |
Long-term portion of obligations under capital leases |
$ | 25,958 | ||||||||
| | | | | | | | | | | |
| | | | | | | | | | | |
| | | | | | | | | | | |
Rent expense for all operating leases was $60.3 million, $36.7 million, and $30.7 million for the years ended December 31, 2017, 2016, and 2015, respectively.
Contract-Related Contingencies
The Company has certain contingent liabilities that arise in the ordinary course of providing services to its customers. These contingencies are generally the result of contracts that require the Company to comply with certain performance measurements or the delivery of certain services by a specified deadline. The Company believes the liability, if any, incurred under these contract provisions will not have a material adverse effect on the Company's consolidated balance sheets, consolidated statements of operations or consolidated statements of cash flows.
The Company has certain contingent liabilities related to prior acquisitions. The Company adjusts these liabilities to fair value at each reporting period. The Company had a $0.7 million liability related to HandsOn Global Management's ("HGM") acquisition of BancTec, Inc. for both December 31, 2017 and 2016, respectively. The fair value is determined using an earn out method based on the agreement terms. This fair value measurement represents a Level 3 measurement as it is based on significant inputs not observable in the market. Significant judgment is employed in determining the appropriateness of these assumptions.
13. Fair Value Measurement
Assets and Liabilities Measured at Fair Value on a Non-Recurring Basis
The carrying amount of assets and liabilities including cash and cash equivalents, accounts receivable and accounts payable approximated their fair value as of December 31, 2017 and December 31, 2016 due to the relative short maturity of these instruments. Management estimates the fair values of the secured term loan and secured notes at approximately 96.8% and 97.5%, respectively, of the respective principal balance outstanding as of December 30, 2017. The carrying value approximates the fair value for the long-term debt. The Company acquired $11.7 million of other
100
long-term debt from Novitex (refer to Note 3), which primarily relates to the financing of equipment. Other debt represents the Company's outstanding loan balances associated with various hardware and software purchases along with loans entered into by subsidiaries of the Company and as such, the cost incurred would approximate fair value. Property and equipment, intangible assets, capital lease obligations, and goodwill are not required to be re-measured to fair value on a recurring basis. These assets are evaluated for impairment if certain triggering events occur. If such evaluation indicates that impairment exists, the respective asset is written down to its fair value.
The Company determined the fair value of its long-term debt using Level 2 inputs including the recent issue of the debt, the Company's credit rating, and the current risk-free rate. The Company's contingent liabilities related to prior acquisitions are re-measured each period and represent a Level 2 measurement as it is based on using an earn out method based on the agreement terms.
The Company determined the fair value of the interest rate swap using Level 2 inputs. The Company uses closing prices as provided by a third party institution. (Refer to Note 2—Basis of Presentation and Summary of Significant Accounting Policies).
The following table provides the carrying amounts and estimated fair values of the Company's financial instruments as of December 31, 2017 and December 31, 2016:
| |
|
|
Fair Value Measurements | |||||||||||||
|---|---|---|---|---|---|---|---|---|---|---|---|---|---|---|---|---|
| |
Carrying Amount |
Fair Value |
||||||||||||||
As of December 31, 2017
|
Level 1 | Level 2 | Level 3 | |||||||||||||
Recurring and nonrecurring assets and liabilities: |
||||||||||||||||
Acquisition contingent liability |
$ | 721 | $ | 721 | $ | — | $ | — | $ | 721 | ||||||
Long-term debt |
1,276,094 | 1,308,478 | — | 1,308,478 | — | |||||||||||
Interest rate swap |
1,297 | 1,297 | — | 1,297 | — | |||||||||||
| | | | | | | | | | | | | | | | | |
|
$ | 1,278,112 | $ | 1,310,496 | $ | — | $ | 1,309,775 | $ | 721 | ||||||
| | | | | | | | | | | | | | | | | |
| | | | | | | | | | | | | | | | | |
| | | | | | | | | | | | | | | | | |
| |
|
|
Fair Value Measurements | |||||||||||||
|---|---|---|---|---|---|---|---|---|---|---|---|---|---|---|---|---|
| |
Carrying Amount |
Fair Value |
||||||||||||||
As of December 31, 2016
|
Level 1 | Level 2 | Level 3 | |||||||||||||
Recurring and nonrecurring assets and liabilities: |
||||||||||||||||
Acquisition contingent liability |
$ | 721 | $ | 721 | $ | — | $ | — | $ | 721 | ||||||
Long-term debt |
983,502 | 1,009,913 | — | 1,009,913 | — | |||||||||||
| | | | | | | | | | | | | | | | | |
|
$ | 984,223 | $ | 1,010,634 | $ | — | $ | 1,009,913 | $ | 721 | ||||||
| | | | | | | | | | | | | | | | | |
| | | | | | | | | | | | | | | | | |
| | | | | | | | | | | | | | | | | |
The significant unobservable inputs used in the fair value of the Company's acquisition contingent liabilities are the discount rate, growth assumptions, and revenue thresholds. Significant increases (decreases) in the discount rate would have resulted in a lower (higher) fair value measurement. Significant increases (decreases) in the forecasted financial information would have resulted in a higher (lower) fair value measurement. For all significant unobservable inputs used in the fair value measurement of the Level 3 liabilities, a change in one of the inputs would not necessarily result in a directionally similar change in the other based on the current level of billings.
101
The following table reconciles the beginning and ending balances of net assets and liabilities classified as Level 3 for which a reconciliation is required:
| |
December 31, | ||||||
|---|---|---|---|---|---|---|---|
| |
2017 | 2016 | |||||
Balance as of January 1, |
$ | 721 | $ | 1,513 | |||
Payments/Reductions |
— | (792 | ) | ||||
| | | | | | | | |
Balance as of December 31, |
$ | 721 | $ | 721 | |||
| | | | | | | | |
| | | | | | | | |
| | | | | | | | |
14. Stock-Based Compensation
At Closing, SourceHOV had 24,535 restricted stock units ("RSUs") outstanding under its 2013 Long Term Incentive Plan ("2013 Plan"). Simultaneous with the Closing, the 2013 Plan, as well as all vested and unvested RSUs under the 2013 Plan, were assumed by Ex-Sigma, LLC ("Ex-Sigma"), an entity formed by the former SourceHOV equity holders, which is also the Company's principal stockholder. In accordance with U.S. GAAP, the Company will continue to incur compensation expense related to the 9,880 unvested RSUs as of July 12, 2017 on a straight-line basis until fully vested, as the recipients of the RSUs are employees of the Company. Subject to continuous employment and other terms of the 2013 Plan, all remaining unvested RSUs with an initial vesting period of 3 or 4 years will vest by April 2019. Stock-based compensation expense is recorded as personnel and related costs within Selling, general, and administrative expenses. The Company incurred total compensation expense of $6.7 million and $7.1 million related to these awards for the years ended December 31, 2017 and 2016, respectively.
Exela 2018 Stock Incentive Plan
On December 20, 2017, Exela's 2018 Stock Incentive Plan (the "2018 Plan") became effective. The 2018 Plan provides for the grant of incentive and nonqualified stock options, restricted stock, restricted stock units, stock appreciation rights, performance awards, and other stock-based compensation to eligible participants. Under the 2018 Plan, stock options are granted at a price per share not less than 100% of the fair market value per share of the underlying stock at the grant date. The plan administrator determines the vesting period for each option award on the grant date, and the options generally expire 10 years from the grant date. The Company will be authorized to issue up to 8,323,764 shares of Common Stock. No awards have been issued under the 2018 Plan as of December 31, 2017.
A summary of the status of restricted stock units as of December 31, 2017 and 2016, and the changes during the years then ended is presented as follows:
| |
Number of Shares |
Weighted Remaining Contractual Life (Years) |
Aggregate Intrinsic Value ($) |
|||||||
|---|---|---|---|---|---|---|---|---|---|---|
Nonvested as of January 1, 2016 |
7,301 | 2.13 | $ | 1,587 | ||||||
Shares granted |
6,375 | — | ||||||||
Shares forfeited |
(250 | ) | — | |||||||
Shares vested |
(4,539 | ) | — | |||||||
| | | | | | | | | | | |
Nonvested as of December 31, 2016 |
8,887 | 2.01 | 1,567 | |||||||
| | | | | | | | | | | |
Shares granted |
— | — | ||||||||
Shares forfeited |
(1,192 | ) | — | |||||||
Shares vested |
(2,295 | ) | — | |||||||
| | | | | | | | | | | |
Nonvested as of December 31, 2017 |
5,400 | 1.33 | $ | 1,633 | ||||||
| | | | | | | | | | | |
| | | | | | | | | | | |
| | | | | | | | | | | |
102
For the 6,375 restricted stock units issued during 2016, the fair value of the awards was estimated based on the estimated enterprise value of SourceHOV, determined under a market approach. SourceHOV determined the enterprise value by performing a guideline public company analysis, and determining multiples to apply based on guideline public companies' enterprise value ratios, in accordance with the Guideline Public Company Method. The enterprise value was reduced by outstanding debt to determine the fair value of the Company's equity, which was adjusted for discounts attributable to lack of control and marketability.
As of December 31, 2017, there was approximately $6.0 million of total unrecognized compensation expense related to restricted stock of which will be recognized over the respective service period, approximately 1.33 years. There were 24,535 restricted stock units outstanding, of which 5,400 were unvested. As of December 31, 2016, there were 25,727 restricted stock units outstanding, of which 8,887 were unvested.
Awards to Non- employees
At Closing, the Company issued 3,609,375 shares of Common Stock to advisors who are not affiliates of the Company at the Closing in exchange for services provided. The shares issued were fully vested at the Closing. The Company records equity instruments issued to non-employees as expense at the fair value. For the year ended December 31, 2017, the Company recorded expense related to these non-employee advisors of $28.6 million in Selling, general and administrative expense, based on the fair value of $8.00 per share.
15. Stockholders' Equity
The following description summarizes the material terms and provisions of the securities that the Company has authorized.
Common Stock
The Company is authorized to issue 1,600,000,000 shares of Common Stock. At Closing, the Company had 146,910,648 shares of Common Stock outstanding, of which: a) 80,600,000 shares were issued to Ex-Sigma 2, LLC, b) 30,600,000 shares were issued to the sole stockholder of Novitex, c) 12,093,331 shares were issued to the stockholders of Quinpario who did not redeem their shares, d) 3,609,375 shares were issued to certain third party advisors involved in the Business Combination, and e) 16,358,389 shares were issued to holders as part of a secondary offering at $8.00 per share with an additional 2,399,553 bonus shares issued. Certain stockholders of Quinpario were offered 25% Common Stock bonuses if they executed conversion agreements within a specified time limit. Seven Quinpario stockholders returned the agreements and were awarded 841,876 additional shares. As of December 31, 2017, there were no additional issuances of Common Stock other than the conversion of 3,000,000 shares of Series A Preferred Stock being converted into 3,667,803 shares of Common Stock. In January 2018, 1,625,000 shares of Series A Preferred Stock were converted into 1,986,767 shares of Common Stock. As of December 31, 2017, there were 150,578,451 shares of Common Stock issued and 150,529,151 shares outstanding.
Except as otherwise required by law or as otherwise provided in any certificate of designation for any series of preferred stock or as provided for in the Director Nomination Agreements, the holders of Exela Common Stock possess all voting power for the election of Exela's directors and all other matters requiring stockholder action and will at all times vote together as one class on all matters submitted to a vote of Exela stockholders. Holders of Exela Common Stock are entitled to one vote per share on matters to be voted on by stockholders. Holders of Exela Common Stock will be entitled to receive such dividends and other distributions, if any, as may be declared from time to time by the board of directors in its discretion out of funds legally available therefor and shall share equally on a
103
per share basis in such dividends and distributions. The holders of the Common Stock have no conversion, preemptive or other subscription rights and there are no sinking fund or redemption provisions applicable to the Common Stock.
Preferred Stock
The Company is authorized to issue 20,000,000 shares of preferred stock with such designations, voting and other rights and preferences as may be determined from time to time by the board of directors. At the Closing, the Company issued 9,194,233 shares of Series A Preferred Stock. Refer to Note 3 for additional details about the Business Combination. The par value of the Series A Preferred Stock is $0.0001 per share. Each share of Series A Preferred Stock will be convertible at the holder's option, at any time after the six month anniversary and prior to the third anniversary of the issue date, initially into 1.2226 shares of Exela Common Stock (assuming a conversion price of $8.80 per share and a third anniversary expected liquidation preference of $10.75911 per the below). Due to a Fundamental Change (as defined in the Certificate of Designations, Preferences, Rights and Limitations of the Series A Preferred Stock) that occurred on August 1, 2017 as described in the beneficial conversion feature section of Note 2, holders of the Series A Preferred Stock were able to convert their shares prior to the six month anniversary. Based on such assumed conversion rate, approximately 11,240,869 shares of Exela Common Stock would be issuable upon conversion of all of the shares of Series A Preferred Stock at the six month anniversary of the issue date. As 3,000,000 shares of Series A Preferred Stock converted into 3,667,803 shares of Common Stock upon the occurrence of a fundamental change, as of December 31, 2017, an additional 7,573,066 shares of Common Stock are issuable upon conversion of the remaining 6,194,233 shares of Series A Preferred Stock.
Holders of the Series A Preferred Stock will be entitled to receive cumulative dividends at a rate per annum of 10% of the Liquidation Preference per share of Series A Preferred Stock, paid or accrued quarterly in arrears. From the issue date until the third anniversary of the issue date, the amount of all accrued but unpaid dividends on the Series A Preferred Stock will be added to the Liquidation Preference without any action by the Company's board of directors. For the year ended December 31, 2017, this amount was $2.5 million as reflected on the Consolidated Statement of Operations.
Following the third anniversary of the issue date, dividends on the Series A Preferred Stock will be accrued by adding to the Liquidation Preference or paid in cash, or a combination thereof. In addition, holders of the Series A Preferred Stock will participate in any dividend or distribution of cash or other property paid in respect of the Common Stock pro rata with the holders of the Common Stock (other than certain dividends or distributions that trigger an adjustment to the conversion rate, as described in the Certificate of Designations), as if all shares of Series A Preferred Stock had been converted into Common Stock immediately prior to the date on which such holders of the Common Stock became entitled to such dividend or distribution.
Treasury Stock
On November 8, 2017, the Company's board of directors authorized a share buyback program (the "Share Buyback Program"), pursuant to which the Company may, from time to time, purchase up to 5,000,000 shares of its Common Stock. Share repurchases may be executed through various means, including, without limitation, open market transactions, privately negotiated transactions or otherwise. The decision as to whether to purchase any shares and the timing of purchases, if any, will be based on the price of the Company's Common Stock, general business and market conditions and other investment considerations and factors. The Share Buyback Program does not obligate the Company to purchase any shares and expires in 24 months. The Share Buyback Program may be terminated or amended by the Company's board of directors in its discretion at any time. As of December 31, 2017,
104
49,300 shares had been repurchased under the share buyback program. The Company records treasury stock using the cost method.
Warrants
At December 31, 2017, there were a total of 35,000,000 warrants outstanding. As part of its IPO, Quinpario had issued 35,000,000 units including one share of Common Stock and one warrant. As of December 31, 2017, there are 35,000,000 warrants outstanding. The warrants are traded on the OTC Bulletin board as of December 31, 2017.
Each warrant entitles the holder to purchase one-half of one share of Common Stock at a price of $5.75 per half share ($11.50 per whole share). Warrants may be exercised only for a whole number of shares of Common Stock. No fractional shares will be issued upon exercise of the warrants. Each warrant is currently exercisable and will expire July 12, 2022 (five years after the completion of the Business Combination), or earlier upon redemption.
The Company may call the warrants for redemption at a price of $0.01 per warrant upon a minimum of 30 days' prior written notice of redemption, if, and only if, the last sales price of the shares of Common Stock equals or exceeds $24.00 per share for any 20 trading days within a 30 trading day period (the "30-day trading period") ending three business days before the Company sends the notice of redemption, and if, and only if, there is a current registration statement in effect with respect to the shares of Common Stock underlying such warrants commencing five business days prior to the 30-day trading period and continuing each day thereafter until the date of redemption.
16. Related-Party Transactions
Leasing Transactions
Certain operating companies lease their operating facilities from HOV RE, LLC and HOV Services Limited, which are affiliates through common interest held by Ex-Sigma 2 LLC, our largest stockholder. The rental expense for these operating leases was $0.7 million, $0.6 million, and $0.2 million for the years ended December 31, 2017, 2016, and 2015.
Consulting Agreements
The Company receives services from Oakana Holdings, Inc. The Company and Oakana Holdings, Inc. are related through a family relationship between certain stockholders and the president of Oakana Holdings, Inc. The expense recognized for these services was approximately $0.1 million for the year ended December 31, 2017. For the years ended December 31, 2016, and 2015, the Company incurred no expenses for these services.
The Company receives consulting services from Shadow Pond, LLC. Shadow Pond, LLC is wholly-owned and controlled by Vik Negi, our Executive Vice President Treasury and Business Affairs. The consulting arrangement was established to compensate Mr. Negi for his services to the Company prior to becoming an employee. The expense recognized for these services was approximately $0.5 million, $0.5 million, and $0.2 million for the years ended December 31, 2017, 2016 and 2015, respectively. We expect the consulting arrangement with Shadow Pond, LLC to terminate on April 1, 2018 and for Mr.Negi to continue to provide services as an employee of the Company.
Relationship with HandsOn Global Management
The Company incurred management fees to HGM, SourceHOV's former owner, of $6.0 million for all years ended December 31, 2017, 2016, and 2015. The contract with HGM was terminated upon consummation of the Business Combination, and no fees were payable after July 12, 2017.
105
The Company incurred reimbursable travel expenses to HGM of $0.9 million, $1.7 million, and $0.8 million for the years ended December 31, 2017, 2016, and 2015, respectively.
Pursuant to a master agreement dated January 1, 2015 between Rule 14, LLC and SourceHOV, the Company incurs marketing fees to Rule 14, LLC, a portfolio company of HGM. Similarly, SourceHOV is party to ten master agreements with entities affiliated with HGM's ventures portfolio, each of which were entered into during 2015 and 2016. Each master agreement provides SourceHOV with free use of technology and includes a reseller arrangement pursuant to which SourceHOV is entitled to sell these services to third parties. Any revenue earned by SourceHOV in such third-party sale is shared 75%/25% with each of HGM's venture affiliates in favor of SourceHOV. The brands Zuma, Athena, Peri, BancMate, Spring, Jet, Teletype, CourtQ and Rewardio are part of the HGM ventures portfolio. SourceHOV has the license to use and resell such brands, as described therein. We incurred fees relating to these agreements of $0.6 million and $0.5 million for the years ended December 31, 2017 and 2016, respectively. No expenses were incurred for the year ended December 31, 2015.
During 2017, the Company incurred contract cancellation and advising fees to HGM of $23.0 million, $10.0 million of which was paid by the issuance of 1,250,000 shares of Common Stock, relating to the Business Combination.
Relationship with HOV Services, Ltd.
HOV Services, Ltd., a former stockholder of SourceHOV who currently owns equity interest in the Company through Ex-Sigma, provides the Company data capture and technology services. The expense recognized for these services was approximately $1.7 million, $1.7 million, and $1.4 million for the years ended December 31, 2017, 2016, and 2015 and is included in cost of revenue in the consolidated statements of operations.
Relationship with Apollo Global Management, LLC
The Company provides services to and receives services from certain companies controlled by investment funds affiliated with Apollo Global Management, LLC (together with its subsidiaries and affiliates, as applicable, "Apollo"). Investment funds affiliated with Apollo also control one of our largest stockholders, Novitex Holdings, which has the right to designate two of the Company's directors and has certain other consent rights under the Director Nomination Agreement. For the year ended December 31, 2017 there were related party expenses of $0.3 million for services received from an Apollo affiliated company with a common Apollo designated director. For the years ended December 31, 2016 and 2015, the Company incurred no expenses for these services.
On November 18, 2014, Novitex Solutions, entered into a master services agreement with Management Holdings, an indirect wholly-owned subsidiary of Apollo. Pursuant to this master services agreement, Novitex Solutions provides Management Holdings printer supplies and maintenance services, including toner maintenance, training, quarterly business review and printer procurement. We recognized revenue of approximately $0.3 million in our consolidated statements of operations from Apollo Holdings under this agreement for the year ended December 31, 2017. For the years ended December 31, 2016 and 2015, there were no revenues from this agreement.
On January 18, 2017, Novitex Solutions entered into a master purchase and professional services agreement with Caesars Enterprise Services, LLC ("Caesars"). Caesars is controlled by investment funds affiliated with Apollo. Pursuant to this master purchase and professional services agreement, Novitex Solutions provides managed print services to Caesars, including general equipment operation, supply management, support services and technical support. We recognized revenue of approximately $1.2 million in our consolidated statements of operations from Caesars under this master purchase and professional services agreement for the year ended December 31, 2017. For the years ended December 31, 2016 and 2015, there were no revenues from this agreement.
106
On May 5, 2017, Novitex Solutions entered into a master services agreement with ADT LLC. ADT LLC is controlled by investment funds affiliated with Apollo. Pursuant to this master services agreement, Novitex Solutions provides ADT LLC with mailroom and onsite mail delivery services at an ADT LLC office location and managed print services, including supply management, equipment maintenance and technical support services. We recognized revenue of less than $0.1 million in our consolidated statements of operations from ADT LLC under this master services agreement for the year ended December 31, 2017.
Payable Balances with Affiliates
Payable balances with affiliates as of December 31, 2017 and 2016 are as follows:
| |
December 31, | ||||||
|---|---|---|---|---|---|---|---|
| |
2017 | 2016 | |||||
| |
Payable |
Payable |
|||||
HOV Services, Ltd |
$ | 286 | $ | 352 | |||
Rule 14 |
158 | 134 | |||||
HGM |
13,689 | 8,858 | |||||
Apollo affiliated company |
312 | — | |||||
| | | | | | | | |
|
$ | 14,445 | $ | 9,344 | |||
| | | | | | | | |
| | | | | | | | |
| | | | | | | | |
17. Segment and Geographic Area Information
The Company's operating segments are significant strategic business units that align its products and services with how it manages its business, approach the markets and interacts with its customers. The Company is organized into three segments: ITPS, HS, and LLPS.
ITPS: The ITPS segment provides a wide range of solutions and services designed to aid businesses in information capture, processing, decisioning and distribution to customers primarily in the financial services, commercial, public sector and legal industries.
HS: The HS segment operates and maintains a consulting and outsourcing business specializing in both the healthcare provider and payer markets.
LLPS: The LLPS segment provides a broad and active array of legal services in connection with class action, bankruptcy labor, claims adjudication and employment and other legal matters.
The chief operating decision maker reviews operating segment revenue and cost of revenue. The Company does not allocate Selling, general, and administrative expenses, depreciation and amortization, interest expense and sundry, net. The Company manages assets on a total company basis,
107
not by operating segment, and therefore asset information and capital expenditures by operating segments are not presented.
| |
Year December 31, 2017 | ||||||||||||
|---|---|---|---|---|---|---|---|---|---|---|---|---|---|
| |
ITPS | HS | LLPS | Total | |||||||||
Revenue |
827,110 | 233,595 | 91,619 | 1,152,324 | |||||||||
Cost of revenue |
620,719 | 152,864 | 55,560 | 829,143 | |||||||||
Selling, general and administrative expenses |
220,955 | ||||||||||||
Depreciation and amortization |
98,890 | ||||||||||||
Impairment of goodwill and other intangible assets |
69,437 | ||||||||||||
Related party expense |
33,431 | ||||||||||||
Interest expense, net |
128,489 | ||||||||||||
Loss on extinguishment of debt |
35,512 | ||||||||||||
Sundry expense, net |
2,295 | ||||||||||||
Other income, net |
(1,297 | ) | |||||||||||
| | | | | | | | | | | | | | |
Net loss before income taxes |
$ | (264,531 | ) | ||||||||||
| | | | | | | | | | | | | | |
| | | | | | | | | | | | | | |
| | | | | | | | | | | | | | |
| |
Year ended December 31, 2016 | ||||||||||||
|---|---|---|---|---|---|---|---|---|---|---|---|---|---|
| |
ITPS | HS | LLPS | Total | |||||||||
Revenue |
439,924 | 247,796 | 102,206 | 789,926 | |||||||||
Cost of revenue |
296,848 | 158,800 | 63,473 | 519,121 | |||||||||
Selling, general and administrative expenses |
130,437 | ||||||||||||
Depreciation and amortization |
79,639 | ||||||||||||
Related party expense |
10,493 | ||||||||||||
Interest expense, net |
109,414 | ||||||||||||
Sundry expense, net |
712 | ||||||||||||
| | | | | | | | | | | | | | |
Net loss before income taxes |
$ | (59,890 | ) | ||||||||||
| | | | | | | | | | | | | | |
| | | | | | | | | | | | | | |
| | | | | | | | | | | | | | |
| |
Year December 31, 2015 | ||||||||||||
|---|---|---|---|---|---|---|---|---|---|---|---|---|---|
| |
ITPS | HS | LLPS | Total | |||||||||
Revenue |
421,409 | 251,685 | 132,138 | 805,232 | |||||||||
Cost of revenue |
303,067 | 174,380 | 82,399 | 559,846 | |||||||||
Selling, general and administrative expenses |
120,691 | ||||||||||||
Depreciation and amortization |
75,408 | ||||||||||||
Related party expense |
8,977 | ||||||||||||
Interest expense, net |
108,779 | ||||||||||||
Sundry expense, net |
3,247 | ||||||||||||
| | | | | | | | | | | | | | |
Net loss before income taxes |
$ | (71,716 | ) | ||||||||||
| | | | | | | | | | | | | | |
| | | | | | | | | | | | | | |
| | | | | | | | | | | | | | |
The following table presents revenues by principal geographic area where the Company's customers are located for the years ended December 31, 2017 and 2016:
| |
Years ended December 31, | |||||||||
|---|---|---|---|---|---|---|---|---|---|---|
| |
2017 | 2016 | 2015 | |||||||
United States |
$ | 1,001,766 | $ | 654,565 | $ | 664,795 | ||||
Europe |
135,575 | 131,303 | 136,711 | |||||||
Other |
14,983 | 4,058 | 3,726 | |||||||
| | | | | | | | | | | |
Total Consolidated Revenue |
$ | 1,152,324 | $ | 789,926 | $ | 805,232 | ||||
| | | | | | | | | | | |
| | | | | | | | | | | |
| | | | | | | | | | | |
108
18. Selected Quarterly Financial Results (Unaudited)
The following tables show a summary of the Company's quarterly financial information for each of the four quarters of 2017 and 2016. Significant items impacting the fourth quarter of 2017 compared to other interim periods in 2017 relate to the Business Combination of SourceHOV Holdings, Inc. and Novitex Holdings, Inc. as described in Note 3 to the consolidated financial statements and impairment charges as described in Note 7 to the consolidated financial statements.
| |
Q1 2017 | Q2 2017 | Q3 2017 | Q4 2017 | |||||||||
|---|---|---|---|---|---|---|---|---|---|---|---|---|---|
Revenue |
$ | 218,260 | $ | 209,382 | $ | 338,393 | $ | 386,289 | |||||
Cost of revenue (exclusive of depreciation and amortization) |
143,708 | 140,418 | 255,116 | 289,901 | |||||||||
Selling, general and administrative expenses |
35,581 | 34,998 | 102,048 | 48,328 | |||||||||
Depreciation and amortization |
21,320 | 21,406 | 28,052 | 28,112 | |||||||||
Impairment of goodwill and other intangible assets |
— | — | — | 69,437 | |||||||||
Related party expense |
2,385 | 2,456 | 26,892 | 1,698 | |||||||||
| | | | | | | | | | | | | | |
Operating income (loss) |
15,266 | 10,104 | (73,715 | ) | (51,187 | ) | |||||||
Other expense (income), net: |
|||||||||||||
Interest expense, net |
26,219 | 27,869 | 37,652 | 36,749 | |||||||||
Loss on extinguishment of debt |
— | — | 35,512 | — | |||||||||
Sundry expense (income), net |
2,724 | (327 | ) | 563 | (665 | ) | |||||||
Other income, net |
— | — | — | (1,297 | ) | ||||||||
| | | | | | | | | | | | | | |
Net loss before income taxes |
(13,677 | ) | (17,438 | ) | (147,442 | ) | (85,974 | ) | |||||
Income tax (expense) benefit |
(2,004 |
) |
(2,074 |
) |
37,002 |
27,322 |
|||||||
| | | | | | | | | | | | | | |
Net loss |
(15,681 | ) | (19,512 | ) | (110,440 | ) | (58,652 | ) | |||||
| | | | | | | | | | | | | | |
| | | | | | | | | | | | | | |
| | | | | | | | | | | | | | |
Dividend equivalent on Series A Preferred Stock related to beneficial conversion feature |
— | — | (16,375 | ) | — | ||||||||
Cumulative dividends for Series A Preferred Stock |
— | — | (1,225 | ) | (1,264 | ) | |||||||
| | | | | | | | | | | | | | |
Net loss attributable to common stockholders |
$ | (15,681 | ) | $ | (19,512 | ) | $ | (128,040 | ) | $ | (59,916 | ) | |
| | | | | | | | | | | | | | |
| | | | | | | | | | | | | | |
| | | | | | | | | | | | | | |
Weighted average outstanding common shares |
67,827,401 | 69,721,078 | 138,895,681 | 150,569,877 | |||||||||
Earnings per share: |
|||||||||||||
Basic and diluted |
$ | (0.23 | ) | $ | (0.28 | ) | $ | (0.92 | ) | $ | (0.40 | ) | |
109
| |
Q1 2016 | Q2 2016 | Q3 2016 | Q4 2016 | |||||||||
|---|---|---|---|---|---|---|---|---|---|---|---|---|---|
Revenue |
$ | 199,690 | $ | 191,464 | $ | 186,373 | $ | 212,399 | |||||
Cost of revenue (exclusive of depreciation and amortization) |
133,343 | 122,577 | 121,780 | 141,421 | |||||||||
Selling, general and administrative expenses |
31,028 | 33,528 | 30,829 | 35,052 | |||||||||
Depreciation and amortization |
18,759 | 20,943 | 18,761 | 21,176 | |||||||||
Related party expense |
2,335 | 2,589 | 2,448 | 3,121 | |||||||||
| | | | | | | | | | | | | | |
Operating income (loss) |
14,225 | 11,827 | 12,555 | 11,629 | |||||||||
Other expense (income), net: |
|||||||||||||
Interest expense, net |
27,400 | 26,913 | 27,399 | 27,702 | |||||||||
Sundry expense (income), net |
(1,931 | ) | 1,503 | 711 | 429 | ||||||||
| | | | | | | | | | | | | | |
Net loss before income taxes |
(11,244 | ) | (16,589 | ) | (15,555 | ) | (16,502 | ) | |||||
Income tax benefit |
3,082 |
3,130 |
3,757 |
1,818 |
|||||||||
| | | | | | | | | | | | | | |
Net loss |
(8,162 | ) | (13,459 | ) | (11,798 | ) | (14,684 | ) | |||||
| | | | | | | | | | | | | | |
| | | | | | | | | | | | | | |
| | | | | | | | | | | | | | |
Net loss attributable to common stockholders |
$ | (8,162 | ) | $ | (13,459 | ) | $ | (11,798 | ) | $ | (14,684 | ) | |
| | | | | | | | | | | | | | |
| | | | | | | | | | | | | | |
| | | | | | | | | | | | | | |
Weighted average outstanding common shares |
64,024,557 | 64,024,557 | 64,024,557 | 64,024,557 | |||||||||
Earnings per share: |
— | ||||||||||||
Basic and diluted |
$ | (0.13 | ) | $ | (0.21 | ) | $ | (0.18 | ) | $ | (0.23 | ) | |
110
ITEM 9. CHANGES IN AND DISAGREEMENTS WITH ACCOUNTANTS ON ACCOUNTING AND FINANCIAL DISCLOSURE
None.
ITEM 9A. CONTROLS AND PROCEDURES
Evaluation of Disclosure Controls and Procedures
Our management, with the participation of our Chief Executive Officer and Chief Financial Officer, evaluated the effectiveness of our disclosure controls and procedures, as defined by Rules 13a-15(e) and 15d-15(e) under the Exchange Act, as of December 31, 2017. Based on the evaluation of our disclosure controls and procedures, our Chief Executive Officer and Chief Financial Officer concluded that our disclosure controls and procedures were not effective as of December 31, 2017 due to a material weakness in its internal control over financial reporting described below.
Notwithstanding the material weaknesses, management believes the consolidated financial statements included in this Annual Report on Form 10-K present fairly, in all material respects, the Company's financial condition, results of operations and cash flows at and for the periods presented in accordance with U.S. generally accepted accounting principles.
Management's Report on Internal Controls Over Financial Reporting
This Annual Report on Form 10-K does not include a report of management's assessment regarding internal control over financial reporting or an attestation report of our registered public accounting firm due to a transition period established by rules of the SEC for newly public companies.
Previously Identified Material Weaknesses in Internal Control over Financial Reporting
For the year ended December 31, 2016, we identified and disclosed material weaknesses in SourceHOV's internal controls over financial reporting with respect to (i) deficiencies in the financial statement close process, including appropriate levels of review and (ii) the lack of formal policies and procedures and related controls related to the evaluation of goodwill for impairment and the supervision of specialists engaged to assist management in making the necessary fair value estimates involved in the impairment analysis. To remediate the material weakness described in (i) above, we designed and implemented controls and enhanced and revised the design of existing controls and procedures and properly addressed that material weakness. For the material weakness described in (ii) above, management has not adequately addressed the supervision of specialists engaged to assist management in developing accounting conclusions with respect to a specific revenue contract and stock-based compensation accounting. As a result, for the year ended December 31, 2017, a material weaknesses in internal controls over financial reporting continues to exist.
Changes in Internal Control over Financial Reporting
Except as noted above, there were no changes in the Company's internal control over financial reporting identified during the fourth quarter of 2017 that materially affected, or are reasonably likely to materially affect, our internal control over financial reporting.
None.
111
ITEM 10. DIRECTORS, EXECUTIVE OFFICERS AND CORPORATE GOVERNANCE
Directors and Executive Officers
Our current directors and executive officers are as follows:
Name
|
Age | Position | |||
|---|---|---|---|---|---|
| Par Chadha | 62 | Chairman of the Board | |||
Ronald Cogburn |
62 |
Chief Executive Officer |
|||
Jim Reynolds |
49 |
Chief Financial Officer |
|||
Matthew H. Nord |
38 |
Director |
|||
Joshua M. Black |
31 |
Director |
|||
Nathaniel J. Lipman |
53 |
Director |
|||
Gordon J. Coburn |
54 |
Director |
|||
John H. Rexford |
61 |
Director |
|||
Suresh Yannamani |
52 |
President |
|||
Mark Fairchild |
58 |
President, Exela Enterprise Solutions |
|||
Shrikant Sortur |
45 |
Executive Vice President, Global Finance |
|||
Par Chadha is the Chairman of our board of directors and is the founder, Chief Executive Officer and Chief Investment Officer of HGM, a family office, formed in 2001, and the principal stockholder of SourceHOV immediately prior to the Business Combination on July 12, 2017. Mr. Chadha also served as Chairman of SourceHOV from 2011 until the closing of the Business Combination. Mr. Chadha brings over 40 years of experience in building businesses in the Americas, Europe and Asia, including execution of mergers and acquisitions, integration of businesses and public offerings. Mr. Chadha is co-founder and owner of Rule 14, LLC, a leading big data mining and automation company formed in 2011, and during his career, Mr. Chadha has founded or co-founded other technology companies in the fields of metro optical networks, systems-on-silicon and communications. Through HGM, Mr. Chadha previously participated in director and executive roles in joint ventures with major financial and investment institutions, including Apollo, as well as other portfolio companies of HGM, and currently holds and manages investments in evolving financial technology, health technology and communications industries. Since 2005, Mr. Chadha has served as a Director of HOV Services Limited, a company listed on the National Stock exchange of India, acting as its Chairman from 2009 to 2011. Mr. Chadha holds a B.S. in electrical engineering from Punjab Engineering College, India.
We believe Mr. Chadha's significant experience in the public information technology and business services industry and his experience with mergers and integration of businesses make him well-qualified to serve as a director of Exela.
Ronald Cogburn is our Chief Executive Officer and served as Chief Executive Officer of SourceHOV from 2013 until the closing of the Business Combination. Mr. Cogburn has been part of companies that were predecessors to SourceHOV since 1993, bringing over 30 years of diversified experience in executive management, construction claims consulting, litigation support, program management project management, cost estimating, damages assessment and general building construction. Mr. Cogburn has also been the President of Meridian Consulting Group, LLC since January 1998 and a principal of HGM since 2003. Prior to his role as Chief Executive Officer of
112
SourceHOV, Mr. Cogburn was SourceHOV's President, KPO from March 2011 to July 2013. Prior to this role, Mr. Cogburn was the President of HOV Services, LLC from January 2005 to September 2007, providing executive leadership during the company's growth to its IPO on the India Stock Exchange in September 2006. Mr. Cogburn has a BSCE in Structural Design/Construction Management from Texas A&M University and is a registered Professional Engineer.
We believe that Mr. Cogburn's significant, diversified business experience in Exela's industry make him well-qualified to serve as a director of Exela.
Jim Reynolds is our Chief Financial Officer and has served in that role since the closing of the Business Combination. Mr. Reynolds served as Co-Chairman of SourceHOV from 2014 until the closing of the Business Combination in 2017. Mr. Reynolds is also the Chief Operating Officer and a Partner at HGM, bringing over 25 years of industry experience to the team. Prior to HGM Mr. Reynolds held numerous executive management or senior advisory positions at SourceHOV and its related subsidiaries and predecessor companies, including serving as Chief Financial Officer for HOV Services, LLC from 2007 to 2011 and Vice President and Corporate Controller for Lason from 2001 to 2006. Mr. Reynolds was a Senior Manager in the Business Advisory Services Practice at PricewaterhouseCoopers from 1990 to 2001. Mr. Reynolds is a C.P.A. and holds a B.S. in Accounting from Michigan State University.
We believe that Mr. Reynold's significant industry and management experience make him well-qualified to serve as a director of the Company.
Matthew H. Nord is a Senior Partner of Apollo, where he has been employed since 2003. From 2001 to 2003, Mr. Nord was a member of the Investment Banking division of Salomon Smith Barney Inc. Mr. Nord serves on the boards of directors of Presidio, Inc., The ADT Corporation, and Mt. Olympus Holdings, Inc., DSB Parent, L.P. Mr. Nord also serves on the Board of Trustees of Montefiore Health System and on the Board of Overseers of the University of Pennsylvania's School of Design. Mr. Nord served as a Director of Novitex from July 2013 until the closing of the Business Combination. Mr. Nord graduated summa cum laude with a B.S. in Economics from the Wharton School of the University of Pennsylvania.
We believe that Mr. Nord's work at Apollo and his prior experience in investment banking and analyzing, financing and investing in public and private companies, makes him well-qualified to serve as a director of Exela.
Joshua M. Black is a Principal of Apollo, where he has been employed since 2011. From 2010 to 2011, Mr. Black was a member of the Leveraged Finance Group of Goldman, Sachs & Co. From 2008 to 2010, Mr. Black was a member of the Financial Institutions Group within the Investment Banking Division of Goldman, Sachs & Co. Mr. Black has served as a director of Environmental Solutions Worldwide, Inc., a public company, from January 2011 to March 2015 and Athene USA Corporation from October 1, 2013 to January 22, 2015. Mr. Black graduated cum laude with a B.A. in Religion from Princeton University.
We believe Mr. Black's significant investment and financial expertise make him well-qualified to serve as a director of Exela.
Nathaniel J. Lipman has held numerous executive management or senior advisory positions in Affinion Group Holdings, Inc., a public company that provides customer engagement and loyalty solutions, and/or its predecessors and subsidiaries, including serving as its Chief Executive Officer from 2005 to 2012 and Executive Chairman of the board of directors from 2012 to November 2015. Since November 2015, Mr. Lipman has served as a consultant to Affinion Group Holdings, Inc. Since December 2015, Mr. Lipman has served as a Special Advisor to the Chairman of the Upside Travel Group, Inc., a business travel company, where he was a founding member of the Board of Managers. From 1996 to 1999, Mr. Lipman served as Senior Executive Vice President, Corporate Development
113
and Strategic Planning for Planet Hollywood International, Inc., an entertainment and restaurant company. Prior to his tenure at Planet Hollywood, Mr. Lipman was Senior Vice President and General Counsel of House of Blues Entertainment, Inc., an entertainment and restaurant company, Senior Corporate Counsel at The Walt Disney Company, a diversified worldwide entertainment company, and a corporate associate at Skadden, Arps, Slate, Meagher and Flom, LLP. Mr. Lipman serves on the board of directors of Trusted Media Brands, Inc., Diamond Resorts International, Walker Innovations, Inc. and Redbox Automated Holdings, LLC. During the past five years, Mr. Lipman has also served as a director of EVERTEC, Inc. from September 2010 to April 2013 and Walker Digital Holdings, LLC from May 2013 to September 2013. Mr. Lipman also previously served as a director of Netmarket Group, Inc. Mr. Lipman received a Bachelor of Arts in Political Economy of Industrial Societies from the University of California, Berkeley and a J.D. from UCLA School of Law.
We believe that Mr. Lipman's significant experience and numerous directorships make him well-qualified to serve as a director of Exela.
Gordon J. Coburn is an Operating Executive for the Carlyle Group, which he joined in December 2017. He has also served as the Executive Chairman of ZeroChaos, LLC since August 2017. Mr. Coburn previously held numerous executive management positions in Cognizant Technology Solutions Corporation, a professional services company, from 1998 to 2016, including serving as President from 2012 to 2016, Chief Operating Officer from 2007 to 2012, Chief Financial Officer and Treasurer from 1998 to 2012, Executive Vice President from 2003 to 2006 and Senior Vice President from 1999 to 2003. Mr. Coburn has served as a director of ProKarm, Inc. since February 2018. Mr. Coburn has also served as a director of CEB Inc. from 2007 until its acquisition in April 2017, director of US2020 from 2013 to 2015, director of TechAmerica from 2009 to 2013, director of ICT Group, Inc. from 2005 until its acquisition in 2010 and director of Information Technology Association of America from 2005 to 2008. Mr. Coburn holds a Bachelor of Arts degree from Wesleyan University and a Master of Business Administration degree from the Amos Tuck School at Dartmouth College, where he serves as a member of its MBA Advisory Board.
We believe that Mr. Coburn's experience as a director and as an officer of a major public information technology and business services firm make him well-qualified to serve as a director of Exela.
John H. Rexford is the Managing Director of Ramona Park Consulting LLC, which he founded in 2016. Mr. Rexford has over 36 years of finance experience that includes serving as Global M&A Head from 2010 to 2015 at the Xerox Corporation and serving in various positions at Affiliated Computer Services, Inc. (which was acquired by the Xerox Corporation), including Chief Financial Officer from 2006 to 2007, Executive Vice President from 2001 to 2009 and Senior Vice President of Mergers and Acquisitions from 1996 to 2001. Mr. Rexford received a Bachelor of Business Administration from Southern Methodist University and a MBA from SMU Cox School of Business.
We believe that Mr. Rexford's prior experiences give him an understanding of the business models, structures and attributes of Exela, as well as the risks and operating environment of Exela, which make him well-qualified to serve as a director of Exela.
Suresh Yannamani is our President and served as President, Americas of SourceHOV from 2011 until the closing of the Business Combination, and was been a part of companies that were predecessors to SourceHOV from 1997 until the closing of the Business Combination. Mr. Yannamani oversees the region's sales and operations and plays a large part in scaling the transaction processing solutions practice and enterprise solution strategy for healthcare, financial services and commercial industries. Mr. Yannamani was also President of HOV Services, LLC from 2007 to 2011, serving customers in the healthcare, financial services, insurance and commercial industries. Mr. Yannamani was the Executive Vice President of BPO services for Lason, which was subsequently acquired by HOV Services, LLC from 1997 to 2007. Mr. Yannamani also served in management roles at IBM from 1995
114
to 1997, managing the design, development, and implementation of financial management information systems for the Public Sector and worked for Coopers & Lybrand as a consultant in public audits from 1992 to 1994. Mr. Yannamani has a bachelor's degree in Chemistry from the University of London and holds an MBA from Eastern Michigan University.
Mark Fairchild is our President, Exela Enterprise Solutions and served as President, Europe, of SourceHOV from the merger of BancTec and SourceHOV in 2014, having served in management roles at BancTec since 1985. With more than 30 years of executive experience in the financial services industry, Mr. Fairchild specializes in global account management, transaction processing services, software solutions & hardware technology products. In 2005, Mr. Fairchild was appointed Chief Technology Officer of BancTec and was responsible for the company's software and hardware products, manufacturing and internal IT services until 2014. Prior to this role, Mr. Fairchild acted as Vice President for International Operations from 2001 to 2005 and VP of European Operations from 1998 to 2001. In his role as International Systems Director from 1991 to 1998, Mr. Fairchild led the European software teams, implementing payment platforms throughout the region. As Director of Engineering of BancTec from 1989 to 1991, Mr. Fairchild led the research and development team that introduced a new high-speed digital image processing system that formed the base of BancTec's ImageFIRST product portfolio. Mr. Fairchild joined BancTec as a Project Manager, a position he held from 1985 to 1986. He began his career as a software developer at British Aerospace, where he worked from 1981 to 1985. Mr. Fairchild graduated with honors from Manchester University with a bachelor's degree in aeronautical engineering and an MBA from London Business School.
Shrikant Sortur is our Executive Vice President, Global Finance and served as Senior Vice President, Global Finance of SourceHOV from 2016 until the closing of the Business Combination. He was responsible for SourceHOV's finance and accounting groups, a role in which he leads financial operations, activities, plans and budgets. Mr. Sortur's career spans more than 19 years of varied experience in financial management, accounting, reporting, and lean operations. Mr. Sortur served in management roles in predecessor companies to SourceHOV from 2002 until the closing of the Business Combination. Mr. Sortur also acted as Vice President of Finance of SoureHOV from June 2015 to May 2016. Mr. Sortur acted as Director of Financial Planning and Analysis, TPS from January 2014 to June 2015. Prior to this role, Mr. Sortur was the Director of Financial Planning and Analysis, North America Operations from January 2012 to December 2013. Mr. Sortur acted as Controller for HOV Global from January 2009 to December 2011. Mr. Sortur was a Senior Accounting Manager for HOV Services, LLC / Lason, Inc. from May 2004 to December 2008 and worked for the SourceHOV group as a Manager, Finance & Accounts for Lason India Ltd. from December 2002 to May 2014. From March 1999 to December 2002, Mr. Sortur served as General Manager, Finance at SRM Technologies, a business solutions and technology provider specializing in software design and development, systems integration, web services, enterprise mobilization, and embedded solutions development. From June 1997 to February 1999, Mr. Sortur served as Junior Manager, Finance and Accounting for Steel Authority of India, a large state-owned steel making company based in New Delhi, India. Mr. Sortur graduated from Osmania University with a bachelor's degree in accounting and is a Certified Public Accountant (CPA), Chartered Accountant (CA), and Certified Management Accountant (CMA).
ITEM 11. EXECUTIVE COMPENSATION
Compensation Discussion and Analysis
Executive Compensation Program Overview
Prior to the close of the Business Combination, SourceHOV maintained an executive compensation program that was aimed at attracting, motivating and rewarding executives for exceeding financial performance expectations and enhancing shareholder value. The program primarily consisted of a base salary, discretionary cash bonuses, and equity-based long-term incentive awards. The
115
compensation committee of our board of directors, or the compensation committee, did not engage outside advisors to assist with its review or administration of our executive compensation program and instead decided to maintain SourceHOV's existing executive compensation program during the portion of the 2017 calendar year that followed the close of the Business Combination.
In 2018, the compensation committee engaged Willis Towers Watson to assist with its review of our executive compensation program. With the assistance of Willis Towers Watson, the compensation committee expects to develop and implement a new executive compensation program during 2018 that is market competitive, supports the achievement of short-term financial and operational performance, aligns the interests of our named executive officers with those of our stockholders, and allows us to successfully attract and retain the talent needed to continue to grow and successfully execute our business strategy.
This discussion summarizes material aspects of our executive compensation program during 2017 for our named executive officers which consisted of the following executive officers:
- •
- Ronald C. Cogburn, Chief Executive Officer
- •
- Jim Reynolds, Chief Financial Officer
- •
- Suresh Yannamani, President
- •
- Mark Fairchild, President, Exela Enterprise Solutions
- •
- Shrikant Sortur, Executive Vice President, Global Finance
Material Elements of our 2017 Executive Compensation Program
Salary
We generally provide our named executive officers a base salary to compensate them for their service in their respective roles. Salaries for 2017 for our named executive officers (other than Messrs. Reynolds and Sortur) remained the same before and after the close of the Business Combination. On January 25, 2018, the compensation committee approved a base salary for Mr. Reynolds equal to $325,000, with retroactive effect as of the consummation of the Business Combination, or July 12, 2017. Mr. Reynolds' base salary reflects the base salary earned by him with respect to service as our Chief Financial Officer following the Business Combination during 2017, which was paid to him in the form of a lump sum catch-up payment on February 16, 2018. Mr. Sortur's base salary was increased from $195,000 to $280,000, which became effective on October 1, 2017, in recognition of his expanded duties and responsibilities resulting from the Business Combination.
Cash Bonuses
Prior to the close of the Business Combination, SourceHOV's practice was to provide discretionary bonuses to certain of our named executive officers. The objective of the cash bonuses was to recognize the named executive officer for his contributions to the achievement of various key short-term performance indicators. Factors that were considered in making these bonus payments included performance relative to revenue projections, EBITDA levels and margin, and cost savings initiatives. Bonuses have historically been paid in equal installments on each pay period during the calendar year following the calendar year of performance (for example, 2016 bonuses were paid in equal installments during 2017), subject to continued employment through each applicable payroll date.
116
The table below details the aggregate bonuses paid to each of our named executive officers during 2017 for performance during the 2016 calendar year.
Executive
|
2016 Bonus | |||
|---|---|---|---|---|
Ronald C. Cogburn |
$ | 300,000 | ||
Jim Reynolds |
— | |||
Suresh Yannamani |
$ | 300,000 | ||
Mark Fairchild |
— | |||
Shrikant Sortur |
$ | 66,667 | ||
In lieu of bonuses for performance during the 2017 calendar year, our named executive officers (other than Mr. Reynolds) have received, and are eligible to receive, the transaction bonuses described below.
Transaction Bonuses
Each of Messrs. Cogburn, Yannamani, Fairchild and Sortur received a portion of, and is eligible to receive the remaining portion of, a cash transaction bonus in partial consideration for their efforts in connection with the Business Combination. Receipt of the transaction bonus payments by each of Messrs. Cogburn, Yannamani, Fairchild and Sortur was and is contingent on the applicable executive remaining continuously employed by the Company and its subsidiaries through the applicable payment date. The table below details the transaction bonuses payable to our named executive officers.
Executive
|
Transaction Bonus |
|||
|---|---|---|---|---|
Ronald C. Cogburn |
$ | 350,000 | (1) | |
Jim Reynolds |
— | |||
Suresh Yannamani |
$ | 450,000 | (2) | |
Mark Fairchild |
$ | 200,000 | (3) | |
Shrikant Sortur |
$ | 200,000 | (4) | |
- (1)
- Mr. Cogburn's
transaction bonus was paid in $50,000 increments on each of January 5, 2018, January 19, 2018, February 2, 2018,
February 16, 2018 and March 2, 2018. Subject to his continuous employment with the Company and its subsidiaries, he will be paid the remaining two $50,000 increments on March 16,
2018 and March 30, 2018, respectively.
- (2)
- Mr. Yannamani's
transaction bonus was paid in $75,000 increments on each of January 12, 2018, January 26, 2018, February 9, 2018 and
February 23, 2018. Subject to his continuous employment with the Company and its subsidiaries, he will be paid the remaining two $75,000 increments on March 9, 2018 and March 23,
2018, respectively.
- (3)
- Mr. Fairchild's
transaction bonus was paid in approximately $33,333 increments on each of January 12, 2018, January 26, 2018, February 9,
2018 and February 23, 2018. Subject to his continuous employment with the Company and its subsidiaries, he will be paid the remaining two approximately $33,333 increments on March 9,
2018 and March 23, 2018, respectively.
- (4)
- Mr. Sortur's transaction bonus was paid in approximately $16,667 increments on each of October 27, 2017, November 9, 2017, November 24, 2017, December 8, 2017, December 22, 2017, January 5, 2018, January 19, 2018, February 2, 2018, February 16, 2018 and March 2, 2018. Subject to his continuous employment with the Company and its subsidiaries, he will be paid the remaining two approximately $16,667 increments on March 16, 2018 and March 30, 2018, respectively.
117
Because only a portion of the transaction bonus paid to Mr. Sortur was paid or earned in 2017, the remaining transaction bonuses are not included in the Summary Compensation Table in this filing.
Long-Term Incentives
On December 19, 2017, our board of directors adopted, our 2018 Stock Incentive Plan, or the Plan, which was subsequently approved on December 20, 2017 by the written consent of the holders of a majority of the shares of our Common Stock. The Plan became effective on January 17, 2018. The Plan, which is administered by the compensation committee, permits us to grant an aggregate of 8,323,764 shares of our Common Stock to eligible participants in the form of stock options, restricted stock awards, restricted stock units, stock appreciation rights, performance awards and other awards that may be settled in or based on our Common Stock. The compensation committee did not grant any awards under our Plan in 2017. As a part of the overall review of our executive compensation program, we anticipate making equity grants in the future to create alignment with our stockholders, motivate long-term value creation and retain our executives.
Prior to the Business Combination, long-term incentives were a key component of the executive compensation program. Our subsidiary, SourceHOV, maintained a long-term incentive compensation plan, the 2013 Long Term Incentive Plan or the 2013 Plan, pursuant to which certain of our named executive officers were previously granted restricted stock units. SourceHOV's objectives in granting equity-based awards was to retain executives, align our executives' interests with those of our shareholders, and provide an incentive to deliver long-term performance. In connection with the Business Combination, the 2013 Plan and all outstanding awards thereunder were assumed by Ex-Sigma LLC, or Ex-Sigma.
Ex-Sigma is a limited liability company that was formed to facilitate the raising of the funds necessary to consummate the Business Combination and is owned by the former equity holders of SourceHOV. Ex-Sigma, through its wholly-owned subsidiary Ex Sigma 2, LLC, or Ex Sigma 2, owns 84,912,500 shares of our Common Stock and 2,669,233 shares of our preferred stock (which presently are convertible into 3,263,473 shares of Common Stock). Those shares are pledged to secure certain financing incurred in connection with the Business Combination. Upon the repayment of such financing, it is anticipated that Ex-Sigma will distribute the shares of our preferred stock and Common Stock that it then owns to its members (including holders of restricted stock units) based on each member's proportionate ownership interest of Ex-Sigma at such time.
Upon the assumption of the 2013 Plan and awards thereunder by Ex-Sigma, each restricted stock unit granted pursuant to the 2013 Plan was converted into the right to receive a membership interest of Ex-Sigma, subject to the applicable vesting terms, which require, among other things, continued employment with us through the applicable vesting date. These awards generally vest ratably over three or four years based on an executive's continued employment. Given the anticipated Business Combination, no restricted stock units were granted to our named executive officers under the 2013 Plan in 2017.
Severance Benefits
Mr. Fairchild is a party to an employment agreement with our subsidiary, BancTec, Inc., which provides for certain payments to be made in connection with certain terminations of service, as described below. This employment agreement was in effect prior to the Business Combination and remains in effect currently in accordance with its terms. In addition, although we have not entered into written agreements providing Messrs. Cogburn, Reynolds, Yannamani or Sortur severance benefits, upon a termination of Messrs. Cogburn's, Reynolds', Yannamani's or Sortur's employment by us without cause, each of Messrs. Cogburn, Reynolds, Yannamani and Sortur would be entitled to severance benefits pursuant to SourceHOV's current severance policy equal to continued payment of
118
his base salary for a period of three weeks for each year of credited service with SourceHOV and its affiliates, up to a maximum of 16 weeks. As of December 31, 2017, Messrs. Cogburn, Reynolds, Yannamani and Sortur had 24, 1, 20 and 13 years of credited service with SourceHOV and its affiliates, respectively. The SourceHOV severance policy may be amended or terminated at our discretion at any time.
Health and Welfare Plans
Our named executive officers are eligible to participate in our employee benefit plans, including our medical, dental, vision, life, disability, health and dependent care flexible spending accounts and accidental death and dismemberment benefit plans, in each case on the same basis as all of our other employees. We do not provide any other supplemental benefits or perquisites to our named executive officers other than those that are provided to all our employees.
Retirement Plan
Our named executive officers are eligible to participate in our 401(k) retirement plan on the same basis as all of our other employees. The plan provides for a discretionary employer matching contribution; but we did not make any matching contributions with respect to the 2017 or 2016 plan years.
Other Compensation Policies and Practices
Insider Trading Policy
Our Insider Trading Policy provides that employees, including our executive officers and the members of our board of directors, are prohibited from engaging in transactions in our securities if such employee possesses material, non-public information about the Company. In addition, certain covered persons must advise our General Counsel before effectuating any transaction in our securities.
Stock Ownership Guidelines
On December 19, 2017, our board of directors adopted stock ownership guidelines for our Chief Executive Officer, Chief Financial Officer and our other executive officers who report directly to our Chief Executive Officer, which set the minimum ownership expectations for each such executive officer. The guidelines require that within five years after first becoming subject to the guidelines (which for our named executive officers occurred on December 19, 2017), our Chief Executive Officer, Chief Financial Officer and our other executive officers who report directly to our Chief Executive Officer, should own shares of our Common Stock with a value equal to six times his or her annual base salary, three times his or her annual base salary and one and one-half times his or her annual base salary, respectively. Half of the fair market value of the shares of our Common Stock underlying vested stock options (to the extent the fair market value exceeds the applicable exercise price) and vested but deferred restricted stock units are included when determining the executive officer's stock ownership. Shares underlying unvested restricted stock units are not counted towards determining the executive officers' stock ownership. To the extent an executive covered by the stock ownership guidelines is a member of Ex-Sigma, the executive is deemed to beneficially own a proportional share of the shares of our Common Stock held by Ex-Sigma. We believe that the stock ownership guidelines serve to further align the interests of our executive officers with the interests of our stockholders.
119
Report of the Compensation Committee
The compensation committee has reviewed and discussed with management the Compensation Discussion and Analysis set forth in this annual report on Form 10-K for the year ended December 31, 2017. Based on such review and discussions, the compensation committee recommended to the board of directors that the Compensation Discussion and Analysis be included in this annual report on Form 10-K for the year ended December 31, 2017.
Respectfully submitted, |
||
The Compensation Committee of the Board of Directors Nathaniel Lipman, Chair John Rexford Gordon J. Coburn |
120
Summary Compensation Table
The following table sets forth compensation information for our named executive officers for services performed for the Company and its subsidiaries for the fiscal year ended December 31, 2017, and for certain of our named executive officers, for the fiscal year ended December 31, 2016.
Name and principal position
|
Year | Salary ($) |
Bonus ($)(1) |
Stock Awards ($) |
Total ($) |
|||||||||||
|---|---|---|---|---|---|---|---|---|---|---|---|---|---|---|---|---|
Ronald C. Cogburn |
2017 | 325,000 | — | — | 325,000 | |||||||||||
Chief Executive Officer |
2016 | 325,000 | 300,000 | 120,000 | 745,000 | |||||||||||
Jim Reynolds |
2017 | 186,096 | (2) | — | — | — | ||||||||||
Chief Financial Officer |
||||||||||||||||
Suresh Yannamani |
2017 | 325,000 | — | 325,000 | ||||||||||||
President |
2016 | 325,000 | 300,000 | 120,000 | 745,000 | |||||||||||
Mark Fairchild |
2017 | 400,000 | — | — | 400,000 | |||||||||||
President, Exela Enterprise |
2016 | 400,000 | — | — | 400,000 | |||||||||||
Solutions |
||||||||||||||||
Shrikant Sortur |
2017 | 228,365 | 83,333 | — | 311,698 | |||||||||||
Executive Vice President, Global Finance |
||||||||||||||||
- (1)
- The
amounts reported in this column for 2016 reflect discretionary cash bonuses paid to certain of our named executive officers with respect to performance for
calendar year 2016, which bonuses were paid in equal installments on each regularly scheduled payroll date between January 6, 2017 and December 22, 2017 for Mr. Cogburn, and
between January 13 and December 29, 2017 for Mr. Yannamani.
- (2)
- On
January 25, 2018, our compensation committee approved a base salary for Mr. Reynolds equal to $325,000, with retroactive effect as of the
consummation of the Business Combination, or July 12, 2017. The amount reported in this column for Mr. Reynolds reflects the base salary earned by him with respect to service as our
Chief Financial Officer following the Business Combination during 2017, which was paid to him in the form of a lump sum catch-up payment on February 16, 2018.
- (3)
- The amount reported represents the portion of the cash transaction bonus payable to Mr. Sortur in partial consideration for his efforts in connection with the Business Combination that was paid in 2017.
Grant of Plan-Based Awards
None of our named executive officers were granted awards pursuant to any plan during the fiscal year ended December 31, 2017.
Narrative to Summary Compensation Table
Executive Employment Agreements
Certain of the compensation paid to Mr. Fairchild reflected in the summary compensation table was provided pursuant to an employment agreement with our subsidiary, BancTec, Inc. Mr. Fairchild is a party to an employment agreement, dated May 2007, with BancTec, Inc., which provides for an indefinite term. Pursuant to his employment agreement, Mr. Fairchild is entitled to an annual base salary, currently $400,000 and is eligible to earn a target annual bonus equal to up to 100% of his base salary.
We have not entered into employment agreements with Messrs. Cogburn, Reynolds, Yannamani or Sortur. For a discussion of the severance pay and other benefits to be provided to our named executive
121
officers in connection with a termination of employment and/or a change in control under arrangements (including Mr. Fairchild's employment agreement), please see "—Potential Payments Upon Termination or Change In Control" below.
Stock Plans, Health and Welfare Plans, and Retirement Plans
2018 Stock Incentive Plan.
On December 19, 2017, our board of directors adopted our 2018 Stock Incentive Plan, or the Plan, which was subsequently approved on December 20, 2017 by the written consent of the holders of a majority of the shares of our Common Stock, and became effective on January 17, 2018. The Plan is administered by the compensation committee of our board of directors. Under the Plan, the compensation committee may grant an aggregate of 8,323,764 shares of our Common Stock to eligible participants in the form of stock options, restricted stock awards, restricted stock units, stock appreciation rights, performance awards and other awards that may be settled in or based on our Common Stock. The compensation committee did not grant any awards under our Plan in 2017.
SourceHOV Long Term Incentive Plan.
Prior to the Business Combination, our subsidiary, SourceHOV, maintained the 2013 Long Term Incentive Plan, or the 2013 Plan. Certain of our named executive officers were granted restricted stock units pursuant to the 2013 Plan. In connection with the Business Combination, the 2013 Plan was assigned to, and assumed by, Ex-Sigma LLC, or Ex-Sigma, and all awards outstanding under the 2013 Plan were transferred to, and assumed by, Ex-Sigma. Upon such assumption, each restricted stock unit granted pursuant to the 2013 Plan was converted into the right to receive a membership interest of Ex-Sigma, subject to the applicable vesting terms, which require, among other things, continued employment with us through the applicable vesting date. For a summary of the vesting terms applicable to the restricted stock units granted to our named executive officers, see "—Outstanding Equity Awards at Fiscal Year End" below.
Ex-Sigma is a limited liability company that was formed to facilitate the raising of the funds necessary to consummate the Business Combination and is owned by the former equity holders of SourceHOV. Ex-Sigma, through its wholly-owned subsidiary Ex Sigma 2, LLC ("Ex Sigma 2"), owns 84,912,500 shares of our Common Stock and 2,669,233 shares of our preferred stock (which presently are convertible into 3,263,473 shares of Common Stock). Those shares are pledged to secure certain financing incurred in connection with the Business Combination. Upon the repayment of such financing, it is anticipated that Ex-Sigma will distribute the shares of our preferred stock and Common Stock that it then owns to its members (including holders of restricted stock units) based on each member's proportionate ownership interest of Ex-Sigma at such time.
Health and Welfare Plans.
Our named executive officers are eligible to participate in our employee benefit plans, including our medical, dental, vision, life, disability, health and dependent care flexible spending accounts and accidental death and dismemberment benefit plans, in each case on the same basis as all of our other employees.
Retirement Plan.
We sponsor a retirement plan intended to qualify for favorable tax treatment under Section 401(a) of the Internal Revenue Code of 1986, as amended, or the Code, containing a cash or deferred feature that is intended to meet the requirements of Section 401(k) of the Code. Employees who meet the eligibility requirements may make pre-tax contributions to the plan from their eligible earnings up to the statutorily prescribed annual limit on pre-tax contributions under the Code. Participants who are
122
50 years of age or older may contribute additional amounts based on the statutory limits for catch-up contributions. All employee and employer contributions are allocated to each participant's individual account and are then invested in selected investment alternatives according to the participant's directions. Pre-tax contributions by participants and contributions that we make to the plan and the income earned on those contributions are generally not taxable to participants until withdrawn, and all contributions are generally deductible by us when made. Participant contributions are held in trust as required by law. No minimum benefit is provided under the plan. An employee is 100% vested in his or her pre-tax deferrals when contributed and any employer contributions ratably over four years. The plan provides for a discretionary employer matching contribution, however, we currently do not make any matching contributions to the plan and did not make any matching contributions with respect to the 2017 or 2016 plan years.
Outstanding Equity Awards at Fiscal Year End
The following table contains information regarding outstanding equity awards of Ex-Sigma held by our named executive officers as of December 31, 2017.
| |
|
Stock awards(1) | ||||||||
|---|---|---|---|---|---|---|---|---|---|---|
Name
|
Grant date | Number of shares or units of stock that have not vested |
Market Value of shares or units of stock that have not vested ($)(4) |
|||||||
Ronald C. Cogburn |
April 30, 2015 | (2) | 475 | 676,638 | ||||||
Ronald C. Cogburn |
April 29, 2016 | (3) | 100 | 142,450 | ||||||
Suresh Yannamani |
April 30, 2015 | (2) | 25 | 35,613 | ||||||
Suresh Yannamani |
April 29, 2016 | (3) | 100 | 142,450 | ||||||
Mark Fairchild |
April 30, 2015 | (2) | 138 | 196,581 | ||||||
Shrikant Sortur |
April 29, 2016 | (3) | 100 | 142,450 | ||||||
- (1)
- Stock
awards represent restricted stock units in Ex-Sigma. Ex-Sigma, through its wholly-owned subsidiary Ex Sigma 2, owns 84,912,500 shares of our Common Stock and
2,669,233 shares of our preferred stock (which presently are convertible into 3,263,473 shares of Common Stock). Those shares are pledged to secure certain financing incurred in connection with the
Business Combination. Upon the repayment of such financing, it is anticipated that Ex-Sigma will distribute the shares of our preferred stock and Common Stock that it then owns to its members
(including holders of restricted stock units) based on each member's proportionate ownership interest of Ex-Sigma at such time.
- (2)
- The
restricted units are subject to the following vesting schedule: one-fourth of the restricted stock units vest on each of the first four anniversaries of the
vesting commencement date, or April 30, 2015, subject to continued employment with us through such date. In addition, if the grantee's employment is terminated without cause (other than as a
result of death or disability) following the occurrence of a change in control of Ex-Sigma, all unvested restricted stock units will immediately vest.
- (3)
- The Restricted stock units are subject to the following vesting schedule: one-third of the restricted stock units vest on each of the first three anniversaries of the vesting commencement date, or April 29, 2016, subject to continued employment with us through such date. In addition, if the grantee's employment is terminated without cause (other than as a result of death or disability) following the occurrence of a change in control of Ex-Sigma, all unvested restricted stock units will immediately vest.
123
- (4)
- The amounts disclosed in this column represent the value of the membership interests underlying each restricted stock unit that had not vested as of December 31, 2017, based on each member's (including each holder of restricted stock units) proportionate ownership of Ex-Sigma at such time and the closing price of our Common Stock on December 29, 2017, or $5.15, which was the final day in the fiscal year ended December 31, 2017 on which our Common Stock was traded.
Option Exercises and Stock Vested Table
The following table sets forth information concerning the vesting of stock awards in Ex-Sigma held by our named executive officers during the fiscal year ended December 31, 2017.
| |
Stock Awards | ||||||
|---|---|---|---|---|---|---|---|
Name
|
Number of Shares Acquired on Vesting (#) |
Value Realized on Vesting ($)(1)(2) |
|||||
Ronald C. Cogburn |
627 | 1,003,200 | |||||
Suresh Yannamani |
402 | 643,200 | |||||
Mark Fairchild |
69 | 110,400 | |||||
Shrikant Sortur |
50 | 80,000 | |||||
- (1)
- Settlement
of each of the restricted stock units that vested during 2017 is deferred pursuant to the terms of the applicable agreement until the earlier to occur of
(x) the fifth anniversary of the applicable date of grant, and (y) a change in control of Ex-Sigma. All restricted stock units noted in the table above for each named executive officer
vested during fiscal year 2017, but the underlying membership interests of Ex-Sigma were not delivered to or acquired by the executive as of the end of fiscal year 2017.
- (2)
- The amounts reported in this column represent the value of the Ex-Sigma membership interests underlying the applicable restricted stock unit at the time the restricted stock units vested in accordance with their terms. Each relevant vesting event during 2017 occurred prior to the consummation of the Business Combination, at which time each share of SourceHOV Common Stock had a fair market value of $1,600 per share. Each restricted stock unit currently represents the right to receive a membership interest in Ex-Sigma. Ex-Sigma, through its wholly-owned subsidiary Ex Sigma 2, owns 84,912,500 shares of our Common Stock and 2,669,233 shares of our preferred stock (which presently are convertible into 3,263,473 shares of Common Stock). Those shares are pledged to secure certain financing incurred in connection with the Business Combination. Upon the repayment of such financing, it is anticipated that Ex-Sigma will distribute the shares of our preferred stock and Common Stock that it then owns to its members (including holders of restricted stock units) based on each member's proportionate ownership interest of Ex-Sigma at such time.
124
Non-Qualified Deferred Compensation
The following table sets forth information for our named executive officers with respect to Ex-Sigma restricted stock units held by our named executive officers as of December 31, 2017 that were vested but for which the underlying Ex-Sigma membership interests had not yet been delivered to the executive due to a deferral required by the applicable award agreements.
Name
|
Executive Contributions in Fiscal Year 2017 ($)(1) |
Aggregate Earnings in Fiscal Year 2017 ($)(2) |
Aggregate Withdrawals/ Distributions ($) |
Aggregate Balance at 2017 Fiscal Year End ($)(3) |
|||||||||
|---|---|---|---|---|---|---|---|---|---|---|---|---|---|
Ronald C. Cogburn |
1,003,200 | (330,116 | ) | — | 2,679,485 | ||||||||
Suresh Yannamani |
643,200 | (251,141 | ) | — | 2,038,460 | ||||||||
Mark Fairchild |
110,400 | (24,131 | ) | — | 195,157 | ||||||||
Shrikant Sortur |
80,000 | (8,775 | ) | — | 71,225 | ||||||||
- (1)
- The
amounts reported in this column represent the value of the Ex-Sigma membership interests underlying the applicable restricted stock unit that vested during 2017
as reported in the Option Exercises and Stock Vested Table above. All membership interests underlying the deferred restricted stock unit awards will be
released to Messrs. Cogburn, Yannamani, Fairchild, and Sortur, upon the earlier to occur of (x) the fifth anniversary of the applicable date of grant, and (y) a change in control
of Ex-Sigma LLC.
- (2)
- Represents
the change in market value of the membership interests underlying the deferred restricted stock units held by the executives as of the last day of fiscal
year 2017, calculated as the difference between: (a) the value of the restricted stock units on the applicable vesting date (for restricted stock units vesting during fiscal year 2017) (at
which time each share of SourceHOV Common Stock had a fair market value of $1,600 per share), or the first day of fiscal year 2017 (for restricted stock units that vested during prior fiscal years)
(at which time each share of SourceHOV Common Stock had a fair market value of $1,600 per share), and (b) the value on December 31, 2017, the last day of fiscal year 2017 (at which time
each Ex-Sigma membership interest had a fair market value of $1,424.50). No additional earnings (either in the form of accrued dividends or dividend equivalents) are paid or accrued on deferred
restricted stock units.
- (3)
- The amounts disclosed in this column represent the value of the membership interests underlying each deferred restricted stock unit as of December 31, 2017, based on each member's (including each holder of restricted stock units) proportionate ownership of Ex-Sigma at such time and the closing price of our Common Stock on December 29, 2017, or $5.15, which was the final day in the fiscal year ended December 31, 2017 on which our Common Stock was traded.
Pension Benefits
None of our named executive officers participates in or has account balances in qualified or non-qualified defined benefit plans sponsored by us.
Potential Payments Upon Termination or Change in Control
The following summaries describe the potential payments and benefits that we would provide to our named executive officers in connection with a termination of employment and/or a change in control.
125
Severance Benefits
Mr. Fairchild's employment agreement provides for certain payments to be made in connection with certain terminations of service, as further described below. In addition, although we have not entered into written agreements providing Messrs. Cogburn, Reynolds, Yannamani or Sortur severance benefits, upon a termination of Messrs. Cogburn, Reynolds, Yannamani or Sortur's employment by us without cause, each of Messrs. Cogburn, Reynolds, Yannamani and Sortur would be eligible for severance benefits pursuant to SourceHOV's current severance policy equal to continued payment of his base salary for a period of three weeks for each year of service, up to a maximum of 16 weeks. The SourceHOV severance policy may be amended or terminated at any time in our sole discretion.
Mark Fairchild. In the event that Mr. Fairchild's employment is terminated either by BancTec, Inc. without "cause" or by him for "good reason," subject to the his execution of a release of claims, Mr. Fairchild would be entitled to: (i) one years' base salary and one times his target annual bonus; (ii) payment of the employee and employer portion of his COBRA premiums until the earlier of 18 months following such termination and when he is employed by an employer who offers welfare benefits; and (iii) immediate vesting of all outstanding equity awards. In the event Mr. Fairchild's employment is terminated either by BancTec, Inc. without "cause" at the request of any third party in connection with a "change in control" or by him for "good reason," within one year following a "change in control," in addition to the severance benefits described in the previous sentence, he would also be entitled to a pro-rated bonus for the year of termination.
In the event any payments paid pursuant Mr. Fairchild's employment agreement are subject to an excise tax under Section 4999 of the Code, or any similar tax that may be imposed, he is entitled to an additional gross-up payment such that the net amount retained by him equals the amount he would have been entitled to had no such tax been imposed on the payments. Following any termination of employment, Mr. Fairchild is subject to a non-solicit of employees and customers for a period of one-year following his termination.
Vesting and Settlement of Outstanding Equity Awards
Each of Messrs. Cogburn, Yannamani, Fairchild and Sortur hold restricted stock units, which represent the right to receive membership interests in Ex-Sigma. Ex-Sigma, through its wholly-owned subsidiary Ex Sigma 2, owns 84,912,500 shares of our Common Stock and 2,669,233 shares of our preferred stock (which presently are convertible into 3,263,473 shares of Common Stock). Those shares are pledged to secure certain financing incurred in connection with the Business Combination. Upon the repayment of such financing, it is anticipated that Ex-Sigma will distribute the shares of our preferred stock and Common Stock that it then owns to its members (including holders of restricted stock units) based on each member's proportionate ownership interest of Ex-Sigma at such time.
The vesting and settlement of each of Messrs. Cogburn, Yannamani, Fairchild and Sortur's restricted stock units will be accelerated in certain instances upon or following a change in control of Ex-Sigma. With respect to the restricted stock units granted to each of Messrs. Cogburn and Yannamani on November 6, 2013, all of the restricted stock units underlying such grants are currently vested and such restricted stock units will be settled on the earlier of (i) the occurrence of a change in control of Ex-Sigma, and (ii) the fifth anniversary of the date of grant.
All of the then unvested restricted stock units granted to each of Messrs. Cogburn, Yannamani and Fairchild on April 30, 2015 and to Messrs. Cogburn, Yannamani and Sortur on April 29, 2016 will vest if, following the occurrence of a change in control of Ex-Sigma, the grantee's employment with us and our subsidiaries is terminated without cause (other than as a result of death or disability). In addition, such restricted stock units will be settled on the earlier of (i) the occurrence of a change in control of Ex-Sigma, and (ii) the fifth anniversary of the date of grant; provided, that, following a change in control of Ex-Sigma, each restricted stock unit that is not vested as of the date of such change in
126
control will be settled on the earlier to occur of (i) the date on which such restricted stock unit vests (disregarding any accelerated vesting on account of a termination without cause), and (ii) if the grantee's employment is terminated without cause (other than as a result of the grantee's death or disability) within two years following the occurrence of such change in control of Ex-Sigma, the date of such termination.
The table below reflects the amount of compensation and benefits payable to each named executive officer in the event of (i) an involuntary termination without "cause" or, with respect to Mr. Fairchild, a resignation for "good reason" and (ii) an involuntary termination without "cause" following a change in control. The amounts shown assume that the applicable triggering event occurred on December 31, 2017, and therefore are estimates of the amounts that would be paid to the named executive officers upon the occurrence of such triggering event.
| |
|
Triggering Event | |||||||
|---|---|---|---|---|---|---|---|---|---|
Name
|
Type of Payment | Involuntary Termination ($) |
Involuntary Termination following a Change in Control ($) |
||||||
Ronald C. Cogburn |
Cash severance | 100,000 | (1) | 100,000 | (1) | ||||
|
Benefit continuation | — | — | ||||||
|
Equity acceleration | — | 819,088 | (3) | |||||
|
TOTAL | 100,000 | 919,088 | ||||||
Jim Reynolds |
Cash severance |
25,000 |
(1) |
25,000 |
(1) |
||||
|
Benefit continuation | — | — | ||||||
|
Equity acceleration | — | — | ||||||
|
TOTAL | 25,000 | 25,000 | ||||||
Suresh Yannamani |
Cash severance |
100,000 |
(1) |
100,000 |
(1) |
||||
|
Benefit continuation | — | — | ||||||
|
Equity acceleration | — | 178,063 | (3) | |||||
|
TOTAL | 100,000 | 278,063 | ||||||
Mark Fairchild |
Cash severance |
800,000 |
(1) |
1,200,000 |
(1) |
||||
|
Benefit continuation | 31,072 | (2) | 31,072 | (2) | ||||
|
Equity acceleration | — | 196,581 | (3) | |||||
|
Gross-up | — | — | ||||||
|
TOTAL | 831,072 | 1,427,653 | ||||||
Shrikant Sortur |
Cash Severance |
86,154 |
(1) |
86,154 |
(1) |
||||
|
Benefit continuation | — | — | ||||||
|
Equity acceleration( | — | 142,450 | (3) | |||||
|
TOTAL | 86,154 | 228,604 | ||||||
- (1)
- Represents
the value of base salary continuation for twelve months, in the case of Mr. Fairchild, and for a period of three weeks for each year of service, up
to a maximum of 16 weeks, in the case of our other named executive officers and, for Mr. Fairchild, one times his target annual bonus and for an involuntary termination following a
change in control, and a pro-rated bonus for the year of such termination.
- (2)
- Represents the value of payment of the employee and employer portion of Mr. Fairchild's COBRA premiums for 18 months.
127
- (3)
- Includes the value of accelerated vesting of all outstanding restricted stock units, which our named executive officers are entitled to upon an involuntary termination without "cause" (other than due to death or disability) following a change in control, based on each member's (including each holder of a restricted stock unit) proportionate ownership of Ex-Sigma at such time and the closing price of our Common Stock on December 29, 2017, or $5.15, which was the final day in the fiscal year ended December 31, 2017 on which our Common Stock was traded.
Director Remuneration
Director Compensation Policy
For 2017, certain members of our board of directors received a pro-rated cash payment for services rendered in the 2017 calendar year. On December 19, 2017, our board of directors approved the director compensation policy. This compensation policy provides that each non-employee director will receive the following compensation for service on our board of directors:
| |
Annual Retainer ($) |
|||
|---|---|---|---|---|
Annual Cash Retainer for Board Membership |
75,000 | |||
Annual Cash Retainer for Board Chairman |
185,000 | |||
Audit Committee Member (other than the Chair) |
20,000 | |||
Audit Committee Chair |
30,000 | |||
Compensation Committee Member (other than the Chair) |
12,500 | |||
Compensation Committee Chair |
20,000 | |||
Nominating and Corporate Governance Committee |
12,500 | |||
Nominating and Corporate Governance Committee Chair |
20,000 | |||
Each member of the audit committee, compensation committee and nominating and corporate governance committee will also receive $2,000 per committee meeting, if in any one year there are greater than four audit, compensation or nominating and corporate governance committee meetings, as applicable. Our board of directors also approved a one-time cash retainer for the chairman of our disclosure transition committee of $20,000. In addition, if there are greater than four disclosure transition committee meetings following December 19, 2017, each non-employee director who is a member of such committee will also receive $2,000 per committee meeting.
In addition, each non-employee director (other than the chairman of our board of directors) will receive (i) a one-time initial award of equity interests with a grant date fair value of $150,000, which award vests ratably over a three-year period and (ii) an annual award of equity interests of $110,000, which award vests immediately prior to the first annual meeting subsequent to the date of grant. The chairman of our board of directors will receive (x) a one-time initial award of equity interests of $200,000, which award vests ratably over a three-year period and (y) an annual award of equity interests of $140,000, which award vests immediately prior to the first annual meeting subsequent to the date of grant. The amount of any equity award will be determined by dividing the fair value of the award by the most recent closing price of our Common Stock (rounded down to the nearest whole share) immediately preceding the date of grant. Any non-employee director who is a representative of Apollo Management Holdings, L.P. or any of its subsidiaries (but excluding any portfolio companies of funds or accounts managed or advised thereby) is not eligible to receive any fees or equity awards pursuant to the director compensation policy.
128
All Other Compensation
We reimburse our directors for reasonable and necessary out-of-pocket expenses incurred in attending board and committee meetings or performing other services for us in their capacities as directors.
Director Compensation Table
The following table sets forth information concerning director compensation for services performed during the year ended December 31, 2017.
Name
|
Fees earned or paid in cash ($)(1) |
Total ($) |
|||||
|---|---|---|---|---|---|---|---|
Par Chadha |
94,602 | 94,602 | |||||
Nathaniel Lipman |
64,665 | 64,665 | |||||
Gordon Coburn |
61,073 | 61,073 | |||||
Matthew Nord(2) |
— | — | |||||
Joshua Black(2) |
— | — | |||||
John Rexford |
56,283 | 56,283 | |||||
- (1)
- Each
of our directors was appointed as a member of our board of directors in connection with the close of the Business Combination. As such, amounts reflected in
this column show the fees earned or paid in cash for service on our board of directors from and after the close of the Business Combination. No fees were paid to our directors for service prior to the
close of the Business Combination.
- (2)
- Messrs, Nord and Black are the Apollo Management Holdings, L.P. representatives, and therefore did not earn or receive any fees in respect of service on our board of directors during the 2017 calendar year.
ITEM 12. SECURITY OWNERSHIP OF CERTAIN BENEFICIAL OWNERS AND MANAGEMENT AND RELATED STOCKHOLDER MATTERS
Securities Authorized for Issuance Under Equity Compensation Plans
The following table provides information as of December 31, 2017, with respect to the shares of our Common Stock that may be issued under our existing equity compensation plans.
Plan Category
|
Number of Securities to be Issued Upon Exercise of Outstanding Options, RSU, Warrants and Rights (a) |
Weighted Average Exercise Price of Outstanding Options, Warrants and Rights (b) |
Number of Securities Remaining Available for Future Issuance Under Equity Compensation Plans(1) (Excluding Securities Reflected in Column (a)) (c) |
|||||||
|---|---|---|---|---|---|---|---|---|---|---|
Equity compensation plans approved by stockholders |
— | — | — | |||||||
Equity compensation plans not approved by stockholders |
— | — | — | |||||||
| | | | | | | | | | | |
Total |
— | — | — | |||||||
- (1)
- The Company currently maintains the 2018 Stock Incentive Plan, which was approved by our board of directors on December 20, 2017 and subsequently approved by a majority of our stockholders by
129
written consent on December 20, 2017. The 2018 Stock Incentive Plan became effective on January 17, 2018 and there are 8,323,764 shares of our Common Stock reserved for issuance under our 2018 Stock Incentive Plan
Principal Holders of Common Stock
The following table shows, based upon filings made with the Company, certain information as of March 16, 2018 concerning persons who may be deemed beneficial owners of 5% or more of the outstanding shares of Common Stock because they possessed or shared voting or investment power with respect to the shares of Common Stock.
Name and Address
|
Amount and Nature of Beneficial Ownership |
Percent of Class(1) |
|||||
|---|---|---|---|---|---|---|---|
Various entities affiliated with Apollo Novitex Holdings, L.P.(2) 9 West 57th Street, 43rd Floor, New York, NY 10019 |
28,647,136 | 17.9 | % | ||||
Various entities affiliated with Ex-Sigma 2 LLC(3) 8550 West Desert Inn Road, Suite 102-452, Las Vegas, NV 89117 |
89,425,973 | (4) | 55.8 | % | |||
Rotation Capital Management, LP(5) 489 Fifth Avenue, 11th Floor, New York, NY 10017 |
10,806,485 | 6.7 | % | ||||
Greenlight Capital, Inc.(6) 140 East 45th Street, 24th Floor, New York, New York 10017 |
8,384,629 | 5.2 | % | ||||
- (1)
- Percent
of class refers to percentage of class beneficially owned as the term beneficial ownership is defined in Rule 13d-3 under the Securities Exchange Act
and is based upon the 152,565,218 shares of Common Stock outstanding and 7,573,066 shares of Common Stock issuable upon conversion of the Series A Preferred Stock as of March 16, 2018.
- (2)
- Information
based on Amendment Number 1 to Schedule 13D (the ``13D"), filed with the SEC on October 10, 2017, relating to securities held of
record by Apollo Novitex Holdings, L.P., a Delaware limited partnership (``Novitex Holdings"). Novitex Parent GP, LLC ("Novitex GP") is the general partner of Novitex
Holdings. Apollo Management VII, L.P. ("Management VII") is the manager of Novitex GP, and AIF VII Management, LLC ("AIF VII LLC") is the general partner of Management VII.
Apollo Management, L.P. ("Apollo Management") is the sole member-manager of AIF VII LLC, and Apollo Management GP, LLC ("Apollo Management GP") is the general
partner of Apollo Management. Apollo Management Holdings, L.P. ("Management Holdings") is the sole member-manager of Apollo Management GP, and Apollo Management
Holdings GP, LLC ("Management Holdings GP") is the general partner of Management Holdings. Leon Black, Joshua Harris and Marc Rowan are the managers, as well as executive
officers, of Apollo Management Holdings GP and as such may be deemed to have voting and dispositive control of the shares of Common Stock held by Novitex Holdings. The address of each of
Novitex Holdings, Novitex GP, Management VII, AIF VII LLC, Apollo Management, Apollo Management GP, Management Holdings and Management Holdings GP, and
Messrs. Black, Harris and Rowan is 9 West 57th Street, 43rd Floor, New York, New York.
- (3)
- Information based on a Schedule 13D, filed with the SEC on July 24, 2017, by HOVS LLC, HandsOn Fund 4 I LLC, HOV Capital III LLC, HOV Services Ltd., Adesi 234 LLC, HOF 2 LLC, Ex-Sigma 2 LLC, Ex-Sigma LLC, HandsOn Global Management LLC, and Par Chadha (collectively, the "HGM Reporting Persons") and includes 1,250,000 shares of Common Stock held directly by HandsOn Global Management LLC. According to the Schedule 13D, Mr. Chadha may be deemed to be the beneficial owner of, and he has shared power to vote and dispose of, the aggregate 89,425,973 shares of Common Stock held by the HGM Reporting Persons.
130
- (4)
- Share
totals and ownership percentage include 3,263,473 shares of Common Stock issuable upon the conversion of 2,669,233 shares of Series A Preferred Stock.
Ex-Sigma 2 LLC, a Delaware limited liability company ("Ex-Sigma 2"), directly owns 84,912,500 shares of Common Stock and 2,669,233 shares of Series A Convertible Preferred Stock, which
may be converted into 3,262,474 shares of Common Stock. Ex-Sigma LLC ("Ex-Sigma") is the sole equityholder of Ex-Sigma 2. HOVS LLC, a Delaware limited liability company ("HOVS"),
HandsOnFund 4 I LLC, a Nevada limited liability company ("HOF 4"), HOV Capital III, LLC, a Nevada limited liability company ("HOV 3"), each directly own interests in Ex-Sigma.
HOVS is a wholly-owned subsidiary of HOV Services Ltd., an Indian limited company ("HOV Services"). Adesi 234 LLC, a Nevada limited liability company ("Adesi"), and
HOF 2 LLC, a Nevada limited liability company ("HOF 2"), together own a majority of the equity interests of HOV 3. HandsOn Global Management, LLC, a Delaware limited
liability company ("HGM"), owns 1,250,000 shares of Common Stock. Mr. Par Chadha may be deemed to control HGM , Ex-Sigma 2, Ex-Sigma, HOVS, HOF 4, HOV 3, Adesi, and
HOF 2 LLC and each may be deemed to share beneficial ownership of the shares of Common Stock. In connection with the Business Combination, HOVS, HOF 4 and certain of their
affiliates entered into a Director Nomination Agreement with the Company pursuant to which HOVS, HOF 4 and certain of their affiliates are entitled to nominate a certain number of directors to
the board of the Company based on ownership thresholds in the Company. Mr. Par Chadha is currently Chairman of the board of the Company. The principal business address of Ex-Sigma 2 and HGM is
8550 West Desert Inn Road, Suite 102-452, Las Vegas, NV 89117.
- (5)
- Information based on a Schedule 13G, filed with the SEC on February 9, 2018, by Rotation Capital Management, LP (the "Investment Manager") and Matthew Rothfleisch. According to the Schedule 13G, the Investment Manager serves as the investment manager to the Rotation Capital Credit Opportunities Fund, Ltd. The general partner of the Investment Manager is Rotation Capital Partners, LLC (the "General Partner"). Mr. Rothfleisch is the managing member of the General Partner. Mr. Rothfleisch expressly disclaims beneficial ownership of the shares of Common Stock.(6) Information based on Schedule 13G, filed with the SEC on February 14, 2018, by Greenlight Capital, Inc., a Delaware corporation ("Greenlight Inc."), DME Advisors, LP, a Delaware limited partnership ("DME Advisors"), DME Capital Management, LP, a Delaware limited partnership ("DME CM"), DME Advisors GP, LLC, a Delaware limited liability company ("DME GP" and together with Greenlight Inc., DME Advisors and DME CM, "Greenlight"), and Mr. David Einhorn, the principal of Greenlight (collectively with Greenlight, the "Greenlight Reporting Persons"). Pursuant to Rule 13d-4, each of the Greenlight Reporting Persons disclaims all such beneficial ownership except to the extent of its pecuniary interest in any shares of Common Stock, if applicable.
Common Stock Ownership by Directors and Executive Officers
The following table presents the number of shares of Common Stock beneficially owned by the directors, the nominees for director, the named executive officers and all directors, nominees for
131
director and named executive officers as a group as of March 16, 2018. Individuals have sole voting and dispositive power over the stock unless otherwise indicated in the footnotes.
Name of Individual
|
Amount and Nature of Beneficial Ownership |
Percent of Class(1) |
|||
|---|---|---|---|---|---|
Par Chadha(2) |
89,425,973 | 55.8% | |||
Ronald Cogburn(3) |
— | * | |||
Jim Reynolds(4) |
— | * | |||
Matthew H. Nord(5) |
— | * | |||
Joshua M. Black(5) |
— | * | |||
Nathaniel J. Lipman |
30,754 | * | |||
Gordon J. Coburn |
— | * | |||
John H. Rexford |
27,000 | * | |||
Suresh Yannamani |
— | * | |||
Mark Fairchild |
— | * | |||
Shrikant Sortur |
— | * | |||
All directors, named executive officers and other executive officers as a group (11 persons) |
89,483,727 | 55.8% | |||
- *
- Represents
holdings of less than one percent.
- (1)
- Percent
of class refers to percentage of class beneficially owned as the term beneficial ownership is defined in Rule 13d-3 under the Securities Exchange Act
of 1934 and is based upon the 152,565,218 shares of Common Stock outstanding and 7,573,066 shares of Common Stock issuable upon conversion of the Series A Preferred Stock as of March 16
2018.
- (2)
- The
business address of Mr. Chadha is 8550 West Desert Inn Road, Suite 102-452, Las Vegas, NV 89117. Mr. Chadha is a member of HGM or its
affiliates and may be deemed to beneficially own the shares of Common Stock and Series A Perpetual Convertible Preferred Stock beneficially owned by HGM or its affiliates under
Rule 13d-3. Mr. Chadha disclaims beneficial ownership of any such shares beneficially owned by HGM, except to the extent of his pecuniary interest therein. See "Ownership of Voting
Common Stock—Principal Holders of Voting Common Stock" above.
- (3)
- Mr. Cogburn
is affiliated with HGM or its affiliates. Mr. Cogburn disclaims beneficial ownership of shares of Common Stock that are owned by HGM or its
affiliates.
- (4)
- Mr. Reynolds
is affiliated with HGM or its affiliates. Mr. Reynolds disclaims beneficial ownership of shares of Common Stock that are owned by HGM or
its affiliates.
- (5)
- Messrs. Nord and Black are each affiliated with Apollo or its affiliated investment managers and advisors. Messrs. Nord and Black each disclaim beneficial ownership of the shares of Common Stock that are owned by Apollo. The address of Messrs. Nord and Black is c/o Apollo Global Management, LLC, 9 West 57th Street, 43rd Floor, New York, NY 10019.
132
ITEM 13. CERTAIN RELATIONSHIPS AND RELATED TRANSACTIONS, AND DIRECTOR INDEPENDENCE
Certain Relationships and Related Transactions
We have adopted a written policy requiring that any related person transaction that would require disclosure under Item 404(a) of Regulation S-K under the Exchange Act be reviewed and approved by our audit committee or, if the audit committee is not able to review the transaction for any reason, the chairman of the audit committee. Compensation matters regarding our executive officers or directors are reviewed and approved by our compensation committee. The policy also provides that, at least annually, any such ongoing, previously approved related person transaction is to be reviewed by the audit committee to ensure that the transaction is in compliance with the audit committee's guidelines and that the transaction remains appropriate. All relevant factors with respect to a proposed related person transaction will be considered, and such a transaction will only be approved if it is in our and our stockholders' best interests. Related persons include our major stockholders and directors and officers, as well as immediate family members of directors and officers.
During 2017, Exela entered into the following transactions with related persons that are required to be reported under the SEC's rules:
Registration Rights Agreement
In connection with the closing of the Business Combination on July 12, 2017, the Company and certain stockholders, including certain entities affiliated with each of HGM and Apollo, entered into an Amended and Restated Registration Rights Agreement (the "Registration Rights Agreement"). Under the Registration Rights Agreement, certain stockholders, including affiliates of HGM and Apollo, and their permitted transferees are entitled to certain registration rights described in the Registration Rights Agreement. Among other things, pursuant to the Registration Rights Agreement, affiliates of each of HGM and Apollo are each entitled to participate in five demand registrations, and also have certain "piggyback" registration rights with respect to registration statements filed subsequent to the Business Combination. In addition, Ex-Sigma, an affiliate of HGM, has the right to request up to three demand registrations for the purpose of generating proceeds to repay financing it received in connection with the closing of the Business Combination. We will bear the expenses incurred in connection with the filing of any such registration statements, other than underwriting discounts and selling commissions.
Messrs. Chadha, Cogburn, and Reynolds are each affiliated with HGM and Messrs. Black and Nord are each affiliated with Apollo. Messrs. Cogburn and Reynolds received compensation from Exela as executive officers of Exela. See "Executive Compensation" above.
Director Nomination Agreements
At the closing of the Business Combination, the Company entered into a Director Nomination Agreement (the "Director Nomination Agreement") with each of Novitex Holdings, an affiliate of Apollo, and certain affiliates of HOVS LLC and HandsOn Fund 4 I, LLC, affiliates of HGM (each a "Nominating Stockholder"), which will remain in effect for so long as the applicable Nominating Stockholder (or Nominating Stockholder's affiliate) continues to beneficially own at least 5% of the then outstanding shares of our Common Stock (without giving effect to the exercise of any outstanding warrants to purchase our Common Stock). The Director Nomination Agreements require that the individuals nominated for election as directors by our board of directors shall include a number of individuals selected by each of the Nominating Stockholders such that, upon the election of each such individual, and each other individual nominated by or at the direction of our board of directors or a duly-authorized committee of the Board, as a director of our Company, the individuals selected by each Nominating Stockholder (or Nominating Stockholder's affiliate) shall be: (i) solely with respect to the
133
Director Nomination Agreement with certain affiliates of HOVS LLC and HandsOn Fund 4 I, LLC, for so long as the applicable Nominating Stockholder beneficially owns at least 35% of the then outstanding shares of our Common Stock (without giving effect to the exercise of any outstanding warrants to purchase our Common Stock), three directors; (ii) for so long as the applicable Nominating Stockholder beneficially owns at least 15%, but less than 35%, of the then outstanding shares of Common Stock (without giving effect to the exercise of any outstanding warrants to purchase our Common Stock), two directors; and (iii) for so long as the applicable Nominating Stockholder (or Nominating Stockholder's affiliate) beneficially owns at least 5%, but less than 15%, of the then outstanding shares of our Common Stock (without giving effect to the exercise of any outstanding warrants to purchase our Common Stock), one director. In the case of a vacancy on our board of directors created by the removal or resignation of an individual selected for nomination by a Nominating Stockholder (or Nominating Stockholder's affiliate), the Director Nomination Agreements require us to appoint another individual selected by the applicable Nominating Stockholder. The Director Nomination Agreements also provide for observation rights for each Nominating Stockholder (or Nominating Stockholder's Affiliate) to the extent that it has a right of nomination that it does not utilize.
In addition, the Director Nomination Agreements provide that for so long as a Nominating Stockholder continues to beneficially own at least 15% of the then outstanding shares of our Common Stock (without giving effect to the exercise of any outstanding warrants to purchase our Common Stock), we cannot, without the consent of such Nominating Stockholder, engage in certain related-party transactions, adopt an equity incentive plan or amend the same to increase the number of securities that may be granted thereunder, issue certain equity securities, including with a fair market value of more than $100 million, amend our certificate of incorporation or bylaws in a manner that adversely affects such Nominating Stockholder's rights under the applicable Director Nomination Agreement or has a disproportionate impact on the interests of such Nominating Stockholder, enter into certain new lines of business, or increase or decrease the size of the board of directors or change the classes on which the members of the board of directors serve. For additional information on ownership of each of the Nominating Stockholders, see section entitled "Security Ownership of Certain Beneficial Owners and Management and Related Stockholder Matters—Principal Holders of Common Stock."
PIPE Investment
In connection with the financing of the Business Combination, Ex-Sigma committed to fund up to $57.5 million of the private placement of shares of Exela Common Stock and Series A Perpetual Convertible Preferred Stock (the "PIPE Investment"). In connection therewith, Ex-Sigma entered into a financing arrangement pursuant to which Ex-Sigma, through its wholly-owned subsidiary Ex Sigma 2, LLC, or Ex-Sigma 2, borrowed $57.5 million (the "Ex-Sigma Financing") and pledged to the lenders thereunder 2,669,233 shares of Series A Perpetual Convertible Preferred Stock and 4,312,500 shares of Exela Common Stock acquired by Ex-Sigma in the PIPE Investment and the 80,600,000 shares of Exela Common Stock acquired by Ex-Sigma in the Business Combination. As the Ex-Sigma Financing was undertaken to facilitate consummation of the Business Combination, the Company agreed to pay the fees and expenses of the lenders thereunder associated with the incurrence of the Ex-Sigma Financing and to issue up to 821,429 shares of Exela Common Stock to the lenders thereunder as a fee under the loan agreement. The Company also paid certain expenses associated with the conversion of restricted equity awards in SourceHOV becoming restricted equity awards in Ex-Sigma.
Real Estate
HOV RE, LLC, an affiliate through common interest held by certain shareholders, leases a property in Antioch, California to HOVG LLC (aka Bay Area Credit Service LLC) and HOV Services, Inc., pursuant to two lease agreements entered into on December 1, 2008 and September 1,
134
2010, respectively. Additionally, pursuant to a tripartite lease agreement dated November 14, 2016, HOV Services Limited, as landlord, rents to BancTec TPS India Private Limited, as lessee, and TransCentra FTS Private Limited, as sub-lessee, a property in Vashi, Navi Mumbai, India. The rental expense for these premises was $0.7 million, $0.6 million and $0.2 million for the years ended December 31, 2017, 2016 and 2015, respectively.
Services
HOV Services, Ltd., a former shareholder of SourceHOV who currently owns equity interest in the Company through Ex-Sigma, provides the Company data capture and technology services. The expense recognized for these services was approximately $1.7 million, $1.7 million, and $1.4 million for the years ended December 31, 2017, 2016, and 2015, respectively.
SourceHOV licenses the use of the trademark "HOV" on a non-exclusive basis from HOF 2 LLC pursuant to a trademark license agreement dated April 29, 2011.
Pursuant to a master agreement dated January 1, 2015 between Rule 14, LLC and SourceHOV, the Company incurred marketing fees to Rule 14, LLC, a portfolio company of HGM, of $0.6 million and $0.5 million for the years ended December 31, 2017 and 2016, respectively. No expenses were incurred for the year ended December 31, 2015.
SourceHOV is party to ten master agreements with entities affiliated with HGM's ventures portfolio, each of which were entered into during 2015 and 2016. Each master agreement provides SourceHOV with free use of technology and includes a reseller arrangement pursuant to which SourceHOV is entitled to sell these services to third parties. Any revenue earned by SourceHOV in such third-party sale is shared 75%/25% with each of HGM's venture affiliates in favor of SourceHOV. The brands Zuma, Athena, Peri, BancMate, Spring, Jet, Teletype, CourtQ and Rewardio are part of the HGM ventures portfolio. SourceHOV has the license to use and resell such brands, as described therein.
Relationship with HGM
The Company incurred management fees to HGM, SourceHOV's former owner, of $6.0 million for all years ended December 31, 2017, 2016, and 2015. The contract with HGM was terminated upon consummation of the Business Combination, and no fees were payable after July 12, 2017.
The Company incurred reimbursable travel expenses to HGM of $0.9 million, $1.7 million, and $0.8 million for the years ended December 31, 2017, 2016, and 2015, respectively.
Consulting Agreements
The Company receives services from Oakana Holdings, Inc. The Company and Oakana Holdings, Inc. are related through a family relationship between certain shareholders and the president of Oakana Holdings, Inc. The expense recognized for these services was approximately $0.1 million for the year ended December 31, 2017.
The Company receives consulting services from Shadow Pond, LLC. Shadow Pond, LLC is wholly-owned and controlled by Vik Negi, our Executive Vice President Treasury and Business Affairs. The consulting arrangement was established to compensate Mr. Negi for his services to the Company prior to becoming an employee. The expense recognized for these services was approximately $0.5 million, $0.5 million, and $0.2 million for the years ended December 31, 2017, 2016 and 2015, respectively. We expect the consulting arrangement with Shadow Pond, LLC to terminate on April 1, 2018 and for Mr.Negi to continue to provide services as an employee of the Company.
135
Relationship with Apollo
The Company provides services to and receives services from certain companies controlled by investment funds affiliated with Apollo.
In April 2016, the Company's subsidiary, Novitex Enterprise Solutions, Inc. ("Novitex Solutions") entered into a master services agreement with Presidio Networked Solutions Group, LLC ("Presidio Group"), a wholly-owned subsidiary of Presidio, Inc., a portion of which is owned by affiliates of Apollo and with a common Apollo designated director. Pursuant to this master services agreement, Presidio Group provides Novitex Solutions with employees, subcontractors, and/or goods and services. For the year ended December 31, 2017 there were related party expenses of $0.3 million for this service.
On November 18, 2014, Novitex Solutions, entered into a master services agreement with Management Holdings, an indirect wholly-owned subsidiary of Apollo. Pursuant to this master services agreement, Novitex Solutions provides Management Holdings printer supplies and maintenance services, including toner maintenance, training, quarterly business review and printer procurement. The Company recognized revenue from Apollo Holdings under this agreement of approximately $0.3 million in 2017.
On January 18, 2017, Novitex Solutions entered into a master purchase and professional services agreement with Caesars Enterprise Services, LLC ("Caesars"). Caesars is controlled by investment funds affiliated with Apollo. Pursuant to this master purchase and professional services agreement, Novitex Solutions provides managed print services to Caesars, including general equipment operation, supply management, support services and technical support. The Company recognized revenue from Caesars under this master purchase and professional services agreement of approximately $1.2 million for the year ended December 31, 2017.
On May 5, 2017, Novitex Solutions entered into a master services agreement with ADT LLC. ADT LLC is controlled by investment funds affiliated with Apollo. Pursuant to this master services agreement, Novitex Solutions provides ADT LLC with mailroom and onsite mail delivery services at an ADT LLC office location and managed print services, including supply management, equipment maintenance and technical support services. The Company recognized revenue from ADT LLC under this master services agreement of less than $0.1 million for the year ended December 31, 2017.
On July 20, 2017, Novitex Solutions entered into a master services agreement with Diamond Resorts Centralized Services Company. Diamond Resorts Centralized Services Company is controlled by investment funds affiliated with Apollo. Pursuant to this master services agreement, Novitex Solutions provides commercial print and promotional product procurement services to Diamond Resorts Centralized Services Company, including sourcing, inventory management and fulfillment services. The Company did not recognize revenue from Diamond Resorts Centralized Services Company under this master services agreement during the year ended December 31, 2017, however it is expected to realize revenues in excess of the reporting thresholds for 2018.
Employment Relationships
We have entered into or propose to enter into the following related party employment relationships: Matt Reynolds, the brother of our chief financial officer, is employed as our Vice President—Finance, and is expected to receive to a base salary of $162,567 and may be eligible for additional incentive compensation for 2018; and Andrej Jonovic, the son-in-law of the chairman of our board of directors, is expected to be employed as our Executive Vice President, Business Strategy and Corporate Affairs and is expected to receive to a base salary of $300,000 and may be eligible for additional incentive compensation for 2018.
136
Director Independence
The Company's Common Stock is listed on the Nasdaq Stock Market, and the Company complies with the Nasdaq listing requirements regarding independent directors. Under Nasdaq's Marketplace Rules, the definition of an "independent director" is a person other than an executive officer or employee of the company or any other individual having a relationship which, in the opinion of the issuer's board of directors, would interfere with the exercise of independent judgment in carrying out the responsibilities of a director. Our board of directors has reviewed such information as it has deemed appropriate for purposes of determining whether any of the directors has a relationship which, in the opinion of the Board, would interfere with the exercise of independent judgment in carrying out the responsibilities of a director, including the beneficial ownership by our directors of Common Stock (see "Ownership of Common Stock—Common Stock Ownership by Directors and Executive Officers") and transactions between the Company, on the one hand, and our directors and their affiliates, on the other hand (see "Certain Relationships and Related Party Transactions"). Based on such review, the board of directors has determined that we have six "independent directors" as defined in the Nasdaq listing standards and applicable SEC rules, Messrs. Chadha, Lipman, Coburn, Rexford, Nord and Black; independent directors, therefore, constitute a majority of our board of directors. Non-management directors meet periodically in executive session without members of the Company's management at the conclusion of regularly scheduled board meetings. In addition, Messrs. Lipman, Coburn and Rexford qualify as independent directors for the purpose of serving on the audit committee of the Company under SEC rules.
ITEM 14. PRINCIPAL ACCOUNTING FEES AND SERVICES
From and after July 12, 2017, the closing of the Business Combination, KPMG LLP and its affiliates (collectively, "KPMG") provided services consisting of the audit of the annual consolidated financial statements and internal controls over financial reporting of the Company, review of the quarterly financial statements of the Company, accounting consultations and consents and other services related to SEC filings by the Company and its subsidiaries and other pertinent matters and other permitted services to the Company. From January 1, 2016 to July 12, 2017, KPMG provided accounting services to SourceHOV, our accounting acquirer.
Audit Fees
The aggregate fees billed or expected to be billed by KPMG for professional services rendered for the audit of the Company's annual consolidated financial statements and internal controls over financial reporting for the fiscal years ended 2016 and 2017, for the reviews of the condensed consolidated financial statements included in the Company's Quarterly Reports on Form 10-Q for the 2016 and 2017 fiscal years and for accounting research and consultation related to the audits and reviews totaled approximately $2.4 million for 2016 and $3.3 million for 2017. These fees were approved by the Audit Committee.
Audit-Related Fees
The aggregate fees billed by KPMG for audit-related services for the fiscal years ended 2016 and 2017 were $0.3 million and $1.1 million, respectively. These fees related to research and consultation on various filings with the SEC and due diligence services and were approved by the Audit Committee.
All Other Fees
There were no fees billed by KPMG for services rendered to the Company other than the services described above under "Audit Fees," "and Audit-Related Fees" for the fiscal years ended 2016 and 2017.
137
ITEM 15. EXHIBITS AND FINANCIAL STATEMENT SCHEDULES
(a) (1) Financial Statements
Report of Independent Registered Public Accounting FirmReport of Independent Registered Public Accounting Firm |
||||
Consolidated Balance Sheets at December 31, 2017 and 2016 Consolidated Balance Sheets at December 31, 2017 and 2016 |
||||
Consolidated Statements of Stockholders' Equity for each of the three years in the period ended December 31, 2017 Consolidated Statements of Operations for each of the three years in the period ended December 31, 2017 |
||||
Consolidated Statements of Stockholders' Equity for each of the three years in the period ended December 31, 2017 |
||||
Consolidated Statements of Cash Flows for each of the three years in the period ended December 31, 2017 Consolidated Statements of Cash Flows for each of the three years in the period ended December 31, 2017 |
||||
Notes to Consolidated Financial Statements Notes to Consolidated Financial Statements |
(2) Financial Statement Schedules
Schedule II—Valuation and Qualifying Accounts
All other schedules for which provision is made in Regulation S-X either (i) are not required under the related instructions or are inapplicable and, therefore, have been omitted, or (ii) the information required is included in the consolidated financial statements or the notes thereto that are a part hereof.
138
(a)(3) Exhibits
139
- (1)
- Incorporated
by reference to the Registrant's Registration Statement on Form S-1 (SEC File No. 333-198988).
- (2)
- Incorporated
by reference to the Registrant's Amendment No. 2 to Registration Statement on Form S-3, filed on September 21, 2017.
- (3)
- Incorporated
by reference to the Registrant's Current Report on Form 8-K filed on February 22, 2017.
- (4)
- Incorporated
by reference to the Registrants' Current Report on Form 8-K, filed on June 21, 2017.
- (5)
- Incorporated
by reference to the Registrants' Current Report on Form 8-K, filed on July 18, 2017.
- (6)
- Incorporated by reference to the Registrants' Current Report on Form 8-K, filed on December 21, 2017.
140
Valuation and Qualifying Accounts
For the years ended December 31, 2017, 2016, and 2015
(Dollars in Thousands)
| |
|
Additions | |
|
|
||||||||||||||
|---|---|---|---|---|---|---|---|---|---|---|---|---|---|---|---|---|---|---|---|
| |
Balance at Beginning of Year |
Charges to Costs and Expenses |
Other Comprehensive Income (Loss) |
Goodwill | Deductions from Reserves |
Balance at End of Year |
|||||||||||||
2017 |
|||||||||||||||||||
Allowance for doubtful accounts receivable |
$ | 3,219 | $ | 15 | $ | — | $ | — | $ | 491 | $ | 3,725 | |||||||
Valuation allowances for deferred tax assets |
(170,821 | ) | (9,747 | ) | — | (730 | ) | 72,676 | (108,622 | ) | |||||||||
2016 |
|||||||||||||||||||
Allowance for doubtful accounts receivable |
$ | 3,164 | $ | 188 | $ | — | $ | — | $ | (132 | ) | $ | 3,219 | ||||||
Valuation allowances for deferred tax assets |
(147,758 | ) | (8,517 | ) | — | (16,880 | ) | 2,334 | (170,821 | ) | |||||||||
2015 |
|||||||||||||||||||
Allowance for doubtful accounts receivable |
$ | 2,199 | $ | 196 | $ | — | $ | — | $ | 769 | $ | 3,164 | |||||||
Valuation allowances for deferred tax assets |
(149,376 | ) | (4,143 | ) | — | — | 5,761 | (147,758 | ) | ||||||||||
141
Pursuant to the requirements of Section 13 or 15(d) of the Securities Exchange Act of 1934, as amended, the Registrant has duly caused this report to be signed on its behalf by the undersigned, thereunto duly authorized.
| Dated: March 16, 2018 |
By: | /s/ RONALD COGBURN Ronald Cogburn, Chief Executive Officer |
Pursuant to the requirements of the Securities Exchange Act of 1934, as amended, this report has been signed below by the following persons on behalf of the Registrant and in the capacities and on the dates indicated.
| Dated: March 16, 2018 |
By: | /s/ RONALD COGBURN Ronald Cogburn, Chief Executive Officer (Principal Executive Officer) and Director |
||
Dated: March 16, 2018 |
By: |
/s/ JIM REYNOLDS Jim Reynolds, Executive Chief Financial Officer (Principal Financial Officer and Principal Accounting Officer) and Director |
||
Dated: March 16, 2018 |
By: |
/s/ PAR CHADHA Par Chadha, Chairman of the Board of Directors |
||
Dated: March 16, 2018 |
By: |
/s/ MATTHEW H. NORD Matthew H. Nord, Director |
||
Dated: March 16, 2018 |
By: |
/s/ JOSHUA M. BLACK Joshua M. Black, Director |
||
Dated: March 16, 2018 |
By: |
/s/ NATHANIEL J. LIPMAN Nathaniel J. Lipman, Director |
||
Dated: March 16, 2018 |
By: |
/s/ GORDON J. COBURN Gordon J. Coburn, Director |
||
Dated: March 16, 2018 |
By: |
/s/ JOHN H. REXFORD John H. Rexford, Director |
142