Attached files
| file | filename |
|---|---|
| 8-K - 8-K - CAMBRIDGE BANCORP | catc-8k_20180316.htm |

Investor Presentation March 16, 2018 Parent of Cambridge Trust Company NASDAQ: CATC Cambridge Bancorp Exhibit 99.1
Forward Looking Statements This presentation contains forward-looking statements as defined in the Private Securities Litigation Reform Act of 1995. Such forward-looking statements about Cambridge Bancorp (together with its bank subsidiary unless the context otherwise requires, the “Company”) and its industry involve substantial risks and uncertainties. Statements other than statements of current or historical fact, including statements regarding the Company’s future financial condition, results of operations, business plans, liquidity, cash flows, projected costs, and the impact of any laws or regulations applicable to the Company, are forward-looking statements. Words such as “anticipates,” “believes,” “estimates,” “expects,” “forecasts,” “intends,” “plans,” “projects,” “may,” “will,” “should,” and other similar expressions are intended to identify these forward-looking statements. Such statements are subject to factors that could cause actual results to differ materially from anticipated results. Such factors are described within the Company’s filings with the Securities & Exchange Commission. The Company does not undertake, and specifically disclaims any obligation, to publicly release the result of any revisions which may be made to any forward-looking statements to reflect the occurrence of anticipated or unanticipated events or circumstances after the date of such statements. You are cautioned not to place undue reliance on these forward-looking statements.
Company Profile (as of December 31, 2017) Banking subsidiary: Cambridge Trust Company, founded 1890: Total assets: $1.9 billion Loans: $1.4 billion Deposits: $1.8 billion Non-interest income: 34% of total revenue Wealth Management AUM $3.0 billion, AUM & AUA $3.1 billion Headquartered in Harvard Square, Cambridge Massachusetts 10 full-service banking offices located in Middlesex and Suffolk counties of Massachusetts Wealth Management offices located in Boston’s financial district, and Concord, Manchester and Portsmouth, New Hampshire
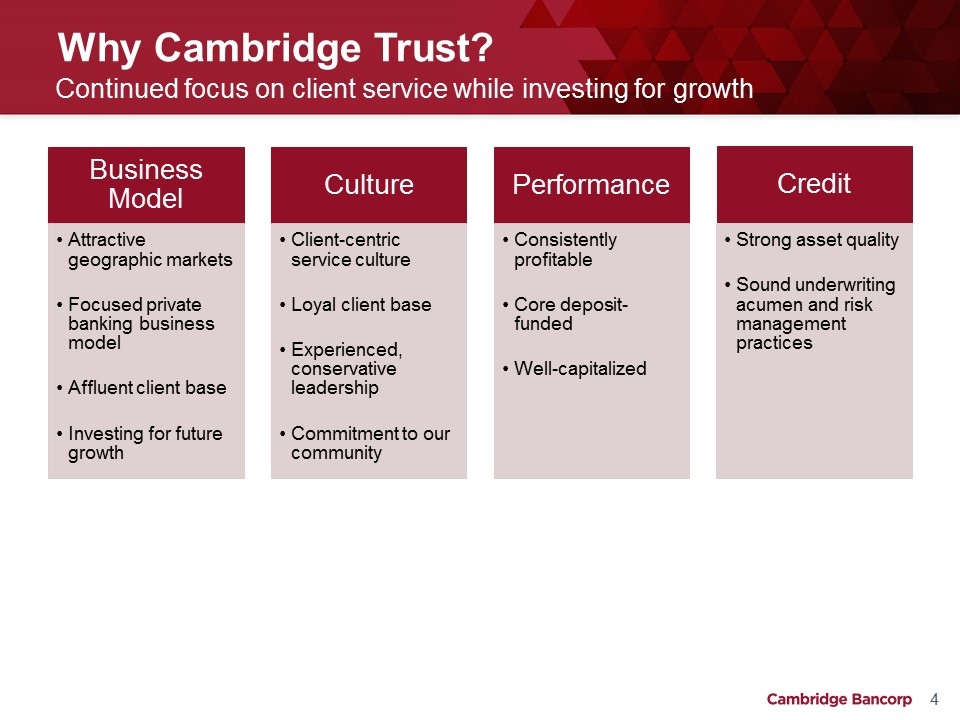
Why Cambridge Trust? Continued focus on client service while investing for growth 4 Business Model Attractive geographic markets Focused private banking business model Culture Client-centric service culture Loyal client base Performance Strong asset quality Sound underwriting acumen and risk management practices Credit Investing for future growth Consistently profitable Experienced, conservative leadership Commitment to our community Core deposit-funded Well-capitalized Affluent client base
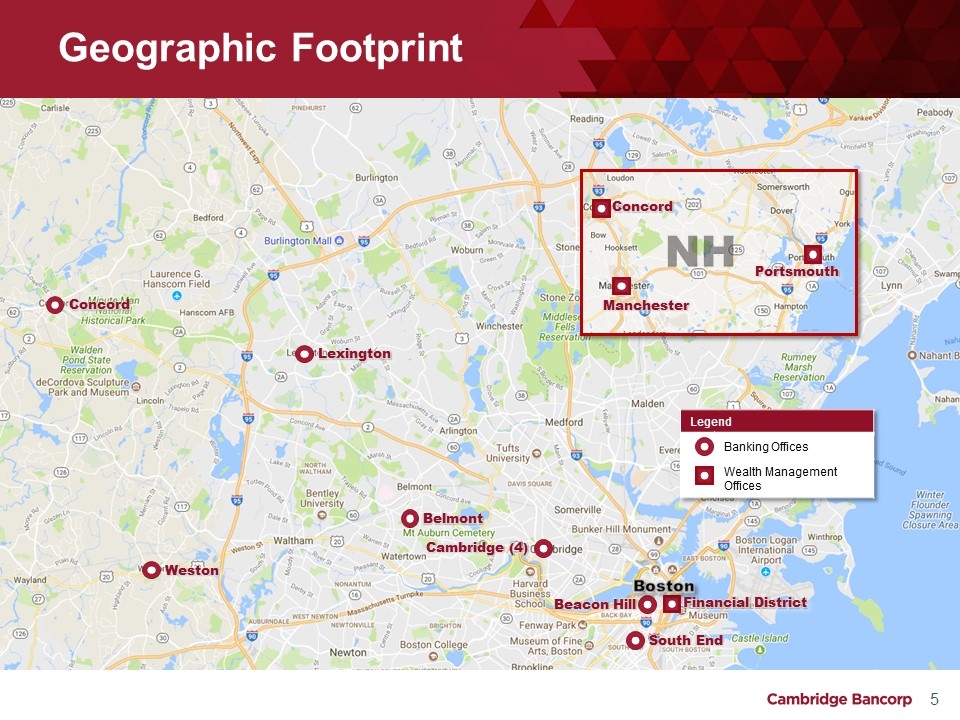
Geographic Footprint Cambridge (4) Beacon Hill Legend Banking Offices Wealth Management Offices Weston Concord Lexington Belmont South End Financial District NH Manchester Portsmouth Concord Boston
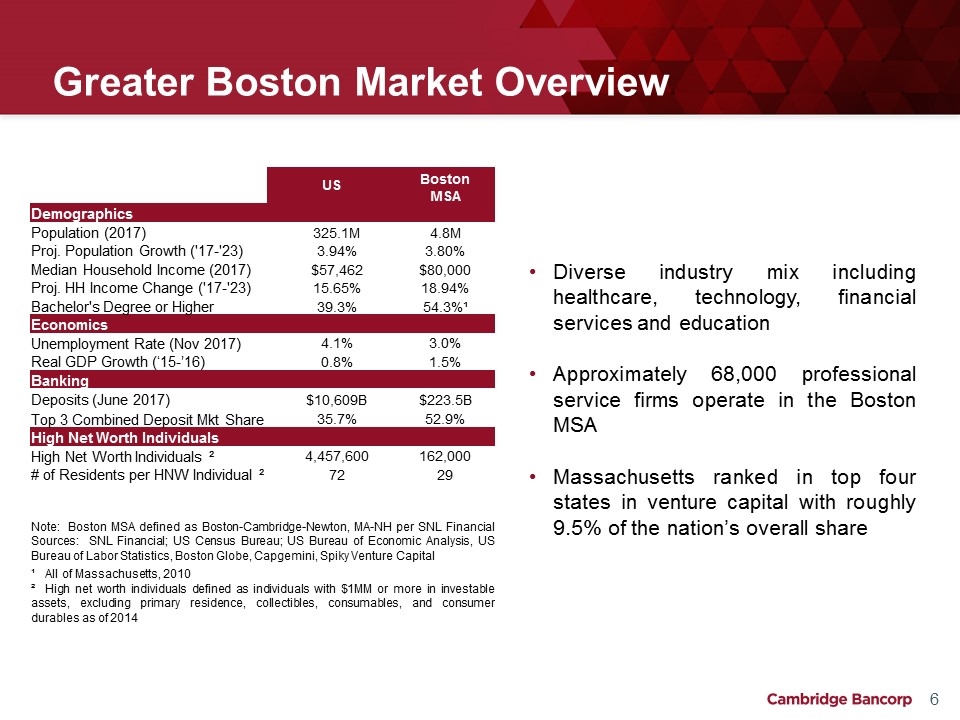
Greater Boston Market Overview US Boston MSA Demographics Population (2017) 325.1M 4.8M Proj. Population Growth ('17-'23) 3.94% 3.80% Median Household Income (2017) $57,462 $80,000 Proj. HH Income Change ('17-'23) 15.65% 18.94% Bachelor's Degree or Higher 39.3% 54.3%¹ Economics Unemployment Rate (Nov 2017) 4.1% 3.0% Real GDP Growth (‘15-’16) 0.8% 1.5% Banking Deposits (June 2017) $10,609B $223.5B Top 3 Combined Deposit Mkt Share 35.7% 52.9% High Net Worth Individuals High Net Worth Individuals ² 4,457,600 162,000 # of Residents per HNW Individual ² 72 29 Note: Boston MSA defined as Boston-Cambridge-Newton, MA-NH per SNL Financial Sources: SNL Financial; US Census Bureau; US Bureau of Economic Analysis, US Bureau of Labor Statistics, Boston Globe, Capgemini, Spiky Venture Capital ¹ All of Massachusetts, 2010 ² High net worth individuals defined as individuals with $1MM or more in investable assets, excluding primary residence, collectibles, consumables, and consumer durables as of 2014 Diverse industry mix including healthcare, technology, financial services and education Approximately 68,000 professional service firms operate in the Boston MSA Massachusetts ranked in top four states in venture capital with roughly 9.5% of the nation’s overall share
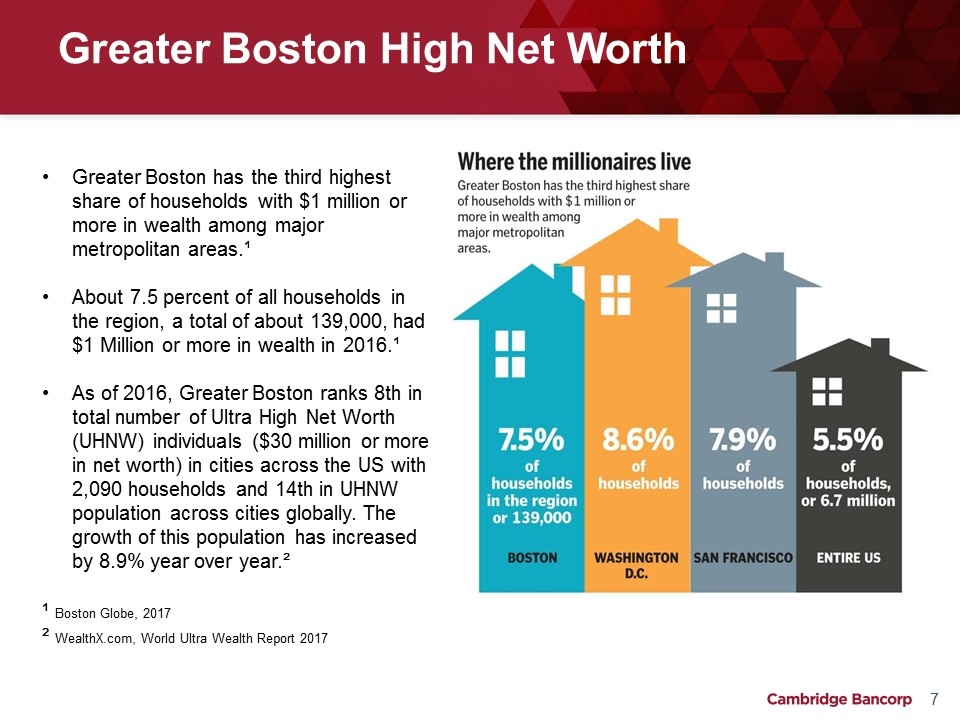
Greater Boston High Net Worth Greater Boston has the third highest share of households with $1 million or more in wealth among major metropolitan areas.¹ About 7.5 percent of all households in the region, a total of about 139,000, had $1 Million or more in wealth in 2016.¹ As of 2016, Greater Boston ranks 8th in total number of Ultra High Net Worth (UHNW) individuals ($30 million or more in net worth) in cities across the US with 2,090 households and 14th in UHNW population across cities globally. The growth of this population has increased by 8.9% year over year.² ¹ Boston Globe, 2017 ² WealthX.com, World Ultra Wealth Report 2017
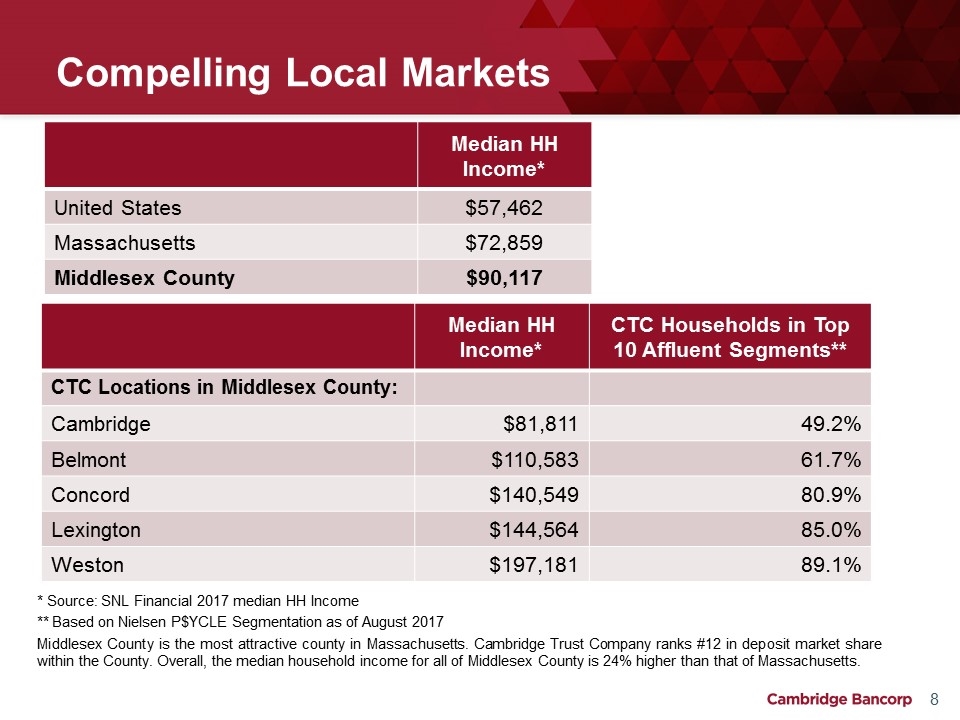
Compelling Local Markets * Source: SNL Financial 2017 median HH Income ** Based on Nielsen P$YCLE Segmentation as of August 2017 Middlesex County is the most attractive county in Massachusetts. Cambridge Trust Company ranks #12 in deposit market share within the County. Overall, the median household income for all of Middlesex County is 24% higher than that of Massachusetts. Median HH Income* CTC Households in Top 10 Affluent Segments** CTC Locations in Middlesex County: Cambridge $81,811 49.2% Belmont $110,583 61.7% Concord $140,549 80.9% Lexington $144,564 85.0% Weston $197,181 89.1% Median HH Income* United States $57,462 Massachusetts $72,859 Middlesex County $90,117
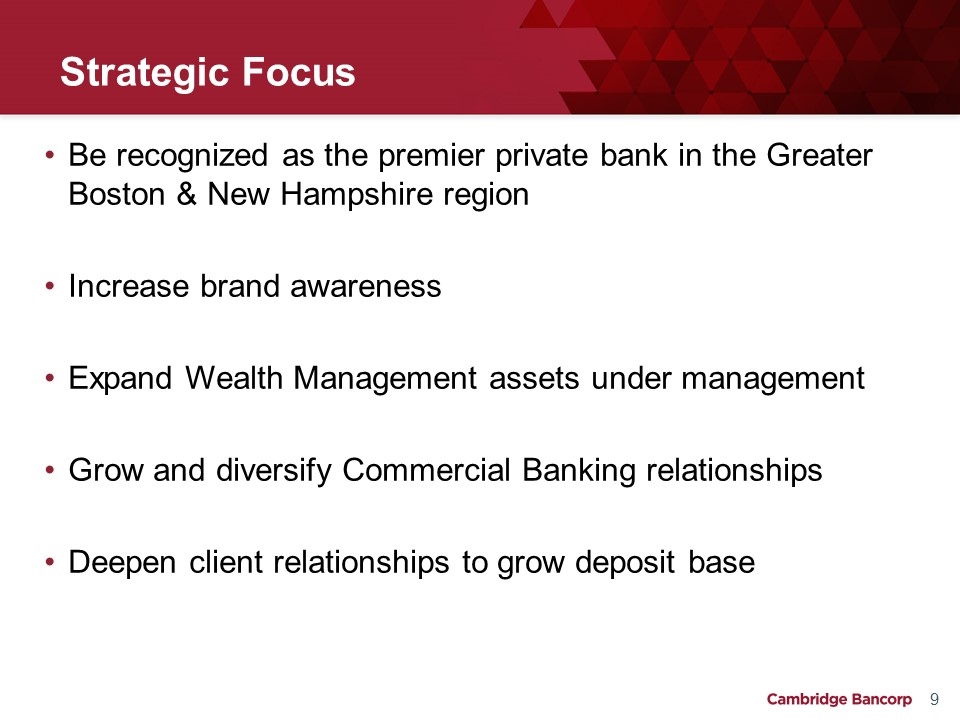
Strategic Focus Be recognized as the premier private bank in the Greater Boston & New Hampshire region Increase brand awareness Expand Wealth Management assets under management Grow and diversify Commercial Banking relationships Deepen client relationships to grow deposit base
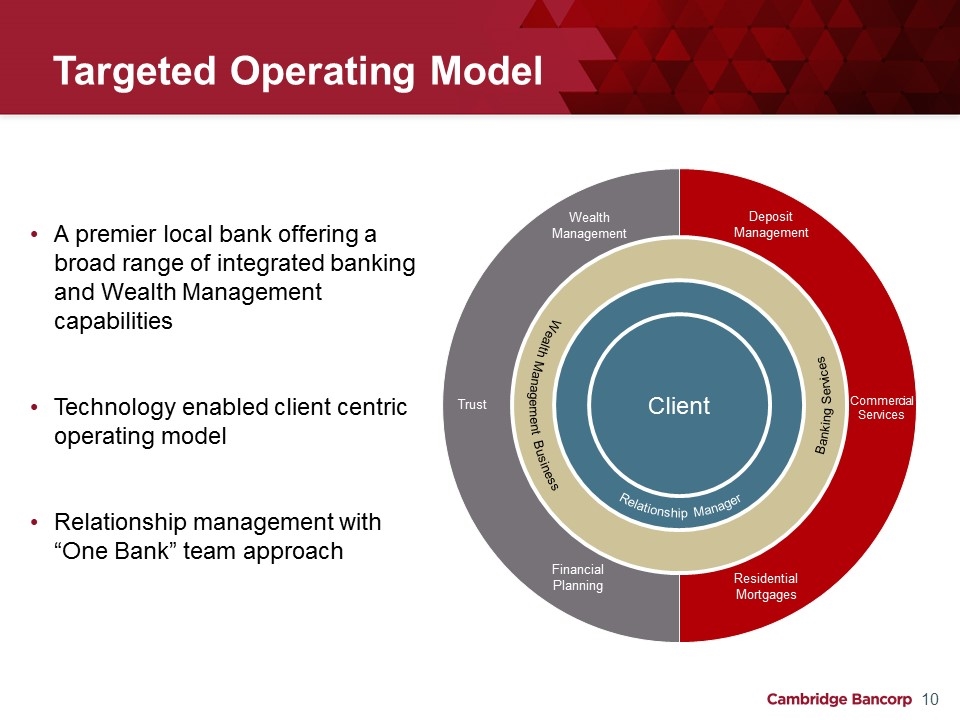
Targeted Operating Model Client Relationship Manager Wealth Management Business Banking Services Wealth Management Financial Planning Trust Deposit Management Residential Mortgages Commercial Services A premier local bank offering a broad range of integrated banking and Wealth Management capabilities Technology enabled client centric operating model Relationship management with “One Bank” team approach
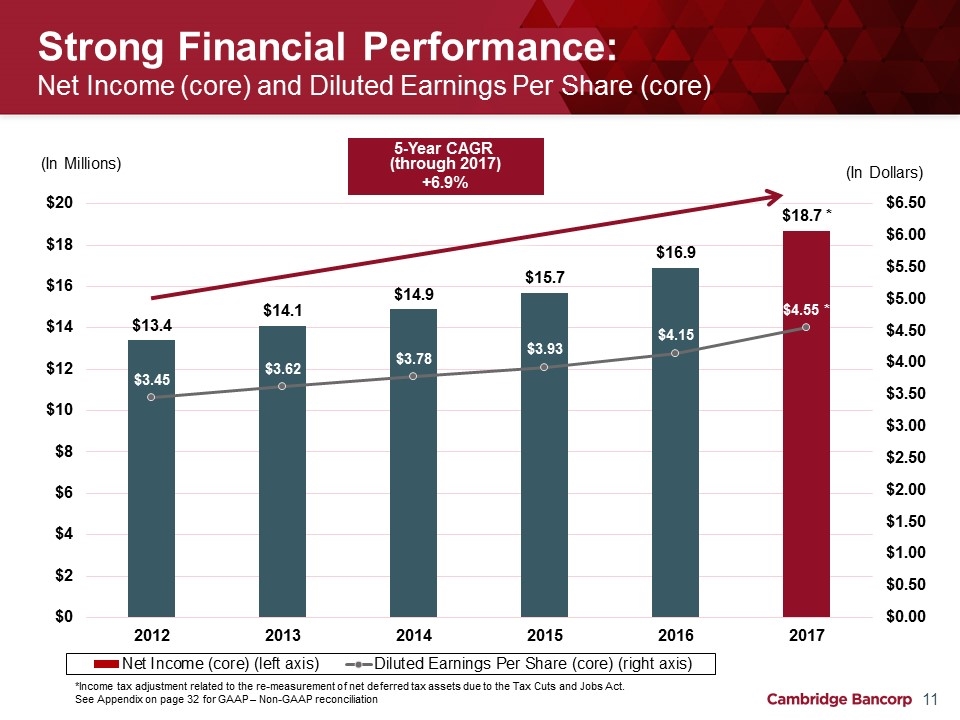
Strong Financial Performance: Net Income (core) and Diluted Earnings Per Share (core) (In Millions) 5-Year CAGR (through 2017) +6.9% (In Dollars) *Income tax adjustment related to the re-measurement of net deferred tax assets due to the Tax Cuts and Jobs Act. See Appendix on page 32 for GAAP – Non-GAAP reconciliation
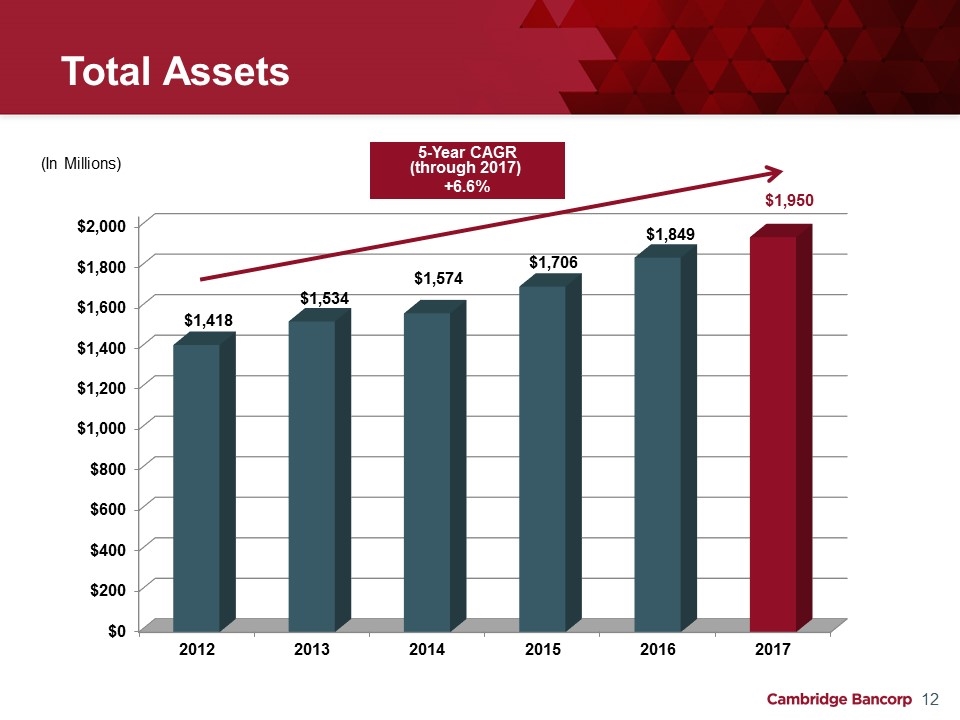
Total Assets 5-Year CAGR (through 2017) +6.6% (In Millions)
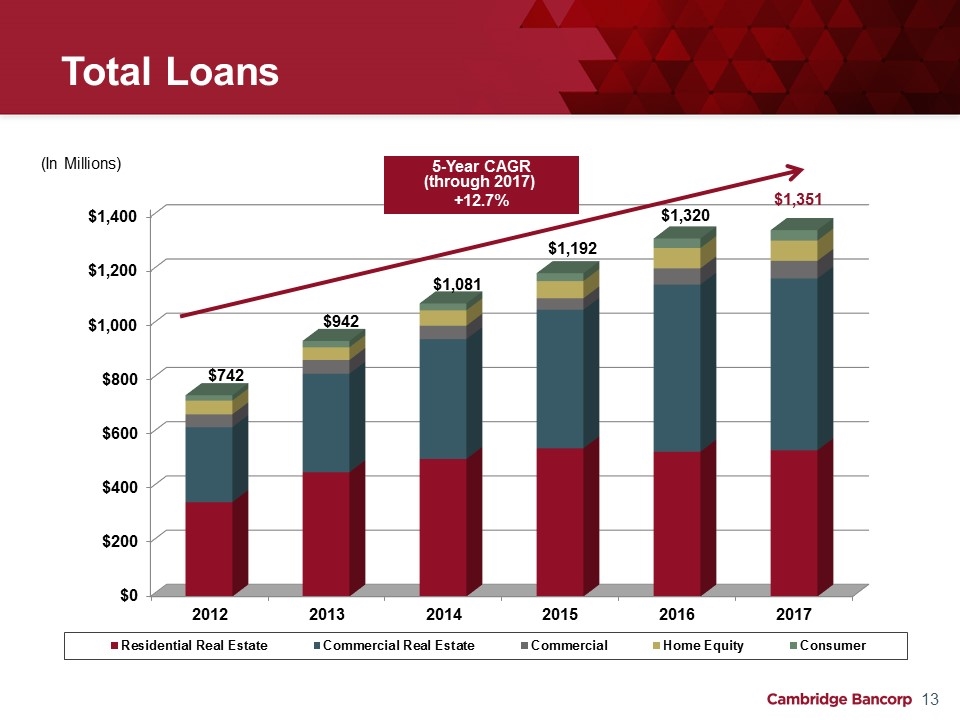
Total Loans 5-Year CAGR (through 2017) +12.7% (In Millions)

Loan Portfolio (as of December 31, 2017)
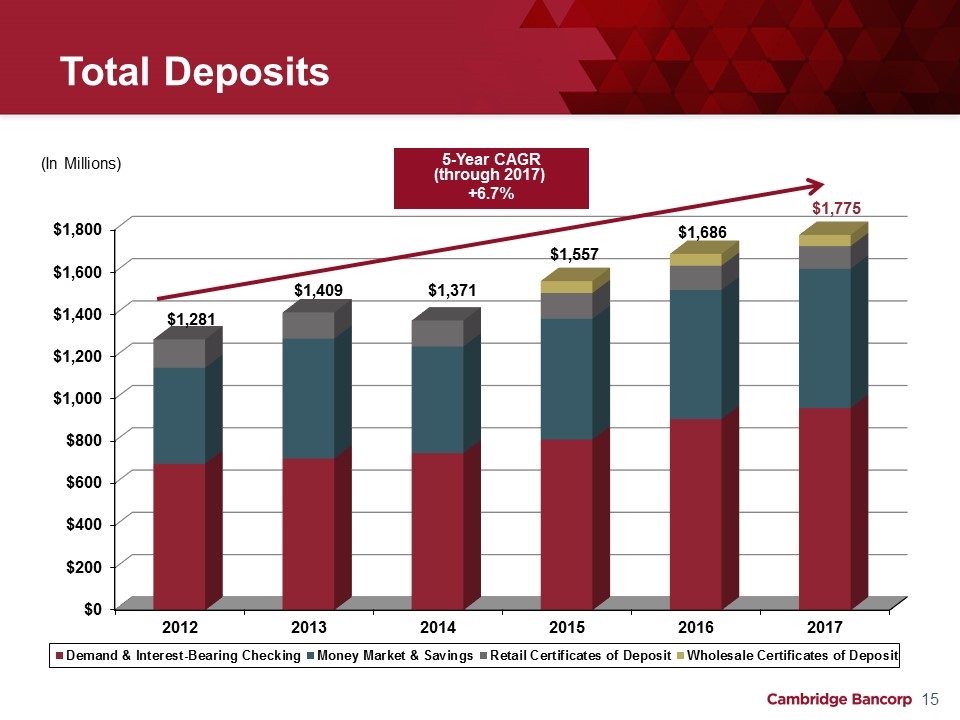
Total Deposits $1,557 $1,371 $1,281 $1,686 5-Year CAGR (through 2017) +6.7% (In Millions)
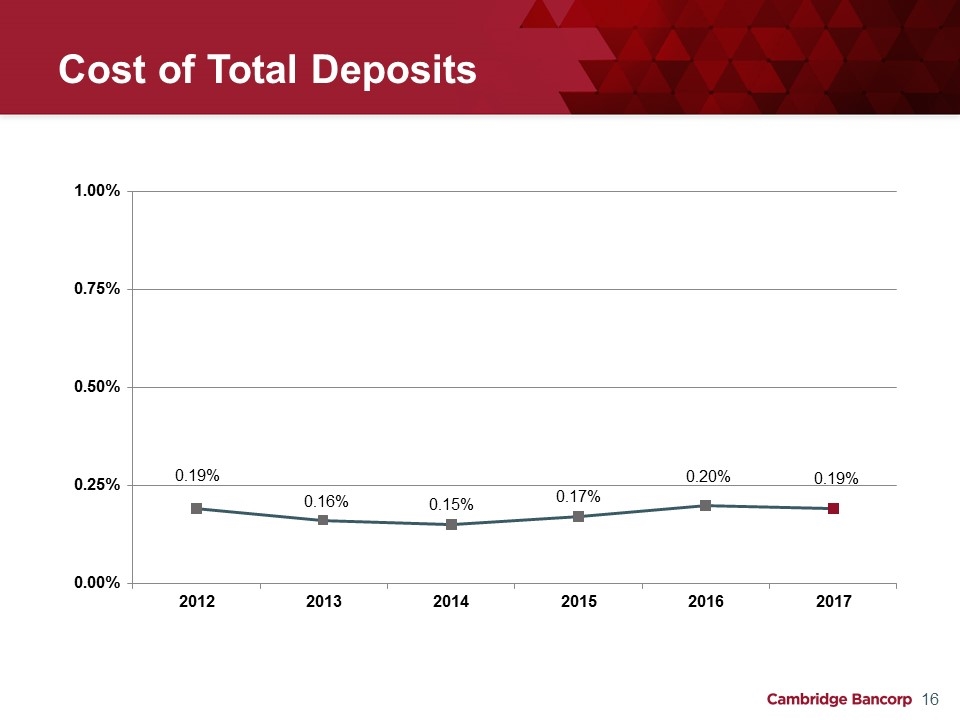
Cost of Total Deposits
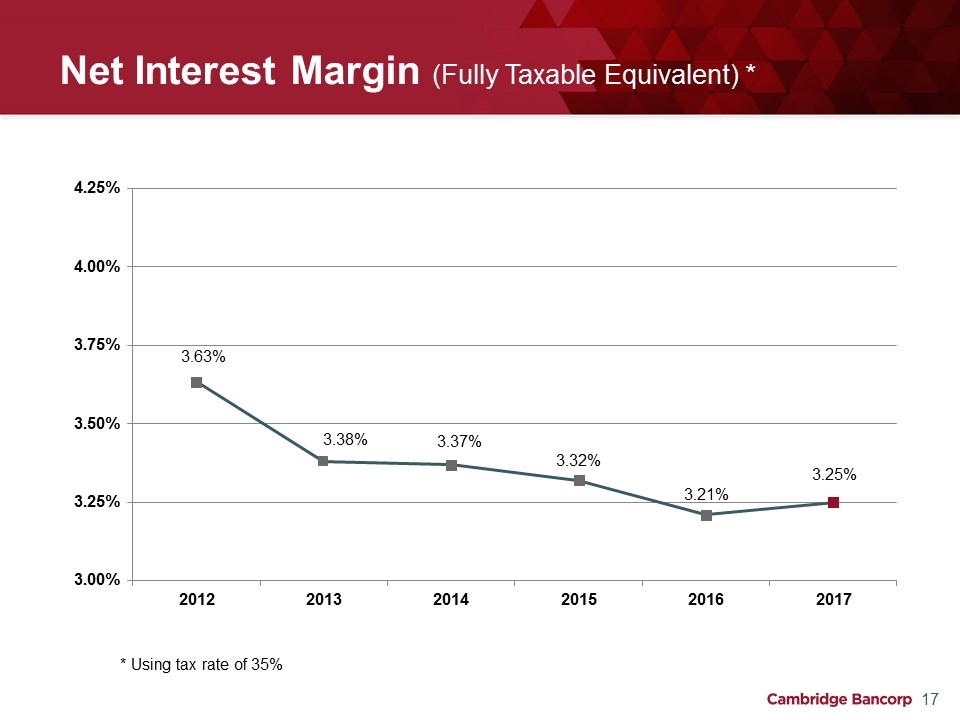
Net Interest Margin (Fully Taxable Equivalent) * * Using tax rate of 35%

Non-Interest Income (In Millions) 34% of Revenue
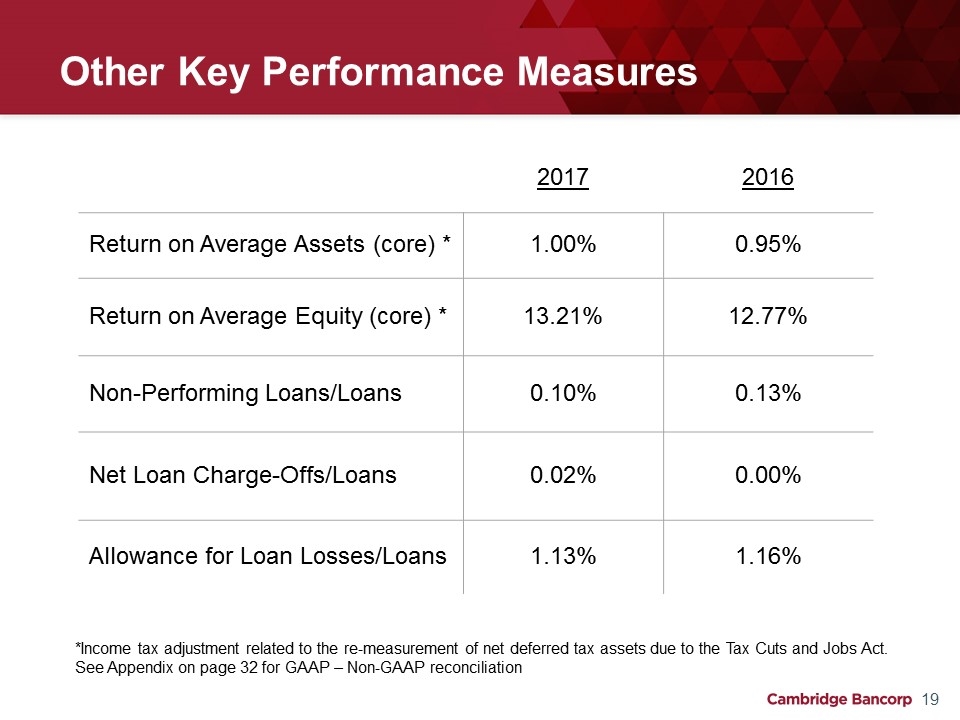
Other Key Performance Measures 2017 2016 Return on Average Assets (core) * 1.00% 0.95% Return on Average Equity (core) * 13.21% 12.77% Non-Performing Loans/Loans 0.10% 0.13% Net Loan Charge-Offs/Loans 0.02% 0.00% Allowance for Loan Losses/Loans 1.13% 1.16% *Income tax adjustment related to the re-measurement of net deferred tax assets due to the Tax Cuts and Jobs Act. See Appendix on page 32 for GAAP – Non-GAAP reconciliation
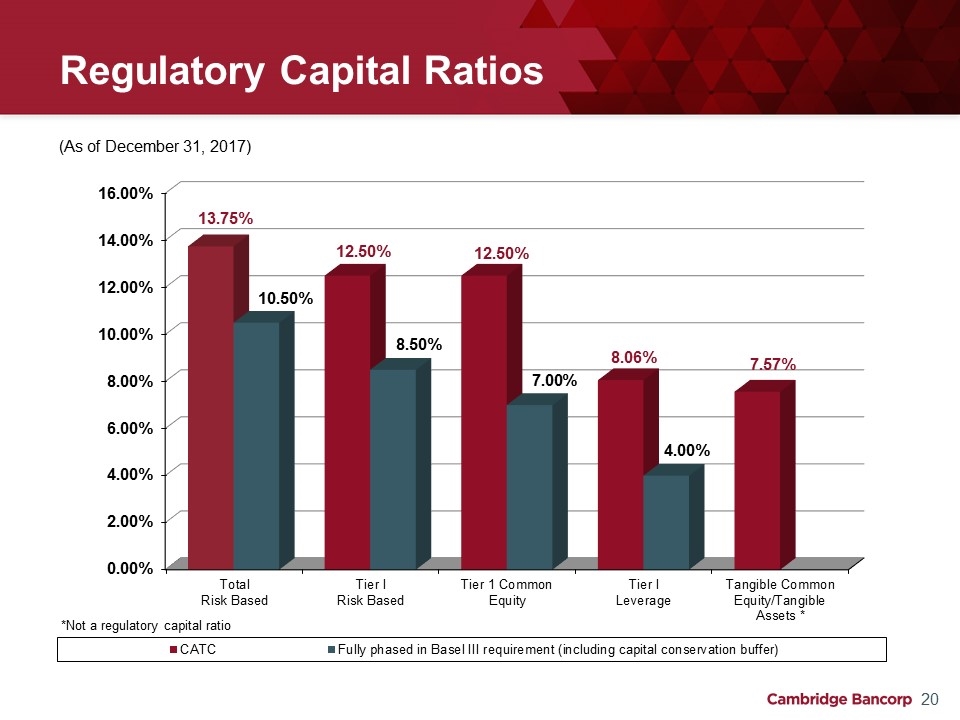
Regulatory Capital Ratios (As of December 31, 2017)
Growing the Franchise – Wealth Management 2017 Results: Wealth assets under management and administration increased by 14.7% to $3.1 billion, driven by strong market performance and new business generation. Continued growth in New Hampshire markets. New Hampshire assets under management grew to $1.1 billion, or 36% of total managed assets. Investments & Growth Opportunities: Investment in Business Development: Add additional Private Banking Officers in 2018 & 2019 Enhance diversification and asset allocation capability via a more open architecture approach
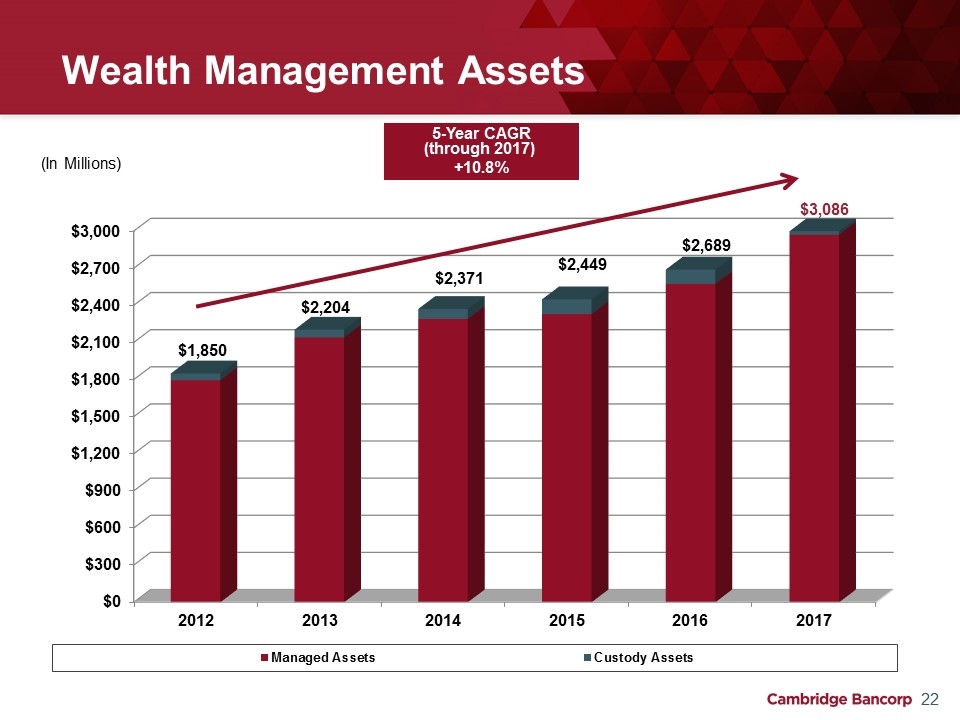
Wealth Management Assets $2,449 $1,850 $2,204 5-Year CAGR (through 2017) +10.8% (In Millions)
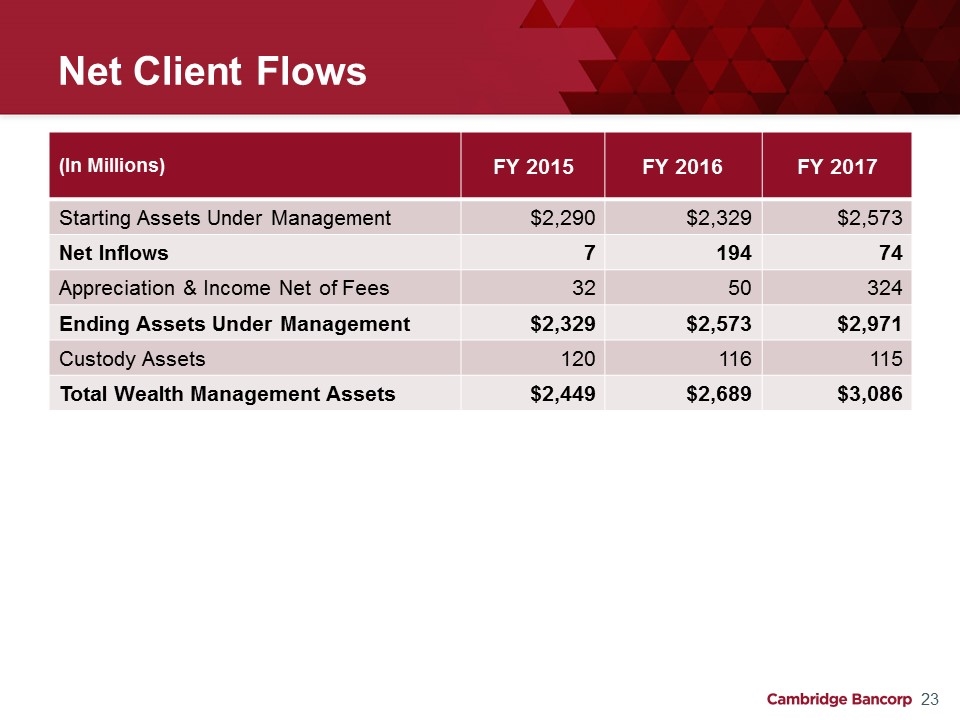
Net Client Flows (In Millions) FY 2015 FY 2016 FY 2017 Starting Assets Under Management $2,290 $2,329 $2,573 Net Inflows 7 194 74 Appreciation & Income Net of Fees 32 50 324 Ending Assets Under Management $2,329 $2,573 $2,971 Custody Assets 120 116 115 Total Wealth Management Assets $2,449 $2,689 $3,086
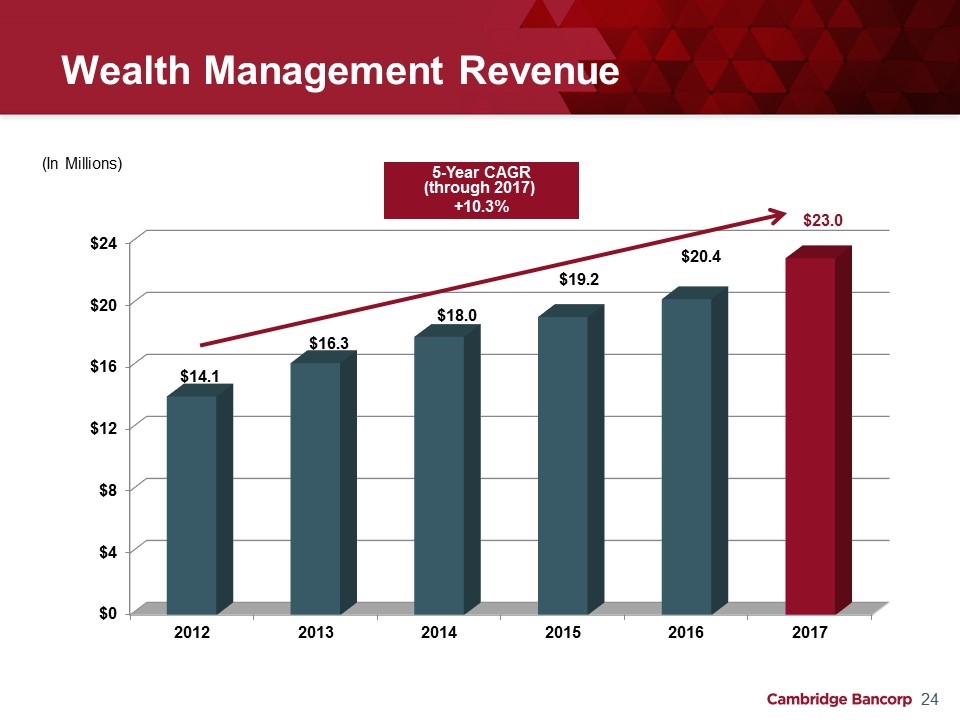
Wealth Management Revenue 5-Year CAGR (through 2017) +10.3% (In Millions)
Growing the Franchise – Commercial Banking 2017 Results: Total commercial loan growth of $23 million or 3% Commercial & industrial loan growth of $6 million or 9% Business deposit growth of $39 million or 6%, representing 38% of total deposits Investments & Growth Opportunities: Further investment in specialty lending in 2018 Asset-based lending
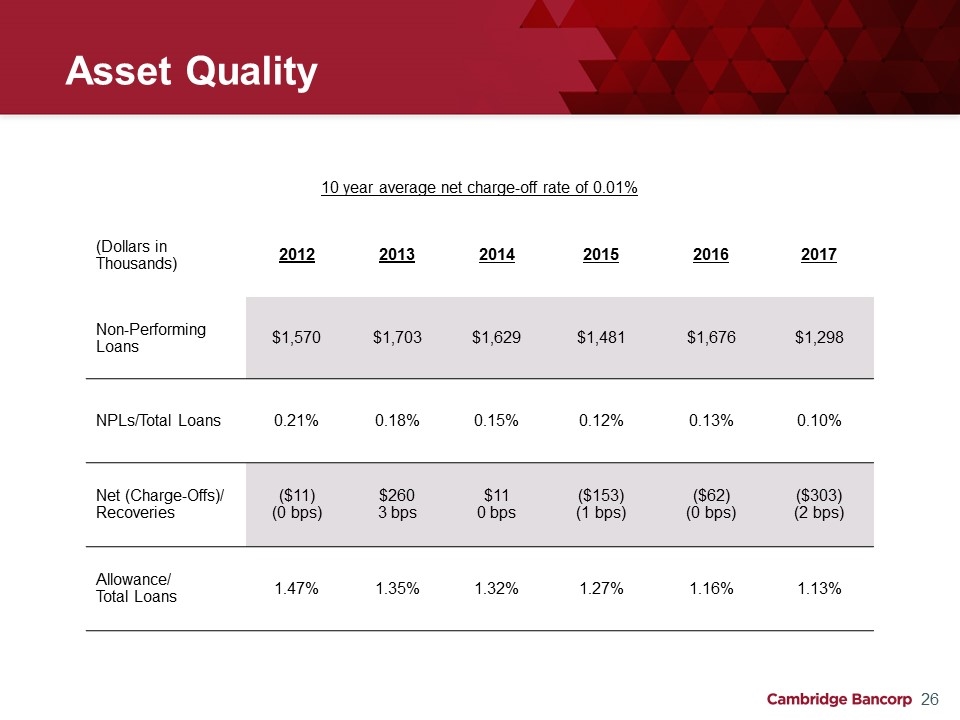
Asset Quality 10 year average net charge-off rate of 0.01% (Dollars in Thousands) 2012 2013 2014 2015 2016 2017 Non-Performing Loans $1,570 $1,703 $1,629 $1,481 $1,676 $1,298 NPLs/Total Loans 0.21% 0.18% 0.15% 0.12% 0.13% 0.10% Net (Charge-Offs)/ Recoveries ($11) (0 bps) $260 3 bps $11 0 bps ($153) (1 bps) ($62) (0 bps) ($303) (2 bps) Allowance/ Total Loans 1.47% 1.35% 1.32% 1.27% 1.16% 1.13%
Growing the Franchise – Consumer Banking 2017 Results: Kendall Square branch relocated in May 2017 as part of MIT’s ambitious development on Main Street. Opportunity to test new branch model better suited to highly innovative and young community Investments & Growth Opportunities: Identify existing clients without full private banking offering to deepen client relationships Selectively evaluate markets for office expansion
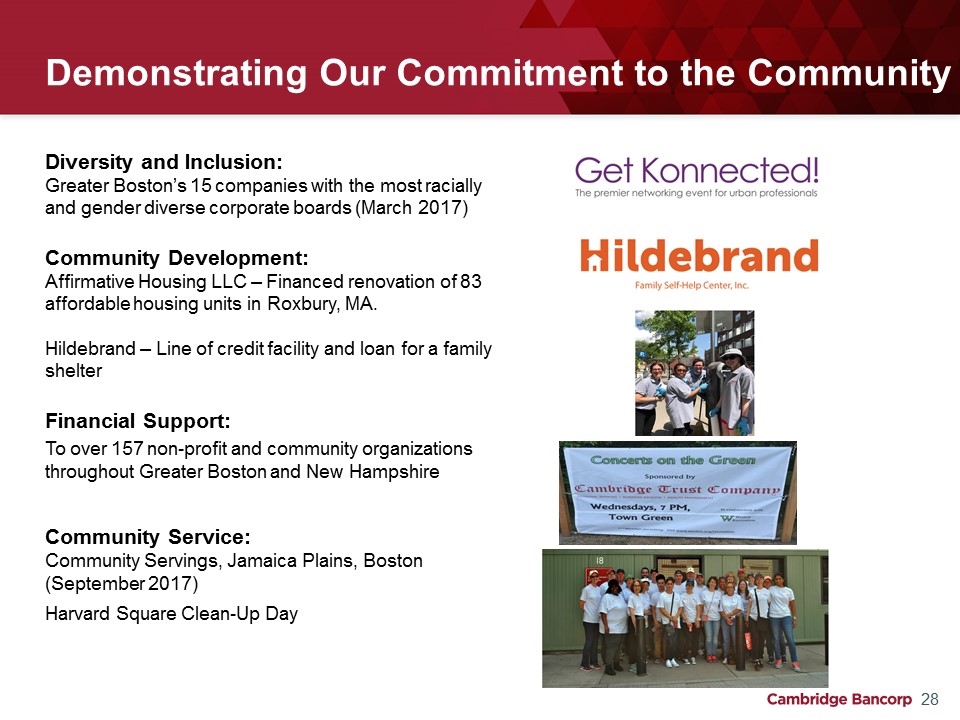
Demonstrating Our Commitment to the Community Diversity and Inclusion: Greater Boston’s 15 companies with the most racially and gender diverse corporate boards (March 2017) Community Development: Affirmative Housing LLC – Financed renovation of 83 affordable housing units in Roxbury, MA. Hildebrand – Line of credit facility and loan for a family shelter Financial Support: To over 157 non-profit and community organizations throughout Greater Boston and New Hampshire Community Service: Community Servings, Jamaica Plains, Boston (September 2017) Harvard Square Clean-Up Day
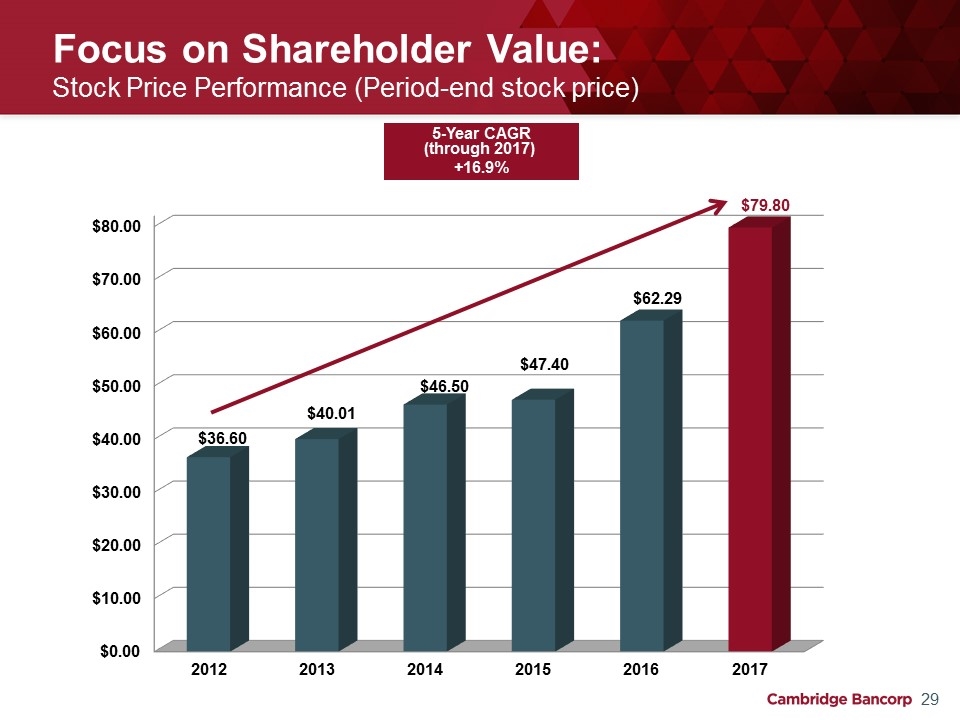
Focus on Shareholder Value: Stock Price Performance (Period-end stock price) 5-Year CAGR (through 2017) +16.9%
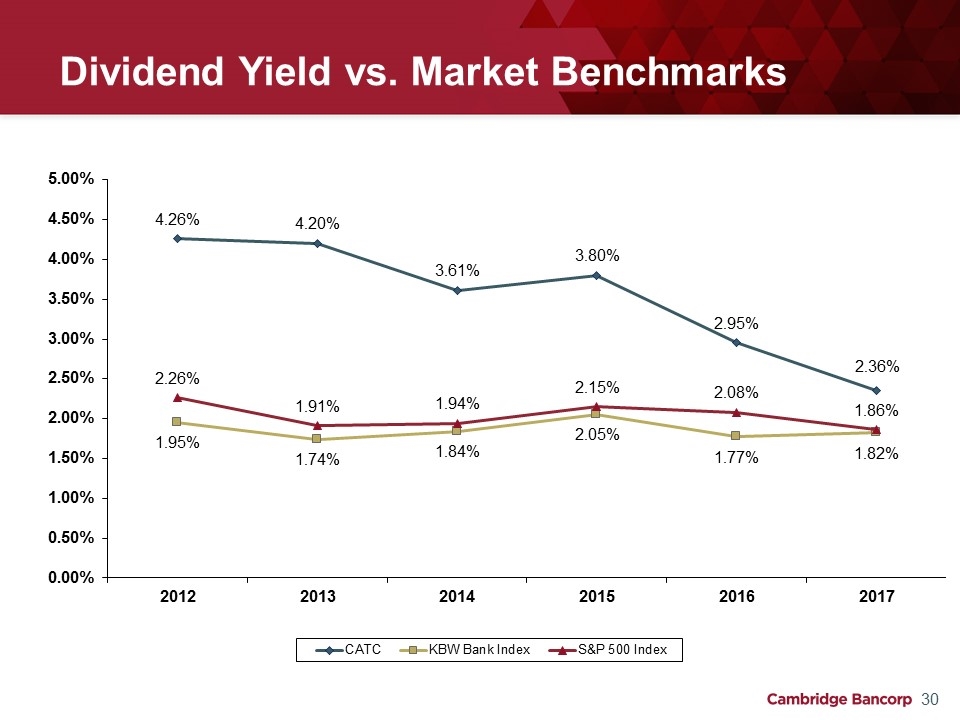
Dividend Yield vs. Market Benchmarks
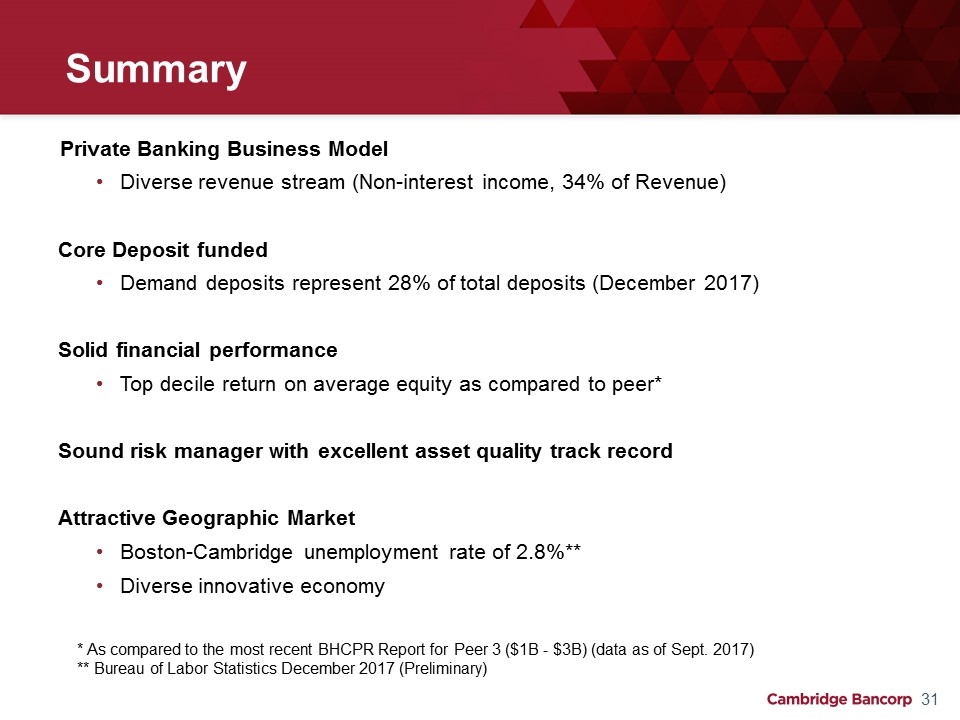
Summary Private Banking Business Model Diverse revenue stream (Non-interest income, 34% of Revenue) Core Deposit funded Demand deposits represent 28% of total deposits (December 2017) Solid financial performance Top decile return on average equity as compared to peer* Sound risk manager with excellent asset quality track record Attractive Geographic Market Boston-Cambridge unemployment rate of 2.8%** Diverse innovative economy * As compared to the most recent BHCPR Report for Peer 3 ($1B - $3B) (data as of Sept. 2017) ** Bureau of Labor Statistics December 2017 (Preliminary)
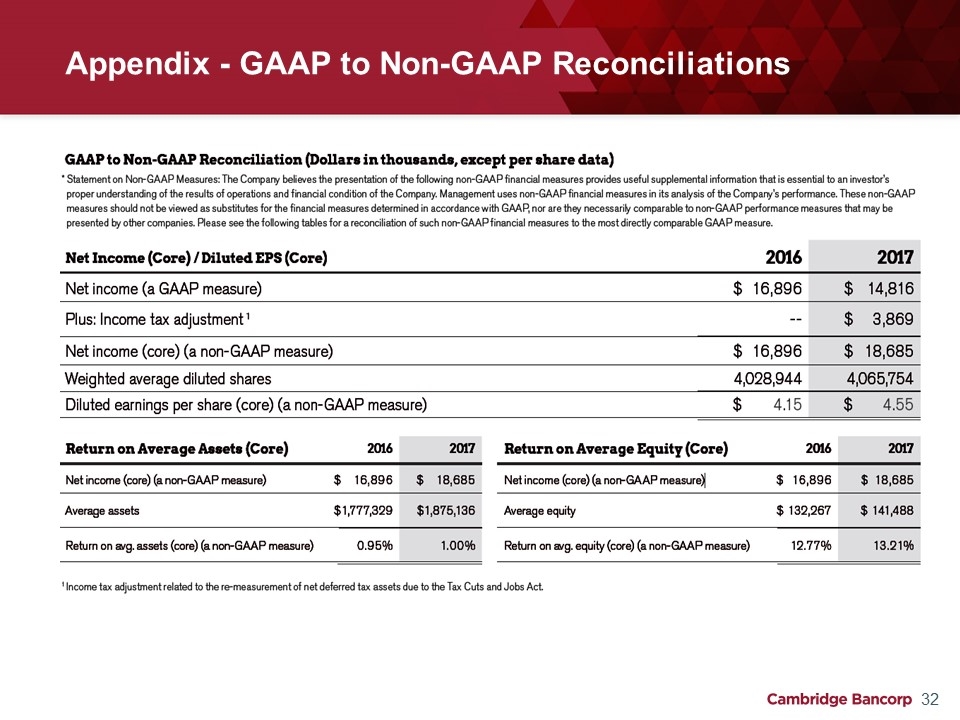
Appendix - GAAP to Non-GAAP Reconciliations
Denis K. Sheahan Chairman and Chief Executive Officer 617-441-1533 Michael F. Carotenuto Senior Vice President and Chief Financial Officer 617-520-5543 Mark D. Thompson President 617-441-1505 Cambridge Bancorp Parent of Cambridge Trust Company
