Attached files
| file | filename |
|---|---|
| EX-32 - EX-32 - BSB Bancorp, Inc. | d542384dex32.htm |
| EX-31.2 - EX-31.2 - BSB Bancorp, Inc. | d542384dex312.htm |
| EX-31.1 - EX-31.1 - BSB Bancorp, Inc. | d542384dex311.htm |
| EX-23.1 - EX-23.1 - BSB Bancorp, Inc. | d542384dex231.htm |
| EX-10.7 - EX-10.7 - BSB Bancorp, Inc. | d542384dex107.htm |
| EX-10.6 - EX-10.6 - BSB Bancorp, Inc. | d542384dex106.htm |
Table of Contents
UNITED STATES
SECURITIES AND EXCHANGE COMMISSION
Washington, D.C. 20549
FORM 10-K
| ☒ | ANNUAL REPORT PURSUANT TO SECTION 13 OR 15(d) OF THE SECURITIES EXCHANGE ACT OF 1934 |
For the fiscal year ended December 31, 2017
OR
| ☐ | TRANSITION REPORT PURSUANT TO SECTION 13 OR 15(d) OF THE SECURITIES EXCHANGE ACT OF 1934 |
For the transition period from to
Commission File Number: 001-35309
BSB BANCORP, INC.
(Exact name of registrant as specified in its charter)
| MARYLAND | 80-0752082 | |
| (State or other jurisdiction of incorporation or organization) |
(I.R.S. Employer Identification No.) | |
| 2 Leonard Street, Belmont, Massachusetts | 02478 | |
| (Address of principal executive offices) | (Zip Code) | |
(617) 484-6700
(Registrant’s telephone number, including area code)
Securities registered pursuant to Section 12(b) of the Act:
|
Title of each class |
Name of each exchange on which registered | |
| Common Stock, par value $0.01 per share | Nasdaq Capital Market |
Securities registered pursuant to Section 12(g) of the Act: None
Indicate by check mark if the registrant is a well-known seasoned issuer, as defined in Rule 405 of the Securities Act. Yes ☐ No ☒
Indicate by check mark if the registrant is not required to file reports pursuant to Section 13 or Section 15(d) of the Act. Yes ☐ No ☒
Indicate by check mark whether the registrant (1) has filed all reports required to be filed by Section 13 or 15(d) of the Securities Exchange Act of 1934 during the preceding 12 months (or for such shorter period that the registrant was required to file such reports), and (2) has been subject to such filing requirements for the past 90 days. Yes ☒ No ☐
Indicate by check mark whether the registrant has submitted electronically and posted on its corporate Web site, if any, every Interactive Data File required to be submitted and posted pursuant to Rule 405 of Regulation S-T (§ 232.405 of this chapter) during the preceding 12 months (or for such shorter period that the registrant was required to submit and post such files). Yes ☒ No ☐
Indicate by check mark if disclosure of delinquent filers pursuant to Item 405 of Regulation S-K is not contained herein, and will not be contained, to the best of the registrant’s knowledge, in definitive proxy or information statements incorporated by reference in Part III of this Form 10-K or any amendment to this Form 10-K. ☒
Indicate by check mark whether the registrant is a large accelerated filer, an accelerated filer, a non-accelerated filer, or a smaller reporting company.
| Large accelerated filer | ☐ | Accelerated filer | ☒ | |||
| Non-accelerated filer | ☐ (Do not check if a smaller reporting company) | Smaller reporting company | ☐ | |||
| Emerging growth company | ☐ | |||||
If an emerging growth company, indicate by check mark if the registrant has elected not to use the extended transition period for complying with any new or revised financial accounting standards provided pursuant to Section 7(a)(2)(B) of the Securities Act. ☐
Indicate by check mark whether the registrant is a shell company (as defined by Rule 12b-2 of the Act). Yes ☐ No ☒
The aggregate market value of the voting and non-voting common equity held by nonaffiliates as of June 30, 2017 was approximately $229,885,274.
The number of shares outstanding of the registrant’s common stock as of March 9, 2018 was 9,749,842.
DOCUMENTS INCORPORATED BY REFERENCE:
(1) Proxy Statement for the 2018 Annual Meeting of Stockholders of the Registrant (Part III).
Table of Contents
| Page | ||||||
| 2 | ||||||
| ITEM 1. |
2 | |||||
| ITEM 1A. |
35 | |||||
| ITEM 1B. |
44 | |||||
| ITEM 2. |
44 | |||||
| ITEM 3. |
45 | |||||
| ITEM 4. |
45 | |||||
| 46 | ||||||
| ITEM 5. |
46 | |||||
| ITEM 6. |
49 | |||||
| ITEM 7. |
MANAGEMENT’S DISCUSSION AND ANALYSIS OF FINANCIAL CONDITION AND RESULTS OF OPERATION |
50 | ||||
| ITEM 7A. |
65 | |||||
| ITEM 8. |
66 | |||||
| ITEM 9. |
CHANGES IN AND DISAGREEMENTS WITH ACCOUNTANTS ON ACCOUNTING AND FINANCIAL DISCLOSURE |
117 | ||||
| ITEM 9A. |
117 | |||||
| ITEM 9B. |
117 | |||||
| 118 | ||||||
| ITEM 10. |
118 | |||||
| ITEM 11. |
118 | |||||
| ITEM 12. |
SECURITY OWNERSHIP OF CERTAIN BENEFICIAL OWNERS AND MANAGEMENT AND RELATED STOCKHOLDERS MATTERS |
118 | ||||
| ITEM 13. |
CERTAIN RELATIONSHIPS AND RELATED TRANSACTIONS, AND DIRECTOR INDEPENDENCE |
118 | ||||
| ITEM 14. |
118 | |||||
| 119 | ||||||
| ITEM 15. |
119 | |||||
| ITEM 16. |
120 | |||||
| 120 | ||||||
This report contains certain “forward-looking statements” within the meaning of the federal securities laws. These statements are not historical facts; rather, they are statements based on BSB Bancorp, Inc.’s current expectations regarding its business strategies, intended results and future performance. Forward-looking statements are preceded by terms such as “expects,” “believes,” “anticipates,” “intends” and similar expressions.
Management’s ability to predict results or the effect of future plans or strategies is inherently uncertain. Factors which could affect actual results include interest rate trends, the general economic climate in the market area in which BSB Bancorp, Inc. operates, as well as nationwide, BSB Bancorp, Inc.’s ability to control costs and expenses, competitive products and pricing, loan delinquency rates and changes in federal and state legislation and regulation. For further discussion of factors that may affect our results, see “Item 1A. Risk Factors” in this Annual Report on Form 10-K (“Form 10-K”). These factors should be considered in evaluating the forward-looking statements and undue reliance should not be placed on such statements. Except as required by law, we disclaim any intention or obligation to update or revise any forward-looking statements after the date of this Form 10-K, whether as a result of new information, future events or otherwise.
1
Table of Contents
| ITEM 1. | BUSINESS |
General
BSB Bancorp, Inc. (“BSB Bancorp” or the “Company”) is a Maryland corporation that owns 100% of the common stock of Belmont Savings Bank (“Belmont Savings” or the “Bank”) and BSB Funding Corporation. BSB Bancorp was incorporated in June, 2011 to become the holding company of Belmont Savings in connection with the Bank’s conversion from the mutual holding company to stock holding company form of organization (the “conversion”). On October 4, 2011 we completed our initial public offering of common stock in connection with the conversion, selling 8,993,000 shares of common stock at $10.00 per share for approximately $89.9 million in gross proceeds, including 458,643 shares sold to the Bank’s employee stock ownership plan. In addition, in connection with the conversion, we issued 179,860 shares of our common stock and contributed $200,000 in cash to the Belmont Savings Bank Foundation. At December 31, 2017, we had consolidated assets of $2.68 billion, consolidated deposits of $1.75 billion and consolidated equity of $178.03 million. Other than holding the common stock of Belmont Savings, BSB Bancorp has not engaged in any significant business to date.
Belmont Savings is a Massachusetts-chartered savings bank headquartered in Belmont, Massachusetts. The Bank’s business consists primarily of accepting deposits from the general public, small businesses, nonprofit organizations and municipalities and investing those deposits, together with funds generated from operations and borrowings, in one-to-four family residential mortgage loans, commercial real estate loans, multi-family real estate loans, home equity lines of credit, indirect automobile loans (automobile loans assigned to us by automobile dealerships), commercial business loans, construction loans and investment securities. To a much lesser extent, the Bank also makes other consumer loans and second mortgage loans. We offer a variety of deposit accounts, including relationship checking accounts for consumers and businesses, passbook and statement savings accounts, certificates of deposit, money market accounts, Interest on Lawyer Trust Accounts (“IOLTA”), commercial, municipal and regular checking accounts and Individual Retirement Accounts (“IRAs”). The Bank offers a wide range of commercial and retail banking services which include a full suite of cash management services, lockbox, online and mobile banking and global payments.
Throughout its history, Belmont Savings has remained focused on providing a broad range of quality services within its market area as a community bank. In 2009, Belmont Savings reorganized into the mutual holding company structure. Further, following a comprehensive strategic review of the Bank’s management and operations, the board of directors of the Bank approved a new strategic plan designed to increase the growth and profitability of the Bank. The strategic plan was intended to take advantage of the sound Eastern Massachusetts economy, which was not as negatively affected by the recession that began in 2008 as other regions of the United States. The Bank’s current strategic plan contemplates continued growth in assets and liabilities over the next several years with the intent of building upon Belmont Savings’ leading market share in Belmont and growing share in the communities we serve, striving to be the “Bank of Choice” for deposit driven small businesses, nonprofit organizations and municipalities in its market area. Additionally, we are striving to be the lender of choice for one-to-four family residential real estate loans and the trusted lending partner for commercial real estate investors, developers and managers within our market area.
Available Information
BSB Bancorp is a public company, and files interim, quarterly and annual reports with the Securities and Exchange Commission, or “SEC”. These respective reports are on file and a matter of public record with the SEC and may be read and copied at the SEC’s Public Reference Room at 100 F Street, NE, Washington, DC 20549. The public may obtain information regarding our filings with the SEC by calling the SEC at 1-800-SEC-0330. The SEC maintains an Internet site that contains reports, proxy and information statements, and other information regarding issuers that file electronically with the SEC (http://www.sec.gov).
2
Table of Contents
BSB Bancorp’s executive offices are located at 2 Leonard Street, Belmont, Massachusetts 02478. Our telephone number at this address is (617) 484-6700, and our website address is www.belmontsavings.com. Information on our website should not be considered a part of this Form 10-K.
Market Area
We conduct our operations from our six full service branch offices located in Belmont, Watertown, Waltham, Newton and Cambridge in Southeast Middlesex County, Massachusetts. Our primary lending market includes Middlesex, Norfolk and Suffolk Counties, Massachusetts. Due to its proximity to Boston, our primary market area benefits from the presence of numerous institutions of higher learning, medical care and research centers and the corporate headquarters of several significant financial service companies. Eastern Massachusetts also has many high technology companies employing personnel with specialized skills. These factors affect the demand for residential homes, multi-family apartments, office buildings, shopping centers, industrial warehouses and other commercial properties.
Our lending area is primarily an urban market area with a substantial number of one-to-four unit properties, some of which are non-owner occupied, as well as apartment buildings, condominiums, office buildings and retail space. As a result, compared to many thrift institutions, our loan portfolio contains a significantly greater number of multi-family and commercial real estate loans.
Our market area is located largely in the Boston-Cambridge-Quincy, Massachusetts/New Hampshire Metropolitan Statistical Area (“MSA”). The United States Census Bureau estimates that as of July 1, 2016, the Boston metropolitan area is the 10th largest metropolitan area in the United States. Located adjacent to major transportation corridors, the Boston metropolitan area provides a highly diversified economic base, with major employment sectors ranging from services, manufacturing and wholesale/retail trade, to finance, technology, education and medical care. According to the United States Department of Labor, in December 2017, the Boston-Cambridge-Quincy, Massachusetts/New Hampshire MSA had an unemployment rate of 2.8% compared to the national unemployment rate of 3.9%.
Competition
We face intense competition in our market area both for making loans and attracting deposits. We compete with commercial banks, credit unions, savings institutions, online banks, mortgage brokerage firms, finance companies, mutual funds, insurance companies and investment banking firms. Some of our competitors have greater name recognition and market presence that benefit them in attracting customers, and offer certain services that we do not or cannot provide.
Our deposit sources are primarily from customers in the communities in which our offices are located, as well as from small businesses, municipalities, nonprofit organizations and other customers from our lending areas. As of June 30, 2017 (the latest date for which information is publicly available from the Federal Deposit Insurance Corporation), we ranked first of eleven bank and thrift institutions with offices in the town of Belmont, Massachusetts, with a 49.4% market share. As of that same date, we ranked fourth of seven bank and thrift institutions with offices in the city of Watertown, Massachusetts, with a 5.3% market share, eighth of ten bank and thrift institutions with offices in the city of Waltham, Massachusetts, with a 2.8% market share, thirteenth of fifteen bank and thrift institutions with offices in the city of Newton, Massachusetts, with a 1.0% market share, and thirteenth of sixteen bank and thrift institutions with offices in the city of Cambridge, with a 0.8% market share.
Lending Activities
Our primary lending activity is comprised of one-to-four family residential mortgage loans, multi-family real estate loans, commercial real estate loans, home equity lines of credit, indirect auto loans, commercial business loans and construction loans.
3
Table of Contents
Loan Portfolio Composition. The following table sets forth the composition of our loan portfolio at the dates indicated, excluding loans held for sale of $0, $0, $1.2 million, $0, and $0 at December 31, 2017, 2016, 2015, 2014, and 2013, respectively.
| At December 31, | ||||||||||||||||||||||||
| 2017 | 2016 | 2015 | ||||||||||||||||||||||
| Amount | Percent | Amount | Percent | Amount | Percent | |||||||||||||||||||
| (Dollars in thousands) | ||||||||||||||||||||||||
| Mortgage loans: |
||||||||||||||||||||||||
| Residential one to four family |
$ | 1,333,058 | 57.93 | % | $ | 997,336 | 53.34 | % | $ | 709,426 | 46.15 | % | ||||||||||||
| Commercial real estate (1) |
642,072 | 27.90 | 491,838 | 26.31 | 449,391 | 29.24 | ||||||||||||||||||
| Home equity lines of credit |
178,624 | 7.76 | 167,465 | 8.96 | 160,040 | 10.41 | ||||||||||||||||||
| Construction |
53,045 | 2.31 | 89,003 | 4.76 | 60,722 | 3.95 | ||||||||||||||||||
|
|
|
|
|
|
|
|
|
|
|
|
|
|||||||||||||
| Total mortgage loans |
2,206,799 | 95.90 | 1,745,642 | 93.37 | 1,379,579 | 89.75 | ||||||||||||||||||
|
|
|
|
|
|
|
|
|
|
|
|
|
|||||||||||||
| Commercial loans |
63,722 | 2.77 | 63,404 | 3.39 | 53,192 | 3.46 | ||||||||||||||||||
| Consumer loans: |
||||||||||||||||||||||||
| Indirect auto |
30,227 | 1.31 | 60,240 | 3.22 | 103,965 | 6.76 | ||||||||||||||||||
| Other consumer (2) |
435 | 0.02 | 439 | 0.02 | 453 | 0.03 | ||||||||||||||||||
|
|
|
|
|
|
|
|
|
|
|
|
|
|||||||||||||
| 94,384 | 4.10 | 124,083 | 6.63 | 157,610 | 10.25 | |||||||||||||||||||
|
|
|
|
|
|
|
|
|
|
|
|
|
|||||||||||||
| Total loans |
2,301,183 | 100.00 | % | 1,869,725 | 100.00 | % | 1,537,189 | 100.00 | % | |||||||||||||||
|
|
|
|
|
|
|
|||||||||||||||||||
| Net deferred loan costs |
3,426 | 3,622 | 4,663 | |||||||||||||||||||||
| Net unamortized mortgage premiums |
8,661 | 6,273 | 4,345 | |||||||||||||||||||||
| Allowance for loan losses |
(16,312 | ) | (13,585 | ) | (11,240 | ) | ||||||||||||||||||
|
|
|
|
|
|
|
|||||||||||||||||||
| Total loans, net |
$ | 2,296,958 | $ | 1,866,035 | $ | 1,534,957 | ||||||||||||||||||
|
|
|
|
|
|
|
|||||||||||||||||||
| At December 31, | ||||||||||||||||
| 2014 | 2013 | |||||||||||||||
| Amount | Percent | Amount | Percent | |||||||||||||
| (Dollars in thousands) | ||||||||||||||||
| Mortgage loans: |
||||||||||||||||
| Residential one-to-four family |
$ | 450,572 | 38.16 | % | $ | 287,652 | 34.17 | % | ||||||||
| Commercial real estate (1) |
395,178 | 33.47 | 320,807 | 38.10 | ||||||||||||
| Home equity lines of credit |
131,628 | 11.15 | 92,461 | 10.98 | ||||||||||||
| Construction |
31,389 | 2.66 | 9,965 | 1.18 | ||||||||||||
|
|
|
|
|
|
|
|
|
|||||||||
| Total mortgage loans |
1,008,767 | 85.44 | 710,885 | 84.43 | ||||||||||||
|
|
|
|
|
|
|
|
|
|||||||||
| Commercial loans |
39,161 | 3.32 | 30,691 | 3.65 | ||||||||||||
| Consumer loans: |
||||||||||||||||
| Indirect auto |
131,961 | 11.17 | 99,798 | 11.85 | ||||||||||||
| Other consumer (2) |
774 | 0.07 | 558 | 0.07 | ||||||||||||
|
|
|
|
|
|
|
|
|
|||||||||
| 171,896 | 14.56 | 131,047 | 15.57 | |||||||||||||
|
|
|
|
|
|
|
|
|
|||||||||
| Total loans |
1,180,663 | 100.00 | % | 841,932 | 100.00 | % | ||||||||||
|
|
|
|
|
|||||||||||||
| Net deferred loan costs |
5,068 | 3,535 | ||||||||||||||
| Net unamortized mortgage premiums |
2,549 | 1,504 | ||||||||||||||
| Allowance for loan losses |
(8,881 | ) | (7,958 | ) | ||||||||||||
|
|
|
|
|
|||||||||||||
| Total loans, net |
$ | 1,179,399 | $ | 839,013 | ||||||||||||
|
|
|
|
|
|||||||||||||
| (1) | Includes multi-family real estate loans. |
| (2) | Other consumer loans consist primarily of passbook loans, overdraft protection, overdraft privilege and consumer unsecured loans. |
4
Table of Contents
Loan Portfolio Maturities and Coupons. The following table summarizes the dollar amount of loans maturing in our portfolio based on their contractual terms to maturity at December 31, 2017. The table does not include any estimate of prepayments, which can significantly shorten the average life of all loans and may cause our actual repayment experience to differ from that shown below. Demand loans, loans having no stated repayment schedule or maturity, and overdraft loans are reported as being due in one year or less.
| Residential | Home | |||||||||||||||||||||||||||||||
| One to Four Family | Commercial Real Estate (1) | Equity Lines of Credit | Construction | |||||||||||||||||||||||||||||
| Amount | Coupon | Amount | Coupon | Amount | Coupon | Amount | Coupon | |||||||||||||||||||||||||
| (Dollars in thousands) | ||||||||||||||||||||||||||||||||
| Maturing During the Twelve Months Ending December 31, |
||||||||||||||||||||||||||||||||
| 2018 |
$ | 436 | 4.93 | % | $ | 3,439 | 4.31 | % | $ | 6 | 4.25 | % | $ | 13,605 | 4.81 | % | ||||||||||||||||
| 2019 |
37 | 4.35 | % | 11,177 | 4.29 | % | 8 | 4.25 | % | 13,826 | 4.31 | % | ||||||||||||||||||||
| 2020 to 2022 |
387 | 3.60 | % | 83,276 | 4.38 | % | 69 | 4.55 | % | — | 0.00 | % | ||||||||||||||||||||
| 2023 to 2027 |
37,921 | 3.34 | % | 414,148 | 4.18 | % | 2,578 | 4.15 | % | 9,064 | 4.01 | % | ||||||||||||||||||||
| 2028 to 2032 |
49,895 | 3.35 | % | 10,814 | 4.38 | % | 2,113 | 4.53 | % | — | 0.00 | % | ||||||||||||||||||||
| 2033 and beyond |
1,244,382 | 3.52 | % | 119,218 | 4.19 | % | 173,850 | 3.25 | % | 16,550 | 4.32 | % | ||||||||||||||||||||
|
|
|
|
|
|
|
|
|
|||||||||||||||||||||||||
| Total |
$ | 1,333,058 | 3.51 | % | $ | 642,072 | 4.21 | % | $ | 178,624 | 3.28 | % | $ | 53,045 | 4.39 | % | ||||||||||||||||
|
|
|
|
|
|
|
|
|
|||||||||||||||||||||||||
| Commercial | Indirect Auto | Other Consumer | Total | |||||||||||||||||||||||||||||
| Amount | Coupon | Amount | Coupon | Amount | Coupon | Amount | Coupon | |||||||||||||||||||||||||
| (Dollars in thousands) | ||||||||||||||||||||||||||||||||
| Maturing During the Twelve Months Ending December 31, |
||||||||||||||||||||||||||||||||
| 2018 |
$ | 13,443 | 4.34 | % | $ | 2,035 | 2.64 | % | $ | 413 | 2.66 | % | $ | 33,377 | 4.41 | % | ||||||||||||||||
| 2019 |
18,700 | 4.04 | % | 7,937 | 2.90 | % | — | 0.00 | % | 51,685 | 3.99 | % | ||||||||||||||||||||
| 2020 to 2022 |
26,946 | 4.08 | % | 20,255 | 3.31 | % | 22 | 11.85 | % | 130,955 | 4.15 | % | ||||||||||||||||||||
| 2023 to 2027 |
4,328 | 4.66 | % | — | 0.00 | % | — | 0.00 | % | 468,039 | 4.11 | % | ||||||||||||||||||||
| 2028 to 2032 |
305 | 4.50 | % | — | 0.00 | % | — | 0.00 | % | 63,127 | 3.57 | % | ||||||||||||||||||||
| 2033 and beyond |
— | 0.00 | % | — | 0.00 | % | — | 0.00 | % | 1,554,000 | 3.55 | % | ||||||||||||||||||||
|
|
|
|
|
|
|
|
|
|||||||||||||||||||||||||
| Total |
$ | 63,722 | 4.16 | % | $ | 30,227 | 3.16 | % | $ | 435 | 3.13 | % | $ | 2,301,183 | 3.72 | % | ||||||||||||||||
|
|
|
|
|
|
|
|
|
|||||||||||||||||||||||||
| (1) | Includes multi-family real estate loans. |
The following table sets forth the scheduled repayments of fixed and adjustable-rate loans at December 31, 2017 that are contractually due after December 31, 2018.
| Due After December 31, 2018 | ||||||||||||
| Fixed | Adjustable | Total | ||||||||||
| (Dollars in thousands) | ||||||||||||
| Mortgage loans: |
||||||||||||
| Residential one to four family |
$ | 659,451 | $ | 673,171 | $ | 1,332,622 | ||||||
| Commercial real estate loans (1) |
320,898 | 317,735 | 638,633 | |||||||||
| Equity lines of credit |
— | 178,618 | 178,618 | |||||||||
| Construction loans |
1,812 | 37,628 | 39,440 | |||||||||
|
|
|
|
|
|
|
|||||||
| Total mortgage loans |
982,161 | 1,207,152 | 2,189,313 | |||||||||
| Commercial loans |
7,905 | 42,374 | 50,279 | |||||||||
| Consumer loans: |
||||||||||||
| Indirect auto loans |
28,192 | — | 28,192 | |||||||||
| Other consumer loans |
22 | — | 22 | |||||||||
|
|
|
|
|
|
|
|||||||
| Total loans |
$ | 1,018,280 | $ | 1,249,526 | $ | 2,267,806 | ||||||
|
|
|
|
|
|
|
|||||||
| (1) | Includes multi-family real estate loans. |
5
Table of Contents
One-to-Four Family Residential Mortgage Loans.
At December 31, 2017, $1.33 billion, or 57.9%, of our total loan portfolio, consisted of one-to-four family residential mortgage loans. We offer fixed and adjustable rate residential mortgage loans with maturities up to 30 years.
Much of the housing stock in our primary lending market area is comprised of one, two, three and four unit properties, all of which are classified as one-to-four family residential mortgage loans. At December 31, 2017, of the $1.33 billion of one-to-four family residential mortgage loans in our portfolio, $59.6 million, or 4.5%, were comprised of non-owner occupied properties.
Our one-to-four family residential mortgage loans are generally underwritten according to Fannie Mae and Freddie Mac guidelines, and we refer to loans that conform to such guidelines as “conforming loans.” We generally originate and purchase both fixed and adjustable rate mortgage loans in amounts up to the maximum conforming loan limits as established by the Federal Housing Finance Agency, which is generally between $424,100 and $636,150 (increased to between $453,100 and $679,650 in 2018) for one-unit properties. We also originate and purchase loans above this amount, which are referred to as “jumbo loans.” We generally underwrite jumbo loans in a manner similar to conforming loans, and in adherence to Belmont Savings Bank’s Credit Policy. Jumbo loans are common in our market area. During the year ended December 31, 2017, we originated $74.5 million and purchased $392.6 million of jumbo loans.
We generally originate and purchase our adjustable rate one-to-four family residential mortgage loans with initial interest rate adjustment periods of one, three, five, seven and ten years, based on adding a margin to a designated market index. We determine whether a borrower qualifies for an adjustable rate mortgage loan annually based on secondary market guidelines.
We will originate and purchase one-to-four family residential mortgage loans with loan-to-value ratios up to 80% without private mortgage insurance. We will originate loans with loan-to-value ratios of up to 95% with private mortgage insurance and where the borrower’s debt service does not exceed 43% of the borrower’s monthly cash flow.
Occasionally, we sell into the secondary market both fixed and adjustable rate one-to-four family residential mortgage loans. We base the amount of loans that we sell into the secondary market on our liquidity needs, asset/liability mix, loan volume, portfolio size and other factors. We sell loans both servicing released and servicing retained. For the year ended December 31, 2017, we sold $69.4 million of one-to-four family residential mortgage loans and recognized gains of $936,000 on the sales. For the year ended December 31, 2017, we received servicing fees of $216,000 on one-to-four family residential mortgage loans that were previously sold. At December 31, 2017, the principal balance of loans serviced for others totaled $114.5 million.
We generally do not offer reverse mortgages, “interest only” mortgage loans on one to four family residential properties nor do we offer loans that provide for negative amortization of principal, such as “Option ARM” loans, where the borrower can pay less than the interest owed on his loan, resulting in an increased principal balance during the life of the loan. We do not offer “subprime loans” (loans that are made with low down payments to borrowers with weakened credit histories typically characterized by payment delinquencies, previous charge-offs, judgments, bankruptcies, or borrowers with questionable repayment capacity as evidenced by low credit scores or high debt-burden ratios) or Alt-A loans (defined as loans having less than full documentation).
Commercial Real Estate and Multi-family Real Estate Loans.
At December 31, 2017, $642.1 million, or 27.9%, of our loan portfolio consisted of commercial real estate loans and multi-family (which we consider to be five or more units) residential real estate loans. At December 31, 2017, substantially all of our commercial real estate and multi-family real estate loans were secured by properties located in Eastern Massachusetts.
Our commercial real estate mortgage loans are primarily secured by office buildings, owner-occupied commercial buildings, industrial buildings and strip mall centers.
6
Table of Contents
Our multi-family loans are primarily secured by five or more unit residential properties. At December 31, 2017, loans secured by commercial real estate and multi-family real estate had an average loan balance of $2.8 million. Also included within our commercial real estate portfolio are certain industrial revenue bonds. The Bank owns certain bonds issued by state agencies that it categorizes as loans. This categorization is made on the basis that another entity (i.e. the Bank’s customer), not the issuing agency, is responsible for the payment to the Bank of the principal and interest on the debt. Furthermore, credit underwriting is based solely on the credit of the customer (and guarantors, if any), the banking relationship is with the customer and not the agency, there is no active secondary market for the bonds, and the bonds are not available for sale, but are intended to be held by the Bank until maturity. At December 31, 2017, the balance of industrial development bonds was $13.7 million. These loans were secured by office property containing 60,250 feet of rentable area and fourteen one-to-four family residential properties.
We offer commercial real estate and multi-family real estate loans at fixed and adjustable rates. Our commercial real estate and multi-family real estate loans with adjustable rates generally have terms of ten years with fixed rates for the first five years and adjustable rates thereafter based on changes in a designated market index. These loans generally amortize on a twenty-five to thirty year basis, with a balloon payment due at maturity.
In underwriting commercial real estate and multi-family real estate loans, we consider a number of factors, which include the net cash flow to the loan’s debt service requirement (generally requiring a minimum of 125%), the age and condition of the collateral, the financial resources and income level of the borrower or guarantor and the borrower’s and guarantor’s experience in owning or managing similar properties. Commercial real estate and multi-family real estate loans are generally originated in amounts up to 80% of the appraised value or the purchase price of the property securing the loan, whichever is lower. Personal guarantees are typically obtained on these commercial real estate and multi-family real estate loans. In addition, the borrower’s and guarantors financial information on such loans is monitored on an ongoing basis through required periodic financial statement updates.
Commercial real estate and multi-family real estate loans generally carry higher interest rates and have shorter terms than one-to-four family residential mortgage loans. Commercial real estate and multi-family real estate loans, however, entail greater credit risks compared to the one-to-four family residential mortgage loans we hold as they typically involve larger loan balances concentrated with single borrowers or groups of related borrowers. In addition, the payment of loans secured by income producing properties typically depends on the successful operation of the property as repayment of the loan generally is dependent, in large part, on sufficient income from the property to cover operating expenses and debt service. Changes in economic conditions that are not in the control of the borrower or lender could affect the value of the collateral or the future cash flow of the property. Additionally, any decline in real estate values may be more pronounced for commercial real estate and multi-family real estate than for one-to-four family residential properties. All commercial real estate loans, regardless of size, are approved by Senior Vice President-Credit Manager of Commercial Real Estate Lending, the Executive Vice President and Division Executive of Commercial Real Estate Lending and the President and Chief Executive Officer of the Bank.
At December 31, 2017, our largest commercial real estate loan had an outstanding balance of $18.2 million, was secured by two office buildings and one industrial building totaling 337,852 square feet, and was performing in accordance with its original terms. At December 31, 2017, our largest multi-family real estate loan had a balance of $25.0 million, was secured by a 6 story, 80 unit residential building and was performing in accordance with its original terms.
Home Equity Lines of Credit. At December 31, 2017, $178.6 million, or 7.8%, of our loan portfolio consisted of home equity lines of credit. In addition to traditional one-to-four family residential mortgage loans, we offer home equity lines of credit that are secured by the borrower’s primary residence, secondary residence or one to four family investment properties. Home equity lines of credit are generally underwritten with the same criteria that we use to underwrite one-to-four family residential mortgage loans. In addition, the borrower’s financial condition is monitored on an ongoing basis through required periodic credit score reviews. If the borrower has shown signs of credit deterioration, home equity lines of credit may be frozen. Under the Tax Cuts and Jobs Act enacted on December 22, 2017, interest on home equity loans and lines of credit is only deductible if the proceeds are used to buy, build or substantially improve the taxpayer’s home that secures the loan or line of credit. This change could adversely impact the level of originations and outstanding volumes of home equity lines of credit in the future.
7
Table of Contents
Our home equity lines of credit are revolving lines of credit which generally have a term of twenty five years, with draws available for the first ten years. Our twenty five year lines of credit are interest only during the first ten years, and amortize on a fifteen year basis thereafter. We generally originate home equity lines of credit with loan-to-value ratios of up to 80% when combined with the principal balance of the existing first mortgage loan, although loan-to-value ratios may occasionally exceed 80% on a case by case basis. Maximum loan-to-values are determined based on an applicant’s credit score, property value and debt-to-income ratio. Lines of credit above $1 million with loan-to-values greater than 60% require two full appraisals with the valuation being the average of the two. Rates are adjusted monthly based on changes in a designated market index. At December 31, 2017, our largest home equity line of credit was a $2.3 million line of credit and did not have an outstanding balance. At December 31, 2017 this line of credit was performing in accordance with its original terms.
Commercial Loans. We originate commercial term loans and variable lines of credit to small- and medium-sized businesses in our primary market area. Our commercial loans are generally used for working capital purposes or for acquiring equipment or real estate. These loans are generally secured by real estate as well as business assets, such as business equipment and inventory or accounts receivable, and are generally originated with maximum loan-to-value ratios of up to 80%. The commercial business loans that we offer are generally adjustable-rate loans with terms ranging from three to five years. At December 31, 2017, we had $63.7 million of commercial business loans and lines of credit outstanding, representing 2.8% of our total loan portfolio. At December 31, 2017, the average outstanding loan balance of our commercial loans and lines of credit was $980,000.
When making commercial business loans, we consider the financial condition of the borrower, the payment history of the borrower, the debt service capabilities of the borrower, the projected cash flows of the business and the value of the collateral, if any. Generally our loans are guaranteed by the principals of the borrower.
Commercial business loans generally have a greater credit risk than residential mortgage loans. Unlike residential mortgage loans, which generally are made on the basis of the borrower’s ability to make repayment from his or her employment and other income, and which are secured by real property whose value tends to be more easily ascertainable, commercial business loans are of higher risk and typically are made on the basis of the borrower’s ability to make repayment from the cash flow of the borrower’s business. As a result, the availability of funds for the repayment of commercial business loans may be substantially dependent on the success of the business itself. Further, the collateral securing the loans may depreciate over time, may be difficult to appraise and may fluctuate in value based on the success of the business. We seek to minimize these risks through our underwriting standards and the experience of our credit department. The credit department is responsible for the underwriting and documentation of new commercial loans as well as the annual review of credit ratings of existing loans and special credit projects. The credit department has no loan production goals and has annual performance objectives based on credit quality and credit risk management. All commercial loans, regardless of size, are approved by the Senior Vice President-Credit Manager of Commercial Real Estate Lending, the Executive Vice President and Division Executive of Commercial Real Estate Lending and the President and Chief Executive Officer of the Bank.
At December 31, 2017, our largest commercial loan outstanding was a $14.6 million loan secured by five separate Class A suburban office properties with a combined total of 487,254 square feet of rentable space, on a combined 47 acres of property. At December 31, 2017, this loan was performing in accordance with its original terms.
Construction Loans. We originate loans to professional developers and investors to finance the construction of one-to-four family residential properties, multi-family properties and commercial properties. The majority of our construction loans are for commercial development projects, including residential properties. Most of our loans for the construction of one-to-four family residential properties are “on speculation,” meaning there is no buyer committed to purchase the completed residence. At December 31, 2017, $53.0 million, or 2.3%, of our total loan portfolio, consisted of construction loans, $5.4 million of which were secured by one-to-four family residential real estate projects on speculation, $26.9 million of which were secured by multi-family residential real estate projects, and $20.8 million of which were secured by land and commercial real estate.
Our construction loans generally provide for the payment of interest only during the construction phase, which is usually 12 to 24 months. At the end of the construction phase, depending upon the initial purpose, the loan either converts to a permanent mortgage loan or the project is sold and the loan is paid off.
8
Table of Contents
Loans generally are made with a maximum loan to cost ratio of 75%, or a maximum loan-to-as completed value ratio of 75%, whichever is lower. Before making a commitment to fund a construction loan, we require an appraisal of the property by an independent licensed appraiser. We also require satisfactory inspections of the property and a satisfactory title update before disbursements of funds during the term of the construction loan.
At December 31, 2017, our largest speculative construction loan had a principal balance of $14.7 million and was secured by a 2.24 acre former grocery store site improved by two new six-story buildings including 210 residential apartment units, 1,951 square feet of ground floor retail space and 168 on-site parking spaces. At December 31, 2017, this loan was performing in accordance with its original terms.
Construction financing generally involves greater credit risk than the financing of improved cash flowing real estate. Risk of loss on a construction loan depends largely upon the accuracy of the initial estimate of the value of the property at completion of construction compared to the estimated cost (including interest) of construction and other assumptions. If the estimate of construction cost is inaccurate, we may be required to advance additional funds beyond the amount originally committed in order to protect the value of the property. Moreover, if the estimated value of the completed project is inaccurate, the borrower may hold a property with a value that is insufficient to assure full repayment of the construction loan upon the sale of the property. Construction loans also expose us to the risk that improvements will not be completed on time in accordance with specifications and projected costs. In addition, the ultimate sale or rental of the property may not occur as anticipated.
Indirect Automobile Loans and Other Consumer Loans. In the fourth quarter of 2010, we began originating indirect automobile loans. These are automobile loans that franchised dealerships originate and assign to us, upon our approval, for a premium based on pre-established rates and terms. During the year ended December 31, 2017, our portfolio of indirect auto loans decreased from $60.2 million to $30.2 million, a decrease of 49.8% as we decided to suspend new originations due to market conditions during the second quarter of 2015.
To a lesser extent we also offer a variety of other consumer loans, primarily loans secured by savings deposits. At December 31, 2017, our portfolio of consumer loans other than indirect automobile loans totaled $435,000, or 0.02%, of our total loan portfolio.
Indirect automobile loans and other consumer loans generally have shorter terms to maturity, which reduces our exposure to changes in interest rates. In addition, management believes that offering consumer loan products helps to expand and create stronger ties to our existing customer base by increasing the number of customer relationships and providing cross-marketing opportunities.
Consumer loans generally have greater risk compared to longer-term loans secured by improved, owner-occupied real estate, particularly consumer loans that are secured by rapidly depreciable assets, such as automobiles. In these cases, any repossessed collateral for a defaulted loan may not provide an adequate source of repayment of the outstanding loan balance. As a result, consumer loan repayments are dependent on the borrower’s continuing financial stability and thus are more likely to be adversely affected by job loss, divorce, illness or personal bankruptcy. Furthermore, our consumer loan portfolio contains a substantial number of indirect automobile loans where we assume the risk that the automobile dealership administering the lending process complies with federal, state and local consumer protection laws.
Loan Originations, Purchases, Sales, Participations and Servicing. Residential one-to-four family loans that we originate are generally underwritten pursuant to our policies and procedures, which incorporate standard underwriting guidelines, including those of Fannie Mae, to the extent applicable. We originate both adjustable-rate and fixed-rate loans. Our loan origination and sales activity may be adversely affected by a rising interest rate environment that typically results in decreased loan demand. Most of our one-to-four family residential mortgage loan originations are generated by our loan officers or referred by branch managers and employees located in our banking offices.
In recent years, in an effort to manage interest rate risk in what has been a relatively low interest rate environment, as well as generate non-interest income, we have sold a portion of fixed-rate one-to-four family residential mortgage loans that we have originated or purchased.
9
Table of Contents
Some of these loans were sold with the servicing rights released. For loans sold with servicing rights retained, we provide the servicing for the loans on a per-loan fee basis.
For the year ended December 31, 2017, we recognized $160,000 in net servicing income on residential mortgage loans that we sold and retained the servicing rights. At December 31, 2017, the principal balance of residential mortgage loans serviced for others totaled $114.5 million. For the year ended December 31, 2017, we recognized $238,000 in net servicing income on indirect auto loans that we sold and retained the servicing rights. At December 31, 2017, the principal balance of indirect auto loans serviced for others totaled $10.5 million.
We generally sell our loans without recourse, except for customary representations and warranties provided in sales transactions. Loan servicing includes collecting and remitting loan payments, accounting for principal and interest, contacting delinquent borrowers, supervising foreclosures and property dispositions in the event of unremedied defaults, making certain insurance and tax payments on behalf of the borrowers and generally administering the loans. We retain a portion of the interest paid by the borrower on the loans we service as consideration for our servicing activities.
From time to time, we will participate in loans with other banks. Whether we are the lead lender or not, we follow our customary loan underwriting and approval policies. At December 31, 2017, we held $25.0 million of commercial real estate loans in our portfolio that were participation loans from other lenders and we are the lead bank on $239.7 million of commercial real estate and commercial construction loans of which $66.6 million has been participated out to other lenders.
We also purchase whole loans from other banks and mortgage companies. In these cases, we follow our customary loan underwriting and approval policies. During the year ended December 31, 2017, we purchased one-to-four family residential mortgage loans of $438.9 million, of whole loans, with both fixed and adjustable rates, from other banks and mortgage companies.
Loan Approval Procedures and Authority. Our lending activities follow written, non-discriminatory underwriting standards and loan origination procedures established by senior management and approved by our Board of Directors. The loan approval process is intended to assess the borrower’s ability to repay the loan and the value of the collateral that will secure the loan. To assess the borrower’s ability to repay, we review the borrower’s employment and credit history and information on the historical and projected income and expenses of the borrower. We require “full documentation” on all of our loan applications.
Our policies and loan approval limits are approved by our Board of Directors. Aggregate commercial lending relationships in amounts up to $1.0 million can be approved by designated individual officers or officers acting together with specific lending approval authority. Individual commercial loans and commercial relationships of $1.0 million or greater require the approval of the Executive Committee of the Board of Directors (“Executive Committee”). All commercial real estate and commercial loans, regardless of size, are approved by the Senior Vice President-Credit Manager of Commercial Real Estate Lending, the Executive Vice President and Division Executive of Commercial Real Estate Lending and the President and Chief Executive Officer of the Bank.
In accordance with governing banking statutes, the Bank is permitted, with certain exceptions, to make loans and commitments to any one borrower, including related entities, in the aggregate amount of not more than 20% of the Bank’s Tier 1 capital, or $34.6 million, at December 31, 2017, which is the Bank’s legal lending limit. There were no borrowers whose total indebtedness in aggregate exceeded the Bank’s legal lending limit.
We seek to minimize credit risks through our underwriting standards and the experience of our credit department. The credit department is responsible for the underwriting and documentation of new commercial loans as well as the annual review of credit ratings of existing loans and special credit projects. We consider our credit department to be independent because it has no loan production goals and has annual performance objectives based on credit quality and credit risk management.
We require appraisals based on a comparison with current market sales for all real property securing one-to-four family residential mortgage loans, multi-family loans and commercial real estate loans, unless the Executive Committee approves an alternative means of valuation.
10
Table of Contents
All appraisers are independent, state-licensed or state-certified appraisers and are approved by the Board of Directors annually.
Non-Performing and Problem Assets
When a residential mortgage loan or home equity line of credit is 15 days past due, a late payment notice is generated and mailed to the borrower. We will attempt personal, direct contact with the borrower to determine when payment will be made. We will send a letter when a loan is 30 days or more past due and will attempt to contact the borrower by telephone. Thereafter, we will send an additional letter when a loan is 60 days or more past due, and we will attempt to contact the borrower by telephone. By the 90th day of delinquency, unless the borrower has made arrangements to bring the loan current on its payments, the loan will be placed on non-accrual. We refer loans to legal counsel to commence foreclosure proceedings according to Massachusetts law. In addition, a property appraisal is made to determine the current condition and market value of the property. The account will be monitored on a regular basis thereafter. In attempting to resolve a default on a residential mortgage loan, Belmont Savings Bank complies with all applicable Massachusetts laws regarding a borrower’s right to cure the default.
When auto finance loans become 10 to 15 days past due, a late fee is charged according to applicable guidelines. When the loan is 11 days past due, the customer will receive a phone call from our servicer requesting a payment. Letters are generated at 20 and 25 days past due. A letter stating our intent to repossess the automobile goes to the customer 21 days prior to repossession, which is triggered at 45 days past due. Vehicles are assigned for repossession at 65 to 70 days past due. Once an automobile has been repossessed, the customer has 21 days for right of redemption until the vehicle is sold. Auto loans are placed on non-accrual status at 90 days past due and charged off at 120 days past due.
Commercial business loans, commercial real estate loans and consumer loans are generally handled in the same manner as residential mortgage loans or home equity lines of credit. All commercial business loans that are 30 days past due are immediately referred to a senior lending officer. Because of the nature of the collateral securing consumer loans, we may commence collection procedures faster for consumer loans than for residential mortgage loans or home equity lines of credit.
Loans are placed on non-accrual status when payment of principal or interest is more than 90 days delinquent. Loans are also placed on non-accrual status if collection of principal or interest in full and in a timely manner is in doubt. When loans are placed on a non-accrual status, unpaid accrued interest is fully reversed, and further income is recognized only to the extent received. In general, the loan may be returned to accrual status if both principal and interest payments are brought current and remain current for six consecutive months and full payment of principal and interest is expected. All non-performing loans and problem assets are reviewed by the Executive Committee on a regular basis.
11
Table of Contents
Non-Performing Assets. The table below sets forth the amounts and categories of our non-performing assets at the dates indicated.
| At December 31, | ||||||||||||||||||||
| 2017 | 2016 | 2015 | 2014 | 2013 | ||||||||||||||||
| (Dollars in thousands) | ||||||||||||||||||||
| Non-accrual loans: |
||||||||||||||||||||
| Mortgage loans: |
||||||||||||||||||||
| One-to-four family |
$ | 1,372 | $ | 1,804 | $ | 1,192 | $ | 2,662 | $ | 3,860 | ||||||||||
| Commercial real estate |
— | — | 2,424 | — | 38 | |||||||||||||||
| Construction loans |
— | — | — | — | — | |||||||||||||||
| Equity lines of credit |
— | — | — | 96 | 200 | |||||||||||||||
| Commercial loans |
— | — | — | — | — | |||||||||||||||
| Consumer loans: |
||||||||||||||||||||
| Indirect auto loans |
4 | 15 | 15 | 12 | 16 | |||||||||||||||
| Other consumer loans |
— | — | — | — | 1 | |||||||||||||||
|
|
|
|
|
|
|
|
|
|
|
|||||||||||
| Total non-accrual loans |
$ | 1,376 | $ | 1,819 | $ | 3,631 | $ | 2,770 | $ | 4,115 | ||||||||||
|
|
|
|
|
|
|
|
|
|
|
|||||||||||
| Loans delinquent 90 days or greater and still accruing: |
||||||||||||||||||||
| Mortgage loans: |
||||||||||||||||||||
| Residential one-to-four family |
— | — | — | — | — | |||||||||||||||
| Commercial real estate |
— | — | — | — | — | |||||||||||||||
| Construction loans |
— | — | — | — | — | |||||||||||||||
| Equity lines of credit |
— | — | — | — | — | |||||||||||||||
| Commercial loans |
— | — | — | — | — | |||||||||||||||
| Consumer loans: |
||||||||||||||||||||
| Indirect auto loans |
— | — | — | — | — | |||||||||||||||
| Other consumer loans |
— | — | — | — | — | |||||||||||||||
|
|
|
|
|
|
|
|
|
|
|
|||||||||||
| Total loans 90 days delinquent and still accruing |
— | — | — | — | — | |||||||||||||||
|
|
|
|
|
|
|
|
|
|
|
|||||||||||
| Total non-performing loans |
$ | 1,376 | $ | 1,819 | $ | 3,631 | $ | 2,770 | $ | 4,115 | ||||||||||
|
|
|
|
|
|
|
|
|
|
|
|||||||||||
| Other real estate owned |
$ | — | $ | — | $ | — | $ | — | $ | — | ||||||||||
|
|
|
|
|
|
|
|
|
|
|
|||||||||||
| Total repossessed vehicles |
$ | — | $ | 3 | $ | 8 | $ | 48 | $ | — | ||||||||||
|
|
|
|
|
|
|
|
|
|
|
|||||||||||
| Total non-performing assets (NPAs) |
$ | 1,376 | $ | 1,822 | $ | 3,639 | $ | 2,818 | $ | 4,115 | ||||||||||
|
|
|
|
|
|
|
|
|
|
|
|||||||||||
| Troubled debt restructures included in NPAs |
$ | 645 | $ | 1,442 | $ | 781 | $ | 1,551 | $ | 1,900 | ||||||||||
| Troubled debt restructures not included in NPAs |
4,194 | 4,656 | 7,007 | 7,675 | 7,366 | |||||||||||||||
|
|
|
|
|
|
|
|
|
|
|
|||||||||||
| Total troubled debt restructures |
$ | 4,839 | $ | 6,098 | $ | 7,788 | $ | 9,226 | $ | 9,266 | ||||||||||
|
|
|
|
|
|
|
|
|
|
|
|||||||||||
| Ratios: |
||||||||||||||||||||
| Non-performing loans to total loans |
0.06 | % | 0.10 | % | 0.24 | % | 0.23 | % | 0.49 | % | ||||||||||
| Non-performing assets to total assets |
0.05 | % | 0.08 | % | 0.20 | % | 0.20 | % | 0.39 | % | ||||||||||
For the years ended December 31, 2017 and 2016, gross interest income that would have been recorded had our non-accruing loans been current in accordance with their original terms was $56,000 and $76,000, respectively. Interest income recognized on such loans for the years ended December 31, 2017 and 2016, was $19,000 and $0, respectively. Loans remain on non-accrual until both principal and interest payments are brought current and remain current for six consecutive months and full payment of principal and interest is expected. As of December 31, 2017, $645,000 in non-performing loans were paid current.
12
Table of Contents
Troubled Debt Restructurings. We periodically modify loans to extend the term or make other concessions to help a borrower stay current on their loan and to avoid foreclosure. We generally do not forgive principal or interest on loans or modify the interest rates on loans to rates that are below market rates. At December 31, 2017 and 2016, we had $4.8 million and $6.1 million, respectively, of troubled debt restructurings. At December 31, 2017, $2.0 million was related to five residential one-to-four family loans and $2.9 million was related to two commercial real estate loans. At December 31, 2016, $2.5 million was related to six residential one to four family loans, $200,000 was related to one home equity line of credit and $3.4 million was related to three commercial real estate loans. For the years ended December 31, 2017 and 2016, gross interest income that would have been recorded had our troubled debt restructurings been performing in accordance with their original terms was $98,000 and $119,000, respectively. Interest income recognized on such modified loans for the years ended December 31, 2017 and 2016 was $194,000 and $201,000, respectively.
13
Table of Contents
Delinquent Loans. The following table sets forth certain information with respect to our loan portfolio delinquencies at the dates indicated.
| Loans Delinquent For | ||||||||||||||||||||||||
| 60 to 89 Days | 90 Days or Greater | Total | ||||||||||||||||||||||
| Number | Amount | Number | Amount | Number | Amount | |||||||||||||||||||
| (Dollars in thousands) | ||||||||||||||||||||||||
| At December 31, 2017 |
||||||||||||||||||||||||
| Mortgage loans: |
||||||||||||||||||||||||
| Residential one to four family |
— | $ | — | 1 | $ | 260 | 1 | $ | 260 | |||||||||||||||
| Commercial real estate loans |
— | — | — | — | — | — | ||||||||||||||||||
| Construction loans |
— | — | — | — | — | — | ||||||||||||||||||
| Equity lines of credit |
— | — | — | — | — | — | ||||||||||||||||||
|
|
|
|
|
|
|
|
|
|
|
|
|
|||||||||||||
| — | — | 1 | 260 | 1 | 260 | |||||||||||||||||||
| Commercial loans |
— | — | — | — | — | — | ||||||||||||||||||
| Consumer loans: |
||||||||||||||||||||||||
| Indirect auto loans |
4 | 30 | 1 | 4 | 5 | 34 | ||||||||||||||||||
| Other consumer loans |
— | — | — | — | — | — | ||||||||||||||||||
|
|
|
|
|
|
|
|
|
|
|
|
|
|||||||||||||
| Total loans |
4 | $ | 30 | 2 | $ | 264 | 6 | $ | 294 | |||||||||||||||
|
|
|
|
|
|
|
|
|
|
|
|
|
|||||||||||||
| At December 31, 2016 |
||||||||||||||||||||||||
| Mortgage loans: |
||||||||||||||||||||||||
| Residential one to four family |
— | $ | — | 1 | $ | 497 | 1 | $ | 497 | |||||||||||||||
| Commercial real estate loans |
— | — | — | — | — | — | ||||||||||||||||||
| Construction loans |
— | — | — | — | — | — | ||||||||||||||||||
| Equity lines of credit |
1 | 486 | — | — | 1 | 486 | ||||||||||||||||||
|
|
|
|
|
|
|
|
|
|
|
|
|
|||||||||||||
| 1 | 486 | 1 | 497 | 2 | 983 | |||||||||||||||||||
| Commercial loans |
— | — | — | — | — | — | ||||||||||||||||||
| Consumer loans: |
||||||||||||||||||||||||
| Indirect auto loans |
7 | 106 | 1 | 15 | 8 | 121 | ||||||||||||||||||
| Other consumer loans |
— | — | — | — | — | — | ||||||||||||||||||
|
|
|
|
|
|
|
|
|
|
|
|
|
|||||||||||||
| Total loans |
8 | $ | 592 | 2 | $ | 512 | 10 | $ | 1,104 | |||||||||||||||
|
|
|
|
|
|
|
|
|
|
|
|
|
|||||||||||||
| At December 31, 2015 |
||||||||||||||||||||||||
| Mortgage loans: |
||||||||||||||||||||||||
| Residential one to four family |
2 | $ | 81 | 1 | $ | 411 | 3 | $ | 492 | |||||||||||||||
| Commercial real estate loans |
— | — | — | — | — | — | ||||||||||||||||||
| Construction loans |
— | — | — | — | — | — | ||||||||||||||||||
| Equity lines of credit |
— | — | — | — | — | — | ||||||||||||||||||
|
|
|
|
|
|
|
|
|
|
|
|
|
|||||||||||||
| 2 | 81 | 1 | 411 | 3 | 492 | |||||||||||||||||||
| Commercial loans |
— | — | — | — | — | — | ||||||||||||||||||
| Consumer loans: |
||||||||||||||||||||||||
| Indirect auto loans |
4 | 47 | 1 | 15 | 5 | 62 | ||||||||||||||||||
| Other consumer loans |
— | — | — | — | — | — | ||||||||||||||||||
|
|
|
|
|
|
|
|
|
|
|
|
|
|||||||||||||
| Total loans |
6 | $ | 128 | 2 | $ | 426 | 8 | $ | 554 | |||||||||||||||
|
|
|
|
|
|
|
|
|
|
|
|
|
|||||||||||||
14
Table of Contents
| Loans Delinquent For | ||||||||||||||||||||||||
| 60 to 89 Days | 90 Days or Greater | Total | ||||||||||||||||||||||
| Number | Amount | Number | Amount | Number | Amount | |||||||||||||||||||
| At December 31, 2014 |
||||||||||||||||||||||||
| Mortgage loans: |
||||||||||||||||||||||||
| Residential one to four family |
1 | $ | 230 | 3 | $ | 2,432 | 4 | $ | 2,662 | |||||||||||||||
| Commercial real estate loans |
— | — | — | — | — | — | ||||||||||||||||||
| Construction loans |
— | — | — | — | — | — | ||||||||||||||||||
| Equity lines of credit |
— | — | 1 | 96 | 1 | 96 | ||||||||||||||||||
|
|
|
|
|
|
|
|
|
|
|
|
|
|||||||||||||
| 1 | 230 | 4 | 2,528 | 5 | 2,758 | |||||||||||||||||||
| Commercial loans |
— | — | — | — | — | — | ||||||||||||||||||
| Consumer loans: |
||||||||||||||||||||||||
| Indirect auto loans |
4 | 45 | 1 | 12 | 5 | 57 | ||||||||||||||||||
| Other consumer loans |
— | — | — | — | — | — | ||||||||||||||||||
|
|
|
|
|
|
|
|
|
|
|
|
|
|||||||||||||
| Total loans |
5 | $ | 275 | 5 | $ | 2,540 | 10 | $ | 2,815 | |||||||||||||||
|
|
|
|
|
|
|
|
|
|
|
|
|
|||||||||||||
| At December 31, 2013 |
||||||||||||||||||||||||
| Mortgage loans: |
||||||||||||||||||||||||
| Residential one to four family |
— | $ | — | 1 | $ | 1,911 | 1 | $ | 1,911 | |||||||||||||||
| Commercial real estate loans |
— | — | 1 | 38 | 1 | 38 | ||||||||||||||||||
| Construction loans |
— | — | — | — | — | — | ||||||||||||||||||
| Equity lines of credit |
— | — | — | — | — | — | ||||||||||||||||||
|
|
|
|
|
|
|
|
|
|
|
|
|
|||||||||||||
| — | — | 2 | 1,949 | 2 | 1,949 | |||||||||||||||||||
| Commercial loans |
— | — | — | — | — | — | ||||||||||||||||||
| Consumer loans: |
||||||||||||||||||||||||
| Indirect auto loans |
— | — | 1 | 16 | 1 | 16 | ||||||||||||||||||
| Other consumer loans |
— | — | 1 | 1 | 1 | 1 | ||||||||||||||||||
|
|
|
|
|
|
|
|
|
|
|
|
|
|||||||||||||
| Total loans |
— | $ | — | 4 | $ | 1,966 | 4 | $ | 1,966 | |||||||||||||||
|
|
|
|
|
|
|
|
|
|
|
|
|
|||||||||||||
Other Real Estate Owned. Real estate acquired by us as a result of foreclosure or by deed in lieu of foreclosure is classified as other real estate owned. When property is acquired it is recorded at the estimated fair value at the date of foreclosure less the estimated costs to sell, establishing a new cost basis. Estimated fair value generally represents the sales price a buyer would be willing to pay on the basis of current market conditions, including normal terms from other financial institutions. Holding costs and declines in estimated fair value result in charges to expense after acquisition. At December 31, 2017 and 2016 we did not have any property classified as other real estate owned.
Classification of Assets. Our policies, consistent with regulatory guidelines, provide for the classification of loans and other assets that are considered to be of lesser quality as substandard, doubtful, or loss assets. An asset is considered substandard if it is inadequately protected by the current paying capacity of the obligor or of the collateral pledged, if any. Substandard assets include those assets characterized by the distinct possibility that we will sustain some loss if the deficiencies are not corrected. Assets classified as doubtful have all of the weaknesses inherent in those classified substandard with the added characteristic that the weaknesses present make collection or liquidation in full, on the basis of currently existing facts, conditions and values, highly questionable and improbable. Assets (or portions of assets) classified as loss are those considered uncollectible and of such little value that their continuance as assets is not warranted. Assets that do not expose us to risk sufficient to warrant classification in one of the aforementioned categories, but which possess potential weaknesses that deserve our close attention, are required to be designated as special mention.
15
Table of Contents
We maintain an allowance for loan losses at an amount estimated to equal all credit losses incurred in our loan portfolio that are both probable and reasonable to estimate at a balance sheet measurement date. Our determination as to the classification of our assets and the amount of our loss allowances is subject to review by regulatory agencies, which may require that we establish additional loss allowances. We regularly review our asset portfolio to determine whether any assets require classification in accordance with applicable regulations.
The following table sets forth our amounts of classified assets, assets designated as special mention and criticized assets (classified assets and loans designated as special mention) as of the dates indicated.
| At December 31, | ||||||||||||||||||||
| 2017 | 2016 | 2015 | 2014 | 2013 | ||||||||||||||||
| (Dollars in thousands) | ||||||||||||||||||||
| Classified loans: |
||||||||||||||||||||
| Substandard |
$ | 6,650 | $ | 7,623 | $ | 9,786 | $ | 12,960 | $ | 15,053 | ||||||||||
| Doubtful |
— | — | — | — | — | |||||||||||||||
| Loss |
— | — | — | — | — | |||||||||||||||
|
|
|
|
|
|
|
|
|
|
|
|||||||||||
| Total classified loans |
6,650 | 7,623 | 9,786 | 12,960 | 15,053 | |||||||||||||||
| Special mention |
384 | 16,383 | 19,781 | 1,136 | 7,657 | |||||||||||||||
|
|
|
|
|
|
|
|
|
|
|
|||||||||||
| Total criticized loans |
$ | 7,034 | $ | 24,006 | $ | 29,567 | $ | 14,096 | $ | 22,710 | ||||||||||
|
|
|
|
|
|
|
|
|
|
|
|||||||||||
At December 31, 2017, we had $6.7 million of substandard assets, of which $3.8 million were commercial real estate loans, $2.1 million were one-to-four family residential mortgage loans, and $772,000 was a home equity line of credit. At December 31, 2017, special mention assets consisted of $344,000 of one-to-four family residential mortgage loans and $40,000 of commerial lines of credit. Other than disclosed in the above tables, there are no other loans at December 31, 2017 that management has serious doubts about the ability of the borrowers to comply with the present loan repayment terms.
Potential Problem Loans. Potential problem loans are loans that are currently performing and are not included in non-accrual loans above, but may be delinquent. These loans require an increased level of management attention, because we have serious doubts as to the ability of the borrower to comply with the present loan repayment terms and as a result such loans may be included at a later date in non-accrual loans. At December 31, 2017, we had no potential problem loans that are not discussed above under “Classification of Assets.”
Allowance for Loan Losses
We provide for loan losses based upon the consistent application of our documented allowance for loan losses methodology. All loan losses are charged to the allowance for loan losses and all recoveries are credited to it. Additions to the allowance for loan losses are provided by charges to income based on various factors which, in our judgment, deserve current recognition in estimating probable losses. We regularly review the loan portfolio, including a review of our classified assets, and make provisions for loan losses in order to maintain the allowance for loan losses in accordance with Accounting Principles Generally Accepted in the United States of America (“GAAP”). The allowance for loan losses consists primarily of two components:
| (1) | specific allowances established for impaired loans (as defined by GAAP). The amount of impairment provided for as a specific allowance is measured based on the deficiency, if any, between the present value of expected future cash flows discounted at the loan’s effective interest rate at the time of impairment or, as a practical expedient, at the loan’s observable market price or the fair value of the collateral if the loan is collateral-dependent, and the carrying value of the loan; and |
16
Table of Contents
| (2) | general allowances established for loan losses on a portfolio basis for loans that do not meet the definition of impaired loans. The portfolio is grouped into homogenous pools by similar risk characteristics, primarily by loan type and regulatory classification. We apply an estimated incurred loss rate to each loan group. The loss rates applied are based upon our loss experience adjusted, as appropriate, for the environmental factors discussed below. This evaluation is inherently subjective, as it requires material estimates that may be susceptible to significant revisions based upon changes in economic and real estate market conditions. |
Actual loan losses may be significantly more than the allowance for loan losses we have established, which could have a material negative effect on our financial results.
The adjustments to historical loss experience are based on our evaluation of several qualitative and environmental factors, including:
| • | changes in any concentration of credit (including, but not limited to, concentrations by geography, industry or collateral type); |
| • | changes in the number and amount of non-accrual loans, watch list loans and past due loans; |
| • | changes in national, state and local economic trends; |
| • | changes in the types of loans in the loan portfolio; |
| • | changes in the experience and ability of personnel and management in the loan origination and loan servicing departments; |
| • | changes in the value of underlying collateral for collateral dependent loans; |
| • | changes in lending strategies; and |
| • | changes in lending policies and procedures. |
In addition, we may establish an unallocated allowance to provide for probable losses that have been incurred as of the reporting date but are not reflected in the allocated allowance.
We evaluate the allowance for loan losses based upon the combined total of the specific and general components. Generally when the loan portfolio increases, absent other factors, the allowance for loan losses methodology results in a higher dollar amount of estimated probable losses than would be the case without the increase. Generally when the loan portfolio decreases, absent other factors, the allowance for loan losses methodology results in a lower dollar amount of estimated probable losses than would be the case without the decrease.
We evaluate the loan portfolio on a quarterly basis and the allowance is adjusted accordingly. While we use the best information available to make evaluations, future adjustments to the allowance may be necessary if conditions differ substantially from the information used in making the evaluations. In addition, various regulatory agencies, as an integral part of their examination process, will periodically review the allowance for loan losses. Such agencies may require us to recognize additions to the allowance based on their analysis of information available to them at the time of their examination.
17
Table of Contents
The following table sets forth activity in our allowance for loan losses at and for the periods indicated.
| At or For the Years Ended December 31, | ||||||||||||||||||||
| 2017 | 2016 | 2015 | 2014 | 2013 | ||||||||||||||||
| (Dollars in thousands) | ||||||||||||||||||||
| Balance at the beginning of the period |
$ | 13,585 | $ | 11,240 | $ | 8,881 | $ | 7,958 | $ | 6,440 | ||||||||||
| Charge-offs: |
||||||||||||||||||||
| Residential one-to-four family |
— | — | (64 | ) | (375 | ) | — | |||||||||||||
| Commercial real estate |
— | — | — | — | — | |||||||||||||||
| Construction |
— | — | — | — | — | |||||||||||||||
| Commercial |
— | — | — | (4 | ) | — | ||||||||||||||
| Home equity |
— | — | — | (199 | ) | (20 | ) | |||||||||||||
| Indirect auto |
(45 | ) | (85 | ) | (139 | ) | (51 | ) | (62 | ) | ||||||||||
| Other consumer |
(14 | ) | (16 | ) | (16 | ) | (29 | ) | (53 | ) | ||||||||||
|
|
|
|
|
|
|
|
|
|
|
|||||||||||
| Total charge-offs |
(59 | ) | (101 | ) | (219 | ) | (658 | ) | (135 | ) | ||||||||||
| Recoveries: |
||||||||||||||||||||
| Residential one-to-four family |
— | — | — | — | 68 | |||||||||||||||
| Commercial real estate |
— | — | — | — | — | |||||||||||||||
| Construction |
— | — | — | — | — | |||||||||||||||
| Commercial |
— | — | 24 | — | — | |||||||||||||||
| Home equity |
— | — | 199 | — | — | |||||||||||||||
| Indirect auto |
22 | 56 | 32 | 15 | 69 | |||||||||||||||
| Other consumer |
2 | 5 | 6 | 14 | 18 | |||||||||||||||
|
|
|
|
|
|
|
|
|
|
|
|||||||||||
| Total recoveries |
24 | 61 | 261 | 29 | 155 | |||||||||||||||
| Net (charge-offs) recoveries |
(35 | ) | (40 | ) | 42 | (629 | ) | 20 | ||||||||||||
| Provision for loan losses |
2,762 | 2,385 | 2,317 | 1,552 | 1,498 | |||||||||||||||
|
|
|
|
|
|
|
|
|
|
|
|||||||||||
| Balance at the end of the period |
$ | 16,312 | $ | 13,585 | $ | 11,240 | $ | 8,881 | $ | 7,958 | ||||||||||
|
|
|
|
|
|
|
|
|
|
|
|||||||||||
| Ratios: |
||||||||||||||||||||
| Net (charge-offs) recoveries to average loans outstanding |
0.00 | % | 0.00 | % | 0.00 | % | (0.06 | )% | 0.00 | % | ||||||||||
| Allowance for loan losses to non-performing loans at end of period |
1185.47 | % | 746.84 | % | 309.56 | % | 320.59 | % | 193.39 | % | ||||||||||
| Allowance for loan losses to total loans at end of period |
0.71 | % | 0.73 | % | 0.73 | % | 0.75 | % | 0.95 | % | ||||||||||
18
Table of Contents
Allocation of Allowance for Loan Losses. The following table sets forth the allowance for loan losses allocated by loan category and the percent of loans in each category to total loans at the dates indicated. The allowance for loan losses allocated to each category is not necessarily indicative of future losses in any particular category and does not restrict the use of the allowance to absorb losses in other categories.
| At December 31, | ||||||||||||||||||||||||
| 2017 | 2016 | 2015 | ||||||||||||||||||||||
| (Dollars in thousands) | ||||||||||||||||||||||||
| Percent of | Percent of | Percent of | ||||||||||||||||||||||
| Loans in Each | Loans in Each | Loans in Each | ||||||||||||||||||||||
| Allowance for | Category to | Allowance for | Category to | Allowance for | Category to | |||||||||||||||||||
| Loan Losses | Total Loans | Loan Losses | Total Loans | Loan Losses | Total Loans | |||||||||||||||||||
| Mortgage loans: |
||||||||||||||||||||||||
| Residential one-to-four family |
$ | 6,400 | 57.93 | % | $ | 4,828 | 53.34 | % | $ | 3,574 | 46.15 | % | ||||||||||||
| Commercial real estate |
6,583 | 27.90 | 4,885 | 26.31 | 4,478 | 29.24 | ||||||||||||||||||
| Construction |
764 | 2.31 | 1,219 | 4.76 | 801 | 3.95 | ||||||||||||||||||
| Home equity |
947 | 7.76 | 1,037 | 8.96 | 928 | 10.41 | ||||||||||||||||||
| Commercial |
758 | 2.77 | 728 | 3.39 | 613 | 3.46 | ||||||||||||||||||
| Consumer loans: |
||||||||||||||||||||||||
| Indirect auto |
230 | 1.31 | 362 | 3.22 | 623 | 6.76 | ||||||||||||||||||
| Other consumer |
9 | 0.02 | 9 | 0.02 | 10 | 0.03 | ||||||||||||||||||
|
|
|
|
|
|
|
|
|
|
|
|
|
|||||||||||||
| Total allocated allowance |
15,691 | 100.00 | 13,068 | 100.00 | 11,027 | 100.00 | ||||||||||||||||||
| Unallocated allowance |
621 | — | 517 | — | 213 | — | ||||||||||||||||||
|
|
|
|
|
|
|
|
|
|
|
|
|
|||||||||||||
| Total allowance |
$ | 16,312 | 100.00 | % | $ | 13,585 | 100.00 | % | $ | 11,240 | 100.00 | % | ||||||||||||
|
|
|
|
|
|
|
|
|
|
|
|
|
|||||||||||||
| At December 31, | ||||||||||||||||
| 2014 | 2013 | |||||||||||||||
| (Dollars in thousands) | ||||||||||||||||
| Percent of | Percent of | |||||||||||||||
| Loans in Each | Loans in Each | |||||||||||||||
| Allowance for | Category to | Allowance for | Category to | |||||||||||||
| Loan Losses | Total Loans | Loan Losses | Total Loans | |||||||||||||
| Mortgage loans: |
||||||||||||||||
| Residential one-to-four family |
$ | 2,364 | 38.16 | % | $ | 2,189 | 34.17 | % | ||||||||
| Commercial real estate |
4,043 | 33.47 | 3,621 | 38.10 | ||||||||||||
| Construction |
228 | 2.66 | 134 | 1.18 | ||||||||||||
| Home equity |
828 | 11.15 | 681 | 10.98 | ||||||||||||
| Commercial |
458 | 3.32 | 419 | 3.65 | ||||||||||||
| Consumer loans: |
||||||||||||||||
| Indirect auto |
778 | 11.17 | 749 | 11.85 | ||||||||||||
| Other consumer |
11 | 0.07 | 26 | 0.07 | ||||||||||||
|
|
|
|
|
|
|
|
|
|||||||||
| Total allocated allowance |
8,710 | 100.00 | 7,819 | 100.00 | ||||||||||||
| Unallocated allowance |
171 | — | 139 | — | ||||||||||||
|
|
|
|
|
|
|
|
|
|||||||||
| Total allowance |
$ | 8,881 | 100.00 | % | $ | 7,958 | 100.00 | % | ||||||||
|
|
|
|
|
|
|
|
|
|||||||||
Investments
The Board of Directors has the responsibility for approving our investment policy, and it is the responsibility of management to implement specific investment strategies. The Executive Committee has authorized our President and Chief Executive Officer, our Executive Vice President and Chief Financial Officer, and our Senior Vice President, Director of External Reporting & Accounting Policy to execute specific investment actions. The investment policy requires that single day transactions in excess of $15.0 million must contain the signature of two authorized officers and a member of the Executive Committee.
19
Table of Contents
The investment policy is reviewed and approved annually by the Board of Directors. The overall objectives of the investment policy are to: fully and efficiently employ funds not presently required for Belmont Savings Bank’s loan portfolio, cash requirements, or other assets essential to our operations; to provide for the safety of the funds invested while generating maximum income and capital appreciation in accordance with the objectives of liquidity and quality; to meet liquidity requirements projected by management; to meet regulatory and industry standards; to generate earnings which, after the impact of taxes, will provide added growth to surplus; and to employ a percentage of assets in a manner that will balance the market and credit risks of other assets, as well as our liquidity, capital, and reserve structure. All gains and losses on securities transactions are reported to the Executive Committee on a monthly basis.
Our current investment policy permits investments in securities issued by the U.S. government and U.S. government agencies, municipal bonds, corporate bonds, mortgage-backed securities issued by Fannie Mae, Freddie Mac and Ginnie Mae, asset-backed securities (collateralized by assets other than conforming residential first mortgages), repurchase agreements, federal funds sold, certificates of deposit, money market funds, money market preferred securities, mutual funds, equity securities, daily overnight deposit funds, bankers acceptances, commercial paper, equity securities, structured notes, callable securities and any other investments that are deemed prudent and are approved by the Executive Committee and permitted by statute.
ASC 320, “Investments—Debt and Equity Securities” requires that, at the time of purchase, we designate a security as either held to maturity, available for sale, or trading, based upon our intent and ability to hold such security until maturity. Securities available for sale and trading securities are reported at fair value and securities held to maturity are reported at amortized cost. We currently do not maintain a trading portfolio. A periodic review and evaluation of the available-for-sale and held-to-maturity securities portfolios is conducted to determine if the fair value of any security has declined below its carrying value and whether such decline is other-than-temporary. For securities classified as available for sale, unrealized gains and losses are excluded from earnings and are reported as an increase or decrease to stockholders’ equity through other comprehensive income. If such decline is deemed to be other-than-temporary, the security is written down to a new cost basis and the resulting loss is charged against earnings or other comprehensive income.
Generally, mortgage-backed securities are more liquid than individual mortgage loans since there is an active trading market for such securities. In addition, mortgage-backed securities may be used to collateralize our borrowings. Investments in mortgage-backed securities involve a risk that actual payments will be greater or less than the prepayment rate estimated at the time of purchase, which may require adjustments to the amortization of any premium or accretion of any discount relating to such interests, thereby affecting the net yield on our securities. Current prepayment speeds determine whether prepayment estimates require modification that could cause amortization or accretion adjustments.
Securities. At December 31, 2017, our securities portfolio consisted entirely of corporate debt securities and mortgage-backed securities issued by Fannie Mae, Freddie Mac or Ginnie Mae. At December 31, 2017, our securities portfolio had a fair value of $175.3 million and an amortized cost of $177.1 million. Total securities had a carrying value of $177.0 million, or 6.6% of total assets. At December 31, 2017, none of the underlying collateral consisted of subprime or Alt-A (traditionally defined as loans having less than full documentation) loans. We do not own any trust preferred securities or collateralized debt obligations. See “Management’s Discussion and Analysis of Financial Condition and Results of Operations—Average Balances and Yields” for a discussion of the recent performance of our securities portfolio.
At December 31, 2017, we had no investments in a single company or entity, other than U.S. government-sponsored enterprises, that had an aggregate book value in excess of 10% of our stockholders’ equity.
20
Table of Contents
Investment Securities Portfolio. The following tables set forth the composition of our investment securities portfolio at the dates indicated.
| At December 31, | ||||||||||||||||||||||||
| 2017 | 2016 | 2015 | ||||||||||||||||||||||
| Amortized | Fair | Amortized | Fair | Amortized | Fair | |||||||||||||||||||
| Cost | Value | Cost | Value | Cost | Value | |||||||||||||||||||
| (Dollars in thousands) | ||||||||||||||||||||||||
| Available-for-sale securities: |
||||||||||||||||||||||||
| Corporate debt securities |
$ | 16,975 | $ | 16,921 | $ | 22,051 | $ | 22,048 | $ | 22,126 | $ | 21,876 | ||||||||||||
|
|
|
|
|
|
|
|
|
|
|
|
|
|||||||||||||
| Total available-for-sale securities |
$ | 16,975 | $ | 16,921 | $ | 22,051 | $ | 22,048 | $ | 22,126 | $ | 21,876 | ||||||||||||
|
|
|
|
|
|
|
|
|
|
|
|
|
|||||||||||||
| At December 31, | ||||||||||||||||||||||||
| 2017 | 2016 | 2015 | ||||||||||||||||||||||
| Amortized | Fair | Amortized | Fair | Amortized | Fair | |||||||||||||||||||
| Cost | Value | Cost | Value | Cost | Value | |||||||||||||||||||
| (Dollars in thousands) | ||||||||||||||||||||||||
| Held-to-maturity securities: |
||||||||||||||||||||||||
| U.S. government sponsored mortgage-backed securities |
$ | 142,383 | $ | 140,439 | $ | 112,543 | $ | 111,560 | $ | 119,517 | $ | 119,012 | ||||||||||||
| Corporate debt securities |
17,707 | 17,946 | 17,654 | 17,905 | 17,602 | 17,716 | ||||||||||||||||||
|
|
|
|
|
|
|
|
|
|
|
|
|
|||||||||||||
| Total securities held-to-maturity |
$ | 160,090 | $ | 158,385 | $ | 130,197 | $ | 129,465 | $ | 137,119 | $ | 136,728 | ||||||||||||
|
|
|
|
|
|
|
|
|
|
|
|
|
|||||||||||||
21
Table of Contents
Portfolio Maturities and Yields. The composition and maturities of the investment securities portfolio at December 31, 2017 are summarized in the following table. Maturities are based on the final contractual payment dates, and do not reflect the impact of scheduled payments, prepayments or early redemptions that may occur.
| More than One Year | More than Five Years | |||||||||||||||||||||||||||||||||||||||
| One Year or Less | through Five Years | through Ten Years | More than Ten Years | Total Securities | ||||||||||||||||||||||||||||||||||||
| Weighted | Weighted | Weighted | Weighted | Weighted | ||||||||||||||||||||||||||||||||||||
| Amortized | Average | Amortized | Average | Amortized | Average | Amortized | Average | Amortized | Average | |||||||||||||||||||||||||||||||
| Cost | Yield | Cost | Yield | Cost | Yield | Cost | Yield | Cost | Yield | |||||||||||||||||||||||||||||||
| (Dollars in thousands) | ||||||||||||||||||||||||||||||||||||||||
| U.S. government sponsored mortgage-backed securities |
$ | 3 | 1.06 | % | $ | 2,040 | 0.70 | % | $ | 32,640 | 1.90 | % | $ | 107,700 | 2.45 | % | $ | 142,383 | 2.30 | % | ||||||||||||||||||||
| Corporate debt securities |
19,753 | 2.33 | % | 14,929 | 2.89 | % | — | — | — | — | 34,682 | 2.57 | % | |||||||||||||||||||||||||||
|
|
|
|
|
|
|
|
|
|
|
|||||||||||||||||||||||||||||||
| Total |
$ | 19,756 | 2.33 | % | $ | 16,969 | 2.63 | % | $ | 32,640 | 1.90 | % | $ | 107,700 | 2.45 | % | $ | 177,065 | 2.35 | % | ||||||||||||||||||||
|
|
|
|
|
|
|
|
|
|
|
|||||||||||||||||||||||||||||||
22
Table of Contents
Bank-Owned Life Insurance. We invest in bank-owned life insurance to help defray the cost of our benefit plan obligations. Bank-owned life insurance also provides us noninterest income that is generally non-taxable. Applicable regulations generally limit our investment in bank-owned life insurance to 25% of our tier one risk based capital. At December 31, 2017, we had $37.0 million in bank-owned life insurance.
Sources of Funds
General. Deposits traditionally have been our primary source of funds for our investment and lending activities. We also borrow from the Federal Home Loan Bank of Boston (the “FHLB of Boston”) to supplement cash flow needs, to lengthen the maturities of liabilities for interest rate risk management purposes and to manage our cost of funds. Our additional sources of funds are scheduled payments and prepayments of principal and interest on loans and investment securities, fee income and proceeds from the sales of loans and securities.
Deposits. We accept deposits primarily from customers in the communities in which our offices are located, as well as from small businesses, municipalities, nonprofit organizations and other customers throughout our lending area. We rely on our competitive pricing and products, convenient locations and quality customer service to attract and retain deposits. We offer a variety of deposit accounts with a range of interest rates and terms. Our deposit accounts consist of relationship checking for consumers and businesses, passbook and statement savings accounts, certificates of deposit, money market accounts, IOLTA, commercial, municipal and regular checking accounts, and IRAs. Deposit rates and terms are based primarily on current business strategies and market interest rates, liquidity requirements and our deposit growth goals. We also access the brokered deposit market for funding.
At December 31, 2017, we had a total of $257.5 million in certificates of deposit, excluding brokered deposits, of which $138.3 million had remaining maturities of one year or less. Based on historical experience and our current pricing strategy, we believe we will retain a large portion of these accounts upon maturity. In addition, when rates and terms are competitive, and in keeping with the Bank’s interest rate risk and liquidity strategy, the Bank will supplement its customer deposit base with brokered deposits. As of December 31, 2017 and 2016, we had a total of $247.2 million and $156.4 million, respectively, of brokered certificates of deposit.
23
Table of Contents
The following tables set forth the distribution of our average total deposit accounts, by account type, for the periods indicated.
| For the Fiscal Year Ended | For the Fiscal Year Ended | |||||||||||||||||||||||
| December 31, 2017 | December 31, 2016 | |||||||||||||||||||||||
| Weighted | Weighted | |||||||||||||||||||||||
| Average | Average | Average | Average | |||||||||||||||||||||
| Balance | Percent | Rate | Balance | Percent | Rate | |||||||||||||||||||
| (Dollars in thousands) | ||||||||||||||||||||||||
| Deposit type: |
||||||||||||||||||||||||
| Demand deposits |
$ | 204,264 | 12.64 | % | — | % | $ | 189,234 | 13.84 | % | — | % | ||||||||||||
| Interest-bearing checking accounts |
133,805 | 8.28 | 0.43 | 135,387 | 9.90 | 0.40 | ||||||||||||||||||
| Regular savings accounts |
856,142 | 52.98 | 0.72 | 732,445 | 53.55 | 0.60 | ||||||||||||||||||
| Money market deposits |
8,297 | 0.51 | 0.01 | 8,337 | 0.61 | 0.01 | ||||||||||||||||||
| Certificates of deposit |
413,599 | 25.59 | 1.49 | 302,314 | 22.10 | 1.48 | ||||||||||||||||||
|
|
|
|
|
|
|
|
|
|||||||||||||||||
| Total deposits |
$ | 1,616,107 | 100.00 | % | 0.80 | % | $ | 1,367,717 | 100.00 | % | 0.69 | % | ||||||||||||
|
|
|
|
|
|
|
|
|
|||||||||||||||||
| For the Fiscal Year Ended | ||||||||||||
| December 31, 2015 | ||||||||||||
| Weighted | ||||||||||||
| Average | Average | |||||||||||
| Balance | Percent | Rate | ||||||||||
| (Dollars in thousands) | ||||||||||||
| Deposit type: |
||||||||||||
| Demand deposits |
$ | 174,884 | 15.54 | % | — | % | ||||||
| Interest-bearing checking accounts |
94,219 | 8.37 | 0.35 | |||||||||
| Regular savings accounts |
595,447 | 52.92 | 0.59 | |||||||||
| Money market deposits |
8,774 | 0.78 | 0.06 | |||||||||
| Certificates of deposit |
251,887 | 22.39 | 1.55 | |||||||||
|
|
|
|
|
|||||||||
| Total deposits |
$ | 1,125,211 | 100.00 | % | 0.69 | % | ||||||
|
|
|
|
|
|||||||||
24
Table of Contents
The following table sets forth certificates of deposit classified by interest rate as of the dates indicated.
| At December 31, | ||||||||||||
| 2017 | 2016 | 2015 | ||||||||||
| (Dollars in thousands) | ||||||||||||
| Interest Rate: |
||||||||||||
| Less than 1.00% |
$ | 23,077 | $ | 73,780 | $ | 53,876 | ||||||
| 1.00% to 1.99% |
452,967 | 247,538 | 174,886 | |||||||||
| 2.00% to 2.99% |
28,641 | — | 8,368 | |||||||||
| 3.00% to 3.99% |
— | 28 | 13,624 | |||||||||
| 4.00% to 4.99% |
29 | 14,255 | 7,681 | |||||||||
|
|
|
|
|
|
|
|||||||
| Total |
$ | 504,714 | $ | 335,601 | $ | 258,435 | ||||||
|
|
|
|
|
|
|
|||||||
The following table sets forth, by interest rate ranges, information concerning our certificates of deposit.
| At December 31, 2017 | ||||||||||||||||||||||||
| Less Than or | More Than | More Than | ||||||||||||||||||||||
| Equal to | One to | Two to | More Than | Percent of | ||||||||||||||||||||
| One Year | Two Years | Three Years | Three Years | Total | Total | |||||||||||||||||||
| (Dollars in thousands) | ||||||||||||||||||||||||
| Interest Rate: |
||||||||||||||||||||||||
| Less than 1.00% |
$ | 16,752 | $ | 5,371 | $ | 839 | $ | 115 | $ | 23,077 | 4.57 | % | ||||||||||||
| 1.00% to 1.99% |
210,129 | 89,426 | 127,715 | 25,697 | 452,967 | 89.75 | % | |||||||||||||||||
| 2.00% to 2.99% |
— | — | 490 | 28,151 | 28,641 | 5.67 | % | |||||||||||||||||
| 3.00% to 3.99% |
— | — | — | — | — | 0.00 | % | |||||||||||||||||
| 4.00% to 4.99% |
29 | — | — | — | 29 | 0.01 | % | |||||||||||||||||
|
|
|
|
|
|
|
|
|
|
|
|
|
|||||||||||||
| Total |
$ | 226,910 | $ | 94,797 | $ | 129,044 | $ | 53,963 | $ | 504,714 | 100.00 | % | ||||||||||||
|
|
|
|
|
|
|
|
|
|
|
|
|
|||||||||||||
As of December 31, 2017, the aggregate amount of outstanding certificates of deposit in amounts greater than or equal to $100,000 was approximately $207.7 million. The following table sets forth the maturity of those certificates as of December 31, 2017.
| At | ||||
| December 31, 2017 | ||||
| (Dollars in thousands) | ||||
| Three months or less |
$ | 37,633 | ||
| Over three months through six months |
56,364 | |||
| Over six months through one year |
22,423 | |||
| Over one year to three years |
70,952 | |||
| Over three years |
20,278 | |||
|
|
|
|||
| Total |
$ | 207,650 | ||
|
|
|
|||
25
Table of Contents
Borrowings. Our borrowings consist of advances from the Federal Home Loan Bank of Boston and repurchase agreements.
At December 31, 2017, we had access to additional Federal Home Loan Bank advances of up to $279.2 million. The following table sets forth information concerning balances and interest rates on our Federal Home Loan Bank advances at the dates and for the periods indicated.
| At or For the Years Ended December 31, | ||||||||||||
| 2017 | 2016 | 2015 | ||||||||||
| (Dollars in thousands) | ||||||||||||
| Balance at end of period |
$ | 723,150 | $ | 508,850 | $ | 374,000 | ||||||
| Average balance during period |
$ | 571,431 | $ | 428,163 | $ | 290,812 | ||||||
| Maximum outstanding at any month end |
$ | 723,150 | $ | 508,850 | $ | 374,000 | ||||||
| Weighted average interest rate at end of period |
1.63 | % | 1.20 | % | 0.98 | % | ||||||
| Average interest rate during period |
1.43 | % | 1.12 | % | 0.82 | % | ||||||
The following table sets forth information concerning balances and interest rates on our repurchase agreements at the dates and for the periods indicated.
| At or For the Years Ended December 31, | ||||||||||||
| 2017 | 2016 | 2015 | ||||||||||
| (Dollars in thousands) | ||||||||||||
| Balance at end of period |
$ | 3,268 | $ | 1,985 | $ | 3,695 | ||||||
| Average balance during period |
$ | 2,865 | $ | 2,419 | $ | 2,399 | ||||||
| Maximum outstanding at any month end |
$ | 4,000 | $ | 3,772 | $ | 4,119 | ||||||
| Weighted average interest rate at end of period |
0.15 | % | 0.15 | % | 0.15 | % | ||||||
| Average interest rate during period |
0.15 | % | 0.15 | % | 0.15 | % | ||||||
Personnel
At December 31, 2017, the Bank had 123 full-time employees and 3 part-time employees. Our employees are not represented by any collective bargaining group. Management believes that we have a good working relationship with our employees.
Subsidiaries
BSB Bancorp conducts its principal business activities through its wholly-owned subsidiary, Belmont Savings Bank. BSB Bancorp has one other wholly-owned subsidiary, BSB Funding Corporation, the sole purpose of which is to hold the loan to Belmont Savings Bank’s employee stock ownership plan. Belmont Savings has one subsidiary, BSB Investment Corporation, a Massachusetts corporation, which is engaged in the buying, selling and holding of investment securities.
26
Table of Contents
REGULATION AND SUPERVISION
General
Belmont Savings Bank is a Massachusetts-chartered savings bank and the wholly-owned subsidiary of BSB Bancorp, a Maryland corporation. Belmont Savings Bank’s deposits are insured up to applicable limits by the Federal Deposit Insurance Corporation, or “FDIC”, and by the Depositors Insurance Fund of Massachusetts for amounts in excess of the FDIC insurance limits. Belmont Savings Bank is subject to extensive regulation by the Massachusetts Commissioner of Banks, as its chartering agency, and by the FDIC, its primary federal regulator and deposit insurer. Belmont Savings Bank is required to file reports with, and is periodically examined by, the FDIC and the Massachusetts Commissioner of Banks concerning its activities and financial condition and must obtain regulatory approvals prior to entering into certain transactions, including, but not limited to, mergers with or acquisitions of other financial institutions. As a registered bank holding company, BSB Bancorp is regulated by the Board of Governors of the Federal Reserve System, or the “Federal Reserve Board.”
The regulatory and supervisory structure establishes a comprehensive framework of activities in which an institution can engage and is intended primarily for the protection of depositors and the deposit insurance funds, rather than for the protection of stockholders and creditors. The regulatory structure also gives the regulatory authorities extensive discretion in connection with their supervisory and enforcement activities and examination policies, including policies concerning the establishment of deposit insurance assessment fees, classification of assets and establishment of adequate loan loss reserves for regulatory purposes. Any change in such regulatory requirements and policies, whether by the Massachusetts legislature, the Massachusetts Commissioner of Banks, the FDIC, the Federal Reserve Board or Congress, could have a material adverse impact on the financial condition and results of operations of BSB Bancorp and Belmont Savings Bank.
Set forth below is a summary of certain material statutory and regulatory requirements that are applicable to Belmont Savings Bank and BSB Bancorp. This description of statutes and regulations is not intended to be a complete description of such statutes and regulations and their effects on Belmont Savings Bank and BSB Bancorp.
Massachusetts Banking Laws and Supervision
General. As a Massachusetts-chartered stock savings bank, Belmont Savings Bank is subject to supervision, regulation and examination by the Massachusetts Commissioner of Banks and to various Massachusetts statutes and regulations which govern, among other things, investment powers, lending and deposit-taking activities, borrowings, maintenance of surplus and reserve accounts, distribution of earnings and payment of dividends. In addition, Belmont Savings Bank is subject to Massachusetts consumer protection and civil rights laws and regulations. The approval of the Massachusetts Commissioner of Banks and/or the Massachusetts Board of Bank Incorporation is required for a Massachusetts-chartered bank to establish or close branches, merge with other financial institutions, issue stock and undertake certain other activities.
Massachusetts regulations generally allow Massachusetts banks, with appropriate regulatory approvals, to engage in activities permissible for federally chartered banks or banks chartered by another state. The Commissioner also has adopted procedures reducing regulatory burdens and expense and expediting branching by well-capitalized and well-managed banks.
The Commonwealth of Massachusetts recently adopted a law modernizing the Massachusetts banking law, which affords Massachusetts chartered banks with greater flexibility compared to federally chartered and out-of-state banks.
27
Table of Contents
Dividends. A Massachusetts stock bank may declare cash dividends from net profits not more frequently than quarterly. Non-cash dividends may be declared at any time. No dividends may be declared, credited or paid if the bank’s capital stock is impaired. The approval of the Massachusetts Commissioner of Banks is required if the total of all dividends declared in any calendar year exceeds the total of its net profits for that year combined with its retained net profits of the preceding two years. Dividends from BSB Bancorp may depend, in part, upon receipt of dividends from Belmont Savings Bank. The payment of dividends from Belmont Savings Bank would be restricted by federal law if the payment of such dividends resulted in Belmont Savings Bank failing to meet regulatory capital requirements.
Lending Activities in General. A Massachusetts bank may, in accordance with Massachusetts law and regulations issued by the Massachusetts Commissioner of Banks, exercise any power and engage in any activity that has been authorized for national banks, federal thrifts or state banks in a state other than Massachusetts, provided that the activity is permissible under applicable federal and not specifically prohibited by Massachusetts law. Such powers and activities must be subject to the same limitations and restrictions imposed on the national bank, federal thrift or out-of-state bank that exercised the power or activity. In many cases, a Massachusetts Bank is required to submit advanced written notice to the Massachusetts Commissioner of Banks prior to engaging in certain activities authorized for national banks, federal thrifts, or out-of-state banks.
Loans to One Borrower Limitations. Massachusetts banking law grants broad lending authority. However, with certain limited exceptions, total obligations to one borrower may not exceed 20 percent of the bank’s capital, which is defined under Massachusetts law as the sum of the bank’s capital stock, surplus account and undivided profits.
Investment Activities. In general, Massachusetts-chartered savings banks may invest in preferred and common stock of any corporation organized under the laws of the United States or any state provided such investments do not involve control of any corporation and do not, in the aggregate, exceed 4% of the bank’s deposits. Massachusetts-chartered savings banks may in addition invest an amount equal to 1.0% of their deposits in stocks of Massachusetts corporations or companies with substantial employment in the Commonwealth which have pledged to the Massachusetts Commissioner of Banks that such monies will be used for further development within the Commonwealth. Federal law imposes additional restrictions on Belmont Savings Bank’s investment activities. See “—Federal Bank Regulations—Business and Investment Activities.”
Insurance Sales. Massachusetts banks may engage in insurance sales activities if the Massachusetts Commissioner of Banks has approved a plan of operation for insurance activities and the bank obtains a license from the Massachusetts Division of Insurance. A bank may be licensed directly or indirectly through an affiliate or a subsidiary corporation established for this purpose. The Bank has not sought approval for insurance sales activities.
Regulatory Enforcement Authority. Any Massachusetts savings bank that does not operate in accordance with the regulations, policies and directives of the Massachusetts Commissioner of Banks may be subject to sanctions for non-compliance, including revocation of its charter. The Massachusetts Commissioner of Banks may, under certain circumstances, suspend or remove officers or directors who have violated the law, conducted the bank’s business in an unsafe or unsound manner or contrary to the depositors interests or been negligent in the performance of their duties. Upon finding that a bank has engaged in an unfair or deceptive act or practice, the Massachusetts Commissioner of Banks may issue an order to cease and desist and impose a fine on the bank concerned. The Commissioner also has authority to take possession of a bank and appoint a liquidating agent under certain conditions such as an unsafe and unsound condition to transact business, the conduct of business in an unsafe or unauthorized manner, impaired capital, or violations of law or the bank’s charter. In addition, Massachusetts consumer protection and civil rights statutes applicable to Belmont Savings Bank permit private individual and class action law suits and provide for the rescission of consumer transactions, including loans, and the recovery of statutory and punitive damage and attorney’s fees in the case of certain violations of those statutes.
Depositors Insurance Fund. Massachusetts-chartered savings banks are required to be members of the Depositors Insurance Fund, a corporation that insures savings bank deposits in excess of federal deposit insurance coverage. However, if a savings bank has over $1 billion of deposits in excess of federal deposit insurance coverage, the bank must exit the Depositors Insurance Fund. The Depositors Insurance Fund is authorized to charge savings banks an annual assessment fee on deposit balances in excess of amounts insured by the FDIC.
28
Table of Contents
Assessment rates are based on the institution’s risk category, similar to the method currently used to determine assessments by the FDIC discussed below under “—Federal Bank Regulations—Insurance of Deposit Accounts.”
Protection of Personal Information. Massachusetts has adopted regulatory requirements intended to protect personal information. These requirements are similar to existing federal laws such as the Gramm-Leach-Bliley Act, discussed below under “—Federal Regulations—Privacy Regulations,” that require organizations to establish written information security programs to prevent identity theft. The Massachusetts regulation also contains technology system requirements, especially for the encryption of personal information sent over wireless or public networks or stored on portable devices.
Massachusetts has other statutes or regulations that are similar to certain of the federal provisions discussed below.
Federal Bank Regulations
Prompt Corrective Action Regulations. Federal law establishes a system of prompt corrective action to resolve the problems of undercapitalized institutions. The FDIC has adopted regulations to implement the prompt corrective action legislation. The regulations were amended to incorporate increased regulatory capital standards that were effective January 1, 2015 (discussed below). Banks are placed in one of the following five categories based on the bank’s capital:
| • | well-capitalized (at least 5% leverage capital, 8% Tier 1 risk-based capital, 10% total risk-based capital and 6.5% common equity Tier 1 risk-based capital); |
| • | adequately capitalized (at least 4% leverage capital, 6% Tier 1 risk-based capital, 8% total risk-based capital and 4.5% common equity Tier 1 risk-based capital); |
| • | undercapitalized (less than 4% leverage capital, 6% Tier 1 risk-based capital, 8% total risk-based capital or 4.5% common equity Tier 1 risk-based capital); |
| • | significantly undercapitalized (less than 3% leverage capital, 4% Tier 1 risk-based capital, 6% total risk-based capital or 3% common equity Tier 1 risk-based capital); and |
| • | critically undercapitalized (less than 2% tangible capital). |
“Undercapitalized” banks must adhere to growth, capital distribution (including dividend) and other limitations and are required to submit a capital restoration plan. A bank’s compliance with such a plan must be guaranteed by any company that controls the undercapitalized institution in an amount equal to the lesser of 5% of the institution’s total assets when deemed undercapitalized or the amount necessary to achieve the status of adequately capitalized. If an “undercapitalized” bank fails to submit an acceptable plan, it is treated as if it is “significantly undercapitalized.” “Significantly undercapitalized” banks must comply with one or more of a number of additional measures, including, but not limited to, a required sale of sufficient voting stock to become adequately capitalized, a requirement to reduce total assets, cessation of taking deposits from correspondent banks, the dismissal of directors or officers and restrictions on interest rates paid on deposits, compensation of executive officers and capital distributions by the parent holding company. “Critically undercapitalized” institutions are subject to additional measures including, subject to a narrow exception, the appointment of a receiver or conservator within 270 days after it obtains such status.
At December 31, 2017, Belmont Savings Bank met the criteria for being considered “well-capitalized.”
Capital Requirements. Under the FDIC’s regulations, federally insured state-chartered banks that are not members of the Federal Reserve System (“state non-member banks”), such as Belmont Savings Bank, are required to comply with minimum leverage capital requirements.
29
Table of Contents
Federal regulations require federally insured depository institutions to meet several minimum capital standards: a common equity Tier 1 capital to risk-based assets ratio of 4.5%, a Tier 1 capital to risk-based assets ratio of 6.0%, a total capital to risk-based assets of 8%, and a Tier 1 capital to total assets leverage ratio of 4%. These capital requirements were effective January 1, 2015. In addition to establishing the minimum regulatory capital requirements, the regulations limit capital distributions and certain discretionary bonus payments to management if the institution does not hold a “capital conservation buffer” consisting of 2.5% of common equity Tier 1 capital to risk-weighted asset above the amount necessary to meet its minimum risk-based capital requirements. The capital conservation buffer requirement is being phased in. It is 1.875% as of January 1, 2018 and will be fully implemented at 2.5% on January 1, 2019.
In determining the amount of risk-weighted assets for purposes of calculating risk-based capital ratios, all assets, including certain off-balance sheet assets (e.g., recourse obligations, direct credit substitutes, residual interests) are multiplied by a risk weight factor assigned by the regulations based on the risks believed inherent in the type of asset. Higher levels of capital are required for asset categories believed to present greater risk. In assessing an institution’s capital adequacy, the FDIC takes into consideration, not only these numeric factors, but qualitative factors as well, and has the authority to establish higher capital requirements for individual institutions if it deems necessary.
Standards for Safety and Soundness. As required by statute, the federal banking agencies adopted final regulations and Interagency Guidelines Establishing Standards for Safety and Soundness to implement safety and soundness standards. The guidelines set forth the safety and soundness standards that the federal banking agencies use to identify and address problems at insured depository institutions before capital becomes impaired. The guidelines address internal controls and information systems, internal audit systems, credit underwriting, loan documentation, interest rate exposure, asset growth, asset quality, earnings, compensation, fees and benefits and, more recently, safeguarding customer information. If the appropriate federal banking agency determines that an institution fails to meet any standard prescribed by the guidelines, the agency may require the institution to submit to the agency an acceptable plan to achieve compliance with the standard.
Business and Investment Activities. Under federal law, all state-chartered FDIC-insured banks, including savings banks, have been limited in their activities as principal and in their equity investments to the type and the amount authorized for national banks, notwithstanding state law. Federal law permits exceptions to these limitations. For example, certain state-chartered savings banks may, with FDIC approval, continue to exercise state authority to invest in common or preferred stocks listed on a national securities exchange and in the shares of an investment company registered under the Investment Company Act of 1940, as amended. The maximum permissible investment is the lesser of 100.0% of Tier 1 capital or the maximum amount permitted by Massachusetts law. Belmont Savings Bank received approval from the FDIC to retain and acquire such equity instruments up to the specified limits. However, at December 31, 2017, Belmont Savings Bank held no such investments. Any such grandfathered authority may be terminated upon the FDIC’s determination that such investments pose a safety and soundness risk or upon the occurrence of certain events such as the savings bank’s conversion to a different charter.
The FDIC is also authorized to permit state banks to engage in state authorized activities or investments not permissible for national banks (other than non-subsidiary equity investments) if they meet all applicable capital requirements and it is determined that such activities or investments do not pose a significant risk to the FDIC insurance fund. The FDIC has adopted regulations governing the procedures for institutions seeking approval to engage in such activities or investments. The Gramm-Leach-Bliley Act of 1999 specified that a state bank may control a subsidiary that engages in activities as principal that would only be permitted for a national bank to conduct in a “financial subsidiary,” if a bank meets specified conditions and deducts its investment in the subsidiary for regulatory capital purposes.
Transactions with Affiliates. Transactions between a bank (and, generally, its subsidiaries) and its related parties or affiliates are limited by Sections 23A and 23B of the Federal Reserve Act. An affiliate of a bank is any company or entity that controls, is controlled by or is under common control with the bank. In a holding company context, the parent bank holding company and any companies which are controlled by such parent holding company are affiliates of the bank.
30
Table of Contents
Generally, Sections 23A and 23B of the Federal Reserve Act limit the extent to which the bank or its subsidiaries may engage in “covered transactions” with any one affiliate to 10% of such institution’s capital stock and surplus and contain an aggregate limit on all such transactions with all affiliates to an amount equal to 20% of such institution’s capital stock and surplus. The term “covered transaction” includes the making of loans, purchase of assets, issuance of a guarantee and similar transactions. In addition, loans or other extensions of credit by the institution to the affiliate are required to be collateralized in accordance with specified requirements. The law also requires that affiliate transactions be on terms and conditions that are substantially the same, or at least as favorable to the institution, as those provided to non-affiliates.
The Sarbanes-Oxley Act of 2002 generally prohibits loans by a company to its executive officers and directors. The law contains a specific exception for loans by a depository institution to its executive officers and directors in compliance with federal banking laws, assuming such loans are also permitted under the law of the institution’s chartering state. Under such laws, a bank’s authority to extend credit to executive officers, directors and 10% shareholders (“insiders”), as well as entities such persons control, is restricted. The law limits both the individual and aggregate amount of loans that may be made to insiders based, in part, on the bank’s capital position and requires certain board approval procedures to be followed. Such loans are required to be made on terms substantially the same as those offered to unaffiliated individuals and not involve more than the normal risk of repayment. There is an exception for loans made pursuant to a benefit or compensation program that is widely available to all employees of the institution and does not give preference to insiders over other employees. Loans to executive officers are further limited to loans of specific types and amounts.
Interstate Banking and Branching. Federal law permits well capitalized and well managed bank holding companies to acquire banks in any state, subject to Federal Reserve Board approval, certain concentration limits and other specified conditions. Interstate mergers of banks are also authorized, subject to regulatory approval and other specified conditions. In addition, among other things, banks are permitted to establish de novo branches on an interstate basis provided to the extent that branching is authorized by the law of the host state for the banks chartered by that state.
Enforcement. The FDIC has extensive enforcement authority over insured state savings banks, including Belmont Savings Bank. That enforcement authority includes, among other things, the ability to assess civil money penalties, issue cease and desist orders and remove directors and officers. In general, enforcement actions may be initiated in response to violations of laws and regulations and unsafe or unsound practices. The FDIC also has authority under federal law to appoint a conservator or receiver for an insured bank under certain circumstances. The FDIC is required, with certain exceptions, to appoint a receiver or conservator for an insured state non-member bank if that bank was “critically undercapitalized” on average during the calendar quarter beginning 270 days after the date on which the institution became “critically undercapitalized.”
Federal Insurance of Deposit Accounts. The Federal Deposit Insurance Corporation imposes deposit insurance assessments. Assessments for most institutions are based on financial measures and supervisory ratings derived from statistical modeling estimating the probability of failure within three years. In conjunction with the Deposit Insurance Fund reserve ratio achieving 1.15%, the assessment range (inclusive of possible adjustments) was reduced for institutions of less than $10 billion in total assets to 1.5 basis points to 30 basis points, also effective July 1, 2016. The Dodd-Frank Act specifies that banks of greater than $10 billion in assets be required to bear the burden of raising the reserve ratio from 1.15% to 1.35%. Such institutions are subject to an annual surcharge of 4.5 basis points of total assets exceeding $10 billion. This surcharge will remain in place until the earlier of the Deposit Insurance Fund reaching the 1.35% ratio or December 31, 2018, at which point a shortfall assessment would be applied. The FDIC, exercising discretion provided to it by the Dodd-Frank Act, has established a long-term goal of achieving a 2% reserve ratio for the Deposit Insurance Fund.
The Federal Deposit Insurance Corporation has authority to increase insurance assessments. A significant increase in insurance premiums would likely have an adverse effect on the operating expenses and results of operations of the Bank. Future insurance assessment rates cannot be predicted.
In addition to FDIC assessments, the Financing Corporation (“FICO”) is authorized to impose and collect, through the FDIC, assessments for costs related to bonds issued by the FICO in the 1980s to recapitalize the former Federal Savings and Loan Insurance Corporation.
31
Table of Contents
The bonds issued by the FICO are due to mature in 2017 through 2019. During the calendar year ended December 31, 2017, the Bank paid $109,000 in fees related to the FICO.
Belmont Savings Bank is a member of the Depositors Insurance Fund, a corporation that insures savings bank deposits in excess of federal deposit insurance coverage. See “—Massachusetts Banking Laws and Supervision—Depositors Insurance Fund,” above.
Community Reinvestment Act. Under the Community Reinvestment Act (“CRA”), a bank has a continuing and affirmative obligation, consistent with its safe and sound operation, to help meet the credit needs of its entire community, including low and moderate income neighborhoods. The CRA does not establish specific lending requirements or programs for financial institutions nor does it limit an institution’s discretion to develop the types of products and services that it believes are best suited to its particular community. The CRA does require the FDIC, in connection with its examination of a bank, to assess the institution’s record of meeting the credit needs of its community and to take such record into account in its evaluation of certain applications by such institution, including applications to establish or acquire branches and merge with other depository institutions. The CRA requires the FDIC to provide a written evaluation of an institution’s CRA performance utilizing a five-tiered descriptive rating system. Belmont Savings Bank’s latest FDIC CRA rating, dated April 3, 2017, was “satisfactory.”
Massachusetts has its own statutory counterpart to the CRA which is also applicable to Belmont Savings Bank. The Massachusetts version is generally similar to the CRA and utilizes a five-tiered descriptive rating system. The Massachusetts Commissioner of Banks is required to consider a bank’s record of performance under the Massachusetts law in considering any application by the bank to establish a branch or other deposit-taking facility, relocate an office or to merge or consolidate with or acquire the assets and assume the liabilities of any other banking institution. Belmont Savings Bank’s most recent rating under Massachusetts law, dated April 3, 2017, was “satisfactory.”
Federal Reserve System. The Federal Reserve Board regulations require savings institutions to maintain non-interest earning reserves against their transaction accounts (primarily Negotiable Order of Withdrawal (NOW) and regular checking accounts). The regulations currently provide that reserves be maintained against aggregate transaction accounts as follows: a 3% reserve ratio is assessed on net transaction accounts up to and including $122.3 million; a 10% reserve ratio is applied above $122.3 million. The first $16.0 million of otherwise reservable balances are exempted from the reserve requirements. The amounts are adjusted annually. Belmont Savings Bank complies with the foregoing requirements.
Federal Home Loan Bank System. Belmont Savings Bank is a member of the Federal Home Loan Bank System, which consists of twelve regional Federal Home Loan Banks. The Federal Home Loan Bank System provides a central credit facility primarily for member institutions as well as other entities involved in home mortgage lending. As a member of the Federal Home Loan Bank of Boston, Belmont Savings Bank is required to acquire and hold a specified amount of shares of capital stock in the Federal Home Loan Bank of Boston. As of December 31, 2017, Belmont Savings Bank was in compliance with this requirement.
Other Regulations
Some interest and other charges collected or contracted for by Belmont Savings Bank are subject to state usury laws and federal laws concerning interest rates. Belmont Savings Bank’s operations are also subject to state and federal laws applicable to credit transactions and other operations, including but not limited to, the:
| • | Truth-In-Lending Act, governing disclosures of credit terms to consumer borrowers; |
| • | Real Estate Settlement Procedures Act, requiring that borrowers for mortgage loans for one to four family residential real estate receive various disclosures, including good faith estimates of settlement costs, lender servicing and escrow account practices, and prohibiting certain practices that increase the cost of settlement services; |
32
Table of Contents
| • | Home Mortgage Disclosure Act, requiring financial institutions to provide information to enable the public and public officials to determine whether a financial institution is fulfilling its obligation to help meet the housing needs of the community it serves; |
| • | Equal Credit Opportunity Act, prohibiting discrimination on the basis of race, creed, or other prohibited factors in extending credit; |
| • | Fair Credit Reporting Act, governing the use and provision of information to credit reporting agencies; and |
| • | Fair Debt Collection Act, governing the manner in which consumer debts may be collected by collection agencies. |
The operations of Belmont Savings Bank also are subject to the:
| • | Right to Financial Privacy Act, which imposes a duty to maintain confidentiality of consumer financial records and prescribes procedures for complying with administrative subpoenas of financial records; |
| • | Electronic Funds Transfer Act and Regulation E promulgated thereunder, that govern automatic deposits to and withdrawals from deposit accounts and customers’ rights and liabilities arising from the use of automated teller machines and other electronic banking services; |
| • | Gramm-Leach-Bliley Act privacy statute which requires each depository institution to disclose its privacy policy, identify parties with whom certain nonpublic customer information is shared and provide customers with certain rights to “opt out” of disclosure to certain third parties; and |
| • | Title III of The Uniting and Strengthening America by Providing Appropriate Tools Required to Intercept and Obstruct Terrorism Act of 2001 (referred to as the “USA PATRIOT Act”), which significantly expanded the responsibilities of financial institutions, in preventing the use of the United States financial system to fund terrorist activities. Among other things, the USA PATRIOT Act and the related regulations required banks operating in the United States to develop anti-money laundering compliance programs, due diligence policies and controls to facilitate the detection and reporting of money laundering. |
Holding Company Regulation
BSB Bancorp, as a bank holding company, is subject to examination, regulation, and periodic reporting under the Bank Holding Company Act of 1956, as amended, as administered by the Federal Reserve Board. BSB Bancorp is required to obtain the prior approval of the Federal Reserve Board to acquire all, or substantially all, of the assets of any bank or bank holding company. Prior Federal Reserve Board approval would be required for BSB Bancorp to acquire direct or indirect ownership or control of any voting securities of any bank or bank holding company if it would, directly or indirectly, own or control more than 5% of any class of voting shares of the bank or bank holding company.
A bank holding company is generally prohibited from engaging in, or acquiring, direct or indirect control of more than 5% of the voting securities of any company engaged in non-banking activities. One of the principal exceptions to this prohibition is for activities found by the Federal Reserve Board to be so closely related to banking or managing or controlling banks as to be a proper incident thereto. Some of the principal activities that the Federal Reserve Board has determined by regulation to be closely related to banking are: (i) making or servicing loans; (ii) performing certain data processing services; (iii) providing securities brokerage services; (iv) acting as fiduciary, investment or financial advisor; (v) leasing personal or real property under certain conditions; (vi) making investments in corporations or projects designed primarily to promote community welfare; and (vii) acquiring a savings association.
33
Table of Contents
The Gramm-Leach-Bliley Act of 1999 authorizes a bank holding company that meets specified conditions, including depository institutions subsidiaries that are “well capitalized” and “well managed,” to opt to become a “financial holding company.” A “financial holding company” may engage in a broader array of financial activities than permitted a typical bank holding company. Such activities can include insurance underwriting and investment banking. BSB Bancorp has not opted for “financial holding company” status up to this time.
BSB Bancorp is subject to the Federal Reserve Board’s capital requirements for bank holding companies. The Dodd-Frank Act directed the Federal Reserve Board to issue consolidated capital requirements for depository institution holding companies that are not less stringent, both quantitatively and in terms of components of capital, than those applicable to institutions themselves. Consolidated regulatory capital requirements identical to those applicable to banks were applied to bank holding companies (with greater than $1.0 billion of assets) as of January 1, 2015.
A bank holding company is generally required to give the Federal Reserve Board prior written notice of any purchase or redemption of then outstanding equity securities if the gross consideration for the purchase or redemption, when combined with the net consideration paid for all such purchases or redemptions during the preceding 12 months, is equal to 10% or more of the company’s consolidated net worth. The Federal Reserve Board may disapprove such a purchase or redemption if it determines that the proposal would constitute an unsafe and unsound practice, or would violate any law, regulation, Federal Reserve Board order or directive, or any condition imposed by, or written agreement with, the Federal Reserve Board. The Federal Reserve Board has adopted an exception to that approval requirement for well-capitalized bank holding companies that meet certain other conditions.
The Dodd-Frank Act codified the “source of strength” doctrine. That longstanding policy of the Federal Reserve Board requires bank holding companies to serve as a source of strength to their subsidiary depository institutions by providing capital, liquidity and other support in times of financial stress.
The Federal Reserve Board has issued a policy statement regarding the payment of dividends and the repurchase of shares of common stock by bank holding companies. In general, the policy provides that dividends should be paid only out of current earnings and only if the prospective rate of earnings retention by the holding company appears consistent with the organization’s capital needs, asset quality and overall financial condition. The policy statement also provides for regulatory consultation prior to a holding company paying dividends or redeeming or repurchasing regulatory capital instruments under certain circumstances.
The Federal Deposit Insurance Act, makes depository institutions liable to the FDIC for losses suffered or anticipated by the insurance fund in connection with the default of a commonly controlled depository institution or any assistance provided by the FDIC to such an institution in danger of default. That law would have potential applicability if BSB Bancorp ever held as a separate subsidiary a depository institution in addition to Belmont Savings Bank.
The status of BSB Bancorp as a registered bank holding company under the Bank Holding Company Act will not exempt it from certain federal and state laws and regulations applicable to corporations generally, including, without limitation, certain provisions of the federal securities laws.
Change in Control Regulations. Under the Change in Bank Control Act, no person may acquire control of a bank holding company such as BSB Bancorp, Inc. unless the Federal Reserve Board has been given 60 days’ prior written notice and has not issued a notice disapproving the proposed acquisition, taking into consideration certain factors, including the financial and managerial resources of the acquirer and the competitive effects of the acquisition. Control, as defined under federal law, means ownership, control of or holding irrevocable proxies representing more than 25% of any class of voting stock, control in any manner of the election of a majority of the institution’s directors, or a determination by the regulator that the acquirer has the power to direct, or directly or indirectly to exercise a controlling influence over, the management or policies of the institution. Acquisition of more than 10% of any class of a savings and loan holding company’s voting stock constitutes a rebuttable determination of control under the regulations under certain circumstances including where, as will be the case with BSB Bancorp, Inc., the issuer has registered securities under Section 12 of the Securities Exchange Act of 1934.
34
Table of Contents
Massachusetts Holding Company Regulation. Under Massachusetts banking laws, a company owning or controlling two or more banking institutions, including a savings bank, is regulated as a bank holding company. Each Massachusetts bank holding company: (i) must obtain the approval of the Massachusetts Board of Bank Incorporation before engaging in certain transactions, such as the acquisition of more than 5% of the voting stock of another banking institution; (ii) must register, and file reports, with the Massachusetts Division of Banks; and (iii) is subject to examination by the Division of Banks. BSB Bancorp would become a Massachusetts bank holding company if it acquires a second banking institution and holds and operates it separately from Belmont Savings Bank.
Federal Securities Laws
BSB Bancorp’s common stock is registered with the Securities and Exchange Commission. BSB Bancorp is subject to the information, proxy solicitation, insider trading restrictions and other requirements under the Securities Exchange Act of 1934.
| ITEM 1A. | RISK FACTORS |
The material risks and uncertainties that Management believes affect the Company are described below. These risks and uncertainties are not the only ones affecting the Company. Additional risks and uncertainties that Management is not aware of or focused on or that Management currently deems immaterial may also impair the Company’s business operations. This report is qualified in its entirety by these risk factors. If any one or more of the following risks actually occur, the Company’s financial condition and results of operations could be materially and adversely affected.
Our business strategy includes significant asset and liability growth. If we fail to grow or fail to manage our growth effectively, our financial condition and results of operations could be negatively affected.
In 2010, the Board of Directors of the Bank approved a strategic plan that has resulted in significant growth in assets and liabilities. We intend to continue our growth. Specifically, we intend to continue to increase our commercial real estate loans, one-to-four family residential real estate loans and home equity lines of credit, while attracting favorably priced deposits. During 2012 we added our Shaw’s Supermarket in-store branch in Waltham. In 2013 we opened two new in-store branches in Newton and Cambridge, and in 2014 we closed one of our existing branches due to its proximity to another branch. We have incurred substantial additional expenses due to the execution of our strategic plan, including salaries and occupancy expense related to new lending officers and related support staff, as well as marketing and infrastructure expenses. Many of these increased expenses are considered fixed expenses. Unless we can continue to successfully execute our strategic plan, results of operations will be negatively affected by these increased costs.
The successful continuation of our strategic plan will require, among other things, that we increase our market share by attracting new customers that currently bank at other financial institutions in our market area. In addition, our ability to continue to successfully grow will depend on several factors, including continued favorable market conditions, the competitive responses from other financial institutions in our market area, and our ability to maintain high asset quality as we increase our commercial real estate loans, one-to-four family residential real estate loans, home equity lines of credit and commercial business loans. While we believe we have the management resources in place to successfully manage our future growth, growth opportunities may not be available and we may not be successful in achieving our business strategy goals.
Our branch network expansion strategy may negatively affect our financial performance.
During 2012 we added our Shaw’s Supermarket in-store branch in Waltham. In 2013 we opened two new in-store branches in Newton and Cambridge, and in 2014 we closed one of our existing branches due to its proximity to another branch. We have three of our branches located within supermarkets and changes in the supermarkets’ business could impact our branch operations within those supermarkets.
35
Table of Contents
This strategy of opening new branches may not generate earnings, or may not generate earnings within a reasonable period of time. Numerous factors contribute to the performance of a new branch, such as a suitable location, qualified personnel, and an effective marketing strategy. Additionally, it takes time for a new branch to originate sufficient loans and generate sufficient deposits to produce enough income to offset expenses, some of which, like salaries and occupancy expense, are considered fixed costs.
Because we intend to continue to emphasize our commercial real estate and multi-family loan originations, our credit risk will increase, and downturns in the local real estate market or economy could adversely affect our earnings.
We intend to continue originating commercial real estate and multi-family loans. At December 31, 2017, $642.1 million, or 27.9% of our total loan portfolio, consisted of multi-family loans and commercial real estate loans. Commercial real estate and multi-family loans generally have more risk than the one-to-four family residential real estate loans that we originate. Because the repayment of commercial real estate loans and multi-family loans depends on the successful management and operation of the borrower’s properties or related businesses, repayment of such loans can be affected by adverse conditions in the local real estate market or economy. Commercial real estate loans and multi-family loans may also involve relatively large loan balances to individual borrowers or groups of related borrowers. A downturn in the real estate market or the local economy could adversely affect the value of properties securing the loan or the revenues from the borrower’s business, thereby increasing the risk of nonperforming loans. As our commercial real estate loan and multi-family loan portfolios increase, the corresponding risks and potential for losses from these loans may also increase.
Our loan portfolio has greater risk than those of many savings banks due to the substantial number of indirect automobile loans in our portfolio.
We have a diversified loan portfolio with a substantial number of loans secured by collateral other than owner-occupied one-to-four-family residential real estate. Our loan portfolio includes a substantial number of indirect automobile loans, which are automobile loans assigned to us by participating automobile dealerships upon our review and approval of such loans. At December 31, 2017, our indirect automobile loans totaled $30.2 million, or 1.3% of our total loan portfolio. Automobile loans generally have greater risk of loss in the event of default than one to four family residential mortgage loans due to the rapid depreciation of automobiles securing the loans. We face the risk that the collateral for a defaulted loan may not provide an adequate source of repayment of the outstanding loan balance. Furthermore, the application of various federal and state laws, including bankruptcy and insolvency laws, may limit our ability to recover on such loans. Although we have suspended new originations due to unattractive yields, it remains difficult to assess the future performance of this part of our loan portfolio due to the recent origination of these loans. These loans may have delinquency or charge off levels above our estimates, which would adversely affect our future performance. In addition, if our losses on these loans increase, it may become necessary to increase our provision for loan losses, which would also adversely impact our future earnings.
Our information systems may experience an interruption or breach in security.
We rely heavily on communications and information systems operated by us and third party service providers to conduct our business. Any failure, interruption, or breach in security or operational integrity of these systems, whether it is caused intentionally or unintentionally, could result in failures or disruptions in our customer relationship management, general ledger, deposit, loan, and other systems. While we have policies and procedures designed to prevent or limit the effect of the failure, interruption, or security breach of our information systems, we cannot assure you that any such failures, interruptions, or security breaches will not occur or, if they do occur, that they will be adequately addressed. The occurrence of any failures, interruptions, or security breaches of our information systems could damage our reputation, result in a loss of customer business, subject us to additional regulatory scrutiny, or expose us to civil litigation and possible financial liability, any of which could have a material adverse effect on our financial condition and results of operations.
36
Table of Contents
We are exposed to cyber-security risks, including denial of service, hacking, ransomware attacks and identity theft.
The potential need to adapt to changes in information technology could adversely impact our operations and require increased capital spending. The risk of electronic fraudulent activity within the financial services industry, especially in the commercial banking sector due to cyber criminals targeting bank accounts and other customer information, could adversely impact our operations, damage its reputation and require increased capital spending. Our information technology infrastructure and systems may be vulnerable to cyber terrorism, computer viruses, system failures and other intentional or unintentional interference, negligence, fraud and other unauthorized attempts to access or interfere with these systems and proprietary information. Although we believe we have implemented and maintain reasonable security controls over proprietary information as well as information of our customers, stockholders and employees, a breach of these security controls may have a material adverse effect on our business, financial condition and results of operations and could subject us to significant regulatory actions and fines, litigation, loss, third-party damages and other liabilities.
A portion of our one to four family residential mortgage loan portfolio is comprised of non-owner occupied properties, which increases the credit risk on this portion of our loan portfolio.
A significant portion of the housing stock in our primary lending market area is comprised of two-, three- and four-unit properties. At December 31, 2017, of the $1.33 billion of one-to-four family residential mortgage loans in our portfolio, $59.6 million, or 4.47% of this amount, were comprised of non-owner occupied properties. There is greater credit risk inherent in two-, three- and four-unit properties and especially in non-owner occupied properties, than in owner-occupied one-unit properties. These loans are similar to commercial real estate loans and multi-family loans, as the repayment of these loans may depend, in part, on the successful management of the property and/or the borrower’s ability to lease the units of the property. A downturn in the real estate market or the local economy could adversely affect the value of properties securing these loans or the revenues derived from these properties, which could affect the borrower’s ability to repay the loan.
Our home equity line of credit strategy exposes us to a risk of loss due to a decline in property values.
At December 31, 2017, $178.6 million, or 7.8%, of our total loan portfolio consisted of home equity lines of credit. As part of our strategic business plan, we intend to increase our home equity lines of credit over the next several years. We generally originate home equity lines of credit with loan-to-value ratios of up to 80% when combined with the principal balance of the existing first mortgage loan, although loan-to-value ratios may exceed 80% on a case-by-case basis. Declines in real estate values in our market area could cause some of our home equity loans to be inadequately collateralized, which would expose us to a greater risk of loss in the event that we seek to recover on defaulted loans by selling the real estate collateral. In addition, under the Tax Cuts and Jobs Act enacted on December 22, 2017, interest on home equity loans and lines of credit is only deductible if the proceeds are used to buy, build or substantially improve the taxpayer’s home that secures the loan or line of credit. This change could adversely impact the level of originations and outstanding volumes of home equity lines of credit in the future.
Future changes in interest rates could reduce our profits.
Our ability to make a profit largely depends on our net interest and dividend income, which could be negatively affected by changes in interest rates. Net interest and dividend income is the difference between:
| • | the interest and dividend income we earn on our interest-earning assets, such as loans and securities; and |
| • | the interest expense we pay on our interest-bearing liabilities, such as deposits and borrowings. |
37
Table of Contents
A significant portion of our loans are fixed-rate one-to-four family residential mortgage loans with terms of up to 30 years, 3/1, 5/1, 7/1 and 10/1 adjustable rate mortgage loans and 5/5 adjustable rate—10 year maturity commercial real estate loans, and like many savings institutions, our focus on deposit accounts as a source of funds, which have no stated maturity date or shorter contractual maturities, results in our liabilities having a shorter duration than our assets. This imbalance can create significant earnings volatility, because market interest rates change over time. In a period of rising interest rates, the interest income earned on our assets, such as loans and investments, may not increase as rapidly as the interest paid on our liabilities, such as deposits. In a period of declining interest rates, the interest income earned on our assets may decrease more rapidly than the interest paid on our liabilities, as borrowers prepay mortgage loans, and mortgage-backed securities and callable investment securities are called or prepaid, thereby requiring us to reinvest these funds at lower interest rates. At December 31, 2017 our interest rate risk analysis indicated that our base forecasted net interest income would decrease by 11.8% over the next twelve months if there was an instantaneous 200 basis point increase in market interest rates. For additional discussion of how changes in current interest rates could impact our financial condition and results of operations, see “Management’s Discussion and Analysis of Financial Condition and Results of Operations—Management of Market Risk.”
Changes in interest rates also create reinvestment risk, which is the risk that we may not be able to reinvest prepayments at rates that are comparable to the rates we earned on the prepaid loans or securities in a declining interest rate environment.
Additionally, increases in interest rates may decrease loan demand and/or make it more difficult for borrowers to repay adjustable-rate loans. At December 31, 2017, $673.2 million, or 50.5% of our $1.33 billion total one-to-four family residential mortgage loans due after December 31, 2018 had adjustable rates of interest. If interest rates increase, the rates on these loans will, in turn, increase, thereby increasing the risk that borrowers will not be able to repay these loans.
Changes in interest rates also affect the current fair value of our interest-earning securities portfolio. Generally, the value of securities moves inversely with changes in interest rates. Because a portion of the securities in our portfolio are classified as available for sale, a decline in the fair value of our securities could cause a decline in our reported equity and/or net income.
Monetary policies and regulations of the Federal Reserve Board could adversely affect our business, financial condition and results of operations.
In addition to being affected by general economic conditions, our earnings and growth are affected by the policies of the Federal Reserve Board. An important function of the Federal Reserve Board is to regulate the money supply and credit conditions. Among the instruments used by the Federal Reserve Board to implement these objectives are open market purchases and sales of U.S. government securities, adjustments of the discount rate and changes in banks’ reserve requirements against bank deposits. These instruments are used in varying combinations to influence overall economic growth and the distribution of credit, bank loans, investments and deposits. Their use also affects interest rates charged on loans or paid on deposits.
The monetary policies and regulations of the Federal Reserve Board have had a significant effect on the operating results of financial institutions in the past and are expected to continue to do so in the future. The effects of such policies upon our business, financial condition and results of operations cannot be predicted.
We are subject to liquidity risk. A failure to maintain adequate liquidity could have a material adverse effect on our business, financial condition and results of operations.
We require liquidity to meet our deposit and debt obligations as they come due. Our access to funding sources in amounts adequate to finance our activities or on terms that are acceptable to us could be impaired by factors that affect us specifically or the financial services industry or economy generally.
38
Table of Contents
Factors that could reduce our access to liquidity sources include a downturn in the Massachusetts economy, difficult credit markets or adverse regulatory actions against us. Our access to deposits may also be affected by the liquidity needs of our depositors. In particular, a substantial majority of our liabilities are demand deposits, savings and interest bearing checking, which are payable on demand or upon several days’ notice, while by comparison, a substantial portion of our assets are loans, which cannot be called or sold in the same time frame. We may not be able to replace maturing deposits and FHLB advances as necessary in the future, especially if a large number of our depositors sought to withdraw their accounts, regardless of the reason. A failure to maintain adequate liquidity could have a material adverse effect on our business, financial condition and results of operations.
We may lose lower-cost funding sources.
Checking, savings, and money market deposit account balances and other forms of client deposits can decrease when clients perceive alternative investments, such as the stock market, as providing a better risk/return tradeoff. If clients move money out of bank deposits and into other investments, we could lose a relatively low-cost source of funds, increasing our funding costs and reducing our net interest income and net income.
Changes in law, regulation or oversight may adversely affect our operations.
We are subject to extensive regulation under federal and state laws, as well as supervision and examination by the Massachusetts Commissioner of Banks, FDIC, Federal Reserve, SEC, the Consumer Financial Protection Bureau (“CFPB”), and other regulatory bodies. Congress and federal agencies have significantly increased their focus on the regulation of the financial services industry. The Dodd-Frank Act, enacted in July 2010, instituted major changes to the banking and financial institutions regulatory regimes, many parts of which are now in effect. The Federal Reserve has adopted regulations implementing the Basel III framework on bank capital adequacy, stress testing, and market liquidity risk in the U.S. These regulations affect our lending practices, deposits, capital structure, investment practices, operating activities and growth, among other things. Regulation of the financial services industry continues to undergo major changes. Changes to statutes, regulations or regulatory policies, including changes in interpretation or implementation of statutes, regulations or policies could affect us in substantial and unpredictable ways. In addition, such changes could also subject us to additional costs and limit the types of financial services and products we may offer. Failure to comply with laws, regulations or policies could result in civil or criminal sanctions by state and federal agencies, the loss of FDIC insurance, the revocation of our banking charter, civil money penalties and/or reputation damage, which could have a material adverse impact on our businesses, results of operations and financial condition. The effects of such legislation and regulatory actions on us cannot be reliably determined at this time. See Item 1. Business — Supervision and Regulation for more information about the regulations to which we are subject.
In addition to new rules promulgated under the Dodd Frank Act, bank regulatory agencies have been responding aggressively to concerns and adverse trends identified in examinations. These measures are likely to increase our costs of doing business and may have a significant adverse effect on our lending activities, financial performance and operating flexibility. In addition, these risks could affect the performance and value of our loan and investment securities portfolios, which also would negatively affect our financial performance.
We may be adversely affected by recent changes in U.S. tax laws.
The Tax Cuts and Jobs Act, which was enacted in December 2017, is likely to have both positive and negative effects on our financial performance. For example, the new legislation will result in a reduction in our federal corporate tax rate from 35% to 21% beginning in 2018, which will have a favorable impact on our earnings and capital generation abilities. However, the new legislation also enacted limitations on certain deductions that will have an impact on the banking industry, borrowers and the market for single-family residential real estate. These limitations include (1) a lower limit on the deductibility of mortgage interest on single-family residential mortgage loans, (2) the elimination of interest deductions for certain home equity loans, (3) a limitation on the deductibility of business interest expense and (4) a limitation on the deductibility of property taxes and state and local income taxes.
The recent changes in the tax laws may have an adverse effect on the market for, and the valuation of, residential properties, and on the demand for such loans in the future, and could make it harder for borrowers to make their loan payments.
39
Table of Contents
In addition, these recent changes may also have a disproportionate effect on taxpayers in states with higher than average residential home prices and high state and local taxes, like Massachusetts. If home ownership becomes less attractive, demand for mortgage loans could decrease. The value of the properties securing loans in our loan portfolio may be adversely impacted as a result of the changing economics of home ownership, which could require an increase in our provision for loan losses, which would reduce our profitability and could materially adversely affect our business, financial condition and results of operations.
Our ability to originate and sell loans could be restricted by recently adopted federal regulations.
The CFPB has issued a rule intended to clarify how lenders can avoid legal liability under the Dodd-Frank Act, which holds lenders accountable for ensuring a borrower’s ability to repay a mortgage loan. Under the rule, loans that meet the “qualified mortgage” definition will be presumed to have complied with the new ability-to-repay standard. Under the rule, a “qualified mortgage” loan must not contain certain specified features, including:
| • | excessive upfront points and fees (those exceeding 3% of the total loan amount, less “bona fide discount points” for prime loans); |
| • | interest-only payments; |
| • | negative amortization; and |
| • | terms of longer than 30 years. |
Also, to qualify as a “qualified mortgage,” a loan must generally be made to a borrower whose total monthly debt-to-income ratio does not exceed 43%. Lenders must also verify and document the income and financial resources relied upon to qualify a borrower for the loan and underwrite the loan based on a fully amortizing payment schedule and maximum interest rate during the first five years, taking into account all applicable taxes, insurance and assessments.
In addition, the Dodd-Frank Act requires the regulatory agencies to issue regulations that require securitizers of loans to retain “not less than 5% of the credit risk for any asset that is not a qualified residential mortgage.” The regulatory agencies have issued a final rule to implement this requirement. The final rule provides that the definition of “qualified residential mortgage” includes loans that meet the definition of qualified mortgage issued by the CFPB.
These rules could have a significant effect on the secondary market for loans and the types of loans we originate, and restrict our ability to make loans, any of which could limit our growth or profitability.
Non-compliance with the USA PATRIOT Act, Bank Secrecy Act, or other laws and regulations could result in fines or sanctions.
The USA PATRIOT and Bank Secrecy Acts require financial institutions to develop programs to prevent financial institutions from being used for money laundering and terrorist activities. If such activities are detected, financial institutions are obligated to file suspicious activity reports with the U.S. Treasury’s Office of Financial Crimes Enforcement Network (“FinCEN”). The FinCEN has delegated examination authority for compliance by banks with the Bank Secrecy Act to the federal bank regulators. The rules require financial institutions to establish procedures for identifying and verifying the identity of customers seeking to open new financial accounts. Failure to comply with these regulations could result in fines or sanctions, including restrictions on conducting acquisitions or establishing new branches. The policies and procedures we have adopted that are designed to assist in compliance with these laws and regulations may not be effective in preventing violations of these laws and regulations.
The CFPB is in the process of reshaping the consumer financial laws through rulemaking and enforcement of such laws against unfair, deceptive and abusive acts or practices.
Compliance with consumer financial laws may impact the business operations of depository institutions offering consumer financial products or services, including the Bank. The CFPB has broad rulemaking authority to administer and carry out the provisions of the Dodd-Frank Act with respect to financial institutions that offer covered financial products and services to consumers.
40
Table of Contents
The CFPB has also been directed to write rules identifying practices or acts that are unfair, deceptive or abusive in connection with any transaction with a consumer for a consumer financial product or service, or the offering of a consumer financial product or service. The prohibition on “abusive” acts or practices was created by the Dodd-Frank Act and did not previously exist in federal law. The meaning of the prohibition is being clarified each year by CFPB enforcement actions and opinions from courts and administrative proceedings. The CFPB has further issued a series of final rules to implement provisions in the Dodd-Frank Act related to mortgage origination and servicing that may increase the cost of originating and servicing residential mortgage loans, which went into effect in January 2014. While it is difficult to quantify the increase in our regulatory compliance burden, we do believe that costs associated with regulatory compliance, including the need to hire additional compliance personnel, may continue to increase.
A worsening of economic conditions could adversely affect our financial condition and results of operations.
Although the U.S. economy has emerged from the severe recession that occurred in 2008 and 2009, economic growth has been slow despite the Federal Reserve Board’s unprecedented efforts to maintain low market interest rates and encourage economic growth. A return to prolonged deteriorating economic conditions could significantly affect the markets in which we do business, the value of our loans and investments, and our ongoing operations, costs and profitability. Declines in real estate values and sales volumes or an increase in unemployment levels may result in greater loan delinquencies, increases in our nonperforming, criticized and classified assets and a decline in demand for our products and services. These events may cause us to incur losses and may adversely affect our financial condition and results of operations.
If our risk management framework does not effectively identify or mitigate our risks, we could suffer unexpected losses and could be materially adversely affected.
Our risk management process aims to mitigate risk and appropriately balance risk and return. We have established processes and procedures intended to identify, measure, monitor and report the types of risk to which we are subject, including credit risk, operations risk, compliance risk, reputation risk, strategic risk, market risk and liquidity risk. We aim to monitor and control our risk exposure through a framework of policies, procedures and reporting mechanisms. Management of our risks in some cases depends upon the use of analytical and/or forecasting models. If the models used to mitigate these risks are inadequate, we may incur losses. In addition, there may be risks that exist, or that develop in the future, that we have not appropriately anticipated, identified or mitigated. If our risk management framework does not effectively identify or mitigate our risks, we could suffer unexpected losses and could be materially adversely affected.
The recent change in regulatory capital requirements may have an adverse impact on our future financial results.
In 2013, the FDIC and FRB approved new rules that substantially amended the regulatory risk-based capital rules applicable to the Company and the Bank. The final rule implemented the “Basel III” regulatory capital reforms and changes required by the Dodd-Frank Act. The new rules went into effect on January 1, 2015, although certain portions of the rule, including the capital conservation buffer, are being phased in over a period of several years. The application of more stringent capital requirements, including the phase in of the capital conservation buffer, could, among other things, result in lower returns on equity, require the raising of additional capital, and result in regulatory actions such as a prohibition on the payment of dividends or on the repurchase of shares if we were unable to comply with such requirements.
We may need to raise additional capital in the future, and such capital may not be available when needed or at all.
We may need to raise additional capital in the future to provide us with sufficient capital resources and liquidity to meet our commitments and business needs, particularly if our asset quality or earnings were to deteriorate significantly. Our ability to raise additional capital, if needed, will depend on, among other things, conditions in the capital markets at that time, which are outside of our control, and our financial condition.
41
Table of Contents
Economic conditions and the loss of confidence in financial institutions may increase our cost of funding and limit access to certain customary sources of capital, including inter-bank borrowings, repurchase agreements and borrowings from the Federal Home Loan Bank and discount window of the Federal Reserve.
We cannot assure that such capital will be available on acceptable terms or at all. Any occurrence that may limit our access to the capital markets, such as a decline in the confidence of investors, debt purchasers, depositors of Belmont Savings Bank or counterparties participating in the capital markets, may adversely affect our capital costs and our ability to raise capital and, in turn, our liquidity. Moreover, if we need to raise capital in the future, we may have to do so when many other financial institutions are also seeking to raise capital and would have to compete with those institutions for investors. An inability to raise additional capital on acceptable terms when needed could have a materially adverse effect on our business, financial condition and results of operations.
If our allowance for loan losses is not sufficient to cover actual loan losses, our earnings will decrease.
We make various assumptions and judgments about the collectability of our loan portfolio, including the creditworthiness of our borrowers and the value of the real estate and other assets serving as collateral for the repayment of many of our loans. In determining the amount of the allowance for loan losses, we review our loans and our loss and delinquency experience, and we evaluate economic conditions. If our assumptions are incorrect, our allowance for loan losses may not be sufficient to cover probable incurred losses in our loan portfolio, resulting in additions to our allowance. Material additions to our allowance could materially decrease our net income.
In addition, bank regulators periodically review our allowance for loan losses and may require us to increase our allowance for loan losses or recognize further loan charge-offs. Any increase in our allowance for loan losses or loan charge-offs as required by these regulatory authorities might have a material adverse effect on our financial condition and results of operations.
Changes in accounting standards could adversely affect us.
In June 2016, the FASB issued Accounting Standards Update 2016-13, “Financial Instruments-Credit Losses (Topic 326): Measurement of Credit Losses on Financial Instruments.” The update changes the impairment model for most financial assets and sets forth a “current expected credit loss” (CECL) model which will require the Company to measure all expected credit losses for financial instruments held at the reporting date based on historical experience, current conditions and reasonable supportable forecasts. This method is forward-looking and will generally result in earlier recognition of allowances for losses. This replaces the existing incurred loss model and is applicable to the measurement of credit losses on financial assets measured at amortized cost and also applies to some off-balance sheet credit exposures. This ASU is effective for fiscal years beginning after December 15, 2019, including interim periods within those fiscal years. The adoption of this ASU may materially reduce retained earnings in the period of adoption.
Because most of our borrowers are located in Eastern Massachusetts, a downturn in the local economy, or a decline in local real estate values, could cause an increase in nonperforming loans or a decrease in loan demand, which would reduce our profits.
Our success depends primarily on general economic conditions in our market area in Eastern Massachusetts. Nearly all of our loans are to customers in this market. Continued weakness in our local economy and our local real estate markets could adversely affect the ability of our borrowers to repay their loans and the value of the collateral securing our loans, which could adversely affect our results of operations. Real estate values are affected by various factors, including supply and demand, changes in general or regional economic conditions, interest rates, governmental rules or policies and natural disasters. Continued weakness in economic conditions also could result in reduced loan demand and a decline in loan originations, which could negatively affect our financial results.
42
Table of Contents
Loss of key personnel could adversely impact results.
Our success has been and will continue to be greatly influenced by our ability to retain the services of our existing senior management. The unexpected loss of the services of any of the key management personnel, or the inability to recruit and retain qualified personnel in the future, could have an adverse impact on our business and financial results.
Strong competition for deposits and lending opportunities within our market areas, as well as competition from non-depository investment alternatives, may limit our growth and profitability.
Competition in the banking and financial services industry is intense. In our market areas, we compete with commercial banks, savings institutions, mortgage brokerage firms, credit unions, finance companies, mutual funds, insurance companies, financial technology companies and brokerage and investment banking firms operating locally and elsewhere. Some of our competitors have greater name recognition and market presence that benefit them in attracting business, and offer certain services that we do not or cannot provide. In addition, larger competitors may be able to price loans and deposits more aggressively than we do, which could affect our ability to grow and to be profitable on a long-term basis. Our profitability depends upon our ability to successfully compete in our market areas. If we must raise interest rates paid on deposits or lower interest rates charged on our loans, our net interest margin and profitability could be adversely affected.
In addition, checking and savings account balances and other forms of deposits can decrease when our deposit customers perceive alternative investments, such as the stock market or other non-depository investments, as providing superior expected returns, or if our customers seek to spread their deposits over several banks to maximize FDIC insurance coverage. Furthermore, technology and other changes have made it more convenient for bank customers to transfer funds into alternative investments, including products offered by other financial institutions or non-bank service providers. Additional increases in short-term interest rates could increase transfers of deposits to higher yielding deposits. Efforts and initiatives we undertake to retain and increase deposits, including deposit pricing, can increase our costs. When bank customers move money out of bank deposits in favor of alternative investments or into higher yielding deposits, or spread their accounts over several banks, we can lose a relatively inexpensive source of funds, thus increasing our funding costs and reducing our profitability.
Changes in the programs offered by secondary market purchasers or our ability to qualify for their programs, or the loss of our ability to purchase mortgage loans through our correspondent bank relationships, may reduce our mortgage banking revenues, which would negatively impact our non-interest income.
We generate mortgage revenues from gains on the sale of single-family mortgage loans pursuant to programs currently offered by Fannie Mae and non-GSE investors. These entities account for a substantial portion of the secondary market in residential mortgage loans. Any future changes in these programs, our eligibility to participate in such programs, the criteria for loans to be accepted or laws that significantly affect the activity of such entities could, in turn, materially adversely affect our results of operations.
Technological advances impact our business.
The banking industry is undergoing technological changes with frequent introductions of new technology-driven products and services. In addition to improving customer services, the effective use of technology increases efficiency and enables financial institutions to reduce costs. Our future success will depend, in part, on our ability to address the needs of our customers by using technology to provide products and services that will satisfy customer demands for convenience as well as to create additional efficiencies in operations. Many competitors have substantially greater resources to invest in technological improvements. We may not be able to effectively implement new technology-driven products and services or successfully market such products and services to our customers.
43
Table of Contents
Negative publicity could damage our reputation and our business.
Reputation risk, or the risk to our earnings and capital from negative public opinion, is inherent in our business. Negative public opinion could adversely affect our ability to keep and attract customers and expose us to adverse legal and regulatory consequences. Negative public opinion could result from our actual or alleged conduct in any number of activities, including lending practices, corporate governance, regulatory compliance, mergers and acquisitions, and disclosure, sharing or inadequate protection of customer information, and from actions taken by government regulators and community organizations in response to that conduct. Negative public opinion could also result from adverse news or publicity that impairs the reputation of the financial services industry generally.
Severe weather, natural disasters, acts of war or terrorism and other external events could significantly impact our business.
Severe weather, natural disasters, acts of war or terrorism and other adverse external events could have a significant impact on our ability to conduct business. In addition, such events could affect the stability of our deposit base, impair the ability of borrowers to repay outstanding loans, impair the value of collateral securing loans, cause significant property damage, result in loss of revenue and/or cause us to incur additional expenses. The occurrence of any such event in the future could have a material adverse effect on our business, which, in turn, could have a material adverse effect on our financial condition and results of operations.
| ITEM 1B. | UNRESOLVED STAFF COMMENTS |
None.
| ITEM 2. | PROPERTIES |
We operated from our six full-service banking offices at December 31, 2017, including our main office and five branch offices located in Belmont, Watertown, Waltham, Cambridge and Newton, Massachusetts. The net book value of our premises, land and equipment was $2.3 million at December 31, 2017. The following table sets forth information with respect to our offices, including the expiration date of leases with respect to leased facilities.
44
Table of Contents
| Location |
Year Opened |
Owned/ Leased |
||||||
| Full Service Banking Offices: |
||||||||
| Main Office |
1969 | Owned | ||||||
| 2 Leonard Street Belmont, Massachusetts 02478 |
||||||||
| Trapelo Road |
1992 | Owned | ||||||
| 277 Trapelo Road Belmont, Massachusetts 02478 |
||||||||
| Watertown Square |
2001 | Leased | (1) | |||||
| 53 Mount Auburn Street |
||||||||
| Watertown, Massachusetts 02472 |
||||||||
| Shaws Supermarket In-Store Branch |
2012 | Leased | (2) | |||||
| 1070 Lexington Street Waltham, Massachusetts 02452 |
||||||||
| Shaws Supermarket In-Store Branch |
2013 | Leased | (3) | |||||
| 33 Austin Street Newton, Massachusetts 02460 |
||||||||
| Star Market Supermarket In-Store Branch |
2013 | Leased | (4) | |||||
| 699 Mount Auburn Street Cambridge, Massachusetts 02138 |
||||||||
| Administrative Offices |
||||||||
| Leonard Street |
1969 | Owned | ||||||
| 2 Leonard Street Belmont, Massachusetts 02478 |
||||||||
| Concord Avenue – Suite 3 |
2010 | Leased | (5) | |||||
| 385 Concord Avenue Belmont, Massachusetts 02478 |
||||||||
| Concord Avenue – Suite 105 |
2014 | Leased | (5) | |||||
| 385 Concord Avenue Belmont, Massachusetts 02478 |
||||||||
| Concord Avenue – Suite 205 |
2012 | Leased | (5) | |||||
| 385 Concord Avenue Belmont, Massachusetts 02478 |
||||||||
| Fall River |
2010 | Leased | (6) | |||||
| 10 N. Main Street Fall River, Massachusetts 02722 |
||||||||
| Concord Avenue – Suite 203A |
2012 | Leased | (5) | |||||
| 385 Concord Avenue Belmont, Massachusetts 02478 |
||||||||
| (1) | Lease expires in March 2020. |
| (2) | Lease expires in March 2025. |
| (3) | Lease expires in July 2023. |
| (4) | Lease expires in May 2023. |
| (5) | Lease expires in September 2020. |
| (6) | Lease expires in August 2018. |
| ITEM 3. | LEGAL PROCEEDINGS |
Periodically, there have been various claims and lawsuits against us, such as claims to enforce liens, condemnation proceedings on properties in which we hold security interests, claims involving the making and servicing of real property loans and other issues incident to our business. We are not a party to any pending legal proceedings that we believe would have a material adverse effect on our financial condition, results of operations or cash flows.
| ITEM 4. | MINE SAFETY DISCLOSURE |
Not applicable.
45
Table of Contents
| ITEM 5. | MARKET FOR REGISTRANT’S COMMON EQUITY, RELATED STOCKHOLDER MATTERS AND ISSUER PURCHASES OF EQUITY SECURITIES |
Market Information.
The Company’s common stock is listed on the Nasdaq Capital Market (“NASDAQ”) under the trading symbol “BLMT.” The Company completed its initial public offering on October 4, 2011 and commenced trading on October 5, 2011.
The following table sets forth the high and low sales prices of the Company’s common stock as reported by NASDAQ for the periods indicated.
| Price Range Per Share | ||||||||
| 2017: |
High | Low | ||||||
| Fourth Quarter |
$ | 32.15 | $ | 27.75 | ||||
| Third Quarter |
30.35 | 27.25 | ||||||
| Second Quarter |
30.75 | 27.80 | ||||||
| First Quarter |
29.40 | 26.65 | ||||||
| Price Range Per Share | ||||||||
| 2016: |
High | Low | ||||||
| Fourth Quarter |
$ | 30.05 | $ | 23.09 | ||||
| Third Quarter |
25.18 | 22.51 | ||||||
| Second Quarter |
23.98 | 21.51 | ||||||
| First Quarter |
23.24 | 20.72 | ||||||
46
Table of Contents
Stock Performance Graph.
The following graph compares the cumulative total shareholder return on BSB Bancorp common stock with the cumulative total return on the Russell 2000 Index and with the SNL Thrift Industry Index. The graph assumes $100 was invested at the close of business on December 31, 2012 and utilizes closing market price.
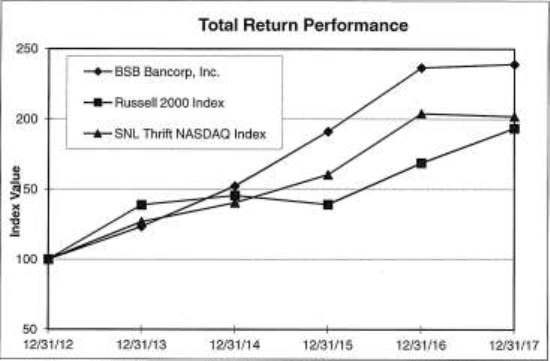
| Period Ending | ||||||||||||||||||||||||
| Index |
12/31/12 | 12/31/13 | 12/31/14 | 12/31/15 | 12/31/16 | 12/31/17 | ||||||||||||||||||
| BSB Bancorp, Inc. |
100.00 | 123.39 | 152.33 | 191.25 | 236.71 | 239.17 | ||||||||||||||||||
| Russell 2000 |
100.00 | 138.82 | 145.62 | 139.19 | 168.85 | 193.58 | ||||||||||||||||||
| SNL Thrift NASDAQ |
100.00 | 126.80 | 140.44 | 160.48 | 204.03 | 202.08 | ||||||||||||||||||
Holders.
As of March 9, 2018, there were 255 holders of record of the Company’s common stock.
Dividends.
The Company has not paid any dividends to its stockholders to date. The payment of dividends in the future will depend upon a number of factors, including capital requirements, the Company’s financial condition and results of operations, tax considerations, statutory and regulatory limitations and general economic conditions. In addition, the Company’s ability to pay dividends is dependent on dividends received from Belmont Savings. For more information regarding restrictions on the payment of cash dividends by the Company and by Belmont Savings, see “Business—Regulation and Supervision—Holding Company Regulation—Dividends” and “—Regulation and Supervision—Massachusetts Banking Laws and Supervision—Dividends.” No assurances can be given that any dividends will be paid or that, if paid, will not be reduced or eliminated in the future.
47
Table of Contents
Securities Authorized for Issuance under Equity Compensation Plans.
Stock-Based Compensation Plan
Information regarding stock-based compensation awards outstanding and available for future grants as of December 31, 2017, segregated between stock-based compensation plans approved by shareholders and stock-based compensation plans not approved by shareholders, is presented in the table below. Additional information regarding stock-based compensation plans is presented in Note 16 – Stock Based Compensation in the notes to consolidated financial statements included in Item 8. Financial Statements and Supplementary Data located elsewhere in this report.
| Plan category |
Number of securities to be issued upon exercise of outstanding options, warrants and rights |
Weighted-average exercise price of outstanding options, warrants and rights |
Number of securities remaining available for future issuance under equity compensation plans (excluding securities reflected in column (a)) |
|||||||||
| (a) | (b) | (c) | ||||||||||
| Equity compensation plans approved by security holders |
590,522 | $ | 12.86 | 3,898 | ||||||||
| Equity compensation plans not approved by security holders |
— | — | — | |||||||||
|
|
|
|
|
|
|
|||||||
| Total |
590,522 | 12.86 | 3,898 | |||||||||
|
|
|
|
|
|
|
|||||||
Purchases of Equity Securities by the Issuer and Affiliated Purchasers.
The following table provides certain information with regard to shares repurchased by the Company in the fourth quarter of 2017.
| Period |
(a) Total Number of Shares Purchased |
(b) Average Price Paid per Share |
(c) Total Number of Shares Purchased as Part of Publicly Announced Plans or Programs(1) |
(d) Maximum Number of Shares that May Yet Be Purchased Under the Plans or Programs(1) |
||||||||||||
| October 1 - October 31 |
— | $ | — | — | 500,000 | |||||||||||
| November 1 - November 30 |
— | — | — | 500,000 | ||||||||||||
| December 1 - December 31 |
— | — | — | 500,000 | ||||||||||||
|
|
|
|
|
|||||||||||||
| Total |
— | $ | — | — | ||||||||||||
|
|
|
|
|
|||||||||||||
| (1) | The Company completed its first stock repurchase program during the second quarter of 2013. On August 5, 2013, the Company announced the commencement of a second stock repurchase program to acquire up to 500,000 shares, or 5.5% of the Company’s then outstanding common stock. Repurchases will be made from time to time depending on market conditions and other factors, and will be conducted through open market or private transactions, through block trades, and pursuant to any trading plan that may be adopted in accordance with Rule 10b5-1 of the Securities and Exchange Commission. There is no guarantee as to the exact number of shares to be repurchased by the Company. |
48
Table of Contents
| ITEM 6. | SELECTED FINANCIAL DATA |
| At December 31, | ||||||||||||||||||||
| 2017 | 2016 | 2015 | 2014 | 2013 | ||||||||||||||||
| (Dollars in thousands) | ||||||||||||||||||||
| Selected Financial Condition Data: |
||||||||||||||||||||
| Total assets |
$ | 2,676,565 | $ | 2,158,704 | $ | 1,812,916 | $ | 1,425,550 | $ | 1,054,619 | ||||||||||
| Cash and cash equivalents |
110,888 | 58,876 | 51,261 | 51,767 | 38,042 | |||||||||||||||
| Investment securities - available for sale |
16,921 | 22,048 | 21,876 | 22,079 | 21,921 | |||||||||||||||
| Investment securities - held to maturity |
160,090 | 130,197 | 137,119 | 118,528 | 119,776 | |||||||||||||||
| Loans receivable, net |
2,296,958 | 1,866,035 | 1,534,957 | 1,179,399 | 839,013 | |||||||||||||||
| Federal Home Loan Bank stock |
32,382 | 25,071 | 18,309 | 13,712 | 7,712 | |||||||||||||||
| Bank-owned life insurance |
36,967 | 35,842 | 29,787 | 23,888 | 13,325 | |||||||||||||||
| Deposits |
1,751,251 | 1,469,422 | 1,269,519 | 984,562 | 764,753 | |||||||||||||||
| Federal Home Loan Bank advances |
723,150 | 508,850 | 374,000 | 285,100 | 142,100 | |||||||||||||||
| Securities sold under agreements to repurchase |
3,268 | 1,985 | 3,695 | 1,392 | 2,127 | |||||||||||||||
| Other borrowed funds |
— | — | 1,020 | 1,067 | 1,113 | |||||||||||||||
| Total stockholders’ equity |
178,029 | 160,921 | 146,203 | 137,010 | 130,421 | |||||||||||||||
| For the Fiscal Year Ended December 31, | ||||||||||||||||||||
| 2017 | 2016 | 2015 | 2014 | 2013 | ||||||||||||||||
| (Dollars in thousands) | ||||||||||||||||||||
| Selected Operating Data: |
||||||||||||||||||||
| Interest and dividend income |
$ | 77,143 | $ | 61,621 | $ | 48,406 | $ | 38,652 | $ | 30,968 | ||||||||||
| Interest expense |
21,054 | 14,231 | 10,194 | 7,051 | 4,987 | |||||||||||||||
|
|
|
|
|
|
|
|
|
|
|
|||||||||||
| Net interest and dividend income |
56,089 | 47,390 | 38,212 | 31,601 | 25,981 | |||||||||||||||
| Provision for loan losses |
2,762 | 2,385 | 2,317 | 1,552 | 1,498 | |||||||||||||||
|
|
|
|
|
|
|
|
|
|
|
|||||||||||
| Net interest and dividend income after provision for loan losses |
53,327 | 45,005 | 35,895 | 30,049 | 24,483 | |||||||||||||||
| Noninterest income |
3,627 | 2,750 | 3,165 | 3,294 | 3,610 | |||||||||||||||
| Noninterest expense |
30,686 | 28,349 | 27,824 | 26,490 | 25,091 | |||||||||||||||
|
|
|
|
|
|
|
|
|
|
|
|||||||||||
| Income before income tax expense |
26,268 | 19,406 | 11,236 | 6,853 | 3,002 | |||||||||||||||
| Income tax expense |
11,882 | 7,425 | 4,322 | 2,562 | 1,042 | |||||||||||||||
|
|
|
|
|
|
|
|
|
|
|
|||||||||||
| Net income |
$ | 14,386 | $ | 11,981 | $ | 6,914 | $ | 4,291 | $ | 1,960 | ||||||||||
|
|
|
|
|
|
|
|
|
|
|
|||||||||||
49
Table of Contents
| At or for the fiscal years ended December 31, | ||||||||||||||||||||
| 2017 | 2016 | 2015 | 2014 | 2013 | ||||||||||||||||
| Selected Financial Ratios and Other Data: |
||||||||||||||||||||
| Performance Ratios: |
||||||||||||||||||||
| Return on average assets |
0.61 | % | 0.61 | % | 0.44 | % | 0.35 | % | 0.21 | % | ||||||||||
| Return on average stockholders’ equity |
8.40 | % | 7.78 | % | 4.87 | % | 3.20 | % | 1.50 | % | ||||||||||
| Interest rate spread (1) |
2.24 | % | 2.32 | % | 2.33 | % | 2.47 | % | 2.69 | % | ||||||||||
| Net interest margin (2) |
2.38 | % | 2.45 | % | 2.48 | % | 2.64 | % | 2.89 | % | ||||||||||
| Efficiency ratio (3) |
51.39 | % | 56.54 | % | 67.25 | % | 75.91 | % | 84.79 | % | ||||||||||
| Noninterest expense to average total assets |
1.29 | % | 1.44 | % | 1.77 | % | 2.16 | % | 2.72 | % | ||||||||||
| Average interest-earning assets to average interest-bearing liabilities |
115.96 | % | 118.26 | % | 122.46 | % | 128.79 | % | 137.34 | % | ||||||||||
| Average stockholders’ equity to average total assets |
7.21 | % | 7.83 | % | 9.01 | % | 10.91 | % | 14.11 | % | ||||||||||
| Asset Quality Ratios: |
||||||||||||||||||||
| Non-performing assets to total assets |
0.05 | % | 0.08 | % | 0.20 | % | 0.20 | % | 0.39 | % | ||||||||||
| Non-performing loans to total loans |
0.06 | % | 0.10 | % | 0.24 | % | 0.23 | % | 0.49 | % | ||||||||||
| Allowance for loan losses to non-performing loans |
1185.47 | % | 746.84 | % | 309.56 | % | 320.59 | % | 193.39 | % | ||||||||||
| Allowance for loan losses to total loans |
0.71 | % | 0.73 | % | 0.73 | % | 0.75 | % | 0.95 | % | ||||||||||
| Capital Ratios (4): |
||||||||||||||||||||
| Total capital to risk-weighted assets |
11.30 | % | 11.72 | % | 12.22 | % | 12.99 | % | 16.30 | % | ||||||||||
| Tier 1 capital to risk-weighted assets |
10.35 | % | 10.80 | % | 11.34 | % | 12.19 | % | 15.35 | % | ||||||||||
| Common Equity Tier 1 Capital to risk-weighted assets |
10.35 | % | 10.80 | % | 11.34 | % | N/A | N/A | ||||||||||||
| Tier 1 capital to average assets |
6.97 | % | 7.63 | % | 8.37 | % | 10.05 | % | 12.59 | % | ||||||||||
| Other Data: |
||||||||||||||||||||
| Number of full service offices |
6 | 6 | 6 | 6 | 7 | |||||||||||||||
| Full time equivalent employees |
123 | 122 | 129 | 126 | 123 | |||||||||||||||
| (1) | The interest rate spread represents the difference between the weighted-average yield on interest-earning assets and the weighted-average cost of interest-bearing liabilities for the period. |
| (2) | The net interest margin represents net interest income as a percent of average interest-earning assets for the period. |
| (3) | The efficiency ratio represents noninterest expense as a percentage of the sum of net interest income and noninterest income. |
| (4) | Capital ratios are for BSB Bancorp, Inc. |
| ITEM 7. | MANAGEMENT’S DISCUSSION AND ANALYSIS OF FINANCIAL CONDITION AND RESULTS OF OPERATION |
Overview
Our results of operations depend primarily on our net interest and dividend income. Net interest and dividend income is the difference between the income we earn on our interest and dividend earning assets and the amount we pay on our interest bearing liabilities. Interest and dividend earning assets consist primarily of loans, investment securities (including corporate bonds and mortgage-backed securities guaranteed or issued by U.S. government-sponsored enterprises) and interest-earning deposits at other financial institutions. Interest bearing liabilities consist primarily of our depositors’ money market, savings, checking, and certificates of deposit accounts and to a lesser extent Federal Home Loan Bank of Boston advances and brokered certificates of deposit. Our results of operations also are affected by our provision for loan losses, non-interest income and non-interest expense. Non-interest income consists primarily of service charges on deposit accounts, income derived from bank owned life insurance, loan servicing fees, gains or losses on the sale of loans, gains or losses on the sale of available-for-sale investment securities, and other income. Non-interest expense consists primarily of salaries and employee benefits, occupancy and equipment expenses, data processing expenses, legal expenses, accounting and exam fees, FDIC insurance premiums, director compensation and other operating expenses. Our results of operations may also be significantly affected by competitive conditions, changes in market interest rates, governmental policies, general and local economic conditions, and actions of regulatory authorities.
50
Table of Contents
Management evaluates the Company’s operating results and financial condition using measures that include net income, earnings per share, return on assets and equity, efficiency ratio, net interest margin, tangible book value per share, asset quality indicators, and many others. These metrics help management make key decisions regarding the Bank’s balance sheet, liquidity, interest rate risk position, and capital resources and assist with identifying areas to improve.
In 2009, the Bank reorganized into the mutual holding company structure. In 2010, the Board of Directors approved a new strategic plan designed to increase growth and long-term profitability of the Bank. On October 4, 2011, we completed our initial public offering of common stock in connection with BSB Bancorp, MHC’s mutual-to-stock conversion, selling 8,993,000 shares of common stock at $10.00 per share, including 458,643 shares sold to Belmont Savings Bank’s employee stock ownership plan, and raising approximately $89.9 million of gross proceeds. In addition, we issued 179,860 shares of our common stock and contributed $200,000 in cash to the Belmont Savings Bank Foundation.
Further, following a comprehensive strategic review of the Bank’s management and operations, the Board of Directors of the Bank approved a new strategic plan designed to increase the growth and profitability of the Bank. The strategic plan contemplated significant growth in assets and liabilities over the next several years with the intent of building upon the Bank’s leading market share in Belmont and the surrounding communities, striving to be the “Bank of Choice” for small businesses in its market area and the trusted lending partner for area commercial real estate investors, developers and managers. The strategic plan was intended to take advantage of the sound eastern Massachusetts economy, which has not been as negatively affected by the recent recession as other regions of the United States. Our current strategy also includes striving to be the “Bank of Choice” for cash driven small businesses, municipalities and nonprofit organizations in the Bank’s market area.
The current strategic plan includes growth in one-to-four family residential real estate loans, increased home equity lending and increased commercial real estate lending. Our portfolios of commercial real estate loans, one-to-four family residential real estate loans and home equity lines of credit have increased in accordance with the strategic plan, and we intend to continue this strategy of growing these asset classes, while selling a portion of the loans that we originate from time to time as conditions warrant. We have also suspended originations of indirect auto loans due to the current market conditions and low interest rate environment.
Our emphasis on conservative loan underwriting has resulted in relatively low levels of delinquency and non-performing assets. Our non-performing assets totaled $1.4 million, or 0.05% of total assets, at December 31, 2017, compared to $1.8 million, or 0.08% of total assets, at December 31, 2016, and $3.6 million, or 0.20% of total assets, at December 31, 2015. Total loan delinquencies of 60 days or more as of December 31, 2017, 2016 and 2015 were $294,000, $1.1 million and $554,000, respectively. Our provision for loan losses was $2.8 million, $2.4 million and $2.3 million for the years ended December 31, 2017, 2016 and 2015, respectively. For the years ending December 31, 2017 and 2016 we experienced net charge offs of $35,000 and $40,000, respectively. For the year ended December 31, 2015 we experienced net recoveries of $42,000.
Management pays close attention to the ongoing operating expenses incurred by the Company while making needed capital expenditures and prudently investing in our infrastructure. The Company’s primary expenses are related to salaries and employee benefits, data processing costs, deposit insurance costs and expenses associated with buildings and equipment. During the year ended December 31, 2017, noninterest expense was managed well and we continued to make improvements in our efficiency ratio.
Critical Accounting Policies
Critical accounting policies are defined as those that involve significant judgments and uncertainties, and could potentially result in materially different results under different assumptions and conditions. We believe that the most critical accounting policies upon which our financial condition and results of operation depend, and which involve the most complex subjective decisions or assessments, are the following:
Allowance for Loan Losses. The allowance for loan losses is the estimated amount considered necessary to cover probable and reasonably estimable credit losses inherent in the loan portfolio at the balance sheet date. The allowance for loan losses is established through the provision for loan losses that is charged against income.
51
Table of Contents
The determination of the allowance for loan losses is considered a critical accounting policy by management because of the high degree of judgment involved, the subjectivity of the assumptions used, and the potential for changes in the economic environment that could result in changes to the amount of the recorded allowance for loan losses.
The allowance for loan losses has been determined in accordance with GAAP. We are responsible for the timely and periodic determination of the amount of the allowance for loan losses required. We believe the allowance for loan losses is an appropriate estimate of the inherent probable losses within our loan portfolio.
The estimate of our credit losses is applied to two general categories of loans:
| • | Loans that we evaluate individually for impairment under ASC 310-10, “Receivables;” and |
| • | Groups of loans with similar risk characteristics that we evaluate collectively for impairment under ASC 450-20, “Loss Contingencies.” |
The allowance for loan losses is evaluated on a regular basis by management and reflects consideration of all significant factors that affect the collectability of the loan portfolio. The factors used to evaluate the collectability of the loan portfolio include, but are not limited to, current economic conditions, our historical loss experience, the nature and volume of the loan portfolio, the financial strength of the borrower, and the estimated value of any underlying collateral. This evaluation is inherently subjective as it requires estimates that are subject to significant revision as more information becomes available. Actual loan losses may be significantly more than the allowance for loan losses we have established which could have a material negative effect on our financial results.
Securities Valuation and Impairment. Our available-for-sale securities portfolio consists of corporate bonds. Our available-for-sale securities portfolio is carried at estimated fair value, with any unrealized gains or losses, net of taxes, reported as accumulated other comprehensive income or loss in stockholders’ equity. Our held-to-maturity securities portfolio, which consists of corporate bonds and U.S. government agency sponsored mortgage-backed securities for which we have the positive intent and ability to hold to maturity, is carried at amortized cost. We conduct a quarterly review and evaluation of the available-for-sale and held-to-maturity securities portfolios to determine if the fair value of any security has declined below its amortized cost, and whether such decline is other-than-temporary. If the amortized cost basis of a security exceeds its fair value, we evaluate, among other factors, general market conditions, the duration and extent to which the fair value is less than cost, the probability of a near-term recovery in value and our intent to sell the security and whether it is more likely than not that we will be required to sell the security before full recovery of our investment or maturity. If such a decline is deemed other-than-temporary for equity securities, an impairment charge is recorded through current earnings based upon the estimated fair value of the security at the time of impairment and a new cost basis in the investment is established. For any debt security with a fair value less than its amortized cost basis, we will determine whether we have the intent to sell the debt security or whether it is more likely than not we will be required to sell the debt security before the recovery of its amortized cost basis. If either condition is met, we will recognize the full impairment charge to earnings. For all other debt securities that are considered other-than-temporarily impaired and do not meet either condition, the credit loss portion of impairment will be recognized in earnings as realized losses. The other-than-temporary impairment related to all other factors will be recorded in other comprehensive income.
Determining if a security’s decline in estimated fair value is other-than-temporary is inherently subjective. In performing our evaluation of securities in an unrealized loss position, we consider among other things, the severity, and duration of time that the security has been in an unrealized loss position and the credit quality of the issuer. This evaluation is inherently subjective as it requires estimates of future events, many of which are difficult to predict. Actual results could be significantly different than our estimates and could have a material effect on our financial results.
Deferred Income Taxes. We use the asset and liability method of accounting for income taxes. Under this method, deferred tax assets and liabilities are recognized for the future tax consequences attributable to differences between the financial statement carrying amounts of existing assets and liabilities and their respective tax bases.
52
Table of Contents
Deferred tax assets and liabilities are measured using enacted tax rates expected to apply to taxable income in the years in which those temporary differences are expected to be recovered or settled. If it is determined that it is more likely than not that the deferred tax assets will not be realized, a valuation allowance is established. We consider the determination of this valuation allowance to be a critical accounting policy because of the need to exercise significant judgment in evaluating the amount and timing of recognition of deferred tax liabilities and assets, including projections of future taxable income. These judgments and estimates are reviewed quarterly as regulatory and business factors change. A valuation allowance for deferred tax assets may be required if the amounts of taxes recoverable through loss carrybacks decline, or if we project lower levels of future taxable income. Such a valuation allowance would be established and any subsequent changes to such allowance would require an adjustment to income tax expense that could adversely affect our operating results.
Comparison of Financial Condition at December 31, 2017 and December 31, 2016
Total Assets. Total assets increased $517.9 million, or 24.0% to $2.68 billion at December 31, 2017, from $2.16 billion at December 31, 2016. The increase was primarily the result of a $430.9 million or 23.1% increase in net loans, a $52.0 million or 88.3% increase in cash and cash equivalents and a $24.8 million or 16.3% increase in investment securities.
Loans. Net loans increased by $430.9 million to $2.30 billion at December 31, 2017 from $1.87 billion at December 31, 2016. The increase in net loans was primarily due to increases of $335.7 million or 33.7% in one-to-four family residential loans, $150.2 million or 30.5% in commercial real estate loans, and $11.2 million or 6.7% in home equity lines of credit. Partially offsetting these increases were decreases of $36.0 million or 40.4% in construction loans as projects were completed and $30.0 million or 49.8% in indirect automobile loans as we have suspended originations due to current market conditions. Our plan to prudently build our commercial and consumer loan portfolios continues as significant growth was achieved in each of our strategic business lines while credit losses remained low.
Investment Securities. The carrying value of total investment securities increased by $24.8 million to $177.0 million at December 31, 2017, from $152.2 million at December 31, 2016. The increase in investment securities was driven by an increase of $29.9 million or 23.0% in securities classified as held to maturity. Partially offsetting that increase was a decrease of $5.1 million or 23.3% in securities classified as available for sale.
Cash and Cash Equivalents. Cash and cash equivalents increased by $52.0 million to $110.9 million at December 31, 2017, from $58.9 million at December 31, 2016.
Bank-Owned Life Insurance. We invest in bank-owned life insurance to help defray the costs of our employee benefit plan obligations. Additionally, bank-owned life insurance generally provides nontaxable, noninterest income. At December 31, 2017, our investment in bank-owned life insurance was $37.0 million, an increase of $1.1 million from $35.8 million at December 31, 2016, primarily due to increases in the cash surrender value.
Deposits. Deposits increased $281.8 million or 19.2%, to $1.75 billion at December 31, 2017 from $1.47 billion at December 31, 2016. The increase in deposits was primarily driven by a $169.1 million or 50.4% increase in certificate of deposit accounts, a $67.8 million or 8.6% increase in savings accounts, a $31.9 million or 24.2% increase in interest bearing checking accounts and a $13.4 million or 6.4% increase in demand deposit accounts. 2017 was a very strong year for deposit growth at Belmont Savings. Expansion of our Business Banking team, diligent focus on key target segments, continued success with commercial relationship expansion and consistent retail deposit product development and marketing were key factors in driving this performance. Our core deposit accounts, which we consider to include all deposits other than CDs and brokered CDs, experienced significant growth of $112.7 million, or 9.9%, which indicates that core banking relationships continue to grow.
Borrowings. At December 31, 2017, borrowings consisted of advances from the Federal Home Loan Bank of Boston and securities sold to customers under agreements to repurchase, or “repurchase agreements.”
Total borrowings increased $215.6 million or 42.2%, to $726.4 million at December 31, 2017, from $510.8 million at December 31, 2016. This increase was driven by an increase in advances from the Federal Home Loan Bank of Boston of $214.3 million or 42.1%.
53
Table of Contents
Stockholders’ Equity. Total stockholders’ equity increased $17.1 million or 10.6% to $178.0 million at December 31, 2017, from $160.9 million at December 31, 2016. This increase is primarily the result of earnings of $14.4 million and a $2.6 million increase in additional paid-in capital related to stock-based compensation.
Comparison of Operating Results for the Years Ended December 31, 2017 and 2016
General. For the year ended December 31, 2017, net income was $14.39 million or $1.55 per diluted share as compared to net income of $11.98 million or $1.33 per diluted share for the year ended December 31, 2016 or an increase in net income of $2.4 million or 20.1%. The increase was primarily due to an $8.3 million or 18.5% increase in net interest and dividend income after the provision for loan losses and an $877,000 or 31.9% increase in noninterest income, partially offset by a $2.3 million or 8.2% increase in noninterest expense and a $4.5 million or 60.0% increase in income tax expense. The fourth quarter of 2017 included a one-time charge of $2.63 million, recorded within income tax expense, related to the enactment of the Tax Cuts and Jobs Act (“Tax Reform Act”). This charge resulted from the re-measurement of the Bank’s deferred tax assets due to a lower future U.S corporate income tax rate. Excluding the impact of the Tax Reform Act, adjusted net income was $17.01 million or $1.84 per adjusted diluted share for the year ended December 31, 2017 representing an increase in adjusted net income of 42.0% compared to 2016. The reduction in the corporate tax rate due to the Tax Reform Act is expected to benefit future earnings as the statutory federal income tax rate is lower beginning in 2018. Adjusted net income and adjusted earnings per share figures are non-GAAP financial measures that exclude the impact of the Tax Reform Act from net income and earnings per share. Refer to the table below for a reconciliation of these measures to reported results.
54
Table of Contents
The charts below illustrate the Company’s consistent increases in earnings, strong asset growth, high quality credit and good expense control. There is no guarantee that these trends will continue in future periods.
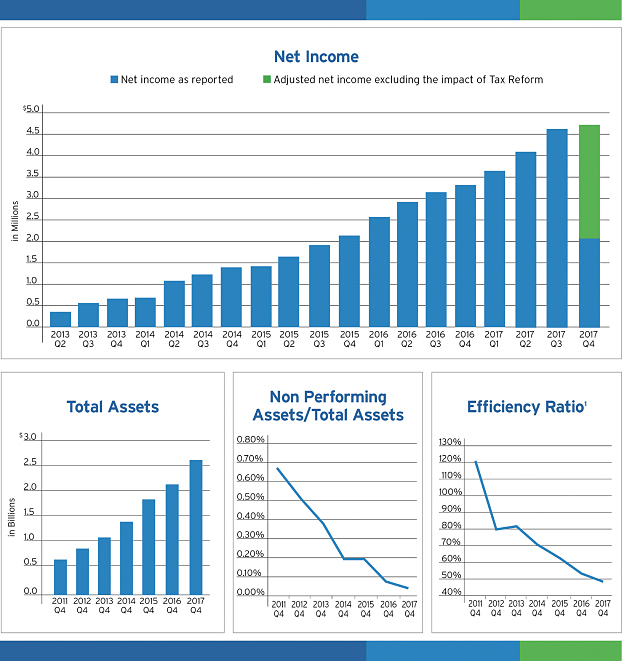
| 1 | Non-interest expense divided by net interest income and non-interest income. |
55
Table of Contents
Reconciliation Table - Non-GAAP Financial Information
| Year ended December 31, |
||||||||
| 2017 | 2016 | |||||||
| Net income as reported |
$ | 14,386 | $ | 11,981 | ||||
| Add: Income tax expense related to write-down of deferred tax asset |
2,626 | — | ||||||
|
|
|
|
|
|||||
| Adjusted net income |
$ | 17,012 | $ | 11,981 | ||||
|
|
|
|
|
|||||
| Diluted earnings per share as reported |
$ | 1.55 | $ | 1.33 | ||||
| Add: Income tax expense related to write-down of deferred tax asset |
0.29 | — | ||||||
|
|
|
|
|
|||||
| Adjusted diluted earnings per share |
$ | 1.84 | $ | 1.33 | ||||
|
|
|
|
|
|||||
Net Interest and Dividend Income. Net interest and dividend income increased by $8.7 million to $56.1 million for the year ended December 31, 2017, from $47.4 million for the year ended December 31, 2016. The increase in net interest and dividend income was primarily due to an increase in our net interest-earning assets and the ability to effectively manage our cost of funds. Net average interest-earning assets increased $23.1 million or 7.9% to $317.0 million for the year ended December 31, 2017 from $293.9 million for the year ended December 31, 2016. Our net interest margin decreased 7 basis points to 2.38% for the year ended December 31, 2017, compared to 2.45% for the year ended December 31, 2016, and our net interest rate spread decreased 8 basis points to 2.24% for the year ended December 31, 2017, compared to 2.32% for the year ended December 31, 2016.
Interest and Dividend Income. Total interest and dividend income increased $15.5 million or 25.2% to $77.1 million for the year ended December 31, 2017 from $61.6 million for the year ended December 31, 2016. The increase in interest and dividend income was primarily due to a $14.5 million increase in interest income on loans. The increase in interest income on loans resulted from a $378.7 million increase in the average balance of loans.
Interest Expense. Interest expense increased $6.8 million or 47.9% to $21.1 million for the year ended December 31, 2017 from $14.2 million for the year ended December 31, 2016. The increase was driven by a $376.8 million increase in the average balance of interest-bearing liabilities as well as an increase in the average cost of funds of 18 basis points to 1.06% at December 31, 2017 from 0.88% at December 31, 2016.
Interest expense on interest-bearing deposits increased by $3.5 million to $12.9 million for the year ended December 31, 2017 from $9.4 million for the year ended December 31, 2016. This increase was primarily due to an increase of $233.4 million in the average balance of interest-bearing deposits to $1.41 billion at December 31, 2017 from $1.18 billion at December 31, 2016. The average cost of interest-bearing deposits increased 11 basis points to 0.91% for the year ended December 31, 2017, compared to 0.80% for the year ended December 31, 2016. The average cost of savings accounts increased by 12 basis points during the year ended December 31, 2017 as compared to the year ended December 31, 2016 as we have focused on growing these products and attracting new relationships.
Interest expense on Federal Home Loan Bank advances increased $3.4 million to $8.2 million for the year ended December 31, 2017 from $4.8 million for the year ended December 31, 2016. This increase was primarily due to an increase of $143.3 million in the average balance of Federal Home Loan Bank advances to $571.4 million for the year ended December 31, 2017 from $428.2 million for the year ended December 31, 2016. Also driving this additional interest expense was an increase in the average cost of advances to 1.43% for the year ended December 31, 2017 from 1.12% for the year ended December 31, 2016. The increase in the cost is due to both increases in short term rates and increased balances of our long term advances.
Provision for Loan Losses. We recorded a provision for loan losses of $2.8 million for the year ended December 31, 2017 compared to a provision for loan losses of $2.4 million for the year ended December 31, 2016. We recorded net charge offs of $35,000 for the year ended December 31, 2017 compared to net charge offs of $40,000 during the year ended December 31, 2016. The allowance for loan losses was $16.3 million or 0.71% of total loans at December 31, 2017 compared to $13.6 million or 0.73% of total loans at December 31, 2016.
56
Table of Contents
Noninterest Income. Noninterest income for the year ended December 31, 2017 was $3.6 million as compared to $2.8 million for the year ended December 31, 2016 or an increase of 31.9%.
| • | Customer service fees decreased $118,000 or 13.1% primarily due to declines in NSF and other fees. |
| • | Income from bank-owned life insurance increased $70,000 or 6.7% primarily due to a purchase of $5.0 million in additional bank-owned life insurance policies at the end of the second quarter of 2016. |
| • | Net gains on sales of securities increased $38,000 from zero as we sold one security classified as available for sale. |
| • | Net gains on sales of loans increased $665,000 or 245.4% due to an increase in the number of loans sold. |
| • | Loan servicing fee income increased $48,000 or 13.7% due to an improvement in the value of our mortgage servicing right asset. |
| • | Other income increased by $174,000 or 98.9% primarily due to vendor loss experience refunds and increases in the values of investments held in a Rabbi Trust. |
Noninterest Expense. Noninterest expense for the year ended December 31, 2017 was $30.7 million as compared to $28.4 million for the year ended December 31, 2016 or an increase of 8.2%.
| • | Salaries and employee benefits increased $1.8 million or 9.9% driven by stock-based compensation related to grants of restricted stock made during the first quarter of 2017, an increase in the number of employees, an increase in cash-based incentive compensation and an increase in health care costs. |
| • | Director compensation increased $384,000 or 39.5% primarily driven by stock-based compensation related to grants of restricted stock made during the first quarter of 2017 and increased deferred compensation costs related to the increase in value of the investments held in the Rabbi Trust. |
| • | Deposit insurance expense increased by $448,000 or 34.9% primarily driven by asset growth. |
| • | Data processing fees decreased by $327,000 or 10.5% as we renegotiated certain contracts with service providers in late 2016. |
Income Tax Expense. We recorded a provision for income taxes of $11.9 million for the year ended December 31, 2017, compared to a provision for income taxes of $7.4 million for the year ended December 31, 2016, reflecting effective tax rates of 45.2% and 38.3%, respectively.
The effective tax rate for 2017 was impacted by the adjustment of our deferred tax assets and liabilities related to the reduction in the U.S. federal statutory income tax rate from 35% to 21% under the Tax Reform Act enacted on December 22, 2017. Under ASC 740, Income Taxes, the effect of income tax law changes on deferred taxes should be recognized as a component of income tax expense related to continuing operations in the period in which the law is enacted. This requirement applies not only to items initially recognized in continuing operations, but also to items initially recognized in other comprehensive income. As a result of the reduction in the U.S. federal statutory income tax rate, we recognized a writedown of our deferred tax asset of $2.6 million through income tax expense, determined as follows (in thousands):
| Tax Benefit/(Expense) | ||||
| Deferred taxes related to items recognized in continuing operations |
$ | (2,645 | ) | |
| Deferred taxes related to items recognized in other comprehensive income: |
||||
| Deferred taxes on net actuarial gain on defined benefit post-retirement benefit plans |
26 | |||
| Deferred taxes on net unrealized loss on securities available-for-sale |
(7 | ) | ||
|
|
|
|||
| Net adjustment to deferred taxes recognized as income tax expense |
$ | (2,626 | ) | |
|
|
|
|||
57
Table of Contents
Because ASC 740 requires the effect of income tax law changes on deferred taxes to be recognized as a component of income tax expense related to continuing operations rather than merely backward tracing the adjustment through the accumulated other comprehensive income component of stockholders’ equity, the net adjustment to deferred taxes detailed above included a net benefit totaling $19,000 related to items recognized in other comprehensive income. The amounts included in the table above are included as as separate components of accumulated other comprehensive income at December 31, 2017. In February 2018, the Financial Accounting Standards Board issued Accounting Standards Update 2018-02, that allows companies to elect to reclassify the tax effects stranded in accumulated other comprehensive income to retained earnings rather than income tax benefit or expense.
Comparison of Operating Results for the Years Ended December 31, 2016 and 2015
General. Net income increased $5.1 million, or 73.3%, to $12.0 million for the year ended December 31, 2016, from $6.9 million for the year ended December 31, 2015. The increase was primarily due to a $9.2 million increase in net interest and dividend income after the provision for loan losses, partially offset by a $525,000 increase in noninterest expense, a $415,000 decrease in noninterest income and a $3.1 million increase in income tax expense.
Net Interest and Dividend Income. Net interest and dividend income increased by $9.2 million to $47.4 million for the year ended December 31, 2016, from $38.2 million for the year ended December 31, 2015. The increase in net interest and dividend income was primarily due to an increase in our net interest-earning assets and the ability to attract lower cost core deposits and take advantage of the historically low wholesale funding rates. Net average interest-earning assets increased $14.3 million, or 5.1%, to $293.9 million for the year ended December 31, 2016 from $279.6 million for the year ended December 31, 2015. Our net interest margin decreased 3 basis points to 2.45% for the year ended December 31, 2016, compared to 2.48% for the year ended December 31, 2015, and our net interest rate spread decreased 1 basis point to 2.32% for the year ended December 31, 2016, compared to 2.33% for the year ended December 31, 2015.
Interest and Dividend Income. Total interest and dividend income increased $13.2 million, or 27.3%, to $61.6 million for the year ended December 31, 2016, from $48.4 million for the year ended December 31, 2015. The increase in interest and dividend income was primarily due to a $12.6 million increase in interest income on loans. The increase in interest income on loans resulted from a $366.2 million increase in the average balance of loans.
Interest Expense. Interest expense increased $4.0 million, or 39.6%, to $14.2 million for the year ended December 31, 2016, from $10.2 million for the year ended December 31, 2015. The increase was driven by a $364.7 million increase in the average balance of interest-bearing liabilities as well as an increase in the average cost of funds of 6 basis points to 0.88% from 0.82%.
Interest expense on interest-bearing deposits increased by $1.6 million to $9.4 million for the year ended December 31, 2016, from $7.8 million for the year ended December 31, 2015. This increase was primarily due to an increase of $228.2 million in the average balance of interest bearing deposits to $1.2 billion at December 31, 2016 from $950.3 million at December 31, 2015. The average cost of interest-bearing deposits remained low at 0.80% for the year ended December 31, 2016, compared to 0.82% for the year ended December 31, 2015. The average cost of certificates of deposits declined slightly during the year ended December 31, 2016 as compared to the year ended December 31, 2015 and we experienced an increase in the average cost of interest-bearing checking accounts for the year ended December 31, 2016 as compared to the year ended December 31, 2015 as we have focused on growing these products and attracting new relationships.
Interest expense on Federal Home Loan Bank advances increased $2.4 million to $4.8 million for the year ended December 31, 2016, from $2.4 million for the year ended December 31, 2015. This increase was primarily due to an increase of $137.4 million in the average balance of Federal Home Loan Bank advances to $428.2 million for the year ended December 31, 2016, from $290.8 million for the year ended December 31, 2015. Also driving this additional interest expense was an increase in the average cost of advances to 1.12% for the year ended December 31, 2016, from 0.82% for the year ended December 31, 2015. The increase in the cost is due to both increases in short term rates and increased balances of our long term advances.
58
Table of Contents
Provision for Loan Losses. We recorded a provision for loan losses of $2.4 million for the year ended December 31, 2016, compared to a provision for loan losses of $2.3 million for the year ended December 31, 2015. We recorded net charge offs of $40,000 for the year ended December 31, 2016 compared to net recoveries of $42,000 during the year ended December 31, 2015. The allowance for loan losses was $13.6 million, or 0.73% of total loans, at December 31, 2016, compared to $11.2 million, or 0.73% of total loans, at December 31, 2015.
Noninterest Income. Noninterest income decreased $415,000 to $2.8 million for the year ended December 31, 2016, from $3.2 million for the year ended December 31, 2015. This decrease was primarily the result of a decrease in loan servicing fee income of $264,000, a decrease in other income of $193,000 and a decrease in net gains on sales of loans of $124,000. Partially offsetting these decreases was an increase in income from bank owned life insurance of $157,000 as we purchased additional bank owned life insurance policies of $5.0 million during 2016.
Noninterest Expense. Noninterest expense increased $525,000 to $28.3 million for the year ended December 31, 2016, from $27.8 million for the year ended December 31, 2015. This increase was largely the result of increases in deposit insurance costs of $316,000. Professional fees costs also increased $215,000.
Income Tax Expense. We recorded a provision for income taxes of $7.4 million for the year ended December 31, 2016, compared to a provision for income taxes of $4.3 million for the year ended December 31, 2015, reflecting effective tax rates of 38.3% and 38.5%, respectively.
Average Balances and Yields
The following tables set forth average balance sheets, average yields and costs, and certain other information for the periods indicated. Non-accrual loans were included in the computation of average balances, but have been reflected in the table as loans carrying a zero yield. The yields set forth below include the effect of deferred fees, discounts and premiums that are amortized or accreted to interest income or expense.
59
Table of Contents
| For the Year Ended December 31, | ||||||||||||||||||||||||||||||||||||
| 2017 | 2016 | 2015 | ||||||||||||||||||||||||||||||||||
| Average Outstanding Balance |
Interest | Yield/ Rate | Average Outstanding Balance |
Interest | Yield/ Rate | Average Outstanding Balance |
Interest | Yield/ Rate | ||||||||||||||||||||||||||||
| (Dollars in thousands) | ||||||||||||||||||||||||||||||||||||
| Interest-earning assets: |
||||||||||||||||||||||||||||||||||||
| Total loans |
$ | 2,080,571 | $ | 72,011 | 3.46 | % | $ | 1,701,909 | $ | 57,513 | 3.38 | % | $ | 1,335,748 | $ | 44,890 | 3.36 | % | ||||||||||||||||||
| Securities |
161,866 | 3,356 | 2.07 | % | 156,526 | 3,163 | 2.02 | % | 149,806 | 3,064 | 2.05 | % | ||||||||||||||||||||||||
| Other |
60,717 | 583 | 0.96 | % | 44,774 | 185 | 0.41 | % | 38,607 | 79 | 0.20 | % | ||||||||||||||||||||||||
|
|
|
|
|
|
|
|
|
|
|
|
|
|||||||||||||||||||||||||
| Total interest-earning assets (4) |
2,303,154 | 75,950 | 3.30 | % | 1,903,209 | 60,861 | 3.20 | % | 1,524,161 | 48,033 | 3.15 | % | ||||||||||||||||||||||||
| Non-interest-earning assets |
73,472 | 63,317 | 51,401 | |||||||||||||||||||||||||||||||||
|
|
|
|
|
|
|
|||||||||||||||||||||||||||||||
| Total assets |
$ | 2,376,626 | $ | 1,966,526 | $ | 1,575,562 | ||||||||||||||||||||||||||||||
|
|
|
|
|
|
|
|||||||||||||||||||||||||||||||
| Interest-bearing liabilities: |
||||||||||||||||||||||||||||||||||||
| Regular savings accounts |
$ | 856,142 | 6,144 | 0.72 | % | $ | 732,445 | 4,402 | 0.60 | % | $ | 595,447 | 3,515 | 0.59 | % | |||||||||||||||||||||
| Checking accounts |
133,805 | 580 | 0.43 | % | 135,387 | 548 | 0.40 | % | 94,219 | 333 | 0.35 | % | ||||||||||||||||||||||||
| Money market accounts |
8,297 | 1 | 0.01 | % | 8,337 | 1 | 0.01 | % | 8,774 | 6 | 0.07 | % | ||||||||||||||||||||||||
| Certificates of deposit |
413,599 | 6,175 | 1.49 | % | 302,314 | 4,483 | 1.48 | % | 251,887 | 3,914 | 1.55 | % | ||||||||||||||||||||||||
|
|
|
|
|
|
|
|
|
|
|
|
|
|||||||||||||||||||||||||
| Total interest-bearing deposits |
1,411,843 | 12,900 | 0.91 | % | 1,178,483 | 9,434 | 0.80 | % | 950,327 | 7,768 | 0.82 | % | ||||||||||||||||||||||||
| Federal Home Loan Bank advances |
571,431 | 8,150 | 1.43 | % | 428,163 | 4,788 | 1.12 | % | 290,812 | 2,394 | 0.82 | % | ||||||||||||||||||||||||
| Securities sold under agreements to repurchase |
2,865 | 4 | 0.15 | % | 2,419 | 4 | 0.17 | % | 2,399 | 4 | 0.17 | % | ||||||||||||||||||||||||
| Other borrowed funds |
— | — | 0.00 | % | 250 | 5 | 2.00 | % | 1,045 | 28 | 2.68 | % | ||||||||||||||||||||||||
|
|
|
|
|
|
|
|
|
|
|
|
|
|||||||||||||||||||||||||
| Total interest-bearing liabilities |
1,986,139 | 21,054 | 1.06 | % | 1,609,315 | 14,231 | 0.88 | % | 1,244,583 | 10,194 | 0.82 | % | ||||||||||||||||||||||||
| Non-interest-bearing liabilities |
219,194 | 203,264 | 189,047 | |||||||||||||||||||||||||||||||||
|
|
|
|
|
|
|
|||||||||||||||||||||||||||||||
| Total liabilities |
2,205,333 | 1,812,579 | 1,433,630 | |||||||||||||||||||||||||||||||||
| Stockholders’ Equity |
171,293 | 153,947 | 141,932 | |||||||||||||||||||||||||||||||||
|
|
|
|
|
|
|
|||||||||||||||||||||||||||||||
| Total liabilities and stockholders’ equity |
$ | 2,376,626 | $ | 1,966,526 | $ | 1,575,562 | ||||||||||||||||||||||||||||||
|
|
|
|
|
|
|
|||||||||||||||||||||||||||||||
| Net interest income |
$ | 54,896 | $ | 46,630 | $ | 37,839 | ||||||||||||||||||||||||||||||
|
|
|
|
|
|
|
|||||||||||||||||||||||||||||||
| Net interest rate spread (1) |
2.24 | % | 2.32 | % | 2.33 | % | ||||||||||||||||||||||||||||||
| Net interest-earning assets (2) |
$ | 317,015 | $ | 293,894 | $ | 279,578 | ||||||||||||||||||||||||||||||
|
|
|
|
|
|
|
|||||||||||||||||||||||||||||||
| Net interest margin (3) |
2.38 | % | 2.45 | % | 2.48 | % | ||||||||||||||||||||||||||||||
| Average interest-earning assets to interest-bearing liabilities |
115.96 | % | 118.26 | % | 122.46 | % | ||||||||||||||||||||||||||||||
| (1) | Net interest rate spread represents the difference between the yield on average interest-earning assets and the cost of average interest-bearing liabilities. |
| (2) | Net interest-earning assets represents total interest-earning assets less total interest-bearing liabilities. |
| (3) | Net interest margin represents net interest and dividend income divided by average total interest-earning assets. |
| (4) | Totals do not include FHLB stock dividends of $1,193,000, $760,000 and $373,000 for the years ended December 31, 2017, 2016 and 2015, respectively. |
60
Table of Contents
Rate/Volume Analysis
The following table presents the effects of changing rates and volumes on our net interest income for the periods indicated. The rate column shows the effects attributable to changes in rate (changes in rate multiplied by prior volume). The volume column shows the effects attributable to changes in volume (changes in volume multiplied by prior rate). The net column represents the sum of the prior columns. For purposes of this table, changes attributable to both rate and volume, which cannot be segregated, have been allocated to the changes due to rate and the changes due to volume in proportion to the relationship of the absolute dollar amounts of the change in each.
| Fiscal Years Ended December 31, 2017 vs. 2016 |
Fiscal Years Ended December 31, 2016 vs. 2015 |
|||||||||||||||||||||||
| Increase (Decrease) | Total Increase (Decrease) |
Increase (Decrease) | Total Increase (Decrease) |
|||||||||||||||||||||
| Due to | Due to | |||||||||||||||||||||||
| Volume | Rate | Volume | Rate | |||||||||||||||||||||
| (Dollars in thousands) | (Dollars in thousands) | |||||||||||||||||||||||
| Interest-earning assets: |
||||||||||||||||||||||||
| Loans |
$ | 13,076 | $ | 1,422 | $ | 14,498 | $ | 12,372 | $ | 251 | $ | 12,623 | ||||||||||||
| Securities |
110 | 83 | 193 | 136 | (37 | ) | 99 | |||||||||||||||||
| Other |
84 | 314 | 398 | 14 | 92 | 106 | ||||||||||||||||||
|
|
|
|
|
|
|
|
|
|
|
|
|
|||||||||||||
| Total interest-earning assets |
$ | 13,270 | $ | 1,819 | $ | 15,089 | $ | 12,522 | $ | 306 | $ | 12,828 | ||||||||||||
|
|
|
|
|
|
|
|
|
|
|
|
|
|||||||||||||
| Interest-bearing liabilities: |
||||||||||||||||||||||||
| Regular savings accounts |
$ | 811 | $ | 931 | $ | 1,742 | $ | 823 | $ | 64 | $ | 887 | ||||||||||||
| Checking accounts |
(6 | ) | 38 | 32 | 161 | 54 | 215 | |||||||||||||||||
| Money market accounts |
— | — | — | — | (5 | ) | (5 | ) | ||||||||||||||||
| Certificates of deposit |
1,661 | 31 | 1,692 | 755 | (186 | ) | 569 | |||||||||||||||||
|
|
|
|
|
|
|
|
|
|
|
|
|
|||||||||||||
| Total interest-bearing deposits |
2,466 | 1,000 | 3,466 | 1,739 | (73 | ) | 1,666 | |||||||||||||||||
| Federal Home Loan Bank advances |
1,844 | 1,518 | 3,362 | 1,361 | 1,033 | 2,394 | ||||||||||||||||||
| Securities sold under agreements to repurchase |
1 | (1 | ) | — | — | — | — | |||||||||||||||||
| Other borrowed funds |
(3 | ) | (2 | ) | (5 | ) | (17 | ) | (6 | ) | (23 | ) | ||||||||||||
|
|
|
|
|
|
|
|
|
|
|
|
|
|||||||||||||
| Total interest-bearing liabilities |
$ | 4,308 | $ | 2,515 | $ | 6,823 | $ | 3,083 | $ | 954 | $ | 4,037 | ||||||||||||
|
|
|
|
|
|
|
|
|
|
|
|
|
|||||||||||||
| Change in net interest income |
$ | 8,962 | $ | (696 | ) | $ | 8,266 | $ | 9,439 | $ | (648 | ) | $ | 8,791 | ||||||||||
|
|
|
|
|
|
|
|
|
|
|
|
|
|||||||||||||
61
Table of Contents
Management of Market Risk
General. Our most significant form of market risk is interest rate risk because, as a financial institution, the majority of our assets and liabilities are sensitive to changes in interest rates. Changes in interest rates, as well as fluctuations in the level and duration of assets and liabilities, affect net interest income, the Company’s primary source of revenue. Interest rate risk arises directly from the Company’s core banking activities. In addition to directly impacting net interest income, changes in the level of interest rates can also affect the amount of loans originated, the timing of cash flows on loans and securities, and the fair value of securities, as well as other effects.
Therefore, a principal part of our operations is to manage interest rate risk and limit the exposure of our financial condition and results of operations to changes in market interest rates. The primary goal of interest rate risk management is to control this risk within limits approved by the Board of Directors. These limits reflect the Company’s tolerance for interest rate risk over both short-term and long-term horizons. If assets and liabilities do not re-price simultaneously and in equal volume, the potential for interest rate exposure exists. It is management’s objective to maintain stability in the growth of net interest income through the maintenance of an appropriate mix of interest-earning assets and interest-bearing liabilities. The Asset/Liability Management Committee is responsible for evaluating the interest rate risk inherent in our assets and liabilities, for determining the level of risk that is appropriate, given our business strategy, operating environment, capital, liquidity and performance objectives, and for managing this risk consistent with the policy and guidelines approved by our Board of Directors.
Net Interest Income Analysis
We analyze the Bank’s sensitivity to changes in interest rates through the Bank’s net interest income model. Net interest income is the difference between the interest income the Bank earns on interest-earning assets, such as loans and securities, and the interest the Bank pays on our interest-bearing liabilities, such as deposits and borrowings. We estimate what the Bank’s net interest income would be under different scenarios including instantaneous parallel shifts (“shock”) to market interest rates and gradual (12 to 24 months) shifts in interest rates. These estimates require us to make certain assumptions including loan and mortgage-related investment prepayment speeds, reinvestment rates, and deposit maturities and decay rates. These assumptions are inherently uncertain and, as a result, we cannot precisely predict the impact of changes in interest rates on the Bank’s net interest income. Although the net interest income table below provides an indication of our interest rate risk exposure at a particular point in time, such estimates are not intended to, and do not, provide a precise forecast of the effect of changes in market interest rates on the Bank’s net interest income and will differ from actual results. The following table shows the estimated impact on the Bank’s base forecasted net interest income (“NII”) for the one-year period beginning as of December 31, 2017 and December 31, 2016 resulting from potential changes in interest rates.
| NII Change Year One (% Change From Year One Base) At December 31, |
||||||||
| 2017 | 2016 | |||||||
| Change in Interest Rates (basis points 1) |
||||||||
| Shock +300 |
-17.8 | % | -16.1 | % | ||||
| Ramp +200 |
-5.4 | % | -6.0 | % | ||||
| Ramp -100 |
-0.1 | % | -0.5 | % | ||||
| (1) | The calculated change for -100 BPS and +200 BPS, assume a gradual parallel shift across the yield curve over a one-year period. The calculated change for “Shock +300” assumes that market rates experience an instantaneous and sustained increase of 300 bp. |
62
Table of Contents
The table above indicates that at December 31, 2017, in the event of a 200 basis point increase in interest rates over a one year period, assuming a gradual parallel shift across the yield curve over such period, we would experience a 5.4% decrease in net interest income. At December 31, 2017, in the event of a 100 basis point decrease in interest rates over a one year period, assuming a gradual parallel shift across the yield curve over such period, we would experience a 0.1% decrease in net interest income.
Economic Value of Equity Analysis. We also analyze the sensitivity of the Bank’s financial condition to changes in interest rates through our economic value of equity model. This analysis measures the difference between estimated changes in the present value of the Bank’s assets and estimated changes in the present value of the Bank’s liabilities assuming various changes in current interest rates. The Bank’s economic value of equity analysis as of December 31, 2017 estimated that, in the event of an instantaneous 200 basis point increase in interest rates, the Bank would experience a 27.1% decrease in the economic value of equity. At December 31, 2017, our analysis estimated that, in the event of an instantaneous 100 basis point decrease in interest rates, the Bank would experience a 1.7% decrease in the economic value of equity. The estimates of changes in the economic value of our equity require us to make certain assumptions including loan and mortgage-related investment prepayment speeds, reinvestment rates, and deposit maturities and decay rates. These assumptions are inherently uncertain and, as a result, we cannot precisely predict the impact of changes in interest rates on the economic value of our equity. Although our economic value of equity analysis provides an indication of our interest rate risk exposure at a particular point in time, such estimates are not intended to, and do not, provide a precise forecast of the effect of changes in market interest rates on the economic value of our equity and will differ from actual results.
Liquidity and Capital Resources
Liquidity is the ability to meet current and future financial obligations. Our primary sources of funds consist of deposit inflows, loan and investment security repayments, advances from the Federal Home Loan Bank of Boston, loan sales and the sale of securities. While maturities and scheduled amortization of loans and securities are predictable sources of funds, deposit flows and mortgage prepayments are greatly influenced by general interest rates, economic conditions and competition. Our Asset/Liability Management Committee is responsible for establishing and monitoring our liquidity targets and strategies in order to ensure that sufficient liquidity exists for meeting the borrowing needs and deposit withdrawals of our customers as well as unanticipated contingencies. We believe that we had enough sources of liquidity at December 31, 2017, to satisfy our short- and long-term liquidity needs as of that date.
We regularly monitor and adjust our investments in liquid assets based on our assessment of:
| (i) | expected loan demand; |
| (ii) | expected deposit flows and borrowing maturities; |
| (iii) | yields available on interest-earning deposits and securities; and |
| (iv) | the objectives of our asset/liability management program. |
Excess liquid assets are invested generally in interest-earning deposits and short-term securities and may also be used to pay off short-term borrowings.
Our most liquid assets are cash and cash equivalents. The level of these assets is dependent on our operating, financing, lending and investing activities during any given period. At December 31, 2017, cash and cash equivalents totaled $110.9 million.
Our cash flows are derived from operating activities, investing activities and financing activities as reported in our Consolidated Statements of Cash Flows included in our Consolidated Financial Statements.
At December 31, 2017, we had $89.4 million in loan commitments outstanding. In addition to commitments to originate and purchase loans, we had $325.8 million in unused lines of credit to borrowers and $11.5 million in unadvanced construction loans. Certificates of deposit due within one year of December 31, 2017 totaled $227.0 million, or 13.0%, of total deposits.
63
Table of Contents
If these deposits do not remain with us, we may be required to seek other sources of funds, including loan sales, brokered deposits, repurchase agreements and Federal Home Loan Bank advances. Depending on market conditions, we may be required to pay higher rates on such deposits or other borrowings than we currently pay on the certificates of deposit due on or before December 31, 2018, or on our savings accounts. We believe, however, based on historical experience and current market interest rates, that we will retain upon maturity a large portion of our certificates of deposit with maturities of one year or less as of December 31, 2017.
Our primary investing activity is originating and purchasing loans. During the years ended December 31, 2017 and 2016, we funded $835.8 million and $875.3 million of loans, respectively.
Financing activities consist primarily of activity in deposit accounts, Federal Home Loan Bank advances and, to a lesser extent, brokered deposits. We experienced net increases in deposits of $281.8 million and $199.9 million for the years ended December 31, 2017 and 2016, respectively. At December 31, 2017 and 2016, the level of brokered time deposits was $247.2 million and $156.4 million, respectively. Deposit flows are affected by the overall level of interest rates, the interest rates and products offered by us and our local competitors, and by other factors.
Liquidity management is both a daily and long-term function of business management. If we require funds beyond our ability to generate them internally, borrowing agreements exist with the Federal Home Loan Bank of Boston, which provide an additional source of funds. At December 31, 2017, we had $723.2 million of Federal Home Loan Bank advances outstanding. At December 31, 2017, we had the ability to borrow up to an additional $279.2 million from the Federal Home Loan Bank of Boston.
Accumulated other comprehensive income at December 31, 2017 included $19,000 related to stranded amounts resulting from the re-measurement of deferred tax assets and liabilities in connection with the enactment of the Tax Reform Act on December 22, 2017. In February 2018, the Financial Accounting Standards Board issued Accounting Standards Update 2018-02, that allows companies to elect to reclassify the tax effects stranded in accumulated other comprehensive income to retained earnings rather than income tax benefit or expense.
Belmont Savings is subject to various regulatory capital requirements, including a risk-based capital measure. The risk-based capital guidelines include both a definition of capital and a framework for calculating risk-weighted assets by assigning balance sheet assets and off-balance sheet items to broad risk categories. At December 31, 2017, Belmont Savings exceeded all regulatory capital requirements. Belmont Savings is considered “well capitalized” under regulatory guidelines. See “Supervision and Regulation—Federal Regulation—Capital Requirements” and Note 14 of the Notes to our Consolidated Financial Statements.
The net proceeds from our stock offering completed in October 2011 have significantly increased our liquidity and capital resources. Over time, the level of liquidity will continue to be reduced as net proceeds from the stock offering and additions to capital from income generated are used for general corporate purposes, including the funding of loans. Our financial condition and results of operations will be enhanced by the continued investment of the net proceeds from the stock offering, resulting in increased net interest-earning assets and net interest and dividend income.
At the time of conversion from a mutual holding company to a stock holding company, BSB Bancorp, Inc. substantially restricted retained earnings by establishing a liquidation account and the Bank established a parallel liquidation account. The liquidation account will be maintained for the benefit of eligible holders who continue to maintain their accounts at the Bank after conversion. The liquidation account is reduced annually to the extent that eligible account holders have reduced their qualifying deposits. Subsequent increases will not restore an eligible account holder’s interest in the liquidation account. In the event of a complete liquidation of the Bank, and only in such event, each account holder will be entitled to receive a distribution from the liquidation account in an amount proportionate to the adjusted qualifying account balances then held. The Bank may not pay dividends if those dividends would reduce equity capital below the required liquidation account amount.
64
Table of Contents
Off-Balance Sheet Arrangements and Contractual Obligations
Commitments. As a financial services provider, we routinely are a party to various financial instruments with off balance-sheet risks, such as commitments to extend credit and unused lines of credit. While these contractual obligations represent our potential future cash requirements, a significant portion of commitments to extend credit may expire without being drawn upon. Such commitments are subject to the same credit policies and approval process accorded to loans we make. In addition, from time to time we enter into commitments to sell mortgage loans that we originate. For additional information, see Note 11 of the Notes to our Consolidated Financial Statements.
Contractual Obligations. We are obligated to make future payments according to various contracts. The following table presents the expected future payments of the contractual obligations aggregated by obligation type at December 31, 2017.
| December 31, 2017 | ||||||||||||||||||||
| One year or less |
More than one year to three years |
More than three years to five years |
More than five years |
Total | ||||||||||||||||
| (Dollars in thousands) | ||||||||||||||||||||
| Federal Home Loan Bank of Boston advances |
$ | 352,900 | $ | 260,250 | $ | 110,000 | $ | — | $ | 723,150 | ||||||||||
| Securities sold under agreements to repurchase |
3,268 | — | — | — | 3,268 | |||||||||||||||
| Certificates of deposit |
226,910 | 223,841 | 53,963 | — | 504,714 | |||||||||||||||
| Operating leases |
361 | 625 | 244 | 122 | 1,352 | |||||||||||||||
|
|
|
|
|
|
|
|
|
|
|
|||||||||||
| Total contractual obligations |
$ | 583,481 | $ | 484,698 | $ | 164,183 | $ | 122 | $ | 1,232,484 | ||||||||||
|
|
|
|
|
|
|
|
|
|
|
|||||||||||
Recent Accounting Pronouncements
For a discussion of the impact of recent accounting pronouncements, see Note 1 of the Notes to our Consolidated Financial Statements.
Impact of Inflation and Changing Prices
Our Consolidated Financial Statements and related notes have been prepared in accordance with U.S. GAAP. U.S. GAAP generally requires the measurement of financial position and operating results in terms of historical dollars without consideration of changes in the relative purchasing power of money over time due to inflation. The impact of inflation is reflected in the increased cost of our operations. Unlike industrial companies, our assets and liabilities are primarily monetary in nature. As a result, changes in market interest rates have a greater impact on performance than the effects of inflation.
| ITEM 7A. | QUANTITATIVE AND QUALITATIVE DISCLOSURES ABOUT MARKET RISK |
The information required by this item is incorporated herein by reference to Part II, Item 7, “Management’s Discussion and Analysis of Financial Condition and Results of Operation.”
65
Table of Contents
| ITEM 8. | FINANCIAL STATEMENTS AND SUPPLEMENTARY DATA |
INDEX TO CONSOLIDATED FINANCIAL STATEMENTS
66
Table of Contents
Management’s Report on Internal Control over Financial Reporting
The management of BSB Bancorp, Inc. and subsidiaries (the “Company”) is responsible for establishing and maintaining adequate internal control over financial reporting. The internal control process has been designed under our supervision to provide reasonable assurance regarding the reliability of financial reporting and the preparation of the Company’s financial statements for external reporting purposes in accordance with accounting principles generally accepted in the United States of America.
Management conducted an assessment of the effectiveness of the Company’s internal control over financial reporting as of December 31, 2017, utilizing the framework established in Internal Control — Integrated Framework issued by the Committee of Sponsoring Organizations of the Treadway Commission-2013 (COSO). Based on this assessment, management has determined that the Company’s internal control over financial reporting as of December 31, 2017 is effective.
Our internal control over financial reporting includes policies and procedures that pertain to the maintenance of records that accurately and fairly reflect, in reasonable detail, transactions and dispositions of assets; and provide reasonable assurances that: (1) transactions are recorded as necessary to permit preparation of financial statements in accordance with accounting principles generally accepted in the United States of America; (2) receipts and expenditures are being made only in accordance with authorizations of management and the directors of the Company; and (3) provide reasonable assurance regarding prevention or timely detection of unauthorized acquisition, use, or disposition of the Company’s assets that could have a material effect on the Company’s financial statements.
All internal control systems, no matter how well designed, have inherent limitations. Therefore, even those systems determined to be effective can provide only reasonable assurance with respect to financial statement preparation and presentation. Also, projections of any evaluation of effectiveness to future periods are subject to the risk that controls may become inadequate because of changes in conditions, or that the degree of compliance with the policies or procedures may deteriorate.
The effectiveness of the Company’s internal control over financial reporting as of December 31, 2017 has been audited by Baker Newman & Noyes, LLC, the Company’s independent registered public accounting firm, as stated in their accompanying report, which expressed an unqualified opinion on the effectiveness of the Company’s internal control over financial reporting as of December 31, 2017.
67
Table of Contents
REPORT OF INDEPENDENT REGISTERED PUBLIC ACCOUNTING FIRM
To the Stockholders and the Board of Directors
BSB Bancorp, Inc.
Opinions on the Financial Statements and Internal Control Over Financial Reporting
We have audited the accompanying consolidated balance sheets of BSB Bancorp, Inc. and Subsidiaries (the Company) as of December 31, 2017 and 2016, and the related consolidated statements of operations, comprehensive income, changes in stockholders’ equity and cash flows for each of the three years in the period ended December 31, 2017, and the related notes (collectively, the financial statements). We also have audited the Company’s internal control over financial reporting as of December 31, 2017, based on criteria established in Internal Control — Integrated Framework issued by the Committee of Sponsoring Organizations of the Treadway Commission in 2013.
In our opinion, the financial statements referred to above present fairly, in all material respects, the financial position of the Company as of December 31, 2017 and 2016, and the results of its operations and its cash flows for each of the years in the three-year period ended December 31, 2017, in conformity with accounting principles generally accepted in the United States of America. Also in our opinion, the Company maintained, in all material respects, effective internal control over financial reporting as of December 31, 2017, based on criteria established in Internal Control — Integrated Framework issued by the Committee of Sponsoring Organizations of the Treadway Commission in 2013.
Basis for Opinions
The Company’s management is responsible for these financial statements, for maintaining effective internal control over financial reporting, and for its assessment of the effectiveness of internal control over financial reporting, included in the accompanying Management’s Report on Internal Control Over Financial Reporting. Our responsibility is to express an opinion on the Company’s financial statements and an opinion on the company’s internal control over financial reporting based on our audits. We are a public accounting firm registered with the Public Company Accounting Oversight Board (United States) (PCAOB) and are required to be independent with respect to the Company in accordance with U.S. federal securities laws and the applicable rules and regulations of the Securities and Exchange Commission and the PCAOB.
We conducted our audits in accordance with the standards of the PCAOB. Those standards require that we plan and perform the audits to obtain reasonable assurance about whether the financial statements are free of material misstatement, whether due to error or fraud, and whether effective internal control over financial reporting was maintained in all material respects.
Our audits of the financial statements included performing procedures to assess the risks of material misstatement of the financial statements, whether due to error or fraud, and performing procedures that respond to those risks. Such procedures included examining, on a test basis, evidence regarding the amounts and disclosures in the financial statements. Our audits also included evaluating the accounting principles used and significant estimates made by management, as well as evaluating the overall presentation of the financial statements. Our audit of internal control over financial reporting included obtaining an understanding of internal control over financial reporting, assessing the risk that a material weakness exists, and testing and evaluating the design and operating effectiveness of internal control based on the assessed risk. Our audits also included performing such other procedures as we considered necessary in the circumstances. We believe that our audits provide a reasonable basis for our opinions.
Definition and Limitations of Internal Control Over Financial Reporting
A company’s internal control over financial reporting is a process designed to provide reasonable assurance regarding the reliability of financial reporting and the preparation of financial statements for external purposes in accordance with generally accepted accounting principles. A company’s internal control over financial reporting includes those policies and procedures that (1) pertain to the maintenance of records that, in reasonable detail, accurately and fairly reflect the transactions and dispositions of the assets of the company; (2) provide reasonable
68
Table of Contents
assurance that transactions are recorded as necessary to permit preparation of financial statements in accordance with generally accepted accounting principles, and that receipts and expenditures of the company are being made only in accordance with authorizations of management and directors of the company; and (3) provide reasonable assurance regarding prevention or timely detection of unauthorized acquisition, use or disposition of the company’s assets that could have a material effect on the financial statements.
Because of its inherent limitations, internal control over financial reporting may not prevent or detect misstatements. Also, projections of any evaluation of effectiveness to future periods are subject to the risk that controls may become inadequate because of changes in conditions, or that the degree of compliance with the policies or procedures may deteriorate.
We or our predecessor firms have served as the Company’s auditor since 2006.
/s/ Baker Newman & Noyes LLC
Boston, Massachusetts
March 16, 2018
69
Table of Contents
BSB BANCORP, INC. AND SUBSIDIARIES
(Dollars in thousands)
| December 31, 2017 | December 31, 2016 | |||||||
| ASSETS |
||||||||
| Cash and due from banks |
$ | 1,771 | $ | 2,211 | ||||
| Interest-bearing deposits in other banks |
109,117 | 56,665 | ||||||
|
|
|
|
|
|||||
| Cash and cash equivalents |
110,888 | 58,876 | ||||||
| Interest-bearing time deposits with other banks |
2,440 | 234 | ||||||
| Investments in available-for-sale securities |
16,921 | 22,048 | ||||||
| Investments in held-to-maturity securities (fair value of $158,385 as of December 31, 2017 and $129,465 as of December 31, 2016) |
160,090 | 130,197 | ||||||
| Federal Home Loan Bank stock, at cost |
32,382 | 25,071 | ||||||
| Loans, net of allowance for loan losses of $16,312 as of December 31, 2017 and $13,585 as of December 31, 2016 |
2,296,958 | 1,866,035 | ||||||
| Premises and equipment, net |
2,254 | 2,355 | ||||||
| Accrued interest receivable |
6,344 | 4,635 | ||||||
| Deferred tax asset, net |
5,794 | 8,321 | ||||||
| Income taxes receivable |
53 | 423 | ||||||
| Bank-owned life insurance |
36,967 | 35,842 | ||||||
| Other assets |
5,474 | 4,667 | ||||||
|
|
|
|
|
|||||
| Total assets |
$ | 2,676,565 | $ | 2,158,704 | ||||
|
|
|
|
|
|||||
| LIABILITIES AND STOCKHOLDERS’ EQUITY |
||||||||
| Deposits: |
||||||||
| Noninterest-bearing |
$ | 221,462 | $ | 208,082 | ||||
| Interest-bearing |
1,529,789 | 1,261,340 | ||||||
|
|
|
|
|
|||||
| Total deposits |
1,751,251 | 1,469,422 | ||||||
| Federal Home Loan Bank advances |
723,150 | 508,850 | ||||||
| Securities sold under agreements to repurchase |
3,268 | 1,985 | ||||||
| Accrued interest payable |
1,594 | 1,023 | ||||||
| Deferred compensation liability |
7,919 | 7,043 | ||||||
| Other liabilities |
11,354 | 9,460 | ||||||
|
|
|
|
|
|||||
| Total liabilities |
2,498,536 | 1,997,783 | ||||||
|
|
|
|
|
|||||
| Stockholders’ equity: |
||||||||
| Common stock; $0.01 par value, 100,000,000 shares authorized; 9,707,665 and 9,110,077 shares issued and outstanding at December 31, 2017 and 2016, respectively |
97 | 91 | ||||||
| Additional paid-in capital |
94,590 | 92,013 | ||||||
| Retained earnings |
86,884 | 72,498 | ||||||
| Accumulated other comprehensive income |
89 | 103 | ||||||
| Unearned compensation - ESOP |
(3,631 | ) | (3,784 | ) | ||||
|
|
|
|
|
|||||
| Total stockholders’ equity |
178,029 | 160,921 | ||||||
|
|
|
|
|
|||||
| Total liabilities and stockholders’ equity |
$ | 2,676,565 | $ | 2,158,704 | ||||
|
|
|
|
|
|||||
The accompanying notes are an integral part of these consolidated financial statements.
70
Table of Contents
BSB BANCORP, INC. AND SUBSIDIARIES
CONSOLIDATED STATEMENTS OF OPERATIONS
(Dollars in thousands, except for per share data)
| Years Ended December 31, | ||||||||||||
| 2017 | 2016 | 2015 | ||||||||||
| Interest and dividend income: |
||||||||||||
| Interest and fees on loans |
$ | 72,011 | $ | 57,513 | $ | 44,890 | ||||||
| Interest on debt securities: |
||||||||||||
| Taxable |
3,356 | 3,163 | 3,064 | |||||||||
| Dividends |
1,193 | 760 | 373 | |||||||||
| Other interest income |
583 | 185 | 79 | |||||||||
|
|
|
|
|
|
|
|||||||
| Total interest and dividend income |
77,143 | 61,621 | 48,406 | |||||||||
|
|
|
|
|
|
|
|||||||
| Interest expense: |
||||||||||||
| Interest on deposits |
12,900 | 9,434 | 7,768 | |||||||||
| Interest on Federal Home Loan Bank advances |
8,150 | 4,788 | 2,394 | |||||||||
| Interest on securities sold under agreements to repurchase |
4 | 4 | 4 | |||||||||
| Interest on other borrowed funds |
— | 5 | 28 | |||||||||
|
|
|
|
|
|
|
|||||||
| Total interest expense |
21,054 | 14,231 | 10,194 | |||||||||
|
|
|
|
|
|
|
|||||||
| Net interest and dividend income |
56,089 | 47,390 | 38,212 | |||||||||
| Provision for loan losses |
2,762 | 2,385 | 2,317 | |||||||||
|
|
|
|
|
|
|
|||||||
| Net interest and dividend income after provision for loan losses |
53,327 | 45,005 | 35,895 | |||||||||
|
|
|
|
|
|
|
|||||||
| Noninterest income: |
||||||||||||
| Customer service fees |
785 | 903 | 894 | |||||||||
| Income from bank-owned life insurance |
1,120 | 1,050 | 893 | |||||||||
| Net gain on sales of securities |
38 | — | — | |||||||||
| Net gain on sales of loans |
936 | 271 | 395 | |||||||||
| Loan servicing fee income |
398 | 350 | 614 | |||||||||
| Other income |
350 | 176 | 369 | |||||||||
|
|
|
|
|
|
|
|||||||
| Total noninterest income |
3,627 | 2,750 | 3,165 | |||||||||
|
|
|
|
|
|
|
|||||||
| Noninterest expense: |
||||||||||||
| Salaries and employee benefits |
19,587 | 17,819 | 17,610 | |||||||||
| Director compensation |
1,355 | 971 | 912 | |||||||||
| Occupancy expense |
964 | 991 | 1,074 | |||||||||
| Equipment expense |
422 | 452 | 533 | |||||||||
| Deposit insurance |
1,733 | 1,285 | 969 | |||||||||
| Data processing |
2,793 | 3,120 | 3,108 | |||||||||
| Professional fees |
1,044 | 964 | 749 | |||||||||
| Marketing |
912 | 872 | 926 | |||||||||
| Other expense |
1,876 | 1,875 | 1,943 | |||||||||
|
|
|
|
|
|
|
|||||||
| Total noninterest expense |
30,686 | 28,349 | 27,824 | |||||||||
|
|
|
|
|
|
|
|||||||
| Income before income tax expense |
26,268 | 19,406 | 11,236 | |||||||||
| Income tax expense |
11,882 | 7,425 | 4,322 | |||||||||
|
|
|
|
|
|
|
|||||||
| Net income |
$ | 14,386 | $ | 11,981 | $ | 6,914 | ||||||
|
|
|
|
|
|
|
|||||||
| Net income available to common stockholders |
$ | 14,278 | $ | 11,791 | $ | 6,747 | ||||||
|
|
|
|
|
|
|
|||||||
| Earnings per share |
||||||||||||
| Basic |
$ | 1.63 | $ | 1.38 | $ | 0.80 | ||||||
| Diluted |
$ | 1.55 | $ | 1.33 | $ | 0.78 | ||||||
The accompanying notes are an integral part of these consolidated financial statements.
71
Table of Contents
BSB BANCORP, INC. AND SUBSIDIARIES
CONSOLIDATED STATEMENTS OF COMPREHENSIVE INCOME
(Dollars in thousands)
| Years Ended December 31, | ||||||||||||
| 2017 | 2016 | 2015 | ||||||||||
| Net income |
$ | 14,386 | $ | 11,981 | $ | 6,914 | ||||||
| Other comprehensive (loss) income, net of tax: |
||||||||||||
| Net change in fair value of securities available for sale |
(31 | ) | 149 | (78 | ) | |||||||
| Net change in other comprehensive income for defined-benefit postretirement plan |
17 | 70 | (16 | ) | ||||||||
|
|
|
|
|
|
|
|||||||
| Total other comprehensive (loss) income |
(14 | ) | 219 | (94 | ) | |||||||
|
|
|
|
|
|
|
|||||||
| Total comprehensive income |
$ | 14,372 | $ | 12,200 | $ | 6,820 | ||||||
|
|
|
|
|
|
|
|||||||
The accompanying notes are an integral part of these consolidated financial statements.
72
Table of Contents
BSB BANCORP, INC. AND SUBSIDIARIES
CONSOLIDATED STATEMENTS OF CHANGES IN STOCKHOLDERS’ EQUITY
YEARS ENDED DECEMBER 31, 2017, 2016 AND 2015
(Dollars in thousands)
| Accumulated | ||||||||||||||||||||||||||||
| Additional | Other | Unearned | Total | |||||||||||||||||||||||||
| Common Stock | Paid-In | Retained | Comprehensive | Compensation - | Stockholders’ | |||||||||||||||||||||||
| Shares | Amount | Capital | Earnings | (Loss) Income | ESOP | Equity | ||||||||||||||||||||||
| Balance at December 31, 2014 |
9,067,792 | $ | 91 | $ | 87,428 | $ | 53,603 | $ | (22 | ) | $ | (4,090 | ) | $ | 137,010 | |||||||||||||
| Net income |
— | — | — | 6,914 | — | — | 6,914 | |||||||||||||||||||||
| Other comprehensive loss |
— | — | — | — | (94 | ) | — | (94 | ) | |||||||||||||||||||
| Release of ESOP stock |
— | — | 168 | — | — | 153 | 321 | |||||||||||||||||||||
| Stock based compensation-restricted stock awards |
— | — | 869 | — | — | — | 869 | |||||||||||||||||||||
| Stock based compensation-stock options |
— | — | 791 | — | — | — | 791 | |||||||||||||||||||||
| Tax benefit from stock compensation |
— | — | 215 | — | — | — | 215 | |||||||||||||||||||||
| Stock option exercises, net of shares surrendered |
21,113 | — | 228 | — | — | — | 228 | |||||||||||||||||||||
| Restricted stock awards surrendered |
(2,266 | ) | — | (51 | ) | — | — | — | (51 | ) | ||||||||||||||||||
|
|
|
|
|
|
|
|
|
|
|
|
|
|
|
|||||||||||||||
| Balance at December 31, 2015 |
9,086,639 | $ | 91 | $ | 89,648 | $ | 60,517 | $ | (116 | ) | $ | (3,937 | ) | $ | 146,203 | |||||||||||||
| Net income |
— | — | — | 11,981 | — | — | 11,981 | |||||||||||||||||||||
| Other comprehensive income |
— | — | — | — | 219 | — | 219 | |||||||||||||||||||||
| Release of ESOP stock |
— | — | 207 | — | — | 153 | 360 | |||||||||||||||||||||
| Stock based compensation-restricted stock awards |
— | — | 869 | — | — | — | 869 | |||||||||||||||||||||
| Stock based compensation-stock options |
— | — | 780 | — | — | — | 780 | |||||||||||||||||||||
| Tax benefit from stock compensation |
— | — | 329 | — | — | — | 329 | |||||||||||||||||||||
| Stock option exercises, net of shares surrendered |
27,964 | — | 298 | — | — | — | 298 | |||||||||||||||||||||
| Restricted stock awards surrendered |
(4,526 | ) | — | (118 | ) | — | — | — | (118 | ) | ||||||||||||||||||
|
|
|
|
|
|
|
|
|
|
|
|
|
|
|
|||||||||||||||
| Balance at December 31, 2016 |
9,110,077 | $ | 91 | $ | 92,013 | $ | 72,498 | $ | 103 | $ | (3,784 | ) | $ | 160,921 | ||||||||||||||
| Net income |
— | — | — | 14,386 | — | — | 14,386 | |||||||||||||||||||||
| Other comprehensive loss |
— | — | — | — | (14 | ) | — | (14 | ) | |||||||||||||||||||
| Release of ESOP stock |
— | — | 291 | — | — | 153 | 444 | |||||||||||||||||||||
| Stock based compensation-restricted stock awards |
— | — | 1,835 | — | — | — | 1,835 | |||||||||||||||||||||
| Stock based compensation-stock options |
— | — | 724 | — | — | — | 724 | |||||||||||||||||||||
| Stock option exercises, net of shares surrendered |
120,749 | 1 | 55 | — | — | — | 56 | |||||||||||||||||||||
| Restricted stock awards issued, net of awards surrendered |
476,839 | 5 | (328 | ) | — | — | — | (323 | ) | |||||||||||||||||||
|
|
|
|
|
|
|
|
|
|
|
|
|
|
|
|||||||||||||||
| Balance at December 31, 2017 |
9,707,665 | $ | 97 | $ | 94,590 | $ | 86,884 | $ | 89 | $ | (3,631 | ) | $ | 178,029 | ||||||||||||||
|
|
|
|
|
|
|
|
|
|
|
|
|
|
|
|||||||||||||||
The accompanying notes are an integral part of these consolidated financial statements.
73
Table of Contents
BSB BANCORP, INC. AND SUBSIDIARIES
CONSOLIDATED STATEMENTS OF CASH FLOWS
(Dollars in thousands)
| Years Ended December 31, | ||||||||||||
| 2017 | 2016 | 2015 | ||||||||||
| Cash flows from operating activities: |
||||||||||||
| Net income |
$ | 14,386 | $ | 11,981 | $ | 6,914 | ||||||
| Adjustments to reconcile net income to net cash provided by operating activities: |
||||||||||||
| Amortization of securities, net |
843 | 833 | 732 | |||||||||
| Gain on sales of securities |
(38 | ) | — | — | ||||||||
| Gain on sales of loans, net |
(936 | ) | (271 | ) | (395 | ) | ||||||
| Loans originated for sale |
(5,439 | ) | (10,134 | ) | (13,678 | ) | ||||||
| Proceeds from sales of loans |
71,473 | 11,649 | 22,943 | |||||||||
| Provision for loan losses |
2,762 | 2,385 | 2,317 | |||||||||
| Change in unamortized mortgage premium |
(2,388 | ) | (1,928 | ) | (1,796 | ) | ||||||
| Change in net deferred loan costs |
196 | 1,041 | 405 | |||||||||
| ESOP expense |
444 | 360 | 321 | |||||||||
| Depreciation and amortization expense |
595 | 621 | 726 | |||||||||
| Impairment of fixed assets |
18 | 16 | 6 | |||||||||
| Deferred income tax expense (benefit) |
2,535 | (1,741 | ) | (1,021 | ) | |||||||
| Increase in bank-owned life insurance |
(1,120 | ) | (1,050 | ) | (893 | ) | ||||||
| Loss on sale of other real estate owned |
— | — | 10 | |||||||||
| Stock based compensation expense |
2,559 | 1,649 | 1,660 | |||||||||
| Excess tax benefit from stock-based compensation |
— | (329 | ) | (215 | ) | |||||||
| Net change in: |
||||||||||||
| Accrued interest receivable |
(1,709 | ) | (854 | ) | (804 | ) | ||||||
| Other assets |
(807 | ) | 400 | (1,027 | ) | |||||||
| Income taxes receivable |
370 | (423 | ) | 321 | ||||||||
| Income taxes payable |
— | 145 | 398 | |||||||||
| Accrued interest payable |
571 | 30 | 32 | |||||||||
| Deferred compensation liability |
876 | 609 | 683 | |||||||||
| Other liabilities |
574 | (2,216 | ) | 446 | ||||||||
|
|
|
|
|
|
|
|||||||
| Net cash provided by operating activities |
85,765 | 12,773 | 18,085 | |||||||||
|
|
|
|
|
|
|
|||||||
74
Table of Contents
BSB BANCORP, INC. AND SUBSIDIARIES
CONSOLIDATED STATEMENTS OF CASH FLOWS
(continued)
(Dollars in thousands)
| Years Ended December 31, | ||||||||||||
| 2017 | 2016 | 2015 | ||||||||||
| Cash flows from investing activities: |
||||||||||||
| Maturities of interest-bearing time deposits with other banks |
234 | 131 | — | |||||||||
| Purchases of interest-bearing time deposits with other banks |
(2,440 | ) | (234 | ) | — | |||||||
| Proceeds from sales of available-for-sale securities |
5,038 | — | — | |||||||||
| Proceeds from maturities, payments, and calls of held-to-maturity securities |
28,362 | 25,976 | 21,459 | |||||||||
| Purchases of held-to-maturity securities |
(59,022 | ) | (19,812 | ) | (40,708 | ) | ||||||
| Redemption of Federal Home Loan Bank stock |
3,767 | 3,014 | — | |||||||||
| Purchases of Federal Home Loan Bank stock |
(11,078 | ) | (9,776 | ) | (4,597 | ) | ||||||
| Recoveries of loans previously charged off |
24 | 61 | 261 | |||||||||
| Loan originations and principal collections, net |
(57,732 | ) | 16,997 | (79,445 | ) | |||||||
| Purchases of loans |
(438,883 | ) | (350,653 | ) | (288,928 | ) | ||||||
| Capital expenditures |
(512 | ) | (335 | ) | (323 | ) | ||||||
| Capital expenditures on other real estate owned |
— | — | (7 | ) | ||||||||
| Premiums paid on bank-owned life insurance |
(5 | ) | (5,005 | ) | (5,006 | ) | ||||||
| Proceeds from sales of other real estate owned |
— | — | 1,510 | |||||||||
|
|
|
|
|
|
|
|||||||
| Net cash used in investing activities |
(532,247 | ) | (339,636 | ) | (395,784 | ) | ||||||
|
|
|
|
|
|
|
|||||||
| Cash flows from financing activities: |
||||||||||||
| Net increase in demand deposits, interest-bearing checking and savings accounts |
112,716 | 122,737 | 252,735 | |||||||||
| Net increase in time deposits |
169,113 | 77,166 | 32,222 | |||||||||
| Proceeds from Federal Home Loan Bank advances |
125,000 | 211,250 | 84,000 | |||||||||
| Principal payments on Federal Home Loan Bank advances |
(85,000 | ) | (7,000 | ) | (14,100 | ) | ||||||
| Net change in short-term Federal Home Loan Bank advances |
174,300 | (69,400 | ) | 19,000 | ||||||||
| Net increase (decrease) in securities sold under agreements to repurchase |
1,283 | (1,710 | ) | 2,303 | ||||||||
| Repayment of principal on other borrowed funds |
— | — | (47 | ) | ||||||||
| Proceeds from exercise of stock options, net of cash paid |
56 | 298 | 228 | |||||||||
| Restricted stock awards issued, net of awards surrendered |
(323 | ) | (118 | ) | (51 | ) | ||||||
| Net increase in mortgagors’ escrow accounts |
1,349 | 926 | 688 | |||||||||
| Excess tax benefit from stock-based compensation |
— | 329 | 215 | |||||||||
|
|
|
|
|
|
|
|||||||
| Net cash provided by financing activities |
498,494 | 334,478 | 377,193 | |||||||||
|
|
|
|
|
|
|
|||||||
| Net increase (decrease) in cash and cash equivalents |
52,012 | 7,615 | (506 | ) | ||||||||
| Cash and cash equivalents at beginning of period |
58,876 | 51,261 | 51,767 | |||||||||
|
|
|
|
|
|
|
|||||||
| Cash and cash equivalents at end of period |
$ | 110,888 | $ | 58,876 | $ | 51,261 | ||||||
|
|
|
|
|
|
|
|||||||
| Supplemental disclosures: |
||||||||||||
| Interest paid |
$ | 20,483 | $ | 14,201 | $ | 10,162 | ||||||
| Income taxes paid |
8,977 | 9,446 | 4,624 | |||||||||
| Transfer of loans receivable to loans held for sale |
63,913 | — | 10,116 | |||||||||
| Transfer of loans to other real estate owned |
— | — | 1,513 | |||||||||
| Derecognition of loans and related recourse obligation in other borrowings |
— | 1,020 | — | |||||||||
The accompanying notes are an integral part of these consolidated financial statements.
75
Table of Contents
BSB BANCORP, INC. AND SUBSIDIARIES
NOTES TO CONSOLIDATED FINANCIAL STATEMENTS
(Tables in thousands, except share amounts)
NOTE 1 – SUMMARY OF SIGNIFICANT ACCOUNTING POLICIES
Nature of Operations
BSB Bancorp, Inc. (the “Company”) was incorporated in Maryland in June, 2011 to become the holding company of Belmont Savings Bank (the “Bank”), a state-chartered Massachusetts savings bank. The Company is supervised by the Board of Governors of the Federal Reserve System (“FRB”), while the Bank is subject to the regulations of, and periodic examination by, the Federal Deposit Insurance Corporation (“FDIC”) and the Massachusetts Division of Banks (the “Division”). The Bank’s deposits are insured by the Bank Insurance Fund of the FDIC up to $250,000 per account. For balances in excess of the FDIC deposit insurance limits, coverage is provided by the Massachusetts Depositors Insurance Fund, Inc. (“Mass DIF”). In connection with the Company’s conversion from a mutual holding company to stock holding company form of organization (the “conversion”), on October 4, 2011 we completed our initial public offering of common stock, selling 8,993,000 shares of common stock at $10.00 per share for approximately $89.9 million in gross proceeds, including 458,643 shares sold to the Bank’s employee stock ownership plan. In addition, in connection with the conversion, we issued 179,860 shares of our common stock and contributed $200,000 in cash to the Belmont Savings Bank Foundation.
Belmont Savings Bank is a state chartered savings bank which was incorporated in 1885 and is headquartered in Belmont, Massachusetts. The Bank is engaged principally in the business of attracting deposits from the general public and investing those deposits in residential and commercial real estate loans, consumer loans, including indirect auto loans, commercial loans and construction loans, as well as investment securities.
Basis of Presentation
The consolidated financial statements include the accounts of the Company and its wholly-owned subsidiaries, Belmont Savings Bank and BSB Funding Corporation and the Bank’s wholly owned subsidiary, BSB Investment Corporation. All significant intercompany balances and transactions have been eliminated in consolidation.
The Company’s consolidated financial statements have been prepared in conformity with U.S. generally accepted accounting principles and general practices within the financial services industry.
Use of Estimates
The preparation of financial statements in conformity with accounting principles generally accepted in the United States of America requires management to make estimates and assumptions that affect the reported amounts of assets and liabilities as of the date of the balance sheet and reported amounts of revenues and expenses during the reporting period. Actual results could differ from those estimates. Material estimates that are particularly susceptible to significant changes in the near-term relate to the determination of the allowance for loan losses, valuation and potential other-than-temporary impairment (“OTTI”) of investment securities and the valuation of deferred tax assets.
Reclassification
Certain previously reported amounts have been reclassified to conform to the current year’s presentation.
Significant Group Concentrations of Credit Risk
Most of the Company’s business activity is with customers located within the Commonwealth of Massachusetts. There are no concentrations of credit to borrowers that have similar economic characteristics. The majority of the Company’s loan portfolio is comprised of loans collateralized by real estate located in the Commonwealth of Massachusetts.
Cash and Cash Equivalents
For purposes of the consolidated statements of cash flows, cash and cash equivalents include cash, balances due from banks and interest-bearing deposits in other banks.
76
Table of Contents
Securities
Debt securities that management has the positive intent and ability to hold to maturity are classified as “held-to-maturity” and recorded at amortized cost. Securities not classified as held-to-maturity or trading, including equity securities with readily determinable fair values, are classified as “available-for-sale” and recorded at fair value, with unrealized gains and losses excluded from earnings and reported in other comprehensive income.
Purchase premiums and discounts are recognized in interest income using the interest method over the terms of the securities, adjusted for the effect of actual prepayments in the case of mortgage-backed securities. Gains and losses on the sale of securities are recorded on the trade date and are determined using the specific identification method.
Each reporting period, the Company evaluates all securities classified as available-for-sale or held-to-maturity, with a decline in fair value below the amortized cost of the investment to determine whether or not the impairment is deemed to be OTTI. Consideration is given to the obligor of the security, whether the security is guaranteed, whether there is a projected adverse change in cash flows, the liquidity of the security, the type of security, the capital position of security issuers, and payment history of the security, amongst other factors when evaluating these individual securities.
OTTI is required to be recognized if (1) the Company intends to sell the security; (2) it is “more likely than not” that the Company will be required to sell the security before recovery of its amortized cost basis; or (3) for debt securities, the present value of expected cash flows is not sufficient to recover the entire amortized cost basis. Marketable equity securities are evaluated for OTTI based on the severity and duration of the impairment and, if deemed to be other than temporary, the declines in fair value are reflected in earnings as realized losses. For impaired debt securities that the Company intends to sell, or more likely than not will be required to sell, the full amount of the depreciation is recognized as OTTI through earnings. For all other impaired debt securities, credit-related OTTI is recognized through earnings and non-credit related OTTI is recognized in other comprehensive income, net of applicable taxes.
Federal Home Loan Bank Stock
As a member of the Federal Home Loan Bank of Boston (FHLB), the Company is required to invest in stock of the FHLB. Based on redemption provisions, the stock has no quoted market value and is carried at cost. Management evaluates the Company’s investment in the FHLB of Boston stock for other-than-temporary impairment at least on a quarterly basis and more frequently when economic or market conditions warrant such evaluation. Based on its most recent analysis of the FHLB of Boston as of December 31, 2017, management deems its investment in FHLB of Boston stock to not be other-than-temporarily impaired.
Loans Held For Sale
Loans purchased or transferred from held for investment, (if intent or ability to hold existing loans changes), and loans originated and intended for sale in the secondary market are carried at the lower of cost or estimated fair value, in the aggregate. Net unrealized losses, if any, are recognized through a valuation allowance by charges to income. Direct loan origination costs and fees are deferred upon origination and are recognized on the date of sale.
Loans
Loans that management has the intent and ability to hold for the foreseeable future or until maturity or pay-off generally are reported at their outstanding unpaid principal balances adjusted for charge-offs, the allowance for loan losses, any deferred fees or costs on originated loans and unamortized premiums on purchased loans.
Interest income is accrued on the unpaid principal balance. Loan origination fees, net of certain direct origination costs, are deferred and recognized over the expected term as an adjustment of the related loan yield using the interest method.
The accrual of interest on all loans is discontinued at the time the loan is 90 days past due unless the credit is well-secured and in process of collection. Past due status is based on contractual terms of the loan. In all cases, loans are placed on nonaccrual if collection of principal or interest is considered doubtful. All interest accrued but not collected for loans that are placed on nonaccrual is reversed against interest income.
The interest on these loans is accounted for on the cash-basis or cost-recovery method, until qualifying for return to accrual. Loans are returned to accrual status when all the principal and interest amounts contractually due are brought current and future payments are reasonably assured.
77
Table of Contents
Cash receipts of interest income on impaired loans are credited to principal to the extent necessary to eliminate doubt as to the collectability of the net carrying amount of the loan. Some or all of the cash receipts of interest income on impaired loans is recognized as interest income if the remaining net carrying amount of the loan is deemed to be fully collectible. When recognition of interest income on an impaired loan on a cash basis is appropriate, the amount of income that is recognized is limited to that which would have been accrued on the net carrying amount of the loan at the contractual interest rate. Any cash interest payments received in excess of the limit and not applied to reduce the net carrying amount of the loan are recorded as recoveries of charge-offs until the charge-offs are fully recovered.
Allowance for Loan Losses
The allowance for loan losses is established as losses are estimated to have occurred through a provision for loan losses charged to earnings. Loan losses are charged against the allowance when management believes the uncollectibility of a loan balance is confirmed. Subsequent recoveries, if any, are credited to the allowance.
The allowance for loan losses is evaluated on a regular basis by management. This evaluation is inherently subjective as it requires estimates that are susceptible to significant revision as more information becomes available. The allowance consists of general, allocated and unallocated components, as further described below.
General Component:
The general component of the allowance for loan losses is based on historical loss experience adjusted for qualitative factors stratified by the following loan segments: residential real estate, home equity lines of credit, commercial real estate, construction, commercial, indirect auto and other consumer. Management uses a rolling average of historical losses based on a time frame appropriate to capture relevant loss data for each loan segment. This historical loss factor is adjusted for the following qualitative factors: levels/trends in delinquencies; trends in volume and terms of loans; effects of changes in risk selection and underwriting standards and other changes in lending policies, procedures and practices; experience/ability/depth of lending management and staff; and national and local economic trends and conditions. There were no changes in the Company’s policies or methodology pertaining to the general component of the allowance for loan losses during 2017 or 2016.
The qualitative factors are determined based on the various risk characteristics of each loan segment. Risk characteristics relevant to each portfolio segment are as follows:
Residential real estate loans and home equity lines of credit – The Company generally does not originate or purchase loans with a loan-to-value ratio greater than 80 percent and does not grant subprime loans. Loans in this segment are generally collateralized by owner-occupied residential real estate and repayment is primarily dependent on the credit quality of the individual borrower and secondarily, liquidation of the collateral. The overall health of the economy, including unemployment rates and housing prices, will have an effect on the credit quality in this segment.
Commercial real estate loans – Loans in this segment are primarily income-producing properties throughout New England. The underlying cash flows generated by the properties are adversely impacted by a downturn in the economy as evidenced by increased vacancy rates, which in turn, will have an effect on the credit quality in this segment. Management generally obtains rent rolls annually and continually monitors the cash flows of these borrowers.
Construction loans – Loans in this segment primarily include speculative real estate development loans for which payment is derived from sale and/or lease up of the property. Credit risk is affected by cost overruns, time to sell at an adequate price, and market conditions.
Commercial loans – Loans in this segment are made to businesses and are generally secured by real estate and assets of the business. Repayment is expected from the cash flows of the business. A weakened economy, and resultant decreased consumer and business spending, will have an effect on the credit quality in this segment.
Indirect auto loans – Loans in this segment are secured installment loans that are originated through a network of select regional automobile dealerships. The Company’s interest in the vehicle is secured with a recorded lien on the state title of each automobile. Collections are sensitive to changes in borrower financial circumstances, and the collateral can depreciate or be damaged in the event of repossession. Repayment is primarily dependent on the credit worthiness and the cash flow of the individual borrower and secondarily, liquidation of collateral.
78
Table of Contents
Consumer loans – Loans in this segment include secured and unsecured consumer loans including passbook loans, consumer lines of credit, overdraft protection and consumer unsecured loans. Repayment is dependent on the credit quality and the cash flow of the individual borrower.
Allocated Component:
The allocated component relates to loans that are classified as impaired. A loan is considered impaired when, based on current information and events, it is probable that the Company will be unable to collect the scheduled payments of principal or interest when due according to the contractual terms of the loan agreement. Factors considered by management in determining impairment include payment status, collateral value, and the probability of collecting scheduled principal and interest payments when due. Loans that experience insignificant payment delays and payment shortfalls generally are not classified as impaired. Management determines the significance of payment delays and payment shortfalls on a case-by-case basis, taking into consideration all of the circumstances surrounding the loan and the borrower, including the length of the delay, the reasons for the delay, the borrower’s prior payment record, and the amount of the shortfall in relation to the principal and interest owed.
The Company periodically may agree to modify the contractual terms of loans. When a loan is modified and a concession is made to a borrower experiencing financial difficulty, the modification is considered a troubled debt restructuring (“TDR”). All TDRs are classified as impaired and therefore are subject to a specific review for impairment.
Impaired loans are measured based on the present value of expected future cash flows discounted at the loan’s effective interest rate at the time of impairment or, as a practical expedient, at the loan’s observable market price or the fair value of the collateral if the loan is collateral-dependent. Generally, impairment on TDRs is measured using the discounted cash flow method by discounting expected cash flows by the loan’s contractual rate of interest in effect prior to the loan’s modification. Loans that have been classified as TDRs and which subsequently default are reviewed to determine if the loan should be deemed collateral dependent. In such an instance, any shortfall between the value of the collateral and the book value of the loan is determined by measuring the recorded investment in the loan against the fair value of the collateral less costs to sell. Generally, all other impaired loans are collateral dependent and impairment is measured through the collateral method. All loans on non-accrual status, with the exception of indirect auto and consumer loans, are considered to be impaired. When the measurement of the impaired loan is less than the recorded investment in the loan, the impairment is recorded through the allowance for loan losses. The Bank charges off the amount of any confirmed loan loss in the period when the loans, or portion of loans, are deemed uncollectible.
Unallocated Component:
An unallocated component is maintained to cover uncertainties that could affect management’s estimate of probable losses. The unallocated component of the allowance reflects the margin of imprecision inherent in the underlying assumptions used in the methodologies for estimating allocated and general reserves in the portfolio.
In the ordinary course of business, the Bank enters into commitments to extend credit, commercial letters of credit and standby letters of credit. Such financial instruments are recorded in the financial statements when they are funded or become payable. The credit risk associated with these commitments is evaluated in a manner similar to the allowance for loan losses. The reserve for off-balance sheet commitments is included in other liabilities in the balance sheet. At December 31, 2017 and 2016, the reserve for unfunded loan commitments was $36,000 and $63,000, respectively. The related provision for off-balance sheet credit losses is included in non-interest expense in the consolidated statement of operations.
Premises and Equipment
Land is carried at cost. Buildings and equipment are stated at cost, less accumulated depreciation, computed on the straight-line method over the estimated useful lives of the assets. It is general practice to charge the cost of maintenance and repairs to earnings when incurred; major expenditures for betterments are capitalized and depreciated over the shorter of the lease term for leasehold improvements or their estimated useful lives. The cost and related accumulated depreciation of assets sold, or otherwise disposed of, are removed from the related accounts and any gain or loss is included in earnings.
Bank-owned Life Insurance
Bank-owned life insurance policies are reflected on the consolidated balance sheets at cash surrender value. Changes in the net cash surrender value of the policies, as well as insurance proceeds received, are reflected in non-interest income on the consolidated statements of operations and are generally not subject to income taxes. The Company reviews the financial strength of the insurance carriers prior to the purchase of life insurance policies and no less than annually thereafter.
79
Table of Contents
A life insurance policy with any individual carrier is limited to 15% of tier one capital and the total cash surrender value of life insurance policies is limited to 25% of tier one capital.
Transfers and Servicing of Financial Assets
Transfers of an entire financial asset, a group of entire financial assets, or a participating interest in an entire financial asset are accounted for as sales when control over the assets has been surrendered. Control over transferred assets is deemed to be surrendered when (1) the assets have been isolated from the Company, (2) the transferee obtains the right to pledge or exchange the transferred assets, and (3) the Company does not maintain effective control over the transferred assets.
During the normal course of business, the Company may transfer whole loans or a portion of a financial asset, such as a participation loan or the government guaranteed portion of a loan. In order to be eligible for sales treatment, the transfer of the portion of the loan must meet the criteria of a participating interest. If it does not meet the criteria of a participating interest, the transfer will be accounted for as a secured borrowing. In order to meet the criteria for a participating interest, all cash flows from the loan must be divided proportionately, the rights of each loan holder must have the same priority, the loan holders must have no recourse to the transferor other than standard representations and warranties and no loan holder has the right to pledge or exchange the entire loan.
The Company services mortgage and indirect auto loans for others. Loan servicing fee income is reported in the consolidated statements of operations as fees are earned for servicing loans. The fees are based on a contractual percentage of the outstanding principal and are recorded as income when earned. Late fees and ancillary fees related to loan servicing are not material.
Mortgage servicing rights (“MSR”) are initially recorded as an asset and measured at fair value when loans are sold to third parties with servicing rights retained. MSR assets are amortized in proportion to, and over the period of, estimated net servicing revenues. The carrying value of these assets is periodically reviewed for impairment using the lower of amortized cost or fair value methodology. The fair value of the servicing rights is determined by estimating the present value of future net cash flows, taking into consideration market loan prepayment speeds, discount rates, servicing costs and other economic factors. For purposes of measuring impairment, the underlying loans are stratified into relatively homogeneous pools based on predominant risk characteristics which include product type (i.e., fixed or adjustable) and interest rate bands. If the aggregate carrying value of the capitalized mortgage servicing rights for a stratum exceeds its fair value, MSR impairment is recognized in earnings through a valuation allowance for the difference. As the loans are repaid and net servicing revenue is earned, the MSR asset is amortized as an offset to loan servicing income. Servicing revenues are expected to exceed this amortization expense. However, if actual prepayment experience or defaults exceed what was originally anticipated, net servicing revenues may be less than expected and mortgage servicing rights may be impaired. No servicing assets or liabilities related to auto loans were recorded, as the contractual servicing fees are adequate to compensate the Company for its servicing responsibilities.
Other Real Estate Owned and Other Foreclosed Assets
Assets acquired through, or in lieu of, loan foreclosure are held for sale and are initially recorded at fair value, less estimated costs to sell, at the date of foreclosure or when control is established, establishing a new cost basis. Subsequent to foreclosure, valuations are periodically performed by management and the assets are carried at the lower of carrying amount or fair value less cost to sell. Revenue and expenses from operations, changes in the valuation allowance and any direct writedowns are included in other noninterest expense.
The Company classifies commercial loans as in-substance repossessed or foreclosed if the Company receives physical possession of the debtor’s assets regardless of whether formal foreclosure proceedings take place. The Company classifies residential real estate loans as in-substance repossessed or foreclosed upon either obtaining legal title to the residential real estate property upon completion of a foreclosure or when the borrower conveys all interest in the property to the Company to satisfy the loan through a completion of a deed in lieu of foreclosure or through a similar legal agreement.
Advertising Costs
Advertising costs are expensed as incurred and recorded within marketing expense.
Belmont Savings Bank Supplemental Executive Retirement Plan
The compensation cost of an employee’s retirement benefit is recognized on the projected unit credit method over the employee’s approximate service period. The aggregate cost method is utilized for funding purposes.
80
Table of Contents
The Company accounts for its supplemental executive retirement plan using an actuarial model that allocates benefit costs over the service period of employees in the plan. The Company accounts for the over-funded or under-funded status of the plan as an asset or liability in its consolidated balance sheets and recognizes changes in the funded status in the year in which the changes occur through other comprehensive income or loss.
Other Supplemental Executive Retirement Plans
The compensation cost of an employe’s retirement benefit is accrued over the estimated period of the employee’s service. At each measurement date, the aggregate amount accrued equals the then present value of the benefits expected to be provided to the employee in exchange for the employee’s service to that date.
Employee Stock Ownership Plan
Compensation expense for the Employee Stock Ownership Plan (“ESOP”) is recorded at an amount equal to the shares allocated by the ESOP multiplied by the average fair value of the shares during the period. The Company recognizes compensation expense ratably over the year based upon the Company’s estimate of the number of shares expected to be allocated by the ESOP. Unearned compensation applicable to the ESOP is reflected as a reduction of stockholders’ equity in the consolidated balance sheets. The difference between the average fair value and the cost of the shares allocated by the ESOP is recorded as an adjustment to additional paid-in capital.
Stock Based Compensation
The Company recognizes stock-based compensation based on the grant-date fair value of the award adjusted for expected forfeitures. The Company values share-based stock option awards granted using the Black-Scholes option-pricing model. The Company recognizes compensation expense for its awards on a straight-line basis over the requisite service period for the entire award (straight-line attribution method), ensuring that the amount of compensation cost recognized at any date at least equals the portion of the grant-date fair value of the award that is vested at that time.
Income Taxes
Deferred income tax assets and liabilities are determined using the liability (or balance sheet) method. Under this method, the net deferred tax asset or liability is determined based on the tax effects of the temporary differences between the book and tax bases of the various balance sheet assets and liabilities and gives current recognition to changes in tax rates and laws. A valuation allowance is established against deferred tax assets when, based upon all available evidence, both positive and negative, it is determined that it is more likely than not that some or all of the deferred tax assets will not be realized.
Fair Value Hierarchy
The Company measures the fair values of its financial instruments in accordance with accounting guidance that requires an entity to base fair value on exit price, and maximize the use of observable inputs and minimize the use of unobservable inputs to determine the exit price. Under applicable accounting guidance, the Company categorizes its financial instruments, based on the priority of inputs to the valuation technique, into a three-level hierarchy, as described below.
Level 1 - Level 1 inputs are quoted prices (unadjusted) in active markets for identical assets or liabilities that the reporting entity has the ability to access at the measurement date.
Level 2 - Level 2 inputs are inputs other than quoted prices included within Level 1 that are observable for the asset or liability, either directly or indirectly.
Level 3 - Level 3 inputs are unobservable inputs for the asset or liability.
Transfers between levels are recognized at the end of a reporting period, if applicable.
Earnings per Share (“EPS”)
Basic earnings per share is calculated using the two-class method. The two-class method is an earnings allocation formula under which earnings per share is calculated from common stock and participating securities considering both dividends declared (or accumulated) and participation rights in undistributed earnings as if all such earnings had been distributed during the period.
81
Table of Contents
Under this method, all earnings distributed and undistributed, are allocated to participating securities and common shares based on their respective rights to receive dividends. Unvested share-based payment awards that contain nonforfeitable rights to dividends are considered participating securities (i.e. unvested restricted stock), not subject to performance based measures. Basic earnings per share is calculated by dividing net income available to common shareholders by the weighted average number of common shares outstanding. Diluted earnings per share have been calculated in a manner similar to that of basic earnings per share except that the weighted average number of common shares outstanding is increased to include the number of additional common shares that would have been outstanding if all potentially dilutive common shares (such as those resulting from the exercise of stock options or the attainment of performance measures) were issued during the period, computed using the treasury stock method.
Comprehensive Income
Accounting principles generally require that recognized revenue, expenses, gains and losses be included in net income. Although certain changes in assets and liabilities are reported as a separate component of the stockholders’ equity section of the consolidated balance sheets, such items, along with net income, are components of comprehensive income. Other comprehensive income includes unrealized gains and losses on securities available for sale and changes in the funded status of the Belmont Savings Bank Supplemental Executive Retirement Plan.
Recent Accounting Pronouncements
In May 2014, the FASB issued amendments to Accounting Standards Codification (“ASC”) section 606 “Revenue from Contracts with Customers” through issuance of ASU 2014-09, “Revenue from Contracts with Customers.” The guidance in this update affects any entity that either enters into contracts with customers to transfer goods or services or enters into contracts for the transfer of nonfinancial assets unless those contracts are within the scope of other standards (for example, insurance contracts or lease contracts). The core principle of the guidance is that an entity should recognize revenue to depict the transfer of promised goods or services to customers in an amount that reflects the consideration to which the entity expects to be entitled in exchange for those goods or services. The guidance provides steps to follow to achieve the core principle. An entity should disclose sufficient information to enable users of financial statements to understand the nature, amount, timing and uncertainty of revenue and cash flows arising from contracts with customers. Qualitative and quantitative information is required about contracts with customers, significant judgments and changes in judgments, and assets recognized from the costs to obtain or fulfill a contract. In August 2015, the FASB issued ASU 2015-14, “Revenue from Contracts with Customers (Topic 606).” The amendments in ASU 2015-14 defer the effective date of ASU 2014-09 for all entities by one year to interim and annual reporting periods beginning after December 15, 2017. Our revenue is comprised of net interest income on financial assets and financial liabilities, which is explicitly excluded from the scope of ASU 2014-09, and non-interest income. We have completed our evaluation of the impact of ASU 2014-09 on components of our non-interest income and have not identified any significant changes to our methodology of recognizing revenue. We will adopt the standard in the first quarter of 2018 utilizing the modified retrospective approach and it will not have a material impact on our financial statements.
In May 2015, the FASB issued ASU 2015-07, “Fair Value Measurement (Topic 820) – Disclosures for Investments in Certain Entities That Calculate Net Asset Value per Share (or Its Equivalent).” The objective of this update is to address the diversity in practice related to how certain investments measured at net asset value with redemption dates in the future are categorized within the fair value hierarchy. The amendments in this update remove the requirement to categorize within the fair value hierarchy all investments for which fair value is measured using the net asset value per share practical expedient. The amendments also remove the requirement to make certain disclosures for all investments that are eligible to be measured at fair value using the net asset value per share practical expedient. Rather, those disclosures are limited to investments for which the entity has elected to measure the fair value using that practical expedient. The amendments in this update were effective for the Company on January 1, 2016 and did not have a material impact on its consolidated financial statements.
In January 2016, the FASB issued ASU 2016-01, “Financial Instruments – Overall (Subtopic 825-10): Recognition and Measurement of Financial Assets and Financial Liabilities.” ASU 2016-01, among other things, (i) requires equity investments, with certain exceptions, to be measured at fair value with changes in fair value recognized in net income, (ii) simplifies the impairment assessment of equity investments without readily determinable fair values by requiring a qualitative assessment to identify impairment, (iii) eliminates the requirement for public business entities to disclose the methods and significant assumptions used to estimate the fair value that is required to be disclosed for financial instruments measured at amortized cost on the balance sheet, (iv) requires public business entities to use the exit price notion when measuring the fair value of financial instruments for disclosure purposes, (v) requires an entity to present separately in other comprehensive income the portion of the total change in the fair value of a liability resulting from a change in the instrument-specific credit risk when the entity has elected to measure the liability at fair value in accordance with the fair value option for financial instruments, (vi) requires separate presentation of financial assets and financial liabilities by measurement category and form of financial asset on the balance sheet or the accompanying notes to the financial statements and
82
Table of Contents
(vii) clarifies that an entity should evaluate the need for a valuation allowance on a deferred tax asset related to available-for-sale securities in combination with the entity’s other deferred tax assets. The amendments in this update are effective for fiscal years, and interim periods within those fiscal years, beginning after December 15, 2017. The adoption of this guidance is not expected to have a material impact on the Company’s consolidated financial statements.
In February 2016, the FASB issued ASU 2016-02, “Leases (Topic 842).” Under the new guidance, a lessee will be required to recognize assets and liabilities for leases with lease terms of more than 12 months. Consistent with current GAAP, the recognition, measurement, and presentation of expenses and cash flows arising from a lease by a lessee primarily will depend on its classification as a finance or operating lease. However, unlike current GAAP, which requires only capital leases to be recognized on the balance sheet, the new ASU will require both types of leases to be recognized on the balance sheet. This ASU is effective for fiscal years beginning after December 15, 2018, including interim periods therein. Early adoption is permitted. We are currently evaluating the impact of adopting the new guidance on the Company’s consolidated financial statements.
In March 2016, the FASB issued ASU 2016-09, “Compensation-Stock Compensation (Topic 718): Improvements to Employee Share-Based Payment Accounting.” This update makes several modifications to Topic 718 related to the accounting for forfeitures, employer tax withholding on share-based compensation and the financial statement presentation of excess tax benefits or deficiencies. ASU 2016-09 also clarifies the statement of cash flows presentation for certain components of share-based awards. The standard is effective for interim and annual reporting periods beginning after December 15, 2016. The Company adopted this standard as of January 1, 2017. As a result, we recognized excess tax benefits from stock-based compensation of $1.3 million during the year ended December 31, 2017, within income tax expense on the consolidated statements of operations (adopted prospectively). Excess tax benefits from stock based compensation are now classified in net income within operating activities in the statement of cash flows instead of being separately stated in financing activities for the year ended December 31, 2017 (adopted prospectively). Amendments related to the presentation of employee taxes paid within financing activities in the statement of cash flows have been adopted retrospectively and prior period reclassifications will be made. Following the adoption of the new standard, the Company has elected to continue to estimate forfeitures. The adoption did not impact the existing classification of the awards.
In June 2016, the FASB issued ASU 2016-13, “Financial Instruments-Credit Losses (Topic 326): Measurement of Credit Losses on Financial Instruments.” The update changes the impairment model for most financial assets and sets forth a “current expected credit loss” (CECL) model which will require the Company to measure all expected credit losses for financial instruments held at the reporting date based on historical experience, current conditions and reasonable supportable forecasts. This method is forward-looking and will generally result in earlier recognition of allowances for losses. This replaces the existing incurred loss model and is applicable to the measurement of credit losses on financial assets measured at amortized cost and also applies to some off-balance sheet credit exposures. This ASU is effective for fiscal years beginning after December 15, 2019, including interim periods within those fiscal years. Early adoption is permitted. We are currently evaluating the impact of adopting the new guidance on the Company’s consolidated financial statements.
In August 2016, the FASB issued ASU 2016-15, “Statement of Cash Flows (Topic 230): Classification of Certain Cash Receipts and Cash Payments.” The update provides guidance on the classification of certain cash receipts and cash payments for presentation in the statement of cash flows. The amendment is effective for the Company for fiscal years beginning after December 15, 2017 and interim periods within those years. Early adoption is permitted. The amendments will be applied using a retrospective transition method to each period presented unless impracticable. The adoption of this guidance is not expected to have a material impact on the Company’s consolidated financial statements.
In November 2016, the FASB issued ASU 2016-18, “Statement of Cash Flows (Topic 230): Restricted Cash.” The update requires that a statement of cash flows explain the change during the period in the total of cash, cash equivalents, and amounts generally described as restricted cash or restricted cash equivalents. Therefore, amounts generally described as restricted cash or restricted cash equivalents should be included with cash and cash equivalents when reconciling the beginning-of-period and end-of-period total amounts shown on the statement of cash flows. The amendment is effective for the Company for fiscal years beginning after December 15, 2017 and interim periods within those years. Early adoption is permitted. The adoption of this guidance is not expected to have a material impact on the Company’s consolidated financial statements.
In February 2017, the FASB issued ASU 2017-05, “Other Income-Gains and Losses from the Derecognition of Nonfinancial Assets (Subtopic 610-20): Clarifying the Scope of Asset Derecognition Guidance and Accounting for Partial Sales of Nonfinancial Assets.” This ASU is meant to clarify the scope of ASC Subtopic 610-20, Other Income-Gains and Losses from the Derecognition of Nonfinancial Assets. The guidance is to be applied using a full retrospective method or a modified retrospective method and is effective at the same time as the amendments in update 2014-09. Early adoption is permitted. The adoption of this guidance is not expected to have a material impact on the Company’s consolidated financial statements.
83
Table of Contents
In March 2017, the FASB issued ASU 2017-07, “Compensation-Retirement Benefits (Topic 715): Improving the Presentation of Net Periodic Pension Cost and Net Periodic Postretirement Benefit Cost.” This ASU is meant to improve the presentation of net periodic pension cost and net periodic postretirement benefit cost. The amendments in this ASU require that an employer report the service cost component in the same line item or items as other compensation costs arising from services rendered by the pertinent employees during the period. The other components of net benefit cost are required to be presented in the income statement separately. The amendments in this Update are effective for public business entities for annual periods beginning after December 15, 2017, including interim periods within those annual periods. Early adoption is permitted. The adoption of this guidance is not expected to have a material impact on the Company’s consolidated financial statements.
In March 2017, the FASB issued ASU 2017-08, “Receivables-Nonrefundable Fees and Other Costs (Subtopic 310-20): Premium Amortization on Purchased Callable Debt Securities.” The amendments in this ASU shorten the amortization period for certain callable debt securities held at a premium. Specifically, the amendments require the premium to be amortized to the earliest call date. The amendments do not require an accounting change for securities held at a discount; the discount continues to be amortized to maturity. For public business entities, the amendments in this Update are effective for fiscal years, and interim periods within those fiscal years, beginning after December 15, 2018. Early adoption is permitted, including adoption in an interim period. If an entity early adopts the amendments in an interim period, any adjustments should be reflected as of the beginning of the fiscal year that includes that interim period. The adoption of this guidance is not expected to have a material impact on the Company’s consolidated financial statements.
In July 2017, the FASB issued ASU 2017-11, “ASU No. 2017-11, Earnings Per Share (Topic 260); Distinguishing Liabilities from Equity (Topic 480); Derivatives and Hedging (Topic 815): (Part I) Accounting for Certain Financial Instruments with Down Round Features, (Part II) Replacement of the Indefinite Deferral for Mandatorily Redeemable Financial Instruments of Certain Nonpublic Entities and Certain Mandatorily Redeemable Noncontrolling Interests with a Scope Exception.” The amendments in Part I of this ASU change the classification analysis of certain equity-linked financial instruments (or embedded features) with down round features. The amendments in Part II of this ASU recharacterize the indefinite deferral of certain provisions of Topic 480 that now are presented as pending content in the Codification, to a scope exception. Those amendments do not have an accounting effect. When determining whether certain financial instruments should be classified as liabilities or equity instruments, a down round feature no longer precludes equity classification when assessing whether the instrument is indexed to an entity’s own stock. The amendments also clarify existing disclosure requirements for equity-classified instruments. For public business entities, the amendments in Part I of this ASU are effective for fiscal years, and interim periods within those fiscal years, beginning after December 15, 2018. Early adoption is permitted, including adoption in an interim period for which financial statements (interim or annual) have not been issued or have not been made available for issuance. The amendments in Part II of this ASU do not require any transition guidance because those amendments do not have an accounting effect. The adoption of this guidance is not expected to have a material impact on the Company’s consolidated financial statements.
In August 2017, the FASB issued ASU 2017-12, “Derivatives and Hedging: Targeted Improvements to Accounting for Hedging Activities”. The purpose of this ASU is to better align a company’s financial reporting for hedging activities with the economic objectives of those activities. The amendments in this ASU are effective for public business entities for fiscal years beginning after December 15, 2018, with early adoption, including adoption in an interim period, permitted. The Company plans to adopt this ASU in the first quarter of 2018. This ASU requires a modified retrospective transition method in which the Company will recognize the cumulative effect of the change on the opening balance of each affected component of equity in the statement of financial position as of the date of adoption. The adoption of this guidance is not expected to have a material impact on the Company’s consolidated financial statements.
In February 2018, the FASB issued ASU 2018-02, “Income Statement – Reporting Comprehensive Income (Topic 220): Reclassification of Certain Tax Effects from Accumulated Other Comprehensive Income”. The purpose of this ASU is to eliminate the stranded tax effects resulting from the Tax Reform Act. The underlying guidance that requires the effect of a change in tax laws or rates be included in income from continuing operations is not affected. The amendments in this ASU are effective for public business entities for fiscal years beginning after December 15, 2018, with early adoption, including adoption in an interim period, permitted. The Company plans to adopt this ASU in the first quarter of 2018. The amendments in this ASU should be applied either in the period of adoption or retrospectively to each period (or periods) in which the effect of the change in the U.S. federal corporate income tax rate in the Tax Reform Act is recognized. The Company will recognize a reclassification from accumulated other comprehensive income to retained earnings in the statement of financial position as of the date of adoption. The adoption of this guidance is not expected to have a material impact on the Company’s consolidated financial statements.
84
Table of Contents
NOTE 2 – RESTRICTIONS ON CASH AND AMOUNTS DUE FROM BANKS
Cash and cash equivalents as of December 31, 2017 and 2016 includes $25,218,000 and $23,450,000, respectively, which is subject to withdrawals and usage restrictions to satisfy the reserve requirements of the Federal Reserve Bank of Boston.
NOTE 3 – SECURITIES
Debt securities have been classified in the consolidated balance sheets according to management’s intent.
The following table presents a summary of the amortized cost, gross unrealized holding gains and losses and fair value of securities available for sale and securities held to maturity for the periods indicated. Gross unrealized holding gains and losses on available-for-sale securities are included in accumulated other comprehensive loss.
| December 31, 2017 | December 31, 2016 | |||||||||||||||||||||||||||||||
| Amortized | Gross | Gross | Amortized | Gross | Gross | |||||||||||||||||||||||||||
| Cost | Unrealized | Unrealized | Fair | Cost | Unrealized | Unrealized | Fair | |||||||||||||||||||||||||
| Basis | Gains | Losses | Value | Basis | Gains | Losses | Value | |||||||||||||||||||||||||
| Available for sale securities: |
||||||||||||||||||||||||||||||||
| Corporate debt securities |
$ | 16,975 | $ | 24 | $ | (78 | ) | $ | 16,921 | $ | 22,051 | $ | 147 | $ | (150 | ) | $ | 22,048 | ||||||||||||||
|
|
|
|
|
|
|
|
|
|
|
|
|
|
|
|
|
|||||||||||||||||
| $ | 16,975 | $ | 24 | $ | (78 | ) | $ | 16,921 | $ | 22,051 | $ | 147 | $ | (150 | ) | $ | 22,048 | |||||||||||||||
|
|
|
|
|
|
|
|
|
|
|
|
|
|
|
|
|
|||||||||||||||||
| Held to maturity securities: |
||||||||||||||||||||||||||||||||
| U.S. government sponsored mortgage-backed securities |
$ | 142,383 | $ | 145 | $ | (2,089 | ) | $ | 140,439 | $ | 112,543 | $ | 306 | $ | (1,289 | ) | $ | 111,560 | ||||||||||||||
| Corporate debt securities |
17,707 | 239 | — | 17,946 | 17,654 | 251 | — | 17,905 | ||||||||||||||||||||||||
|
|
|
|
|
|
|
|
|
|
|
|
|
|
|
|
|
|||||||||||||||||
| $ | 160,090 | $ | 384 | $ | (2,089 | ) | $ | 158,385 | $ | 130,197 | $ | 557 | $ | (1,289 | ) | $ | 129,465 | |||||||||||||||
|
|
|
|
|
|
|
|
|
|
|
|
|
|
|
|
|
|||||||||||||||||
The amortized cost and estimated fair value of debt securities by contractual maturity at December 31, 2017 is as follows. Expected maturities will differ from contractual maturities because issuers may have the right to call or prepay obligations with or without call or prepayment penalties.
| Available-for-Sale | Held-to-Maturity | |||||||||||||||
| Amortized | Fair | Amortized | Fair | |||||||||||||
| Cost Basis | Value | Cost Basis | Value | |||||||||||||
| Due within one year |
$ | 12,753 | $ | 12,777 | $ | 7,003 | $ | 7,019 | ||||||||
| Due after one year through five years |
4,222 | 4,144 | 12,747 | 12,918 | ||||||||||||
| Due after five years through ten years |
— | — | 32,640 | 32,143 | ||||||||||||
| Due after ten years |
— | — | 107,700 | 106,305 | ||||||||||||
|
|
|
|
|
|
|
|
|
|||||||||
| $ | 16,975 | $ | 16,921 | $ | 160,090 | $ | 158,385 | |||||||||
|
|
|
|
|
|
|
|
|
|||||||||
At December 31, 2017 and 2016, securities with a carrying value of $5,582,000 and $4,721,000, respectively, were pledged to secure securities sold under agreements to repurchase. Securities with a carrying value of $47,666,000 and $37,561,000 were pledged to secure borrowings with the Federal Home Loan Bank of Boston at December 31, 2017 and 2016, respectively, and securities with a carrying value of $15,780,000 and $15,739,000 were pledged to an available line of credit with the Federal Reserve Bank of Boston at December 31, 2017 and 2016, respectively.
During the year ended December 31, 2017 proceeds from the sale of securities available for sale amounted to $5,038,000, resulting in realized gains of $38,000. There were no sales of securities available for sale during the years ending December 31, 2016 and 2015.
In addition to the securities listed above, the Company holds investments in a Rabbi Trust that are used to fund the executive and director non-qualified deferred compensation plan.
85
Table of Contents
These investments are available to satisfy the claims of general creditors of the Company in the event of bankruptcy and are consolidated in our consolidated balance sheets in other assets and consisted primarily of cash and cash equivalents and mutual funds, and are classified as trading securities and recorded at fair value. The fair value of these investments at December 31, 2017 and December 31, 2016 was $2.8 million and $2.6 million, respectively. For the years ended December 31, 2017 and 2016, the net gain on these investments still held at the reporting date was $159,000 and $36,000, respectively. Refer to Note 15 – Employee Benefit Plans, for more information on the non-qualified deferred compensation plan.
Information pertaining to securities with gross unrealized losses at December 31, 2017 and 2016, aggregated by investment category and length of time that individual securities have been in a continuous loss position, follows:
| Less than 12 Months | 12 Months and Over | |||||||||||||||||||
| # of | Fair | Unrealized | Fair | Unrealized | ||||||||||||||||
| Holdings | Value | Losses | Value | Losses | ||||||||||||||||
| December 31, 2017: |
||||||||||||||||||||
|
Available-for-sale |
||||||||||||||||||||
| Corporate debt securities |
1 | $ | — | $ | — | $ | 4,144 | $ | (78 | ) | ||||||||||
|
Held-to-maturity |
||||||||||||||||||||
| U.S. government sponsored mortgage-backed securities |
81 | 64,056 | (718 | ) | 62,798 | (1,371 | ) | |||||||||||||
|
|
|
|
|
|
|
|
|
|
|
|||||||||||
| Total temporarily impaired securities |
82 | $ | 64,056 | $ | (718 | ) | $ | 66,942 | $ | (1,449 | ) | |||||||||
|
|
|
|
|
|
|
|
|
|
|
|||||||||||
| December 31, 2016: |
||||||||||||||||||||
|
Available-for-sale |
||||||||||||||||||||
| Corporate debt securities |
1 | $ | 4,130 | $ | (150 | ) | $ | — | $ | — | ||||||||||
|
Held-to-maturity |
||||||||||||||||||||
| U.S. government sponsored mortgage-backed securities |
57 | 77,474 | (1,097 | ) | 6,518 | (192 | ) | |||||||||||||
|
|
|
|
|
|
|
|
|
|
|
|||||||||||
| Total temporarily impaired securities |
58 | $ | 81,604 | $ | (1,247 | ) | $ | 6,518 | $ | (192 | ) | |||||||||
|
|
|
|
|
|
|
|
|
|
|
|||||||||||
Management evaluates securities for other-than-temporary impairment at least on a quarterly basis, and more frequently when economic or market concerns warrant such evaluation. When there are securities in an unrealized loss position, consideration is given to (1) the length of time and the extent to which the fair value has been less than cost, (2) the financial condition and near-term prospects of the issuer, and (3) the intent and ability of the Company to retain its investment in the issuer for a period of time sufficient to allow for any anticipated recovery in fair value.
At December 31, 2017, 82 debt securities had unrealized losses with aggregate depreciation of 1.63% from the Company’s amortized cost basis.
The Company’s unrealized losses on investments in corporate bonds and mortgage-backed securities are primarily caused by changes in market interest rates. The contractual terms of these investments do not permit the companies to settle the security at a price less than the par value of the investment. The Company currently does not believe it is probable that it will be unable to collect all amounts due according to the contractual terms of the investments. Therefore, it is expected that the securities would not be settled at a price less than the par value of the investment. Because the Company does not intend to sell the investments and it is more likely than not that the Company will not be required to sell the investments before recovery of their amortized cost basis, it does not consider these investments to be other-than-temporarily impaired at December 31, 2017.
86
Table of Contents
NOTE 4 – LOANS, ALLOWANCE FOR LOAN LOSSES AND CREDIT QUALITY
A summary of the balances of loans follows:
| December 31, | ||||||||
| 2017 | 2016 | |||||||
| Mortgage loans on real estate: |
||||||||
| Residential one-to-four family |
$ | 1,333,058 | $ | 997,336 | ||||
| Commercial real estate |
642,072 | 491,838 | ||||||
| Home equity lines of credit |
178,624 | 167,465 | ||||||
| Construction |
53,045 | 89,003 | ||||||
|
|
|
|
|
|||||
| Total real estate loans |
2,206,799 | 1,745,642 | ||||||
|
|
|
|
|
|||||
| Other loans: |
||||||||
| Commercial |
63,722 | 63,404 | ||||||
| Indirect auto |
30,227 | 60,240 | ||||||
| Consumer |
435 | 439 | ||||||
|
|
|
|
|
|||||
| 94,384 | 124,083 | |||||||
|
|
|
|
|
|||||
| Total loans |
2,301,183 | 1,869,725 | ||||||
| Net deferred loan costs |
3,426 | 3,622 | ||||||
| Net unamortized mortgage premiums |
8,661 | 6,273 | ||||||
| Allowance for loan losses |
(16,312 | ) | (13,585 | ) | ||||
|
|
|
|
|
|||||
| Total loans, net |
$ | 2,296,958 | $ | 1,866,035 | ||||
|
|
|
|
|
|||||
The following tables present the activity in the allowance for loan losses for the years ended December 31, 2017, 2016 and 2015 and the balances of the allowance for loan losses and recorded investment in loans by portfolio class based on impairment method at December 31, 2017 and 2016. The recorded investment in loans in any of the following tables does not include accrued and unpaid interest or any deferred loan fees or costs, as amounts are not significant.
| Year Ended December 31, 2017 | ||||||||||||||||||||
| Beginning Balance |
Provision (Benefit) |
Charge-offs | Recoveries | Ending Balance | ||||||||||||||||
| Residential one-to-four family |
$ | 4,828 | $ | 1,572 | $ | — | $ | — | $ | 6,400 | ||||||||||
| Commercial real estate |
4,885 | 1,698 | — | — | 6,583 | |||||||||||||||
| Construction |
1,219 | (455 | ) | — | — | 764 | ||||||||||||||
| Commercial |
728 | 30 | — | — | 758 | |||||||||||||||
| Home equity lines of credit |
1,037 | (90 | ) | — | — | 947 | ||||||||||||||
| Indirect auto |
362 | (109 | ) | (45 | ) | 22 | 230 | |||||||||||||
| Consumer |
9 | 12 | (14 | ) | 2 | 9 | ||||||||||||||
| Unallocated |
517 | 104 | — | — | 621 | |||||||||||||||
|
|
|
|
|
|
|
|
|
|
|
|||||||||||
| Total |
$ | 13,585 | $ | 2,762 | $ | (59 | ) | $ | 24 | $ | 16,312 | |||||||||
|
|
|
|
|
|
|
|
|
|
|
|||||||||||
87
Table of Contents
| Year Ended December 31, 2016 | ||||||||||||||||||||
| Beginning Balance |
Provision (Benefit) |
Charge-offs | Recoveries | Ending Balance | ||||||||||||||||
| Residential one-to-four family |
$ | 3,574 | $ | 1,254 | $ | — | $ | — | $ | 4,828 | ||||||||||
| Commercial real estate |
4,478 | 407 | — | — | 4,885 | |||||||||||||||
| Construction |
801 | 418 | — | — | 1,219 | |||||||||||||||
| Commercial |
613 | 115 | — | — | 728 | |||||||||||||||
| Home equity lines of credit |
928 | 109 | — | — | 1,037 | |||||||||||||||
| Indirect auto |
623 | (232 | ) | (85 | ) | 56 | 362 | |||||||||||||
| Consumer |
10 | 10 | (16 | ) | 5 | 9 | ||||||||||||||
| Unallocated |
213 | 304 | — | — | 517 | |||||||||||||||
|
|
|
|
|
|
|
|
|
|
|
|||||||||||
| Total |
$ | 11,240 | $ | 2,385 | $ | (101 | ) | $ | 61 | $ | 13,585 | |||||||||
|
|
|
|
|
|
|
|
|
|
|
|||||||||||
| Year Ended December 31, 2015 | ||||||||||||||||||||
| Beginning Balance |
Provision (Benefit) |
Charge-offs | Recoveries | Ending Balance | ||||||||||||||||
| Residential one-to-four family |
$ | 2,364 | $ | 1,274 | $ | (64 | ) | $ | — | $ | 3,574 | |||||||||
| Commercial real estate |
4,043 | 435 | — | — | 4,478 | |||||||||||||||
| Construction |
228 | 573 | — | — | 801 | |||||||||||||||
| Commercial |
458 | 131 | — | 24 | 613 | |||||||||||||||
| Home equity lines of credit |
828 | (99 | ) | — | 199 | 928 | ||||||||||||||
| Indirect auto |
778 | (48 | ) | (139 | ) | 32 | 623 | |||||||||||||
| Consumer |
11 | 9 | (16 | ) | 6 | 10 | ||||||||||||||
| Unallocated |
171 | 42 | — | — | 213 | |||||||||||||||
|
|
|
|
|
|
|
|
|
|
|
|||||||||||
| Total |
$ | 8,881 | $ | 2,317 | $ | (219 | ) | $ | 261 | $ | 11,240 | |||||||||
|
|
|
|
|
|
|
|
|
|
|
|||||||||||
88
Table of Contents
| Year Ended December 31, 2017 | ||||||||||||||||||||||||
| Individually evaluated for impairment | Collectively evaluated for impairment | Total | ||||||||||||||||||||||
| Loan Balance | Allowance | Loan Balance | Allowance | Loan Balance | Allowance | |||||||||||||||||||
| Residential one-to-four family |
$ | 2,688 | $ | 147 | $ | 1,330,370 | $ | 6,253 | $ | 1,333,058 | $ | 6,400 | ||||||||||||
| Commercial real estate |
2,877 | — | 639,195 | 6,583 | 642,072 | 6,583 | ||||||||||||||||||
| Construction |
— | — | 53,045 | 764 | 53,045 | 764 | ||||||||||||||||||
| Commercial |
— | — | 63,722 | 758 | 63,722 | 758 | ||||||||||||||||||
| Home equity lines of credit |
— | — | 178,624 | 947 | 178,624 | 947 | ||||||||||||||||||
| Indirect auto |
4 | — | 30,223 | 230 | 30,227 | 230 | ||||||||||||||||||
| Consumer |
— | — | 435 | 9 | 435 | 9 | ||||||||||||||||||
| Unallocated |
— | — | — | 621 | — | 621 | ||||||||||||||||||
|
|
|
|
|
|
|
|
|
|
|
|
|
|||||||||||||
| Total |
$ | 5,569 | $ | 147 | $ | 2,295,614 | $ | 16,165 | $ | 2,301,183 | $ | 16,312 | ||||||||||||
|
|
|
|
|
|
|
|
|
|
|
|
|
|||||||||||||
| Year Ended December 31, 2016 | ||||||||||||||||||||||||
| Individually evaluated for impairment | Collectively evaluated for impairment | Total | ||||||||||||||||||||||
| Loan Balance | Allowance | Loan Balance | Allowance | Loan Balance | Allowance | |||||||||||||||||||
| Residential one-to-four family |
$ | 2,896 | $ | 154 | $ | 994,440 | $ | 4,674 | $ | 997,336 | $ | 4,828 | ||||||||||||
| Commercial real estate |
3,364 | — | 488,474 | 4,885 | 491,838 | 4,885 | ||||||||||||||||||
| Construction |
— | — | 89,003 | 1,219 | 89,003 | 1,219 | ||||||||||||||||||
| Commercial |
— | — | 63,404 | 728 | 63,404 | 728 | ||||||||||||||||||
| Home equity lines of credit |
200 | — | 167,265 | 1,037 | 167,465 | 1,037 | ||||||||||||||||||
| Indirect auto |
15 | — | 60,225 | 362 | 60,240 | 362 | ||||||||||||||||||
| Consumer |
— | — | 439 | 9 | 439 | 9 | ||||||||||||||||||
| Unallocated |
— | — | — | 517 | — | 517 | ||||||||||||||||||
|
|
|
|
|
|
|
|
|
|
|
|
|
|||||||||||||
| Total |
$ | 6,475 | $ | 154 | $ | 1,863,250 | $ | 13,431 | $ | 1,869,725 | $ | 13,585 | ||||||||||||
|
|
|
|
|
|
|
|
|
|
|
|
|
|||||||||||||
Information about loans that meet the definition of an impaired loan in ASC 310-10-35 is as follows as of December 31, 2017 and 2016:
| Impaired loans with a related allowance for credit losses at December 31, 2017 | ||||||||||||
| Unpaid | Related | |||||||||||
| Recorded | Principal | Allowance For | ||||||||||
| Investment | Balance | Credit Losses | ||||||||||
| Residential one-to-four family |
$ | 725 | $ | 725 | $ | 147 | ||||||
|
|
|
|
|
|
|
|||||||
| Totals |
$ | 725 | $ | 725 | $ | 147 | ||||||
|
|
|
|
|
|
|
|||||||
| Impaired loans with no related allowance for credit losses at December 31, 2017 | ||||||||||||
| Unpaid | Related | |||||||||||
| Recorded | Principal | Allowance For | ||||||||||
| Investment | Balance | Credit Losses | ||||||||||
| Residential one-to-four family |
$ | 1,963 | $ | 2,052 | $ | — | ||||||
| Commercial real estate |
2,877 | 2,877 | — | |||||||||
| Indirect auto |
4 | 4 | — | |||||||||
|
|
|
|
|
|
|
|||||||
| Totals |
$ | 4,844 | $ | 4,933 | $ | — | ||||||
|
|
|
|
|
|
|
|||||||
89
Table of Contents
| Impaired loans with a related allowance for credit losses at December 31, 2016 | ||||||||||||
| Unpaid | Related | |||||||||||
| Recorded | Principal | Allowance For | ||||||||||
| Investment | Balance | Credit Losses | ||||||||||
| Residential one-to-four family |
$ | 740 | $ | 740 | $ | 154 | ||||||
|
|
|
|
|
|
|
|||||||
| Totals |
$ | 740 | $ | 740 | $ | 154 | ||||||
|
|
|
|
|
|
|
|||||||
| Impaired loans with no related allowance for credit losses at December 31, 2016 | ||||||||||||
| Unpaid | Related | |||||||||||
| Recorded | Principal | Allowance For | ||||||||||
| Investment | Balance | Credit Losses | ||||||||||
| Residential one-to-four family |
$ | 2,156 | $ | 2,278 | $ | — | ||||||
| Commercial real estate |
3,364 | 3,364 | — | |||||||||
| Home equity lines of credit |
200 | 200 | — | |||||||||
| Indirect auto |
15 | 15 | — | |||||||||
|
|
|
|
|
|
|
|||||||
| Totals |
$ | 5,735 | $ | 5,857 | $ | — | ||||||
|
|
|
|
|
|
|
|||||||
The following tables set forth information regarding interest income recognized on impaired loans, by portfolio, for the periods indicated.
| Year Ended December 31, 2017 | Year Ended December 31, 2016 | Year Ended December 31, 2015 | ||||||||||||||||||||||
| Average | Interest | Average | Interest | Average | Interest | |||||||||||||||||||
| Recorded | Income | Recorded | Income | Recorded | Income | |||||||||||||||||||
| With an allowance recorded |
Investment | Recognized | Investment | Recognized | Investment | Recognized | ||||||||||||||||||
| Residential one-to-four family |
$ | 897 | $ | 32 | $ | 1,273 | $ | 33 | $ | 1,265 | $ | 33 | ||||||||||||
| Commercial real estate |
— | — | 3,124 | 136 | 3,230 | 123 | ||||||||||||||||||
|
|
|
|
|
|
|
|
|
|
|
|
|
|||||||||||||
| Totals |
$ | 897 | $ | 32 | $ | 4,397 | $ | 169 | $ | 4,495 | $ | 156 | ||||||||||||
|
|
|
|
|
|
|
|
|
|
|
|
|
|||||||||||||
| Year Ended December 31, 2017 | Year Ended December 31, 2016 | Year Ended December 31, 2015 | ||||||||||||||||||||||
| Average | Interest | Average | Interest | Average | Interest | |||||||||||||||||||
| Recorded | Income | Recorded | Income | Recorded | Income | |||||||||||||||||||
| Without an allowance recorded |
Investment | Recognized | Investment | Recognized | Investment | Recognized | ||||||||||||||||||
| Residential one-to-four family |
$ | 1,986 | $ | 94 | $ | 2,977 | $ | 78 | $ | 4,296 | $ | 95 | ||||||||||||
| Commercial real estate |
3,159 | 140 | 784 | 34 | 744 | 30 | ||||||||||||||||||
| Home equity lines of credit |
106 | 13 | 200 | 8 | 286 | 8 | ||||||||||||||||||
| Indirect auto |
6 | — | 12 | — | 8 | — | ||||||||||||||||||
|
|
|
|
|
|
|
|
|
|
|
|
|
|||||||||||||
| Totals |
$ | 5,257 | $ | 247 | $ | 3,973 | $ | 120 | $ | 5,334 | $ | 133 | ||||||||||||
|
|
|
|
|
|
|
|
|
|
|
|
|
|||||||||||||
At December 31, 2017, there were no additional funds committed to be advanced in connection with loans to borrowers with impaired loans.
90
Table of Contents
The following is a summary of past due and non-accrual loans at December 31, 2017 and 2016:
| December 31, 2017 | ||||||||||||||||||||||||
| 30–59 Days | 60–89 Days | 90 Days or More |
Total Past Due |
90 days or more and accruing |
Loans on Non-accrual |
|||||||||||||||||||
| Real estate loans: |
||||||||||||||||||||||||
| Residential one-to-four family |
$ | 711 | $ | — | $ | 260 | $ | 971 | $ | — | $ | 1,372 | ||||||||||||
| Home equity lines of credit |
716 | — | — | 716 | — | — | ||||||||||||||||||
| Other loans: |
||||||||||||||||||||||||
| Indirect auto |
347 | 30 | 4 | 381 | — | 4 | ||||||||||||||||||
|
|
|
|
|
|
|
|
|
|
|
|
|
|||||||||||||
| $ | 1,774 | $ | 30 | $ | 264 | $ | 2,068 | $ | — | $ | 1,376 | |||||||||||||
|
|
|
|
|
|
|
|
|
|
|
|
|
|||||||||||||
| December 31, 2016 | ||||||||||||||||||||||||
| 30–59 Days | 60–89 Days | 90 Days or More |
Total Past Due |
90 days or more and accruing |
Loans on Non-accrual |
|||||||||||||||||||
| Real estate loans: |
||||||||||||||||||||||||
| Residential one-to-four family |
$ | — | $ | — | $ | 497 | $ | 497 | $ | — | $ | 1,804 | ||||||||||||
| Home equity lines of credit |
57 | 486 | — | 543 | — | — | ||||||||||||||||||
| Other loans: |
||||||||||||||||||||||||
| Indirect auto |
460 | 106 | 15 | 581 | — | 15 | ||||||||||||||||||
|
|
|
|
|
|
|
|
|
|
|
|
|
|||||||||||||
| $ | 517 | $ | 592 | $ | 512 | $ | 1,621 | $ | — | $ | 1,819 | |||||||||||||
|
|
|
|
|
|
|
|
|
|
|
|
|
|||||||||||||
Credit Quality Information
The Company utilizes a nine grade internal loan rating system for commercial, commercial real estate and construction loans, and a five grade internal loan rating system for certain residential real estate, home equity and consumer loans that are rated if the loans become delinquent.
Loans rated 1, 2, 2.5, 3 and 3.5: Loans in these categories are considered “pass” rated loans with low to average risk.
Loans rated 4: Loans in this category are considered “special mention.” These loans are starting to show signs of potential weakness and are being closely monitored by management.
Loans rated 5: Loans in this category are considered “substandard.” Generally, a loan is considered substandard if it is inadequately protected by the current net worth and paying capacity of the obligors and/or the collateral pledged. There is a distinct possibility that the Company will sustain some loss if the weakness is not corrected.
Loans rated 6: Loans in this category are considered “doubtful.” Loans classified as doubtful have all the weaknesses inherent in those classified substandard with the added characteristic that the weaknesses make collection or liquidation in full, on the basis of currently existing facts, highly questionable and improbable.
Loans rated 7: Loans in this category are considered uncollectible (“loss”) and of such little value that their continuance as loans is not warranted.
On an annual basis, or more often if needed, the Company formally reviews the ratings on all commercial, commercial real estate, and construction loans. On an annual basis, the Company engages an independent third party to review a significant portion of loans within these segments and to assess the credit risk management practices of its commercial lending department. Management uses the results of these reviews as part of its annual review process and overall credit risk administration.
On a quarterly basis, the Company formally reviews the ratings on all residential real estate and home equity loans if they have become delinquent. Criteria used to determine ratings consist of loan-to-value ratios and days delinquent.
The following table presents the Company’s loans by risk rating at December 31, 2017 and 2016. There were no loans rated as 6 (“doubtful”) or 7 (“loss”) at the dates indicated.
91
Table of Contents
| December 31, 2017 | ||||||||||||||||||||
| Loans rated 1-3.5 | Loans rated 4 | Loans rated 5 | Loans not rated (A) | Total | ||||||||||||||||
| Residential one-to-four family |
$ | — | $ | 344 | $ | 2,060 | $ | 1,330,654 | $ | 1,333,058 | ||||||||||
| Commercial real estate |
638,254 | — | 3,818 | — | 642,072 | |||||||||||||||
| Construction |
53,045 | — | — | — | 53,045 | |||||||||||||||
| Commercial |
63,682 | 40 | — | — | 63,722 | |||||||||||||||
| Home equity lines of credit |
— | — | 772 | 177,852 | 178,624 | |||||||||||||||
| Indirect auto |
— | — | — | 30,227 | 30,227 | |||||||||||||||
| Consumer |
— | — | — | 435 | 435 | |||||||||||||||
|
|
|
|
|
|
|
|
|
|
|
|||||||||||
| Total |
$ | 754,981 | $ | 384 | $ | 6,650 | $ | 1,539,168 | $ | 2,301,183 | ||||||||||
|
|
|
|
|
|
|
|
|
|
|
|||||||||||
| December 31, 2016 | ||||||||||||||||||||
| Loans rated 1-3.5 | Loans rated 4 | Loans rated 5 | Loans not rated (A) | Total | ||||||||||||||||
| Residential one-to-four family |
$ | — | $ | 351 | $ | 2,509 | $ | 994,476 | $ | 997,336 | ||||||||||
| Commercial real estate |
471,491 | 16,032 | 4,315 | — | 491,838 | |||||||||||||||
| Construction |
89,003 | — | — | — | 89,003 | |||||||||||||||
| Commercial |
63,404 | — | — | — | 63,404 | |||||||||||||||
| Home equity lines of credit |
— | — | 799 | 166,666 | 167,465 | |||||||||||||||
| Indirect auto |
— | — | — | 60,240 | 60,240 | |||||||||||||||
| Consumer |
— | — | — | 439 | 439 | |||||||||||||||
|
|
|
|
|
|
|
|
|
|
|
|||||||||||
| Total |
$ | 623,898 | $ | 16,383 | $ | 7,623 | $ | 1,221,821 | $ | 1,869,725 | ||||||||||
|
|
|
|
|
|
|
|
|
|
|
|||||||||||
| (A) | Residential one-to-four family, home equity lines of credit, indirect auto and consumer loans are not formally risk rated by the Company unless the loans become delinquent. |
The Company periodically modifies loans to extend the term or make other concessions to help a borrower stay current on their loan and to avoid foreclosure. The Company generally does not forgive principal or interest on loans or modify the interest rates on loans to those not otherwise available in the market. During the year ended December 31, 2017, no loans were modified and determined to be TDRs and one existing TDR was modified again to extend the maturity. During the year ended December 31, 2016, four loans were modified and determined to be TDRs (three of which had previously been restructured and determined to be TDRs).
The following table shows the Company’s total TDRs and other pertinent information as of the dates indicated:
| December 31, 2017 | December 31, 2016 | |||||||
| TDRs on Accrual Status |
$ | 4,194 | $ | 4,656 | ||||
| TDRs on Non-accrual Status |
645 | 1,442 | ||||||
|
|
|
|
|
|||||
| Total TDRs |
$ | 4,839 | $ | 6,098 | ||||
|
|
|
|
|
|||||
| Amount of specific allocation included in the allowance for loan losses associated with TDRs |
$ | 147 | $ | 154 | ||||
| Additional commitments to lend to a borrower who has been a party to a TDR |
$ | — | $ | — | ||||
92
Table of Contents
The following table shows the TDR modifications which occurred during the the years ended December 31, 2017 and 2016 and the outstanding recorded investment subsequent to the modifications occurring:
| Year Ended December 31, 2017 |
||||||||||||
| Pre-modification | Post-modification | |||||||||||
| # of | outstanding | outstanding | ||||||||||
| Contracts | recorded investment | recorded investment (a) | ||||||||||
| Real estate loans: |
||||||||||||
| Commercial real estate |
1 | $ | 273 | $ | 273 | |||||||
|
|
|
|
|
|
|
|||||||
| 1 | $ | 273 | $ | 273 | ||||||||
|
|
|
|
|
|
|
|||||||
| Year Ended December 31, 2016 |
||||||||||||
| Pre-modification | Post-modification | |||||||||||
| # of | outstanding | outstanding | ||||||||||
| Contracts | recorded investment | recorded investment (a) | ||||||||||
| Real estate loans: |
||||||||||||
| Residential one-to-four family |
1 | $ | 621 | $ | 699 | |||||||
| Commercial real estate |
3 | 3,394 | 3,394 | |||||||||
|
|
|
|
|
|
|
|||||||
| 4 | $ | 4,015 | $ | 4,093 | ||||||||
|
|
|
|
|
|
|
|||||||
| (a) | The post-modification balances represent the balance of the loan on the date of modifications. These amounts may show an increase when modifications include a capitalization of interest or taxes. |
The following table shows the Company’s post-modification balance of TDRs listed by type of modification during the years indicated:
| For the years ended | ||||||||
| December 31, 2017 | December 31, 2016 | |||||||
| Capitalization of interest, taxes and extended maturity |
$ | — | $ | 699 | ||||
| Extended maturity |
273 | 3,394 | ||||||
|
|
|
|
|
|||||
| Total |
$ | 273 | $ | 4,093 | ||||
|
|
|
|
|
|||||
For purposes of this table the Company generally considers a loan to have defaulted when it reaches 90 days past due. The following table shows the loans that have been modified during the past twelve months which have subsequently defaulted during the periods indicated:
| For the years ended December 31, | ||||||||||||||||||||||||
| 2017 | 2016 | 2015 | ||||||||||||||||||||||
| Number | Recorded | Number | Recorded | Number | Recorded | |||||||||||||||||||
| of Contracts | Investment | of Contracts | Investment | of Contracts | Investment | |||||||||||||||||||
| TDRs that subsequently defaulted |
||||||||||||||||||||||||
| Residential one-to-four family |
— | $ | — | 1 | $ | 497 | — | $ | — | |||||||||||||||
|
|
|
|
|
|
|
|
|
|
|
|
|
|||||||||||||
| Totals |
— | $ | — | 1 | $ | 497 | — | $ | — | |||||||||||||||
|
|
|
|
|
|
|
|
|
|
|
|
|
|||||||||||||
Foreclosure Proceedings
Consumer mortgage loans collateralized by residential real estate property that are in the process of foreclosure totaled $0 and $497,000 as of December 31, 2017 and December 31, 2016, respectively. The Company did not have any foreclosed residential real estate property held as of December 31, 2017 or December 31, 2016.
Pledged Loans
At December 31, 2017 and 2016, $1.4 billion and $1.1 billion in loans, respectively, were pledged to secure FHLB advances.
93
Table of Contents
NOTE 5 – TRANSFERS AND SERVICING
Certain residential mortgage loans are periodically sold by the Company to the secondary market. Generally, these loans are sold without recourse or other credit enhancements. The Company sells loans and both releases and retains the servicing rights. For loans sold with servicing rights retained, the Company provides the servicing for the loans on a per-loan fee basis. The Company also periodically sells auto loans to other financial institutions without recourse or other credit enhancements and the Company generally provides servicing for these loans. Mortgage loans sold for cash during the years ended December 31, 2017, 2016 and 2015 were $70.5 million, $11.4 million and $19.1 million, respectively, with net gains recognized in non-interest income of $936,000, $271,000 and $367,000, respectively. No auto loans were sold for cash during the years ended December 31, 2017 and 2016. Auto loans sold for cash during the year ended December 31, 2015 were $3.5 million, respectively, with net gains recognized in non-interest income of $28,000. At December 31, 2017 and 2016, residential mortgage loans previously sold and serviced by the Company were $114.5 million and $59.8 million, respectively. At December 31, 2017 and 2016, auto loans previously sold and serviced by the Company were $10.5 million and $28.2 million, respectively. There were no liabilities incurred during the years ended December 31, 2017 and 2016 in connection with these loan sales.
On March 16, 2006, seventeen loans with an aggregate principal balance of $10.5 million were sold to another financial institution. The agreement related to this sale contained provisions requiring the Company to repurchase any loan that became 90 days past due during the initial 120 months. The Company would repurchase the past due loan for 100 percent of the unpaid principal plus interest to repurchase date. During the twelve months ended December 31, 2016, the recourse provision expired and both the loans and recourse obligation were derecognized from the consolidated balance sheet. As of December 31, 2017 and 2016, the Company’s recorded balance of these loans sold with recourse amounted to $0. The Company did not incur any losses related to these loans.
Changes in mortgage servicing rights, which are included in other assets, were as follows:
| Years Ended December 31, | ||||||||||||
| 2017 | 2016 | 2015 | ||||||||||
| Balance at beginning of period |
$ | 403 | $ | 479 | $ | 476 | ||||||
| Capitalization |
508 | 85 | 99 | |||||||||
| Amortization |
(130 | ) | (101 | ) | (93 | ) | ||||||
| Valuation allowance adjustment |
74 | (60 | ) | (3 | ) | |||||||
|
|
|
|
|
|
|
|||||||
| Balance at end of period |
$ | 855 | $ | 403 | $ | 479 | ||||||
|
|
|
|
|
|
|
|||||||
As of December 31, 2017 and 2016, the fair value of mortgage servicing rights approximated carrying value.
NOTE 6 – PREMISES AND EQUIPMENT
A summary of the cost and accumulated depreciation of premises and equipment follows:
| December 31, | ||||||||
| 2017 | 2016 | |||||||
| Land |
$ | 161 | $ | 161 | ||||
| Buildings |
3,516 | 3,424 | ||||||
| Leasehold improvements |
1,414 | 1,399 | ||||||
| Furniture and equipment |
4,350 | 3,979 | ||||||
|
|
|
|
|
|||||
| 9,441 | 8,963 | |||||||
| Accumulated depreciation |
(7,187 | ) | (6,608 | ) | ||||
|
|
|
|
|
|||||
| $ | 2,254 | $ | 2,355 | |||||
|
|
|
|
|
|||||
Depreciation and amortization expense for the years ended December 31, 2017, 2016 and 2015 amounted to $595,000, $621,000 and $726,000, respectively. During the years ended December 31, 2017, 2016 and 2015, the Company determined that certain assets had no future economic benefit to the Company and recorded impairment charges of $18,000, $16,000, and $6,000, respectively, within equipment expense on the consolidated statements of operations.
94
Table of Contents
During the year ended December 31, 2016, assets with a cost of $3.5 million that were fully depreciated and no longer in use were disposed of. No gain or loss was recognized as a result of this disposal.
NOTE 7 – DEPOSITS
The aggregate amount of time deposits in denominations that meet or exceed the FDIC insurance limit of $250,000 at December 31, 2017 and 2016 was $128.7 million and $74.4 million, respectively.
At December 31, 2017, the scheduled maturities of time deposits are as follows:
| 2018 |
$ | 226,910 | ||
| 2019 |
94,797 | |||
| 2020 |
129,044 | |||
| 2021 |
42,587 | |||
| 2022 |
11,376 | |||
|
|
|
|||
| $ | 504,714 | |||
|
|
|
Included in time deposits are brokered deposits of $247.2 million at December 31, 2017 and $156.4 million at December 31, 2016.
The amounts of overdraft deposits that were reclassified to loans at December 31, 2017 and 2016 were $48,000 and $36,000, respectively.
Related Party Deposits
Deposit accounts of directors, executive officers and their affiliates totaled $8.5 million and $11.0 million at December 31, 2017 and 2016, respectively.
Secured Deposits
The Bank has an Irrevocable Letter of Credit Reimbursement Agreement with the FHLB, whereby upon the Bank’s request, an irrevocable letter of credit is issued to secure public unit deposit accounts. These letters of credit are secured by a blanket security agreement on qualified collateral, principally mortgage loans, home equity lines of credit, commercial loans and U.S. government sponsored mortgage-backed securities in an aggregate amount equal to outstanding letters of credit. The amount of funds available to the Bank through the FHLB is reduced by any letters of credit outstanding. At December 31, 2017 and 2016, there were $5.0 million and $0 letters of credit outstanding.
NOTE 8 – SHORT-TERM BORROWINGS
Federal Home Loan Bank Advances
Fixed rate FHLB advances with an original maturity of less than one year, amounted to $305.9 million and $131.6 million at December 31, 2017 and 2016, respectively, at a weighted average rate of 1.52% and 0.79%, respectively. The Bank also has an available line of credit with the FHLB in the amount of $5.6 million at December 31, 2017 and 2016 at an interest rate that adjusts daily. All borrowings from the FHLB are secured by a blanket security agreement on qualified collateral, principally mortgage loans, home equity lines of credit, commercial loans and U.S. government sponsored mortgage-backed securities in an aggregate amount equal to outstanding advances. The Bank’s unused remaining available borrowing capacity at the FHLB was approximately $279.2 million and $289.7 million at December 31, 2017 and 2016, respectively. At December 31, 2017 and 2016, the Bank had sufficient collateral at the FHLB to support its obligations and was in compliance with the FHLB’s collateral pledging program.
Securities Sold Under Agreements to Repurchase
Securities sold under agreements to repurchase amounted to $3.3 million and $2.0 million at December 31, 2017 and 2016, respectively, mature on a daily basis and are secured by U.S. government sponsored mortgage-backed securities. The weighted average interest rate on these agreements was 0.15% at December 31, 2017 and 2016.
95
Table of Contents
The obligations to repurchase the securities sold are reflected as a liability in the consolidated balance sheets. The dollar amounts of the securities underlying the agreements remain in the asset accounts. The repurchase agreements stipulate that the securities are not delivered to the customer and instead are held in segregated safekeeping accounts maintained by the Company’s safekeeping agent.
NOTE 9 – LONG-TERM BORROWINGS
Long-term debt at December 31, 2017 and 2016 consists of the following fixed rate FHLB advances:
| Amount | Weighted Average Rate | |||||||||||||||
| 2017 | 2016 | 2017 | 2016 | |||||||||||||
| Fixed rate advances maturing: |
||||||||||||||||
| 2017 |
$ | — | $ | 35,000 | — | % | 1.14 | % | ||||||||
| 2018 |
47,000 | 47,000 | 1.63 | % | 1.63 | % | ||||||||||
| 2019 |
225,250 | 225,250 | 1.49 | % | 1.49 | % | ||||||||||
| 2020 |
35,000 | 20,000 | 1.76 | % | 1.75 | % | ||||||||||
| 2021 |
15,000 | — | 2.03 | % | — | % | ||||||||||
| 2022 |
95,000 | — | 2.17 | % | — | % | ||||||||||
| 2031 |
— | 50,000 | — | % | 0.39 | % | ||||||||||
|
|
|
|
|
|||||||||||||
| $ | 417,250 | $ | 377,250 | 1.70 | % | 1.34 | % | |||||||||
|
|
|
|
|
|||||||||||||
Included in the advances above at December 31, 2016 was a long-term advance in the amount of $50.0 million with an interest rate of 0.39% which was callable by the FHLB on September 12, 2017. The advance was called on September 12, 2017.
NOTE 10 – INCOME TAXES
Allocation of federal and state income taxes between current and deferred portions is as follows:
| Years Ended December 31, | ||||||||||||
| 2017 | 2016 | 2015 | ||||||||||
| Current tax provision: |
||||||||||||
| Federal |
$ | 7,386 | $ | 7,212 | $ | 4,223 | ||||||
| State |
1,961 | 1,954 | 1,120 | |||||||||
|
|
|
|
|
|
|
|||||||
| 9,347 | 9,166 | 5,343 | ||||||||||
|
|
|
|
|
|
|
|||||||
| Deferred tax expense (benefit): |
||||||||||||
| Federal |
(71 | ) | (1,391 | ) | (799 | ) | ||||||
| State |
(20 | ) | (350 | ) | (222 | ) | ||||||
| Effect of change in statutory federal tax rate |
2,626 | — | — | |||||||||
|
|
|
|
|
|
|
|||||||
| 2,535 | (1,741 | ) | (1,021 | ) | ||||||||
|
|
|
|
|
|
|
|||||||
| Total provision for income taxes |
$ | 11,882 | $ | 7,425 | $ | 4,322 | ||||||
|
|
|
|
|
|
|
|||||||
96
Table of Contents
The reasons for the differences between the statutory federal income tax rate and the effective tax rates are summarized as follows:
| Years Ended December 31, | ||||||||||||
| 2017 | 2016 | 2015 | ||||||||||
| Statutory federal tax rate |
35.0 | % | 35.0 | % | 34.0 | % | ||||||
| Increase (decrease) resulting from: |
||||||||||||
| State taxes, net of federal tax benefit |
4.8 | 5.4 | 5.3 | |||||||||
| Bank-owned life insurance |
(1.5 | ) | (1.9 | ) | (2.7 | ) | ||||||
| Tax exempt income |
(0.6 | ) | (0.8 | ) | (0.3 | ) | ||||||
| Change in statutory federal tax rate |
10.0 | — | — | |||||||||
| Share based compensation |
(3.5 | ) | 1.2 | 1.9 | ||||||||
| Other, net |
1.0 | (0.6 | ) | 0.3 | ||||||||
|
|
|
|
|
|
|
|||||||
| Effective tax rates |
45.2 | % | 38.3 | % | 38.5 | % | ||||||
|
|
|
|
|
|
|
|||||||
The components of the net deferred tax asset are as follows:
| December 31, | ||||||||
| 2017 | 2016 | |||||||
| Deferred tax assets: |
||||||||
| Employee benefit and deferred compensation plans |
$ | 2,375 | $ | 3,827 | ||||
| Allowance for loan losses |
4,596 | 5,577 | ||||||
| Accrued rent |
8 | 10 | ||||||
| Interest on non-performing loans |
34 | 50 | ||||||
| Stock options |
356 | 547 | ||||||
| Unrealized loss on securities available for sale |
15 | 1 | ||||||
| ESOP |
92 | 116 | ||||||
|
|
|
|
|
|||||
| Gross deferred tax assets |
7,476 | 10,128 | ||||||
|
|
|
|
|
|||||
| Deferred tax liabilities: |
||||||||
| Mortgage servicing rights |
(240 | ) | (164 | ) | ||||
| Deferred loan origination costs |
(860 | ) | (1,104 | ) | ||||
| Restricted stock awards |
(280 | ) | (140 | ) | ||||
| Depreciation |
(201 | ) | (305 | ) | ||||
| Unrecognized retirement benefit |
(58 | ) | (72 | ) | ||||
| Other |
(43 | ) | (22 | ) | ||||
|
|
|
|
|
|||||
| Gross deferred tax liabilities |
(1,682 | ) | (1,807 | ) | ||||
|
|
|
|
|
|||||
| Net deferred tax asset |
$ | 5,794 | $ | 8,321 | ||||
|
|
|
|
|
|||||
The Company does not have any uncertain tax positions at December 31, 2017 or 2016 which require accrual or disclosure. The Company records interest and penalties as part of income tax expense. No interest or penalties were recorded for the years ended December 31, 2017, 2016 and 2015.
The Company’s income tax returns are subject to review and examination by federal and state taxing authorities. The Company is currently open to audit under the applicable statutes of limitations by the Internal Revenue Service for the years ended December 31, 2014 through 2017. The years open to examination by state taxing authorities vary by jurisdiction; no years prior to 2014 are open.
97
Table of Contents
In prior years, the Company was allowed a special tax-basis bad debt deduction under certain provisions of the Internal Revenue Code. As a result, retained earnings of the Company as of December 31, 2017 and 2016 includes approximately $3.6 million for which federal and state income taxes have not been provided. If the Company no longer qualifies as a bank as defined in certain provisions of the Internal Revenue Code, this amount will be subject to recapture in taxable income ratably over four (4) years, subject to a combined federal and state tax rate of approximately 28%.
The Tax Cuts and Jobs Act. The Tax Cuts and Jobs Act was enacted on December 22, 2017. Among other things, the new law (i) establishes a new, flat corporate federal statutory income tax rate of 21%, (ii) eliminates the corporate alternative minimum tax and allows the use of any such carryforwards to offset regular tax liability for any taxable year, (iii) limits the deduction for net interest expense incurred by U.S. corporations, (iv) allows businesses to immediately expense, for tax purposes, the cost of new investments in certain qualified depreciable assets, (v) eliminates or reduces certain deductions related to meals and entertainment expenses, (vi) modifies the limitation on excessive employee remuneration to eliminate the exception for performance-based compensation and clarifies the definition of a covered employee and (vii) limits the deductibility of deposit insurance premiums. The Tax Cuts and Jobs Act also significantly changes U.S. tax law related to foreign operations, however, such changes do not currently impact us. As stated above, as a result of the enactment of the Tax Cuts and Jobs Act on December 22, 2017, the Company remeasured its deferred tax assets and liabilities based upon the newly enacted U.S. statutory federal income tax rate of 21%, which is the tax rate at which these assets and liabilities are expected to reverse in the future. As a result, the Company recorded a one-time charge of $2.63 million, recorded within income tax expense.
NOTE 11 – OFF-BALANCE SHEET ARRANGEMENTS
Credit-Related Financial Instruments
The Company is a party to credit related financial instruments with off-balance sheet risk in the normal course of business to meet the financing needs of its customers. These financial instruments include commitments to grant and purchase loans, commitments under lines of credit, commitments under construction loans and standby letters of credit. Such commitments involve, to varying degrees, elements of credit and interest rate risk in excess of the amount recognized in the consolidated balance sheets. The Company minimizes its exposure to loss under these commitments by subjecting them to credit approval and monitoring procedures.
The Company’s exposure to credit loss is represented by the contractual amount of these commitments. The Company follows the same credit policies in making commitments as it does for on-balance sheet financial instruments.
At December 31, 2017 and 2016, the following financial instruments were outstanding whose contract amounts represent credit risk:
| Contract Amount | ||||||||
| 2017 | 2016 | |||||||
| Commitments to grant loans |
$ | 23,702 | $ | 44,677 | ||||
| Unfunded commitments under lines of credit |
325,768 | 259,124 | ||||||
| Unadvanced portion of construction loans |
11,486 | 36,555 | ||||||
| Standby letters of credit |
561 | 658 | ||||||
| Commitments to purchase loans |
65,692 | 62,036 | ||||||
Commitments to extend credit are agreements to lend to a customer as long as there is no violation of any condition established in the contract. Commitments generally have fixed expiration dates or other termination clauses and may require payment of a fee.
The commitments for home equity and commercial lines of credit may expire without being drawn upon. Therefore, the total commitment amounts do not necessarily represent future cash requirements. The amount of collateral obtained, if it is deemed necessary by the Company, is based on management’s credit evaluation of the customer. Unfunded commitments under revolving credit lines and overdraft protection agreements are commitments for possible future extensions of credit to existing customers. These lines-of-credit are uncollateralized and usually do not contain a specified maturity date and ultimately may not be drawn upon to the total extent to which the Company is committed.
Standby letters-of-credit are conditional commitments issued by the Company to guarantee the performance of a customer to a third party. Those letters-of-credit are primarily issued to support public and private borrowing arrangements. Essentially all letters of credit issued have expiration dates within one year.
98
Table of Contents
The credit risk involved in issuing letters-of-credit is essentially the same as that involved in extending loan facilities to customers. The Company generally holds collateral supporting those commitments.
Commitments to purchase loans are conditional commitments issued by the Company to purchase loans through select correspondent mortgage companies who originate and sell loans as part of their operations. Typically the commitment to purchase is valid as long as there is no violation of any condition established in the correspondent contract. Commitments generally have fixed expiration dates or other termination clauses and generally do not require payment of a fee.
NOTE 12 – COMMITMENTS AND CONTINGENT LIABILITIES
Pursuant to the terms of noncancelable lease agreements in effect at December 31, 2017, pertaining to banking premises and equipment, future minimum rent commitments under various operating leases are as follows:
| 2018 |
$ | 361 | ||
| 2019 |
359 | |||
| 2020 |
266 | |||
| 2021 |
122 | |||
| 2022 |
122 | |||
| Thereafter |
122 | |||
|
|
|
|||
| $ | 1,352 | |||
|
|
|
Certain leases contain provisions for escalation of minimum lease payments contingent upon increases in real estate taxes and percentage increases in the consumer price index. Also, certain leases contain options to extend for periods from one to ten years. The cost of such rentals is not included above. Total rent expense for the years ended December 31, 2017, 2016 and 2015 amounted to $363,000, $384,000 and $398,000, respectively.
NOTE 13 – LEGAL CONTINGENCIES
In the normal course of business, there are various outstanding legal proceedings. In the opinion of management, after consulting with legal counsel, the consolidated financial position and results of operations of the Company are not expected to be affected materially by the outcome of such proceedings.
NOTE 14 – MINIMUM REGULATORY CAPITAL REQUIREMENTS
The Company’s primary source of cash is dividends from the Bank. The Bank is subject to certain restrictions on the amount of dividends that it may declare without prior regulatory approval. In addition, the dividends declared cannot be in excess of the amount which would cause the Bank to fall below the minimum required for capital adequacy purposes.
The Company (on a consolidated basis) and the Bank are subject to various regulatory capital requirements administered by the federal banking agencies. Failure to meet minimum capital requirements can initiate certain mandatory and possibly additional discretionary actions by regulators that, if undertaken, could have a direct material effect on the Company’s and Bank’s financial statements. Under capital adequacy guidelines and the regulatory framework for prompt corrective action, the Company and the Bank must meet specific capital guidelines that involve quantitative measures of their assets, liabilities and certain off-balance sheet items as calculated under regulatory accounting practices. The capital amounts and classification are also subject to qualitative judgments by the regulators about components, risk weightings, and other factors. Prompt corrective action provisions are not applicable to bank holding companies.
On July 2, 2013, the Federal Reserve Bank (“FRB”) approved the final rules implementing the Basel Committee on Banking Supervision’s capital guidelines for U.S. banks (“Basel III Capital Rules”). On July 9, 2013, the FDIC also approved, as an interim final rule, the regulatory capital requirements for U.S. banks, following the actions of the FRB. On April 8, 2014, the FDIC adopted as final its interim final rule, which is identical in substance to the final rules issued by the FRB in July 2013. Under the final rules, minimum requirements increased for both the quantity and quality of capital held by the Bank.
99
Table of Contents
The rules include a new common equity Tier 1 capital risk-weighted assets minimum ratio of 4.5%, raise the minimum ratio of Tier 1 capital to risk-weighted assets from 4.0% to 6.0%, require a minimum ratio of Total capital to risk-weighted assets of 8.0%, and require a minimum Tier 1 leverage ratio of 4.0%.
The Basel III Capital Rules became effective for the Company and the Bank on January 1, 2015 (subject to a phase-in period for the capital conservation buffer discussed below). Quantitative measures established by the Basel III Capital Rules to ensure capital adequacy require the maintenance of minimum amounts and ratios (set forth in the table below) of Common Equity Tier 1 capital, Tier 1 capital and Total capital (as defined in the regulations) to risk-weighted assets (as defined), and of Tier 1 capital to adjusted quarterly average assets (as defined).
When fully phased in on January 1, 2019, the Basel III Capital Rules will require the Company and the Bank to maintain (i) a minimum ratio of Common Equity Tier 1 capital to risk-weighted assets of at least 4.5%, plus a 2.5% “capital conservation buffer” (which is added to the 4.5% Common Equity Tier 1 capital ratio as that buffer is phased in, effectively resulting in a minimum ratio of Common Equity Tier 1 capital to risk-weighted assets of at least 7.0% upon full implementation), (ii) a minimum ratio of Tier 1 capital to risk-weighted assets of at least 6.0%, plus the capital conservation buffer (which is added to the 6.0% Tier 1 capital ratio as that buffer is phased in, effectively resulting in a minimum Tier 1 capital ratio of 8.5% upon full implementation), (iii) a minimum ratio of Total capital (that is, Tier 1 plus Tier 2) to risk-weighted assets of at least 8.0%, plus the capital conservation buffer (which is added to the 8.0% total capital ratio as that buffer is phased in, effectively resulting in a minimum total capital ratio of 10.5% upon full implementation) and (iv) a minimum leverage ratio of 4.0%, calculated as the ratio of Tier 1 capital to average quarterly assets.
The implementation of the capital conservation buffer began on January 1, 2016 at the 0.625% level and will be phased in over a four-year period (increasing by that amount on each subsequent January 1, until it reaches 2.5% on January 1, 2019). The capital conservation buffer is designed to absorb losses during periods of economic stress and, as detailed above, effectively increases the minimum required risk-weighted capital ratios. Banking institutions with a ratio of Common Equity Tier 1 capital to risk-weighted assets below the effective minimum (4.5% plus the capital conservation buffer) will face constraints on dividends, equity repurchases and compensation based on the amount of the shortfall.
Management believes, as of December 31, 2017 and 2016, that the Company and the Bank meet all capital adequacy requirements to which they are subject.
As of December 31, 2017, the most recent notification from the FDIC categorized the Bank as well capitalized under the regulatory framework for prompt corrective action. To be categorized as well capitalized, an institution must maintain minimum total risk-based, Tier 1 risk-based, Common Equity Tier 1 risk-based and Tier 1 leverage ratios as set forth in the following tables. There are no conditions or events since the notification that management believes have changed the Bank’s category.
The following table presents actual and required capital ratios as of December 31, 2017 and December 31, 2016 for the Company and the Bank under the Basel III Capital Rules. The minimum required capital amounts presented include the minimum required capital levels as of December 31, 2017 and December 31, 2016 based on the phase-in provisions of the Basel III Capital Rules and the minimum required capital levels as of January 1, 2019 when the Basel III Capital Rules have been fully phased-in. Capital levels required to be considered well capitalized are based upon prompt corrective action regulations, as amended to reflect the changes under the Basel III Capital Rules.
100
Table of Contents
| Actual | Minimum Capital Required For Capital Adequacy |
Minimum Capital Required For Capital Adequacy Plus Capital Conservation Buffer Basel III Phase-In Schedule |
Minimum Capital Required For Capital Adequacy Plus Capital Conservation Buffer Basel III Fully Phased In |
Minimum To Be Well Capitalized Under Prompt Corrective Action Provisions |
||||||||||||||||||||||||||||||||||||
| Amount | Ratio | Amount | Ratio | Amount | Ratio | Amount | Ratio | Amount | Ratio | |||||||||||||||||||||||||||||||
| As of December 31, 2017: |
||||||||||||||||||||||||||||||||||||||||
| Total Capital (to Risk Weighted Assets) |
||||||||||||||||||||||||||||||||||||||||
| Consolidated |
$ | 194,287 | 11.30 | % | $ | 137,498 | 8.00 | % | $ | 158,982 | 9.25 | % | $ | 180,466 | 10.50 | % | N/A | N/A | ||||||||||||||||||||||
| Belmont Savings Bank |
189,311 | 11.01 | % | 137,497 | 8.00 | % | 158,981 | 9.25 | % | 180,465 | 10.50 | % | $ | 171,871 | 10.00 | % | ||||||||||||||||||||||||
| Tier 1 Capital (to Risk Weighted Assets) |
||||||||||||||||||||||||||||||||||||||||
| Consolidated |
$ | 177,939 | 10.35 | % | $ | 103,123 | 6.00 | % | $ | 124,607 | 7.25 | % | $ | 146,092 | 8.50 | % | N/A | N/A | ||||||||||||||||||||||
| Belmont Savings Bank |
172,963 | 10.06 | % | 103,123 | 6.00 | % | 124,607 | 7.25 | % | 146,091 | 8.50 | % | $ | 137,497 | 8.00 | % | ||||||||||||||||||||||||
| Common Equity Tier 1 Capital (to Risk Weighted Assets) |
||||||||||||||||||||||||||||||||||||||||
| Consolidated |
$ | 177,939 | 10.35 | % | $ | 77,343 | 4.50 | % | $ | 98,827 | 5.75 | % | $ | 120,311 | 7.00 | % | N/A | N/A | ||||||||||||||||||||||
| Belmont Savings Bank |
172,963 | 10.06 | % | 77,342 | 4.50 | % | 98,826 | 5.75 | % | 120,310 | 7.00 | % | $ | 111,716 | 6.50 | % | ||||||||||||||||||||||||
| Tier 1 Capital (to Average Assets) |
||||||||||||||||||||||||||||||||||||||||
| Consolidated |
$ | 177,939 | 6.97 | % | $ | 102,148 | 4.00 | % | $ | 102,148 | 4.00 | % | $ | 102,148 | 4.00 | % | N/A | N/A | ||||||||||||||||||||||
| Belmont Savings Bank |
172,963 | 6.77 | % | 102,147 | 4.00 | % | 102,147 | 4.00 | % | 102,147 | 4.00 | % | $ | 127,683 | 5.00 | % | ||||||||||||||||||||||||
| Actual | Minimum Capital Required For Capital Adequacy |
Minimum Capital Required For Capital Adequacy Plus Capital Conservation Buffer Basel III Phase-In Schedule |
Minimum Capital Required For Capital Adequacy Plus Capital Conservation Buffer Basel III Fully Phased In |
Minimum To Be Well Capitalized Under Prompt Corrective Action Provisions |
||||||||||||||||||||||||||||||||||||
| Amount | Ratio | Amount | Ratio | Amount | Ratio | Amount | Ratio | Amount | Ratio | |||||||||||||||||||||||||||||||
| As of December 31, 2016: |
||||||||||||||||||||||||||||||||||||||||
| Total Capital (to Risk Weighted Assets) |
||||||||||||||||||||||||||||||||||||||||
| Consolidated |
$ | 174,465 | 11.72 | % | $ | 119,116 | 8.00 | % | $ | 128,422 | 8.625 | % | $ | 156,340 | 10.50 | % | N/A | N/A | ||||||||||||||||||||||
| Belmont Savings Bank |
169,499 | 11.38 | % | 119,114 | 8.00 | % | 128,420 | 8.625 | % | 156,337 | 10.50 | % | $ | 148,893 | 10.00 | % | ||||||||||||||||||||||||
| Tier 1 Capital (to Risk Weighted Assets) |
||||||||||||||||||||||||||||||||||||||||
| Consolidated |
$ | 160,817 | 10.80 | % | $ | 89,337 | 6.00 | % | $ | 98,643 | 6.625 | % | $ | 126,561 | 8.50 | % | N/A | N/A | ||||||||||||||||||||||
| Belmont Savings Bank |
155,851 | 10.47 | % | 89,336 | 6.00 | % | 98,641 | 6.625 | % | 126,559 | 8.50 | % | $ | 119,114 | 8.00 | % | ||||||||||||||||||||||||
| Common Equity Tier 1 Capital (to Risk Weighted Assets) |
||||||||||||||||||||||||||||||||||||||||
| Consolidated |
$ | 160,817 | 10.80 | % | $ | 67,003 | 4.50 | % | $ | 76,309 | 5.125 | % | $ | 104,227 | 7.00 | % | N/A | N/A | ||||||||||||||||||||||
| Belmont Savings Bank |
155,851 | 10.47 | % | 67,002 | 4.50 | % | 76,308 | 5.125 | % | 104,225 | 7.00 | % | $ | 96,780 | 6.50 | % | ||||||||||||||||||||||||
| Tier 1 Capital (to Average Assets) |
||||||||||||||||||||||||||||||||||||||||
| Consolidated |
$ | 160,817 | 7.63 | % | $ | 84,253 | 4.00 | % | $ | 84,253 | 4.00 | % | $ | 84,253 | 4.00 | % | N/A | N/A | ||||||||||||||||||||||
| Belmont Savings Bank |
155,851 | 7.40 | % | 84,251 | 4.00 | % | 84,251 | 4.00 | % | 84,251 | 4.00 | % | $ | 105,314 | 5.00 | % | ||||||||||||||||||||||||
Stock Repurchase Plans. From time to time, the Company’s Board of Directors has authorized stock repurchase plans. In general, stock repurchase plans allow the Company to proactively manage its capital position and return excess capital to shareholders. As of December 31, 2017 and December 31, 2016, the Company had an active stock repurchase plan to repurchase up to 500,000 shares of the Company’s common stock. During the twelve months ended December 31, 2017, 2016 and 2015 no shares were repurchased under the repurchase plan.
NOTE 15 – EMPLOYEE BENEFIT PLANS
Belmont Savings Bank Supplemental Executive Retirement Plan
Effective October 1, 2010, the Company established the Belmont Savings Bank Supplemental Executive Retirement Plan (the “Plan”). The purpose of the Plan is to remain competitive with our peers in our compensation arrangements and to help us retain certain executive officers of the Company. At December 31, 2017 and 2016, there were four participants in the Plan. Participants are fully vested after the completion of between five and ten years of service. The plan is unfunded.
101
Table of Contents
Information pertaining to the activity in the plan is as follows:
| Years Ended December 31, | ||||||||
| 2017 | 2016 | |||||||
| Change in benefit obligation: |
||||||||
| Benefit obligation at beginning of year |
$ | 1,521 | $ | 1,316 | ||||
| Service cost |
253 | 261 | ||||||
| Interest cost |
66 | 57 | ||||||
| Actuarial gain |
(42 | ) | (113 | ) | ||||
|
|
|
|
|
|||||
| Benefit obligation at end of year |
1,798 | 1,521 | ||||||
|
|
|
|
|
|||||
| Funded status at end of year |
$ | (1,798 | ) | $ | (1,521 | ) | ||
|
|
|
|
|
|||||
| Accrued pension benefit |
$ | (2,003 | ) | $ | (1,696 | ) | ||
|
|
|
|
|
|||||
| Accumulated benefit obligation |
$ | 1,175 | $ | 985 | ||||
|
|
|
|
|
|||||
The assumptions used to determine the benefit obligation are as follows:
| December 31, | ||||||||
| 2017 | 2016 | |||||||
| Discount rate |
3.80 | % | 4.35 | % | ||||
| Rate of compensation increase |
3.00 | % | 3.00 | % | ||||
The components of net periodic pension cost are as follows:
| December 31, | ||||||||
| 2017 | 2016 | |||||||
| Service cost |
$ | 253 | $ | 261 | ||||
| Interest cost |
66 | 57 | ||||||
| Amortization of gain |
(19 | ) | — | |||||
| Amortization of prior service cost |
6 | 6 | ||||||
|
|
|
|
|
|||||
| Net periodic cost |
$ | 306 | $ | 324 | ||||
|
|
|
|
|
|||||
Other changes in benefit obligations recognized in other comprehensive loss are as follows:
| December 31, | ||||||||
| 2017 | 2016 | |||||||
| Amortization of prior service cost |
$ | (6 | ) | $ | (6 | ) | ||
| Amortization of unrecognized gain |
19 | — | ||||||
| Net actuarial gain |
(42 | ) | (112 | ) | ||||
|
|
|
|
|
|||||
| Total recognized in other comprehensive loss |
$ | (29 | ) | $ | (118 | ) | ||
|
|
|
|
|
|||||
102
Table of Contents
The assumptions used to determine net periodic pension cost are as follows:
| December 31, | ||||||||
| 2017 | 2016 | |||||||
| Discount rate |
4.35 | % | 4.30 | % | ||||
| Rate of compensation increase |
3.00 | % | 3.00 | % | ||||
Amounts recognized in accumulated other comprehensive income, before tax effects, consist of the following:
| December 31, | ||||||||
| 2017 | 2016 | |||||||
| Unrecognized prior service cost |
$ | 40 | $ | 46 | ||||
| Unrecognized net gain |
(245 | ) | (222 | ) | ||||
|
|
|
|
|
|||||
| $ | (205 | ) | $ | (176 | ) | |||
|
|
|
|
|
|||||
The estimated prior service cost that will be amortized from accumulated other comprehensive income into net periodic pension expense during the year ending December 31, 2018 is $6,000. The estimated unrecognized net gain that will be accreted from accumulated other comprehensive income into net periodic pension expense during the year ending December 31, 2018 is $18,500.
The Company does not expect to contribute to the Plan in 2018.
Estimated future benefit payments, which reflect expected future service, as appropriate, are as follows:
| Year Ending December 31, |
Amount | |||
| 2018 |
$ | — | ||
| 2019 |
57 | |||
| 2020 |
191 | |||
| 2021 |
267 | |||
| 2022 |
267 | |||
| Years 2023-2027 |
1,565 | |||
Other Supplemental Retirement Plans
The Company has supplemental retirement plans for certain eligible executive officers that do not participate in the Belmont Savings Bank Supplemental Executive Retirement Plan which provide for a lump sum benefit upon termination of employment at or after age 55 and completing 10 or more years of service (certain reduced benefits are available prior to attaining age 55 or fewer than 10 years of service), subject to certain limitations as set forth in the agreements. The present value of these future payments is being accrued over the service period. The estimated liability at December 31, 2017 and 2016 relating to these plans was $2.6 million and $2.3 million, respectively. The discount rate used to determine the Company’s obligation was 3.8% and 4.35% during the years ended December 31, 2017 and 2016, respectively. The projected rate of salary increase was 3% during the years ended December 31, 2017 and 2016. Total supplemental retirement plan expense amounted to $331,000, $233,000 and $254,000 for the years ended December 31, 2017, 2016 and 2015, respectively.
The Company has a supplemental retirement plan for eligible directors that provides for monthly benefits based upon years of service to the Company, subject to certain limitations as set forth in the agreements. The present value of these future payments is being accrued over the estimated period of service. The estimated liability at December 31, 2017 and 2016 relating to this plan was $697,000 and $661,000, respectively. The discount rate used to determine the Company’s obligation was 3.8% and 4.35% during the years ended December 31, 2017 and 2016, respectively. Total supplemental retirement plan expense amounted to $64,000, $55,000 and $17,000 for the years ended December 31, 2017, 2016 and 2015, respectively.
103
Table of Contents
Incentive Compensation Plan
The Incentive Compensation Plan is a discretionary annual cash-based incentive plan that is an integral part of the participant’s total compensation package and supports the continued growth and profitability of the Bank. Each year participants are awarded for the achievement of certain performance objectives on a company-wide and individual basis. Compensation expense recognized was $2.3 million, $2.0 million and $2.0 million for the years ended December 31, 2017, 2016 and 2015, respectively.
Defined Contribution Plan
The Bank sponsors a 401(k) plan covering substantially all employees meeting certain eligibility requirements. Under the provisions of the plan, employees are able to contribute up to an annual limit of the lesser of 75% of eligible compensation or the maximum allowed by the Internal Revenue Service. The Company’s contributions for the years ended December 31, 2017, 2016 and 2015 totaled $891,000, $839,000 and $842,000, respectively.
Deferred Compensation Plan
The Company has a deferred compensation plan by which selected employees and directors of the Company are entitled to elect, prior to the beginning of each year, to defer the receipt of an amount of their compensation for the forthcoming year to an individual deferred compensation account established by the Bank. Compensation that is deferred is held in a Rabbi Trust, or grantor trust. The Rabbi Trust is maintained by the Bank primarily for purposes of providing a vehicle for deferred compensation for certain Directors and employees of the Company. The plan is administered by a third party and permits participants to select from a number of investment options for the investment of their account balances. Each participant is always 100% vested in his or her deferred compensation account balance. As of December 31, 2017 and 2016, the recorded liability relating to the Rabbi Trust was $2.8 million and $2.6 million, respectively.
Employee Stock Ownership Plan
The Company maintains an Employee Stock Ownership Plan (“ESOP”) to provide eligible employees the opportunity to own Company stock. This plan is a tax-qualified retirement plan for the benefit of all Company employees. Contributions are allocated to eligible participants on the basis of compensation, subject to federal tax law limits.
The Company contributed funds to a subsidiary to enable it to grant a loan to the ESOP for the purchase of 458,643 shares of the Company’s common stock at a price of $10.00 per share. The loan obtained by the ESOP from the Company’s Subsidiary to purchase Company common stock is payable annually over 30 years at a rate per annum equal to the Prime Rate on the first business day of each calendar year, or 3.75% for 2017. Loan payments are principally funded by cash contributions from the Bank. The loan is secured by the shares purchased, which are held in a suspense account for allocation among participants as the loan is repaid. Cash dividends paid on allocated shares are distributed to participants and cash dividends paid on unallocated shares are used to repay the outstanding debt of the ESOP. Shares used as collateral to secure the loan are released and available for allocation to eligible employees as the principal and interest on the loan is paid.
At December 31, 2017, the remaining principal balance on the ESOP debt is payable as follows:
| Years Ending December 31, |
Amount | |||
| 2018 |
$ | 96 | ||
| 2019 |
100 | |||
| 2020 |
104 | |||
| 2021 |
110 | |||
| 2022 |
115 | |||
| Thereafter |
3,444 | |||
|
|
|
|||
| $ | 3,969 | |||
|
|
|
|||
104
Table of Contents
Shares held by the ESOP include the following:
| December 31, | ||||||||
| 2017 | 2016 | |||||||
| Unallocated |
363,091 | 378,379 | ||||||
| Allocated |
84,813 | 72,598 | ||||||
|
|
|
|
|
|||||
| 447,904 | 450,977 | |||||||
|
|
|
|
|
|||||
The fair value of unallocated shares was approximately $10.6 million at December 31, 2017 and $11.0 million at December 31, 2016. Total compensation expense recognized in connection with the ESOP for the years ended December 31, 2017, 2016 and 2015 was $444,000, $360,000 and $321,000, respectively.
Severance Agreements
The Company has entered into employment agreements and change in control agreements with certain executive officers which would provide the executive officers with severance payments based on salary, and the continuation of other benefits, upon a change in control as defined in the agreements.
NOTE 16 – STOCK BASED COMPENSATION
On November 14, 2012, the stockholders of BSB Bancorp, Inc. approved the BSB Bancorp, Inc. 2012 Equity Incentive Plan. The table below presents the amount of cumulatively granted stock options and restricted stock awards, net of forfeitures, through December 31, 2017 under the BSB Bancorp, Inc. 2012 Equity Incentive Plan.
On February 8, 2017, the stockholders of the Company approved the BSB Bancorp, Inc. 2017 Equity Incentive Plan. The BSB Bancorp, Inc. 2017 Equity Incentive Plan authorized the issuance or delivery to participants of up to 487,200 shares of BSB Bancorp, Inc. common stock pursuant to grants of restricted stock awards and/or restricted stock unit awards. On March 15, 2017, 487,200 restricted stock awards were granted under the Plan at $27.10, the grant date fair value per share, with a ten year vesting period and an estimated 2.64% forfeiture rate. The awards are not deemed to be participating securities. Upon the approval of this new plan, the Company canceled the existing 2012 Equity Incentive Plan and no further awards will be granted out of that plan.
The following table presents the amount of cumulatively granted restricted stock awards, net of forfeitures, through December 31, 2017 under the BSB Bancorp, Inc. 2017 Equity Incentive Plan:
| Authorized | Authorized | Cumulative Granted Net of Forfeitures |
Outstanding Total |
|||||||||||||||||||||
| Stock Option Awards |
Restricted Stock Awards |
Authorized Total |
Stock Option Awards |
Restricted Stock Awards |
||||||||||||||||||||
| 2012 Equity Incentive Plan |
917,286 | 366,914 | 1,284,200 | 889,092 | 363,570 | 1,252,662 | ||||||||||||||||||
| 2017 Equity Incentive Plan |
— | 487,200 | 487,200 | — | 483,302 | 483,302 | ||||||||||||||||||
105
Table of Contents
The following table presents the pre-tax expense associated with stock option and restricted stock awards and the related tax benefits recognized:
| For the year ended | ||||||||||||
| December 31, | ||||||||||||
| 2017 | 2016 | 2015 | ||||||||||
| Stock based compensation expense |
||||||||||||
| Stock options |
$ | 724 | $ | 780 | $ | 791 | ||||||
| Restricted stock awards |
1,835 | 869 | 869 | |||||||||
|
|
|
|
|
|
|
|||||||
| Total stock based award expense |
$ | 2,559 | $ | 1,649 | $ | 1,660 | ||||||
|
|
|
|
|
|
|
|||||||
| Related tax benefits recognized in earnings |
$ | 874 | $ | 492 | $ | 481 | ||||||
|
|
|
|
|
|
|
|||||||
The following table presents relevant information relating to the Company’s stock options for the periods indicated:
| For the year ended | ||||||||||||
| December 31, | ||||||||||||
| 2017 | 2016 | 2015 | ||||||||||
| Weighted average grant date fair value of options granted |
$ | — | $ | 4.63 | $ | 3.90 | ||||||
| Intrinsic value of stock options exercised |
3,299 | 368 | 226 | |||||||||
| Cash paid to settle equity instruments granted under stock based compensation arrangements |
— | — | — | |||||||||
Total compensation cost related to non-vested awards not yet recognized and the weighted average period (in years) over which it is expected to be recognized is as follows:
| As of December 31, 2017 | ||||||||
| Amount | Weighted average period |
|||||||
| Stock options |
$ | 136 | 2.36 | |||||
| Restricted stock |
10,574 | 9.19 | ||||||
|
|
|
|||||||
| Total |
$ | 10,710 | ||||||
|
|
|
|||||||
The Company granted the awards presented in the table below. The fair value of the stock options granted was estimated on the date of the grant using the Black-Scholes option pricing model with the following assumptions used:
| • | Expected volatility is based on the standard deviation of the historical volatility of the daily adjusted closing price of the Company’s shares. |
| • | Expected term represents the period of time that the option is expected to be outstanding. The Company determined the expected life using the “Simplified Method.” |
| • | Expected dividend yield is determined based on management’s expectations regarding issuing dividends in the foreseeable future. |
| • | The risk-free interest rate is based on the U.S. Treasury yield curve in effect at the time of grant for a period equivalent to the expected life of the option. |
| • | The stock-based compensation expense recognized in earnings is based on the amount of awards ultimately expected to vest, therefore a forfeiture assumption is estimated at the time of grant and revised, if necessary, in subsequent periods if actual forfeitures differ from those estimates. |
106
Table of Contents
| Date of grant |
3/1/2016 | 2/25/2015 | 2/11/2015 | |||||||||
| Options granted |
27,500 | 5,414 | 7,828 | |||||||||
| Exercise price |
$ | 22.31 | $ | 18.83 | $ | 18.78 | ||||||
| Vesting period (1) |
5 years | 5 years | 5 years | |||||||||
| Expiration date |
3/1/2026 | 2/25/2025 | 2/11/2025 | |||||||||
| Expected volatility |
16.13 | % | 15.51 | % | 15.52 | % | ||||||
| Expected term |
6.5 years | 6.5 years | 6.5 years | |||||||||
| Expected dividend yield |
0 | % | 0 | % | 0 | % | ||||||
| Risk free interest rate |
1.54 | % | 1.70 | % | 1.76 | % | ||||||
| Fair value |
$ | 4.63 | $ | 3.89 | $ | 3.91 |
| (1)- | Vesting is ratably and the period begins on the date of grant. |
The option exercise price is derived from trading value on the date of grant.
A summary of the status of the Company’s Stock Option and Restricted Stock Awards for the year ended December 31, 2017 is presented in the tables below:
| Outstanding | ||||||||||||||||
| Stock option awards |
Weighted average exercise price |
Weighted average remaining contractual term (in years) |
Aggregate intrinsic value |
|||||||||||||
| Balance at January 1, 2017 |
804,484 | $ | 12.68 | |||||||||||||
| Granted |
— | — | ||||||||||||||
| Exercised |
(213,962 | ) | 12.17 | |||||||||||||
| Forfeited |
— | — | ||||||||||||||
|
|
|
|||||||||||||||
| Balance at December 31, 2017 |
590,522 | $ | 12.86 | 5.17 | $ | 9,676 | ||||||||||
|
|
|
|||||||||||||||
| Exercisable |
543,763 | $ | 12.31 | 5.00 | $ | 9,209 | ||||||||||
|
|
|
|||||||||||||||
| Non-vested restricted stock awards |
Weighted average grant price |
|||||||
| Balance at January 1, 2017 |
73,429 | $ | 12.22 | |||||
| Granted |
487,200 | 27.10 | ||||||
| Vested |
(71,829 | ) | 12.10 | |||||
| Forfeited |
(3,898 | ) | 27.10 | |||||
|
|
|
|||||||
| Balance at December 31, 2017 |
484,902 | $ | 27.07 | |||||
|
|
|
|||||||
For the years ended December 31, 2017, 2016 and 2015, the fair value of shares vested during the year amounted to $2.2 million, $1.9 million and $1.6 million, respectively.
107
Table of Contents
NOTE 17 – EARNINGS PER SHARE
Earnings per share consisted of the following components for the years ended December 31, 2017, 2016 and 2015:
| December 31, 2017 |
December 31, 2016 |
December 31, 2015 |
||||||||||
| Net income |
$ | 14,386 | $ | 11,981 | $ | 6,914 | ||||||
| Undistributed earnings attributable to participating securities |
(108 | ) | (190 | ) | (167 | ) | ||||||
|
|
|
|
|
|
|
|||||||
| Net income available to common stockholders |
$ | 14,278 | $ | 11,791 | $ | 6,747 | ||||||
|
|
|
|
|
|
|
|||||||
| Weighted average shares outstanding, basic |
8,754,393 | 8,571,861 | 8,465,177 | |||||||||
| Effect of dilutive shares |
429,400 | 286,030 | 217,813 | |||||||||
|
|
|
|
|
|
|
|||||||
| Weighted average shares outstanding, assuming dilution |
9,183,793 | 8,857,891 | 8,682,990 | |||||||||
|
|
|
|
|
|
|
|||||||
| Basic EPS |
$ | 1.63 | $ | 1.38 | $ | 0.80 | ||||||
| Effect of dilutive shares |
(0.08 | ) | (0.05 | ) | (0.02 | ) | ||||||
|
|
|
|
|
|
|
|||||||
| Diluted EPS |
$ | 1.55 | $ | 1.33 | $ | 0.78 | ||||||
|
|
|
|
|
|
|
|||||||
For 2017, 2016 and 2015, average options to purchase 0, 22,992, and 17,159 shares of common stock were outstanding, respectively, but not included in the computation of EPS because they were antidilutive under the treasury stock method.
NOTE 18 – RELATED PARTY TRANSACTIONS
In the ordinary course of business, the Bank has granted loans to principal officers and directors and their affiliates. As of December 31, 2017 and 2016, related party loans were not significant.
NOTE 19 – RESTRICTIONS ON DIVIDENDS, LOANS AND ADVANCES
Federal and state banking regulations place certain restrictions on dividends paid and loans or advances made by the Bank to the Company. The total amount for dividends which may be paid in any calendar year cannot exceed the Bank’s net income for the current year, plus the Bank’s net income retained for the two previous years, without regulatory approval. Loans or advances are limited to 10 percent of the Bank’s capital stock and surplus on a secured basis.
In addition, dividends paid by the Bank to the Company would be prohibited if the effect thereof would cause the Bank’s capital to be reduced below applicable minimum capital requirements.
NOTE 20 – FAIR VALUES OF ASSETS AND LIABILITIES
Determination of Fair Value
The fair value of an asset or liability is the price that would be received to sell an asset or paid to transfer a liability in an orderly transaction between market participants at the measurement date. The Company uses prices and inputs that are current as of the measurement date, including during periods of market dislocation. In periods of market dislocation, the observability of prices and inputs may be reduced for many instruments. This condition could cause an instrument to be reclassified from one level to another. Fair value is best determined based upon quoted market prices. However, in many instances, there are no quoted market prices for the Company’s various assets and liabilities. In cases where quoted market prices are not available, fair values are based on estimates using present value of cash flows or other valuation techniques. Those techniques are significantly affected by the assumptions used, including the discount rate and estimates of future cash flows. Accordingly, the fair value estimates may not be realized in an immediate settlement of the instrument.
The Company groups its assets and liabilities measured at fair value in three levels, based on the markets in which the assets and liabilities are traded and the observability and reliability of the assumptions used to determine fair value.
Level 1 - Level 1 inputs are quoted prices (unadjusted) in active markets for identical assets or liabilities that the reporting entity has the ability to access at the measurement date.
108
Table of Contents
Level 2 - Level 2 inputs are inputs other than quoted prices included within Level 1 that are observable for the asset or liability, either directly or indirectly.
Level 3 - Level 3 inputs are unobservable inputs for the asset or liability.
For assets and liabilities, fair value is based upon the lowest level of observable input that is significant to the fair value measurement.
In general, fair value is based upon quoted market prices, where available. If such quoted market prices are not available, fair value is based upon models that primarily use, as inputs, observable market based parameters. The Company’s valuation methodologies may produce a fair value calculation that may not be indicative of net realizable value or reflective of future fair values. While management believes the Company’s valuation methodologies are appropriate and consistent with other market participants, the use of different methodologies or assumptions to determine the fair value of certain financial instruments could result in a different estimate of fair value at the reporting date. Furthermore, the reported fair value amounts have not been comprehensively revalued since the presentation dates, and therefore, estimates of fair value after the balance sheet date may differ significantly from the amounts presented herein. A more detailed description of the valuation methodologies used for assets and liabilities measured at fair value is set forth below. A description of the valuation methodologies used for instruments measured at fair value, as well as the general classification of such instruments pursuant to the valuation hierarchy, is set forth below. These valuation methodologies were applied to all of the Company’s financial assets and financial liabilities carried at fair value for December 31, 2017 and 2016. There were no significant transfers between levels of the fair value hierarchy during the years ended December 31, 2017 and 2016.
Financial Assets and Financial Liabilities: Financial assets and financial liabilities measured at fair value on a recurring basis include the following:
Securities Available for Sale: The Company’s investment in mortgage-backed securities and other debt securities is generally classified within Level 2 of the fair value hierarchy. For these securities, the Company obtains fair value measurements from independent pricing services. The fair value measurements consider observable data that may include reported trades, dealer quotes, market spreads, cash flows, the U.S. treasury yield curve, trading levels, market consensus prepayment speeds, credit information and the instrument’s terms and conditions.
Investments held in the Rabbi Trust: Investments held in the Rabbi Trust consist of mutual funds and were recorded at fair value and included in other assets. The purpose of these investments is to fund certain director and executive non-qualified retirement benefits and deferred compensation. The mutual funds were valued based on quoted prices from the market.
109
Table of Contents
The following table summarizes financial assets measured at fair value on a recurring basis as of December 31, 2017 and 2016, segregated by the level of the valuation inputs within the fair value hierarchy utilized to measure fair value:
| Level 1 | Level 2 | Level 3 | Total Fair Value |
|||||||||||||
| At December 31, 2017 |
||||||||||||||||
| Securities available for sale |
||||||||||||||||
| Corporate debt securities |
$ | — | $ | 16,921 | $ | — | $ | 16,921 | ||||||||
| Trading securities |
||||||||||||||||
| Rabbi Trust |
2,808 | — | — | 2,808 | ||||||||||||
|
|
|
|
|
|
|
|
|
|||||||||
| Totals |
$ | 2,808 | $ | 16,921 | $ | — | $ | 19,729 | ||||||||
|
|
|
|
|
|
|
|
|
|||||||||
| Level 1 | Level 2 | Level 3 | Total Fair Value |
|||||||||||||
| At December 31, 2016 |
||||||||||||||||
| Securities available for sale |
||||||||||||||||
| Corporate debt securities |
$ | — | $ | 22,048 | $ | — | $ | 22,048 | ||||||||
| Trading securities |
||||||||||||||||
| Rabbi Trust |
2,606 | — | — | 2,606 | ||||||||||||
|
|
|
|
|
|
|
|
|
|||||||||
| Totals |
$ | 2,606 | $ | 22,048 | $ | — | $ | 24,654 | ||||||||
|
|
|
|
|
|
|
|
|
|||||||||
Certain financial assets and financial liabilities are measured at fair value on a non-recurring basis; that is, the instruments are not measured at fair value on an ongoing basis but are subject to fair value adjustments in certain circumstances (for example, when there is evidence of impairment). Financial assets measured at fair value on a non-recurring basis during the reported periods include certain impaired loans reported at the fair value of the underlying collateral. Fair value is measured using appraised values of collateral and adjusted as necessary by management based on unobservable inputs for specific properties. However, the choice of observable data is subject to significant judgment, and there are often adjustments based on judgment in order to make observable data comparable and to consider the impact of time, the condition of properties, interest rates, and other market factors on current values. Additionally, commercial real estate appraisals frequently involve discounting of projected cash flows, which relies inherently on unobservable data. Therefore, real estate collateral related nonrecurring fair value measurement adjustments have generally been classified as Level 3. Estimates of fair value used for other collateral supporting commercial loans generally are based on assumptions not observable in the marketplace and therefore such valuations have been classified as Level 3. Financial assets measured at fair value on a non-recurring basis during the reported periods also include loans held for sale. Residential mortgage loans held for sale are recorded at the lower of cost or fair value and are therefore measured at fair value on a non-recurring basis. The fair values for loans held for sale are estimated using discounted cash flow analyses, using interest rates currently being offered for loans with similar terms to borrowers of similar credit quality and are included in Level 3.
There were no impaired loans that were remeasured and reported at fair value through either a charge off or a specific valuation allowance based upon the fair value of the underlying collateral or and loans held for sale at December 31, 2017 and 2016.
Non-Financial Assets and Non-Financial Liabilities: The Company has no non-financial assets or non-financial liabilities measured at fair value on a recurring basis. Non-financial assets measured at fair value on a non-recurring basis generally include certain foreclosed assets which, upon initial recognition, were remeasured and reported at fair value through a charge-off to the allowance for loan losses and certain foreclosed assets which, subsequent to their initial recognition, are remeasured at fair value through a
110
Table of Contents
write-down included in other non-interest expense. Non-financial assets also include mortgage servicing right assets that are remeasured and reported at the lower of cost or fair value. The following tables present the non-financial assets that were re-measured and reported at the lower of cost or fair value at the periods indicated:
| December 31, 2017 | ||||||||||||
| Level 1 | Level 2 | Level 3 | ||||||||||
| Mortgage servicing rights |
$ | — | $ | — | $ | 855 | ||||||
|
|
|
|
|
|
|
|||||||
| Totals |
$ | — | $ | — | $ | 855 | ||||||
|
|
|
|
|
|
|
|||||||
| December 31, 2016 | ||||||||||||
| Level 1 | Level 2 | Level 3 | ||||||||||
| Mortgage servicing rights |
$ | — | $ | — | $ | 403 | ||||||
|
|
|
|
|
|
|
|||||||
| Totals |
$ | — | $ | — | $ | 403 | ||||||
|
|
|
|
|
|
|
|||||||
There were no foreclosed assets at December 31, 2017 or 2016.
ASC Topic 825, “Financial Instruments,” requires disclosure of the fair value of financial assets and financial liabilities, including those financial assets and financial liabilities that are not measured and reported at fair value on a recurring basis or non-recurring basis. The methodologies for estimating the fair value of financial assets and financial liabilities that are measured at fair value on a recurring or non-recurring basis are discussed above. The estimated fair value approximates carrying value for cash and cash equivalents, interest bearing time deposits with other banks, Federal Home Loan Bank stock, bank owned life insurance, accrued interest, securities sold under agreements to repurchase, and mortgagors’ escrow accounts. The methodologies for other financial assets and financial liabilities are discussed below:
Securities held-to-maturity - The fair values presented are based on quoted market prices, where available. If quoted market prices are not available, fair values are based on quoted market prices of comparable instruments and/or discounted cash flow analyses.
Loans - For variable-rate loans that reprice frequently and with no significant change in credit risk, fair values are based on carrying values. The fair values for other loans are estimated using discounted cash flow analyses, using interest rates currently being offered for loans with similar terms to borrowers of similar credit quality.
Deposits - The fair values disclosed for demand deposits (e.g., interest and non-interest checking, passbook savings and money market accounts) are, by definition, equal to the amount payable on demand at the reporting date (i.e., their carrying amounts). Fair values for fixed-rate certificate accounts are estimated using a discounted cash flow calculation that applies interest rates currently being offered on certificates to a schedule of aggregated expected monthly maturities on certificate accounts.
Federal Home Loan Bank advances - The fair values of the Company’s Federal Home Loan Bank advances are estimated using discounted cash flow analyses based on the current incremental borrowing rates in the market for similar types of borrowing arrangements.
111
Table of Contents
Summary of Fair Values of Financial Instruments not Carried at Fair Value
The estimated fair values, and related carrying or notional amounts, of the Company’s financial instruments are as follows:
| December 31, 2017 | ||||||||||||||||||||
| Carrying | Fair | |||||||||||||||||||
| Amount | Value | Level 1 | Level 2 | Level 3 | ||||||||||||||||
| Financial assets: |
||||||||||||||||||||
| Cash and cash equivalents |
$ | 110,888 | $ | 110,888 | $ | 110,888 | $ | — | $ | — | ||||||||||
| Interest-bearing time deposits with other banks |
2,440 | 2,440 | — | 2,440 | — | |||||||||||||||
| Held-to-maturity securities |
160,090 | 158,385 | — | 158,385 | — | |||||||||||||||
| Federal Home Loan Bank stock |
32,382 | 32,382 | — | 32,382 | — | |||||||||||||||
| Bank owned life insurance |
36,967 | 36,967 | — | 36,967 | ||||||||||||||||
| Loans, net |
2,296,958 | 2,251,971 | — | — | 2,251,971 | |||||||||||||||
| Accrued interest receivable |
6,344 | 6,344 | 6,344 | — | — | |||||||||||||||
| Financial liabilities: |
||||||||||||||||||||
| Deposits |
1,751,251 | 1,748,995 | 1,246,537 | 502,458 | — | |||||||||||||||
| Federal Home Loan Bank advances |
723,150 | 719,430 | — | 719,430 | — | |||||||||||||||
| Securities sold under agreements to repurchase |
3,268 | 3,268 | — | 3,268 | — | |||||||||||||||
| Accrued interest payable |
1,594 | 1,594 | 1,594 | — | — | |||||||||||||||
| Mortgagors’ escrow accounts |
4,690 | 4,690 | — | 4,690 | — | |||||||||||||||
| December 31, 2016 | ||||||||||||||||||||
| Carrying | Fair | |||||||||||||||||||
| Amount | Value | Level 1 | Level 2 | Level 3 | ||||||||||||||||
| Financial assets: |
||||||||||||||||||||
| Cash and cash equivalents |
$ | 58,876 | $ | 58,876 | $ | 58,876 | $ | — | $ | — | ||||||||||
| Interest-bearing time deposits with other banks |
234 | 233 | — | 233 | — | |||||||||||||||
| Held-to-maturity securities |
130,197 | 129,465 | — | 129,465 | — | |||||||||||||||
| Federal Home Loan Bank stock |
25,071 | 25,071 | — | 25,071 | — | |||||||||||||||
| Bank owned life insurance |
35,842 | 35,842 | — | 35,842 | ||||||||||||||||
| Loans, net |
1,866,035 | 1,837,068 | — | — | 1,837,068 | |||||||||||||||
| Accrued interest receivable |
4,635 | 4,635 | 4,635 | — | — | |||||||||||||||
| Financial liabilities: |
||||||||||||||||||||
| Deposits |
1,469,422 | 1,469,906 | 1,133,821 | 336,085 | — | |||||||||||||||
| Federal Home Loan Bank advances |
508,850 | 507,773 | — | 507,773 | — | |||||||||||||||
| Securities sold under agreements to repurchase |
1,985 | 1,985 | — | 1,985 | — | |||||||||||||||
| Accrued interest payable |
1,023 | 1,023 | 1,023 | — | — | |||||||||||||||
| Mortgagors’ escrow accounts |
3,341 | 3,341 | — | 3,341 | — | |||||||||||||||
112
Table of Contents
NOTE 21 – OTHER COMPREHENSIVE (LOSS) INCOME
The following table presents a reconciliation of the changes in the components of other comprehensive (loss) income for the dates indicated, including the amount of income tax benefit (expense) allocated to each component of other comprehensive (loss) income:
| Year Ended December 31, 2017 | ||||||||||||
| Pre Tax | Tax Benefit | After Tax | ||||||||||
| Amount | (Expense) | Amount | ||||||||||
| Securities available-for-sale: |
||||||||||||
| Change in fair value of securities available for sale |
$ | (13 | ) | $ | 5 | $ | (8 | ) | ||||
| Reclassification adjustment for net gains included in net income1 |
(38 | ) | 15 | (23 | ) | |||||||
|
|
|
|
|
|
|
|||||||
| Net change in fair value of securities available for sale |
(51 | ) | 20 | (31 | ) | |||||||
|
|
|
|
|
|
|
|||||||
| Defined benefit post-retirement benefit plans: |
||||||||||||
| Change in the actuarial gain/loss |
42 | (17 | ) | 25 | ||||||||
| Reclassification adjustment included in net income2 |
(13 | ) | 5 | (8 | ) | |||||||
|
|
|
|
|
|
|
|||||||
| Net change defined-benefit post-retirement benefit plans |
29 | (12 | ) | 17 | ||||||||
|
|
|
|
|
|
|
|||||||
| Total other comprehensive loss |
$ | (22 | ) | $ | 8 | $ | (14 | ) | ||||
|
|
|
|
|
|
|
|||||||
| Year Ended December 31, 2016 | ||||||||||||
| Pre Tax | Tax | After Tax | ||||||||||
| Amount | Expense | Amount | ||||||||||
| Securities available-for-sale: |
||||||||||||
| Change in fair value of securities available for sale |
$ | 247 | $ | (98 | ) | $ | 149 | |||||
|
|
|
|
|
|
|
|||||||
| Net change in fair value of securities available for sale |
247 | (98 | ) | 149 | ||||||||
|
|
|
|
|
|
|
|||||||
| Defined benefit post-retirement benefit plans: |
||||||||||||
| Change in the actuarial gain/loss |
112 | (46 | ) | 66 | ||||||||
| Reclassification adjustment included in net income2 |
6 | (2 | ) | 4 | ||||||||
|
|
|
|
|
|
|
|||||||
| Net change defined-benefit post-retirement benefit plans |
118 | (48 | ) | 70 | ||||||||
|
|
|
|
|
|
|
|||||||
| Total other comprehensive income |
$ | 365 | $ | (146 | ) | $ | 219 | |||||
|
|
|
|
|
|
|
|||||||
| Year Ended December 31, 2015 | ||||||||||||
| Pre Tax | Tax Benefit | After Tax | ||||||||||
| Amount | (Expense) | Amount | ||||||||||
| Securities available-for-sale: |
||||||||||||
| Change in fair value of securities available for sale |
$ | (130 | ) | $ | 52 | $ | (78 | ) | ||||
|
|
|
|
|
|
|
|||||||
| Net change in fair value of securities available for sale |
(130 | ) | 52 | (78 | ) | |||||||
|
|
|
|
|
|
|
|||||||
| Defined benefit post-retirement benefit plans: |
||||||||||||
| Change in the actuarial gain/loss |
(33 | ) | 13 | (20 | ) | |||||||
| Reclassification adjustment included in net income2 |
6 | (2 | ) | 4 | ||||||||
|
|
|
|
|
|
|
|||||||
| Net change defined-benefit post-retirement benefit plans |
(27 | ) | 11 | (16 | ) | |||||||
|
|
|
|
|
|
|
|||||||
| Total other comprehensive loss |
$ | (157 | ) | $ | 63 | $ | (94 | ) | ||||
|
|
|
|
|
|
|
|||||||
| 1- | Reclassification adjustments are comprised of realized security gains. The gains have been reclassified out of accumulated other comprehensive income and have affected certain lines in the consolidated statements of operations as follows; the pre-tax amount is included in net gain on sales of securities, the tax expense amount is included in income tax expense and the after tax amount is included in net income. |
| 2- | Reclassification adjustments are comprised of amortization of prior service cost and unrecognized gain and have been reclassified out of accumulated other comprehensive income (loss). The amounts affected certain lines in the consolidated statements of operations as follows: amortization of prior service cost and unrecognized gain is included in salaries and employee benefits expense. The tax expense amount is included in income tax expense and the after tax amount is included in net income. |
113
Table of Contents
The components of accumulated other comprehensive income, included in stockholders’ equity, are as follows:
| December 31, 2017 | December 31, 2016 | |||||||
| Net unrealized holding loss on available-for-sale securities, net of tax |
$ | (32 | ) | $ | (1 | ) | ||
| Unrecognized benefit pertaining to defined benefit plan, net of tax |
121 | 104 | ||||||
|
|
|
|
|
|||||
| Accumulated other comprehensive income |
$ | 89 | $ | 103 | ||||
|
|
|
|
|
|||||
Accumulated other comprehensive income at December 31, 2017 included $19,000 related to stranded amounts resulting from the re-measurement of deferred tax assets and liabilities in connection with the enactment of the Tax Reform Act on December 22, 2017. In February 2018, the Financial Accounting Standards Board issued Accounting Standards Update 2018-02, that allows companies to elect to reclassify the tax effects stranded in accumulated other comprehensive income to retained earnings rather than income tax benefit or expense.
NOTE 22 – CONDENSED FINANCIAL STATEMENTS OF PARENT COMPANY
The following condensed financial statements are for the Parent Company only and should be read in conjunction with the consolidated financial statements of the Company.
Condensed Balance Sheets
| December 31, | ||||||||
| 2017 | 2016 | |||||||
| Assets |
||||||||
| Cash and cash equivalents held at Belmont Savings Bank |
$ | 919 | $ | 519 | ||||
| Investment in Belmont Savings Bank |
173,054 | 155,955 | ||||||
| Investment in BSB Funding Corp. |
4,065 | 4,436 | ||||||
| Other assets |
45 | 62 | ||||||
|
|
|
|
|
|||||
| Total assets |
$ | 178,083 | $ | 160,972 | ||||
|
|
|
|
|
|||||
| Liabilities and Stockholders’ Equity |
||||||||
| Accrued expenses |
$ | 38 | $ | 37 | ||||
| Other liabilities |
16 | 14 | ||||||
|
|
|
|
|
|||||
| Total liabilities |
54 | 51 | ||||||
|
|
|
|
|
|||||
| Stockholders’ equity |
178,029 | 160,921 | ||||||
|
|
|
|
|
|||||
| Total liabilities and stockholders’ equity |
$ | 178,083 | $ | 160,972 | ||||
|
|
|
|
|
|||||
114
Table of Contents
Condensed Statements of Operations
| Years Ended December 31, | ||||||||||||
| 2017 | 2016 | 2015 | ||||||||||
| Interest and dividend income: |
||||||||||||
| Interest on cash equivalents |
$ | — | $ | — | $ | 1 | ||||||
| Dividends from subsidiaries |
— | — | — | |||||||||
|
|
|
|
|
|
|
|||||||
| Total interest and dividend income |
— | — | 1 | |||||||||
| Interest expense |
— | — | — | |||||||||
|
|
|
|
|
|
|
|||||||
| Net interest and dividend income |
— | — | 1 | |||||||||
| Non-interest income |
— | — | — | |||||||||
| Non-interest expense |
230 | 219 | 242 | |||||||||
|
|
|
|
|
|
|
|||||||
| Loss before income taxes and equity in undistributed earnings of subsidiaries |
(230 | ) | (219 | ) | (241 | ) | ||||||
| Income tax benefit |
(94 | ) | (89 | ) | (96 | ) | ||||||
|
|
|
|
|
|
|
|||||||
| Loss before equity in income of subsidiaries |
(136 | ) | (130 | ) | (145 | ) | ||||||
| Equity in undistributed earnings of Belmont Savings Bank |
14,432 | 12,025 | 6,976 | |||||||||
| Equity in undistributed earnings of BSB Funding Corp |
90 | 86 | 83 | |||||||||
|
|
|
|
|
|
|
|||||||
| Net income |
$ | 14,386 | $ | 11,981 | $ | 6,914 | ||||||
|
|
|
|
|
|
|
|||||||
115
Table of Contents
Condensed Statements of Cash Flows
| Years Ended December 31, | ||||||||||||
| 2017 | 2016 | 2015 | ||||||||||
| Cash flows from operating activities: |
||||||||||||
| Net income |
$ | 14,386 | $ | 11,981 | $ | 6,914 | ||||||
| Adjustments to reconcile net income to net cash (used in) provided by operating activities: |
||||||||||||
| Equity in undistributed earnings of Belmont Savings Bank |
(14,432 | ) | (12,025 | ) | (6,976 | ) | ||||||
| Equity in undistributed earnings of BSB Funding Corp. |
(90 | ) | (86 | ) | (83 | ) | ||||||
| Deferred income tax expense |
— | — | 190 | |||||||||
| Other, net |
26 | (27 | ) | 720 | ||||||||
|
|
|
|
|
|
|
|||||||
| Net cash (used in) provided by operating activities |
(110 | ) | (157 | ) | 765 | |||||||
|
|
|
|
|
|
|
|||||||
| Cash flows from investing activities: |
||||||||||||
| Return of capital from BSB Funding Corp. |
460 | — | 600 | |||||||||
| Investment in Belmont Savings Bank |
— | — | (3,800 | ) | ||||||||
|
|
|
|
|
|
|
|||||||
| Net cash provided by (used in) investing activities |
460 | — | (3,200 | ) | ||||||||
|
|
|
|
|
|
|
|||||||
| Cash flows from financing activities: |
||||||||||||
| Proceeds from exercise of stock options, net of cash paid |
50 | 298 | 228 | |||||||||
| Restricted stock awards issued, net of awards surrendered |
— | (118 | ) | (51 | ) | |||||||
|
|
|
|
|
|
|
|||||||
| Net cash provided by financing activities |
50 | 180 | 177 | |||||||||
|
|
|
|
|
|
|
|||||||
| Net increase (decrease) in cash and cash equivalents |
400 | 23 | (2,258 | ) | ||||||||
| Cash and cash equivalents at beginning of period |
519 | 496 | 2,754 | |||||||||
|
|
|
|
|
|
|
|||||||
| Cash and cash equivalents at end of period |
$ | 919 | $ | 519 | $ | 496 | ||||||
|
|
|
|
|
|
|
|||||||
116
Table of Contents
NOTE 23 – QUARTERLY DATA (UNAUDITED)
Quarterly results of operations are as follows:
| Years Ended December 31, | ||||||||||||||||||||||||||||||||
| 2017 | 2016 | |||||||||||||||||||||||||||||||
| Fourth | Third | Second | First | Fourth | Third | Second | First | |||||||||||||||||||||||||
| Quarter | Quarter | Quarter | Quarter | Quarter | Quarter | Quarter | Quarter | |||||||||||||||||||||||||
| Interest and dividend income |
$ | 21,114 | $ | 19,758 | $ | 18,764 | $ | 17,506 | $ | 16,291 | $ | 15,726 | $ | 15,164 | $ | 14,439 | ||||||||||||||||
| Interest expense |
6,414 | 5,579 | 4,816 | 4,245 | 3,918 | 3,699 | 3,457 | 3,158 | ||||||||||||||||||||||||
|
|
|
|
|
|
|
|
|
|
|
|
|
|
|
|
|
|||||||||||||||||
| Net interest income |
14,700 | 14,179 | 13,948 | 13,261 | 12,373 | 12,027 | 11,707 | 11,281 | ||||||||||||||||||||||||
| Provision for loan losses |
691 | 535 | 707 | 829 | 601 | 443 | 741 | 599 | ||||||||||||||||||||||||
|
|
|
|
|
|
|
|
|
|
|
|
|
|
|
|
|
|||||||||||||||||
| Net interest income, after provision for loan losses |
14,009 | 13,644 | 13,241 | 12,432 | 11,772 | 11,584 | 10,966 | 10,682 | ||||||||||||||||||||||||
| Non-interest income |
1,117 | 885 | 995 | 630 | 703 | 680 | 705 | 660 | ||||||||||||||||||||||||
| Non-interest expense |
7,636 | 7,929 | 7,645 | 7,476 | 7,045 | 7,066 | 6,984 | 7,252 | ||||||||||||||||||||||||
|
|
|
|
|
|
|
|
|
|
|
|
|
|
|
|
|
|||||||||||||||||
| Income before taxes |
7,490 | 6,600 | 6,591 | 5,586 | 5,430 | 5,198 | 4,687 | 4,090 | ||||||||||||||||||||||||
| Income tax expense |
5,382 | 2,001 | 2,579 | 1,920 | 2,120 | 2,018 | 1,735 | 1,551 | ||||||||||||||||||||||||
|
|
|
|
|
|
|
|
|
|
|
|
|
|
|
|
|
|||||||||||||||||
| Net income |
$ | 2,108 | $ | 4,599 | $ | 4,012 | $ | 3,666 | $ | 3,310 | $ | 3,180 | $ | 2,952 | $ | 2,539 | ||||||||||||||||
|
|
|
|
|
|
|
|
|
|
|
|
|
|
|
|
|
|||||||||||||||||
| Earnings per common share |
||||||||||||||||||||||||||||||||
| Basic |
$ | 0.24 | $ | 0.52 | $ | 0.45 | $ | 0.42 | $ | 0.38 | $ | 0.36 | $ | 0.34 | $ | 0.29 | ||||||||||||||||
| Diluted |
$ | 0.23 | $ | 0.50 | $ | 0.43 | $ | 0.40 | $ | 0.37 | $ | 0.35 | $ | 0.33 | $ | 0.28 | ||||||||||||||||
NOTE 24 – SUBSEQUENT EVENTS
The Company has evaluated subsequent events for potential recognition and/or disclosure through the date these consolidated financial statements were issued.
| ITEM 9. | CHANGES IN AND DISAGREEMENTS WITH ACCOUNTANTS ON ACCOUNTING AND FINANCIAL DISCLOSURE |
None.
| ITEM 9A. | CONTROLS AND PROCEDURES |
Evaluation of Disclosure Controls and Procedures.
The Company’s President and Chief Executive Officer, its Chief Financial Officer, and other members of its senior management team have evaluated the effectiveness of the Company’s disclosure controls and procedures (as defined in Exchange Act Rules 13a-15(e) or 15d-15(e)), as of December 31, 2017. Based on such evaluation, the President and Chief Executive Officer and Chief Financial Officer have concluded that the Company’s disclosure controls and procedures, as of the end of the period covered by this report, were effective.
Changes in Internal Controls over Financial Reporting.
There have been no changes in the Company’s internal control over financial reporting during the quarter ended December 31, 2017 that have materially affected, or are reasonably likely to materially affect, the Company’s internal control over financial reporting.
Management’s Report on Internal Control over Financial Reporting and the Report of Independent Registered Public Accounting Firm are set forth in Part II, Item 8 of this Form 10-K.
| ITEM 9B. | OTHER INFORMATION |
Not applicable.
117
Table of Contents
| ITEM 10. | DIRECTORS, EXECUTIVE OFFICERS AND CORPORATE GOVERNANCE |
The information relating to the directors and officers of BSB Bancorp, Inc. is incorporated herein by reference to our definitive Proxy Statement for the 2018 Annual Meeting of Stockholders (the “Proxy Statement”) under the headings “Corporate Governance and Board Matters” and “Proposal I—Election of Directors.” Information regarding compliance with Section 16(a) of the Exchange Act, our procedures for stockholders to submit recommendations for director candidates, and the audit committee and audit committee financial expert, is incorporated herein by reference from our definitive Proxy Statement, specifically the sections captioned “Section 16(a) Beneficial Ownership Reporting Compliance” and “Corporate Governance and Board Matters.”
We have adopted a Joint Code of Ethics and Conflicts of Interest Policy (the “Code”) that is designed to promote the highest standards of ethical conduct by our directors, officers (including our senior officers, which are our principal executive officer, principal financial officer, principal accounting officer and all officers performing similar functions). The Code is available on our website, www.belmontsavings.com, under “Investor Relations—Corporate Information—Governance Documents—Joint Code of Ethics and Conflicts of Interest Policy.”
| ITEM 11. | EXECUTIVE COMPENSATION |
Information concerning executive compensation is incorporated herein by reference from our Proxy Statement, specifically the sections captioned “Executive Compensation,” “Director Compensation,” “Compensation Discussion and Analysis,” “Compensation Committee Interlocks and Insider Participation,” and “Compensation Committee Report.”
ITEM 12. SECURITY OWNERSHIP OF CERTAIN BENEFICIAL OWNERS AND MANAGEMENT AND RELATED STOCKHOLDERS MATTERS
Information concerning security ownership of certain owners and management is incorporated herein by reference from our Proxy Statement, specifically the sections captioned “Stock Ownership” and Item 5 of the Report on Form 10-K.
| ITEM 13. | CERTAIN RELATIONSHIPS AND RELATED TRANSACTIONS, AND DIRECTOR INDEPENDENCE |
Information concerning relationships and transactions is incorporated herein by reference from our Proxy Statement, specifically the section captioned “Transactions with Related Persons” and “Corporate Governance and Board Matters.”
| ITEM 14. | PRINCIPAL ACCOUNTING FEES AND SERVICES |
Information concerning principal accountant fees and services is incorporated herein by reference from our Proxy Statement, specifically the section captioned “Proposal II-Ratification of Independent Registered Public Accounting Firm.”
118
Table of Contents
| ITEM 15. | EXHIBITS AND FINANCIAL STATEMENT SCHEDULES |
| (1) | The financial statements required in response to this item are incorporated by reference from Item 8 of this report. |
| (2) | All financial statement schedules are omitted because they are not required or applicable, or the required information is shown in the consolidated financial statements or the notes thereto. |
| (3) | Exhibits |
| † | This exhibit is a management contract or a compensatory plan or arrangement. |
| * | This information is furnished and not filed. |
119
Table of Contents
| ITEM 16. | FORM 10-K SUMMARY |
None.
Pursuant to the requirements of Section 13 or 15(d) of the Securities Exchange Act of 1934, the Registrant has duly caused this report to be signed on its behalf by the undersigned, thereunto duly authorized.
| BSB BANCORP, INC. | ||||||
| Date: March 14, 2018 | By: | /s/ Robert M. Mahoney | ||||
| Robert M. Mahoney | ||||||
| President and Chief Executive Officer | ||||||
Pursuant to the requirements of the Securities Exchange Act of 1934, this report has been signed below by the following persons on behalf of the Registrant and in the capacities and on the dates indicated.
| Signatures |
Title |
Date | ||
| /s/ Robert M. Mahoney Robert M. Mahoney |
President, Chief Executive Officer and Director (Principal Executive Officer) | March 14, 2018 | ||
| /s/ John A. Citrano John A. Citrano |
Executive Vice President and Chief Financial Officer (Principal Financial and Accounting Officer) | March 14, 2018 | ||
| /s/ Hal R. Tovin Hal R. Tovin |
Executive Vice President, Chief Operating Officer and Director | March 14, 2018 | ||
| /s/ Robert J. Morrissey Robert J. Morrissey |
Chairman of the Board | March 14, 2018 | ||
| /s/ John A. Borelli John A. Borelli |
Director | March 14, 2018 | ||
| /s/ M. Patricia Brusch M. Patricia Brusch |
Director | March 14, 2018 | ||
| /s/ Warren Farrell S. Warren Farrell |
Director | March 14, 2018 | ||
120
Table of Contents
| Signatures |
Title |
Date | ||
| /s/ Richard J. Fougere Richard J. Fougere |
Director | March 14, 2018 | ||
| /s/ John W. Gahan, III John W. Gahan, III |
Director | March 14, 2018 | ||
| /s/ John A. Greene John A. Greene |
Director | March 14, 2018 | ||
| /s/ Paul E. Petry Paul E. Petry |
Director | March 14, 2018 | ||
| /s/ John A. Whittemore John A. Whittemore |
Director | March 14, 2018 | ||
121