Attached files
| file | filename |
|---|---|
| EX-32.2 - EX-32.2 - IMPINJ INC | pi-ex322_78.htm |
| EX-32.1 - EX-32.1 - IMPINJ INC | pi-ex321_77.htm |
| EX-31.2 - EX-31.2 - IMPINJ INC | pi-ex312_79.htm |
| EX-31.1 - EX-31.1 - IMPINJ INC | pi-ex311_80.htm |
| EX-23.1 - EX-23.1 - IMPINJ INC | pi-ex231_225.htm |
UNITED STATES
SECURITIES AND EXCHANGE COMMISSION
Washington, D.C. 20549
FORM 10-K
|
☒ |
ANNUAL REPORT PURSUANT TO SECTION 13 OR 15(d) OF THE SECURITIES EXCHANGE ACT OF 1934 |
For the fiscal year ended December 31, 2017
OR
|
☐ |
TRANSITION REPORT PURSUANT TO SECTION 13 OR 15(d) OF THE SECURITIES EXCHANGE ACT OF 1934 |
Commission File Number 001-37824
IMPINJ, INC.
(Exact name of Registrant as specified in its Charter)
|
Delaware |
91-2041398 |
|
(State or other jurisdiction of incorporation or organization) |
(I.R.S. Employer Identification No.) |
|
400 Fairview Avenue North, Suite 1200, Seattle, Washington |
98109 |
|
(Address of principal executive offices) |
(Zip Code) |
(206) 517-5300
(Registrant’s telephone number, including area code)
Securities registered pursuant to Section 12(b) of the Act:
|
Common Stock, $0.001 par value per share (Title of each class) |
The Nasdaq Global Select Market (Name of each exchange on which registered) |
Securities registered pursuant to Section 12(g) of the Act:
None
Indicate by check mark whether the registrant is a well-known seasoned issuer, as defined in Rule 405 of the Securities Act. Yes ☐ No ☒
Indicate by check mark whether the registrant is not required to file reports pursuant to Section 13 or 15(d) of the Act. Yes ☐ No ☒
Indicate by check mark whether the registrant: (1) has filed all reports required to be filed by Section 13 or 15(d) of the Securities Exchange Act of 1934 during the preceding 12 months (or for such shorter period that the Registrant was required to file such reports), and (2) has been subject to such filing requirements for the past 90 days. Yes ☒ No ☐
Indicate by check mark whether the registrant has submitted electronically and posted on its corporate Web site, if any, every Interactive Data File required to be submitted and posted pursuant to Rule 405 of Regulation S-T (§232.405 of this chapter) during the preceding 12 months (or for such shorter period that the registrant was required to submit and post such files). Yes ☒ No ☐
Indicate by check mark if disclosure of delinquent filers pursuant to Item 405 of Regulation S-K (§229.405) is not contained herein, and will not be contained, to the best of registrant’s knowledge, in definitive proxy or information statements incorporated by reference in Part III of this Form 10-K or any amendment to this Form 10-K. ☐
Indicate by check mark whether the registrant is a large accelerated filer, an accelerated filer, a non-accelerated filer, or a smaller reporting company. See the definition of “large accelerated filer”, “accelerated filer”, “smaller reporting company,” and “emerging growth company” in Rule 12b-2 of the Exchange Act.:
|
Large accelerated filer |
|
☐ |
|
Accelerated filer |
|
☒ |
|
|
|
|
|
|||
|
Non-accelerated filer |
|
☐ (Do not check if a small reporting company) |
|
Small reporting company Emerging growth company |
|
☐ ☒ |
If an emerging growth company, indicate by check mark if the registrant has elected not to use the extended transition period for complying with any new or revised financial accounting standards provided pursuant to Section 13(a) of the Exchange Act. ☐
Indicate by check mark whether the registrant is a shell company (as defined in Rule 12b-2 of the Exchange Act). Yes ☐ No ☒
As of June 30, 2017, the last business day of the Registrant’s most recently completed second fiscal quarter, the aggregate market value of the Registrant’s common stock held by non-affiliates based upon the closing price of such shares on The Nasdaq Global Market on such date was $635,374,303.
As of February 28, 2018, 21,317,792 of shares of common stock were outstanding.
DOCUMENTS INCORPORATED BY REFERENCE
The information required by Part III of this report, to the extent not set forth herein, is incorporated in this report by reference to the Registrant’s definitive proxy statement relating to its 2018 annual meeting of stockholders. The definitive proxy statement or annual report on Form 10-K/A will be filed with the Securities and Exchange Commission within 120 days after the end of the 2017 fiscal year.
|
|
|
Page |
|
|
3 |
|
|
PART I |
|
|
|
Item 1. |
4 |
|
|
Item 1A. |
12 |
|
|
Item 1B. |
42 |
|
|
Item 2. |
42 |
|
|
Item 3. |
42 |
|
|
Item 4. |
42 |
|
|
|
|
|
|
PART II |
|
|
|
Item 5. |
43 |
|
|
Item 6. |
45 |
|
|
Item 7. |
Management’s Discussion and Analysis of Financial Condition and Results of Operations |
47 |
|
Item 7A. |
68 |
|
|
Item 8. |
70 |
|
|
Item 9. |
Changes in and Disagreements With Accountants on Accounting and Financial Disclosure |
102 |
|
Item 9A. |
102 |
|
|
Item 9B. |
103 |
|
|
|
|
|
|
PART III |
|
|
|
Item 10. |
104 |
|
|
Item 11. |
104 |
|
|
Item 12. |
Security Ownership of Certain Beneficial Owners and Management and Related Stockholder Matters |
104 |
|
Item 13. |
Certain Relationships and Related Transactions, and Director Independence |
104 |
|
Item 14. |
104 |
|
|
|
|
|
|
PART IV |
|
|
|
Item 15. |
105 |
|
|
Item 16. |
109 |
As used in this report, the terms “Impinj,” “the Company,” “we,” “us” and “our” refer to Impinj, Inc., unless the context indicates otherwise.
NOTE REGARDING FORWARD-LOOKING STATEMENTS
This report contains certain forward-looking statements within the meaning of Section 27A of the Securities Act of 1933, as amended, and Section 21E of the Securities Exchange Act of 1934, as amended. Statements containing words such as “may,” “believe,” “anticipate,” “expect,” “intend,” “plan,” “project,” “projections,” “business outlook,” “estimate,” or similar expressions constitute forward-looking statements. You should read these statements carefully because they discuss future expectations, contain projections of future results of operations or financial condition or state other “forward-looking” information. These statements relate to our future plans, objectives, expectations, intentions and financial performance and the assumptions that underlie these statements. They include, but are not limited to, statements about:
|
|
• |
our market opportunity; the adoption of RAIN RFID technology and solutions; our ability to compete effectively against competitors and competing technologies; and our market share and technology leadership; |
|
|
• |
our future financial performance, including our average selling prices and gross margins and future macroeconomic conditions; |
|
|
• |
the performance of third parties on which we rely for product manufacture, assembly and testing; and our relationship with third parties on which we rely for product distribution, sales, integration and development; |
|
|
• |
our ability to adequately protect our intellectual property; the regulatory regime for our products and services; and |
|
|
• |
our leadership of standards-setting processes. |
Our actual results may differ materially from those contained in or implied by any forward-looking statements. Factors that could cause or contribute to these differences include those discussed below and elsewhere in this report, including those factors discussed in Part I, Item 1A (Risk Factors).
In light of the significant uncertainties and risks inherent in these forward-looking statements, you should not regard these statements as a representation or warranty by us or anyone else that we will achieve our objectives and plans in any specified time frame, or at all, or as predictions of future events. Moreover, neither we nor any other person assumes responsibility for the accuracy and completeness of the forward-looking statements. We undertake no obligation to publicly update any forward-looking statements, whether as a result of new information, future events or otherwise, except as required by law.
3
Our vision is digital life for everyday items. We are driving toward a future in which everyday physical items have digital counterparts, digital twins, in the cloud, and in which businesses and people engage with trillions of those everyday physical items via their digital twins. Our mission is to deliver a platform that powers that item-to-cloud connectivity, enabling developers to innovate Internet-of-Things, or IoT, applications on our platform. Today, we deliver the identity, location and authenticity of billions of physical items; our future is enabling those cloud-based digital twins, each storing an individual item’s ownership, history and available services, and enabling ubiquitous access to them. We believe the item-to-cloud connectivity we will deliver will enhance businesses efficiencies and commerce and, ultimately, improve peoples’ lives.
Opportunity
Our platform connects individual items, capturing and delivering data about each item from manufacturing, through distribution to sale. We envision a future where we extend and deliver an item’s digital life to the person that purchases and owns it. We and our channel partners connect items via a miniature radio chip embedded in the item or in its packaging, reading and delivering the item’s unique identity, location and authenticity to business and consumer applications. To date, we have enabled connectivity to more than 25 billion items, enabling retailers, hospitals, airlines, automotive manufacturers and business in many other industries to derive timely business value from those connected items. Our opportunity is to connect billions, ultimately possibly trillions of everyday items, and to deliver valuable information about these items not just to businesses, but also to people.
Our platform connects everyday items using RAIN, a radio-frequency identification, or RFID, technology we pioneered. We spearheaded development of the RAIN radio standard, lobbied governments to allocate frequency spectrum and cofounded the RAIN Industry Alliance which today has more than 150 member companies. Today, the RAIN RFID industry uses the RAIN radio standard nearly exclusively, has access to radio spectrum freely available in 78 countries encompassing roughly 96.5% of the world’s GDP and has connected tens of billions of items. We believe RAIN’s unique capabilities – unique identifiers for individual items, battery-free operation, low cost, long range, not line-of-sight, 1,000 reads per second, designed to have essentially unlimited life and available cryptographic item authentication – position RAIN to be the leading item-to-cloud connectivity technology for the IoT.
RAIN market adoption has historically been slower than anticipated or forecasted by us and industry sources. For additional information related to RAIN market adoption, please see the section of this report captioned “Risk Factors.”
Impinj Platform
Our platform comprises software, connectivity, and endpoint integrated circuits, or ICs, that together deliver item data to business applications. We link the layers of our platform to deliver advanced capabilities and performance that surpasses mix-and-match solutions built from competitor products. Within each layer we sell one or more product families.
Software
Our primary software offering, ItemSense, is a distributed operating system for our platform. ItemSense transforms item-level RAIN data into actionable business information, enabling analytics and insights about items a business manufactures, transports and sells. ItemSense’s key capabilities include enterprise-class RAIN deployment management and health monitoring; software-defined algorithms for item inventory and location determination; and easy-to-use, easy-to-integrate APIs that enable application developers to quickly build powerful IoT solutions on our platform to solve business problems.
4
Our connectivity offering comprises a family of readers, gateways and reader ICs that wirelessly identify, locate, authenticate and engage items. Our connectivity products wirelessly provide power to, and communicate bidirectionally with, endpoint ICs on those items, identifying and locating up to 1,000 items per second.
Readers read, write, authenticate or otherwise engage endpoint ICs on items. Gateways integrate stationary readers with scanning antennas to locate and track items. Our readers and gateways are easy to deploy and use, can be powered via power-over-Ethernet and are certified for operation in more than 40 countries. Our customers have deployed our readers and gateways in applications ranging from retail inventory-taking to automated fuel filling to shipping-container tracking to airport luggage handling.
Our stationary reader product family, branded Speedway, comprises high-performance finished products. We sell our Speedway readers through an established channel of distributors, system integrators, or SIs, value-added resellers, or VARs, and solution providers. Our readers sell for hundreds of dollars.
Our gateway product family integrates our Speedway readers with beamforming antennas to electrically steer a radio beam like a searchlight. Their always-on, autonomous operation delivers timely item data without ongoing labor costs. Our portal gateways, branded xPortal and xSpan, scan doorways or hallways such as front-to-back store transitions, entryways and exits. Our array gateway, branded xArray, scans up to 1,500 square feet of floor space such as in a store, manufacturing facility or hospital room. Our gateways sell for thousands of dollars.
Our reader ICs and modules, branded Indy, comprises a suite of ICs and modules that combine our reader ICs with peripheral circuitry in an easy-to-use format. We sell our reader ICs and modules to original equipment manufacturing, or OEM, and original design manufacturing, or ODM, partners that use them in a variety of products such as mobile or handheld readers, fixed readers, gateways, and RAIN-enabled appliances. We offer easy-to-use APIs, development environments, sample code, drivers and libraries. We sell our reader ICs and modules for tens of dollars.
Endpoints ICs
Our endpoint IC product family, branded Monza, comprises a family of miniature radios-on-a-chip that attach-to and uniquely identify their host items. Monza ICs include a number to identify a host item and may also include features such as user data storage, security, authentication, loss prevention, consumer privacy and value-added Impinj custom features, all accessible by our platform. Our Monza ICs power themselves from a reader’s radio waves so they do not need a battery, can wirelessly connect almost any item and, are readable to 30 feet without line-of-sight, yet they sell for pennies.
Our OEM partners attach each Monza IC to a thin printed antenna on a paper or Mylar backing, then typically cover the composite inlay with a paper face to form a tag. End customers attach the tag to an item in markets including retail, healthcare, automotive, industrial and manufacturing, consumer experience, food, datacenter, travel and banking. We refer to a tag and its host item as an endpoint.
Endpoint ICs differ from traditional silicon ICs in that most endpoint ICs are disposable. For example, when consumers purchase retail items they discard the price tags containing the endpoint ICs. We believe endpoint ICs are the first market for consumable silicon and are a recurring revenue source for us. We have shipped more than 25 billion endpoint ICs to date, including approximately 7.1 billion and 6.0 billion in 2017 and 2016, respectively.
Industry Use Cases
The following use cases are representative of actual RAIN deployments we serve today.
Retail
Retailers, both traditional “brick-and-mortar” and online, are consuming billions of tags each year to obtain real-time data about products they manufacture, transport and sell. By using our platform retailers can obtain these benefits:
5
|
|
• |
Omnichannel Operations. Omnichannel retailing is about selling products when, where and how customers want to buy—but retailers can’t sell what they can’t see. The cornerstone of a successful omnichannel operation is real-time inventory visibility that provides accurate item information in stores, distribution and fulfillment centers. With real-time inventory visibility delivered by our platform, omnichannel retailers can efficiently sell inventory distributed across all their retail locations. |
|
|
• |
Store Operations. Accurate inventory data is key to an efficient, optimized retail organization. But many retailers are stuck doing things the old way—manually counting items. And the data are outdated soon after they complete a cycle count. The Impinj platform delivers timely information about items in retail stores and warehouses, enabling retailers to confidently sell down to the last item in stock, know what products are popular, and help customers shop in their stores. |
|
|
• |
Enhanced Shopper Experiences. Capturing customer attention as they step foot in a store with seamless interactive item-based experiences helps sell those items. The Impinj platform enables interactive in-store applications such as digital signs, magic mirrors and self-checkout kiosks. These interactive applications grab customers’ attention, provide information during the buying decision and keep shoppers engaged in the store. |
|
|
• |
Loss Identification and Analytics. The same platform capabilities that give retailers inventory visibility can also improve loss prevention. With the Impinj platform, retailers can be alerted when items enter or leave specific zones within a store. Item identification, location and movement data can help retailers make smart decisions to protect their inventory and avoid lost sales due to missing inventory. |
Healthcare
The healthcare industry continues to focus on patient quality-of-care and operational efficiencies, increasing pressure on hospitals and healthcare providers to obtain real-time data about assets, inventory, staff and patients. By using the Impinj platform, the healthcare industry can obtain these benefits:
|
|
• |
Hospital Asset Management. The Impinj platform wirelessly connects information about an asset’s identity and location to the hospital’s enterprise systems, tracking assets as they move through the hospital. This asset visibility allows hospital staff to visualize an item’s location in real-time, improving resource usage, reducing capital expenditures and ensuring compliance with regulated processes. |
|
|
• |
Inventory Management. The Impinj platform provides accurate, real-time visibility into inventory levels in hospital supply rooms, allowing hospitals to eliminate inefficiencies including over-ordering, supply hoarding and wasted supplies. Partner solutions built on the Impinj platform include RAIN-enabled medical cabinets, refrigerators and freezers and medical kit verification. |
|
|
• |
Patient Care and Experience. By automatically tracking and managing patient and clinician workflows, healthcare providers can regain valuable time to focus on quality of care. Solutions built on the Impinj platform include ensuring patient transport equipment is available when it's needed, delivering better visibility about patient-staff interactions and automatically tracking supply usage. With the Impinj platform, hospital staff can focus on what matters most — caring for patients. |
Supply Chain and Logistics
The supply chain and logistics industry is increasingly demanding smarter, simpler and more automated operations. Using the Impinj platform they can obtain these benefits:
6
|
|
• |
Returnable Transit Item (RTI) Tracking. By tagging RTI containers that travel in and out of warehouses, the Impinj platform can reduce RTI loss and ensures a business has the RTI containers it needs to satisfy its customers. |
|
|
• |
Asset Management. The Impinj platform enables automated check-in and -out procedures, maintenance alerts and location monitoring, improving efficiencies, reducing loss and complying with maintenance schedules. |
Other Industries
Other industries are also deriving business value from RAIN. A few examples of deployments that use part or all of the Impinj Platform include:
|
|
• |
Airline. RAIN-enabled luggage tags provide passengers with the real-time location of their checked bags and reduces lost bags. |
|
|
• |
Automotive. Fueling stations use vehicle windshield tags to enable automatic, cashless fueling. |
|
|
• |
Industrial and Manufacturing. Car and aircraft manufacturers track components to ensure proper assembly, reduce labor costs and improve operations. |
|
|
• |
Consumer Experience. Marathons and other foot races track runners via endpoint ICs in race bibs; golf venues score participants’ shots via endpoint ICs inside golf balls. |
|
|
• |
Datacenter. Datacenters use our platform for asset tracking. Electronics manufacturers embed our endpoint ICs into electronic devices for processor-secured storage. |
|
|
• |
Travel. Driver licenses in some states in the United States include our endpoint ICs to speed border crossings. |
|
|
• |
Banking. Banks use our endpoint ICs for money bundles and to track information technology assets. |
|
|
• |
Linen and Uniform Tracking. Laundry providers automatically track linens and uniforms to ensure the items don’t go astray, reduce safety stock and keep supply matched to customer needs. |
Competitive Advantages
We lead the RAIN RFID market in connecting and delivering information about items. We believe we can maintain and extend our leadership position as the market grows by leveraging our competitive strengths, including:
|
|
• |
Comprehensive Platform. Impinj products provide significant value through advanced features and fuctionality, but end users who deploy the Impinj Platform gain performance, reliability and ease-of-use we believe is unequaled by “mix-and-match” systems cobbled-together from competitors’ components. We believe our success with these end users will drive broader adoption of our platform. |
|
|
• |
Market Leadership. Our platform is integrated, easy to deploy and use, versatile and applicable to many use cases, and delivers unmatched performance. We believe we are the only company with an integrated RAIN platform, and believe we have leading market share in endpoint ICs, reader ICs and stationary readers. |
|
|
• |
Broad Partner Ecosystem. Our worldwide partner ecosystem comprising more than 500 distributors, system integrators, value-added resellers, or VARs, and software solution partners as of December 31, 2017 gives us market reach, penetration and scalability we believe few, if any, of our competitors enjoy. |
7
|
|
• |
Trusted Brand. We believe our industry leadership, name recognition and reputation for innovative, high-performing and quality products have significantly contributed to our leading market position. We believe our brand is unmatched in the industry, helping us sell products and maintain our market leadership. |
Growth Strategies
To further our mission of connecting everyday items, we plan to focus on the following strategic areas:
|
|
• |
Continue Investing in Our Platform. We have made significant investments and plan to continue investing in platform functionality, software/hardware linkages, broadening our software capabilities, enhancing platform features such as item authentication and loss prevention and reducing costs. We are investing to extend our platform linkages substantially, with our next-generation reader delivering item-authentication features that our operating system will deliver as a cloud service, and our next-generation endpoint IC connecting via our platform to that cloud service. We also plan to enhance our gateway functionalities to help drive gateways as the preferred connectivity devices for retail, healthcare and other industries. |
|
|
• |
Drive End-User Adoption. We plan to deepen our platform integration with software partners and to grow our sales, support and product-development teams. These investments will allow us to expand our engagements with end users in retail, healthcare and other industries and accelerate their adoption of the Impinj Platform. We also intend to broaden our partner ecosystem and expand our solutions focus and offerings. To meet the growing demand for our products, we are expanding inventory and reducing product lead times. |
|
|
• |
Cross-Sell and Up-Sell Our Platform within our Installed Footprint. We believe the majority of RAIN deployments today use one or more of our products, positioning us for future platform cross-sell and up-sell opportunities. For example, retailers that deploy our gateways see improved inventory accuracy when using our endpoint ICs, positioning us to up-sell our platform into these retail accounts. |
|
|
• |
Expand within our Existing Customer Base. We will seek additional revenue from existing end users of our platform by expanding their deployment scope and adding new use cases. For example, retailers typically start deploying RAIN by tagging apparel. We see opportunities to expand their tagging to housewares, appliances, cosmetics and eventually all items in a store. These same retailers typically choose inventory visibility as their first use case. We see opportunities to extend their use cases for already-tagged items to omnichannel fulfillment, loss prevention, enhanced retail analytics and more. |
|
|
• |
Enable Ubiquitous Reading. We plan to invest in next-generation reader ICs to improve functionality, reduce costs, and make Impinj-based readers ubiquitous in industrial and consumer devices and facilities infrastructure. |
Sales and Marketing
Our go-to-market model prioritizes brand development, end-user awareness, lead generation and sales enablement. Our communications use web, electronic and channel programs complemented by press initiatives and industry-analyst relationships. Our solutions-marketing, business-development and solutions-architecture teams work with our partner independent software vendors, or ISVs, to enable joint solutions and joint go-to-market selling.
We deliver products and solutions that are easy for our partner ecosystem to sell and deploy. We engender preference for our platform in all sales engagements, encouraging end users to deploy our multiple products to gain full benefit from our platform. Our business development, product marketing, technical and systems engineers all actively engage partners and end customers.
8
Our sales force leverages a global partner ecosystem of distributors, SIs, VARs and ISV partners. Each regional sales team sells all of our products. We organize our sales team primarily by geography: (1) Americas, (2) Asia Pacific and (3) Europe, Middle East and Africa. We also have a small number of worldwide sales executives with expertise in endpoint and reader ICs to support the geographic sales teams. Because our operating-system software is still relatively new to the market, the revenue we derive from software is small, so we currently derive most of our revenue from connectivity product and endpoint IC sales. We sell our products as follows:
|
|
• |
Software through distributors, VARs, system integrators and other software-solution partners. |
|
|
• |
Readers and gateways primarily to VARs and system integrators through distributors. |
|
|
• |
Reader ICs and modules primarily through distribution to reader OEMs and ODMs. |
The following table presents total revenue concentrations to Avery Dennison Corporation, or Avery, Smartrac NV, or Smartrac, Arizon RFID Technology (Yangzhou) Co., LTD, or Arizon, Shang Yang RFID Technology Yangzhou Co. Ltd., or Shang Yang, and Blue Star, Inc., or Blue Star, for the periods presented:
|
|
|
Year Ended December 31, |
|
|||||||||
|
|
|
2017 |
|
|
2016 |
|
|
2015 |
|
|||
|
Revenue: |
|
|
|
|
|
|
|
|
|
|
|
|
|
Avery |
|
|
18 |
% |
|
|
14 |
% |
|
|
16 |
% |
|
Smartrac |
|
|
14 |
|
|
|
16 |
|
|
|
14 |
|
|
Arizon |
|
|
13 |
|
|
|
11 |
|
|
|
9 |
|
|
Shang Yang |
|
|
7 |
|
|
|
10 |
|
|
|
15 |
|
|
Blue Star |
|
|
10 |
|
|
|
9 |
|
|
|
10 |
|
|
|
|
|
62 |
% |
|
|
60 |
% |
|
|
64 |
% |
We engage directly with end users in collaboration with partners across our ecosystem, usually fulfilling sales through those same partners. In some instances, these end-customer engagements leverage go-to-market relationships with companies who do not sell our products but whose product offerings complement ours. Many of our partners sell multiple of our products or our entire platform.
We outsource all our product manufacturing to third-party manufacturers that build our products to our design specifications. This capital-efficient operating model scales efficiently with volume, allowing us to focus our resources on accelerating development of new products and solutions.
Taiwan Semiconductor Manufacturing Company Limited, or TSMC, fabricates our endpoint IC wafers in Asia and the United States and has been our sole endpoint IC wafer supplier since 2003. We order endpoint IC wafers on a purchase-order basis and do not have a long-term agreement with TSMC. We test the wafers at our U.S. headquarters and in Asia. We use multiple subcontractors to post-process the wafers. Our primary subcontractor for our endpoint ICs is Stars Microelectronics (Thailand) Public Company Limited, or Stars. We generally engage all our endpoint IC subcontractors on a purchase-order basis.
TowerJazz Ltd. fabricates our reader IC wafers in the United States and has been our sole reader IC wafer supplier since 2008. We order reader IC wafers on a purchase-order basis and do not have a long-term agreement with TowerJazz. We use subcontractors on a purchase-order basis to package the ICs and test the packaged parts.
9
Plexus Corp., or Plexus, manufactures our readers in Asia and has been our sole supplier since 2005. Plexus and Western Corporation in the United States have manufactured our gateways since 2013 and 2010, respectively. We order readers and gateways pursuant to nonexclusive purchase agreements that renew automatically each year, subject to each party’s right to terminate upon 180 days’ notice. We engage subcontractors on a purchase-order basis to assemble and test printed circuit boards, to build our reader and gateway enclosures and test our readers and gateways.
Research and Development
We built our company around technology leadership and innovation. We have committed, and plan to continue committing, significant resources to technology and product innovation and development. We achieved our market leadership by innovating, delivering and continuously improving product performance, features, quality and reliability while also reducing costs. In most situations, we strive to lead the market with new innovations, but we sometimes adopt a “fast follower” approach depending on the market situation. As one example, endpoint IC performance typically improves when we migrate the semiconductor processing to more advance process nodes. We execute these node migrations when the development costs, performance improvements, competitive situation and product cost reductions justify the migration. But external factors, such as the ability of our OEM and ODM partners to process larger wafers with smaller ICs can cause us to delay, or even allow our competition to temporarily lead, while we develop competitive products that we introduce when our OEM and ODM partners are ready.
We have assembled a team of skilled engineers and currently perform all research and most of our product development internally. As of December 31, 2017, we had 133 employees in research and development, of which 13 hold a Ph.D. and 37 hold a master’s degree. Research and development expenses for 2017, 2016 and 2015 were $32.2 million, $25.2 million and $17.6 million, respectively. We regularly review our technology, products, developments and product opportunities and reallocate our spending and resources accordingly.
Intellectual Property
We protect our technologies by filing patent applications, retaining trade secrets and defending and enforcing our intellectual-property rights where appropriate. To date, our intellectual property portfolio includes 233 issued and allowed U.S. patents, 20 pending U.S. patent applications and two pending international patent applications. The first of our 175 issued utility patents expire in 2024 and the first of our 26 issued design patents expire in 2021. To protect confidential information not otherwise subject to patent protection, we rely on trade secret law and enter into confidentiality agreements with our employees, customers, suppliers and partners.
Because most RAIN product SKUs are used in, or imported into, the United States, and because many of our partners and end customers have U.S. operations, we believe U.S. patents hold the most value for our business. Consequently, we have filed primarily U.S. patent applications. We have a small number of pending foreign patent applications but none have yet allowed or issued. Because our portfolio currently contains only U.S. patents, we have limited ability to assert our intellectual-property rights outside the United States.
Although our patents and trade secrets constitute valuable assets, we do not view any one of them as material. Instead, we believe the totality of our patent and trade-secret portfolio creates an advantage for our business.
We have entered into licensing, broad-scope cross-licensing and other agreements authorizing us to use or to operate within the scope of patents and intellectual property owned by third parties. For example, we have licenses to third-party intellectual property that we use in our products. As another example, by participating in developing GS1 EPCglobal protocols, such as the RAIN radio protocol, we agreed to license those of our patents necessarily infringed by the practice of these protocols on a royalty-free basis to other GS1 EPCglobal members, subject to reciprocal royalty-free rights from those members. By participating in developing ISO standards, we have agreed to grant to all users worldwide a license to those of our patents necessarily infringed by the practice of several ISO standards, including non-RAIN standards, on reasonable and nondiscriminatory terms, subject to reciprocity.
We own a number of trademarks, develop names for our new products and secure trademark protection for them, including domain name registration, in relevant jurisdictions.
10
We, along with Google, Intel and Smartrac, cofounded the RAIN Industry Alliance in 2014. Our chief executive officer is presently an Alliance Director and was previously the Alliance Chairman. The Alliance is a global organization promoting the universal adoption of RAIN technology and solutions with more than 150 members as of the date of this report. The name “RAIN” connotes ubiquity and a close link to cloud data.
We, our customers, partners and competitors developed the RAIN radio protocol, UHF Gen2 (standardized as ISO/IEC 18000-63) in 2004, with us as the editor. Our community delivered a backwards-compatible update in 2013, again with us as the editor. Our industry uses Gen2 nearly exclusively.
By participating in GS1 EPCglobal, which produced Gen2, and ISO, which ratified 18000-63, as well as in other standards bodies, we agreed to license certain patents as described in the section captioned “Intellectual Property.”
Government Regulations
Government regulations require us to certify our readers and gateways in jurisdictions where they operate. For example, we certify our readers and gateways to Federal Communications Commission regulations to operate in the United States and its territories. Currently, our Speedway readers are certified for operation in more than 40 countries worldwide including the United States, Canada, Mexico, China, Japan, South Korea and all of the European Union. Our gateway products have the same or fewer certifications, depending on the recency of the product introduction; we plan to eventually certify them in all countries with compelling market opportunities.
Competition
We believe we are the only company in our industry with a platform spanning software, connectivity and endpoints. Our competitors compete with us with respect to some, but not all, of our business. Our principal competition in our platform layers include:
|
|
• |
Software. Zebra Technologies Corporation, or Zebra, and Mojix, Inc. |
|
|
• |
Readers and Gateways. Alien Technology Corporation, or Alien, and Zebra., both of which also purchase our reader ICs. |
|
|
• |
Reader ICs. STMicroelectronics N.V. and Phychips Inc. |
|
|
• |
Endpoint ICs. NXP B.V., or NXP, and Alien. In October 2016, Qualcomm Incorporated, or Qualcomm, announced it entered into a definitive agreement to acquire NXP. Qualcomm could use this acquisition as an entry point into the endpoint IC market. |
The market for our platform and products is relatively new and highly competitive. We believe competition will increase as the market grows and RAIN technology continues to advance. New entrants could enter our market at any time, creating additional competition in the future. The competitive factors that impact our platform and product sales include:
|
|
• |
portfolio, performance, features, lead times, reliability and price; |
|
|
• |
support, ease of use and availability of reference designs; |
|
|
• |
development tools and API availability (except in the endpoint IC market); |
|
|
• |
integration and certification with end-user applications; and |
|
|
• |
company reputation. |
Although we believe we compete favorably on the above factors, our future competitiveness will depend upon our ability to design, develop and deliver compelling solutions. We occasionally experience competitive pressures due to prevailing exchange rates as our product pricing is denominated in U.S. dollars. In addition, our competitive position depends on our ability to continue to attract and retain talent while protecting our intellectual property. For additional information on the risks associated with our business, see “Risk Factors.”
11
As of December 31, 2017, we had 311 employees, with 282 of those in the United States, 13 in the Asia Pacific region, 15 in Europe and one in Latin America. None of our employees are represented by a labor union, and we believe our employee relations are excellent.
We use four words to capture the essence of our corporate culture—innovation, action, commitment and team. We believe our culture is essential to the health and success of our business and aligns our employees around a set of behaviors and actions that foster passion and commitment.
Facilities
We are headquartered in Seattle, Washington. Our current facilities in Seattle has approximately 81,000 square feet under leases that expire between October 2018 and December 2026.
Legal Proceedings
As of the date of this report, we are not a party to any material legal proceedings. In the normal course of business, we may be named as a party to various legal claims, actions and complaints. We cannot predict whether any resulting liability would have a material adverse effect on our financial position, results of operations or cash flows.
Financial Information about Segments and Geographic Revenue
We operate as one operating segment. See Note 12 to our audited consolidated financial statements included in this report. For financial information regarding our business, see Part II—Item 7—“Management's Discussion and Analysis of Financial Condition and Results of Operations” of this report and our audited consolidated financial statements and related notes included elsewhere in this report.
We were incorporated in Delaware in April 2000. Our principal executive office is located at 400 Fairview Avenue North, Suite 1200, Seattle, Washington 98109. Our telephone number is (206) 517-5300. Our website is www.impinj.com. Information contained in, or that can be accessed through, our website is not a part of, and is not incorporated into, this report.
Where You Can Find More Information
Our filings with the Securities and Exchange Commission, or SEC, including our annual reports on Form 10-K, quarterly reports on Form 10-Q, current reports on Form 8-K, and amendments to those reports, are available on our website at www.investor.impinj.com as soon as reasonably practicable after the electronic filing of these reports with the SEC. The information contained on our website is not a part of this report or any other document we file with the SEC.
You should carefully consider the following risk factors, in addition to the other information contained in this report, including the section of this report captioned “Management’s Discussion and Analysis of Financial Condition and Results of Operations” and our financial statements and related notes. If any of the events described in the following risk factors and the risks described elsewhere in this report occurs, our business, operating results and financial condition could be seriously harmed. This report also contains forward-looking statements that involve risks and uncertainties. Our actual results could differ materially from those anticipated in the forward-looking statements as a result of factors that are described below and elsewhere in this report.
12
Risks Relating to Our Business and Industry
RAIN market adoption is uncertain. If RAIN market adoption does not continue to develop, or develops more slowly than we expect, our business will suffer.
The RAIN market is relatively new and, to a large extent, unproven. RAIN technology and product adoption, including that of Impinj’s products and platform, will depend on numerous factors, including:
|
|
• |
whether end users embrace the benefits we believe RAIN offers, and if so whether RAIN will achieve and sustain high demand and market adoption; |
|
|
• |
whether end users perceive that the benefits of RAIN adoption outweigh the cost and time to install, replace or modify their existing systems and processes; and |
|
|
• |
whether the technological capabilities of RAIN products and applications meet end users’ current or anticipated needs. |
The adoption of RAIN technology and products has historically been slower than anticipated or forecasted by us and industry sources. Our industry has also experienced periods of accelerated adoption that were not sustained. For example, RAIN adoption accelerated in 2016, but then decelerated in 2017, in part, we believe, due to delays in the implementation of planned programs by certain large retailers. Near-term RAIN adoption depends on large organizations with market influence, particularly in the retail industry, continuing to deploy RAIN solutions. Long-term RAIN market growth will depend on adoption by other industries and government agencies. End users and our prospective customers may not be familiar with our products or RAIN in general, or may use other products and technologies to identify, locate, authenticate, engage, track and prevent loss of their items. Additionally, even if prospective customers are familiar with RAIN, our products or platform, a negative perception of, or experience with, RAIN or a competitor’s RAIN products may deter them from adopting RAIN or our products or platform. Before they adopt RAIN, businesses, government agencies and other organizations may need education on the benefits of using RAIN in their operations, and how they outweigh the costs, including potentially significant costs of modifying or replacing existing systems and processes. These educational efforts may not be successful, and organizations may decide that the costs of adopting RAIN outweigh the benefits, or may decide to defer near term RAIN adoption in favor of a more advanced or comprehensive future deployment. Failure of organizations to adopt RAIN generally, and our products and platform specifically, for any reason will hurt the development of our market and, consequently, impair our business and prospects.
Fluctuations in the adoption of RAIN may affect our ability to forecast our future operating results, including revenue, gross margins, cash flows and profitability. Moreover, to ensure adequate inventory supply, we must forecast inventory needs and expenses and place orders sufficiently in advance with our suppliers and contract manufacturers based on our estimates of future demand for particular products. In the near term, we expect to invest significantly in endpoint IC and gateway inventory to support the projected growth in our business. Our failure to accurately forecast demand for RAIN solutions may cause us to experience excess inventory levels or a shortage of products available for sale.
If RAIN adoption by retailers does not continue at the rate we expect, our business will be adversely affected.
The retail apparel industry leads RAIN adoption, and end users in the retail industry were the largest consumers of our endpoint ICs in 2016. We believe the retail industry is a leading indicator of RAIN market adoption and if large apparel retailers in particular continue adopting our platform then adoption within the retail industry and in other industries will accelerate. As such, the retail industry is one of our key strategic areas of focus.
13
If retailers or others deploying RAIN fail to realize demonstrable benefits from RAIN or delay or abandon their deployments, overall RAIN market acceptance may be materially and adversely affected. For example, in 2017, we believe our growth decelerated due, in part, to delays in the implementation of planned programs by certain large retailers. This contributed toward sequential declines in endpoint IC sales in the third and fourth quarters of 2017. In addition, retailers that have a primarily physical presence in the marketplace have experienced financial stress in recent periods. Many of these retailers have deployed RAIN to improve competitiveness; however, if they fail to compete effectively, the number of stores they maintain, and thus the scope of their RAIN deployments, may decrease significantly. Any widespread delay, slowdown or failure by retailers or other organizations to implement RAIN-based systems generally, and our products and platform specifically, will materially and adversely affect our business, operating results, financial condition and long-term prospects.
If we are unsuccessful in fostering meaningful adoption of our products and platform by end users other than retailers, our business prospects may be adversely affected.
We expect end users to deploy our platform in sectors beyond retail, including, for example, healthcare and logistics. If we fail to make our products and platform an easy-to-deploy, economical solution for use cases in these other sectors, our ability to penetrate them may suffer and our business prospects may be adversely affected.
We have a history of losses and have only achieved profitability intermittently. We cannot be certain that we will increase or sustain profitability in the future.
We have incurred losses since our inception in 2000. While we were profitable between 2013 and 2015, we had a net loss of $17.3 million for 2017 and an accumulated deficit of $204.5 million as of December 31, 2017. Our ability to regain or sustain profitability depends on numerous factors, many of which are out of our control, including continued RAIN adoption, our market share and our margins. We expect significant expenditures to support operations, product development, and business and headcount expansion in sales, engineering, and marketing as a public company. If we fail to increase our revenue or manage our expenses, we may not increase or sustain profitability in the future.
Fluctuations in our quarterly and annual operating results may adversely affect our business, prospects and stock price.
You must consider our business and prospects in light of the risks and difficulties we encounter in the uncertain and rapidly evolving RAIN market. Because this market is new and evolving, predicting its future growth rate and size is difficult. The rapidly evolving nature of the markets in which we sell our products, as well as other factors that are beyond our control, reduce our ability to accurately evaluate our future prospects and forecast quarterly or annual performance.
End users drive demand for our products. Because we sell nearly all of our products through channel partners, our ability to determine and forecast end-user demand is limited. For example, our 2016 endpoint IC sales exceeded both our expectations and those of our industry’s analysts due in large part to several coincident large-scale deployments. However, in the second quarter of 2017 several large end users that had planned 2017 deployments delayed or slowed those deployments, leading us to reduce expectations for endpoint IC growth for the year. This volatility for demand for RAIN solutions makes accurate forecasting difficult. In addition, we rely on our channel partners to integrate our products with end-user information systems and this integration has been uneven and unpredictable in scope, timing and implementation. Partly as a consequence, in the past, both we and other industry participants have at times overestimated the RAIN market size and growth rates, then failed to meet expectations.
To date, we have had limited success in accurately predicting future sales of our products and platform. Due to our shorter lead-times for endpoint ICs, we are increasingly receiving customer orders and shipping the products within a quarter. A shortened sales cycle decreases our ability to accurately predict both optimal inventory supply and order volume for a quarter. Additionally, customer orders for readers and gateways are generally weighted toward the end of a quarter. If we do not have adequate supply of readers and gateways to fulfill the orders within a quarter or if we do not accurately predict the sales cycle for reader and gateways, sales of some sizeable transactions might extend into a subsequent quarter. We expect that for the foreseeable future our visibility into future sales, including both volumes and prices, will continue to be limited. This poor visibility may cause fluctuations in our operating results, particularly on a quarterly basis, that we are unable to predict as well as failure to achieve our expected operating results.
14
In addition, if endpoint IC sales (one indicator of market adoption) exceed expectations or if we discount prices to win a particularly large opportunity or in response to competition, our revenue and profitability may be positively affected, but gross margins may be negatively affected depending on product mix for the applicable period. If research analysts or investors perceive such product mix shift negatively, the trading price of our common stock could be adversely affected.
Numerous other factors, many of which are outside our control, may cause or contribute to significant fluctuations in our quarterly and annual operating results. These fluctuations may make financial planning and forecasting difficult. In addition, these fluctuations may result in unanticipated decreases in our available cash, which could negatively affect our business and prospects. Factors that may contribute to fluctuations in our operating results and revenue include:
|
|
• |
variations in RAIN adoption and deployment delays by end users; |
|
|
• |
fluctuations in demand for our products or platform, including by tag manufacturers and other significant customers on which we rely for a substantial portion of our revenue; |
|
|
• |
fluctuations in the available supply of our products; |
|
|
• |
variations in the quality of our products and return rates; |
|
|
• |
declines in selling prices for our products; |
|
|
• |
delays in our product-shipment timing, customer or end-user sales or deployment cycles, or work performed under development contracts; |
|
|
• |
intellectual property disputes involving us, our customers, end users or other participants in our industry; |
|
|
• |
adverse outcomes of litigation or governmental proceedings; |
|
|
• |
timing variability in product introductions, enhancements, services, and technologies by us and our competitors and market acceptance of these new or enhanced products, services and technologies; |
|
|
• |
unanticipated excess or obsolete inventory as a result of supply-chain mismanagement, new-product introduction, quality issues or otherwise; |
|
|
• |
changes in the amount and timing of our operating costs, including those related to the expansion of our business, operations and infrastructure; |
|
|
• |
changes in business cycles or seasonal fluctuations that may affect the markets in which we sell; |
|
|
• |
changes in industry standards or specifications, or changes in government regulations, relating to RAIN, or Impinj’s products or platform; |
|
|
• |
late, delayed or cancelled payments from our customers; and |
|
|
• |
unanticipated impairment of long-lived assets and goodwill. |
A substantial portion of our operating expenses are fixed for the short-term, and as a result, fluctuations in revenue or unanticipated expenses can have a material and immediate impact on our profitability. The occurrence of any one of these risks could negatively affect our operating results in any particular period, which could cause the price of our common stock to decline.
Our market is very competitive. If we fail to compete successfully, our business and operating results will suffer.
We face significant competition from both established and emerging competitors. We believe our principal current competitors are: in readers and gateways, Zebra Technologies Corporation and Alien Technology Corporation, or Alien; in reader ICs and modules, STMicroelectronics N.V. and Phychips Inc.; and in endpoint ICs, NXP Semiconductors N.V., or NXP, which in October 2016 entered into a definitive agreement to be acquired by Qualcomm, and Alien. Our channel partners, including distributors, system integrators, or SIs, value-added resellers, or VARs, and software solution partners, may enter our market and compete with us rather than purchase our products, which would not only reduce our customer base but also increase competition in the market, adversely affecting our operating results, business and prospects. In addition, companies in adjacent markets or newly formed companies may decide to enter our market, particularly as RAIN adoption grows. For example, Qualcomm could use its NXP acquisition as an entry point into the RAIN market.
15
Competition for customers is intense. Because the RAIN market is evolving rapidly, winning customer and end-user accounts at an early stage in the development of the market is critical to growing our business. End users that instead use competing products and technologies may face high switching costs, which may affect our and our channel partners’ ability to successfully convert them to our products. Failure to obtain orders from customers and end users, for competitive reasons or otherwise, will materially adversely affect our operating results, business and prospects.
Some of our competitors may devote more resources than we can to the development, promotion, sale and support of their products. Our competitors include companies that have much greater financial, operating, research and development, marketing and other resources than us. These competitors may discount their products to gain market share. In doing so, they could simply accept smaller margins or they could maintain margins by achieving cost savings through better, more efficient designs or production methods. To gain share, competitors could also bundle near-field communication, or NFC, products with RAIN products, or stationary readers with handheld readers. New competitors could enter the gateway market or develop RAIN platforms or solutions. Larger or more established companies may deliver and directly compete with our products or platform. Smaller companies could launch new products and applications we do not offer and could gain market acceptance quickly. Moreover, consolidation in the RAIN industry could intensify the competitive pressures that we face. Many of our existing and potential competitors may be better positioned than we are to acquire other companies, technologies or products.
Some of our customers have policies requiring diverse supplier bases to enhance competition and maintain multiple RAIN product providers. They do not have an interest in purchasing exclusively from one supplier or promoting a particular brand. Our ability to increase order sizes from these customers and maintain or increase our market share is constrained by these policies. In addition, any decline in quality or availability of our products or any increase in the number of suppliers that such a customer uses may decrease demand for our products and adversely affect our operating results, business and prospects.
We cannot assure you that our products will continue to compete favorably or that we will be successful in the face of increasing competition from new products, or enhancements introduced by our existing competitors, or new companies entering our market. In addition, we cannot assure you that our competitors do not have, or will not develop, processes or product designs that currently or in the future will enable them to produce competitive products at lower costs than ours. Any failure to compete successfully will materially adversely affect our business, prospects, operating results and financial condition.
Downturns in the industries we serve, particularly retail, may adversely affect our business.
Worldwide economic conditions have exhibited significant fluctuations in the past, and customers remain guarded with respect to market volatility and uncertainty. As a consequence, we and our customers have had difficulty forecasting and planning future business activities accurately. Volatile economic conditions could cause our customers or end users to reduce their capital-expense budgets, which could decrease spending for our products resulting in delayed and lengthened deployment, a decrease in sales or a loss of sales opportunities. The retail industry is subject to volatility, especially during uncertain economic conditions. A downturn in the retail industry in particular may disproportionately affect us because retailers comprise a significant portion of the RAIN end users. We cannot predict the timing, strength or duration of any economic slowdown or recovery, whether global, regional or within specific markets. If the conditions of the general economy or markets in which we operate worsen, our business could be harmed.
If we fail to obtain quality products in adequate quantity and in a timely and cost-effective manner, our operating results and growth prospects will be adversely affected.
We do not own or operate manufacturing facilities. Currently, all our endpoint IC wafers are manufactured by Taiwan Semiconductor Manufacturing Company Limited, or TSMC, and primarily post-processed by our subcontractor Stars Microelectronics (Thailand) Public Company Limited, or Stars; all our reader IC wafers are manufactured by Tower Semiconductors Ltd., or TowerJazz, and our modules are manufactured by Stars and Microelectronics Technology Inc., or MTI; and all our readers and gateways are manufactured by Plexus Corp., or Plexus, or Western Corporation. We also use subcontractors for post-processing, assembly and testing.
We do not control our manufacturers’ or subcontractors’ ability or willingness to meet our supply requirements.
16
Currently, we do not have long-term supply contracts with TSMC, TowerJazz, MTI, Plexus or Western Corporation, and neither they nor our subcontractors are required to supply us with products for any specific period or in any specific quantity. Suppliers can allocate production capacity to other companies’ and reduce deliveries to us on short notice. Our suppliers may allocate capacity to other companies, which could impair our ability to secure sufficient product supply for sale.
Some components of our products have very long lead times, so we place orders with some of our suppliers five or more months before our anticipated product delivery dates to our customers. We base these orders on our customer-demand forecasts. If we inaccurately forecast this customer demand then we may be unable to obtain adequate and cost-effective components, or foundry or assembly capacity to meet our customers’ delivery requirements, or we may accumulate excess inventory.
Manufacturing capacity may not be available when we need it or at reasonable prices. For example, in 2010 we experienced wafer shortages from TSMC relative to our submitted endpoint IC wafer purchase orders because of high worldwide demand for semiconductor foundry capacity. These shortages adversely affected our ability to meet our customers’ demand and, in some cases, caused customers to cancel orders, qualify alternative suppliers or purchase from our competitors. As another example, in mid-2016, as a consequence of rapid growth in endpoint IC demand, we depleted our endpoint IC buffer stock and were temporarily unable to satisfy demand for all customers, causing some customers to purchase from alternative suppliers even as we increased our wafer orders from TSMC, ramped up our wafer post-processing and rebuilt our inventory. In response to any future shortages, our customers may act similarly or, alternatively, may overbuy our products, which could artificially inflate sales in near-term periods while leading to sales declines in future periods as our customers consume their accumulated inventory.
At times, our suppliers ask us to purchase excess products to ensure we do not face a subsequent shortage. For example, in certain quarters of 2014, 2015 and 2016, we purchased more wafers from TSMC than required, which affected our available cash for that quarter. In addition, we may invest significantly in inventory to support anticipated growth in our business, as we have done with endpoint IC inventory in 2017. If we are unable to sell the additional inventory we purchased, or if we must sell it at lower prices due to obsolescence, our operating results may be adversely affected.
If our suppliers fail to deliver products at reasonable prices or with satisfactory quality levels then our ability to bring products to market and our reputation could suffer. For example, if supplier capacity diminishes, including from a catastrophic loss of facilities or otherwise, we could have difficulty fulfilling our orders, our revenue could decline and our growth prospects could be impaired. We anticipate requiring three to 18 months to transition our assembly services or foundries to new providers. Such a transition would likely require a qualification process by our customers or end users, which could also adversely affect our ability to sell our products and our operating results. Moreover, in the event of a suspected quality issue, the process of testing suspect products and diagnosing and fixing defects could be time consuming and costly, and could constrain our ability to supply customers with product.
If we are unsuccessful introducing new products and enhancements, our operating results will be harmed.
To keep pace with technology developments, satisfy increasingly stringent end-user requirements and achieve market acceptance, we plan to introduce new products and solutions. We commit significant resources to developing these new products and solutions while improving performance, reliability and reducing costs. For example, we are investing substantial resources to develop and enhance our operating-system software but do not expect to realize material revenue from this software in the near future. The market for our software is nascent, and we need to create market awareness of its benefits to drive end-user adoption. Creating market awareness includes promoting our software as a foundation on which end users, ISVs, consultants, SIs, and others can develop applications that meet end-user needs and drive adoption. We may be late in delivering or improving our software to meet our partners’ or end users’ needs. In addition, we have limited experience developing and selling software products and cannot be certain that our proposed pricing model, sales strategy, or software quality and reliability will be successful. We rely on and must train our channel partners to sell, develop applications for and integrate our software with end users’ systems, but we cannot guarantee that we or they will be successful doing so. We believe that we must continue to dedicate a significant amount of resources to our development efforts to develop and maintain our competitive position. We also cannot be certain that our software will generate revenue from these investments for several years, if it all, or that such revenue will exceed the investment we are committing to develop and deploy our software.
17
The success of a new or enhanced product is impacted by accurate forecasts of long-term market demand. For example, our xArray and xSpan gateways are relatively new products that incorporate enhanced technological features, but we cannot be certain whether demand for such gateways will develop as forecasted. We may also fail to anticipate or meet market requirements for new features and functionality. By focusing on certain new products and industries, we may miss opportunities for other products and applications that may be more widely adopted.
If we are unable to develop new products and services using new or enhanced technologies, our competitive position will be adversely affected.
In the future, we may not succeed in developing the underlying technologies or processes necessary to create new or enhanced products and services, or license or otherwise acquire these technologies from third parties. In some instances we may be late to market with our innovations, or may choose to be a “fast follower” but subsequently be unable to overcome the lead we gave to our competition. The success of a new or enhanced product depends on technological developments, market positioning and timing, as well as on various implementation factors, including:
|
|
• |
our timely and efficient completion of the design process; |
|
|
• |
our timely and efficient implementation of manufacturing, assembly and testing procedures; |
|
|
• |
product or service performance; |
|
|
• |
product certification; |
|
|
• |
our ability to attract, retain and manage technical personnel; |
|
|
• |
the quality, reliability and selling price of the product or service; and |
|
|
• |
effective marketing, sales and service. |
If we are unable to develop new products, features and services to compete effectively, our market share could be adversely affected, which would harm our business, financial condition and operating results.
An inability or limited ability of enterprise systems to exploit RAIN information may adversely affect the market for our products.
A successful end-user RAIN deployment requires not only tags and readers or gateways, but integration with information systems and applications that derive business value from endpoint data. Unless technology providers continue developing and advancing business-analytics tools, and end users install or enhance their information systems and applications to use these tools, deployments of RAIN products and applications could stall. Our efforts to foster development and deployment of these tools by providing software that delivers item-level data could fail. In addition, our guidance to business-analytics tool providers for integrating our products with their tools could prove ineffective.
Solution providers and systems integrators form an essential part of the RAIN market by providing deployment know-how to end users who are unable to deploy RAIN solutions on their own. Our efforts to train and support these solution providers and systems integrators could fail. Further, integrating our products with end-user information systems could prove more difficult or time consuming than we or they anticipate, which could delay deployments. If end users are unable to successfully exploit RAIN data, or if we are unable to support solution providers or systems integrators adequately, or if deployments of our platform are delayed, we could see a material adverse impact on our business, operating results, financial condition or prospects.
Our reliance on a small number of customers could adversely affect our business and operating results.
We sell our endpoint ICs directly to inlay and tag original equipment manufacturers, or OEMs, and original design manufacturers, or ODMs. In 2017, sales to Avery, Smartrac, Arizon and Blue Star accounted for 18%, 14%, 13% and 10% of our total revenue, respectively. This sales concentration to a relatively small number of tag OEMs lowers our bargaining power, and increases the risk that our pricing or sales could decline quickly based on aggressive pricing or sales measures taken by our competitors or our own failure to compete effectively.
We sell our reader ICs and modules to reader OEMs and ODMs, and our readers and gateways to VARs and SIs, primarily through distribution. We are beginning to sell software through these same partners as well as through ISV partners. We have experienced in the past and may again experience in the future purchasing delays or disruptions by some of these channel partners due to conditions within their organizations that are independent of market demand for our products or the RAIN market generally.
18
Although our strategy is to diversify our partner base by pursuing increased orders from smaller partners, add new partners, and increase end-user demand for our products, we cannot assure you we will succeed in doing so. The number of tag OEMs may decrease by consolidation or otherwise. Even if we are successful in obtaining and retaining new partners, our small number of existing large tag OEMs may continue to account for a substantial portion of our future sales. Changes in markets, channel partners, end-user customers, products, negative economic or financial developments, or poor or limited credit availability may adversely affect the ability of our tag OEMs, reader and gateway partners and distributors to bring our products to market.
Our future performance will depend, in part, on our ability to attract new tag OEMs, reader and gateway partners and distributors that use, market and support our products effectively, especially in market segments where we have not sold products previously. If we cannot retain our current tag manufacturers, reader and gateway partners and distributors or establish new relationships, our business, financial condition and operating results could be harmed. In addition, our competitors’ strategic relationships with or acquisitions of these tag OEMs, reader and gateway partners or distributors could disrupt our relationships with them. Any such disruption could impair or delay our product sales to end users and increase our costs of distribution, which could adversely affect our sales or operating results.
Our reliance on distributors, SIs, VARs and software solution providers to sell and distribute our products to end users could harm our business and revenue.
We rely on our partner ecosystem to sell and distribute our products to end users. Our revenue depends on their ability to successfully market, sell, install and provide technical support for the solutions in which our products are integrated or to sell our products on a standalone basis. Our revenue will decline if our channel partners fail. Further, faulty or negligent implementation and installation of our products by systems integrators may harm our reputation.
Because we fulfill through channel partners, our ability to determine end-user demand is constrained. End users drive demand for our products and because we are often at least one step removed from these end users, we may be unable to rectify damage to our reputation caused by our channel partners who have more direct contact with these end users. For strategic or other reasons, our channel partners may choose to prioritize the sale of our competitors’ products over our products. Furthermore, some of our channel partners may offer some products that compete with our products and may limit sales of our competing products. If reader IC or module OEMs are unable to obtain components for products in which our products are included, our product sales could be adversely affected. If our distributors, SIs, VARs or software solution providers are unable to sell an adequate amount of our products in a given quarter or if they choose to decrease their inventories of our products for any reason, our sales to these channel partners and our revenue will decline.
Many of our channel partners provide us with customer referrals and cooperate with us in marketing our products; however, our relationships with them may end at any time. If we fail to successfully manage our relationships with our channel partners, our ability to sell our products into new industries and to increase our penetration into existing industries may be impaired and our business will be harmed.
If our channel partners do not properly forecast end users’ demand for our products then they may carry excess product inventory, which could adversely affect our revenue and operating results.
If some or all of our channel partners purchase more of our products than they need to satisfy end-user demand in any particular period, inventories held by the channel partners will grow during that period. The channel partners are then likely to reduce future orders until they realign inventory levels with end-user demand, which could adversely affect our product revenue in a subsequent period. Distributors may also return our products in exchange for other products, subject to time and quantity limitations. Our reserve estimates for products stocked by our distributors are based principally on reports provided to us by our distributors, typically on a monthly basis. To the extent this resale and channel-inventory information is inaccurate or we do not receive it in a timely manner, we may not be able to make accurate reserve estimates for future periods, which could adversely affect our operating results.
19
Our growth strategy depends in part on the success of strategic relationships with third parties and their continued performance and alignment.
To continue our growth, we are investing in our relationships with SIs, VARs and software solution providers that have product offerings that complement our platform and through which we will fulfill sales. Our business will be harmed if we fail to successfully develop and implement such strategic relationships. For example, operating results may suffer if our efforts towards developing our go-to-market relationships consume resources and incur costs, but do not result in a commensurate increase in revenue. In addition, such relationships may involve exclusivity provisions, additional levels of distribution, discount pricing or investments in other companies. The cost of developing and maintaining such relationships may go unrecovered or unrewarded and our efforts may not generate a correspondingly significant increase in revenue.
Selling prices of our products could decrease substantially, which could have a material adverse effect on our revenue and gross margins.
Historically, our market has experienced price erosion. The average selling price, or ASPs, of our products has decreased as the RAIN market has developed. We may experience substantial fluctuations in future operating results due to further ASP reductions.
From time-to-time we reduce the selling prices of our products to meet end-customer demands or due to market pressure from our competition. For example, during the second half of 2017 competitive pressures led to larger declines in ASPs of our endpoint ICs than in recent, prior quarters. As the market has grown, we have generally seen competitive pressures increase. We also sometimes reduce prices to encourage adoption, address macroeconomic conditions or for other reasons. We expect to do so again in the future. If we are unable to offset ASP reductions with increased sales volumes or reduced product costs then our revenue and gross margins will suffer. Further, our customers may be slow to migrate to new, higher margin products. Some competitors have significantly greater resources than we have and may be better able to absorb the negative impact on operating results as a result of such trends.
Rapid market innovation, which we continue to experience, can drive intense pricing pressure, particularly for older products or products using older technology. Short product life cycles cause our channel partners and end users to replace older products with newer ones on a regular basis. When demand for older products declines, ASPs may drop, in some cases precipitously. To profitably sell our products we must continually improve our technology, and processes, and reduce costs in line with the lower selling prices. If we and our third-party suppliers and manufacturers cannot advance process technologies or improve efficiencies to a degree sufficient to maintain required margins, we may not be able to sell our products profitably. Should our cost reductions fail to keep pace with reductions in market prices, our business, financial condition and operating results will be materially adversely affected.
Changes in our product mix could cause our overall gross margin to decline, adversely affecting our operating results and financial condition.
We cannot assure you that we will be able to maintain our historical gross margins. Our gross margins depend strongly on product mix. A shift in sales mix away from our higher margin products to lower margin products will adversely affect our gross margins. We generate a majority of our revenue from sales of our endpoint ICs, which have lower gross margins than our other products, and endpoint IC revenue may continue to increase as a percentage of our total revenue over time. In addition, gross margins can be affected by endpoint IC product mix. As the market for our newer, higher-margin endpoint IC products matures, we expect to experience price erosion for those products which may adversely affect gross margins if we are not able to realize cost reductions or shift towards newer or other higher margin products. If endpoint IC revenue continues to grow relative to our other products, our company-wide gross margin will decline. Additionally, competitive alternatives to our products, overall increased competition, weaker than expected demand, currency exchange rates and other factors may lead to lower prices, revenue and margins in the future, adversely affecting our operating results and financial condition.
20
We generate most of our revenue from our endpoint ICs, and a decline in sales of these products or increased price competition in the market for endpoint ICs could adversely affect our operating results and financial condition.
We derive, and expect to continue to derive, a majority of our product revenue from our endpoint ICs. Accordingly, we are vulnerable to fluctuations in demand for our endpoint ICs, and if demand for them declines, our business and operating results will be adversely affected. In addition, the continued adoption of our endpoint ICs and maintaining demand for them and our new endpoint IC products, derives in part from our ability to continually innovate and to demonstrate the benefits of using our endpoint ICs with our reader ICs and modules, readers and gateways to achieve superior performance over our competitors. If we are not successful in establishing the benefits of using our products and platform, we may not be successful in countering competitive pressures to lower prices for our endpoint ICs and our business and operating results could be adversely affected.
Our products must meet exacting technical and quality specifications. Defects, errors or interoperability issues with our products, the failure of our products to operate as expected, or undue difficulty in deploying our products in actual operations could affect our reputation, result in significant costs to us and impair our ability to sell our products.
Our products may contain defects or errors or may not operate as we or our channel partners or end-user customers expect, which could materially and adversely affect our reputation, result in significant costs to us and impair our ability to sell our products in the future. Our products must meet demanding specifications for quality, performance and reliability. Our products are highly technical and designed to be deployed in large, complex systems under a variety of conditions. Channel partners and end users may discover errors, defects or incompatibilities only after deploying our products. For example, harsh environments or radio-frequency interference may negatively affect gateway performance. In addition, our channel partners or end users may experience compatibility or interoperability issues between our products and their enterprise software systems or networks, or between our products and other RAIN products they may use.
We may experience quality problems with our products combined with or incorporated into products from other vendors, such as tags produced by our tag OEMs using our endpoint ICs, or readers or gateways assembled by OEMs and ODMs using our reader ICs or modules. We may have difficulty identifying and correcting the source of problems when third parties are combining, incorporating or assembling our products.
If we are unable to fix errors or other problems, we could experience:
|
|
• |
loss of customers or customer orders; |
|
|
• |
lost or delayed market acceptance and sales of our products; |
|
|
• |
loss of market share; |
|
|
• |
damage to our brand and reputation; |
|
|
• |
impaired ability to attract new customers or achieve market acceptance; |
|
|
• |
diversion of development resources; |
|
|
• |
increased service and warranty costs; |
|
|
• |
replacement costs; |
|
|
• |
legal actions by our customers; and |
|
|
• |
increased insurance costs. |
Given the technical and business requirements against which end users evaluate RAIN and our products and platform, our business results and prospects could suffer if we are unable to make our products and our platform easy to deploy. To demonstrate the benefits of our platform, or layers of it, in fulfilling business needs and to develop deployment methods to meet those needs, we frequently enter into proof-of-concept deployments, or POCs, with prospective end users. These POCs can extend for relatively long periods of time, and their ultimate outcome can be mixed for a variety of reasons, including changes in end-user business requirements, changes in end-user commitment to the POC as well as deployment challenges. If we fail to deliver deployable solutions through POCs or otherwise, adoption of our products and platform could be adversely affected and our reputation and our business prospects could suffer.
21
Although our agreements typically contain provisions that purport to limit our liability for damages resulting from defects in our products, such limitations and disclaimers may not be enforceable or otherwise effectively protect us from claims. We may be required to indemnify our customers against liabilities arising from defects in our products or in their solutions that incorporate our products. These liabilities may also include costs incurred by our channel partners or end users to correct problems or replace our products.
The costs we incur correcting product defects or errors may be substantial and could adversely affect our operating results. Although we test our products for defects or errors prior to product release and during production, our customers still occasionally catch defects or errors that we miss. Such defects or errors have occurred in the past and may occur in the future. To the extent product failures are material, they could adversely affect our business, operating results, customer relationships, reputation and prospects. Also, we assert that our products conform to the UHF Gen2 protocol. Compatibility issues between our products and the protocol, or among different products that each nominally conform to the protocol, could disrupt our customers’ operations, hurt our customer relations and materially adversely affect our business and prospects.
We will lose market share and may not be successful if end users or customers do not design our products into their products and systems.
End users often undertake extensive pilot programs or qualification processes prior to placing orders for large quantities of our products, in particular for reader and gateway products, because these products must function as part of a larger system or network or meet certain other specifications. We spend significant time and resources to have our products selected by a potential end user or customer, which is known as a “design-in.” In the case of reader and gateway products, a “design-in” means the product has been selected to be designed into the end user’s system and, in the case of an endpoint IC, may mean the endpoint IC has met certain unique performance criteria established by the end user or customer. If we fail to develop new products that adequately or competitively address the needs of potential end users, they may not select our products to be designed into their systems, which could adversely affect our business, prospects and operating results.
Our business is dependent upon our brand recognition and reputation, and if we fail to maintain or enhance our brand recognition or reputation, our business could be harmed.
We believe that maintaining and enhancing our brand and our reputation is critical to our relationships with our customers and end users and to our ability to attract new customers and end users. We also believe that our brand and reputation will be increasingly important as competition in our market continues to develop. Our success in this area will depend on a wide range of factors, some of which are beyond our control, including the following:
|
|
• |
the efficacy of our marketing efforts; |
|
|
• |
our ability to continue to offer high-quality, innovative and defect-free products; |
|
|
• |
our ability to maintain the security and privacy of our customers’ sensitive and proprietary information; |
|
|
• |
our ability to retain existing customers and obtain new customers; |
|
|
• |
our ability to maintain high customer satisfaction; |
|
|
• |
the quality and perceived value of our products; |
|
|
• |
our ability to successfully differentiate our products from those of our competitors; |
|
|
• |
actions of competitors and other third parties; and |
|
|
• |
positive or negative publicity. |
If our brand promotion activities are not successful, our operating results and growth may be harmed.
Furthermore, negative publicity, whether or not justified, relating to events or activities attributed to us, employees, channel partners or others associated with any of these parties, may tarnish our reputation and reduce the value of our brand. Damage to our reputation and loss of brand equity may reduce demand for our products and platform and have an adverse effect on our business, operating results and financial condition. Moreover, any attempts to rebuild our reputation and restore the value of our brands may be costly and time consuming, and such efforts may not ultimately be successful.
22
If we are unable to protect our intellectual property then our business could be adversely affected.
Our success depends in part upon our ability to obtain, maintain and enforce patents, copyrights, trade secrets, trademarks and other intellectual property rights and to prevent third parties from infringing, misappropriating or circumventing the rights we own or license. Given our industry-leading innovation in RAIN technology, there is a high likelihood that material elements of our enpoint ICs have been or will be copied by competitors, and while we take appropriate and feasible measures to protect our intellectual property rights, we cannot be sure that we will be able to prevent such conduct by simply enforcing, or threatening to enforce, those rights.
We rely on a variety of intellectual property rights, including patents in the United States and copyrights, trademarks and trade secrets in the United States and foreign countries. Because many RAIN products are used in or imported into the United States, we have historically focused on filing U.S. patent applications. We have filed a small number of foreign patent applications, but do not yet have any issued or allowed patents in any foreign country. By seeking patent protection primarily in the United States, our ability to assert our intellectual property rights outside the United States is limited. We have registered trademarks and domain names in selected foreign countries where we believe filing for such protection is appropriate. Regardless, some of our products and technologies may not be covered adequately by any patent, patent application, trademark, copyright, trade secret or domain name.
We cannot guarantee that:
|
|
• |
any of the patents, trademarks, copyrights, trade secrets or other intellectual property rights we presently employ in our business will not lapse or be invalidated, circumvented, challenged or abandoned; |
|
|
• |
our intellectual property rights will provide competitive advantages to us; |
|
|
• |
our ability to assert our intellectual property rights against potential competitors or to settle current or future disputes will not be limited by our agreements with third parties; |
|
|
• |
any of our pending or future patent applications will be issued or have the coverage we originally sought; |
|
|
• |
our intellectual property rights will be enforced, particularly in jurisdictions where competition may be intense or where legal protections may be weak; |
|
|
• |
we will not lose the ability to assert our intellectual property rights against, or to license our technology to, others and collect royalties or other payments; or |
|
|
• |
we will retain the right to ask for a royalty-bearing license in relation to ratification of a standard for which we participate in the standards process if we fail to file an intellectual property declaration pursuant to such standards process. |
In addition, our competitors or others may design around our patents or protected technologies. Effective intellectual property protection may be unavailable or more limited in one or more relevant jurisdictions relative to those protections available in the United States. If we pursue litigation to assert our intellectual property rights, an adverse decision in any legal action could limit our ability to assert our intellectual property rights, limit the value of our technology or otherwise negatively impact our business, financial condition and operating results.
Monitoring unauthorized use of our intellectual property is difficult and costly. Unauthorized use of our intellectual property may have already occurred or may occur in the future. Our failure to identify unauthorized use or otherwise adequately protect our intellectual property could adversely affect our business.
Moreover, any actual or threatened litigation to enforce our intellectual property could be time consuming, distracting, expensive and could result in outcomes or trigger consequences that are harmful to us. We could incur significant costs and divert our attention and the efforts of our employees by threatening or initiating litigation. This could, in turn, result in lower revenue and higher expenses. To the extent we discuss our concerns regarding possible or actual infringement with others prior to or in lieu of litigation, we could also become subject to claims brought by alleged infringers. Because outcomes in litigation are uncertain, we could lose in our enforcement action or weaken our intellectual property through the litigation process. At the same time, any decision not to enforce our intellectual property rights through litigation could embolden others to violate or potentially violate our intellectual property rights, and thus weaken them over time.
23
Some of our know-how or technology is not patented or patentable and may constitute trade secrets. To protect our trade secrets, we have a policy of requiring our employees, consultants, advisors and other collaborators to enter into confidentiality agreements. We also rely on customary contractual protections with our channel partners, suppliers and end users, and we implement security measures intended to protect our trade secrets, know-how or other proprietary information. However, we cannot guarantee we have entered into appropriate agreements with all parties that have had access to our trade secrets, know-how or other proprietary information. We also cannot assure you that those agreements will provide meaningful protection for our trade secrets, know-how or other proprietary information in the event of any unauthorized use or disclosure. Our trade secrets, know-how or other proprietary information could be obtained by third parties as a result of breaches of our physical or electronic security systems or our suppliers, employees or consultants could assert rights to our intellectual property.
Finally, our use of overseas manufacturers may involve particular risks. The intellectual property protection in countries where our third-party contractors operate is weaker than in the United States. If the steps we have taken and the protection provided by law do not adequately safeguard our intellectual property rights then we could suffer losses in profits due to the sales of competing products that exploit our intellectual property rights.
We may face claims of intellectual property infringement which could be time consuming, costly to defend or settle, result in the loss of significant rights, and adversely affect RAIN adoption generally.
Many companies in our industry, as well as so-called non-practicing entities, hold large numbers of patents and other intellectual property rights and may vigorously pursue, protect and enforce their intellectual property rights. We have in the past, and may in the future, receive invitations to license patent and other intellectual property rights to technologies that are important to our business. We may also receive assertions against us, our channel partners or end users claiming that we or they infringe patent or other intellectual property rights. Claims that our products, processes, technology or other aspects of our business infringe third-party intellectual property rights, regardless of their merit or resolution, could be costly to defend or settle and could divert the efforts and attention of our management and technical personnel. If we decline to accept an offer, the offering party may allege that we infringe such patents, which could result in litigation.
Intellectual property disputes affecting our industry may adversely affect RAIN adoption. For example, in 2011 Round Rock Research filed lawsuits against 11 end users, including Walmart and Macy’s, for patent infringement in the RAIN products these retailers use. We believe these lawsuits materially and adversely affected demand for our products by retailers and others from 2011 to 2014. In 2013, Round Rock Research entered into licensing settlement agreements with a substantial number of RAIN vendors, including us; in early 2015, they reached a settlement agreement with the last of the end-user defendants. We, our channel partners, suppliers or end users could be involved in similar disputes in the future which would materially and adversely affect our operating results and growth prospects.
Many of our agreements require us to indemnify and defend our channel partners and end users from third-party infringement claims and pay damages in the case of adverse rulings. Moreover, we may not know whether we are infringing a third party’s rights due to the large number of RAIN-related patents or to other systemic factors. For example, patent applications in the United States are maintained in confidence for up to 18 months after filing or, in some instances, for the entire time prior to patent issuance. Consequently, we may not be able to account for such rights until after publication. Competitors may also have filed patent applications or received patents and may obtain additional patents and proprietary rights that block or compete with our patents. Claims of this sort could harm our relationships with our channel partners or end users and might deter future customers from doing business with us. We do not know whether we will prevail in any such future proceedings given the complex technical issues and inherent uncertainties in intellectual property litigation. If any pending or future proceedings result in an adverse outcome then we could be required to:
|
|
• |
cease the manufacture, use or sale of the infringing products, processes or technology; |
|
|
• |
pay substantial damages for infringement; |
|
|
• |
expend significant resources to develop non-infringing products, processes or technology; |
|
|
• |
license technology from the party claiming infringement, which license may not be available on commercially reasonable terms, or at all; |
24
|
|
• |
cross-license our technology to a competitor to resolve an infringement claim, which could weaken our ability to compete with that competitor; or |
|
|
• |
pay substantial damages to our channel partners or end users to cause them to discontinue their use of, or replace, infringing products with non-infringing products. |
Any of the foregoing results could have a material adverse effect on our business, financial condition and operating results.
We have limited visibility into the length of the sales and deployment cycles for our products.
Because we have limited sales history for our products, we have limited visibility into the lengths of the product sales and deployment cycles, and from time-to-time these cycles have been longer than we anticipated. For new types of products, such as our gateways and ItemSense software, our visibility into the sales and deployment cycle lengths is even more limited; inasmuch as these products are components in a systems sale, our experience in the systems-selling cycle is even more limited. Numerous factors can contribute to uncertainties in the cycle lengths, including the time channel partners and end users spend evaluating our products, our time educating them on the products’ benefits, and our time integrating our systems with their systems. The length and uncertain timing of the sales and deployment cycles can lead to delayed product orders. In anticipation of product orders, we may incur substantial costs before the sales cycle is complete and before we receive any customer orders or payments. If a sale is not completed or is cancelled or delayed, we may incur substantial expenses, which could hinder our ability to achieve or maintain profitability or otherwise negatively affect our financial results.
Significant developments stemming from the current U.S. presidential administration’s priorities or initiatives, or the U.K.’s referendum on membership in the EU could have a material adverse effect on us.
In January 2017, Mr. Donald J. Trump was inaugurated as president of the United States. President Trump’s administration has since notified Congress of its intentions to begin renegotiating NAFTA, and withdrawn the United States from negotiations for the TPP; he has also previously proposed restrictions on free trade generally and significant increases in tariffs on goods imported into the United States, particularly from China; and he has expressed an intention to review policies regarding, and possibly restrict, immigration to the United States. Changes in U.S. social, political, regulatory and economic conditions or in laws and policies governing foreign trade, manufacturing, development and investment in the territories and countries where we currently develop and sell products, and immigration to the United States, and any negative sentiments towards the United States as a result of such changes, could adversely affect our business. In addition, negative sentiments towards the United States among non-U.S. customers and among non-U.S. employees or prospective employees, or the imposition of restrictions on immigration to the United States, could adversely affect sales or hiring and retention, respectively. To the extent U.S. policies engender an economic downturn, in the United States or abroad, the effects could materially affect our business, in many ways only some of which we can identify as of the date of this report.
In June 2016, the United Kingdom held a referendum and voted in favor of leaving the European Union, or EU, and in March 2017 the United Kingdom began the official process to leave the EU by April 2019. This action has created political and economic uncertainty, particularly in the United Kingdom and the EU, and this uncertainty may last for years. Our business in the United Kingdom, the EU and worldwide could be affected during this period of uncertainty, and perhaps longer, by the impact of the United Kingdom’s decision to leave the EU. There are many ways in which our business could be affected, only some of which we can identify as of the date of this report.
The withdrawal of the United Kingdom from the EU, along with events that could occur in the future as a consequence of the United Kingdom’s withdrawal, including the possible breakup of the United Kingdom, may cause significant volatility in global financial markets, including in global currency and debt markets. This volatility could cause a slowdown in economic activity in the United Kingdom, Europe or globally, which could adversely affect our operating results and growth prospects. In addition, our business could be negatively affected by new trade agreements between the United Kingdom and other countries, including the United States, and by the possible imposition of trade or other regulatory barriers in the United Kingdom. Furthermore, we currently operate in Europe through an Impinj subsidiary based in the United Kingdom, which currently provides us with certain operational, tax and other benefits. The United Kingdom’s withdrawal from the EU could adversely affect our ability to realize those benefits and we may incur costs and suffer disruptions in our European operations as a result. These possible negative impacts, and others resulting from the United Kingdom’s withdrawal from the EU, may adversely affect our operating results and growth prospects.
25
We are subject to order and shipment uncertainties. Inaccuracies in our estimates of end-customer or channel-partner demand and product mix could negatively affect our inventory levels, sales and operating results.
We sell our products primarily through channel partners, and we derive revenue primarily from purchase orders rather than from long-term purchase commitments. To ensure product availability, we typically manufacture from channel-partner forecasts in advance of received purchase orders. However, many of our channel partners have difficulty accurately forecasting their product requirements and estimating the timing of demand for our products. In addition, when we release new products, we may carry higher inventories or have slower inventory turnover depending on our ability to anticipate market acceptance.
Our estimates of channel-partner and end-user demand have historically been inaccurate. Some of the inaccuracies have been material, leading to excess inventory with associated costs or product shortages with its concomitant loss of revenue and gross margin. Further, our channel partners can cancel purchase orders or defer product shipments, in some cases with little or no advance notice to us. Additionally, we sometimes receive soft commitments for larger order sizes which do not materialize.
For all these reasons, our ability to accurately plan purchases or manufacturing is limited. This may cause us to experience excess inventory levels or a shortage of products available for sale. High inventory levels and increased obsolescence could result in unexpected expenses or increases in reserves that could adversely affect our business, operating results and financial condition. Lead times for our products can be lengthy so experiencing product shortages may require us to defer revenue into subsequent periods, or may cause us to lose revenue opportunities entirely. Further, if we underestimate customer demand or if sufficient manufacturing capacity is unavailable, we could potentially lose market share and damage our customer relationships. Any significant product-order cancellations or deferrals or the return of previously sold products could materially and adversely impact our profit margins, increase our write-offs due to product obsolescence and restrict our ability to fund our operations.
We are subject to risks inherent in foreign operations, including social, political and economic flux and compliance with additional U.S. and international laws, including those related to anti-bribery and anti-corruption, and may not be able to successfully maintain or expand our international operations.
In 2017, 77% of our total revenue was derived from sales outside the United States. We anticipate growing our business, in part, by continuing to expand our international operations, which involves a variety of risks, including:
|
|
• |
changes, some unexpected or unanticipated, in regulatory requirements, taxes, trade laws, tariffs, export quotas, custom duties or other trade restrictions; |
|
|
• |
lack of established, clear, or fairly implemented standards or regulations with which our products must comply; |
|
|
• |
greater difficulty in enforcing contracts, judgments and arbitration awards in international courts, and in collecting accounts receivable and longer payment and collection periods; |
|
|
• |
difficulty in supporting and localizing our international products; |
|
|
• |
different or unique competitive pressures as a result of, among other things, the presence of, or preference for, local businesses and market players; |
|
|
• |
challenges in managing employees, some foreign nationals, over large geographic distances, including the need to implement appropriate systems, policies, benefits and compliance programs; |
|
|
• |
challenges in doing business in different languages and in business cultures with varying norms of transparency and compliance with policies than in the United States; |
|
|
• |
limited or unfavorable intellectual property protection; |
|
|
• |
misappropriation of our intellectual property; |
|
|
• |
inflation and fluctuations in foreign-currency exchange rates and interest rates; |
|
|
• |
withholding taxes or other taxes, or changes thereof, on our foreign income; |
|
|
• |
restrictions, or changes thereof, on foreign trade or investment, including currency exchange controls; |
|
|
• |
changes in a country’s or region’s political, regulatory, legal or economic conditions; |
|
|
• |
political uncertainty, strife, unrest, or conflict; |
|
|
• |
differing regulations with regard to maintaining operations, products and public information; |
|
|
• |
inequities or difficulties obtaining or maintaining export and import licenses; |
26
|
|
• |
differing labor regulations, including where labor laws may be more advantageous to employees than in the United States |
|
|
• |
restrictions on earnings repatriation; |
|
|
• |
corrupt or unethical practices in foreign jurisdictions that may subject us to exposure under applicable anti-corruption and anti-bribery laws such as the Foreign Corrupt Practices Act and the United Kingdom Bribery Act of 2010, or U.K. Bribery Act; and |
|
|
• |
regulations, and changes thereof, relating to data privacy and the unauthorized use of, or access to, commercial and personal information, particularly in Europe. |
Various foreign regulatory or other governmental bodies may issue rulings that invalidate prior laws, regulations, or legal frameworks in manners that may adversely impact our business. The Court of Justice of the European Union in October 2015 issued a ruling immediately invalidating the EU-U.S. Safe Harbor Framework, which facilitated personal data transfers to the United States in compliance with applicable EU data protection laws. EU and U.S. political authorities adopted the -EU-U.S. Privacy Shield on July 12, 2016, which provides a new mechanism for companies to transfer EU personal data to the United States. It is unclear as of the date of this report whether we will make use of the EU-U.S. Privacy Shield, and it has been subject to challenges in EU courts. In view of these developments, there is significant regulatory uncertainty surrounding the future of data transfers from the European Economic Area to the United States. In addition, the European Commission adopted a General Data Protection Regulation that, when fully effective on May 25, 2018, will impose more stringent data protection requirements than the present regulatory regime in the EU and provide for greater penalties for noncompliance. Additionally, the United Kingdom has proposed a Data Protection Bill that is anticipated to provide for similar obligations and associated penalties as the EU General Data Protection Regulation, but as of the date of this report, it remains in the legislative process in the United Kingdom, with it uncertain what such legislation will provide for, should it be enacted.
We opened an office in Shanghai, China in 2011. In addition to the risks listed above, we are also exposed to risks associated with changes in laws and policies governing Chinese operations and, to a lesser extent, changes in U.S. laws and regulations relating to foreign trade and investment. To date, legal, policy or regulatory changes have not had a material adverse effect on our business or financial condition, but we cannot assure you they will not in the future. We may experience increased costs for, or significant impact to, our Chinese operations in the event of changes in Chinese government policies or political unrest or unstable economic conditions in China. The nationalization or other expropriation of private enterprises by the Chinese government could result in total loss of our China investment. Any of these matters could materially and adversely affect our business and results of operations.
Failure to comply with anti-corruption and anti-bribery laws in our foreign activities could subject us to penalties and other adverse consequences. Anti-corruption and anti-bribery laws generally prohibit companies and their employees and intermediaries from making payments to foreign officials for the purpose of obtaining or keeping business, securing an advantage or directing business to another person, and require companies to maintain accurate books and records and a system of internal accounting controls. Under the U.S. Foreign Corrupt Practices Act of 1977, as amended, or the FCPA, U.S. companies may be held liable for corrupt actions taken by directors, officers, employees, agents, or other strategic or local partners or representatives. If we, our intermediaries or our solution providers, SIs, OEMs, VARs, distributors, tag manufacturers, and other channel partners fail to comply with FCPA requirements or similar legislation, government authorities in the United States and elsewhere could seek to impose civil or criminal fines and penalties which could have a material adverse effect on our business, operating results and financial conditions. Moreover, China is an area of heightened exposure regarding compliance with anticorruption laws such as the FCPA and the U.K. Bribery Act. We intend to increase our international sales and business there and, as such, our risk of violating laws such as the FCPA or U.K. Bribery Act also increases.
We have limited experience marketing, selling and supporting our products and services abroad and may not be able to increase or maintain international market demand for our products. In addition, regulations or standards adopted by other countries may require us to redesign existing products or develop new products for those countries. For example, foreign governments may impose regulations or standards with which our current products do not comply, or may require operation in frequency bands in which our products do not operate. Furthermore, if we are unable to expand international operations in a timely and cost-effective manner in response to increased demand, we could miss sales opportunities and our revenue may decline, adversely affecting our operating results, business and prospects. If we invest substantial time and resources but are unable to expand our international operations successfully and in a timely manner, our business, prospects and operating results will suffer.
27
We generally conduct our China operations through a wholly owned subsidiary and our European operations through our U.K. subsidiary. We generally report our taxable income in worldwide jurisdictions based on our business operations in those jurisdictions. The relevant taxing authorities may disagree with our determinations as to the income and expenses attributable to the jurisdiction or subsidiary. In the event of a disagreement, if our position was not sustained, we could be required to pay additional taxes, interest and penalties, which could result in tax charges, higher effective tax rates, reduced cash flows and lower overall profitability.
We are subject to governmental export and import controls that could subject us to liability or impair our ability to compete in international markets.
The U.S. and various foreign governments have imposed controls, export license requirements and restrictions on the import or export of certain products, technologies and software. We must export our products in compliance with U.S. export controls, including the Commerce Department’s Export Administration Regulations and various economic and trade sanctions established by the Treasury Department’s Office of Foreign Assets Controls. We may not always be successful in obtaining necessary export licenses, and our failure to obtain required import or export approval for our products or limitations on our ability to export or sell our products imposed by these laws may harm our international and domestic sales and adversely affect our revenue. Noncompliance with these laws could have negative consequences, including government investigations, penalties and reputational harm.
Changes in our products or changes in export, import and economic sanctions laws and regulations may delay our introduction of new products in international markets, prevent our customers from deploying our products internationally or, in some cases, prevent the export or import of our products to or from certain countries altogether. While we are not aware of any current or proposed export or import regulations that will materially restrict our ability to sell our products, any change in export or import regulations or legislation, shift or change in enforcement, or change in the countries, persons or technologies targeted by these regulations, could result in decreased use of our products by, or in our decreased ability to export or sell our products to, existing or potential customers with international operations. In such event, our business and results of operations could be adversely affected.
Political unrest, as well as changes in the political, social, business or economic conditions in Thailand, could harm our business, financial condition and operating results.
We post-process many of our IC wafers, including testing, dicing and other wafer operations, using subcontractors in Bangkok, Thailand. Deterioration in the political, social, business and economic conditions in Thailand could have a material effect on our business. Thailand has experienced ongoing political and social upheaval over the past two decades, such as in May 2014 when the Royal Thai Army staged a military coup, banned demonstrations and enforced monitoring of civilian activities. In August 2014, Thailand’s national assembly appointed the coup leader as prime minister. Thailand may also experience political unrest stemming from the results of its August 2016 constitutional referendum, as well as the death of its king in October 2016. We do not know what direction the political situation may take or if subsequent issues will affect us. Any changes to tax regimes, laws, exchange controls or political action in Thailand may harm our business, financial condition and operating results.
Instability in Thailand could prevent wafer shipments from entering or leaving the country and disrupt our ability to test or post-process wafers in Thailand. In such an event, we could be forced to transfer our testing and dicing activities to more stable, and potentially more costly, regions and find alternative sources for testing and dicing, which could harm our business, financial condition and operating results.
28
Intellectual property licensing from or to others, including competitors, may subject us to requirements or limitations that could adversely affect our business and prospects.
We have intellectual property license agreements that give us access to certain patents and intellectual property of others. We have not licensed our patents or intellectual property to others except as necessary for our customers to practice their business using our products and as required pursuant to agreements we have entered into in connection with our participation in the development of GS1 EPCglobal protocols and International Standards Organization, or ISO, standards. In the course of our participation in the development of GS1 EPCglobal protocols, including UHF Gen2, UHF Gen2 V2, tag data standards, low-level reader protocol, and others, we have agreed to license on a royalty-free basis those of our patents that are necessarily infringed by the practice of these protocols to other GS1 EPCglobal members, subject to reciprocal royalty-free rights from those other members. Because it may not be clear whether a member’s intellectual property is necessary or optional to the practice of a protocol, disputes could arise among members, resulting in our inability to receive a license on royalty-free terms. Further, some GS1 EPCglobal members declined to provide licenses to some of their intellectual property under royalty-free terms, instead choosing reasonable and non-discriminatory, or RAND, terms. Disputes or confusion may arise about whether we may invoke our necessary intellectual property if these members choose to assert their RAND intellectual property, potentially causing or at least complicating any ensuing litigation and harming our business, financial condition and operating results.
In the course of our participation in the development of certain ISO standards we have agreed to grant to all users worldwide a license to those of our patents that are necessarily infringed by the practice of those standards, including at frequencies other than UHF, on RAND terms, again subject to reciprocity. As a result, we are not always able to limit to whom and, to a certain extent, on what terms we license our technologies, and our control over and our ability to generate licensing revenue from some of our technologies may be limited. We may choose to license our patents or intellectual property to others in the future. We cannot guarantee that any patents and technology that we provide in such future licenses will not be used to compete against us.
We rely on third-party license agreements; impairment of those agreements may cause production or shipment delays that could harm our business.
We have licensing agreements with other entities for patents, software and technology used in our manufacturing operations and products. For example, we license tools from design-automation software vendors to design our silicon products. Third-party licenses for patents, software and other technology important to our business may not continue to be available on commercially reasonable terms, if at all. Loss of any such licenses could cause significant manufacturing interruptions, delays or reductions in product shipments until we can develop, license, integrate, and deploy alternative technologies, if even possible, which would materially harm our business and operating results.
Our use of open-source software may expose us to additional risks and harm our intellectual property.
Our products, processes and technology sometimes use or incorporate software that is subject to an open-source license. Open-source software is typically freely accessible, usable and modifiable, and is made available to the general public on an “as-is” basis under the terms of a non-negotiable license. Use and distribution of open-source software may entail greater risks than use of third-party commercial software. Certain open-source software licenses require a user who intends to distribute the open-source software as a component of the user’s software to disclose publicly part or all of the user’s source code. In addition, certain open-source software licenses require the user of such software to make derivative works of the open-source code available to others at low or no cost. Consequently, open-source licensing can subject our previously proprietary software to open-source licensing terms, which could enable our competitors to create similar offerings with lower development effort and time and ultimately could result in a loss of sales. In addition, open-source licensors generally do not provide warranties or other contractual protections regarding infringement claims or the quality of their code, opening us to business risks that could materially harm our operating results.
29
We may face claims alleging noncompliance with open-source license terms or infringement or misappropriation of proprietary software. These claims could result in litigation, require us to purchase a costly license, or require us to devote research and development resources to change our software, any of which would have a negative effect on our business and operating results. Few courts have interpreted open-source licenses, and these licenses could be construed in a way that could impose unanticipated conditions or restrictions on our ability to commercialize our offerings. In addition, if there are changes in the licensing terms for the open-source software we use, we may be forced to re-engineer our solutions, incur additional costs or discontinue sale of our offerings. We cannot guarantee that we have incorporated all open-source software in our software in a manner that is consistent with our current policies and procedures, or in a manner that will not subject us to liability.
Privacy and security concerns relating to RAIN could damage our reputation and deter current or potential customers from using our products.
Privacy advocates and others have raised and may continue raising concerns about RAIN compromising consumer privacy or facilitating theft. These concerns include unauthorized parties collecting personally identifiable information, tracking consumers, stealing identities or causing other privacy-related issues. Consumers may be subject to unauthorized readers or gateways surreptitiously identifying and tracking their RAIN tags to gain information a consumer considers private, even if the consumer employs protective measures. Retailers may inadvertently or perhaps even intentionally read consumers’ tags to gain information, such as shopping behavior, that may be illegal to collect, or if not illegal, may be considered intrusive by consumers. Unauthorized readers or gateways could gain access to sensitive information stored in tags despite measures designed to thwart such unauthorized access. For example, criminals seeking to divert or steal high-value pharmaceutical products could seek to identify these products by looking for tags with Electronic Product Codes, or EPCs, corresponding to these products. If such concerns increase, or if actual malicious or inadvertent breaches of privacy or theft occur, then our reputation could be damaged, our business and prospects may suffer, and we could incur significant liability.
In addition to concerns over privacy or theft, it may be possible for those with malicious intent to misuse RAIN in ways that actually facilitate theft or damage the public trust, such as by changing the EPC on a narcotic to misrepresent it as an over-the-counter product. It may even be possible to embed computer viruses or other malicious code into endpoint ICs so that by reading endpoint IC memory, the malicious code can be inserted into end-user systems. If a breach occurs, our customers could be the target of regulatory actions or private lawsuits. In such cases, a customer might allege that our products did not function as promised and may sue us for breach of contract, breach of warranty, negligence or another cause of action. Additionally, if our customers’ security measures are breached, even if through means beyond our control, our reputation may be damaged, we may be subject to litigation and our business and prospects could suffer. Moreover, concerns about security and privacy risks, even if unfounded, could damage our reputation and operating results and could delay the development of the overall RAIN industry. Security breaches could expose us to litigation and possible liability. Even if our products meet new standards or regulations, if our security measures are breached as a result of third-party action, our error or criminal act or otherwise, and, as a result, someone obtains unauthorized access to customer or end-user data, our reputation could be damaged, our business and prospects may suffer, and we could incur significant liability.
Government regulations and guidelines relating to consumer privacy may adversely impact adoption of our products, require us to make design changes or constrain our ability to implement new and desired product features.
Our customers are subject to laws and regulations related to collecting, storing, transmitting and using personal information, as well as additional laws and regulations that address privacy and security issues related to radiofrequency identification, or RFID. For example, some U.S. states have enacted statutes specifically governing the use of RFID, including prohibitions on mandatory implantation of an RFID IC, unauthorized skimming of information from ID cards and documents, unauthorized personnel tracking using RFID and improper use of RFID tags in drivers’ licenses or on vehicles. Because RAIN uses RFID technology, we believe these statutes and regulations apply to RAIN systems.
30
The European Commission, or EC, has issued guidance to address privacy concerns about RFID. In May 2009, the EC issued a recommendation that retail companies in the EU inform their customers when RFID tags are either on or embedded within products. In April 2011, the EC signed a voluntary agreement with private and public stakeholders to develop privacy guidelines for companies using RFID in the EU. The agreement requires companies to conduct privacy impact assessments of new RFID applications and to take measures to address risks identified by the assessment before the RFID application is deployed. While compliance with the guidelines is voluntary, our customers that do business in the EU may have a preference for products that comply with the guidelines. If our RAIN products do not provide the necessary functionality to allow customers to comply with the guidelines then our business may suffer.
The data security and privacy legislative and regulatory landscape in the United States and EU, and other foreign jurisdictions is evolving, and changes in laws and regulations may adversely impact our business, including our ability to develop future products. If we fail to develop products that implement end-user privacy requirements then end users may choose not to use our products in certain applications, which would harm our business, operating results and financial condition.
Although the Gen2 V2 protocol described below includes features for addressing consumer privacy and authenticating a tag, a third party may still breach these features, including as implemented in our products, in which case our reputation could be damaged and our business and prospects may suffer.
Alternative technologies or standards, or changes in existing technologies or standards, may adversely affect RAIN market growth.
Technology developments may affect our business in ways we cannot anticipate. Breakthroughs in legacy RFID technologies or markets, including those using low frequency or high frequency technology, could adversely affect RAIN market growth generally and demand for our products in particular. For example, NFC technology, which today addresses a different market than RAIN, could, with breakthrough innovations, compete with RAIN in item tagging. Likewise, new technologies such as organic transistors may allow lower-cost ICs than our current silicon-based technology allows. These competing technologies could use intellectual property that is either not royalty free or to which we do not have access. If we are unable to innovate using new or enhanced technologies or processes, or are slow to react to changes in existing technologies or in the market, or have difficulty competing with advances in new or legacy technologies, then our development of new or enhanced products could be materially impacted and potentially result in product obsolescence, decreased revenue and reduced market share.
To encourage widespread RAIN market adoption, we have participated in the development of industry standards, and we have designed our products to comply with these standards. In 2013, GS1 EPCglobal ratified “UHF Gen2 Version 2” or simply “Gen2 V2,” a new version of the protocol that underlies RAIN communications. In the future, we could lose our position in GS1 EPCglobal or we could lose our project-editorship role for UHF Gen2. If one of our competitors introduces a Gen2 V2 product that gains market adoption before we do, we could lose market share and face difficulty selling our products. The introduction of new industry standards, or changes to existing industry standards, could make our products incompatible with the new or changed standards and could cause us to incur substantial development costs to adapt to these new or changed standards, particularly if they were to achieve, or be perceived as likely to achieve, greater penetration in the marketplace. If Gen2 V2 diverges significantly from our or the RAIN market’s needs then our products may likewise fail to keep pace with the market, our competitors’ products and end-user requirements, in which case end users could delay RAIN adoption. Moreover, the adoption or expected adoption of new or changed standards could slow the sale of our existing products before products based on the new or changed standards become available. New industry standards or changes to existing standards could also limit our ability to implement new features in our products if those features do not meet the new or changed standards. The lost opportunities as well as time and expense required for us to develop new products or change our existing products to comply with new or changed standards could be substantial, and we cannot assure you that we could successfully develop products that comply with new or changed standards. If we are not successful in complying with any new or changed industry standards, then we could lose market share, causing our business to suffer.
31
We are a founding member of the RAIN Alliance. Our chief executive officer is presently an Alliance Director and was previously the Alliance Chairman. Board membership is an elected position that we could lose in future elections. It provides industry stature and attendant benefits but is not without risk. If the RAIN market falters, or if the RAIN Alliance falters, then we could be blamed, our reputation and industry position could be impacted, and our business could suffer.
Compliance with, and changes in, government spectrum regulations could adversely affect our ability to sell products and impair our operating results.
Government radio regulations require that our readers and gateways be certified for spectral compliance in jurisdictions where they are sold or operated. Our readers and gateways are collectively certified for use in more than 40 countries worldwide, including the United States, Canada, Mexico, China, Japan, South Korea and each country in the EU. If one of our reader or gateway products is found to be noncompliant despite having such certification then we could be required to modify field-deployed readers or gateways to regain certification and could spend significant resources as well as miss sales opportunities in the process. Our revenue could decline, adversely affecting our operating results, financial condition, business and prospects. Additionally, government regulations may change, requiring us to redesign our products to the new regulations or constraining our ability to implement new and desired features into our products, thereby causing us to incur significant expenses or forego opportunities to improve our products, potentially delaying time-to-market, adversely affecting our operating results, financial condition, business and prospects.
Our products may cannibalize revenue from each other, which could harm our business.
Sales of some of our products enable our channel partners to develop their own products that compete with other of our products. For example, sales of our reader ICs allow technology companies to build and sell readers and gateways that compete with our products. Similarly, sales of our readers allow our channel partners to build and sell products that compete with our xPortal, xArray and xSpan. We even see cannibalization within our own product line—for example, our xSpan sometimes competes with our xPortal. In the future, we may see one product line expand at the expense of another, or we may be asked by channel partners to disadvantage or divest a product line. We cannot predict whether we can manage such conflicts in the future, or retain channel partners despite conflicts. Any of the foregoing could have a material adverse effect on our business, financial condition and operating results.
Acquisitions could result in operating difficulties, dilution and other harmful consequences.
We have evaluated, and expect to continue evaluating, potential strategic transactions, and we may pursue one or more transactions, including acquisitions. We have limited experience executing acquisitions. Any transaction could be material to our financial condition and operating results. Integrating an acquired company, business or technology may create unforeseen operating difficulties and expenditures. Acquisition-related risks include:
|
|
• |
diverting management time and focus from operating our business to acquisition integration; |
|
|
• |
difficulties integrating acquired products into our strategy and product plans; |
|
|
• |
customers switching from us to new suppliers because of the acquisition; |
|
|
• |
inability to retain employees from the business we acquire; |
|
|
• |
challenges associated with integrating employees from the acquired company into our organization; |
|
|
• |
difficulties integrating accounting, management information, human resource and other administrative systems to permit effective management of the business we acquire; |
|
|
• |
potential requirements for remediating controls, procedures and policies appropriate for a public company in the acquired business that prior to the acquisition lacked these controls, procedures and policies; |
|
|
• |
potential liability for past or present environmental, hazardous substance, or contamination concerns associated with the acquired business or its predecessors; |
|
|
• |
possible write-offs or impairment charges resulting from the acquisition; and |
|
|
• |
unanticipated or unknown liabilities relating to the acquired business. |
32
Foreign acquisitions involve additional risks beyond those above, including risks related to integrating operations across different cultures and languages, currency risks and the economic, political and regulatory risks associated with other countries. Also, the anticipated benefit of any acquisition, domestic or foreign, may not materialize. Future acquisitions or dispositions could result in potentially dilutive issuances of our equity securities, debt incurrence, contingent liabilities or amortization expenses or goodwill write-offs, any of which could harm our financial condition. Future acquisitions may require us to obtain additional equity or debt financing, which may not be available on favorable terms or at all.
Our business could be adversely affected if one or more members of our executive management team departed.
Our success depends, in large part, on the continued contributions of our executive management team including Chris Diorio, Ph.D., our chief executive officer, and Eric Brodersen, our chief operating officer. None of our executive management team is bound by employment contracts to remain with us for a specified period. The loss of any member of our executive management team could harm our ability to implement our business strategy and respond to the rapidly changing market conditions in which we operate.
If we are unable to attract, train and retain qualified personnel, especially technical, sales and marketing personnel, then we may not be able to effectively execute our business strategy.
Our success depends on our ability to attract, motivate and retain qualified personnel. Our technical personnel, the source of our technical and product innovations, and our sales and marketing personnel that drive our go-to-market initiatives are especially important. There is no guarantee we can attract and retain such personnel as we continue to pursue our business strategy. The availability of, and competition for, qualified personnel in the Seattle area, where we are headquartered, constrains our ability to attract qualified personnel. The loss of the services of one or more of our key employees, or our inability to attract, retain and motivate qualified personnel could have a material adverse effect on our business, financial condition and operating results.
Pricing and other provisions in our customer agreements could adversely affect our operating results.
In the ordinary course of business we enter into agreements containing pricing terms; in some instances the terms, whether advertently or inadvertently, may adversely affect our operating results and gross margins. For example, some contracts specify future reader, gateway or IC pricing, or contain most-favored customer pricing for certain products. As another example, some agreements contain exclusivity terms that prevent us from pursuing certain business with other customers during the exclusivity period. Further, reducing prices or offering other favorable terms to one customer could adversely affect our ability to negotiate favorable terms with other customers. We may decide for competitive or strategic reasons to enter into similar types of agreements in the future, and such agreements could impair our operating results.
We and our suppliers are subject to environmental laws and regulations that could impose substantial costs on us and may adversely affect our business, operating results and financial condition.
Some of our facilities, including those devoted to research and development, are regulated under federal, state, local, foreign and international environmental laws. Those laws govern pollutant discharge into air and water; managing, disposing, handling, labeling, and exposure to hazardous substances/wastes; and contaminated site cleanup. We could incur costs, fines and civil or criminal sanctions; third-party property damage or personal-injury claims; or could be required to pay substantial investigation or remediation costs, if we were to violate or become liable under environmental laws. Liability under certain environmental laws can be joint and several and without regard to comparative fault. In addition, some of our products contain hazardous substances and are subject to requirements that regulate their content, such as the EU’s Restriction of Hazardous Substances Directive and analogous regulations elsewhere. Although we design our products to be compliant with environmental regulations and require our third-party contractors to comply, we cannot guarantee that we or our products will always be in compliance with these requirements. Environmental laws also tend to become more stringent over time, and we cannot predict the ultimate costs under environmental laws or the timing of these costs. Failure to comply with these and other environmental laws could result in fines, penalties and decreased revenue, which could adversely affect our operating results.
33
If our third-party contractors fail to operate in compliance with environmental requirements, properly dispose of wastes associated with our products, or comply with requirements governing the hazardous-substance content of our products, we could be held liable or suffer reputational harm.
We may not sustain or effectively manage our growth.
We have experienced significant revenue growth in a short period of time. We may not experience similar growth rates in future periods. For example, revenue declined in the second half of 2017. You should not rely on our operating results for any prior periods as an indication of our future operating performance. If we are unable to maintain adequate revenue growth then our financial results could suffer and our stock price would decline.
To manage our growth and the responsibilities of being a public company, we believe we must effectively:
|
|
• |
recruit, hire, train and manage qualified engineers for our research and development activities; |
|
|
• |
add sales and marketing personnel and expand our customer-support offices; |
|
|
• |
implement and improve administrative, financial and operational systems, procedures and controls; |
|
|
• |
integrate and train new employees quickly and effectively; and |
|
|
• |
coordinate growth among our executive, engineering, finance, marketing, sales, operations and customer-support organizations. |
All the above activities add to our organizational complexity and increase our operating expenses.
We may have insufficient management capabilities or resources to manage our growth and business effectively. As a consequence of our small management team we may be unable to pursue all commercial opportunities. Accordingly, we may require significant additional resources as we increase the complexity and scale of our business operations. We cannot assure you that we will have adequate resources when we need them or that we will have sufficient capital to fund our resource needs. If we are unable to manage our growth effectively, we may not be able to exploit market opportunities or develop new products, and we may fail to satisfy customer requirements, maintain product quality, execute our business plan or respond to competitive pressures.
Our management has limited public-company experience. We are subject to additional regulatory compliance requirements, including Section 404 of the Sarbanes-Oxley Act of 2002. If we fail to maintain an effective system of internal controls then we may not be able to accurately report our consolidated financial results or prevent fraud. In the course of preparing our consolidated financial statements, we previously identified a material weakness in our internal control over financial reporting.
We have only very recently begun operating as a public company. Most of our management team, including our chief executive officer, have never managed a publicly traded company prior to our initial public offering and have little experience complying with the increasingly complex and changing laws pertaining to public companies. In addition, our chief financial officer has recently announced his decision to resign from our company and we are in process of identifying a replacement. Our entire management team as well as other company personnel will need to devote substantial time to compliance, and may not effectively or efficiently manage our maturation as a public company. We have incurred and will continue to incur significant legal, accounting and other expenses that we did not incur as a private company.
We expect rules and regulations such as the Sarbanes-Oxley Act of 2002, or the Sarbanes-Oxley Act, to increase our legal and finance compliance time and costs, and also to increase the time and costs of other activities. For example, Section 404 of the Sarbanes-Oxley Act requires that management report on, and our independent registered public accounting firm attest to, the effectiveness of our internal control over financial reporting. Effective internal controls are necessary for us to provide reliable financial reports and prevent fraud. Section 404 compliance will divert resources and take significant time and effort to complete. We may be unable to successfully complete the procedures and certification and attestation requirements of Section 404 by the time we are required to do so. In addition, the Sarbanes-Oxley Act requirements may be modified, supplemented or amended from time to time. Implementing the changes may take significant time and may require additional employee compliance training. We may discover internal controls that need improvement. Our or our independent registered public accounting firm’s discovery of a material weakness, even if quickly remedied, could reduce the market’s confidence in our financial statements and harm our stock price. Any inability to provide reliable financial reports or prevent fraud could harm our business.
34
We may be unable to effectively implement, or effectively implement in a timely manner, the necessary controls and employee training to ensure continued compliance with the Sarbanes-Oxley Act and other regulatory and reporting requirements. Our growth will challenge our ability to maintain the internal control and disclosure standards applicable to public companies. If we fail to successfully complete the procedures and certification and attestation requirements of Section 404, or if in the future our chief executive officer, chief financial officer or independent registered public accounting firm determines that our internal control over financial reporting is not effective as defined under Section 404, we could be subject to sanctions or investigations by the Securities and Exchange Commission, or SEC, or by other regulatory authorities. Investor perceptions of our company may suffer, likely causing a decline in our stock’s market price. We cannot assure you that we will be able to fully comply with the requirements of the Sarbanes-Oxley Act or that management or our independent registered public accounting firm will conclude that our internal controls are effective in future periods. Irrespective of compliance with Section 404, any failure of our internal controls could have a material adverse effect on our stated operating results and harm our reputation.
In the course of preparing our consolidated financial statements in prior years, we, in conjunction with our independent registered public accounting firm, identified an error in the accounting treatment for the recapitalization of our company in 2012 and the impact of the recapitalization on earnings per share that resulted in the restatement of our previously issued financial statements for the years ended December 31, 2012 and 2013. In 2015, we, in conjunction with our independent registered public accounting firm, identified an error related to the cash flow statement presentation of lease incentives in our consolidated interim financial statements for the nine months ended September 30, 2015. Also, in 2016, we identified that we inadvertently did not reflect the correction of the identified error related to the cash flow statement presentation of lease incentive in our consolidated interim financial statements for the nine months ended September 30, 2015 on the statement of cash flows included in our quarterly report on Form 10-Q filed with the SEC on November 7, 2016. These financial statement errors, combined with other identified control deficiencies, were considered to indicate a material weakness in our internal control over financial reporting related to the accounting and financial statement disclosure over complex accounting matters. A material weakness is a deficiency, or combination of control deficiencies, in internal control over financial reporting, such that there is a reasonable possibility that a material misstatement of the annual or interim consolidated financial statements will not be prevented or detected on a timely basis. We have taken and continue to take steps to remediate the material weakness, including increasing the depth and experience within our accounting and finance organization, as well as designing and implementing improved processes and internal controls. As of December 31, 2017, this material weakness had not been remediated. Our remediation of this material weakness in future periods may not be effective or prevent future material weaknesses or significant deficiencies in our internal control over financial reporting.
If we fail to retain finance personnel or fail to maintain our financial reporting systems and infrastructure then we may be unable to timely and accurately report our financial results or comply with the requirements of being a public company, including compliance with the Sarbanes-Oxley Act and SEC reporting requirements, which in turn could significantly harm our reputation and our business.
We have hired personnel with financial reporting and Sarbanes-Oxley Act compliance expertise. Our ability to retain personnel could adversely impact our ability to timely and accurately prepare our financial statements. Further, our ability to retain employees with the requisite experience could adversely affect our financial statements because new employees require time and training to learn our business and operating procedures. If our finance and accounting organization is unable for any reason to meet the increased demands of being a public company then the quality and timeliness of our financial reporting may suffer, which could result in material weaknesses in our internal controls. The consequences of inaccuracies or delays in our reported financial statements could cause the trading price of our common stock to decline and could harm our business, operating results and financial condition.
35
We may need to raise additional capital which may not be available on favorable terms, if at all, causing dilution to stockholders, restricting our operations or adversely affecting our ability to operate our business.
In the course of running our business we may need to raise capital, diluting our stockholders. If our need is due to unforeseen circumstances or material expenditures or if our operating results are worse than expected then we cannot be certain that we will be able to obtain additional financing on favorable terms, if at all, and these additional financings could cause additional dilution to our stockholders. Debt financing, if available, may involve agreements that include covenants limiting or restricting our ability to take specific actions such as incurring additional debt, expending capital, or declaring dividends, or which impose financial covenants on us that limit our ability to achieve our business objectives. If we need but cannot raise additional capital on acceptable terms then we may not be able to meet our business objectives, our stock price may fall, and you may lose some or all of your investment.
Our debt obligations contain restrictions that impact our business and expose us to risks that could adversely affect our liquidity and financial condition.
We have a loan and security agreement, or senior credit facility, with Silicon Valley Bank. As amended and restated in April 2017, the senior credit facility provides for (1) a $25.0 million revolving credit facility, with a $5.0 million letter of credit subfacility, (2) a $10.5 million term loan and (3) approximately $1.7 million aggregate principal amount of outstanding equipment loans. At December 31, 2017, we had $8.5 million term loan borrowings outstanding, no revolver borrowings outstanding and $1.2 million equipment loan borrowings outstanding.
Our senior credit facility contains customary covenants, which limit our and our subsidiaries’ ability to, among other things:
|
|
• |
incur additional indebtedness or guarantee indebtedness of others; |
|
|
• |
create liens on our assets; |
|
|
• |
enter into mergers or consolidations; |
|
|
• |
dispose of assets; |
|
|
• |
pay dividends and make other distributions on our capital stock, and redeem and repurchase our capital stock; |
|
|
• |
make investments, including acquisitions; and |
|
|
• |
enter into transactions with affiliates. |
Our senior credit facility also includes customary affirmative covenants and maximum adjusted EBITDA loss and liquidity ratio covenants.
The senior credit facility contains customary events of default, subject to customary cure periods for certain defaults, that include, among others, non-payment defaults, covenant defaults, material judgment defaults, bankruptcy and insolvency defaults, cross-defaults to certain other material indebtedness, a material adverse change default and inaccuracy of representations and warranties.
If we experience a decline in cash flow due to any of the factors described in this “Risk Factors” section or otherwise, we could have difficulty paying interest and principal amounts due on our indebtedness and meeting the financial covenants set forth in our senior credit facility. If we are unable to generate sufficient cash flow or otherwise obtain the funds necessary to make required payments under our senior credit facility, or if we fail to comply with the requirements of our indebtedness, we could default under our senior credit facility. Any such default that is not cured or waived could result in the acceleration of the obligations under the senior credit facility, an increase in the applicable interest rate under the senior credit facility, and would permit our lender to exercise remedies with respect to all of the collateral that is securing the senior credit facility, including substantially all of our assets, other than intellectual property. Any such default could have a material adverse effect on our liquidity and financial condition.
Even if we comply with all of the applicable covenants, the restrictions on the conduct of our business could adversely affect our business by, among other things, limiting our ability to take advantage of financings, mergers, acquisitions and other corporate opportunities that may be beneficial to the business.
36
A breach of our security systems could have a material adverse effect on our business.
We use security systems to maintain our facility’s physical security and to protect our proprietary and confidential information, including that of our customers, suppliers and employees. Accidental or willful security breaches or other unauthorized access to our facilities or information systems, or viruses, loggers, or other malfeasant code in our data or software, could compromise access to and the integrity of this information. The consequences of such loss and possible misuse of our proprietary and confidential information could include, among other things, unfavorable publicity, damage to our reputation, difficulty marketing our products, customer allegations of breach-of-contract, litigation by affected parties and possible financial liabilities for damages, any of which could have a material adverse effect on our business, financial condition, reputation and relationships with customers and partners. We also rely on third-party providers of corporate infrastructure services relating to, among other things, human resources, electronic communication services and some financial functions, and we are therefore dependent on the security systems of these providers. Any security breaches or other unauthorized access to our service-providers’ systems or viruses, loggers, or other malfeasant code in their data or software could expose us to information loss and misappropriation of confidential information. Because the techniques used to obtain unauthorized access to or sabotage security systems change frequently and are often not recognized until after an attack, we may be unable to anticipate the techniques or implement adequate preventative measures, thereby exposing us to material adverse effect on our business, operations and financial condition.
Our operations could be disrupted by natural disasters.
An earthquake, fire, flood or other natural or manmade disaster could disable our facilities, disrupt operations, or cause catastrophic losses. We have facilities in areas with a known history of seismic activity, such as our headquarters in Seattle, Washington. We also have facilities in areas with a known history of flooding, such as our office in Shanghai, China. We have a wafer testing and dicing subcontractor in Thailand, a region with a known, and quite recent, history of flooding. A loss at or of any of these or other of our or our suppliers’ facilities could disrupt operations, delay production and shipments, reduce revenue and engender potentially large expenses to repair or replace the facility. As a specific example, in 2011 and 2012 floods in Thailand disrupted our subcontractor’s facility for approximately six months. During that time, we relied on a secondary subcontractor that had longer lead times for, and decreased yield of, our endpoint IC wafers. We do not carry insurance policies that cover potential losses caused by earthquakes, floods or other disasters.
Our ability to use net operating losses to offset future taxable income may be limited.
As of December 31, 2017, we had federal net operating loss carryforwards, or NOLs, of $126.4 million and federal research and experimentation credit carryforwards of $9.7 million which we may use to reduce future taxable income or offset income taxes due. We have established a valuation allowance against the carrying value of our deferred tax assets, as it is not currently more likely than not that we will be able to realize these deferred tax assets. The tax loss and research and development credit carryforwards begin to expire in 2023. Insufficient future taxable income will adversely affect our ability to utilize these NOLs and credit carryforwards. Reductions in corporate tax rates may reduce the realization of the NOLs. In addition, under Sections 382 and 383 of the U.S. Internal Revenue Code, or the Code, a corporation that experiences a more-than 50% ownership change over a three-year testing period is limited in its ability to use its pre-change NOLs and other tax assets to offset future taxable income or income taxes due. Our existing NOLs and credit carryforwards may be subject to limitations arising from previous ownership changes; if we undergo an ownership change then our ability to use our NOLs and credit carryforwards could be further limited by Sections 382 and 383 of the Code. Future changes in our stock ownership, the causes of which may be outside our control, could result in an ownership change under Sections 382 and 383 of the Code. Our NOLs may also be impaired under state law. As a result of these limitations, we may not be able to utilize a material portion of, or possibly any of, the NOLs and credit carryforwards.
37
We could be subject to additional income tax liabilities.
We are subject to income taxes in the United States and certain foreign jurisdictions. We use significant judgment in evaluating our worldwide income-tax provision. During the ordinary course of business, we conduct many transactions for which the ultimate tax determination is uncertain. For example, our effective tax rates could be adversely affected by earnings being lower than anticipated in countries where we have lower statutory rates and higher than anticipated in countries where we have higher statutory rates, by changes in currency exchange rates, by changes in the valuation of our deferred tax assets and liabilities or by changes in the relevant tax, accounting and other laws, regulations, principles and interpretations. We are subject to audit in various jurisdictions, and such jurisdictions may assess additional income tax against us. Although we believe our tax estimates are reasonable, the final determination of tax audits and any related litigation could be materially different from our historical income-tax provisions and accruals. The results of an audit or litigation could have a material effect on our operating results or cash flows in the period or periods for which that determination is made.
Taxing authorities may successfully assert that we should have collected or in the future should collect sales and use, value-added or similar taxes, and we could be subject to liability with respect to past or future sales, which could adversely affect our operating results.
We do not collect sales and use, value-added or similar taxes in all jurisdictions in which we have sales, based on our belief that such taxes are either not applicable or an exemption from such taxes applies. Sales and use, value-added and similar tax laws and rates vary greatly by jurisdiction. Certain jurisdictions in which we do not collect such taxes may assert that such taxes are applicable, which could result in tax assessments, penalties and interest, and we may be required to collect such taxes in the future, including as a result of a change in law. Such tax assessments, penalties and interest or future requirements may adversely affect our operating results.
We are subject to SEC rules regarding the use and disclosure of conflict minerals, which we expect will increase our operating and compliance costs and could potentially harm our reputation, causing a decline in our stock price.
We are subject to the requirements under the Dodd-Frank Wall Street Reform and Consumer Protection Act of 2010 that will require us to diligence, disclose and report whether our solutions contain conflict minerals. The rule requires us to submit forms and reports to the SEC by May 31, 2019 and annually thereafter to disclose our determinations and due-diligence measures regarding conflict minerals. Although we do not directly purchase conflict minerals, tracing the minerals our suppliers use back to country of origin is a complex task that requires us to, among other things, survey our supply chain to understand what programs our suppliers have for tracing the source of minerals used in products supplied to us and ensure these suppliers have performed reasonable due diligence. We have not determined how many or, if any, of our suppliers use conflict minerals. In addition to the increased administrative expense required to comply with these requirements, some of our customers are also subject to this rule, and we have been and will continue to be asked as part of their supply chain to comply with their requirements as part of their compliance with the rule. Moreover, we may face a limited pool of suppliers who can provide “conflict-free” products, and we may not be able to obtain conflict-free products or supplies in sufficient quantities or at competitive prices for our operations. We may be required to disclose our products as not being “conflict free,” which could adversely affect our reputation and may harm relationships with business partners and customers, and our stock price could suffer as a result.
Risks Relating to the Ownership of Our Common Stock
The market price of our common stock has been and will likely continue to be volatile, and the value of your investment could decline significantly.
There was no public market for our common stock prior to our initial public offering. Since July 2016, when we sold shares of our common stock in our initial public offering at a price of $14.00 per share, our stock price has ranged from $9.95 to $60.85 through February 28, 2018. Securities of companies similar to ours experience significant price and volume fluctuations. The following factors, in addition to other risks described in this report, may have a significant effect on our common stock price:
|
|
• |
price and volume fluctuations in the overall stock market from time to time; |
38
|
|
• |
changes in operating performance, stock market valuations, and volatility in the market prices of other technology companies generally, or those in our industry in particular; |
|
|
• |
actual or anticipated quarterly variations in our results of operations or those of our competitors; |
|
|
• |
actual or anticipated changes in our growth rate relative to our competitors; |
|
|
• |
delays in end-user deployments of RAIN systems; |
|
|
• |
announcements by us or our competitors of acquisitions, new products, significant contracts, commercial relationships or capital commitments; |
|
|
• |
supply interruptions; |
|
|
• |
developments with respect to intellectual property rights; |
|
|
• |
our ability to develop and market new and enhanced products on a timely basis; |
|
|
• |
commencement of, or our involvement in, litigation; |
|
|
• |
changes in our board of directors or management; |
|
|
• |
changes in governmental regulations or in the status of our regulatory approvals; |
|
|
• |
unstable regional political and economic conditions, such as those caused by the U.S. presidential election and the U.K. referendum to leave the EU; |
|
|
• |
the trading volume of our stock; |
|
|
• |
limited public float; |
|
|
• |
any future sales of our common stock or other securities; |
|
|
• |
failure of financial analysts to maintain coverage of us, changes in financial estimates by any analysts who follow our company, or our failure to meet these estimates or the expectations of investors; |
|
|
• |
fluctuations in the values of companies perceived by investors to be comparable to us; |
|
|
• |
the financial projections we may provide to the public, any changes in these projections or our failure to meet these projections; and |
|
|
• |
general economic conditions and slow or negative growth of related markets. |
In addition, the stock market in general, and the market for technology companies in particular, has experienced extreme price and volume fluctuations that have often been unrelated or disproportionate to the operating performance of those companies. Broad market and industry factors may seriously affect our stock price, regardless of our actual operating performance. In addition, in the past, securities class action litigation has often been instituted against companies whose stock prices have declined, especially following periods of volatility in the overall market. This litigation, if instituted against us, could result in substantial costs and a diversion of our management’s attention and resources.
If securities or industry analysts do not publish research reports about our business, or if they issue an adverse opinion about our business, our stock price and trading volume could decline.
The trading market for our common stock will be influenced by the research and reports that industry or securities analysts publish about us or our business. If one or more of the analysts who cover us issues an adverse opinion about our company, our stock price would likely decline. If one or more of these analysts ceases coverage of us or fails to regularly publish reports on us, we could lose visibility in the financial markets, which in turn could cause our stock price or trading volume to decline.
Future sales of our common stock in the public market could cause our stock price to fall.
Sales of a substantial number of shares of our common stock into the public market, particularly sales by our directors, executive officers, and principal stockholders, or the perception that these sales might occur, could cause the market price of our common stock to decline. These sales, or the possibility that these sales may occur, also might make it more difficult for us to sell equity securities in the future at a time and at a price that we deem appropriate.
In addition, in the future, we may issue additional shares of common stock or other equity or debt securities convertible into common stock in connection with a financing, acquisition, litigation settlement, employee arrangement or otherwise. Any such issuance could result in substantial dilution to our existing stockholders and could cause our stock price to decline.
39
Our principal stockholders and management own a significant percentage of our stock and are able to exercise significant influence over matters subject to stockholder approval.
As of February 28, 2018, our executive officers, directors and principal stockholders, together with their respective affiliates, beneficially owned approximately 54.0% of our capital stock. As a result, our executive officers, directors and principal stockholders, if acting together, may be able to significantly influence, in their capacity as stockholders, matters requiring approval by our stockholders, including the election of directors and the approval of mergers, acquisitions or other extraordinary transactions. They may also have interests that differ from yours and may vote in a way with which you disagree and which may be adverse to your interests. This concentration of ownership could have the effect of delaying or preventing a change in our control or otherwise discouraging a potential acquirer from attempting to obtain control of us, which in turn could have a material adverse effect on our stock price and may prevent attempts by our stockholders to replace or remove our board of directors or management.
Anti-takeover provisions in our charter documents and under Delaware or Washington law could make an acquisition of us difficult, limit attempts by our stockholders to replace or remove our current management and limit our stock price.
Provisions of our certificate of incorporation and bylaws may delay or discourage transactions involving an actual or potential change in our control or change in our management, including transactions in which stockholders might otherwise receive a premium for their shares, or transactions that our stockholders might otherwise deem to be in their best interests. Therefore, these provisions could adversely affect the price of our stock. Among other things, our certificate of incorporation and bylaws:
|
|
• |
permit our board of directors to issue up to 5,000,000 shares of preferred stock, with any rights, preferences and privileges as they may designate; |
|
|
• |
provide that the authorized number of directors may be changed only by resolution of the board of directors; |
|
|
• |
provide that all vacancies, including newly created directorships, may, except as otherwise required by law, be filled by the affirmative vote of a majority of directors then in office, even if less than a quorum; |
|
|
• |
divide our board of directors into three classes; |
|
|
• |
restrict the forum for certain litigation against us to Delaware; |
|
|
• |
require that any action to be taken by our stockholders must be effected at a duly called annual or special meeting of stockholders and may not be taken by written consent; |
|
|
• |
provide that stockholders seeking to present proposals before a meeting of stockholders or to nominate candidates for election as directors at a meeting of stockholders must provide notice in writing in a timely manner, and also specify requirements as to the form and content of a stockholder’s notice; |
|
|
• |
do not provide for cumulative voting rights (therefore allowing the holders of a plurality of the shares of common stock entitled to vote in any election of directors to elect all of the directors standing for election, if they should so choose); |
|
|
• |
provide that special meetings of our stockholders may be called only by the chair of the board, our chief executive officer or by the board of directors; and |
|
|
• |
provide that stockholders will be permitted to amend our bylaws only upon receiving at least two-thirds of the total votes entitled to be cast by holders of all outstanding shares then entitled to vote generally in the election of directors, voting together as a single class. |
In addition, because we are incorporated in Delaware, we are governed by the provisions of Section 203 of the Delaware General Corporation Law, which generally prohibits a Delaware corporation from engaging in any of a broad range of business combinations with any “interested” stockholder for a period of three years following the date on which the stockholder became an “interested” stockholder. Likewise, because our principal executive offices are located in Washington, the anti-takeover provisions of the Washington Business Corporation Act may apply to us under certain circumstances now or in the future. These provisions prohibit a “target corporation” from engaging in any of a broad range of business combinations with any stockholder constituting an “acquiring person” for a period of five years following the date on which the stockholder became an “acquiring person.”
40
Our bylaws provide that the Court of Chancery of the State of Delaware is the exclusive forum for substantially all disputes between us and our stockholders, which could limit our stockholders’ ability to obtain a favorable judicial forum for disputes with us or our directors, officers or employees.
Our bylaws provide that, unless we otherwise consent in writing, the Court of Chancery of the State of Delaware is the exclusive forum for any derivative action or proceeding brought on our behalf, any action asserting a breach of fiduciary duty, any action asserting a claim against us arising pursuant to the Delaware General Corporation Law, our certificate of incorporation or our bylaws or any action asserting a claim against us that is governed by the internal affairs doctrine. The choice of forum provision may limit stockholders’ ability to bring a claim in a judicial forum favorable for disputes with us or our directors, officers or other employees, which may discourage such lawsuits against us and our directors, officers and other employees. Alternatively, if a court were to find the choice of forum provision contained in our bylaws to be inapplicable or unenforceable in an action, we may incur additional costs associated with resolving such action in other jurisdictions, which could adversely affect our business and financial condition.
As an emerging growth company within the meaning of the Securities Act, we will utilize certain modified disclosure requirements, and we cannot be certain if these reduced requirements will make our common stock less attractive to investors.
We are an emerging growth company, and for as long as we continue to be an emerging growth company, we may choose to take advantage of exemptions from various reporting requirements applicable to other public companies but not to “emerging growth companies” including:
|
|
• |
not being required to have our independent registered public accounting firm audit our internal control over financial reporting under Section 404 of the Sarbanes-Oxley Act; |
|
|
• |
reduced disclosure obligations regarding executive compensation in our periodic reports and proxy statements; and |
|
|
• |
exemptions from the requirements of holding a nonbinding advisory vote on executive compensation and stockholder approval of any golden parachute payments not previously approved. |
We plan in filings with the SEC to continue to utilize the modified disclosure requirements available to emerging growth companies. As a result, our stockholders may not have access to certain information they may deem important.
We could remain an “emerging growth company” for up to five years, or until the earliest of:
|
|
• |
the last day of the first fiscal year in which our annual gross revenue exceeds $1 billion; |
|
|
• |
the date that we become a “large accelerated filer” as defined in Rule 12b-2 under the Exchange Act, which would occur if the market value of our common stock that is held by non-affiliates exceeds $700 million as of the last business day of our most recently completed second fiscal quarter; or |
|
|
• |
the date on which we have issued more than $1 billion in non-convertible debt during the preceding three-year period. |
We have incurred and will continue to incur increased costs by being a public company.
As a public company, we have and will incur significant legal, accounting and other expenses that we did not incur as a private company, including costs associated with public company reporting requirements. We have and will incur costs associated with recently adopted corporate governance requirements, including requirements of the SEC and The NASDAQ Global Select Market. We expect these rules and regulations to increase our legal and financial compliance costs and to make some activities more time-consuming and costly. We also expect these rules and regulations may make it more difficult and more expensive for us to obtain director and officer liability insurance, and we may be required to accept reduced policy limits and coverage or incur substantially higher costs to obtain the same or similar coverage. As a result, we may have more difficulty attracting and retaining qualified individuals to serve on our board of directors or as executive officers. We are currently evaluating and monitoring developments with respect to these rules, and we cannot predict or estimate the additional costs we may incur or the timing of such costs.
41
So long as we remain an “emerging growth company,” we expect to avail ourselves of the exemption from the requirement that our independent registered public accounting firm attest to the effectiveness of our internal control over financial reporting under Section 404. When our independent registered public accounting firm is required to undertake an assessment of our internal control over financial reporting, the cost of our compliance with Section 404 will correspondingly increase. Moreover, if we are not able to comply with the requirements of Section 404 applicable to us in a timely manner, or if we or our independent registered public accounting firm identifies deficiencies in our internal control over financial reporting that are deemed to be material weaknesses, the market price of our stock could decline and we could be subject to sanctions or investigations by the SEC or other regulatory authorities, which would require additional financial and management resources.
Item 1B. Unresolved Staff Comments
Not applicable.
We have various operating leases for office space, which are summarized as of December 31, 2017 in the table below. We believe that our facilities are adequate for our current needs.
|
Location |
|
Purpose |
|
Approximate Square Feet |
|
|
Principal Lease Expiration Dates |
|
|
Seattle, Washington |
|
Corporate headquarters |
|
|
70,000 |
|
|
2023 |
|
Seattle, Washington |
|
Design laboratory office |
|
|
11,000 |
|
|
2018 |
|
Shanghai, China |
|
General office space |
|
|
4,000 |
|
|
2018 |
We lease additional offices in California, Virginia and Thailand. For more information about our lease commitments, please refer to Note 12 to our consolidated financial statements included elsewhere in this report.
As of the date of this report, we are not a party to any material legal proceedings. In the normal course of business, we may be named as a party to various legal claims, actions and complaints. We cannot predict whether any resulting liability would have a material adverse effect on our financial position, results of operations or cash flows.
Item 4. Mine Safety Disclosures
Not applicable.
42
Item 5. Market for Registrant’s Common Equity, Related Stockholder Matters and Issuer Purchases of Equity Securities
Market Information and Holders
Our common stock has traded on The Nasdaq Global Select Market under the symbol “PI” since July 21, 2016. The following table sets forth, for each quarterly period indicated, the high and low sales prices per share for our common stock as quoted on The Nasdaq Global Select Market:
|
|
|
High |
|
|
Low |
|
||
|
Year Ended December 31, 2016: |
|
|
|
|
|
|
|
|
|
Third Quarter |
|
$ |
38.43 |
|
|
$ |
16.36 |
|
|
Fourth Quarter |
|
|
41.91 |
|
|
|
23.55 |
|
|
|
|
High |
|
|
Low |
|
||
|
Year Ended December 31, 2017: |
|
|
|
|
|
|
|
|
|
First Quarter |
|
$ |
37.42 |
|
|
$ |
26.69 |
|
|
Second Quarter |
|
|
60.85 |
|
|
|
28.00 |
|
|
Third Quarter |
|
|
55.90 |
|
|
|
29.82 |
|
|
Fourth Quarter |
|
|
41.97 |
|
|
|
19.97 |
|
Holders of Record
As of February 28, 2018, there were 69 holders of record of our common stock. The actual number of stockholders is greater than this number of record holders and includes stockholders who are beneficial owners but whose shares are held in street name by brokers and other nominees. This number of holders of record also does not include stockholders whose shares may be held in trust by other entities.
Dividends
We have never declared or paid a cash dividend on our common stock and we intend to retain all available funds and any future earnings to fund the development and growth of our business. We therefore do not anticipate paying any cash dividends on our common stock in the foreseeable future. In addition, our senior credit facility materially restricts, and future debt instruments may materially restrict, our ability to pay dividends on our common stock. Any future determinations to pay dividends on our common stock would depend on our results of operations, our financial condition and liquidity requirements, restrictions that may be imposed by applicable law or our contracts, and any other factors that our board of directors may consider relevant.
43
Use of Proceeds from Public Offerings of Common Stock
On July 20, 2016, our registration statement on Form S-1 (No. 333-211779) was declared effective for our initial public offering, or IPO. There has been no material change in the planned use of proceeds from our IPO from that described in the final prospectus dated July 20, 2016 filed with the SEC pursuant to Rule 424(b)(4) under the Securities Act. Pending the uses described, we have invested the net proceeds in short-term, investment-grade interest-bearing securities such as U.S. government agencies, corporate notes and bonds and money market funds.
Performance Graph
The following graph compares our cumulative total stockholder return on Impinj’s common stock with the NASDAQ Composite Index and the Philadelphia Semiconductor Index:
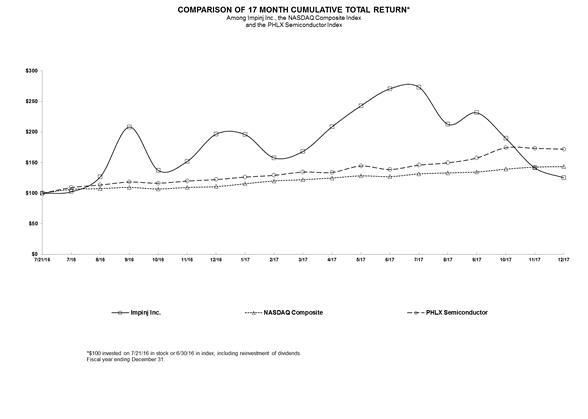
This graph covers the period from July 21, 2016, using the closing price for the first day of trading immediately following the effectiveness of our initial public offering per SEC regulations, through December 31, 2017. This graph assumes that the value of the investment in Impinj’s common stock and each index (including reinvestment of dividends) was $100 on July 21, 2016.
44
Item 6. Selected Financial Data
The selected financial data set forth below should be read in conjunction with the information under “Management’s Discussion and Analysis of Financial Condition and Results of Operations” and our audited consolidated financial statements and related notes included elsewhere in this report and our previous financial statements that are not included in this report.
|
|
|
Year Ended |
|
|||||||||||||||||
|
|
|
December 31, |
|
|||||||||||||||||
|
|
|
2017 |
|
|
2016 |
|
|
2015 |
|
|
2014 |
|
|
2013 |
|
|||||
|
|
|
(in thousands, except per share data) |
|
|||||||||||||||||
|
Statements of Operations Data: |
|
|
|
|
|
|
|
|
|
|
|
|
|
|
|
|
|
|
|
|
|
Revenue |
|
$ |
125,300 |
|
|
$ |
112,287 |
|
|
$ |
78,479 |
|
|
$ |
63,763 |
|
|
$ |
55,491 |
|
|
Cost of revenue (1) |
|
|
60,359 |
|
|
|
52,834 |
|
|
|
37,633 |
|
|
|
30,121 |
|
|
|
27,069 |
|
|
Gross profit |
|
|
64,941 |
|
|
|
59,453 |
|
|
|
40,846 |
|
|
|
33,642 |
|
|
|
28,422 |
|
|
Operating expenses: |
|
|
|
|
|
|
|
|
|
|
|
|
|
|
|
|
|
|
|
|
|
Research and development expense (1) |
|
|
32,220 |
|
|
|
25,185 |
|
|
|
17,579 |
|
|
|
14,287 |
|
|
|
10,608 |
|
|
Sales and marketing expense (1) |
|
|
31,579 |
|
|
|
22,330 |
|
|
|
14,579 |
|
|
|
10,825 |
|
|
|
9,645 |
|
|
General and administrative expense (1) |
|
|
18,161 |
|
|
|
12,426 |
|
|
|
7,087 |
|
|
|
6,115 |
|
|
|
5,653 |
|
|
Offering costs (1) |
|
|
— |
|
|
|
— |
|
|
|
— |
|
|
|
1,959 |
|
|
|
— |
|
|
Total operating expenses |
|
|
81,960 |
|
|
|
59,941 |
|
|
|
39,245 |
|
|
|
33,186 |
|
|
|
25,906 |
|
|
Income (loss) from operations |
|
|
(17,019 |
) |
|
|
(488 |
) |
|
|
1,601 |
|
|
|
456 |
|
|
|
2,516 |
|
|
Interest income (expense) and other income (expense), net |
|
|
(400 |
) |
|
|
(1,017 |
) |
|
|
(535 |
) |
|
|
(63 |
) |
|
|
(2,183 |
) |
|
Income (loss) before tax expense |
|
|
(17,419 |
) |
|
|
(1,505 |
) |
|
|
1,066 |
|
|
|
393 |
|
|
|
333 |
|
|
Income tax benefit (expense) |
|
|
97 |
|
|
|
(168 |
) |
|
|
(166 |
) |
|
|
(96 |
) |
|
|
(98 |
) |
|
Net income (loss) |
|
|
(17,322 |
) |
|
|
(1,673 |
) |
|
|
900 |
|
|
|
297 |
|
|
|
235 |
|
|
Less: Accretion of preferred stock (2) |
|
|
— |
|
|
|
(6,258 |
) |
|
|
(11,301 |
) |
|
|
(11,301 |
) |
|
|
(11,301 |
) |
|
Net loss attributable to common stockholders |
|
$ |
(17,322 |
) |
|
$ |
(7,931 |
) |
|
$ |
(10,401 |
) |
|
$ |
(11,004 |
) |
|
$ |
(11,066 |
) |
|
Net loss per share attributable to common stockholders — basic and diluted (3) |
|
$ |
(0.84 |
) |
|
$ |
(0.74 |
) |
|
$ |
(2.67 |
) |
|
$ |
(3.30 |
) |
|
$ |
(3.52 |
) |
|
Weighted-average shares used to compute net loss per share attributable to common stockholders — basic and diluted |
|
|
20,680 |
|
|
|
10,778 |
|
|
|
3,893 |
|
|
|
3,338 |
|
|
|
3,144 |
|
|
|
|
|
|
|
|
|
|
|
|
|
|
|
|
|
|
|
|
|
|
|
|
(1) Includes stock-based compensation as follows: |
|
|
|
|
|
|
|
|
|
|
|
|
|
|
|
|
|
|
|
|
|
Cost of revenue |
|
$ |
231 |
|
|
$ |
96 |
|
|
$ |
31 |
|
|
$ |
49 |
|
|
$ |
45 |
|
|
Research and development expense |
|
|
2,431 |
|
|
|
983 |
|
|
|
305 |
|
|
|
362 |
|
|
|
339 |
|
|
Sales and marketing expense |
|
|
3,113 |
|
|
|
1,289 |
|
|
|
692 |
|
|
|
413 |
|
|
|
148 |
|
|
General and administrative expense |
|
|
1,653 |
|
|
|
397 |
|
|
|
150 |
|
|
|
313 |
|
|
|
275 |
|
|
Offering costs |
|
|
— |
|
|
|
— |
|
|
|
— |
|
|
|
38 |
|
|
|
— |
|
|
Total stock-based compensation expense |
|
$ |
7,428 |
|
|
$ |
2,765 |
|
|
$ |
1,178 |
|
|
$ |
1,175 |
|
|
$ |
807 |
|
(2) See Note 9 of the notes to our consolidated financial statements included elsewhere in this report for the explanation of the accretion of redeemable convertible preferred stock.
(3) See Note 13 of the notes to our consolidated financial statements included elsewhere in this report for an explanation of the calculation of our net loss per share attributable to common stockholders — basic and diluted.
45
|
|
As of December 31, |
|
||||||||||||||||||
|
|
|
2017 |
|
|
2016 |
|
|
2015 |
|
|
2014 |
|
|
2013 |
|
|||||
|
|
|
(in thousands) |
|
|||||||||||||||||
|
Balance Sheet Data: |
|
|
|
|
|
|
|
|
|
|
|
|
|
|
|
|
|
|
|
|
|
Cash, cash equivalents and short-term investments |
|
$ |
58,116 |
|
|
$ |
100,541 |
|
|
$ |
10,121 |
|
|
$ |
6,939 |
|
|
$ |
11,178 |
|
|
Working capital |
|
|
109,879 |
|
|
|
123,345 |
|
|
|
18,468 |
|
|
|
12,169 |
|
|
|
15,282 |
|
|
Total assets |
|
|
152,034 |
|
|
|
167,536 |
|
|
|
52,848 |
|
|
|
33,817 |
|
|
|
32,968 |
|
|
Total long-term debt |
|
|
9,588 |
|
|
|
12,265 |
|
|
|
15,910 |
|
|
|
7,974 |
|
|
|
10,592 |
|
|
Accumulated deficit |
|
|
(204,525 |
) |
|
|
(187,203 |
) |
|
|
(185,315 |
) |
|
|
(186,215 |
) |
|
|
(186,512 |
) |
|
Total stockholders’ equity (deficit) (1) |
|
|
118,942 |
|
|
|
124,023 |
|
|
|
(85,035 |
) |
|
|
(76,471 |
) |
|
|
(67,028 |
) |
(1) See Note 9 of the notes to our consolidated financial statements included elsewhere in this report for the explanation of the automatic conversion of redeemable convertible preferred stock upon the effectiveness of the registration statement related to our initial public offering.
46
Item 7. Management’s Discussion and Analysis of Financial Condition and Results of Operations
You should read the following discussion and analysis together with our consolidated financial statements and the related notes to those statements included elsewhere in this report. This discussion contains forward-looking statements that involve risks and uncertainties. As a result of many factors, such as those set forth under “Risk Factors” and elsewhere in this report, our actual results may differ materially from those anticipated in these forward-looking statements.
Overview
Our vision is digital life for everyday items. Our mission is to deliver a platform that powers that item-to-cloud connectivity, enabling developers to innovate IoT applications on our platform. We believe that by expanding the reach of the Internet to items such as retail apparel, medical supplies, pharmaceuticals, airline luggage, automotive parts, food – nearly everything – we can improve peoples’ lives.
We were founded in 2000 and, since 2003, have been focused on our mission of item connectivity. Our platform delivers real-time information about an item’s unique identity, location and authenticity through RAIN RFID technology.
The Impinj platform comprises three layers that together connect items to applications. Figuratively, from bottom to top, they are an endpoint layer, a connectivity layer and a software layer. Within each layer we sell one or more product families. Our platform comprises:
|
|
• |
Endpoints. Our endpoint IC product family, branded Monza, comprises a family of miniature radios-on-a-chip that attach to and uniquely identify their host items. We term the endpoint IC and its host item an “endpoint.” Our endpoint ICs power themselves from a reader’s radio waves so don’t need a battery, can wirelessly connect almost any item and are readable to 30 feet without line-of-sight. We launched our first endpoint IC, Monza 1, in 2005 and have brought to market five subsequent Monza product families. Each family has increased performance, offered new features and functionalities and reduced cost. Most recently, we introduced our Monza R6 product family, which has longer read range, improved ease-of-use and lower cost when compared with prior Monza products. We have shipped over 25 billion Monza endpoint ICs since 2005, including approximately 7.1 billion and 6.0 billion in the 12 months ended December 31, 2017 and 2016, respectively. |
|
|
• |
Connectivity. Our connectivity layer comprises a family of readers, gateways and reader ICs that wirelessly identify, locate, authenticate and engage endpoints via RAIN. These connectivity products wirelessly provide power to, and communicate bidirectionally with, endpoint ICs, identifying and locating up to 1,000 items per second. |
|
|
o |
Readers and Gateways. Our readers read, write, authenticate or otherwise engage endpoint ICs. Our gateways integrate stationary readers with scanning antennas to locate and track endpoints. Our stationary reader product family, branded Speedway, comprises high-performance finished products. We launched our first Speedway reader in 2006 and have brought to market two subsequent Speedway product families as well as firmware/software enhancements. Our gateway product family integrates our Speedway readers with beamforming antennas to electrically steer a radio beam like a searchlight. We introduced our first gateway, xPortal, in 2010. xPortal is optimized for reading tags in transition zones such as doors and hallways. We introduced our xArray gateway in 2014. xArray is optimized for reading tags over a wide area such as store floors, manufacturing facilities and hospital rooms. We introduced our xSpan gateway in 2016, Like xPortal, xSpan is optimized for reading tags in transition zones such as doors and hallways. |
47
|
|
• |
Software. ItemSense is the operating system for our platform. It extracts item data from the connectivity and endpoint layers to deliver data to business and consumer applications. It also centralizes reader and gateway configuration, management and control through a management application program interface, or API. It is modular, scalable and secure and can operate on-premises, in hybrid-cloud or in cloud-based environments. ItemSense can connect, manage and process data from hundreds of readers or gateways. We began generating ItemSense revenue in the second half of 2016; however, as anticipated, our revenue to date has not been material as we continue our development and commercialization efforts. |
We derive a substantial majority of our revenue from sales of our platform hardware and software. We also occasionally derive revenue from non-recurring engineering, or NRE, development agreements under which we develop custom products or services. Although we will continue to pursue strategic NRE opportunities, we expect NRE-based revenue to remain a small percentage of total revenue.
We manage our business using a capital-efficient operating model that leverages third-party semiconductor foundries and subcontractors to produce and test our ICs and contract manufacturers to assemble and test our readers and gateways. We designed this production model to scale efficiently with volume. We leverage a partner channel comprising OEMs, ODMs, distributors, system integrators, VARs and software-solution partners to deliver our products and scale revenue.
The efficiency of our operating model allows us to invest strategically in research and development, inventory and sales and marketing.
|
|
• |
In 2017 and 2016, we invested $32.2 million and $25.4 million, respectively, in research and development, including expenses related to NRE development agreements and capitalized internal-use software-development costs. We intend to continue investing significantly in research and development to maintain our technology leadership. |
|
|
• |
In 2017, we grew our ending inventory by $19.3 million over the ending inventory of $27.7 million at December 31, 2016 to meet growing demand for our products and to reduce lead times. We intend to slow our investment in inventory in the near term. |
|
|
• |
In 2017 and 2016, we invested $31.6 million and $22.3 million, respectively, in sales and marketing. We intend to continue investing in sales and marketing, including expanding our sales and marketing personnel to increase our selling opportunities. |
These investments will increase operating expenses on an absolute dollar basis for the foreseeable future. Many of these investments will occur in advance of us experiencing any direct benefit from them and may affect our profitability, or cause an operating loss, in future periods.
In February 2018, we agreed to a partner’s request for a one-time product exchange, requiring us to record a sales returns reserve in 2017. The sales returns reserve reduced our revenue by $3.2 million and there was a decrease to cost of sales. This exchange transaction decreased gross profit and gross margin in 2017. We expect to recognize revenue of $3.2 million in the first half of 2018 when the exchange transaction is completed. This exchange transaction will increase gross profit in 2018 and we expect an accretive impact on gross margin in the first half of 2018.
48
In February 2018, we began implementing a restructuring to match our strategic and financial objectives and to optimize resources for long-term growth, including a reduction in force program affecting approximately 9% of our employees. As part of the restructuring, we will also look to reduce leased office space and close some remote offices. We estimate expenses relating to these actions at approximately $3.75 million to $4.25 million. We currently expect the reduction-in-force charges, comprising primarily severance benefits, to be in the range of $1.0 million to $1.35 million; and the lease space reduction, comprising primarily sublease costs and lease cease-use charges, to be in the range of $2.75 million to $2.9 million. We anticipate we will recognize most of these charges in the first half of 2018.
In March 2018, we amended its Senior Credit Facility, to, among other things, extend the maturity date of the revolving credit facility to March 5, 2020, and provide for a new $20.0 million term loan, the proceeds of which refinance $7.9 million outstanding under the existing term loan and $1.1 million of equipment loans outstanding under the Senior Credit Facility. The remaining term loan proceeds are available for general corporate purposes. The new term loan will amortize over 36 months, beginning on April 1, 2019, following an initial interest-only period, and mature on March 1, 2022. The Company retains the ability to prepay the term loan at any time, subject to a prepayment fee equal to 2.0% of the outstanding principal amount if prepaid on or before March 5, 2019, or 1.0% of the outstanding principal amount if prepaid after March 5, 2019, but on or before March 5, 2020. The amendment also amends the financial covenants under the Senior Credit Facility such that if our cash in accounts maintained with the lender, plus available revolver borrowings, falls below $60.0 million for the period of time beginning on March 5, 2018 and ending on December 31, 2018, or $55.0 million for the period of time beginning on January 1, 2019 and at all times thereafter, the Company must comply with an amended covenant to not exceed maximum adjusted EBITDA loss thresholds that vary by period and the existing minimum liquidity ratio, each determined in accordance with the terms of the Senior Credit Facility.
Our total revenue was $125.3 million, $112.3 million and $78.5 million for 2017, 2016 and 2015, respectively. Our net loss was $17.3 million and $1.7 million for 2017 and 2016, respectively and our net income was $900,000 for 2015. Our adjusted EBITDA loss was $5.6 million for 2017, and our adjusted EBITDA income was $5.1 million and $5.8 million for 2016 and 2015, respectively. For a definition of adjusted EBITDA and a reconciliation of adjusted EBITDA to net income (loss), see “Selected Consolidated Financial Data—Adjusted EBITDA.”
Factors Affecting Our Performance
Investing in Growth
We have invested, and plan to continue investing, significantly in research and development to enhance and extend our platform, including enhancing existing platform products and introducing new platform products. We plan to enhance our operating-system software, including its deployment models and functionalities. We plan to enhance our fixed readers and gateways and leverage them for platform deployments in retail, healthcare and other industries. We also plan to develop next-generation reader and endpoint ICs. We may enter into arrangements with customers, vendors and channel partners to fund a portion of certain of these research and development initiatives. If we are unsuccessful in attracting such funding, our operating results and product time-to-market may be adversely affected.
We also are investing in sales and marketing and are deepening product integration with our software partners to accelerate the development and adoption of solutions based on our platform. These investments will increase research, development, sales and marketing expenses on an absolute dollar basis for the foreseeable future. Many of these investments will occur in advance of experiencing any direct benefit from them and may affect our profitability in future periods.
49
Our financial performance generally depends upon the rate, scope and depth of end-user adoption of our platform in multiple industries, including the retail industry which is our largest market. In 2015 and 2016 some major retailers, brand owners and other entities initiated new deployments that significantly increased our product sales. In 2016, our endpoint IC sales exceeded both our expectations and those of our industry’s analysts. We believe these deployments indicate a trend toward greater RAIN adoption in retail and other markets, and intend to continue introducing new products to further grow overall market adoption. As a result of these 2016 trends, we invested in endpoint IC inventory both to meet forecasted demand and to enhance our ability to deliver in the event of another unexpected demand surge. However, in the second half of 2017 the growth rate in endpoint IC shipments decelerated due to multiple factors including, but not limited to, delays in both new deployments and the planned expansions at several large retailers.
As another example of growing RAIN adoption, our reader and gateway sales in the second half of 2017 exceeded our expectations, due to end users deploying shipment-verification and asset-tracking use cases that demand real-time fixed reading and RAIN data integration with enterprise software systems. In addition, retailers demanding more transformative business value from RAIN are beginning to turn to real-time fixed reading. We believe greater adoption of fixed readers and our software will increase the value of our platform, which could further drive adoption over the longer term.
If market adoption of RAIN technology, and our platform products specifically, does not meet our expectations, our growth prospects and operating results will be adversely affected. In addition, if endpoint IC, reader and gateway sales exceed expectations, our revenue and profitability may be positively affected, or if we discount prices to win opportunities, our gross margins may be negatively affected. In addition, if we are unable to meet end user or customer volume or performance expectations in the near term our business and prospects may be adversely affected.
Timing and Complexity of Customer Deployments
From 2010 to 2017, our endpoint IC unit sales volume increased at a compounded annual growth rate of 33%. However, deployment of RAIN-based solutions has been uneven and unpredictable in scope, timing and implementation. For example, growth in endpoint IC unit sales volumes decelerated in the second half of 2017. For end users to gain business value from our platform, they typically must integrate our platform with their applications and information systems. End-users may only deploy certain of our hardware products, which may affect the value they derive from our platform, and in turn, our operating results. We have a large and multi-tiered partner channel which serves many markets and end users; we rely on these channel partners to deploy or integrate our platform and products with end user applications and information systems. If our partners fail to deploy or integrate our platforms and products as planned then sales of our products and our reputation may be adversely affected. As a result of these factors and our reliance on our channel partners, we may experience significant fluctuation in revenue on a quarterly basis, and we anticipate these factors will continue to characterize our business for the foreseeable future. Therefore, we focus on annual results as they are more relevant for planning and for evaluating our performance.
Average Selling Price
We occasionally discount prices of our products to win opportunities, particularly large opportunities. In future periods we expect our hardware ASPs to fluctuate based on the level of discounting and competitive price pressures, and generally to decline over time. Historically, we have been able to implement manufacturing and quality improvements that effectively reduce the cost per unit of most of our products, allowing us to maintain, and in some cases increase, gross margins.
Inventory Supply
From time to time we may experience high inventory levels or shortages of products available for sale. These inventory dynamics can impact some of our hardware components or key SKUs within a particular product line. High inventory levels and potential obsolescence could result in unexpected expenses or increases in reserves that could adversely affect our business. In periods of rapidly increasing demand, lead times for our products can be lengthy, causing us to occasionally experience product shortages. If we underestimate customer demand or if sufficient manufacturing capacity is unavailable, we could potentially lose market share and damage our customer relationships.
50
Components of Results of Operations
Revenue
We currently derive substantially all of our revenue from sales of our endpoint ICs, reader ICs, readers and gateways as follows:
|
|
• |
We sell our endpoint ICs primarily to inlay manufacturers. In 2017, endpoint IC sales represented 73% of our revenue, compared to 77% in 2016. We expect endpoint IC sales to represent a majority of our revenue for the foreseeable future. In 2017, endpoint IC sales to inlay manufacturers Avery, Smartrac and Arizon accounted for 61% of our total endpoint IC revenue, and 18%, 14% and 13% of our total revenue, respectively. |
|
|
• |
We sell our readers and gateways to VARs and system integrators primarily through distributors. We are beginning to sell software through these same partners as well as through ISVs. In 2017, sales to Blue Star accounted for 48% of our readers and gateway revenue, and 10% of our total revenue. We expect revenue from reader, gateway and software sales to increase as a percentage of total revenue over time as a result of our investment in sales and marketing associated with our solutions business and our growing emphasis on software. |
|
|
• |
We sell our reader ICs primarily to OEMs and ODMs through distributors. In 2017, sales to our top three reader IC customers accounted for 63% of our total reader IC revenue, but none individually represented more than 10% of our total revenue. We expect customer concentration for reader ICs to decrease over time as demand for RAIN solutions grows and the number of OEMs and ODMs increases. |
We sell our products through a broad network of OEMs, ODMs and distribution channel partners; many of these channel partners sell multiple Impinj products. In addition, to take advantage of the benefits associated with our platform, end users must deploy multiple products. As a result, we evaluate our performance primarily on total revenue rather than on the revenue associated with any particular product line.
For our endpoint and reader ICs, we generally recognize revenue upon shipment because the relevant criteria for revenue recognition are met at that time. For our reader and gateway products, which are occasionally sold with other products and support, we allocate revenue to each separate deliverable on a relative fair-value basis and generally recognize revenue upon shipment or defer and recognize revenue ratably over the contract service period. We believe software revenue will grow over time, but it has not been material to date, and we expect modest software revenue for the foreseeable future.
Cost of Revenue and Gross Margin
Cost of revenue includes costs associated with manufacturing our endpoint ICs, reader ICs, readers and gateways, including direct materials and manufacturing costs as well as associated overhead costs such as logistics, quality control, planning and procurement. We outsource manufacturing of our readers and gateways to a third-party contract manufacturer, and our costs for these devices are based on negotiated prices for finished goods. Cost of revenue also includes charges for inventory write-downs, warranty costs and accrued losses on purchase commitments to third-party contract manufacturers. Our gross margin varies from period to period based on product mix and discounting to win strategic opportunities. Historical gross margin has remained relatively consistent at between 48% and 55% for the interim and annual periods during the last three fiscal years.
Operating Expenses
Research and Development
Research and development expense consists primarily of salaries and related compensation costs, including stock-based compensation expense, for our product development personnel, contract developers, prototype materials and other expenses related to the development of new and innovative products and solutions. We expect research and development expense to increase in absolute dollars in future periods for platform product development.
51
Selling and marketing expense consists primarily of salaries and related variable compensation costs, including stock-based compensation expense for our sales personnel, as well as travel, advertising and promotional expenses and other related expenses. We anticipate that sales and marketing expense will increase in absolute dollars, as we increase personnel and focus on expanding our market penetration, developing strategic partnerships and driving adoption of our platform. We expect incentive sales compensation to fluctuate as a function of sales.
General and Administrative
General and administrative expense consists primarily of salaries and related compensation costs, including stock-based compensation expense, for our executive, finance, human resources and information technology personnel, legal, accounting and other professional services, travel and related expenses, insurance, occupancy and other overhead costs. We expect our general and administrative expenses to increase in absolute dollars as we add personnel and facilities to support our growth. In addition, we will incur additional compliance and reporting costs as a public company.
Interest Income (Expense) and Other Income (Expense), Net
Interest expense consists primarily of interest on our credit facilities and amortization of deferred financing fees associated with such facilities. Interest income and other income (expense), net consists of interest income earned on our cash, cash equivalents and short-term investments and, in periods prior to our initial public offering, changes in the fair value of outstanding redeemable convertible preferred stock warrants.
52
The following table present our results of operations for the periods indicated:
|
|
|
Year Ended |
|
|||||||||
|
|
|
December 31, |
|
|||||||||
|
|
|
2017 |
|
|
2016 |
|
|
2015 |
|
|||
|
|
|
(in thousands, except per share data) |
|
|||||||||
|
Statements of Operations Data: |
|
|
|
|
|
|
|
|
|
|
|
|
|
Revenue |
|
$ |
125,300 |
|
|
$ |
112,287 |
|
|
$ |
78,479 |
|
|
Cost of revenue (1) |
|
|
60,359 |
|
|
|
52,834 |
|
|
|
37,633 |
|
|
Gross profit |
|
|
64,941 |
|
|
|
59,453 |
|
|
|
40,846 |
|
|
Operating expenses: |
|
|
|
|
|
|
|
|
|
|
|
|
|
Research and development (1) |
|
|
32,220 |
|
|
|
25,185 |
|
|
|
17,579 |
|
|
Sales and marketing (1) |
|
|
31,579 |
|
|
|
22,330 |
|
|
|
14,579 |
|
|
General and administrative (1) |
|
|
18,161 |
|
|
|
12,426 |
|
|
|
7,087 |
|
|
Total operating expenses |
|
|
81,960 |
|
|
|
59,941 |
|
|
|
39,245 |
|
|
Income (loss) from operations |
|
|
(17,019 |
) |
|
|
(488 |
) |
|
|
1,601 |
|
|
Interest income (expense) and other income (expense), net |
|
|
(400 |
) |
|
|
(1,017 |
) |
|
|
(535 |
) |
|
Income (loss) before tax expense |
|
|
(17,419 |
) |
|
|
(1,505 |
) |
|
|
1,066 |
|
|
Income tax benefit (expense) |
|
|
97 |
|
|
|
(168 |
) |
|
|
(166 |
) |
|
Net income (loss) |
|
|
(17,322 |
) |
|
|
(1,673 |
) |
|
|
900 |
|
|
Less: Accretion of preferred stock |
|
|
— |
|
|
|
(6,258 |
) |
|
|
(11,301 |
) |
|
Net loss attributable to common stockholders |
|
$ |
(17,322 |
) |
|
$ |
(7,931 |
) |
|
$ |
(10,401 |
) |
|
Net loss per share attributable to common stockholders — basic and diluted (2) |
|
$ |
(0.84 |
) |
|
$ |
(0.74 |
) |
|
$ |
(2.67 |
) |
|
Weighted-average shares used to compute net income (loss) per share attributable to common stockholders — basic and diluted |
|
|
20,680 |
|
|
|
10,778 |
|
|
|
3,893 |
|
|
Other Financial Data: |
|
|
|
|
|
|
|
|
|
|
|
|
|
Adjusted EBITDA (3) |
|
$ |
(5,641 |
) |
|
$ |
5,146 |
|
|
$ |
4,751 |
|
|
|
|
|
|
|
|
|
|
|
|
|
|
|
|
(1) Includes stock-based compensation as follows: |
|
|
|
|
|
|
|
|
|
|
|
|
|
Cost of revenue |
|
$ |
231 |
|
|
$ |
96 |
|
|
$ |
31 |
|
|
Research and development expense |
|
|
2,431 |
|
|
|
983 |
|
|
|
305 |
|
|
Sales and marketing expense |
|
|
3,113 |
|
|
|
1,289 |
|
|
|
692 |
|
|
General and administrative expense |
|
|
1,653 |
|
|
|
397 |
|
|
|
150 |
|
|
Total stock-based compensation expense |
|
$ |
7,428 |
|
|
$ |
2,765 |
|
|
$ |
1,178 |
|
|
|
|
|
|
|
|
|
|
|
|
|
|
|
|
(2) See Note 13 of the notes to our condensed consolidated financial statements included elsewhere in this report for an explanation of the calculation of our net loss per share attributable to common stockholders — basic and diluted. |
|
|||||||||||
|
(3) See “Adjusted EBITDA” below for more information and for a reconciliation of adjusted EBITDA to net (income) loss, the most directly comparable financial measure calculated and presented in accordance with U.S. generally accepted accounting principles. |
|
|||||||||||
Adjusted EBITDA
We use adjusted EBITDA as a key measure to understand and evaluate our core operating performance and trends, to prepare and approve our annual budget and to develop short- and long-term operational plans. In addition, we believe excluding certain expenses in calculating adjusted EBITDA can provide a useful measure for period-to-period comparisons of our business. Accordingly, we believe that adjusted EBITDA provides useful information to investors and others in understanding and evaluating our operating results in the same manner as it does for our management and board of directors.
53
Adjusted EBITDA is not prepared in accordance with U.S. generally accepted accounting principles, or GAAP, and should not be considered in isolation of, or as an alternative to, measures prepared in accordance with GAAP. In addition, adjusted EBITDA is not based on any comprehensive set of accounting rules or principles. As a non-GAAP measure, adjusted EBITDA has limitations in that it does not reflect all of the amounts associated with our results of operations as determined in accordance with GAAP. Some of these limitations are that our adjusted EBITDA:
|
|
• |
does not reflect interest or other income; |
|
|
• |
does not reflect interest expense, or the cash requirements necessary to service interest or principal payments on our debt; |
|
|
• |
does not reflect the amounts we paid in taxes or other components of our tax expense; |
|
|
• |
does not reflect the non-cash charges of depreciation and amortization; |
|
|
• |
does not reflect stock-based compensation expense; |
|
|
• |
does not reflect offering costs written off due to delays in offering activities related to our initial public offering; and |
|
|
• |
may be calculated differently than such metric calculated by other companies, limiting its usefulness as a comparative measure. |
Because of these limitations, you should consider adjusted EBITDA alongside other financial performance measures, including our financial results presented in accordance with GAAP.
The following table presents a reconciliation of net income (loss) to adjusted EBITDA:
|
|
|
Year Ended |
|
|||||||||
|
|
|
December 31, |
|
|||||||||
|
|
|
2017 |
|
|
2016 |
|
|
2015 |
|
|||
|
|
|
(in thousands) |
|
|||||||||
|
Reconciliation of Adjusted EBITDA to Net Income: |
|
|
|
|
|
|
|
|
|
|
|
|
|
Net income (loss) |
|
$ |
(17,322 |
) |
|
$ |
(1,673 |
) |
|
$ |
900 |
|
|
Interest income (expense) and other income (expense), net |
|
|
400 |
|
|
|
1,017 |
|
|
|
535 |
|
|
Income tax benefit (expense) |
|
|
(97 |
) |
|
|
168 |
|
|
|
166 |
|
|
Depreciation and amortization |
|
|
3,950 |
|
|
|
2,869 |
|
|
|
1,972 |
|
|
Stock-based compensation |
|
|
7,428 |
|
|
|
2,765 |
|
|
|
1,178 |
|
|
Adjusted EBITDA |
|
$ |
(5,641 |
) |
|
$ |
5,146 |
|
|
$ |
4,751 |
|
54
The following table presents our results of operations for the periods indicated as a percentage of total revenue. Percentages from certain line items do not sum to the subtotal or total line items due to rounding.
|
|
|
Year Ended |
|
|||||||||
|
|
|
December 31, |
|
|||||||||
|
|
|
2017 |
|
|
2016 |
|
|
2015 |
|
|||
|
Percentage of Revenue: |
|
|
|
|
|
|
|
|
|
|
|
|
|
Revenue |
|
|
100.0 |
% |
|
|
100.0 |
% |
|
|
100.0 |
% |
|
Cost of revenue |
|
|
48.2 |
|
|
|
47.1 |
|
|
|
48.0 |
|
|
Gross profit |
|
|
51.8 |
|
|
|
52.9 |
|
|
|
52.0 |
|
|
Operating expenses: |
|
|
|
|
|
|
|
|
|
|
|
|
|
Research and development |
|
|
25.7 |
|
|
|
22.4 |
|
|
|
22.4 |
|
|
Sales and marketing |
|
|
25.2 |
|
|
|
19.9 |
|
|
|
18.6 |
|
|
General and administrative |
|
|
14.5 |
|
|
|
11.1 |
|
|
|
9.0 |
|
|
Total operating expenses |
|
|
65.4 |
|
|
|
53.4 |
|
|
|
50.0 |
|
|
Income (loss) from operations |
|
|
(13.6 |
) |
|
|
(0.4 |
) |
|
|
2.0 |
|
|
Interest income (expense) and other income (expense), net |
|
|
(0.3 |
) |
|
|
(0.9 |
) |
|
|
(0.7 |
) |
|
Income (loss) before tax expense |
|
|
(13.9 |
) |
|
|
(1.3 |
) |
|
|
1.4 |
|
|
Income tax benefit (expense) |
|
|
0.1 |
|
|
|
(0.1 |
) |
|
|
(0.1 |
) |
|
Net income (loss) |
|
|
(13.8 |
)% |
|
|
(1.5 |
)% |
|
|
1.1 |
% |
Comparison of Years Ended December 31, 2017 and 2016
Revenue
|
|
|
Year ended December 31, |
|
|
Change 2016 to 2017 |
|
||||||||||
|
|
|
2017 |
|
|
2016 |
|
|
In Dollars |
|
|
In Percentage |
|
||||
|
Revenue: |
|
|
|
|
|
|
|
|
|
|
|
|
|
|
|
|
|
Endpoint ICs |
|
$ |
91,699 |
|
|
$ |
86,218 |
|
|
$ |
5,481 |
|
|
|
6.4 |
% |
|
Systems |
|
|
33,601 |
|
|
|
26,069 |
|
|
|
7,532 |
|
|
|
28.9 |
|
|
Total revenue |
|
$ |
125,300 |
|
|
$ |
112,287 |
|
|
$ |
13,013 |
|
|
|
11.6 |
% |
Revenue increased $13.0 million for 2017 compared to 2016, primarily attributable to increased demand for our endpoint ICs, readers and gateways. Endpoint IC revenue increased $5.5 million in 2017 compared to 2016 due to increased shipment volumes of 65% for our Monza R6 product family; partially offset by a 40% decrease in shipment volumes for our Monza 5 product and a decrease in the average selling prices of our endpoint ICs due to the competitive environment and product mix. In addition, endpoint ICs revenue was impacted by a sales returns reserve of $3.2 million related to a product exchange that we expect to complete in the first half of 2018. For information regarding the product exchange transaction, see “Management's Discussion and Analysis of Financial Condition and Results of Operations—Overview” of this report. Systems revenue increased $7.5 million in 2017 compared to 2016 due to increased shipment volumes of 45% for systems, which includes readers and gateways and reader ICs, partially offset by a decrease in the average selling prices primarily due to product mix.
55
|
|
|
Year Ended |
|
|
|
|
|
|
|
|
|
|||||
|
|
|
December 31, |
|
|
Change 2016 to 2017 |
|
||||||||||
|
|
|
2017 |
|
|
2016 |
|
|
In Dollars |
|
|
In Percentage |
|
||||
|
|
|
(in thousands, except percentages) |
|
|||||||||||||
|
Gross profit |
|
$ |
64,941 |
|
|
$ |
59,453 |
|
|
$ |
5,488 |
|
|
|
9.2 |
% |
|
Gross margin |
|
|
51.8 |
% |
|
|
52.9 |
% |
|
|
|
|
|
|
|
|
Gross profit increased $5.5 million for 2017 compared to 2016 due to increased shipment volumes of our endpoint ICs, readers and gateways described above. Gross margin decreased in 2017 compared to 2016 primarily due to decreases in average selling prices for endpoint ICs and a smaller impact due to the sales returns reserve mentioned above. The decrease in gross margin was partially offset by higher gross margins due to product mix within endpoint ICs and volume pricing discounts from suppliers of our endpoint ICs. Gross margin also decreased due to a decrease in average selling prices for readers and gateways as we discounted prices to win opportunities and substituted higher-cost products to meet customer demand; partially offset by an increase in the percentage of total revenue attributable to readers and gateways, which generally have higher margins.
Operating Expenses
Research and Development
|
|
|
Year Ended |
|
|
|
|
|
|
|
|
|
|||||
|
|
|
December 31, |
|
|
Change 2016 to 2017 |
|
||||||||||
|
|
|
2017 |
|
|
2016 |
|
|
In Dollars |
|
|
In Percentage |
|
||||
|
|
|
(in thousands, except percentages) |
|
|||||||||||||
|
Research and development |
|
$ |
32,220 |
|
|
$ |
25,185 |
|
|
$ |
7,035 |
|
|
|
27.9 |
% |
Research and development expense increased $7.0 million for 2017 compared to 2016 due to increases of $4.4 million in personnel costs as we continued to grow our engineering headcount to support current and future product initiatives, $1.1 million in consulting services, $896,000 in contract design services, $352,000 in software subscriptions and $262,000 in allocated rent, utilities and depreciation.
Sales and Marketing
|
|
|
Year Ended |
|
|
|
|
|
|
|
|
|
|||||
|
|
|
December 31, |
|
|
Change 2016 to 2017 |
|
||||||||||
|
|
|
2017 |
|
|
2016 |
|
|
In Dollars |
|
|
In Percentage |
|
||||
|
|
|
(in thousands, except percentages) |
|
|||||||||||||
|
Sales and marketing |
|
$ |
31,579 |
|
|
$ |
22,330 |
|
|
$ |
9,249 |
|
|
|
41.4 |
% |
Sales and marketing expense increased $9.2 million for 2017 compared to 2016 due to increases of $6.6 million in personnel costs due primarily to growth in the size of our sales team, $1.0 million in sales related travel expenses, $734,000 in marketing and advertising costs, $326,000 in service providers, $293,000 in allocated rent, utilities and depreciation, and $277,000 in software subscriptions.
56
|
|
|
Year Ended |
|
|
|
|
|
|
|
|
|
|||||
|
|
|
December 31, |
|
|
Change 2016 to 2017 |
|
||||||||||
|
|
|
2017 |
|
|
2016 |
|
|
In Dollars |
|
|
In Percentage |
|
||||
|
|
|
(in thousands, except percentages) |
|
|||||||||||||
|
General and administrative |
|
$ |
18,161 |
|
|
$ |
12,426 |
|
|
$ |
5,735 |
|
|
|
46.2 |
% |
General and administrative expense increased $5.7 million for 2017 compared to 2016 due to increases of $1.8 million in personnel costs driven primarily by growth in headcount in shared corporate services, $1.4 million in professional services, $1.3 million in allocated rent, utilities and depreciation, $780,000 in software subscriptions and $411,000 in business insurance.
Interest Income (Expense) and Other Income (Expense), Net
|
|
|
Year Ended |
|
|
|
|
|
|
|
|
|
|||||
|
|
|
December 31, |
|
|
Change 2016 to 2017 |
|
||||||||||
|
|
|
2017 |
|
|
2016 |
|
|
In Dollars |
|
|
In Percentage |
|
||||
|
|
|
(in thousands, except percentages) |
|
|||||||||||||
|
Interest expense |
|
$ |
(908 |
) |
|
$ |
(1,633 |
) |
|
$ |
(725 |
) |
|
|
(44.4 |
)% |
|
Interest income and other income (expense), net |
|
|
508 |
|
|
|
616 |
|
|
|
(108 |
) |
|
|
(17.5 |
) |
Interest expense decreased by $725,000 for 2017 compared to 2016 due to a decrease in interest expense of $689,000 resulting from a lower interest rate, which decreased 1.5% as a result from our debt refinance in April 2017, and a lower principle balance on our long-term debt.
Interest income and other income (expense), net decreased $108,000 for 2017 compared to 2016 due to a favorable change of $560,000 in the fair value of outstanding convertible preferred stock warrants during 2016, partially offset by an increase in interest income of $485,000.
Comparison of Years Ended December 31, 2016 and 2015
Revenue
|
|
|
Year ended December 31, |
|
|
Change 2015 to 2016 |
|
||||||||||
|
|
|
2016 |
|
|
2015 |
|
|
In Dollars |
|
|
In Percentage |
|
||||
|
Revenue: |
|
|
|
|
|
|
|
|
|
|
|
|
|
|
|
|
|
Endpoint ICs |
|
$ |
86,218 |
|
|
$ |
52,854 |
|
|
$ |
33,364 |
|
|
|
63.1 |
% |
|
Systems |
|
|
26,069 |
|
|
|
25,625 |
|
|
|
444 |
|
|
|
1.7 |
|
|
Total revenue |
|
$ |
112,287 |
|
|
$ |
78,479 |
|
|
$ |
33,808 |
|
|
|
43.1 |
% |
Revenue increased for 2016 compared to 2015 primarily driven by increased demand for our endpoint ICs. Endpoint IC revenue increased $33.4 million in 2016 compared to 2015. More than 95% of the $33.8 million increase in revenue was attributable to increased shipment volumes of our Monza R6 product family; partially offset by a modest decrease in average selling prices for our endpoint ICs. Systems revenue increased $444,000 in 2016 compared to 2015 due to increased shipment volumes of 11%; partially offset by a decrease in average selling prices due to volume pricing discounts for readers and gateways.
57
|
|
|
Year Ended |
|
|
|
|
|
|
|
|
|
|||||
|
|
|
December 31, |
|
|
Change 2015 to 2016 |
|
||||||||||
|
|
|
2016 |
|
|
2015 |
|
|
In Dollars |
|
|
In Percentage |
|
||||
|
|
|
(in thousands, except percentages) |
|
|||||||||||||
|
Gross profit |
|
$ |
59,453 |
|
|
$ |
40,846 |
|
|
$ |
18,607 |
|
|
|
45.6 |
% |
|
Gross margin |
|
|
52.9 |
% |
|
|
52.0 |
% |
|
|
|
|
|
|
|
|
Gross profit increased $18.6 million for 2016 compared to 2015 due to increased shipment volumes of our Monza R6 product family described above. Gross margin increased in 2016 compared to 2015 due to both product mix and volume pricing discounts from suppliers of our endpoint ICs; partially offset by the modest decreases in average selling prices for endpoint ICs and readers and gateways.
Operating Expenses
Research and Development
|
|
|
Year Ended |
|
|
|
|
|
|
|
|
|
|||||
|
|
|
December 31, |
|
|
Change 2015 to 2016 |
|
||||||||||
|
|
|
2016 |
|
|
2015 |
|
|
In Dollars |
|
|
In Percentage |
|
||||
|
|
|
(in thousands, except percentages) |
|
|||||||||||||
|
Research and development |
|
$ |
25,185 |
|
|
$ |
17,579 |
|
|
$ |
7,606 |
|
|
|
43.3 |
% |
Research and development expense increased $7.6 million for 2016 compared to 2015 due to increases of $4.5 million in personnel costs as we continued to grow our engineering headcount to support current and future product initiatives, $2.9 million in allocated rent, utilities and depreciation and $215,000 in consulting services.
Sales and Marketing
|
|
|
Year Ended |
|
|
|
|
|
|
|
|
|
|||||
|
|
|
December 31, |
|
|
Change 2015 to 2016 |
|
||||||||||
|
|
|
2016 |
|
|
2015 |
|
|
In Dollars |
|
|
In Percentage |
|
||||
|
|
|
(in thousands, except percentages) |
|
|||||||||||||
|
Sales and marketing |
|
$ |
22,330 |
|
|
$ |
14,579 |
|
|
$ |
7,751 |
|
|
|
53.2 |
% |
Sales and marketing expense increased $7.8 million for 2016 compared to 2015 due to increased personnel costs of $6.2 million primarily related to the significant growth in the size of our sales team. Additionally, there was an increase of $510,000 in allocated rent, utilities and depreciation, $434,000 in sales related travel expenses and $419,000 in marketing and advertising costs.
General and Administrative
|
|
|
Year Ended |
|
|
|
|
|
|
|
|
|
|||||
|
|
|
December 31, |
|
|
Change 2015 to 2016 |
|
||||||||||
|
|
|
2016 |
|
|
2015 |
|
|
In Dollars |
|
|
In Percentage |
|
||||
|
|
|
(in thousands, except percentages) |
|
|||||||||||||
|
General and administrative |
|
$ |
12,426 |
|
|
$ |
7,087 |
|
|
$ |
5,339 |
|
|
|
75.3 |
% |
General and administrative expense increased $5.3 million for 2016 compared to 2015 due to increases of $1.9 million in personnel costs driven primarily by growth in headcount in shared corporate services, $1.2 million in allocated rent, utilities and depreciation and $2.2 million in professional services.
58
Interest Income (Expense) and Other Income (Expense), Net
|
|
|
Year Ended |
|
|
|
|
|
|
|
|
|
|||||
|
|
|
December 31, |
|
|
Change 2015 to 2016 |
|
||||||||||
|
|
|
2016 |
|
|
2015 |
|
|
In Dollars |
|
|
In Percentage |
|
||||
|
|
|
(in thousands, except percentages) |
|
|||||||||||||
|
Interest expense |
|
$ |
(1,633 |
) |
|
$ |
(1,208 |
) |
|
$ |
(425 |
) |
|
|
35.2 |
% |
|
Interest income and other income (expense), net |
|
|
616 |
|
|
|
673 |
|
|
|
(57 |
) |
|
|
(8.5 |
) |
Interest expense increased $425,000 for 2016 compared to 2015 due to higher outstanding borrowings in 2016 under our mezzanine credit facility which carried an interest rate of 18% and additional borrowings under the equipment term-loan facility.
59
Quarterly Results of Operations
The following tables set forth our unaudited quarterly statements of operations data for the last eight quarters, as well as the percentage that each line item represents of total revenue. Percentages from certain line items do not sum to the subtotal or total line items due to rounding. In the opinion of management, the data has been prepared on the same basis as the audited consolidated financial statements included elsewhere in this report, and reflects all adjustments, which include normal recurring adjustments, necessary for a fair presentation of this data. The results of historical periods are not necessarily indicative of the results of operations of any future period. You should read this data together with our audited consolidated financial statements and the related notes included elsewhere in this report.
|
|
|
Three months ended |
|
|||||||||||||||||||||||||||||
|
|
|
Dec 31, |
|
|
Sept 30, |
|
|
June 30, |
|
|
Mar 31, |
|
|
Dec 31, |
|
|
Sept 30, |
|
|
June 30, |
|
|
Mar 31, |
|
||||||||
|
|
|
2017 |
|
|
2017 |
|
|
2017 |
|
|
2017 |
|
|
2016 |
|
|
2016 |
|
|
2016 |
|
|
2016 |
|
||||||||
|
|
|
(in thousands, except percentages) |
|
|||||||||||||||||||||||||||||
|
Statements of Operations Data: |
|
|
|
|
|
|
|
|
|
|
|
|
|
|
|
|
|
|
|
|
|
|
|
|
|
|
|
|
|
|
|
|
|
Revenue |
|
|
26,863 |
|
|
|
32,599 |
|
|
|
34,111 |
|
|
|
31,727 |
|
|
|
33,655 |
|
|
|
31,013 |
|
|
|
25,988 |
|
|
|
21,631 |
|
|
Cost of revenue |
|
|
13,854 |
|
|
|
15,606 |
|
|
|
15,940 |
|
|
|
14,959 |
|
|
|
15,267 |
|
|
|
14,638 |
|
|
|
12,396 |
|
|
|
10,533 |
|
|
Gross profit |
|
|
13,009 |
|
|
|
16,993 |
|
|
|
18,171 |
|
|
|
16,768 |
|
|
|
18,388 |
|
|
|
16,375 |
|
|
|
13,592 |
|
|
|
11,098 |
|
|
Gross margin |
|
|
48.4 |
% |
|
|
52.1 |
% |
|
|
53.3 |
% |
|
|
52.9 |
% |
|
|
54.6 |
% |
|
|
52.8 |
% |
|
|
52.3 |
% |
|
|
51.3 |
% |
|
Operating expenses: |
|
|
|
|
|
|
|
|
|
|
|
|
|
|
|
|
|
|
|
|
|
|
|
|
|
|
|
|
|
|
|
|
|
Research and development expense |
|
|
8,912 |
|
|
|
8,846 |
|
|
|
7,119 |
|
|
|
7,343 |
|
|
|
7,403 |
|
|
|
6,622 |
|
|
|
5,726 |
|
|
|
5,434 |
|
|
Sales and marketing expense |
|
|
9,092 |
|
|
|
8,107 |
|
|
|
7,044 |
|
|
|
7,336 |
|
|
|
6,428 |
|
|
|
5,584 |
|
|
|
5,288 |
|
|
|
5,030 |
|
|
General and administrative expense |
|
|
4,529 |
|
|
|
4,723 |
|
|
|
4,822 |
|
|
|
4,087 |
|
|
|
4,212 |
|
|
|
3,356 |
|
|
|
2,356 |
|
|
|
2,502 |
|
|
Total operating expenses |
|
|
22,533 |
|
|
|
21,676 |
|
|
|
18,985 |
|
|
|
18,766 |
|
|
|
18,043 |
|
|
|
15,562 |
|
|
|
13,370 |
|
|
|
12,966 |
|
|
Income (loss) from operations |
|
|
(9,524 |
) |
|
|
(4,683 |
) |
|
|
(814 |
) |
|
|
(1,998 |
) |
|
|
345 |
|
|
|
813 |
|
|
|
222 |
|
|
|
(1,868 |
) |
|
Interest income (expense) and other income (expense), net |
|
|
(59 |
) |
|
|
(118 |
) |
|
|
(118 |
) |
|
|
(105 |
) |
|
|
(172 |
) |
|
|
38 |
|
|
|
(436 |
) |
|
|
(447 |
) |
|
Income (loss) before tax expense |
|
|
(9,583 |
) |
|
|
(4,801 |
) |
|
|
(932 |
) |
|
|
(2,103 |
) |
|
|
173 |
|
|
|
851 |
|
|
|
(214 |
) |
|
|
(2,315 |
) |
|
Income tax benefit (expense) |
|
|
249 |
|
|
|
(50 |
) |
|
|
(45 |
) |
|
|
(57 |
) |
|
|
(70 |
) |
|
|
(43 |
) |
|
|
(40 |
) |
|
|
(15 |
) |
|
Net income (loss) |
|
$ |
(9,334 |
) |
|
$ |
(4,851 |
) |
|
$ |
(977 |
) |
|
$ |
(2,160 |
) |
|
$ |
103 |
|
|
$ |
808 |
|
|
$ |
(254 |
) |
|
$ |
(2,330 |
) |
|
Net income (loss) per share attributable to common stockholders — basic and diluted |
|
$ |
(0.45 |
) |
|
$ |
(0.23 |
) |
|
$ |
(0.05 |
) |
|
$ |
(0.11 |
) |
|
$ |
0.01 |
|
|
$ |
0.01 |
|
|
$ |
(0.71 |
) |
|
$ |
(1.21 |
) |
|
Weighted-average shares used to compute net income (loss) per shares attributable to common stockholders |
|
|
|
|
|
|
|
|
|
|
|
|
|
|
|
|
|
|
|
|
|
|
|
|
|
|
|
|
|
|
|
|
|
Basic |
|
|
20,907 |
|
|
|
20,826 |
|
|
|
20,636 |
|
|
|
20,344 |
|
|
|
19,078 |
|
|
|
15,318 |
|
|
|
4,321 |
|
|
|
4,267 |
|
|
Diluted |
|
|
20,907 |
|
|
|
20,826 |
|
|
|
20,636 |
|
|
|
20,344 |
|
|
|
20,667 |
|
|
|
16,859 |
|
|
|
4,321 |
|
|
|
4,267 |
|
|
Other Financial Information: |
|
|
|
|
|
|
|
|
|
|
|
|
|
|
|
|
|
|
|
|
|
|
|
|
|
|
|
|
|
|
|
|
|
Adjusted EBITDA (1) |
|
$ |
(5,777 |
) |
|
$ |
(1,522 |
) |
|
$ |
1,412 |
|
|
$ |
246 |
|
|
$ |
2,419 |
|
|
$ |
2,227 |
|
|
$ |
1,320 |
|
|
$ |
(820 |
) |
(1) See “Adjusted EBITDA” below for more information and for a reconciliation of Adjusted EBITDA to net income (loss), the most directly comparable financial measure calculated and presented in accordance with GAAP.
60
|
|
|
Three months ended |
|
|||||||||||||||||||||||||||||
|
|
|
Dec 31, |
|
|
Sept 30, |
|
|
June 30, |
|
|
Mar 31, |
|
|
Dec 31, |
|
|
Sept 30, |
|
|
June 30, |
|
|
Mar 31, |
|
||||||||
|
|
|
2017 |
|
|
2017 |
|
|
2017 |
|
|
2017 |
|
|
2016 |
|
|
2016 |
|
|
2016 |
|
|
2016 |
|
||||||||
|
Percentage of Revenue: |
|
|
|
|
|
|
|
|
|
|
|
|
|
|
|
|
|
|
|
|
|
|
|
|
|
|
|
|
|
|
|
|
|
Revenue |
|
|
100.0 |
% |
|
|
100.0 |
% |
|
|
100.0 |
% |
|
|
100.0 |
% |
|
|
100.0 |
% |
|
|
100.0 |
% |
|
|
100.0 |
% |
|
|
100.0 |
% |
|
Cost of revenue |
|
51.6 |
|
|
47.9 |
|
|
46.7 |
|
|
47.1 |
|
|
45.4 |
|
|
47.2 |
|
|
47.7 |
|
|
48.7 |
|
||||||||
|
Gross profit |
|
|
48.4 |
|
|
|
52.1 |
|
|
|
53.3 |
|
|
|
52.9 |
|
|
|
54.6 |
|
|
|
52.8 |
|
|
|
52.3 |
|
|
|
51.3 |
|
|
Operating expenses: |
|
|
|
|
|
|
|
|
|
|
|
|
|
|
|
|
|
|
|
|
|
|
|
|
|
|
|
|
|
|
|
|
|
Research and development expense |
|
|
33.2 |
|
|
|
27.1 |
|
|
|
20.9 |
|
|
|
23.1 |
|
|
|
22.0 |
|
|
|
21.4 |
|
|
|
22.0 |
|
|
|
25.1 |
|
|
Sales and marketing expense |
|
|
33.8 |
|
|
|
24.9 |
|
|
|
20.7 |
|
|
|
23.1 |
|
|
|
19.1 |
|
|
|
18.0 |
|
|
|
20.3 |
|
|
|
23.3 |
|
|
General and administrative expense |
|
|
16.9 |
|
|
|
14.5 |
|
|
|
14.1 |
|
|
|
12.9 |
|
|
|
12.5 |
|
|
|
10.8 |
|
|
|
9.1 |
|
|
|
11.6 |
|
|
Total operating expenses |
|
|
83.9 |
|
|
|
66.5 |
|
|
|
55.7 |
|
|
|
59.1 |
|
|
|
53.6 |
|
|
|
50.2 |
|
|
|
51.4 |
|
|
|
59.9 |
|
|
Income (loss) from operations |
|
|
(35.5 |
) |
|
|
(14.4 |
) |
|
|
(2.4 |
) |
|
|
(6.3 |
) |
|
|
1.0 |
|
|
|
2.6 |
|
|
|
0.9 |
|
|
|
(8.6 |
) |
|
Interest income (expense) and other income (expense), net |
|
|
(0.2 |
) |
|
|
(0.4 |
) |
|
|
(0.3 |
) |
|
|
(0.3 |
) |
|
|
(0.5 |
) |
|
|
0.1 |
|
|
|
(1.7 |
) |
|
|
(2.1 |
) |
|
Income (loss) before tax expense |
|
|
(35.7 |
) |
|
|
(14.7 |
) |
|
|
(2.7 |
) |
|
|
(6.6 |
) |
|
|
0.5 |
|
|
|
2.7 |
|
|
|
(0.8 |
) |
|
|
(10.7 |
) |
|
Income tax benefit (expense) |
|
|
0.9 |
|
|
|
(0.2 |
) |
|
|
(0.1 |
) |
|
|
(0.2 |
) |
|
|
(0.2 |
) |
|
|
(0.1 |
) |
|
|
(0.2 |
) |
|
|
(0.1 |
) |
|
Net income (loss) |
|
|
(34.7 |
%) |
|
|
(14.9 |
%) |
|
|
(2.9 |
%) |
|
|
(6.8 |
%) |
|
|
0.3 |
% |
|
|
2.6 |
% |
|
|
(1.0 |
%) |
|
|
(10.8 |
%) |
Our quarterly revenue increased for all periods presented above, except for the fourth quarter of 2017, when compared to the same quarter of the prior year, reflecting increased demand for our products from new and existing customers. We cannot assure you that the pattern of revenue growth will continue. The decline in our revenue for the fourth quarter of 2017 compared to the same quarter of the prior year was primarily attributable to the following: (1) delays in expanded RAIN deployments at several large retailers; (2) our shortened lead times for endpoint ICs resulting in our inlay partners decreasing their inventory balances; and (3) a sales returns reserve of $3.2 million related to a product exchange that we expect to complete in the first half of 2018.
Our quarterly cost of revenue generally moves in line with the associated period’s total revenue. Gross margin has remained relatively consistent at between 52% and 55% for the periods presented other than for fourth quarter of 2017, fluctuating as a result of product mix and discounting to win strategic opportunities based on product mix and discounting to win strategic opportunities. We typically negotiate pricing with our OEM and ODM partners with an effective date during the first quarter of every year, impacting both revenue and gross margins when compared with prior periods. Gross margin for the fourth quarter of 2017 was adversely affected due to the following: (1) lower than expected endpoint IC volumes; (2) ASP erosion as a result of the competitive environment; and (3) the impact of a one-time product exchange requiring us to record a sales returns reserve. For information regarding the product exchange transaction, see “Management's Discussion and Analysis of Financial Condition and Results of Operations—Overview” of this report.
Total operating expenses have generally increased sequentially quarter-over-quarter for all periods presented above, primarily due to the continued hiring of additional personnel to drive the growth of our business. Operating expenses as a percentage of total revenue increased during the third and fourth quarters of 2017 due to the decline in revenue, mentioned above, and our operational decision to continue investing for growth by increasing the number of engineering and sales and marketing employees.
We evaluate our total investment in technology development based upon the combined total of research and development costs and cost of development revenue which remained consistent period-over-period as a percentage of total revenue. Our total investment in technology development increased sequentially quarter-over-quarter for all periods presented above, primarily due to increases in headcount-related expenses from continued hiring to develop and enhance our products.
61
The following table sets forth a reconciliation of Adjusted EBITDA to net loss for each of the periods presented below. See “Adjusted EBITDA” under “Results of Operations” above in this Item 7 for additional information about why we have included Adjusted EBITDA in this report and how we use Adjusted EBITDA.
|
|
|
Three months ended |
|
|||||||||||||||||||||||||||||
|
|
|
Dec 31, |
|
|
Sept 30, |
|
|
June 30, |
|
|
Mar 31, |
|
|
Dec 31, |
|
|
Sept 30, |
|
|
June 30, |
|
|
Mar 31, |
|
||||||||
|
|
|
2017 |
|
|
2017 |
|
|
2017 |
|
|
2017 |
|
|
2016 |
|
|
2016 |
|
|
2016 |
|
|
2016 |
|
||||||||
|
|
|
(in thousands) |
|
|||||||||||||||||||||||||||||
|
Reconciliation of Adjusted EBITDA to Net Income: |
|
|
|
|
|
|
|
|
|
|
|
|
|
|
|
|
|
|
|
|
|
|
|
|
|
|
|
|
|
|
|
|
|
Net income (loss) |
|
|
(9,334 |
) |
|
|
(4,851 |
) |
|
|
(977 |
) |
|
|
(2,160 |
) |
|
|
103 |
|
|
|
808 |
|
|
|
(254 |
) |
|
|
(2,330 |
) |
|
Interest income (expense) and other income (expense), net |
|
|
59 |
|
|
|
118 |
|
|
|
118 |
|
|
|
105 |
|
|
|
172 |
|
|
|
(38 |
) |
|
|
436 |
|
|
|
447 |
|
|
Income tax benefit (expense) |
|
|
(249 |
) |
|
|
50 |
|
|
|
45 |
|
|
|
57 |
|
|
|
70 |
|
|
|
43 |
|
|
|
40 |
|
|
|
15 |
|
|
Depreciation and amortization |
|
|
1,082 |
|
|
|
1,021 |
|
|
|
973 |
|
|
|
874 |
|
|
|
726 |
|
|
|
659 |
|
|
|
770 |
|
|
|
714 |
|
|
Stock-based compensation |
|
|
2,665 |
|
|
|
2,140 |
|
|
|
1,253 |
|
|
|
1,370 |
|
|
|
1,348 |
|
|
|
755 |
|
|
|
328 |
|
|
|
334 |
|
|
Adjusted EBITDA |
|
$ |
(5,777 |
) |
|
$ |
(1,522 |
) |
|
$ |
1,412 |
|
|
$ |
246 |
|
|
$ |
2,419 |
|
|
$ |
2,227 |
|
|
$ |
1,320 |
|
|
$ |
(820 |
) |
Seasonality
We typically renegotiate pricing with many of our partners with an effective date in the first quarter of the calendar year, impacting both revenue and gross margins when compared with prior periods. From time-to-time we may renegotiate that pricing or otherwise adjust our selling prices to meet market demands, capture special opportunities, or in response to competitive situations or other market factors.
In the first half of 2017 and during 2016, our lengthy endpoint IC lead times may have masked the existence of seasonality in retail RAIN deployments. In 2017, we observed a potential trend of seasonal slowdowns in retail deployments as retailers prioritize holiday sales execution, and this trend may continue in future periods.
Liquidity and Capital Resources
As of December 31, 2017 and 2016, we had cash, cash equivalents and short-term investments of $58.1 and $100.5 million, respectively, consisting of cash deposits held at major financial institutions and short-term investments in a variety of securities, including U.S. government agencies, corporate bonds and notes and money market funds. We had working capital of $109.9 million as of December 31, 2017.
Historically, we funded our operations principally through the issuance of equity securities or the incurrence of debt. In 2017 and 2016, our principal uses of cash were funding operations to fund operations, debt service payments, and capital expenditures. We believe, based on our current operating plan, that our existing cash, cash equivalents, short-term investments and available borrowings under our senior credit facility will be sufficient to meet our anticipated cash needs for the next 12 months.
Sources of Funds
We believe, based on our current operating plan, that our existing cash, cash equivalents, short-term investments and available borrowings under our senior credit facility will be sufficient to meet our anticipated cash needs for at least the next 12 months.
From time to time, we may explore additional financing sources and means to lower our cost of capital, which could include equity, equity-linked and debt financing. In addition, in connection with any future acquisitions, we may require additional funding which may be provided in the form of additional debt, equity or equity-linked financing or a combination thereof. There can be no assurance that any additional financing will be available to us on acceptable terms.
62
On July 26, 2016, we closed our initial public offering of 5,520,000 shares of common stock at an initial price to the public of $14.00 per share, including 720,000 shares of common stock pursuant to the underwriters’ option to purchase additional shares, resulting in aggregate net proceeds to us of $68.5 million after deducting underwriting discounts and commissions and offering costs. On December 7, 2016, we closed a follow-on public offering of 1,527,380 shares of common stock at a price to the public of $27.00 per share, resulting in aggregate net proceeds to us of $38.7 million after deducting underwriting discounts and commissions and offering costs. We intend to continue investing in the growth of our business, and there is no assurance that we will be able to consistently fund our business out of operating cash flows in the future.
Senior Credit Facility and Mezzanine Credit Facility
At December 31, 2017, $9.7 million of term loan and equipment loans were outstanding under our senior credit facility, excluding unamortized debt issuance costs of $113,000. The weighted average interest rate was 4.6% at December 31, 2017.
We had a mezzanine loan and security agreement, which we referred to as our mezzanine credit facility, with SG Enterprises II, LLC, which provided for a $5.0 million term loan which was drawn in September 2015. On July 26, 2016, we repaid without premium or penalty the principal and accrued interest on the $5.0 million term loan pursuant to the mezzanine credit facility and expensed unamortized debt discounts and issuance costs of $109,000.
For information on our debt facilities, please refer to Note 8 to our consolidated financial statements included elsewhere in this report.
Use of Funds
Our principal uses of cash are our operating expenses, inventory purchases, debt repayment and other working capital requirements.
Historical Cash Flow Trends
The following table shows a summary of our cash flows for the periods indicated:
|
|
|
Year Ended |
|
|||||||||
|
|
|
December 31, |
|
|||||||||
|
|
|
2017 |
|
|
2016 |
|
|
2015 |
|
|||
|
|
|
(in thousands) |
|
|||||||||
|
Net cash provided by (used in) operating activities |
|
$ |
(35,886 |
) |
|
$ |
(9,497 |
) |
|
$ |
3,456 |
|
|
Net cash provided by (used in) investing activities |
|
|
21,398 |
|
|
|
(70,633 |
) |
|
|
(7,450 |
) |
|
Net cash provided by (used in) financing activities |
|
|
137 |
|
|
|
103,645 |
|
|
|
7,176 |
|
Operating Cash Flows
For the year ended December 31, 2017, net cash used in operating activities was $35.9 million. This cash usage was primarily driven by a net loss of $17.3 million, a $4.8 million increase in accounts receivable due to the timing of product shipments period over period, a $19.3 million increase in inventory to meet anticipated future demand for our products and a $7.4 million increase in accounts payable, accrued liabilities and accrued compensation and benefits due to the timing of when amounts came due. Offsetting these uses of cash in operations were benefits of an $11.5 million impact of non-cash items, a $1.2 million increase in deferred rent and a $439,000 decrease in prepaids and other current assets.
For the year ended December 31, 2016, net cash used in operating activities was $9.5 million. This cash usage was primarily driven by a net loss of $1.7 million, a $4.5 million increase in accounts receivable due to the timing of product shipments period over period, a $15.9 million increase in inventory to meet anticipated future demand for our products and a $1.8 million increase in prepaid expenses and other assets. Offsetting these uses of cash in operations were benefits of a $5.3 million impact of non-cash items and an $8.9 million increase in accounts payable, accrued liabilities and accrued compensation and benefits due to the timing of when amounts came due.
63
For the year ended December 31, 2015, net cash provided by operating activities was $3.5 million This cash benefit was primarily driven by $900,000 of net income, a $2.6 million impact of non-cash items, a $4.6 million increase in deferred rent due to tenant improvements and a net $2.3 million increase in accounts payable, accrued liabilities and accrued compensation and benefits due to the timing of when amounts came due. Offsetting these benefits were usages of a $3.3 million increase in accounts receivable due to the timing of product shipments period over period, a $466,000 decrease in deferred revenue and a $2.8 million increase in inventory.
Investing Cash Flows
For the year ended December 31, 2017, net cash provided by investing activities was $21.4 million. This cash benefit was driven by investment maturities of $77.1 million. These maturities were partially offset by purchases of investments and equipment of $49.1 million and $6.6 million, respectively.
For the year ended December 31, 2016, net cash used in investing activities was $70.6 million. This cash usage consisted of purchases of investments of $67.1 million and purchases of equipment of $3.5 million.
For the year ended December 31, 2015, net cash used in investing activities was $7.5 million. This cash usage consisted of purchases of equipment of $7.5 million.
Financing Cash Flows
For the year ended December 31, 2017, net cash provided by financing activities was $137,000. This cash benefit consisted of proceeds of $4.7 million from the exercise of stock options and stock purchases under the employee stock purchase plan. These proceeds were partially offset by payments of offering costs of $600,000, payments of $1.1 million for capital lease financing obligations and repayments of indebtedness of $2.8 million of principal under our senior credit facility.
For the year ended December 31, 2016, net cash provided by financing activities was $103.6 million. This cash benefit consisted of proceeds from public offerings of $108.1 million, net of offering costs of $10.4 million paid in 2016, $322,000 offering costs paid in 2015 and $626,000 unpaid offering costs at December 31, 2016, proceeds from borrowings of $61.4 million and proceeds of $662,000 from the exercise of stock options and warrants; offset by repayments of indebtedness of $65.3 million of principal under our senior credit facility and payments of $1.2 million for capital lease financing obligations.
For the year ended December 31, 2015, net cash provided by financing activities was $7.2 million. This cash benefit consisted of proceeds from borrowings of $13.9 million and proceeds of $538,000 from the exercise of stock options; offset by repayments of indebtedness of $6.1 million of principal under our credit facility; payments of deferred offering costs of $322,000 and payments of $824,000 for capital lease financing obligations.
64
The following table reflects a summary of our contractual obligations as of December 31, 2017:
|
|
|
PAYMENTS DUE BY PERIOD |
|
|||||||||||||||||
|
|
|
TOTAL |
|
|
LESS THAN 1 YEAR |
|
|
1-3 YEARS |
|
|
3-5 YEARS |
|
|
MORE THAN 5 YEARS |
|
|||||
|
|
|
(in thousands) |
|
|||||||||||||||||
|
Senior credit facility (1) |
|
$ |
9,702 |
|
|
$ |
4,167 |
|
|
$ |
5,535 |
|
|
$ |
— |
|
|
$ |
— |
|
|
Capital lease obligations |
|
|
1,869 |
|
|
|
1,024 |
|
|
|
843 |
|
|
|
2 |
|
|
|
— |
|
|
Operating lease obligations |
|
|
35,380 |
|
|
|
4,218 |
|
|
|
8,631 |
|
|
|
9,157 |
|
|
|
13,374 |
|
|
Purchase commitments (2) |
|
|
23,502 |
|
|
|
23,502 |
|
|
|
— |
|
|
|
— |
|
|
|
— |
|
|
Total |
|
$ |
70,453 |
|
|
$ |
32,911 |
|
|
$ |
15,009 |
|
|
$ |
9,159 |
|
|
$ |
13,374 |
|
(1) Senior credit facility includes estimated interest payments assuming a change in interest rates only for the conclusion of contractual interest only periods over the term of the repayment periods. As of December 31, 2017, we had principal outstanding under our senior credit facility of $9.7 million with a blended interest rate of 4.6%.
(2) We manufacture products with a third-party manufacturer under recurring one-year agreements. We were committed to purchase $23.5 million of inventory as of December 31, 2017.
Off-Balance Sheet Arrangements
Since inception, we have not had any relationships with unconsolidated entities or financial partnerships, such as entities often referred to as structured finance or special purpose entities, which would have been established for the purpose of facilitating off-balance sheet arrangements or for another contractually narrow or limited purpose.
Critical Accounting Policies and Significant Estimates
Our discussion and analysis of our financial condition and results of operations are based upon our consolidated financial statements which have been prepared in accordance with GAAP. The preparation of these consolidated financial statements requires us to make estimates and judgments that affect the reported amounts of assets and liabilities and related disclosure of contingent assets and liabilities, revenue and expenses at the date of the consolidated financial statements. Generally, we base our estimates on historical experience and on various other assumptions, in accordance with GAAP, that we believe to be reasonable under the circumstances. Actual results may differ from these estimates under other assumptions or conditions.
Critical accounting policies and estimates are those that we consider the most important to the portrayal of our financial condition and results of operations because they require our most difficult, subjective or complex judgments, often as a result of the need to make estimates about the effect of matters that are inherently uncertain. Our critical accounting policies and estimates include those related to:
|
|
• |
revenue recognition; |
|
|
• |
inventory; |
|
|
• |
income taxes; and |
|
|
• |
stock-based compensation. |
Revenue Recognition
We generate revenue from sales of our hardware and software products, development and service agreements and licensing agreements. We recognize revenue when: (1) persuasive evidence of an arrangement exists; (2) delivery has occurred; (3) the price is fixed or determinable; and (4) collection is probable.
65
Sales agreements do not generally provide for a right of return for refund but for certain distributors provide for a right of return in exchange for other similar products, subject to time and quantity limitations. When we give our distributors the right to exchange eligible products, we estimate the expected exchanges based on an analysis of historical experience. We may provide other credits or considerations to our customers, which are accounted for as sales incentives when estimating the amount of revenue to recognize. The price of our products and revenue we recognize varies with changes in marketing incentives and returns we offer to our customers and their customers. Credits and returns are estimated at contract inception and updated at the end of each reporting period as additional information becomes available and only to the extent that it is probable that a significant reversal of any incremental revenue will not occur.
We sell our reader and gateway products in combination with a limited hardware warranty against manufacturer defect. Our hardware warranty includes access to repair or replacement of hardware in the event of breakage or failure resulting directly from a manufacturer defect; this warranty is provided to all customers and considered an integral part of the initial product sale. Certain software is integrated with our reader and gateway products and is essential to the functionality of the integrated products. We also sell other software that configures, manages and controls readers and gateways which is not considered essential to the functionality of the hardware product.
Our multi-element arrangements generally include a combination of hardware products, non-essential software, extended warranty, enhanced maintenance and services. We allocate revenue to software and non-software deliverables based on their relative fair value. Amounts allocated to extended warranty, enhanced maintenance and services sold with our reader products are deferred and recognized on a straight-line basis over the arrangement term. Accounting principles establish a hierarchy to determine the selling price to be used for allocating revenue to non-software deliverables as follows: (1) vendor-specific objective evidence of selling price, or VSOE; (2) third-party evidence of selling price, or TPE; and (3) best estimated selling prices, or ESP. VSOE generally exists only when we sell the deliverable separately and is the price actually charged by us for that deliverable on a stand-alone basis. When VSOE cannot be established, we attempt to establish the selling price of each element based on TPE. TPE is determined based on competitor prices for similar deliverables when sold separately. We are unable to reliably determine what similar competitor products’ selling prices are on a stand-alone basis and are therefore typically not able to determine TPE. When we are unable to establish selling price using VSOE or TPE, we use ESP in the allocation of arrangement consideration. The objective of ESP is to determine the price at which we would transact a sale if the product or service were sold on a stand-alone basis.
Our ESPs for all products and services are calculated using a method consistent with the way management prices new products. We consider multiple factors in developing the ESPs for our products including our historical pricing and discounting practices, the costs incurred to manufacture the product or deliver the service, the nature of the customer relationship and market trends. In addition, we may consider other factors as appropriate, including the pricing of competitive alternatives if they exist and product-specific business objectives. We regularly review VSOE and ESP and maintain internal controls over the establishment and updates of these estimates.
For software deliverables, we recognize revenue in accordance with industry specific software accounting guidance for stand-alone software licenses and related support services. Revenue from software deliverables that do not require significant production, modification or customization of our software is generally recognized when: (1) delivery has occurred; (2) there is no customer acceptance clause in the contract; (3) there are no significant post-delivery obligations remaining; (4) the price is fixed; and (5) collection of the resulting receivable is reasonably assured. For transactions where we have established VSOE for the fair value of support services as measured by the renewal prices paid by our customers when the services are sold separately on a stand-alone basis, we use the residual method to determine the amount of software revenue to be recognized. Under the residual method, the fair value of the undelivered elements is deferred and the remaining portion of the sales amount is recognized as license revenue. Support services revenue is deferred and recognized ratably over the period during which the services are to be performed, which is typically from one to three years. In those instances where we have not established VSOE of our support services, the license and service revenue is recognized on a straight-line basis over the support period.
We account for development, service and licensing agreements generally by recognizing the revenue ratably over the performance period or as services are performed; advance payments under these agreements are initially deferred. Revenue associated with these agreements for the periods presented in this report was not material.
66
Payment terms range from 30 days to 120 days. We present revenue net of sales tax in our consolidated statements of operations. Shipping charges billed to customers are included in revenue and the related shipping costs are included in cost of revenue.
Inventory
Inventories consist of a combination of raw materials, work-in-progress and finished goods and are stated at the lower of cost or net realizable value. Cost is determined using the average costing method, which approximates the first in, first out, or FIFO, method. We establish reserves for excess and obsolete inventory based on our analysis of inventory levels, future sales forecasts and the estimated utility of our inventory. If our review indicates a reduction in utility below carrying value, we reduce our inventory to a new cost basis through a charge to cost of revenue. Estimating the value of our inventory requires considerable judgment. Changes in our judgment could have a material impact on our results of operations, financial position and cash flows.
Income Taxes
We use the asset and liability approach for accounting, which requires the recognition of deferred tax assets and liabilities for the expected future tax consequences of temporary differences between the financial statement and tax bases. Deferred tax assets and liabilities are measured using enacted tax rates expected to be in effect when such assets and liabilities are recovered or settled. The effect on deferred tax assets and liabilities of a change in tax rates is recognized in the year that includes the enactment date. We determine deferred tax assets, including historical net operating losses, and deferred tax liabilities, based on temporary differences between the book and tax bases of assets and liabilities. We believe that it is currently more likely than not that our deferred tax assets will not be realized and as such, we have recorded a full valuation allowance for these assets. We evaluate the likelihood of the ability to realize deferred tax assets in future periods on a quarterly basis, and when appropriate evidence indicates we would release our valuation allowance accordingly.
We utilize a two-step approach for evaluating uncertain tax positions. First, we evaluate recognition, which requires us to determine if the weight of available evidence indicates that a tax position is more likely than not to be sustained upon audit, including resolution of related appeals or litigation processes. If a tax position is not considered more likely than not to be sustained, no benefits of the position are recognized. Second, we measure the uncertain tax position based on the largest amount of benefit which is more likely than not to be realized on effective settlement. This process involves estimating our actual current tax exposure, including assessing the risks associated with tax audits, together with assessing temporary differences resulting from the different treatment of items for tax and financial reporting purposes. If actual results differ from our estimates, our net operating loss and credit carryforwards could be materially impacted.
Our realization of the benefits of the NOLs and credit carryforwards depends on sufficient taxable income in future years. We have established a valuation allowance against the carrying value of our deferred tax assets, as it is not currently more likely than not that we will be able to realize these deferred tax assets. In addition, utilization of NOLs and credits to offset future income subject to taxes may be subject to substantial annual limitations due to the “change in ownership” provisions of the Code and similar state provisions. Events that cause limitations in the amount of NOLs that we may utilize in any one year include, but are not limited to, a cumulative ownership change of more than 50%, as defined by Code Sections 382 and 383, over a three-year period. Utilization of our NOLs and tax credit carryforwards could be significantly reduced if a cumulative ownership change of more than 50% has occurred in our past or occurs in our future.
We do not anticipate that the amount of our existing unrecognized tax benefits will significantly increase or decrease within the next 12 months. Due to the presence of NOLs in most jurisdictions, our tax years remain open for examination by taxing authorities back to 2000.
Stock-Based Compensation
Stock-based compensation cost is measured on the grant date, based on the estimated fair value of the award using a Black-Scholes option model and recognized as an expense over the employee’s requisite service period on a straight-line basis. We expect to continue to grant stock awards pursuant to our 2016 Equity Incentive Plan and to allow employees to purchase shares of our common stock pursuant to our 2016 Employee Stock Purchase Plan, and to the extent that we do, our stock-based compensation expense recognized in future periods will likely increase.
67
We account for stock-based compensation arrangements with non-employees using a fair value approach. The fair value of these awards is measured using the Black-Scholes option pricing model reflecting the same assumptions as applied to employee awards in each of the reported periods, other than the expected life, which is assumed to be the remaining contractual life of the option. The compensation costs of these arrangements are subject to remeasurement over the vesting terms as earned.
Prior to the closing of our initial public offering, we granted stock options at exercise prices believed to be equal to the fair value of the common stock underlying such options as determined by the board of directors, with input from management, on the date of grant. Because such grants occurred prior to the public trading of our common stock, the board of directors exercised significant judgment in determining the fair market value of our common stock. The valuations were consistent with the guidance and methods outlined in the AICPA Practice Aid, Valuation of Privately-Held-Company Equity Securities Issued as Compensation, or AICPA Practice Aid, for all option grant dates. After the closing of the initial public offering, we granted stock options with exercise prices based on market prices.
Our Black-Scholes option-pricing model requires the input of highly subjective assumptions, including the expected volatility of the price of our common stock, the expected term of the award, risk-free interest rates, the expected dividend yield of our common stock and, for the period prior to our IPO, the fair value of the underlying common stock. These estimates involve inherent uncertainties and the application of management’s judgment. If factors change and different assumptions are used, our stock-based compensation expense could be materially different in the future.
Recent Accounting Pronouncements
For information on recent accounting pronouncements, please refer to Note 2 to our consolidated financial statements included elsewhere in this report.
We are an emerging growth company under the JOBS Act. The JOBS Act provides that an emerging growth company can delay adoption of new or revised accounting pronouncements applicable to public companies until such pronouncements are made applicable to private companies, unless we otherwise irrevocably elect not to avail itself of this exemption. While we have not made such an irrevocable election, we have not delayed the adoption of any applicable accounting standards.
Subject to certain conditions set forth in the JOBS Act, if, as an “emerging growth company,” we choose to rely on certain exemptions provided for in the JOBS Act we may not be required to, among other things, (1) provide an auditor’s attestation report on our system of internal controls over financial reporting pursuant to Section 404, (2) provide all of the compensation disclosure that may be required of non-emerging growth public companies under the Dodd-Frank Wall Street Reform and Consumer Protection Act, (3) comply with any requirement that may be adopted by the PCAOB regarding mandatory audit firm rotation or a supplement to the auditor’s report providing additional information about the audit and the financial statements (auditor discussion and analysis) and (4) disclose certain executive compensation related items such as the correlation between executive compensation and performance, and comparisons of the CEO’s compensation to median employee compensation. These exemptions will apply for a period of five years following the completion of our initial public offering or until we are no longer an “emerging growth company,” whichever is earlier.
Item 7A. Quantitative and Qualitative Disclosures About Market Risk
We are exposed to market risks in the ordinary course of our business. These risks primarily consist of fluctuations in interest rates.
68
Under our current investment policy, we invest our excess cash in money market funds, U.S. government agency securities, corporate bonds and notes and commercial paper. Our current investment policy seeks first to preserve principal, second to provide liquidity for our operating and capital needs and third to maximize yield without putting our principal at risk. We do not enter into investments for trading or speculative purposes.
We had cash, cash equivalents and short-term investments of $58.1 million and $100.5 million as of December 31, 2017 and 2016, respectively. Our investments are exposed to market risk due to the fluctuation of prevailing interest rates that may reduce the yield on our investments or their fair value. As our investment portfolio is short-term in nature, we do not believe an immediate 10% increase in interest rates would have a material effect on the fair market value of our portfolio, and therefore we do not expect our results of operations or cash flows to be materially affected by a sudden change in market interest rates.
We are subject to interest rate risk in connection with the borrowings under our senior credit facility, which accrue interest at variable rates. As of December 31, 2017, our borrowings under our senior credit facility had a blended rate of 4.6%. Assuming the revolver borrowings under the senior credit facility are fully drawn and holding other variables constant, a 100 basis-point increase in interest rates, occurring January 1, 2018 and sustained throughout the period ended December 31, 2018, would result in an increase in interest expense and a decrease in our cash flows and income before taxes of approximately $324,000.
Inflation Risk
We do not believe that inflation has had a material effect on our business, financial condition or results of operations. If our costs were to become subject to significant inflationary pressures, we may not be able to fully offset such higher costs through price increases. Our inability or failure to do so could adversely affect our business, financial condition and results of operations.
Foreign Currency Exchange Risk
Prices for our products are denominated in U.S. dollars, and as a result, we do not face significant risk with respect to foreign currency exchange rates.
69
Item 8. Financial Statements and Supplementary Data
|
|
|
Page |
|
|
71 |
|
|
|
72 |
|
|
|
73 |
|
|
|
74 |
|
|
Consolidated Statements of Changes in Redeemable Convertible Preferred Stock |
|
75 |
|
Consolidated Statements of Changes in Stockholders’ Equity (Deficit) |
|
76 |
|
|
77 |
|
|
|
78 |
The supplementary financial information required by this Item 8 is included in Item 7 under the caption “Quarterly Results of Operations.”
70
Report of Independent Registered Public Accounting Firm
To the Board of Directors and Stockholders of Impinj, Inc.
Opinion on the Financial Statements
We have audited the accompanying consolidated balance sheets of Impinj, Inc. and its subsidiaries as of December 31, 2017 and 2016, and the related consolidated statements of operations, of comprehensive income (loss), of changes in redeemable convertible preferred stock, of changes in stockholders’ equity (deficit) and of cash flows for each of the three years in the period ended December 31, 2017, including the related notes (collectively referred to as the “consolidated financial statements”). In our opinion, the consolidated financial statements present fairly, in all material respects, the financial position of the Company as of December 31, 2017 and 2016, and the results of their operations and their cash flows for each of the three years in the period ended December 31, 2017 in conformity with accounting principles generally accepted in the United States of America.
Basis for Opinion
These consolidated financial statements are the responsibility of the Company’s management. Our responsibility is to express an opinion on the Company’s consolidated financial statements based on our audits. We are a public accounting firm registered with the Public Company Accounting Oversight Board (United States) (“PCAOB”) and are required to be independent with respect to the Company in accordance with the U.S. federal securities laws and the applicable rules and regulations of the Securities and Exchange Commission and the PCAOB.
We conducted our audits of these consolidated financial statements in accordance with the standards of the PCAOB. Those standards require that we plan and perform the audit to obtain reasonable assurance about whether the consolidated financial statements are free of material misstatement, whether due to error or fraud. The Company is not required to have, nor were we engaged to perform, an audit of its internal control over financial reporting. As part of our audits we are required to obtain an understanding of internal control over financial reporting but not for the purpose of expressing an opinion on the effectiveness of the Company's internal control over financial reporting. Accordingly, we express no such opinion.
Our audits included performing procedures to assess the risks of material misstatement of the consolidated financial statements, whether due to error or fraud, and performing procedures that respond to those risks. Such procedures included examining, on a test basis, evidence regarding the amounts and disclosures in the consolidated financial statements. Our audits also included evaluating the accounting principles used and significant estimates made by management, as well as evaluating the overall presentation of the consolidated financial statements. We believe that our audits provide a reasonable basis for our opinion.
/s/ PricewaterhouseCoopers LLP
Seattle, Washington
March 15, 2018
We have served as the Company’s auditor since 2003.
71
(in thousands, except par value)
|
|
|
December 31, |
|
|
December 31, |
|
||
|
|
|
2017 |
|
|
2016 |
|
||
|
Assets: |
|
|
|
|
|
|
|
|
|
Current assets: |
|
|
|
|
|
|
|
|
|
Cash and cash equivalents |
|
$ |
19,285 |
|
|
$ |
33,636 |
|
|
Short-term investments |
|
|
38,831 |
|
|
|
66,905 |
|
|
Accounts receivable, net of allowances of $3,625 and $284 at December 31, 2017 and 2016, respectively |
|
|
22,244 |
|
|
|
17,447 |
|
|
Inventory |
|
|
47,083 |
|
|
|
27,734 |
|
|
Prepaid expenses and other current assets |
|
|
2,359 |
|
|
|
3,004 |
|
|
Total current assets |
|
|
129,802 |
|
|
|
148,726 |
|
|
Property and equipment, net of accumulated depreciation of $13,587 and $10,227 at December 31, 2017 and 2016, respectively |
|
|
18,110 |
|
|
|
14,929 |
|
|
Other non-current assets |
|
|
241 |
|
|
|
— |
|
|
Goodwill and other intangible assets, net |
|
|
3,881 |
|
|
|
3,881 |
|
|
Total assets |
|
$ |
152,034 |
|
|
$ |
167,536 |
|
|
Liabilities and stockholders' equity: |
|
|
|
|
|
|
|
|
|
Current liabilities: |
|
|
|
|
|
|
|
|
|
Accounts payable |
|
$ |
4,666 |
|
|
$ |
7,166 |
|
|
Accrued compensation and employee related benefits |
|
|
5,729 |
|
|
|
7,647 |
|
|
Accrued liabilities |
|
|
3,162 |
|
|
|
6,098 |
|
|
Current portion of long-term debt |
|
|
4,088 |
|
|
|
2,589 |
|
|
Current portion of capital lease obligations |
|
|
936 |
|
|
|
1,130 |
|
|
Current portion of deferred rent |
|
|
628 |
|
|
|
306 |
|
|
Current portion of deferred revenue |
|
|
714 |
|
|
|
445 |
|
|
Total current liabilities |
|
|
19,923 |
|
|
|
25,381 |
|
|
Long-term debt, net of current portion |
|
|
5,500 |
|
|
|
9,676 |
|
|
Capital lease obligations, net of current portion |
|
|
745 |
|
|
|
1,698 |
|
|
Long-term liabilities — other |
|
|
532 |
|
|
|
770 |
|
|
Deferred rent, net of current portion |
|
|
5,891 |
|
|
|
5,022 |
|
|
Deferred revenue, net of current portion |
|
|
501 |
|
|
|
966 |
|
|
Total liabilities |
|
|
33,092 |
|
|
|
43,513 |
|
|
Stockholders' equity: |
|
|
|
|
|
|
|
|
|
Preferred stock, $0.001 par value — 5,000 shares authorized, no shares issued and outstanding at December 31, 2017 and 2016, respectively |
|
|
— |
|
|
|
— |
|
|
Common stock, $0.001 par value — 495,000 shares authorized, 20,973 and 20,336 shares issued and outstanding at December 31, 2017 and 2016, respectively |
|
|
21 |
|
|
|
20 |
|
|
Additional paid-in capital |
|
|
323,482 |
|
|
|
311,216 |
|
|
Accumulated other comprehensive income (loss) |
|
|
(36 |
) |
|
|
(10 |
) |
|
Accumulated deficit |
|
|
(204,525 |
) |
|
|
(187,203 |
) |
|
Total stockholders' equity |
|
|
118,942 |
|
|
|
124,023 |
|
|
Total liabilities and stockholders' equity |
|
$ |
152,034 |
|
|
$ |
167,536 |
|
The accompanying notes are an integral part of these consolidated financial statements.
72
Consolidated Statements of Operations
(in thousands, except per share data)
|
|
Year Ended |
|
|||||||||
|
|
December 31, |
|
|||||||||
|
|
2017 |
|
|
2016 |
|
|
2015 |
|
|||
|
Revenue |
$ |
125,300 |
|
|
$ |
112,287 |
|
|
$ |
78,479 |
|
|
Cost of revenue |
|
60,359 |
|
|
|
52,834 |
|
|
|
37,633 |
|
|
Gross profit |
|
64,941 |
|
|
|
59,453 |
|
|
|
40,846 |
|
|
Operating expenses: |
|
|
|
|
|
|
|
|
|
|
|
|
Research and development |
|
32,220 |
|
|
|
25,185 |
|
|
|
17,579 |
|
|
Sales and marketing |
|
31,579 |
|
|
|
22,330 |
|
|
|
14,579 |
|
|
General and administrative |
|
18,161 |
|
|
|
12,426 |
|
|
|
7,087 |
|
|
Total operating expenses |
|
81,960 |
|
|
|
59,941 |
|
|
|
39,245 |
|
|
Income (loss) from operations |
|
(17,019 |
) |
|
|
(488 |
) |
|
|
1,601 |
|
|
Interest income (expense) and other income (expense), net: |
|
|
|
|
|
|
|
|
|
|
|
|
Interest expense |
|
(908 |
) |
|
|
(1,633 |
) |
|
|
(1,208 |
) |
|
Interest income and other income (expense), net |
|
508 |
|
|
|
616 |
|
|
|
673 |
|
|
Total interest income (expense) and other, net |
|
(400 |
) |
|
|
(1,017 |
) |
|
|
(535 |
) |
|
Income (loss) before tax expense |
|
(17,419 |
) |
|
|
(1,505 |
) |
|
|
1,066 |
|
|
Income tax benefit (expense) |
|
97 |
|
|
|
(168 |
) |
|
|
(166 |
) |
|
Net income (loss) |
$ |
(17,322 |
) |
|
$ |
(1,673 |
) |
|
$ |
900 |
|
|
Less: Accretion of preferred stock |
|
— |
|
|
|
(6,258 |
) |
|
|
(11,301 |
) |
|
Net income (loss) attributable to common stockholders |
$ |
(17,322 |
) |
|
$ |
(7,931 |
) |
|
$ |
(10,401 |
) |
|
Net income (loss) per share attributable to common stockholders — basic and diluted |
$ |
(0.84 |
) |
|
$ |
(0.74 |
) |
|
$ |
(2.67 |
) |
|
Weighted-average shares used to compute net income (loss) per shares attributable to common stockholders — basic and diluted |
|
20,680 |
|
|
|
10,778 |
|
|
|
3,893 |
|
The accompanying notes are an integral part of these consolidated financial statements.
73
Consolidated Statements of Comprehensive Income (Loss)
(in thousands)
|
|
Year Ended |
|
|||||||||
|
|
December 31, |
|
|||||||||
|
|
2017 |
|
|
2016 |
|
|
2015 |
|
|||
|
Net income (loss) |
$ |
(17,322 |
) |
|
$ |
(1,673 |
) |
|
$ |
900 |
|
|
Other comprehensive income (loss), net of tax: |
|
|
|
|
|
|
|
|
|
|
|
|
Unrealized gains (losses) on investments |
|
(26 |
) |
|
|
(10 |
) |
|
|
— |
|
|
Total other comprehensive income (loss) |
|
(26 |
) |
|
|
(10 |
) |
|
|
— |
|
|
Comprehensive income (loss) |
$ |
(17,348 |
) |
|
$ |
(1,683 |
) |
|
$ |
900 |
|
The accompanying notes are an integral part of these consolidated financial statements.
74
Consolidated Statements of Changes in Redeemable Convertible Preferred Stock
(in thousands)
|
|
|
SERIES 1 |
|
|
SERIES 2 |
|
|
TOTAL |
|
|||||||||||
|
|
|
SHARES |
|
|
AMOUNT |
|
|
SHARES |
|
|
AMOUNT |
|
|
AMOUNT |
|
|||||
|
Balance at December 31, 2014 |
|
|
5,334 |
|
|
$ |
48,883 |
|
|
|
2,552 |
|
|
$ |
37,779 |
|
|
$ |
86,662 |
|
|
Accretion of redeemable convertible preferred stock |
|
|
— |
|
|
|
11,301 |
|
|
|
— |
|
|
|
— |
|
|
|
11,301 |
|
|
Balance at December 31, 2015 |
|
|
5,334 |
|
|
|
60,184 |
|
|
|
2,552 |
|
|
|
37,779 |
|
|
|
97,963 |
|
|
Accretion of redeemable convertible preferred stock |
|
|
— |
|
|
|
6,258 |
|
|
|
— |
|
|
|
— |
|
|
|
6,258 |
|
|
Issuance of preferred stock upon exercise of preferred stock warrants |
|
|
— |
|
|
|
— |
|
|
|
106 |
|
|
|
1,863 |
|
|
|
1,863 |
|
|
Conversion of preferred stock into common stock at initial public offering |
|
|
(5,334 |
) |
|
|
(66,442 |
) |
|
|
(2,658 |
) |
|
|
(39,642 |
) |
|
|
(106,084 |
) |
|
Balance at December 31, 2016 |
|
|
— |
|
|
|
— |
|
|
|
— |
|
|
|
— |
|
|
|
— |
|
|
Balance at December 31, 2017 |
|
|
— |
|
|
$ |
— |
|
|
|
— |
|
|
$ |
— |
|
|
$ |
— |
|
The accompanying notes are an integral part of these consolidated financial statements.
75
Consolidated Statements of Changes in Stockholders’ Equity (Deficit)
(in thousands)
|
|
|
|
|
|
|
|
|
|
|
|
|
|
|
|
|
|
|
ACCUMULATED |
|
|
TOTAL |
|
||
|
|
|
|
|
|
|
|
|
|
|
ADDITIONAL |
|
|
|
|
|
|
OTHER |
|
|
STOCKHOLDERS’ |
|
|||
|
|
|
COMMON STOCK |
|
|
PAID-IN |
|
|
ACCUMULATED |
|
|
COMPREHENSIVE |
|
|
EQUITY |
|
|||||||||
|
|
|
SHARES |
|
|
AMOUNT |
|
|
CAPITAL |
|
|
DEFICIT |
|
|
INCOME (LOSS) |
|
|
(DEFICIT) |
|
||||||
|
Balance at December 31, 2014 |
|
|
3,728 |
|
|
$ |
4 |
|
|
$ |
109,740 |
|
|
$ |
(186,215 |
) |
|
$ |
— |
|
|
$ |
(76,471 |
) |
|
Issuance of common stock |
|
|
654 |
|
|
|
— |
|
|
|
649 |
|
|
|
— |
|
|
|
— |
|
|
|
649 |
|
|
Stock-based compensation |
|
|
— |
|
|
|
— |
|
|
|
1,188 |
|
|
|
— |
|
|
|
— |
|
|
|
1,188 |
|
|
Accretion of preferred stock |
|
|
— |
|
|
|
— |
|
|
|
(11,301 |
) |
|
|
— |
|
|
|
— |
|
|
|
(11,301 |
) |
|
Net income (loss) |
|
|
— |
|
|
|
— |
|
|
|
— |
|
|
|
900 |
|
|
|
— |
|
|
|
900 |
|
|
Balance at December 31, 2015 |
|
|
4,382 |
|
|
|
4 |
|
|
|
100,276 |
|
|
|
(185,315 |
) |
|
|
— |
|
|
|
(85,035 |
) |
|
Issuance of common stock |
|
|
197 |
|
|
|
— |
|
|
|
453 |
|
|
|
— |
|
|
|
— |
|
|
|
453 |
|
|
Stock-based compensation |
|
|
— |
|
|
|
— |
|
|
|
2,765 |
|
|
|
— |
|
|
|
— |
|
|
|
2,765 |
|
|
Accretion of preferred stock |
|
|
— |
|
|
|
— |
|
|
|
(6,258 |
) |
|
|
— |
|
|
|
— |
|
|
|
(6,258 |
) |
|
Conversion of preferred stock warrants into common stock warrants at initial public offering |
|
|
— |
|
|
|
— |
|
|
|
505 |
|
|
|
— |
|
|
|
— |
|
|
|
505 |
|
|
Common stock issued in connection with net exercises of common stock warrants |
|
|
55 |
|
|
|
— |
|
|
|
— |
|
|
|
— |
|
|
|
— |
|
|
|
— |
|
|
Conversion of preferred stock into common stock at initial public offering |
|
|
8,655 |
|
|
|
9 |
|
|
|
106,075 |
|
|
|
— |
|
|
|
— |
|
|
|
106,084 |
|
|
Issuance of common stock from public offerings, net of issuance costs |
|
|
7,047 |
|
|
|
7 |
|
|
|
107,185 |
|
|
|
— |
|
|
|
— |
|
|
|
107,192 |
|
|
Net cumulative effect adjustment upon adoption of share-based payment guidance to account for forfeitures as they occur |
|
|
— |
|
|
|
— |
|
|
|
215 |
|
|
|
(215 |
) |
|
|
— |
|
|
|
— |
|
|
Net income (loss) |
|
|
— |
|
|
|
— |
|
|
|
— |
|
|
|
(1,673 |
) |
|
|
— |
|
|
|
(1,673 |
) |
|
Other comprehensive income (loss) |
|
|
— |
|
|
|
— |
|
|
|
— |
|
|
|
— |
|
|
|
(10 |
) |
|
|
(10 |
) |
|
Balance at December 31, 2016 |
|
|
20,336 |
|
|
|
20 |
|
|
|
311,216 |
|
|
|
(187,203 |
) |
|
|
(10 |
) |
|
|
124,023 |
|
|
Issuance of common stock |
|
|
637 |
|
|
|
1 |
|
|
|
4,838 |
|
|
|
— |
|
|
|
— |
|
|
|
4,839 |
|
|
Stock-based compensation |
|
|
— |
|
|
|
— |
|
|
|
7,428 |
|
|
|
— |
|
|
|
— |
|
|
|
7,428 |
|
|
Net income (loss) |
|
|
— |
|
|
|
— |
|
|
|
— |
|
|
|
(17,322 |
) |
|
|
— |
|
|
|
(17,322 |
) |
|
Other comprehensive income (loss) |
|
|
— |
|
|
|
— |
|
|
|
— |
|
|
|
— |
|
|
|
(26 |
) |
|
|
(26 |
) |
|
Balance at December 31, 2017 |
|
|
20,973 |
|
|
$ |
21 |
|
|
$ |
323,482 |
|
|
$ |
(204,525 |
) |
|
$ |
(36 |
) |
|
$ |
118,942 |
|
The accompanying notes are an integral part of these consolidated financial statements.
76
Consolidated Statements of Cash Flows
(in thousands)
|
|
|
December 31, |
|
|||||||||
|
|
|
2017 |
|
|
2016 |
|
|
2015 |
|
|||
|
Operating activities: |
|
|
|
|
|
|
|
|
|
|
|
|
|
Net income (loss) |
|
$ |
(17,322 |
) |
|
$ |
(1,673 |
) |
|
$ |
900 |
|
|
Adjustment to reconcile net income (loss) to net cash provided by (used in) operating activities: |
|
|
|
|
|
|
|
|
|
|
|
|
|
Depreciation and amortization |
|
|
3,950 |
|
|
|
2,869 |
|
|
|
1,972 |
|
|
Amortization and write-off of debt issuance costs |
|
|
95 |
|
|
|
239 |
|
|
|
152 |
|
|
Amortization of premium on short-term investments |
|
|
70 |
|
|
|
31 |
|
|
|
— |
|
|
Revaluation of warrant liability |
|
|
— |
|
|
|
(559 |
) |
|
|
(703 |
) |
|
Stock-based compensation |
|
|
7,428 |
|
|
|
2,765 |
|
|
|
1,178 |
|
|
Changes in operating assets and liabilities: |
|
|
|
|
|
|
|
|
|
|
|
|
|
Accounts receivable |
|
|
(4,822 |
) |
|
|
(4,515 |
) |
|
|
(3,327 |
) |
|
Inventory |
|
|
(19,349 |
) |
|
|
(15,897 |
) |
|
|
(2,783 |
) |
|
Prepaid expenses and other assets |
|
|
439 |
|
|
|
(1,759 |
) |
|
|
(360 |
) |
|
Deferred revenue |
|
|
(196 |
) |
|
|
17 |
|
|
|
(466 |
) |
|
Deferred rent |
|
|
1,191 |
|
|
|
86 |
|
|
|
4,601 |
|
|
Accounts payable |
|
|
(2,836 |
) |
|
|
3,883 |
|
|
|
754 |
|
|
Accrued compensation and benefits |
|
|
(1,735 |
) |
|
|
3,462 |
|
|
|
1,356 |
|
|
Accrued liabilities |
|
|
(2,799 |
) |
|
|
1,554 |
|
|
|
182 |
|
|
Net cash provided by (used in) operating activities |
|
|
(35,886 |
) |
|
|
(9,497 |
) |
|
|
3,456 |
|
|
Investing activities: |
|
|
|
|
|
|
|
|
|
|
|
|
|
Purchases of investments |
|
|
(49,125 |
) |
|
|
(67,103 |
) |
|
|
— |
|
|
Proceeds from maturities of investments |
|
|
77,075 |
|
|
|
— |
|
|
|
— |
|
|
Purchases of property and equipment |
|
|
(6,552 |
) |
|
|
(3,530 |
) |
|
|
(7,450 |
) |
|
Net cash provided by (used in) investing activities |
|
|
21,398 |
|
|
|
(70,633 |
) |
|
|
(7,450 |
) |
|
Financing activities: |
|
|
|
|
|
|
|
|
|
|
|
|
|
Proceeds from initial public offering, net of offering costs |
|
|
— |
|
|
|
108,096 |
|
|
|
— |
|
|
Payments on capital lease financing obligations |
|
|
(1,147 |
) |
|
|
(1,229 |
) |
|
|
(824 |
) |
|
Payments on term loans |
|
|
(2,772 |
) |
|
|
(65,320 |
) |
|
|
(6,115 |
) |
|
Proceeds from term loans |
|
|
— |
|
|
|
61,436 |
|
|
|
13,899 |
|
|
Proceeds from exercise of stock options and employee stock purchase plan |
|
|
4,656 |
|
|
|
600 |
|
|
|
538 |
|
|
Proceeds from issuance of preferred stock upon exercise of warrants |
|
|
— |
|
|
|
62 |
|
|
|
— |
|
|
Payments of deferred offering costs |
|
|
(600 |
) |
|
|
— |
|
|
|
(322 |
) |
|
Net cash provided by (used in) financing activities |
|
|
137 |
|
|
|
103,645 |
|
|
|
7,176 |
|
|
Net increase (decrease) in cash and cash equivalents |
|
|
(14,351 |
) |
|
|
23,515 |
|
|
|
3,182 |
|
|
Cash and cash equivalents: |
|
|
|
|
|
|
|
|
|
|
|
|
|
Beginning of period |
|
|
33,636 |
|
|
|
10,121 |
|
|
|
6,939 |
|
|
End of period |
|
$ |
19,285 |
|
|
$ |
33,636 |
|
|
$ |
10,121 |
|
|
Supplemental disclosure of cash flow information: |
|
|
|
|
|
|
|
|
|
|
|
|
|
Cash paid for interest |
|
$ |
814 |
|
|
$ |
1,503 |
|
|
$ |
973 |
|
|
Supplemental disclosure of non-cash financing and investing activities: |
|
|
|
|
|
|
|
|
|
|
|
|
|
Accretion on preferred stock |
|
$ |
— |
|
|
$ |
6,258 |
|
|
$ |
11,301 |
|
|
Vesting of early exercise stock options |
|
|
183 |
|
|
|
167 |
|
|
$ |
117 |
|
|
Additions to property and equipment through capital lease |
|
|
— |
|
|
|
341 |
|
|
|
2,907 |
|
|
Accrued not yet paid offering costs |
|
|
— |
|
|
|
626 |
|
|
|
315 |
|
|
Purchases of property and equipment not yet paid |
|
|
579 |
|
|
|
1,538 |
|
|
|
347 |
|
|
Write-off of fully depreciated property and equipment |
|
|
592 |
|
|
|
1,571 |
|
|
|
1,913 |
|
|
Conversion of convertible preferred stock to common stock |
|
|
— |
|
|
|
106,084 |
|
|
|
— |
|
|
Conversion of convertible preferred stock warrants to common stock warrants |
|
|
— |
|
|
|
505 |
|
|
|
— |
|
The accompanying notes are an integral part of these consolidated financial statements.
77
NOTES TO CONSOLIDATED FINANCIAL STATEMENTS
Note 1. Description of Business
Impinj, Inc., a Delaware corporation, is headquartered in Seattle, Washington. Impinj enables wireless connectivity for everyday items, delivering each item’s unique identity, location and authenticity to business and consumer applications. Impinj’s platform spans endpoints, connectivity and software and provides wireless item connectivity and information delivery. Impinj derives revenue from selling endpoint ICs, readers, gateways, reader ICs and software as well as from development, service and license agreements. Our integrated platform connects billions of everyday items to applications, delivering real-time information to businesses about items they create, manage, transport and sell.
Note 2. Summary of Significant Accounting Policies
Basis of Presentation
The accompanying consolidated financial statements include Impinj, Inc. and its wholly-owned subsidiaries. Intercompany balances and transactions have been eliminated in consolidation. These consolidated financial statements have been prepared in conformity with U.S. generally accepted accounting principles, or GAAP.
Principles of Consolidation
Our consolidated financial statements include the accounts of Impinj, Inc. and our wholly-owned subsidiaries Impinj RFID Technology (Shanghai) Co., Ltd., located in China, Impinj UK Ltd., located in United Kingdom, Impinj Japan LLC, located in Japan, Pi Operations (Thailand) Co., Ltd, located in Thailand, Impinj France SARL, located in France, and Impinj International, Ltd., located in the Cayman Islands.
Public Offerings
On July 26, 2016, we closed our initial public offering of 5,520,000 shares of common stock at an initial price to the public of $14.00 per share, including 720,000 shares of common stock pursuant to the underwriters’ option to purchase additional shares, resulting in aggregate net proceeds to us of $68.5 million after deducting underwriting discounts and commissions and offering costs. Upon the effectiveness of the registration statement related to the initial public offering on July 20, 2016, all of our outstanding shares of redeemable convertible preferred stock and outstanding preferred stock warrants, which automatically net exercised, converted into 8,531,146 shares and 123,759 shares, respectively, of common stock. The related carrying value of the redeemable convertible preferred stock and warrants of $106.1 million and $505,000, respectively, were reclassified to common stock and additional paid-in capital.
On December 7, 2016, we closed our follow-on public offering of 1,527,380 shares of common stock at a price to the public of $27.00 per share, resulting in aggregate net proceeds to us of $38.7 million after deducting underwriting discounts and commissions and offering costs.
Reverse Stock Split
On June 16, 2016, our board of directors and stockholders approved an amendment to our certificate of incorporation to effect a reverse split of shares of our authorized, issued and outstanding common stock and redeemable convertible preferred stock at a 1-for-12 ratio. The reverse stock split was effected on July 8, 2016. The par value of our common stock and the par value of our redeemable convertible preferred stock were not adjusted as a result of the reverse stock split. All authorized, issued and outstanding shares of common stock and redeemable convertible preferred stock, warrants for common stock and redeemable convertible preferred stock, options to purchase common stock and the related per share amounts contained in these consolidated financial statements have been retroactively adjusted to reflect this reverse stock split for all periods presented.
78
Offering costs, consisting of legal, accounting and other fees and costs related to our public offerings, were capitalized. Total offering costs of approximately $4.1 million were deferred through the completion of the public offerings and upon closing of each of the public offerings in 2016 were reclassified to additional paid-in capital as a reduction of the proceeds. There were no deferred offering costs as of December 31, 2017 and 2016, respectively.
Use of Estimates
The preparation of financial statements in conformity with GAAP requires management to make certain estimates, judgments and assumptions that affect the reported amounts of assets and liabilities and the related disclosures at the date of the financial statements, as well as the reported amounts of revenue and expenses during the periods presented. On an ongoing basis, we evaluate our estimates, including those related to revenue recognition, reserve for returns, collectability of accounts receivable, estimated costs to complete development contracts, warranty obligations, deferred revenue, sales incentives, inventory excess and obsolescence, depreciable lives of fixed assets, the determination of the fair value of stock awards and warrants and accrued liabilities, compensation and employee related benefits. To the extent there are material differences between these estimates, judgments, or assumptions and actual results, our financial statements will be affected.
Risks and Uncertainties
Inherent in our business are various risks and uncertainties, including that we are developing advanced technologies and new applications in a rapidly changing industry. These risks include the failure to develop and extend our products and the rejection of our products by consumers, as well as other risks and uncertainties. If we do not successfully implement our business plan, certain assets may not be recoverable, certain liabilities may not be paid and investments in our capital stock may not be recoverable. Our success depends upon the acceptance of our technology, development of sales and distribution channels and our ability to generate significant revenue from the use of our technology.
Concentrations of Credit Risk
Financial instruments, which potentially subject us to concentrations of credit risk, consist primarily of cash equivalents, investments and accounts receivable. We place cash and cash equivalents and investments with major financial institutions, which management assesses to be of high credit quality, in order to limit exposure of our investments. We extend credit to customers based upon an evaluation of the customer’s financial condition and generally collateral is not required. The following table presents total revenue and accounts receivable concentration for the periods presented or as of the dates presented:
|
|
|
Year Ended December 31, |
|
|||||||||
|
|
|
2017 |
|
|
2016 |
|
|
2015 |
|
|||
|
Revenue: |
|
|
|
|
|
|
|
|
|
|
|
|
|
Avery |
|
|
18 |
% |
|
|
14 |
% |
|
|
16 |
% |
|
Smartrac |
|
|
14 |
|
|
|
16 |
|
|
|
14 |
|
|
Arizon |
|
|
13 |
|
|
|
11 |
|
|
|
9 |
|
|
Shang Yang |
|
|
7 |
|
|
|
10 |
|
|
|
15 |
|
|
Blue Star |
|
|
10 |
|
|
|
9 |
|
|
|
10 |
|
|
|
|
|
62 |
% |
|
|
60 |
% |
|
|
64 |
% |
79
|
|
|
As of December 31, |
|
|||||
|
|
|
2017 |
|
|
2016 |
|
||
|
Accounts Receivable: |
|
|
|
|
|
|
|
|
|
Smartrac |
|
|
17 |
% |
|
|
15 |
% |
|
Shang Yang |
|
|
10 |
|
|
|
11 |
|
|
Blue Star |
|
|
11 |
|
|
|
11 |
|
|
Invengo |
|
|
10 |
|
|
|
18 |
|
|
|
|
|
48 |
% |
|
|
55 |
% |
Concentration of Supplier Risk
We outsource the manufacturing and production of our hardware products to a limited number of suppliers. Although there are a limited number of manufacturers for hardware products, we believe that other suppliers could provide similar products on comparable terms. A change in suppliers, however, could cause a delay in manufacturing and a possible loss of sales, which would adversely affect our operating results.
Cash and Cash Equivalents
Cash includes demand deposits with banks or financial institutions. Cash equivalents include short-term, highly liquid investments that are both readily convertible to known amounts of cash, and so near their maturity that they present minimal risk of changes in value because of changes in interest rates. Our cash equivalents include only investments with an original or remaining maturity of three months or less at the date of purchase. We regularly maintain cash in excess of federally insured limits at financial institutions.
Investments
Our investments consist of fixed income securities, which include U.S. government agency securities, corporate notes and bonds and commercial paper. As the investments are available to support current operations, our available-for-sale securities are classified as short-term investments. Available-for-sale securities are carried at fair value with unrealized gains and losses reported as a component of accumulated other comprehensive income (loss) in stockholders’ equity, while realized gains and losses and other-than-temporary impairments are reported as a component of net income (loss) based on specific identification. An impairment charge is recorded in the consolidated statements of operations for declines in fair value below the cost of an individual investment that are deemed to be other than temporary. We assess whether a decline in value is temporary based on the length of time that the fair market value has been below cost, the severity of the decline and the intent and ability to hold or sell the investment. We did not identify any investments as other-than-temporarily impaired as of December 31, 2017 or 2016.
Accounts Receivable and Allowances
Accounts receivable consists of amounts billed currently due from customers and amounts earned not yet billed on development agreements, net of an allowance for doubtful accounts, an allowance for sales returns and an allowance for price exceptions.
The allowance for doubtful accounts is our best estimate of the amount of probable credit losses in existing accounts receivable and is determined based on our historical collections experience, age of the receivable, knowledge of the customer and the condition of the general economy and industry as a whole. We record changes in our estimate to the allowance for doubtful accounts through bad debt expense and relieve the allowance when accounts are ultimately determined to be uncollectible. Bad debt expense is included in general and administrative expenses. For the periods presented in this report, bad debt expense was not material.
The allowance for sales returns is our best estimate based on historical experience and currently available evidence. We record changes in our estimate to the allowance for sales returns through revenue and relieve the allowance when product returns are received. In 2017, we reserved for $3.2 million related to a product exchange that we expect to complete in the first half of 2018. The following table summarizes our allowance for sales returns (in thousands):
80
|
|
Balance at beginning of year |
|
|
Charged to reductions revenue |
|
|
Applied price concession credit |
|
|
Balance at end of year |
|
|||||
|
Allowance for sales returns: |
|
|
|
|
|
|
|
|
|
|
|
|
|
|
|
|
|
During year ended December 31, 2017 |
|
$ |
63 |
|
|
$ |
3,250 |
|
|
$ |
(31 |
) |
|
$ |
3,282 |
|
|
During year ended December 31, 2016 |
|
|
128 |
|
|
|
— |
|
|
|
(65 |
) |
|
|
63 |
|
|
During year ended December 31, 2015 |
|
|
151 |
|
|
|
73 |
|
|
|
(96 |
) |
|
|
128 |
|
The allowance for price exceptions is our best estimate based on historical experience. For the periods presented, price exceptions are not material and are not included in the table above.
Inventory
Inventories consist of a combination of raw materials, work-in-progress and finished goods and are stated at the lower of cost or net realizable value. Cost is determined using the average costing method, which approximates the first in, first out method. We establish reserves for excess and obsolete inventory based on our analysis of inventory levels, future sales forecasts and the estimated utility of our inventory. If our review indicates a reduction in utility below carrying value, we reduce our inventory to a new cost basis through a charge to cost of revenue. For the periods presented in this report, inventory write-downs and sales of inventory previously written-down were not material. Estimating the value of our inventory requires considerable judgment. Changes in our judgment could have a material impact on our results of operations, financial position and cash flows.
Property and Equipment
Property and equipment is recorded at cost and depreciated using the straight-line method over the estimated useful lives of the related assets. The useful lives are as follows:
|
Category |
|
Useful Life |
|
|
|
Laboratory equipment |
|
3 to 5 years |
|
|
|
Computer equipment and software |
|
2 to 5 years |
|
|
|
Furniture and fixtures |
|
3 to 7 years |
|
|
|
Equipment acquired under capital leases |
|
3 to 7 years |
|
|
|
Leasehold improvements |
|
Shorter of remaining lease term or expected useful life |
||
Maintenance and repair costs are charged to expense as incurred. Major improvements, which extend the useful life of the related asset, are capitalized. Upon disposal of a fixed asset, we record a gain or loss based on the differences between the proceeds received and the net book value of the disposed asset.
Goodwill
Goodwill is measured as the excess of the cost of acquisition over the sum of the amounts assigned to identifiable tangible and intangible assets acquired less liabilities assumed. For goodwill, we perform an impairment assessment at the reporting unit level on an annual basis as of the end of our September month end or more frequently if circumstances warrant. Our annual impairment assessment requires a comparison of the fair value of each of our reporting units to the respective carrying value. If the fair value of a reporting unit exceeds its carrying amount, goodwill of the reporting unit is considered not impaired. If the carrying value of a reporting unit is greater than its fair value, an impairment loss will be recognized in an amount equal to that excess, limited to the total amount of goodwill allocated to that reporting unit. Additionally, we will consider the income tax effect from any tax deductible goodwill on the carrying amount of the reporting unit when measuring the goodwill impairment loss.
Revenue Recognition
We generate revenue from sales of our hardware and software products, and from development and service agreements and licensing agreements. We recognize revenue when: (1) persuasive evidence of an arrangement exists; (2) delivery has occurred; (3) the price is fixed or determinable; and (4) collection is probable.
81
Sales agreements do not generally provide for a right of return for refund but for certain distributors provide for a right of return in exchange for other similar products, subject to time and quantity limitations. When we give our distributors the right to exchange eligible products, we estimate the expected exchanges based on an analysis of historical experience. We may provide other credits or considerations to our customers, which are accounted for as sales incentives when estimating the amount of revenue to recognize. The price of our products and revenue we recognize varies with changes in marketing incentives and returns we offer to our customers and their customers. Credits and returns are estimated at contract inception and updated at the end of each reporting period as additional information becomes available and only to the extent that it is probable that a significant reversal of any incremental revenue will not occur.
We sell our reader and gateway products in combination with a limited hardware warranty against manufacturer defect. Our hardware warranty includes access to repair or replacement of hardware in the event of breakage or failure resulting directly from a manufacturer defect; this warranty is provided to all customers and considered an integral part of the initial product sale. Certain software is integrated with our reader and gateway products and is essential to the functionality of the integrated products. We also sell other software that configures, manages and controls readers and gateways which is not considered essential to the functionality of the hardware product.
Our multi-element arrangements generally include a combination of hardware products, non-essential software, extended warranty, enhanced maintenance and services. We allocate revenue to software and non-software deliverables based on their relative fair value. Amounts allocated to extended warranty, enhanced maintenance and services sold with our reader products are deferred and recognized on a straight-line basis over the arrangement term. Accounting principles establish a hierarchy to determine the selling price to be used for allocating revenue to non-software deliverables as follows: (1) vendor-specific objective evidence of selling price, or VSOE; (2) third-party evidence of selling price, or TPE; and (3) best estimated selling prices, or ESP. VSOE generally exists only when we sell the deliverable separately and is the price actually charged by us for that deliverable on a stand-alone basis. When VSOE cannot be established, we attempt to establish the selling price of each element based on TPE. TPE is determined based on competitor prices for similar deliverables when sold separately. We are unable to reliably determine what similar competitor products’ selling prices are on a stand-alone basis and are therefore typically not able to determine TPE. When we are unable to establish selling price using VSOE or TPE, we use ESP in the allocation of arrangement consideration. The objective of ESP is to determine the price at which we would transact a sale if the product or service were sold on a stand-alone basis.
Our ESPs for all products and services are calculated using a method consistent with the way management prices new products. We consider multiple factors in developing the ESPs for our products including our historical pricing and discounting practices, the costs incurred to manufacture the product or deliver the service, the nature of the customer relationship and market trends. In addition, we may consider other factors as appropriate, including the pricing of competitive alternatives if they exist and product-specific business objectives. We regularly review VSOE and ESP and maintain internal controls over the establishment and updates of these estimates.
We sell software that configures, manages and controls readers and gateways which is not considered essential to the functionality of the hardware product. For software deliverables, we recognize revenue in accordance with industry specific software accounting guidance for stand-alone software licenses and related support services. Revenue from software deliverables that do not require significant production, modification or customization of our software is generally recognized when: (1) delivery has occurred; (2) there is no customer acceptance clause in the contract; (3) there are no significant post-delivery obligations remaining; (4) the price is fixed; and (5) collection of the resulting receivable is reasonably assured. For transactions where we have established VSOE for the fair value of support services as measured by the renewal prices paid by our customers when the services are sold separately on a stand-alone basis, we use the residual method to determine the amount of software revenue to be recognized. Under the residual method, the fair value of the undelivered elements is deferred and the remaining portion of the sales amount is recognized as license revenue. Support services revenue is deferred and recognized ratably over the period during which the services are to be performed, which is typically from one to three years. In those instances where we have not established VSOE of our support services, the license and service revenue is recognized on a straight-line basis over the support period.
We account for development, service and licensing agreements generally by recognizing the revenue ratably over the performance period or as services are performed; advance payments under these agreements are initially deferred. Revenue associated with these agreements for the periods presented in this report was not material.
82
Payment terms range from 30 days to 120 days. We present revenue net of sales tax in our consolidated statements of operations. Shipping charges billed to customers are included in revenue and the related shipping costs are included in cost of revenue.
Guarantees and Product Warranties
In the normal course of business to facilitate sales of our products, we indemnify other parties, including customers, distributors, resellers and parties to other transactions with us, with respect to certain matters. We have agreed to hold the other party harmless against losses arising from a breach of representations or covenants, from intellectual property infringement and from other claims made against certain parties. These agreements may limit the time within which an indemnification claim can be made and the amount of the claim. It is not possible to determine the maximum potential amount under these indemnification agreements due to the limited history of prior indemnification claims and the unique facts and circumstances involved in each particular agreement.
We provide limited warranty coverage for most products, generally ranging from a period of 90 days to one year from the date of shipment. A liability is recorded for the estimated cost of product warranties based on historical claims, product failure rates and other factors when the related revenue is recognized. We review these estimates periodically and adjust the warranty reserves as actual experience differs from historical estimates or other information becomes available. The warranty liability primarily includes the anticipated cost of materials, labor and shipping necessary to repair or replace the product. Accrued warranty costs in 2017 and 2016 were not material.
Research and Development Costs
Research and development costs are expensed as incurred and consist of salaries and related benefits of product development personnel, contract developers, prototype materials and other expenses related to the development of new and improved products.
Foreign Currency
The functional currency for all of our subsidiaries is the U.S. dollar. All foreign currency transactions are initially measured and recorded in U.S. dollars using the exchange rate on the date of the transaction. Foreign currency denominated assets and liabilities are remeasured at the end of each reporting period using the exchange rate at that date. We record remeasurement gains and losses in other income (expense), net on the consolidated statements of operations.
Income Taxes
We use the asset and liability approach for accounting, which requires the recognition of deferred tax assets and liabilities for the expected future tax consequences of temporary differences between the financial statement and tax bases. Deferred tax assets and liabilities are measured using enacted tax rates expected to be in effect when such assets and liabilities are recovered or settled. The effect on deferred tax assets and liabilities of a change in tax rates is recognized in the year that includes the enactment date. We determine deferred tax assets, including historical net operating losses, and deferred tax liabilities, based on temporary differences between the book and tax bases of assets and liabilities. We believe that it is currently more likely than not that our deferred tax assets will not be realized and as such, we have recorded a full valuation allowance for these assets. We evaluate the likelihood of the ability to realize deferred tax assets in future periods on a quarterly basis, and when appropriate evidence indicates we would release our valuation allowance accordingly.
We utilize a two-step approach for evaluating uncertain tax positions. First, we evaluate recognition, which requires us to determine if the weight of available evidence indicates that a tax position is more likely than not to be sustained upon audit, including resolution of related appeals or litigation processes. If a tax position is not considered more likely than not to be sustained, no benefits of the position are recognized. Second, we measure the uncertain tax position based on the largest amount of benefit which is more likely than not to be realized on effective settlement. This process involves estimating our actual current tax exposure, including assessing the risks associated with tax audits, together with assessing temporary differences resulting from the different treatment of items for tax and financial reporting purposes. If actual results differ from our estimates, our net operating loss and credit carryforwards could be materially impacted.
83
Our realization of the benefits of the NOLs and credit carryforwards depends on sufficient taxable income in future years. We have established a valuation allowance against the carrying value of our deferred tax assets, as it is not currently more likely than not that we will be able to realize these deferred tax assets. In addition, utilization of NOLs and credits to offset future income subject to taxes may be subject to substantial annual limitations due to the “change in ownership” provisions of the Code and similar state provisions. Events that cause limitations in the amount of NOLs that we may utilize in any one year include, but are not limited to, a cumulative ownership change of more than 50%, as defined by Code Sections 382 and 383, over a three-year period. Utilization of our NOLs and tax credit carryforwards could be significantly reduced if a cumulative ownership change of more than 50% has occurred in our past or occurs in our future.
We do not anticipate that the amount of our existing unrecognized tax benefits will significantly increase or decrease within the next 12 months. Due to the presence of NOLs in most jurisdictions, our tax years remain open for examination by taxing authorities back to 2000.
On December 22, 2017, the U.S. government enacted comprehensive tax legislation under the Tax Cuts and Jobs Act, (“the Tax Act”). The Tax Act makes broad and complex changes to the U.S. tax code, including but not limited to: (1) reducing the U.S. federal corporate tax rate from 35 percent to 21 percent; (2) requiring companies to pay a one-time transition tax on certain unrepatriated earnings of foreign subsidiaries; (3) generally eliminating U.S. federal income taxes on dividends from foreign subsidiaries; (4) eliminating the corporate alternative minimum tax (“AMT”) and how AMT credits are utilized; and (5) changing rules related to uses and limitations of net operating loss carryforwards created in tax years beginning after December 31, 2017. The Securities and Exchange Commission requires a company to reflect the income tax effects of those aspects of the Tax Act for which the accounting under the accounting rules is complete. To the extent that a company’s accounting for certain income tax effects of the Tax Act is incomplete but the company is able to determine a reasonable estimate, it should record a provisional estimate in the financial statements. Further, the implementation guidance also provides for a measurement period that should not extend beyond one year from the Tax Act enactment date for companies to complete their accounting pursuant to the accounting rules.
Stock-Based Compensation
We have stock-based compensation plans that are more fully described in Note 10.
Stock-based compensation cost is measured on the grant date, based on the estimated fair value of the award using a Black-Scholes option model and recognized as an expense over the employee’s requisite service period on a straight-line basis. We account for stock-based compensation arrangements with non-employees using a fair value approach. The fair value of these awards is measured using the Black-Scholes option pricing model reflecting the same assumptions as applied to employee awards in each of the reported periods, other than the expected life, which is assumed to be the remaining contractual life of the award. The compensation costs of these arrangements are subject to remeasurement over the vesting terms as earned. Stock-based compensation expense on awards granted to nonemployees was not material for 2017, 2016 and 2015.
Prior to the closing of our initial public offering, we granted stock options at exercise prices believed to be equal to the fair value of the common stock underlying such options as determined by the board of directors, with input from management, on the date of grant. Because such grants occurred prior to the public trading of our common stock, the board of directors exercised significant judgment in determining the fair market value of our common stock. The valuations were consistent with the guidance and methods outlined in the AICPA Practice Aid, Valuation of Privately-Held-Company Equity Securities Issued as Compensation, or AICPA Practice Aid, for all option grant dates. After the closing of the initial public offering, we granted stock options with exercise prices based on market prices.
We use the Black-Scholes-Merton option-pricing model to determine the fair value for option awards. In valuing our option awards, we make assumptions about risk-free interest rates, dividend yields, volatility, and weighted-average expected lives. These estimates involve inherent uncertainties and the application of management’s judgment. If factors change and different assumptions are used, our stock-based compensation expense could be materially different in the future. We have not paid and do not anticipate paying cash dividends on common stock; therefore, the expected dividend yield is assumed to be zero. In addition, through December 31, 2016, we made assumptions about estimated forfeiture rates. Beginning on January 1, 2017, we elected to account for forfeitures as they occur. We also use the Black-Scholes-Merton option pricing model to determine the fair value
84
of each common share issued under the Employee Stock Purchase Plan, or the ESPP. The fair value for the ESPP grants is determined on the first day of each offering period.
For issuances of restricted stock units, we determine the fair value of the award based on the market value of our common stock at the date of grant.
Warrant Liability
We account for preferred stock warrant liabilities at fair value. Warrant liability costs are recognized based on their grant date fair value estimated using the Black-Scholes option pricing model. To date, all warrants have been issued in connection with entering into or refinancing of our credit facilities and the costs of the warrants were accounted for as a debt discount which is amortized and recognized in interest expense over the term of the associated credit facility. Warrants issued to purchase preferred stock were adjusted to fair value at each period end as estimated using the Black-Scholes model and the associated change in fair value is included in other income (expense), net on the consolidated statements of operations. Upon the effectiveness of the registration statement related to the initial public offering on July 20, 2016, all of our outstanding warrants automatically converted into shares of common stock.
Net Loss per Share Attributable to Common Stockholders
Net loss per share attributable to common stockholders is computed by dividing the net loss attributable to common stockholders by the weighted-average number of shares of common stock outstanding. We have outstanding stock options, unvested common stock subject to repurchase, warrants and convertible preferred stock, which are included in the calculation of diluted net loss attributable to common stockholders per share whenever to do so would be dilutive.
We calculate basic and diluted net loss per share attributable to common stockholders in conformity with the two-class method, in those periods where we had participating securities. We consider all series of convertible preferred stock to be participating securities. Under the two-class method, the net loss attributable to common stockholders is not allocated to the convertible preferred stock as the holders of convertible preferred stock do not have a contractual obligation to share in losses.
The diluted net loss per share attributable to common stockholders is computed by giving effect to all potential dilutive common stock equivalents outstanding for the period. For purposes of this calculation, convertible preferred stock, options to purchase common stock and warrants to purchase common stock and convertible preferred stock are considered potentially dilutive securities but have been excluded from the calculation of diluted net loss per share attributable to common stockholders as their effect is antidilutive. Basic and diluted net loss per share was the same for each period presented, as the inclusion of all potential common shares outstanding would have been antidilutive.
Recently Adopted Accounting Standards
In January 2017, the Financial Accounting Standards Board, or FASB, issued guidance simplifying the test for goodwill impairment. This standard eliminates Step 2 from the goodwill impairment test, instead requiring an entity to recognize a goodwill impairment charge for the amount by which the goodwill carrying amount exceeds the reporting unit’s fair value. This guidance is effective for interim and annual goodwill impairment tests in fiscal years beginning after December 15, 2019, and early adoption is permitted. This guidance must be applied on a prospective basis. We adopted this guidance on January 1, 2017 for interim and annual goodwill impairment tests. Adoption of this guidance did not impact our financial position, results of operations or cash flows.
85
In July 2015, the FASB issued guidance on the measurement of inventory. The amendments require the measurement of inventory at the lower of cost or net realizable value; where net realizable value is the estimated selling price in the ordinary course of business, less reasonably predictable costs of completion, disposal and transportation. This guidance is effective for interim and annual reporting periods beginning after December 31, 2016, and early adoption is permitted. We adopted this guidance on January 1, 2017. Adoption of this guidance did not have a material impact on our financial position, results of operations or cash flows.
Recently Issued Accounting Standards Not Yet Adopted
In January 2017, the FASB issued guidance to narrow the definition of a business. This standard provides guidance to assist entities with evaluating when a set of transferred assets and activities is a business. This guidance is effective for interim and annual reporting periods beginning after December 15, 2017, and early adoption is permitted. This guidance must be applied prospectively to transactions occurring within the period of adoption. We adopted this guidance on January 1, 2018. While we continue to assess all potential impacts of this new standard, we do not expect the adoption of this guidance to have a material impact on our financial position, results of operations or cash flows.
In June 2016, the FASB issued guidance on the measurement of credit losses on financial instruments. This guidance requires the measurement and recognition of expected credit losses for financial assets held at amortized cost. This guidance is effective for interim and annual reporting periods beginning after December 15, 2019, and early adoption is permitted. We expect to adopt this guidance on January 1, 2020. The adoption of this guidance requires a cumulative-effect adjustment to retained earnings as of the beginning of the first reporting period in which the guidance is effective. While we continue to assess all potential impacts of this new standard, we do not expect the adoption of this guidance to have a material impact on our financial position, results of operations or cash flows.
In February 2016, the FASB issued guidance on leases. This standard requires the recognition of a right-of-use asset and lease liability on the balance sheet for all leases. This standard also requires more detailed disclosures to enable users of financial statements to understand the amount, timing, and uncertainty of cash flows arising from leases. This guidance is effective for interim and annual reporting periods beginning after December 15, 2018 and should be applied through a modified retrospective transition approach for leases existing at, or entered into after, the beginning of the earliest comparative period presented in the financial statements, and early adoption is permitted. We expect to adopt this guidance on January 1, 2019. While we continue to assess all potential impacts of this new standard, we anticipate this standard will have a material impact on our financial position, primarily due to our office space operating leases, as we will be required to recognize right-of-use assets and lease liabilities on our consolidated balance sheets. However, we do not expect the adoption to have a significant impact on our results of operations or cash flows.
In May 2014, the FASB issued guidance on revenue recognition. This guidance provides that an entity should recognize revenue to depict the transfer of promised goods or services to customers in an amount that reflects the consideration to which the entity expects to be entitled in exchange for those goods or services. This guidance also requires more detailed disclosures to enable users of financial statements to understand the nature, amount, timing, and uncertainty of revenue and cash flows arising from contracts with customers. The effective date of this guidance for a public company is for interim and annual reporting periods beginning after December 15, 2017, early adoption is permitted, and the guidance must be applied retrospectively to each prior period presented or retrospectively with the cumulative effect of initially applying the guidance recognized at the date of initial application. We adopted the new revenue standard on January 1, 2018 utilizing the full retrospective transition method. In the fourth quarter of fiscal 2017, we finalized our assessment of the new standard, including completing our contract reviews and our evaluation of the incremental costs of obtaining a contract. Revenue recognition related to our hardware products, non-essential software, extended warranty, enhanced maintenance services and non-recurring engineering development agreements, and recognition of cost of sales commissions will remain substantially unchanged. The primary impact of adopting the new standard relates to software license revenue that will generally be recognized at the time of delivery, rather than ratably over the subscription period. Unrecognized software license revenue at December 31, 2017 and 2016 was not material. We continue to assess the impact the adoption of this guidance will have on our disclosures. We are implementing key control activities related to the new guidance, particularly related to evaluating the impact of the standard on products with more than one performance obligation, products with variable consideration, and the determination of the amortization period for contract costs. We have concluded that upon adoption of the new guidance, we will not need to implement new information technology systems.
86
Note 3. Fair Value Measurements
Fair Value Measurement
Accounting standards define fair value as the price that would be received to sell an asset or paid to transfer a liability (an exit price) in the principal or most advantageous market in an orderly transaction between market participants on the measurement date. The standards also establish a fair value hierarchy, which requires an entity to maximize the use of observable inputs and minimize the use of unobservable inputs when measuring fair value. There are three levels of inputs that may be used to measure fair value:
|
|
• |
Level 1 — Quoted prices in active markets for identical assets or liabilities. |
|
|
• |
Level 2 — Assets and liabilities valued based on observable market data for similar instruments, such as quoted prices for similar assets or liabilities. |
|
|
• |
Level 3 — Unobservable inputs that are supported by little or no market activity; instruments valued based on the best available data, some of which is internally developed, and considers risk premiums that a market participant would require. |
We applied the following methods and assumptions in estimating our fair value measurements:
Cash equivalents — Cash equivalents are comprised of highly liquid investments, including money market funds and certificates of deposit, with an original or remaining maturity of three months or less at the date of purchase. The fair value measurement of these assets is based on quoted market prices in active markets.
Investments — Our investments consist of fixed income securities, which include U.S. government agency securities and corporate notes and bonds. The fair value measurement of these assets is based on observable market-based inputs or inputs that are derived principally from or corroborated by observable market data by correlation or other means.
Long-term debt — The fair values of our long-term debt approximates carrying value based on the borrowing rates currently available to us for loans with similar terms using Level 2 inputs.
The following tables present the balances of assets measured at fair value on a recurring basis, by level within the fair value hierarchy, as of the dates presented (in thousands):
|
|
|
December 31, 2017 |
|
|||||
|
|
|
Level 1 |
|
|
Level 2 |
|
||
|
Cash equivalents: |
|
|
|
|
|
|
|
|
|
Money market funds |
|
$ |
10,393 |
|
|
$ |
— |
|
|
Commercial paper |
|
|
— |
|
|
|
1,000 |
|
|
Short-term investments: |
|
|
|
|
|
|
|
|
|
U.S. government agency securities |
|
|
— |
|
|
|
13,970 |
|
|
Corporate notes and bonds |
|
|
— |
|
|
|
7,503 |
|
|
Commercial paper |
|
|
— |
|
|
|
8,972 |
|
|
Treasury bills |
|
|
— |
|
|
|
8,386 |
|
|
Total |
|
$ |
10,393 |
|
|
$ |
39,831 |
|
87
|
|
|
December 31, 2016 |
|
|||||
|
|
|
Level 1 |
|
|
Level 2 |
|
||
|
Cash equivalents: |
|
|
|
|
|
|
|
|
|
Money market funds |
|
$ |
14,065 |
|
|
$ |
— |
|
|
U.S. government agency securities |
|
|
— |
|
|
|
4,997 |
|
|
Corporate notes and bonds |
|
|
— |
|
|
|
959 |
|
|
Commercial paper |
|
|
— |
|
|
|
2,948 |
|
|
Short-term investments: |
|
|
|
|
|
|
|
|
|
U.S. government agency securities |
|
|
— |
|
|
|
36,531 |
|
|
Corporate notes and bonds |
|
|
— |
|
|
|
19,252 |
|
|
Commercial paper |
|
|
— |
|
|
|
11,122 |
|
|
Total |
|
$ |
14,065 |
|
|
$ |
75,809 |
|
We did not have any Level 3 assets as of December 31, 2017 or 2016. There were no liabilities measured at fair value as of December 31, 2017 or 2016.
88
Note 4. Cash, Cash Equivalents and Investments
The following tables present the amortized cost, gross unrealized gains and losses, and estimated fair market value of our cash and cash equivalents and available-for-sale securities as of the dates presented (in thousands):
|
|
|
December 31, 2017 |
|
|||||||||||||
|
|
|
Amortized Cost |
|
|
Gross Unrealized Gains |
|
|
Gross Unrealized Losses |
|
|
Fair Value |
|
||||
|
Cash |
|
$ |
7,892 |
|
|
$ |
— |
|
|
$ |
— |
|
|
$ |
7,892 |
|
|
Cash equivalents: |
|
|
|
|
|
|
|
|
|
|
|
|
|
|
|
|
|
Money market funds |
|
|
10,393 |
|
|
|
— |
|
|
|
— |
|
|
|
10,393 |
|
|
Commercial Paper |
|
|
1,000 |
|
|
|
— |
|
|
|
— |
|
|
|
1,000 |
|
|
Short-term investments: |
|
|
|
|
|
|
|
|
|
|
|
|
|
|
|
|
|
U.S. government agency securities |
|
|
13,979 |
|
|
|
— |
|
|
|
(9 |
) |
|
|
13,970 |
|
|
Corporate notes and bonds |
|
|
7,514 |
|
|
|
— |
|
|
|
(11 |
) |
|
|
7,503 |
|
|
Commercial Paper |
|
|
8,972 |
|
|
|
— |
|
|
|
— |
|
|
|
8,972 |
|
|
Treasury bills |
|
|
8,402 |
|
|
|
— |
|
|
|
(16 |
) |
|
|
8,386 |
|
|
Total |
|
$ |
58,152 |
|
|
$ |
— |
|
|
$ |
(36 |
) |
|
$ |
58,116 |
|
|
|
|
December 31, 2016 |
|
|||||||||||||
|
|
|
Amortized Cost |
|
|
Gross Unrealized Gains |
|
|
Gross Unrealized Losses |
|
|
Fair Value |
|
||||
|
Cash |
|
$ |
10,667 |
|
|
$ |
— |
|
|
$ |
— |
|
|
$ |
10,667 |
|
|
Cash equivalents: |
|
|
|
|
|
|
|
|
|
|
|
|
|
|
|
|
|
Money market funds |
|
|
14,065 |
|
|
|
— |
|
|
|
— |
|
|
|
14,065 |
|
|
U.S. government agency securities |
|
|
4,996 |
|
|
|
1 |
|
|
|
— |
|
|
|
4,997 |
|
|
Corporate notes and bonds |
|
|
959 |
|
|
|
— |
|
|
|
— |
|
|
|
959 |
|
|
Commercial paper |
|
|
2,948 |
|
|
|
— |
|
|
|
— |
|
|
|
2,948 |
|
|
Short-term investments: |
|
|
|
|
|
|
|
|
|
|
|
|
|
|
|
|
|
U.S. government agency securities |
|
|
36,535 |
|
|
|
6 |
|
|
|
(10 |
) |
|
|
36,531 |
|
|
Corporate notes and bonds |
|
|
19,259 |
|
|
|
2 |
|
|
|
(9 |
) |
|
|
19,252 |
|
|
Commercial paper |
|
|
11,122 |
|
|
|
— |
|
|
|
— |
|
|
|
11,122 |
|
|
Total |
|
$ |
100,551 |
|
|
$ |
9 |
|
|
$ |
(19 |
) |
|
$ |
100,541 |
|
The contractual maturities are due in one year of less for our available-for-sale investments as of December 31, 2017.
Note 5. Inventory
The following table presents the detail of inventories as of the dates presented (in thousands):
|
|
|
December 31, |
|
|
December 31, |
|
||
|
|
|
2017 |
|
|
2016 |
|
||
|
Raw materials |
|
$ |
1,351 |
|
|
$ |
5,482 |
|
|
Work-in-process |
|
|
15,647 |
|
|
|
5,556 |
|
|
Finished goods |
|
|
30,085 |
|
|
|
16,696 |
|
|
Total Inventory |
|
$ |
47,083 |
|
|
$ |
27,734 |
|
89
Note 6. Property and Equipment
The following table presents the detail of property and equipment as of the dates presented (in thousands):
|
|
|
December 31, |
|
|||||
|
|
|
2017 |
|
|
2016 |
|
||
|
Laboratory equipment |
|
$ |
11,223 |
|
|
$ |
6,687 |
|
|
Computer equipment and software |
|
|
4,213 |
|
|
|
2,529 |
|
|
Furniture and fixtures |
|
|
1,117 |
|
|
|
228 |
|
|
Equipment acquired under capital leases |
|
|
4,468 |
|
|
|
6,172 |
|
|
Leasehold improvements |
|
|
10,676 |
|
|
|
9,540 |
|
|
|
|
|
31,697 |
|
|
|
25,156 |
|
|
Less: Accumulated depreciation |
|
|
(13,587 |
) |
|
|
(10,227 |
) |
|
|
|
$ |
18,110 |
|
|
$ |
14,929 |
|
Depreciation expense, which includes amortization of leased assets, was $3.9 million, $2.9 million and $1.9 million for the years ended December 31, 2017, 2016 and 2015, respectively. The net book value of property and equipment acquired under capital leases was $1.7 million and $2.7 million at December 31, 2017 and 2016, respectively.
Note 7. Income Taxes
We are subject to federal and state income taxes in the United States and foreign jurisdictions. In 2017, we recorded a tax benefit of $97,000, and in 2016 and 2015 tax expenses of $168,000 and $166,000, respectively.
The following table presents the detail of income tax benefit (expense) for the periods presented (in thousands):
|
|
|
Year Ended December 31, |
|
|||||||||
|
|
|
2017 |
|
|
2016 |
|
|
2015 |
|
|||
|
Current: |
|
|
|
|
|
|
|
|
|
|
|
|
|
U.S. - Federal |
|
$ |
— |
|
|
$ |
— |
|
|
$ |
— |
|
|
U.S. - State |
|
|
(8 |
) |
|
|
(15 |
) |
|
|
(56 |
) |
|
Foreign |
|
|
(126 |
) |
|
|
(63 |
) |
|
|
(22 |
) |
|
|
|
|
(134 |
) |
|
|
(78 |
) |
|
|
(78 |
) |
|
Deferred: |
|
|
|
|
|
|
|
|
|
|
|
|
|
U.S. - Federal |
|
|
241 |
|
|
|
(91 |
) |
|
|
(88 |
) |
|
U.S. - State |
|
|
(10 |
) |
|
|
1 |
|
|
|
— |
|
|
Foreign |
|
|
|
|
|
|
— |
|
|
|
— |
|
|
|
|
|
231 |
|
|
|
(90 |
) |
|
|
(88 |
) |
|
Total income tax benefit (expense) |
|
$ |
97 |
|
|
$ |
(168 |
) |
|
$ |
(166 |
) |
We have not recorded a liability for U.S. income taxes and foreign withholding taxes on the undistributed earnings of foreign subsidiaries of December 31, 2017 as we have no foreign undistributed earnings. We intend to permanently reinvest future such earnings outside the United States. The amount of unrecognized deferred tax liability related to these temporary differences is estimated to be approximately $17,000.
90
The following table presents a reconciliation of the federal statutory rate and our effective tax rate for the periods presented:
|
|
|
Year Ended December 31, |
|
|||||||||
|
|
|
2017 |
|
|
2016 |
|
|
2015 |
|
|||
|
U.S. Statutory Rate |
|
|
34.0 |
% |
|
|
34.0 |
% |
|
|
34.0 |
% |
|
Change in valuation allowance |
|
|
56.4 |
|
|
|
(11.8 |
) |
|
|
9.9 |
|
|
State taxes (net of federal benefit) |
|
|
1.9 |
|
|
|
(4.4 |
) |
|
|
3.8 |
|
|
Federal research and development credit |
|
|
7.1 |
|
|
|
67.4 |
|
|
|
(60.8 |
) |
|
Incentive stock options |
|
|
12.5 |
|
|
|
(46.2 |
) |
|
|
19.5 |
|
|
Unrecognized tax benefits |
|
|
(3.5 |
) |
|
|
(47.1 |
) |
|
|
28.8 |
|
|
Preferred stock warrant revaluation |
|
|
— |
|
|
|
12.6 |
|
|
|
(22.4 |
) |
|
Impact of Tax Cuts and Jobs Act of 2017 |
|
|
(113.5 |
) |
|
|
— |
|
|
|
— |
|
|
Return to provision - deductible transaction costs |
|
|
5.6 |
|
|
|
— |
|
|
|
— |
|
|
Other, net |
|
|
0.1 |
|
|
|
(15.5 |
) |
|
|
2.9 |
|
|
Effective income tax rate |
|
|
0.6 |
% |
|
|
(11.0 |
)% |
|
|
15.7 |
% |
The effective tax rate increased from the prior year due to the change in tax rates as a result of the enactment of new U.S. tax law in December 2017 and increase in taxes in foreign jurisdictions. We continue to maintain a full valuation allowance against our net deferred tax assets in the U.S. but recognize deferred income tax expense in the U.S. solely based on the amortization of goodwill intangibles. As a result of the change in tax law in the United States, the change in deferred tax liabilities related to goodwill decreased, resulting in a tax benefit. We also record current tax expense for certain state margin taxes that are based on income and on earnings in foreign jurisdictions.
Deferred federal, state and foreign income taxes reflect the net tax impact of temporary differences between the carrying amounts of assets and liabilities for financial reporting purposes and such amounts for tax purposes. The following table presents the significant components of our deferred tax assets and liabilities as of the dates presented (in thousands):
|
|
|
December 31, |
|
|||||
|
|
|
2017 |
|
|
2016 |
|
||
|
Net operating loss carryforwards (1) |
|
$ |
27,090 |
|
|
$ |
34,287 |
|
|
Credit carryforwards |
|
|
7,478 |
|
|
|
6,492 |
|
|
Capitalized research and development |
|
|
3,665 |
|
|
|
6,992 |
|
|
Deferred rent |
|
|
1,189 |
|
|
|
1,825 |
|
|
Allowances |
|
|
1,466 |
|
|
|
767 |
|
|
Deferred compensation |
|
|
218 |
|
|
|
1,209 |
|
|
Deferred revenue |
|
|
108 |
|
|
|
331 |
|
|
Stock compensation |
|
|
525 |
|
|
|
220 |
|
|
Deferred tax assets |
|
|
41,739 |
|
|
|
52,123 |
|
|
Less: valuation allowance |
|
|
(41,130 |
) |
|
|
(50,959 |
) |
|
Net deferred tax assets |
|
$ |
609 |
|
|
$ |
1,164 |
|
|
Deferred tax liability |
|
|
|
|
|
|
|
|
|
Goodwill |
|
|
(532 |
) |
|
|
(766 |
) |
|
Depreciation and amortization |
|
|
(609 |
) |
|
|
(1,164 |
) |
|
Deferred tax liabilities |
|
|
(1,141 |
) |
|
|
(1,930 |
) |
|
Net deferred tax liability |
|
$ |
(532 |
) |
|
$ |
(766 |
) |
|
(1) During the prior year, we recorded an increase to the NOL and increase to the valuation allowance of $727,000 as a result of the adoption of ASU 2016-09, “Improvements to Employee Share-Based Payment Accounting.” |
|
|||||||
91
Realization of deferred tax assets is dependent upon the generation of future taxable income, if any, the timing and amount of which are uncertain. We have provided a full valuation allowance against the net deferred tax assets as of December 31, 2017 and 2016 because, based on the weight of available evidence, it is more likely than not (a likelihood of more than 50%) that some or all of the deferred tax assets will not be realized. The valuation allowance decreased $9.8 million during the year ended December 31, 2017 due to the change in enacted future tax rates under the Tax Cuts and Jobs Act, and increased $905,000 during the year ended December 31, 2016.
We have accumulated federal tax losses of approximately $126.4 million and $100.0 million, respectively, as of December 31, 2017 and 2016, which are available to reduce future taxable income. We have accumulated state tax losses of approximately $18.4 million and $15.1 million, respectively, as of December 31, 2017 and 2016. Additionally, we have net research and development credit carryforwards of $9.7 million and $8.5 million, respectively, as of December 31, 2017 and 2016, which are available to reduce future tax liabilities. The tax loss and research and development credit carryforwards begin to expire in 2023. Under Sections 382 and 383 of the Internal Revenue Code, if a corporation undergoes an ownership change, the corporation’s ability to use its pre-change net operating loss carryforwards and other pre-change tax attributes, such as research tax credits, to offset its post-change income or income tax liability may be limited.
We are currently not under audit in any tax jurisdiction. Tax years from 2000 through 2017 are currently open for audit by federal and state taxing authorities.
We establish reserves for tax positions based on estimates of whether, and the extent to which, additional taxes will be due. The reserves are established when we believe that positions might be challenged by taxing authorities despite our belief that our tax return positions are fully supportable.
The following table presents the total balance of unrecognized tax benefits as of the dates presented (in thousands):
|
|
|
Year ended December 31, |
|
|||||||||
|
|
|
2017 |
|
|
2016 |
|
|
2015 |
|
|||
|
Unrecognized tax benefits at beginning of the period |
|
$ |
2,597 |
|
|
$ |
1,878 |
|
|
$ |
1,732 |
|
|
Gross increases to tax positions in prior periods |
|
|
2 |
|
|
|
210 |
|
|
|
— |
|
|
Gross increases to tax positions in current periods |
|
|
307 |
|
|
|
509 |
|
|
|
146 |
|
|
Unrecognized tax benefits at end of the period |
|
$ |
2,906 |
|
|
$ |
2,597 |
|
|
$ |
1,878 |
|
At December 31, 2017, the total amount of unrecognized tax benefits of $2.9 million is recorded as a reduction to the deferred tax asset. We do not anticipate that the amount of existing unrecognized tax benefits will significantly increase or decrease within the next 12 months. Accrued interest and penalties related to unrecognized tax benefits are recorded as income tax expense and are zero.
Tax Cuts and Jobs Act
The Tax Act, was enacted on December 22, 2017. As described above, the Tax Act reduces the U.S. federal corporate tax rate from 35% to 21%, requires companies to pay a one-time transition tax on earnings of certain foreign subsidiaries that were previously tax deferred, and creates new taxes on certain foreign sourced earnings. Additionally, on December 22, 2017, the SEC issued Staff Accounting Bulletin 118, (“SAB 118”), which allows companies to record provisional amounts during a measurement period. As of December 31, 2017, we have not completed our accounting for the tax effects of enactment of the Tax Act; however, in certain cases, as described below, we have made a reasonable estimate of (1) the effects on our existing deferred tax balances and (2) the one-time transition tax. In other cases, we have not been able to make a reasonable estimate and continue to account for those items based on the provisions of the tax laws that were in effect immediately prior to enactment, as prescribed by SAB 118. Additional work is necessary to analyze the impact of the Tax Act on our unremitted foreign earnings position and other components of the Tax Act. Any subsequent adjustment to these amounts will be recorded to current tax expense in the quarter of 2018 when the analysis is complete. In accordance with SAB 118, for the items which we are able to determine a reasonable estimate, we recognized a provisional amount of $19.8 million related to the revaluation of deferred tax assets, which is entirely offset by a corresponding decrease to the valuation allowance, resulting in no impact to current tax expense. In all cases, we will continue to make and refine our calculation as additional analysis is completed. In addition our estimates may also be affected as we gain a more thorough understanding of the new tax law and further guidance is issued from taxing authorities.
92
We have not assessed the impact of certain other provisions of the Tax Act such as Global Intangible Low Taxed Income (“GILTI”). Further, we have not made a policy election with respect to the treatment of potential deferred tax assets or liabilities affected by GILTI. We will continue to refine our calculations and understanding of the Tax Act and make the necessary adjustments within the measurement period ending December 22, 2018.
Provisional Amounts
Deferred tax assets and liabilities were re-measured to reflect the reduction in the U.S. corporate income tax rate at the rates they are expected to reverse in the future, generally 21%. However, we are still analyzing certain aspects of the Tax Act and refining our calculations, which could potentially affect the measurement of these balances or potentially give rise to new deferred tax amounts. The provisional amount recorded related to the re-measurement of our deferred tax balances was $19.8 million.
The impact of the one-time transition tax is based on our total post-1986 earnings and profits, or E&P, that we previously deferred from U.S. income taxes. We did not record a provisional amount due to E&P deficits from foreign operations. Further, the transition tax is based in part on the amount of those earnings held in cash and other specified assets. This amount may change when we finalize the calculation of post-1986 foreign E&P previously deferred from U.S. federal taxation and finalize the amounts held in cash or other specified assets. No additional income taxes have been provided for any remaining undistributed foreign earnings not subject to the transition tax, or any additional outside basis difference inherent in these entities, as these amounts continue to be indefinitely reinvested in foreign operations. The amount of unrecognized deferred tax liability related to any remaining undistributed foreign earnings not subject to the transition tax and additional outside basis difference in these entities as of December 31, 2017 is estimated to be $17,000.
Note 8. Debt Facilities
Senior Credit Facility
On April 24, 2017, we amended and restated our loan agreement, or senior credit facility, with Silicon Valley Bank. As amended, the senior credit facility provides for (1) a $25.0 million revolving credit facility, with a $5.0 million letter of credit subfacility, (2) a $10.5 million term loan and (3) approximately $1.7 million aggregate principal amount of outstanding equipment loans. The revolving credit facility reflects a $10.0 million increase in revolver borrowing capacity and is no longer subject to a borrowing base. Consistent with the prior loan agreement, the term loan will amortize over 36 months beginning on June 1, 2017, following an initial interest-only period, and will mature on May 1, 2020. We retain the ability to prepay the term loan at any time, subject to a prepayment fee of 1.0% of the outstanding principal amount if prepaid on or before May 27, 2018. At December 31, 2017, we had no revolver borrowings outstanding and $8.5 million of term loan borrowings outstanding.
The senior credit facility also refinanced the current balance of the equipment loans outstanding in the principal amount of approximately $870,000, or the Equipment A Advance, and $815,000, or the Equipment B Advance, initially borrowed on September 20, 2016 and December 30, 2016, respectively. Beginning on May 1, 2017, the Equipment A Advance will continue to amortize over 29 months, maturing on September 1, 2019, and the Equipment B Advance will continue to amortize over 32 months, maturing on December 1, 2019. We may prepay the equipment loans in full at any time, subject to a prepayment fee equal to 2.0% of the principal amount of each equipment loan prepaid if such equipment loan is prepaid on or prior to the first anniversary of the date such equipment loan was initially borrowed, and 1.0% of the outstanding principal amount if prepaid after the first anniversary, but on or prior to the second anniversary, of the date such equipment loan was initially borrowed. At December 31, 2017, we had $1.2 million equipment loan borrowings outstanding.
The loans accrue interest, at our option, at (1) a LIBOR rate determined in accordance with the senior credit facility, plus a margin of 2.75% or 3.25%, in the case of revolving borrowings, or 3.0% or 3.5%, in the case of the term loan and equipment loans, or (2) a prime rate determined in accordance with the senior credit facility, plus a margin of 0.0% or 0.5%, in the case of revolving borrowings, or 0.25% or 0.75%, in the case of the term loan and equipment loans, in each case with such margin determined based on our adjusted EBITDA for the preceding 12 month period. Interest is due and payable in arrears monthly for prime rate loans and at the end of an interest period for LIBOR rate loans. We are also obligated to pay other customary closing fees, commitment fees and letter of credit fees for a facility of this size and type.
93
If our cash and investments in accounts maintained with the lender, plus availability under the revolving credit facility, falls below $50.0 million, the senior credit facility requires that we maintain compliance with (1) maximum adjusted EBITDA loss for the twelve month period ending as of the last day of each fiscal quarter of not greater than $7.5 million and (2) a ratio of unrestricted cash in accounts maintained with the lender plus net accounts receivable, to debt owed to the lender, of not less than 1.5 to 1.0.
At December 31, 2017, $9.7 million of term loan and equipment loans were outstanding, excluding unamortized debt issuance costs of $113,000. The weighted average interest rate was 4.6% at December 31, 2017. The following table presents the scheduled principal maturities as of December 31, 2017 (in thousands):
|
2018 |
|
$ |
4,167 |
|
|
2019 |
|
|
4,077 |
|
|
2020 |
|
|
1,458 |
|
|
Total |
|
$ |
9,702 |
|
Mezzanine Credit Facility
We had a mezzanine loan and security agreement, which we referred to as our mezzanine credit facility, with SG Enterprises II, LLC, which provided for a $5.0 million term loan which was drawn in September 2015. On July 26, 2016, we repaid without premium or penalty the principal and accrued interest on the $5.0 million term loan pursuant to the mezzanine credit facility and wrote-off unamortized debt discounts and issuance costs of $109,000.
Note 9. Redeemable Convertible Preferred Stock and Stockholders’ Equity
Redeemable Convertible Preferred Stock
Upon the effectiveness of the registration statement related to the initial public offering on July 20, 2016, all of our previously outstanding shares of redeemable convertible preferred stock automatically converted into 8,531,146 of common stock at the conversion rate of 1-to-1 and shares of Series 2 redeemable convertible preferred stock automatically converted into common stock at the conversion ratio of 1-to-1.25. The related carrying value of the redeemable convertible preferred stock of $106.1 million was reclassified to common stock and additional paid-in capital.
Our previously outstanding Series 1 and Series 2 preferred stock included certain redemption provisions which prevented us from including these amounts in stockholders’ equity (deficit). Holders of our Series 1 and Series 2 redeemable convertible preferred stock were entitled to accretion equal to 7% annual interest (non-compounded) on the original price paid per share of the applicable series of preferred stock. We recorded no accretion in 2017 and accretion of $6.3 million and $11.3 million during 2016 and 2015, respectively, in respect of our outstanding Series 1 and Series 2 redeemable convertible preferred stock. Accretion is generally recorded against distributable earnings. Since we have accumulated losses, we recorded accretion against additional paid-in capital until there is no remaining capital.
Preferred Stock
Our board of directors has the authority to fix the designations, powers, preferences and rights, and the qualifications, limitations or restrictions thereof, of any wholly unissued series of preferred stock, and to increase or decrease the number of shares in any series of preferred stock, subject to limitations prescribed by law or by our certificate of incorporation. There was no preferred stock issued and outstanding as of December 31, 2017 or 2016.
Common Stock
As of December 31, 2017, we had authorized 495,000,000 shares of voting $0.001 par value common stock. Each holder of the common stock is entitled to one vote per common share. At its discretion, the Board of Directors may declare dividends on shares of common stock, subject to the prior rights of our preferred stockholders. Upon liquidation or dissolution, holders of common stock will receive distributions only after preferred stock preferences have been satisfied.
94
The following shares of common stock have been reserved for future issuance as of the dates presented (in thousands):
|
|
|
December 31, |
|
|||||
|
|
|
2017 |
|
|
2016 |
|
||
|
Option awards outstanding |
|
|
2,850 |
|
|
|
2,310 |
|
|
Restricted stock units outstanding |
|
|
12 |
|
|
|
— |
|
|
Common stock reserved under equity incentive plans |
|
|
1,221 |
|
|
|
1,198 |
|
|
Common stock reserved under employee stock purchase plan |
|
|
374 |
|
|
|
— |
|
|
Total |
|
|
4,457 |
|
|
|
3,508 |
|
Note 10. Stock-Based Awards
2016 Equity Incentive Plan
In June 2016, our board of directors adopted and our stockholders approved the 2016 Equity Incentive Plan, or the 2016 Plan, which became effective in July 2016 at which time the 2010 Equity Incentive Plan, or the 2010 Plan, was terminated. Our 2000 Stock Plan was terminated in March 2010. The number of shares of common stock reserved for issuance under the 2016 Plan may increase on January 1 of each year, beginning on January 1, 2017 and ending on and including January 1, 2026, by the least of (1) 1,825,000; (2) 5% of the total number of shares of common stock outstanding on December 31 of the preceding calendar year; and (3) a lesser number of shares determined by our board of directors. All options granted under the 2000 Stock Plan, the 2010 Plan and the 2016 Plan have a maximum 10-year term and generally vest and become exercisable over four years of continued employment or service as defined in each option agreement. We generally grant stock options with exercise prices that equal the fair value of the common stock on the date of grant.
Option Awards
The following table summarizes option award activity for the year ended December 31, 2017 (in thousands, except per share data and years):
|
|
|
Number of Shares Underlying Options |
|
|
Weighted-Average Exercise Price Per Share |
|
|
Weighted-Average Remaining Contractual Life (Years) |
|
|
Total Intrinsic Value |
|
||||
|
Outstanding at December 31, 2016 |
|
|
2,310 |
|
|
$ |
8.84 |
|
|
|
|
|
|
|
|
|
|
Granted |
|
|
1,275 |
|
|
|
36.26 |
|
|
|
|
|
|
|
|
|
|
Exercised |
|
|
(444 |
) |
|
|
3.64 |
|
|
|
|
|
|
|
|
|
|
Forfeited or Cancelled |
|
|
(291 |
) |
|
|
16.16 |
|
|
|
|
|
|
|
|
|
|
Outstanding at December 31, 2017 |
|
|
2,850 |
|
|
|
21.16 |
|
|
|
8.01 |
|
|
|
20,802 |
|
|
Vested and exercisable at December 31, 2017 |
|
|
1,009 |
|
|
$ |
6.72 |
|
|
|
6.14 |
|
|
$ |
16,128 |
|
The fair value of options granted is estimated at the date of grant using the Black-Scholes-Merton option-pricing model with the following assumptions for the periods presented:
|
|
|
Stock Options |
|
|||||||||
|
|
|
Year Ended December 31, |
|
|||||||||
|
|
2017 |
|
|
2016 |
|
|
2015 |
|
||||
|
Risk-free interest rate |
1.8% – 2.2% |
|
|
1.1% – 2.1% |
|
|
1.2% – 1.6% |
|
||||
|
Expected dividends yield |
None |
|
|
None |
|
|
None |
|
||||
|
Expected volatility |
52.2% – 59.1% |
|
|
40.8% – 49.5% |
|
|
41.5% – 43.4% |
|
||||
|
Weighted-average expected life |
6.08 |
|
|
5.78 |
|
|
4.31 |
|
||||
|
Weighted-average fair value of options granted |
$ |
19.15 |
|
|
$ |
9.60 |
|
|
$ |
3.12 |
|
|
95
We determined that it was not practicable to calculate the volatility of our share price since we do not have an extensive public trading history for shares of our common stock. Therefore, we estimated our volatility based on a combination of our historical volatility since becoming a publicly traded company and reported market value data for a group of publicly-traded entities that we believe are relatively comparable after consideration of their size, stage of lifecycle, profitability, growth and risk and return on investment.
The total intrinsic value of options exercised during 2017, 2016 and 2015 was $14.9 million, $1.1 million and $3.8 million, respectively. The total fair value of options vested was $3.1 million, $1.4 million and $1.3 million during 2017, 2016 and 2015, respectively.
As of December 31, 2017, our total unrecognized stock-based compensation cost related to unvested stock options was $27.3 million, which will be recognized over the weighted-average remaining requisite service period of 3.0 years.
Unvested Shares
Prior to the adoption of our 2016 Equity Incentive Plan, we provided employees with the opportunity to early exercise stock options subject to the original vesting schedule of the option. In the event of voluntary or involuntary termination of employment with us, we have an irrevocable and exclusive option to repurchase the unvested portion of the shares at the original exercise price after the termination of employment. We account for cash received in consideration for the purchase of unvested shares of common stock or the early exercise of unvested stock options as a current liability and include it in accrued compensation and employee related benefits on the consolidated balance sheet. We repurchased 1,765 unvested shares from terminated employees in 2017 and none in 2016.
The following table summarizes activity of unvested shares related to early exercise of our common stock for the year ended December 31, 2017 (in thousands, except per share data):
|
|
|
Shares Outstanding |
|
|||||
|
|
|
Number of Shares |
|
|
Weighted-Average Exercise Price per Share |
|
||
|
Outstanding at December 31, 2016 |
|
|
118 |
|
|
$ |
3.30 |
|
|
Issued |
|
|
1 |
|
|
|
4.71 |
|
|
Vested |
|
|
(69 |
) |
|
|
2.59 |
|
|
Repurchased |
|
|
(2 |
) |
|
|
3.19 |
|
|
Outstanding at December 31, 2017 |
|
|
48 |
|
|
|
4.32 |
|
Restricted Stock Units
The following table summarizes activity for restricted stock units for the year ended December 31, 2017 (in thousands, except per share data):
|
|
|
Shares Outstanding |
|
|||||
|
|
|
Number of Shares |
|
|
Weighted-Average Grant Date Fair Value |
|
||
|
Outstanding at December 31, 2016 |
|
|
— |
|
|
$ |
— |
|
|
Granted |
|
|
12 |
|
|
|
46.53 |
|
|
Outstanding at December 31, 2017 |
|
|
12 |
|
|
|
46.53 |
|
The fair value of the outstanding restricted stock units will be recorded as stock-based compensation expense over the vesting period. As of December 31, 2017, there was $267,000 of total unrecognized compensation cost related to unvested restricted stock units, which is expected to be recognized over a weighted average period of 0.7 years.
96
In 2016, we adopted the 2016 Employee Stock Purchase Plan, the ESPP, which became effective in July 2016. Under the ESPP, eligible employees can authorize payroll deductions for amounts up to 15% of their eligible compensation. A participant may purchase a maximum of 4,000 shares each six-month period or some lesser number of shares as determined by IRS rules. The offering periods generally start on the first trading day on or after February 20 and August 20 of each year, except for the first offering period, which commenced on July 21, 2016 and will end on the first trading day on or after February 20, 2017. Participants in an offering period will be granted the right to purchase common shares at a price per share that is 85% of the least of the fair market value of the shares at (1) the first day of the offering period and (2) the end of each purchase period within the offering period. The fair value of the ESPP options granted is determined using a Black-Scholes model and is amortized on a straight-line basis over the related offering period. The number of shares reserved for the ESPP may increase each year, beginning on January 1, 2017 and continuing through and including January 1, 2036, by the least of: (1) 1% of the total number of shares of common stock outstanding on the first day of such year; (2) 365,411 shares of common stock; and (3) such amount as determined by our board of directors.
As of December 31, 2017, the total unrecognized stock-based compensation related to the ESPP was $118,000 and will be recognized on a straight-line basis over the weighted-average remaining service period of 0.1 years.
The fair value of the ESPP options granted is estimated at the start of the offering period using the Black-Scholes-Merton option-pricing model with the following assumptions for the periods presented:
|
|
|
Employee Stock Purchase Plan |
|
||
|
|
|
Year Ended December 31, |
|
||
|
|
|
2017 |
|
2016 |
|
|
Risk-free interest rate |
|
0.7% – 1.1% |
|
0.4% |
|
|
Expected term |
|
0.5 years |
|
0.5 years |
|
|
Expected volatility |
|
66.5% – 71.2% |
|
61.8% |
|
Stock-Based Compensation Expense
The following table presents the detail of stock-based compensation expense amounts included in our consolidated statements of operations for the periods indicated (in thousands):
|
|
Year Ended |
|
|||||||||
|
|
December 31, |
|
|||||||||
|
|
2017 |
|
|
2016 |
|
|
2015 |
|
|||
|
Cost of revenue |
$ |
231 |
|
|
$ |
96 |
|
|
$ |
31 |
|
|
Research and development expense |
|
2,431 |
|
|
|
983 |
|
|
|
305 |
|
|
Sales and marketing expense |
|
3,113 |
|
|
|
1,289 |
|
|
|
692 |
|
|
General and administrative expense |
|
1,653 |
|
|
|
397 |
|
|
|
150 |
|
|
Total stock-based compensation expense |
$ |
7,428 |
|
|
$ |
2,765 |
|
|
$ |
1,178 |
|
97
Note 11. Commitments and Contingencies
Leases
In July 2017, we entered into a lease for additional office space for our corporate headquarters in Seattle, Washington. We took possession of an additional 39,000 square feet in November 2017, and are obligated to make escalating monthly lease payments that will begin in February 2018 and continue through January 2023. We are entitled to landlord incentives totaling $1.5 million that we will amortize as a reduction in rent expense over the remaining term of the lease. On February 13, 2018, the Company began implementing a restructuring to match strategic and financial objectives and optimize resources for long-term growth. As part of the restructuring, we ceased use of this office space. This subsequent event and our restructuring plans are more fully described in Note 15.
In December 2014, we entered into a lease for our corporate headquarters in Seattle, Washington. Pursuant to the terms of this lease, we occupy a total of approximately 70,000 square feet, and we are obligated to make escalating monthly lease payments that began in January 2016 and continue through December 2026. The terms of the lease provide for rental payments on a graduated scale and the right to terminate this lease beginning in December 2022, subject to the payment of certain early termination fees. We received landlord incentives totaling $1.4 million that we are amortizing as a reduction in rent expense over the remaining term of the lease.
In October 2013, we entered into a lease for our design laboratory in Seattle, Washington. We lease approximately 11,000 square feet under an operating lease that expires in October 2018 with an option to renew for an additional one or three year term. The terms of the lease provide for rental payments on a graduated scale and the right to terminate this lease early, beginning in December 2015, subject to the payment of certain early termination fees. We received landlord incentives of $108,000 and have used $95,000. We recorded these incentives as deferred rent obligations and are amortizing them as a reduction in rental expense over the term of the lease.
We recognize rent expense on a straight-line basis over the lease period. Total rent expense under operating leases was $3.4 million, $2.9 million and $1.1 million for the years ended December 31, 2017, 2016 and 2015 respectively.
We lease a portion of our property and equipment under capital leases, which include options allowing us to purchase the equipment at the end of the lease term.
The following table presents future minimum lease payments under operating and capital leases as of December 31, 2017 were as follows (in thousands):
|
|
|
Operating |
|
|
Capital |
|
||
|
2018 |
|
$ |
4,218 |
|
|
$ |
1,024 |
|
|
2019 |
|
|
4,252 |
|
|
|
574 |
|
|
2020 |
|
|
4,379 |
|
|
|
269 |
|
|
2021 |
|
|
4,511 |
|
|
|
2 |
|
|
2022 |
|
|
4,646 |
|
|
|
— |
|
|
Thereafter |
|
|
13,374 |
|
|
|
— |
|
|
Total minimum lease payments |
|
$ |
35,380 |
|
|
$ |
1,869 |
|
|
Less: Portion representing interest |
|
|
|
|
|
|
(188 |
) |
|
Present value of capital lease obligations |
|
|
|
|
|
|
1,681 |
|
|
Less: Current portion of capital lease obligations |
|
|
|
|
|
|
(936 |
) |
|
Capital lease obligations net of current portion |
|
|
|
|
|
$ |
745 |
|
98
In the normal course of business, we periodically enter into agreements that require us to indemnify either customers or suppliers for specific risks. While we cannot estimate our maximum exposure under these indemnification provisions, we do not expect them to have a material impact on our consolidated results of operations or financial condition.
Obligations with Third-Party Manufacturers
We manufacture products with third-party manufacturers. We are committed to purchase $23.5 million of inventory as of December 31, 2017.
Note 12. Segment Reporting
We have one reportable segment: the development and sale of our products and services. Our reportable segment has been identified based on how our chief operating decision-maker manages our business, makes operating decisions and evaluates operating performance. The chief executive officer acts as the chief operating decision-maker and reviews financial and operational information on an entity-wide basis. We have one business activity and there are no segment managers who are held accountable for operations, operating results or plans for levels or components. Accordingly, we have determined that we have a single reporting segment and operating unit structure.
The chief executive officer reviews information about revenue categories, including endpoints, connectivity, software and other revenue. The following table presents our revenue categories for the periods presented (in thousands):
|
|
|
Year ended December 31, |
|
|||||||||
|
|
|
2017 |
|
|
2016 |
|
|
2015 |
|
|||
|
Revenue: |
|
|
|
|
|
|
|
|
|
|
|
|
|
Endpoint ICs |
|
$ |
91,699 |
|
|
$ |
86,218 |
|
|
$ |
52,854 |
|
|
Systems |
|
|
33,601 |
|
|
|
26,069 |
|
|
|
25,625 |
|
|
Total revenue |
|
$ |
125,300 |
|
|
$ |
112,287 |
|
|
$ |
78,479 |
|
Systems revenue includes sales of readers, gateways, reader ICs and software. Revenue from readers and gateways as a percentage of total revenue was 19%, 16% and 22% for years ended December 31, 2017, 2016 and 2015, respectively. None of our other product families within the above categories were above 10% of total revenue for the periods presented.
Our assets are primarily located in the United States and not allocated to any specific geographic region. Therefore, geographic information is presented only for total revenue. Substantially all of our long-lived assets are located in the United States.
The following table is based on the location of the value-added resellers, inlay manufacturers, reader OEMs, distributors or end users who purchased products and services directly from us. For sales to our resellers and distributors, their location may be different from the locations of the ultimate end users. The following table presents our sales by geography for the periods presented (in thousands):
|
|
|
Year ended December 31, |
|
|||||||||
|
|
|
2017 |
|
|
2016 |
|
|
2015 |
|
|||
|
Americas |
|
$ |
29,656 |
|
|
$ |
26,401 |
|
|
$ |
21,568 |
|
|
Asia Pacific |
|
|
80,531 |
|
|
|
73,084 |
|
|
|
45,096 |
|
|
Europe, Middle East and Africa |
|
|
15,113 |
|
|
|
12,802 |
|
|
|
11,815 |
|
|
Total revenue |
|
$ |
125,300 |
|
|
$ |
112,287 |
|
|
$ |
78,479 |
|
Total revenue in the United States was $28.8 million, $25.9 million and $21.0 million for the years ended December 31, 2017, 2016 and 2015, respectively.
99
For the periods presented, the following table provides a reconciliation of the numerator and denominator used in computing basic and diluted net income (loss) per share attributable to common stockholders (in thousands, expect per share amounts):
|
|
|
Year ended |
|
|||||||||
|
|
|
December 31, |
|
|||||||||
|
|
|
2017 |
|
|
2016 |
|
|
2015 |
|
|||
|
Numerator: |
|
|
|
|
|
|
|
|
|
|
|
|
|
Net income (loss) |
|
$ |
(17,322 |
) |
|
$ |
(1,673 |
) |
|
$ |
900 |
|
|
Less: Accretion of preferred stock |
|
|
— |
|
|
|
(6,258 |
) |
|
|
(11,301 |
) |
|
Net income (loss) attributable to common stockholders |
|
$ |
(17,322 |
) |
|
$ |
(7,931 |
) |
|
$ |
(10,401 |
) |
|
Denominator: |
|
|
|
|
|
|
|
|
|
|
|
|
|
Weighted-average common shares outstanding |
|
|
20,763 |
|
|
|
10,904 |
|
|
|
4,067 |
|
|
Weighted-average unvested shares of common stock subject to repurchase |
|
|
(83 |
) |
|
|
(126 |
) |
|
|
(174 |
) |
|
Weighted-average shares used to compute net income (loss) per share attributable to common stockholders — basic and diluted |
|
|
20,680 |
|
|
|
10,778 |
|
|
|
3,893 |
|
|
Net income (loss) per share attributable to common stockholders — basic and diluted |
|
$ |
(0.84 |
) |
|
$ |
(0.74 |
) |
|
$ |
(2.67 |
) |
The following outstanding options, warrants and shares of preferred stock were excluded from the computation of diluted net loss per share attributable to common stockholders for the periods presented because their effect would have been antidilutive (in thousands):
|
|
Year ended |
|
|||||||||
|
|
December 31, |
|
|||||||||
|
|
2017 |
|
|
2016 |
|
|
2015 |
|
|||
|
Redeemable convertible preferred stock |
|
— |
|
|
|
— |
|
|
|
7,885 |
|
|
Common stock warrants |
|
— |
|
|
|
— |
|
|
|
25 |
|
|
Redeemable convertible preferred stock warrants |
|
— |
|
|
|
— |
|
|
|
264 |
|
|
Unvested shares of common stock subject to repurchase |
|
48 |
|
|
|
118 |
|
|
|
136 |
|
|
Stock options |
|
2,911 |
|
|
|
2,310 |
|
|
|
1,896 |
|
Note 14. Retirement Plans
In 2001, we adopted a salary deferral 401(k) plan for our employees. The plan allows employees to contribute a percentage of their pretax earnings annually, subject to limitations imposed by the Internal Revenue Service. The plan also allows us to make a matching contribution, subject to certain limitations. To date, we have not made any contributions to the plan.
100
On February 13, 2018, the Company began implementing a restructuring to match strategic and financial objectives and optimize resources for long-term growth, including a reduction-in-force program affecting approximately 9% of our employees. As part of the restructuring, we will also look to reduce leased office space and close some remote offices.
On March 5, 2018, the Company, amended its Senior Credit Facility, to, among other things, extend the maturity date of the revolving credit facility to March 5, 2020, and provide for a new $20.0 million term loan, the proceeds of which refinance $7.9 million outstanding under the existing term loan and $1.1 million of equipment loans outstanding under the Senior Credit Facility. The remaining term loan proceeds are available for general corporate purposes. The new term loan will amortize over 36 months, beginning on April 1, 2019, following an initial interest-only period, and mature on March 1, 2022. The Company retains the ability to prepay the term loan at any time, subject to a prepayment fee equal to 2.0% of the outstanding principal amount if prepaid on or before March 5, 2019, or 1.0% of the outstanding principal amount if prepaid after March 5, 2019, but on or before March 5, 2020.
The amendment also amends the financial covenants under the Senior Credit Facility such that if the Company’s cash in accounts maintained with the lender, plus available revolver borrowings, falls below $60.0 million for the period of time beginning on March 5, 2018 and ending on December 31, 2018, or $55.0 million for the period of time beginning on January 1, 2019 and at all times thereafter, the Company must comply with an amended covenant to not exceed maximum adjusted EBITDA loss thresholds that vary by period and the existing minimum liquidity ratio, each determined in accordance with the terms of the Senior Credit Facility.
101
Item 9. Changes in and Disagreements with Accountants on Accounting and Financial Disclosure
None.
Item 9A. Controls and Procedures
Evaluation of Disclosure Controls and Procedures
Our management, with the participation of our chief executive officer and our chief financial officer, evaluated the effectiveness of our disclosure controls and procedures as of December 31, 2017. Disclosure controls and procedures, as defined in Rules 13a-15(e) and 15d-15(e) under the Exchange Act, are designed to ensure that information required to be disclosed by a company in the reports that it files or submits under the Exchange Act is (1) recorded, processed, summarized and reported within the time periods specified in the SEC’s rules and forms and (2) accumulated and communicated to management, including its principal executive officer and principal financial officer, as appropriate to allow timely decisions regarding required disclosure. Based on the evaluation of our disclosure controls and procedures, our chief executive officer and chief financial officer concluded that, due to the material weakness in our internal control over financial reporting as described below, our disclosure controls and procedures were not effective as of December 31, 2017 at a reasonable assurance level.
Management’s Report on Internal Control Over Financial Reporting
Our management is responsible for establishing and maintaining adequate internal control over financial reporting, as such term is defined under Rule 13a-15(f) under the Exchange Act. Under the supervision and with the participation of our management, including our chief executive officer and chief financial officer, we conducted an evaluation of the effectiveness of our internal control over financial reporting based on the framework in Internal Control – Integrated Framework issued by the Committee of Sponsoring Organizations of the Treadway Commission (2013 framework). Based on our evaluation, our management concluded that our internal control over financial reporting was not effective as of December 31, 2017 due to a material weakness in our internal control over financial reporting as described below.
This report does not include an attestation report of our independent registered public accounting firm as we have chosen to take advantage of exemptions from various reporting requirements that are available to us as long as we continue to be an emerging growth company as defined in the Jumpstart Our Business Startups Act.
Previously Identified Material Weakness in Internal Control Over Financial Reporting
We previously identified and disclosed in our Annual Report on Form 10-K for the period ended December 31, 2016, a material weakness in our internal control over financial reporting relating to the accounting and financial statement disclosure over complex accounting matters.
The impact of this material weakness resulted in the restatement of our consolidated financial statements for the years ended December 31, 2012 and 2013 and the restatement of our consolidated financial statements for the three and nine months ended September 30, 2015 and 2016.
102
Remediation Efforts to Address Previously Disclosed Material Weakness
Our management, with oversight from our audit committee, has taken steps to implement the following remediation actions to address the previously disclosed material weakness and to improve our internal control over financial reporting, primarily through:
|
|
• |
increasing the depth and experience within our accounting and finance organization; |
|
|
• |
enhancing the communication and coordination among our accounting and financial reporting department and expanded cross-functional involvement and input into period-end disclosures; and |
|
|
• |
implementing additional internal reporting procedures, including enhancing the analytical procedures used to assess period-end balances, to add depth to our review process and improve our segregation of duties. |
For the three months ended December 31, 2017, we continued to assess the design of existing controls and implement new controls as needed to remediate the previously identified material weakness. Accordingly, we concluded the previously reported material weakness remained unremediated as of December 31, 2017.
Notwithstanding the identified material weakness, management believes the consolidated financial statements included in this report fairly represent in all material respects our financial condition, results of operations and cash flows at and for the periods presented in accordance with GAAP.
Changes in Internal Control over Financial Reporting
There were no changes in our internal control over financial reporting identified during the three months ended December 31, 2017 that materially affected, or are reasonably likely to materially affect, our internal control over financial reporting.
Limitations on Controls
Our disclosure controls and procedures and internal control over financial reporting are designed to provide reasonable assurance of achieving the desired control objectives. Our management recognizes that any control system, no matter how well designed and operated, is based upon certain judgments and assumptions and cannot provide absolute assurance that its objectives will be met. Similarly, an evaluation of controls cannot provide absolute assurance that misstatements due to error or fraud will not occur or that all control issues and instances of fraud, if any, have been detected.
None.
103
Item 10. Directors, Executive Officers and Corporate Governance
The information required by this item is incorporated by reference to the Company’s definitive proxy statement relating to the 2018 annual meeting of stockholders or to the annual report on Form 10-K/A. The definitive proxy statement or annual report on Form 10-K/A will be filed with the SEC within 120 days after the end of the 2017 fiscal year.
We have adopted a Code of Ethics that applies to our Chief Executive Officer, Chief Financial Officer, principal accounting officer and controller and persons performing similar functions. The Code of Ethics is posted on our website at http://corporate-governance.impinj.com. We intend to satisfy the disclosure requirements under Item 5.05 of Form 8-K regarding an amendment to, or waiver from, a provision of the Code of Ethics by posting such information on our website at the address specified above.
Item 11. Executive Compensation
The information required by this item is incorporated by reference to the Company’s definitive proxy statement relating to the 2018 annual meeting of stockholders or to the annual report on Form 10-K/A. The definitive proxy statement or annual report on Form 10-K/A will be filed with the SEC within 120 days after the end of the 2017 fiscal year.
Item 12. Security Ownership of Certain Beneficial Owners and Management and Related Stockholder Matters
The information required by this item is incorporated by reference to the Company’s definitive proxy statement relating to the 2018 annual meeting of stockholders or to the annual report on Form 10-K/A. The definitive proxy statement or annual report on Form 10-K/A will be filed with the SEC within 120 days after the end of the 2017 fiscal year.
Item 13. Certain Relationships and Related Transactions, and Director Independence
The information required by this item is incorporated by reference to the Company’s definitive proxy statement relating to the 2018 annual meeting of stockholders or to the annual report on Form 10-K/A. The definitive proxy statement or annual report on Form 10-K/A will be filed with the SEC within 120 days after the end of the 2017 fiscal year.
Item 14. Principal Accounting Fees and Services
The information required by this item is incorporated by reference to the Company’s definitive proxy statement relating to the 2018 annual meeting of stockholders or to the annual report on Form 10-K/A. The definitive proxy statement or annual report on Form 10-K/A will be filed with the SEC within 120 days after the end of the 2017 fiscal year.
104
Item 15. Exhibits and Financial Statement Schedules
(a)(1) Financial Statements
We have filed the financial statements listed in the Index to Consolidated Financial Statements as a part of this report.
(a)(2) Financial Statement Schedules
All financial statement schedules have been omitted because they are not applicable, not material or the required information is presented in the financial statements or the notes thereto.
(a)(3) Exhibits
The list of exhibits included in the Exhibit Index to this report is incorporated herein by reference.
105
|
|
|
|
|
INCORPORATION BY REFERENCE |
||||
|
NUMBER |
|
DESCRIPTION |
|
Form |
|
Date |
|
Number |
|
|
|
|
|
|
|
|
|
|
|
3.1 |
|
|
10-Q |
|
9/2/2016 |
|
3.1 |
|
|
|
|
|
|
|
|
|
|
|
|
3.2 |
|
|
S-1/A |
|
7/11/2016 |
|
3.2 |
|
|
|
|
|
|
|
|
|
|
|
|
4.1 |
|
|
S-1/A |
|
7/11/2016 |
|
4.1 |
|
|
|
|
|
|
|
|
|
|
|
|
4.2 |
|
|
S-1 |
|
6/2/2016 |
|
4.2 |
|
|
|
|
|
|
|
|
|
|
|
|
10.1+ |
|
Form of Director and Executive Officer Indemnification Agreement |
|
S-1/A |
|
7/11/2016 |
|
10.1 |
|
|
|
|
|
|
|
|
|
|
|
10.2+ |
|
|
S-1 |
|
6/2/2016 |
|
10.2 |
|
|
|
|
|
|
|
|
|
|
|
|
10.3+ |
|
|
S-1 |
|
6/2/2016 |
|
10.3 |
|
|
|
|
|
|
|
|
|
|
|
|
10.4+ |
|
|
S-1 |
|
6/2/2016 |
|
10.4 |
|
|
|
|
|
|
|
|
|
|
|
|
10.5+ |
|
Form of Notice of Stock Option Grant and Stock Option Agreement under the 2010 Equity Incentive Plan |
|
S-1 |
|
6/2/2016 |
|
10.5 |
|
|
|
|
|
|
|
|
|
|
|
10.6+ |
|
|
S-1 |
|
6/2/2016 |
|
10.6 |
|
|
|
|
|
|
|
|
|
|
|
|
10.7+ |
|
|
S-1/A |
|
7/11/2016 |
|
10.7 |
|
|
|
|
|
|
|
|
|
|
|
|
10.8+ |
|
Form of Notice of Stock Option Grant and Stock Option Agreement under the 2016 Equity Incentive Plan |
|
S-1/A |
|
7/11/2016 |
|
10.8 |
|
|
|
|
|
|
|
|
|
|
|
10.9+ |
|
|
S-1/A |
|
7/11/2016 |
|
10.9 |
|
|
|
|
|
|
|
|
|
|
|
|
10.10+ |
|
|
S-1 |
|
6/2/2016 |
|
10.12 |
|
|
|
|
|
|
|
|
|
|
|
|
10.11+ |
|
|
S-1 |
|
6/2/2016 |
|
10.13 |
|
|
|
|
|
|
|
|
|
|
|
|
10.12+ |
|
Executive Employment Agreement, dated April 1, 2014, between the registrant and Eric Brodersen |
|
S-1 |
|
6/2/2016 |
|
10.14 |
|
|
|
|
|
|
|
|
|
|
|
10.13+ |
|
|
S-1 |
|
6/2/2016 |
|
10.15 |
|
|
|
|
|
|
|
|
|
|
|
|
10.14+ |
|
Fein Employment Agreement, dated December 23, 2009, between the registrant and Evan Fein |
|
S-1 |
|
6/2/2016 |
|
10.16 |
|
|
|
|
|
|
|
|
|
|
|
10.15+ |
|
|
S-1 |
|
6/2/2016 |
|
10.17 |
|
106
|
|
|
|
|
INCORPORATION BY REFERENCE |
||||
|
NUMBER |
|
DESCRIPTION |
|
Form |
|
Date |
|
Number |
|
|
|
|
|
|
|
|
|
|
|
10.16† |
|
|
S-1 |
|
6/2/2016 |
|
10.19 |
|
|
|
|
|
|
|
|
|
|
|
|
10.16 |
|
|
8-K |
|
4/26/2017 |
|
99.1 |
|
|
|
|
|
|
|
|
|
|
|
|
10.18 |
|
Office Lease, dated December 10, 2014, by and between the registrant and 400 Fairview LLC |
|
S-1 |
|
6/2/2016 |
|
10.21 |
|
|
|
|
|
|
|
|
|
|
|
10.18A |
|
First Amendment to Lease, dated July 31, 2015, between the registrant and 400 Fairview LLC |
|
S-1 |
|
6/2/2016 |
|
10.21A |
|
|
|
|
|
|
|
|
|
|
|
10.18B |
|
Second Amendment to Lease, dated March 4, 2016, between the registrant and 400 Fairview LLC |
|
S-1 |
|
6/2/2016 |
|
10.21B |
|
|
|
|
|
|
|
|
|
|
|
10.18C |
|
Third Amendment to Lease, dated March 28, 2016, between the registrant and 400 Fairview LLC |
|
S-1 |
|
6/2/2016 |
|
10.21C |
|
|
|
|
|
|
|
|
|
|
|
10.19 |
|
|
S-1 |
|
6/2/2016 |
|
10.22 |
|
|
|
|
|
|
|
|
|
|
|
|
10.20† |
|
License Agreement, dated July 3, 2008, between the registrant and Intel Corporation |
|
S-1 |
|
6/2/2016 |
|
10.24 |
|
|
|
|
|
|
|
|
|
|
|
10.21† |
|
|
S-1 |
|
6/2/2016 |
|
10.25 |
|
|
|
|
|
|
|
|
|
|
|
|
10.22† |
|
|
S-1 |
|
6/2/2016 |
|
10.26 |
|
|
|
|
|
|
|
|
|
|
|
|
10.23† |
|
|
S-1 |
|
6/2/2016 |
|
10.27 |
|
|
|
|
|
|
|
|
|
|
|
|
10.24† |
|
|
S-1 |
|
6/2/2016 |
|
10.28 |
|
|
|
|
|
|
|
|
|
|
|
|
10.25† |
|
|
S-1 |
|
6/2/2016 |
|
10.29 |
|
|
|
|
|
|
|
|
|
|
|
107
|
|
|
|
|
INCORPORATION BY REFERENCE |
||||
|
NUMBER |
|
DESCRIPTION |
|
Form |
|
Date |
|
Number |
|
|
|
S-1 |
|
6/2/2016 |
|
10.30 |
||
|
|
|
|
|
|
|
|
|
|
|
10.27+ |
|
|
10-Q |
|
8/14/2017 |
|
10.1 |
|
|
|
|
|
|
|
|
|
|
|
|
21.1 |
|
|
S-1 |
|
6/2/2016 |
|
21.1 |
|
|
|
|
|
|
|
|
|
|
|
|
23.1 |
|
Consent of PricewaterhouseCoopers LLP, Independent Registered Public Accounting Firm |
|
|
|
|
|
|
|
|
|
|
|
|
|
|
|
|
|
24.1 |
|
|
|
|
|
|
|
|
|
|
|
|
|
|
|
|
|
|
|
31.1 |
|
|
|
|
|
|
|
|
|
|
|
|
|
|
|
|
|
|
|
31.2 |
|
|
|
|
|
|
|
|
|
|
|
|
|
|
|
|
|
|
|
32.1* |
|
|
|
|
|
|
|
|
|
|
|
|
|
|
|
|
|
|
|
32.2* |
|
|
|
|
|
|
|
|
|
|
|
|
|
|
|
|
|
|
|
101.INS |
|
XBRL Instance Document |
|
|
|
|
|
|
|
|
|
|
|
|
|
|
|
|
|
101.SCH |
|
XBRL Taxonomy Extension Schema Linkbase Document |
|
|
|
|
|
|
|
|
|
|
|
|
|
|
|
|
|
101.CAL |
|
XBRL Taxonomy Extension Calculation Linkbase Document |
|
|
|
|
|
|
|
|
|
|
|
|
|
|
|
|
|
101.DEF |
|
XBRL Taxonomy Extension Definition Linkbase Document |
|
|
|
|
|
|
|
|
|
|
|
|
|
|
|
|
|
101.LAB |
|
XBRL Taxonomy Extension Label Linkbase Document |
|
|
|
|
|
|
|
|
|
|
|
|
|
|
|
|
|
101.PRE |
|
XBRL Taxonomy Extension Presentation Linkbase Document |
|
|
|
|
|
|
108
None.
109
Pursuant to the requirements of Section 13 or 15(d) of the Securities Exchange Act of 1934, the registrant has duly caused this report to be signed on its behalf by the undersigned, thereunto duly authorized.
|
|
|
Impinj, Inc. |
||
|
|
|
|
|
|
|
Date: March 15, 2018 |
|
By: |
|
/s/ Evan Fein |
|
|
|
|
|
Evan Fein |
|
|
|
|
|
Chief Financial Officer (principal financial and accounting officer and duly authorized signatory) |
KNOW ALL PERSONS BY THESE PRESENTS, that each person whose signature appears below constitutes and appoints Chris Diorio, Ph.D. and Evan Fein, and each of them, with full power of substitution and resubstitution and full power to act without the other, as his or her true and lawful attorney-in-fact and agent to act in his or her name, place and stead and to execute in the name and on behalf of each person, individually and in each capacity stated below, and to file, any and all documents in connection therewith, with the Securities and Exchange Commission, granting unto said attorneys-in-fact and agents, and each of them, full power and authority to do and perform each and every act and thing, ratifying and confirming all that said attorneys-in-fact and agents or any of them or their and his or her substitute or substitutes, may lawfully do or cause to be done by virtue thereof.
Pursuant to the requirements of the Securities Exchange Act of 1934, this report has been signed below by the following persons on behalf of the registrant in the capacities and in the capacities and on the dates indicated.
110