Attached files
| file | filename |
|---|---|
| 10-K - 10-K - HOPFED BANCORP INC | d464046d10k.htm |
| EX-32.2 - EX-32.2 - HOPFED BANCORP INC | d464046dex322.htm |
| EX-32.1 - EX-32.1 - HOPFED BANCORP INC | d464046dex321.htm |
| EX-31.2 - EX-31.2 - HOPFED BANCORP INC | d464046dex312.htm |
| EX-31.1 - EX-31.1 - HOPFED BANCORP INC | d464046dex311.htm |
| EX-23.1 - EX-23.1 - HOPFED BANCORP INC | d464046dex231.htm |
| EX-21.1 - EX-21.1 - HOPFED BANCORP INC | d464046dex211.htm |
EXHIBIT 13.1
SELECTED FINANCIAL INFORMATION AND OTHER DATA
The following summary of selected financial information and other data does not purport to be complete and is qualified in its entirety by reference to the detailed information and Consolidated Financial Statements and accompanying Notes appearing elsewhere in this Report.
Financial Condition and Other Data
| At December 31, | ||||||||||||||||||||
| 2017 | 2016 | 2015 | 2014 | 2013 | ||||||||||||||||
| (Dollars in Thousands) | ||||||||||||||||||||
| Total amount of: |
||||||||||||||||||||
| Assets |
$ | 917,510 | $ | 891,486 | $ | 903,154 | $ | 935,785 | $ | 973,649 | ||||||||||
| Loans receivable, net |
637,102 | 604,286 | 556,349 | 539,264 | 543,632 | |||||||||||||||
| Cash and due from banks |
45,076 | 25,749 | 46,926 | 34,389 | 37,229 | |||||||||||||||
| Federal Home Loan Bank stock |
4,428 | 4,428 | 4,428 | 4,428 | 4,428 | |||||||||||||||
| Securities available for sale |
184,791 | 209,480 | 237,177 | 303,628 | 318,910 | |||||||||||||||
| Deposits |
754,009 | 732,882 | 739,406 | 731,308 | 762,997 | |||||||||||||||
| Repurchase agreements |
38,353 | 47,655 | 45,770 | 57,358 | 52,759 | |||||||||||||||
| FHLB advances |
23,000 | 11,000 | 15,000 | 34,000 | 46,780 | |||||||||||||||
| Subordinated debentures |
10,310 | 10,310 | 10,310 | 10,310 | 10,310 | |||||||||||||||
| Total stockholders’ equity |
87,412 | 86,428 | 87,630 | 98,402 | 95,717 | |||||||||||||||
|
|
|
|
|
|
|
|
|
|
|
|||||||||||
| Number of active: |
||||||||||||||||||||
| Real estate loans |
||||||||||||||||||||
| Outstanding |
3,941 | 4,359 | 4,089 | 4,527 | 4,730 | |||||||||||||||
| Deposit accounts |
34,663 | 38,584 | 44,174 | 44,183 | 44,792 | |||||||||||||||
| Offices open |
18 | 18 | 18 | 18 | 18 | |||||||||||||||
Operating Data
| Year Ended December 31, | ||||||||||||||||||||
| 2017 | 2016 | 2015 | 2014 | 2013 | ||||||||||||||||
| (Dollars in Thousands) | ||||||||||||||||||||
| Interest and dividend income |
$ | 33,755 | $ | 31,727 | $ | 33,122 | $ | 34,680 | $ | 35,857 | ||||||||||
| Interest expense |
5,963 | 5,299 | 6,550 | 8,879 | 10,581 | |||||||||||||||
|
|
|
|
|
|
|
|
|
|
|
|||||||||||
| Net interest income before provision for loan losses |
27,792 | 26,428 | 26,572 | 25,801 | 25,276 | |||||||||||||||
| Provision for loan losses |
477 | 1,241 | 1,051 | (2,273 | ) | 1,604 | ||||||||||||||
|
|
|
|
|
|
|
|
|
|
|
|||||||||||
| Net interest income |
27,315 | 25,187 | 25,521 | 28,074 | 23,672 | |||||||||||||||
| Non-interest income |
8,030 | 7,935 | 7,602 | 7,840 | 9,372 | |||||||||||||||
| Non-interest expense |
29,896 | 29,856 | 30,445 | 33,916 | 28,638 | |||||||||||||||
|
|
|
|
|
|
|
|
|
|
|
|||||||||||
| Income before income taxes |
5,449 | 3,266 | 2,678 | 1,998 | 4,406 | |||||||||||||||
| Provision for income taxes |
2,148 | 362 | 274 | (201 | ) | 644 | ||||||||||||||
|
|
|
|
|
|
|
|
|
|
|
|||||||||||
| Net income |
$ | 3,301 | $ | 2,904 | $ | 2,404 | $ | 2,199 | $ | 3,762 | ||||||||||
|
|
|
|
|
|
|
|
|
|
|
|||||||||||
1
Selected Quarterly Information (Unaudited)
| First Quarter |
Second Quarter |
Third Quarter |
Fourth Quarter |
|||||||||||||
| (Dollars in Thousands) | ||||||||||||||||
| Year Ended December 31, 2017: |
||||||||||||||||
| Interest and dividend income |
$ | 8,160 | $ | 8,419 | $ | 8,635 | $ | 8,541 | ||||||||
| Net interest income after provision for losses on loans |
6,463 | 6,906 | 7,027 | 6,919 | ||||||||||||
| Non-interest income |
2,296 | 1,836 | 2,030 | 1,868 | ||||||||||||
| Non-interest expense |
7,689 | 7,233 | 7,168 | 7,806 | ||||||||||||
| Net income (loss) |
935 | 1,141 | 1,403 | (178 | ) | |||||||||||
| Year Ended December 31, 2016: |
||||||||||||||||
| Interest and dividend income |
$ | 8,081 | $ | 7,691 | $ | 8,004 | $ | 7,951 | ||||||||
| Net interest income after provision for losses on loans |
6,218 | 5,958 | 6,434 | 6,577 | ||||||||||||
| Non-interest income |
2,020 | 1,970 | 1,945 | 2,000 | ||||||||||||
| Non-interest expense |
7,683 | 7,609 | 7,353 | 7,211 | ||||||||||||
| Net income |
509 | 304 | 985 | 1,106 | ||||||||||||
2
| Key Operating Ratios |
||||||||||||
| At or for the Year Ended December 31, |
||||||||||||
| 2017 | 2016 | 2015 | ||||||||||
| Performance Ratios |
||||||||||||
| Return on average assets (net income available to common shareholders divided by average total assets) |
0.36 | % | 0.33 | % | 0.27 | % | ||||||
| Return on average equity (net income available to common shareholders divided by average total equity) |
3.78 | % | 3.26 | % | 2.65 | % | ||||||
| Interest rate spread (combined weighted average interest rate earned less combined weighted average interest rate cost) |
3.23 | % | 3.21 | % | 3.20 | % | ||||||
| Net interest margin |
3.38 | % | 3.35 | % | 3.36 | % | ||||||
| Ratio of average interest-earning assets to average interest-bearing liabilities on a tax equivalent basis |
121.86 | % | 121.98 | % | 119.43 | % | ||||||
| Ratio of non-interest expense to average total assets on a tax equivalent basis |
3.30 | % | 3.45 | % | 3.41 | % | ||||||
| Ratio of net interest income after provision for loan losses to non-interest expense on a tax equivalent basis |
93.23 | % | 85.11 | % | 86.68 | % | ||||||
| Tax equivalent efficiency ratio (non-interest expense divided by sum of net interest income plus non-interest income) |
82.18 | % | 86.72 | % | 86.85 | % | ||||||
| Asset Quality Ratios |
||||||||||||
| Non-performing assets to total assets at end of period |
0.52 | % | 1.29 | % | 1.02 | % | ||||||
| Non-accrual loans to total loans at end of period |
0.20 | % | 1.49 | % | 1.32 | % | ||||||
| Allowance for loan losses to total loans at end of period |
0.75 | % | 1.00 | % | 1.01 | % | ||||||
| Allowance for loan losses to non-performing loans at end of period |
351.49 | % | 67.36 | % | 76.80 | % | ||||||
| Provision for loan losses to total loans receivable, net |
0.07 | % | 0.20 | % | 0.19 | % | ||||||
| Net charge-offs to average loans outstanding |
0.28 | % | 0.15 | % | 0.29 | % | ||||||
| Capital Ratios |
||||||||||||
| Total equity to total assets at end of period |
9.53 | % | 9.69 | % | 9.72 | % | ||||||
| Average total equity to average assets |
9.64 | % | 10.11 | % | 10.17 | % | ||||||
| December 31, 2017 | ||||||||
| Regulatory Capital | (Dollars in Thousands) | |||||||
| Corporation | Bank | |||||||
| Tier 1 Leverage capital to adjusted total assets |
$ | 95,709 | $ | 95,123 | ||||
| Less: Tier 1 Leverage capital requirement |
36,137 | 36,090 | ||||||
|
|
|
|
|
|||||
| Excess |
59,572 | 59,033 | ||||||
|
|
|
|
|
|||||
| Tier 1 Risk Based capital to risk weighted assets |
$ | 95,709 | $ | 95,123 | ||||
| Less: Tier 1 Risk Based capital requirement |
37,764 | 37,735 | ||||||
|
|
|
|
|
|||||
| Excess |
57,945 | 57,388 | ||||||
|
|
|
|
|
|||||
| Total risk-based capital to risk weighted assets |
$ | 100,535 | $ | 99,949 | ||||
| Less: Risk-based capital requirement |
50,352 | 50,314 | ||||||
|
|
|
|
|
|||||
| Excess |
50,183 | 49,635 | ||||||
|
|
|
|
|
|||||
| Common equity tier 1 capital to risk weighted assets |
$ | 95,709 | $ | 95,123 | ||||
| Less: Common equity tier 1 capital requirement |
28,323 | 28,301 | ||||||
|
|
|
|
|
|||||
| Excess |
67,386 | 66,822 | ||||||
|
|
|
|
|
|||||
3
Aggregate Contractual Obligations
| Maturity by Period | ||||||||||||||||||||
| Greater | Greater | Greater | ||||||||||||||||||
| December 31, 2017 (In Thousands) | Less than | than 1 year | than 3 year | than | ||||||||||||||||
| 1 year | to 3 years | to 5 years | 5 years | Total | ||||||||||||||||
| Deposits |
$ | 639,995 | 98,793 | 15,221 | — | 754,009 | ||||||||||||||
| FHLB borrowings |
6,000 | 17,000 | — | — | 23,000 | |||||||||||||||
| Repurchase agreements |
38,353 | — | — | — | 38,353 | |||||||||||||||
| Subordinated debentures |
— | — | — | 10,310 | 10,310 | |||||||||||||||
| Lease commitments |
312 | 396 | 225 | — | 933 | |||||||||||||||
| Purchase obligations |
1,974 | 1,759 | 55 | — | 3,788 | |||||||||||||||
|
|
|
|
|
|
|
|
|
|
|
|||||||||||
| Total |
$ | 686,634 | 117,948 | 15,501 | 10,310 | 830,393 | ||||||||||||||
|
|
|
|
|
|
|
|
|
|
|
|||||||||||
Deposits represent non-interest bearing, money market, savings, interest bearing checking accounts and certificates of deposits held by the Company. Amounts that have an indeterminate maturity period are included in the less than one-year category. FHLB borrowings represent the amounts that are due to Federal Home Loan Bank of Cincinnati. All amounts have fixed maturity dates. Repurchase agreements represent overnight retail repurchase accounts. Retail repurchase agreements mature daily and pay interest based on their account balances.
Subordinated debentures represent the amount borrowed in a private pool trust preferred issuance group on September 25, 2003. The Company’s rate of interest on the debentures is equal to the three-month LIBOR plus 3.10%. On January 11, 2018, the three-month LIBOR rate was 1.72% and the debenture repriced at 4.82%. The debentures re-price and pay interest quarterly and have a thirty-year final maturity. The Company may call the debentures on a quarterly basis. The interest rate of the debentures reset on the 8th day (or the next business day) of January, April, August and November of each year.
Lease commitments represent the total minimum lease payments under non-cancelable operating leases. The most significant operating contract is for the Company’s data processing services, which re-prices monthly based on the number of accounts and other operational factors. The Company’s operating contract with the current data processing provider is currently set to expire September 30, 2019.
Off Balance Sheet Arrangements
| Maturity by Period | ||||||||||||||||||||
| Greater | Greater | Greater | ||||||||||||||||||
| December 31, 2017 (In Thousands) | Less than | than 1 year | than 3 year | than | ||||||||||||||||
| 1 year | to 3 years | to 5 years | 5 years | Total | ||||||||||||||||
| Commercial lines of credit |
$ | 46,184 | 15,522 | 218 | 986 | 62,910 | ||||||||||||||
| Commitments to extend credit |
22,383 | 17,242 | 20,904 | 10,977 | 71,506 | |||||||||||||||
| Standby letters of credit |
130 | 8 | 5 | — | 143 | |||||||||||||||
| Home equity lines of credit |
1,296 | 4,127 | 7,993 | 19,285 | 32,701 | |||||||||||||||
|
|
|
|
|
|
|
|
|
|
|
|||||||||||
| Total |
$ | 69,993 | 36,899 | 29,120 | 31,248 | 167,260 | ||||||||||||||
|
|
|
|
|
|
|
|
|
|
|
|||||||||||
Standby letters of credit represent commitments by the Company to repay a third-party beneficiary when a customer fails to repay a loan or debt instrument. The terms and risk of loss involved in issuing standby letters of credit are similar to those involved in issuing loan commitments and extending credit. In addition to credit risk, the Company also has liquidity risk associated with stand-by letters of credit because funding for these obligations could be required immediately. Unused lines of credit represent commercial and residential equity lines of credit with maturities ranging from one to fifteen years.
4
MANAGEMENT’S DISCUSSION AND ANALYSIS OF
FINANCIAL CONDITION AND RESULTS OF OPERATIONS
General
This discussion relates to the consolidated financial condition and results of operations of the Company, which consist of the consolidation of Heritage Bank USA, Inc. (the “Bank”) and HopFed Bancorp, Inc. (the “Corporation”), JBMM LLC, Heritage Interim Corporation, Heritage USA Title LLC, and Fort Webb LLC (collectively referred to as the “Company”). The Corporation became the holding company for the Bank in February 1998. The principal business of the Bank consists of accepting deposits from the public and investing these funds primarily in loans and in investment securities and mortgage-backed securities. The Bank’s loan portfolio consists primarily of loans secured by real estate located in its market area.
Comparison of Financial Condition at December 31, 2017 and December 31, 2016
At December 31, 2017, the Company’s total assets were $917.5 million, representing an increase of $26.0 million compared to December 31, 2016. At December 31, 2017, cash balances were $45.1 million compared to $25.7 million at December 31, 2016. At December 31, 2017, the Company’s balances of securities available for sale were $184.8 million compared to $209.5 million at December 31, 2016. It is the Company’s intent to continue to use a portion of the cash flows provided by the securities portfolio to fund future loan growth as a means to improve profitability.
At December 31, 2017, the Company’s non-interest checking account balances were $136.2 million compared to $131.1 million at December 31, 2016. The growth in checking account balances occurred despite changes to retail deposit offerings that reduced the amount of checking accounts not being assessed a monthly fee. The Company’s time deposit balances increased from $293.1 million at December 31, 2016 to $305.0 million at December 31, 2017 and Company’s Federal Home Loan Bank (“FHLB”) borrowings increased from $11.0 million at December 31, 2016 to $23.0 million at December 31, 2017. Management continues to place a heavy emphasis on core deposit growth, utilizing FHLB borrowing to supplement liquidity needs.
In 2017, the Company foreclosed on a significant substandard loan relationship and recognized a $2.6 million charge off. At December 31, 2017, the balance in the allowance for loan loss account declined to $4.8 million compared to $6.1 million at December 31, 2016. At December 31, 2017, the Company’s lower levels of loans classified as substandard and non-accrual were contributing factors in the Company’s reduced levels of provision for loan loss expense.
At December 31, 2017, net loans outstanding were $637.1 million compared to $604.3 million at December 31, 2016. For the years ended December 31, 2017 and December 31, 2016, loan growth has driven improved profitability levels. The Company’s net loan growth in each of the last two years is as follows (In Thousands):
| Dollar | Percent | Dollar | Percent | |||||||||||||
| Growth | Growth | Growth | Growth | |||||||||||||
| 12/31/2017 | 12/31/2017 | 12/31/2016 | 12/31/2016 | |||||||||||||
| Loan growth, net of the allowance for loan loss |
32,816 | 5.43 | % | 47,937 | 8.62 | % | ||||||||||
In each of the last two years, a significant portion of the Company’s loan growth has occurred in two key markets. At December 31, 2017 and December 31, 2016, the Company’s loan production office (“Nashville LPO”) experienced loan growth of $26.1 million and $27.1 million, respectively. Christian County, Kentucky, the Company’s home market, experienced loan growth of $5.0 million and $24.2 million for the years ended December 31, 2017 and December 31, 2016, respectively. The highly desirable demographics and growth characteristics of the Nashville market will provide the most significant opportunities for the Company’s future loan growth.
5
As the Company’s Nashville LPO office has continued to find success, the Company’s non-residential loan portfolio has experienced significant growth as outlined by the table below:
| 12/31/2017 | 12/31/2016 | 12/31/2015 | ||||||||||
| (Dollars in Thousands, Except Percentages) | ||||||||||||
| Non-residential real estate loans |
$ | 224,952 | $ | 182,940 | $ | 149,711 | ||||||
| Year over year growth |
$ | 42,012 | $ | 33,229 | ($ | 885 | ) | |||||
| Growth rate |
23.0 | % | 22.2 | % | -0.59 | % | ||||||
Comparison of Operating Results for the Years Ended December 31, 2017 and 2016
The Company’s net income for the year ended December 31, 2017 and December 31, 2016 was $3.3 million and $2.9 million, respectively. The modest improvement in net income was largely the result of loan growth and lower levels of provision for loan loss expenses. The passage of the Tax Cut and Jobs Act of 2017 reduces the Company’s future corporate tax rate but required a $980,000 after-tax expense to reduce the value of the Company’s deferred tax assets. Improvements in net income were further limited by more than $1.1 million in legal expenses that resulted from a shareholder lawsuit and shareholder demand letter.
For the year ended December 31, 2017, total interest income on loans increased $2.4 million compared to December 31, 2016 due to the Company’s $56.1 million increase in the average balance of net loans. For the year ended December 31, 2017, the Company’s interest income on investments declined by $411,000 due to lower average balances of securities as the Company continues to re-allocate cash flows generated by the investment portfolio into loans.
For the year ended December 31, 2017, interest expense was $6.0 million compared to $5.3 million for the year ended December 31, 2016. The increase in interest expense was largely the result of higher short term interest rates as the Federal Reserve Open Market Committee (“FED”) increased its overnight borrowing rate to 1.50% by the end of 2017. In 2017, the Company increased its reliance on both Federal Home Loan Bank borrowings and brokered deposits as loan demand and deposit outflows become more unpredictable during the year.
The average cost of deposits was 0.64% for the year ended December 31, 2017 compared to 0.59% of average deposits for the year ended December 31, 2016. Over the same period, the average balance of deposits increased from $721.8 million for the year ended December 31, 2016 to $747.8 million for the year ended December 31, 2017. For the year ended December 31, 2017, interest expense on the variable rate trust preferred securities issued by the Company increased $48,000 compared to the year ended December 31, 2016 due to an increase in the three month Libor rate.
The Company determined that an additional $477,000 and $1.2 million in provision for loan loss expense was required for the years ended December 31, 2017 and December 31, 2016, respectively. We reduced our provision expense in 2017 due to lower levels of non-accrual and substandard loans. Management uses a number of factors in determining the amount of provision for loan loss expense that is necessary including the amounts of current periods loan charge offs and recoveries, our perceived trends of asset quality, and the Company’s current growth prospects of its loan portfolio. The Company’s ratio of allowance for loan losses to non-accrual loans at December 31, 2017 and December 31, 2016 was 375.74% and 67.36%, respectively. The following table depicts the level of non-performing loans, classified assets and charge offs at December 31, 2017 and December 31, 2016:
| 12/31/2017 | 12/31/2016 | |||||||
| (Dollars in Thousands) | ||||||||
| Non-performing assets |
4,742 | 11,471 | ||||||
| Classified assets |
10,780 | 29,339 | ||||||
| Net charge offs |
1,763 | 829 | ||||||
6
For the year ended December 31, 2017, total non-interest income was $8.0 million, an increase of $95,000 compared to December 31, 2016. For the year ended December 31, 2017, the slight increase in non-interest income was accomplished despite a $443,000 decline in gains on the sale of securities and a $264,000 decline in mortgage origination income. The decline of income in both gains on the sale of securities and mortgage origination income is partially attributable to rising interest rates as well as increased competition for mortgage originators in the Company’s higher growth markets.
For the year ended December 31, 2017, the Company’s service charge income was $3.2 million, representing an increase of $436,000 compared to the year ended December 31, 2016. The increase in service charge income is the result of changes made by management to the Company’s retail deposit account offerings that increased the number of checking accounts paying a monthly fee. For the year ended December 31, 2017, other non-interest income increased by $306,000 as compared to the year ended December 31, 2016. The increase in other income was largely the result of a $225,000 one-time payment collected from a vendor.
Total non-interest expense for the years ended December 31, 2017 and December 31, 2016 was $29.9 million, respectively. For the year ended December 31, 2017, the Company’s salaries and benefits expense increased by $649,000 compared to the year ended December 31, 2016. The increase in salary and benefit expenses in 2017 compared to 2016 was the result of a $300,000 increase in health insurance benefits and a $349,000 increase in compensation. For the year ended December 31, 2017, professional services expenses were $2.3 million compared to $1.4 million for the year ended December 31, 2016 largely due to legal expenses of approximately $1.1 million incurred as a result of a shareholder lawsuit and shareholder demand letter.
For the year ended December 31, 2017, net foreclosure expenses were $9,000 compared to $448,000 for the year ended December 31, 2016. The decline in net foreclosure expenses for the year ended December 31, 2017 was the result of a reduction in both the number and complexity of foreclosures and higher realized values on properties sold. For the year ended December 31, 2017, other operating expenses were $3.6 million compared to $4.2 million for the year ended December 31, 2016.
Income Taxes. The effective tax rates for the years ended December 31, 2017 and December 31, 2016, was 39.4% and 11.1%, respectively. For the year ended December 31, 2017, the Company’s effective tax rate was largely influenced by the $980,000 reduction in the Company’s deferred tax asset. For the year ended December 31, 2017, higher tax rates were the result of higher levels of taxable income and reduced balances of municipal bonds.
In 2018, Management anticipates that short term interest rates will continue to increase, placing pressures on net interest margins. The Company’s opportunities for improved net income lies in management’s ability to continue to grow the Company’s loan portfolio while maintaining net interest margins at or near current levels. Another key factor to the Company’s future success will be in reducing our operating expenses through reduced legal expenses and improved operational efficiencies.
Comparison of Operating Results for the Years Ended December 31, 2016 and 2015
The Company’s net income for the year ended December 31, 2016 was $2.9 million compared to $2.4 million for the year ended December 31, 2015. The improvement in net income for the year ended December 31, 2016 compared to December 31, 2015 was largely the result of loan growth that occurred in the second half of the year.
Interest income declined $1.4 million from $33.1 million to $31.7 million, or approximately 4.2% during the year ended December 31, 2016 compared to the year ended December 31, 2015. The decline in interest income was largely attributable to a decline in yields on assets, the collection of $830,000 in non-accrual interest in 2015 and a decline in the average balance of our available for sale portfolio.
Interest expense declined to $5.3 million for the year ended December 31, 2016 compared to $6.6 million for 2015. The decline in interest expense was largely attributable to the $791,000 decline in interest expense on deposits and a $351,000 decline on interest expense on subordinated debentures. The Company determined that an additional $1.2 million and $1.1 million in provision for loan loss expense was required for the years ended December 31, 2016 and December 31, 2015, respectively.
7
For the year ended December 31, 2016, non-interest income was $7.9 million compared to $7.6 million for the year ended December 31, 2015. For the year ended December 31, 2016, the Company’s service charge income was $2.8 million, representing a decline of $137,000 as compared to the year ended December 31, 2015.
For the year ended December 31, 2016, income from mortgage origination income was $1.6 million compared to $1.2 million for the year ended December 31, 2015. The increase in mortgage origination revenue for 2016 was the result of an active home market due to the continued low level of mortgage interest rates that were in place in 2016.
Total non-interest expense for the year ended December 31, 2016 was $29.9 million, compared to $30.4 million in 2015. For the year ended December 31, 2016, the Company’s salaries and benefits expense declined by $410,000, or 2.6%, as compared to the year ended December 31, 2015. For the year ended December 31, 2016, other operating expenses were $4.2 million compared to $3.7 million for the year ended December 31, 2015 largely due to higher legal expenses.
Lending Activities
The total gross loans, net of deferred loan fees of $443,000, totaled $641.9 million at December 31, 2017, representing 70.0% of total assets at that date. Set forth below is selected data relating to the composition of the loan portfolio by type of loan at the dates indicated. At December 31, 2017, there were no concentrations of loans exceeding 10% of total loans other than as disclosed below:
| 2017 | 2016 | 2015 | 2014 | 2013 | ||||||||||||||||||||||||||||||||||||
| Amount | Percent | Amount | Percent | Amount | Percent | Amount | Percent | Amount | Percent | |||||||||||||||||||||||||||||||
| (Dollars in Thousands) | ||||||||||||||||||||||||||||||||||||||||
| Type of Loan: |
||||||||||||||||||||||||||||||||||||||||
| Real estate loans: |
||||||||||||||||||||||||||||||||||||||||
| One-to-four family residential |
$ | 200,446 | 31.2 | % | $ | 185,098 | 30.3 | % | 181,414 | 32.3 | % | 186,891 | 34.2 | % | 192,603 | 34.9 | % | |||||||||||||||||||||||
| Multi-family residential |
37,445 | 5.8 | % | 34,284 | 5.6 | % | 24,725 | 4.4 | % | 25,991 | 4.8 | % | 29,736 | 5.4 | % | |||||||||||||||||||||||||
| Construction |
30,246 | 4.7 | % | 39,255 | 6.4 | % | 34,878 | 6.2 | % | 24,241 | 4.4 | % | 10,618 | 1.9 | % | |||||||||||||||||||||||||
| Non-residential (1) |
276,676 | 43.1 | % | 254,576 | 41.7 | % | 214,410 | 38.1 | % | 220,124 | 40.3 | % | 244,241 | 44.2 | % | |||||||||||||||||||||||||
|
|
|
|
|
|
|
|
|
|
|
|
|
|
|
|
|
|
|
|
|
|||||||||||||||||||||
| Total real estate loans |
544,813 | 84.8 | % | 513,213 | 84.0 | % | 455,427 | 81.0 | % | 457,247 | 83.7 | % | 477,198 | 86.4 | % | |||||||||||||||||||||||||
|
|
|
|
|
|
|
|
|
|
|
|
|
|
|
|
|
|
|
|
|
|||||||||||||||||||||
| Other loans: |
||||||||||||||||||||||||||||||||||||||||
| Consumer loans |
8,620 | 1.3 | % | 8,717 | 1.4 | % | 20,324 | 3.6 | % | 14,438 | 2.7 | % | 11,167 | 2.0 | % | |||||||||||||||||||||||||
| Commercial loans |
88,938 | 13.9 | % | 88,907 | 14.6 | % | 86,743 | 15.4 | % | 74,154 | 13.6 | % | 64,041 | 11.6 | % | |||||||||||||||||||||||||
|
|
|
|
|
|
|
|
|
|
|
|
|
|
|
|
|
|
|
|
|
|||||||||||||||||||||
| Total other loans |
97,558 | 15.2 | % | 97,624 | 16.0 | % | 107,067 | 19.0 | % | 88,592 | 16.3 | % | 75,208 | 13.6 | % | |||||||||||||||||||||||||
|
|
|
|
|
|
|
|
|
|
|
|
|
|
|
|
|
|
|
|
|
|||||||||||||||||||||
| 642,371 | 100.0 | % | 610,837 | 100.0 | % | 562,494 | 100.0 | % | 545,839 | 100.0 | % | 552,406 | 100.0 | % | ||||||||||||||||||||||||||
|
|
|
|
|
|
|
|
|
|
|
|||||||||||||||||||||||||||||||
| Deferred loan cost, net |
(443 | ) | (439 | ) | (445 | ) | (286 | ) | (92 | ) | ||||||||||||||||||||||||||||||
| Allowance for loan losses |
(4,826 | ) | (6,112 | ) | (5,700 | ) | (6,289 | ) | (8,682 | ) | ||||||||||||||||||||||||||||||
|
|
|
|
|
|
|
|
|
|
|
|||||||||||||||||||||||||||||||
| Total |
$ | 637,102 | $ | 604,286 | 556,349 | 539,264 | 543,632 | |||||||||||||||||||||||||||||||||
|
|
|
|
|
|
|
|
|
|
|
|||||||||||||||||||||||||||||||
| (1) | Consists of loans secured by first liens on residential lots and loans secured by first mortgages on commercial real property, farmland and land. |
8
Loan Maturity Schedule. The following table sets forth certain information at December 31, 2017 regarding the dollar amount of loans maturing in the portfolio based on their contractual maturity dates. Demand loans, loans having no stated schedule of repayments, loans having no stated maturity, and overdrafts are due in one year or less.
| Due | Due | Due | ||||||||||||||||||||||||||||||
| 3 through 5 | 5 through 10 | 10 through 15 | Due 15 | |||||||||||||||||||||||||||||
| Due the year | years after | years after | years after | years after | ||||||||||||||||||||||||||||
| ending December 31, | December 31, | December 31, | December 31, | December 31, | ||||||||||||||||||||||||||||
| 2018 | 2019 | 2020 | 2018 | 2018 | 2018 | 2018 | Total | |||||||||||||||||||||||||
| (Dollars in Thousands) | ||||||||||||||||||||||||||||||||
| One-to-four family residential |
5,854 | 10,177 | 9,725 | 25,147 | 33,781 | 29,863 | 85,899 | 200,446 | ||||||||||||||||||||||||
| Multi-family residential |
15 | 589 | 3,938 | 9,281 | 19,338 | 3,427 | 857 | 37,445 | ||||||||||||||||||||||||
| Construction |
16,977 | 2,875 | 258 | 1,885 | 2,827 | 4,945 | 479 | 30,246 | ||||||||||||||||||||||||
| Non-residential |
33,277 | 18,067 | 22,499 | 59,565 | 75,253 | 30,615 | 37,400 | 276,676 | ||||||||||||||||||||||||
| Consumer |
1,736 | 1,630 | 2,646 | 2,233 | 375 | — | — | 8,620 | ||||||||||||||||||||||||
| Commercial |
26,327 | 18,189 | 7,995 | 10,728 | 21,714 | 975 | 3,010 | 88,938 | ||||||||||||||||||||||||
|
|
|
|
|
|
|
|
|
|
|
|
|
|
|
|
|
|||||||||||||||||
| Total |
84,186 | 51,527 | 47,061 | 108,839 | 153,288 | 69,825 | 127,645 | 642,371 | ||||||||||||||||||||||||
|
|
|
|
|
|
|
|
|
|
|
|
|
|
|
|
|
|||||||||||||||||
The following table sets forth at December 31, 2017 the dollar amount of all loans due after December 31, 2017 which had predetermined interest rates and had floating or adjustable interest rates.
| Predetermined Rate |
Floating or Adjustable Rate |
|||||||
| (Dollars In Thousands) | ||||||||
| One-to-four family residential |
$ | 86,928 | $ | 107,664 | ||||
| Multi-family residential |
27,786 | 9,644 | ||||||
| Construction |
5,368 | 7,901 | ||||||
| Non-residential |
130,199 | 113,200 | ||||||
| Consumer |
6,835 | 49 | ||||||
| Commercial |
45,292 | 17,319 | ||||||
|
|
|
|
|
|||||
| Total |
$ | 302,408 | $ | 255,777 | ||||
|
|
|
|
|
|||||
Scheduled contractual principal repayments of loans do not reflect the actual life of such assets. The average life of loans is substantially less than their contractual terms because of prepayments. In addition, due-on-sale clauses on loans generally give the lender the right to declare a loan immediately due and payable in the event, among other things, that the borrower sells the real property subject to the mortgage and the loan is not repaid. The average life of mortgage loans tends to increase when current mortgage loan market rates are substantially higher than rates on existing mortgage loans and, conversely, decrease when current mortgage loan market rates are substantially lower than rates on existing mortgage loans.
Management measures commercial real estate (CRE) concentrations as discussed in Concentrations of Commercial Real Estate Lending, Sound Risk Management Practices issued on December 12, 2006 jointly by the Office of the Comptroller of the Currency (OCC), Board of Governors of the Federal Reserve System (Federal Reserve) and the Federal Deposit Insurance Corporation (FDIC). In this guidance, the agencies make a significant distinction between owner-occupied CRE and non-owner occupied CRE. The agencies have a heightened level of concern with those loans with risk profiles sensitive to the condition of the CRE market.
CRE loans secured by non-farm, non-residential CRE where the primary source of repayment is the cash flow from the ongoing operations and activities conducted by the owner of the property are excluded from the guidance. The Bank has used the FDIC’s call report instructions to calculate that $211.9 million of our loan portfolio, or 211.9% of the Bank’s risk based capital, consists of properties classified as non-owner occupied commercial real estate. Non-owner occupied commercial real estate loans (“NOOCRE”) include all loans secured by multi-family properties, all construction and land development loans and certain other commercial real estate loans identified by regulations as non-owner occupied.
9
At December 31, 2017, 2016 and 2015, the Company’s NOOCRE portfolio consisted of the following:
| 12/31/2017 | 12/31/2016 | 12/31/2015 | ||||||||||
| (Dollars in Thousands) | ||||||||||||
| Manufacturing |
$ | 8,952 | 4,924 | 303 | ||||||||
| Medical |
5,562 | 2,490 | — | |||||||||
| Hotel |
17,281 | 16,364 | 13,083 | |||||||||
| Nursing Home |
3,408 | 1,411 | 550 | |||||||||
| Office Building |
16,105 | 9,205 | 4,233 | |||||||||
| Retail |
60,062 | 43,595 | 31,026 | |||||||||
| Warehouse / Other |
17,990 | 26,263 | 18,200 | |||||||||
|
|
|
|
|
|
|
|||||||
| Total |
$ | 129,360 | 104,252 | 67,395 | ||||||||
|
|
|
|
|
|
|
|||||||
Loan Underwriting Policies. Lending activities are subject to written, non-discriminatory underwriting standards and to loan origination procedures prescribed by the Board of Directors and its management. Detailed loan applications are obtained to determine the ability of borrowers to repay, and the more significant items on these applications are verified through the use of credit reports, financial statements and confirmations. Loan requests exceeding loan officer limits must be approved by the Chief Credit Officer, Chief Executive Officer, Executive Loan Committee of the Board of Directors or the entire Board of Directors.
The Bank offers a residential fixed rate loan program with maturities of 15, 20, and 30 years. The majority of our fixed rate single-family loans are underwritten and closed in accordance with secondary market standards. The Bank originates these loans with intent to sell on the secondary market. However, the Bank may choose to maintain a certain percentage of these loans in our portfolio. The Bank offers both servicing retained and servicing released products in an attempt to meet the needs of our customers. Due to the increasing level of regulatory burden imposed on companies that provide servicing for single family home loans, our pricing strategy provides incentives for the vast majority of our customers to select a servicing released loan product.
The Bank may lend up to 100% of the appraised value of the residential real property securing a mortgage loan. Under its lending policies, the Bank may originate a one-to-four family residential mortgage loan for owner-occupied property with a loan-to-value ratio of up to 95%. In most cases, the Bank requires private mortgage insurance for loan-to-value ratios exceeding 85%. For residential properties that are not owner-occupied, the Bank generally does not lend more than 80% of the appraised value. For all residential mortgage loans, the Bank may increase its lending level on a case-by-case basis.
At December 31, 2017 and December 31, 2016, the Bank held 1-4 family residential mortgages with a loan to value ratio exceeding 90% without private mortgage insurance in the amount of $2.0 million and $2.4 million, respectively. At December 31, 2017, no loans with a loan to value exceeding 90% without private mortgage insurance are past due 30 days or more or in non-accrual status. At December 31, 2016, the Company had approximately $24,000 in loans with a loan to value exceeding 90% without private mortgage insurance past due 30 days or more.
Under applicable law, with certain limited exceptions, loans and extensions of credit outstanding by a commercial bank to a person at one time shall not exceed 15% of the institution’s unimpaired capital and surplus. Loans and extensions of credit fully secured by readily marketable collateral may comprise an additional 10% of unimpaired capital and surplus. Under these limits, the Bank’s loans to one borrower were limited to approximately $15.0 million at December 31, 2017. At that date, the Bank had no lending relationships in excess of the loans-to-one-borrower limit.
10
Non-accrual Loans and Other Problem Assets
The Company’s non-accrual loans to total loan ratio at December 31, 2017 was 0.20%. Loans are placed on a non-accrual status when the loan is past due in excess of 90 days or the collection of principal and interest is doubtful. At December 31, 2017, the Company had $88,000 in loans secured by a single family residence that was past due more than 90 days and still accruing interest. The Company’s total non-performing loan to total loan ratio was 0.21% at December 31, 2017. The following table sets forth information with respect to the Company’s non-performing loans at the dates indicated.
| At December 31, | ||||||||||||||||||||
| 2017 | 2016 | 2015 | 2014 | 2013 | ||||||||||||||||
| (Dollars In Thousands) | ||||||||||||||||||||
| Accruing loans which are contractually past due 90 days or more: |
||||||||||||||||||||
| Residential real estate |
$ | 88 | — | — | — | — | ||||||||||||||
|
|
|
|
|
|
|
|
|
|
|
|||||||||||
| Total |
88 | — | — | — | — | |||||||||||||||
|
|
|
|
|
|
|
|
|
|
|
|||||||||||
| Non-Accrual Loans: |
||||||||||||||||||||
| Residential real estate |
672 | 672 | 2,282 | 1,501 | 948 | |||||||||||||||
| Construction |
— | — | — | — | 175 | |||||||||||||||
| Multi-family |
— | — | 1,968 | 95 | — | |||||||||||||||
| Land |
40 | 7,675 | 1,553 | 215 | 1,218 | |||||||||||||||
| Non-residential real estate |
— | 208 | 247 | 1,159 | 6,546 | |||||||||||||||
| Farmland |
111 | — | 166 | 115 | 703 | |||||||||||||||
| Consumer |
3 | 3 | 8 | — | 13 | |||||||||||||||
| Commercial |
459 | 516 | 1,198 | 90 | 463 | |||||||||||||||
|
|
|
|
|
|
|
|
|
|
|
|||||||||||
| Total non-performing loans |
$ | 1,373 | $ | 9,074 | $ | 7,422 | $ | 3,175 | $ | 10,066 | ||||||||||
|
|
|
|
|
|
|
|
|
|
|
|||||||||||
| Percentage of total loans |
0.21 | % | 1.49 | % | 1.32 | % | 0.58 | % | 1.82 | % | ||||||||||
|
|
|
|
|
|
|
|
|
|
|
|||||||||||
Federal regulations require commercial banks to classify their assets based on credit quality. In determining the classification of an asset, the Company utilizes a Classified Asset Committee consisting of members of senior management, accounting, credit analysis, loan administration, loan review, internal audit and collections. The committee attempts to determine the value of assets that are potentially impaired as well as the accurate reporting of Troubled Debt Restructuring (TDR) assets as defined later in this report. The committee’s function is an important step in management’s determination as to the necessary level of funding required in the Company’s allowance for loan loss account.
An asset is classified as substandard if it is determined to be inadequately protected by the current retained earnings and paying capacity of the obligor or of the collateral pledged, if any and may or may not be paying as agreed. An asset is classified as doubtful if full collection is highly questionable or improbable. An asset is classified as loss if it is considered uncollectible, even if a partial recovery could be expected in the future. The regulations also provide for a special mention designation, described as assets which do not currently expose a savings institution to a sufficient degree of risk to warrant classification but do possess credit deficiencies or potential weaknesses deserving management’s close attention. Such assets designated as special mention may include non-performing loans consistent with the above definition.
Assets classified as substandard or doubtful with balances exceeding $250,000 require the Company to conduct an impairment test to determine if the establishment of a specific reserve against the allowance for loan loss account is necessary. Typically, the basis for a loan impairment test is the current market value of the collateral, discounted to allow for selling and carrying cost. The Company requires a new appraisal for all impairment testing of collateral when the loan balance exceeds $250,000. If the Company determines that a loan relationship is collateral dependent, it will charge off the portion of that loan that is deemed to be impaired. The Company defines collateral dependent as any loan in that the customer will be unable to reduce the principal balance of the loan without the complete or partial sale of the collateral.
11
State and federal examiners may disagree with management’s classifications. If management does not agree with an examiner’s classification of an asset, it may appeal this determination to the appropriate supervisory examiner with the Kentucky Department of Financial Institutions (“KDFI”) and the FDIC. Management regularly reviews its assets to determine whether any assets require classification or re-classification. At December 31, 2017, the Bank had $10.8 million in loans classified as substandard and no loans classified as doubtful. Loans classified as substandard or doubtful by the Bank meet our classification of impaired loans, as defined by ASC 942-310-45-1. At December 31, 2017 and including our most recent examination, there were no material disagreements between examiners and management regarding risk grading or the funding of the allowance for loan loss account.
The tables below provide a summary of loans classified by the Bank as special mention and substandard by loan type for the years ended December 31, 2017 and December 31, 2016. The table also identifies the amount of the Bank’s allowance for loan loss account specifically allocated to individual loans for the specific periods below:
| Special | Specific Allowance | |||||||||||
| December 31, 2017 |
Mention | Substandard | for Impairment | |||||||||
| (Dollars in Thousands) | ||||||||||||
| One-to-four family residential |
$ | — | 572 | — | ||||||||
| Home equity line of credit |
— | 412 | — | |||||||||
| Land |
— | 555 | — | |||||||||
| Non-residential real estate |
979 | 7,072 | 2 | |||||||||
| Farmland |
1,147 | 451 | — | |||||||||
| Consumer |
— | 224 | 54 | |||||||||
| Commercial |
3,572 | 1,474 | 233 | |||||||||
|
|
|
|
|
|
|
|||||||
| Total |
$ | 5,698 | 10,780 | 289 | ||||||||
|
|
|
|
|
|
|
|||||||
| Special | Specific Allowance | |||||||||||
| December 31, 2016 |
Mention | Substandard | for Impairment | |||||||||
| (Dollars in Thousands) | ||||||||||||
| One-to-four family residential |
$ | 744 | 1,253 | — | ||||||||
| Home equity line of credit |
25 | 550 | — | |||||||||
| Junior lien |
30 | 11 | — | |||||||||
| Multi-family |
— | 3,004 | — | |||||||||
| Land |
35 | 8,224 | 1,036 | |||||||||
| Non-residential real estate |
3 | 10,542 | — | |||||||||
| Farmland |
674 | 2,290 | — | |||||||||
| Consumer |
— | 335 | 84 | |||||||||
| Commercial |
603 | 3,130 | 28 | |||||||||
|
|
|
|
|
|
|
|||||||
| Total |
$ | 2,114 | 29,339 | 1,148 | ||||||||
|
|
|
|
|
|
|
|||||||
Troubled Debt Restructuring
A loan customer may experience financial hardship and make request that the Company modify the original terms of their loan agreement. The Company analyzes each request separately and grants loan modifications based on the customer’s ability to eventually repay the loan and return to the original loan terms, the customer’s current loan status and the current and projected future value of the Company’s collateral. Loans that are modified as a result of a customer’s financial distress are classified as TDRs. The classification of a loan as a TDR is important in that it indicates that a particular customer may not be past due but represents a credit weakness due to the Company’s willingness to modify loan terms based on the financial weakness of the borrower.
12
The table below provides a summary of the activity of loans classified as TDR for the year ended December 31, 2017:
| Balance at | New | Loss on | Loan | Balance at | ||||||||||||||||
| December 31, 2016 | TDR | Foreclosure | Amortization | December 31, 2017 | ||||||||||||||||
| (Dollars in Thousands) | ||||||||||||||||||||
| Multi-family real estate |
$ | 815 | — | — | (815 | ) | — | |||||||||||||
| Non-residential real estate |
5,646 | — | — | (2,483 | ) | 3,163 | ||||||||||||||
|
|
|
|
|
|
|
|
|
|
|
|||||||||||
| Total TDR |
$ | 6,461 | — | — | (3,298 | ) | 3,163 | |||||||||||||
|
|
|
|
|
|
|
|
|
|
|
|||||||||||
| The table below provides a summary of the activity of loans classified as TDR for the year ended December 31, 2016:
|
| |||||||||||||||||||
| Balance at | New | Loss on | Loan | Balance at | ||||||||||||||||
| December 31, 2015 | TDR | Foreclosure | Amortization | December 31, 2016 | ||||||||||||||||
| (Dollars in Thousands) | ||||||||||||||||||||
| Multi-family real estate |
— | 816 | — | (1 | ) | 815 | ||||||||||||||
| Non-residential real estate |
$ | 5,536 | 228 | — | (118 | ) | 5,646 | |||||||||||||
|
|
|
|
|
|
|
|
|
|
|
|||||||||||
| Total TDR |
$ | 5,536 | 1,044 | — | (119 | ) | 6,461 | |||||||||||||
|
|
|
|
|
|
|
|
|
|
|
|||||||||||
Real estate acquired by the Company as a result of foreclosure is classified as foreclosed assets until such time as it is sold. When such property is acquired, it is recorded at its fair value less estimated costs of sale. At the time of foreclosure, the collateral is reduced in value to its fair market value less holding and selling expenses and the remaining balance is charged against the allowance for loan losses. The value of foreclosed assets is periodically evaluated to ascertain its current market value. Additional reductions in market value are recognized as an expense through a charge to losses on foreclosures. At December 31, 2017, the Company’s total non-performing asset to total asset ratio was 0.52%. The following table sets forth information with respect to the Bank’s real estate and other assets owned at December 31, 2017, December 31, 2016 and December 31, 2015:
| 2017 | 2016 | 2015 | ||||||||||
| (Dollars in Thousands) | ||||||||||||
| One-to-four family first mortgages |
$ | 169 | 135 | 55 | ||||||||
| Home equity line of credit |
— | 28 | — | |||||||||
| Multi-family |
— | 1,775 | — | |||||||||
| Land |
3,200 | — | 943 | |||||||||
| Non-residential real estate |
— | 459 | 738 | |||||||||
|
|
|
|
|
|
|
|||||||
| Total real estate and other assets owned |
$ | 3,369 | 2,397 | 1,736 | ||||||||
|
|
|
|
|
|
|
|||||||
13
Allowance for Loan Losses. In originating loans, the Company recognizes that credit losses will be experienced and that the risk of loss will vary with, among other things, the type of loan being made, the creditworthiness of the borrower over the term of the loan, general economic conditions and, in the case of a secured loan, the quality of the security for the loan. It is management’s policy to maintain an adequate allowance for loan losses based on, among other things, the Company’s and the industry’s historical loan loss experience, evaluation of economic conditions, regular reviews of delinquencies and loan portfolio quality and evolving standards imposed by federal bank examiners and other regulatory agencies. The Company increases its allowance for loan losses by charging provisions for loan losses against the Company’s income.
Management will continue to actively monitor the Company’s asset quality and allowance for loan losses. Management will charge off loans and properties acquired in settlement of loans against the allowances for loan losses on such loans and such properties when appropriate and will provide specific loss allowances when necessary. Although management believes it uses the best information available to make determinations with respect to the allowances for loan losses and believes such allowances are adequate, future adjustments may be necessary if economic conditions differ substantially from the economic conditions in the assumptions used in making the initial determinations.
The Company’s methodology for establishing the allowance for loan losses takes into consideration probable losses that have been identified in connection with specific assets as well as losses that have not been identified but have occurred in the last twelve quarters. Management conducts regular reviews of the Company’s assets and evaluates the need to establish allowances on the basis of this review. Allowances are established by the Board of Directors on a quarterly basis based on an assessment of risk in the Company’s assets taking into consideration the composition and quality of the portfolio, delinquency trends, current charge-off and loss experience, loan concentrations, the state of the real estate market, regulatory reviews conducted in the regulatory examination process and economic conditions generally.
Specific reserves will be provided for individual assets, or portions of assets, when ultimate collection is considered improbable by management based on the current payment status of the assets and the fair value of the security. At the date of foreclosure or other repossession, the Company would transfer the property to foreclosed assets at the lower of cost or estimated fair value and subsequently at the lower of book value or fair value less estimated selling costs. Any portion of the outstanding loan balance in excess of fair value less estimated selling costs would be charged off against the allowance for loan losses. If, upon ultimate disposition of the property, net sales proceeds exceed the net carrying value of the property, a gain on sale of other real estate would be recorded.
Financial institutions must provide adequate disclosure of the methodology used regarding maintenance of an adequate allowance for loan and lease losses and an effective loan review system. The Company utilizes a combination of its twelve quarter loan loss history and the sum of all impairment testing completed on individually classified loans deemed collateral dependent. The charge off history is weighted using the sum of the year’s digits. This method provides a 15.4% weight to the most recent quarterly losses, then 14.1% for the prior quarter’s losses, 12.8% for the 2nd prior quarter’s losses and 11.5% for the prior quarter’s losses and continuing for twelve quarters.
Using this method, the Company trends for increasing or decreasing levels of charge offs may materially impact the funding level of the allowance for loan loss account. Additionally, the Company reserves the loss amount of any loans deemed to be impaired. The Company also applies certain qualitative factors in reviewing its allowance funding, including local and national delinquency and loss trends, noted concentrations or risk and recent additions to regulatory guidance. Financial institutions regulated by the KDFI and FDIC may require institutions to immediately charge off any portion of a collateral dependent loan that is deemed to be impaired.
14
The following table sets forth an analysis of the Bank’s allowance for loan losses for the years indicated.
| Year Ended December 31, | ||||||||||||||||||||
| 2017 | 2016 | 2015 | 2014 | 2013 | ||||||||||||||||
| (Dollars in thousands) | ||||||||||||||||||||
| Balance at beginning of period |
$ | 6,112 | 5,700 | 6,289 | 8,682 | 10,648 | ||||||||||||||
| Loans charged off: |
||||||||||||||||||||
| Commercial loans |
(2,832 | ) | (1,016 | ) | (1,334 | ) | (501 | ) | (2,802 | ) | ||||||||||
| Consumer loans and overdrafts |
(261 | ) | (422 | ) | (298 | ) | (415 | ) | (649 | ) | ||||||||||
| Residential real estate |
(66 | ) | (30 | ) | (235 | ) | (316 | ) | (993 | ) | ||||||||||
|
|
|
|
|
|
|
|
|
|
|
|||||||||||
| Total charge-offs |
(3,159 | ) | (1,468 | ) | (1,867 | ) | (1,232 | ) | (4,444 | ) | ||||||||||
|
|
|
|
|
|
|
|
|
|
|
|||||||||||
| Recoveries |
1,396 | 639 | 227 | 1,112 | 874 | |||||||||||||||
|
|
|
|
|
|
|
|
|
|
|
|||||||||||
| Net loans charged off |
(1,763 | ) | (829 | ) | (1,640 | ) | (120 | ) | (3,570 | ) | ||||||||||
|
|
|
|
|
|
|
|
|
|
|
|||||||||||
| Provision for loan losses |
477 | 1,241 | 1,051 | (2,273 | ) | 1,604 | ||||||||||||||
|
|
|
|
|
|
|
|
|
|
|
|||||||||||
| Balance at end of period |
$ | 4,826 | 6,112 | 5,700 | 6,289 | 8,682 | ||||||||||||||
|
|
|
|
|
|
|
|
|
|
|
|||||||||||
| Ratio of net charge-offs to average loans outstanding during the period |
0.28 | % | 0.15 | % | 0.29 | % | 0.03 | % | 0.66 | % | ||||||||||
|
|
|
|
|
|
|
|
|
|
|
|||||||||||
The following table sets forth the breakdown of the allowance for loan losses by loan category at the dates indicated. Management believes that the allowance can be allocated by category only on an approximate basis. The allocation of the allowance to each category is not necessarily indicative of future losses and does not restrict the use of the allowance to absorb losses in any category.
| At December 31, | ||||||||||||||||||||||||||||||||
| 2017 | 2016 | 2015 | 2014 | |||||||||||||||||||||||||||||
| Amount | Percent of Allowance in Each Category To Total Allowance |
Amount | Percent of Allowance in Each Category To Total Allowance |
Amount | Percent of Allowance in Each Category To Total Allowance |
Amount | Percent of Allowance in Each Category To Total Allowance |
|||||||||||||||||||||||||
| (Dollars in thousands) | ||||||||||||||||||||||||||||||||
| One-to-four family |
$ | 941 | 19.5 | % | $ | 1,120 | 18.3 | % | $ | 1,239 | 21.7 | % | $ | 1,393 | 22.1 | % | ||||||||||||||||
| Construction |
161 | 3.3 | % | 277 | 4.5 | % | 377 | 6.6 | % | 146 | 2.3 | % | ||||||||||||||||||||
| Multi-family residential |
314 | 6.5 | % | 412 | 6.8 | % | 227 | 4.0 | % | 85 | 1.4 | % | ||||||||||||||||||||
| Non-residential |
2,379 | 49.3 | % | 3,502 | 57.3 | % | 2,876 | 50.5 | % | 3,667 | 58.3 | % | ||||||||||||||||||||
| Other loans |
1,031 | 21.4 | % | 801 | 13.1 | % | 981 | 17.2 | % | 998 | 15.9 | % | ||||||||||||||||||||
|
|
|
|
|
|
|
|
|
|
|
|
|
|
|
|
|
|||||||||||||||||
| Total allowance for loan losses |
$ | 4,826 | 100.0 | % | $ | 6,112 | 100.0 | % | $ | 5,700 | 100.0 | % | $ | 6,289 | 100.0 | % | ||||||||||||||||
|
|
|
|
|
|
|
|
|
|
|
|
|
|
|
|
|
|||||||||||||||||
| At December 31, 2013 | ||||||||
| Amount | Percent of Allowance In Each Category To Total Allowance |
|||||||
| (Dollars In Thousands) | ||||||||
| One-to-four family |
$ | 2,305 | 26.5 | % | ||||
| Construction |
88 | 1.0 | % | |||||
| Multi-family residential |
466 | 5.4 | % | |||||
| Non-residential |
4,534 | 52.2 | % | |||||
| Other consumer loans |
1,289 | 14.9 | % | |||||
|
|
|
|
|
|||||
| Total allowance for loan losses |
$ | 8,682 | 100.0 | % | ||||
|
|
|
|
|
|||||
15
Investment Securities
The Company purchases investments in order to maintain the levels of liquid assets required by regulatory authorities and manage cash flow, diversify its assets, obtain yield and to satisfy certain requirements for favorable tax treatment. The principal objective of the investment policy is to earn as high a rate of return as possible while giving consideration to financial risk, credit risk, liquidity risk and interest rate risk. The investment activities of the Company consist primarily of investments in U.S. Government agency securities, municipal and corporate bonds, CMOs (see definition below), and mortgage-backed securities. Typical investments include federally sponsored agency mortgage pass-through and federally sponsored agency and mortgage-related securities. Investment and aggregate investment limitations and credit quality parameters of each class of investment are prescribed in the Company’s investment policy.
The Company purchases U.S. government agency securities for terms fifteen years or less. Securities may or may not have call options. At December 31, 2017, the Company’s agency security portfolio consisted of the following:
| Book | Market | |||||||
| Value | Value | |||||||
| (Dollars in Thousands) | ||||||||
| Small Business Administration: |
||||||||
| Fixed rate bonds |
53,046 | 53,257 | ||||||
| Floating rate pools |
4,356 | 4,321 | ||||||
| United State Agency Bonds: |
||||||||
| Non-Callable |
19,061 | 18,871 | ||||||
| Callable |
7,747 | 7,644 | ||||||
|
|
|
|
|
|||||
| Total Agency Bonds |
84,210 | 84,093 | ||||||
|
|
|
|
|
|||||
Small Business Administration (“SBA”) fixed rates notes have a maturity of either ten or twenty years and may pay interest either monthly or semi-annually with principal typically paid semi-annually. SBA fixed rate notes typically finance commercial real estate and have a ten year prepayment penalty. SBA pools are floating rate securities are typically indexed to either the prime rate or LIBOR and have final maturities of ten, twenty-five or thirty years and pay principal and interest monthly. The interest rates on SBA pools reset quarterly or monthly, providing the Company with lower price volatility as compared to fixed rate securities. The purchase of variable rate securities with low price volatility provides the Company with a source of lower risk liquidity should loan demand improve or interest rates increase. The risk in purchasing SBA Pools is that they are typically purchased at large premiums and therefore carry a greater than higher level of prepayment risk while providing lower yields as compared to many long term fixed rate investment products.
At December 31, 2017, the Company has $27.0 million in tax free municipal bonds and $1.3 million in taxable municipal bonds. The Company’s investment policy limits the Company’s total municipal bond portfolio to 125% of the Bank’s Tier 1 Capital, places a concentration limit on the amounts of municipal bonds per issuer and limits concentrations in the amounts a single state guarantee program can provide to a bond at 75% of Tier 1 Capital. At December 31, 2017, the Company is in compliance with its concentration policy.
Mortgage-backed securities (“MBS”) entitle the Company to receive a pro-rata portion of the cash flow from an identified pool of single family mortgages. A Collateralized Mortgage Obligation (“CMO”) is a pool of single family loans in which the interest and principal cash flows may be structured so that certain classes of ownership receive principal payments in a manner other than a pro-rata basis. Collateralized mortgage-backed securities (“CMBS”) held by the Company are securities collateralized by either a pool or a single multi-family property. The Company has one asset backed security issued by the U.S. Student Loan Marketing Association (“SLMA”).
16
The asset backed security issued by SLMA has a 97% full faith and credit guarantee by the agency has a par value of $3.9 million. The SLMA bond is floating rate security tied to the one month LIBOR rate and re-prices on a monthly basis. At December 31, 2017 and December 31, 2016, the Company owned one mortgage back security with a book and market value of $22,000 and $91,000, respectively, that were not issued by an agency of the U.S. Government. All remaining securities owned by the Company labeled as MBS, CMO or CMBS were issued by a U.S. Government Agency.
At December 31, 2017, the Company’s mortgage backed security portfolio consisted of the following:
| Book | Market | |||||||
| Value | Value | |||||||
| (Dollars in Thousands) | ||||||||
| CMO - whole loan |
23 | 23 | ||||||
| CMO - fixed rate |
3,784 | 3,783 | ||||||
| CMBS - fixed rate |
4,179 | 4,142 | ||||||
| MBS - fixed rate |
59,653 | 59,201 | ||||||
| Asset backed securities |
3,750 | 3,615 | ||||||
|
|
|
|
|
|||||
| Total mortgage backed securities |
71,389 | 70,764 | ||||||
|
|
|
|
|
|||||
In June of 2008, the Company purchased $2.0 million par value of a private placement subordinated debenture issued by First Financial Services Corporation (“FFKY”), the holding company for First Federal Savings Bank (“First Fed”). The debenture is a thirty year security with a coupon rate of 8.00%. FFKY was a NASDAQ listed commercial bank holding company located in Elizabethtown, Kentucky. In October of 2010, FFKY informed the owners of its subordinated trust, including the Company, that it would defer future dividend payments for up to five years as prescribed by the trust. FFKY had significant asset quality issues that have resulted in negative earnings beginning in 2009. In 2013, the Company recognized a $400,000 other-than-temporary impairment loss on the subordinated debenture issued by FFKY. The recognition of a loss was the result of the Company’s analysis that, despite slowly improving its financial condition, FFKY was not likely to resume dividend payments prior to the end of the five year interest rate extension period.
On January 1, 2015, FFKY was sold and merged into Community Bank Shares of Indiana, (“CBIN”). On January 12, 2015, the Company was notified by Wilmington Trust that its investment in First Federal Statutory Trust III, (“FFKY Trust”), had elected to terminate the extension period of interest payments effective January 1, 2015. All accrued interest due and payable to all owners of securities through March 15, 2015 was paid to the Trustee in January 2015. On January 21, 2015, the Company determined that FFKY Trust is no longer impaired and has placed the investment back into accrual status. On July 1, 2015, CBIN changed its NASDAQ ticker symbol to YCB. In September of 2016, YCB was sold and merged into Wesbanco of West Virginia (‘WSBC”). WSBC has approximately $9.9 billion in assets. WSBC is well capitalized, highly profitable and appears to maintain strong asset quality. At December 31, 2017, interest payments on this security are current.
Deposit Activities
Deposits are the primary source of the Company’s funds for lending, investment activities and general operational purposes. In addition to deposits, the Company derives funds from loan principal and interest repayments, maturities of investment securities and mortgage-backed securities and interest payments thereon. Although scheduled loan repayments are a relatively stable source of funds, deposit inflows and outflows are influenced by general interest rates, and money market conditions and business cycles. Borrowings may be used on a short-term basis to compensate for reductions in the availability of funds, or on a long-term basis for general corporate purposes. The Company has access to borrow from the FHLB. The Company relies upon retail deposits rather than borrowings as its primary source of funding.
The Company attracts deposits principally from within its market area by offering competitive rates on its deposit instruments, including money market accounts, passbook savings accounts, individual retirement accounts, and certificates of deposit which range in maturity from three months to five years. The Company reviews its deposit mix and pricing on a weekly basis. In determining the characteristics of its deposit accounts, the Company considers the rates offered by competing institutions, lending and liquidity requirements, growth goals and federal regulations.
17
At December 31, 2017, the Company had $60.1 million in brokered deposits, or 8.0% of total deposits compared to $33.4 million at December 31, 2016. The Company utilizes brokered deposits to fill in maturity gaps in an effort to balance the amount of time deposits maturing in any one period and as an alternative source of funding. All brokered deposits are FDIC insured.
The Company attempts to compete for deposits with other institutions in its market area by offering competitively priced deposit instruments that meet the needs of its customers. Additionally, the Company seeks to meet customers’ needs by providing convenient customer service to the community. With the exception of brokered deposits, substantially all of the Company’s depositors are Kentucky or Tennessee residents who reside in the Company’s market area. At December 31, 2017, the Company had deposit programs and balances as described below:
| Interest Rate* |
Minimum Term |
Category |
Minimum Amount |
Balance | Percentage of Total Deposits |
|||||||||||
| (In Thousands) | ||||||||||||||||
| — % |
None | Non-interest bearing | $ | 100 | $ | 136,197 | 18.1 | % | ||||||||
| 0.05% |
None | Interest checking accounts | 1,500 | 208,496 | 27.7 | % | ||||||||||
| 0.10% |
None | Savings and money market | 10 | 104,347 | 13.8 | % | ||||||||||
|
|
|
|
|
|||||||||||||
| 449,040 | 59.6 | % | ||||||||||||||
| Certificates of Deposit |
||||||||||||||||
| 0.30% |
3 months or less | Fixed-term, fixed rate | 1,000 | 60,662 | 8.0 | % | ||||||||||
| 0.49% |
3 to 12 months | Fixed-term, fixed-rate | 1,000 | 130,293 | 17.3 | % | ||||||||||
| 1.20% |
12 to 24-months | Fixed-term, fixed-rate | 1,000 | 68,714 | 9.1 | % | ||||||||||
| 1.50% |
24 to 36-months | Fixed-term, fixed-rate | 1,000 | 30,079 | 4.0 | % | ||||||||||
| 0.95% |
36 to 48-months | Fixed-term, fixed-rate | 1,000 | 10,649 | 1.4 | % | ||||||||||
| 1.54% |
48 to 60-months | Fixed-term, fixed rate | 1,000 | 4,572 | 0.6 | % | ||||||||||
|
|
|
|
|
|||||||||||||
| 304,969 | 40.5 | % | ||||||||||||||
|
|
|
|
|
|||||||||||||
| $ | 754,009 | 100.0 | % | |||||||||||||
|
|
|
|
|
|||||||||||||
| * | Represents current interest rate offered by the Bank. |
At December 31, 2017, certificates of deposits included approximately $176.8 million of deposits greater than $100,000, as compared to $157.0 million and $169.3 million at December 31, 2016 and December 31, 2015, respectively. Certificates of deposit at December 31, 2017 included approximately $97.8 million of deposits with balances of $250,000 or more compared to $79.7 million and $78.8 million at December 31, 2016 and December 31, 2015, respectively. Such time deposits may be risky because their continued presence in the Company is dependent partially upon the rates paid by the Company rather than any customer relationship and, therefore, may be withdrawn upon maturity if another institution offers higher interest rates. At this time, the Company does not believe that it will need to pay above market rates to maintain such certificates of deposit, but anticipates higher interest rates in the future.
The following table indicates the amount of the Company’s certificates of deposit of $250,000 or more by time remaining until maturity as of December 31, 2017.
| Maturity Period |
Certificates of Deposit | |||
| (Dollars in Thousands) | ||||
| Three months or less |
$ | 25,893 | ||
| Over three through six months |
17,934 | |||
| Over six through 12 months |
26,878 | |||
| Over 12 months |
27,139 | |||
|
|
|
|||
| Total |
$ | 97,844 | ||
|
|
|
|||
18
The following table sets forth the change in dollar amount of deposits in the various types of accounts offered by the Company between the dates indicated.
| Balance at December 31, 2017 |
% of Deposits |
Increase (Decrease) from December 31, 2016 |
Balance at December 31, 2016 |
% of Deposits |
Increase (Decrease) from December 31, 2015 |
|||||||||||||||||||
| (Dollars in Thousands) | ||||||||||||||||||||||||
| Non-interest bearing |
$ | 136,197 | 18.1 | % | 5,052 | $ | 131,145 | 17.9 | % | 6,075 | ||||||||||||||
| Interest checking |
208,496 | 27.7 | % | (851 | ) | 209,347 | 28.6 | % | 5,568 | |||||||||||||||
| Savings and MMDA |
104,347 | 13.8 | % | 5,035 | 99,312 | 13.5 | % | 3,419 | ||||||||||||||||
| Time deposits |
304,969 | 40.4 | % | 11,891 | 293,078 | 40.0 | % | (21,586 | ) | |||||||||||||||
|
|
|
|
|
|
|
|
|
|
|
|
|
|||||||||||||
| Total |
$ | 754,009 | 100.0 | % | 21,127 | $ | 732,882 | 100.0 | % | (6,524 | ) | |||||||||||||
|
|
|
|
|
|
|
|
|
|
|
|
|
|||||||||||||
| Balance at December 31, 2015 |
% of Deposits |
Increase (Decrease) from December 31, 2014 |
Balance at December 31, 2014 |
% of Deposits |
||||||||||||||||
| (Dollars in Thousands) | ||||||||||||||||||||
| Non-interest bearing |
125,070 | 16.9 | % | 10,019 | 115,051 | 15.7 | % | |||||||||||||
| Interest checking |
203,779 | 27.5 | % | 17,163 | 186,616 | 25.5 | % | |||||||||||||
| Savings and MMDA |
95,893 | 13.0 | % | (1,833 | ) | 97,726 | 13.4 | % | ||||||||||||
| Time deposits |
314,664 | 42.6 | % | (17,251 | ) | 331,915 | 45.4 | % | ||||||||||||
|
|
|
|
|
|
|
|
|
|
|
|||||||||||
| Total |
739,406 | 100.0 | % | 8,098 | 731,308 | 100.0 | % | |||||||||||||
|
|
|
|
|
|
|
|
|
|
|
|||||||||||
The following table sets forth the time deposits in the Company classified by rates at the dates indicated.
| At December 31, | ||||||||||||
| 2017 | 2016 | 2015 | ||||||||||
| (Dollars in Thousands) | ||||||||||||
| 0.01 - 2.00% |
$ | 303,895 | 291,516 | 251,085 | ||||||||
| 2.01 - 4.00% |
1,074 | 1,562 | 63,579 | |||||||||
| 4.01 - 6.00% |
— | — | — | |||||||||
|
|
|
|
|
|
|
|||||||
| Total |
$ | 304,969 | 293,078 | 314,664 | ||||||||
|
|
|
|
|
|
|
|||||||
The following table sets forth the amount and maturities of time deposits at December 31, 2017.
| Amount Due | ||||||||||||||||||||
| Less Than One Year | 1-2 Years | 2-3 Years | After 3 Years | Total | ||||||||||||||||
| (Dollars in Thousands) | ||||||||||||||||||||
| 0.00 - 2.00% |
$ | 190,955 | 68,714 | 30,032 | 14,194 | 303,895 | ||||||||||||||
| 2.01 - 4.00% |
— | — | 47 | 1,027 | 1,074 | |||||||||||||||
| 4.01 - 6.00% |
— | — | — | — | — | |||||||||||||||
|
|
|
|
|
|
|
|
|
|
|
|||||||||||
| Total |
$ | 190,955 | 68,714 | 30,079 | 15,221 | 304,969 | ||||||||||||||
|
|
|
|
|
|
|
|
|
|
|
|||||||||||
19
Quantitative and Qualitative Disclosure about Market Risk
Quantitative Aspects of Market Risk. The principal market risk affecting the Company is risk associated with interest rate volatility (interest rate risk). The Company does not maintain a trading account for investment securities. The Company is not subject to foreign currency exchange rate risk or commodity price risk. Substantially all of the Company’s interest rate risk results from the Company’s lending, deposit taking, and investment activities. This risk could result in reduced net income, loss in fair values of assets and/or increases in fair values of liabilities due to changes in interest rates.
Qualitative Aspects of Market Risk. The Company’s principal financial objective is to achieve long-term profitability while reducing its exposure to fluctuating market interest rates. The Company has sought to reduce the exposure of its earnings to changes in market interest rates by attempting to manage the mismatch between assets and liabilities maturities and interest rates. The principal element in achieving this objective is to increase the interest rate sensitivity of the Company’s interest-earning assets by retaining adjustable rate loans in our portfolio. The Company relies on retail deposits as its primary source of funds. However, management is utilizing brokered deposits, wholesale repurchase agreements and FHLB borrowings as sources of liquidity. As part of its interest rate risk management strategy, the Company promotes demand accounts, overnight repurchase agreements and certificates of deposit with primarily terms of up to five years.
Impact of Inflation and Changing Prices
The consolidated financial statements and notes thereto presented herein have been prepared in accordance with accounting principles generally accepted in the United States of America, which require the measurement of financial position and operating results in terms of historical dollars without considering the change in the relative purchasing power of money over time and due to inflation. The impact of inflation is reflected in the increased cost of the Company’s operations.
Unlike most industrial companies, nearly all the assets and liabilities of the Company are monetary in nature. As a result, changes in interest rates have a greater impact on the Company’s performance than do the effects of general levels of inflation. Interest rates do not necessarily move in the same direction or to the same extent as the price of goods and services.
Key components of a successful asset/liability strategy are the monitoring and managing of interest rate sensitivity of both the interest-earning asset and interest-bearing liability portfolios. The Company has employed various strategies intended to minimize the adverse effect of interest rate risk on future operations by providing a better match between the interest rate sensitivity between its assets and liabilities. In particular, the Company’s strategies attempt to stabilize net interest income for the long-term by protecting its interest rate spread against increases in interest rates.
Such strategies include the origination of adjustable-rate mortgage loans secured by one-to-four family residential real estate, and, to a lesser extent, multi-family real estate loans and the origination of other loans with interest rates that are more sensitive to adjustment based upon market conditions than long-term, fixed-rate residential mortgage loans. At December 31, 2017, approximately $113.5 million of the $200.4 million of one-to-four family residential loans originated by the Company (comprising 66.0% of such loans) had adjustable rates or will mature within one year.
Asset / Liability Management
Interest Rate Sensitivity Analysis
The Company’s profitability is affected by fluctuations in interest rates. A sudden and substantial increase or decrease in interest rates may adversely impact the Company’s earnings to the extent that the interest rates on interest earning assets and interest bearing liabilities do not change at the same speed, to the same extent or on the same basis. As part of its effort to manage interest rate risk, the Company monitors its net economic value of capital (“EVE”) by using our asset liability software to assist in modeling how changes in interest rates affect the values of various assets and liabilities on the Company’s balance sheet. By calculating our EVE, the Company is able to construct models that show the effect of different interest rate changes on its total capital. This risk analysis is a key tool that allows Company to prepare against constantly changing interest rates.
20
Generally, EVE is a cash flow calculation that takes the present value of all asset cash flows and subtracts the present value of all liability cash flows. The application of the methodology attempts to quantify interest rate risk as the change in the EVE, which would result from a theoretical 200 basis point (1 basis point equals .01%) change in market rates. Both a 300 basis point increase in market interest rates and a 100 basis point decrease in market interest rates are considered.
The following table presents the Company’s EVE at December 31, 2017 as calculated by the Company’s asset liability model for the year period ending December 31, 2017:
| Change | Net Portfolio Value | |||||||||||
| In Rates |
$ Amount | $ Change | % Change | |||||||||
| (Dollars in Thousands) | ||||||||||||
| +300 bp |
$ | 77,222 | ($ | 18,080 | ) | (19.0 | %) | |||||
| +200 bp |
83,601 | (11,701 | ) | (12.3 | %) | |||||||
| +100 bp |
90,601 | (4,701 | ) | (4.9 | %) | |||||||
| 0 bp |
95,302 | — | — | |||||||||
| -100 bp |
100,234 | 4,933 | 5.2 | % | ||||||||
Interest Rate Risk Measures: 200 Basis Point (bp) Rate Shock
| Tangible Common Equity Ratio at December 31, 2017 |
9.6 | % | ||
| Pre-Shock Tier 1 Capital Ratio at December 31, 2017 |
10.6 | % | ||
| Exposure Measure: 2% Increase in Rates |
9.3 | % |
The computation of prospective effects of hypothetical interest rate changes are based on numerous assumptions, including relative levels of market interest rates, loan prepayments and deposit decay rates, and should not be relied upon as indicative of actual results. The computations do not contemplate any actions the Company could undertake in response to changes in interest rates. The matching of assets and liabilities may be analyzed by examining the extent to which such assets and liabilities are “interest rate sensitive” and by monitoring an institution’s interest rate sensitivity “gap.” An asset or liability is said to be interest rate sensitive within a specific period if it will mature or re-price within that period.
Interest Income Analysis
As a part of the Company’s asset liability management process, an emphasis is placed on the effect that changes in interest rates have on the net interest income of the Company and the resulting change in the net present value of capital. As a part of its analysis, the Company uses third party software and analytical tools derived from the Company’s regulatory reporting models to analyze the re-pricing characteristics of both assets and liabilities and the resulting net present value of the Company’s capital given various changes in interest rates. The model also uses mortgage prepayment assumptions obtained from third party vendors to anticipate prepayment speeds on both loans and investments.
The Company’s model uses incremental changes in interest rates. For example, a 3.0% change in annual rates includes a 75 basis point change in each of the next four quarters. The Company’s analysis at December 31, 2017 indicates that changes in interest rates are likely to result in modest changes in the Company’s annual net interest income. A summary of the Company’s analysis at December 31, 2017 for the year ending December 31, 2018 is as follows:
| Down 1.00% |
No Change |
Up 1.00% | Up 2.00% | Up 3.00% | ||||||||||||||||
| (Dollars in Thousands) | ||||||||||||||||||||
| Net interest income |
$ | 27,479 | $ | 28,939 | $ | 30,036 | $ | 30,884 | $ | 31,611 | ||||||||||
21
Average Balance, Interest and Average Yields and Rates
The following table sets forth certain information relating to the Company’s average interest-earning assets and average interest-bearing liabilities and reflects the average yield on assets and average cost of liabilities for the periods and at the date indicated. Such yields and costs are derived by dividing income or expense by the average monthly balance of assets or liabilities, respectively, for the periods presented. Average balances are derived from month-end balances. Management does not believe that the use of month-end balances instead of daily balances has caused any material difference in the information presented.
| Years Ended December 31, | ||||||||||||||||||||||||||||||||||||
| 2017 | 2016 | 2015 | ||||||||||||||||||||||||||||||||||
| Average Balance |
Interest | Average Yield/ Cost |
Average Balance |
Interest | Average Yield/ Cost |
Average Balance |
Interest | Average Yield/ Cost |
||||||||||||||||||||||||||||
| (Dollars in Thousands) | ||||||||||||||||||||||||||||||||||||
| Interest-earning assets: |
||||||||||||||||||||||||||||||||||||
| Loans receivable, net (a) |
$ | 626,735 | 28,222 | 4.50 | % | $ | 570,674 | 25,801 | 4.52 | % | $ | 552,265 | 25,322 | 4.59 | % | |||||||||||||||||||||
| Taxable securities AFS |
173,062 | 4,478 | 2.59 | % | 190,843 | 4,595 | 2.41 | % | 203,160 | 6,149 | 3.03 | % | ||||||||||||||||||||||||
| Non-taxable securities AFS |
30,787 | 1,516 | 4.93 | % | 38,981 | 1,958 | 5.02 | % | 52,836 | 2,464 | 4.66 | % | ||||||||||||||||||||||||
| Other interest-bearing deposits |
6,976 | 96 | 1.38 | % | 7,512 | 46 | 0.61 | % | 8,528 | 22 | 0.26 | % | ||||||||||||||||||||||||
|
|
|
|
|
|
|
|
|
|
|
|
|
|
|
|
|
|
|
|||||||||||||||||||
| Total interest-earning assets |
$ | 837,560 | 34,312 | 4.10 | % | $ | 808,010 | 32,400 | 4.01 | % | $ | 816,789 | 33,957 | 4.16 | % | |||||||||||||||||||||
|
|
|
|
|
|
|
|
|
|
|
|
|
|||||||||||||||||||||||||
| Non-interest-earning assets |
69,004 | 72,407 | 75,032 | |||||||||||||||||||||||||||||||||
|
|
|
|
|
|
|
|||||||||||||||||||||||||||||||
| Total assets |
$ | 906,564 | $ | 880,417 | $ | 891,821 | ||||||||||||||||||||||||||||||
|
|
|
|
|
|
|
|||||||||||||||||||||||||||||||
| Interest-bearing liabilities: |
||||||||||||||||||||||||||||||||||||
| Deposits |
$ | 619,372 | 4,810 | 0.78 | % | $ | 596,109 | 4,240 | 0.71 | % | $ | 612,816 | 5,031 | 0.82 | % | |||||||||||||||||||||
| Borrowings |
67,924 | 1,153 | 1.70 | % | 66,280 | 1,059 | 1.60 | % | 71,084 | 1,519 | 2.14 | % | ||||||||||||||||||||||||
|
|
|
|
|
|
|
|
|
|
|
|
|
|
|
|
|
|
|
|||||||||||||||||||
| Total interest-bearing liabilities |
687,296 | 5,963 | 0.87 | % | 662,389 | 5,299 | 0.80 | % | 683,900 | 6,550 | 0.96 | % | ||||||||||||||||||||||||
|
|
|
|
|
|
|
|
|
|
|
|
|
|||||||||||||||||||||||||
| Non-interest-bearing liabilities |
131,832 | 128,983 | 117,215 | |||||||||||||||||||||||||||||||||
|
|
|
|
|
|
|
|||||||||||||||||||||||||||||||
| Total liabilities |
819,128 | 791,372 | 801,115 | |||||||||||||||||||||||||||||||||
| Common stock |
80 | 79 | 79 | |||||||||||||||||||||||||||||||||
| Additional paid-in capital |
58,742 | 58,630 | 58,544 | |||||||||||||||||||||||||||||||||
| Retained earnings |
50,615 | 48,678 | 46,305 | |||||||||||||||||||||||||||||||||
| Treasury stock |
(16,001 | ) | (14,409 | ) | (11,449 | ) | ||||||||||||||||||||||||||||||
| Unearned ESOP shares |
(6,225 | ) | (6,864 | ) | (5,709 | ) | ||||||||||||||||||||||||||||||
| Accumulated other comprehensive income |
225 | 2,931 | 2,936 | |||||||||||||||||||||||||||||||||
|
|
|
|
|
|
|
|||||||||||||||||||||||||||||||
| Total liabilities and equity |
$ | 906,564 | $ | 880,417 | $ | 891,821 | ||||||||||||||||||||||||||||||
|
|
|
|
|
|
|
|||||||||||||||||||||||||||||||
| Net interest income |
28,349 | 27,101 | 27,407 | |||||||||||||||||||||||||||||||||
|
|
|
|
|
|
|
|||||||||||||||||||||||||||||||
| Interest rate spread |
3.23 | % | 3.21 | % | 3.20 | % | ||||||||||||||||||||||||||||||
|
|
|
|
|
|
|
|||||||||||||||||||||||||||||||
| Net interest margin |
3.38 | % | 3.35 | % | 3.36 | % | ||||||||||||||||||||||||||||||
|
|
|
|
|
|
|
|||||||||||||||||||||||||||||||
| Ratio of average interest-earning assets to average interest-bearing liabilities |
121.86 | % | 121.98 | % | 119.43 | % | ||||||||||||||||||||||||||||||
|
|
|
|
|
|
|
|||||||||||||||||||||||||||||||
| (a) | Average loans include non-performing loans. |
| (b) | Interest income and yields are presented on a fully tax equivalent basis. |
22
Rate Volume Analysis
The following table sets forth certain information regarding changes in interest income and interest expense of the Company for the periods indicated. For each category of interest-earning asset and interest-bearing liability, information is provided on changes attributable to: (i) changes in volume (changes in volume from year to year multiplied by the average rate for the prior year) and (ii) changes in rate (changes in the average rate from year to year multiplied by the prior year’s volume). All amounts are quoted on a tax equivalent basis using a cost of funds rate of 0.87% for 2017 and 0.80% for 2016.
| Year Ended December 31, | ||||||||||||||||||||||||
| 2017 vs. 2016 | 2016 vs. 2017 | |||||||||||||||||||||||
| Increase (Decrease) due to |
Increase (Decrease) due to |
|||||||||||||||||||||||
| Rate | Volume | Total Increase (Decrease) |
Rate | Volume | Total Increase (Decrease) |
|||||||||||||||||||
| (Dollars in Thousands) | ||||||||||||||||||||||||
| Interest-earning assets: |
||||||||||||||||||||||||
| Loans receivable |
$ | (103 | ) | 2,524 | 2,421 | $ | (353 | ) | 832 | 479 | ||||||||||||||
| Securities available for sale, taxable |
343 | (460 | ) | (117 | ) | (1,257 | ) | (297 | ) | (1,554 | ) | |||||||||||||
| Securities available for sale, non-taxable |
(38 | ) | (404 | ) | (442 | ) | 190 | (696 | ) | (506 | ) | |||||||||||||
| Other interest- earning assets |
57 | (7 | ) | 50 | 30 | (6 | ) | 24 | ||||||||||||||||
|
|
|
|
|
|
|
|
|
|
|
|
|
|||||||||||||
| Total interest-earning assets |
259 | 1,653 | 1,912 | (1,390 | ) | (167 | ) | (1,557 | ) | |||||||||||||||
|
|
|
|
|
|
|
|
|
|
|
|
|
|||||||||||||
| Interest-bearing liabilities: |
||||||||||||||||||||||||
| Deposits |
353 | 217 | 570 | (592 | ) | (199 | ) | (791 | ) | |||||||||||||||
| Borrowings |
69 | 25 | 94 | (397 | ) | (63 | ) | (460 | ) | |||||||||||||||
|
|
|
|
|
|
|
|
|
|
|
|
|
|||||||||||||
| Total interest-bearing liabilities |
422 | 242 | 664 | (989 | ) | (262 | ) | (1,251 | ) | |||||||||||||||
|
|
|
|
|
|
|
|
|
|
|
|
|
|||||||||||||
| Increase (decrease) in net interest income |
$ | (163 | ) | 1,411 | 1,248 | $ | (401 | ) | 95 | (306 | ) | |||||||||||||
|
|
|
|
|
|
|
|
|
|
|
|
|
|||||||||||||
Critical Accounting Policies and Estimates
The Company’s consolidated financial statements are prepared in accordance with accounting principles generally accepted in the United States of America (“U.S. GAAP”). The financial information contained within these statements is, to a significant extent, financial information that is based on appropriate measures of the financial effects of transactions and events that have already occurred. Based on its consideration of accounting policies that involved the most complex and subjective decisions and assessments, management has identified its most critical accounting policy to be that related to the allowance for loan losses. The Company’s allowance for loan loss methodology incorporates a variety of risk considerations, both quantitative and qualitative; in establishing an allowance for loan loss that management believes is appropriate at each reporting date. Quantitative factors included the Company’s historical loss experience, delinquency and charge-off trends, collateral values, changes in non-performing loans, and other factors. Quantitative factors also incorporate known information about individual loans, including borrower’s sensitivity to economic conditions throughout the southeast and particular, the state of certain industries. Size and complexity of individual credits in relation to loan structure, existing loan policies and pace of portfolio growth are other qualitative factors that are considered in the methodology.
As the Company adds new products and increases the complexity of the loan portfolio, its methodology accordingly may change. In addition, it may report materially different amounts for the provision for loan losses in the statement of operations if management’s assessment of the above factors changes in future periods. This discussion and analysis should be read in conjunction with the Company’s consolidated financial statements and the accompanying notes presented elsewhere herein. Although management believes the levels of the allowance for loan losses as of both December 31, 2017 and December 31, 2016 were adequate to absorb inherent losses in the loan portfolio, a decline in local economic conditions, or other factors, could result in increasing losses that cannot be reasonably predicted at this time. The Company also considers its policy on non-accrual loans as a critical accounting policy.
23
Liquidity and Capital Resources
The Company’s primary business is that of the Bank. Management believes dividends that may be paid from the Bank to the Company will provide sufficient funds for the Company’s current and anticipated needs; however, no assurance can be given that the Company will not have a need for additional funds in the future. The Bank is subject to certain regulatory limitations with respect to the payment of dividends to the Company.
Capital Resources. At December 31, 2017, the Bank and Corporation exceeded all regulatory minimum capital requirements. For a detailed discussion of the Kentucky Department of Financial Institutions (“KDFI”) and FDIC capital requirements, and for a tabular presentation of the Bank’s compliance with such requirements, see Note 15 of Notes to Consolidated Financial Statements. See the Company’s Risk Factors, located in our Annual Report filed on SEC form 10-K as of and for the year ended December 31, 2017 for comments related to effects that the implementation of Basel III will have on the Company’s future operations.
Liquidity. Liquidity management is both a daily and long-term function of business management. If the Bank requires funds beyond its ability to generate them internally, the Bank believes that it could borrow funds from the FHLB. At December 31, 2017, the Bank had outstanding advances of $23.0 million from the FHLB and $47.6 million of letters of credit issued by the FHLB to secure municipal deposits. The Bank can immediately borrow an additional $49.1 million from the FHLB and the Company has the ability to pledge another $9.9 million in securities to the FHLB for additional borrowing capacity. The Bank can immediately borrow $12.0 million from its correspondent bank. See Note 6 of Notes to Consolidated Financial Statements.
Subordinated Debentures Issuance. On September 25, 2003, the Company issued $10,310,000 of subordinated debentures in a private placement offering. The securities have a thirty-year maturity and are callable at the issuer’s discretion on a quarterly basis beginning five years after issuance. The securities are priced at a variable rate equal to the three-month LIBOR (London Interbank Offering Rate) plus 3.10%. Interest is paid and the rate of interest may change on a quarterly basis. The Company’s subsidiary, a state chartered commercial bank supervised by the KDFI and the FDIC may recognize the proceeds of trust preferred securities as capital. KDFI and FDIC regulations provide that 25% of Tier I capital may consist of trust preferred proceeds. See Note 9 of Notes to Consolidated Financial Statements.
The Bank’s primary sources of funds consist of deposits, repayment of loans and mortgage-backed securities, maturities of investments and interest-bearing deposits, and funds provided from operations. While scheduled repayments of loans and mortgage-backed securities and maturities of investment securities are predictable sources of funds, deposit flows and loan prepayments are greatly influenced by the general level of interest rates, economic conditions and competition. The Bank uses its liquidity resources principally to fund existing and future loan commitments, to fund maturing certificates of deposit and demand deposit withdrawals, to invest in other interest-earning assets, to maintain liquidity, and to meet operating expenses.
Management believes that loan repayments and other sources of funds will be adequate to meet the Bank’s liquidity needs for the immediate future. A portion of the Bank’s liquidity consists of cash and cash equivalents. At December 31, 2017, cash and cash equivalents totaled $45.1 million. The level of these assets depends upon the Bank’s operating, investing and financing activities during any given period.
Summary of the Company’s Market Area
Western Kentucky
Small manufacturing and agri-business interests are the largest drivers of the local economy in our Western Kentucky markets. In Western Kentucky, small manufacturing typically revolves around the automotive, transportation, and chemical industries. The manufacturing sector is reasonably strong in the immediate area with most factories operating near capacity. Unemployment rates are low in many counties in Western Kentucky due largely to the rebound in automobile sales.
In 2016, local farmers enjoyed strong yields on their crops. However, the continued weak level of commodity prices has made it difficult for all those involved in the agri-business sector. Agri-business profitability remains marginal at best. In 2017, the agri-business community anticipates the operating conditions will remain challenging without a meaningful increase in commodity prices, which are projected to remain weak into 2018.
24
The tables below are a summary of selected information from the 2010 U.S. Census related to the Company’s current market areas. The source of our future growth projections was the 2011 Kentucky State Data Center at the University of Louisville:
| 2010 Median | Median Values | |||||||||||||||||||||||
| Household | Owner Occupied | 2010 | 2020 | 2030 | 2040 | |||||||||||||||||||
| Income | Housing Units | Census | Estimated | Estimated | Estimated | |||||||||||||||||||
| Calloway |
$ | 39,194 | $ | 105,300 | 37,191 | 40,411 | 43,618 | 46,607 | ||||||||||||||||
| Christian |
$ | 37,061 | $ | 95,500 | 73,955 | 77,840 | 81,015 | 82,947 | ||||||||||||||||
| Marshall |
$ | 43,326 | $ | 96,900 | 31,448 | 33,023 | 33,787 | 33,835 | ||||||||||||||||
| Todd |
$ | 36,989 | $ | 79,700 | 12,460 | 12,958 | 13,292 | 13,439 | ||||||||||||||||
| Trigg |
$ | 41,825 | $ | 98,300 | 14,339 | 16,244 | 17,913 | 19,179 | ||||||||||||||||
| Fulton |
$ | 31,965 | $ | 55,300 | 6,813 | 6,223 | 5,535 | 4,785 | ||||||||||||||||
| Total population |
176,206 | 186,699 | 195,160 | 200,792 | ||||||||||||||||||||
| Estimated ten year population growth |
|
8,542 | 10,493 | 8,461 | 5,632 | |||||||||||||||||||
| Estimated population growth rate |
|
5.1 | % | 6.0 | % | 4.5 | % | 2.9 | % | |||||||||||||||
Clarksville, Montgomery County, Tennessee (“Clarksville”)
The Clarksville market is the largest market in which the Company has a significant retail banking presence. The Clarksville economy has several large employers and economic drivers including the United States (“U.S.”) Army’s 101st Airborne Division with approximately 29,000 active duty military personnel and 3,900 civilian employees assigned to the division. Fort Campbell supports the third largest military population in the U.S. Army and the seventh largest in the U.S. Department of Defense. The many services available on the army installation and the community’s modest cost of living have resulted in a sizable military retirement population in the area. Clarksville is also home to Austin Peay State University, a 10,000 student public university as well as a diverse manufacturing sector.
Late in 2017, Hankook Tires began production in a new manufacturing facility in Clarksville. Hankook, a South Korean tire company, has hired approximately 1,000 employees with plans to increase employment to 1,800 and chose Clarksville due to its ideal location, strong transportation network and its proximity to automotive assembly plants owned by Nissan, Volkswagen, Toyota and General Motors. In February 2017, LG Electronics announced plans to construct a new home appliance manufacturing facility in Clarksville anticipates hiring 600 employees. The Clarksville market exhibits stronger growth and income demographics as compared to the communities in Western Kentucky. The 2010 census noted that Clarksville had a median household income of $48,930 and a $129,400 median value of owner occupied housing units. Clarksville’s demographics benefit by its proximity to the Fort Campbell Army base; its proximity to Nashville, Tennessee; and the absence of a state income tax.
| 2010 | 2020 | 2030 | 2040 | |||||||||||||
| Census | Estimated | Estimated | Estimated | |||||||||||||
| Clarksville MSA |
172,331 | 221,620 | 264,680 | 311,239 | ||||||||||||
| Ten year growth rate |
27.9 | % | 28.6 | % | 19.4 | % | 17.6 | % | ||||||||
25
Middle Tennessee and Nashville MSA
Cheatham County (“Cheatham”) and Houston County (“Houston”) are located in Middle Tennessee. However, Cheatham is located within the Nashville MSA, and its three largest communities are an easy commute to downtown Nashville. Cheatham’s proximity to Nashville has resulted in higher levels of income and population growth as compared to Houston. The Company believes that the tables below support their views that the Clarksville and Nashville MSAs provide the greatest opportunities for growth within our current market area. The Company opened our Nashville LPO in October of 2014 and our Brentwood LPO (located in Williamson County, Tennessee) in October of 2016. The Nashville MSA has a population of approximately 1.6 million (includes Cheatham County, Tennessee) and attractive demographics outlined below:
| 2010 Estimated | Population | Median | Median Value | |||||||||||||
| Nashville TN MSA | Census | Change | Household | Owner Occupied | ||||||||||||
| Population | 2000 - 2010 | Income | Housing Units | |||||||||||||
| Robertson (Springfield) |
66,283 | 21.8 | % | $ | 50,820 | $ | 149,100 | |||||||||
| Sumner (Gallatin) |
160,645 | 23.1 | % | $ | 54,916 | $ | 169,100 | |||||||||
| Wilson (Lebanon) |
113,193 | 28.4 | % | $ | 60,678 | $ | 187,500 | |||||||||
| Rutherford (Murfreesboro) |
262,604 | 44.3 | % | $ | 53,770 | $ | 157,100 | |||||||||
| Williamson (Franklin) |
183,182 | 44.7 | % | $ | 87,832 | $ | 335,800 | |||||||||
| Maury (Columbia) |
80,956 | 16.5 | % | $ | 46,278 | $ | 137,100 | |||||||||
| Dickson |
49,666 | 15.1 | % | $ | 44,554 | $ | 128,700 | |||||||||
| Davidson (Nashville) |
626,681 | 10.0 | % | $ | 45,668 | $ | 164,700 | |||||||||
| Cheatham |
39,105 | 9.0 | % | $ | 52,585 | $ | 155,900 | |||||||||
Additional Growth Opportunities
In addition to the Clarksville and Nashville MSA markets, management views promising opportunities for growth in the midsize metropolitan markets near the Company’s current locations. Highly desirable markets include Bowling Green, Kentucky, Hardin, Kentucky, and Louisville, Kentucky. These markets provide desirable demographic and growth opportunities as compared to the Company’s current footprint. As evident in the table below, Kentucky growth opportunities may be most attractive in Bowling Green, which is approximately 65 miles from the Company’s corporate headquarters. The tables below include the two largest counties by population in Kentucky and other communities in Kentucky within a two-hour drive of the Company’s headquarters:
| 2010 | Population | Median | Median Value | |||||||||||||
| Kentucky | Census | Change | Household | Owner Occupied | ||||||||||||
| Population | 2000 - 2010 | Income | Housing Units | |||||||||||||
| Henderson |
46,250 | 3.2 | % | $ | 40,438 | $ | 101,200 | |||||||||
| Hardin (Elizabethtown) |
105,543 | 12.1 | % | $ | 47,540 | $ | 131,900 | |||||||||
| Daviess (Owensboro) |
96,656 | 5.6 | % | $ | 42,821 | $ | 106,400 | |||||||||
| McCracken (Paducah) |
65,565 | 0.1 | % | $ | 41,630 | $ | 107,500 | |||||||||
| Warren (Bowling Green) |
113,792 | 23.0 | % | $ | 43,954 | $ | 135,400 | |||||||||
| Fayette (Lexington) |
295,803 | 13.5 | % | $ | 47,469 | $ | 159,200 | |||||||||
| Jefferson (Louisville) |
741,096 | 6.8 | % | $ | 45,352 | $ | 145,900 | |||||||||
Forward-Looking Statements
Management’s discussion and analysis includes certain forward-looking statements addressing, among other things, the Bank’s prospects for earnings, asset growth and net interest margin. Forward-looking statements are accompanied by, and identified with, such terms as “anticipates,” “believes,” “expects,” “intends,” and similar phrases. Management’s expectations for the Company’s future involve a number of assumptions and estimates. Factors that could cause actual results to differ from the expectations expressed herein include: substantial changes in interest rates, and changes in the general economy; changes in the Company’s strategies for credit-risk management, interest-rate risk management and investment activities. Accordingly, any forward-looking statements included herein do not purport to be predictions of future events or circumstances and may not be realized.
26
Stock Performance Comparison
The following graph, which was prepared by SNL Financial LC (“SNL”), shows the cumulative total return of the Common Stock of the Company since December 31, 2012 compared with the (1) NASDAQ Composite Index, comprised of all U.S. Companies quoted on NASDAQ, (2) the SNL Midwest Thrift Index, comprised of publically traded thrifts and thrift holding companies operating in the Midwestern United States, and (3) the SNL Midwest Bank Index, comprised of publically traded commercial banks and bank holding companies operating in the Midwestern United States. Cumulative total return on the Common Stock or the index equals the total increase in the value since December 31, 2012 assuming reinvestment of all dividends paid into the Common Stock or the index, respectively. The graph was prepared assuming that $100 was invested on December 31, 2012 in the Common Stock, the securities included in the indices.
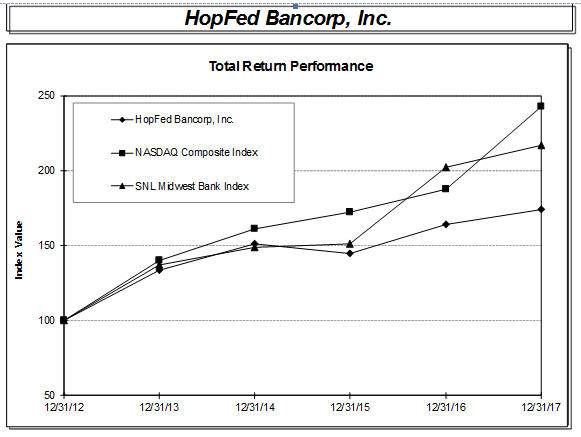
| Period Ending | ||||||||||||||||||||||||
| Index |
12/31/12 | 12/31/13 | 12/31/14 | 12/31/15 | 12/31/16 | 12/31/17 | ||||||||||||||||||
| HopFed Bancorp, Inc. |
100.00 | 133.57 | 151.18 | 144.51 | 164.28 | 173.76 | ||||||||||||||||||
| NASDAQ Composite Index |
100.00 | 140.12 | 160.78 | 171.97 | 187.22 | 242.71 | ||||||||||||||||||
| SNL Midwest Bank Index |
100.00 | 136.91 | 148.84 | 151.10 | 201.89 | 216.95 | ||||||||||||||||||
27
Consolidated Financial Statements
HopFed Bancorp, Inc.
and Subsidiaries
December 31, 2017, 2016 and 2015
Management Report on Internal Control
The management of HopFed Bancorp, Inc. and its subsidiaries (collectively referred to as the “Company”) is responsible for the preparation, integrity and fair presentation of published financial statements and all other information presented in this annual report. The financial statements have been prepared in accordance with accounting principles generally accepted in the United States of America (GAAP) and, as such, include amounts based on informed judgments and estimates made by management.
Management is responsible for establishing and maintaining adequate internal control over financial reporting for financial presentations in conformity with GAAP. Pursuant to the rules and regulations of the Securities and Exchange Commission, internal control over financial reporting is a process designed by, or under the supervision of, the Company’s Board of Directors, management and other personnel, to provide reasonable assurance regarding the reliability of financial reporting and the preparation of financial statements for external purposes in accordance with GAAP and included those policies and procedures that:
| • | Pertain to the maintenance of records that in reasonable detail accurately and fairly reflect the transactions and dispositions of the assets of the Company. |
| • | Provide reasonable assurance that transactions are recorded as necessary to permit preparation of financial statements in accordance with GAAP, and that receipts and expenditures of the Company are being made only in accordance with authorizations of management and Directors of the Company; and |
| • | Provide reasonable assurance regarding prevention or timely detection of unauthorized acquisition, use or disposition of the Company’s assets that could have a material effect on the financial statements. |
All internal control systems, no matter how well designed, have inherent limitations, including the possibility of human error and the circumvention of overriding controls. Accordingly, even effective internal control can provide only reasonable assurance with respect to financial statement preparation. Further, because of changes in conditions, or that the degree of compliance with the policies and procedures include in such controls may deteriorate.
Management has evaluated the effectiveness of its internal control over financial reporting as of December 31, 2017 based on the control criteria established in a report entitled Internal Control – Integrated Framework (2013), issued by the Committee of Sponsoring Organizations of the Treadway Commission. Based on such evaluation, we have concluded that the Company’s internal control over financial reporting is effective as of December 31, 2017.
Carr, Riggs & Ingram, LLC, the independent registered public accounting firm that audited the consolidated financial statements of the Company included in this Annual Report on Form 10-K, has issued an attestation report on the effectiveness of the Company’s internal control over financial reporting as of December 31, 2017. The report, which expresses an unqualified opinion on the effectiveness of the Company’s internal control over financial reporting as of December 31, 2017 is included in this Item under the heading “Report of Independent Registered Public Accounting Firm.”
| Date: March 15, 2018 |
By: | (signed) John E. Peck | ||||
| John E. Peck | ||||||
| President and Chief Executive Officer | ||||||
| By: | (signed) Billy C. Duvall | |||||
| Billy C. Duvall | ||||||
| Senior Vice President and Treasurer | ||||||
| (Principal Financial Officer) | ||||||
REPORT OF INDEPENDENT REGISTERED PUBLIC ACCOUNTING FIRM
To the Board of Directors and Stockholders
HopFed Bancorp, Inc.
Opinions on the Financial Statements and Internal Control over Financial Reporting
We have audited the accompanying consolidated balance sheets of HopFed Bancorp, Inc. and subsidiaries (the “Company”) as of December 31, 2017 and 2016, and the related consolidated statements of income, comprehensive income, changes in stockholders’ equity, and cash flows for each of the years in the two-year period ended December 31, 3017, and the related notes (collectively referred to as the “consolidated financial statements”). We also have audited the Company’s internal control over financial reporting as of December 31, 2017, based on criteria established in Internal Control – Integrated Framework (2013) issued by the Committee of Sponsoring Organizations of the Treadway Commission (COSO).
In our opinion, the consolidated financial statements referred to above present fairly, in all material respects, the consolidated financial position of the Company as of December 31, 2017 and 2016, and the results of their operations and their cash flows for each of the years in the two-year period ended December 31, 2017, in conformity with accounting principles generally accepted in the United States of America. Also, in our opinion, the Company maintained, in all material respects, effective internal control over financial reporting as of December 31, 2017, based on criteria established in Internal Control – Integrated Framework (2013) issued by COSO.
Basis for Opinion
The Company’s management is responsible for these consolidated financial statements, for maintaining effective internal control over financial reporting, and for its assessment of the effectiveness of internal control over financial reporting included in the accompanying Management Report on Internal Control. Our responsibility is to express an opinion on the Company’s consolidated financial statements and an opinion on the Company’s internal control over financial reporting based on our audits. We are a public accounting firm registered with the Public Company Accounting Oversight Board (United States) (PCAOB) and are required to be independent with respect to the Company in accordance with the U.S. federal securities laws and the applicable rules and regulations of the Securities and Exchange Commission and the PCAOB.
We conducted our audits in accordance with the standards of the PCAOB. Those standards require that we plan and perform the audits to obtain reasonable assurance about whether the consolidated financial statements are free of material misstatement, whether due to error or fraud, and whether effective internal control over financial reporting was maintained in all material respects.
Our audits of the financial statements included performing procedures to assess the risks of material misstatement of the consolidated financial statements, whether due to error or fraud, and performing procedures that respond to those risks. Such procedures included examining, on a test basis, evidence regarding the amounts and disclosures in the consolidated financial statements. Our audits also included evaluating the accounting principles used and significant estimates made by management, as well as evaluating the overall presentation of the consolidated financial statements. Our audit of internal control over financial reporting included obtaining an understanding of internal control over financial reporting, assessing the risk that a material weakness exists, and testing and evaluating the design and operating effectiveness of internal control based on the assessed risk. Our audits also included performing such other procedures as we considered necessary in the circumstances. We believe that our audits provide a reasonable basis for our opinions.
Definition and Limitations of Internal Control over Financial Reporting
A company’s internal control over financial reporting is a process designed to provide reasonable assurance regarding the reliability of financial reporting and the preparation of financial statements for external purposes in accordance with generally accepted accounting principles. A company’s internal control over financial reporting includes those policies and procedures that (1) pertain to the maintenance of records that, in reasonable detail, accurately and fairly reflect the transactions and dispositions of the assets of the company; (2) provide reasonable assurance that transactions are recorded as necessary to permit preparation of financial statements in accordance with generally accepted accounting principles, and that receipts and expenditures of the company are being made only in accordance with authorizations of management and directors of the company; and (3) provide reasonable assurance regarding prevention or timely detection of unauthorized acquisition, use, or disposition of the company’s assets that could have a material effect on the financial statements.
Because of its inherent limitations, internal control over financial reporting may not prevent or detect misstatements. Also, projections of any evaluation of effectiveness to future periods are subject to the risk that controls may become inadequate because of changes in conditions, or that the degree of compliance with the policies or procedures may deteriorate.
/s/ Carr, Riggs & Ingram, LLC
We have served as the Company’s auditor since 2000.
Nashville, Tennessee
March 15, 2018
REPORT OF INDEPENDENT REGISTERED PUBLIC ACCOUNTING FIRM
To the Board of Directors and Stockholders
of HopFed Bancorp, Inc.
Hopkinsville, Kentucky
We have audited the accompanying consolidated statements of income, comprehensive income, changes in stockholders’ equity, and cash flows of HopFed Bancorp, Inc. and subsidiaries (the “Company”) for the year ended December 31, 2015. These consolidated financial statements are the responsibility of the Company’s management. Our responsibility is to express an opinion on these consolidated financial statements based on our audit.
We conducted our audit in accordance with the standards of the Public Company Accounting Oversight Board (United States). Those standards require that we plan and perform the audit to obtain reasonable assurance about whether the financial statements are free of material misstatement. An audit includes examining, on a test basis, evidence supporting the amounts and disclosures in the financial statements, assessing the accounting principles used and significant estimates made by management, as well as evaluating the overall financial statement presentation. We believe that our audit provides a reasonable basis for our opinion.
In our opinion, the consolidated financial statements referred to above present fairly, in all material respects, the consolidated results of operations and cash flows of HopFed Bancorp Inc. and subsidiaries for the year ended December 31, 2015 in conformity with U.S. generally accepted accounting principles.
/S/ RAYBURN | FITZGERALD PC
Brentwood, Tennessee
March 3, 2016
HopFed Bancorp, Inc. and Subsidiaries
Consolidated Balance Sheets
December 31, 2017 and 2016
(Dollars in Thousands)
| 2017 | 2016 | |||||||
| Assets | ||||||||
| Cash and due from banks |
$ | 37,965 | $ | 21,779 | ||||
| Interest-bearing deposits in banks |
7,111 | 3,970 | ||||||
|
|
|
|
|
|||||
| Cash and cash equivalents |
45,076 | 25,749 | ||||||
| Federal Home Loan Bank stock, at cost |
4,428 | 4,428 | ||||||
| Securities available for sale |
184,791 | 209,480 | ||||||
| Loans held for sale |
1,539 | 1,094 | ||||||
| Loans receivable, net of allowance for loan losses of $4,826 at December 31, 2017 and $6,112 at December 31, 2016 |
637,102 | 604,286 | ||||||
| Accrued interest receivable |
3,589 | 3,799 | ||||||
| Foreclosed assets, net |
3,369 | 2,397 | ||||||
| Bank owned life insurance |
10,368 | 10,662 | ||||||
| Premises and equipment, net |
22,700 | 23,461 | ||||||
| Deferred tax assets |
1,764 | 3,052 | ||||||
| Other assets |
2,784 | 3,078 | ||||||
|
|
|
|
|
|||||
| Total assets |
$ | 917,510 | $ | 891,486 | ||||
|
|
|
|
|
|||||
| Liabilities and Stockholders’ Equity | ||||||||
| Liabilities: |
||||||||
| Deposits: |
||||||||
| Non-interest-bearing accounts |
$ | 136,197 | $ | 131,145 | ||||
| Interest-bearing accounts: |
||||||||
| Interest bearing checking accounts |
208,496 | 209,347 | ||||||
| Savings and money market accounts |
104,347 | 99,312 | ||||||
| Other time deposits |
304,969 | 293,078 | ||||||
|
|
|
|
|
|||||
| Total deposits |
754,009 | 732,882 | ||||||
| Advances from Federal Home Loan Bank |
23,000 | 11,000 | ||||||
| Repurchase agreements |
38,353 | 47,655 | ||||||
| Subordinated debentures |
10,310 | 10,310 | ||||||
| Advances from borrowers for taxes and insurance |
808 | 766 | ||||||
| Accrued expenses and other liabilities |
3,618 | 2,445 | ||||||
|
|
|
|
|
|||||
| Total liabilities |
830,098 | 805,058 | ||||||
|
|
|
|
|
|||||
See accompanying notes to consolidated financial statements.
32
HopFed Bancorp, Inc. and Subsidiaries
Consolidated Balance Sheets, Continued
December 31, 2017 and 2016
(Dollars in Thousands)
| 2017 | 2016 | |||||||
| Stockholders’ equity |
||||||||
| Preferred stock, par value $0.01 per share; authorized 500,000 shares; no shares issued or outstanding at December 31, 2017 and December 31, 2016 |
$ | — | $ | — | ||||
| Common stock, par value $.01 per share; authorized 15,000,000 shares; 7,976,131 issued and 6,637,771 outstanding at December 31, 2017 and 7,963,378 issued and 6,717,242 outstanding at December 31, 2016 |
80 | 80 | ||||||
| Additional paid-in-capital |
58,825 | 58,660 | ||||||
| Retained earnings |
51,162 | 49,035 | ||||||
| Treasury stock, at cost (1,338,360 shares at December 31, 2017 and 1,246,136 shares at December 31, 2016) |
(16,655 | ) | (15,347 | ) | ||||
| Unearned ESOP shares (at cost 434,548 shares at December 31, 2017 and 498,346 at December 31, 2016) |
(5,901 | ) | (6,548 | ) | ||||
| Accumulated other comprehensive income (loss) |
(99 | ) | 548 | |||||
|
|
|
|
|
|||||
| Total stockholders’ equity |
87,412 | 86,428 | ||||||
|
|
|
|
|
|||||
| Total liabilities and stockholders’ equity |
$ | 917,510 | $ | 891,486 | ||||
|
|
|
|
|
|||||
See accompanying notes to consolidated financial statements
33
HopFed Bancorp, Inc. and Subsidiaries
Consolidated Statements of Income
For the Years ended December 31, 2017, 2016 and 2015
(Dollars in Thousands)
| 2017 | 2016 | 2015 | ||||||||||
| Interest and dividend income |
||||||||||||
| Loans |
$ | 28,167 | 25,778 | 25,300 | ||||||||
| Taxable securities available for sale |
4,478 | 4,595 | 6,149 | |||||||||
| Nontaxable securities available for sale |
1,014 | 1,308 | 1,651 | |||||||||
| Interest bearing deposits in banks |
96 | 46 | 22 | |||||||||
|
|
|
|
|
|
|
|||||||
| Total interest and dividend income |
33,755 | 31,727 | 33,122 | |||||||||
|
|
|
|
|
|
|
|||||||
| Interest expense: |
||||||||||||
| Deposits |
4,810 | 4,240 | 5,031 | |||||||||
| Advances from Federal Home Loan Bank |
248 | 163 | 289 | |||||||||
| Repurchase agreements |
469 | 508 | 491 | |||||||||
| Subordinated debentures |
436 | 388 | 739 | |||||||||
|
|
|
|
|
|
|
|||||||
| Total interest expense |
5,963 | 5,299 | 6,550 | |||||||||
|
|
|
|
|
|
|
|||||||
| Net interest income |
27,792 | 26,428 | 26,572 | |||||||||
|
|
|
|
|
|
|
|||||||
| Provision for loan losses |
477 | 1,241 | 1,051 | |||||||||
|
|
|
|
|
|
|
|||||||
| Net interest income after provision for loan losses |
27,315 | 25,187 | 25,521 | |||||||||
|
|
|
|
|
|
|
|||||||
| Non-interest income: |
||||||||||||
| Service charges |
3,224 | 2,788 | 2,925 | |||||||||
| Merchant card |
1,222 | 1,224 | 1,130 | |||||||||
| Mortgage origination |
1,321 | 1,585 | 1,175 | |||||||||
| Realized gains from sale of securities available for sale, net |
169 | 612 | 691 | |||||||||
| Income from bank owned life insurance |
483 | 343 | 335 | |||||||||
| Financial services commission |
536 | 614 | 685 | |||||||||
| Other operating |
1,075 | 769 | 661 | |||||||||
|
|
|
|
|
|
|
|||||||
| Total non-interest income |
8,030 | 7,935 | 7,602 | |||||||||
|
|
|
|
|
|
|
|||||||
See accompanying notes to consolidated financial statements.
34
HopFed Bancorp, Inc. and Subsidiaries
Consolidated Statements of Income, Continued
For the Years ended December 31, 2017, 2016 and 2015
(Dollars in Thousands, Except Per Share Amounts)
| 2017 | 2016 | 2015 | ||||||||||
| Non-interest expenses: |
||||||||||||
| Salaries and employee benefits |
16,049 | 15,400 | 15,810 | |||||||||
| Occupancy |
2,920 | 3,173 | 3,077 | |||||||||
| Data processing |
2,884 | 2,942 | 2,827 | |||||||||
| State deposit tax |
770 | 990 | 1,018 | |||||||||
| Professional services |
2,316 | 1,404 | 1,506 | |||||||||
| Advertising |
1,354 | 1,401 | 1,302 | |||||||||
| Foreclosed assets, net |
9 | 448 | 1,227 | |||||||||
| (Gain) loss on sale of premises and equipment |
2 | (72 | ) | 1 | ||||||||
| Other operating |
3,592 | 4,170 | 3,677 | |||||||||
|
|
|
|
|
|
|
|||||||
| Total non-interest expense |
29,896 | 29,856 | 30,445 | |||||||||
|
|
|
|
|
|
|
|||||||
| Income before income tax expense |
5,449 | 3,266 | 2,678 | |||||||||
| Income tax expense |
2,148 | 362 | 274 | |||||||||
|
|
|
|
|
|
|
|||||||
| Net income |
$ | 3,301 | 2,904 | 2,404 | ||||||||
|
|
|
|
|
|
|
|||||||
| Earnings per share available to common stockholders: |
||||||||||||
| Basic |
$ | 0.53 | 0.47 | 0.38 | ||||||||
|
|
|
|
|
|
|
|||||||
| Diluted |
$ | 0.53 | 0.47 | 0.38 | ||||||||
|
|
|
|
|
|
|
|||||||
| Weighted average shares outstanding—basic |
6,221,632 | 6,233,860 | 6,372,277 | |||||||||
|
|
|
|
|
|
|
|||||||
| Weighted average shares outstanding—diluted |
6,221,632 | 6,233,860 | 6,372,277 | |||||||||
|
|
|
|
|
|
|
|||||||
See accompanying notes to consolidated financial statements.
35
HopFed Bancorp, Inc. and Subsidiaries
Consolidated Statements of Comprehensive Income
For the Years ended December 31, 2017, 2016 and 2015
(Dollars in Thousands)
| 2017 | 2016 | 2015 | ||||||||||
| Net income |
$ | 3,301 | 2,904 | 2,404 | ||||||||
| Other comprehensive income, net of tax: |
||||||||||||
| Unrealized loss on non – other than temporary impaired (“OTTI”) investment securities available for sale, net of taxes |
(387 | ) | (1,351 | ) | (1,121 | ) | ||||||
| Unrealized gain (loss) on OTTI securities, net of taxes |
(148 | ) | (170 | ) | 237 | |||||||
| Unrealized gain on derivatives, net of taxes |
— | — | 257 | |||||||||
| Reclassification adjustment for gains and accretion included in net income, net of taxes |
(112 | ) | (405 | ) | (456 | ) | ||||||
|
|
|
|
|
|
|
|||||||
| Total other comprehensive loss |
(647 | ) | (1,926 | ) | (1,083 | ) | ||||||
|
|
|
|
|
|
|
|||||||
| Comprehensive income |
$ | 2,654 | 978 | 1,321 | ||||||||
|
|
|
|
|
|
|
|||||||
See accompanying notes to consolidated financial statements.
36
HopFed Bancorp, Inc. and Subsidiaries
Consolidated Statements of Changes in Stockholders’ Equity
For the Years ended December 31, 2017, 2016 and 2015
(Dollars in Thousands, Except Share Amounts)
| Common Shares |
Common Stock |
Additional Paid-in Capital |
Retained Earnings |
Common Treasury Stock |
Unearned ESOP Shares |
Accumulated Other Comprehensive Income (Loss) |
Total Equity |
|||||||||||||||||||||||||
| Balance January 1, 2015 |
7,171,282 | 79 | 58,466 | 45,729 | (9,429 | ) | — | 3,557 | 98,402 | |||||||||||||||||||||||
| Net Income |
— | — | — | 2,404 | — | — | — | 2,404 | ||||||||||||||||||||||||
| Restricted stock awards |
2,034 | — | — | — | — | — | — | — | ||||||||||||||||||||||||
| Net change in unrealized gain on securities available for sale, net of taxes of $690 |
— | — | — | — | — | — | (1,340 | ) | (1,340 | ) | ||||||||||||||||||||||
| Net change in unrealized losses on derivatives, net of taxes of ($132) |
— | — | — | — | — | — | 257 | 257 | ||||||||||||||||||||||||
| Cash dividend to common stockholders ($0.16 per share) |
— | — | — | (1,009 | ) | — | — | — | (1,009 | ) | ||||||||||||||||||||||
| Common stock repurchase |
(907,505 | ) | — | — | — | (11,926 | ) | — | — | (11,926 | ) | |||||||||||||||||||||
| Common stock issued |
600,000 | — | — | — | 7,884 | (7,884 | ) | — | — | |||||||||||||||||||||||
| ESOP shares earned |
— | — | (52 | ) | — | — | 704 | — | 652 | |||||||||||||||||||||||
| Compensation expense, restricted stock awards |
— | — | 190 | — | — | — | — | 190 | ||||||||||||||||||||||||
|
|
|
|
|
|
|
|
|
|
|
|
|
|
|
|
|
|||||||||||||||||
| Balance December 31, 2015 |
6,865,811 | 79 | 58,604 | 47,124 | (13,471 | ) | (7,180 | ) | 2,474 | 87,630 | ||||||||||||||||||||||
|
|
|
|
|
|
|
|
|
|
|
|
|
|
|
|
|
|||||||||||||||||
| Net Income |
— | — | — | 2,904 | — | — | — | 2,904 | ||||||||||||||||||||||||
| Restricted stock awards |
11,679 | 1 | — | — | — | — | — | 1 | ||||||||||||||||||||||||
| Net change in unrealized gain on securities available for sale, net of taxes of $992 |
— | — | — | — | — | — | (1,926 | ) | (1,926 | ) | ||||||||||||||||||||||
| Cash dividend to common stockholders ($0.16 per share) |
— | — | — | (993 | ) | — | — | — | (993 | ) | ||||||||||||||||||||||
| Common stock repurchase |
(160,248 | ) | — | — | — | (1,876 | ) | — | — | (1,876 | ) | |||||||||||||||||||||
| ESOP shares earned |
— | — | (79 | ) | — | — | 632 | — | 553 | |||||||||||||||||||||||
| Compensation expense, restricted stock awards |
— | — | 135 | — | — | — | — | 135 | ||||||||||||||||||||||||
|
|
|
|
|
|
|
|
|
|
|
|
|
|
|
|
|
|||||||||||||||||
| Balance December 31, 2016 |
6,717,242 | $ | 80 | 58,660 | 49,035 | (15,347 | ) | (6,548 | ) | 548 | 86,428 | |||||||||||||||||||||
|
|
|
|
|
|
|
|
|
|
|
|
|
|
|
|
|
|||||||||||||||||
37
HopFed Bancorp, Inc. and Subsidiaries
Consolidated Statements of Changes in Stockholders’ Equity
For the Years ended December 31, 2017, 2016 and 2015
(Dollars in Thousands, Except Share Amounts)
| Common Shares |
Common Stock |
Additional Paid-in Capital |
Retained Earnings |
Common Treasury Stock |
Unearned ESOP Shares |
Accumulated Other Comprehensive Income (Loss) |
Total Equity |
|||||||||||||||||||||||||
| December 31, 2016 |
6,717,242 | $ | 80 | 58,660 | 49,035 | (15,347 | ) | (6,548 | ) | 548 | 86,428 | |||||||||||||||||||||
| Net Income |
— | — | — | 3,301 | — | — | — | 3,301 | ||||||||||||||||||||||||
| Restricted stock awards |
12,753 | — | — | — | — | — | — | — | ||||||||||||||||||||||||
| Net change in unrealized gain on securities available for sale, net of taxes of $172 |
— | — | — | — | — | — | (647 | ) | (647 | ) | ||||||||||||||||||||||
| Cash dividend to common stockholders ($0.19 per share) |
— | — | — | (1,174 | ) | — | — | — | (1,174 | ) | ||||||||||||||||||||||
| Common stock repurchase |
(92,224 | ) | — | — | — | (1,308 | ) | — | — | (1,308 | ) | |||||||||||||||||||||
| ESOP shares earned |
— | — | 59 | — | — | 647 | — | 706 | ||||||||||||||||||||||||
| Compensation expense, restricted stock awards |
— | — | 106 | — | — | — | — | 106 | ||||||||||||||||||||||||
|
|
|
|
|
|
|
|
|
|
|
|
|
|
|
|
|
|||||||||||||||||
| Balance December 31, 2017 |
6,637,771 | $ | 80 | 58,825 | 51,162 | (16,655 | ) | (5,901 | ) | (99 | ) | 87,412 | ||||||||||||||||||||
|
|
|
|
|
|
|
|
|
|
|
|
|
|
|
|
|
|||||||||||||||||
See accompanying notes to consolidated financial statements.
38
HopFed Bancorp, Inc. and Subsidiaries
Consolidated Statements of Cash Flows
For the Years ended December 31, 2017, 2016 and 2015
(Dollars in Thousands)
| 2017 | 2016 | 2015 | ||||||||||
| Cash flows from operating activities: |
||||||||||||
| Net income |
$ | 3,301 | 2,904 | 2,404 | ||||||||
| Adjustments to reconcile net income to net cash provided by operating activities: |
||||||||||||
| Provision for loan losses |
477 | 1,241 | 1,051 | |||||||||
| Depreciation |
1,225 | 1,320 | 1,266 | |||||||||
| Amortization of intangible assets |
— | — | 33 | |||||||||
| Amortization of investment premiums and discounts, net |
1,073 | 1,515 | 1,650 | |||||||||
| OTTI recovery on available for sale securities |
(17 | ) | (17 | ) | (17 | ) | ||||||
| Expense for deferred income taxes |
1,585 | 267 | 177 | |||||||||
| Stock compensation expense |
106 | 135 | 138 | |||||||||
| Income from bank owned life insurance |
(483 | ) | (343 | ) | (335 | ) | ||||||
| Gain on sale of securities available for sale |
(169 | ) | (612 | ) | (691 | ) | ||||||
| Gain on sale of mortgage loans |
(1,321 | ) | (1,585 | ) | (1,175 | ) | ||||||
| (Gain) loss on sale of premises and equipment |
2 | (72 | ) | 1 | ||||||||
| Proceeds from sale of mortgage loans |
51,494 | 56,309 | 43,847 | |||||||||
| (Gain) loss on sale of foreclosed assets |
(158 | ) | (21 | ) | 716 | |||||||
| Originations of mortgage loans sold |
(50,618 | ) | (53,026 | ) | (44,020 | ) | ||||||
| Decrease in: |
||||||||||||
| Accrued interest receivable |
210 | 340 | 437 | |||||||||
| Other assets |
389 | 145 | 21 | |||||||||
| Increase (decrease) in accrued expenses and other liabilities |
1,173 | (1,980 | ) | 933 | ||||||||
|
|
|
|
|
|
|
|||||||
| Net cash provided by operating activities |
8,269 | 6,520 | 6,436 | |||||||||
|
|
|
|
|
|
|
|||||||
| Cash flows from investing activities: |
||||||||||||
| Proceeds from sales, calls and maturities of securities available for sale |
54,416 | 67,671 | 120,354 | |||||||||
| Purchase of securities available for sale |
(31,594 | ) | (43,778 | ) | (56,875 | ) | ||||||
| Net increase in loans |
(37,605 | ) | (49,586 | ) | (19,005 | ) | ||||||
| Proceeds from sale of foreclosed assets |
3,498 | 1,623 | 344 | |||||||||
| Proceeds from death benefit of bank owned life insurance policy |
777 | — | — | |||||||||
| Proceeds from sale of premises and equipment |
— | 100 | — | |||||||||
| Purchase of premises and equipment |
(466 | ) | (775 | ) | (2,361 | ) | ||||||
|
|
|
|
|
|
|
|||||||
| Net cash provided by (used in) investing activities |
(10,974 | ) | (24,745 | ) | 42,457 | |||||||
|
|
|
|
|
|
|
|||||||
See accompanying notes to consolidated financial statements.
39
HopFed Bancorp, Inc. and Subsidiaries
Consolidated Statements of Cash Flows, Continued
For the Years ended December 31, 2017, 2016 and 2015
(Dollars in Thousands)
| 2017 | 2016 | 2015 | ||||||||||
| Cash flows from financing activities: |
||||||||||||
| Net increase (decrease) in deposits |
$ | 21,127 | ($ | 6,524 | ) | 8,098 | ||||||
| Increase in advance payments by borrowers for taxes and insurance |
42 | 152 | 101 | |||||||||
| Advances from Federal Home Loan Bank |
80,000 | 26,000 | 41,000 | |||||||||
| Repayment of advances from Federal Home Loan Bank |
(68,000 | ) | (30,000 | ) | (60,000 | ) | ||||||
| Increase (decrease) in repurchase agreements |
(9,302 | ) | 1,885 | (11,588 | ) | |||||||
| Acquisition of treasury stock |
(1,308 | ) | (1,876 | ) | (11,926 | ) | ||||||
| Proceeds from repayment of ESOP loan |
647 | 632 | 704 | |||||||||
| Dividends paid on common stock |
(1,174 | ) | (993 | ) | (1,023 | ) | ||||||
|
|
|
|
|
|
|
|||||||
| Net cash provided by (used in) financing activities |
22,032 | (10,724 | ) | (34,634 | ) | |||||||
|
|
|
|
|
|
|
|||||||
| Increase (decrease) in cash and cash equivalents |
19,327 | (28,949 | ) | 14,259 | ||||||||
| Cash and cash equivalents, beginning of period |
25,749 | 54,698 | 40,439 | |||||||||
|
|
|
|
|
|
|
|||||||
| Cash and cash equivalents, end of period |
$ | 45,076 | $ | 25,749 | 54,698 | |||||||
|
|
|
|
|
|
|
|||||||
| Supplemental disclosures of cash flow information: |
||||||||||||
| Interest paid |
$ | 5,920 | $ | 5,354 | 6,587 | |||||||
|
|
|
|
|
|
|
|||||||
| Income taxes (refund) paid |
1,044 | (564 | ) | (900 | ) | |||||||
|
|
|
|
|
|
|
|||||||
| Supplemental disclosures of non-cash investing and financing activities: |
||||||||||||
| Loans charged off |
$ | 3,159 | $ | 1,468 | 1,867 | |||||||
|
|
|
|
|
|
|
|||||||
| Foreclosures and in-substance foreclosures of loans during year |
4,312 | 2,263 | 869 | |||||||||
|
|
|
|
|
|
|
|||||||
| Net unrealized losses on investment securities classified as available for sale |
(978 | ) | (2,918 | ) | (2,030 | ) | ||||||
|
|
|
|
|
|
|
|||||||
| Increase in deferred tax asset related to unrealized gains on investments |
331 | 992 | 691 | |||||||||
|
|
|
|
|
|
|
|||||||
| Dividends declared and payable |
355 | 288 | 287 | |||||||||
|
|
|
|
|
|
|
|||||||
| Sale and financing of stock to ESOP |
— | — | 7,884 | |||||||||
|
|
|
|
|
|
|
|||||||
| Issue of unearned restricted stock |
178 | 145 | 25 | |||||||||
|
|
|
|
|
|
|
|||||||
See accompanying notes to consolidated financial statements.
40
HopFed Bancorp, Inc. and Subsidiaries
Notes to Consolidated Financial Statements
December 31, 2017, 2016 and 2015
| (1) | Summary of Significant Accounting Policies: |
Nature of Operations and Customer Concentration
HopFed Bancorp, Inc. (the “Corporation”) is a bank holding company which incorporated in the state of Delaware and headquartered in Hopkinsville, Kentucky. The Corporation’s principal business activities are conducted through its wholly-owned subsidiary, Heritage Bank USA, Inc. (the “Bank”), a Kentucky state chartered commercial bank engaged in the business of accepting deposits and providing mortgage, consumer, construction and commercial loans to the general public through its retail banking offices. The Bank’s business activities are primarily limited to western Kentucky and middle and western Tennessee. The Bank is subject to competition from other financial institutions. Deposits at the Bank are insured up to the applicable limits by the Federal Deposit Insurance Corporation (FDIC).
The Bank is a Kentucky commercial chartered bank and is supervised by the Kentucky Department of Financial Institutions (“KDFI”) and the FDIC. Supervision of the Corporation is conducted by the Federal Reserve Bank of Saint Louis (“FED”).
The Bank owns JBMM, LLC, a wholly owned limited liability company which owns and manages the Bank’s foreclosed assets. The Bank owns Heritage Interim Corporation, a Tennessee corporation established to facilitate the acquisition of a bank in Tennessee. The proposed acquisition was terminated in August of 2013. The Bank owns Heritage USA Title, LLC, which sells title insurance to the Bank’s real estate loan customers.
The Bank owns Fort Webb LP, LLC, which owns a limited partnership interest in Fort Webb Elderly Housing LP, LLC, a low income senior citizen housing facility in Bowling Green, Kentucky. The facility offers apartments for rent for those senior citizens who qualify and is managed by the Bowling Green, Kentucky Housing Authority.
A substantial portion of the Bank’s loans are secured by real estate in the western Kentucky and middle and west Tennessee markets. In addition, foreclosed real estate is located in this same market. Accordingly, the ultimate ability to collect on a substantial portion of the Bank’s loan portfolio and the recovery of a substantial portion of the carrying amount of foreclosed real estate is susceptible to changes in local market conditions.
Principles of Consolidation
The consolidated financial statements include the accounts of the Corporation, the Bank and its subsidiaries (collectively the “Company”) for all periods. Significant inter-company balances and transactions have been eliminated in consolidation.
Accounting
The accounting and reporting policies of the Company are in accordance with accounting principles generally accepted in the United States of America (“U.S. GAAP”) and conform to general practices in the banking industry. U.S. GAAP is generally defined by the Financial Accounting Standards Board (“FASB”) Accounting Standards Codification (“ASC”), as amended by Accounting Standards Updates (“ASUs”). Rules and interpretive releases of the Securities and Exchange Commission (“SEC”) are also sources of authoritative U.S. GAAP for SEC registrants.
41
HopFed Bancorp, Inc. and Subsidiaries
Notes to Consolidated Financial Statements, Continued
December 31, 2017, 2016 and 2015
| (1) | Summary of Significant Accounting Policies: (Continued) |
Accounting (Continued)
The Company determines whether it has a controlling financial interest in an entity by first evaluating whether the entity is a voting interest entity or a variable interest entity (VIE) under U.S. GAAP. Voting interest entities in which the total equity investment is a risk is sufficient to enable the entity to finance itself independently and provides the equity holders with the obligation to absorb losses, the right to receive residual returns and the right to make decision about the entity’s activities. The Company consolidates voting interest entities in which it has all, or at least a majority of, the voting interest. A controlling financial interest in a VIE is present when an enterprise has both the power to direct the activities of the VIE that most significantly impact the VIE economic performance and an obligation to absorb losses or the right to receive benefits that could potentially be significant to the VIE. The subsidiaries, HopFed Capital Trust I and Fort Webb LP, LLC are VIEs for which the Company is not the primary beneficiary. Accordingly, these accounts are not included in the Company’s consolidated financial statements.
Subsequent Events
The Company has evaluated subsequent events for potential impact and disclosure through the issue date of these consolidated financial statements.
Estimates
In preparing the consolidated financial statements in conformity with U.S. GAAP, management is required to make estimates and assumptions that affect the reported amounts of assets and liabilities as of the date of the consolidated balance sheets and revenues and expenses for each year. Actual results could differ significantly from those estimates. Material estimates that are particularly susceptible to significant change relate to the determination of the allowance for loan losses and the valuation of real estate acquired in connection with foreclosures or in satisfaction of loans. In connection with the determination of the allowances for loan losses and foreclosed real estate, management obtains independent appraisals for significant collateral.
Cash and Cash Equivalents
Cash and cash equivalents are defined as cash on hand, amounts due on demand from commercial banks, interest-bearing deposits in other financial institutions and federal funds sold with maturities of three months or less. The Company is required to maintain reserve funds in either cash on hand or on deposit with the Federal Reserve Bank. At December 31, 2017, the Company’s reserve requirement was met with available cash on hand.
42
HopFed Bancorp, Inc. and Subsidiaries
Notes to Consolidated Financial Statements, Continued
December 31, 2017, 2016 and 2015
| (1) | Summary of Significant Accounting Policies: (Continued) |
Securities
The Company reports debt, readily-marketable equity, mortgage-backed and mortgage related securities in one of the following categories: (i) “trading” (held for current resale) which are to be reported at fair value, with unrealized gains and losses included in earnings; and (ii) “available for sale” (all other debt, equity, mortgage-backed and mortgage related securities) which are to be reported at fair value, with unrealized gains and losses reported net of tax as a separate component of stockholders’ equity. At the time of new security purchases, a determination is made as to the appropriate classification. Realized and unrealized gains and losses on trading securities are included in net income. Unrealized gains and losses on securities available for sale are recognized as direct increases or decreases in stockholders’ equity, net of any tax effect. Cost of securities sold is recognized using the specific identification method. Interest income on securities is recognized as earned. The Company purchases many agency bonds at either a premium or discount to its par value. Premiums and discounts on agency bonds are amortized using the net interest method. For callable bonds purchased at a premium, the premium is amortized to the first call date. If the bond is not called on that date, the premium is fully amortized and the Company recognizes an increase in the net yield of the investment. For agency bonds purchased at a discount, the discount is accreted to the final maturity date. For callable bonds purchased at discount and called before maturity, the Company recognizes a gain on the sale of securities. The Company amortizes premiums and accretes discounts on mortgage back securities and collateralized mortgage obligations based on the securities three-month average prepayment speed. Gains and losses on sales are recorded on the trade date.
Other Than Temporary Impairment
Management evaluates securities for other-than-temporary impairment (“OTTI”) on at least a quarterly basis, and more frequently when economic conditions warrant such evaluation. A decline in the fair value of any available-for-sale security below cost that is deemed to be other-than-temporary results in a reduction in the carrying amount to fair value. To determine whether impairment is other-than-temporary, management considers whether the entity expects to recover the entire amortized cost basis of the security by reviewing the present value of the future cash flows associated with the security. The shortfall of the present value of the cash flows expected to be collected in relation to the amortized cost basis is referred to as a credit loss. If a credit loss is identified, management then considers whether it is more-likely-than-not that the Company will be required to sell the security prior to recovery. If management concludes that it is not more-likely-than-not that it will be required to sell the security, then the security is not other-than-temporarily impaired and the shortfall is recorded as a component of equity. If the security is determined to be other-than-temporarily impaired, the credit loss is recognized as a charge to earnings and a new cost basis for the security is established.
43
HopFed Bancorp, Inc. and Subsidiaries
Notes to Consolidated Financial Statements, Continued
December 31, 2017, 2016 and 2015
| (1) | Summary of Significant Accounting Policies: (Continued) |
Other Securities
Other securities which are not actively traded and may be restricted, such as Federal Home Loan Bank (FHLB) stock are recognized at cost. FHLB stock is periodically evaluated for impairment based on ultimate recovery of par value. Both cash and stock dividends are reported as income.
Loans Receivable and Allowance for Loan Losses
Loans receivable are stated at unpaid principal balances, less the allowance for loan losses and deferred loan cost. ASC 310-20, Nonrefundable Fees and Other Costs Associated with Originating or Acquiring Loans and Initial Direct Costs of Leases, requires the recognition of loan origination fee income over the life of the loan and the recognition of certain direct loan origination costs over the life of the loan. Uncollectible interest on loans that are contractually past due is charged off, or an allowance is established based on management’s periodic evaluation. The Company charges off loans after, in management’s opinion, the collection of all or a large portion of the principal or interest is not probable. The allowance is established by a charge to interest income equal to all interest previously accrued, and income is subsequently recognized only to the extent that cash payments are received while the loan is classified as non-accrual, when the loan is ninety days past due. Loans may be returned to accrual status when all principal and interest amounts contractually due (including arrearages) are reasonably assured of repayment within an acceptable period of time, and there is a sustained period of repayment performance by the borrower in accordance with the contractual terms of interest and principal.
The Company provides an allowance for loan losses and includes a provision for loan losses determined by management. Subsequent recoveries, if any, are credited to the allowance. Management’s periodic evaluation of the adequacy of the allowance is based on the Company’s loan loss experience, known and inherent risks in the portfolio, adverse situations that may affect the borrower’s ability to repay, the estimated value of any underlying collateral, and current economic conditions. The loss experience is determined by portfolio segment and is based on the actual losses experienced by the Company over the most recent three years.
Factors considered by management in determining impairment include payment status, collateral value and the probability of collecting scheduled principal and interest payments in accordance with the contractual terms of the loan agreement. Impaired loans and loans classified as Troubled Debt Restructurings (“TDRs”) may be classified as either substandard or doubtful and reserved for based on individual loans risk for loss. Loans not considered impaired may be classified as either special mention or watch and may have an allowance established for it. Typically, unimpaired classified loans exhibit some form of weakness in either industry trends, collateral, or cash flow that result in a default risk greater than that of the Company’s typical loan. All classified amounts include all unpaid interest and fees as well as the principal balance outstanding.
44
HopFed Bancorp, Inc. and Subsidiaries
Notes to Consolidated Financial Statements, Continued
December 31, 2017, 2016 and 2015
| (1) | Summary of Significant Accounting Policies: (Continued) |
Loans Receivable and Allowance for Loan Losses (Continued)
The measurement of impaired loans may be based on the present value of future cash flows discounted at the historical effective interest rate. However, the majority of the Company’s problem loans become collateral dependent at the time they are judged to be impaired. Therefore, the measurement of impairment requires the Company to obtain a new appraisal to obtain the fair value of the collateral. The appraised value is then discounted to an estimate of the Company’s net realizable value, reducing the appraised value. When the measured amount of an impaired loan is less than the recorded investment in the loan, the impairment is recorded as a charge to income and a valuation allowance, which is included as a component of the allowance for loan losses. For loans not individually evaluated, management considers the Company’s recent charge off history, the Company’s current past due and non-accrual trends, banking industry trends and both local and national economic conditions when making an estimate as to the amount to reserve for losses. Management believes it has established the allowance in accordance with U.S. GAAP and has taken into account the views of its regulators and the current economic environment.
If an asset or portion thereof is classified as a loss, we establish a specific reserve for such amount. If the Company determines that a loan relationship is collateral dependent, the Company will charge off the portion of that loan that is deemed to be impaired against the allowance for loan loss account. The Company defines collateral dependent as any loan in that the customer will be unable to reduce the principal balance of the loan without the complete or partial sale of the collateral. The Company will charge off a portion or all of a loan balance once it deems the collection of any remaining interest and principal due to be unlikely.
Loans Held For Sale
Mortgage loans originated and intended for sale are carried at the lower of cost or estimated fair value as determined on a loan-by-loan basis. Net unrealized losses, if any, are recognized through a valuation allowance by charges to income. Realized gains and losses are recognized when legal title to the loans has been transferred to the purchaser and sales proceeds have been received and are reflected in the accompanying consolidated statement of operations in gains on mortgage loans sold, net of related costs such as compensation expenses. The Company does not securitize mortgage loans.
Fixed Rate Mortgage Originations
The Company operates a mortgage division that originates mortgage loans in the name of assorted investors, including Federal Home Loan Mortgage Corporation (Freddie Mac). Originations for Freddie Mac are sold through the Bank while originations to other investors are processed for a fee. On a limited basis, loans sold to Freddie Mac may result in the Bank retaining loan servicing rights. In recent years, customers have chosen lower origination rates over having their loan locally serviced; thereby limiting the amount of new loans sold with servicing retained. At December 31, 2017, the Bank maintained a servicing portfolio of one to four family real estate loans of approximately $16.9 million.
45
HopFed Bancorp, Inc. and Subsidiaries
Notes to Consolidated Financial Statements, Continued
December 31, 2017, 2016 and 2015
| (1) | Summary of Significant Accounting Policies: (Continued) |
Foreclosed Assets
Assets acquired through, or in lieu of, loan foreclosure or repossession are initially recorded at fair value less selling cost when acquired, establishing a new cost basis. These assets are subsequently accounted for at lower of cost or fair value less estimated cost to sell. Costs of improving the assets are capitalized if the Company determines that it is likely to recover the cost. Other improvement cost and all cost relating to holding the property are expensed. Management conducts periodic valuations and any adjustments to value are recognized in the current period’s operations.
Repurchase Agreements
The Company sells investments from its portfolio to business and municipal customers with a written agreement to repurchase those investments on the next business day. The repurchase product gives business customers the opportunity to earn income on liquid cash reserves. These funds are overnight borrowings of the Company secured by Company assets and are not FDIC insured.
Treasury Stock
The Company may purchase its own common stock either in open market transactions or privately negotiated transactions. The value of the Company’s common stock held in treasury is listed at cost.
Unearned ESOP Shares
The Company offers an Employee Stock Ownership Plan (“ESOP”) to the employees of the Company. The unearned portion of common stock of the Company held in the ESOP Trust is recorded on the balance sheet at cost. Common stock is released from the ESOP Trust to the participants as the Bank makes payments on the loan to the Corporation on behalf of the ESOP Trust.
Comprehensive Income
Comprehensive income consists of net income and other comprehensive income, net of applicable income taxes. Other comprehensive income includes unrealized appreciation (depreciation) on available-for-sale securities, unrealized appreciation (depreciation) on available-for-sale securities for which a portion of an other-than-temporary impairment has been recognized in income, and unrealized appreciation (depreciation) on derivatives.
Transfers of Financial Assets
Transfers of financial assets are accounted for as sales, when control over the assets have been relinquished. Control over transferred assets is deemed to be surrendered when the assets have been isolated from the Company, the transferee obtains the right (free of conditions that constrain it from taking advantage of that right) to pledge or exchange the transferred assets, and the Company does not maintain effective control over the transferred assets through an agreement to repurchase them before their maturity.
46
HopFed Bancorp, Inc. and Subsidiaries
Notes to Consolidated Financial Statements, Continued
December 31, 2017, 2016 and 2015
| (1) | Summary of Significant Accounting Policies: (Continued) |
Revenue Recognition
Mortgage loans held for sale are generally delivered to secondary market investors under best efforts sales commitments entered into prior to the closing of the individual loan. Loan sales and related gains or losses are recognized at settlement. Loan fees earned for the servicing of secondary market loans are recognized as earned. Interest income on loans receivable is reported on the interest method. Interest income is not reported when full loan repayment is in doubt, typically when the loan is impaired, placed in non-accrual status, or payments are past due more than 90 days. Interest is reversed on any loans classified as non-accrual or past due more than 90 days. Interest may continue to accrue on loans over 90 days past due if they are well secured and in the process of collection.
Income Taxes
Income taxes are accounted for through the use of the asset and liability method. Under the asset and liability method, deferred taxes are recognized for the tax consequences of temporary differences by applying enacted statutory rates applicable to future years to differences between the financial statement carrying amounts and the tax bases of existing assets and liabilities. The effect on deferred taxes of a change in tax rates would be recognized in income in the period that includes the enactment date. Accordingly, deferred tax assets that will be realized after December 31, 2017 were revalued using the tax rates enacted as a result of the 2017 Tax Cuts and Jobs Act resulting in a revaluation charge of $980,000. The Company files its federal and Kentucky income tax returns as well as its Kentucky and Tennessee franchise and excise tax returns on a consolidated basis with its subsidiaries. All taxes are accrued on a separate entity basis.
A tax position is recognized as a benefit only if it is “more likely than not” that the tax position would be sustained in a tax examination, with a tax examination being presumed to occur. The amount recognized is the largest amount of tax benefit that is greater than 50% likely of being recognized on examination. For tax positions not meeting the “more likely than not test”, no benefit is recorded.
Operating Segments
The Company’s continuing operations include one primary segment, retail banking. The retail banking segment involves the origination of commercial, residential and consumer loans as well as the collections of deposits in eighteen branch offices.
Premises and Equipment
Land, land improvements, buildings, and furniture and equipment are carried at cost, less accumulated depreciation and amortization. Buildings and land improvements are depreciated generally by the straight-line method, and furniture and equipment are depreciated under various methods over the estimated useful lives of the assets. The Company capitalizes interest expense on construction in process at a rate equal to the Company’s cost of funds. The estimated useful lives used to compute depreciation are as follows:
| Land improvements |
5-15 years | |||
| Buildings |
40 years | |||
| Furniture and equipment |
5-15 years |
47
HopFed Bancorp, Inc. and Subsidiaries
Notes to Consolidated Financial Statements, Continued
December 31, 2017, 2016 and 2015
| (1) | Summary of Significant Accounting Policies: (Continued) |
Bank Owned Life Insurance
Bank owned life insurance policies (BOLI) are recorded at the cash surrender value or the amount to be realized upon current redemption. The realization of the redemption value is evaluated for each insuring entity that holds insurance contracts annually by management.
Advertising
The Company expenses the production cost of advertising as incurred.
Financial Instruments
The Company has entered into off-balance-sheet financial instruments consisting of commitments to extend credit and commercial letters of credit. Such financial instruments are recorded in the consolidated financial statements when they are funded or related fees are incurred or received.
Fair Values of Financial Instruments (ASC 825) requires disclosure of fair value information about financial instruments, whether or not recognized in the consolidated balance sheets for which it is practicable to estimate that value. In cases where quoted market prices are not available, fair values are based on estimates using present value or other valuation techniques. Those techniques are significantly affected by the assumptions used, including the discount rate and estimates of future cash flows. In that regard, the derived fair value estimates cannot be substantiated by comparison to independent markets and, in many cases, could not be realized in immediate settlement of the instruments. Fair value estimates are made at a point in time, based on relevant market information and information about the financial instrument. Accordingly, such estimates involve uncertainties and matters of judgment and therefore cannot be determined with precision. ASC 825 excludes certain financial instruments and all non-financial instruments from its disclosure requirements. Accordingly, the aggregate fair value amounts presented do not represent the underlying value of the Company.
The following are the more significant methods and assumptions used by the Company in estimating its fair value disclosures for financial instruments:
Cash and due from banks
The carrying amounts reported in the consolidated balance sheets for cash and due from banks approximate those assets’ fair values because they mature within 90 days or less and do not present credit risk concerns.
Interest-bearing deposits in banks
The carrying amounts reported in the consolidated balance sheets for interest bearing deposits in banks approximate those assets’ fair values because they are considered overnight deposits and may be withdrawn at any time without penalty and do not present credit risk concerns.
48
HopFed Bancorp, Inc. and Subsidiaries
Notes to Consolidated Financial Statements, Continued
December 31, 2017, 2016 and 2015
| (1) | Summary of Significant Accounting Policies: (Continued) |
Fair Values of Financial Instruments (Continued)
FHLB stock
The fair value of FHLB stock is recognized at cost.
Available-for-sale securities
Fair values for investment securities available-for-sale are based on quoted market prices, where available. If quoted market prices are not available, fair values are based on quoted market prices of comparable instruments provided by a third party pricing service. The Company reviews all securities in which the book value is greater than the market value for impairment that is other than temporary. For securities deemed to be other than temporarily impaired, the Company reduces the book value of the security to its market value by recognizing an impairment charge on its income statement.
Loans held for sale
Mortgage loans originated and intended to be sold are carried at the lower of cost or estimated fair value as determined on a loan by loan basis. Gains or losses are recognized at the time of ownership transfer. Net unrealized losses, if any, are recognized through a valuation allowance and charged to income.
Loans receivable
The fair values for of fixed-rate loans and variable rate loans that re-price on an infrequent basis is estimated using discounted cash flow analysis which considers future re-pricing dates and estimated repayment dates, and further using interest rates currently being offered for loans of similar type, terms to borrowers of similar credit quality. Loan fair value estimates include judgments regarding future expected loss experience and risk characteristics. The estimated fair value of variable-rate loans that re-price frequently and have no significant change in credit risk is approximately the carrying value of the loan.
Accrued interest receivable
Fair value is estimated to approximate the carrying amount because such amounts are expected to be received within 90 days or less and any credit concerns have been previously considered in the carrying value.
Deposits
The fair values disclosed for deposits with no stated maturity such as demand deposits, interest-bearing checking accounts and savings accounts are, by definition, equal to the amount payable on demand at the reporting date (that is, their carrying amounts). The fair values for certificates of deposit and other fixed maturity time deposits are estimated using a discounted cash flow calculation that applies interest rates currently being offered on such type accounts or similar accounts to a schedule of aggregated contractual maturities or similar maturities on such time deposits.
Repurchase agreements
Overnight repurchase agreements have a fair value at book, given that they mature overnight.
49
HopFed Bancorp, Inc. and Subsidiaries
Notes to Consolidated Financial Statements, Continued
December 31, 2017, 2016 and 2015
| (1) | Summary of Significant Accounting Policies: (Continued) |
Fair Values of Financial Instruments (Continued)
Advances from the Federal Home Loan Bank (FHLB)
The fair value of these advances is estimated by discounting the future cash flows of these advances using the current rates at which similar advances or similar financial instruments could be obtained.
Subordinated debentures
The book value of subordinated debentures is cost. The subordinated debentures re-price quarterly at a rate equal to three month libor plus 3.10%.
Dividend Restrictions
The Company is not permitted to pay a dividend to common shareholders if it fails to make a quarterly interest payment to the holders of the Company’s subordinated debentures. Furthermore, the Bank may be restricted in the payment of dividends to the Corporation by the KDFI or FDIC. Any restrictions imposed by either regulator would effectively limit the Company’s ability to pay a dividend to its common stockholders as discussed in Note 16. At December 31, 2017, there were no such restrictions. At December 31, 2017 and December 31, 2016, the Corporation had cash balances on hand to pay common dividends and repurchase treasury stock as outlined in Note 19 of approximately $860,000 and $1.1 million, respectively.
Earnings Per Share
Earnings per share (EPS) consists of two separate components, basic EPS and diluted EPS. Basic EPS is computed by dividing net income available to common shareholders by the weighted average number of common shares outstanding for each period presented. Diluted EPS is calculated by dividing net income available to common shareholders by the weighted average number of common shares outstanding plus dilutive common stock equivalents (CSE). CSE consists of dilutive stock options granted through the Company’s stock option plan. Restricted stock awards represent future compensation expense and are dilutive. Anti-dilutive common stock equivalents are not included for the purposes of this calculation. At December 31, 2017 and December 31, 2016, the Company has no warrants or stock options outstanding.
Stock Compensation
Compensation cost is recognized for restricted stock awards issued to employees based on the fair value of these awards at the date of grant. The cost is recognized over the required service period, generally defined as the vesting period.
50
HopFed Bancorp, Inc. and Subsidiaries
Notes to Consolidated Financial Statements, Continued
December 31, 2017, 2016 and 2015
| (1) | Summary of Significant Accounting Policies: (Continued) |
Effect of New Accounting Pronouncements
In May 2014, the FASB issued new guidance related to “Revenue from Contracts with Customers.” This guidance supersedes the revenue recognition requirements in ASC Topic 605, Revenue Recognition, and most industry-specific guidance throughout the ASC. The guidance requires an entity to recognize revenue to depict the transfer of promised goods or services to customers in an amount that reflects the consideration to which the company expects to be entitled in exchange for those goods or services. This guidance is effective for interim and annual reporting periods beginning after December 15, 2016; however, the FASB has agreed to a one-year deferral of the effective date to annual reporting periods beginning after December 15, 2017. The implementation of ASC Topic 605 is not expected to have a material impact on the Company’s Consolidated Financial Statements.
ASU 2016-01, “Financial Instruments – Overall (Subtopic 825-10): Recognition and Measurement of Financial Assets and Financial Liabilities.” ASU 2016-01, among other things, (i) requires equity investments, with certain exceptions, to be measured at fair value with changes in fair value recognized in net income, (ii) simplifies the impairment assessment of equity investments without readily determinable fair values by requiring a qualitative assessment to identify impairment, (iii) eliminates the requirement for public business entities to disclose the methods and significant assumptions used to estimate the fair value that is required to be disclosed for financial instruments measured at amortized cost on the balance sheet, (iv) requires public business entities to use the exit price notion when measuring the fair value of financial instruments for disclosure purposes, (v) requires an entity to present separately in other comprehensive income the portion of the total change in the fair value of a liability resulting from a change in the instrument-specific credit risk when the entity has elected to measure the liability at fair value in accordance with the fair value option for financial instruments, (vi) requires separate presentation of financial assets and financial liabilities by measurement category and form of financial asset on the balance sheet or the accompanying notes to the financial statements and (vii) clarifies that an entity should evaluate the need for a valuation allowance on a deferred tax asset related to available-for-sale. ASU 2016-01 will be effective on January 1, 2018, and is not expected to have a material effect on the Company’s Consolidated Financial Statements.
ASU 2016-02, “Leases (Topic 842).” ASU 2016-02 will, among other things, require lessees to recognize a lease liability, which is a lessee’s obligation to make lease payments arising from a lease, measured on a discounted basis; and a right-of-use asset, which is an asset that represents the lessee’s right to use, or control the use of, a specified asset for the lease term. ASU 2016-02 does not significantly change lease accounting requirements applicable to lessors; however, certain changes were made to align, where necessary, lessor accounting with the lessee accounting model and ASC Topic 606, “Revenue from Contracts with Customers.” ASU 2016-02 will be effective for us on January 1, 2019, and will require transition using a modified retrospective approach for leases existing at, or entered into after, the beginning of the earliest comparative period presented in the financial statements. We are currently evaluating the potential impact of ASU 2016-02 on the Company’s Consolidated Financial Statements.
51
HopFed Bancorp, Inc. and Subsidiaries
Notes to Consolidated Financial Statements, Continued
December 31, 2017, 2016 and 2015
| (1) | Summary of Significant Accounting Policies: (Continued) |
Effect of New Accounting Pronouncements (Continued)
ASU 2016-09, “Compensation – Stock Compensation (Topic 718): Improvements to Employee Share-Based Payment Accounting.” Under ASU 2016-09 all excess tax benefits and tax deficiencies related to share-based payment awards should be recognized as income tax expense or benefit in the income statement during the period in which they occur. Previously, such amounts were recorded in the pool of excess tax benefits included in additional paid-in capital, if such pool was available. Because excess tax benefits are no longer recognized in additional paid-in capital, the assumed proceeds from applying the treasury stock method when computing earnings per share should exclude the amount of excess tax benefits that would have previously been recognized in additional paid-in capital. Additionally, excess tax benefits should be classified along with other income tax cash flows as an operating activity rather than a financing activity, as was previously the case. ASU 2016-09 also provides that an entity can make an entity-wide accounting policy election to either estimate the number of awards that are expected to vest (current GAAP) or account for forfeitures when they occur. ASU 2016-09 changes the threshold to qualify for equity classification (rather than as a liability) to permit withholding up to the maximum statutory tax rates (rather than the minimum as was previously the case) in the applicable jurisdictions. ASU 2016-09 was effective on January 1, 2017. The implementation of ASU 2016-09 did not have a material effect on the Company’s Consolidated Financial Statements.
On June 16, 2016, the FASB released its finalized ASU 2016-13, “Financial Instruments – Credit Losses (Topic 326): Measurement of Credit Losses on Financial Instruments”. The amendments to U.S. GAAP require businesses and other organization to measure the expected credit losses on financial assets, such as loans, securities, bond insurance, and many receivables, the FASB said. The accounting changes apply to instruments recorded on balance sheets at their historical cost, although there are some limited changes to the accounting for debt instruments classified as available-for-sale. Write-downs will be based on historical information, current business conditions, and forecasts, and FASB expects the forecasts to improve the loss estimates on financial assets that are losing value. FASB also said the techniques that are employed today to write down loans and other instruments can still be used, although FASB expects the variables for calculating the losses to change. ASU 2016-13 will become effective on January 1, 2020. Companies are permitted to adopt ASU 2016-13 in fiscal years beginning after December 15, 2018. The Company is currently evaluating the potential impact of ASU 2016-13.
ASU 2016-15 “Statement of Cash Flows” (Topic 230) is intended to reduce the diversity in practice around how certain transactions are classified within the statement of cash flows. ASU 2016-15 is effective for public companies for annual periods beginning after December 15, 2017 including interim periods within those fiscal years. Early adoption is permitted with retrospective application. The application of ASU 2016-15 did not have a material impact on the Company’s Consolidated Financial Statements.
52
HopFed Bancorp, Inc. and Subsidiaries
Notes to Consolidated Financial Statements, Continued
December 31, 2017, 2016 and 2015
| (1) | Summary of Significant Accounting Policies: (Continued) |
Effect of New Accounting Pronouncements (Continued)
ASU 2017-08, “Receivables – Nonrefundable Fees and Other Cost” (Topic 310) – amends the amortization period for certain purchased callable debt securities held at a premium. Prior to the issuance of this guidance, premiums were amortized as an adjustment of yield over the contractual life of instrument. ASU 2017-08 premiums on purchased callable debt securities that have an explicit, non-contingent call features that are callable at fixed prices to be amortized to the earliest call date. There are no accounting changes for securities held at a discount. This ASU is effective for annual periods and interim periods within those annual periods beginning after December 15, 2018 and early adoption is permitted. The adoption of ASU 2017-08 is not expected to have a material impact on the Company’s Consolidated Financial Statements.
ASU 2017-09 “Compensation – Stock Compensation” (Topic 718) – clarifies when changes to the terms or conditions of a share-based payment must be accounted for as modifications. Under AUS 2017-09, an entity should account for changes to the terms or conditions of a share-based payment unless all of the following are met:
| • | The fair value of the modified award is the same as the fair value of the original award immediately before modification, |
| • | The vesting conditions of the modified award is the same as the vesting conditions value of the original award immediately before modification, and |
| • | The classification of the modified award as an equity instrument or a liability instrument is the same as the classification of the original award immediately before modification. |
ASU 2017-09 will be effective for the Company on January 1, 2018 and is not expected to have a material impact on our consolidated financial statements.
ASU 2017-12 “Derivatives and Hedging (Topic 815) amends the hedge accounting recognition and presentation requirements in ASC 815 to improve the transparency and understandability of information convey to financial statement users about an entity’s risk management activities to better align the entity’s financial reporting for hedging relationships with those risk management activities and to reduce the complexity of and simplify the application of hedge accounting. ASU 2017-12 will be effective for the Company on January 1, 2019 and is not expected to have a material impact on the Company’s Consolidated Financial Statements.
Other accounting standards that have been issued or proposed by the FASB or other standards bodies are not expected to have a material impact on the Company’s financial position, results of operations or cash flows.
Reclassifications
Certain items in prior financial statements have been reclassified to conform to the current presentation. Reclassifications had no effect on prior year’s net income or shareholders’ equity.
53
HopFed Bancorp, Inc. and Subsidiaries
Notes to Consolidated Financial Statements, Continued
December 31, 2017, 2016 and 2015
(Table Amounts in Thousands)
| (2) | Securities: |
Securities, which consist of debt and equity investments, have been classified in the consolidated balance sheets according to management’s intent. The carrying amount of securities and their estimated fair values follow:
| December 31, 2017 | ||||||||||||||||
| Gross | Gross | Estimated | ||||||||||||||
| Amortized | Unrealized | Unrealized | Fair | |||||||||||||
| Cost | Gains | Losses | Value | |||||||||||||
| Restricted: |
||||||||||||||||
| FHLB stock |
$ | 4,428 | — | — | 4,428 | |||||||||||
|
|
|
|
|
|
|
|
|
|||||||||
| Available for Sale: |
||||||||||||||||
| U.S. Agency securities |
$ | 84,210 | 536 | (653 | ) | 84,093 | ||||||||||
| Tax free municipal bonds |
26,412 | 637 | (83 | ) | 26,966 | |||||||||||
| Taxable municipal bonds |
1,279 | 5 | (1 | ) | 1,283 | |||||||||||
| Trust preferred securities |
1,650 | 35 | — | 1,685 | ||||||||||||
| Mortgage-backed securities |
71,389 | 201 | (826 | ) | 70,764 | |||||||||||
|
|
|
|
|
|
|
|
|
|||||||||
| $ | 184,940 | 1,414 | (1,563 | ) | 184,791 | |||||||||||
|
|
|
|
|
|
|
|
|
|||||||||
| December 31, 2016 | ||||||||||||||||
| Gross | Gross | Estimated | ||||||||||||||
| Amortized | Unrealized | Unrealized | Fair | |||||||||||||
| Cost | Gains | Losses | Value | |||||||||||||
| Restricted: |
||||||||||||||||
| FHLB stock |
$ | 4,428 | — | — | 4,428 | |||||||||||
|
|
|
|
|
|
|
|
|
|||||||||
| Available for Sale: |
||||||||||||||||
| U.S. Treasury securities |
$ | 2,000 | 1 | — | 2,001 | |||||||||||
| U.S. Agency securities |
83,667 | 983 | (638 | ) | 84,012 | |||||||||||
| Tax free municipal bonds |
33,004 | 1,081 | (174 | ) | 33,911 | |||||||||||
| Taxable municipal bonds |
2,720 | 17 | (10 | ) | 2,727 | |||||||||||
| Trust preferred securities |
1,634 | 183 | — | 1,817 | ||||||||||||
| Mortgage-backed securities |
85,626 | 437 | (1,051 | ) | 85,012 | |||||||||||
|
|
|
|
|
|
|
|
|
|||||||||
| $ | 208,651 | 2,702 | (1,873 | ) | 209,480 | |||||||||||
|
|
|
|
|
|
|
|
|
|||||||||
54
HopFed Bancorp, Inc. and Subsidiaries
Notes to Consolidated Financial Statements, Continued
December 31, 2017, 2016 and 2015
(Table Amounts in Thousands)
| (2) | Securities: (Continued) |
The scheduled maturities of debt securities available for sale at December 31, 2017 and December 31, 2016 were as follows:
| December 31, 2017 |
Amortized Cost |
Estimated Fair Value |
||||||
| Due within one year |
$ | 2,078 | 2,095 | |||||
| Due in one to five years |
28,692 | 28,624 | ||||||
| Due in five to ten years |
18,161 | 18,287 | ||||||
| Due after ten years |
7,218 | 7,443 | ||||||
|
|
|
|
|
|||||
| 56,149 | 56,449 | |||||||
| Amortizing agency bonds |
57,402 | 57,578 | ||||||
| Mortgage-backed securities |
71,389 | 70,764 | ||||||
|
|
|
|
|
|||||
| Total unrestricted securities available for sale |
$ | 184,940 | 184,791 | |||||
|
|
|
|
|
|||||
| December 31, 2016 |
Amortized Cost |
Estimated Fair Value |
||||||
| Due within one year |
$ | 6,605 | 6,615 | |||||
| Due in one to five years |
13,913 | 14,067 | ||||||
| Due in five to ten years |
32,611 | 32,744 | ||||||
| Due after ten years |
13,022 | 13,603 | ||||||
|
|
|
|
|
|||||
| 66,151 | 67,029 | |||||||
| Amortizing agency bonds |
56,874 | 57,439 | ||||||
| Mortgage-backed securities |
85,626 | 85,012 | ||||||
|
|
|
|
|
|||||
| Total unrestricted securities available for sale |
$ | 208,651 | 209,480 | |||||
|
|
|
|
|
|||||
55
HopFed Bancorp, Inc. and Subsidiaries
Notes to Consolidated Financial Statements, Continued
December 31, 2017, 2016 and 2015
(Table Amounts in Thousands)
| (2) | Securities: (Continued) |
The estimated fair value and unrealized loss amounts of temporarily impaired investments as of December 31, 2017 and December 31, 2016 are as follows:
| Less than 12 months | 12 months or longer | Total | ||||||||||||||||||||||
| December 31, 2017 |
Estimated Fair Value |
Unrealized Losses |
Estimated Fair Value |
Unrealized Losses |
Estimated Fair Value |
Unrealized Losses |
||||||||||||||||||
| Available for sale |
||||||||||||||||||||||||
| U.S. Agency securities |
$ | 41,501 | (431 | ) | 9,846 | (222 | ) | 51,347 | (653 | ) | ||||||||||||||
| Taxable municipals |
521 | (1 | ) | — | — | 521 | (1 | ) | ||||||||||||||||
| Tax free municipals |
4,860 | (51 | ) | 913 | (32 | ) | 5,773 | (83 | ) | |||||||||||||||
| Mortgage-backed securities |
40,441 | (289 | ) | 21,566 | (537 | ) | 62,007 | (826 | ) | |||||||||||||||
|
|
|
|
|
|
|
|
|
|
|
|
|
|||||||||||||
| Total Available for Sale |
$ | 87,323 | (772 | ) | 32,325 | (791 | ) | 119,648 | (1,563 | ) | ||||||||||||||
|
|
|
|
|
|
|
|
|
|
|
|
|
|||||||||||||
| Less than 12 months | 12 months or longer | Total | ||||||||||||||||||||||
| December 31, 2016 |
Estimated Fair Value |
Unrealized Losses |
Estimated Fair Value |
Unrealized Losses |
Estimated Fair Value |
Unrealized Losses |
||||||||||||||||||
| Available for sale |
||||||||||||||||||||||||
| U.S. Agency securities |
$ | 41,963 | (597 | ) | 3,459 | (41 | ) | 45,422 | (638 | ) | ||||||||||||||
| Taxable municipals |
1,347 | (10 | ) | — | — | 1,347 | (10 | ) | ||||||||||||||||
| Tax free municipals |
7,369 | (174 | ) | — | — | 7,369 | (174 | ) | ||||||||||||||||
| Mortgage-backed securities |
48,462 | (796 | ) | 7,439 | (255 | ) | 55,901 | (1,051 | ) | |||||||||||||||
|
|
|
|
|
|
|
|
|
|
|
|
|
|||||||||||||
| Total Available for Sale |
$ | 99,141 | (1,577 | ) | 10,898 | (296 | ) | 110,039 | (1,873 | ) | ||||||||||||||
|
|
|
|
|
|
|
|
|
|
|
|
|
|||||||||||||
Management evaluates securities for other-than-temporary impairment at least on a quarterly basis, and more frequently when economic or market concerns warrant such evaluations. Management gives consideration to (1) the length of time and the extent to which the fair value has been less than cost, (2) the financial condition and near-term prospects of the issuer, and (3) the intent and ability of the Company to retain its investment in the issuer for a period of time sufficient to allow for any anticipated recovery in fair value.
56
HopFed Bancorp, Inc. and Subsidiaries
Notes to Consolidated Financial Statements, Continued
December 31, 2017, 2016 and 2015
| (2) | Securities: (Continued) |
At December 31, 2017, the Company has 83 securities with unrealized losses. Management believes these unrealized losses relate to changes in interest rates and not credit quality. Management also believes the Company has the ability to hold these securities until maturity and, therefore, no declines are deemed to be other than temporary. The carrying value of the Company’s investment securities may decline in the future if the financial condition of issuers deteriorates and management determines it is probable that the Company will not recover the entire amortized cost bases of the securities. As a result, there is a risk that other-than-temporary impairment charges may occur in the future.
In June of 2008, the Company purchased $2.0 million par value of a private placement subordinated debenture issued by First Financial Services Corporation (“FFKY”), the holding Company for First Federal Savings Bank (“First Fed”). The debenture is a thirty-year security with a coupon rate of 8.00%. FFKY is a NASDAQ listed commercial bank holding company located in Elizabethtown, Kentucky. In October of 2010, FFKY informed the owners of its subordinated trust, including the Company, that it was deferring the dividend payments for up to five years as prescribed by the trust agreement.
At September 30, 2013, the Company recognized a $400,000 impairment charge related to management’s financial analysis of the issuing institution, and our opinion that it would be unable to make dividend payments after the five-year extension expired. In January 2015, Your Community Bancshares (“YCB”) purchased FFKY. In September of 2016, Wesbanco (“WSBC”) closed on its purchase of YCB. WSBC is a $9.9 billion institution headquartered in West Virginia. WSBC has assumed the debt originally issued by FFKY, and all interest is now current. The Company is currently accreting the $400,000 impairment charge back into income ratably.
During 2017, the Company sold investment securities classified as available for sale for proceeds of $18.0 million resulting in gross gains of $272,000 and gross losses of $103,000. During 2016, the Company sold investment securities classified as available for sale for proceeds of $19.0 million resulting in gross gains of $690,000 and gross losses of $78,000. During 2015, the Company sold investment securities classified as available for sale for proceeds of $84.9 million resulting in gross gains of $1,274,000 and gross losses of $583,000.
As part of its normal course of business, the Bank holds significant balances of municipal and other deposits that require the Bank to pledge investment instruments as collateral. At December 31, 2017, the Bank pledged investments with a book value of $118.0 million and a market value of approximately $119.8 million to various municipal entities as required by law. In addition, the Bank has provided $47.6 million of letters of credit issued by the Federal Home Loan Bank of Cincinnati to collateralize municipal deposits. At December 31, 2016, the Bank pledged investments with a book value of $125.6 million and a market value of approximately $128.4 million to various municipal entities as required by law. In addition, the Bank provided $45.6 million of letters of credit issued by the Federal Home Loan Bank of Cincinnati to collateralize municipal deposits. At December 31, 2017 and December 31, 2016, the collateral for the letters of credit issued are the Bank’s one to four family loan portfolio.
57
HopFed Bancorp, Inc. and Subsidiaries
Notes to Consolidated Financial Statements, Continued
December 31, 2017, 2016 and 2015
| (3) | Loans Receivable, Net: |
The Company uses the following loan segments as described below:
| • | One-to-four family first mortgages are closed-end loans secured by residential housing. Loans may be either owner or non-owner occupied properties. If the loan is owner-occupied, the loan is analyzed and under-written as a consumer loan. Loan terms may be up to 30 years. |
| • | Home equity lines of credit may be first or second mortgages secured by one-to-four family properties. Home equity loans carry a variable rate and typically are open ended for a period not to exceed ten years with a fifteen year final maturity. Loans secured by home equity lines of credit are under-written under the Company’s consumer loan guidelines. |
| • | Junior liens are closed-end loans secured by one-to-four family residences with a fixed or variable rate. Typically, the collateral for these loans are owner occupied units with a subordinate lien. Loans secured by junior liens are under-written under the Company’s consumer loan guidelines. |
| • | Multi-family loans are closed-end loans secured by residential housing with five or more units in a single building. Multi-family loans may carry a variable rate of interest or the interest rate on the loan is a fixed rate (usually five years). After the initial fixed rate period, the loan reverts to a variable rate or has balloon maturity. Multi-family loans have amortization terms of up to twenty years and are under-written under the Company’s commercial loan underwriting guidelines. |
| • | Constructions loans may consist of residential or commercial properties and carry a fixed or variable rate for the term of the construction period. Construction loans have a maturity of between twelve and twenty-four months depending on the type of property. After the construction period, loans are amortized over a twenty-year period. All construction loans are under written under the Company’s commercial loan underwriting guidelines for the type of property being constructed. |
| • | Land loans consist of properties currently under development, land held for future development and land held for recreational purposes. Land loans used for recreational purposes are amortized for twenty years and typically carry a fixed rate of interest for one-to-five years with a balloon maturity or floating rate period to follow and are under-written under the Company’s commercial loan underwriting guidelines. |
| • | Loans classified as farmland by the Company include properties that are used exclusively for the production of grain, livestock, poultry or swine. Loans secured by farmland have a maturity of up to twenty years and carry a fixed rate of interest for five to ten years. Loans secured by farmland are under-written under the Company’s commercial loan underwriting guidelines. |
58
HopFed Bancorp, Inc. and Subsidiaries
Notes to Consolidated Financial Statements, Continued
December 31, 2017, 2016 and 2015
| (3) | Loans Receivable, Net: (Continued) |
| • | Non-residential real estate loans are secured by commercial real estate properties and may be either owner or non-owner occupied. The loans typically have a twenty year maturity and may be fixed for a period of five to ten years. After the initial fixed rate period, the note will either revert to a one year adjustable rate loan or have a balloon maturity. Loans secured by non-residential real estate are under-written under the Company’s commercial loan underwriting standards. |
| • | The Company originates secured and unsecured consumer loans. Collateral for consumer loans may include deposits, brokerage accounts, automobiles and other personal items. Consumer loans are typically fixed for a term of one to five years and are under-written using the Company’s consumer loan policy. |
| • | The Company originates unsecured and secured commercial loans. Secured commercial loans may have business inventory, accounts receivable and equipment as collateral. The typical customer may include all forms of manufacturing, retail and wholesale sales, professional services and various forms of agri-business interest. Commercial loans may be fixed or variable rate and typically have terms between one and five years. |
59
HopFed Bancorp, Inc. and Subsidiaries
Notes to Consolidated Financial Statements, Continued
December 31, 2017, 2016 and 2015
(Table Amounts in Thousands)
| (3) | Loans Receivable, Net: (Continued) |
Set forth below is selected data relating to the composition of the loan portfolio by type of loan at December 31, 2017 and December 31, 2016:
| December 31, 2017 | December 31, 2016 | |||||||
| Real estate loans: |
||||||||
| One-to-four family (closed end) first mortgages |
$ | 163,565 | 147,962 | |||||
| Home equity lines of credit |
35,697 | 35,684 | ||||||
| Junior liens (closed end) |
1,184 | 1,452 | ||||||
| Multi-family |
37,445 | 34,284 | ||||||
| Construction |
30,246 | 39,255 | ||||||
| Land |
14,873 | 23,840 | ||||||
| Non-residential real estate |
224,952 | 182,940 | ||||||
| Farmland |
36,851 | 47,796 | ||||||
|
|
|
|
|
|||||
| Total mortgage loans |
544,813 | 513,213 | ||||||
| Consumer loans |
8,620 | 8,717 | ||||||
| Commercial loans |
88,938 | 88,907 | ||||||
|
|
|
|
|
|||||
| Total other loans |
97,558 | 97,624 | ||||||
|
|
|
|
|
|||||
| Total loans, gross |
642,371 | 610,837 | ||||||
| Deferred loan cost, net of fees |
(443 | ) | (439 | ) | ||||
| Less allowance for loan losses |
(4,826 | ) | (6,112 | ) | ||||
|
|
|
|
|
|||||
| Total loans |
$ | 637,102 | $ | 604,286 | ||||
|
|
|
|
|
|||||
Although the Company has a diversified loan portfolio, 84.8% and 84.0% of the portfolio was concentrated in loans secured by real estate at December 31, 2017 and December 31, 2016, respectively. At December 31, 2017 and December 31, 2016, the majority of these loans are located within the Company’s general operating areas of Western Kentucky and Middle and Western Tennessee.
60
HopFed Bancorp, Inc. and Subsidiaries
Notes to Consolidated Financial Statements, Continued
December 31, 2017, 2016 and 2015
| (3) | Loans Receivable, Net: (Continued) |
Risk Grade Classifications
The Company uses the following risk definitions for commercial loan risk grades:
Excellent—Loans in this category are to persons or entities of unquestioned financial strength, a highly liquid financial position, with collateral that is liquid and well margined. These borrowers have performed without question on past obligations, and the Bank expects their performance to continue. Internally generated cash flow covers current maturities of long-term debt by a substantial margin. Loans secured by Bank certificates of deposit and savings accounts, with appropriate holds placed on the accounts, are to be rated in this category.
Very Good—These are loans to persons or entities with strong financial condition and above-average liquidity who have previously satisfactorily handled their obligations with the Bank. Collateral securing the Bank’s debt is margined in accordance with policy guidelines. Internally generated cash flow covers current maturities of long-term debt more than adequately. Unsecured loans to individuals supported by strong financial statements and on which repayment is satisfactory may be included in this classification.
Satisfactory—Assets of this grade conform to substantially all the Bank’s underwriting criteria and evidence an average level of credit risk; however, such assets display more susceptibility to economic, technological or political changes since they lack the above average financial strength of credits rated Very Good. Borrower’s repayment capacity is considered to be adequate. Credit is appropriately structured and serviced; payment history is satisfactory.
Acceptable—Assets of this grade conform to most of the Bank’s underwriting criteria and evidence an acceptable, though higher than average, level of credit risk; however, these loans have certain risk characteristics which could adversely affect the borrower’s ability to repay given material adverse trends. Loans in this category require an above average level of servicing and show more reliance on collateral and guaranties to preclude a loss to the Bank should material adverse trends develop. If the borrower is a company, its earnings, liquidity and capitalization are slightly below average when compared to its peers.
Watch—These loans are characterized by borrowers who have marginal cash flow, marginal profitability, or have experienced an unprofitable year and a declining financial condition. The borrower has in the past satisfactorily handled debts with the Bank, but in recent months has either been late, delinquent in making payments, or made sporadic payments. While the Bank continues to be adequately secured, margins have decreased or are decreasing, despite the borrower’s continued satisfactory condition. Other characteristics of borrowers in this class include inadequate credit information, weakness of financial statement and repayment capacity, but with collateral that appears to limit exposure. This classification includes loans to established borrowers that are reasonably margined by collateral, but where potential for improvement in financial capacity appears limited.
61
HopFed Bancorp, Inc. and Subsidiaries
Notes to Consolidated Financial Statements, Continued
December 31, 2017, 2016 and 2015
| (3) | Loans Receivable, Net (Continued) |
Risk Grade Classifications (Continued)
Special Mention—Loans in this category have potential weaknesses that deserve management’s close attention. If left uncorrected, these potential weaknesses may result in deteriorating prospects for the asset or in the institution’s credit position at some future date. Borrowers may be experiencing adverse operating trends or market conditions. Non-financial reasons for rating a credit exposure Special Mention include, but are not limited to: management problems, pending litigations, ineffective loan agreement and/or inadequate loan documentation, structural weaknesses and/or lack of control over collateral.
Substandard—A substandard asset is inadequately protected by the current sound worth or paying capacity of the debtor or the collateral pledged. There exists one or more well defined weaknesses that jeopardize the liquidation of the debt. There is a distinct possibility the Bank will experience some loss if the deficiencies are not corrected.
Doubtful—A loan classified as doubtful has all the weaknesses inherent in a loan classified as substandard, with the added characteristic that the weaknesses make collection or liquidation in full, on the basis of currently existing facts, conditions, and values, highly questionable and improbable. These are poor quality loans in which neither the collateral, if any, nor the financial condition of the borrower presently ensure collectability in full in a reasonable period of time; in fact, there is permanent impairment in the collateral securing the Bank’s loan. These loans are in a work-out status and have a defined work-out strategy.
Loss—Loans classified as loss are considered uncollectible and of such little value that their continuance as bankable assets is not warranted. The Bank takes losses in the period in which they become uncollectible.
The following credit risk standards are assigned to consumer loans:
Satisfactory—All consumer open-end and closed-end retail loans shall have an initial risk grade assigned of 3—Satisfactory.
Substandard—All consumer open-end and closed-end retail loans past due 90 cumulative days from the contractual date will be classified as 7—Substandard. If a consumer/retail loan customer files bankruptcy, the loan will be classified as 7—Substandard regardless of payment history.
Loss—All closed-end retail loans that become past due 120 cumulative days and open-end retail loans that become past due 180 cumulative days from the contractual due date will be charged off as loss assets. The charge-off will be taken by the end of the month in which the 120-day or 180-day time period elapses. All losses in retail credit will be recognized when the affiliate becomes aware of the loss, but in no case should the charge off exceed the time frames stated within this policy.
62
HopFed Bancorp, Inc. and Subsidiaries
Notes to Consolidated Financial Statements, Continued
December 31, 2017, 2016 and 2015
(Table Amounts in Thousands)
| (3) | Loans Receivable, Net: (Continued) |
Loans by classification type and credit risk indicator at December 31, 2017 were as follows:
| Pass | Special Mention |
Substandard | Doubtful | Total | ||||||||||||||||
| One-to-four family mortgages |
$ | 162,993 | — | 572 | — | 163,565 | ||||||||||||||
| Home equity line of credit |
35,285 | — | 412 | — | 35,697 | |||||||||||||||
| Junior liens |
1,184 | — | — | — | 1,184 | |||||||||||||||
| Multi-family |
37,445 | — | — | — | 37,445 | |||||||||||||||
| Construction |
30,246 | — | — | — | 30,246 | |||||||||||||||
| Land |
14,318 | — | 555 | — | 14,873 | |||||||||||||||
| Non-residential real estate |
216,901 | 979 | 7,072 | — | 224,952 | |||||||||||||||
| Farmland |
35,253 | 1,147 | 451 | — | 36,851 | |||||||||||||||
| Consumer loans |
8,376 | — | 244 | — | 8,620 | |||||||||||||||
| Commercial loans |
83,892 | 3,572 | 1,474 | — | 88,938 | |||||||||||||||
|
|
|
|
|
|
|
|
|
|
|
|||||||||||
| Total |
$ | 625,893 | 5,698 | 10,780 | — | 642,371 | ||||||||||||||
|
|
|
|
|
|
|
|
|
|
|
|||||||||||
Loans by classification type and credit risk indicator at December 31, 2016 were as follows:
| Pass | Special Mention |
Substandard | Doubtful | Total | ||||||||||||||||
| One-to-four family mortgages |
$ | 145,965 | 744 | 1,253 | — | 147,962 | ||||||||||||||
| Home equity line of credit |
35,109 | 25 | 550 | — | 35,684 | |||||||||||||||
| Junior liens |
1,411 | 30 | 11 | — | 1,452 | |||||||||||||||
| Multi-family |
31,280 | — | 3,004 | — | 34,284 | |||||||||||||||
| Construction |
39,255 | — | — | — | 39,255 | |||||||||||||||
| Land |
15,581 | 35 | 8,224 | — | 23,840 | |||||||||||||||
| Non-residential real estate |
172,395 | 3 | 10,542 | — | 182,940 | |||||||||||||||
| Farmland |
44,832 | 674 | 2,290 | — | 47,796 | |||||||||||||||
| Consumer loans |
8,382 | — | 335 | — | 8,717 | |||||||||||||||
| Commercial loans |
85,174 | 603 | 3,130 | — | 88,907 | |||||||||||||||
|
|
|
|
|
|
|
|
|
|
|
|||||||||||
| Total |
$ | 579,384 | 2,114 | 29,339 | — | 610,837 | ||||||||||||||
|
|
|
|
|
|
|
|
|
|
|
|||||||||||
63
HopFed Bancorp, Inc. and Subsidiaries
Notes to Consolidated Financial Statements, Continued
December 31, 2017, 2016 and 2015
(Table Amounts in Thousands)
| (3) | Loans Receivable, Net: (Continued) |
Impaired loans by classification type and the related valuation allowance amounts at December 31, 2017 were as follows:
| At December 31, 2017 | For the year ended December 31, 2017 |
|||||||||||||||||||
| Recorded Investment |
Unpaid Principal Balance |
Related Allowance |
Average Recorded Investment |
Interest Income Recognized |
||||||||||||||||
| Impaired loans with no specific allowance |
||||||||||||||||||||
| One-to-four family mortgages |
$ | 257 | 257 | — | 1,235 | 35 | ||||||||||||||
| Home equity line of credit |
— | — | — | 447 | 26 | |||||||||||||||
| Junior liens |
— | — | — | 6 | — | |||||||||||||||
| Multi-family |
— | — | — | 1,135 | — | |||||||||||||||
| Construction |
— | — | — | — | — | |||||||||||||||
| Land |
515 | 515 | — | 837 | 44 | |||||||||||||||
| Non-residential real estate |
7,086 | 7,086 | — | 8,979 | 395 | |||||||||||||||
| Farmland |
444 | 444 | — | 1,094 | 35 | |||||||||||||||
| Consumer loans |
— | — | — | 8 | 2 | |||||||||||||||
| Commercial loans |
875 | 875 | — | 1,571 | 46 | |||||||||||||||
|
|
|
|
|
|
|
|
|
|
|
|||||||||||
| Total |
9,177 | 9,177 | — | 15,312 | 583 | |||||||||||||||
|
|
|
|
|
|
|
|
|
|
|
|||||||||||
| Impaired loans with a specific allowance |
||||||||||||||||||||
| One-to-four family mortgages |
$ | — | — | — | — | — | ||||||||||||||
| Home equity line of credit |
— | — | — | — | — | |||||||||||||||
| Junior liens |
— | — | — | — | — | |||||||||||||||
| Multi-family |
— | — | — | — | — | |||||||||||||||
| Construction |
— | — | — | — | — | |||||||||||||||
| Land |
— | — | — | 4,006 | — | |||||||||||||||
| Non-residential real estate |
2 | 2 | 2 | 88 | 2 | |||||||||||||||
| Farmland |
— | — | — | 195 | — | |||||||||||||||
| Consumer loans |
217 | 217 | 54 | 248 | — | |||||||||||||||
| Commercial loans |
541 | 541 | 233 | 479 | 13 | |||||||||||||||
|
|
|
|
|
|
|
|
|
|
|
|||||||||||
| Total |
760 | 760 | 289 | 5,016 | 15 | |||||||||||||||
|
|
|
|
|
|
|
|
|
|
|
|||||||||||
| Total impaired loans |
$ | 9,937 | 9,937 | 289 | 20,328 | 598 | ||||||||||||||
|
|
|
|
|
|
|
|
|
|
|
|||||||||||
64
HopFed Bancorp, Inc. and Subsidiaries
Notes to Consolidated Financial Statements, Continued
December 31, 2017, 2016 and 2015
(Table Amounts in Thousands)
| (3) | Loans Receivable, Net: (Continued) |
Impaired loans by classification type and the related valuation allowance amounts at December 31, 2016 were as follows:
| At December 31, 2016 | For the year ended December 31, 2016 |
|||||||||||||||||||
| Recorded Investment |
Unpaid Principal Balance |
Related Allowance |
Average Recorded Investment |
Interest Income Recognized |
||||||||||||||||
| Impaired loans with no specific allowance |
||||||||||||||||||||
| One-to-four family mortgages |
$ | 1,253 | 1,253 | — | 1,470 | 67 | ||||||||||||||
| Home equity line of credit |
550 | 550 | — | 390 | 24 | |||||||||||||||
| Junior liens |
11 | 11 | — | 13 | 1 | |||||||||||||||
| Multi-family |
3,004 | 3,004 | — | 3,005 | 172 | |||||||||||||||
| Construction |
— | — | — | — | — | |||||||||||||||
| Land |
1,553 | 2,513 | — | 7,868 | 38 | |||||||||||||||
| Non-residential real estate |
10,542 | 10,542 | — | 9,363 | 485 | |||||||||||||||
| Farmland |
2,290 | 2,290 | — | 1,563 | 120 | |||||||||||||||
| Consumer loans |
— | — | — | 21 | 1 | |||||||||||||||
| Commercial loans |
2,865 | 2,865 | — | 3,168 | 112 | |||||||||||||||
|
|
|
|
|
|
|
|
|
|
|
|||||||||||
| Total |
22,068 | 23,028 | — | 26,861 | 1,020 | |||||||||||||||
|
|
|
|
|
|
|
|
|
|
|
|||||||||||
| Impaired loans with a specific allowance |
||||||||||||||||||||
| One-to-four family mortgages |
$ | — | — | — | 452 | — | ||||||||||||||
| Home equity line of credit |
— | — | — | — | — | |||||||||||||||
| Junior liens |
— | — | — | — | — | |||||||||||||||
| Multi-family |
— | — | — | 910 | — | |||||||||||||||
| Construction |
— | — | — | — | — | |||||||||||||||
| Land |
6,671 | 6,671 | 1,036 | 1,811 | 485 | |||||||||||||||
| Non-residential real estate |
— | — | — | — | — | |||||||||||||||
| Farmland |
— | — | — | 533 | — | |||||||||||||||
| Consumer loans |
335 | 335 | 84 | 273 | — | |||||||||||||||
| Commercial loans |
265 | 265 | 28 | 754 | 24 | |||||||||||||||
|
|
|
|
|
|
|
|
|
|
|
|||||||||||
| Total |
7,271 | 7,271 | 1,148 | 4,733 | 509 | |||||||||||||||
|
|
|
|
|
|
|
|
|
|
|
|||||||||||
| Total impaired loans |
$ | 29,339 | 30,299 | 1,148 | 31,594 | 1,529 | ||||||||||||||
|
|
|
|
|
|
|
|
|
|
|
|||||||||||
65
HopFed Bancorp, Inc. and Subsidiaries
Notes to Consolidated Financial Statements, Continued
December 31, 2017, 2016 and 2015
| (3) | Loans Receivable, Net (Continued) |
Allowance for Loan Losses
A loan is considered to be impaired when management determines that it is probable that the Company will be unable to collect all principal and interest payments due in accordance with the contractual terms of the loan agreement. The value of individually impaired loans is measured based on the present value of expected payments or using the fair value of the collateral if the loan is collateral dependent.
The Company has certain lending policies and procedures in place that are designed to maximize loan income within an acceptable level of risk. Management reviews and approves these policies and procedures on a regular basis. A management reporting system supplements the review process by providing the Company with frequent reports related to loan production, loan quality, concentrations of credit, loan delinquencies and non-performing and potential problem loans. Diversification in the loan portfolio is a means of managing risk associated with fluctuations in economic conditions.
66
HopFed Bancorp, Inc. and Subsidiaries
Notes to Consolidated Financial Statements, Continued
December 31, 2017, 2016 and 2015
| (3) | Loans Receivable, Net (Continued) |
Allowance for Loan Losses (Continued)
Management monitors and evaluates commercial real estate loans based on collateral, geography and risk grade criteria. The Company also utilizes third-party experts to provide insight and guidance about economic conditions and trends affecting market areas it serves. In addition, management tracks the level of owner-occupied commercial real estate loans versus non-owner occupied loans. At December 31, 2017, approximately $95.6 million of the outstanding principal balance of the Company’s non-residential real estate loans were secured by owner-occupied properties, approximately $129.4 million was secured by non-owner occupied properties. At December 31, 2016, approximately $78.7 million of the outstanding principal balance of the Company’s non-residential real estate loans were secured by owner-occupied properties, approximately $104.2 million was secured by non-owner occupied properties.
67
HopFed Bancorp, Inc. and Subsidiaries
Notes to Consolidated Financial Statements, Continued
December 31, 2017, 2016 and 2015
(Table Amounts in Thousands)
| (3) | Loans Receivable, Net: (Continued) |
The following table presents the balance in the allowance for loan losses and the recorded investment in loans as of December 31, 2017 and December 31, 2016 by portfolio segment and based on the impairment method as of December 31, 2017 and December 31, 2016.
| Commercial | Land Development / Construction |
Commercial Real Estate |
Residential Real Estate |
Consumer | Total | |||||||||||||||||||
| December 31, 2017: |
||||||||||||||||||||||||
| Allowance for loan losses: |
||||||||||||||||||||||||
| Ending allowance balance attributable to loans: |
||||||||||||||||||||||||
| Individually evaluated for impairment |
$ | 233 | — | 2 | — | 54 | 289 | |||||||||||||||||
| Collectively evaluated for impairment |
614 | 1,384 | 1,468 | 941 | 130 | 4,537 | ||||||||||||||||||
|
|
|
|
|
|
|
|
|
|
|
|
|
|||||||||||||
| Total ending allowance balance |
$ | 847 | 1,384 | 1,470 | 941 | 184 | 4,826 | |||||||||||||||||
|
|
|
|
|
|
|
|
|
|
|
|
|
|||||||||||||
| Loans: |
||||||||||||||||||||||||
| Loans individually evaluated for impairment |
$ | 1,416 | 515 | 7,532 | 257 | 217 | 9,937 | |||||||||||||||||
| Loans collectively evaluated for impairment |
87,522 | 44,604 | 291,716 | 200,189 | 8,403 | 632,434 | ||||||||||||||||||
|
|
|
|
|
|
|
|
|
|
|
|
|
|||||||||||||
| Total ending loans balance |
$ | 88,938 | 45,119 | 299,248 | 200,446 | 8,620 | 642,371 | |||||||||||||||||
|
|
|
|
|
|
|
|
|
|
|
|
|
|||||||||||||
| Commercial | Land Development / Construction |
Commercial Real Estate |
Residential Real Estate |
Consumer | Total | |||||||||||||||||||
| December 31, 2016: |
||||||||||||||||||||||||
| Allowance for loan losses: |
||||||||||||||||||||||||
| Ending allowance balance attributable to loans: |
||||||||||||||||||||||||
| Individually evaluated for impairment |
$ | 28 | 1,036 | — | — | 84 | 1,148 | |||||||||||||||||
| Collectively evaluated for impairment |
565 | 1,001 | 2,154 | 1,120 | 124 | 4,964 | ||||||||||||||||||
|
|
|
|
|
|
|
|
|
|
|
|
|
|||||||||||||
| Total ending allowance balance |
$ | 593 | 2,037 | 2,154 | 1,120 | 208 | 6,112 | |||||||||||||||||
|
|
|
|
|
|
|
|
|
|
|
|
|
|||||||||||||
| Loans: |
||||||||||||||||||||||||
| Loans individually evaluated for impairment |
$ | 3,130 | 8,224 | 15,836 | 1,814 | 335 | 29,339 | |||||||||||||||||
| Loans collectively evaluated for impairment |
85,777 | 54,871 | 249,184 | 183,284 | 8,382 | 581,498 | ||||||||||||||||||
|
|
|
|
|
|
|
|
|
|
|
|
|
|||||||||||||
| Total ending loans balance |
$ | 88,907 | 63,095 | 265,020 | 185,098 | 8,717 | 610,837 | |||||||||||||||||
|
|
|
|
|
|
|
|
|
|
|
|
|
|||||||||||||
68
HopFed Bancorp, Inc. and Subsidiaries
Notes to Consolidated Financial Statements, Continued
December 31, 2017, 2016 and 2015
(Table Amounts in Thousands)
| (3) | Loans Receivable, Net: (Continued) |
The average recorded investment in impaired loans for the years ended December 31, 2017 and 2016 was $20.3 million and $31.6 million, respectively. For the year ended December 31, 2017, the Company recognized $598,000 of interest income on impaired loans as compared to $1.5 million of interest income on impaired loans for the years ended December 31, 2016. The following table provides a detail of the Company’s activity in the allowance for loan loss account allocated by loan type for the years ended December 31, 2017, December 31, 2016 and December 31, 2015:
| December 31, 2017 |
Balance 12/31/2016 |
Charge off |
Recovery | Provision for Loan Loss |
Ending Balance 12/31/2017 |
|||||||||||||||
| One-to-four family mortgages |
$ | 852 | (66 | ) | 13 | (52 | ) | 747 | ||||||||||||
| Home equity line of credit |
260 | — | 12 | (83 | ) | 189 | ||||||||||||||
| Junior liens |
8 | — | 4 | (7 | ) | 5 | ||||||||||||||
| Multi-family |
412 | — | 417 | (515 | ) | 314 | ||||||||||||||
| Construction |
277 | — | — | (116 | ) | 161 | ||||||||||||||
| Land |
1,760 | (2,608 | ) | 559 | 1,512 | 1,223 | ||||||||||||||
| Non-residential real estate |
964 | — | 16 | (191 | ) | 789 | ||||||||||||||
| Farmland |
778 | — | 10 | (421 | ) | 367 | ||||||||||||||
| Consumer loans |
208 | (261 | ) | 87 | 150 | 184 | ||||||||||||||
| Commercial loans |
593 | (224 | ) | 278 | 200 | 847 | ||||||||||||||
|
|
|
|
|
|
|
|
|
|
|
|||||||||||
| $ | 6,112 | (3,159 | ) | 1,396 | 477 | 4,826 | ||||||||||||||
|
|
|
|
|
|
|
|
|
|
|
|||||||||||
| December 31, 2016 |
Balance 12/31/2015 |
Charge off |
Recovery | Provision for Loan Loss |
Ending Balance 12/31/2016 |
|||||||||||||||
| One-to-four family mortgages |
$ | 1,030 | — | 167 | (345 | ) | 852 | |||||||||||||
| Home equity line of credit |
201 | (30 | ) | 14 | 75 | 260 | ||||||||||||||
| Junior liens |
8 | — | 14 | (14 | ) | 8 | ||||||||||||||
| Multi-family |
227 | (421 | ) | — | 606 | 412 | ||||||||||||||
| Construction |
377 | — | — | (100 | ) | 277 | ||||||||||||||
| Land |
1,379 | — | — | 381 | 1,760 | |||||||||||||||
| Non-residential real estate |
1,139 | — | 10 | (185 | ) | 964 | ||||||||||||||
| Farmland |
358 | — | — | 420 | 778 | |||||||||||||||
| Consumer loans |
358 | (422 | ) | 293 | (21 | ) | 208 | |||||||||||||
| Commercial loans |
623 | (595 | ) | 141 | 424 | 593 | ||||||||||||||
|
|
|
|
|
|
|
|
|
|
|
|||||||||||
| $ | 5,700 | (1,468 | ) | 639 | 1,241 | 6,112 | ||||||||||||||
|
|
|
|
|
|
|
|
|
|
|
|||||||||||
69
HopFed Bancorp, Inc. and Subsidiaries
Notes to Consolidated Financial Statements, Continued
December 31, 2017, 2016 and 2015
(Table Amounts in Thousands)
| (3) | Loans Receivable, Net: (Continued) |
| December 31, 2015 |
Balance 12/31/2014 |
Charge off | Recovery | Provision for Loan Loss |
Ending Balance 12/31/2015 |
|||||||||||||||
| One-to-four family mortgages |
$ | 1,198 | (143 | ) | 39 | (64 | ) | 1,030 | ||||||||||||
| Home equity line of credit |
181 | (92 | ) | 10 | 102 | 201 | ||||||||||||||
| Junior liens |
14 | — | 4 | (10 | ) | 8 | ||||||||||||||
| Multi-family |
85 | — | — | 142 | 227 | |||||||||||||||
| Construction |
146 | — | — | 231 | 377 | |||||||||||||||
| Land |
1,123 | (911 | ) | — | 1,167 | 1,379 | ||||||||||||||
| Non-residential real estate |
2,083 | (222 | ) | 2 | (724 | ) | 1,139 | |||||||||||||
| Farmland |
461 | — | — | (103 | ) | 358 | ||||||||||||||
| Consumer loans |
494 | (298 | ) | 118 | 44 | 358 | ||||||||||||||
| Commercial loans |
504 | (201 | ) | 54 | 266 | 623 | ||||||||||||||
|
|
|
|
|
|
|
|
|
|
|
|||||||||||
| $ | 6,289 | (1,867 | ) | 227 | 1,051 | 5,700 | ||||||||||||||
|
|
|
|
|
|
|
|
|
|
|
|||||||||||
Non-accrual loans totaled $1.3 million and $9.1 million at December 31, 2017 and December 31, 2016, respectively. All non-accrual loans noted below are classified as substandard. Interest income foregone on such loans totaled $100,000 at December 31, 2017, $108,000 at December 31, 2016, and $337,000 at December 31, 2015, respectively. The Company is not committed to lend additional funds to borrowers whose loans have been placed on a non-accrual basis. At December 31, 2017, there was one loan with a balance $88,000 that was past due more than ninety days and still accruing interest. There were no loans past due more than three months and still accruing interest as of December 31, 2016 and December 31, 2015, respectively. At December 31, 2017 and December 31, 2016, the Company’s balances of non-accrual loans by loan type are as follows:
| 12/31/2017 | 12/31/2016 | |||||||
| One-to-four family first mortgages |
$ | 266 | $ | 270 | ||||
| Home equity lines of credit |
402 | 402 | ||||||
| Junior lien |
4 | — | ||||||
| Land |
40 | 7,675 | ||||||
| Non-residential real estate |
— | 208 | ||||||
| Farmland |
111 | — | ||||||
| Consumer loans |
3 | 3 | ||||||
| Commercial loans |
459 | 516 | ||||||
|
|
|
|
|
|||||
| Total non-accrual loans |
$ | 1,285 | $ | 9,074 | ||||
|
|
|
|
|
|||||
70
HopFed Bancorp, Inc. and Subsidiaries
Notes to Consolidated Financial Statements, Continued
December 31, 2017, 2016 and 2015
(Table Amounts in Thousands)
| (3) | Loans Receivable, Net: (Continued) |
The table below presents gross loan balances excluding deferred loan fees of $443,000 at December 31, 2017 by loan classification allocated between past due, performing and non-accrual:
| Currently Performing |
30 – 89 Days Past Due |
More than 90 days past Due and still Accruing |
Non-accrual Loans |
Total | ||||||||||||||||
| One-to-four family mortgages |
$ | 163,030 | 181 | 88 | 266 | $ | 163,565 | |||||||||||||
| Home equity line of credit |
35,295 | — | — | 402 | 35,697 | |||||||||||||||
| Junior liens |
1,180 | — | — | 4 | 1,184 | |||||||||||||||
| Multi-family |
37,445 | — | — | — | 37,445 | |||||||||||||||
| Construction |
30,246 | — | — | — | 30,246 | |||||||||||||||
| Land |
14,833 | — | — | 40 | 14,873 | |||||||||||||||
| Non-residential real estate |
224,743 | 209 | — | — | 224,952 | |||||||||||||||
| Farmland |
36,740 | — | — | 111 | 36,851 | |||||||||||||||
| Consumer loans |
8,614 | 3 | — | 3 | 8,620 | |||||||||||||||
| Commercial loans |
88,479 | — | — | 459 | 88,938 | |||||||||||||||
|
|
|
|
|
|
|
|
|
|
|
|||||||||||
| Total |
$ | 640,605 | 393 | 88 | 1,285 | 642,371 | ||||||||||||||
|
|
|
|
|
|
|
|
|
|
|
|||||||||||
The table below presents gross loan balances excluding deferred loan fees of $439,000 at December 31, 2016 by loan classification allocated between past due, performing and non-accrual:
| Currently Performing |
30 – 89 Days Past Due |
Non-accrual Loans |
Total | |||||||||||||
| One-to-four family mortgages |
$ | 146,796 | 896 | 270 | $ | 147,962 | ||||||||||
| Home equity line of credit |
35,260 | 22 | 402 | 35,684 | ||||||||||||
| Junior liens |
1,448 | 4 | — | 1,452 | ||||||||||||
| Multi-family |
34,284 | — | — | 34,284 | ||||||||||||
| Construction |
39,255 | — | — | 39,255 | ||||||||||||
| Land |
16,165 | — | 7,675 | 23,840 | ||||||||||||
| Non-residential real estate |
182,732 | — | 208 | 182,940 | ||||||||||||
| Farmland |
47,796 | — | — | 47,796 | ||||||||||||
| Consumer loans |
8,686 | 28 | 3 | 8,717 | ||||||||||||
| Commercial loans |
88,130 | 261 | 516 | 88,907 | ||||||||||||
|
|
|
|
|
|
|
|
|
|||||||||
| Total |
$ | 600,552 | 1,211 | 9,074 | 610,837 | |||||||||||
|
|
|
|
|
|
|
|
|
|||||||||
71
HopFed Bancorp, Inc. and Subsidiaries
Notes to Consolidated Financial Statements, Continued
December 31, 2017, 2016 and 2015
| (3) | Loans Receivable, Net: (Continued) |
Troubled Debt Restructuring
On a periodic basis, the Company may modify the terms of certain loans. In evaluating whether a restructuring constitutes a TDR, ASC 310; A Creditor’s Determination of Whether a Restructuring is a Troubled Debt Restructuring, is determinative. In evaluating whether a restructuring constitutes a TDR, the Company must separately conclude that both of the following exist:
| a.) | The restructuring constitutes a concession |
| b.) | The debtor is experiencing financial difficulties |
ASC 310 provides the following guidance for the Company’s evaluation of whether it has granted a concession.
If a debtor does not otherwise have access to funds at a market interest rate for debt with similar risk characteristics as the restructured debt, the restructured debt would be considered a below market rate, which may indicate that the Company may have granted a concession. In that circumstance, the Company should consider all aspects of the restructuring in determining whether it has granted a concession, the creditor must make a separate assessment about whether the debtor is experiencing financial difficulties to determine whether the restructuring constitutes a TDR.
A temporary or permanent increase in the interest rate on a loan as a result of a restructuring does not eliminate the possibility of the restructuring from being considered a concession if the new interest rate on the loan is below the market interest rate for loans of similar risk characteristics.
A restructuring that results in a delay in payment that is insignificant is not a concession. However, the Company must consider a variety of factors in assessing whether a restructuring resulting in a delay in payment is insignificant.
There were no loans as of December 31, 2017, December 31, 2016 and December 31, 2015 that were been modified as TDRs and within twelve months of the modification subsequently defaulted on their modified terms. At December 31, 2017 and December 31, 2016, there were no commitments to lend additional funds to any borrower whose loan terms have been modified in a TDR.
72
HopFed Bancorp, Inc. and Subsidiaries
Notes to Consolidated Financial Statements, Continued
December 31, 2017, 2016 and 2015
(Table Amounts in Thousands)
| (3) | Loans Receivable, Net: (Continued) |
Troubled Debt Restructurings (Continued)
A summary of the activity in loans classified as TDRs for the year ended December 31, 2017 is as follows:
| Balance at 12/31/16 |
New TDR |
Loss on Foreclosure |
Transferred to Non-accrual |
Loan Amortization |
Balance at 12/31/17 |
|||||||||||||||||||
| Multi-family real estate |
$ | 815 | — | — | — | (815 | ) | — | ||||||||||||||||
| Non-residential real estate |
5,646 | — | — | — | (2,483 | ) | 3,163 | |||||||||||||||||
|
|
|
|
|
|
|
|
|
|
|
|
|
|||||||||||||
| Total performing TDR |
$ | 6,461 | — | — | — | (3,298 | ) | 3,163 | ||||||||||||||||
|
|
|
|
|
|
|
|
|
|
|
|
|
|||||||||||||
During the year ended December 31, 2017, there were no new loans modified as TDR.
A summary of the activity in loans classified as TDRs for the year ended December 31, 2016 is as follows:
| Balance at 12/31/15 |
New TDR |
Loss on Foreclosure |
Transferred to Non-accrual |
Loan Amortization |
Balance at 12/31/16 |
|||||||||||||||||||
| Multi-family real estate |
$ | — | 816 | — | — | (1 | ) | 815 | ||||||||||||||||
| Non-residential real estate |
5,536 | 228 | — | — | (118 | ) | 5,646 | |||||||||||||||||
|
|
|
|
|
|
|
|
|
|
|
|
|
|||||||||||||
| Total performing TDR |
$ | 5,536 | 1,044 | — | — | (119 | ) | 6,461 | ||||||||||||||||
|
|
|
|
|
|
|
|
|
|
|
|
|
|||||||||||||
During the year ended December 31, 2016, the Company made financial concessions to one borrower having four loans totaling $1.04 million that resulted in in a TDR classification. The loans were secured by three multi-family real estate properties and one parcel of non-residential real estate. The borrower had financial problems and made a request of the Bank to make interest only payments for a period not to exceed one year. During the interest only period, the borrower committed to attempt to sell the collateral. During 2017, the borrower successfully sold the collateral and the Company received all funds due.
73
HopFed Bancorp, Inc. and Subsidiaries
Notes to Consolidated Financial Statements, Continued
December 31, 2017, 2016 and 2015
(Table Amounts in Thousands)
| (3) | Loans Receivable, Net: (Continued) |
Troubled Debt Restructurings (Continued)
A summary of the activity in loans classified as TDRs for the year ended December 31, 2015 is as follows:
| Balance at 12/31/14 |
New TDR |
Loss on Foreclosure |
Transferred to Non-accrual |
Loan Amortization |
Balance at 12/31/15 |
|||||||||||||||||||
| Non-residential real estate |
$ | 3,284 | 2,265 | — | — | (13 | ) | 5,536 | ||||||||||||||||
|
|
|
|
|
|
|
|
|
|
|
|
|
|||||||||||||
| Total performing TDR |
$ | 3,284 | 2,265 | — | — | (13 | ) | 5,536 | ||||||||||||||||
|
|
|
|
|
|
|
|
|
|
|
|
|
|||||||||||||
During the year ended December 31, 2015 there were six new loans to one borrower modified as TDR. The loans included one commercial vehicle, two parcels of non-residential real estate and three loans for commercial equipment used in conjunction with the non-residential real estate. The customer had financial difficulties related to personal legal issues. The customer received a concession from the Bank of one year of interest only payments due to his inability to materially participate in the business. The customer listed the properties for sale. The properties remained in TDR status until they were sold to a third party in 2017.
The Company originates loans to officers and directors and their affiliates at terms substantially equivalent to those available to other borrowers. Loans to officers and directors at December 31, 2017 and December 31, 2016, were approximately $5.9 million and $4.9 million, respectively. At December 31, 2017 and December 31, 2016, funds committed that were undisbursed to officers and directors approximated $1.5 million and $380,000, respectively.
The following summarizes activity of loans to officers and directors and their affiliates for the years ended December 31, 2017 and December 31, 2016:
| 2017 | 2016 | |||||||
| Balance at beginning of period |
$ | 4,894 | 3,844 | |||||
| New loans |
3,043 | 1,651 | ||||||
| Principal repayments |
(2,004 | ) | (601 | ) | ||||
|
|
|
|
|
|||||
| Balance at end of period |
$ | 5,933 | 4,894 | |||||
|
|
|
|
|
|||||
74
HopFed Bancorp, Inc. and Subsidiaries
Notes to Consolidated Financial Statements, Continued
December 31, 2017, 2016 and 2015
(Table Amounts in Thousands)
| (4) | Premises and Equipment: |
Components of premises and equipment included in the consolidated balance sheets as of December 31, 2017 and December 31, 2016 consisted of the following:
| 2017 | 2016 | |||||||
| Land |
$ | 6,555 | 6,555 | |||||
| Land improvements |
1,153 | 1,132 | ||||||
| Buildings |
22,467 | 22,397 | ||||||
| Furniture and equipment |
6,957 | 6,932 | ||||||
|
|
|
|
|
|||||
| 37,132 | 37,016 | |||||||
| Less accumulated depreciation |
14,432 | 13,555 | ||||||
|
|
|
|
|
|||||
| Premises and equipment, net |
$ | 22,700 | 23,461 | |||||
|
|
|
|
|
|||||
Depreciation expense was approximately $1,225,000, $1,320,000 and $1,266,000 for the years ended December 31, 2017, 2016 and 2015, respectively.
75
HopFed Bancorp, Inc. and Subsidiaries
Notes to Consolidated Financial Statements, Continued
December 31, 2017, 2016 and 2015
(Table Amounts in Thousands)
| (5) | Deposits: |
At December 31, 2017, the scheduled maturities of other time deposits were as follows:
| Years Ending December 31, |
||||
| 2018 |
$ | 190,955 | ||
| 2019 |
68,714 | |||
| 2020 |
30,079 | |||
| 2021 |
10,649 | |||
| 2022 |
4,572 | |||
|
|
|
|||
| $ | 304,969 | |||
|
|
|
|||
The amount of other time deposits with a minimum denomination of $250,000 or more was approximately $97.8 million and $79.7 million at December 31, 2017, and December 31, 2016, respectively. At December 31, 2017 and December 31, 2016, directors, members of senior management and their affiliates had deposits in the Bank of approximately $2.1 million. At December 31, 2017 and December 31, 2016, the Company had deposits classified as brokered deposits totaling $60.1 million and $33.4 million, respectively.
Interest expense on deposits for the years ended December 31, 2017, December 31, 2016 and December 31, 2015, is summarized as follows:
| 2017 | 2016 | 2015 | ||||||||||
| Interest bearing checking accounts |
$ | 1,262 | 1,183 | 1,105 | ||||||||
| Money market accounts |
71 | 76 | 88 | |||||||||
| Savings |
94 | 95 | 103 | |||||||||
| Other time deposits |
3,383 | 2,886 | 3,735 | |||||||||
|
|
|
|
|
|
|
|||||||
| $ | 4,810 | 4,240 | 5,031 | |||||||||
|
|
|
|
|
|
|
|||||||
The Bank maintains clearing arrangements for its demand, interest bearing checking accounts and money market accounts with BBVA Compass Bank. The Bank is required to maintain certain cash reserves in its account to cover average daily clearings. For the month ended December 31, 2017, average daily clearings were approximately $5.3 million.
At December 31, 2017 and December 31, 2016, the Company had deposit accounts in overdraft status that were reclassified to loans on the accompanying consolidated balance sheet of approximately $0.2 million and $0.3 million, respectively.
76
HopFed Bancorp, Inc. and Subsidiaries
Notes to Consolidated Financial Statements, Continued
December 31, 2017, 2016 and 2015
(Table Amounts in Thousands, Except Percentages)
| (6) | Advances from Federal Home Loan Bank: |
Federal Home Loan Bank advances are summarized as follows:
| December 31, | ||||||||||||||||
| 2017 | 2016 | |||||||||||||||
| Types of Advances |
Amount | Weighted Average Rate |
Amount | Weighted Average Rate |
||||||||||||
| Fixed-rate |
$ | 23,000 | 1.57 | % | $ | 11,000 | 1.04 | % | ||||||||
Scheduled maturities of FHLB advances as of December 31, 2017, are as follows:
| Years Ending December 31, |
Fixed Rate |
Average Cost |
||||||
| 2018 |
$ | 6,000 | 1.18 | % | ||||
| 2019 2020 |
|
7,000 10,000 |
|
|
1.55 1.83 |
% % | ||
|
|
|
|
|
|||||
| Total |
$ | 23,000 | 1.57 | % | ||||
|
|
|
|
|
|||||
The Bank has an approved line of credit of $30 million at the FHLB of Cincinnati, which is secured by a blanket agreement to maintain residential first mortgage loans and non-residential real estate loans with a principal value of 125% of the outstanding advances and has a variable interest rate. At December 31, 2017, the Bank could borrow an additional $49.1 million from the FHLB of Cincinnati without pledging additional collateral. At December 31, 2017, the Bank has an additional $9.9 million in additional collateral that could be pledged to the FHLB to secure additional advance requirements. The Bank has a $12.0 million unsecured line of credit with BBVA Compass Bank of Birmingham, Alabama. The Company’s overnight lines of credit with both the Federal Home Loan Bank of Cincinnati and Compass Bank had no balance at December 31, 2017.
77
HopFed Bancorp, Inc. and Subsidiaries
Notes to Consolidated Financial Statements, Continued
December 31, 2017, 2016 and 2015
(Table Amounts in Thousands, Except Percentages)
| (7) | Repurchase Agreements: |
At December 31, 2017, the Company provided investment securities with a market value of $38.4 million as collateral for repurchase agreements. The maximum repurchase balance outstanding during the year ended December 31, 2017 and December 31, 2016 was $46.8 million and $54.8 million, respectively.
At December 31, 2017 and December 31, 2016, the respective cost and maturities of the Company’s repurchase agreements are as follows:
| 2017 |
Balance | Average Rate | Maturity | |||||||||
| Various customers |
$ | 38,353 | 1.24 | % | Overnight | |||||||
|
|
|
|
|
|||||||||
| Total |
$ | 38,353 | 1.24 | % | ||||||||
|
|
|
|
|
|||||||||
| 2016 |
Balance | Average Rate | Maturity | |||||||||
| Various customers |
$ | 47,655 | 0.91 | % | Overnight | |||||||
|
|
|
|
|
|||||||||
| Total |
$ | 47,655 | 0.91 | % | ||||||||
|
|
|
|
|
|||||||||
78
HopFed Bancorp, Inc. and Subsidiaries
Notes to Consolidated Financial Statements, Continued
December 31, 2017, 2016 and 2015
| (8) | Fair Value Measurement: |
ASC Topic 820, Fair Value Measurements and Disclosures, establishes a fair value hierarchy which requires an entity to maximize the use of observable input and minimize the use of unobservable inputs when measuring fair value. Although ASC 820 provides for fair value accounting, the Company did not elect the fair value option for any financial instrument not presently required to be accounted for at fair value.
Management has developed a process for determining fair values. Fair value is based upon quoted market prices, where available. If listed prices or quotes are not available, fair value is based upon internally developed models or processes that use primarily market based or based on third party market data, including interest rate yield curves, option volatilities and other third party information. Valuation adjustments may be made to ensure that financial instruments are recorded at fair value. Furthermore, while the Company believes its valuation methods are appropriate and consistent with other market participants, the use of different methodologies, or assumptions, to determine the fair value of certain financials instruments could result in a different estimate of fair value at the reporting date.
ASC 820 establishes a three-level valuation hierarchy for disclosure of fair value measurement. The valuation hierarchy is based upon the transparency of inputs to the valuation of an asset or liability as of the measurement date.
| • | Level 1 is for assets and liabilities that management has obtained quoted prices or identical assets or liabilities in active markets that the Company has the ability to access as of the measurement date. |
| • | Level 2 is for assets and liabilities in which significant unobservable inputs other than Level 1 prices such as quoted prices for similar assets and liabilities; quoted prices in markets that are not active; or other inputs that are observable or can be corroborated by observable market data. |
| • | Level 3 is for assets and liabilities in which significant unobservable inputs that reflect a reporting entity’s own assumptions about the assumptions that market participants would use in pricing an asset or liability. |
The fair value of securities available for sale are determined by a matrix pricing, which is a mathematical technique what is widely used in the industry to value debt securities without relying exclusively on quoted prices for the individual securities in the Company’s portfolio but relying on the securities relationship to other benchmark quoted securities. Impaired loans are valued at the net present value of expected payments and considering the fair value of any assigned collateral. The fair value of these liabilities is based on information obtained from a third party bank and is reflected within level 2 of the valuation hierarchy.
79
HopFed Bancorp, Inc. and Subsidiaries
Notes to Consolidated Financial Statements, Continued
December 31, 2017, 2016 and 2015
(Table Amounts in Thousands)
| (8) | Fair Value Measurement: (Continued) |
Assets and Liabilities Measured on a Recurring Basis
The assets and liabilities measured at fair value on a recurring basis are summarized below:
| Total carrying value in the consolidated balance sheet at |
Quoted Prices In Active Markets for Identical Assets |
Significant Other Observable Inputs |
Significant Unobservable Inputs |
|||||||||||||
| Description |
12/31/2017 | (Level 1) | (Level 2) | (Level 3) | ||||||||||||
| (Dollars in Thousands) |
||||||||||||||||
| Securities available for sale |
||||||||||||||||
| U.S. Agency securities |
$ | 84,093 | — | 84,093 | — | |||||||||||
| Taxable municipals |
1,283 | — | 1,283 | — | ||||||||||||
| Tax-free municipals |
26,966 | — | 26,966 | — | ||||||||||||
| Trust preferred securities |
1,685 | — | — | 1,685 | ||||||||||||
| Mortgage backed securities |
70,764 | — | 70,764 | — | ||||||||||||
|
|
|
|
|
|
|
|
|
|||||||||
| Total |
$ | 184,791 | — | 183,106 | 1,685 | |||||||||||
|
|
|
|
|
|
|
|
|
|||||||||
| Total carrying value in the consolidated balance sheet at |
Quoted Prices In Active Markets for Identical Assets |
Significant Other Observable Inputs |
Significant Unobservable Inputs |
|||||||||||||
| Description |
12/31/2016 | (Level 1) | (Level 2) | (Level 3) | ||||||||||||
| (Dollars in Thousands) |
||||||||||||||||
| Securities available for sale |
||||||||||||||||
| U.S. Treasury securities |
$ | 2,001 | 2,001 | — | — | |||||||||||
| U.S. Agency securities |
84,012 | — | 84,012 | — | ||||||||||||
| Taxable municipals |
2,727 | — | 2,727 | — | ||||||||||||
| Tax-free municipals |
33,911 | — | 33,911 | — | ||||||||||||
| Trust preferred securities |
1,817 | — | — | 1,817 | ||||||||||||
| Mortgage backed securities |
85,012 | — | 85,012 | — | ||||||||||||
|
|
|
|
|
|
|
|
|
|||||||||
| Total |
$ | 209,480 | 2,001 | 205,662 | 1,817 | |||||||||||
|
|
|
|
|
|
|
|
|
|||||||||
80
HopFed Bancorp, Inc. and Subsidiaries
Notes to Consolidated Financial Statements, Continued
December 31, 2017, 2016 and 2015
(Table Amounts in Thousands)
| (8) | Fair Value Measurement: (Continued) |
The assets and liabilities measured at fair value on a non-recurring basis are summarized below:
| December 31, 2017 |
Total carrying value in the |
Quoted Prices In Active |
Significant Other |
Significant | ||||||||||||
| Description |
consolidated balance sheet At 12/31/2017 |
Markets for Identical Assets (Level 1) |
Observable Inputs (Level 2) |
Unobservable Inputs (Level 3) |
||||||||||||
| Assets |
||||||||||||||||
| Foreclosed assets |
$ | 3,369 | — | — | 3,369 | |||||||||||
| Impaired loans, net of allowance of $289 |
$ | 473 | — | — | 473 | |||||||||||
| December 31, 2016 |
Total carrying value in the |
Quoted Prices In Active |
Significant Other |
Significant | ||||||||||||
| Description |
consolidated balance sheet At 12/31/2016 |
Markets for Identical Assets (Level 1) |
Observable Inputs (Level 2) |
Unobservable Inputs (Level 3) |
||||||||||||
| Assets |
||||||||||||||||
| Foreclosed assets |
$ | 2,397 | — | — | 2,397 | |||||||||||
| Impaired loans, net of allowance of $1,148 |
$ | 6,123 | — | — | 6,123 | |||||||||||
81
HopFed Bancorp, Inc. and Subsidiaries
Notes to Consolidated Financial Statements, Continued
December 31, 2017, 2016 and 2015
(Table Amounts in Thousands)
| (8) | Fair Value Measurement: (Continued) |
The following table presents quantitative information about level 3 fair value measurements for assets measured at fair value on a recurring and non-recurring basis at December 31, 2017 and December 31, 2016:
| Level 3 Significant Unobservable Input Assumptions | ||||||||
| Fair Value | Valuation Technique | Unobservable Input | Quantitative Range of Unobservable Inputs | |||||
| December 31, 2017 |
||||||||
| Assets measured on a non-recurring basis |
||||||||
| Foreclosed assets |
3,369 | Discount to either actual sales price or appraised value of collateral | Appraisal and sales comparability adjustments | 30% to 55% | ||||
| Impaired loans |
760 | Discount to appraised value of collateral | Appraisal comparability adjustments | 10% to 25% | ||||
| Asset measured on a recurring basis |
||||||||
| Trust preferred securities |
1,685 | Discounted cash flow Spread to Libor swap curve | Compare to quotes for sale when available | One month libor plus 4% to 6% | ||||
| December 31, 2016 |
||||||||
| Assets measured on a non-recurring basis |
||||||||
| Foreclosed assets |
2,397 | Discount to either actual sales price or appraised value of collateral | Appraisal comparability adjustments | 30% to 55% | ||||
| Impaired loans |
7,271 | Discount to appraised value of collateral | Appraisal comparability adjustments | 10% to 15% | ||||
| Asset measured on a recurring basis |
||||||||
| Trust preferred securities |
1,817 | Discounted cash flow Spread to Libor swap curve | Compare to quotes for sale when available | One month libor plus 4% to 6% | ||||
Foreclosed assets and impaired loans are valued at fair value, less cost to sell. Fair value of a foreclosed asset is determined by an appraised value of the underlying collateral to which a discount is applied. Management establishes the discount or adjustments based on recent sales and any unique features the collateral may possess. Management also considers the anticipated selling cost associated with the collateral when establishing the discounted percentage. Management may adjust the discounts based on the most recent sales of comparable collateral.
82
HopFed Bancorp, Inc. and Subsidiaries
Notes to Consolidated Financial Statements, Continued
December 31, 2017, 2016 and 2015
(Table Amounts in Thousands)
| (8) | Fair Value Measurement: (Continued) |
The Company bases the value of its trust preferred security on a quarterly review of SEC filings by the issuer to ascertain overall financial strength. Based on our analysis, the Company then reviews Libor swap curve to analyze the overall yield of our investment as compared to long-term swap rates. On rare occasions, the Company may receive an offer from a broker to purchase similar type instruments and the Company will analyze these offerings as compared to our investment.
Change in Level 3 fair value measurements:
The table below includes a roll-forward of the balance sheet items for the years ended December 31, 2017 and 2016, (including the change in fair value) for assets and liabilities classified by the Company within level 3 of the valuation hierarchy for assets and liabilities measured at fair value on a recurring basis. When a determination is made to classify a financial instrument within Level 3 of the valuation hierarchy, the determination is based upon the significance of the unobservable factors to the overall fair value measurement. However, since Level 3 financial instruments typically include, in addition to the unobservable or Level 3 components, observable components (that is components that are actively quoted and can be validated to external sources), the gains and losses in the table below include changes in fair value due in part to observable factors that are part of the valuation methodology.
| Year ended December 31, | ||||||||
| 2017 | 2016 | |||||||
| Other Assets |
Other Assets |
|||||||
| Fair value, December 31, |
$ | 1,817 | $ | 1,865 | ||||
| Change in unrealized gains included in other comprehensive income for assets and liabilities still held at December 31, |
(149 | ) | (65 | ) | ||||
| Recovery of prior impairment charge |
17 | 17 | ||||||
|
|
|
|
|
|||||
| Fair value, December 31, |
$ | 1,685 | $ | 1,817 | ||||
|
|
|
|
|
|||||
83
HopFed Bancorp, Inc. and Subsidiaries
Notes to Consolidated Financial Statements, Continued
December 31, 2017, 2016 and 2015
(Table Amounts in Thousands)
| (8) | Fair Value Measurement: (Continued) |
The estimated fair values of financial instruments were as follows at December 31, 2017:
| Carrying Amount |
Estimated Fair Value |
Quoted Prices In Active Markets for Identical Assets Level 1 |
Using Significant Other Observable Inputs Level 2 |
Significant Unobservable Inputs Level 3 |
||||||||||||||||
| Financial Assets: |
||||||||||||||||||||
| Cash and due from banks |
$ | 37,965 | 37,965 | 37,965 | — | — | ||||||||||||||
| Interest-bearing deposits in banks |
7,111 | 7,111 | 7,111 | — | — | |||||||||||||||
| Securities available for sale |
184,791 | 184,791 | — | 183,106 | 1,685 | |||||||||||||||
| Federal Home Loan Bank stock |
4,428 | 4,428 | — | — | 4,428 | |||||||||||||||
| Loans held for sale |
1,539 | 1,539 | — | 1,539 | — | |||||||||||||||
| Loans receivable |
637,102 | 615,265 | — | — | 615,265 | |||||||||||||||
| Accrued interest receivable |
3,589 | 3,589 | — | — | 3,589 | |||||||||||||||
| Financial Liabilities: |
||||||||||||||||||||
| Deposits |
754,009 | 754,510 | — | 754,510 | — | |||||||||||||||
| Advances from borrowers for taxes and insurance |
808 | 808 | — | 808 | — | |||||||||||||||
| Advances from Federal Home Loan Bank |
23,000 | 22,849 | — | 22,849 | — | |||||||||||||||
| Repurchase agreements |
38,353 | 38,353 | — | 38,353 | — | |||||||||||||||
| Subordinated debentures |
10,310 | 10,099 | — | — | 10,099 | |||||||||||||||
84
HopFed Bancorp, Inc. and Subsidiaries
Notes to Consolidated Financial Statements, Continued
December 31, 2017, 2016 and 2015
(Table Amounts in Thousands)
| (8) | Fair Value Measurement: (Continued) |
The estimated fair values of financial instruments were as follows at December 31, 2016:
| Carrying Amount |
Estimated Fair Value |
Quoted Prices In Active Markets for Identical Assets Level 1 |
Using Significant Other Observable Inputs Level 2 |
Significant Unobservable Inputs Level 3 |
||||||||||||||||
| Financial Assets: |
||||||||||||||||||||
| Cash and due from banks |
$ | 21,779 | 21,779 | 21,779 | — | — | ||||||||||||||
| Interest-bearing deposits in banks |
3,970 | 3,970 | 3,970 | — | — | |||||||||||||||
| Securities available for sale |
209,480 | 209,480 | 2,001 | 205,662 | 1,817 | |||||||||||||||
| Federal Home Loan Bank stock |
4,428 | 4,428 | — | — | 4,428 | |||||||||||||||
| Loans held for sale |
1,094 | 1,094 | — | 1,094 | — | |||||||||||||||
| Loans receivable |
604,286 | 593,257 | — | — | 593,257 | |||||||||||||||
| Accrued interest receivable |
3,799 | 3,799 | — | — | 3,799 | |||||||||||||||
| Financial Liabilities: |
||||||||||||||||||||
| Deposits |
732,882 | 732,942 | — | 732,942 | — | |||||||||||||||
| Advances from borrowers for taxes and insurance |
766 | 766 | — | 766 | — | |||||||||||||||
| Advances from Federal Home Loan Bank |
11,000 | 10,979 | — | 10,979 | — | |||||||||||||||
| Repurchase agreements |
47,655 | 47,655 | — | 47,655 | — | |||||||||||||||
| Subordinated debentures |
10,310 | 10,099 | — | — | 10,099 | |||||||||||||||
85
HopFed Bancorp, Inc. and Subsidiaries
Notes to Consolidated Financial Statements, Continued
December 31, 2017, 2016 and 2015
(Table Amounts in Thousands)
| (8) | Fair Value Measurement: (Continued) |
Non-Financial Assets and Non-Financial Liabilities:
The Company has no non-financial assets or non-financial liabilities measured at fair value on a recurring basis. Certain non-financial assets measured at fair value on a non-recurring basis include foreclosed assets (upon initial recognition or subsequent impairment), non-financial assets and other non-financial long-lived assets measured at fair value for impairment assessment. Non-financial assets measured at fair value on a non-recurring basis during the reported periods include certain foreclosed assets which, upon initial recognition, were re-measured and reported at fair value through a charge-off to the allowance for loan losses and certain foreclosed assets which, subsequent to their initial recognition, were re-measured at fair value through a write-down included in other non-interest expense. The fair value of a foreclosed asset is estimated using Level 2 inputs based on observable market data or Level 3 inputs based on customized discounting criteria.
The following table presents foreclosed assets that were re-measured and reported at fair value:
| Years Ended December 31, | ||||||||||||
| 2017 | 2016 | 2015 | ||||||||||
| Beginning balance |
$ | 2,397 | 1,736 | 1,927 | ||||||||
| Foreclosed assets measured at initial recognition: |
||||||||||||
| Carrying value of foreclosed assets acquired |
4,312 | 2,263 | 869 | |||||||||
| Proceeds from sale of foreclosed assets |
(3,498 | ) | (1,623 | ) | (344 | ) | ||||||
| Gains (losses) included in non-interest expense |
158 | 21 | (716 | ) | ||||||||
|
|
|
|
|
|
|
|||||||
| Fair value |
$ | 3,369 | $ | 2,397 | 1,736 | |||||||
|
|
|
|
|
|
|
|||||||
Changes in economic conditions of model-based valuation techniques may require the transfer of financial instruments from one fair value level to another. There were no transfers between levels for the years ended December 31, 2017, 2016 and 2015.
86
HopFed Bancorp, Inc. and Subsidiaries
Notes to Consolidated Financial Statements, Continued
December 31, 2017, 2016 and 2015
| (9) | Subordinated Debentures: |
On September 25, 2003, the Company formed HopFed Capital Trust I (the “Trust”). The Trust is a statutory trust formed under the laws of the state of Delaware. In September 2003, the Trust issued variable rate capital securities with an aggregate liquidation amount of $10,000,000 ($1,000 per preferred security) to a third-party investor. The Company then issued floating rate junior subordinated debentures aggregating $10,310,000 to the Trust. The junior subordinated debentures are the sole assets of the Trust. The junior subordinated debentures and the capital securities pay interest and dividends, respectively, on a quarterly basis. The variable interest rate is the three-month LIBOR plus 3.10% adjusted quarterly. The most recent interest rate adjustment for the trust was effective January 12, 2018, which adjusted the total coupon rate to 4.82%. These junior subordinated debentures mature in 2033, at which time the capital securities must be redeemed. The junior subordinated debentures and capital securities became redeemable contemporaneously, in whole or in part, beginning October 8, 2008 at a redemption price of $1,000 per capital security.
The Company has provided a full-irrevocable and unconditional guarantee on a subordinated basis of the obligations of the Trust under the capital securities in the event of the occurrence of an event of default, as defined in such guarantee.
| (10) | Concentrations of Credit Risk: |
Most of the Bank’s business activity is with customers located within the western part of the Commonwealth of Kentucky and middle and western Tennessee. One-to-four family residential and non residential real estate collateralize the majority of the loans. The Bank requires collateral for the majority of loans.
The distribution of commitments to extend credit approximates the distribution of loans outstanding. The contractual amounts of credit-related financial instruments such as commitments to extend credit and commercial letters of credit represent the amounts of potential accounting loss should the contract be fully drawn upon, the customer default, and the value of any existing collateral become worthless.
At December 31, 2017 and December 31, 2016, all cash and cash equivalents are deposited with BBVA Compass Bank, the Federal Reserve Bank or the Federal Home Loan Bank of Cincinnati (FHLB). Deposits at Compass BBVA Bank are insured to $250,000. All deposits at the FHLB are liabilities of the individual bank and were not federally insured. The FHLB is a government sponsored enterprise (GSE) and has the second highest rating available by all rating agencies. At December 31, 2017, total FHLB deposits were approximately $5.6 million and total deposits at the Federal Reserve were $7.1 million, none of which is insured by the FDIC. At December 31, 2017, total deposits at BBVA were $26.3 million, of which $250,000 were insured by the FDIC. At December 31, 2016, total FHLB deposits were approximately $0.8 million and total deposits at the Federal Reserve were $4.7 million, none of which is insured by the FDIC. At December 31, 2016, total deposits at BBVA were $9.7 million, of which $250,000 were insured by the FDIC.
87
HopFed Bancorp, Inc. and Subsidiaries
Notes to Consolidated Financial Statements, Continued
December 31, 2017, 2016 and 2015
(Table Amounts in Thousands)
| (11) | Employee Benefit Plans: |
HopFed Bancorp Long Term Incentive Plans
On March 20, 2013, the Board of Directors of the Company adopted the HopFed Bancorp, Inc. 2013 Long Term Incentive Plan (the “Plan”), which was subsequently approved at the 2013 Annual Meeting of Stockholders. Under the Plan, the Compensation Committee has discretionary authority to grant up to 300,000 shares in the form of restricted stock grants and options to such employees, directors and advisory directors as the committee shall designate. The grants vest in equal installments over three or four year periods. Grants may vest immediately upon specific events, including a change of control of the Company, death or disability of award recipient, and termination of employment of the recipient by the Company without cause.
Awards are recognized as an expense to the Company in accordance with the vesting schedule. Awards in which the vesting is accelerated must be recognized as an expense immediately. Awards are valued at the closing stock price on the day the award is granted. For the year ended December 31, 2017, the Compensation Committee granted 12,753 shares of restricted stock with a market value of $178,000. For the year ended December 31, 2016, the Compensation Committee granted 12,342 shares of restricted stock with a market value of $145,000. For the year ended December 31, 2015, the Compensation Committee granted 2,034 shares of restricted stock with a market value of $25,000. The Company recognized $106,000, $135,000 and $190,000 in compensation expense in 2017, 2016 and 2015, respectively. The remaining compensation expense to be recognized at December 31, 2017, is as follows:
| Year Ending December 31, |
Approximate Future Compensation Expense |
|||
| 2018 |
$ | 111 | ||
| 2019 |
67 | |||
| 2020 |
45 | |||
| 2021 |
3 | |||
|
|
|
|||
| Total |
$ | 226 | ||
|
|
|
|||
The Compensation Committee may make additional awards of restricted stock, thereby increasing the future expense related to this plan. The early vesting of restricted stock awards due to factors outlined in the award agreement may accelerate future compensation expenses related to the plan. However, the total amount of future compensation expense would not change as a result of an accelerated vesting of shares. At December 31, 2017, the Company has 229,824 restricted shares available from the Plan that may be awarded.
88
HopFed Bancorp, Inc. and Subsidiaries
Notes to Consolidated Financial Statements, Continued
December 31, 2017, 2016 and 2015
| (11) | Employee Benefit Plans: (Continued) |
401(K) Plan
The Company has a 401(K) retirement program that is available to all employees who meet minimum eligibility requirements. In 2015, the Company discontinued all employer 401(K) contributions on behalf of employees while allowing employees to continue contributions to the 401(K) plan.
HopFed Bancorp, Inc. 2015 Employee Stock Ownership Plan
On March 2, 2015, the Company implemented the HopFed Bancorp, Inc. 2015 Employee Stock Ownership Plan which covers substantially all employees who are at least 21 years old with at least one year of employment with the Company and Heritage Bank USA, Inc., the Company’s commercial bank subsidiary. The ESOP has three individuals who have been selected by the Company to serve as trustees. A directed corporate trustee has also been appointed. The ESOP will be administered by a committee (the “Committee”) currently composed of eleven employees selected by the Company or its designee.
On March 2, 2015, the ESOP purchased 600,000 shares from the Corporation at a cost of $7,884,000 using the proceeds of a loan granted to the ESOP from the Company. In accordance with the ESOP Loan documents, the common stock purchased by the ESOP serves as collateral for the ESOP Loan. The ESOP Loan will be repaid principally from discretionary contributions by the Bank to the ESOP. The ESOP Loan requires annual payments and has a final maturity of December 9, 2026. The interest rate on the ESOP Loan is 3.0%. Shares purchased by the ESOP are be held in a trust account for allocation among participants as the ESOP Loan is repaid. The ESOP shares receive dividends. Dividends on unearned shares will be used to repay the ESOP Loan.
89
HopFed Bancorp, Inc. and Subsidiaries
Notes to Consolidated Financial Statements, Continued
December 31, 2017, 2016 and 2015
| (11) | Employee Benefit Plans: (Continued) |
HopFed Bancorp, Inc. 2015 Employee Stock Ownership Plan, (Continued)
For the year ended December 31, 2017, the Company recognized an expense of $706,000 related to the ESOP loan payment and the Company released 64,032 shares from the ESOP trust to individual participants of the ESOP as a result of the 2017 loan payment. For the year ended December 31, 2016, the Company recognized an expense of $553,000 related to the ESOP loan payment and released 48,067 shares from the ESOP trust to individual participants as a result of the 2016 loan payment. For the year ended December 31, 2015, the Company recognized an expense of $652,000 related to the ESOP loan payment and released 53,587 shares from the ESOP trust to individual participants of the plan as a result of a 2015 loan payment. At December 31, 2017, shares held by the ESOP were as follows:
| December 31, 2017 | December 31, 2016 | |||||||
| Earned ESOP shares |
165,686 | 101,654 | ||||||
| Unearned ESOP shares |
434,548 | 498,346 | ||||||
|
|
|
|
|
|||||
| Total ESOP shares |
600,234 | 600,000 | ||||||
|
|
|
|
|
|||||
| Share price at December 31, |
$ | 14.10 | $ | 13.46 | ||||
|
|
|
|
|
|||||
| Fair value of ESOP shares |
$ | 6,127,127 | $ | 6,707,737 | ||||
|
|
|
|
|
|||||
90
HopFed Bancorp, Inc. and Subsidiaries
Notes to Consolidated Financial Statements, Continued
December 31, 2017, 2016 and 2015
(Table Amounts in Thousands)
(12) Income Taxes:
The provision for income tax expense for the years ended December 31, 2017, December 31, 2016 and December 31, 2015, consisted of the following:
| 2017 | 2016 | 2015 | ||||||||||
| Current |
||||||||||||
| Federal |
$ | 468 | — | — | ||||||||
| State |
95 | 95 | 97 | |||||||||
|
|
|
|
|
|
|
|||||||
| 563 | 95 | 97 | ||||||||||
| Deferred |
||||||||||||
| Federal |
1,585 | 267 | 177 | |||||||||
| State |
— | — | — | |||||||||
|
|
|
|
|
|
|
|||||||
| 1,585 | 267 | 177 | ||||||||||
|
|
|
|
|
|
|
|||||||
| $ | 2,148 | $ | 362 | 274 | ||||||||
|
|
|
|
|
|
|
|||||||
Total income tax expense for the years ended December 31, 2017, December 31, 2016 and December 31, 2015, differed from the amounts computed by applying the federal income tax rate of 34 percent to income before income taxes as follows:
| 2017 | 2016 | 2015 | ||||||||||
| Expected federal income tax expense at statutory tax rate |
$ | 1,853 | 1,110 | 911 | ||||||||
| Effect of nontaxable interest income |
(345 | ) | (452 | ) | (458 | ) | ||||||
| Effect of nontaxable bank owned life insurance income |
(164 | ) | (117 | ) | (114 | ) | ||||||
| Effect of Qualified Zone Academy Bond (QZAB) |
— | (114 | ) | (109 | ) | |||||||
| State taxes on income, net of federal benefit |
59 | 59 | 59 | |||||||||
| Other tax credits |
(243 | ) | (128 | ) | (80 | ) | ||||||
| Deferred tax asset revaluation |
980 | — | — | |||||||||
| Non-deductible expenses |
8 | 4 | 65 | |||||||||
|
|
|
|
|
|
|
|||||||
| Total income tax expense |
$ | 2,148 | 362 | 274 | ||||||||
|
|
|
|
|
|
|
|||||||
| Income tax rate |
39.4 | % | 11.1 | % | 10.2 | % | ||||||
|
|
|
|
|
|
|
|||||||
91
HopFed Bancorp, Inc. and Subsidiaries
Notes to Consolidated Financial Statements, Continued
December 31, 2017, 2016 and 2015
(Table Amounts in Thousands)
| (12) | Income Taxes: (Continued) |
The components of deferred taxes as of December 31, 2017 and December 31, 2016 are summarized as follows:
| 2017 | 2016 | |||||||
| Deferred tax assets: |
||||||||
| Allowance for loan loss |
$ | 1,014 | 2,078 | |||||
| Accrued expenses |
77 | 294 | ||||||
| Net operating loss carry forward |
192 | 454 | ||||||
| Tax credit carry forward |
651 | 568 | ||||||
| Unrealized loss on securities available for sale |
57 | — | ||||||
| Intangible amortization |
192 | 548 | ||||||
| Other |
77 | 242 | ||||||
|
|
|
|
|
|||||
| 2,260 | 4,184 | |||||||
|
|
|
|
|
|||||
| Deferred tax liabilities: |
||||||||
| FHLB stock dividends |
(486 | ) | (787 | ) | ||||
| Unrealized gain on securities available for sale |
— | (240 | ) | |||||
| Depreciation and amortization |
(10 | ) | (105 | ) | ||||
|
|
|
|
|
|||||
| (496 | ) | (1,132 | ) | |||||
|
|
|
|
|
|||||
| Net deferred tax asset |
$ | 1,764 | 3,052 | |||||
|
|
|
|
|
|||||
At December 31, 2017, the Company has operating loss carry forwards of approximately $3.1 million, which begin to expire in 2034.
92
HopFed Bancorp, Inc. and Subsidiaries
Notes to Consolidated Financial Statements, Continued
December 31, 2017, 2016 and 2015
(Table Amounts in Thousands)
| (12) | Income Taxes: (Continued) |
No valuation allowance for deferred tax assets was recorded at December 31, 2017 and December 31, 2016, as management believes it is more likely than not that all of the deferred tax assets will be realized because they were supported by recoverable taxes paid in prior years and expected future taxable income. There were no unrecognized tax benefits during any of the reported periods. The Corporation files income tax returns in the U.S. federal jurisdiction. The Company is no longer subject to U.S. federal income tax examinations by tax authorities for years before 2013. The Company recognizes interest and penalties on income taxes, if any, as a component of income tax expense.
| (13) | Foreclosed Asset: |
The Company’s foreclosed asset balances at December 31, 2017 and December 31, 2016 represent properties and personal collateral acquired by the Bank through customer loan defaults. The property is recorded at fair value less selling cost at the date acquired with any loss recognized as a charge off through the allowance for loan loss account. Additional real estate and other asset losses may be determined on individual properties at specific intervals or at the time of disposal. Additional losses are recognized as a non-interest expense. As of December 31, 2017 and December 31, 2016, the composition of the Company’s balance in foreclosed assets are as follows:
| December 31, | ||||||||
| 2017 | 2016 | |||||||
| One-to-four family mortgages |
$ | 169 | 135 | |||||
| Home equity line of credit |
— | 28 | ||||||
| Multi-family |
— | 1,775 | ||||||
| Land |
3,200 | — | ||||||
| Non-residential real estate |
— | 459 | ||||||
|
|
|
|
|
|||||
| Total foreclosed assets |
$ | 3,369 | 2,397 | |||||
|
|
|
|
|
|||||
93
HopFed Bancorp, Inc. and Subsidiaries
Notes to Consolidated Financial Statements, Continued
December 31, 2017, 2016 and 2015
(Table Amounts in Thousands)
| (14) | Commitments and Contingencies: |
In the ordinary course of business, the Bank has various outstanding commitments and contingent liabilities that are not reflected in the accompanying consolidated financial statements. The table below outlines the Company’s open loan commitments at December 31, 2017 and December 31, 2016:
| December 31, | ||||||||
| 2017 | 2016 | |||||||
| Commitments to extend credit |
$ | 54,458 | $ | 43,365 | ||||
| Standby letters of credit |
143 | 228 | ||||||
| Unused commercial lines of credit |
62,910 | 59,790 | ||||||
| Unused home equity lines of credit |
32,701 | 31,818 | ||||||
| Unused personal lines of credit |
17,048 | 18,559 | ||||||
The Company and the Bank have agreed to enter into employment agreements with certain officers, which provide certain benefits in the event of their termination following a change in control of the Company or the Bank. The employment agreements provide for an initial term of three years. On each anniversary of the commencement date of the employment agreements, the term of each agreement may be extended for an additional year at the discretion of the Board. In the event of a change in control of the Company or the Bank, as defined in the agreement, the officers shall be paid an amount equal to 2.9 times the officer’s base salary as defined in the employment agreement.
The Company and the Bank have entered into commitments to rent facilities, purchase services and lease operating equipment that are non-cancelable. At December 31, 2017, future minimal purchase, lease and rental commitments were as follows:
| Years Ending December 31, |
||||
| 2018 |
$ | 2,286 | ||
| 2019 |
1,953 | |||
| 2002 |
202 | |||
| 2021 |
169 | |||
| 2022 |
110 | |||
|
|
|
|||
| Total |
$ | 4,720 | ||
|
|
|
|||
The Company incurred rental expenses of approximately $130,000, $127,000 and $61,000 for the years ended December 31, 2017 December 31, 2016 and December 31, 2015, respectively. In the normal course of business, the Bank and Corporation have entered into operating contracts necessary to conduct the Company’s daily business. The most significant operating contract is for the Bank’s data processing services, ACH item processing and ATM / Debit card processing which is variable based on the number of accounts and usage but has an expected annual cost of approximately $2.8 million annually.
94
HopFed Bancorp, Inc. and Subsidiaries
Notes to Consolidated Financial Statements, Continued
December 31, 2017, 2016 and 2015
| (14) | Commitments and Contingencies: (Continued) |
The Company is partially self-insured for medical benefits provided to employees. Heritage Bank is named as the plan administrator for this plan and has retained Anthem Blue Cross Blue Shield (“Anthem”) to process claims and handle other duties of the plan. Anthem does not assume any liabilities as a third-party administrator. The Bank purchased two stop-loss insurance policies to limit total medical claims from Anthem. The first specific stop-loss policy limits the Company’s annual cost per covered individual in 2015, 2016 and 2017 to $90,000, $90,000 and $100,000, respectively. The Company has purchased a second stop-loss policy that limits the aggregate claims for the Company in 2017, 2016 and 2015 at $1.7 million, $1.8 million and $1.7 million, respectively, based upon the Company’s enrollment during those years. The Company has established a liability for outstanding claims as well as incurred but unreported claims. While management uses what it believes are pertinent factors in estimating the plan liability, the actual liability is subject to change based upon unexpected claims experience and fluctuations in enrollment during the plan year. At December 31, 2017 and December 31, 2016, the Company recognized a liability for self-insured medical expenses of approximately $172,000 and $256,000, respectively.
The Company is a party to financial instruments with off-balance-sheet risk in the normal course of business to meet the financing needs of its customers and to reduce its own exposure to fluctuations in interest rates. These financial instruments include commitments to extend credit, standby letters of credit, and financial guarantees. Those instruments involve, to varying degrees, elements of credit and interest rate risk in excess of the amount recognized in the consolidated balance sheets. The contract or notional amounts of those instruments reflect the extent of involvement the Company has in particular classes of financial instruments.
The Company’s exposure to credit loss in the event of nonperformance by the other party to the financial instrument for commitments to extend credit and standby letters of credit and financial guarantees written is represented by the contractual notional amount of those instruments. The Company uses the same credit policies in making these commitments and conditional obligations as it does for on-balance-sheet instruments.
Commitments to extend credit are agreements to lend to a customer as long as there is no violation of any condition established in the contract. Commitments generally have fixed expiration dates or other termination clauses and may require payment of a fee. Since many of the commitments are expected to expire without being drawn upon, the total commitment amounts do not necessarily represent future cash requirements. The Company evaluates each customer’s creditworthiness on a case-by-case basis. The amount of collateral obtained, if deemed necessary by the Company upon extension of credit, is based on management’s credit evaluation of the counter-party. Collateral held varies but may include property, plant, and equipment and income-producing commercial properties.
95
HopFed Bancorp, Inc. and Subsidiaries
Notes to Consolidated Financial Statements, Continued
December 31, 2017, 2016 and 2015
| (14) | Commitments and Contingencies: (Continued) |
Standby letters of credit are conditional commitments issued by the Company to guarantee the performance of a customer to a third-party. Those guarantees are primarily issued to support public and private borrowing arrangements, including commercial paper, bond financing, and similar transactions. Most guarantees extend from one to two years. The credit risk involved in issuing letters of credit is essentially the same as that involved in extending loan facilities to customers.
The Bank, in the normal course of business, originates fixed rate mortgages that are sold to Freddie Mac. Upon tentative underwriting approval by Freddie Mac, the Bank issues a best effort commitment to originate a fixed rate first mortgage under specific terms and conditions that the Bank intends to sell to Freddie Mac. The Bank no longer assumes a firm commitment to originate fixed rate loans, thus eliminating the risk of having to deliver loans they did not close or pay commitment fees to make Freddie Mac whole.
The Company is subject to various claims and legal actions that have arisen in the course of conducting business. The Company records these as liabilities when the likelihood of loss is probable and an amount or range of loss can be reasonably estimated. Management does not expect the ultimate disposition of these matters to have a material adverse impact of the Company’s consolidated financial statements.
On May 4, 2017, the Company, its directors, and a former director, were named as defendants in a lawsuit filed in the Court of Chancery in the State of Delaware by Company stockholders, Stilwell Associates, L.P., Stilwell Activist Fund, L.P. and Stilwell Activist Investments, L.P. (collectively, the “Plaintiffs”), concerning the adoption of Article III, Section 13 of the Company’s Amended and Restated Bylaws.
On October 3, 2017, upon the recommendation of the Nominating and Corporate Governance Committee, the Board of Directors adopted amendments to Article III, Section 13 of the Bylaws. See the Company’s Current Report on Form 8-K filed on October 4, 2017.
On October 25, 2017, the Court of Chancery granted the parties’ stipulation regarding dismissal of the lawsuit and dismissed the lawsuit without prejudice, subject to possible consideration of a Fee and Expense Application by the Plaintiffs. On October 26, 2017, the Company disclosed the dismissal in a press release on the Company’s Current Report on Form 8-K filed on October 26, 2017. See subsequent event note related to this lawsuit.
| (15) | Regulatory Matters: |
The Company is a commercial bank holding company and, as such, is subject to regulation, examination and supervision by the Board of Governors of the Federal Reserve System. The Company’s wholly owned bank subsidiary is a state chartered commercial bank supervised by the KDFI and the FDIC. Failure to meet minimum capital requirements can initiate certain mandatory and possibly additional discretionary actions by regulators that, if undertaken, could have a direct material effect on the Company’s and the Bank’s financial statements.
Under regulatory capital regulations and the regulatory framework for prompt corrective action, the Bank must meet specific capital guidelines that involve quantitative measures of the Bank’s assets, liabilities and certain off-balance sheet items as calculated under regulatory accounting practices. The Bank’s capital amounts and classification are also subject to qualitative judgments by the regulators about components, risk weightings and other factors.
96
HopFed Bancorp, Inc. and Subsidiaries
Notes to Consolidated Financial Statements, Continued
December 31, 2017, 2016 and 2015
(Table Amounts in Thousands)
| (15) | Regulatory Matters: (Continued) |
Quantitative measures established by regulation to ensure capital adequacy require the Bank to maintain minimum amounts and ratios (set forth in the table below) of tangible and core capital (as defined in the regulations) to adjusted total assets (as defined), and of total capital (as defined) and Tier 1 to risk weighted assets (as defined). The minimum required capital amounts presented include the minimum required capital levels as of December 31, 2017 and December 31, 2016. Management believes, as of December 31, 2017 and December 31, 2016, that the Bank meets all capital adequacy requirements to which it is subject, including the phase-in requirements of Basel III. The Company’s consolidated capital ratios and the Bank’s actual capital amounts and ratios as of December 31, 2017 and December 31, 2016 are presented below:
| To be Well | ||||||||||||||||||||||||
| Capitalized for | ||||||||||||||||||||||||
| Minimum Capital | Prompt Corrective | |||||||||||||||||||||||
| Actual | Required | Action Provisions | ||||||||||||||||||||||
| As of December 31, 2017 | Amount | Ratio | Amount | Ratio | Amount | Ratio | ||||||||||||||||||
| Tier 1 leverage capital to adjusted total assets |
||||||||||||||||||||||||
| Company |
$ | 95,709 | 10.6 | % | $ | 36,137 | 4.0 | % | $ | 45,171 | 5.0 | % | ||||||||||||
| Bank |
$ | 95,123 | 10.5 | % | $ | 36,090 | 4.0 | % | $ | 45,112 | 5.0 | % | ||||||||||||
| Total capital to risk weighted assets |
||||||||||||||||||||||||
| Company |
$ | 100,535 | 16.0 | % | $ | 50,352 | 8.0 | % | $ | 62,940 | 10.0 | % | ||||||||||||
| Bank |
$ | 99,949 | 15.9 | % | $ | 50,314 | 8.0 | % | $ | 62,892 | 10.0 | % | ||||||||||||
| Tier 1 capital to risk weighted assets |
||||||||||||||||||||||||
| Company |
$ | 95,709 | 15.2 | % | $ | 37,764 | 6.0 | % | $ | 50,352 | 8.0 | % | ||||||||||||
| Bank |
$ | 95,123 | 15.1 | % | $ | 37,735 | 6.0 | % | $ | 50,314 | 8.0 | % | ||||||||||||
| Common equity tier 1 capital to risk weighted assets |
||||||||||||||||||||||||
| Company |
$ | 95,709 | 15.2 | % | $ | 28,323 | 4.5 | % | n/a | n/a | ||||||||||||||
| Bank |
$ | 95,123 | 15.1 | % | $ | 28,301 | 4.5 | % | $ | 40,880 | 6.5 | % | ||||||||||||
| As of December 31, 2016 |
||||||||||||||||||||||||
| Tier 1 leverage capital to adjusted total assets |
||||||||||||||||||||||||
| Company |
$ | 92,803 | 10.8 | % | $ | 34,392 | 4.0 | % | $ | 42,990 | 5.0 | % | ||||||||||||
| Bank |
$ | 91,617 | 10.7 | % | $ | 34,315 | 4.0 | % | $ | 42,894 | 5.0 | % | ||||||||||||
| Total capital to risk weighted assets |
||||||||||||||||||||||||
| Company |
$ | 98,915 | 16.2 | % | $ | 48,864 | 8.0 | % | $ | 61,080 | 10.0 | % | ||||||||||||
| Bank |
$ | 97,729 | 16.0 | % | $ | 48,753 | 8.0 | % | $ | 60,941 | 10.0 | % | ||||||||||||
| Tier 1 capital to risk weighted assets |
||||||||||||||||||||||||
| Company |
$ | 92,803 | 15.2 | % | $ | 36,648 | 6.0 | % | $ | 48,864 | 8.0 | % | ||||||||||||
| Bank |
$ | 91,617 | 15.0 | % | $ | 36,764 | 6.0 | % | $ | 48,753 | 8.0 | % | ||||||||||||
| Common equity tier 1 capital to risk weighted assets |
||||||||||||||||||||||||
| Company |
$ | 92,803 | 15.2 | % | $ | 27,486 | 4.5 | % | n/a | n/a | ||||||||||||||
| Bank |
$ | 91,617 | 15.0 | % | $ | 27,423 | 4.5 | % | $ | 39,611 | 6.5 | % | ||||||||||||
97
HopFed Bancorp, Inc. and Subsidiaries
Notes to Consolidated Financial Statements, Continued
December 31, 2017, 2016 and 2015
| (15) | Regulatory Matters: (Continued) |
Prompt corrective action regulations provide five classifications: well capitalized, adequately capitalized, undercapitalized, significantly undercapitalized and critically undercapitalized, although these terms are not used to represent overall financial status. At December 31, 2017 and 2016, the most recent regulatory notifications categorized the Bank as well capitalized under the regulatory framework for prompt corrective action. Management is not aware of any conditions or events that have changed the Bank’s status as a well-capitalized bank.
| (16) | Stockholders’ Equity: |
The Company’s sources of income and funds for dividends to its stockholders are earnings on its investments and dividends from the Bank. The Bank’s primary regulator, the KDFI, has regulations that impose certain restrictions on payment of dividends to the Corporation. Current regulations of the KDFI allow the Bank (based upon its current capital level and supervisory status assigned by the KDFI) to pay a dividend as long as the Bank subsidiary maintains an appropriate Tier 1 Capital ratio. Furthermore, for the Bank to pay a dividend to the Corporation without regulatory approval, the dividend is limited to the total amount of the Bank’s current year net income plus the Bank’s net income of the prior two years less any previous dividends paid by the Bank to the Corporation during that time.
At December 31, 2017, the Company holds a total of 1,338,360 shares of treasury stock at an average price of $12.44 per share. At December 31, 2017, the Company may purchase 300,000 shares of treasury stock under a new stock repurchase plan announced on November 11, 2017 that expires December 31, 2019. The Company conducts repurchases through open market transactions or in privately negotiated transactions that may be made from time to time depending on market conditions and other factors.
The Company has paid all interest payments due on HopFed Capital Trust I. If interest payments to HopFed Capital Trust I are not made in a timely manner, the Company is prohibited from making cash dividend payments to its common shareholders.
98
HopFed Bancorp, Inc. and Subsidiaries
Notes to Consolidated Financial Statements, Continued
December 31, 2017, 2016 and 2015
| (16) | Stockholders’ Equity: (Continued) |
In July 2013, the Federal Reserve Board and the FDIC approved final rules that substantially amend the regulatory risk-based capital rules applicable to Heritage Bank USA, Inc. and HopFed Bancorp, Inc. The final rules implement the regulatory capital reforms of the Basel Committee on Banking Supervision reflected in “Basel III: A Global Regulatory Framework for More Resilient Banks and Banking Systems” (Basel III) and changes required by the Dodd-Frank Act.
Under these rules, the leverage capital and risk-based capital ratios of bank holding companies may not be lower than the leverage and risk-based capital ratios for insured depository institutions. The final rules implementing the Basel III regulatory capital reforms became effective on January 1, 2015, and include new minimum risk-based capital and leverage ratios. Moreover, these rules refine the definition of what constitutes “capital” for purposes of calculating those ratios, including the definitions of Tier 1 capital and Tier 2 capital.
The new minimum capital level requirements applicable to bank holding companies and banks subject to the rules are:
| • | a new common equity Tier 1 capital ratio of 4.5%; |
| • | a Tier 1 risk-based capital ratio of 6% (increased from 4%); |
| • | a total risk-based capital ratio of 8% (unchanged from current rules); and |
| • | a Tier 1 leverage ratio of 4% for all institutions. |
The rules also establish a “capital conservation buffer” of 2.5% (to be phased by 2019) above the new regulatory minimum risk-based capital ratios, and result in the following minimum ratios once the capital conservation buffer is fully phased in:
| • | a common equity Tier 1 risk-based capital ratio of 7.0%; |
| • | a Tier 1 risk-based capital ratio of 8.5%; and |
| • | a total risk-based capital ratio of 10.5%. |
At December 31, 2017, the Bank and Corporation met all fully phased capital requirements of Basel III, including the capital conservation buffer of 2.5% to be fully phased in by January 1, 2019. The Capital conservation buffer for 2017 is 1.25% and 1.875% for 2018. The net unrealized gain or loss on available for sale securities is not included in computing regulatory capital.
99
HopFed Bancorp, Inc. and Subsidiaries
Notes to Consolidated Financial Statements, Continued
December 31, 2017, 2016 and 2015
| (17) | Earnings Per Share: |
Earnings per share of common stock are based on the weighted average number of basic shares and dilutive shares outstanding during the year. Common stock warrants outstanding are not included in the dilutive earnings per share computations because they would be anti-dilutive.
The following is a reconciliation of weighted average common shares for the basic and dilutive earnings per share computations:
| Years Ended December 31, | ||||||||||||
| 2017 | 2016 | 2015 | ||||||||||
| Basic earnings per share: |
||||||||||||
| Weighted average common shares |
6,695,721 | 6,757,345 | 6,919,190 | |||||||||
| Less: Average unallocated ESOP shares |
(474,089 | ) | (523,485 | ) | (546,913 | ) | ||||||
|
|
|
|
|
|
|
|||||||
| Weighted average common shares |
6,221,632 | 6,233,860 | 6,372,277 | |||||||||
|
|
|
|
|
|
|
|||||||
| Weighted average common and incremental shares |
6,221,632 | 6,233,860 | 6,372,277 | |||||||||
|
|
|
|
|
|
|
|||||||
100
HopFed Bancorp, Inc. and Subsidiaries
Notes to Consolidated Financial Statements, Continued
December 31, 2017, 2016 and 2015
(Table Amounts in Thousands)
| (18) | Condensed Parent Company Only Financial Statements: |
The following condensed balance sheets as of December 31, 2017 and December 31, 2016 and condensed statements of income and cash flows for the years ended December 31, 2017, December 31, 2016 and December 31, 2015, of the parent company only should be read in conjunction with the consolidated financial statements and the notes thereto.
| Condensed Balance Sheets: |
||||||||
| 2017 | 2016 | |||||||
| Assets: |
||||||||
| Cash |
$ | 862 | 1,084 | |||||
| Investment in subsidiary |
96,826 | 95,242 | ||||||
| Prepaid expenses and other assets |
1,109 | 804 | ||||||
|
|
|
|
|
|||||
| Total assets |
98,797 | 97,130 | ||||||
|
|
|
|
|
|||||
| Liabilities and equity |
||||||||
| Liabilities |
||||||||
| Dividend payable - common |
353 | 288 | ||||||
| Interest payable |
112 | 101 | ||||||
| Other liabilities |
610 | 3 | ||||||
| Subordinated debentures |
10,310 | 10,310 | ||||||
|
|
|
|
|
|||||
| Total liabilities |
11,385 | 10,702 | ||||||
|
|
|
|
|
|||||
| Equity: |
||||||||
| Preferred stock |
— | — | ||||||
| Common stock |
80 | 80 | ||||||
| Additional paid-capital |
58,825 | 58,660 | ||||||
| Retained earnings |
51,162 | 49,035 | ||||||
| Treasury stock - common stock |
(16,655 | ) | (15,347 | ) | ||||
| Unearned ESOP shares |
(5,901 | ) | (6,548 | ) | ||||
| Accumulated other comprehensive income |
(99 | ) | 548 | |||||
|
|
|
|
|
|||||
| Total equity |
87,412 | 86,428 | ||||||
|
|
|
|
|
|||||
| Total liabilities and equity |
$ | 98,797 | 97,130 | |||||
|
|
|
|
|
|||||
101
HopFed Bancorp, Inc. and Subsidiaries
Notes to Consolidated Financial Statements, Continued
December 31, 2017, 2016 and 2015
(Table Amounts in Thousands)
| (18) | Condensed Parent Company Only Financial Statements: (Continued) |
Condensed Statements of Income:
| 2017 | 2016 | 2015 | ||||||||||
| Interest and dividend income: |
||||||||||||
| Dividend income from subsidiary Bank |
$ | 2,500 | 2,000 | 12,100 | ||||||||
|
|
|
|
|
|
|
|||||||
| Total interest and dividend income |
2,500 | 2,000 | 12,100 | |||||||||
|
|
|
|
|
|
|
|||||||
| Interest expense |
436 | 388 | 740 | |||||||||
| Non-interest expenses |
1,538 | 391 | 541 | |||||||||
|
|
|
|
|
|
|
|||||||
| Total expenses |
1,974 | 779 | 1,281 | |||||||||
|
|
|
|
|
|
|
|||||||
| Income before income taxes and equity in undistributed earnings of subsidiary |
526 | 1,221 | 10,819 | |||||||||
| Income tax benefits |
(545 | ) | (319 | ) | (529 | ) | ||||||
|
|
|
|
|
|
|
|||||||
| Income before equity in undistributed earnings of subsidiary |
1,071 | 1,540 | 11,348 | |||||||||
| Equity in (distribution in excess of) earnings of subsidiary |
2,230 | 1,364 | (8,944 | ) | ||||||||
|
|
|
|
|
|
|
|||||||
| Income available to common shareholders |
$ | 3,301 | 2,904 | 2,404 | ||||||||
|
|
|
|
|
|
|
|||||||
102
HopFed Bancorp, Inc. and Subsidiaries
Notes to Consolidated Financial Statements, Continued
December 31, 2017, 2016 and 2015
(Table Amounts in Thousands)
| (18) | Condensed Parent Company Only Financial Statements: (Continued) |
Condensed Statements of Cash Flows:
| 2017 | 2016 | 2015 | ||||||||||
| Cash flows from operating activities |
||||||||||||
| Net income |
$ | 3,301 | 2,904 | 2,404 | ||||||||
| Adjustments to reconcile net income to net cash provided by operating activities |
||||||||||||
| Equity in undistributed earnings of subsidiary |
(2,230 | ) | (1,364 | ) | 8,943 | |||||||
| Amortization of restricted stock |
106 | 135 | 190 | |||||||||
| Increase (decrease) in: |
||||||||||||
| Current income taxes payable |
330 | (49 | ) | 11 | ||||||||
| Accrued expenses |
106 | (392 | ) | (149 | ) | |||||||
|
|
|
|
|
|
|
|||||||
| Net cash provided by operating activities |
1,613 | 1,234 | 11,399 | |||||||||
|
|
|
|
|
|
|
|||||||
| Cash flows from financing activities: |
||||||||||||
| Purchase of treasury stock |
(1,308 | ) | (1,876 | ) | (11,926 | ) | ||||||
| Proceeds on ESOP loan |
647 | 632 | 704 | |||||||||
| Dividends paid on common stock |
(1,174 | ) | (993 | ) | (1,022 | ) | ||||||
|
|
|
|
|
|
|
|||||||
| Net cash used in financing activities |
(1,835 | ) | (2,237 | ) | (12,244 | ) | ||||||
| Net decrease in cash |
(222 | ) | (1,003 | ) | (845 | ) | ||||||
| Cash and due from banks at beginning of year |
1,084 | 2,087 | 2,932 | |||||||||
|
|
|
|
|
|
|
|||||||
| Cash and due from banks at end of year |
$ | 862 | 1,084 | 2,087 | ||||||||
|
|
|
|
|
|
|
|||||||
103
HopFed Bancorp, Inc. and Subsidiaries
Notes to Consolidated Financial Statements, Continued
December 31, 2017, 2016 and 2015
(Table Amounts in Thousands)
| (19) | Investments in Affiliated Companies (Unaudited): |
Investments in affiliated companies accounted for under the equity method consist of 100% of the common stock of HopFed Capital Trust I (the Trust), a wholly owned statutory business trust. The Trust was formed on September 25, 2003. Summary financial information for the HopFed Capital Trust 1 is as follows:
Summary Balance Sheets
| December 31, | December 31, | |||||||
| 2017 | 2016 | |||||||
| Asset – investment in subordinated debentures issued by HopFed Bancorp, Inc. |
$ | 10,310 | 10,310 | |||||
|
|
|
|
|
|||||
| Liabilities |
$ | — | — | |||||
| Stockholders’ equity: |
||||||||
| Trust preferred securities |
10,000 | 10,000 | ||||||
| Common stock (100% owned by HopFed Bancorp, Inc.) |
310 | 310 | ||||||
|
|
|
|
|
|||||
| Total stockholder’s equity |
10,310 | 10,310 | ||||||
|
|
|
|
|
|||||
| Total liabilities and stockholder’s equity |
$ | 10,310 | 10,310 | |||||
|
|
|
|
|
|||||
Summary Statements of Income
| Years Ended December. 31, |
||||||||
| 2017 | 2016 | |||||||
| Income – interest income from subordinated debentures issued by HopFed Bancorp, Inc. |
$ | 449 | 400 | |||||
|
|
|
|
|
|||||
| Net income |
$ | 449 | 400 | |||||
|
|
|
|
|
|||||
Summary Statements of Stockholder’s Equity
| Trust | Total | |||||||||||||||
| Preferred | Common | Retained | Stockholder’s | |||||||||||||
| Securities | Stock | Earnings | Equity | |||||||||||||
| Beginning balances, January 1, 2017 |
$ | 10,000 | 310 | — | 10,310 | |||||||||||
| Retained earnings: |
||||||||||||||||
| Net income |
— | — | 449 | 449 | ||||||||||||
| Dividends: |
||||||||||||||||
| Trust preferred securities |
— | — | (436 | ) | (436 | ) | ||||||||||
| Common dividends paid to HopFed Bancorp, Inc. |
— | — | (13 | ) | (13 | ) | ||||||||||
|
|
|
|
|
|
|
|
|
|||||||||
| Total retained earnings |
— | — | — | — | ||||||||||||
|
|
|
|
|
|
|
|
|
|||||||||
| Ending balances, December 31, 2017 |
$ | 10,000 | 310 | — | 10,310 | |||||||||||
|
|
|
|
|
|
|
|
|
|||||||||
104
HopFed Bancorp, Inc. and Subsidiaries
Notes to Consolidated Financial Statements, Continued
December 31, 2017, 2016 and 2015
(Table Amounts in Thousands)
| (20) | Quarterly Results of Operations: (Unaudited) |
Summarized unaudited quarterly operating results for the year ended December 31, 2017:
| First | Second | Third | Fourth | |||||||||||||
| Quarter | Quarter | Quarter | Quarter | |||||||||||||
| December 31, 2017: |
||||||||||||||||
| Interest and dividend income |
$ | 8,160 | 8,419 | 8,635 | 8,541 | |||||||||||
| Interest expense |
1,406 | 1,454 | 1,537 | 1,566 | ||||||||||||
|
|
|
|
|
|
|
|
|
|||||||||
| Net interest income |
6,754 | 6,965 | 7,098 | 6,975 | ||||||||||||
| Provision for loan losses |
291 | 59 | 71 | 56 | ||||||||||||
|
|
|
|
|
|
|
|
|
|||||||||
| Net interest income after provision for loan losses |
6,463 | 6,906 | 7,027 | 6,919 | ||||||||||||
| Noninterest income |
2,296 | 1,836 | 2,030 | 1,868 | ||||||||||||
| Noninterest expense |
7,689 | 7,233 | 7,168 | 7,806 | ||||||||||||
|
|
|
|
|
|
|
|
|
|||||||||
| Income before income taxes |
1,070 | 1,509 | 1,889 | 981 | ||||||||||||
| Income taxes |
135 | 368 | 486 | 1,159 | ||||||||||||
|
|
|
|
|
|
|
|
|
|||||||||
| Net income (loss) |
$ | 935 | 1,141 | 1,403 | (178 | ) | ||||||||||
|
|
|
|
|
|
|
|
|
|||||||||
| Basic earnings (loss) per share |
$ | 0.15 | 0.18 | 0.22 | (0.03 | ) | ||||||||||
|
|
|
|
|
|
|
|
|
|||||||||
| Diluted earnings (loss) per share |
$ | 0.15 | 0.18 | 0.22 | (0.03 | ) | ||||||||||
|
|
|
|
|
|
|
|
|
|||||||||
| Weighted average shares outstanding: |
||||||||||||||||
| Basic |
6,218,706 | 6,228,994 | 6,236,075 | 6,202,635 | ||||||||||||
|
|
|
|
|
|
|
|
|
|||||||||
| Diluted |
6,218,706 | 6,228,994 | 6,236,075 | 6,202,635 | ||||||||||||
|
|
|
|
|
|
|
|
|
|||||||||
105
HopFed Bancorp, Inc. and Subsidiaries
Notes to Consolidated Financial Statements, Continued
December 31, 2017, 2016 and 2015
(Table Amounts in Thousands)
| (20) | Quarterly Results of Operations: (Unaudited) |
Summarized unaudited quarterly operating results for the year ended December 31, 2016:
| First | Second | Third | Fourth | |||||||||||||
| Quarter | Quarter | Quarter | Quarter | |||||||||||||
| December 31, 2016: |
||||||||||||||||
| Interest and dividend income |
$ | 8,081 | 7,691 | 8,004 | 7,951 | |||||||||||
| Interest expense |
1,405 | 1,268 | 1,315 | 1,311 | ||||||||||||
|
|
|
|
|
|
|
|
|
|||||||||
| Net interest income |
6,676 | 6,423 | 6,689 | 6,640 | ||||||||||||
| Provision for loan losses |
458 | 465 | 255 | 63 | ||||||||||||
|
|
|
|
|
|
|
|
|
|||||||||
| Net interest income after provision for loan losses |
6,218 | 5,958 | 6,434 | 6,577 | ||||||||||||
| Noninterest income |
2,020 | 1,970 | 1,945 | 2,000 | ||||||||||||
| Noninterest expense |
7,683 | 7,609 | 7,353 | 7,211 | ||||||||||||
|
|
|
|
|
|
|
|
|
|||||||||
| Income before income taxes |
555 | 319 | 1,026 | 1,366 | ||||||||||||
| Income taxes |
46 | 15 | 41 | 260 | ||||||||||||
|
|
|
|
|
|
|
|
|
|||||||||
| Net income |
$ | 509 | 304 | 985 | 1,106 | |||||||||||
|
|
|
|
|
|
|
|
|
|||||||||
| Basic earnings per share |
$ | 0.08 | 0.05 | 0.16 | 0.18 | |||||||||||
|
|
|
|
|
|
|
|
|
|||||||||
| Diluted earnings per share |
$ | 0.08 | 0.05 | 0.16 | 0.18 | |||||||||||
|
|
|
|
|
|
|
|
|
|||||||||
| Weighted average shares outstanding: |
||||||||||||||||
| Basic |
6,297,755 | 6,232,457 | 6,212,231 | 6,193,278 | ||||||||||||
|
|
|
|
|
|
|
|
|
|||||||||
| Diluted |
6,297,755 | 6,232,457 | 6,212,231 | 6,193,278 | ||||||||||||
|
|
|
|
|
|
|
|
|
|||||||||
106
HopFed Bancorp, Inc. and Subsidiaries
Notes to Consolidated Financial Statements, Continued
December 31, 2017, 2016 and 2015
(Table Amounts in Thousands)
| (21) | Comprehensive Income: |
FASB ASC 220, Comprehensive Income, established standards for reporting comprehensive income. Comprehensive income includes net income and other comprehensive net income which is defined as non-owner related transactions in equity. The following table sets forth the amounts of other comprehensive income (loss) included in stockholders’ equity along with the related tax effect for the years ended December 31, 2017, 2016 and 2015.
| Pre-Tax | Tax Benefit | Net of Tax | ||||||||||
| Amount | (Expense) | Amount | ||||||||||
| December 31, 2017: |
||||||||||||
| Unrealized holding gains (losses) on: |
||||||||||||
| Available for sale securities |
($ | 585 | ) | 198 | (387 | ) | ||||||
| Available for sale securities – OTTI |
(224 | ) | 76 | (148 | ) | |||||||
| Reclassification adjustments for gains on: |
|
|||||||||||
| Available for sale securities |
(169 | ) | 57 | (112 | ) | |||||||
|
|
|
|
|
|
|
|||||||
| ($ | 978 | ) | 331 | (647 | ) | |||||||
|
|
|
|
|
|
|
|||||||
| Pre-Tax | Tax Benefit | Net of Tax | ||||||||||
| Amount | (Expense) | Amount | ||||||||||
| December 31, 2016: |
||||||||||||
| Unrealized holding gains (losses) on: |
||||||||||||
| Available for sale securities |
($ | 2,048 | ) | 697 | (1,351 | ) | ||||||
| Available for sale securities – OTTI |
(258 | ) | 88 | (170 | ) | |||||||
| Reclassification adjustments for gains on: |
||||||||||||
| Available for sale securities |
(612 | ) | 207 | (405 | ) | |||||||
|
|
|
|
|
|
|
|||||||
| ($ | 2,918 | ) | 992 | (1,926 | ) | |||||||
|
|
|
|
|
|
|
|||||||
| December 31, 2015: |
||||||||||||
| Unrealized holding gains on: |
||||||||||||
| Available for sale securities |
($ | 1,698 | ) | 577 | (1,121 | ) | ||||||
| Available for sale securities—OTTI |
359 | (122 | ) | 237 | ||||||||
| Derivatives |
389 | (132 | ) | 257 | ||||||||
| Reclassification adjustments for gains on: |
|
|||||||||||
| Available for sale securities |
(691 | ) | 235 | (456 | ) | |||||||
|
|
|
|
|
|
|
|||||||
| ($ | 1,641 | ) | 558 | (1,083 | ) | |||||||
|
|
|
|
|
|
|
|||||||
107
HopFed Bancorp, Inc. and Subsidiaries
Notes to Consolidated Financial Statements, Continued
December 31, 2017, 2016 and 2015
| (22) | Subsequent Event |
On February 7, 2018, the Court of Chancery granted Plaintiffs motion requesting that the Company reimburse the Plaintiff for Attorneys’ Fees and Expenses. The Company was ordered to reimburse the Plaintiff a sum of $610,312.40 within five business days of the order. For the year ended December 31, 2017, the Company recognized the reimbursement of fees to the Plaintiff as an expense. Any subsequent recover of fees from the Company’s insurance company will be recognized in the period it is received.
On February 23, 2018, Joseph Stilwell, the managing member of and owner of Stilwell Value LLC, filed a shareholder demand letter to demand that the Company’s Board of Directors take action against the issuers attorney’s, Edward B. Crosland of Jones Walker LLP and George M. Carter of Carter & Carter for legal malpractice and seek damages in excess of $1.0 million to the issue. As of the date of this filing, the Company has taken no action to address the demand letter.
108