Attached files
| file | filename |
|---|---|
| EX-32.1 - EX-32.1 - Benefitfocus, Inc. | bnft-ex321_11.htm |
| EX-31.2 - EX-31.2 - Benefitfocus, Inc. | bnft-ex312_8.htm |
| EX-31.1 - EX-31.1 - Benefitfocus, Inc. | bnft-ex311_7.htm |
| EX-23.1 - EX-23.1 - Benefitfocus, Inc. | bnft-ex231_9.htm |
| EX-21.1 - EX-21.1 - Benefitfocus, Inc. | bnft-ex211_10.htm |
| EX-10.18.1 - EX-10.18.1 - Benefitfocus, Inc. | bnft-ex10181_12.htm |
| EX-10.7.1 - EX-10.7.1 - Benefitfocus, Inc. | bnft-ex1071_6.htm |
UNITED STATES
SECURITIES AND EXCHANGE COMMISSION
Washington, D.C. 20549
FORM 10-K
(Mark One)
|
☒ |
ANNUAL REPORT PURSUANT TO SECTION 13 OR 15(d) OF THE SECURITIES EXCHANGE ACT OF 1934 |
For the fiscal year ended December 31, 2017
or
|
☐ |
TRANSITION REPORT PURSUANT TO SECTION 13 OR 15(d) OF THE SECURITIES EXCHANGE ACT OF 1934 |
For the transition period from to .
Commission File Number: 001-36061
Benefitfocus, Inc.
(Exact name of registrant as specified in its charter)
|
Delaware |
|
46-2346314 |
|
(State or other jurisdiction of incorporation or organization) |
|
(I.R.S. Employer Identification No.) |
100 Benefitfocus Way
Charleston, South Carolina 29492
(Address of principal executive offices and zip code)
(843) 849-7476
(Registrant’s telephone number, including area code)
Securities registered pursuant to Section 12(b) of the Act:
|
|
Title of each class |
|
Name of each exchange of which registered |
|
|
|
Common Stock, $0.001 Par Value |
|
NASDAQ Global Market |
|
Securities registered pursuant to Section 12(g) of the Act:
None
Indicate by check mark if the registrant is a well-known seasoned issuer, as defined in Rule 405 of the Securities Act. Yes ☐ No ☒
Indicate by check mark if the registrant is not required to file reports pursuant to Section 13 or Section 15(d) of the Act. Yes ☐ No ☒
Indicate by check mark whether the registrant (1) has filed all reports required to be filed by Section 13 or 15(d) of the Securities Exchange Act of 1934 during the preceding 12 months (or for such shorter period that the registrant was required to file such reports), and (2) has been subject to such filing requirements for the past 90 days. Yes ☒ No ☐
Indicate by check mark whether the registrant has submitted electronically and posted on its corporate Web site, if any, every Interactive Data File required to be submitted and posted pursuant to Rule 405 of Regulation S-T (§ 232.405 of this chapter) during the preceding 12 months (or for such shorter period that the registrant was required to submit and post such files). Yes ☒ No ☐
Indicate by check mark if disclosure of delinquent filers pursuant to Item 405 of Regulation S-K is not contained herein, and will not be contained, to the best of registrant’s knowledge, in definitive proxy or information statements incorporated by reference in Part III of this Form 10-K or any amendment to this Form 10-K. ☐
Indicate by check mark whether the registrant is a large accelerated filer, an accelerated filer, a non-accelerated filer, a smaller reporting company, or emerging growth company. See the definitions of “large accelerated filer,” “accelerated filer,” “smaller reporting company” and “emerging growth company” in Rule 12b-2 of the Exchange Act.:
|
Large accelerated filer ☐ |
|
Accelerated filer ☒ |
|
Non-accelerated filer ☐ |
|
Smaller reporting company ☐ |
|
Emerging growth company ☒ |
|
|
|
|
|
(Do not check if a smaller reporting company) |
|
|
|
|
If an emerging growth company, indicate by check mark if the registrant has elected not to use the extended transition period for complying with any new or revised financial accounting standards provided pursuant to Section 13(a) of the Exchange Act. ☒
Indicate by check mark whether the registrant is a shell company (as defined in Rule 12b-2 of the Act). Yes ☐ No ☒
The aggregate market value of the registrant's common stock held by non-affiliates of the registrant on June 30, 2017 (based on the closing sale price of $36.35 on that date), was approximately $426,784,296. Common stock held by each officer and director and by each person known to the registrant who owned 10% or more of the outstanding common stock have been excluded in that such persons may be deemed to be affiliates. This determination of affiliate status is not necessarily a conclusive determination for other purposes.
The number of shares of the registrant’s common stock outstanding as of March 12, 2018 was 31,331,447.
DOCUMENTS INCORPORATED BY REFERENCE
Portions of the registrant’s definitive Proxy Statement for its 2018 Annual Meeting of Stockholders currently scheduled to be held on June 1, 2018 are incorporated by reference into Part III hereof.
Form 10-K
For Year Ended December 31, 2017
TABLE OF CONTENTS
1
SPECIAL NOTE REGARDING FORWARD-LOOKING STATEMENTS
This Annual Report on Form 10-K contains “forward-looking statements” that involve risks and uncertainties, as well as assumptions that, if they never materialize or prove incorrect, could cause our results to differ materially from those expressed or implied by such forward-looking statements. The statements contained in this Annual Report on Form 10-K that are not purely historical are forward-looking statements within the meaning of Section 27A of the Securities Act of 1933, as amended (“Securities Act”), and Section 21E of the Securities Exchange Act of 1934, as amended (“Exchange Act”). Such forward-looking statements include any expectation of earnings, revenue or other financial items; any statements of the plans, strategies and objectives of management for future operations; factors that may affect our operating results; statements about our ability to establish and maintain intellectual property rights; statements about our ability to retain and hire necessary associates and appropriately staff our operations; statements related to future capital expenditures; statements related to future economic conditions or performance; statements as to industry trends; and other matters that do not relate strictly to historical facts or statements of assumptions underlying any of the foregoing. Forward-looking statements are often identified by the use of words such as, but not limited to, “anticipate,” “believe,” “can,” “continue,” “could,” “estimate,” “expect,” “intend,” “may,” “might,” “will,” “plan,” “project,” “seek,” “should,” “target,” “would,” and similar expressions or variations intended to identify forward-looking statements. These statements are based on the beliefs and assumptions of our management based on information currently available to management. Such forward-looking statements are subject to risks, uncertainties and other important factors that could cause actual results and the timing of certain events to differ materially from future results expressed or implied by such forward-looking statements. Factors that could cause or contribute to such differences include, but are not limited to, those discussed in the section titled “Risk Factors” included in Item 1A of Part I of this Annual Report on Form 10-K, and the risks discussed in our other SEC filings. Furthermore, such forward-looking statements speak only as of the date of this report. Except as required by law, we undertake no obligation to update any forward-looking statements to reflect events or circumstances after the date of such statements.
As used in this report, the terms “Benefitfocus, Inc.,” “Benefitfocus,” “Company,” “company,” “we,” “us,” and “our” mean Benefitfocus, Inc. and its subsidiaries unless the context indicates otherwise.
Overview
Benefitfocus provides a leading cloud-based benefits management platform for consumers, employers, insurance carriers, and brokers. The Benefitfocus Platform simplifies how organizations and individuals shop for, enroll in, manage and exchange benefits. Our employer and insurance carrier customers rely on our platform to manage, scale and exchange benefits data seamlessly. Our web-based platform has a user-friendly interface designed to enable the insured consumers to access all of their benefits in one place. Our comprehensive solutions support core benefits plans, including healthcare, dental, life, and disability insurance, and voluntary benefits offerings such as income protection, digital health and financial wellness. As the number of employer benefits plans has increased, with each plan subject to many different business rules and requirements, demand for the Benefitfocus Platform has grown.
The Benefitfocus Platform enables our customers to simplify the management of complex benefits processes, from sales through enrollment and implementation to ongoing administration. It provides consumers with an engaging, highly intuitive, and personalized user interface for selecting and managing all of their benefits via their desktop browsers or mobile devices. Employers use our solutions to streamline benefits processes, keep up with complex and changing regulatory requirements, control costs, and offer a greater variety of plans to attract, retain, and motivate their employees. Insurance carriers use our solutions to more effectively market offerings, simplify billing, and improve the enrollment process. We also provide a network of more than 1,500 benefit provider data exchange connections, which facilitates the otherwise highly fragmented interaction among employees, employers, brokers, and carriers.
2
We serve two separate but related market segments. The employer market consists of employers offering benefits to their employees. Within this segment, we mainly target large employers with more than 1,000 employees, of which we believe there are over 18,000 in the United States. In our other market segment, we sell our solutions to insurance carriers, enabling us to expand our overall footprint in the benefits marketplace by aggregating many key constituents, including consumers, employers, and brokers. We believe our presence in both the employer and insurance carrier markets gives us a strong position at the center of the benefits ecosystem. As of December 31, 2017, we served 915 large employer customers, an increase from 141 in 2010, and 54 carrier customers, an increase from 29 in 2010.
We sell the Benefitfocus Platform on a subscription basis, typically through annual contracts with our employer customers and multi-year contracts with our insurance carrier customers, with subscription fees paid monthly, quarterly and annually. The multi-year contracts with our carrier customers are generally only cancellable by the carrier in an instance of our uncured breach, although some of our carrier customers are able to terminate their respective contracts without cause or for convenience. Our software-as-a-service, or SaaS, model provides us significant visibility into our future operating results through increased revenue predictability, which enhances our ability to manage our business. Our company was founded in 2000, and we currently employ approximately 1,450 associates, or employees.
Industry Background
The administration and distribution of benefits to employees is a mainstay of the U.S. economy. Providing these benefits is costly and complex and requires the exchange of information, application of rules, and transfer of funds among a wide variety of constituents, including consumers, employers, insurance carriers, brokers, benefits outsourcers, payroll processors, and financial institutions. According to IBISWorld calculations, in 2017, the market for HR benefits administration in the United States is expected to grow to over $54 billion. In addition, Gartner estimates that in 2016, the U.S. insurance industry spent approximately $66 billion on software and related services.1
The variety and complexity of core benefits plans, including healthcare, dental, life, and disability insurance continues to grow. The Benefitfocus 2017 annual market research report, The State of Employee Benefits 2018, indicates that a higher proportion of benefits offerings are shifting to high-deductible health plans coupled with health savings accounts. This added complexity places greater potential cost burden on employees and creates a greater need for employers to educate employees on becoming more informed healthcare consumers. To help employees cover added cost burdens, employers are increasingly offering a wider range of voluntary benefits plans, such as critical illness, supplemental income, and financial wellness programs. Current point and legacy systems are inadequate to efficiently manage the complexity, regulation, and the involvement of multiple parties, driving the need for an enterprise benefits management system to improve operational efficiency along the entire benefits value chain.
|
|
1 |
Gartner, Forecast: Enterprise IT Spending by Vertical Industry Market, Worldwide, 2015-2021 4Q17 Update, United States Insurance Market Spending on Software, IT Services, and Internal Services. The Gartner Report described herein, (the "Gartner Report") represents research opinion or viewpoints published, as part of a syndicated subscription service, by Gartner, Inc. ("Gartner"), and are not representations of fact. Each Gartner Report speaks as of its original publication date (and not as of the date of this Annual Report) and the opinions expressed in the Gartner Report are subject to change without notice. |
3
Currently, we believe there are over 18,000 entities that employ more than 1,000 individuals in the United States. A significant and growing portion of employers’ costs is non-salary benefits, such as health insurance, that they provide to their employees. With healthcare and other premiums increasing, senior executives are prioritizing benefits administration in their organizations and searching for ways to contain costs without sacrificing benefits. In addition, the expense burden continues to shift to employees. Employees’ contributions to premiums for health insurance have grown from approximately $318 per employee in 1999 to approximately $1,213 per employee in 2017. Employers recognize the importance of offering a greater variety of core and voluntary benefits as a means to attract, motivate, and retain employees. They must maintain relationships with multiple insurance carriers and many other benefits providers, placing a substantial administrative burden on their organizations.
Employers’ distribution, management, and administration of employee benefits has historically consisted of error-prone, paper-based processes, and a patchwork of customized software tools, which are costly to maintain, often lack necessary functionality, and fail to address the increasing complexity of the benefits marketplace. As benefits offerings become more complex and employees bear more of the cost of those benefits, HR software solutions that streamline information, simplify choices, and engage employees are increasingly in demand. Employees desire tailored, dynamic, and interactive communication of critical benefits information as they become accustomed to receiving personalized content through various consumer applications on a range of devices.
Legacy HR systems were generally designed as extensions of enterprise resource planning, or ERP, systems, built for back-office responsibilities like finance and accounting. As a result, these systems lack functionality and ease-of-use for employees. Many legacy HR systems were not designed to integrate with the broader benefits ecosystem, including brokers, carriers, and wellness providers. This results in expensive, error-prone, and frustrating experiences for employers and employees. Benefits outsourcers have attempted to compensate for the shortcomings of legacy HR systems, but they have generally lacked adequate technology solutions necessary to keep up with the rapidly evolving benefits landscape. As a result, employees are often not provided with the appropriate functionality and information required to select and manage their benefits effectively.
Modern technology, changing communication patterns, and a constantly evolving benefits ecosystem have changed the employee-employer relationship. HR executives continue to search for effective strategies to increase efficiency and contain costs, while increasing employee engagement and satisfaction. Employers are increasingly interested in SaaS solutions that can help capture and analyze benefits data and ultimately lead to healthier, happier, and more productive employees. In order to manage the distribution and administration of benefits effectively, employers need an integrated platform, capable of handling all benefits in one place and providing a highly personalized experience for employees.
Insurance Carrier Market
The employee benefits market consists of a myriad of insurance carriers and products. According to the U.S. Bureau of Labor Statistics, the single largest benefit provided to employees in the United States is healthcare insurance, often encompassing more than 90% of all insurance benefits spending by employers.
Large, national insurance carriers also offer numerous individual health plans of different types, including health maintenance organizations, preferred provider organizations, point-of-service plans, and high deductible health plans, across the 50 states, as well as life and ancillary benefits plans. Each carrier offers a complex variety of health insurance, life and ancillary benefits plans, with each plan requiring multiple decisions to address the specific needs of employers and their individual employees. Despite widespread carrier consolidation, numerous disparate systems remain in place, with many large carriers operating on multiple IT systems. Carriers often rely on manual processes and siloed software applications to bridge gaps in legacy administration systems. Even as carriers attempt to modernize and keep up with evolving industry practices and a changing regulatory landscape, they have difficulty connecting with the broader healthcare system.
4
The effective delivery and management of healthcare benefits depends on the timely, continuous exchange of accurate data among carriers, their employer customers, and individual members. Legacy benefits management systems often lack important functionality such as web and mobile self-service capabilities and real-time data exchange. Critical carrier processes, including member enrollment, billing, communications, and retail marketing have often been under-optimized or neglected by legacy systems, and carriers have devoted significant internal resources to cover technology gaps. In addition, healthcare reform mandates and the rise of exchanges have increased focus on carriers’ retail distribution capabilities, which require additional investment.
Governmental oversight, punctuated with the Patient Protection and Affordable Care Act, or PPACA, has led to an increasingly dynamic regulatory framework under which health benefits are delivered, accessed, and maintained. Despite uncertainty regarding the long-term viability of PPACA, we expect digital transformation of healthcare benefits to continue in the form of public and private exchanges – online marketplaces that allow insurance carriers to compete directly for new members. We expect private exchanges will be less rigid, promoting both health and non-health benefits, with substantially fewer rules around the types of benefits offered. As insurance carriers continue to bolster their retail distribution capabilities, we believe they will require consolidation of technology solutions to improve operational efficiency and attract additional members through private exchanges.
Reportable Segments
Our reportable segments, Employer and Carrier, are based on type of customer. Financial information for Benefitfocus’ reportable segments is included in Note 14 to our consolidated financial statements included in this Annual Report on Form 10-K.
The Benefitfocus Solutions
We provide a multi-tenant cloud-based benefits management platform to the employer and carrier markets. The Benefitfocus Platform simplifies how organizations and individuals shop for, enroll in, manage, and exchange benefits.
We believe our solutions help employers in the following important ways:
Simplify Benefits Enrollment. Our solutions reduce the complexity of benefits enrollment by integrating all plan information in one place and presenting it to employees in an organized and easy-to-understand manner. Employees shop and enroll using a highly intuitive and engaging consumer-oriented interface.
Transition to Defined Contribution Benefits Funding Model. Our solutions help enable employers’ ongoing shift to defined contribution plans. Defined contribution plans differ from traditional defined benefit plans as they grant employees a stipend with which to purchase benefits of their choosing. Defined contribution plans also offer more discretion and options compared to defined benefit plans. Our products support traditional defined benefit plans, allowing employees to select from a list of benefits offered by their employer, calculating required member contributions, and recording and transmitting elections and other important information to payroll. Separately, with respect to defined contribution plans, our exchange solutions help facilitate an online shopping environment with many benefit options that allows employees to select personalized benefit offerings to suit their individual needs.
Reduce Cost and Increase ROI. Our solutions automate the benefits management process and reduce the cost associated with clerical errors and covering ineligible employees and dependents. Our solutions also include advanced analytics that enable employers and employees to quickly gather, report, and forecast benefit costs.
Attract, Retain, and Motivate Employees. Our solutions help employers attract, retain, and motivate top talent by delivering benefits information through a highly intuitive and engaging user interface. We believe that when employees understand the value of their benefits, they are more likely to be satisfied with and engaged in their jobs.
5
Streamline HR Processes. Our solutions eliminate the time-consuming and labor-intensive, often paper-based, processes associated with managing employee benefits plans, making HR professionals more efficient. Employers and HR professionals can efficiently enroll users or update information, and communicate or make changes to plans in real-time.
Integrate Seamlessly with Related Systems. Our solutions can be easily and securely integrated with a variety of related systems, including carrier membership and billing, payroll and HR, banking, and other third-party administration. We provide a network of more than 1,500 benefit provider data exchange connections. Our open architecture further extends our functionality by allowing third parties to develop and offer apps and services on our platform.
We believe our solutions help insurance carriers in the following important ways:
Attract and Maintain Membership. Our solutions allow carriers to maximize sales capacity and efficiency by communicating directly with their employer customers and individual members.
Reduce Administrative Costs. The Benefitfocus Platform allows carriers to consolidate IT systems, automate and simplify various aspects of the benefits administration process, such as enrollment, plan changes, eligibility updates, and billing, from one centralized location.
Bolster Retail Distribution Capabilities Through Marketplaces. Our solutions help carriers respond to an evolving marketplace in which retail distribution capabilities are increasingly important to attracting and retaining new members. Our platform offers carriers a lower cost direct sales channel to employer groups and individuals. We offer the ability to sell both healthcare and non-healthcare benefit products in an online shopping environment that serves as an alternative to government-sponsored public exchanges.
Facilitate Real-Time Data Exchange. Our solutions simplify interactions and data exchange, and foster collaboration among carriers and their partners, brokers, employer customers, and individual members. This allows carriers to rapidly tailor and offer new benefits packages.
Our Growth Strategy
We intend to strengthen our position as a leading provider of cloud-based benefits software solutions. Key elements of our growth strategy include the following:
Expand our Customer Base. We believe that our current customer base represents a small fraction of our targeted users that could benefit from our solutions. In order to reach new customers in our existing markets, we are aggressively investing in our sales and marketing resources and our channel marketing strategy, including in ways intended to expand existing relationships and foster organic growth opportunities through brokers.
Deepen our Relationships with our Existing Customer Base. We are deepening our employer relationships by continuing to provide a unified platform with a growing list of additional solutions to manage increasingly complex benefits processes and simplify the distribution and administration of employee benefits. We are expanding our carrier relationships through both the upsell of additional software products and increased adoption across our carriers’ member populations.
Extend our Suite of Applications and Continue our Technology Leadership. We are extending the number, range, and functionality of our benefits applications. We have also extended the functionality of our products with various mobile applications. We intend to continue our collaboration with customers and partners, so we can respond quickly to evolving market needs with innovative applications and support our leadership position.
Further Develop our Partner Ecosystem. We have established strong relationships with organizations such as Mercer, SAP, Allstate Insurance Company, Equifax, and others in a variety of industries to deliver best-in-class applications to our customers. We plan to continue to invest in our integration infrastructure to allow third parties and customers to build custom applications on the Benefitfocus Platform and create deep integrations between their systems and ours.
6
Leverage our Corporate Culture. We believe our culture inspires our associates and customers and supports our growth. We plan to continue to invest in our culture to help attract and retain top design and engineering professionals who are not only passionate about Benefitfocus and motivated to create superior software technology, but also passionate about contributing positively to their communities.
Target New Markets. We believe substantial demand for our solutions exists in markets and geographies beyond our current focus. We intend to leverage opportunities we believe will arise from the complexities of changing government regulation and increased enrollment impacting both Medicare and Medicaid. We also plan to grow our sales capability internationally by expanding our direct sales force and collaborating with strategic partners in new, international locations.
Selectively Pursue Strategic Acquisitions and Investments. We might pursue acquisitions of or investments in complementary businesses and technologies that are consistent with our overall growth strategy. We believe that a selective acquisition and investment strategy could enable us to gain new customers, accelerate our expansion into new markets, and enhance our product capabilities.
The Benefitfocus Portfolio of Products
Our portfolio of products, as summarized below, provides a seamless, integrated experience for the entire life cycle of benefits enrollment and management for insurance carriers and employers. We also provide extensive applications to help carriers and employers manage their programs more effectively.
|
Products and Services for Insurance Carriers |
|
Products and Services for Employers |
|
Marketplaces: |
|
Benefitfocus Marketplace |
|
Large Employer Marketplace |
|
Communication Portal |
|
Mid-Market Marketplace |
BenefitStore |
|
|
Small Employer Marketplace |
|
Core & Advanced Analytics |
|
eEnrollment |
Benefits Service Center |
|
|
eBilling |
|
Video |
|
eExchange |
|
ACA Management & Reporting |
|
eSales |
|
Billing & Payment |
|
Core & Advanced Analytics |
|
Implementation Services |
|
Certified Carrier Program |
|
Integrations |
|
Integrations |
|
Benefitfocus University |
|
Video |
|
Account Services: |
|
Implementation Services |
|
Consumer Directed Healthcare Accounts |
|
Benefits Service Center |
||
|
|
|
COBRA Administration |
7
Products for Insurance Carriers
|
|
• |
Marketplaces are online shopping environments, sometimes referred to as exchanges that allow customers to select from a variety of benefits plan choices to suit their individual needs. Marketplaces support the shift toward defined contribution benefits plans, which are increasing in popularity. Marketplaces provide consumer-centric experiences focused on personalization, and integrate social tools to help drive informed choices while selecting benefits. They also include features to track plans and compare pricing and features across multiple benefit plans. |
|
|
• |
eEnrollment is our flagship product for carriers, providing them with online enrollment for all types of benefits. We designed eEnrollment to enhance our users’ experience by presenting information in a user-friendly format and integrating educational videos as well as plan comparison and decision support tools to help users navigate the enrollment process. In addition to helping customers find suitable plans, eEnrollment supports complex business rules, such as eligibility and rating criteria. eEnrollment facilitates the following activities: |
|
|
• |
Initial Enrollment. Employees and brokers can complete applications and health statements prior to making elections. Once the selection occurs, eEnrollment automatically calculates group numbers, finalizes benefit elections, and sends the data to the insurance carriers’ membership systems. |
|
|
• |
Open Enrollment. eEnrollment simplifies open enrollment by providing tools to map employees from one plan to another, such as workflow, to-do lists, e-mail reminders, and a wide range of reports. |
|
|
• |
New Hire Enrollment. New hires can enroll in benefits anytime during their initial enrollment period. eEnrollment calculates wait periods and effective dates automatically to ensure compliance with the employers’ business rules. |
|
|
• |
Life Events. Employees can make changes to their elections for specific reasons, including a birth, marriage, and military leave. eEnrollment calculates effective dates and helps employees understand what types of coverage changes are permitted with each type of life event. |
|
|
• |
eBilling is an electronic invoice presentment and payment solution, or EIPP. It consolidates invoices from multiple insurance products so employers and individuals receive one invoice that can be viewed and paid electronically. eBilling automates the synchronization of billing and membership data to improve the accuracy of billing processes and provides options to simplify bill payment, such as scheduled one-time and/or recurring payments. |
|
|
• |
eExchange is a solution that bridges the communication gap between carrier and employer systems, allowing a seamless exchange of data between the two. Our customers use eExchange to integrate data from multiple systems, convert data from one format to another, and manage the flow of employee data between carriers and employers. |
|
|
• |
eSales gives carriers and brokers tools to organize and proactively manage accounts, track leads, generate quotes, and create proposals for multiple products. eSales allows carriers to define their own market segments and configure them with unique workflows and business rules. It also enables greater data accuracy by automatically incorporating updated products, options and pricing for the most current rates and quotes. Carriers purchase eSales to increase productivity in their sales force. |
|
|
• |
Core & Advanced Analytics is our data analytics solution for use by carriers and their self-insured employer customers. Core & Advanced Analytics is a privately-labeled analytics solution that helps carriers and their self-insured employers identify cost drivers, recognize trends, and predict future risks and costs. Additional analytical capabilities help create “what-if” scenarios to model different variables, such as co-pay, deductibles, benefits, inflation, and member populations. |
|
|
• |
Certified Carrier Program is our partnership program with large life and ancillary product providers designed to deliver seamless ancillary, voluntary and life-style benefits to consumers. The program is a combination of technology solutions, preferred pricing and distribution opportunities. |
8
|
|
• |
Benefitfocus Marketplace is a cloud-based benefits management portal that streamlines online enrollment, employee communication, and benefits administration. It also and creates an exchange environment for large employers who offer defined contribution plans. In one cohesive, engaging workflow, Benefitfocus Marketplace presents employees with all of the plans their employers offer. Employees who need extra assistance can access avatars, animated videos, and live chat sessions as they explore their benefit options. As employees shop for the plans that best fit their individual needs, a virtual shopping cart keeps a running tally of the employers’ defined contribution in addition to the employees’ out-of-pocket costs. If employees choose to purchase more coverage on their own, they can easily view and pay their bills in the Benefitfocus Marketplace. |
|
|
• |
Communication Portal is an employee engagement portal that gives employers the tools to send personalized, targeted text and email communications to specific employee groups based on location, job level and eligibility status. Features such as an Intelligent Virtual Assistant provide employees on-demand support while reducing administration burden for employers, and Self-Service Total Compensation Reports increase transparency into the full value of benefit offerings, which can contribute to increased engagement and employee satisfaction. |
|
|
• |
BenefitStore is a turnkey solution, enabled by BenefitStore, Inc., a wholly owned subsidiary insurance agency, that makes available directly to employees a broad array of voluntary and ancillary benefits through insurance consulting and brokerage services for employer sponsored and individual products such as transit, supplemental life and disability, among others, to provide a more comprehensive and customizable benefits package. |
|
|
• |
Core & Advanced Analytics is our data analytics solution that helps employers make more informed, data-driven decisions about their benefits offerings. This product aggregates benefit cost and claims data from relevant sources and allows customers to analyze, forecast, and monitor costs. Core & Advanced Analytics enables employers and their advisors to identify cost drivers, recognize trends, and predict future risks and costs. Additional analytical capabilities create “what-if” scenarios to model different variables, such as co-pays, deductibles, benefits, inflation, and member populations. |
|
|
• |
ACA Management & Reporting is our solution that helps employers manage ACA compliance by consolidating and automating IRS reporting. Additionally, Benefitfocus is an approved transmitter, allowing us to electronically file required ACA compliance documents with the Internal Revenue Service on behalf of our customers. |
|
|
• |
Billing & Payment is a comprehensive, dynamic EIPP application that synchronizes enrollment and billing information to streamline the monthly billing process, automate adjustments and increase accuracy of payments. Billing & Payment gives employers the ability to automate or schedule single-invoice payments to all of their benefit providers. Employers can drill down by employee to see coverage level and plan, or focus in by vendor, benefit type or internal cost control center to gain more insight into cost drivers. |
|
|
• |
Consumer-Directed Healthcare Accounts is our solution designed to provide employers and their employees with a seamless enrollment and account management experience for their health savings accounts, or HSAs, or similar medical payment products within Benefitfocus Marketplace. |
|
|
• |
COBRA Administration is our solution for employers that simplifies management of COBRA, or the Consolidated Omnibus Budget Reconciliation Act, benefits. COBRA Administration automates required communication, enrollment, fulfillment and payment processing within Benefitfocus Marketplace. |
9
Professional Services and Customer Support
|
|
• |
Implementation Services. We provide implementation services to our customers in order to help ensure seamless deployment and effective utilization of our solutions. Our carrier and employer implementation teams and third-party system integrators in our Benefitfocus Implementation Program follow a five-step approach for each implementation: |
|
|
• |
Discovery, including project planning and coordination to establish key milestones, documenting business and technical requirements, establishing a deployment strategy, and planning operational and market adoption activities. |
|
|
• |
Configuration and deployment, including configuring products to meet requirements identified during discovery, and defining needs for data exchange, payroll integration, and file transfer protocol. |
|
|
• |
Integration, including connecting the Benefitfocus Platform functionality to a customer’s currently existing systems, such as carrier membership and billing, payroll and HR systems, employee communications, intranets, and others. |
|
|
• |
Testing, including testing of various scenarios and uses cases, inbound and outbound payroll integration, and regression testing. |
|
|
• |
Training and technical support, including sessions to learn how to implement and access our products. |
|
|
• |
Benefits Service Center. We provide employers with expanded support services where our benefits specialists help customers’ employees understand benefit offerings, navigate the enrollment process, and find answers to frequently asked HR questions. Our Benefits Service Center provides employees with personalized, guided support. Additional services, such as fulfillment, dependent verification, and HR administration, are available to meet unique organizational needs. |
|
|
• |
Video. We create video and animated content that can be licensed within our applications or independently for distribution via client portals or websites. Benefitfocus provides a comprehensive video library and also can produce custom videos to meet specific communication requirements of its carrier and employer customers. Our staff of executive producers, project managers, writers, graphic designers, editors, and on-camera talent guide customers through the process from concept development to delivery. Benefitfocus hosts videos, eliminating the need for additional investments or internal IT resources by our customers. In addition, we incorporate our customers’ unique branding to provide a seamless extension of corporate websites and messaging. |
Partner Offerings
|
|
• |
Integrations. We allow our partners and customers to develop custom apps that integrate directly with Benefitfocus Marketplace. The open and flexible nature of our software architecture allows us to build deeper integrations with partner organizations and offer custom services in response to customer demand. Apps are organized into the following categories: voluntary benefits, health and wellness, benefits administration, finance, and communication. Some examples include: |
|
|
• |
RedBrick Health provides access to customizable health assessments, digital coaching, tracking and challenges. |
|
|
• |
LifeLock allows employees to purchase identity theft protection when they are enrolling in other benefit programs. |
|
|
• |
SAP SuccessFactors provides employee performance management solutions. We partnered with SAP to create a full HR and benefits management suite that combines employee talent, profile, and core HR information to help drive employee onboarding, promotion, and development. The SAP SuccessFactors suite of products provides an enterprise-class system of record, as well as powerful analytics and intuitive tools. |
10
Our customers include employers of all sizes across a variety of industries and some of the nation’s largest insurance carriers and aggregators. The following is a list of some of our significant employer and carrier customers.
|
Employer Customers |
|
Carrier Customers |
|
American Eagle Outfitters Inc. |
|
American Family Life Assurance Company of Columbus |
|
Amerigas Propane, Inc. |
|
BlueChoice HealthPlan of South Carolina, Inc. |
|
Brookdale Senior Living Inc. |
|
Blue Cross of Idaho Health Service, Inc. |
|
California Institute of Technology |
|
Blue Cross and Blue Shield of Kansas City |
|
Carolinas HealthCare System |
|
Blue Cross and Blue Shield of South Carolina, Inc. |
|
Fender Musical Instruments Corporation |
|
Wellmark, Inc. |
|
Fiesta Restaurant Group, Inc. |
|
|
|
Hard Rock Café International (USA), Inc. |
|
|
|
Rush University Medical Center |
|
|
|
SAP America Inc. |
|
|
During the year ended December 31, 2017, one customer accounted for 12% of total revenue. No other customer accounted for more than 10% of our total revenue.
Sales and Marketing
We sell our software solutions through our direct sales organization. Our direct sales team comprises employer-focused and carrier-focused field sales professionals who are organized primarily by geography and account size.
We generate customer leads, accelerate sales opportunities and build brand awareness through our marketing programs and strategic relationships. Our marketing programs target HR, benefits, and finance executives, technology professionals, key brokers, and senior business leaders. Our principal marketing programs include:
|
|
• |
use of our website to provide application and company information, as well as learning opportunities for potential customers; |
|
|
• |
territory development representatives who respond to incoming leads and convert them into new sales opportunities; |
|
|
• |
participation in, and sponsorship of, user conferences, executive events, trade shows and industry events, including our annual user and partner conference, One Place; |
|
|
• |
integrated marketing campaigns, including direct email, online web advertising, blogs, webinars and industry reports, including State of Employee Benefits; and |
|
|
• |
public relations, analyst relations and social media initiatives. |
We also sell our software solutions through strategic partners including Mercer LLC (“Mercer”) and SAP SE.
Technology Infrastructure and Operations
As an enterprise cloud software vendor, we have always deployed our solutions using a SaaS model. Our customers access our software via the web or mobile devices, rather than by installing software on their premises. Through our multi-tenant platform, our customers access a single instance of our software with multiple possible configurations enabled by our metadata-driven framework. The multi-tenant approach provides significant operating leverage and improved efficiency as it helps us to reduce our fixed cost base and minimize unused capacity on our hardware. In addition, our software architecture gives us an advantage over vendors of legacy systems, who may be using a less flexible architecture that would require significant time and expense to update.
We host our applications and serve all of our customers from two redundant data centers in separate locations. We rely on third-party vendors to operate these data centers, which are designed to
11
host mission-critical computer systems and have industry-standard measures in place to minimize service interruptions. Our technical operations staff manages the technology stacks supporting the Benefitfocus Platform and uses automated monitoring tools throughout our system to detect unusual events or malfunctions that could interfere with our customers’ or partners’ use of the Benefitfocus Platform. We monitor application health by verifying that all applications, interfaces and supporting middleware are operational. If our monitoring tools detect a problem, our dedicated network operations center staff detect the issue and respond immediately to diagnose and resolve the problem. We take the security of our data and our systems very seriously, and we focus on minimizing the risk of vulnerabilities in our system at every level of software design and system and network administration.
Compliance and Certifications
We obtain third-party examinations of our controls relating to security and data privacy. Certain examinations are conducted under Statement on Standards for Attestation Engagements, or SSAE, No. 16 (Reporting on Controls at a Service Organization). In particular, we obtain Service Organization Controls, or SOC, reports known as SOC 1 Type II and SOC 2 Type II audits that test the design and operating effectiveness of controls over a period of time. An independent auditor conducts these examinations annually and addresses, among other areas, our physical and environmental safeguards for production data centers, data availability and procedures covering integrity, change management, and logical security.
On an annual basis, we complete an internal audit of compliance against the Payment Card Industry Data Security Standards, or PCI-DSS, applicable to Level 1 service providers. These standards focus on application and network security controls for companies that transmit and store credit card data on behalf of clients. Benefitfocus meets PCI compliance requirements as a Level 1 service provider and submits its Report on Compliance and Attestation of Compliance documenting this assessment to the four major credit card brands annually.
In addition to PCI-DDS, Benefitfocus meets all applicable security requirements required by the National Automated Clearinghouse Association, or NACHA, for third-party service providers, as well as all requirements for Covered Entities as required by HIPAA. We validate both NACHA and HIPAA compliance annually through internal audits.
Competition
While we do not believe any single competitor offers similarly expansive software solutions, we face competition from various sources, many of which have greater resources than us. Competition in our employer segment includes:
|
|
• |
ERP software companies, including Oracle (PeopleSoft), Infor (Lawson) and Workday each offering a cloud-based benefits administration software solution; |
|
|
• |
HR outsourcing companies, such as Towers Watson; |
|
|
• |
payroll service providers, such as ADP who expanded their core payroll services to include some form of cloud-based benefits administration services; and |
|
|
• |
various niche software vendors. |
Competitors in our carrier segment include:
|
|
• |
insurance carriers that have invested in internally developed benefit management solutions; |
|
|
• |
member services companies, including those providing web-based subscriber enrollment and claims adjudication services, such as Trizetto (acquired by Cognizant) and DST Health Solutions; and |
|
|
• |
various niche software vendors. |
12
We believe that competition for benefits software and services is based primarily on the following factors:
|
|
• |
capability for customization through configuration, integration, security, scalability, and reliability of applications; |
|
|
• |
competitive and understandable pricing; |
|
|
• |
breadth and depth of application functionality; |
|
|
• |
size of customer base and level of user adoption; |
|
|
• |
extensive data exchange network; |
|
|
• |
cloud-based delivery model; |
|
|
• |
dynamic communication capabilities with contextual media, animation, and acknowledgement tools; |
|
|
• |
ability to integrate with legacy enterprise infrastructures and third-party applications; |
|
|
• |
domain expertise in benefits and healthcare consumerism; |
|
|
• |
extensive base of rules and event-driven benefit eligibility and enrollment; |
|
|
• |
accessible on any browser or mobile device; |
|
|
• |
modern and adaptive technology platform; |
|
|
• |
access to third-party apps; |
|
|
• |
clearly defined implementation timeline; |
|
|
• |
customer-branding and styling; and |
|
|
• |
ability to innovate and respond to customer and legislative needs rapidly. |
We believe that we compete effectively based upon all of these criteria, and that we are likely to continue to retain a high percentage of our customers from year to year. Nonetheless, we believe that the increasing acceptance of automated solutions in the healthcare marketplace and the adoption of more sophisticated technology and continuing legislative reform will result in increased competition, including potentially from large software companies with greater resources than ours. Other companies might develop superior or more economical service offerings that our customers could find more attractive than our offerings. Moreover, the regulatory landscape might shift in a direction that is more strategically advantageous to competitors.
Research and Development
Our ability to compete depends, in large part, on our continuous commitment to rapidly introduce new applications, technologies, features, and functionality. We deliver multiple software releases per year, updating the Benefitfocus Platform to leverage advances in cloud computing, mobile applications, and data management. Our research and development team is responsible for the design and development of our applications. We follow state-of-the-art practices in software development using modern programming languages, data storage systems, and other tools. We use both commercial and open source products, following a “best tool for the job” philosophy in product selection. Our software has a multi-tiered architecture that ensures flexibility to add or modify features quickly in response to changing market dynamics, customer needs, or regulatory requirements.
Our research and development expenses were $49.5 million, $56.6 million and $52.3 million for the years December 31, 2017, 2016 and 2015, respectively.
Intellectual Property
We rely on a combination of patent, trade secret, copyright, and trademark laws, license agreements, confidentiality procedures, confidentiality and nondisclosure agreements, and technical measures to protect the intellectual property used in our business. We generally enter into confidentiality
13
and nondisclosure agreements with our associates, consultants, vendors, and customers. We also seek to control access to and distribution of our software, documentation, and other proprietary information.
We use numerous trademarks for our products and services, and “Benefitfocus”, “HR InTouch”, “HR InTouch Marketplace”, “All Your Benefits. One Place.”, “All Your Benefits. In Your Pocket.”, and “Shop. Enroll. Manage. Exchange.” are registered marks of Benefitfocus in the United States. Through claimed common law trademark protection, we also protect other Benefitfocus marks which identify our services, such as Benefitfocus eEnrollment, Benefitfocus eBilling, Benefitfocus eExchange, and Benefitfocus eSales, and we have reserved numerous domain names, including “benefitfocus.com”. We also have registered trademarks and pending trademark applications in foreign jurisdictions such as Australia, Canada, India, Israel, Ireland, New Zealand, South Africa, and the United Kingdom.
We have been granted eight U.S. patents (utility patents) and have two U.S. patent applications (all for utility patents) pending. Our patents provide protections up to 2034. We also have three Chinese, two Japanese, Australian, Taiwanese, and Hong Kong, and one Canadian patents and a number of pending patent applications.
We also rely on certain intellectual property rights that we license from third parties. Although we believe that alternative technologies are generally available to replace such licenses, these third-party technologies may not continue to be available to us on commercially reasonable terms.
Although we rely on intellectual property rights, including trade secrets, patents, copyrights, and trademarks, as well as contractual protections to establish and protect our proprietary rights, we believe that factors such as the technological and creative skills of our personnel, creation of new modules, features and functionality, and frequent enhancements to our applications are more essential to establishing and maintaining our technology leadership position.
The steps we have taken to protect our copyrights, trademarks, and other intellectual property may not be adequate, and the potential exists that third parties could infringe, misappropriate, or misuse our intellectual property. If this were to occur, it could harm our reputation and adversely affect our competitive position or operations. In addition, laws of other jurisdictions may not protect our intellectual property and proprietary rights from unauthorized use or disclosure in the same manner as the United States. The risk of unauthorized use of our proprietary and intellectual property rights may increase as our company expands outside of the United States.
Government Regulation
Introduction
The employee benefits industry is required to comply with extensive and complex U.S. laws and regulations at the federal and state levels. Although many regulatory and governmental requirements do not directly apply to our business, our customers are required to comply with a variety of U.S. laws, and we may be impacted by these laws as a result of our contractual obligations. For many of these laws, there is little history of regulatory or judicial interpretation upon which to rely.
Requirements of PPACA
Our business could be affected by changes in healthcare spending. PPACA changed how healthcare services are covered, delivered and reimbursed through expanded coverage of uninsured individuals, reduced Medicare program spending and insurance market reforms. PPACA, as enacted, required states to expand Medicaid coverage significantly and establish health insurance exchanges to facilitate the purchase of health insurance by individuals and small employers and provided subsidies to states to create non-Medicaid plans for certain low-income residents. Insurers have experienced mixed results providing services through the exchanges and many have exited this market. Increased volatility following the repeal of the individual mandate in late 2017 could create more uncertainty.
Although numerous lawsuits challenged the constitutionality of PPACA, the U.S. Supreme Court upheld the constitutionality of PPACA except for provisions that would have allowed the U.S. Department of Health and Human Services, or HHS, to penalize states that did not implement the Medicaid expansion
14
with the loss of existing federal Medicaid funding. Consequently, a number of states opted out of the Medicaid expansion. Since that time, several states that initially opted out of the Medicaid expansion changed their minds and expanded Medicaid after all. While many of the provisions of PPACA will not be directly applicable to us, PPACA, as currently implemented, might affect the business of many of our customers. Carriers and large employers might experience changes in the numbers of individuals they insure as a result of Medicaid expansion and the creation of state and national exchanges, though it is unclear how many states will decline to implement the Medicaid expansion or adopt state-specific exchanges.
The long-term viability of PPACA remains in doubt. We expect that the current Congress and White House will continue to seek ways to modify, repeal, or otherwise invalidate all, or certain provisions of PPACA. For instance, on January 20, 2017, an executive order was issued which stated that it is the U.S. federal government’s policy to seek the prompt repeal of PPACA, and directed the heads of all executive departments and agencies to minimize the economic and regulatory burdens of PPACA to the maximum extent permitted by law. Also, the December 2017 revisions to the tax code eliminated PPACA’s individual mandate, which could destabilize the insurance markets. Should Congress or the courts modify, repeal or otherwise invalidate PPACA or any parts of its provisions, the business of our customers could be substantially affected.
Requirements Regarding the Confidentiality, Privacy and Security of Personal Information
HIPAA and Other Privacy and Security Requirements. There are numerous U.S. federal and state laws and regulations related to the privacy and security of personal health information. In particular, regulations promulgated pursuant to the Health Insurance Portability and Accountability Act of 1996, or HIPAA, establish privacy and security standards that limit the use and disclosure of protected health information and require the implementation of administrative, physical and technical safeguards to ensure the confidentiality, integrity, availability, and privacy of protected health information. Health plans, healthcare clearinghouses and most providers are considered by the HIPAA regulations to be "Covered Entities." With respect to our operations as a healthcare clearinghouse, we are directly subject to the Privacy Rule and the Security Rule. In addition, our carrier customers, or payors, are considered to be Covered Entities and are required to enter into written agreements with us, known as Business Associate Agreements, under which we are considered to be a Business Associate and that require us to safeguard protected health information and restrict how we may use and disclose such information. The Privacy Rule extensively regulates the use and disclosure of protected health information by Covered Entities and their Business Associates. For example, the Privacy Rule permits Covered Entities and their Business Associates to use and disclose protected health information for treatment and to process claims for payment, but other uses and disclosures, such as marketing communications, require written authorization from the individual or must meet an exception specified under the Privacy Rule. The Privacy Rule also provides patients with rights related to understanding and controlling how their health information is used and disclosed. To the extent permitted by the Privacy Rule and our contracts with our customers, we may use and disclose protected health information to perform our services and for other limited purposes, such as creating de-identified information. Determining whether data has been sufficiently de-identified to comply with the Privacy Rule and our contractual obligations may require complex factual and statistical analyses and may be subject to interpretation. The Security Rule requires Covered Entities and their Business Associates to implement and maintain administrative, physical and technical safeguards to protect the security of protected health information that is electronically transmitted or electronically stored.
If we are unable to properly protect the privacy and security of health information entrusted to us, we could be found to have breached our contracts with our customers. Further, if we fail to comply with the Privacy Rule, Security Rule, or Breach Notification Rule while acting as a Covered Entity or Business Associate, we could face civil penalties of up to $55,910 per violation and a maximum civil penalty of $1,677,299 in a calendar year for violations of the same requirement, in addition to criminal penalties. Recently, the U.S. Department of Health and Human Services Office for Civil Rights, which enforces HIPAA, appears to have increased its enforcement activities. Additionally, state attorneys general may bring civil actions seeking either injunctions or damages in response to violations of HIPAA that threaten the privacy of state residents.
15
There are additional privacy and data security legal regimes at the federal and state level. For example, the Federal Trade Commission, or FTC, regularly brings privacy and data enforcement actions under Section 5 of the Federal Trade Commission Act, alleging that certain activities constitute unfair or deceptive trade practices. The states have similar laws that prohibit unfair or deceptive trade practices. There are also state data security laws and state laws that regulate the use and disclosure of health information, among others. Further, by regulation, the FTC’s Red Flags Rule requires some financial institutions and creditors, which may include some of our customers, to implement identity theft prevention programs to detect, prevent and mitigate identity theft in connection with customer accounts. We may be required to apply additional resources to our existing processes to assist our affected customers in complying with this rule.
We have implemented and maintain physical, technical and administrative safeguards, including written policies and procedures, intended to protect all personal data, including protected health information, and have processes in place to assist us in complying with all applicable laws and regulations regarding the protection of this data and properly responding to any data breaches or incidents.
Data Breach Notification Laws. There are numerous federal and state laws that generally require notice to affected individuals, regulators, and sometimes the media or credit reporting agencies in the event of a data breach impacting personal information. For example, at the federal level, the HIPAA Breach Notification Rule mandates notification of breaches affecting protected health information to affected individuals and regulators under conditions set forth in the Rule. Covered Entities must report breaches of unsecured protected health information to affected individuals without unreasonable delay, but not to exceed 60 days of discovery of the breach by a Covered Entity or its agents. Notification must also be made to HHS and, in certain circumstances involving large breaches, to the media. Business Associates must report breaches of unsecured protected health information to Covered Entities within 60 days of discovery of the breach by the Business Associate or its agents. Nearly all states, the District of Columbia, Guam, Puerto Rico, and the Virgin Islands have enacted data breach notification laws. While some of these breach notification laws contain an exception for entities subject to HIPAA, other laws do not, and may impose notification obligations in addition to, or inconsistent with, the HIPAA Breach Notification Rule when a data breach implicates protected health information.
HIPAA Administrative Simplification
HIPAA also mandated a package of interlocking administrative simplification rules to establish standards and requirements for the electronic transmission of certain healthcare claims and payment transactions. These regulations are intended to encourage electronic commerce in the healthcare industry and apply directly to Covered Entities. Some of our businesses, including our healthcare clearinghouse operations, are considered Covered Entities under HIPAA and its implementing regulations.
Transaction Standards. The standard transaction regulations established under HIPAA, or Transaction Standards, mandate certain format and data content standards for the most common electronic healthcare transactions, using technical standards promulgated by recognized standards publishing organizations. These transactions include healthcare claims, enrollment, payment and eligibility. The Transaction Standards are applicable to that portion of our business involving the processing of healthcare transactions among payors, providers, patients and other healthcare industry constituents. Failure to comply with the Transaction Standards may subject us to civil and potentially criminal penalties and breach of contract claims. The Centers for Medicare and Medicaid Services, or CMS, is responsible for enforcing the Transaction Standards.
Payors who are unable to exchange data in the required standard formats can achieve Transaction Standards compliance by contracting with a clearinghouse to translate between standard and non-standard formats. As a result, use of a clearinghouse has allowed numerous payors to establish compliance with the Transaction Standards independently and at different times, reducing transition costs and risks. In addition, the standardization of formats and data standards envisioned by the Transaction Standards has only partially occurred. However, PPACA requires HHS to establish operating rules to promote uniformity in the implementation of each standardized electronic transaction. We cannot provide assurance regarding how the CMS will enforce the Transaction Standards. We have modified our
16
systems and processes to implement the Transaction Standards and we continue to work with payors, healthcare information system vendors and other healthcare constituents to maintain our implementation of the Transaction Standards.
Health Plan and Other Entity Identifiers. HHS has promulgated regulations implementing the establishment of a unique health plan identifier, or HPID. Similar to a provider’s national provider identifier, the HPID provides an identification system for health plans to use for electronic transactions. HHS has also promulgated regulations implementing another entity identifier, or OEID, that serves as an identifier for entities that are not health plans, health care providers or individuals. These other entities, which include third-party administrators, transaction vendors, and clearinghouses, are not required to obtain an OEID, but they could obtain and use one if they needed to be identified in standardized transactions. The implementation of the enforcement of the HPID and OEID process has been indefinitely delayed by HHS, and if implemented its impact on our business is unclear at this time.
Financial Services Related Laws and Rules
Financial services and electronic payment processing services are subject to numerous laws, regulations and industry standards, some of which might impact our operations and subject us, our vendors and our customers to liability as a result of the payment distribution and processing solutions we offer. Although we do not act as a bank, we offer solutions that involve banks, or vendors who contract with banks and other regulated providers of financial services. As a result, we might be impacted by banking and financial services industry laws, regulations and industry standards, such as licensing requirements, solvency standards, requirements to maintain the privacy and security of nonpublic personal financial information and Federal Deposit Insurance Corporation deposit insurance limits. In addition, our patient billing and payment distribution and processing solutions might be impacted by payment card association operating rules, certification requirements and rules governing electronic funds transfers. If we fail to comply with applicable payment processing rules or requirements, we might be subject to fines and changes in transaction fees and may lose our ability to process credit and debit card transactions or facilitate other types of billing and payment solutions. Moreover, payment transactions processed using the Automated Clearing House Network, or ACH, are subject to network operating rules promulgated by the National Automated Clearing House Association and to various federal laws regarding such operations, including laws pertaining to electronic funds transfers, and these rules and laws might impact our billing and payment solutions. Further, our solutions might impact the ability of our payor customers to comply with state prompt payment laws. These laws require payors to pay healthcare claims meeting the statutory or regulatory definition of a “clean claim” within a specified time frame.
Banking Regulation
The Goldman Sachs Group, affiliates of which owned approximately 19.9% of the voting and economic interest in our business as of December 31, 2017, is regulated as a bank holding company and a financial holding company under the Bank Holding Company Act of 1956, as amended, or the BHC Act. Due to the size of its voting and economic interest, we are deemed to be controlled by The Goldman Sachs Group and are therefore considered to be a non-bank “subsidiary” of The Goldman Sachs Group under the BHC Act. As a result, although we do not engage in banking operations, we are subject to regulation, supervision, examination and potential enforcement action by the Board of Governors of the Federal Reserve System, or the Federal Reserve, and to most banking laws, regulations and orders that apply to The Goldman Sachs Group. In addition, certain restrictions applicable to Goldman Sachs under the BHC Act apply to the Company as well, and we may be subject to regulatory oversight and examination because we are a technology service provider to regulated financial institutions. The bank regulatory framework is intended primarily to protect the safety and soundness of depository institutions, the federal deposit insurance system, and depositors rather than our stockholders. Because of The Goldman Sachs Group’s status as a bank holding company and a financial holding company, we have agreed to certain covenants for the benefit of The Goldman Sachs Group that are intended to facilitate its compliance with the BHC Act.
In addition, the Dodd-Frank Wall Street Reform and Consumer Protection Act, or Dodd-Frank Act, was signed into law by President Obama on July 21, 2010, including Title VI known as the “Volcker Rule”. US financial regulators approved final rules to implement the Volcker Rule in December 2013. The Volcker Rule, in relevant part, restricts banking entities from proprietary trading (subject to certain
17
exemptions) and from acquiring or retaining any equity, partnership or other interests in, or sponsoring, a private equity fund, subject to satisfying certain conditions, and from engaging in certain transactions with funds. On February 3, 2017, President Trump signed an executive order entitled “Presidential Executive Order on Core Principles for Regulating the United States Financial System”. The executive order required the Secretary of the Treasury to consult with the heads of the member agencies of the Financial Stability Oversight Council (including the Federal Reserve) and report to the president within 120 days of the date of the executive order on the extent to which existing laws, regulations, and other policies promote the core principles outlined in the order. The report was also required to identify any laws, regulations, and other policies that inhibit financial regulation in a manner consistent with the core principles. On June 12, 2017, the U.S. Department of the Treasury published a report identifying regulations inconsistent with the principles articulated in the order. This was the first of a series of reports and addressed only the depository system. Future reports are expected to address the regulation of capital markets, the asset management and insurance industries, and nonbank financial services companies. The extent to which this executive order and the required reports thereunder may ultimately result in changes to financial services laws, regulations, and policies applicable to us is not currently known.
Under the current legislation, we will continue to be deemed to be controlled by The Goldman Sachs Group for purposes of the BHC Act and, therefore, we will continue to be subject to regulation by the Federal Reserve and to the BHC Act, as well as certain other banking laws, regulations and orders that apply to The Goldman Sachs Group. We will remain subject to this regulatory regime until The Goldman Sachs Group is no longer deemed to control us for bank regulatory purposes, which we do not generally have the ability to control and which will not occur until The Goldman Sachs Group has significantly reduced its voting and economic interest in us. We cannot predict the ownership level at which the Federal Reserve would consider us no longer controlled by The Goldman Sachs Group, but it could be less than 10%.
The Goldman Sachs Group and its subsidiaries, including Benefitfocus, generally may conduct only activities that are authorized for a bank holding company or a “financial holding company” under the BHC Act. The scope of services we may provide to our customers is limited under the BHC Act to those which are (i) financial in nature or incidental to financial activities (including data processing services such as those that we provide with our software solutions) or (ii) complementary to a financial activity and which do not pose a substantial risk to the safety and soundness of depository institutions or the financial system generally. We believe that our current and anticipated business activities are permitted under the BHC Act.
Any failure of The Goldman Sachs Group to maintain its status as a financial holding company could result in substantial limitations on our activities and our growth. In particular, our permissible activities could be further restricted to only those that constitute banking or activities closely related to banking. The Goldman Sachs Group’s loss of its financial holding company status could be caused by several factors, including any failure by The Goldman Sachs Group’s bank subsidiaries to remain sufficiently capitalized, by any examination downgrade of one of The Goldman Sachs Group’s bank subsidiaries, or by any failure of one of The Goldman Sachs Group’s bank subsidiaries to maintain a satisfactory rating under the Community Reinvestment Act. In addition, The Goldman Sachs Group is required to remain “well capitalized” and “well managed” to maintain its status as a financial holding company. We have no ability to prevent such occurrences from happening.
The Federal Reserve has broad enforcement authority over us, including the power to prohibit us from conducting any activity that, in the Federal Reserve’s opinion, is unauthorized or constitutes an unsafe or unsound practice in conducting our business. The Federal Reserve may approve, deny or refuse to act upon applications or notices for The Goldman Sachs Group and its subsidiaries to conduct new activities, acquire or divest businesses or assets, or reconfigure existing operations. The Federal Reserve may also impose substantial fines and other penalties for violations of applicable banking laws, regulations and orders. We do not believe that any of our current or anticipated business activities will require Federal Reserve approval.
There are limits on the ability of The Goldman Sachs Group’s bank subsidiaries to extend credit to or conduct other transactions with us. In general, any loans to us from a bank subsidiary of The Goldman Sachs Group must be on market terms and secured by designated amounts of specified collateral and
18
are limited to 10% of the lending bank’s capital stock and surplus. The Dodd-Frank Act places certain additional restrictions on transactions between us and The Goldman Sachs Group, which we do not expect to be material to us.
Geographic Areas
We operate solely in the United States. As such, we held substantially all our assets and generated all our revenue in the United States during the fiscal years ended December 31, 2017, 2016 and 2015.
Corporate Information
We were incorporated in June 2000 as Benefitfocus.com, Inc., a South Carolina corporation. In September 2013, we reincorporated in Delaware as Benefitfocus, Inc. Our principal executive offices are located at 100 Benefitfocus Way, Charleston, South Carolina 29492, and our phone number is (843) 849-7476. Our website address is www.benefitfocus.com. The information on, or that can be accessed through, our website is not part of this report. We currently employ approximately 1,450 associates.
Available Information
Our annual reports on Form 10-K, quarterly reports on Form 10-Q, current reports on Form 8-K, and amendments to those reports filed or furnished pursuant to Section 13(a) or 15(d) of the Exchange Act, are available free of charge on our website at www.benefitfocus.com as soon as reasonably practicable after electronically filing or furnishing such material to the Securities and Exchange Commission. Such reports may also be read and copied at the Securities and Exchange Commission’s Public Reference Room at 100 F Street NE, Washington, D.C. 20549. Information regarding the operation of the Public Reference Room may be obtained by calling the Securities and Exchange Commission at (800) SEC-0330. The Securities and Exchange Commission also maintains a website (www.sec.gov) that includes our reports, proxy statements and other information.
Executive Officers
The following table sets forth information concerning our executive officers as of March 15, 2018:
|
Name |
|
Age |
|
Position |
|
Raymond A. August |
|
56 |
|
President and Chief Executive Officer |
|
Mason R. Holland, Jr. |
|
53 |
|
Executive Chairman, Director |
|
Jonathon E. Dussault |
|
44 |
|
Chief Financial Officer, Treasurer |
|
James P. Restivo |
|
58 |
|
Chief Technology Officer |
Raymond A. August—President and Chief Executive Officer
Raymond August has been our President and Chief Executive Officer since January 2018. Prior to that, Mr. August served as our Chief Operating Officer since August 2014 and was promoted to the title of President and Chief Operating Officer in March 2015. Prior to joining Benefitfocus, Mr. August served as the General Manager of the Computer Sciences Corp. (now DXC Technology Co. (NYSE: DXC)), or CSC, Financial Services Group since October 2012. Prior to that, from March 2008 to September 2012, he served as CSC’s President of the Financial Services Group. Since July 2013 he has served as a member of the Executive Advisory council for Arthur Ventures Private Equity Fund. Mr. August earned a B.S. in Accounting and Management Science from the University of South Carolina and is a Certified Public Accountant.
19
Mason R. Holland, Jr.—Executive Chairman of the Board
Mason Holland, one of our founders, has been our Executive Chairman and a member of our board of directors since our founding in June 2000. Mr. Holland is responsible for the coordination of strategic partnerships with industry leaders and client relations. Mr. Holland founded American Pensions, Inc. in 1988, serving as its Chairman and President from 1988 to 2003. Mr. Holland’s other ventures have included establishing Holland Properties, LLC, a real estate development firm, in 1989, and acquiring Eclipse Aerospace, Inc., a jet aircraft manufacturer, in May 2009, for which he served as Chairman and Chief Executive Officer until its merger with Kestrel Aircraft in April 2015 to form ONE Aviation. Mr. Holland has served as Chairman of ONE Aviation since its formation. Mr. Holland attended Old Dominion University in Norfolk, Virginia.
Jonathon E. Dussault—Chief Financial Officer
Jonathon Dussault has been our Chief Financial Officer since August 2017. He also serves as our Treasurer. Prior to that, since July 2014, Mr. Dussault served as Senior Vice President and Senior Finance Officer of WEX Health, Inc. (formerly Evolution1, Inc.), a leading provider of health savings account cloud-based technology and payment solutions for the healthcare industry and a subsidiary of global payments processing company, WEX Inc. (NYSE: WEX). Prior to that, beginning in April 2003, Mr. Dussault served in multiple roles at Evolution1, most recently as Chief Financial Officer, from December 2011 until its acquisition by WEX. From April 2003 to July 2010, Mr. Dussault also was Vice President of Corporate Development at Women’s Health USA, Inc. and, prior to that, was responsible for financial planning and analysis at Open Solutions, Inc. Mr. Dussault began his career at Arthur Andersen LLP. He holds a B.S. in accounting from Babson College and earned his CPA certification in Massachusetts.
James P. Restivo—Chief Technology Officer
James Restivo has been our Chief Technology Officer since January 2016. Prior to joining Benefitfocus, Mr. Restivo served as Vice President, Chief Technology Officer of Dodge Data & Analytics LLC beginning in February 2015. From December 2012 to September 2014, Mr. Restivo served as Vice President, Chief Technology Officer of Smarter Workforce at International Business Machines Corporation, or IBM (NYSE: IBM). Prior to that, beginning in October 2006, Mr. Restivo served as Chief Technology Officer of Kenexa Corporation where he managed global public Human Capital Management R&D, SaaS operations and information security before the company was purchased by IBM. Mr. Restivo received a B.S. in computer science, applied mathematics and statistics from Stony Brook University and an M.S. from the Massachusetts Institute of Technology in computer science.
As of December 31, 2017, we had approximately 1,450 full-time associates. None of our associates is represented by a labor union, and we consider our current relations with our associates to be good.
20
Investing in our common stock involves a high degree of risk. You should consider carefully the risks and uncertainties described below, together with all of the other information in this Annual Report on Form 10-K, including the consolidated financial statements and the related notes, before deciding to invest in shares of our common stock. If any of the following risks were to materialize, our business, financial condition, results of operations, and future growth prospects could be materially and adversely affected. In that event, the market price of our common stock could decline and you could lose part or all of your investment in our common stock.
Risks Related to Our Business
We have had a history of losses, and we might not be able to achieve or sustain profitability.
We experienced net losses of $25.9 million, $40.1 million, and $62.1 million, for the years ended December 31, 2017, 2016, and 2015, respectively. We cannot predict if we will achieve sustained profitability in the near future or at all. We expect to make significant future expenditures to develop and expand our business. In addition, as a public company, we incur significant legal, accounting, and other expenses that we did not incur as a private company. These increased expenditures will make it harder for us to achieve and maintain future profitability. Our recent growth in revenue and number of customers might not be sustainable, and we might not achieve sufficient revenue to achieve or maintain profitability. We could incur significant losses in the future for a number of reasons, including the other risks described in this Annual Report on Form 10-K, and we may encounter unforeseen expenses, difficulties, complications and delays and other unknown events. Accordingly, we might not be able to achieve or maintain profitability and we may incur significant losses for the foreseeable future.
Our quarterly operating results have fluctuated in the past and might continue to fluctuate, causing the value of our common stock to decline substantially.
Our quarterly operating results might fluctuate due to a variety of factors, many of which are outside of our control. As a result, comparing our operating results on a period-to-period basis might not be meaningful. You should not rely on our past results as indicative of our future performance. Moreover, our stock price might be based on expectations of future performance that are unrealistic or that we might not meet and, if our revenue or operating results fall below the expectations of investors or securities analysts, the price of our common stock could decline substantially. For example, on August 4, 2017, the first trading day after we publically announced our operating results for the second quarter ended June 30, 2017, our stock price dropped $7.10 per share, or approximately 20.5%, to $27.50.
Our operating results have varied in the past. In addition to other risk factors listed in this section, some of the important factors that may cause fluctuations in our quarterly operating results include:
|
|
• |
our ability to hire and retain qualified personnel, including the rate of expansion of our sales force; |
|
|
• |
the extent to which our products and services achieve or maintain market acceptance; |
|
|
• |
changes in the regulatory environment related to benefits and healthcare; |
|
|
• |
our ability to introduce new products and services and enhancements to our existing products and services on a timely basis; |
|
|
• |
new competitors and the introduction of enhanced products and services from competitors; |
|
|
• |
the financial condition of our current and potential customers; |
|
|
• |
changes in customer budgets and procurement policies; |
|
|
• |
the amount and timing of our investment in research and development activities; |
|
|
• |
technical difficulties with our products or interruptions in our services; |
|
|
• |
regulatory compliance costs; |
21
|
|
• |
unforeseen legal expenses, including litigation and settlement costs. |
In addition, a significant portion of our operating expense is relatively fixed in nature, and planned expenditures are based in part on expectations regarding future revenue. Accordingly, unexpected revenue shortfalls might decrease our gross margins and could cause significant changes in our operating results from quarter to quarter. If this occurs, the trading price of our common stock could fall substantially, either suddenly or over time.
Because we previously recognized revenue and expense relating to monthly subscriptions and professional services over varying periods, downturns or upturns in sales were not immediately reflected in full in our operating results.
As a SaaS company, under ASC 605, we recognized our subscription revenue monthly for the term of our contracts and recognized the majority of our professional services revenue ratably over the longer of the contract term or the estimated expected life of the customer relationship. As a result, a portion of the revenue we reported each quarter was the recognition of deferred revenue from contracts we entered into during previous quarters. Consequently, a shortfall in demand for our software solutions and professional services or a decline in new or renewed contracts in any one quarter might not have significantly reduced our revenue for that quarter, but could have negatively affected our revenue in future quarters. Accordingly, the effect of significant downturns in new or renewed sales of our products and services was not reflected in full in our results of operations until future periods. Our revenue recognition model also made it difficult for us to rapidly increase our revenue through additional sales in any period, because revenue from new customers had to be recognized over the applicable term of the contracts or the estimated expected life of the customer relationship period. In addition, we recognized professional services expenses as incurred, which could have caused professional services gross margin to be negative.
As a result of our variable sales and implementation cycles, we previously might not have been able to recognize revenue to offset expenditures, which could have resulted in fluctuations in our quarterly results of operations or otherwise harm our future operating results.
The sales cycle for our products and services can be variable, averaging four months in our employer market segment and 15 months in our carrier market segment, each from initial contact to contract execution. During the sales cycle, we expend time and resources, and we do not recognize any revenue to offset such expenditures.
After a customer contract is signed, we provide an implementation process for the customer during which we establish and test appropriate integrations, connections and registrations, load data into our system, and train customer personnel. Our implementation cycle is also variable, typically ranging from four to six months for employer implementations and from eight to 10 months for complex carrier implementations, each from contract execution to completion of implementation. Some of our new customer projects are complex and require a lengthy set-up period and significant implementation work. During the implementation cycle, we expend substantial time, effort, and financial resources implementing our products and services, but under ASC 605 we could not recognize the resulting revenue until implementation was complete and the services were available for use, at which time we began recognition of implementation revenue over the longer of the life of the contract or the expected life of the customer relationship. Each customer’s situation is different, and unanticipated difficulties and delays might arise as a result of failure by us or by the customer to complete our respective responsibilities. If implementation periods were extended, under ASC 605 revenue recognition could have been delayed and our financial condition might have been adversely affected. In addition, cancellation of any implementation after it began might have resulted in lost time, effort, and expenses invested in the cancelled implementation process and lost opportunity for implementing paying clients in that same period of time.
22
Changes in, or interpretations of, existing accounting principles, including regarding revenue recognition and accounting for leases, and their implementation could have an adverse impact on our reported financial results.
We prepare our financial statements in accordance with U.S. GAAP. These rules are subject to interpretation by the SEC and various bodies formed to interpret and create appropriate accounting principles. Changes in these rules or their interpretation could have a negative impact on our reported financial results and may retroactively affect previously reported transactions. For example, in May 2014, the Financial Accounting Standards Board, or FASB, issued an accounting standards update on revenue recognition, which supersedes nearly all existing revenue recognition guidance under U.S. GAAP. The new standard was effective for us beginning January 1, 2018. While we are continuing to assess all potential impacts of the standard, we have identified areas that might be more significantly affected. The expected effects of the new accounting standard are included in Note 2 to our consolidated financial statements appearing elsewhere in this Annual Report on Form 10-K. In addition, in February 2016, FASB issued an accounting standards update on leases, requiring lessees, among other things, to recognize lease assets and lease liabilities on the balance sheet for those leases classified as operating leases under previous authoritative guidance. This update, which will be effective beginning January 1, 2019 with early adoption permitted, also introduces new disclosure requirements for leasing arrangements. We are currently evaluating the impact of this update on the consolidated financial statements, which could be material, given our related party leases. Implementation of these new standards, and any future accounting pronouncements, implementation guidelines or interpretations, could have an adverse impact on our reported financial results, require that we make significant changes to our systems, processes and controls, or the way we conduct our business. In addition, we are expending considerable effort and resources preparing for and implementing of both these accounting updates, which in and of itself could have negative impact on our results of operations.
We depend on our senior management team, and the loss of one or more key associates or an inability to attract and retain highly skilled associates could adversely affect our business.
Our success depends largely upon the continued services of our key executive officers and other associates. We also rely on our leadership team in the areas of research and development, marketing, services, finance, and general and administrative functions, and on mission-critical individual contributors in sales and research and development. From time to time, there may be changes in our executive management team resulting from the hiring or departure of executives, which could disrupt our business. For example: in 2017 we hired a new Chief Financial Officer and an Executive Vice President of Global Sales; effective January 1, 2018, our Chief Executive Officer became Senior Advisor for Innovation, but remained on our Board of Directors and our Chief Operating Officer became our Chief Executive Officer; and, in March 2018, our Senior Advisor for Innovation resigned from employment and our Board, effective April 1, 2018, for personal reasons. The loss of one or more of our executive officers or key associates could have a serious adverse effect on our business.
To continue to execute our growth strategy, we also must attract and retain highly skilled personnel. Competition is intense for sales people and for engineers with high levels of experience in designing and developing software and Internet-related services. We might not be successful in maintaining our unique culture and continuing to attract and retain qualified personnel. We have from time to time in the past experienced, and we expect to continue to experience in the future, difficulty in hiring and retaining highly skilled personnel with appropriate qualifications. The pool of qualified personnel with SaaS experience and/or experience working with the benefits market is limited overall and specifically in Charleston, South Carolina, where our principal office is located. In addition, many of the companies with which we compete for experienced personnel have greater resources than we have and are located in geographic areas, like Silicon Valley, that may attract more qualified technology workers.
In addition, in making employment decisions, particularly in the Internet and high-technology industries, job candidates often consider the value of the equity awards they are to receive in connection with their employment. Volatility in the price of our stock might, therefore, adversely affect our ability to attract or retain highly skilled personnel. Furthermore, the requirement to expense certain stock awards might discourage us from granting the size or type of stock awards that job candidates require to join our company. If we fail to attract new personnel or fail to retain and motivate our current personnel, our business and future growth prospects could be severely harmed.
23
We operate in a highly competitive industry, and if we are not able to compete effectively, our business and operating results will be harmed.
The benefits management software market is highly competitive and is likely to attract increased competition, which could make it hard for us to succeed. Small, specialized providers continue to become more sophisticated and effective. In addition, large, well-financed, and technologically sophisticated software companies might focus more on our market. The size and financial strength of these entities is increasing as a result of continued consolidation in both the IT and healthcare industries. We expect large integrated software companies to become more active in our market, both through acquisitions and internal investment. In addition, insurance carriers may seek to bring certain of their benefits software solutions in-house, whether through acquisitions or internal investment. For example, Aetna, a customer of ours, owns bswift, a provider of insurance exchange technology solutions and benefits administration technology solutions and services. If Aetna were to decide to use bswift’s solution in place of any portion of the solutions we currently provide to them, then our business and operating results could be materially and adversely affected. As costs fall and technology improves, increased market saturation might change the competitive landscape in favor of our competitors.
Some of our current large competitors have greater name recognition, longer operating histories, and significantly greater resources than we do. As a result, our competitors might be able to respond more quickly and effectively than we can to new or changing opportunities, technologies, standards, or customer requirements. In addition, current and potential competitors have established, and might in the future establish, cooperative relationships with vendors of complementary products, technologies, or services to increase the availability of their products in the marketplace. Accordingly, new competitors or alliances might emerge that have greater market share, a larger customer base, more widely adopted proprietary technologies, greater marketing expertise, greater financial resources, and larger sales forces than we have, which could put us at a competitive disadvantage. Further, in light of these advantages, even if our products and services are more effective than those of our competitors, current or potential customers might accept competitive offerings in lieu of purchasing our offerings. Increased competition is likely to result in pricing pressures, which could negatively impact our sales, profitability, or market share. In addition to new niche vendors, who offer standalone products and services, we face competition from existing enterprise vendors, including those currently focused on software solutions that have information systems in place with potential customers in our target market. These existing enterprise vendors might promise products or services that offer ease of integration with existing systems and which leverage existing vendor relationships. In addition, large insurance carriers often have internal technology staffs and proprietary software for benefits management, making them less likely to buy our solutions.
The market for our products and services is immature and volatile, and if it does not develop or if it develops more slowly than we expect, the growth of our business will be harmed.
The cloud-based benefits management software market is relatively new and unproven, and it is uncertain whether it will achieve and sustain high levels of demand and market acceptance. Our success will depend to a substantial extent on the willingness of employers, carriers, and consumers to increase their use of benefits management software. Many employers and carriers have invested substantial personnel and financial resources to integrate internally developed solutions or traditional enterprise software into their businesses for benefits management, and therefore might be reluctant or unwilling to migrate to our cloud-based solutions. Furthermore, some businesses might be reluctant to use cloud-based solutions because they have concerns about the security of their data and the reliability of the technology delivery model associated with these solutions. If employers, carriers and consumers do not perceive the benefits of our solutions, then our market might not develop at all, or it might develop more slowly than we expect, either of which could significantly adversely affect our operating results. In addition, we might make errors in predicting and reacting to relevant business trends, which could harm our business. If any of these risks occur, it could materially adversely affect our business, financial condition or results of operations.
The SaaS pricing model is evolving and our failure to manage its evolution and demand could lead to lower than expected revenue and profit.
We derive most of our revenue growth from subscription offerings and, specifically, SaaS offerings. This business model depends heavily on achieving economies of scale because the initial upfront investment is costly and the associated revenue is recognized on a ratable basis. If we fail to achieve
24
appropriate economies of scale or if we fail to manage or anticipate the evolution and demand of the SaaS pricing model, then our business and operating results could be adversely affected.
If we do not continue to innovate and provide products and services that are useful to consumers, employers, insurance carriers, and brokers and provide high quality support services, we might not remain competitive, and our revenue and operating results could suffer.
Our success depends in part on providing products and services that consumers, employers, insurance carriers, and brokers will use to manage benefits. We must continue to invest significant resources in research and development in order to enhance our existing products and services and introduce new high quality products and services that customers will want. If we are unable to predict user preferences or industry changes, or if we are unable to modify our products and services on a timely basis, we might lose customers. Our operating results would also suffer if our innovations are not responsive to the needs of our customers, are not appropriately timed with market opportunity, or are not effectively brought to market. As technology continues to develop, our competitors might be able to offer results that are, or that are perceived to be, substantially similar to or better than those generated by us. This would force us to compete on additional product and service attributes and to expend significant resources in order to remain competitive.
In addition, we may experience difficulties with software development, industry standards, design, or marketing that could delay or prevent our development, introduction, or implementation of new solutions and enhancements. The introduction of new solutions by competitors, the emergence of new industry standards, or the development of entirely new technologies to replace existing offerings could render our existing or future solutions obsolete.
Our success also depends on providing high quality support services to resolve any issues related to our products and services. High quality education and customer support is important for the successful marketing and sale of our products and services and for the renewal of existing customers. If we do not help our customers quickly resolve issues and provide effective ongoing support, our ability to sell additional products and services to existing customers would suffer and our reputation with existing or potential customers would be harmed.
If we are unable to retain our existing customers, our revenue and results of operations would be adversely affected.
We sell our products and services pursuant to agreements that are generally one year for employers and three to five years for carriers. While our employer contracts generally automatically renew on an annual basis, our carrier customers have no obligation to renew their contracts after their contract period expires, and these contracts might not be renewed on the same or on more profitable terms if at all. Additionally, some of our carrier customers are able to terminate their respective contracts without cause or for convenience, although generally our carrier contracts are only cancellable by the carrier in an instance of our uncured breach. As a result, our ability to grow depends in part on the continuance and renewal of our carrier contracts. We may not be able to accurately predict future trends in customer renewals, and our customers’ renewal rates may decline or fluctuate because of several factors, including their level of satisfaction or dissatisfaction with our services, the cost of our services, the cost of services offered by our competitors, consolidations or reductions in our customers’ spending levels. If our carrier customers terminate or do not renew their contracts for our services, renew on less favorable terms, or do not purchase additional functionality or products, our revenue may grow more slowly than expected or decline, and our profitability and gross margins may be harmed.
A significant amount of our revenue is derived from our largest customers, and any reduction in revenue from any of these customers would reduce our revenue and net income.
Our ten largest customers by revenue accounted for approximately 43%, 43% and 42% of our consolidated revenue in each of 2017, 2016 and 2015, respectively. Our largest customer by revenue accounted for approximately 12% and 11% of our revenue in each of 2017 and 2016, respectively. In addition, one customer represented 12% and 14% of our accounts receivable at December 31, 2017 and 2016, respectively and another represented 13% at December 31, 2016. If any of our large customers or strategic partners decides not to renew its contracts with us, or to renew on less favorable terms, our
25
business, revenues, reputation, and our ability to obtain new customers could be materially and adversely affected.
Failure to adequately and effectively expand our direct sales force will impede our growth.
We believe that our future growth will depend on the development of our direct sales force and its ability to obtain new customers and to manage our existing customer base. Identifying and recruiting qualified personnel and training them in the use of our software requires significant time, expense, and attention. It can take six months or longer before a new sales representative is fully trained and productive. Our business may be adversely affected if our efforts to expand and train our direct sales force do not generate a corresponding increase in revenues. For example, reduction of our sales force in 2016 negatively impacted sales, and as a result, revenue going forward. In particular, if we are unable to hire and develop sufficient numbers of productive direct sales personnel or if new direct sales personnel are unable to achieve desired productivity levels in a reasonable period of time, sales of our products and services will suffer and our growth will be impeded.
Our growth depends in part on the success of our strategic relationships with third parties.
In order to grow our business, we anticipate that we will continue to depend on our relationships with third parties, including Mercer LLC, or Mercer, and its affiliates, SAP SE, and others such as technology and content providers, third party system integrators and referral sources, including brokers. Identifying partners, negotiating and documenting relationships with them, and developing referral sources requires significant time and resources. Our expanded relationship with and February 2015 sale of stock to Mercer increases our reliance on it and related risks, including Mercer’s competitors being less likely to do business with us. Our competitors might be effective in providing incentives to third parties to favor their products or services or to prevent or reduce subscriptions to our products and services. In addition, acquisitions of our partners by our competitors could result in a decrease in the number of our current and potential customers, as our partners may no longer facilitate the adoption of our applications by potential customers. If we are unsuccessful in establishing or maintaining our relationships with third parties, our ability to compete in the marketplace or to grow our revenue could be impaired and our operating results may suffer. Even if we are successful, we cannot assure you that these relationships will result in increased customer use of our applications or increased revenue.
If the number of individuals covered by our employer and carrier customers decreases or the number of products or services to which our employer and carrier customers subscribe decreases, our revenue will decrease.
Under most of our customer contracts, we base our fees on the number of individuals to whom our customers provide benefits and the number of products or services subscribed to by our customers. Many factors may lead to a decrease in the number of individuals covered by our customers and the number of products or services subscribed to by our customers, including:
|
|
• |
failure of our customers to adopt or maintain effective business practices; |
|
|
• |
changes in the nature or operations of our customers; |
|
|
• |
government regulations; and |
|
|
• |
increased competition or other changes in the benefits marketplace. |
If the number of individuals covered by our customers or the number of products or services subscribed to by our customers decreases for any reason, our revenue will likely decrease.
Failure to manage our rapid growth effectively could increase our expenses, decrease our revenue, and prevent us from implementing our business strategy.
We have been experiencing a period of rapid growth, which puts strain on our business. To manage this and our anticipated future growth effectively, we must continue to maintain and enhance our IT infrastructure, financial and accounting systems, and controls. We also must attract, train, and retain a significant number of qualified sales and marketing personnel, customer support personnel, professional services personnel, software engineers, technical personnel, and management personnel. Failure to effectively manage our rapid growth could lead us to over-invest or under-invest in development and
26
operations, result in weaknesses in our infrastructure, systems, or controls, give rise to operational mistakes, losses, loss of productivity or business opportunities, and result in loss of employees and reduced productivity of remaining employees. Our growth could require significant capital expenditures and might divert financial resources from other projects such as the development of new products and services. If our management is unable to effectively manage our growth, our expenses might increase more than expected, our revenue could decline or might grow more slowly than expected, and we might be unable to implement our business strategy. The quality of our products and services might suffer, which could negatively affect our reputation and harm our ability to retain and attract customers.
Economic uncertainties or downturns in the general economy or the industries in which our customers operate could disproportionately affect the demand for our solutions and negatively impact our results of operations.
General worldwide economic conditions have experienced significant downturns in the past, and market volatility and uncertainty remain widespread, including as a result of the U.S. presidential administration change. All of this makes it extremely difficult for our customers and us to accurately forecast and plan future business activities. In addition, these conditions could cause our customers or prospective customers to decrease headcount, benefits, or HR budgets, which could decrease corporate spending on our products and services, resulting in delayed and lengthened sales cycles, a decrease in new customer acquisition, and/or loss of customers. Furthermore, during challenging economic times, our customers may have difficulty gaining timely access to sufficient credit or obtaining credit on reasonable terms, which could impair their ability to make timely payments to us and adversely affect our revenue. If that were to occur, our financial results could be harmed. Further, challenging economic conditions might impair the ability of our customers to pay for the products and services they already have purchased from us and, as a result, our write-offs of accounts receivable could increase. We cannot predict the timing, strength, or duration of any economic slowdown or recovery. If the condition of the general economy or markets in which we operate worsens, our business could be harmed.
If we fail to maintain awareness of our brand cost-effectively, our business might suffer.
We believe that maintaining awareness of our brand in a cost-effective manner is critical to continuing the widespread acceptance of our existing solutions and is an important element in attracting new customers. Furthermore, we believe that the importance of brand recognition will increase as competition in our market increases. Successful promotion of our brand will depend largely on the effectiveness of our marketing efforts and on our ability to provide reliable and useful services at competitive prices. Our efforts to build, maintain and market changes to our brand nationally have involved significant expenses. Brand promotion activities may not yield increased revenue, and even if they do, any increased revenue may not offset the expenses we incur in maintaining our brand. If we fail to successfully maintain our brand, or incur substantial expenses in an unsuccessful attempt to maintain our brand, we may fail to attract enough new customers or retain our existing customers to the extent necessary to realize a sufficient return on our brand-building efforts, and our business could suffer.
If we are required to collect sales and use taxes in additional jurisdictions, we might be subject to liability for past sales and our future sales may decrease.
We might lose sales or incur significant expenses if states successfully impose broader guidelines on state sales and use taxes. A successful assertion by one or more states requiring us to collect sales or other taxes on the licensing of our software or sale of our services could result in substantial tax liabilities for past transactions and otherwise harm our business. For example, New York recently completed a tax audit of our Company and while we settled for amounts within our sales tax reserve, other states might audit us in the future. Each state has different rules and regulations governing sales and use taxes, and these rules and regulations are subject to varying interpretations that change over time. We review these rules and regulations periodically and, when we believe we are subject to sales and use taxes in a particular state, voluntarily engage state tax authorities in order to determine how to comply with their rules and regulations. We cannot assure you that we will not be subject to sales and use taxes or related penalties for past sales in states where we currently believe no such taxes are required.
Vendors of services, like us, are typically held responsible by taxing authorities for the collection and payment of any applicable sales and similar taxes. If one or more taxing authorities determines that taxes should have, but have not, been paid with respect to our services, we might be liable for past taxes in
27
addition to taxes going forward. Liability for past taxes might also include substantial interest and penalty charges. Our customer contracts typically provide that our customers must pay all applicable sales and similar taxes. Nevertheless, our customers might be reluctant to pay back taxes and might refuse responsibility for interest or penalties associated with those taxes. If we are required to collect and pay back taxes and the associated interest and penalties, and if our clients fail or refuse to reimburse us for all or a portion of these amounts, we will incur unplanned expenses that may be substantial. Moreover, imposition of such taxes on us going forward will effectively increase the cost of our software and services to our customers and might adversely affect our ability to retain existing customers or to gain new customers in the areas in which such taxes are imposed.
We might not be able to utilize a significant portion of our net operating loss or other tax credit carryforwards, which could adversely affect our profitability.
As of December 31, 2017, we had federal and state net operating loss carryforwards due to prior period losses, which if not utilized will begin to expire in 2022 for federal and state purposes. We also have South Carolina jobs tax credit and headquarters tax credit carryforwards, which if not utilized will begin to expire in 2020. These tax credit carryforwards could expire unused and be unavailable to offset future income tax liabilities, which could adversely affect our profitability.
In addition, under Section 382 of the Internal Revenue Code of 1986, as amended, or the Code, our ability to utilize net operating loss carryforwards or other tax attributes in any taxable year may be limited if we experience an “ownership change”. A Section 382 “ownership change” generally occurs if one or more stockholders or groups of stockholders who own at least 5% of our stock increase their ownership by more than 50 percentage points over their lowest ownership percentage within a rolling three-year period. Similar rules might apply under state tax laws. Future issuances of our stock could cause an “ownership change”. It is possible that an ownership change, or any future ownership change, could have a material effect on the use of our net operating loss carryforwards or other tax attributes, which could adversely affect our profitability.
We might be unable to adequately protect, and we might incur significant costs in enforcing, our intellectual property and other proprietary rights.
Our success depends in part on our ability to enforce our intellectual property and other proprietary rights. We rely on a combination of trademark, trade secret, copyright, patent, and unfair competition laws, as well as license and access agreements and other contractual provisions, to protect our intellectual property and other proprietary rights. In addition, we attempt to protect our intellectual property and proprietary information by requiring employees and consultants to enter into confidentiality, noncompetition, and assignment of inventions agreements. Our attempts to protect our intellectual property might be challenged by others or invalidated through administrative process or litigation. While we have eight U.S., three Chinese, two Japanese, Australian, Taiwanese, Hong Kong, and one Canadian patents granted and a number of applications pending, we might not be able to obtain meaningful patent protection for our software. In addition, if any patents are issued in the future, they might not provide us with any competitive advantages, or might be successfully challenged by third parties. Agreement terms that address non-competition are difficult to enforce in many jurisdictions and might not be enforceable in certain cases. To the extent that our intellectual property and other proprietary rights are not adequately protected, third parties might gain access to our proprietary information, develop and market products or services similar to ours, or use trademarks similar to ours, each of which could materially harm our business. Existing U.S. federal and state intellectual property laws offer only limited protection. Moreover, the laws of other countries in which we might in the future conduct operations or contract for services might afford little or no effective protection of our intellectual property. The failure to adequately protect our intellectual property and other proprietary rights could materially harm our business.
In addition, if we resort to legal proceedings to enforce our intellectual property rights or to determine the validity and scope of the intellectual property or other proprietary rights of others, the proceedings could be burdensome and expensive, even if we were to prevail. Any litigation that is necessary in the future could result in substantial costs and diversion of resources and could have a material adverse effect on our business, operating results or financial condition.
28
We might be sued by third parties for alleged infringement of their proprietary rights.
The software and Internet industries are characterized by the existence of a large number of patents, trademarks, and copyrights and by frequent litigation based on allegations of infringement or other violations of intellectual property rights. We have received in the past, and might receive in the future, communications from third parties claiming that we have infringed the intellectual property rights of others. Our technologies might not be able to withstand any third-party claims or rights against their use. Any intellectual property claims, with or without merit, could be time-consuming and expensive to resolve, divert management attention from executing our business plan, and require us to pay monetary damages or enter into royalty or licensing agreements. In addition, many of our contracts contain warranties with respect to intellectual property rights, and most require us to indemnify our clients for third-party intellectual property infringement claims, which would increase the cost to us of an adverse ruling on such a claim.
Moreover, any settlement or adverse judgment resulting from such a claim could require us to pay substantial amounts of money or obtain a license to continue to use the software or information that is the subject of the claim, or otherwise restrict or prohibit our use of it. We might not be able to obtain a license on commercially reasonable terms, if at all, from third parties asserting an infringement claim; we might not be able to develop alternative technology on a timely basis, if at all; and we might not be able to obtain a license to use a suitable alternative technology to permit us to continue offering, and our clients to continue using, our affected services. Accordingly, an adverse determination could prevent us from offering our services to others.
We might require additional capital to support business growth.
We intend to continue to make investments to support our business growth and might require additional funds to respond to business challenges or opportunities, including the need to develop new products and services or enhance our existing services, enhance our operating infrastructure, and acquire complementary businesses and technologies. Accordingly, we might need to engage in equity or debt financings to secure additional funds. If we raise additional funds through further issuances of equity or convertible debt securities, our existing stockholders could suffer significant dilution, and any new equity securities we issue could have rights, preferences and privileges superior to those of holders of our common stock. Any debt financing secured by us in the future could involve restrictive covenants relating to our capital-raising activities and other financial and operational matters, which might make it more difficult for us to obtain additional capital and to pursue business opportunities, including potential acquisitions. In addition, we might not be able to obtain additional financing on terms favorable to us, if at all. If we are unable to obtain adequate financing or financing on terms satisfactory to us when we require it, our ability to continue to support our business growth and to respond to business challenges could be significantly limited.
If we fail to meet our credit facility’s financial covenants, our business and financial condition could be adversely affected.
Our credit facility contains financial covenants, including covenants related to financial liquidity and EBITDA. If at any point we fail to comply with the financial covenants, the lenders can demand immediate repayment of our outstanding balance and deny future borrowings under the credit facility. This could have a negative impact on our liquidity, thereby reducing the availability of cash flow for other purposes and adversely affecting our business.
Any future litigation against us could be costly and time-consuming to defend.
We may become subject, from time to time, to legal proceedings and claims that arise in the ordinary course of business such as claims brought by our clients in connection with commercial disputes, employment claims made by our current or former associates, or purported securities class actions. Litigation might result in substantial costs and may divert management’s attention and resources, which might seriously harm our business, overall financial condition, and operating results. Insurance might not cover such claims, might not provide sufficient payments to cover all the costs to resolve one or more such claims, and might not continue to be available on terms acceptable to us. A claim brought against us that is uninsured or underinsured could result in unanticipated costs, thereby reducing our operating
29
results and leading analysts or potential investors to reduce their expectations of our performance, which could reduce the trading price of our stock.
If we acquire companies or technologies in the future, they could prove difficult to integrate, disrupt our business, dilute stockholder value, and adversely affect our operating results and the value of our common stock.
As part of our business strategy, we might acquire, enter into joint ventures with, or make investments in complementary companies, services, and technologies in the future. For example, in 2010, we acquired the intellectual property assets of BeliefNetworks, Inc. We spent considerable time, effort, and money pursuing this company and successfully integrating it into our business. Acquisitions and investments involve numerous risks, including:
|
|
• |
difficulties in identifying and acquiring products, technologies or businesses that will help our business; |
|
|
• |
difficulties in integrating operations, technologies, services and personnel; |
|
|
• |
diversion of financial and managerial resources from existing operations; |
|
|
• |
risk of entering new markets in which we have little to no experience; and |
|
|
• |
delays in customer purchases due to uncertainty and the inability to maintain relationships with customers of the acquired businesses. |
If we fail to properly evaluate acquisitions or investments, we might not achieve the anticipated benefits of any such acquisitions, we might incur costs in excess of what we anticipate, and management resources and attention might be diverted from other necessary or valuable activities.
Future sales to customers outside the United States or with international operations might expose us to risks inherent in international sales which, if realized, could adversely affect our business.
An element of our growth strategy is to expand internationally. Operating in international markets requires significant resources and management attention and will subject us to regulatory, economic, and political risks that are different from those in the United States. Because of our limited experience with international operations, our international expansion efforts might not be successful in creating demand for our products and services outside of the United States or in effectively selling our solutions in the international markets we enter. In addition, we will face risks in doing business internationally that could adversely affect our business, including:
|
|
• |
unstable regional political and economic conditions, such as those caused by the U.S. presidential administration change and the U.K. exit from the European Union; |
|
|
• |
the need to localize and adapt our solutions for specific countries, including translation into foreign languages and associated expenses; |
|
|
• |
data privacy laws which require that customer data be stored and processed in a designated territory; |
|
|
• |
difficulties in staffing and managing foreign operations; |
|
|
• |
different pricing environments, longer sales cycles and longer accounts receivable payment cycles and collections issues; |
|
|
• |
new and different sources of competition; |
|
|
• |
weaker protection for intellectual property and other legal rights than in the United States and practical difficulties in enforcing intellectual property and other rights outside of the United States; |
|
|
• |
laws and business practices favoring local competitors; |
|
|
• |
compliance challenges related to the complexity of multiple, conflicting and changing governmental laws and regulations, including employment, tax, privacy, and data protection laws and regulations; |
|
|
• |
increased financial accounting and reporting burdens and complexities; |
30
|
|
• |
adverse tax consequences. |
If we denominate our international contracts in local currencies, fluctuations in the value of the U.S. dollar and foreign currencies might impact our operating results when translated into U.S. dollars.
Risks Related to Our Products and Services Offerings
If our security measures are breached or fail, and unauthorized persons gain access to customers’ and consumers’ data, our products and services might be perceived as not being secure, customers and consumers might curtail or stop using our products and services, and we might incur significant liabilities.
Our products and services involve the storage and transmission of customers’ and consumers’ confidential information, which may include sensitive individually identifiable information that is subject to stringent legal and regulatory obligations. Because of the sensitivity of this information, security features of our software are very important. If our security measures are breached or fail and/or are bypassed as a result of third-party action, inadvertent disclosures through technological or human error (including employee error), malfeasance, hacking, ransomware, social engineering (including phishing schemes), computer viruses, malware, or otherwise, someone might be able to acquire or obtain unauthorized access to our customers’ confidential information and/or patient data or other personal information. As a result, our reputation could be damaged, our business might suffer, information might be lost, and we could face damages for contract breach, penalties for violation of applicable laws or regulations, costly litigation or government investigations, and significant costs for remediation and remediation efforts to prevent future occurrences.
In addition, we rely on various third parties, including employers’ HR departments, carriers, and other third-party service providers and consumers themselves, as users of our system for key activities to protect and promote the security of our systems and the data and information accessible within them, such as administration of enrollment, consumer status changes, claims, and billing. Our customers might authorize or enable third parties to access their information and data that is stored on our systems. Because we do not control such access, we cannot ensure the complete integrity or security of such data in our systems. On occasion, people have failed to adhere to appropriate data security practices. For example, employers sometimes have failed to terminate the login/password of former employees, or permitted current employees to share login/passwords. When we become aware of such security incidents, we work with employers to terminate inappropriate access and provide additional instruction in order to avoid the reoccurrence of such problems. Although to date these security incidents have not resulted in claims against us or in material harm to our business, failures to perform these activities might result in claims against us, which could expose us to significant expense, legal liability, and harm to our reputation, which might result in loss of business.
Because techniques used to obtain unauthorized access or to sabotage systems change frequently and often are not recognized until launched against a target, we might not be able to anticipate these techniques or to implement adequate preventive measures. If an actual or perceived breach of our security, or the security of third parties that we rely on, occurs, the market perception of the effectiveness of our security measures could be harmed and we could lose sales and customers. Any significant violations of data privacy or security laws could result in the loss of business, litigation and regulatory investigations and penalties or settlements that could damage our reputation and adversely impact our results of operations and financial condition. In addition, our customers might authorize or enable third parties to access their information and data that is stored on our systems. Because we do not control such access, we cannot ensure the complete integrity or security of such data in our systems.
Failure by our customers to obtain proper permissions and waivers might result in claims against us or may limit or prevent our use of data, which could harm our business.
We require our customers to provide necessary notices and to obtain necessary permissions and waivers for use and disclosure of information on the Benefitfocus Platform, and we require contractual assurances from them that they have done so and will do so. If, however, despite these requirements and contractual obligations, our customers do not obtain necessary permissions and waivers, then our use
31
and disclosure of information that we receive from them or on their behalf might be limited or prohibited by state or federal privacy laws or other laws. This could impair our functions, processes and databases that reflect, contain, or are based upon such data and might prevent use of such data. In addition, this could interfere with, or prevent creation or use of, rules, analyses, or other data-driven activities that benefit us and our business. Moreover, we might be subject to claims or liability for use or disclosure of information by reason of lack of valid notices, agreements, permissions or waivers. These claims or liabilities could subject us to unexpected costs and adversely affect our operating results.
Our proprietary software might not operate properly, which could damage our reputation, give rise to claims against us, or divert application of our resources from other purposes, any of which could harm our business and operating results.
Proprietary software development is time-consuming, expensive, and complex. Unforeseen difficulties can arise. We might encounter technical obstacles, and it is possible that we discover problems that prevent our proprietary applications from operating properly. If they do not function reliably or fail to achieve customer expectations in terms of performance, customers could assert liability claims against us and/or attempt to cancel their contracts with us. This could damage our reputation and impair our ability to attract or maintain customers.
Moreover, benefits management software as complex as ours has in the past contained, and may in the future contain, or develop, undetected defects or errors. Material performance problems or defects in our products and services might arise in the future. Errors might result from the interface of our services with legacy systems and data, which we did not develop and the function of which is outside of our control. Defects or errors might arise in our existing or new software or service processes. Because changes in employer, carrier, and legal requirements and practices relating to benefits are frequent, we are continuously discovering defects and errors in our software and service processes compared against these requirements and practices. Undiscovered vulnerabilities could expose our software to unscrupulous third parties who develop and deploy software programs that could attack our software or result in unauthorized access to customer data. Defects and errors and any failure by us to identify and address them could result in loss of revenue or market share, liability to customers or others, failure to achieve market acceptance or expansion, diversion of development and other resources, injury to our reputation, and increased service and maintenance costs. Defects or errors in our product or service processes might discourage existing or potential customers from purchasing services from us. Correction of defects or errors could prove to be impossible or impracticable. The costs incurred in correcting any defects or errors or in responding to resulting claims or liability might be substantial and could adversely affect our operating results.
In addition, customers that rely on our products and services to collect, manage, and report benefits data might have a greater sensitivity to service errors and security vulnerabilities than customers of software products in general. We market and sell services that, among other things, provide information to assist care providers in tracking and treating ill patients. Any operational delay in or failure of our software service processes might result in the disruption of patient care and could cause harm to our business and operating results.
Our customers might assert claims against us in the future alleging that they suffered damages due to a defect, error, or other failure of our product or service processes. A product liability claim or errors or omissions claim could subject us to significant legal defense costs and adverse publicity regardless of the merits or eventual outcome of such a claim.
Various events could interrupt customers’ access to the Benefitfocus Platform, exposing us to significant costs.
The ability to access the Benefitfocus Platform is critical to our customers. Our operations and facilities are vulnerable to interruption and/or damage from a number of sources, many of which are beyond our control, including, without limitation: (i) power loss and telecommunications failures, (ii) fire, flood, hurricane, and other natural disasters, (iii) software and hardware errors, failures or crashes in our own systems or in other systems, (iv) computer viruses, denial-of-service attacks, hacking and similar disruptive problems in our own systems and in other systems, and (v) civil unrest, war, and/or terrorism. We have implemented various measures to protect against interruptions of customers’ access to our platform. If customers’ access is interrupted because of problems in the operation of our facilities, we
32
could be exposed to significant claims by customers, particularly if the access interruption is associated with problems in the timely delivery of funds due to customers or medical information relevant to patient care. Our plans for disaster recovery and business continuity rely on third-party providers of related services. If those vendors fail us at a time when our systems are not operating correctly, we could incur a loss of revenue and liability for failure to fulfill our obligations. Any significant instances of system downtime could negatively affect our reputation and ability to retain customers and sell our services, which would adversely impact our revenue.
In addition, retention and availability of patient care and physician reimbursement data are subject to federal and state laws governing record retention, accuracy, and access. Some laws impose obligations on our customers and on us to produce information for third parties and to amend or expunge data at their direction. Our failure to meet these obligations might result in liability, which could increase our costs and reduce our operating results.
We rely on data center providers, Internet infrastructure, bandwidth providers, third-party computer hardware and software, other third parties, and our own systems for providing services to our customers, and any failure or interruption in the services provided by these third parties or our own systems could expose us to litigation and negatively impact our relationships with customers, adversely affecting our brand and our business.
We serve all our customers from two data centers, one located in Raleigh, North Carolina and the other located in Charlotte, North Carolina. While we control and have access to our servers, we do not control the operation of these facilities. The owners of our data center facilities have no obligation to renew their agreements with us on commercially reasonable terms, or at all. If we are unable to renew these agreements on commercially reasonable terms, or if one of our data center operators is acquired, we may be required to transfer our servers and other infrastructure to new data center facilities, and we may incur significant costs and possible service interruption in connection with doing so. Problems faced by our third-party data center locations, with the telecommunications network providers with whom we or they contract, or with the systems by which our telecommunications providers allocate capacity among their customers, including us, could adversely affect the experience of our customers. Our third-party data centers operators could decide to close their facilities without adequate notice. In addition, any financial difficulties, such as bankruptcy faced by our third-party data centers operators or any of the service providers with whom we or they contract may have negative effects on our business, the nature and extent of which are difficult to predict.
In addition, our ability to deliver our web-based services depends on the development and maintenance of the infrastructure of the Internet by third parties. This includes maintenance of a reliable network backbone with the necessary speed, data capacity, bandwidth capacity, and security. Our services are designed to operate without interruption in accordance with our service level commitments. However, we have experienced and expect that we will experience future interruptions and delays in services and availability from time to time. In the event of a catastrophic event with respect to one or more of our systems, we may experience an extended period of system unavailability, which could negatively impact our relationship with customers. To operate without interruption, both we and our service providers must guard against:
|
|
• |
damage from fire, power loss, natural disasters and other force majeure events outside our control; |
|
|
• |
communications failures; |
|
|
• |
software and hardware errors, failures, and crashes; |
|
|
• |
security breaches, computer viruses, hacking, denial-of-service attacks, and similar disruptive problems; and |
|
|
• |
other potential interruptions. |
We also rely on computer hardware purchased or leased and software licensed from third parties in order to offer our services, including software from Oracle Corporation and Microsoft Corporation, and routers and network equipment from Cisco, Dell and Hewlett-Packard Company. This hardware and software is generally commercially available on varying terms. However, it is possible that this hardware and software might not continue to be available on commercially reasonable terms, or at all. Any loss of
33
the right to use any of this hardware or software could result in delays in the provisioning of our services until equivalent technology is either developed by us, or, if available, is identified, obtained and integrated.
We exercise limited control over third-party vendors, which increases our vulnerability to problems with technology and information services they provide. Interruptions in our network access and services might in connection with third-party technology and information services reduce our revenue, cause us to issue refunds to customers for prepaid and unused subscription services, subject us to potential liability, or adversely affect our renewal rates. Although we maintain insurance for our business, the coverage under our policies might not be adequate to compensate us for all losses that may occur. In addition, we might not be able to continue to obtain adequate insurance coverage at an acceptable cost, if at all.
The use of open source software in our products and solutions may expose us to additional risks and harm our intellectual property rights.
Some of our products and solutions use or incorporate software that is subject to one or more open source licenses. Open source software is typically freely accessible, usable, and modifiable. Certain open source software licenses require a user who intends to distribute the open source software as a component of the user’s software to disclose publicly part or all of the source code to the user’s software. In addition, certain open source software licenses require the user of such software to make any derivative works of the open source code available to others on potentially unfavorable terms or at no cost.
The terms of many open source licenses to which we are subject have not been interpreted by U.S. or foreign courts. Accordingly, there is a risk that those licenses could be construed in a manner that imposes unanticipated conditions or restrictions on our ability to commercialize our solutions. In that event, we could be required to seek licenses from third parties in order to continue offering our products or solutions, to re-develop our products or solutions, to discontinue sales of our products or solutions, or to release our proprietary software code under the terms of an open source license, any of which could harm our business. Further, given the nature of open source software, it may be more likely that third parties might assert copyright and other intellectual property infringement claims against us based on our use of these open source software programs.
While we monitor the use of all open source software in our products, solutions, processes, and technology and try to ensure that no open source software is used in such a way as to require us to disclose the source code to the related product or solution when we do not wish to do so, it is possible that such use may have inadvertently occurred in deploying our proprietary solutions. In addition, if a third-party software provider has incorporated certain types of open source software into software we license from such third party for our products and solutions without our knowledge, we could, under certain circumstances, be required to disclose the source code to our products and solutions. This could harm our intellectual property position and our business, results of operations, and financial condition.
Risks Related to Regulation
Government regulation of the areas in which we operate creates risks and challenges with respect to our compliance efforts and our business strategies.
The employee benefits industry is highly regulated and is subject to changing political, legislative, regulatory, and other influences. Deregulatory efforts following the U.S. presidential and other elections in 2016 are ongoing, and the outcome of the 2018 elections could further impact the regulatory environment in our industry. Existing and new laws and regulations affecting the employee benefits industry could create unexpected liabilities for us, cause us to incur additional costs and restrict our operations. These laws and regulations are complex and their application to specific services and relationships are not clear. In particular, many existing laws and regulations affecting employee benefits, when enacted, did not anticipate the services that we provide, and these laws and regulations might be applied to our services in ways that we do not anticipate. Our failure to accurately anticipate the application of these laws and regulations, or our failure to comply, could create liability for us, result in adverse publicity, and negatively affect our business. Some of the risks we face from the regulation of employee benefits are as follows:
34
|
|
not directly apply to us, PPACA and continued efforts to repeal or modify the law may affect the business of many of our customers. Carriers and large employers might experience changes in the numbers of individuals they insure as a result of Medicaid expansion, the creation of state and national exchanges under PPACA and state Medicaid expansion, and the number of states that have chosen to implement the Medicaid expansion or adopt state-specific exchanges remains in flux. Although we are unable to predict with any reasonable certainty or otherwise quantify the likely impact of PPACA and related repeal efforts and deregulatory initiatives on our business model, financial condition, or results of operations, changes in the business of our customers and the number of individuals they insure may negatively impact our business. |
|
|
• |
False or Fraudulent Claim Laws. There are numerous federal and state laws that forbid submission of false information or the failure to disclose information in connection with submission and payment of claims for reimbursement from the government. In some cases, these laws also forbid abuse of existing systems for such submission and payment. In addition, federal and state laws prohibit kickbacks in association with the provision of healthcare services. Many of these state laws pertain to all payors, not just items or services paid for by the federal government. Although our business operations are generally not subject to these laws and regulations, any contract we have with a government entity requires us to comply with these laws and regulations. Any failure of our services to comply with these laws and regulations could result in substantial liability, including but not limited to criminal liability, could adversely affect demand for our services, and could force us to expend significant capital, research and development, and other resources to address the failure. Any determination by a court or regulatory agency that our services with government clients violate these laws and regulations could subject us to civil or criminal penalties, invalidate all or portions of some of our government client contracts, require us to change or terminate some portions of our business, require us to refund portions of our services fees, cause us to be disqualified from serving not only government clients but also all clients doing business with government payers, and have an adverse effect on our business. |
|
|
• |
HIPAA and Other Privacy and Security Requirements. There are numerous U.S. federal and state laws and regulations related to the privacy and security of personal health information. In particular, regulations promulgated pursuant to the Health Insurance Portability and Accountability Act of 1996, or HIPAA, established privacy and security standards that limit the use and disclosure of protected health information, and require the implementation of administrative, physical, and technological safeguards to ensure the confidentiality, integrity, availability, and privacy of protected health information. Health plans, healthcare clearinghouses, and most providers are “Covered Entities” subject to HIPAA. With respect to our operations as a healthcare clearinghouse, we are directly subject to the privacy regulations established under HIPAA, or the Privacy Rule, and the security regulations established under HIPAA, or the Security Rule. In addition, our carrier customers, or payors, are considered to be Covered Entities and are required to enter into written agreements with us, known as Business Associate Agreements, under which we are considered to be a “Business Associate” and that require us to safeguard protected health information and restrict how we may use and disclose such information. Both Covered Entities and Business Associates are subject to direct oversight and audit by the Department of Health and Human Services. |
Violations of HIPAA might result in civil fines of up to $55,910 per violation and a maximum civil penalty of $1,677,299 in a calendar year for violations of the same requirement, as well as criminal penalties. State attorneys general may bring civil actions seeking either injunctions or damages in response to violations of HIPAA that threaten the privacy of state residents. Moreover, the U.S. Department of Health and Human Services’ Office for Civil Rights (“OCR”) operates a formal HIPAA audit program. The audits are intended to assess compliance with HIPAA by both Covered Entities and Business Associates and are conducted by OCR with assistance from third party vendors. Issues identified during the audits may result in agency-imposed corrective action plans or civil monetary penalties.
We might not be able to adequately address the business risks created by HIPAA implementation and enforcement. Furthermore, we are unable to predict what changes to HIPAA or other laws or regulations might be made in the future or how those changes could
35
affect our business or the costs of compliance. Noncompliance may result in litigation and high-dollar fines or settlements.
Some payors and clearinghouses interpret HIPAA transaction requirements differently than we do. Where payors or clearinghouses require conformity with their interpretations as a condition of a successful transaction, we seek to comply with their interpretations.
In addition to the Privacy Rule and Security Rule, most states have enacted patient confidentiality laws that protect against the disclosure of confidential medical and/or health information, and many states have adopted or are considering further legislation in this area, including privacy safeguards, security standards, and data security breach notification requirements. Such state laws, if more stringent than HIPAA requirements, are not preempted by the federal requirements, and we are required to comply with them. Failure by us to comply with any state standards regarding patient privacy may subject us to penalties, including civil monetary penalties and, in some circumstances, criminal penalties. Such failure may injure our reputation and adversely affect our ability to retain customers and attract new customers.
|
|
• |
Personal Privacy and Consumer Protection. There are numerous U.S. federal and state laws and regulations that have been adopted or are being considered regarding the collection, retention, use, and disclosure of personal information. In addition to HIPAA, we might be subject to various laws, rules and regulations related to privacy and information security such as those promulgated under the Gramm-Leach-Bliley Act and various state laws regulating the use and security of personal information. Those laws, rules, and regulations include requirements such as reasonable and appropriate safeguards to protect personal information, or providing appropriate notice to consumers about how their personal information will be used or disclosed. Our management believes that we are currently operating in compliance with these regulations. However, continued compliance with these evolving laws, rules and regulations regarding the privacy, security and protection of our customers’ data, or the implementation of any additional privacy rules and regulations, could result in higher compliance and technology costs for us. |
|
|
• |
Medicare and Medicaid Regulatory Requirements. We have contracts with insurance carriers who offer Medicare Managed Care (also known as Medicare Advantage or Medicare Part C) and Medicaid Managed Care benefits plans. We also have contracts with insurance carriers who offer Medicare prescription drug benefits (also known as Medicare Part D) plans. The activities of the Medicare plans are regulated by the Centers for Medicare & Medicaid Services, or CMS, the federal agency that provides oversight of the Medicare and Medicaid programs. The Medicaid Managed Care plans are regulated by both CMS and the individual states where the plans are offered. Some of the activities that we might perform, such as the enrollment of beneficiaries, may be subject to CMS and/or state regulation, and such regulations may force us to change the way we do business or otherwise restrict our ability to provide services to such plans. Moreover, the regulatory environment with respect to these programs has become, and will likely continue to become, increasingly complex. |
36
|
|
and these rules and laws might impact our billing and payment solutions. Further, our solutions might impact the ability of our payor customers to comply with state prompt payment laws. These laws require payors to pay healthcare claims meeting the statutory or regulatory definition of a “clean claim” within a specified time frame. |
|
|
• |
Insurance Broker Laws. Insurance laws in the United States are often complex, and states have broad authority to adopt regulations regarding brokerage activities. Our business's regulatory oversight generally also includes activity governing the selection and payment of insurance products and the licensing of insurance brokers and our wholly owned subsidiary, BenefitStore, Inc., is an insurance agency. Our continuing ability to provide insurance brokerage related services in the jurisdictions in which we operate depends on our compliance with the rules and regulations promulgated from time to time by the regulatory authorities in each of these jurisdictions. |
|
|
• |
ERISA. The Employee Retirement Income Security Act of 1974, as amended, or ERISA, regulates how employee benefits are provided to or through certain types of employer-sponsored health benefits plans. ERISA is a set of laws and regulations that is subject to periodic interpretation by the U.S. Department of Labor as well as the federal courts. In some circumstances, and under certain customer contracts, we might be deemed to have assumed duties that make us an ERISA fiduciary, and thus be required to carry out our operations in a manner that complies with ERISA in all material respects. We believe that our current operations do not render us subject to ERISA fiduciary obligations, and therefore that we are in material compliance with ERISA and that any such compliance does not currently have a material adverse effect on our operations. However, there can be no assurance that continuing ERISA compliance efforts or any future changes to ERISA will not have a material adverse effect on us. |
|
|
• |
Third-Party Administrator Laws. Numerous states in which we do business have adopted regulations governing entities engaged in third-party administrator, or TPA, activities. TPA regulations typically impose requirements regarding enrollment into benefits plans, claims processing and payments, and the handling of customer funds. Although we do not believe we are currently acting as a TPA, changes in state regulations could result in us being obligated to comply with such regulations, which might require us to obtain licenses to provide TPA services in such states. |
We are subject to banking regulations that may limit our business activities.
The Goldman Sachs Group, affiliates of which owned approximately 19.9% of the voting and economic interest in our business at December 31, 2017, is regulated as a bank holding company and a financial holding company under the Bank Holding Company Act of 1956, as amended, or BHC Act. The BHC Act imposes regulations and requirements on The Goldman Sachs Group and on any company that is deemed to be controlled by The Goldman Sachs Group under the BHC Act and the regulations of the Board of Governors of the Federal Reserve System, or the Federal Reserve. Due to the size of its voting and economic interest, we are deemed to be controlled by The Goldman Sachs Group and are therefore considered to be a non-bank “subsidiary” of The Goldman Sachs Group under the BHC Act. We will remain subject to this regulatory regime until The Goldman Sachs Group is no longer deemed to control us for purposes of the BHC Act, which we do not generally have the ability to control and which will not occur until The Goldman Sachs Group has significantly reduced its voting and economic interest in us.
As a controlled non-bank subsidiary of The Goldman Sachs Group, we are restricted from engaging in activities that are not permissible under the BHC Act, or the rules and regulations promulgated thereunder. Permitted activities for a bank holding company or any controlled non-bank subsidiary generally include activities that the Federal Reserve has previously determined to be closely related to banking, financial in nature or incidental or complementary to financial activities, including data processing services such as those that we provide with our software solutions. Restrictions placed on The Goldman Sachs Group as a result of supervisory or enforcement actions under the BHC Act or otherwise may restrict us or our activities in certain circumstances, even if these actions are unrelated to our conduct or business. Further, as a result of being subject to regulation and supervision by the Federal Reserve, we may be required to obtain the prior approval of the Federal Reserve before engaging in certain new activities or businesses, whether organically or by acquisition. The Federal Reserve could exercise its power to restrict us from engaging in any activity that, in the Federal Reserve’s opinion, is
37
unauthorized or constitutes an unsafe or unsound business practice. To the extent that these regulations impose limitations on our business, we could be at a competitive disadvantage because some of our competitors are not subject to these limitations.
Additionally, any failure of The Goldman Sachs Group to maintain its status as a financial holding company could result in further limitations on our activities and our growth. In particular, our permissible activities could be restricted to only those that constitute banking or activities closely related to banking. The Goldman Sachs Group’s loss of its financial holding company status could be caused by several factors, including any failure by The Goldman Sachs Group’s bank subsidiaries to remain sufficiently capitalized, by any examination downgrade of one of The Goldman Sachs Group’s bank subsidiaries, or by any failure of one of The Goldman Sachs Group’s bank subsidiaries to maintain a satisfactory rating under the Community Reinvestment Act. In addition, The Goldman Sachs Group is required to remain “well capitalized” and “well managed” in order to maintain its status as a financial holding company. We have no ability to prevent such occurrences from happening.
As a non-bank subsidiary of a bank holding company, we are subject to examination by the Federal Reserve and required to provide information and reports for use by the Federal Reserve under the BHC Act. In addition, we may be subject to regulatory oversight and examination because we are a technology service provider to regulated financial institutions. The Federal Reserve may also impose substantial fines and other penalties for violations of applicable banking laws, regulations and orders. Further, the Dodd-Frank Act, including Title VI thereunder known as the “Volcker Rule”, and related financial regulatory reform call for the issuance of numerous regulations designed to increase and strengthen the regulation of bank holding companies, including The Goldman Sachs Group and its affiliates. The Volker Rule, in relevant part, restricts banking entities from proprietary trading (subject to certain exemptions) and from acquiring or retaining any equity, partnership or other interests in, or sponsoring, a private equity fund, subject to satisfying certain conditions, and from engaging in certain transactions with funds.
We have agreed to certain covenants that are intended to facilitate The Goldman Sachs Group’s compliance with the BHC Act, but that may impose certain obligations on our company. In particular, The Goldman Sachs Group has rights to conduct audits on, and access certain information of, our company and certain rights to review the policies and procedures that we implement to comply with the laws and regulations that relate to our activities. In addition, we are obligated to provide The Goldman Sachs Group with notice of certain events and business activities and cooperate with The Goldman Sachs Group to mitigate potential adverse consequences resulting therefrom.
Potential regulatory requirements placed on our software, services, and content could impose increased costs on us, delay or prevent our introduction of new service types, and impair the function or value of our existing service types.
Our products and services are and are likely to continue to be subject to increasing regulatory requirements in a number of ways. As these requirements proliferate, we must change or adapt our products and services to comply. Changing regulatory requirements might render our services obsolete or might block us from accomplishing our work or from developing new services. This might in turn impose additional costs upon us to comply or to further develop our products and services. It might also make introduction of new product or service types more costly or more time-consuming than we currently anticipate. It might even prevent introduction by us of new products or services or cause the continuation of our existing products or services to become unprofitable or impossible.
Potential government subsidy of services similar to ours, or creation of a single payor system, might reduce customer demand.
Recently, entities including brokers and U.S. federal and state governments have offered to subsidize adoption of online benefits platforms or clearinghouses. In addition, federal regulations have been changed to permit such subsidy from additional sources subject to certain limitations. To the extent that we do not qualify or participate in such subsidy programs, demand for our services might be reduced, which may decrease our revenue. In addition, prior proposals regarding healthcare reform have included the concept of creation of a single payor for healthcare insurance. This kind of consolidation of critical benefits activity could negatively impact the demand for our services.
38
Our services present the potential for embezzlement, identity theft, or other similar illegal behavior by our associates with respect to third parties.
Among other things, certain services offered by us involve collecting payment information from individuals, and this frequently includes check and credit card information. Even though we do not handle direct payments, our services also involve the use and disclosure of personal and business information that could be used to impersonate third parties, commit identity theft, or otherwise gain access to their data or funds. If any of our associates take, convert, or misuse such funds, documents, or data, we could be liable for damages, and our business reputation could be damaged or destroyed. Moreover, if we fail to adequately prevent third parties from accessing personal and/or business information and using that information to commit identity theft, we might face legal liabilities and other losses than can have a negative impact on our business.
Risks Related to Ownership of Our Common Stock
Our stock price may be volatile or may decline regardless of our operating performance, and you may not be able to resell your shares at or above the price at which you purchase it.
The stock market historically has experienced extreme price and volume fluctuations. As a result of this volatility, you might not be able to sell your common stock at or above the price at which you purchase it. The public market for our stock is new. From our IPO in September 2013 through December 31, 2017, the per share trading price of our common stock has been as high as $77.00 and as low as $19.58. It might continue to fluctuate significantly in response to various factors, some of which are beyond our control. These factors include:
|
|
• |
our operating performance and the operating performance of similar companies; |
|
|
• |
the overall performance of the equity markets; |
|
|
• |
changes in laws or regulations relating to the sale of health insurance; |
|
|
• |
announcements by us or our competitors of acquisitions, business plans, or commercial relationships; |
|
|
• |
any major change in our management; |
|
|
• |
threatened or actual litigation; |
|
|
• |
publication of research reports or news stories about us, our competitors, or our industry, or positive or negative recommendations or withdrawal of research coverage by securities analysts; |
|
|
• |
large volumes of sales of our shares of common stock by existing stockholders; and |
|
|
• |
general political and economic conditions. |
In addition, the stock market in general, and the market for Internet-related companies in particular, has experienced extreme price and volume fluctuations that have often been unrelated or disproportionate to the operating performance of those companies. These fluctuations might be even more pronounced in the relatively new trading market for our stock. Additionally, securities class action litigation has often been instituted against companies following periods of volatility in the overall market and in the market price of a company’s securities. This litigation, if instituted against us, could result in substantial costs, divert our management’s attention and resources, and harm our business, operating results, and financial condition.
We do not currently intend to pay dividends on our common stock and, consequently, your ability to achieve a return on your investment will depend on appreciation in the price of our common stock.
We have never declared or paid any cash dividends on our common stock and do not currently intend to do so for the foreseeable future. We currently intend to invest our future earnings, if any, to fund our growth. Therefore, you are not likely to receive any dividends on your common stock for the foreseeable future, and the success of an investment in shares of our common stock will depend upon future appreciation in its value, if any. There is no guarantee that shares of our common stock will appreciate in value or even maintain the price at which our stockholders purchased their shares.
39
Our stock price could decline due to the large number of outstanding shares of our common stock eligible for future sale.
Sales of a substantial number of shares of our common stock in the public market or the market perception that the holder or holders of a large number of shares intend to sell shares, could reduce the market price of our common stock. These sales could make it more difficult for us to sell equity or equity related securities in the future at a time and price that we deem appropriate.
As of December 31, 2017, we had an aggregate of 31,307,989 shares of common stock outstanding. As of December 31, 2017, there also were outstanding options, restricted stock units and warrants to purchase 2,207,208 shares of our common stock that, if exercised or vested, as applicable, will result in these additional shares becoming available for sale subject in some cases to Rule 144. On November 12, 2013, June 7, 2016 and June 9, 2017, we also registered an aggregate of 9,099,766 shares of our common stock that we may issue or sell under our stock plans. These shares can be freely sold in the public market upon issuance, unless they are held by “affiliates”, as that term is defined in Rule 144 of the Securities Act. If a large number of these shares are sold in the public market, the sales could reduce the trading price of our common stock.
A limited number of stockholders will have the ability to influence the outcome of director elections and other matters requiring stockholder approval.
As of December 31, 2017, our directors, executive officers, and their affiliated entities beneficially owned approximately 37.6% of our outstanding common stock. In particular, GS Capital Partners VI Parallel, L.P., GS Capital Partners VI Offshore Fund, L.P., GS Capital Partners VI Fund, L.P., and GS Capital Partners VI GmbH & CO. KG, which are affiliates of Goldman, Sachs & Co. and which we refer to as the Goldman Funds, collectively beneficially owned approximately 19.9%. These stockholders, if they act together, could exert substantial influence over matters requiring approval by our stockholders, including the amendment of our certificate of incorporation and bylaws, and the approval of mergers or other business combination transactions.
Additionally, the Goldman Funds, Mason R. Holland, Jr., our Executive Chairman and a director, and Shawn A. Jenkins, our Senior Advisor for Innovation and a director until April 1, 2018, entered into a voting agreement for the election of directors. As of December 31, 2017, these stockholders collectively beneficially owned approximately 36.9% of our common stock. Pursuant to the voting agreement, the parties are obligated to vote all of their shares to elect two directors nominated by the Goldman Funds and each of Messrs. Holland and Jenkins to our board of directors, if requested. As a result, these stockholders will have significant influence on the outcome of director elections. This concentration of ownership might discourage, delay, or prevent a change in control of our company, which could deprive our stockholders of an opportunity to receive a premium for their stock as part of a sale of our company and might reduce our stock price. These actions may be taken even if they are opposed by other stockholders.
Our business is subject to changing regulations regarding corporate governance, disclosure controls, internal control over financial reporting, and other compliance areas that will increase both our costs and the risk of noncompliance.
As a public company, we are subject to the reporting requirements of the Securities Exchange Act of 1934, or the Exchange Act, the Sarbanes-Oxley Act of 2002, or the Sarbanes-Oxley Act, the Dodd-Frank Act, and the rules and regulations of our stock exchange. The requirements of these rules and regulations will increase our legal, accounting, and financial compliance costs, will make some activities more difficult, time-consuming, and costly, and may also place undue strain on our personnel, systems, and resources.
The Sarbanes-Oxley Act requires, among other things, that we maintain effective disclosure controls and procedures and internal control over financial reporting. Commencing with our fiscal year ending December 31, 2014, we performed system and process evaluation and testing of our internal control over financial reporting to allow management to report on the effectiveness of our internal control over financial reporting, as required by Section 404 of the Sarbanes-Oxley Act. We also are required to disclose changes made to our internal controls and procedures on a quarterly basis. Our ongoing compliance with Section 404 of the Sarbanes-Oxley Act will require that we incur substantial accounting expense and expend significant management efforts.
40
In addition, we anticipate we will no longer qualify as an “emerging growth company” as defined in the Jumpstart Our Business Startups Act of 2012, or the JOBS Act, as of September 17, 2018. Accordingly, our independent registered public accounting firm will be required to formally attest to the effectiveness of our internal control over financial reporting pursuant to Section 404 of the Sarbanes-Oxley Act in our Annual Report on Form 10-K for the year ending December 31, 2018. We will also be required to include additional information regarding executive compensation in our 2019 proxy statement and hold a nonbinding advisory vote on executive compensation at our 2019 annual meeting of stockholders. These additional reporting requirements, among others, may increase our legal and financial compliance costs and cause management and other personnel to divert attention from operational and other business matters to devote substantial time to public company reporting requirements. In addition, if we are not able to comply with changing legal requirements in a timely manner, the market price of our stock could decline and we could be subject to sanctions or investigations by the stock exchange on which our common stock is listed, the SEC, or other regulatory authorities, which would require additional financial and management resources.
Failure to develop and maintain adequate financial controls could cause us to have material weaknesses, which could adversely affect our operations and financial position.
As previously reported, in the first quarter of 2014, we identified a material weakness in internal controls over the accounting for leasing transactions which resulted in the identification of a material error in the accounting for our headquarters lease executed in May 2005. We might in the future discover other material weaknesses that require remediation. In addition, an internal control system, no matter how well-designed, cannot provide absolute assurance that misstatements due to error or fraud will not occur or that all control issues and instances of fraud will be detected. If we are not able to comply with the requirements of Section 404 of the Sarbanes-Oxley Act in a timely manner, or if we are unable to maintain proper and effective internal controls, we might not be able to produce timely and accurate financial statements. If that were to happen, the market price of our stock could decline and we could be subject to sanctions or investigations by the stock exchange on which our common stock is listed, the SEC, or other regulatory authorities.
Any failure to develop or maintain effective controls, or any difficulties encountered in their implementation or improvement, could harm our operating results or cause us to fail to meet our reporting obligations. Any failure to implement and maintain effective internal controls also could adversely affect the results of periodic management evaluations regarding the effectiveness of our internal control over financial reporting that we are required to include in our periodic reports filed with the SEC under Section 404 of the Sarbanes-Oxley Act. Ineffective disclosure controls and procedures or internal control over financial reporting could also cause investors to lose confidence in our reported financial and other information, which would likely have a negative effect on the trading price of our common stock. Implementing any appropriate changes to our internal controls may require specific compliance training of our directors, officers, and employees, entail substantial costs in order to modify our existing accounting systems, and take a significant period of time to complete. Such changes may not be effective, however, in maintaining the adequacy of our internal controls, and any failure to maintain that adequacy, or consequent inability to produce accurate financial statements on a timely basis, could increase our operating costs and could materially impair our ability to operate our business. In the event that we are not able to demonstrate compliance with Section 404 of the Sarbanes-Oxley Act in a timely manner, that our internal controls are perceived as inadequate, or that we are unable to produce timely or accurate financial statements, investors may lose confidence in our operating results and our stock price could decline.
While we remain an emerging growth company, we cannot be certain if the reduced disclosure requirements applicable to emerging growth companies will make our common stock less attractive to investors.
We anticipate we will no longer qualify as an emerging growth company as of September 17, 2018. Under the JOBS Act, emerging growth companies can delay adopting new or revised accounting standards until such time as those standards apply to private companies. We have irrevocably elected not to avail ourselves of this exemption from new or revised accounting standards and, therefore, we continue to be subject to the same new or revised accounting standards as other public companies that are not emerging growth companies.
41
For as long as we continue to be an emerging growth company, we intend to take advantage of certain other exemptions from various reporting requirements that are applicable to other public companies including, but not limited to, reduced disclosure obligations regarding executive compensation in our periodic reports and proxy statements, exemptions from the requirements of holding a nonbinding advisory vote on executive compensation and stockholder approval of any golden parachute payments not previously approved, and exemptions from the requirements of auditor attestation reports on the effectiveness of our internal control over financial reporting. We cannot predict if investors will find our common stock less attractive while we continue to rely on these exemptions. If some investors find our common stock less attractive as a result, there may be a less active trading market for our common stock and our stock price may be more volatile.
Provisions in our restated certificate of incorporation and amended and restated bylaws and Delaware law might discourage, delay, or prevent a change in control of our company or changes in our management and, therefore, depress the trading price of our common stock.
Provisions of our certificate of incorporation and bylaws and Delaware law might discourage, delay, or prevent a merger, acquisition, or other change in control that stockholders consider favorable, including transactions in which you might otherwise receive a premium for your shares of our common stock. These provisions might also prevent or frustrate attempts by our stockholders to replace or remove our management. These provisions include:
|
|
• |
limitations on the removal of directors; |
|
|
• |
advance notice requirements for stockholder proposals and nominations; |
|
|
• |
limitations on the ability of stockholders to call special meetings; |
|
|
• |
the inability of stockholders to act by written consent once The Goldman Sachs Group and its affiliates cease to own at least 35% of our voting equity; |
|
|
• |
the inability of stockholders to cumulate votes at any election of directors; |
|
|
• |
the classification of our board of directors into three classes with only one class, representing approximately one-third of our directors, standing for election at each annual meeting; and |
|
|
• |
the ability of our board of directors to make, alter or repeal our bylaws. |
Our Board of Directors has the ability to designate the terms of and issue new series of preferred stock without stockholder approval. In addition, Section 203 of the Delaware General Corporation Law prohibits a publicly held Delaware corporation from engaging in a business combination with an interested stockholder, generally a person which together with its affiliates owns, or within the last three years has owned, 15% of our voting stock, for a period of three years after the date of the transaction in which the person became an interested stockholder, unless the business combination is approved in a prescribed manner.
The existence of the foregoing provisions and anti-takeover measures could limit the price that investors are willing to pay in the future for shares of our common stock. They could also deter potential acquirers of our company, thereby reducing the likelihood that you could receive a premium for your common stock in an acquisition.
If securities or industry analysts do not publish research or reports about our business, or publish inaccurate or unfavorable research or reports about our business, our stock price and trading volume could decline.
The trading market for our common stock depends, to some extent, on the research and reports that securities or industry analysts publish about us and our business. We do not have any control over these analysts. If one or more of the analysts who cover us downgrade our common stock or change their opinion of our common stock, our stock price would likely decline. If one or more of these analysts cease coverage of our company or fail to regularly publish reports on us, we could lose visibility in the financial markets, which could cause our stock price or trading volume to decline.
42
Item 1B. Unresolved Staff Comments.
None.
As of December 31, 2017, we occupied approximately 289,000 square feet on the Daniel Island Executive Center campus in Charleston, South Carolina. This office space is leased under leases expiring in 2031. As of December 31, 2017, we also leased facilities in Greenville, South Carolina; North Charleston, South Carolina; Tulsa, Oklahoma; and Salt Lake City, Utah.
We believe that our current and planned facilities are sufficient for our needs. We may add other facilities or expand existing facilities as we expand our associate base and geographic markets in the future, and we believe that suitable additional space will be available as needed to accommodate any such expansion of our operations.
From time to time, we might become involved in legal or regulatory proceedings arising in the ordinary course of our business. We are not currently a party to any material litigation or regulatory proceeding and we are not aware of any pending or threatened litigation or regulatory proceeding against us that could have a material adverse effect on our business, operating results, financial condition or cash flows.
Item 4. Mine Safety Disclosures.
Not applicable.
43
Item 5. Market for Registrant’s Common Equity, Related Stockholder Matters and Issuer Purchases of Equity Securities.
Market Information for Common Stock
Our common stock has been listed on the NASDAQ Global Market under the symbol “BNFT” since September 18, 2013. Prior to that date, there was no public trading market for our common stock. The following table sets forth for the periods indicated the high and low intraday sales prices per share of our common stock as reported on the NASDAQ Global Market.
|
|
|
High |
|
|
Low |
|
||
|
Year Ended December 31, 2017 |
|
|
|
|
|
|
|
|
|
First quarter |
|
$ |
32.00 |
|
|
$ |
24.55 |
|
|
Second quarter |
|
$ |
37.10 |
|
|
$ |
26.80 |
|
|
Third quarter |
|
$ |
36.95 |
|
|
$ |
26.50 |
|
|
Fourth quarter |
|
$ |
33.90 |
|
|
$ |
22.30 |
|
|
|
|
|
|
|
|
|
|
|
|
Year Ended December 31, 2016 |
|
|
|
|
|
|
|
|
|
First quarter |
|
$ |
35.72 |
|
|
$ |
21.04 |
|
|
Second quarter |
|
$ |
41.24 |
|
|
$ |
29.18 |
|
|
Third quarter |
|
$ |
44.98 |
|
|
$ |
36.10 |
|
|
Fourth quarter |
|
$ |
42.49 |
|
|
$ |
24.55 |
|
As of December 31, 2017, we had 57 holders of record of our common stock. The actual number of stockholders is greater than this number of record holders and includes stockholders who are beneficial owners but whose shares are held in street name by brokers and other nominees. This number of holders of record also does not include stockholders whose shares may be held in trust by other entities.
Dividend Policy
We have never declared or paid any cash dividend on our common stock. We currently intend to retain all of our future earnings, if any, generated by our operations for the development and growth of our business for the foreseeable future. The decision to pay dividends is at the discretion of our board of directors and depends upon our financial condition, results of operations, capital requirements, and other factors that our board of directors deems relevant.
Stock Performance Graph
The following shall not be deemed “filed” for purposes of Section 18 of the Exchange Act, or incorporated by reference into any of our other filings under the Exchange Act or the Securities Act of 1933, as amended, except to the extent we specifically incorporate it by reference into such filing.
This chart compares the cumulative total return on our common stock with that of the S&P 500 Index and the S&P 1500 Application Software Index. The chart assumes $100 was invested at the close of market on September 18, 2013, in the common stock of Benefitfocus, Inc., the S&P 500 Index and the S&P 1500 Application Software Index, and assumes the reinvestment of any dividends. The stock price performance on the following graph is not necessarily indicative of future stock price performance.
44
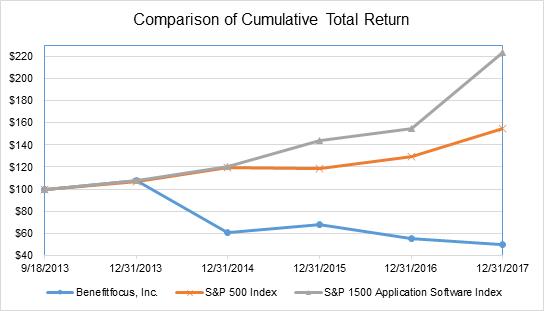
|
|
|
Base Period |
|
|
|
|
|
|
|
|
|
|
|
|
|
|
|
|
|
|
|
|
|
|
|
Company / Index |
|
9/18/2013 |
|
|
12/31/2013 |
|
|
12/31/2014 |
|
|
12/31/2015 |
|
|
12/31/2016 |
|
|
12/31/2017 |
|
||||||
|
Benefitfocus, Inc. |
|
$ |
100.00 |
|
|
$ |
107.82 |
|
|
$ |
61.33 |
|
|
$ |
67.96 |
|
|
$ |
55.46 |
|
|
$ |
50.42 |
|
|
S&P 500 Index |
|
$ |
100.00 |
|
|
$ |
107.12 |
|
|
$ |
119.32 |
|
|
$ |
118.45 |
|
|
$ |
129.75 |
|
|
$ |
154.95 |
|
|
S&P 1500 Application Software Index |
|
$ |
100.00 |
|
|
$ |
107.46 |
|
|
$ |
120.00 |
|
|
$ |
143.70 |
|
|
$ |
154.95 |
|
|
$ |
223.38 |
|
Equity Compensation Plans
The information required by Item 5 of Form 10-K regarding equity compensation plans is incorporated herein by reference to Part III “Item 12. Security Ownership of Certain Beneficial Owners and Management and Related Stockholder Matters”.
45
Item 6. Selected Financial Data.
CONSOLIDATED SELECTED FINANCIAL DATA
The following selected consolidated financial data for the years December 31, 2017, 2016, 2015, 2014 and 2013 and the selected consolidated balance sheet data as of December 31, 2017, 2016, 2015, 2014, and 2013 are derived from our audited consolidated financial statements. Our historical results are not necessarily indicative of the results to be expected in the future. The selected consolidated financial data should be read together with “Management’s Discussion and Analysis of Financial Condition and Results of Operations”, our consolidated financial statements, related notes, and other financial information included elsewhere in this Annual Report on Form 10-K.
Consolidated Statement of Operations Data
|
|
|
Year Ended December 31, |
|
|||||||||||||||||
|
|
|
|
2017 |
|
|
|
2016 |
|
|
|
2015 |
|
|
2014 |
|
|
2013 |
|
||
|
|
|
(in thousands, except share and per share data) |
|
|||||||||||||||||
|
Revenue(1) |
|
$ |
256,735 |
|
|
$ |
233,335 |
|
|
$ |
185,143 |
|
|
$ |
137,420 |
|
|
$ |
104,752 |
|
|
Cost of revenue(2) |
|
|
124,156 |
|
|
|
120,681 |
|
|
|
102,851 |
|
|
|
87,470 |
|
|
|
62,411 |
|
|
Gross profit |
|
|
132,579 |
|
|
|
112,654 |
|
|
|
82,292 |
|
|
|
49,950 |
|
|
|
42,341 |
|
|
Operating expenses: |
|
|
|
|
|
|
|
|
|
|
|
|
|
|
|
|
|
|
|
|
|
Sales and marketing(2) |
|
|
69,280 |
|
|
|
55,488 |
|
|
|
58,589 |
|
|
|
48,467 |
|
|
|
36,072 |
|
|
Research and development(2) |
|
|
49,549 |
|
|
|
56,584 |
|
|
|
52,250 |
|
|
|
41,729 |
|
|
|
23,532 |
|
|
General and administrative(2) |
|
|
27,268 |
|
|
|
32,750 |
|
|
|
25,727 |
|
|
|
18,657 |
|
|
|
10,974 |
|
|
Change in fair value of contingent consideration |
|
|
– |
|
|
|
– |
|
|
|
– |
|
|
|
– |
|
|
|
(43 |
) |
|
Total operating expenses |
|
|
146,097 |
|
|
|
144,822 |
|
|
|
136,566 |
|
|
|
108,853 |
|
|
|
70,535 |
|
|
Loss from operations |
|
|
(13,518 |
) |
|
|
(32,168 |
) |
|
|
(54,274 |
) |
|
|
(58,903 |
) |
|
|
(28,194 |
) |
|
Total other expense, net |
|
|
(12,339 |
) |
|
|
(7,873 |
) |
|
|
(7,785 |
) |
|
|
(4,251 |
) |
|
|
(2,198 |
) |
|
Loss before income taxes |
|
|
(25,857 |
) |
|
|
(40,041 |
) |
|
|
(62,059 |
) |
|
|
(63,154 |
) |
|
|
(30,392 |
) |
|
Income tax expense (benefit) |
|
|
15 |
|
|
|
17 |
|
|
|
25 |
|
|
|
25 |
|
|
|
(31 |
) |
|
Net loss |
|
$ |
(25,872 |
) |
|
$ |
(40,058 |
) |
|
$ |
(62,084 |
) |
|
$ |
(63,179 |
) |
|
$ |
(30,361 |
) |
|
Net loss per common share--basic and diluted |
|
$ |
(0.83 |
) |
|
$ |
(1.35 |
) |
|
$ |
(2.19 |
) |
|
$ |
(2.51 |
) |
|
$ |
(2.99 |
) |
|
Weighted-average common shares outstanding--basic and diluted |
|
|
31,052,378 |
|
|
|
29,589,857 |
|
|
|
28,344,680 |
|
|
|
25,207,099 |
|
|
|
10,144,243 |
|
|
Other Financial Data |
|
|
|
|
|
|
|
|
|
|
|
|
|
|
|
|
|
|
|
|
|
Adjusted EBITDA(3) |
|
$ |
19,443 |
|
|
$ |
(1,097 |
) |
|
$ |
(32,160 |
) |
|
$ |
(43,844 |
) |
|
$ |
(18,915 |
) |
|
(1) |
In the first quarter of 2015, we decreased the estimated expected life of our customer relationships for both employer and carrier customers from 10 to 7 years. This change shortened the term over which we will recognize our deferred revenue and results in more revenue recognized in each period after the change. |
|
(2) |
Cost of revenue and operating expenses include stock-based compensation expense as follows: |
|
|
|
Year Ended December 31, |
|
|||||||||||||||||
|
|
|
|
2017 |
|
|
|
2016 |
|
|
|
2015 |
|
|
|
2014 |
|
|
|
2013 |
|
|
|
|
(in thousands) |
|
|||||||||||||||||
|
Cost of revenue |
|
$ |
2,508 |
|
|
$ |
2,798 |
|
|
$ |
1,950 |
|
|
$ |
986 |
|
|
$ |
274 |
|
|
Sales and marketing |
|
|
4,953 |
|
|
|
3,213 |
|
|
|
2,861 |
|
|
|
1,395 |
|
|
|
171 |
|
|
Research and development |
|
|
2,990 |
|
|
|
4,532 |
|
|
|
2,399 |
|
|
|
1,376 |
|
|
|
255 |
|
|
General and administrative |
|
|
5,686 |
|
|
|
7,545 |
|
|
|
3,244 |
|
|
|
1,831 |
|
|
|
502 |
|
46
|
EBITDA to net loss, the most directly comparable financial measure calculated and presented in accordance with GAAP. |
Our Segments
|
|
|
Year Ended December 31, |
|
|||||||||||||||||
|
|
|
|
2017 |
|
|
|
2016 |
|
|
|
2015 |
|
|
|
2014 |
|
|
|
2013 |
|
|
|
|
(in thousands) |
|
|||||||||||||||||
|
Revenue from external customers by segment: |
|
|
|
|
|
|
|
|
|
|
|
|
|
|
|
|
|
|
|
|
|
Employer |
|
$ |
163,978 |
|
|
$ |
140,522 |
|
|
$ |
94,842 |
|
|
$ |
62,016 |
|
|
$ |
40,656 |
|
|
Carrier |
|
|
92,757 |
|
|
|
92,813 |
|
|
|
90,301 |
|
|
|
75,404 |
|
|
|
64,096 |
|
|
Total net revenue from external customers |
|
$ |
256,735 |
|
|
$ |
233,335 |
|
|
$ |
185,143 |
|
|
$ |
137,420 |
|
|
$ |
104,752 |
|
|
Gross profit by segment |
|
|
|
|
|
|
|
|
|
|
|
|
|
|
|
|
|
|
|
|
|
Employer |
|
$ |
68,735 |
|
|
$ |
53,031 |
|
|
$ |
33,655 |
|
|
$ |
16,186 |
|
|
$ |
13,316 |
|
|
Carrier |
|
|
63,844 |
|
|
|
59,623 |
|
|
|
48,637 |
|
|
|
33,764 |
|
|
|
29,025 |
|
|
Total gross profit by segment |
|
$ |
132,579 |
|
|
$ |
112,654 |
|
|
$ |
82,292 |
|
|
$ |
49,950 |
|
|
$ |
42,341 |
|
Consolidated Balance Sheet Data
|
|
|
As of December 31, |
|
|||||||||||||||||
|
|
|
|
2017 |
|
|
|
2016 |
|
|
|
2015 |
|
|
|
2014 |
|
|
|
2013 |
|
|
|
|
(in thousands) |
|
|||||||||||||||||
|
Cash and cash equivalents |
|
$ |
55,335 |
|
|
$ |
56,853 |
|
|
$ |
48,074 |
|
|
$ |
51,074 |
|
|
$ |
65,645 |
|
|
Marketable securities |
|
|
– |
|
|
|
2,007 |
|
|
|
40,448 |
|
|
|
5,135 |
|
|
|
13,168 |
|
|
Accounts receivable, total, net |
|
|
30,156 |
|
|
|
32,966 |
|
|
|
29,698 |
|
|
|
21,311 |
|
|
|
23,668 |
|
|
Total assets |
|
|
165,109 |
|
|
|
180,410 |
|
|
|
182,119 |
|
|
|
140,018 |
|
|
|
139,611 |
|
|
Deferred revenue, total |
|
|
58,719 |
|
|
|
75,838 |
|
|
|
93,529 |
|
|
|
94,510 |
|
|
|
80,221 |
|
|
Total liabilities |
|
|
204,440 |
|
|
|
213,721 |
|
|
|
200,128 |
|
|
|
182,841 |
|
|
|
128,179 |
|
|
Total redeemable convertible preferred stock |
|
|
– |
|
|
|
– |
|
|
|
- |
|
|
|
- |
|
|
|
- |
|
|
Common stock |
|
|
31 |
|
|
|
30 |
|
|
|
29 |
|
|
|
26 |
|
|
|
24 |
|
|
Additional paid-in capital |
|
|
355,301 |
|
|
|
335,059 |
|
|
|
310,304 |
|
|
|
223,409 |
|
|
|
214,487 |
|
|
Total stockholders' (deficit) equity |
|
|
(39,331 |
) |
|
|
(33,311 |
) |
|
|
(18,009 |
) |
|
|
(42,823 |
) |
|
|
11,432 |
|
Adjusted EBITDA
Within this Annual Report on Form 10-K we use adjusted EBITDA to provide investors with additional information regarding our financial results. Adjusted EBITDA is a non-GAAP financial measure. We have provided below a reconciliation of this measure to the most directly comparable GAAP financial measure, which for adjusted EBITDA is net loss.
We have included adjusted EBITDA in this Annual Report on Form 10-K because it is a key measure used by our management and board of directors to understand and evaluate our core operating performance and trends, to prepare and approve our annual budget, and to develop short- and long-term operational plans. In particular, we believe that the exclusion of the expenses eliminated in calculating adjusted EBITDA can provide a useful measure for period-to-period comparisons of our core business. Accordingly, we believe that adjusted EBITDA provides useful information to investors and others in understanding and evaluating our operating results.
47
Our use of adjusted EBITDA as an analytical tool has limitations, and you should not consider it in isolation or as a substitute for analysis of our financial results as reported under GAAP. Some of these limitations are:
|
|
• |
although depreciation and amortization are non-cash charges, the assets being depreciated and amortized might have to be replaced in the future, and adjusted EBITDA does not reflect cash capital expenditure requirements for such replacements or for new capital expenditure requirements; |
|
|
• |
adjusted EBITDA does not reflect changes in, or cash requirements for, our working capital needs; |
|
|
• |
adjusted EBITDA does not reflect the potentially dilutive impact of stock-based compensation; |
|
|
• |
adjusted EBITDA does not reflect interest or tax payments that would reduce the cash available to us; and |
|
|
• |
other companies, including companies in our industry, might calculate adjusted EBITDA or similarly titled measure differently, which reduces their usefulness as comparative measures. |
Because of these and other limitations, you should consider adjusted EBITDA alongside other GAAP-based financial performance measures, including various cash flow metrics, gross profit, net loss and our other GAAP financial results. The following table presents a reconciliation of adjusted EBITDA to net loss for each of the periods indicated:
|
|
|
Year Ended December 31, |
|
|||||||||||||||||
|
|
|
2017 |
|
|
2016 |
|
|
2015 |
|
|
2014 |
|
|
2013 |
|
|||||
|
|
|
(in thousands) |
|
|||||||||||||||||
|
Reconciliation from Net Loss to Adjusted EBITDA: |
|
|
|
|
|
|
|
|
|
|
|
|
|
|
|
|
|
|
|
|
|
Net loss |
|
$ |
(25,872 |
) |
|
$ |
(40,058 |
) |
|
$ |
(62,084 |
) |
|
$ |
(63,179 |
) |
|
$ |
(30,361 |
) |
|
Depreciation |
|
|
12,391 |
|
|
|
9,959 |
|
|
|
8,791 |
|
|
|
6,931 |
|
|
|
5,231 |
|
|
Amortization of software development costs |
|
|
3,257 |
|
|
|
2,857 |
|
|
|
2,587 |
|
|
|
2,257 |
|
|
|
2,618 |
|
|
Amortization of acquired intangible assets |
|
|
258 |
|
|
|
257 |
|
|
|
286 |
|
|
|
305 |
|
|
|
323 |
|
|
Interest income |
|
|
(182 |
) |
|
|
(138 |
) |
|
|
(188 |
) |
|
|
(77 |
) |
|
|
(46 |
) |
|
Interest expense on building lease financing obligations |
|
|
7,450 |
|
|
|
6,826 |
|
|
|
7,092 |
|
|
|
3,624 |
|
|
|
1,768 |
|
|
Interest expense on other borrowings |
|
|
4,931 |
|
|
|
1,095 |
|
|
|
877 |
|
|
|
682 |
|
|
|
381 |
|
|
Income tax expense |
|
|
15 |
|
|
|
17 |
|
|
|
25 |
|
|
|
25 |
|
|
|
(31 |
) |
|
Stock-based compensation expense |
|
|
16,137 |
|
|
|
18,088 |
|
|
|
10,454 |
|
|
|
5,588 |
|
|
|
1,202 |
|
|
Costs not core to our business |
|
|
1,058 |
|
|
|
- |
|
|
|
- |
|
|
|
- |
|
|
|
- |
|
|
Total net adjustments |
|
$ |
45,315 |
|
|
$ |
38,961 |
|
|
$ |
29,924 |
|
|
$ |
19,335 |
|
|
$ |
11,446 |
|
|
Adjusted EBITDA |
|
$ |
19,443 |
|
|
$ |
(1,097 |
) |
|
$ |
(32,160 |
) |
|
$ |
(43,844 |
) |
|
$ |
(18,915 |
) |
48
Item 7. Management’s Discussion and Analysis of Financial Condition and Results of Operations
MANAGEMENT’S DISCUSSION AND ANALYSIS
OF FINANCIAL CONDITION AND RESULTS OF OPERATIONS
You should read the following discussion and analysis of our financial condition and results of operations together with our consolidated financial statements and the related notes and other financial information included elsewhere in this Annual Report on Form 10-K. Some of the information contained in this discussion and analysis or set forth elsewhere in this report including information with respect to our plans and strategy for our business, includes forward-looking statements that involve risks and uncertainties. You should review the “Risk Factors” section of this report beginning on page 19 for a discussion of important factors that could cause actual results to differ materially from the results described in or implied by the forward-looking statements contained in the following discussion and analysis.
Overview
Benefitfocus provides a leading cloud-based benefits management platform for consumers, employers, insurance carriers, and brokers. The Benefitfocus Platform simplifies how organizations and individuals shop for, enroll in, manage, and exchange benefits. Our employer and insurance carrier customers rely on our platform to manage, scale and exchange data. Our web-based platform has a user-friendly interface designed to enable the insured consumers to access all of their benefits in one place. Our comprehensive solutions support core benefits plans, including healthcare, dental, life, and disability insurance, and voluntary benefits offerings such as income protection, digital health and financial wellness. As the number of employer benefits plans has increased, with each plan subject to many different business rules and requirements, demand for the Benefitfocus Platform has grown.
We serve two separate but related market segments. The employer market which consists of employers offering benefits to their employees. Within this segment, we mainly target large employers with more than 1,000 employees, of which we believe there are over 18,000 in the United States. In our other market segment, we sell our solutions to insurance carriers, enabling us to expand our overall footprint in the benefits marketplace by aggregating many key constituents, including consumers, employers, and brokers. Our business model capitalizes on the close relationship between carriers and their members, and the carriers’ ability to serve as lead generators for potential employer customers. Carriers pay for services at a rate reflective of the aggregated nature of their customer base on a per application basis. Carriers can then deploy their applications to employer groups and members. As employers become direct customers through our employer segment, we provide them our platform offering that bundles many software applications into a comprehensive benefits solution through Benefitfocus Marketplace. We believe our presence in both the employer and insurance carrier markets gives us a strong position at the center of the benefits ecosystem.
We sell the Benefitfocus Platform on a subscription basis, typically through annual contracts with employer customers and multi-year contracts with our insurance carrier customers, with subscription fees paid monthly, quarterly and annually. The multi-year contracts with our carrier customers are generally only cancellable by the carrier in an instance of our uncured breach, although some of our carrier customers are able to terminate their respective contracts without cause or for convenience. Software services revenue accounted for approximately 85%, 87%, and 87% of our total revenue during the years ended December 31, 2017, 2016 and 2015, respectively.
Another component of our revenue is professional services. We derive the majority of our professional services revenue from the implementation of our customers onto our platform, which typically includes discovery, configuration and deployment, integration, testing, and training. In general, it takes from four to six months to implement a new employer customer’s benefits systems and eight to 10 months to implement a new carrier customer’s benefits systems. We also provide customer support services and customized media content that supports our customers’ effort to educate and communicate with consumers. Professional services revenue accounted for approximately 15%, 13%, and 13% of our total revenue during the years ended December 31, 2017, 2016 and 2015, respectively.
49
Increasing our base of large employer customers is an important source of revenue growth for us. We actively pursue new employer customers in the U.S. market, and we have increased the number of large employer customers utilizing our solutions from 141 as of December 31, 2010 to 915 as of December 31, 2017, a 30.6% compound annual growth rate. We believe that our continued innovation and new solutions, such as online benefits marketplaces, also known as private exchanges, account services, enhanced mobile offerings, and more robust data analytics capabilities will help us attract additional large employer customers and increase our revenue from existing customers.
We believe that there is a substantial market for our services, and we have been investing in growth over the past six years. In particular, we have continued to invest in technology and services to better serve our larger employer customers, which we believe are an important source of growth for our business. We have also substantially increased our marketing and sales efforts and expect those increased efforts to continue. As we have invested in growth, we have had operating losses in each of the last seven years, and expect our operating losses to continue for at least the next year. Due to the nature of our customer relationships, which have been stable in spite of some customer losses over the past years, and the subscription nature of our financial model, we believe that our current investment in growth should lead to substantially increased revenue, which will allow us to achieve profitability in the relatively near future. Of course, our ability to achieve profitability will continue to be subject to many factors beyond our control.
Key Financial and Operating Performance Metrics
We regularly monitor a number of financial and operating metrics in order to measure our current performance and project our future performance. These metrics help us develop and refine our growth strategies and make strategic decisions. We discuss revenue, gross margin, and the components of operating loss, as well as segment revenue and segment gross profit, in “Management’s Discussion and Analysis of Financial Condition and Results of Operations—Components of Operating Results”. In addition, we utilize other key metrics as described below.
Number of Large Employer and Carrier Customers
We believe the number of large employer and carrier customers is a key indicator of our market penetration, growth, and future revenue. We have aggressively invested in and intend to continue to invest in our sales function to grow our customer base. We generally define a customer as an entity with an active software services contract as of the measurement date. The following table sets forth the number of large employer and carrier customers for the periods indicated:
|
|
|
Year Ended December 31, |
||||
|
|
|
2017 |
|
2016 |
|
2015 |
|
Number of customers: |
|
|
|
|
|
|
|
Large employer |
|
915 |
|
833 |
|
723 |
|
Carrier |
|
54 |
|
53 |
|
54 |
Software Services Revenue Retention Rate
We believe that our ability to retain our customers and expand the revenue they generate for us over time is an important component of our growth strategy and reflects the long-term value of our customer relationships. We measure our performance on this basis using a metric we refer to as our software services revenue retention rate. We calculate this metric for a particular period by establishing the group of our customers that had active contracts for a given period. We then calculate our software services revenue retention rate by taking the amount of software services revenue we recognized for this group in the subsequent comparable period (for which we are reporting the rate) and dividing it by the software services revenue we recognized for the group in the prior period.
For 2017, 2016 and 2015 our software services revenue retention rate exceeded 95%.
50
Adjusted EBITDA represents our earnings before net interest and other expense, taxes, and depreciation and amortization expense, adjusted to eliminate stock-based compensation and impairment of goodwill and intangible assets and costs not core to our business. Adjusted EBITDA is not a measure calculated in accordance with United States generally accepted accounting principles, or GAAP. Please refer to “Selected Consolidated Financial Data—Adjusted EBITDA” in this report for a discussion of the limitations of adjusted EBITDA and reconciliation of adjusted EBITDA to net loss, the most comparable GAAP measurement, respectively, for 2017, 2016 and 2015.
Components of Operating Results
Revenue
We derive the majority of our revenue from software services fees, which consist primarily of monthly subscription fees paid to us by our employer and carrier customers for access to, and usage of, our cloud-based benefits software solutions for a specified contract term. We also derive revenue from professional services fees, which primarily include fees related to the implementation of our customers onto our platform. Our professional services typically include discovery, configuration and deployment, integration, testing, and training.
The following table sets forth a breakdown of our revenue between software services and professional services for the periods indicated (in thousands):
|
|
|
Year Ended December 31, |
|
|||||||||
|
|
|
2017 |
|
|
2016 |
|
|
2015 |
|
|||
|
Software services |
|
$ |
218,443 |
|
|
$ |
201,797 |
|
|
$ |
161,477 |
|
|
Professional services |
|
|
38,292 |
|
|
|
31,538 |
|
|
|
23,666 |
|
|
Total revenue |
|
$ |
256,735 |
|
|
$ |
233,335 |
|
|
$ |
185,143 |
|
We generally recognize software services fees monthly based on the number of employees covered by the relevant benefits plans at contracted rates for a specified period of time, provided that an enforceable contract has been signed by both parties, access to our software has been granted to the customer and it is available for their use, the fee for the software services is fixed or determinable, and collection is reasonably assured.
We defer recognition of our professional services fees paid by customers related to implementation services that are determined to not have stand-alone value and are sold with our software services, and recognize them, beginning once the related software services have commenced, ratably over the longer of the contract term or the estimated expected life of the customer relationship, which was 7 years. We periodically evaluate the term over which revenue is recognized for professional services to reflect our experience with customer contract renewals.
As of July 1, 2015, we determined that we had established standalone value for the implementation services for the Benefitfocus Marketplace solution in the Employer segment as they are now sold separately from the software services. This was primarily due to the system integrators that have been trained and certified to perform these implementation services, the successful completion of an implementation by a trained system integrator, and the sale of several software subscription arrangements to customers in the Employer segment without the Company’s implementation services. Accordingly, revenues related to implementation services for the Benefitfocus Marketplace solution in the Employer segment that are delivered after July 1, 2015 are recognized separately from the revenues earned from the Employer software subscription services. Revenues related to such implementation services are recognized at the time that the professional services have been completed and the related software services have commenced. Prior to July 1, 2015, we did not have standalone value for implementation services related to the Benefitfocus Marketplace solution as we had historically performed these services to support our customers’ implementation of this solution. The incremental revenue from recognition of services upon delivery compared to recognition over the customer relationship period of 7 years was $2.3 million in twelve months ended December 31, 2015.
51
We generally invoice our employer and carrier customers for software services in advance, in monthly, quarterly or annual installments. We invoice our employer customers for implementation fees at the inception of the arrangement. We generally invoice our carrier customers for implementation fees at various contractually defined times throughout the implementation process. Implementation fees that have been invoiced are initially recorded as deferred revenue until recognized to revenue as described above.
We earn commissions from brokerage services from our voluntary benefit insurance offerings. We recognize revenue when these commissions are earned.
We will adopt the new revenue accounting standard on January 1, 2018. The new standard will significantly affect how we recognize revenue for our products and services. The expected effects of the new accounting standard are included in Note 2 to our consolidated financial statements appearing elsewhere in this Annual Report on Form 10-K.
Overhead Allocation
Expenses associated with our facilities, security, information technology, and depreciation and amortization, are allocated between cost of revenue and operating expenses based on employee headcount determined by the nature of work performed.
Cost of Revenue
Cost of revenue primarily consists of salaries and other personnel-related costs, including benefits, bonuses, and stock-based compensation, for employees, whom we refer to as associates, providing services to our customers and supporting our SaaS platform infrastructure. Additional expenses in cost of revenue include co-location facility costs for our data centers, depreciation expense for computer equipment directly associated with generating revenue, infrastructure maintenance costs, professional fees, amortization expenses associated with capitalized software development costs, allocated overhead, and other direct costs.
We expense our cost of revenue as we incur the costs. However, the related revenue from fees we receive for our implementation services, performed before a customer is operating on our platform, that is determined to not have stand-alone value is deferred until the commencement of the monthly subscription and recognized as revenue ratably over the longer of the related contract term or the estimated expected life of the customer relationship. For those implementation services that have standalone value, the related revenue is recognized as revenue upon completion of service. Therefore, the cost incurred in providing these services is expensed in periods prior to the recognition of the corresponding revenue. Our cost associated with providing implementation services has been significantly higher as a percentage of revenue than our cost associated with providing our monthly subscription services due to the labor associated with implementation.
We plan to continue to expand our capacity to support our growth, which will result in higher cost of revenue in absolute dollars. However, we expect cost of revenue as a percentage of revenue to decline and gross margins to increase primarily from the growth of the percentage of our revenue from large employers and the realization of economies of scale driven by retention of our customer base.
Operating Expenses
Operating expenses consist of sales and marketing, research and development, and general and administrative expenses. Salaries and personnel-related costs are the most significant component of each of these expense categories. We expect to continue to hire new associates in these areas in order to support our anticipated revenue growth; however, we expect to decrease our operating expenses, as a percentage of revenue, as we achieve economies of scale.
Sales and marketing expense. Sales and marketing expense consists primarily of salaries and other personnel-related costs, including benefits, bonuses, stock-based compensation, and commissions for our sales and marketing associates. We record expense for commissions at the time of contract signing. Additional expenses include advertising, lead generation, promotional event programs, corporate
52
communications, travel, and allocated overhead. For instance, our most significant promotional event is our annual user and partner conference, One Place, which we have held annually. We expect our sales and marketing expense to increase, in absolute dollars, in the foreseeable future as we further increase the number of our sales and marketing professionals and expand our marketing activities in order to continue to grow our business.
Research and development expense. Research and development expense consists primarily of salaries and other personnel-related costs, including benefits, bonuses, and stock-based compensation for our research and development associates. Additional expenses include costs related to the development, quality assurance, and testing of new technology, and enhancement of our existing platform technology, consulting, travel, and allocated overhead. We believe continuing to invest in research and development efforts is essential to maintaining our competitive position. We expect our research and development expense to decrease, as a percentage of revenue, as we achieve economies of scale.
General and administrative expense. General and administrative expense consists primarily of salaries and other personnel-related costs, including benefits, bonuses, and stock-based compensation for administrative, finance and accounting, information systems, legal, and human resource associates. Additional expenses include consulting and professional fees, insurance and other corporate expenses, and travel. We expect our general and administrative expenses to increase in absolute terms as a result of ongoing public company costs, including those associated with compliance with the Sarbanes-Oxley Act and other regulations governing public companies, increased costs of directors’ and officers’ liability insurance, and increased professional services expenses, particularly associated with the implementation of new accounting standards.
Other Income and Expense
Other income and expense consists primarily of interest income and expense and gain (loss) on disposal of property and equipment. Interest income represents interest received on our cash and cash equivalents and marketable securities. Interest expense consists primarily of the interest incurred on outstanding borrowings under our financing obligations, capital leases and credit facility.
Income Tax Expense
Income tax expense consists of U.S. federal and state income taxes. We incurred minimal income tax expense for 2017, 2016, and 2015. Net operating loss carryforwards for federal income tax purposes were $253.9 million at December 31, 2017. State net operating loss carryforwards were approximately $221.2 million at December 31, 2017. Federal and state net operating loss carryforwards will expire at various dates beginning in 2022, if not utilized. Valuation allowances are recorded to reduce deferred tax assets to the amount we believe is more likely than not to be realized.
On December 22, 2017, the Tax Cuts & Jobs Act (“Tax Reform”) was enacted. Among other things, we expect that the primary provision of Tax Reform to affect us will be the reduction to the U.S. corporate income tax rate from 35% to 21%. Accordingly, we revalued our deferred tax assets and liabilities to reflect the enacted tax rate and adjusted our valuation allowance. As of December 31, 2017, we have completed our accounting for the income tax effects of Tax Reform except for the impact of state tax conformity of each change and further evaluation of executive compensation. We are not able to determine a reasonable estimate for these items and expect to complete our analysis during 2018 as states make known their conformity with federal tax laws and additional transition guidance is provided related to executive compensation.
53
Consolidated Statements of Operations Data
The following table sets forth our consolidated statements of operations data for each of the periods indicated (in thousands).
|
|
|
Year Ended December 31, |
|
|||||||||
|
|
|
|
2017 |
|
|
|
2016 |
|
|
|
2015 |
|
|
Revenue |
|
$ |
256,735 |
|
|
$ |
233,335 |
|
|
$ |
185,143 |
|
|
Cost of revenue(1) |
|
|
124,156 |
|
|
|
120,681 |
|
|
|
102,851 |
|
|
Gross profit |
|
|
132,579 |
|
|
|
112,654 |
|
|
|
82,292 |
|
|
Operating expenses: |
|
|
|
|
|
|
|
|
|
|
|
|
|
Sales and marketing(1) |
|
|
69,280 |
|
|
|
55,488 |
|
|
|
58,589 |
|
|
Research and development(1) |
|
|
49,549 |
|
|
|
56,584 |
|
|
|
52,250 |
|
|
General and administrative(1) |
|
|
27,268 |
|
|
|
32,750 |
|
|
|
25,727 |
|
|
Total operating expenses |
|
|
146,097 |
|
|
|
144,822 |
|
|
|
136,566 |
|
|
Loss from operations |
|
|
(13,518 |
) |
|
|
(32,168 |
) |
|
|
(54,274 |
) |
|
Other income (expense): |
|
|
|
|
|
|
|
|
|
|
|
|
|
Interest income |
|
|
182 |
|
|
|
138 |
|
|
|
188 |
|
|
Interest expense on building lease financing obligations |
|
|
(7,450 |
) |
|
|
(6,826 |
) |
|
|
(7,092 |
) |
|
Interest expense on other borrowings |
|
|
(4,931 |
) |
|
|
(1,095 |
) |
|
|
(877 |
) |
|
Other expense |
|
|
(140 |
) |
|
|
(90 |
) |
|
|
(4 |
) |
|
Total other expense, net |
|
|
(12,339 |
) |
|
|
(7,873 |
) |
|
|
(7,785 |
) |
|
Loss before income taxes |
|
|
(25,857 |
) |
|
|
(40,041 |
) |
|
|
(62,059 |
) |
|
Income tax expense |
|
|
15 |
|
|
|
17 |
|
|
|
25 |
|
|
Net loss |
|
$ |
(25,872 |
) |
|
$ |
(40,058 |
) |
|
$ |
(62,084 |
) |
|
(1) |
Cost of revenue and operating expenses include stock-based compensation expense as follows (in thousands): |
|
|
|
Year Ended December 31, |
|
|||||||||
|
|
|
|
2017 |
|
|
|
2016 |
|
|
|
2015 |
|
|
Cost of revenue |
|
$ |
2,508 |
|
|
$ |
2,798 |
|
|
$ |
1,950 |
|
|
Sales and marketing |
|
|
4,953 |
|
|
|
3,213 |
|
|
|
2,861 |
|
|
Research and development |
|
|
2,990 |
|
|
|
4,532 |
|
|
|
2,399 |
|
|
General and administrative |
|
|
5,686 |
|
|
|
7,545 |
|
|
|
3,244 |
|
The following table sets forth our consolidated statements of operations data as a percentage of revenue for each of the periods indicated (as a percentage of revenue).
|
|
|
Year Ended December 31, |
|
|
|||||||||
|
|
|
|
2017 |
|
|
|
2016 |
|
|
|
2015 |
|
|
|
Revenue |
|
|
100.0 |
|
% |
|
100.0 |
|
% |
|
100.0 |
|
% |
|
Cost of revenue |
|
|
48.4 |
|
|
|
51.7 |
|
|
|
55.6 |
|
|
|
Gross profit |
|
|
51.6 |
|
|
|
48.3 |
|
|
|
44.4 |
|
|
|
Operating expenses: |
|
|
|
|
|
|
|
|
|
|
|
|
|
|
Sales and marketing |
|
|
27.0 |
|
|
|
23.8 |
|
|
|
31.6 |
|
|
|
Research and development |
|
|
19.3 |
|
|
|
24.3 |
|
|
|
28.2 |
|
|
|
General and administrative |
|
|
10.6 |
|
|
|
14.0 |
|
|
|
13.6 |
|
|
|
Total operating expenses |
|
|
56.9 |
|
|
|
62.1 |
|
|
|
73.8 |
|
|
|
Loss from operations |
|
|
(5.3 |
) |
|
|
(13.8 |
) |
|
|
(29.3 |
) |
|
|
Other income (expense): |
|
|
|
|
|
|
|
|
|
|
|
|
|
|
Interest income |
|
|
0.1 |
|
|
|
0.1 |
|
|
|
0.1 |
|
|
|
Interest expense on building lease financing obligations |
|
|
(2.9 |
) |
|
|
(2.9 |
) |
|
|
(3.8 |
) |
|
|
Interest expense on other borrowings |
|
|
(1.9 |
) |
|
|
(0.5 |
) |
|
|
(0.5 |
) |
|
|
Other expense |
|
|
(0.1 |
) |
|
|
- |
|
|
|
- |
|
|
|
Total other expense, net |
|
|
(4.8 |
) |
|
|
(3.4 |
) |
|
|
(4.2 |
) |
|
|
Loss before income taxes |
|
|
(10.1 |
) |
|
|
(17.2 |
) |
|
|
(33.5 |
) |
|
|
Income tax expense |
|
|
- |
|
|
|
- |
|
|
|
- |
|
|
|
Net loss |
|
|
(10.1 |
) |
% |
|
(17.2 |
) |
% |
|
(33.5 |
) |
% |
54
Our Segments
The following table sets forth segment results for revenue and gross profit for the periods indicated (in thousands):
|
|
|
Year Ended December 31, |
|
|||||||||
|
|
|
2017 |
|
|
2016 |
|
|
2015 |
|
|||
|
Revenue from external customers by segment: |
|
|
|
|
|
|
|
|
|
|
|
|
|
Employer |
|
$ |
163,978 |
|
|
$ |
140,522 |
|
|
$ |
94,842 |
|
|
Carrier |
|
|
92,757 |
|
|
|
92,813 |
|
|
|
90,301 |
|
|
Total net revenue from external customers |
|
$ |
256,735 |
|
|
$ |
233,335 |
|
|
$ |
185,143 |
|
|
Gross profit by segment |
|
|
|
|
|
|
|
|
|
|
|
|
|
Employer |
|
$ |
68,735 |
|
|
$ |
53,031 |
|
|
$ |
33,655 |
|
|
Carrier |
|
|
63,844 |
|
|
|
59,623 |
|
|
|
48,637 |
|
|
Total gross profit by segment |
|
$ |
132,579 |
|
|
$ |
112,654 |
|
|
$ |
82,292 |
|
Comparison of Years Ended December 31, 2017 and 2016
Revenue
|
|
|
Year Ended December 31, |
|
|
|
|
|
|
|
|
|
||||||||||||||||
|
|
|
2017 |
|
2016 |
|
|
|
|
|
|
|
|
|
||||||||||||||
|
|
|
|
|
|
|
Percentage of |
|
|
|
|
|
Percentage of |
|
Period-to-Period Change |
|||||||||||||
|
|
|
Amount |
|
|
Revenue |
|
Amount |
|
|
Revenue |
|
Amount |
|
|
Percentage |
||||||||||||
|
|
|
(in thousands) |
|
|
|
|
|
|
|
|
|
|
|
||||||||||||||
|
Software services |
|
$ |
218,443 |
|
|
|
85.1 |
|
% |
|
$ |
201,797 |
|
|
|
86.5 |
|
% |
|
$ |
16,646 |
|
|
|
8.2 |
|
% |
|
Professional services |
|
|
38,292 |
|
|
|
14.9 |
|
|
|
|
31,538 |
|
|
|
13.5 |
|
|
|
|
6,754 |
|
|
|
21.4 |
|
|
|
Total revenue |
|
$ |
256,735 |
|
|
|
100.0 |
|
% |
|
$ |
233,335 |
|
|
|
100.0 |
|
% |
|
$ |
23,400 |
|
|
|
10.0 |
|
% |
Growth in software services revenue was primarily attributable to existing customers adding covered users to our offerings, or volume increases, and also to existing customers purchasing additional products as well as to the net addition of new customers, as the number of large employer and carrier customers increased to 969 as of December 31, 2017 from 886 as of December 31, 2016.
The increase in professional services revenue was in part attributable to the recognition of $2.5 million of implementation services provided to newly activated customers and new products provided to existing customers, and the remainder from providing consulting services and enhancements to existing customers.
Segment Revenue
|
|
|
Year Ended December 31, |
|
|
|
|
|
|
|
|
|
||||||||||||||||
|
|
|
2017 |
|
2016 |
|
|
|
|
|
|
|
|
|
||||||||||||||
|
|
|
|
|
|
|
Percentage of |
|
|
|
|
|
Percentage of |
|
Period-to-Period Change |
|||||||||||||
|
|
|
Amount |
|
|
Revenue |
|
Amount |
|
|
Revenue |
|
Amount |
|
|
Percentage |
||||||||||||
|
|
|
(in thousands) |
|
|
|
|
|
|
|
|
|
|
|
||||||||||||||
|
Employer |
|
$ |
163,978 |
|
|
|
63.9 |
|
% |
|
$ |
140,522 |
|
|
|
60.2 |
|
% |
|
$ |
23,456 |
|
|
|
16.7 |
|
% |
|
Carrier |
|
|
92,757 |
|
|
|
36.1 |
|
|
|
|
92,813 |
|
|
|
39.8 |
|
|
|
|
(56 |
) |
|
|
(0.1 |
) |
|
|
Total revenue |
|
$ |
256,735 |
|
|
|
100.0 |
|
% |
|
$ |
233,335 |
|
|
|
100.0 |
|
% |
|
$ |
23,400 |
|
|
|
10.0 |
|
% |
Growth in our employer revenue was primarily attributable to a $17.6 million increase in our employer software services revenue driven mostly by new customers and volume increases, as well as additional products sold to existing customers. Additionally, employer professional services revenue increased $5.8 million due to implementation revenue from new customers and customer consulting to existing customers.
The slight decrease in carrier revenue was primarily attributable to a $0.9 million increase in professional services revenue, offset by a decrease of $1.0 million in software services revenue. The
55
professional services revenue increase was primarily driven by additional support and discovery services to existing customers. Carrier software services revenue decreased as volume decreases from existing customers exceeded increases in revenue from new customers.
Cost of Revenue
|
|
|
Year Ended December 31, |
|
|
|
|
|
|
|
|
|
||||||||||||||||
|
|
|
2017 |
|
2016 |
|
|
|
|
|
|
|
|
|
||||||||||||||
|
|
|
|
|
|
|
Percentage of |
|
|
|
|
|
Percentage of |
|
Period-to-Period Change |
|||||||||||||
|
|
|
Amount |
|
|
Revenue |
|
Amount |
|
|
Revenue |
|
Amount |
|
|
Percentage |
||||||||||||
|
|
|
(in thousands) |
|
|
|
|
|
|
|
|
|
|
|
||||||||||||||
|
Cost of revenue |
|
$ |
124,156 |
|
|
|
48.4 |
|
% |
|
$ |
120,681 |
|
|
|
51.7 |
|
% |
|
$ |
3,475 |
|
|
|
2.9 |
|
% |
The increase in cost of revenue in absolute terms was primarily attributable to an increase in salaries and personnel-related costs to support an increased number of customers and volume, as well as professional fees associated with third-party deliveries. This increase included a decrease in stock-based compensation of $0.3 million. Cost of revenue as a percentage of revenue has continued to decrease as a result of economies of scale as our revenues have grown.
Gross Profit
|
|
|
Year Ended December 31, |
|
|
|
|
|
|
|
|
|
||||||||||||||||
|
|
|
2017 |
|
2016 |
|
|
|
|
|
|
|
|
|
||||||||||||||
|
|
|
|
|
|
|
Percentage of |
|
|
|
|
|
Percentage of |
|
Period-to-Period Change |
|||||||||||||
|
|
|
Amount |
|
|
Revenue |
|
Amount |
|
|
Revenue |
|
Amount |
|
|
Percentage |
||||||||||||
|
|
|
(in thousands) |
|
|
|
|
|
|
|
|
|
|
|
||||||||||||||
|
Software services |
|
$ |
134,051 |
|
|
|
61.4 |
|
% |
|
$ |
122,686 |
|
|
|
60.8 |
|
% |
|
$ |
11,365 |
|
|
|
9.3 |
|
% |
|
Professional services |
|
|
(1,472 |
) |
|
|
(3.8 |
) |
|
|
|
(10,032 |
) |
|
|
(31.8 |
) |
|
|
|
8,560 |
|
|
|
(85.3 |
) |
|
|
Gross profit |
|
$ |
132,579 |
|
|
|
51.6 |
|
% |
|
$ |
112,654 |
|
|
|
48.3 |
|
% |
|
$ |
19,925 |
|
|
|
17.7 |
|
% |
The increase in software services gross profit was driven by a $16.6 million, or 8.2%, increase in software services revenue. This increase was partially offset by a $5.3 million, or 6.7%, increase in software services cost of revenue. Software services cost of revenue included $1.7 million of stock-based compensation expense for each of the years ended December 31, 2017 and 2016, and $10.4 million and $8.9 million of depreciation and amortization for the years ended December 31, 2017 and 2016, respectively.
The improvement in professional services gross loss was driven by a $6.8 million, or 21.4%, increase in professional services revenue and a decrease in professional services cost of revenue of $1.8 million. Professional services cost of revenue included $0.8 million and $1.1 million of stock-based compensation expense for the years ended December 31, 2017 and 2016, respectively. In addition, professional services cost of revenue included $1.4 million and $1.2 million in depreciation and amortization for the years ended December 31, 2017 and 2016, respectively.
As discussed in “Components of Operating Results—Cost of Revenue”, we expense our cost of revenue as we incur the costs. However, recognition of the related revenue from implementation services performed before a customer is operating on our platform generally is deferred until the commencement of the monthly subscription. We recognize the revenue ratably over the longer of the related contract term or the estimated expected life of the customer relationship, which is 7 years. Therefore, we expense the cost incurred in providing these services prior to the recognition of the corresponding revenue.
56
|
|
|
Year Ended December 31, |
|
|
|
|
|
|
|
|
|
||||||||||||||||
|
|
|
2017 |
|
2016 |
|
|
|
|
|
|
|
|
|
||||||||||||||
|
|
|
|
|
|
|
Percentage of |
|
|
|
|
|
Percentage of |
|
Period-to-Period Change |
|||||||||||||
|
|
|
Amount |
|
|
Revenue |
|
Amount |
|
|
Revenue |
|
Amount |
|
|
Percentage |
||||||||||||
|
|
|
(in thousands) |
|
|
|
|
|
|
|
|
|
|
|
||||||||||||||
|
Employer |
|
$ |
68,735 |
|
|
|
41.9 |
|
% |
|
$ |
53,031 |
|
|
|
37.7 |
|
% |
|
$ |
15,704 |
|
|
|
29.6 |
|
% |
|
Carrier |
|
|
63,844 |
|
|
|
68.8 |
|
|
|
|
59,623 |
|
|
|
64.2 |
|
|
|
|
4,221 |
|
|
|
7.1 |
|
|
|
Gross profit |
|
$ |
132,579 |
|
|
|
51.6 |
|
% |
|
$ |
112,654 |
|
|
|
48.3 |
|
% |
|
$ |
19,925 |
|
|
|
17.7 |
|
% |
The increase in employer gross profit was driven by a $23.5 million, or 16.7%, increase in employer revenue being only partially offset by a $7.8 million, or 8.9%, increase in employer cost of revenue as we continued to achieve economies of scale. The increase in cost of revenue was primarily attributable to increased personnel-related costs to support our customer base as well as increased depreciation and amortization, technology infrastructure costs and security-related costs. Our employer cost of revenue included $1.9 million and $2.0 million of stock-based compensation expense for the years ended December 31, 2017 and 2016, respectively. In addition, our employer cost of revenue included $7.3 million and $5.8 million of depreciation and amortization for the years ended December 31, 2017 and December 31, 2016, respectively.
The increase in carrier gross profit was driven by a decrease in carrier cost of revenue of $4.3 million, or 12.8%, in combination with carrier revenue being essentially flat. The decrease in cost of revenue was attributable to operational efficiencies achieved in supporting our carrier customers and a decrease in customer-specific development, as opposed to platform enhancements and development. Our carrier cost of revenue included $0.6 million and $0.8 million of stock-based compensation expense for the years ended December 31, 2017 and 2016, respectively. In addition, our carrier cost of revenue included $4.5 million and $4.2 million in depreciation and amortization for the years ended December 31, 2017 and 2016, respectively.
Operating Expenses
|
|
|
Year Ended December 31, |
|
|
|
|
|
|
|
|
|
||||||||||||||||
|
|
|
2017 |
|
2016 |
|
|
|
|
|
|
|
|
|
||||||||||||||
|
|
|
|
|
|
|
Percentage of |
|
|
|
|
|
Percentage of |
|
Period-to-Period Change |
|||||||||||||
|
|
|
Amount |
|
|
Revenue |
|
Amount |
|
|
Revenue |
|
Amount |
|
|
Percentage |
||||||||||||
|
|
|
(in thousands) |
|
|
|
|
|
|
|
|
|
|
|
||||||||||||||
|
Sales and marketing |
|
$ |
69,280 |
|
|
|
27.0 |
|
% |
|
$ |
55,488 |
|
|
|
23.8 |
|
% |
|
$ |
13,792 |
|
|
|
24.9 |
|
% |
|
Research and development |
|
$ |
49,549 |
|
|
|
19.3 |
|
% |
|
$ |
56,584 |
|
|
|
24.3 |
|
% |
|
$ |
(7,035 |
) |
|
|
(12.4 |
) |
% |
|
General and administrative |
|
$ |
27,268 |
|
|
|
10.6 |
|
% |
|
$ |
32,750 |
|
|
|
14.0 |
|
% |
|
$ |
(5,482 |
) |
|
|
(16.7 |
) |
% |
The increase in sales and marketing expense was attributable to $9.0 million higher salaries and personnel-related costs as we continued to invest in our direct sales channel. We increased the number sales associates during 2017, including hiring our Executive Vice-President, Global Sales. This increase included $1.7 million increase in stock-based compensation. Additionally, travel-related expenses increased $2.6 million and marketing expense, professional fees, technology infrastructure costs and other operating costs increased by $1.8 million.
The decrease in research and development expense reflects a $3.5 million decrease in salaries and personnel-related costs as the result of a decrease in the number of associates engaged in research and development activities. This decrease includes a $1.5 million decrease in stock-based compensation. Additionally, costs related to external development and engineering consulting decreased $3.2 million.
The decrease in general and administrative expense was partly attributable to a $1.8 million decrease in salaries and personnel-related costs, which includes a decrease in stock-based compensation expense of $1.3 million. Sales tax expense decreased $1.6 million related to resolving liabilities in certain states. We experienced additional decreases in professional and consulting fees of $1.0 million attributable to discontinuing the use of certain consultants during 2017 and a decrease in bad debt expense of $0.6 million.
57
Comparison of Years Ended December 31, 2016 and 2015
Revenue
|
|
|
Year Ended December 31, |
|
|
|
|
|
|
|
|
|
||||||||||||||||
|
|
|
2016 |
|
2015 |
|
|
|
|
|
|
|
|
|
||||||||||||||
|
|
|
|
|
|
|
Percentage of |
|
|
|
|
|
Percentage of |
|
Period-to-Period Change |
|||||||||||||
|
|
|
Amount |
|
|
Revenue |
|
Amount |
|
|
Revenue |
|
Amount |
|
|
Percentage |
||||||||||||
|
|
|
(in thousands) |
|
|
|
|
|
|
|
|
|
|
|
||||||||||||||
|
Software services |
|
$ |
201,797 |
|
|
|
86.5 |
|
% |
|
$ |
161,477 |
|
|
|
87.2 |
|
% |
|
$ |
40,320 |
|
|
|
25.0 |
|
% |
|
Professional services |
|
|
31,538 |
|
|
|
13.5 |
|
|
|
|
23,666 |
|
|
|
12.8 |
|
|
|
|
7,872 |
|
|
|
33.3 |
|
|
|
Total revenue |
|
$ |
233,335 |
|
|
|
100.0 |
|
% |
|
$ |
185,143 |
|
|
|
100.0 |
|
% |
|
$ |
48,192 |
|
|
|
26.0 |
|
% |
Growth in software services revenue was primarily attributable to existing customers adding covered users to our offerings, or volume increases, and also to existing customers purchasing additional products as well as to the net addition of new customers, as the number of large employer and carrier customers increased to 886 as of December 31, 2016 from 777 as of December 31, 2015.
The increase in professional services revenue was in part attributable to the recognition of $7.5 million of implementation services provided to newly activated customers, new products provided to existing customers and $4.3 million attributable to the acceleration of the customer relationship period for certain customers.
Segment Revenue
|
|
|
Year Ended December 31, |
|
|
|
|
|
|
|
|
|
||||||||||||||||
|
|
|
2016 |
|
2015 |
|
|
|
|
|
|
|
|
|
||||||||||||||
|
|
|
|
|
|
|
Percentage of |
|
|
|
|
|
Percentage of |
|
Period-to-Period Change |
|||||||||||||
|
|
|
Amount |
|
|
Revenue |
|
Amount |
|
|
Revenue |
|
Amount |
|
|
Percentage |
||||||||||||
|
|
|
(in thousands) |
|
|
|
|
|
|
|
|
|
|
|
||||||||||||||
|
Employer |
|
$ |
140,522 |
|
|
|
60.2 |
|
% |
|
$ |
94,842 |
|
|
|
51.2 |
|
% |
|
$ |
45,680 |
|
|
|
48.2 |
|
% |
|
Carrier |
|
|
92,813 |
|
|
|
39.8 |
|
|
|
|
90,301 |
|
|
|
48.8 |
|
|
|
|
2,512 |
|
|
|
2.8 |
|
|
|
Total revenue |
|
$ |
233,335 |
|
|
|
100.0 |
|
% |
|
$ |
185,143 |
|
|
|
100.0 |
|
% |
|
$ |
48,192 |
|
|
|
26.0 |
|
% |
Growth in our employer revenue was primarily attributable to a $42.9 million increase in our employer software services revenue driven primarily by new customers and volume increases, as well as additional products sold to existing customers. Additionally, employer professional services revenue increased $2.7 million, including a $0.7 million increase from services with standalone value.
The increase in carrier revenue in absolute terms was primarily attributable to a $5.1 million increase in professional services revenue, offset by a decrease of $2.6 million in software services revenue. The professional services revenue increase was primarily driven by implementations related to additional products with existing customers and the acceleration of the customer relationship period for certain customers. Carrier software services revenue decreased as volume decreases from existing customers exceeded increases in revenue from new customers.
Cost of Revenue
|
|
|
Year Ended December 31, |
|
|
|
|
|
|
|
|
|
||||||||||||||||
|
|
|
2016 |
|
2015 |
|
|
|
|
|
|
|
|
|
||||||||||||||
|
|
|
|
|
|
|
Percentage of |
|
|
|
|
|
Percentage of |
|
Period-to-Period Change |
|||||||||||||
|
|
|
Amount |
|
|
Revenue |
|
Amount |
|
|
Revenue |
|
Amount |
|
|
Percentage |
||||||||||||
|
|
|
(in thousands) |
|
|
|
|
|
|
|
|
|
|
|
||||||||||||||
|
Cost of revenue |
|
$ |
120,681 |
|
|
|
51.7 |
|
% |
|
$ |
102,851 |
|
|
|
55.6 |
|
% |
|
$ |
17,830 |
|
|
|
17.3 |
|
% |
The increase in cost of revenue in absolute terms was in part attributable to a $14.4 million increase in salaries and personnel-related costs to support an increased number of customers and volume, as well as professional fees associated with third-party deliveries. This increase included an increase in stock-based compensation of $0.9 million. The remaining increase was attributable to other operating expenses related to security, technology infrastructure, depreciation and amortization, and facilities costs to support
58
our organization. However, cost of revenue as a percentage of revenue has continued to decrease as a result of economies of scale as our revenues have grown.
Gross Profit
|
|
|
Year Ended December 31, |
|
|
|
|
|
|
|
|
|
||||||||||||||||
|
|
|
2016 |
|
2015 |
|
|
|
|
|
|
|
|
|
||||||||||||||
|
|
|
|
|
|
|
Percentage of |
|
|
|
|
|
Percentage of |
|
Period-to-Period Change |
|||||||||||||
|
|
|
Amount |
|
|
Revenue |
|
Amount |
|
|
Revenue |
|
Amount |
|
|
Percentage |
||||||||||||
|
|
|
(in thousands) |
|
|
|
|
|
|
|
|
|
|
|
||||||||||||||
|
Software services |
|
$ |
122,686 |
|
|
|
60.8 |
|
% |
|
$ |
102,301 |
|
|
|
63.4 |
|
% |
|
$ |
20,385 |
|
|
|
19.9 |
|
% |
|
Professional services |
|
|
(10,032 |
) |
|
|
(31.8 |
) |
|
|
|
(20,009 |
) |
|
|
(84.5 |
) |
|
|
|
9,977 |
|
|
|
(49.9 |
) |
|
|
Gross profit |
|
$ |
112,654 |
|
|
|
48.3 |
|
% |
|
$ |
82,292 |
|
|
|
44.4 |
|
% |
|
$ |
30,362 |
|
|
|
36.9 |
|
% |
The increase in software services gross profit was driven by a $40.3 million, or 25.0%, increase in software services revenue. This increase was partially offset by a $19.9 million, or 33.7%, increase in software services cost of revenue. Software services cost of revenue included $1.7 million and $0.9 million of stock-based compensation expense for the years ended December 31, 2016 and 2015, respectively, and $8.9 million and $7.7 million of depreciation and amortization for the years ended December 31, 2016 and 2015, respectively.
The improvement in professional services gross loss was driven by a $7.9 million, or 33.3%, increase in professional services revenue and a decrease in professional services cost of revenue of $2.1 million. Professional services cost of revenue included $1.1 million and $1.0 million of stock-based compensation expense for the years ended December 31, 2016 and 2015, respectively. In addition, professional services cost of revenue included $1.2 million and $1.4 million in depreciation and amortization for the years ended December 31, 2016 and 2015, respectively.
As discussed in “Components of Operating Results—Cost of Revenue”, we expense our cost of revenue as we incur the costs. However, recognition of the related revenue from implementation services performed before a customer is operating on our platform is generally deferred until the commencement of the monthly subscription. Beginning at that time, we recognize the revenue ratably over the longer of the related contract term or the estimated expected life of the customer relationship, which is 7 years. Therefore, we expense the cost incurred in providing these services prior to the recognition of the corresponding revenue.
Segment Gross Profit
|
|
|
Year Ended December 31, |
|
|
|
|
|
|
|
|
|
||||||||||||||||
|
|
|
2016 |
|
2015 |
|
|
|
|
|
|
|
|
|
||||||||||||||
|
|
|
|
|
|
|
Percentage of |
|
|
|
|
|
Percentage of |
|
Period-to-Period Change |
|||||||||||||
|
|
|
Amount |
|
|
Revenue |
|
Amount |
|
|
Revenue |
|
Amount |
|
|
Percentage |
||||||||||||
|
|
|
(in thousands) |
|
|
|
|
|
|
|
|
|
|
|
||||||||||||||
|
Employer |
|
$ |
53,031 |
|
|
|
37.7 |
|
% |
|
$ |
33,655 |
|
|
|
35.5 |
|
% |
|
$ |
19,376 |
|
|
|
57.6 |
|
% |
|
Carrier |
|
|
59,623 |
|
|
|
64.2 |
|
|
|
|
48,637 |
|
|
|
53.9 |
|
|
|
|
10,986 |
|
|
|
22.6 |
|
|
|
Gross profit |
|
$ |
112,654 |
|
|
|
48.3 |
|
% |
|
$ |
82,292 |
|
|
|
44.4 |
|
% |
|
$ |
30,362 |
|
|
|
36.9 |
|
% |
The increase in employer gross profit was driven by a $45.7 million, or 48.2%, increase in employer revenue being only partially offset by a $26.3 million, or 43.0%, increase in employer cost of revenue as we continued to achieve economies of scale. The increase in cost of revenue was primarily attributable to increased personnel-related costs to support our customer base as well as increased depreciation and amortization, technology infrastructure costs and security-related costs. Our employer cost of revenue included $5.8 million and $4.6 million of depreciation and amortization for the years ended December 31, 2016 and December 31, 2015, respectively. In addition, our employer cost of revenue included $2.0 million and $1.0 million of stock-based compensation expense for the years ended December 31, 2016 and 2015, respectively.
59
The increase in carrier gross profit was driven by an increase in carrier revenue of $2.5 million, or 2.8%, in combination with a decrease in carrier cost of revenue of $8.5 million, or 20.3%. The decrease in cost of revenue was primarily attributable to a decrease in customer-specific development, as opposed to platform enhancements and development. Our carrier cost of revenue included $4.2 million and $4.5 million in depreciation and amortization for the years ended December 31, 2016 and December 31, 2015, respectively. In addition, our carrier cost of revenue included $0.8 million and $0.9 million of stock-based compensation expense for the years ended December 31, 2016 and 2015, respectively.
Operating Expenses
|
|
|
Year Ended December 31, |
|
|
|
|
|
|
|
|
|
||||||||||||||||
|
|
|
2016 |
|
2015 |
|
|
|
|
|
|
|
|
|
||||||||||||||
|
|
|
|
|
|
|
Percentage of |
|
|
|
|
|
Percentage of |
|
Period-to-Period Change |
|||||||||||||
|
|
|
Amount |
|
|
Revenue |
|
Amount |
|
|
Revenue |
|
Amount |
|
|
Percentage |
||||||||||||
|
|
|
(in thousands) |
|
|
|
|
|
|
|
|
|
|
|
||||||||||||||
|
Sales and marketing |
|
$ |
55,488 |
|
|
|
23.8 |
|
% |
|
$ |
58,589 |
|
|
|
31.6 |
|
% |
|
$ |
(3,101 |
) |
|
|
(5.3 |
) |
% |
|
Research and development |
|
$ |
56,584 |
|
|
|
24.3 |
|
% |
|
$ |
52,250 |
|
|
|
28.2 |
|
% |
|
$ |
4,334 |
|
|
|
8.3 |
|
% |
|
General and administrative |
|
$ |
32,750 |
|
|
|
14.0 |
|
% |
|
$ |
25,727 |
|
|
|
13.9 |
|
% |
|
$ |
7,023 |
|
|
|
27.3 |
|
% |
The decrease in sales and marketing expense was attributable to lower compensation expenses, including the impact of a significant carrier deal that occurred in the first quarter of 2015 and a large employer deal that occurred in the third quarter of 2015, as well as the departure of the Chief Commercial Officer in the fourth quarter of 2015. Additionally, we experienced efficiencies that reduced travel-related expenses by $0.9 million and experienced a $0.6 million decrease in other operating expenses.
The increase in research and development expense in absolute terms was primarily attributable to a $4.5 million increase in salaries and personnel-related costs, including an increase in stock-based compensation of $2.1 million comprised of $0.5 million for the accrual of separation benefits related to the departure of our former Chief Technology Officer and $1.6 million attributable to equity awards granted to new and existing research and development associates. These increases were offset by a $2.0 million increase of personnel-related cost capitalized as part of software development. Additionally, we experienced a $0.9 million increase in engineering consulting fees for assistance in product development and a $0.9 million increase in technology infrastructure costs.
The increase in general and administrative expense was primarily attributable to a $5.7 million increase in salaries and personnel-related costs comprised of a $4.3 million increase in stock-based compensation expense and a $1.2 million increase due to additional general and administrative headcount and the accrual of separation benefits related the retirement of our former Chief Financial Officer. The increase in stock-based compensation is partly attributable to the issuance of stock-based awards in lieu of cash compensation to certain senior executives and a $3.5 million increase in stock-based compensation expense due to additional grants. We also experienced a $1.2 million increase in facilities costs, depreciation expense and technology infrastructure costs.
Critical Accounting Policies and Significant Judgments and Estimates
Our management’s discussion and analysis of our financial condition and results of operations is based on our consolidated financial statements, which have been prepared in accordance with GAAP. The preparation of these consolidated financial statements requires us to make estimates and assumptions that affect the reported amounts of assets and liabilities, disclosure of contingent assets and liabilities at the date of the consolidated financial statements, and the reported amounts of revenue and expenses. In accordance with GAAP, we base our estimates on historical experience and on various other assumptions that we believe reasonable under the circumstances. Actual results might differ from these estimates under different assumptions or conditions.
While our significant accounting policies are more fully described in Note 2 to our consolidated financial statements appearing elsewhere in this Annual Report on Form 10-K, we believe the following accounting policies are critical to the process of making significant judgments and estimates in the preparation of our consolidated financial statements.
60
Revenue Recognition and Deferred Revenue
We derive the majority of our revenue from software services fees, which consist primarily of monthly subscription fees paid by customers for access to and usage of our cloud-based benefits software solutions for a specified contract term. We also derive revenue from professional services which primarily include fees related to the integration of customers’ systems with our platform, which typically includes discovery, configuration, deployment, testing, and training.
We recognize revenue when there is persuasive evidence of an arrangement, the service has been provided, the fees to be paid by the customer are fixed and determinable and collectability is reasonably assured. We consider delivery of our cloud-based software services has commenced once access to a configured and live instance on our platform has been delivered.
Our arrangements generally contain multiple elements comprised of software services and professional services. We evaluate each element in an arrangement to determine whether it represents a separate unit of accounting. An element constitutes a separate unit of accounting when the delivered item has standalone value and delivery of the undelivered element is probable and within our control.
When multiple deliverables included in an arrangement are separable into different units of accounting, the arrangement consideration is allocated to the identified units of accounting based on their relative selling price. Multiple deliverable arrangements accounting guidance provides a hierarchy to use when determining the relative selling price for each unit of accounting. Vendor-specific objective evidence (“VSOE”) of selling price, based on the price at which the item is regularly sold by the vendor on a standalone basis, should be used if it exists. If VSOE of selling price is not available, third-party evidence (“TPE”) of selling price is used to establish the selling price if it exists. VSOE and TPE do not currently exist for any of our deliverables. Accordingly, for arrangements with multiple deliverables that can be separated into different units of accounting, the arrangement fee is allocated to the separate units of accounting based on our best estimate of selling price. The amount of arrangement fee allocated is limited by contingent revenues, if any.
Effective July 1, 2015, we determined that we had established standalone value for Benefitfocus Marketplace implementation services in the Employer segment as they are now sold separately from the software services. This was primarily due to the system integrators that have been trained and certified to perform these implementation services, the successful completion of an implementation by a trained system integrator, and the sale of several software subscription arrangements to customers in the Employer segment without our implementation services. Accordingly, revenues related to implementation services for the Benefitfocus Marketplace solution in the Employer segment that are delivered after July 1, 2015 are recognized separately from the revenues earned from the Employer software subscription services. Revenues related to such implementation services are recognized at the time that the professional services have been completed and the related software services have commenced. Prior to July 1, 2015, we did not have standalone value for implementation services related to the Benefitfocus Marketplace solution as we had historically performed these services to support customers’ implementation of this solution. The incremental revenue from recognition of services upon delivery compared to recognition over the customer relationship period of 7 years was $2.3 million for the twelve months ended December 31, 2015.
Certain of our other professional services, including implementation services related to the Carrier segment, are not sold separately from the software services and there is no alternative use for them. As such, we have determined that those professional services do not have standalone value. Accordingly, software services and professional services are combined and recognized as a single unit of accounting. We generally recognize software services fees monthly based on the number of employees covered by the relevant benefits plans at contracted rates for a specified period of time, once the criteria for revenue recognition described above have been satisfied. We recognize revenue on Benefitfocus Marketplace implementation services in the Employer segment that have standalone value at the time the services have been completed. We defer recognition of revenue for fees from professional services that do not have standalone value and begin recognizing such revenue once the services are delivered and the related software services have commenced, ratably over the longer of the contract term or the estimated expected life of the customer relationship. Costs incurred by us in connection with providing such professional services are charged to expense as incurred and are included in “Cost of revenue.”
61
We also earn commissions from brokerage services from our voluntary benefit insurance offerings. We recognize revenue when these commissions are earned.
We will adopt the new revenue accounting standard on January 1, 2018. The new standard will significantly affect how we recognize revenue for our products and services. The expected effects of the new accounting standard are included in Note 2 to our consolidated financial statements appearing elsewhere in this Annual Report on Form 10-K.
Accounts Receivable and Allowances for Doubtful Accounts and Returns
We state accounts receivable at realizable value, net of an allowance for doubtful accounts and estimated returns. We maintain the allowance for doubtful accounts for estimated losses expected to result from the inability of some customers to make payments as they become due. We base our estimated allowance on our analysis of past due amounts and ongoing credit evaluations. Historically, our actual collection experience has not varied significantly from our estimates, due primarily to our credit and collection policies and the financial strength of our customers.
The allowances for returns are accounted for as reductions of revenue and are estimated based on the Company’s periodic assessment of historical experience and trends. The Company considers factors such as the time lag since the initiation of revenue recognition, historical reasons for adjustments, new customer volume, complexity of billing arrangements, timing of software availability, and past due customer billings.
Stock-Based Compensation
We have issued two types of stock-based awards under our stock plans: stock options and restricted stock units. Stock-based awards granted to associates, directors, and non-associate third parties are measured at fair value at each grant date. We recognize stock-based compensation expense, net of forfeitures, ratably over the requisite service period of the option award. Generally, options vest 25% on the one-year anniversary of the grant date with the balance vesting over the following 36 months. We previously granted options that vest 100% on the fifth anniversary of the grant date. Restricted stock unit awards generally vest 25% on each anniversary of the grant date over 4 years.
In 2017, 2016 and 2015, we granted performance restricted stock units that vest upon the achievement of certain financial performance targets. Compensation expense for performance restricted stock units, which are accounted for as equity awards, is recognized over the requisite service period when it is probable that the award will vest. Significant judgment is involved in assessing the probability of achieving performance measures.
We determined fair value for restricted stock unit awards based on the closing price of our common stock on the date of grant or, if not a trading day, the trading day following the grant date.
We did not grant any stock options in 2017, 2016 or 2015. As of December 31, 2017, all outstanding options are fully vested and expensed.
On January 1, 2017, we adopted Financial Accounting Standards Board (“FASB”) Accounting Standard Update (“ASU”) 2016-09, “Improvements to Employee Share-Based Payment Accounting,” and elected to account for forfeitures as they occur. Prior to that date, we based our estimate of pre-vesting forfeitures, or forfeiture rate, on our analysis of historical behavior by stock award holders. We applied the estimated forfeiture rate to the total estimated fair value of the awards, as derived from the Black-Scholes model, to compute the stock-based compensation expense, net of pre-vesting forfeitures, to be recognized in our consolidated statements of operations.
Based upon the closing stock price of $27.00 on December 29, 2017, the last trading day of 2017, the aggregate intrinsic value of outstanding options to purchase shares of our common stock as of December 31, 2017 was $4.7 million, all of which was related to vested options. The aggregate intrinsic value of outstanding restricted stock units as of December 31, 2017 was $52.3 million, of which all were unvested.
62
Liquidity and Capital Resources
Sources of Liquidity
As of December 31, 2017, our primary sources of liquidity were our cash and cash equivalents totaling $55.3 million, $32.0 million in accounts receivables, net of allowance, and unused availability under a revolving line of credit of $38.8 million, without taking into account the borrowing base limit. The terms of our revolving line of credit are described in Note 8 of our consolidated financial statements included elsewhere in this Annual Report on Form 10-K.
In April 2017, we amended our revolving line of credit agreement. The amendment altered definitions in the agreement, including Consolidated EBITDA and Liquidity, and changed the Minimum Liquidity and Minimum Consolidated EBITDA requirements. It also included consents by the lenders to certain administrative actions by us, including with respect to intellectual property and certain of our bank accounts. Additionally, the amendment modified the definition of Excluded Assets in the Guarantee and Collateral Agreement, dated as of February 20, 2015, which was entered into in connection with the revolving line of credit agreement.
We are bound by customary affirmative and negative covenants in connection with the revolving line of credit, including financial covenants related to liquidity and EBITDA. In the event of a default, the lenders may declare all obligations immediately due and stop advancing money or extending credit under the line of credit. The line of credit is collateralized by substantially all of our tangible and intangible assets, including intellectual property and the equity of our subsidiaries.
Based on our current level of operations and anticipated growth, we believe our future cash flows from operating activities and existing cash balances will be sufficient to meet our cash requirements for at least the next 12 months.
Going forward, we may access capital markets to raise additional equity or debt financing for various business reasons, including required debt payments and acquisitions. The timing, term, size, and pricing of any such financing will depend on investor interest and market conditions, and there can be no assurance that we will be able to obtain any such financing on favorable terms or at all.
Cash Flows
Our cash flows for the years ended December 31, 2017, 2016 and 2015 were as follows:
|
|
|
Year Ended December 31, |
|
|||||||||
|
|
|
2017 |
|
|
2016 |
|
|
2015 |
|
|||
|
|
|
(in thousands) |
|
|||||||||
|
Cash (used in) provided by: |
|
|
|
|
|
|
|
|
|
|
|
|
|
Operating activities |
|
$ |
(5,937 |
) |
|
$ |
(22,826 |
) |
|
$ |
(31,545 |
) |
|
Investing activities |
|
|
(6,279 |
) |
|
|
25,516 |
|
|
|
(50,245 |
) |
|
Financing activities |
|
|
10,698 |
|
|
|
6,089 |
|
|
|
78,790 |
|
|
Net (decrease) increase in cash and cash equivalents |
|
$ |
(1,518 |
) |
|
$ |
8,779 |
|
|
$ |
(3,000 |
) |
Operating Activities
For 2017, our operating activities used $5.9 million of cash, as $39.8 million for non-cash adjustments were more than offset by our net loss of $25.9 million and $19.8 million of cash used in changes in working capital. Adjustments for non-cash items primarily consisted of depreciation and amortization expense of $15.9 million, accrual of interest on financing obligations of $7.5 million, and non-cash stock compensation expense of $16.1 million. The cash used in changes in working capital primarily consisted of a decrease in deferred revenue of $17.1 million, a decrease in accounts payable and accrued expenses not associated with the purchase of property and equipment of $3.0 million, and a decrease in accrued compensation and benefits of $3.1 million as the result of timing of payments of accrued amounts. Changes in working capital that provided cash totaled $3.6 million and were primarily comprised of decreases of accounts receivable and other non-current assets.
For 2016, our operating activities used $22.8 million of cash, as $38.8 million for non-cash adjustments were more than offset by our net loss of $40.0 million and $21.6 million of cash used in
63
changes in working capital. Adjustments for non-cash items primarily consisted of depreciation and amortization expense of $13.1 million, accrual of interest on financing obligations of $6.8 million, and non-cash stock compensation expense of $18.1 million. The cash used in changes in working capital primarily consisted of a decrease in deferred revenue of $17.7 million, an increase in accounts receivable of $3.9 million, and a decrease in accrued compensation and benefits of $3.3 million as the result of timing of payments of accrued amounts. Changes in working capital that provided cash totaled $5.2 million and were primarily comprised of an increase of accrued expenses and other non-current liabilities and a decrease in prepaid expenses.
For 2015, our operating activities used $31.5 million, as changes in working capital provided $1.3 million cash and adjustments for non-cash items of $29.3 million partially offset a net loss of $62.1 million. The cash provided by changes in working capital primarily consisted of an increase in accrued compensation and benefits of $3.3 million, an increase in accrued expenses of $3.0 million, and an increase in accounts payable of $3.4 million, offset by an increase in accounts receivable of $7.8 million. The increase in accrued compensation and benefits resulted from an increase in the number of associates. The increases in accrued expenses and accounts payable are the result of timing of the receipt of invoices and the timing of payments. The increase in accounts receivable resulted from a few significant invoices related to new contracts and the normal timing of customer payments.
Investing Activities
For 2017, investing activity used $6.2 million as purchases of property and equipment of $8.2 million were partially offset by maturity of short-term investments of $2.0 million.
For 2016, investing activities provided $25.5 million as proceeds from the maturity of short-term investments of $40.2 million were partially offset by purchases of property and equipment of $12.7 million and investments in marketable securities of $2.0 million.
Net cash used in investing activities totaled $50.2 million for 2015 as net purchases of marketable securities were $35.5 million and cash purchases of property and equipment were $14.7 million.
Financing Activities
For 2017, net cash provided by financing activities was $10.7 million, as cash from the exercise of stock options of $3.7 million and net borrowings under the revolving line of credit of $16.0 million were partially offset by payments on capital lease and financing obligations of $9.0 million. Cash from the exercise of stock options included $1.8 million related to the exercise of options by our Executive Chairman that were set to expire in February 2017.
For 2016, net cash provided by financing activities was $6.1 million, as the result of cash from the exercise of stock options of $6.9 million and net borrowings under the revolving line of credit of $10.0 million, partially offset by payments on capital lease and financing obligations. Cash from the exercise of stock options included $5.1 million related to the exercise of options by an executive officer that were set to expire in February 2017.
For 2015, net cash provided by financing activities was $78.8 million, primarily as a result of $74.5 million from the issuance of common stock and a warrant in a private placement to Mercer, and net draws on the revolving line of credit of $12.6 million offset by payments on financing and capital lease obligations of $9.9 million.
Operating and Capital Expenditure Requirements
We believe that our existing cash and cash equivalents balances, cash generated from operations, and our ability to draw on the revolving line of credit will be sufficient to meet our anticipated cash requirements through at least the next 12 months. Our future capital requirements will depend on many factors, including our customer growth rate, subscription renewal activity, the timing and extent of development efforts, the expansion of sales and marketing activities, the introduction of new and enhanced services offerings, and the continuing market acceptance of our services. We might require additional capital beyond our currently anticipated amounts. If our available cash and cash equivalents balances are insufficient to satisfy our liquidity requirements, we may seek to sell equity or convertible debt securities or enter into an additional credit facility. The sale of equity and convertible debt securities may result in dilution to our stockholders and those securities may have rights senior to those of our
64
common shares. If we raise additional funds through the issuance of convertible debt securities, these securities could contain covenants that would restrict our operations. Additional capital might not be available on reasonable terms, or at all.
Contractual Obligations and Commitments
Our principal commitments consist of obligations under our outstanding credit facility, non-cancelable leases for our office space and computer equipment and purchase commitments for our co-location and other support services. The following table summarizes these contractual obligations at December 31, 2017. Future events could cause actual payments to differ from these estimates.
|
|
|
Payment due by period |
|
|||||||||||||||||
|
Contractual Obligations |
|
Total |
|
|
Less than 1 year |
|
|
1-3 years |
|
|
3-5 years |
|
|
More than 5 years |
|
|||||
|
|
|
(in thousands) |
|
|||||||||||||||||
|
Long-term debt--Revolving line of credit (1) |
|
$ |
56,246 |
|
|
$ |
- |
|
|
$ |
56,246 |
|
|
$ |
- |
|
|
$ |
- |
|
|
Operating lease obligations |
|
|
14,224 |
|
|
|
1,400 |
|
|
|
2,564 |
|
|
|
1,925 |
|
|
|
8,335 |
|
|
Capital lease obligations |
|
|
50,953 |
|
|
|
5,089 |
|
|
|
8,197 |
|
|
|
5,970 |
|
|
|
31,697 |
|
|
Financing obligations, build-to-suit leases |
|
|
108,658 |
|
|
|
6,359 |
|
|
|
13,297 |
|
|
|
14,107 |
|
|
|
74,895 |
|
|
Financing obligations, other |
|
|
1,709 |
|
|
|
1,400 |
|
|
|
309 |
|
|
|
- |
|
|
|
- |
|
|
Purchase commitments |
|
|
6,570 |
|
|
|
5,602 |
|
|
|
968 |
|
|
|
- |
|
|
|
- |
|
|
Total |
|
$ |
238,360 |
|
|
$ |
19,850 |
|
|
$ |
81,581 |
|
|
$ |
22,002 |
|
|
$ |
114,927 |
|
|
(1) |
Repayment of the revolving line of credit is due at end of the term in 2020. Early repayment is allowed. Interest is paid monthly. |
Borrowing limit under our revolving line of credit agreement is $95.0 million. The agreement terminates on February 20, 2020. Borrowing capacity under this agreement is subject to a borrowing base limit that is a function of our monthly recurring revenue as adjusted to reflect lost customer revenue during the previous three calendar months. Therefore, credit available under our line of credit may be less than the $95.0 million borrowing limit. Advances under the revolving line of credit agreement bear interest at the prime rate as published in the Wall Street Journal plus a margin based on the Company’s liquidity that ranges between 0.75% and 1.25%. The Company is charged an unused line fee under this arrangement at a rate based on its liquidity of 0.300% to 0.375% per year. Any outstanding principal is due at the end of the term. Available credit was $15.7 million as of December 31, 2017.
In December 2016, we entered into a cancellable lease agreement to build additional office space on our headquarters campus. In March 2018, our landlord extended certain terms of the agreement. Under this agreement and extension, we may commence construction on or about April 1, 2019 for a target lease commencement date of July 1, 2020. We can terminate the agreement prior to April 1, 2019 subject to reimbursing the lessor for reasonable pre-agreed out-of-pocket expenses. Annual rent obligation for the first year is $4.4 million and increases 2% each subsequent year during the 15-year lease term. We can renew the lease for five, one-year terms. The aggregate minimum lease payments are approximately $75.8 million and are not reflected in the contractual obligations table above.
Off-Balance Sheet Arrangements
As of December 31, 2017, other than as disclosed in Note 15, we did not have any off-balance sheet arrangements, as defined in Item 303(a)(4)(ii) of SEC Regulation S-K, such as the use of unconsolidated subsidiaries, structured finance, or special purpose entities. We are not the primary beneficiary of, nor do we have a controlling financial interest in, any variable interest entity. Accordingly, we have not consolidated any variable interest entities.
65
Recent Accounting Pronouncements
In May 2014, the FASB issued ASU No. 2014-09, “Revenue from Contracts with Customers (Topic 606),” which amends the revenue recognition requirements in the FASB Accounting Standards Codification. Under the new standard, revenue is recognized when a customer obtains control of promised goods or services and is recognized in an amount that reflects the consideration that the entity expects to receive in exchange for those goods and services. In addition, the new standard requires disclosure of the nature, amount, timing, and uncertainty of revenue and cash flows arising from contracts with customers. The FASB has issued several amendments to the new standard, including clarification on accounting for licenses of intellectual property and identifying performance obligations.
We will adopt the new standard effective January 1, 2018 using the full retrospective transition method and recast each prior reporting period presented.
The more significant impacts of the new standard to our consolidated financial statements are currently expected to be as follows:
|
|
• |
We currently recognize revenue from certain professional services in the Carrier segment over time, which is the customer relationship period. Under the new standard, revenue from certain of these services will be recognized over the contract term of the associated software services contract, including any extension periods representing a material right, or in some cases over the period of delivery of the professional fees, both of which are typically shorter than the customer relationship period. |
|
|
• |
We currently recognize insurance broker commission revenue over the policy period. Under the new standard, the revenue related to broker commissions will be recognized when the orders for the policies are received and transferred to the insurance carrier. As a result, software services revenue from these arrangements in the Employer segment will be recognized earlier under the new standard in comparison to the current guidance. |
|
|
• |
The new standard provides guidance on accounting for certain revenue-related costs, including when to capitalize costs associated with obtaining and fulfilling a contract. The majority of these costs are currently expensed as incurred. Under the new standard, Carrier segment assets recognized for the costs to obtain a contract, which includes sales commissions, will be amortized on a systematic basis that is consistent with the transfer of the services to which the assets relate, considering anticipated renewals when applicable. Carrier segment assets recognized for costs to fulfill a contract, which include internal costs related to implementing carrier products, will be amortized on a systematic basis that is consistent with the transfer of the services to which the asset relates, which is generally expected to be five years. Costs to fulfill contracts in the Employer segment will be expensed as incurred. |
Our historical net cash flows provided by or used in operating, investing, and financing activities will not be impacted by adoption of the new revenue standard.
In June 2016, the FASB ASU No. 2016-13, “Measurement of Credit Losses on Financial Instruments.” The purpose of this ASU is to require a financial asset measured at amortized cost basis to be presented at the net amount expected to be collected. Credit losses relating to available-for-sale debt securities should be recorded through an allowance for credit losses. This ASU is effective for interim and annual reporting periods beginning after December 15, 2019. We are currently evaluating the impact of this guidance on our consolidated financial statements.
In February 2016, the FASB issued ASU No. 2016-02 “Leases (Topic 842)”. The amendments in this update require lessees, among other things, to recognize lease assets and lease liabilities on the balance sheet for those leases classified as operating leases under previous authoritative guidance. This update also introduces new disclosure requirements for leasing arrangements. ASU 2016-02 will be effective for us beginning January 1, 2019, but early adoption is permitted. We are currently evaluating the impact of this update on our consolidated financial statements.
66
We are evaluating other accounting standards and exposure drafts that have been issued or proposed by the FASB or other standards setting bodies that do not require adoption until a future date to determine whether adoption will have a material impact on our consolidated financial statements.
Item 7A. Quantitative and Qualitative Disclosures About Risk.
Market risk is the risk of loss to future earnings, values or future cash flows that may result from changes in the price of a financial instrument. The value of a financial instrument might change as a result of changes in interest rates, exchange rates, commodity prices, equity prices and other market changes. We do not use derivative financial instruments for speculative, hedging or trading purposes, although in the future we might enter into exchange rate hedging arrangements to manage the risks described below.
Interest Rate Risk
We are exposed to market risk related to changes in interest rates. Borrowings under the revolving line of credit agreement, which was entered into in February 2015 and subsequently amended, bear interest at rates that are variable. Increases in the Prime Rate would increase the interest rate on borrowings under the revolving line of credit.
Interest Rate Sensitivity
We are subject to interest rate risk in connection with borrowings under the revolving line of credit agreement, which are subject to a variable interest rate. At December 31, 2017, we had borrowings under the agreement of $56.2 million. As a result, each change of one percentage point in interest rates would result in an approximate $0.6 million increase in our annual interest expense on our outstanding borrowings at December 31, 2017. Any debt we incur in the future may also bear interest at variable rates.
Inflation Risk
We do not believe that inflation has had a material effect on our business, financial condition, or results of operations. We continue to monitor the impact of inflation in order to minimize its effects through pricing strategies, productivity improvements and cost reductions. If our costs were to become subject to significant inflationary pressures, we may not be able to fully offset such higher costs through price increases. Our inability or failure to do so could harm our business, financial condition, and results of operations.
Item 8. Financial Statements and Supplementary Data.
The information required by this Item is set forth in the Consolidated Financial Statements and Notes thereto beginning at page F-1 of this Report.
Item 9. Changes in and Disagreements With Accountants on Accounting and Financial Disclosures.
None.
Item 9A. Controls and Procedures.
Evaluation of Disclosure Controls and Procedures
Under the supervision and with the participation of our management, including our President and Chief Executive Officer and our Chief Financial Officer, we conducted an evaluation of the effectiveness of the design and operation of our disclosure controls and procedures, as defined in Rules 13a-15(e) and 15d-15(e) under the Exchange Act, as of the end of the period covered by this report.
In designing and evaluating our disclosure controls and procedures, management recognizes that any disclosure controls and procedures, no matter how well designed and operated, can provide only reasonable assurance of achieving the desired control objectives. In addition, the design of disclosure
67
controls and procedures must reflect the fact that there are resource constraints and that management is required to apply its judgment in evaluating the benefits of possible controls and procedures relative to their costs.
Based on their evaluation, our President and Chief Executive Officer and our Chief Financial Officer concluded that as of December 31, 2017 our disclosure controls and procedures are designed to, and are effective to, provide assurance at a reasonable level that the information we are required to disclose in reports that we file or submit under the Exchange Act is recorded, processed, summarized and reported within the time periods specified in SEC rules and forms, and that such information is accumulated and communicated to our management, including our President and Chief Executive Officer and our Chief Financial Officer, as appropriate, to allow timely decisions regarding required disclosures as of December 31, 2017.
Management’s Annual Report on Internal Control Over Financial Reporting
Our management, including our President and Chief Executive Officer and our Chief Financial Officer, is responsible for establishing and maintaining adequate internal control over financial reporting (as defined in Rules 13a-15(f) and 15d-15(f) under the Exchange Act). Internal control over financial reporting is a process designed to provide reasonable assurance regarding the reliability of financial reporting and the preparation of financial statements for external purposes in accordance with U.S. GAAP. Our internal control over financial reporting includes those policies and procedures that: (i) pertain to the maintenance of records that, in reasonable detail, accurately and fairly reflect the transactions and dispositions of our assets; (ii) provide reasonable assurance that transactions are recorded as necessary to permit preparation of financial statements in accordance with U.S. GAAP, and that our receipts and expenditures are being made only in accordance with authorizations of our management and directors; and (iii) provide reasonable assurance regarding prevention or timely detection of unauthorized acquisition, use, or disposition of our assets that could have a material effect on the financial statements.
Under the supervision and with the participation of our management, including our President and Chief Executive Officer and our Chief Financial Officer, we conducted an evaluation of the effectiveness of our internal control over financial reporting as of December 31, 2017, based on the Internal Control—Integrated Framework (2013) issued by the Committee of Sponsoring Organizations of the Treadway Commission (COSO) (2013 Framework). Based on this evaluation under the 2013 Framework, our President and Chief Executive Officer and our Chief Financial Officer have concluded that our internal control over financial reporting was effective as of December 31, 2017.
Changes in Internal Control Over Financial Reporting
No change in internal control over financial reporting occurred during the most recent fiscal quarter with respect to our operations, which has materially affected, or is reasonably likely to materially affect, our internal control over financial reporting.
Attestation Report of Registered Public Accounting Firm
This Annual Report on Form 10-K does not include an attestation report of our independent registered public accounting firm due to an exemption established by the JOBS Act for emerging growth companies.
On March 12, 2018, Shawn A. Jenkins informed the Company that he is resigning from the Board of Directors of the Company and from his position as Senior Advisor of Innovation of the Company, effective as of the close of business on April 1, 2018. His resignation is not related to any disagreement with the Company on any matter relating to the Company’s operations, policies or practices, but was for personal reasons.
On March 13, 2018, the Board of Directors appointed Raymond A. August, the Company’s President and Chief Executive Officer, as a Class I director, effective April 1, 2018, to hold office until the Company’s 2020 Annual Meeting of Stockholders or until his successor has been duly elected and
68
qualified. There were no arrangements or understandings between Mr. August and any other person pursuant to which Mr. August was appointed as a director of the Board. Other than his employment by the Company, there have been no transactions in which the Company has participated and in which Mr. August had a direct or indirect material interest that would be required to be disclosed under Item 404(a) of Regulation S-K.
69
Item 10. Directors, Executive Officers and Corporate Governance.
Information required by this Item concerning our directors is incorporated by reference from the sections captioned “Election of Directors” and “Corporate Governance Matters” contained in our proxy statement related to the 2018 Annual Meeting of Stockholders currently scheduled to be held on June 1, 2018 which we intend to file with the Securities and Exchange Commission within 120 days of the end of our fiscal year pursuant to General Instruction G(3) of Form 10-K.
Our board of directors has determined that of the members of the Audit Committee, Messrs. Pelzer, Swad and Dennerline are independent within the meaning of the NASDAQ Stock Market listing rules and meet the additional test for independence for audit committee members imposed by Securities and Exchange Commission regulation and the NASDAQ Stock Market listing rules. Our board has also determined that Mr. Pelzer is an “audit committee financial expert” as defined in Item 407(d)(5)(ii) of Regulation S-K.
We have adopted a code of ethics relating to the conduct of our business by all of our employees, officers, and directors, as well as a code of conduct specifically for our principal executive officer and senior financial officers. Each of these policies is posted on our website, www.benefitfocus.com.
The information required by this Item concerning our executive officers is set forth at the end of Part I of this Annual Report on Form 10-K.
The information required by this Item concerning compliance with Section 16(a) of the United States Securities Exchange Act of 1934, as amended, is incorporated by reference from the section of the proxy statement captioned “Section 16(a) Beneficial Ownership Reporting Compliance”.
Item 11. Executive Compensation.
The information required by this Item is incorporated by reference to the information under the sections captioned “Executive Compensation,” “Director Compensation” and “Compensation Committee Interlocks and Insider Participation” in the proxy statement.
Item 12. Security Ownership of Certain Beneficial Owners and Management and Related Stockholder Matters.
The following table sets forth the indicated information as of December 31, 2017 with respect to our equity compensation plans:
|
Plan Category |
|
Number of securities to be issued upon exercise of outstanding options, warrants and rights |
|
|
Weighted-average exercise price of outstanding options, warrants and rights |
|
|
Number of securities remaining available for future issuance under equity compensation plans |
|
|||
|
Equity compensation plans approved by security holders |
|
|
|
|
|
|
|
|
|
|
|
|
|
2016 Employee Stock Purchase Plan |
|
|
7,039 |
|
|
$ |
25.65 |
|
|
|
134,792 |
|
|
Amended and Restated 2012 Stock Plan |
|
|
2,115,657 |
|
|
$ |
0.95 |
|
|
|
2,632,454 |
|
|
Amended and Restated 2000 Stock Option Plan |
|
|
84,512 |
|
|
$ |
4.85 |
|
|
|
- |
|
|
Total |
|
|
2,207,208 |
|
|
$ |
1.18 |
|
|
|
2,767,246 |
|
Our equity compensation plans consist of the Benefitfocus, Inc. 2016 Employee Stock Purchase Plan, Amended and Restated 2012 Stock Plan, and the Amended and Restated 2000 Stock Option Plan, which were approved by our stockholders. We do not have any equity compensation plans or arrangements that have not been approved by our stockholders.
70
The other information required by this Item is incorporated by reference to the information under the section captioned “Security Ownership of Certain Beneficial Owners and Management” contained in the proxy statement.
Item 13. Certain Relationships and Related Transactions, and Director Independence.
The information required by this Item is incorporated by reference to the information under the section captioned “Certain Relationships and Related Party Transactions” and “Corporate Governance Matters” in the proxy statement.
Item 14. Principal Accounting Fees and Services.
The information required by this Item is incorporated by reference to the information under the section captioned “Audit Committee Report” in the proxy statement.
71
Item 15. Exhibits, Financial Statement Schedules.
(a) 1. Financial Statements.
The following statements are filed as part of this Annual Report on Form 10-K:
|
AUDITED CONSOLIDATED FINANCIAL STATEMENTS |
|
|
|
|
|
|
|
|
F-2 |
|
|
|
|
|
|
Consolidated Balance Sheets as of December 31, 2017 and 2016 |
|
F-3 |
|
|
|
|
|
|
F-4 |
|
|
|
|
|
|
|
F-5 |
|
|
|
|
|
|
Consolidated Statements of Cash Flows for the Years Ended December 31, 2017, 2016 and 2015 |
|
F-6 |
|
|
|
|
|
|
F-7 |
|
|
|
|
|
|
2. Financial Statement Schedules. |
|
|
|
|
|
|
|
|
F-31 |
Schedules not listed above have been omitted because the information required to be set forth therein is not applicable or is shown in the financial statements or notes thereto.
(b) Exhibits.
|
|
|
|
|
Incorporated by Reference (Unless Otherwise Indicated) |
||||||
|
Exhibit Number |
|
Exhibit Title |
|
Form |
|
File |
|
Exhibit |
|
Filing Date |
|
2.1 |
|
|
S-1/A |
|
333-190610 |
|
2.1 |
|
September 5, 2013 |
|
|
|
|
|
|
|
|
|
|
|
|
|
|
3.1 |
|
|
10-Q |
|
— |
|
3.1.3 |
|
November 12, 2013 |
|
|
|
|
|
|
|
|
|
|
|
|
|
|
3.2 |
|
|
8-K |
|
— |
|
3.2.1 |
|
September 19, 2016 |
|
|
|
|
|
|
|
|
|
|
|
|
|
|
4.1 |
|
|
S-1/A |
|
333-190610 |
|
4.1 |
|
September 5, 2013 |
|
|
|
|
|
|
|
|
|
|
|
|
|
|
4.2 |
|
|
S-1/A |
|
333-190610 |
|
4.3 |
|
September 16, 2013 |
|
|
|
|
|
|
|
|
|
|
|
|
|
72
|
|
|
10-K |
|
— |
|
4.3.1 |
|
February 27, 2015 |
||
|
|
|
|
|
|
|
|
|
|
|
|
|
4.3 |
|
Warrant for the Purchase of Shares of Common Stock of Benefitfocus, Inc. issued February 24, 2015. |
|
10-K |
|
— |
|
4.5 |
|
February 27, 2015 |
|
|
|
|
|
|
|
|
|
|
|
|
|
10.1 |
|
|
S-1/A |
|
333-190610 |
|
10.2 |
|
September 5, 2013 |
|
|
|
|
|
|
|
|
|
|
|
|
|
|
10.2 |
|
|
S-1 |
|
333-190610 |
|
10.3 |
|
August 14, 2013 |
|
|
|
|
|
|
|
|
|
|
|
|
|
|
10.3 |
|
|
S-1 |
|
333-190610 |
|
10.5 |
|
August 14, 2013 |
|
|
|
|
|
|
|
|
|
|
|
|
|
|
10.4 |
|
Form of Grant Notice and Stock Option Agreement under the 2012 Stock Plan, as amended.# |
|
S-1 |
|
333-190610 |
|
10.6 |
|
August 14, 2013 |
|
|
|
|
|
|
|
|
|
|
|
|
|
10.5 |
|
|
S-1 |
|
333-190610 |
|
10.7 |
|
August 14, 2013 |
|
|
|
|
|
|
|
|
|
|
|
|
|
|
10.5.1 |
|
|
DEF 14A |
|
— |
|
— |
|
April 25, 2014 |
|
|
|
|
|
|
|
|
|
|
|
|
|
|
10.6 |
|
|
S-1 |
|
333-190610 |
|
10.8 |
|
August 14, 2013 |
|
|
|
|
|
|
|
|
|
|
|
|
|
|
10.7 |
|
|
S-1 |
|
333-190610 |
|
10.9 |
|
August 14, 2013 |
|
|
|
|
|
|
|
|
|
|
|
|
|
|
10.7.1 |
|
|
— |
|
— |
|
— |
|
Filed herewith |
|
|
|
|
|
|
|
|
|
|
|
|
|
|
10.8 |
|
|
S-1 |
|
333-190610 |
|
10.11 |
|
August 14, 2013 |
|
|
|
|
|
|
|
|
|
|
|
|
|
|
10.9 |
|
|
S-1 |
|
333-190610 |
|
10.12 |
|
August 14, 2013 |
|
|
|
|
|
|
|
|
|
|
|
|
|
|
10.10 |
|
|
S-1 |
|
333-190610 |
|
10.13 |
|
August 14, 2013 |
|
|
|
|
|
|
|
|
|
|
|
|
|
73
|
|
|
8-K |
|
— |
|
10.13.1 |
|
December 14, 2016 |
||
|
|
|
|
|
|
|
|
|
|
|
|
|
10.11 |
|
|
S-1 |
|
333-190610 |
|
10.14 |
|
August 14, 2013 |
|
|
|
|
|
|
|
|
|
|
|
|
|
|
10.11.1 |
|
|
8-K |
|
— |
|
10.14.1 |
|
December 14, 2016 |
|
|
|
|
|
|
|
|
|
|
|
|
|
|
10.12 |
|
|
S-1 |
|
333-190610 |
|
10.15 |
|
August 14, 2013 |
|
|
|
|
|
|
|
|
|
|
|
|
|
|
10.13 |
|
Lease between DIEC II, LLC and Benefitfocus.com, Inc., dated as of December 13, 2013. |
|
10-K |
|
— |
|
10.19 |
|
March 21, 2014 |
|
|
|
|
|
|
|
|
|
|
|
|
|
10.13.1 |
|
Amendment to Lease between DIEC II, LLC and Benefitfocus.com, Inc., dated as of December 12, 2016. |
|
8-K |
|
— |
|
10.16.1 |
|
December 14, 2016 |
|
|
|
|
|
|
|
|
|
|
|
|
|
10.14 |
|
|
DEF 14A |
|
— |
|
— |
|
April 25, 2014 |
|
|
|
|
|
|
|
|
|
|
|
|
|
|
10.15 |
|
|
8-K |
|
— |
|
10.21 |
|
June 23, 2014 |
|
|
|
|
|
|
|
|
|
|
|
|
|
|
10.16 |
|
|
10-K |
|
— |
|
10.20 |
|
February 27, 2015 |
|
|
|
|
|
|
|
|
|
|
|
|
|
|
10.17 |
|
|
10-K |
|
— |
|
10.21 |
|
February 27, 2015 |
|
|
|
|
|
|
|
|
|
|
|
|
|
74
|
|
Employment Agreement, dated June 25, 2014, by and between Benefitfocus.com, Inc. and Ray August.# |
|
8-K |
|
— |
|
10.22 |
|
April 8, 2015 |
|
|
|
|
|
|
|
|
|
|
|
|
|
|
10.18.1 |
|
|
— |
|
— |
|
— |
|
Filed herewith |
|
|
|
|
|
|
|
|
|
|
|
|
|
|
10.19 |
|
|
10-Q |
|
— |
|
10.23 |
|
May 6, 2015 |
|
|
|
|
|
|
|
|
|
|
|
|
|
|
10.19.1 |
|
|
8-K |
|
— |
|
10.25 |
|
June 16, 2015 |
|
|
|
|
|
|
|
|
|
|
|
|
|
|
10.19.2 |
|
|
10-K |
|
— |
|
10.23 |
|
February 25, 2016 |
|
|
|
|
|
|
|
|
|
|
|
|
|
|
10.19.3 |
|
|
8-K |
|
— |
|
10.26 |
|
March 29, 2016 |
|
|
|
|
|
|
|
|
|
|
|
|
|
75
|
|
|
8-K |
|
— |
|
10.29 |
|
October 31, 2016 |
||
|
|
|
|
|
|
|
|
|
|
|
|
|
10.19.5 |
|
|
8-K |
|
— |
|
10.32 |
|
December 14, 2016 |
|
|
|
|
|
|
|
|
|
|
|
|
|
|
10.19.6 |
|
|
10-Q |
|
— |
|
10.20.6 |
|
April 28, 2017 |
|
|
|
|
|
|
|
|
|
|
|
|
|
|
10.20 |
|
|
10-Q |
|
— |
|
10.24 |
|
May 6, 2015 |
|
|
|
|
|
|
|
|
|
|
|
|
|
|
10.21 |
|
|
10-Q |
|
— |
|
10.26 |
|
May 5, 2016 |
|
|
|
|
|
|
|
|
|
|
|
|
|
|
10.22 |
|
|
DEF14A |
|
— |
|
— |
|
April 22, 2016 |
|
|
|
|
|
|
|
|
|
|
|
|
|
|
10.23 |
|
|
8-K |
|
— |
|
10.28 |
|
September 1, 2016 |
|
|
|
|
|
|
|
|
|
|
|
|
|
76
|
|
|
10-Q |
|
— |
|
10.30 |
|
November 4, 2016 |
||
|
|
|
|
|
|
|
|
|
|
|
|
|
10.25 |
|
Lease between DIEC II, LLC and Benefitfocus.com, Inc., dated as of December 12, 2016. |
|
8-K |
|
— |
|
10.31 |
|
December 14, 2016 |
|
|
|
|
|
|
|
|
|
|
|
|
|
10.26 |
|
Employment Agreement, dated June 30, 2017, by and between Benefitfocus.com and Jonathon Dussault.# |
|
10-Q |
|
— |
|
10.29 |
|
August 8, 2017 |
|
|
|
|
|
|
|
|
|
|
|
|
|
21.1 |
|
|
— |
|
— |
|
— |
|
Filed herewith |
|
|
|
|
|
|
|
|
|
|
|
|
|
|
23.1 |
|
|
— |
|
— |
|
— |
|
Filed herewith |
|
|
|
|
|
|
|
|
|
|
|
|
|
|
31.1 |
|
|
— |
|
— |
|
— |
|
Filed herewith |
|
|
|
|
|
|
|
|
|
|
|
|
|
|
31.2 |
|
|
— |
|
— |
|
— |
|
Filed herewith |
|
|
|
|
|
|
|
|
|
|
|
|
|
|
32.1 |
|
|
— |
|
— |
|
— |
|
Filed herewith |
|
|
|
|
|
|
|
|
|
|
|
|
|
|
101.INS |
|
XBRL Instance Document. |
|
— |
|
— |
|
— |
|
Filed herewith |
|
|
|
|
|
|
|
|
|
|
|
|
|
101.SCH |
|
XBRL Taxonomy Extension Schema Document. |
|
— |
|
— |
|
— |
|
Filed herewith |
|
|
|
|
|
|
|
|
|
|
|
|
|
101.CAL |
|
XBRL Taxonomy Extension Calculation Linkbase Document. |
|
— |
|
— |
|
— |
|
Filed herewith |
|
|
|
|
|
|
|
|
|
|
|
|
|
101.DEF |
|
XBRL Taxonomy Extension Definition Linkbase Document. |
|
— |
|
— |
|
— |
|
Filed herewith |
|
|
|
|
|
|
|
|
|
|
|
|
|
101.LAB |
|
XBRL Taxonomy Extension Label Linkbase Document. |
|
— |
|
— |
|
— |
|
Filed herewith |
|
|
|
|
|
|
|
|
|
|
|
|
|
101.PRE |
|
XBRL Taxonomy Extension Presentation Linkbase Document. |
|
— |
|
— |
|
— |
|
Filed herewith |
___________
# Management contract or compensatory plan.
+ The registrant has received confidential treatment with respect to portions of this exhibit. Those portions have been omitted from the exhibit and filed separately with the U.S. Securities and Exchange Commission.
77
None.
78
Pursuant to the requirements of Sections 13 or 15(d) of the Securities Exchange Act of 1934, the Registrant has duly caused this report to be signed on its behalf by the undersigned, thereunto duly authorized.
|
|
|
Benefitfocus, Inc. |
||
|
|
|
|
|
|
|
Date: March 15, 2018 |
|
By: |
|
/s/ Jonathon E. Dussault |
|
|
|
|
|
Jonathon E. Dussault |
|
|
|
|
|
Chief Financial Officer |
Pursuant to the requirements of the Securities Exchange Act of 1934, this report has been signed by the following persons on behalf of the Registrant and in the capacities and on the dates indicated.
|
Signature |
|
Capacity |
|
Date |
|
|
|
|
|
|
|
/s/ Mason R. Holland, Jr. |
|
Chairman of the Board of Directors |
|
March 15, 2018 |
|
Mason R. Holland, Jr. |
|
|
|
|
|
|
|
|
|
|
|
/s/ Raymond A. August |
|
President and Chief Executive Officer (principal |
|
March 15, 2018 |
|
Raymond A. August |
|
executive officer) |
|
|
|
|
|
|
|
|
|
/s/ Jonathon E. Dussault |
|
Chief Financial Officer (principal financial and |
|
March 15, 2018 |
|
Jonathon E. Dussault |
|
accounting officer) |
|
|
|
|
|
|
|
|
|
/s/ Douglas A. Dennerline |
|
Director |
|
March 15, 2018 |
|
Douglas A. Dennerline |
|
|
|
|
|
|
|
|
|
|
|
/s/ Joseph P. DiSabato |
|
Director |
|
March 15, 2018 |
|
Joseph P. DiSabato |
|
|
|
|
|
|
|
|
|
|
|
/s/ Shawn A. Jenkins |
|
Director |
|
March 15, 2018 |
|
Shawn A. Jenkins |
|
|
|
|
|
|
|
|
|
|
|
/s/ A. Lanham Napier |
|
Director |
|
March 15, 2018 |
|
A. Lanham Napier |
|
|
|
|
|
|
|
|
|
|
|
/s/ Francis J. Pelzer V |
|
Director |
|
March 15, 2018 |
|
Francis J. Pelzer V |
|
|
|
|
|
|
|
|
|
|
|
/s/ Stephen M. Swad |
|
Director |
|
March 15, 2018 |
|
Stephen M. Swad |
|
|
|
|
79
INDEX TO CONSOLIDATED FINANCIAL STATEMENTS
|
AUDITED CONSOLIDATED FINANCIAL STATEMENTS |
|
|
|
|
|
|
|
|
F-2 |
|
|
|
|
|
|
Consolidated Balance Sheets as of December 31, 2017 and 2016 |
|
F-3 |
|
|
|
|
|
|
F-4 |
|
|
|
|
|
|
|
F-5 |
|
|
|
|
|
|
Consolidated Statements of Cash Flows for the Years Ended December 31, 2017, 2016 and 2015 |
|
F-6 |
|
|
|
|
|
|
F-7 |
|
|
|
|
|
|
CONSOLIDATED FINANCIAL STATEMENT SCHEDULE |
|
|
|
|
|
|
|
|
F-31 |
F-1
Report of Independent Registered Public Accounting Firm
To the Stockholders and the Board of Directors of Benefitfocus, Inc.
Opinion on the Financial Statements
We have audited the accompanying consolidated balance sheets of Benefitfocus, Inc. (the Company) as of December 31, 2017 and 2016, the related consolidated statements of operations and comprehensive loss, changes in stockholders' deficit and cash flows for each of the three years in the period ended December 31, 2017, and the related notes and the financial statement schedule listed in the Index at Item 15(a)(2) (collectively referred to as the “consolidated financial statements”). In our opinion, the consolidated financial statements present fairly, in all material respects, the financial position of the Company at December 31, 2017 and 2016, and the results of its operations and its cash flows for each of the three years in the period ended December 31, 2017, in conformity with U.S. generally accepted accounting principles.
Basis for Opinion
These financial statements are the responsibility of the Company's management. Our responsibility is to express an opinion on the Company’s financial statements based on our audits. We are a public accounting firm registered with the Public Company Accounting Oversight Board (United States) (PCAOB) and are required to be independent with respect to the Company in accordance with the U.S. federal securities laws and the applicable rules and regulations of the Securities and Exchange Commission and the PCAOB.
We conducted our audits in accordance with the standards of the PCAOB. Those standards require that we plan and perform the audit to obtain reasonable assurance about whether the financial statements are free of material misstatement, whether due to error or fraud. The Company is not required to have, nor were we engaged to perform, an audit of its internal control over financial reporting. As part of our audits we are required to obtain an understanding of internal control over financial reporting but not for the purpose of expressing an opinion on the effectiveness of the Company's internal control over financial reporting. Accordingly, we express no such opinion.
Our audits included performing procedures to assess the risks of material misstatement of the financial statements, whether due to error or fraud, and performing procedures that respond to those risks. Such procedures included examining, on a test basis, evidence regarding the amounts and disclosures in the financial statements. Our audits also included evaluating the accounting principles used and significant estimates made by management, as well as evaluating the overall presentation of the financial statements. We believe that our audits provide a reasonable basis for our opinion.
/s/ Ernst & Young LLP
We have served as the Company’s auditor since 2008.
Raleigh, North Carolina
March 15, 2018
F-2
(in thousands, except share and per share data)
|
|
|
As of December 31, |
|
|||||
|
|
|
2017 |
|
|
2016 |
|
||
|
Assets |
|
|
|
|
|
|
|
|
|
Current assets: |
|
|
|
|
|
|
|
|
|
Cash and cash equivalents |
|
$ |
55,335 |
|
|
$ |
56,853 |
|
|
Marketable securities |
|
|
– |
|
|
|
2,007 |
|
|
Accounts receivable, net |
|
|
30,156 |
|
|
|
28,340 |
|
|
Accounts receivable, related party, net |
|
|
– |
|
|
|
4,626 |
|
|
Prepaid expenses and other current assets |
|
|
4,337 |
|
|
|
4,449 |
|
|
Total current assets |
|
|
89,828 |
|
|
|
96,275 |
|
|
Property and equipment, net |
|
|
72,681 |
|
|
|
80,518 |
|
|
Intangible assets, net |
|
|
150 |
|
|
|
408 |
|
|
Goodwill |
|
|
1,634 |
|
|
|
1,634 |
|
|
Other non-current assets |
|
|
816 |
|
|
|
1,575 |
|
|
Total assets |
|
$ |
165,109 |
|
|
$ |
180,410 |
|
|
Liabilities and stockholders' deficit |
|
|
|
|
|
|
|
|
|
Current liabilities: |
|
|
|
|
|
|
|
|
|
Accounts payable |
|
$ |
4,260 |
|
|
$ |
5,829 |
|
|
Accrued expenses |
|
|
9,136 |
|
|
|
10,867 |
|
|
Accrued compensation and benefits |
|
|
14,250 |
|
|
|
17,347 |
|
|
Deferred revenue, current portion |
|
|
38,821 |
|
|
|
35,426 |
|
|
Revolving line of credit, current portion |
|
|
24,000 |
|
|
|
20,000 |
|
|
Financing and capital lease obligations, current portion |
|
|
3,423 |
|
|
|
2,604 |
|
|
Total current liabilities |
|
|
93,890 |
|
|
|
92,073 |
|
|
Deferred revenue, net of current portion |
|
|
19,898 |
|
|
|
40,412 |
|
|
Revolving line of credit, net of current portion |
|
|
32,246 |
|
|
|
20,246 |
|
|
Financing and capital lease obligations, net of current portion |
|
|
55,597 |
|
|
|
57,934 |
|
|
Other non-current liabilities |
|
|
2,809 |
|
|
|
3,056 |
|
|
Total liabilities |
|
|
204,440 |
|
|
|
213,721 |
|
|
Commitments and contingencies |
|
|
|
|
|
|
|
|
|
Stockholders' deficit: |
|
|
|
|
|
|
|
|
|
Preferred stock, par value $0.001, 5,000,000 shares authorized, no shares issued and outstanding at December 31, 2017 and 2016 |
|
|
- |
|
|
|
- |
|
|
Common stock, par value $0.001, 50,000,000 shares authorized, 31,307,989 and 30,429,014 shares issued and outstanding at December 31, 2017 and 2016, respectively |
|
|
31 |
|
|
|
30 |
|
|
Additional paid-in capital |
|
|
355,301 |
|
|
|
335,059 |
|
|
Accumulated deficit |
|
|
(394,663 |
) |
|
|
(368,400 |
) |
|
Total stockholders' deficit |
|
|
(39,331 |
) |
|
|
(33,311 |
) |
|
Total liabilities and stockholders' deficit |
|
$ |
165,109 |
|
|
$ |
180,410 |
|
The accompanying notes are an integral part of the Consolidated Financial Statements.
F-3
CONSOLIDATED STATEMENTS OF OPERATIONS AND COMPREHENSIVE LOSS
(in thousands, except share and per share data)
|
|
|
Year Ended December 31, |
|
||||||||||
|
|
|
|
2017 |
|
|
2016 |
|
|
2015 |
|
|||
|
Revenue |
|
|
$ |
256,735 |
|
|
$ |
233,335 |
|
|
$ |
185,143 |
|
|
Cost of revenue |
|
|
|
124,156 |
|
|
|
120,681 |
|
|
|
102,851 |
|
|
Gross profit |
|
|
|
132,579 |
|
|
|
112,654 |
|
|
|
82,292 |
|
|
Operating expenses: |
|
|
|
|
|
|
|
|
|
|
|
|
|
|
Sales and marketing |
|
|
|
69,280 |
|
|
|
55,488 |
|
|
|
58,589 |
|
|
Research and development |
|
|
|
49,549 |
|
|
|
56,584 |
|
|
|
52,250 |
|
|
General and administrative |
|
|
|
27,268 |
|
|
|
32,750 |
|
|
|
25,727 |
|
|
Total operating expenses |
|
|
|
146,097 |
|
|
|
144,822 |
|
|
|
136,566 |
|
|
Loss from operations |
|
|
|
(13,518 |
) |
|
|
(32,168 |
) |
|
|
(54,274 |
) |
|
Other income (expense): |
|
|
|
|
|
|
|
|
|
|
|
|
|
|
Interest income |
|
|
|
182 |
|
|
|
138 |
|
|
|
188 |
|
|
Interest expense on building lease financing obligations |
|
|
|
(7,450 |
) |
|
|
(6,826 |
) |
|
|
(7,092 |
) |
|
Interest expense on other borrowings |
|
|
|
(4,931 |
) |
|
|
(1,095 |
) |
|
|
(877 |
) |
|
Other expense |
|
|
|
(140 |
) |
|
|
(90 |
) |
|
|
(4 |
) |
|
Total other expense, net |
|
|
|
(12,339 |
) |
|
|
(7,873 |
) |
|
|
(7,785 |
) |
|
Loss before income taxes |
|
|
|
(25,857 |
) |
|
|
(40,041 |
) |
|
|
(62,059 |
) |
|
Income tax expense |
|
|
|
15 |
|
|
|
17 |
|
|
|
25 |
|
|
Net loss |
|
|
$ |
(25,872 |
) |
|
$ |
(40,058 |
) |
|
$ |
(62,084 |
) |
|
Comprehensive loss |
|
|
$ |
(25,872 |
) |
|
$ |
(40,058 |
) |
|
$ |
(62,084 |
) |
|
Net loss per common share: |
|
|
|
|
|
|
|
|
|
|
|
|
|
|
Basic and diluted |
|
|
$ |
(0.83 |
) |
|
$ |
(1.35 |
) |
|
$ |
(2.19 |
) |
|
Weighted-average common shares outstanding: |
|
|
|
|
|
|
|
|
|
|
|
|
|
|
Basic and diluted |
|
|
|
31,052,378 |
|
|
|
29,589,857 |
|
|
|
28,344,680 |
|
The accompanying notes are an integral part of the Consolidated Financial Statements.
F-4
CONSOLIDATED STATEMENTS OF CHANGES IN STOCKHOLDERS’ DEFICIT
(in thousands, except share and per share data)
|
|
|
Common Stock, |
|
|
Additional |
|
|
|
|
|
|
Total |
|
|||||||
|
|
|
$0.001 Par Value |
|
|
Paid-in |
|
|
Accumulated |
|
|
Stockholders' |
|
||||||||
|
|
|
Shares |
|
|
Par Value |
|
|
Capital |
|
|
Deficit |
|
|
Deficit |
|
|||||
|
Balance, December 31, 2014 |
|
|
25,608,937 |
|
|
$ |
26 |
|
|
$ |
223,409 |
|
|
$ |
(266,258 |
) |
|
$ |
(42,823 |
) |
|
Exercise of stock options |
|
|
656,043 |
|
|
|
– |
|
|
|
4,229 |
|
|
|
– |
|
|
|
4,229 |
|
|
Issuance of common stock upon vesting of restricted stock units, net of shares surrendered for taxes |
|
|
111,826 |
|
|
|
– |
|
|
|
(2,116 |
) |
|
|
– |
|
|
|
(2,116 |
) |
|
Issuance of common stock for cashless exercise of warrant |
|
|
2,817,526 |
|
|
|
3 |
|
|
|
74,328 |
|
|
|
– |
|
|
|
74,331 |
|
|
Stock-based compensation expense |
|
|
– |
|
|
|
– |
|
|
|
10,454 |
|
|
|
– |
|
|
|
10,454 |
|
|
Net loss |
|
|
– |
|
|
|
– |
|
|
|
– |
|
|
|
(62,084 |
) |
|
|
(62,084 |
) |
|
Balance, December 31, 2015 |
|
|
29,194,332 |
|
|
$ |
29 |
|
|
$ |
310,304 |
|
|
$ |
(328,342 |
) |
|
$ |
(18,009 |
) |
|
Exercise of stock options |
|
|
944,706 |
|
|
|
1 |
|
|
|
6,869 |
|
|
|
– |
|
|
|
6,870 |
|
|
Issuance of common stock upon vesting of restricted stock units, net of shares surrendered for taxes |
|
|
289,976 |
|
|
|
– |
|
|
|
(202 |
) |
|
|
– |
|
|
|
(202 |
) |
|
Stock-based compensation expense |
|
|
– |
|
|
|
– |
|
|
|
18,088 |
|
|
|
– |
|
|
|
18,088 |
|
|
Net loss |
|
|
– |
|
|
|
– |
|
|
|
– |
|
|
|
(40,058 |
) |
|
|
(40,058 |
) |
|
Balance, December 31, 2016 |
|
|
30,429,014 |
|
|
$ |
30 |
|
|
$ |
335,059 |
|
|
$ |
(368,400 |
) |
|
$ |
(33,311 |
) |
|
Cumulative effect adjustment from adoption of new accounting standard |
|
|
– |
|
|
|
– |
|
|
|
391 |
|
|
|
(391 |
) |
|
|
– |
|
|
Exercise of stock options |
|
|
463,870 |
|
|
|
1 |
|
|
|
3,457 |
|
|
|
– |
|
|
|
3,458 |
|
|
Issuance of common stock upon vesting of restricted stock units |
|
|
406,936 |
|
|
|
– |
|
|
|
– |
|
|
|
– |
|
|
|
– |
|
|
Issuance of common stock under Employee Stock Purchase Plan, or ESPP |
|
|
8,169 |
|
|
|
– |
|
|
|
257 |
|
|
|
– |
|
|
|
257 |
|
|
Stock-based compensation expense |
|
|
– |
|
|
|
– |
|
|
|
16,137 |
|
|
|
– |
|
|
|
16,137 |
|
|
Net loss |
|
|
– |
|
|
|
– |
|
|
|
– |
|
|
|
(25,872 |
) |
|
|
(25,872 |
) |
|
Balance, December 31, 2017 |
|
|
31,307,989 |
|
|
$ |
31 |
|
|
$ |
355,301 |
|
|
$ |
(394,663 |
) |
|
$ |
(39,331 |
) |
The accompanying notes are an integral part of the Consolidated Financial Statements.
F-5
CONSOLIDATED STATEMENTS OF CASH FLOWS
(in thousands)
|
|
|
Year Ended December 31, |
|
|||||||||
|
|
|
|
2017 |
|
|
|
2016 |
|
|
|
2015 |
|
|
Cash flows from operating activities |
|
|
|
|
|
|
|
|
|
|
|
|
|
Net loss |
|
$ |
(25,872 |
) |
|
$ |
(40,058 |
) |
|
$ |
(62,084 |
) |
|
Adjustments to reconcile net loss to net cash and cash equivalents used in operating activities: |
|
|
|
|
|
|
|
|
|
|
|
|
|
Depreciation and amortization |
|
|
15,906 |
|
|
|
13,073 |
|
|
|
11,664 |
|
|
Stock-based compensation expense |
|
|
16,137 |
|
|
|
18,088 |
|
|
|
10,454 |
|
|
Interest accrual on financing obligations |
|
|
7,500 |
|
|
|
6,827 |
|
|
|
7,092 |
|
|
Provision for doubtful accounts |
|
|
75 |
|
|
|
667 |
|
|
|
22 |
|
|
Loss on disposal or impairment of property and equipment |
|
|
157 |
|
|
|
141 |
|
|
|
18 |
|
|
Changes in operating assets and liabilities: |
|
|
|
|
|
|
|
|
|
|
|
|
|
Accounts receivable, net |
|
|
2,735 |
|
|
|
(3,936 |
) |
|
|
(7,800 |
) |
|
Accrued interest on short-term investments |
|
|
7 |
|
|
|
220 |
|
|
|
205 |
|
|
Prepaid expenses and other current assets |
|
|
112 |
|
|
|
1,626 |
|
|
|
(1,328 |
) |
|
Other non-current assets |
|
|
759 |
|
|
|
339 |
|
|
|
1,380 |
|
|
Accounts payable |
|
|
(1,372 |
) |
|
|
(1,849 |
) |
|
|
3,418 |
|
|
Accrued expenses |
|
|
(1,617 |
) |
|
|
990 |
|
|
|
2,961 |
|
|
Accrued compensation and benefits |
|
|
(3,097 |
) |
|
|
(3,337 |
) |
|
|
3,310 |
|
|
Deferred revenue |
|
|
(17,119 |
) |
|
|
(17,690 |
) |
|
|
(1,189 |
) |
|
Other non-current liabilities |
|
|
(248 |
) |
|
|
2,073 |
|
|
|
332 |
|
|
Net cash and cash equivalents used in operating activities |
|
|
(5,937 |
) |
|
|
(22,826 |
) |
|
|
(31,545 |
) |
|
Cash flows from investing activities |
|
|
|
|
|
|
|
|
|
|
|
|
|
Purchases of short-term investments held to maturity |
|
|
– |
|
|
|
(2,004 |
) |
|
|
(68,185 |
) |
|
Proceeds from short-term investments held to maturity |
|
|
2,000 |
|
|
|
40,225 |
|
|
|
32,667 |
|
|
Purchases of property and equipment |
|
|
(8,279 |
) |
|
|
(12,705 |
) |
|
|
(14,727 |
) |
|
Net cash and cash equivalents (used in) provided by investing activities |
|
|
(6,279 |
) |
|
|
25,516 |
|
|
|
(50,245 |
) |
|
Cash flows from financing activities |
|
|
|
|
|
|
|
|
|
|
|
|
|
Draws on revolving line of credit |
|
|
105,000 |
|
|
|
84,000 |
|
|
|
57,492 |
|
|
Payments on revolving line of credit |
|
|
(89,000 |
) |
|
|
(74,000 |
) |
|
|
(44,903 |
) |
|
Proceeds from exercises of stock options and ESPP |
|
|
3,715 |
|
|
|
6,870 |
|
|
|
4,229 |
|
|
Proceeds from issuance of common stock and warrant, net of issuance costs |
|
|
– |
|
|
|
– |
|
|
|
74,538 |
|
|
Payments of deferred financing costs and debt issuance costs |
|
|
– |
|
|
|
(379 |
) |
|
|
(566 |
) |
|
Remittance of taxes upon vesting of restricted stock units |
|
|
– |
|
|
|
(202 |
) |
|
|
(2,116 |
) |
|
Payments on financing and capital lease obligations |
|
|
(9,017 |
) |
|
|
(10,200 |
) |
|
|
(9,884 |
) |
|
Net cash and cash equivalents provided by financing activities |
|
|
10,698 |
|
|
|
6,089 |
|
|
|
78,790 |
|
|
Net (decrease) increase in cash and cash equivalents |
|
|
(1,518 |
) |
|
|
8,779 |
|
|
|
(3,000 |
) |
|
Cash and cash equivalents, beginning of year |
|
|
56,853 |
|
|
|
48,074 |
|
|
|
51,074 |
|
|
Cash and cash equivalents, end of year |
|
$ |
55,335 |
|
|
$ |
56,853 |
|
|
$ |
48,074 |
|
|
|
|
|
|
|
|
|
|
|
|
|
|
|
|
Supplemental disclosure of non-cash investing and financing activities |
|
|
|
|
|
|
|
|
|
|
|
|
|
Property and equipment purchases in accounts payable and accrued expenses |
|
$ |
389 |
|
|
$ |
699 |
|
|
$ |
1,489 |
|
|
Property and equipment purchased with financing and capital lease obligations |
|
$ |
- |
|
|
$ |
28,032 |
|
|
$ |
914 |
|
|
Post contract support purchased with financing obligations |
|
$ |
- |
|
|
$ |
1,048 |
|
|
$ |
272 |
|
|
Allocation of proceeds to deferred revenue from issuance of common stock based on relative selling price |
|
$ |
- |
|
|
$ |
- |
|
|
$ |
207 |
|
|
Supplemental disclosure of cash flow information |
|
|
|
|
|
|
|
|
|
|
|
|
|
Income taxes paid |
|
$ |
14 |
|
|
$ |
7 |
|
|
$ |
18 |
|
|
Interest paid |
|
$ |
10,911 |
|
|
$ |
6,655 |
|
|
$ |
6,525 |
|
The accompanying notes are an integral part of the Consolidated Financial Statements
F-6
NOTES TO CONSOLIDATED FINANCIAL STATEMENTS
(thousands, except share and per share data)
1. Organization and Description of Business
Benefitfocus, Inc. (the “Company”) provides a leading cloud-based benefits management platform for consumers, employers, insurance carriers and brokers under a software-as-a-service (“SaaS”) model. The financial statements of the Company include the financial position and operations of its wholly owned subsidiaries, Benefitfocus.com, Inc. and BenefitStore, Inc.
2. Summary of Significant Accounting Policies
Principles of Consolidation
These consolidated financial statements have been prepared in accordance with U.S. generally accepted accounting principles (“GAAP”). The consolidated financial statements include the accounts of the Company and its wholly owned subsidiaries. All intercompany accounts and transactions have been eliminated in consolidation. The Company is not the primary beneficiary of, nor does it have a controlling financial interest in, any variable interest entity. Accordingly, the Company has not consolidated any variable interest entity.
Use of Estimates
The preparation of financial statements in conformity with GAAP requires the Company to make estimates and assumptions that affect the reported amounts in the consolidated financial statements and accompanying notes. Such estimates include revenue recognition and the customer relationship period, allowances for doubtful accounts and returns, valuations of deferred income taxes, long-lived assets, warrants, capitalizable software development costs and the related amortization, stock-based compensation, the determination of the useful lives of assets, and the impairment assessment of acquired intangibles and goodwill. Determination of these transactions and account balances are based on the Company’s estimates and judgments. These estimates are based on the Company’s knowledge of current events and actions it may undertake in the future as well as on various other assumptions that it believes to be reasonable. Actual results could differ materially from these estimates.
Revenue and Deferred Revenue
The Company derives the majority of its revenue from software services fees, which consist primarily of monthly subscription fees paid by customers for access to and usage of the Company’s cloud-based benefits software solutions for a specified contract term. The Company also derives revenue from professional services which primarily include fees related to the integration of customers’ systems with the Company’s platform, which typically includes discovery, configuration, deployment, testing, and training.
The Company recognizes revenue when there is persuasive evidence of an arrangement, the service has been provided, the fees to be paid by the customer are fixed and determinable and collectability is reasonably assured. The Company considers delivery of its cloud-based software services has commenced once access to a configured and live instance to its platform has been granted to the customer.
The Company’s arrangements generally contain multiple elements comprised of software services and professional services. The Company evaluates each element in an arrangement to determine whether it represents a separate unit of accounting. An element constitutes a separate unit of accounting when the delivered item has standalone value and delivery of the undelivered element is probable and within the Company’s control.
When multiple deliverables included in an arrangement are separable into different units of accounting, the arrangement consideration is allocated to the identified units of accounting based on their relative selling price. Multiple deliverable arrangements accounting guidance provides a hierarchy to use when determining the relative selling price for each unit of accounting. Vendor-specific objective evidence
F-7
BENEFITFOCUS, INC.
NOTES TO CONSOLIDATED FINANCIAL STATEMENTS
(thousands, except share and per share data)
(“VSOE”) of selling price, based on the price at which the item is regularly sold by the vendor on a standalone basis, should be used if it exists. If VSOE of selling price is not available, third-party evidence (“TPE”) of selling price is used to establish the selling price if it exists. VSOE and TPE do not currently exist for any of the Company’s deliverables. Accordingly, for arrangements with multiple deliverables that can be separated into different units of accounting, the arrangement consideration is allocated to the separate units of accounting based on the Company’s best estimate of selling price. The amount of arrangement consideration allocated is limited by contingent revenues, if any.
Effective July 1, 2015, the Company determined it had established standalone value for Benefitfocus Marketplace implementation services in the Employer segment as they can be sold separately from the software services. This was primarily due to the system integrators that have been trained and certified to perform these implementation services, the successful completion of an implementation by a trained system integrator, and the sale of several software subscription arrangements to customers in the Employer segment without the Company’s implementation services. Accordingly, revenues related to implementation services for the Benefitfocus Marketplace solution in the Employer segment that are delivered after July 1, 2015 are recognized separately from the revenues earned from the Employer software subscription services. Revenues related to such implementation services are recognized at the time that the professional services have been completed and the related software services have commenced. Prior to July 1, 2015, the Company did not have standalone value for implementation services related to the Benefitfocus Marketplace solution as the Company had historically performed these services to support customers’ implementation of this solution.
Certain of the Company’s other professional services, including implementation services related to the Carrier segment, are not sold separately from the software services and there is no alternative use for them. As such, the Company has determined that those professional services do not have standalone value. Accordingly, software services and professional services are combined and recognized as a single unit of accounting. The Company generally recognizes software services fees monthly based on the number of employees covered by the relevant benefits plans at contracted rates for a specified period of time, once the criteria for revenue recognition described above have been satisfied. With the exception of Benefitfocus Marketplace implementation services discussed above, the Company defers recognition of revenue for fees from professional services that do not have standalone value and begins recognizing such revenue once the services are delivered and the related software services have commenced, ratably over the longer of the contract term or the estimated expected life of the customer relationship. Costs incurred by the Company in connection with providing such professional services are charged to expense as incurred and are included in “Cost of revenue.”
Cost of Revenue
Cost of revenue primarily consists of employee compensation, professional services, data center co-location costs, networking expenses, depreciation expense for computer equipment directly associated with generating revenue, amortization expense for capitalized software development costs, and infrastructure maintenance costs. In addition, the Company allocates a portion of overhead, such as facilities and security costs, additional depreciation and amortization expense, and employee benefit costs, to cost of revenue based on headcount.
Cash and Cash Equivalents
Cash and cash equivalents consist of bank checking accounts and money market accounts. The Company considers all highly liquid investments with original maturities of three months or less at the time of purchase to be cash equivalents.
Marketable Securities
Marketable securities consist of short-term investments in corporate bonds, commercial paper, and various U.S. government backed securities. To reflect its intention, the Company classifies its marketable securities as held-to-maturity at the time of purchase. As a result, the marketable securities are recorded
F-8
BENEFITFOCUS, INC.
NOTES TO CONSOLIDATED FINANCIAL STATEMENTS
(thousands, except share and per share data)
at amortized cost and any gains or losses realized upon maturity are reported in other expense, net in the consolidated statements of operations and comprehensive loss.
Concentrations of Credit Risk
The Company’s financial instruments that are exposed to concentrations of credit risk consist primarily of cash equivalents, marketable securities and accounts receivable. All of the Company’s cash and cash equivalents are held at financial institutions that management believes to be of high credit quality. The bank deposits of the Company might, at times, exceed federally insured limits and are generally uninsured and uncollateralized. The Company has not experienced any losses on cash and cash equivalents to date.
To manage credit risk related to marketable securities, the Company invests in various types of highly rated corporate bonds, commercial paper, and various U.S. government backed securities with maturities of less than two years. The weighted average maturity of the portfolio of investments must not exceed nine months, per the Company’s investment policy.
To manage accounts receivable risk, the Company evaluates the creditworthiness of its customers and maintains an allowance for doubtful accounts. Accounts receivable were unsecured and were derived from revenue earned from customers located in the United States. Accounts receivable from one customer represented approximately 12% and 14% of the total accounts receivable at December 31, 2017 and 2016, respectively, and approximately 12% and 11% of total revenue for the year ended December 31, 2017 and 2016, respectively. The revenue is attributable to the Company’s Employer segment. Another customer represented approximately 13% of the total accounts receivable at December 31, 2016.
No customer represented more than 10% of total revenue for the year ended December 31, 2015.
Accounts Receivable and Allowance for Doubtful Accounts and Returns
Accounts receivable are stated at realizable value, net of allowances for doubtful accounts and estimated returns. The Company utilizes the allowance method to provide for doubtful accounts based on management’s evaluation of the collectability of amounts due, and other relevant factors. Bad debt expense is recorded in general and administrative expense on the consolidated statements of operations and comprehensive loss. The Company’s estimate is based on historical collection experience and a review of the current status of accounts receivable. Historically, actual write-offs for uncollectible accounts have not significantly differed from the Company’s estimates. The Company removes recorded receivables and the associated allowances when they are deemed permanently uncollectible. However, higher than expected bad debts may result in future write-offs that are greater than the Company’s estimates. The allowance for doubtful accounts was $654 and $691 as of December 31, 2017 and 2016, respectively.
The allowances for returns are accounted for as reductions of revenue and are estimated based on the Company’s periodic assessment of historical experience and trends. The Company considers factors such as the time lag since the initiation of revenue recognition, historical reasons for adjustments, new customer volume, delivery issues or delays, and past due customer billings. The allowance for returns was $2,812 and $3,904 as of December 31, 2017 and 2016, respectively.
Property and Equipment and Capitalized Software Development Costs
Property and equipment, including capitalized software development costs, are stated at cost less accumulated depreciation and amortization. Expenditures for major additions and improvements are capitalized. Depreciation and amortization is recognized over the estimated useful lives of the related assets using the straight-line method.
F-9
BENEFITFOCUS, INC.
NOTES TO CONSOLIDATED FINANCIAL STATEMENTS
(thousands, except share and per share data)
The estimated useful lives for significant property and equipment categories are generally as follows:
|
Buildings |
|
30 years |
|
Computers and related equipment |
|
3-5 years |
|
Purchased software and licenses |
|
1-7 years |
|
Developed software |
|
3 years |
|
Furniture and fixtures |
|
7 years |
|
Leasehold improvements |
|
Lesser of estimated useful life of asset or lease term |
|
Other equipment |
|
5-12 years |
|
Vehicles |
|
5 years |
Useful lives of significant assets are periodically reviewed and adjusted prospectively to reflect the Company’s current estimates of the respective assets’ expected utility. Costs associated with maintenance and repairs are expensed as incurred.
The Company capitalizes certain costs related to its software developed or obtained for internal use. Costs related to preliminary project activities and post-implementation activities are expensed as incurred. Internal and external costs incurred during the application development stage, including upgrades and enhancements representing modifications that will result in significant additional functionality, are capitalized. Software maintenance and training costs are expensed as incurred. Capitalized costs are recorded as part of property and equipment and are amortized on a straight-line basis over the software’s estimated useful life which is three years. The Company evaluates these assets for impairment whenever events or changes in circumstances occur that could impact the recoverability of these assets.
Identifiable Intangible Assets
Identifiable intangible assets with finite lives are recorded at their fair values at the date of acquisition and are amortized on a straight-line basis over their respective estimated useful lives, which is the period over which the asset is expected to contribute directly or indirectly to future cash flows. As of December 31, 2017, the estimated remaining useful life used in computing amortization was 0.6 years.
Impairment of Long-Lived Assets and Goodwill
The Company reviews long-lived assets and definite-lived intangible assets for impairment whenever events or changes in circumstances indicate the carrying amount of an asset might not be recoverable. Recoverability of the long-lived asset is measured by a comparison of the carrying amount of the asset or asset group to future undiscounted net cash flows expected to be generated. If such assets are not recoverable, the impairment to be recognized, if any, is measured as the amount by which the carrying amount of the assets exceeds the estimated fair value (discounted cash flow) of the assets or asset group. Assets held for sale are reported at the lower of the carrying amount or fair value, less costs to sell.
Goodwill represents the excess of the aggregate of the fair value of consideration transferred in a business combination over the fair value of assets acquired, net of liabilities assumed. Goodwill is not amortized; rather, goodwill is tested for impairment at the reporting unit level as of October 31 of each year, or more frequently if an event occurs or circumstances change that would more likely than not reduce the fair value of a reporting unit below its carrying value.
The Company performs a qualitative assessment to determine whether it is more likely than not that the fair value of a reporting unit is less than its carrying value before performing a two-step approach to testing goodwill for impairment for each reporting unit. The reporting units are determined by the components of the Company’s operating segments that constitute a business for which both (1) discrete financial information is available and (2) segment management regularly reviews the operating results of that component. If it is more likely than not that the fair value of a reporting unit is less than its carrying
F-10
BENEFITFOCUS, INC.
NOTES TO CONSOLIDATED FINANCIAL STATEMENTS
(thousands, except share and per share data)
value, the Company performs the impairment test by applying a fair-value-based test. The first step measures for impairment by applying fair-value-based tests at the reporting unit level. The second step (if necessary) measures the amount of impairment by applying fair-value-based tests to the individual assets and liabilities within each reporting unit.
The Company has identified two reporting units, Employer and Carrier. To determine the fair value of the Company’s reporting units, the Company has used a discounted cash flow analysis, which requires significant assumptions and estimates about future operations. Significant judgments inherent in this analysis include the determination of an appropriate discount rate, estimated terminal value and the amount and timing of expected future cash flows. The Company may also determine fair value of its reporting units using a market approach by applying multiples of earnings of peer companies to its operating results.
Financing Obligations
In its build-to-suit lease arrangements where the Company is involved in the construction of its buildings, the Company is deemed the owner for accounting purposes during the construction period. The Company records an asset for the amount of the total project costs in Property and Equipment, net and the related financing obligation in Financing and Capital Lease Obligations on the Consolidated Balance Sheet. Once construction is complete, the Company determines if the asset qualifies for sale-leaseback accounting treatment. If the arrangement does not qualify for sale-lease back treatment, the Company continues to reduce the obligation over the lease term as payments are made and depreciates the asset over its useful life. The Company does not report rent expense for the portion of the rent payment determined to be related to the assets that it owns for accounting purposes. Rather, this portion of the rent payment under the lease is recognized as a reduction of the financing obligation and as interest expense.
Financing obligations also include liabilities for the purchase of software licenses.
Sales Commissions
Sales commissions are generally expensed when the sales contract is executed by the customer.
Advertising
The Company expenses advertising costs as they are incurred. Direct advertising costs for the years ended December 31, 2017, 2016, and 2015 were $168, $635 and $435, respectively.
Comprehensive Loss
The Company’s net loss equals comprehensive loss for all periods presented.
Stock-Based Employee Compensation
Stock-based employee compensation is measured based on the grant-date fair value of the awards and recognized in the Consolidated Statements of Operations and Comprehensive Loss over the period during which the award holder is required to perform services in exchange for the award, which is the vesting period. Compensation expense is recognized over the vesting period of the applicable award using the straight-line method. Compensation expense related to performance-based restricted stock units, which are accounted for as equity awards, is recognized when it is probable that the performance measure will be met. Compensation costs related to restricted stock units (“RSUs”) is based on the market price on the grant date. The Company uses the Black-Scholes option pricing model for estimating the fair value of stock options. The use of the option valuation model requires the input of subjective assumptions, including the expected life of the option and the expected stock price volatility. Additionally, prior to January 1, 2017, the recognition of stock-based compensation expense required the estimation of the number of options and RSUs that will ultimately vest and the number of options and RSUs that will
F-11
BENEFITFOCUS, INC.
NOTES TO CONSOLIDATED FINANCIAL STATEMENTS
(thousands, except share and per share data)
ultimately be forfeited. Starting January 1, 2017, the Company recognizes the effect of forfeitures as they occur. The recognition of stock-based compensation expense associated with performance-based restricted stock units requires the estimation of the probability of achieving performance measures.
The Company adopted the guidance in Accounting Standards Update ("ASU") 2016-09, “Compensation - Stock Compensation (Topic 718) - Improvements to Employee Share-Based Payment Accounting,” on January 1, 2017. Under this ASU, entities are permitted to make an accounting policy election to either estimate forfeitures on share-based payment awards, as previously required, or to recognize forfeitures as they occur. The Company has elected to recognize forfeitures as they occur and the impact of that change in accounting policy has been recorded as a $391 cumulative effect adjustment to its accumulated deficit as of January 1, 2017.
Income Taxes
The Company uses the asset and liability method for income tax accounting. This method requires the recognition of deferred tax assets and liabilities for the expected future tax consequences of temporary differences between the financial reporting and tax basis of assets and liabilities, as well as for operating loss and tax credit carryforwards. Deferred tax assets and liabilities are measured using the tax rates that are expected to apply to taxable income for the years in which those tax assets and liabilities are expected to be realized or settled. Valuation allowances are recorded to reduce deferred tax assets to the amount the Company believes is more likely than not to be realized. The tax benefits of uncertain tax positions are recognized only when the Company believes it is more likely than not that the tax position will be upheld on examination by the taxing authorities based on the merits of the position. The Company recognizes interest and penalties, if any, related to unrecognized income tax benefits in income tax expense.
In addition to the compensation expense provisions previously discussed, ASU 2016-09 requires that all income tax effects related to settlements of share-based payment awards be reported in earnings as an increase or decrease to income tax expense (benefit), net. Previously, income tax benefits at settlement of an award were reported as an increase (or decrease) to additional paid-in capital to the extent that those benefits were greater than (or less than) the income tax benefits reported in earnings during the award's vesting period. The requirement to report those income tax effects in earnings has been applied on a prospective basis to settlements occurring on or after January 1, 2017 and the impact of applying that guidance was not material to the consolidated financial statements for the year ended December 31, 2017.
ASU 2016-09 also requires that all income tax-related cash flows resulting from share-based payments be reported as operating activities in the statement of cash flows. Previously, income tax benefits at settlement of an award were reported as a reduction to operating cash flows and an increase to financing cash flows to the extent that those benefits exceeded the income tax benefits reported in earnings during the award's vesting period. The Company has elected to apply that change in cash flow classification on a prospective basis. However, there is no impact to the statement of cash flows for the year ended December 31, 2017, as the Company did not have any cash flows related to excess tax benefits during that time. The remaining provisions of ASU 2016-09 did not have a material impact on the accompanying consolidated financial statements.
Basic and Diluted Net Loss per Common Share
The Company uses the two-class method to compute net loss per common share because the Company has issued securities, other than common stock, that contractually entitle the holders to participate in dividends and earnings of the Company. The two-class method requires earnings for the period to be allocated between common stock and participating securities based upon their respective rights to receive distributed and undistributed earnings. Holders of each series of the Company’s redeemable convertible preferred stock were entitled to participate in distributions, when and if declared by the board of directors that are made to common stockholders, and as a result are considered participating securities.
F-12
BENEFITFOCUS, INC.
NOTES TO CONSOLIDATED FINANCIAL STATEMENTS
(thousands, except share and per share data)
Under the two-class method, for periods with net income, basic net income per common share is computed by dividing the net income attributable to common stockholders by the weighted-average number of shares of common stock outstanding during the period. Net income attributable to common stockholders is computed by subtracting from net income the portion of current year earnings that the participating securities would have been entitled to receive pursuant to their dividend rights had all of the year’s earnings been distributed. No such adjustment to earnings is made during periods with a net loss, as the holders of the participating securities have no obligation to fund losses. Diluted net loss per common share is computed under the two-class method by using the weighted-average number of shares of common stock outstanding plus, for periods with net income attributable to common stockholders, the potential dilutive effects of stock awards and warrants. In addition, the Company analyzes the potential dilutive effect of the outstanding participating securities under the “if-converted” method when calculating diluted earnings per share, in which it is assumed that the outstanding participating securities convert into common stock at the beginning of the period. The Company reports the more dilutive of the approaches (two-class or “if-converted”) as its diluted net income per share during the period. Due to net losses for the years ended December 31, 2017, 2016, and 2015 basic and diluted loss per share were the same, as the effect of potentially dilutive securities would have been anti-dilutive.
Recent Accounting Pronouncements
In January 2017, the Financial Accounting Standards Board ("FASB") issued Accounting Standards Update ("ASU") No. 2017-04, "Simplifying the Test for Goodwill Impairment." It eliminates Step 2 from the goodwill impairment test and an entity should recognize an impairment charge for the amount by which the carrying amount of goodwill exceeds the reporting unit's fair value, not to exceed the carrying amount of goodwill. This guidance is effective for annual and any interim impairment tests starting January 1, 2020. The Company does not expect this guidance to have any impact on its consolidated financial statements.
In August 2016, the FASB issued ASU No. 2016-15, "Classification of Certain Cash Receipts and Cash Payments." It provides guidance on eight specific cash flow issues with the objective of reducing the existing diversity in practice in how they are classified in the statement of cash flows. This guidance is effective for interim and annual reporting periods starting January 1, 2018. The Company does not expect this guidance to have a material impact on its consolidated financial statements.
In June 2016, the FASB ASU No. 2016-13, “Measurement of Credit Losses on Financial Instruments.” The purpose of this ASU is to require a financial asset measured at amortized cost basis to be presented at the net amount expected to be collected. Credit losses relating to available-for-sale debt securities should be recorded through an allowance for credit losses. This ASU is effective for interim and annual reporting periods starting January 1, 2020. The Company is currently evaluating the impact of this guidance on its consolidated financial statements.
In February 2016, the FASB issued ASU No. 2016-02, “Leases (Topic 842).” The amendments in this update require lessees, among other things, to recognize lease assets and lease liabilities on the balance sheet for those leases classified as operating leases under previous authoritative guidance. This update also introduces new disclosure requirements for leasing arrangements. ASU 2016-02 will be effective for the Company beginning January 1, 2019, but early adoption is permitted. The Company is currently evaluating the impact of this update on the consolidated financial statements.
In May 2014, the FASB issued ASU No. 2014-09, “Revenue from Contracts with Customers (Topic 606),” which amends the revenue recognition requirements in the FASB Accounting Standards Codification. Under the new standard, revenue is recognized when a customer obtains control of promised goods or services and is recognized in an amount that reflects the consideration that the entity expects to receive in exchange for those goods and services. In addition, the new standard requires disclosure of the nature, amount, timing, and uncertainty of revenue and cash flows arising from contracts with customers. The FASB has issued several amendments to the new standard, including clarification on accounting for licenses of intellectual property and identifying performance obligations.
F-13
BENEFITFOCUS, INC.
NOTES TO CONSOLIDATED FINANCIAL STATEMENTS
(thousands, except share and per share data)
The Company will adopt the new standard effective January 1, 2018 using the full retrospective transition method and recast each prior reporting period presented.
The more significant impacts of the new standard to the Company are currently expected to be as follows:
|
|
• |
The Company currently recognizes revenue from certain professional services in the Carrier segment over time, which is the customer relationship period. Under the new standard, revenue from certain of these services will be recognized over the contract term of the associated software services contract, including any extension periods representing a material right, or in some cases over the period of delivery of the professional fees, both of which are typically shorter than the customer relationship period. |
|
|
• |
The Company currently recognizes insurance broker commission revenue over the policy period. Under the new standard, the revenue related to broker commissions will be recognized when the orders for the policies are received and transferred to the insurance carrier. As a result, software services revenue from these arrangements in the Employer segment will be recognized earlier under the new standard in comparison to the current guidance. |
|
|
• |
The new standard provides guidance on accounting for certain revenue-related costs, including when to capitalize costs associated with obtaining and fulfilling a contract. The majority of these costs are currently expensed as incurred. Under the new standard, Carrier segment assets recognized for the costs to obtain a contract, which includes sales commissions, will be amortized on a systematic basis that is consistent with the transfer of the services to which the assets relate, considering anticipated renewals when applicable. Carrier segment assets recognized for costs to fulfill a contract, which include internal costs related to implementing carrier products, will be amortized on a systematic basis that is consistent with the transfer of the services to which the asset relates, which is generally expected to be five years. Costs to fulfill contracts in the Employer segment will be expensed as incurred. |
The Company’s historical net cash flows provided by or used in operating, investing, and financing activities will not be impacted by adoption of the new revenue standard.
3. Net Loss Per Common Share
Diluted loss per common share is the same as basic loss per common share for all periods presented because the effects of potentially dilutive items were anti-dilutive given the Company’s net loss. The following common share equivalent securities have been excluded from the calculation of weighted-average common shares outstanding because the effect is anti-dilutive for the periods presented:
|
|
|
Year Ended December 31, |
|
|||||||||
|
Anti-Dilutive Common Share Equivalents |
|
2017 |
|
|
2016 |
|
|
2015 |
|
|||
|
Restricted stock units |
|
|
1,937,014 |
|
|
|
1,467,811 |
|
|
|
1,017,450 |
|
|
Stock options |
|
|
263,155 |
|
|
|
727,559 |
|
|
|
1,684,843 |
|
|
Warrant to purchase common stock |
|
|
- |
|
|
|
580,813 |
|
|
|
580,813 |
|
|
Employee Stock Purchase Plan |
|
|
7,039 |
|
|
|
3,964 |
|
|
|
- |
|
|
Total anti-dilutive common share equivalents |
|
|
2,207,208 |
|
|
|
2,780,147 |
|
|
|
3,283,106 |
|
F-14
BENEFITFOCUS, INC.
NOTES TO CONSOLIDATED FINANCIAL STATEMENTS
(thousands, except share and per share data)
Basic and diluted net loss per common share is calculated as follows:
|
|
|
Year Ended December 31, |
|
|||||||||
|
|
|
2017 |
|
|
2016 |
|
|
2015 |
|
|||
|
Numerator: |
|
|
|
|
|
|
|
|
|
|
|
|
|
Net loss |
|
$ |
(25,872 |
) |
|
$ |
(40,058 |
) |
|
$ |
(62,084 |
) |
|
Net loss attributable to common stockholders |
|
$ |
(25,872 |
) |
|
$ |
(40,058 |
) |
|
$ |
(62,084 |
) |
|
Denominator: |
|
|
|
|
|
|
|
|
|
|
|
|
|
Weighted-average common shares outstanding, basic and diluted |
|
|
31,052,378 |
|
|
|
29,589,857 |
|
|
|
28,344,680 |
|
|
Net loss per common share, basic and diluted |
|
$ |
(0.83 |
) |
|
$ |
(1.35 |
) |
|
$ |
(2.19 |
) |
4. Marketable Securities
Marketable securities consist of corporate bonds, commercial paper and U.S. Treasury and agency bonds, and are classified as held-to-maturity. Investments held in marketable securities had contractual maturities of less than one month as of December 31, 2016. As of December 31, 2017, the Company did not have any marketable securities. The following presents information about the Company’s marketable securities as of December 31:
|
|
|
2016 |
|
|
|
Aggregate cost basis and net carrying amount |
|
$ |
2,007 |
|
|
Gross unrealized holding gains |
|
|
- |
|
|
Gross unrealized holding losses |
|
|
- |
|
|
Aggregate fair value determined by Level 2 inputs |
|
$ |
2,007 |
|
No investments were in an unrealized loss position as of December 31, 2016.
5. Fair Value Measurement
The carrying amounts of certain of the Company’s financial instruments, including cash and cash equivalents, net accounts receivable, accounts payable and other accrued liabilities, and accrued compensation and benefits, approximate fair value due to their short-term nature. The carrying value of the Company’s financing obligations and revolving line of credit approximates fair value, considering the borrowing rates currently available to the Company for financing obligations with similar terms and credit risks.
The Company uses a three-tier fair value hierarchy to classify and disclose all assets and liabilities measured at fair value on a recurring basis, as well as assets and liabilities measured at fair value on a non-recurring basis, in periods subsequent to their initial measurement. The hierarchy requires the Company to use observable inputs when available, and to minimize the use of unobservable inputs when determining fair value. The three tiers are defined as follows:
Level 1. Quoted prices (unadjusted) in active markets for identical assets or liabilities.
Level 2. Other inputs that are directly or indirectly observable in the marketplace.
Level 3. Unobservable inputs for which there is little or no market data, which require the Company to develop its own assumptions.
F-15
BENEFITFOCUS, INC.
NOTES TO CONSOLIDATED FINANCIAL STATEMENTS
(thousands, except share and per share data)
Assets and Liabilities Measured at Fair Value on a Recurring Basis
The Company evaluates its financial assets and liabilities subject to fair value measurements on a recurring basis to determine the appropriate level to classify them for each reporting period. This determination requires significant judgments to be made.
The following tables present information about the Company’s assets and liabilities that are measured at fair value on a recurring basis using the above categories, as of December 31, 2017 and 2016.
|
|
|
December 31, 2017 |
|
|||||||||||||
|
Description |
|
Level 1 |
|
|
Level 2 |
|
|
Level 3 |
|
|
Total |
|
||||
|
Cash Equivalents: |
|
|
|
|
|
|
|
|
|
|
|
|
|
|
|
|
|
Money market mutual funds (1) |
|
$ |
46,730 |
|
|
$ |
- |
|
|
$ |
- |
|
|
$ |
46,730 |
|
|
Total assets |
|
$ |
46,730 |
|
|
$ |
- |
|
|
$ |
- |
|
|
$ |
46,730 |
|
|
|
|
December 31, 2016 |
|
|||||||||||||
|
Description |
|
Level 1 |
|
|
Level 2 |
|
|
Level 3 |
|
|
Total |
|
||||
|
Cash Equivalents: |
|
|
|
|
|
|
|
|
|
|
|
|
|
|
|
|
|
Money market mutual funds (1) |
|
$ |
51,285 |
|
|
$ |
- |
|
|
$ |
- |
|
|
$ |
51,285 |
|
|
Total assets |
|
$ |
51,285 |
|
|
$ |
- |
|
|
$ |
- |
|
|
$ |
51,285 |
|
|
(1) |
Money market mutual funds are classified as cash equivalents in the Company’s consolidated balance sheets. As short-term, highly liquid investments readily convertible to known amounts of cash, with remaining maturities of three months or less at the time of purchase, the Company’s cash equivalent money market funds have carrying values that approximate fair value. |
6. Property and Equipment
Property and equipment consists of the following as of December 31:
|
|
|
2017 |
|
|
2016 |
|
||
|
Buildings, leased |
|
$ |
48,558 |
|
|
$ |
48,558 |
|
|
Computers and related equipment |
|
|
35,728 |
|
|
|
33,924 |
|
|
Purchased software and licenses |
|
|
27,317 |
|
|
|
25,982 |
|
|
Developed software |
|
|
30,624 |
|
|
|
26,142 |
|
|
Furniture and fixtures |
|
|
6,669 |
|
|
|
6,668 |
|
|
Leasehold improvements |
|
|
4,289 |
|
|
|
4,348 |
|
|
Other equipment |
|
|
2,260 |
|
|
|
2,072 |
|
|
Vehicles |
|
|
146 |
|
|
|
111 |
|
|
Construction in progress |
|
|
- |
|
|
|
319 |
|
|
Total property and equipment, at cost |
|
|
155,591 |
|
|
|
148,124 |
|
|
Accumulated depreciation and amortization |
|
|
(82,910 |
) |
|
|
(67,606 |
) |
|
Property and equipment, net |
|
$ |
72,681 |
|
|
$ |
80,518 |
|
Depreciation and amortization expense on property and equipment was $15,648, $12,816 and $11,378, for the years ended December 31, 2017, 2016 and 2015, respectively. Property and equipment includes fixed assets acquired under capital lease agreements of $35,761 for both the years ended December 31, 2017 and 2016. Accumulated depreciation of assets under capital leases totaled $9,633 and $5,194 as of December 31, 2017 and 2016, respectively. Amortization of assets under capital leases is included in depreciation expense.
The Company capitalized software development costs of $4,482 and $5,242 for the years ended December 31, 2017 and 2016, respectively. Amortization of capitalized software development costs totaled $3,257, $2,857 and $2,587 during the years ended December 31, 2017, 2016 and 2015, respectively. The net book value of capitalized software development costs was $7,660 and $6,435 at December 31, 2017, and 2016, respectively.
F-16
BENEFITFOCUS, INC.
NOTES TO CONSOLIDATED FINANCIAL STATEMENTS
(thousands, except share and per share data)
7. Goodwill and Intangible Assets
The Company’s goodwill balance of $1,634 is solely attributable to the Employer reporting unit. The gross carrying amount and accumulated impairment losses were $3,304 and $(1,670), respectively, for the beginning and ending balances in all periods presented. There were no changes in the carrying amount of goodwill in the years ended December 31, 2017 and 2016.
Information regarding the Company’s acquisition-related intangible assets is as follows:
|
|
|
As of December 31, 2017 |
|
|||||||||||||
|
|
|
Gross Carrying Amount |
|
|
Accumulated Amortization |
|
|
Net Carrying Amount |
|
|
Weighted- Average Remaining Useful Life (in years) |
|
||||
|
Trademarks |
|
$ |
240 |
|
|
$ |
(240 |
) |
|
$ |
- |
|
|
|
- |
|
|
Customer agreements |
|
|
2,060 |
|
|
|
(1,910 |
) |
|
|
150 |
|
|
|
0.6 |
|
|
Non-compete agreements |
|
|
126 |
|
|
|
(126 |
) |
|
|
- |
|
|
|
- |
|
|
Total |
|
$ |
2,426 |
|
|
$ |
(2,276 |
) |
|
$ |
150 |
|
|
|
0.6 |
|
|
|
|
|
|
|
|
|
|
|
|
|
|
|
|
|
|
|
|
|
|
As of December 31, 2016 |
|
|||||||||||||
|
|
|
Gross Carrying Amount |
|
|
Accumulated Amortization |
|
|
Net Carrying Amount |
|
|
Weighted- Average Remaining Useful Life (in years) |
|
||||
|
Trademarks |
|
$ |
240 |
|
|
$ |
(240 |
) |
|
$ |
- |
|
|
|
- |
|
|
Customer agreements |
|
|
2,060 |
|
|
|
(1,652 |
) |
|
|
408 |
|
|
|
1.6 |
|
|
Non-compete agreements |
|
|
126 |
|
|
|
(126 |
) |
|
|
- |
|
|
|
- |
|
|
Total |
|
$ |
2,426 |
|
|
$ |
(2,018 |
) |
|
$ |
408 |
|
|
|
1.6 |
|
Amortization expense of acquisition-related intangible assets for the years ended December 31, 2017, 2016 and 2015 was $258, $257 and $286, respectively. As of December 31, 2017, expected amortization expense for the intangible assets for the remaining useful life was $150, to be incurred during 2018. There were no impairments of intangible assets during the years ended December 31, 2017, 2016 and 2015.
8. Revolving Line of Credit
On August 27, 2013, the Company executed a loan and security agreement with Silicon Valley Bank for a revolving line of credit (“Revolver”) in the initial amount of up to $15,000 for working capital, to fund general business requirements, and to repay the indebtedness under its then existing master credit facility and other senior secured promissory notes. At the beginning of 2014, the borrowing limit under the Revolver was increased from $15,000 to $35,000 at the request of the Company in accordance with the terms of the agreement, as amended on December 10, 2013.
In February 2015, the Company replaced its Revolver with a senior revolving line of credit (“Senior Revolver”) with a syndicate of lenders led by Silicon Valley Bank. The Company borrowed $18,246 under the Senior Revolver, of which $17,657 repaid the principal of the Revolver and $589 paid accrued interest, as well as administrative and legal fees related to the issuance of the Senior Revolver. Debt issuance fees of $591 were capitalized in the Company’s balance sheet and are amortized over the life of the Senior Revolver.
The Senior Revolver had an original borrowing limit of $60,000 and an original term of three years. Borrowing capacity under the Senior Revolver is subject to a borrowing base limit that is a function of the Company’s monthly recurring revenue as adjusted to reflect lost customer revenue during the previous three calendar months. Therefore, credit available under the Senior Revolver may be less than
F-17
BENEFITFOCUS, INC.
NOTES TO CONSOLIDATED FINANCIAL STATEMENTS
(thousands, except share and per share data)
the borrowing limit. Interest is payable monthly. Advances under the Senior Revolver bear interest at the prime rate as published in the Wall Street Journal plus a margin based on the Company’s liquidity, which originally ranged between 1.0% and 1.5%. The Company is charged an unused line fee under this arrangement at a rate based on its liquidity, which was originally 0.300% to 0.375% per year. Any outstanding principal is due at the end of the term.
In October and December 2016, the Company amended its Senior Revolver agreement. The October amendment, among other things, increased the borrowing capacity to $95,000, extended the termination date of the facility to February 20, 2020, and added Goldman Sachs Lending Partners LLC to the lending syndicate. The October amendment altered definitions in the Senior Revolver agreement, including Alternate Base Rate, Applicable Margin, Consolidated EBITDA, Liquidity and Commitment Fee Rate. As a result of certain of these definitional changes, the Alternate Base Rate was modified to be the prime rate as published in the Wall Street Journal plus a margin based on our liquidity that ranges between 0.75% and 1.25%. Certain covenants were also revised, including those related to accounts receivable, Minimum Consolidated EBITDA requirements, Indebtedness, permitted Indebtedness and certain capital expenditure limits. The October amendment further waived any default that may have occurred as a result of certain Indebtedness previously incurred by the Company and the disclosure to the lenders of registered Intellectual Property. In connection with the October amendment, debt issuance fees of $379 were capitalized in the Company’s balance sheet and are being amortized over the remaining life of the Senior Revolver. The December amendment revised the covenant restricting Indebtedness in the Senior Revolver agreement to increase the basket for the Company and its subsidiaries’ building lease obligations, to the extent those would be characterized as Indebtedness under the Senior Revolver agreement.
In April 2017, the Company further amended its Senior Revolver agreement. The amendment altered definitions in the Credit Agreement, including Consolidated EBITDA and Liquidity, and changes the Minimum Liquidity and Minimum Consolidated EBITDA requirements. It also included consents by the lenders to certain administrative actions by the Company, including with respect to intellectual property and certain of its bank accounts. The amendment also modifies the definition of Excluded Assets in the Guarantee and Collateral Agreement, dated as of February 20, 2015, which was entered into in connection with the Senior Revolver.
The Company is bound by customary affirmative and negative covenants in connection with the Senior Revolver agreement, including financial covenants related to liquidity and EBITDA. In the event of a default, the lenders may declare all obligations immediately due and stop advancing money or extending credit under the line of credit. The line of credit is collateralized by substantially all of the Company’s tangible and intangible assets, including intellectual property and the equity of subsidiaries.
During 2017, 2016 and 2015, the Company borrowed an aggregate of $105,000, $84,000 and $39,246, respectively, under the Senior Revolver for general operating purposes and repaid an aggregate of $89,000, $74,000 and $27,246, respectively. As of December 31, 2017, the amount outstanding under the Senior Revolver was $56,246 and the amount available to borrow was $16,102. The amount outstanding, which represents principal and currently bears interest at 5.50%, is due February 2020. No other principal amounts are due in any other year.
F-18
BENEFITFOCUS, INC.
NOTES TO CONSOLIDATED FINANCIAL STATEMENTS
(thousands, except share and per share data)
9. Commitments and Contingencies
The Company leases three buildings on its Charleston, South Carolina campus. One leasing arrangement is accounted for as a capital lease. The remaining two lease agreements are accounted for as build-to-suit, failed sale-leaseback arrangements. Accordingly, the Company recognized liabilities for the lease payments related to these two buildings, which have been recorded as financing obligations. A portion of the lease payment for these two leases has been allocated to land and is accounted for using operating lease accounting. Information regarding these three leases is incorporated in the following disclosures.
Operating Lease Commitments
The Company leases office facilities under various non-cancelable operating lease agreements with original lease periods expiring between 2018 and 2022. Some of the leases provide for renewal terms at the Company’s option. Certain future minimum lease payments due under these operating lease agreements contain free rent periods or escalating rent payment provisions. These leases generally do not contain purchase options. Rent expense on these operating leases is recognized over the term of the lease on a straight-line basis. Operating lease commitments include rent for land associated with the Company’s build-to-suit leases expiring through 2031.
In December 2016, the Company amended its three leases for buildings on its Charleston, South Carolina campus. As a result, one lease, that was previously accounted for as an operating lease was classified as a capital lease at the end of 2016.
Rent expense totaled $1,605, $4,403 and $4,376 for the years ended December 31, 2017, 2016 and 2015, respectively.
Future minimum lease payments are as follows:
|
|
|
Operating Leases |
|
|
|
Year Ending December 31, |
|
|
|
|
|
2018 |
|
$ |
1,400 |
|
|
2019 |
|
|
1,429 |
|
|
2020 |
|
|
1,135 |
|
|
2021 |
|
|
1,101 |
|
|
2022 |
|
|
824 |
|
|
Thereafter |
|
|
8,335 |
|
|
Total minimum lease payments |
|
$ |
14,224 |
|
Financing and Capital Lease Obligations
The Company has entered into various purchase arrangements to obtain property and equipment for operations that are accounted for as capital leases. Certain purchase arrangements contain payments for licenses, which the Company records as financing obligations. These arrangements have original terms ranging from 2 to 5 years with interest rates ranging from 0.5% to 10.0%. The leases are secured by the underlying leased property and equipment.
In December 2016, the Company amended a lease agreement for office space that had been previously accounted for as an operating lease. The amendment extended the term of the lease by 15 years from the amendment date. This modification required the Company to evaluate the lease as if it were a new lease. Upon evaluation, the lease was classified as a capital lease because the present value of the lease payments exceeded 90% of the fair value of the leased asset. Aggregate payments under this lease are $48,600, including executory costs of $5,938. As of December 31, 2017, capital lease obligations include amounts under this lease of $20,571. Details of the lease extension are disclosed under “Contractual Commitments” below.
F-19
BENEFITFOCUS, INC.
NOTES TO CONSOLIDATED FINANCIAL STATEMENTS
(thousands, except share and per share data)
Financing obligations were $34,233 and $33,665, as of December 31, 2017 and 2016, respectively, and consist primarily of obligations for build-to-suit lease arrangements. The aggregate amount of future minimum payments for financing obligations was $110,367 at December 31, 2017 which includes aggregate payments of $108,659 related to build-to-suit arrangements. Details of the build-to-suit lease arrangements are disclosed in Note 15.
Financing obligations are allocated as follows:
|
|
|
As of December 31, |
|
|||||
|
|
|
2017 |
|
|
2016 |
|
||
|
Buildings, build-to-suit |
|
$ |
32,652 |
|
|
$ |
31,326 |
|
|
Software and support |
|
|
1,581 |
|
|
|
2,339 |
|
|
Total financing obligations |
|
$ |
34,233 |
|
|
$ |
33,665 |
|
|
Less: current portion |
|
|
(1,283 |
) |
|
|
(757 |
) |
|
Financing obligations, net of current portion |
|
$ |
32,950 |
|
|
$ |
32,908 |
|
Future minimum lease payments are as follows:
|
|
|
Capital Leases |
|
|
Financing Obligations |
|
||
|
Year Ending December 31, |
|
|
|
|
|
|
|
|
|
2018 |
|
$ |
5,089 |
|
|
$ |
7,759 |
|
|
2019 |
|
|
4,981 |
|
|
|
6,859 |
|
|
2020 |
|
|
3,216 |
|
|
|
6,747 |
|
|
2021 |
|
|
2,941 |
|
|
|
6,949 |
|
|
2022 |
|
|
3,029 |
|
|
|
7,158 |
|
|
Thereafter |
|
|
31,697 |
|
|
|
74,895 |
|
|
Total minimum lease and financing obligation payments |
|
|
50,953 |
|
|
$ |
110,367 |
|
|
Less: executory costs |
|
|
(5,542 |
) |
|
|
|
|
|
Less: imputed interest |
|
|
(20,624 |
) |
|
|
|
|
|
Less: current portion |
|
|
(2,140 |
) |
|
|
|
|
|
Capital lease obligations, net of current portion |
|
$ |
22,647 |
|
|
|
|
|
Contractual Commitments
In connection with a 2013 lease for office space on its Charleston, South Carolina campus, the Company entered into an option to lease space in two additional adjacent buildings. The option term was 36 months and required the Company to incur costs annually prior to the exercise of the option in the amount of up to $466 per year. If the Company terminated the option or did not exercise the option prior to expiration it would incur termination fees pro-rated through the dates of termination or expiration. The maximum liability for termination fees was $757. During the year ended December 31, 2016, the Company determined that the options would expire unexercised and expensed the full amount of the termination fees.
On December 12, 2016, the Company executed an amendment to each of three lease agreements for office space on its Charleston, South Carolina campus. The amendments extended the term of the leases to December 31, 2031. The amendments also provided for the following:
|
|
• |
extending from December 13, 2016 to December 31, 2018 the term of an option that allows the Company to require the lessors to build a two-story building, including potentially for a welcome center, of approximately 18,500 square feet on its campus (“Building 5”) for the Company to lease; |
|
|
• |
waiving accrued and future carrying costs and termination fees otherwise payable to the lessors by the Company under the existing option in the amount of $1,223; and |
F-20
BENEFITFOCUS, INC.
NOTES TO CONSOLIDATED FINANCIAL STATEMENTS
(thousands, except share and per share data)
The waived carrying and termination fees in the amount of $1,223 is being amortized over the 15-year term of the extension as a reduction of interest and rent expense.
On December 12, 2016, the Company also executed a lease agreement pursuant to which the lessor will construct a building of approximately 145,800 square feet on its campus for the Company to accommodate anticipated future growth (“Building 4”). The target commencement date of the lease is July 1, 2019 with a term of 15 years. Under the terms of the lease, the Company agrees to commence construction on or about April 1, 2018, but can terminate the lease prior to that time, subject to the payment of reasonable, documented, and agreed-to out-of-pocket costs with respect to the lease and building to date. If the Company delays beginning construction past December 31, 2018, the lessor may terminate the lease. The Company may renew the lease upon 365 days’ notice to the lessor for five additional one-year terms, provided that the Company is not in default at the time of its request. Significant terms of the lease for Building 4 include annual rent for the first year of the lease of $30.05 per square foot of rentable area with annual rent increases of 2% of the rent paid for the preceding lease year. If the Company exercises its option to cause the construction of Building 5, the term of the lease will reset to 15 years from the date the Company begins paying rent for Building 5. The Company will begin to capitalize costs associated with the construction of Building 4 when construction has commenced.
The Company also has $6,570 of non-cancellable contractual commitments as of December 31, 2017 related to the purchase of software and maintenance. These commitments are not accrued in the consolidated balance sheet of the Company.
Legal Contingencies
The Company may become a party to a variety of legal proceedings that arise in the normal course of business. While the results of such normal course legal proceedings cannot be predicted with certainty, management believes, based on current knowledge, that the final outcome of any matters will not have a material adverse effect on the Company’s business, financial position, results of operations or cash flows.
10. Stock-Based Compensation
Employee Stock-based Compensation Plan
The Company maintains the Amended and Restated Benefitfocus.com, Inc. 2000 Stock Option Plan (the “2000 Plan”) and the Benefitfocus.com, Inc. Amended and Restated 2012 Stock Plan, (the “2012 Plan”), pursuant to which the Company has reserved 4,832,623 shares of its common stock for issuance to its employees, directors and non-employee third parties. The 2012 Plan, effective on January 31, 2012, serves as the successor to the 2000 Plan and permits the granting of incentive stock options, non-statutory stock options, stock bonuses, stock purchase rights, stock appreciation rights, and restricted stock units and awards. No new awards can be issued under the 2000 Plan after the effective date of the 2012 Plan. Outstanding awards under the 2000 Plan continue to be subject to the terms and conditions of the 2000 Plan. Shares available for grant under the 2000 Plan, which were reserved but not issued or subject to outstanding awards under the 2000 Plan as of the effective date, were added to the reserves of the 2012 Plan. As of December 31, 2017, the Company had 2,632,454 shares allocated to the 2012 Plan, but not yet issued.
Stock options are granted at exercise prices not less than the estimated fair market value of the Company’s common stock at the date of grant. The grant date value of restricted stock units is equal to the closing price of the Company’s stock on the date of grant, or, if not a trading day, the closing price of the previous trading day. Generally, the Company issues previously unissued shares for the exercise of stock options or exchange of restricted stock units; however, previously acquired shares may be reissued to satisfy future issuances. The options and restricted stock unit awards typically vest over a four-year
F-21
BENEFITFOCUS, INC.
NOTES TO CONSOLIDATED FINANCIAL STATEMENTS
(thousands, except share and per share data)
period. The options expire 10 years from the grant date. Compensation expense for the fair value of the stock-based awards at their grant date is recognized ratably over the vesting period.
The Company has issued two types of awards under these plans: stock options and restricted stock units. The following table sets forth the number of awards outstanding for each award type is as follows:
|
|
|
Outstanding at December 31, |
|
|||||||||
|
Award type |
|
2017 |
|
|
2016 |
|
|
2015 |
|
|||
|
Restricted stock units |
|
|
1,937,014 |
|
|
|
1,467,811 |
|
|
|
1,017,450 |
|
|
Stock options |
|
|
263,155 |
|
|
|
727,559 |
|
|
|
1,684,843 |
|
Compensation expense related to stock-based awards is included in the following line items in the accompanying consolidated statements of operations and comprehensive loss for the years ended December 31:
|
|
|
2017 |
|
|
2016 |
|
|
2015 |
|
|||
|
Cost of revenue |
|
$ |
2,508 |
|
|
$ |
2,798 |
|
|
$ |
1,950 |
|
|
Sales and marketing |
|
|
4,953 |
|
|
|
3,213 |
|
|
|
2,861 |
|
|
Research and development |
|
|
2,990 |
|
|
|
4,532 |
|
|
|
2,399 |
|
|
General and administrative |
|
|
5,686 |
|
|
|
7,545 |
|
|
|
3,244 |
|
|
|
|
$ |
16,137 |
|
|
$ |
18,088 |
|
|
$ |
10,454 |
|
The total compensation cost related to non-vested awards not yet recognized as of December 31, 2017 was $31,608 and will be recognized over a weighted-average period of approximately 2.74 years.
Restricted Stock Units
During 2017, the Company granted restricted stock units under the 2012 Plan. Restricted stock units granted to employees vest in equal annual installments generally over 4 years from the grant date. The fair value of the stock at the time of grant is amortized based on a straight-line basis over the vesting period.
The summary of unvested restricted stock units is as follows:
|
|
|
Restricted stock units |
|
|
Weighted average grant date fair value |
|
||
|
Unvested at December 31, 2016 |
|
|
1,467,811 |
|
|
$ |
34.33 |
|
|
Granted |
|
|
1,142,253 |
|
|
|
28.90 |
|
|
Forfeited |
|
|
(266,114 |
) |
|
|
33.52 |
|
|
Vested |
|
|
(406,936 |
) |
|
|
35.23 |
|
|
Unvested at December 31, 2017 |
|
|
1,937,014 |
|
|
$ |
30.90 |
|
As of December 31, 2017, the number and intrinsic value of restricted stock units expected to vest was 1,471,818 and $39,739, respectively. The aggregate fair value of restricted stock units vested during the year ended December 31, 2017, 2016 and 2015 was $12,137, $10,311 and $6,261, respectively.
Included in the grants of 2017 restricted stock units are performance restricted stock units for which vesting is contingent upon meeting various financial targets to support growth initiatives. The Company granted 448,974 performance restricted stock units to officers and certain employees with an aggregate grant-date fair value of $12,425. Vesting is contingent upon meeting various financial targets to support growth initiatives through December 31, 2017. The actual number of shares issued upon vesting could range from 0% to 100%. As of December 31, 2017, there were 652,223 performance restricted stock units outstanding with a weighted average grant-date fair value of $29.39 per unit, of which 187,026 units with a weighted average grant-date fair value of $31.61 per unit were expected to vest.
F-22
BENEFITFOCUS, INC.
NOTES TO CONSOLIDATED FINANCIAL STATEMENTS
(thousands, except share and per share data)
Stock Options
The following is a summary of the option activity for the year ended December 31, 2017:
|
|
|
Number of Options |
|
|
Weighted- Average Exercise Price |
|
|
Weighted- Average Remaining Contractual Term (in years) |
|
|
Aggregate Intrinsic Value |
|
||||
|
Outstanding balance at December 31, 2016 |
|
|
727,559 |
|
|
$ |
8.09 |
|
|
|
|
|
|
|
|
|
|
Granted |
|
|
- |
|
|
|
- |
|
|
|
|
|
|
|
|
|
|
Exercised |
|
|
(463,870 |
) |
|
|
7.45 |
|
|
|
|
|
|
|
|
|
|
Forfeited or expired |
|
|
(534 |
) |
|
|
4.77 |
|
|
|
|
|
|
|
|
|
|
Outstanding balance at December 31, 2017 |
|
|
263,155 |
|
|
$ |
9.22 |
|
|
|
4.0 |
|
|
$ |
4,680 |
|
|
Exercisable at December 31, 2017 |
|
|
263,155 |
|
|
$ |
9.22 |
|
|
|
4.0 |
|
|
$ |
4,680 |
|
|
Vested and expected to vest at December 31, 2017 |
|
|
263,155 |
|
|
$ |
9.22 |
|
|
|
4.0 |
|
|
$ |
4,680 |
|
The aggregate intrinsic value of employee options exercised during the years ended December 31, 2017, 2016, and 2015 was $10,829, $21,117 and $18,873, respectively.
No stock options were granted during the years ended December 31, 2017, 2016 and 2015.
Preferred stock
The Company has 5,000,000 shares of preferred stock authorized all of which is undesignated.
Common Stock
The holders of common stock are entitled to one vote for each share. The voting, dividend and liquidation rights of the holders of common stock are subject to and qualified by the rights, powers and preferences of the holders of preferred stock.
The Company maintains the Benefitfocus, Inc. 2016 Employee Stock Purchase Plan (“ESPP”) pursuant to which the Company has reserved 134,792 shares of its common stock for purchase by its employees who meet certain criteria. Under the ESPP, eligible employees may purchase the Company’s common stock through accumulated payroll deductions. Options to purchase shares are granted twice yearly on or about January 1 and July 1 and exercisable on or about the succeeding June 30 and December 31, respectively, of each year. Shares are purchased at acquisition prices equal to 95% of the fair market value of the Company’s common stock at the purchase date. No participant may purchase more than $12 worth of the Company’s common stock in a six-month offering period. As of December 31, 2017, contributions to purchase 7,039 shares had been received but not yet issued.
At December 31, 2017, the Company had reserved a total of 4,967,415 of its authorized 50,000,000 shares of common stock for future issuance as follows:
|
Outstanding stock options |
|
|
263,155 |
|
|
Restricted stock units |
|
|
1,937,014 |
|
|
Available for future issuance under stock award plans |
|
|
2,632,454 |
|
|
Available for future issuance under ESPP |
|
|
134,792 |
|
|
Total common shares reserved for future issuance |
|
|
4,967,415 |
|
F-23
BENEFITFOCUS, INC.
NOTES TO CONSOLIDATED FINANCIAL STATEMENTS
(thousands, except share and per share data)
On February 24, 2015 and in conjunction with the amendment to the commercial contract described in Note 15, the Company entered into a Securities Purchase Agreement to sell shares of its common stock to Mercer, a customer of the Company. Pursuant to the agreement, on the same date, the Company sold 2,817,526 shares of its common stock to Mercer for $26.50 per share or an aggregate of $74,664. At the same time, the Company also issued Mercer a warrant to purchase up to an additional 580,813 shares of its common stock for $26.50 per share at any time during the 30-month term of the warrant. The agreement, among other things, includes certain standstill provisions and prevents Mercer from disposing of its shares of Company common stock until the earlier of December 31, 2017, the expiration or termination of the Mercer Exchange Software as a Service Agreement, as amended between the Company and Mercer Health & Benefits, LLC, the date on which Mercer and its affiliates own less than 75% of the shares it purchased pursuant to the Securities Purchase Agreement, and the date on which Mercer and its affiliates own less than 5% of the outstanding common stock of the Company. The Company received all of the proceeds from this sale of shares and is using the proceeds for working capital and other general corporate purposes. On August 24, 2017, the warrant to purchase 580,813 shares of common stock expired unexercised.
The Stock Purchase Agreement, warrant agreement and amended commercial contract are considered part of a single arrangement and accounted for in accordance with the multiple-element arrangement guidance outlined in ASC 605-25, Revenue: Multiple-Element Arrangements. The aggregate consideration from the arrangement was allocated to the units of accounting in the arrangement based on their estimated relative selling price, which resulted in $74,331 of consideration being allocated to common stock and warrant net of issuance costs.
12. Employee Benefit Plan
The Company maintains a qualified defined contribution plan under Section 401(k) of the U.S. Internal Revenue Code (the “401(k) Plan”) covering substantially all employees. Employees are eligible to participate in the 401(k) Plan after one day of service and upon attainment of age 21, and may elect to defer an amount or percentage of their annual compensation up to amounts prescribed by law. The Company makes discretionary matching contributions to employee plan accounts. During each of the years ended December 31, 2017, 2016 and 2015, the Company matched 50% of the employees’ contribution, with the match limited to 3% of qualifying compensation. Employee vesting in matching company contributions occurs at a rate of 20% per year after one year of service. During the years ended December 31, 2017, 2016, and 2015, employer matching contributions were $3,020, $2,649 and $2,570, respectively.
13. Income Taxes
The Company files income tax returns in the U.S. for federal and various state jurisdictions. The Company is subject to U.S. federal income tax examination for calendar tax years 2010 through 2016 as well as state income tax examinations for various years depending on statutes of limitations of those jurisdictions.
The following summarizes the components of income tax expense for the years ended December 31:
|
Current: |
|
2017 |
|
|
2016 |
|
|
2015 |
|
|||
|
Federal |
|
$ |
- |
|
|
$ |
- |
|
|
$ |
- |
|
|
State and local |
|
|
15 |
|
|
|
17 |
|
|
|
25 |
|
|
Total current expense |
|
$ |
15 |
|
|
$ |
17 |
|
|
$ |
25 |
|
|
Deferred: |
|
|
|
|
|
|
|
|
|
|
|
|
|
Federal |
|
$ |
- |
|
|
$ |
- |
|
|
$ |
- |
|
|
State and local |
|
|
- |
|
|
|
- |
|
|
|
- |
|
|
Total deferred taxes |
|
$ |
- |
|
|
$ |
- |
|
|
$ |
- |
|
F-24
BENEFITFOCUS, INC.
NOTES TO CONSOLIDATED FINANCIAL STATEMENTS
(thousands, except share and per share data)
Reconciliation between the effect of applying the federal statutory rate and the effective income tax rate used to calculate the Company’s income tax provision is as follows for the years ended December 31:
|
|
|
2017 |
|
|
2016 |
|
|
2015 |
|
|||
|
Federal statutory rate |
|
|
34.0 |
% |
|
|
34.0 |
% |
|
|
34.0 |
% |
|
Effect of: |
|
|
|
|
|
|
|
|
|
|
|
|
|
State income taxes, net of federal benefit |
|
|
6.8 |
% |
|
|
6.0 |
% |
|
|
6.0 |
% |
|
Change in state tax rates |
|
|
0.8 |
% |
|
|
2.6 |
% |
|
|
1.7 |
% |
|
Change in federal tax rates |
|
|
(145.2 |
%) |
|
|
0.0 |
% |
|
|
0.0 |
% |
|
Change in valuation allowance |
|
|
98.7 |
% |
|
|
(46.4 |
%) |
|
|
(42.9 |
%) |
|
State tax credits |
|
|
0.7 |
% |
|
|
4.1 |
% |
|
|
2.5 |
% |
|
Stock-based compensation |
|
|
7.4 |
% |
|
|
(0.1 |
%) |
|
|
0.0 |
% |
|
Section 162(m) |
|
|
(2.4 |
%) |
|
|
0.0 |
% |
|
|
0.0 |
% |
|
Other permanent items |
|
|
(0.9 |
%) |
|
|
(0.2 |
%) |
|
|
(0.7 |
%) |
|
Deferred true-up |
|
|
0.0 |
% |
|
|
0.0 |
% |
|
|
(0.6 |
%) |
|
Income tax provision effective rate |
|
|
(0.1 |
%) |
|
|
0.0 |
% |
|
|
0.0 |
% |
The significant components of the Company’s deferred tax asset and liability were as follows as of December 31:
|
|
|
2017 |
|
|
2016 |
|
||
|
Deferred tax assets relating to: |
|
|
|
|
|
|
|
|
|
Net operating loss carryforwards |
|
$ |
69,452 |
|
|
$ |
65,467 |
|
|
Deferred revenue |
|
|
12,275 |
|
|
|
19,255 |
|
|
Commissions and incentive accrual |
|
|
547 |
|
|
|
1,563 |
|
|
Deferred rent |
|
|
471 |
|
|
|
733 |
|
|
State tax credits |
|
|
7,866 |
|
|
|
6,348 |
|
|
Stock-based compensation |
|
|
4,060 |
|
|
|
5,199 |
|
|
Compensation and other accruals |
|
|
2,539 |
|
|
|
5,222 |
|
|
Property and equipment and intangible assets |
|
|
551 |
|
|
|
- |
|
|
Total gross deferred tax assets |
|
|
97,761 |
|
|
|
103,787 |
|
|
Deferred tax liabilities |
|
|
|
|
|
|
|
|
|
Property and equipment and intangible assets |
|
$ |
- |
|
|
$ |
(578 |
) |
|
Total gross deferred tax liabilities |
|
|
- |
|
|
|
(578 |
) |
|
Deferred tax assets less liabilities |
|
|
97,761 |
|
|
|
103,209 |
|
|
Less: valuation allowance |
|
|
(97,761 |
) |
|
|
(103,209 |
) |
|
Net deferred tax asset (liability) |
|
$ |
- |
|
|
$ |
- |
|
As of December 31, 2017 and 2016, the Company’s gross deferred tax was reduced by a valuation allowance of $97,761 and $103,209, respectively.
The valuation allowance decreased by $5,448 and increased by $17,894 during the years ended December 31, 2017 and 2016, respectively. The decrease in the valuation allowance in 2017 resulted primarily from the revaluation of the deferred tax assets and liabilities in connection with enactment of the Tax Cuts & Jobs Act (“Tax Reform”) on December 22, 2017. Among other things, the primary provision of Tax Reform impacting the Company is the reduction to the U.S. corporate income tax rate from 35% to 21%. The valuation allowance increase in 2016 resulted primarily from changes in the deferred tax assets related to the net operating loss carryforwards and deferred revenue.
On December 22, 2017, the SEC issued Staff Accounting Bulletin 118, which provides guidance on accounting for tax effects of Tax Reform when a company does not have all the necessary information available, prepared or analyzed in reasonable detail to complete its accounting for the effect of the changes in Tax Reform and provides a measurement period for companies to complete its accounting. As of December 31, 2017, the Company has completed its initial accounting for the income tax effects of Tax Reform except for the impact of state tax conformity of each change and further evaluation of
F-25
BENEFITFOCUS, INC.
NOTES TO CONSOLIDATED FINANCIAL STATEMENTS
(thousands, except share and per share data)
executive compensation. The Company is not able to determine a reasonable estimate for these items and continues to account for these items based on the tax laws that were in effect immediately before the enactment of Tax Reform. The Company expects to complete its analysis during 2018 as states make known their conformity with federal tax laws and additional transition guidance is provided related to executive compensation.
The Company adopted the provisions of ASU 2016-09 as of January 1, 2017, which requires recognition through opening accumulated deficit of any pre-adoption date net operating loss carryforwards from nonqualified stock options and other employee share-based payments, as well as recognition of all income tax effects from share-based payments arising on or after the date of adoption in income tax expense. As a result, the Company was required to recognize through opening accumulated deficit the tax impact of pre-adoption date net operating loss carryforwards with remaining carryforward periods of more than 10 years. Due to the Company’s existing valuation allowance on deferred tax assets, the amount recognized in opening accumulated deficit was $0. The corresponding deferred tax asset recorded upon adoption was $18,383. However, the Company has determined that a valuation allowance is required against this amount due to the fact that it is more likely than not that the net operating loss carryforwards will expire before use. In addition, due to the valuation allowance, no windfall tax benefits were recognized in tax expense by the Company in the interim period of adoption as required by ASU 2016-09.
Net operating loss carryforwards for federal income tax purposes were approximately $253,946 and $183,528 at December 31, 2017 and 2016, respectively. State net operating loss carryforwards were $221,189 and $176,389 at December 31, 2017 and 2016, respectively. The federal net operating loss carryforwards will expire at various dates beginning in 2022 through 2036, if not utilized. Net operating loss carryforwards and credit carryforwards reflected above may be limited due to historical and future ownership changes.
South Carolina jobs tax credit and headquarters tax credit carryovers of $10,322 and $10,055 were available at December 31, 2017 and 2016, respectively. Headquarters credits are expected to be used to offset future state income tax license fees. The credits expire in various amounts during 2020 through 2032.
The Company follows FASB ASC 740-10 for accounting for unrecognized tax benefits. As of December 31, 2017, the Company had gross unrecognized tax benefits of $437.
A reconciliation of the beginning and ending amounts of unrecognized tax benefits is as follows for the years ended December 31:
|
|
|
2017 |
|
|
2016 |
|
|
2015 |
|
|||
|
Balance at beginning of year |
|
$ |
437 |
|
|
$ |
437 |
|
|
$ |
437 |
|
|
Additions based on tax positions related to the current year |
|
|
- |
|
|
|
- |
|
|
|
- |
|
|
Additions for tax positions in prior years |
|
|
- |
|
|
|
- |
|
|
|
- |
|
|
Reductions for tax positions of prior years |
|
|
- |
|
|
|
- |
|
|
|
- |
|
|
Reductions for tax positions due to lapse of statute |
|
|
- |
|
|
|
- |
|
|
|
- |
|
|
Settlements |
|
|
- |
|
|
|
- |
|
|
|
- |
|
|
Balance at end of year |
|
$ |
437 |
|
|
$ |
437 |
|
|
$ |
437 |
|
At December 31, 2017 and 2016, none of the $437 liabilities for unrecognized tax benefits could impact the Company’s effective tax rate, if recognized. The Company does not expect the unrecognized tax benefits to change within the next twelve months.
The Company is subject to U.S. income taxes, as well as various taxes state and local jurisdictions. With few exceptions, the Company is no longer subject to U.S. federal, state, and local income tax examinations by tax authorities for years before the tax year ended December 31, 2013, although
F-26
BENEFITFOCUS, INC.
NOTES TO CONSOLIDATED FINANCIAL STATEMENTS
(thousands, except share and per share data)
carryforward attributes that were generated prior to 2013 may still be adjusted upon examination by the taxing authorities if they either have been used or will be used in a future period.
14. Segments and Geographic Information
Operating segments are defined as components of an enterprise for which discrete financial information is available that is evaluated regularly by the chief operating decision maker (“CODM”) for purposes of allocating resources and evaluating financial performance. The Company’s CODM, the Chief Executive Officer, reviews financial information presented on a consolidated basis, accompanied by information about operating segments, for purposes of allocating resources and evaluating financial performance.
The Company’s reportable segments are based on the type of customer. The Company determined its operating segments to be: Employer, which derives substantially all of its revenue from customers that use the Company’s services for the provision of benefits to their employees, and administrators acting on behalf of employers; and Carrier, which derives substantially all of its revenue from insurance companies that provide coverage at their own risk.
Segments are evaluated based on gross profit. The Company does not allocate interest income, interest expense or income tax expense by segment. Accordingly, the Company does not report such information. Additionally, Employer and Carrier segments share the majority of the Company’s assets. Therefore, no segment asset information is reported.
|
|
|
Year Ended December 31, |
|
|||||||||
|
|
|
2017 |
|
|
2016 |
|
|
2015 |
|
|||
|
Revenue from external customers by segment: |
|
|
|
|
|
|
|
|
|
|
|
|
|
Employer |
|
$ |
163,978 |
|
|
$ |
140,522 |
|
|
$ |
94,842 |
|
|
Carrier |
|
|
92,757 |
|
|
|
92,813 |
|
|
|
90,301 |
|
|
Total net revenue from external customers |
|
$ |
256,735 |
|
|
$ |
233,335 |
|
|
$ |
185,143 |
|
|
Depreciation and amortization by segment: |
|
|
|
|
|
|
|
|
|
|
|
|
|
Employer |
|
$ |
10,209 |
|
|
$ |
7,950 |
|
|
$ |
6,024 |
|
|
Carrier |
|
|
5,697 |
|
|
|
5,123 |
|
|
|
5,640 |
|
|
Total depreciation and amortization |
|
$ |
15,906 |
|
|
$ |
13,073 |
|
|
$ |
11,664 |
|
|
Gross profit by segment |
|
|
|
|
|
|
|
|
|
|
|
|
|
Employer |
|
$ |
68,735 |
|
|
$ |
53,031 |
|
|
$ |
33,655 |
|
|
Carrier |
|
|
63,844 |
|
|
|
59,623 |
|
|
|
48,637 |
|
|
Total gross profit by segment |
|
$ |
132,579 |
|
|
$ |
112,654 |
|
|
$ |
82,292 |
|
Substantially all assets were held and all revenue was generated in the United States during the years ended December 31, 2017, 2016 and 2015.
15. Related Parties
Related Party Leasing Arrangements
The Company leases its office space at its Charleston, South Carolina headquarters campus under the terms of three non-cancellable leases from entities with which two of the Company’s directors, significant stockholders, and executives are affiliated. The Company’s headquarters building lease and an additional building lease are accounted for as build-to-suit leases and recorded as financing obligations in the Consolidated Balance Sheets. The remaining lease, also for office space, was accounted for as an operating lease during 2016 and periods prior and as a capital lease in 2017 and after. The Company executed an amendment to each of the three lease agreements on December 12, 2016. These amendments extended the term of the leases to December 31, 2031. The leases contain options to renew the leases for five additional years. The arrangements provide for 3.0% fixed annual rent increases. In addition to extending the lease term, the amendment to the lease for the Company’s
F-27
BENEFITFOCUS, INC.
NOTES TO CONSOLIDATED FINANCIAL STATEMENTS
(thousands, except share and per share data)
Customer Success Center, a 145,800 square foot building on its campus, which commenced January 1, 2015:
|
|
• |
extended from December 13, 2016 to December 31, 2018 the term of an option that allows the Company to require the lessor to build a two-story building, including potentially for a welcome center of approximately 18,500 square feet on its campus (“Building 5”) for the Company to lease, |
|
|
|
• |
waived certain accrued and future carrying costs and termination fees payable to the lessor by the Company under the existing option in the amount of $1,223, and |
|
|
|
• |
reduced the annual rent increases for the Customer Success Center from 3% to 2% contingent upon construction of Building 4 described below. |
|
On December 12, 2016 and in conjunction with the lease amendments, the Company also executed a cancellable lease agreement with an entity which two of the Company’s directors, significant stockholders, and executives are affiliated. Pursuant to the agreement the lessor will construct a building of approximately 145,800 square feet on its campus for the Company to accommodate anticipated future growth (“Building 4”). The target commencement date of the lease is July 1, 2019 with a term of 15 years. Under the terms of the lease, the Company agrees to commence construction on or about April 1, 2018, but can terminate the lease prior to that time, subject to payment of reasonable, documented, and agreed-to out-of-pocket costs with respect to the lease and building to date. If the Company delays beginning construction past December 31, 2018, the lessor may terminate the lease. The Company may renew the lease upon 365 days’ notice to the lessor for five additional one-year terms, provided that the Company is not in default at the time of its request. Significant terms of the lease for Building 4 include annual rent for the first year of the lease of $30.05 per square foot of rentable area with annual rent increases of 2% of the rent paid for the preceding lease year. If the Company exercises its option to cause the construction of Building 5, the term of the lease will reset to 15 years from the date the Company begins paying rent for Building 5.
In connection with the cancellable lease for Building 4 and the option for Building 5 described above, the leasing entity meets the criteria to be a variable interest entity. The Company is not the primary beneficiary of the leasing entity, as the activities that are most significant to the leasing entity’s economic performance, consisting of financing, development, management, and sale of office facilities, are directed by another party. As such, the Company is not required to consolidate the entity as the primary beneficiary. The lease terms would not include a residual value guarantee, fixed-price purchase option, or similar feature that would obligate the Company to absorb decreases in value or would entitle the Company to participate in increases in the value of Buildings 4 or 5. The Company has not and does not intend to provide financial or other support to the leasing entity. The Company’s maximum exposure, assuming the exercise of the option, would consist of rent to be paid over the 15-year term of the lease, construction cost overruns, agreed upon pre-construction costs incurred prior to termination and operating expenses in excess of a certain threshold. The Company’s maximum exposure currently cannot be quantified.
Payments related to these agreements were $10,328, $10,417, and $11,940 for the years ended December 31, 2017, 2016 and 2015, respectively. Amounts due to the related parties were recorded as $901 and $854 in “Accrued Expenses” as of December 31, 2017 and 2016, respectively.
Related Party Travel Expenses
The Company utilizes the services of various companies that are owned and controlled by one of the Company’s significant stockholders and executives. Expenses related to these companies were $20, $80 and $127 for the years ended December 31, 2017, 2016 and 2015 respectively, and consist of project management and air travel related to the operations of the business. No amounts were due to the related parties as of December 31, 2017 and 2016.
Related Party Revenues
As disclosed in Note 11, the Company entered into a Stock Purchase Agreement with Mercer, a customer, on February 24, 2015. As a result of this transaction, Mercer became a related party by virtue
F-28
BENEFITFOCUS, INC.
NOTES TO CONSOLIDATED FINANCIAL STATEMENTS
(thousands, except share and per share data)
of beneficially owning more than 10% of the voting interest of the Company. At the same time, the Company entered into an amendment of its commercial contract with Mercer. The amendment to the commercial contract, among other things, expanded certain terms and conditions of the existing relationship between the Company and Mercer and its affiliates. On August 24, 2017, Mercer’s warrant to purchase common stock of the Company expired unexercised resulting in Mercer’s beneficial ownership of the Company falling below 10%. Accordingly, as of that date, the Company no longer considers Mercer a related party. As of December 31, 2017, Mercer beneficially owned 9.0% of the Company’s outstanding common stock. For the period January 1, 2017 to August 24, 2017, revenue from Mercer was $18,638. For the years ended December 31, 2016 and 2015, revenue from Mercer was $26,720 and $13,552, respectively. Revenue from Mercer was reflected in “Revenues,” within the accompanying statements of operations. The amount due from Mercer was $4,626 as of December 31, 2016. The amount of deferred revenue associated with Mercer was and $7,683 as of December 31, 2016, and was reflected in the balances of deferred revenue in the consolidated balance sheets.
Related Party Revolving Line of Credit
As disclosed in Note 8, the Company amended its Senior Revolver at various times in 2016 and 2017. As part of the amendment in October 2016, Goldman Sachs Lending Partners, LLC was added to the lending syndicate. Goldman Sachs Lending Partners, LLC is an affiliate of The Goldman Sachs Group, Inc., as are the Goldman Sachs funds that owned approximately 19.9% of the Company’s outstanding common stock as of December 31, 2017. Goldman Sachs Lending Partners, LLC committed $10,000 to the revolving commitment and participates in amounts borrowed under the credit facility at a rate of approximately 10.5%. Accordingly, approximately $5,906 of the $56,246 outstanding under the Senior Revolver as of December 31, 2017 was due to Goldman Sachs Lending Partners, LLC.
16. Selected Quarterly Financial Data (unaudited)
The following tables set forth selected unaudited quarterly statements of operations data for each of the eight quarters in the years ended December 31, 2017 and 2016.
|
|
|
Quarter Ended |
|
|||||||||||||||||||||||||||||
|
|
|
December 31, |
|
|
September 30, |
|
|
June 30, |
|
|
March 31, |
|
|
December 31, |
|
|
September 30, |
|
|
June 30, |
|
|
March 31, |
|
||||||||
|
|
|
2017 |
|
|
2017 |
|
|
2017 |
|
|
2017 |
|
|
2016 |
|
|
2016 |
|
|
2016 |
|
|
2016 |
|
||||||||
|
Consolidated Statements of Operations Data: |
|
|
|
|
|
|
|
|
|
|
|
|
|
|
|
|
|
|
|
|
|
|
|
|
|
|
|
|
|
|
|
|
|
Revenue |
|
$ |
66,763 |
|
|
$ |
62,453 |
|
|
$ |
63,348 |
|
|
$ |
64,171 |
|
|
$ |
62,647 |
|
|
$ |
58,022 |
|
|
$ |
57,874 |
|
|
$ |
54,792 |
|
|
Gross profit |
|
|
33,503 |
|
|
|
31,986 |
|
|
|
34,520 |
|
|
|
32,570 |
|
|
|
30,125 |
|
|
|
28,910 |
|
|
|
28,124 |
|
|
|
25,495 |
|
|
Total operating expenses |
|
|
37,285 |
|
|
|
35,601 |
|
|
|
35,996 |
|
|
|
37,215 |
|
|
|
35,189 |
|
|
|
35,434 |
|
|
|
37,215 |
|
|
|
36,984 |
|
|
Operating loss |
|
|
(3,782 |
) |
|
|
(3,615 |
) |
|
|
(1,476 |
) |
|
|
(4,645 |
) |
|
|
(5,064 |
) |
|
|
(6,524 |
) |
|
|
(9,091 |
) |
|
|
(11,489 |
) |
|
Net loss |
|
$ |
(7,004 |
) |
|
$ |
(6,674 |
) |
|
$ |
(4,506 |
) |
|
$ |
(7,688 |
) |
|
$ |
(7,099 |
) |
|
$ |
(8,603 |
) |
|
$ |
(11,004 |
) |
|
$ |
(13,352 |
) |
|
Net loss per common share (a) |
|
$ |
(0.22 |
) |
|
$ |
(0.21 |
) |
|
$ |
(0.14 |
) |
|
$ |
(0.25 |
) |
|
$ |
(0.24 |
) |
|
$ |
(0.29 |
) |
|
$ |
(0.37 |
) |
|
$ |
(0.46 |
) |
|
Weighted-average common shares outstanding--basic and diluted |
|
|
31,285,263 |
|
|
|
31,181,141 |
|
|
|
31,076,995 |
|
|
|
30,658,468 |
|
|
|
30,030,164 |
|
|
|
29,651,230 |
|
|
|
29,459,341 |
|
|
|
29,213,198 |
|
|
(a) |
Quarterly and year-to-date computations of per share amounts are made independently. Therefore, the sum of the per-share amounts for the quarters may not agree with per share amounts for the year. |
The quarterly unaudited consolidated financial statements have been prepared on the same basis as the audited consolidated financial statements included in this report and include all adjustments, consisting only of normal recurring adjustments, that we consider necessary for a fair presentation of such information when read in conjunction with our annual audited consolidated financial statements and notes appearing in this report. The operating results for any quarter do not necessarily indicate the results for any subsequent period or for the entire fiscal year.
F-29
BENEFITFOCUS, INC.
NOTES TO CONSOLIDATED FINANCIAL STATEMENTS
(thousands, except share and per share data)
Stock-Based Compensation
During January 2018, the Company granted 54,040 restricted stock units to employees with an aggregate grant date fair value of $1,446. These restricted stock units generally vest in equal annual installments generally over 4 years from the grant date. The Company amortizes the fair value of the stock subject to the restricted stock units at the time of grant on a straight-line basis over the period of vesting.
During January and February 2018, stock option exercises and vesting of restricted stock units resulted in the issuance of 23,458 shares of common stock.
Revolving Line of Credit
In January 2018, the Company repaid $24,000 that was previously borrowed under the Senior Revolver.
Related Party Transaction
In March 2018, the Company’s landlord extended the time period to commence construction of additional office space under its December 12, 2016 lease. Under the extension, the Company agrees to commence construction on or about April 1, 2019 and the target commencement date extends one year to July 1, 2020. The Company can terminate the lease prior to April 1, 2019.
F-30
Schedule II—Valuation and Qualifying Accounts (in thousands)
|
|
|
Balance at Beginning of Period |
|
|
Additions Charged To Expense |
|
|
Additions Charged Against Revenue |
|
|
Deductions |
|
|
Balance at End of Period |
|
|||||
|
Allowance for doubtful accounts and returns: |
|
|
|
|
|
|
|
|
|
|
|
|
|
|
|
|
|
|
|
|
|
Year Ended December 31, 2017 |
|
$ |
4,595 |
|
|
$ |
75 |
|
|
$ |
5,343 |
|
|
$ |
(6,547 |
) |
|
$ |
3,466 |
|
|
Year Ended December 31, 2016 |
|
$ |
2,585 |
|
|
$ |
667 |
|
|
$ |
5,004 |
|
|
$ |
(3,661 |
) |
|
$ |
4,595 |
|
|
Year Ended December 31, 2015 |
|
$ |
1,663 |
|
|
$ |
22 |
|
|
$ |
7,646 |
|
|
$ |
(6,746 |
) |
|
$ |
2,585 |
|
|
|
|
|
|
|
|
|
|
|
|
|
|
|
|
|
|
|
|
|
|
|
|
|
|
Balance at Beginning of Period |
|
|
Additions Charged To Costs and Expenses (1) |
|
|
Deductions (2) |
|
|
Balance at End of Period |
|
|
|
|
|
||||
|
Deferred tax asset valuation allowance: |
|
|
|
|
|
|
|
|
|
|
|
|
|
|
|
|
|
|
|
|
|
Year Ended December 31, 2017 |
|
$ |
103,209 |
|
|
$ |
32,113 |
|
|
$ |
(37,561 |
) |
|
$ |
97,761 |
|
|
|
|
|
|
Year Ended December 31, 2016 |
|
$ |
85,315 |
|
|
$ |
17,894 |
|
|
$ |
- |
|
|
$ |
103,209 |
|
|
|
|
|
|
Year Ended December 31, 2015 |
|
$ |
58,850 |
|
|
$ |
26,465 |
|
|
$ |
- |
|
|
$ |
85,315 |
|
|
|
|
|
|
(1) Increase in valuation allowance is related to the generation of net operating losses and other deferred tax assets. |
|
|||||||||||||||||||
|
(2) Decrease in valuation on allowance is related to the change in the enacted tax rule. |
|
|||||||||||||||||||
F-31