Attached files
UNITED STATES
SECURITIES AND EXCHANGE COMMISSION
Washington, D.C. 20549
FORM 10-K
(Mark One)
☒
ANNUAL REPORT PURSUANT TO SECTION 13 OR 15(d) OF THE SECURITIES
EXCHANGE ACT OF 1934
For the fiscal year ended December 31, 2017
or
☐
TRANSITION REPORT PURSUANT TO SECTION 13 OR 15(d) OF THE SECURITIES
EXCHANGE ACT OF 1934
For the transition period from
to
Commission File Number 1-34761

AutoWeb, Inc.
(Exact Name of Registrant as Specified in Its Charter)
|
Delaware
|
|
33-0711569
|
|
(State of Incorporation)
|
|
(I.R.S. Employer Identification No.)
|
18872 MacArthur Boulevard, Suite 200
Irvine, California 92612-1400
(Address of principal executive offices) (Zip Code)
Registrant’s telephone number,
including area code (949) 225-4500
Securities registered pursuant to Section 12(b) of the
Act:
|
|
|
|
|
Title of each class
|
|
Name of each exchange on which registered
|
|
Common Stock, par value $0.001 per share
|
|
The Nasdaq Capital Market
|
Securities registered pursuant to Section 12(g) of the Act:
None
Indicate by check mark if the registrant is a
well-known seasoned issuer, as defined in Rule 405 of the
Securities
Act. Yes ☐ No ☒
Indicate by check mark if the registrant is not
required to file reports pursuant to Section 13 or
Section 15(d) of the
Act. Yes ☐ No ☒
Indicate by check mark whether the registrant:
(1) has filed all reports required to be filed by
Section 13 or 15(d) of the Securities Exchange Act of 1934
during the preceding 12 months (or for such shorter period that the
registrant was required to file such reports), and (2) has
been subject to such filing requirements for the past
90 days. Yes ☒ No ☐
Indicate by check mark whether the registrant has
submitted electronically and posted on its corporate Website, if
any, every Interactive Data File required to be submitted and
posted pursuant to Rule 405 of Regulation S-T (section 232.405 of
this chapter) during the preceding 12 months (or for such shorter
period that the registrant was required to submit and post such
files). Yes ☒ No ☐
Indicate by check mark if disclosure of delinquent
filers pursuant to Item 405 of Regulation S-K is not contained
herein, and will not be contained, to the best of
registrant’s knowledge, in definitive proxy or information
statements incorporated by reference in Part III of this Form 10-K
or any amendment to this Form 10-K. ☐
Indicate
by check mark whether the registrant is a large accelerated filer,
an accelerated filer, a non-accelerated filer, or a smaller
reporting company, or emerging growth company. See the definitions
of “large accelerated filer,” “accelerated
filer” and “smaller reporting company,” and
“emerging growth company” in Rule 12b-2 of the Exchange
Act.
|
Large accelerated filer ☐
|
Accelerated filer ☒
|
Non-accelerated filer ☐
|
Smaller reporting company ☐
|
|
|
|
(Do not check if a smaller reporting company)
|
Emerging growth company☐
|
If an emerging growth company, indicate by check
mark if the registrant has elected not to use the extended
transition period for complying with any new or revised financial
accounting standards provided pursuant to Section 13(a) of the
Exchange Act. ☐
Indicate by check mark whether the registrant is a
shell company (as defined in Rule 12b-2 of the
Act). Yes ☐ No ☒
Based
on the closing sale price of $12.61 for our common stock on The
Nasdaq Capital Market on June 30, 2017, the aggregate market
value of outstanding shares of common stock held by non-affiliates
was approximately $140 million.
As
of March 12, 2018, 13,074,558 shares of our common stock were
outstanding.
Documents Incorporated by Reference
Portions of our Definitive Proxy Statement for the 2018 Annual
Meeting, expected to be filed within 120 days of our fiscal year
end, are incorporated by reference into Part III of this Annual
Report on Form 10-K.
AutoWeb, Inc.
ANNUAL REPORT ON FORM 10-K
FOR THE FISCAL YEAR ENDED DECEMBER 31, 2017
|
|
|
|
Page
Number
|
|
|
|
|
|
|
|
1
|
||
|
|
9
|
||
|
|
18
|
||
|
|
18
|
||
|
|
18
|
||
|
|
18
|
||
|
|
|||
|
|
|
|
|
|
|
19
|
||
|
|
21
|
||
|
|
21
|
||
|
|
30
|
||
|
|
30
|
||
|
|
30
|
||
|
|
31
|
||
|
|
31
|
||
|
|
|||
|
|
|
|
|
|
|
32
|
||
|
|
32
|
||
|
|
32
|
||
|
|
32
|
||
|
|
32
|
||
|
|
|||
|
|
|
|
|
|
|
33
|
||
|
|
39
|
||
|
|
|
40
|
|
FORWARD-LOOKING STATEMENTS
The Securities and Exchange Commission
(“SEC”) encourages companies to disclose
forward-looking information so that investors can better understand
a company’s future prospects and make informed investment
decisions. This Annual Report on Form 10-K and our proxy statement,
parts of which are incorporated herein by reference, contain such
forward-looking statements within the meaning of the Private
Securities Litigation Reform Act of 1995. Words such as
“anticipates,” “could,”
“may,” “estimates,”
“expects,” “projects,”
“intends,” “pending,” “plans,”
“believes,” “will” and words of similar
substance, or the negative of those words, used in connection with
any discussion of future operations or financial performance
identify forward-looking statements. In particular, statements
regarding expectations and opportunities, new product expectations
and capabilities, and our outlook regarding our performance and
growth are forward-looking statements. This Annual Report on Form
10-K also contains statements regarding plans, goals and
objectives. There is no assurance that we will be able to carry out
our plans or achieve our goals and objectives or that we will be
able to do so successfully on a profitable basis. These
forward-looking statements are just predictions and involve risks
and uncertainties, many of which are beyond our control, and actual
results may differ materially from these statements. Factors that
could cause actual results to differ materially from those
reflected in forward-looking statements include but are not limited
to, those discussed in “Item 1A. Risk Factors,”
and “Item 7. Management’s Discussion and Analysis of
Financial Condition and Results of Operations.” Investors are
urged not to place undue reliance on forward-looking statements.
Forward-looking statements speak only as of the date on which they
were made. Except as may be required by law, we do not undertake
any obligation, and expressly disclaim any obligation, to update or
alter any forward-looking statements, whether as a result of new
information, future events or otherwise. All forward-looking
statements contained herein are qualified in their entirety by the
foregoing cautionary statements.
PART I
Item 1. Business
AutoWeb, Inc. was incorporated in 1996 under the
laws of the State of Delaware. Unless specified otherwise, as used
in this Annual Report on Form 10-K, the terms
“we,” “us,” “our,” the “Company” or “AutoWeb” refer to AutoWeb, Inc. and its
subsidiaries.
On
October 9, 2017, the Company changed its name from Autobytel Inc.
to AutoWeb, Inc., assuming the name of AutoWeb, Inc., which was the
name of the company that was acquired by the Company in October
2015. In connection with this name change, the Company’s
stock ticker symbol was changed from “ABTL” to
“AUTO” on The Nasdaq Capital Market.
Overview
We are
a digital marketing company for the automotive industry that
assists automotive retail dealers (“Dealers”) and automotive
manufacturers (“Manufacturers”) market and sell
new and used vehicles to consumers by utilizing our digital sales
enhancing products and services. Our
consumer-facing automotive websites (“Company
Websites”) provide
consumers with information and tools to aid them with their
automotive purchase decisions and gives in-market consumers the
ability to connect with Dealers regarding purchasing or leasing
vehicles. These consumers are connected to Dealers via our various
programs for online lead referrals (“Leads”). The Company’s AutoWeb®
consumer traffic referral product (“AutoWeb Traffic Product”) engages
with car buyers from AutoWeb’s network of automotive websites
and uses our proprietary technology to present them with highly
relevant offers based on their make and model of interest and their
geographic location. We then direct these in-market consumers to
key areas of a Dealer’s or Manufacturer’s website to
maximize conversion for sales, service or other products or
services.
Available Information
Our corporate website is located at
www.autoweb.com.
Information on our website is not incorporated by reference in this
Annual Report on Form 10-K. At or through the Investor Relations
section of our website we make available free of charge our annual
reports on Form 10-K, quarterly reports on Form 10-Q, current
reports on Form 8-K and all amendments to these reports as soon as
practicable after this material is electronically filed with or
furnished to the SEC and The Nasdaq Stock Market. Our Code of
Conduct and Ethics is available at the Corporate Governance link of
the Investor Relations section of our website, and a copy of the
code may also be obtained, free of charge, by writing to the
Corporate Secretary, AutoWeb, Inc., 18872 MacArthur Boulevard,
Suite 200, Irvine, California 92612-1400.
Significant Business Developments
DealerX
On October 5, 2017, the Company and DealerX
Partners, LLC, a Florida limited liability company
(“DealerX”), entered into a Master License and
Services Agreement (“DealerX License
Agreement”). Pursuant to
the terms of the DealerX License Agreement, AutoWeb was granted a
perpetual license to access and use DealerX’s proprietary
platform and technology for targeted, online marketing. DealerX
will operate the platform for AutoWeb and provide enhancements to
and support for the DealerX platform for at least an initial
five-year period (“Platform Support
Obligations”). See Note 5
of the “Notes to Consolidated Financial Statements” in
Part II, Item 8, Financial Statements and Supplementary Data of
this Annual Report on Form 10-K.
Stock Repurchase
On June 7, 2012, the Company announced that its
board of directors had authorized the Company to repurchase up to
$2.0 million of the Company’s common stock, and on September
17, 2014, the Company announced that its board of
directors had approved the repurchase of up to an additional $1.0
million of the Company’s common stock. On
September 6, 2017, the Company announced that its board of
directors authorized the Company to repurchase an additional $3.0
million of the Company’s common stock. Under these
repurchase programs, we may repurchase common stock from time to
time on the open market or in private transactions. These
authorizations do not require us to purchase a specific number of
shares, and the board of directors may suspend, modify or terminate
the programs at any time. We will fund future repurchases through
the use of available cash. During 2017, we repurchased
226,698 shares for an aggregate price of $1.9 million. The average
price paid for all shares repurchased during 2017 was $8.37. The
shares repurchased during 2017 were cancelled and returned to
authorized and unissued shares.
Industry
Background
We believe that
consumers engaged in the vehicle purchasing process have adopted
the internet, primarily because the internet is one of the best
methods to easily find the information necessary to make informed
buying decisions. Additionally, the internet is a primary tool for
consumers to begin communicating with local Dealers regarding
vehicle pricing, availability, options and financing. J.D. Power
and Associates reported in 2017 that 78% of automotive consumer
buyers surveyed use third party websites for vehicle research. In
addition, we believe that many Dealers and all major Manufacturers
that market their vehicles in the U.S. use the internet as an
efficient way to reach consumers through marketing
programs. According
to Automotive News, U.S. light vehicle sales were 17.2 million in
2017, a decrease from 17.5 million vehicles sold in
2016. J.D. Power/LMC Automotive are forecasting 2018
U.S. total light vehicle sales and retail light-vehicle sales at
17.0 million and 13.7 million,
respectively.
Products and
Services
Leads are internally-generated from our Company
Websites (“Internally-Generated
Leads”) or acquired from
third parties (“Non-Internally-Generated
Leads”) that generate
Leads from their websites (“Non-Company
Websites”). We sell
Internally-Generated Leads and Non-Internally-Generated Leads
directly to Dealers and indirectly to Dealers through a wholesale
market consisting of Manufacturers and other third parties in the
automotive Lead distribution industry. The AutoWeb
Traffic Product links consumers to Dealers and Manufacturer
websites when the consumers click on advertisements on Company
Websites as well as websites operated by third parties that have
contracted with the Company as publishers under the AutoWeb Traffic
Product. In addition to our Leads and AutoWeb Traffic Product
programs, we also offer Dealers and Manufacturers other products
and services, including WebLeads+ and Payment
Pro®,
to assist them in capturing online, in-market customers and selling
more vehicles by improving conversion of Leads to sale
transactions.
Lead Programs
We
provide Dealers and Manufacturers with opportunities to market
their vehicles efficiently to potential vehicle
buyers. Dealers participate in our Lead programs, and
Manufacturers participate in our Lead programs, our display
advertising programs and our direct marketing programs, reaching
consumers that are in the market to acquire a
vehicle. For consumers, we provide, at no cost to the
consumer, an easy way to obtain valuable information to assist them
in their vehicle shopping process. Leads may be submitted by
consumers through our Company Websites or through Non-Company
Websites. For consumers using our Company Websites, we provide
research information, including vehicle specification data, safety
data, pricing data, photos, videos, regional rebate and incentive
data, and additional tools, such as the compare and configuration
tools, to assist them in this process. We also provide
additional content on our Company Websites, including our database
of articles, such as consumer and professional reviews, and other
analyses. Additional automotive information is also
available on our Company Websites to assist consumers with specific
vehicle research, such as the trade-in value of their current
vehicle.
New Vehicle Leads Program. Our Leads program for new vehicles allows
consumers to submit requests for pricing and availability of
specific makes and models. A new vehicle Lead provides a
Dealer with information regarding the make and model of a vehicle
in which the consumer is interested, and may also include
additional data regarding the consumer’s needs, including any
vehicle trade-in, whether the consumer wishes to lease or buy, and
other options that are important to the vehicle acquisition
decision. A Lead will usually also include the consumer’s
name, phone number and email address and may include a postal
address.
Dealers participating in our new vehicle Leads
program are provided with iControl by AutoWeb, our proprietary
technology that allows Dealers many options to filter and control
the volume and source of their Leads. iControl by AutoWeb can be controlled at the
dealership (or by a representative of AutoWeb on behalf of the
dealership), at the Dealer group level from a web-based,
easy-to-use console that makes it quick and simple for dealerships
to change their Lead acquisition strategy to adjust for inventory
conditions at their dealerships and broader industry patterns (such
as changes in gas prices or changes in consumer demand). From
the console, dealerships can easily contract or expand territories
and increase, restrict or block specific models and Lead web
sources, making it much easier to target inventory challenges and
focus marketing resources more efficiently.
Our
Leads are subject to quality verification that is designed to
maintain the high-quality of our Leads and increase the Lead buy
rates for our Lead customers. Quality verification includes the
validation of name, phone number, email address and postal address.
Our quality verification also involves proprietary systems as well
as arrangements with third party vendors specializing in customer
validation. After a Lead has been subjected to quality
verification, if we have placement coverage for the Lead within our
own Dealer network, we send the Lead to Dealers that sell the type
of vehicle requested in the consumer’s geographic area. We
also send an email message to the consumer with the Dealer’s
name and phone number, and if the Dealer has a dedicated internet
manager, the name of that manager. Dealers contact the consumer
with a price quote and availability information for the requested
vehicle. In addition to sales of Leads directly to Dealers in our
network, we also sell Leads wholesale to Manufacturers for delivery
to their Dealers and to third parties that have placement coverage
for the Lead with their own customers.
Dealers participate in our retail new vehicle Lead program by
entering into contracts directly with us or through major Dealer
groups. Generally, our Dealer contracts may be terminated by either
party on 30 days’ notice and are non-exclusive. The majority
of our retail new vehicle Lead revenues consists of either a
monthly subscription or a per-Lead fee paid by Dealers in our
network; however, under our pay-per-sale program, we offer a
limited number of Dealers in states where we are permitted to
charge on a per transaction basis the opportunity to pay a flat per
transaction fee for a Lead that results in a vehicle sale. We
reserve the right to adjust our fees to Dealers upon 30 days’
prior notice at any time during the term of the contract.
Manufacturers (directly or through their marketing agencies) and
other third parties participate in our wholesale new vehicle Lead
programs generally by entering into agreements where either party
has the right to terminate upon prior notice, with the length of
time for the notice varying by contract. Revenues from retail new
vehicle Leads accounted for 19%, 22% and 27% of total revenues in
2017, 2016 and 2015, respectively. Revenues from wholesale Leads
accounted for 46%, 46% and 47% of total revenues in 2017, 2016 and
2015, respectively.
We measure Lead quality by the conversion of Leads
to actual vehicle sales, which we refer to as the “buy
rate.” Buy rate is the percentage of the consumers submitting
Leads that we delivered to our customers represented by the number
of these consumers who purchased vehicles within ninety days of the
date of the Lead submission. We rely on detailed feedback
from Manufacturers and wholesale customers to confirm the
performance of our Leads. Our Manufacturer and
wholesale customers match the Leads we deliver to our customers
against vehicle sales to provide us with information about vehicle
purchases by the consumers who submitted Leads that we delivered to
these customers. We also obtain
vehicle registration data from a third party provider. This
information, together with our internal analysis allows us to
estimate the buy rates for the consumers who submitted the
Internally-Generated Leads and Non-Internally Generated Leads that
we delivered to our customers, and based on these estimates, to
estimate an industry average buy rate. Based on the most current
information and our internal analysis, we have estimated that, on
average, consumers who submit Internally-Generated Leads that we
deliver to our customers have an estimated buy rate of
approximately 19%. Buy rates that individual Dealers may
achieve can be impacted by factors such as the strength of
processes and procedures within the dealership to manage
communications and follow up with consumers.
In
addition, we report a number of key metrics to our customers,
allowing them to gain a better understanding of the revenue
opportunities that they may realize by acquiring Leads from
us. We can now optimize the mix of Leads we deliver to
our customers based on multiple sources of quality measurements.
Also, by reporting the buying behavior of potential consumers, the
findings also can help shape improvements to online Lead
management, online advertising and dealership sales process
training. By providing actionable data, we place useful
information in the hands of our
customers.
During
2017, we continued to focus our Dealer acquisition and retention
strategies on dealerships to which we could deliver a higher
percentage of our Internally-Generated Leads. We believe
this will result in increased vehicle sales for our Dealers and
ultimately stronger relationships with us because, based on our
evaluation of the performance data and information
discussed above, we believe our Internally-Generated Leads are
of high-quality.
Used Vehicle Leads Program. Our used vehicle Lead program allows
consumers to search for used vehicles according to specific search
parameters, such as the price, make, model, mileage, year and
location of the vehicle. The consumer is able to locate and display
the description, price and, if available, digital images of
vehicles that satisfy the consumer’s search
parameters. The consumer can then submit a Lead for
additional information regarding a vehicle that we then deliver to
the Dealer offering the vehicle. In addition to sending Leads
directly to Dealers through our Lead delivery system, consumers may
choose to contact the Dealer using a toll free number posted next
to the vehicle search results. We charge each Dealer that
participates in the used Vehicle Leads program a monthly
subscription or per Lead fee. Revenues from used vehicle
Leads accounted for 9%, 10% and 11% of total revenues in 2017, 2016
and 2015, respectively.
Other Dealer Products and Services
In
addition to Leads and AutoWeb Traffic Product programs, we also
offer products and services that assist Dealers in connecting with
in-market consumers and closing vehicle sales.
WebLeads+.
Designed to work in connection with a Dealer’s participation
in our Lead programs, WebLeads+ offers a Dealer multiple coupon
options that display relevant marketing messages to consumers
visiting the Dealer’s website. When a Dealer uses
WebLeads+, consumers visiting the Dealer’s website are
encouraged to take action in two ways. First, while
interacting with the Dealer website, a consumer is presented with a
customized special offer formatted for easy Lead submission. If a
vehicle quote is requested, the Lead goes directly into the
dealership management tool so a salesperson can promptly address
the customer’s questions. Second, if the consumer
leaves the Dealer’s website but remains online, the
WebLeads+ product keeps the coupon active in a new browser,
providing the Dealer a repeat branding opportunity and giving the
consumer an easy way to re-engage with the Dealer’s website
through submission of a Lead. The additional Leads
generated by the coupons are seamlessly integrated into our
Extranet tool.
Payment
Pro®.
Payment Pro®
is a Dealer website conversion tool
based on a third party product that offers consumers real-time
online monthly payment information based on an instant evaluation
process. The payments are based on the consumer’s
credit, the actual vehicle being researched and the Dealer finance
rates without requiring the consumer to provide personal
information, such as date of birth or social security number. The
Lead goes directly into the Dealer’s management tool so that
a salesperson can promptly address the consumer’s
inquiry.
Advertising Programs
Our Company Websites attract an audience of
prospective automotive buyers that advertisers can target through
display advertising. A primary way advertisers use our Company
Websites to reach consumers is through vehicle content
targeting. This allows automotive marketers to reach
consumers while they are researching one of our comprehensive
automotive segments such as mini-vans or SUVs and offer
Manufacturers sponsorship opportunities to assist in their efforts
both in terms of customer retention and conquest strategies. Our
Company Websites also offer Manufacturers the opportunity to
feature their makes and models within highly contextual content.
Through their advertising placements, Manufacturers can direct
consumers to their respective websites for further information. We
believe this transfer of consumers from our Company Websites to
Manufacturer sites is the most significant action measured by
Manufacturers in evaluating our performance and value for the
Manufacturer’s marketing programs. Through our agreement with
Jumpstart Automotive Group (“Jumpstart”), Jumpstart sells our fixed placement
advertising across our Company Websites to automotive advertisers.
Jumpstart has informed us that Jumpstart currently reaches
approximately 44 million unique visitors per month and works with
every major automotive Manufacturer across its portfolio of digital
publishers. We also offer a direct marketing platform
that enables Manufacturers to selectively target in-market
consumers during the often-extended vehicle shopping process.
Designed to keep a specific automotive brand in consideration, our
direct marketing programs allow automotive marketers to deliver
specific communication through either email or direct mail formats
to in-market consumers during their purchase
cycle.
Our
AutoWeb Traffic Product is our pay-per-click advertising program.
The AutoWeb Traffic Product utilizes proprietary technology to
offer consumers who are shopping targeted offers based on make,
model and geographic location. As these consumers are conducting
research on one of AutoWeb’s consumer facing websites or on
the site of one of our network of automotive publishers, they are
presented with relevant offers on a timely basis and, upon the
consumer clicking on the displayed advertisement, are sent to the
appropriate website location of one of our Dealer, Manufacturer or
advertising customers. The AutoWeb network of publisher websites
reaches and engages with millions of potential car buyers each
month, and we believe it provides high-intent, quality traffic that
Dealers and other customers cannot typically reach through their
own marketing efforts. The AutoWeb Traffic Product is flexible
and in addition to driving traffic to a vehicle detail page, it can
also send website traffic to new vehicle sales, service, used
vehicles or to any other department where a customer wants to
engage with in-market consumers. In addition, we believe that the
AutoWeb Traffic Product can be used to conquest competitive
shoppers who are researching another brand more effectively than
can typically be done using other search engines. Advertisers only
pay for the clicks they receive, and are able to structure
campaigns with flexible budgets and no long-term commitments in
order to manage spend versus key performance indicators. Ongoing
feedback from our customers is that this traffic provides excellent
time-on-site, below-average bounce rates, higher-than-average page
views and is a valuable tool to help Dealers sell more
vehicles.
Advertising
revenues, including direct marketing, accounted for 24%, 16% and 8%
of total revenues in 2017, 2016 and 2015,
respectively.
Strategy
Our
goal is to garner a larger share of the billions of dollars spent
annually by Dealers and Manufacturers on automotive marketing
services. We plan to achieve this objective through the
following principal strategies:
Increasing The Supply of High-Quality Leads. High-quality Leads are those Leads that result
in high transaction (i.e., purchase) closing rates for our Dealer
customers. Internally-Generated Leads are generally
higher quality than Non-Internally-Generated Leads and increase the
overall quality of our Lead portfolio. Non-Internally-Generated
Leads are of varying quality depending on the source of these
Leads. We plan to increase the supply of high-quality Leads
generated to sell to our customers primarily
by:
●
Increasing
traffic acquisition activities for our Company
Websites. Traffic to our Company Websites is monetized
primarily though the creation of Leads that are delivered to our
Dealer or Manufacturer customers to help them market and sell new
and used vehicles, and through the sale of advertising space on our
Company Websites. We plan to increase the traffic to our Company
Websites through effective SEO and SEM traffic acquisition
activities and enhancements to our Company
Websites.
o
SEO and SEM
traffic acquisition activities.
Traffic to our Company Websites is obtained through a variety of
sources and methods, including direct navigation to our Company
Websites, natural search (search engine optimization or
“SEO”, which is the practice of optimizing
keywords in website content to drive traffic to a website), paid
search (search engine marketing, or “SEM,” which is the practice of bidding on
keywords on search engines to drive traffic to a website), direct
marketing and partnering with other website publishers that provide
links to our websites. Our goal is that over time, paid
traffic such as SEM will be balanced by greater visitation from
direct navigation and SEO, which we expect to result in increased
Lead volumes and gross profit margins.
o
Continuing
to enhance the quality and user experience of our Company
Websites. We continuously make enhancements to
our Company Websites, including enhancements of the design and
functionality of our Company Websites. These
enhancements are intended to position our Company Websites as
comprehensive best in class destinations for automotive purchase
research by consumers. By doing so, we believe we will increase the
volume of our Internally-Generated Leads.
●
Increasing
the conversion rate of visitors to Leads on our Company
Websites. Through
increased SEO and SEM activities and significant content, tools and
user interface enhancements to our websites, we believe we will be
able to increase the number of website visits and improve website
“engagement,” and thereby increase the conversion of
page views into Leads. We believe that an increased
conversion rate of page views into Leads could result in higher
revenue per visitor.
●
Relationships with Suppliers of High-Quality,
Non-Internally-Generated Leads. We plan to continue to develop
and maintain strong relationships with suppliers of
Non-Internally-Generated Leads that consistently provide
high-quality Leads.
Increasing Leads Sales to our Customers. Our principal source of revenue comes from sales
of Leads to our retail and wholesale Lead customers. Our goal is to
increase sales of Leads to our customers primarily
by:
●
Increasing Lead
Sales to Dealers. Sales
of Leads to our Dealer network constitute a significant source of
our revenues. Our goal is to increase the number of
Leads sold to our retail Dealer customers by:
o
increasing
the quality of the Leads sold to our Dealers,
o
increasing
the number of Dealers in our Dealer network,
o
reducing
Dealer churn in our Dealer network,
o
providing
customizable Lead programs to meet our Dealers’ unique
marketing requirements,
o
providing
additional value added marketing services that help Dealers more
effectively utilize the internet to market and sell new and used
vehicles,
o
increasing
overall Dealer satisfaction by improving all aspects of our
services,
o
increasing
the size of our retail Dealer footprint,
o
focusing
on higher revenue Dealers that are more cost-effective to support;
and
o
enhancing
our internal Lead generation activities by leveraging our expanded
retail lead coverage.
●
Increasing
Lead Sales to Wholesale Customers. We currently have agreements to
sell Leads to 31 Manufacturer Lead programs, including all
mainstream Manufacturers, with the exception of one luxury brand
that has yet to launch a Lead program.
We intend to continue to demonstrate the value of third party leads
to Manufacturers by utilizing close rate and cross sell data that
demonstrates that third party leads result in incremental sales for
the Manufacturers. Our intention is to increase revenue by
having Manufacturers enhance business rules, program
capacity, pricing and coverage so that each Manufacturer can
purchase more of our Internally-Generated
Leads.
Continuing to develop the AutoWeb Traffic Product targeted
pay-per-click program for online automotive advertisers and
publishers. Our
AutoWeb Traffic Product uses proprietary technology and a
pay-per-click business model to analyze web traffic and adjust
advertiser costs accordingly based on traffic
quality. This traffic network is targeted to attract
high-intent, high-volume publishers and is intended to allow them
to monetize traffic that has previously been
under-monetized. In-market car shoppers are presented
with highly relevant display advertisements and benefit from an
online experience that delivers information that consumers use in
making their car buying decisions. Manufacturers benefit
from this high-quality traffic from serious in-market car
buyers. Our AutoWeb Traffic Product enables
Manufacturers and Dealers to optimize their advertising by driving
traffic to appropriate areas of their Tier 1 (Manufacturer national
advertising), Tier 2 (Manufacturer and advertising associations
regional advertising) and Tier 3 (Dealer)
websites.
We
believe that Manufacturers and Dealers will see the measureable
attribution from this click traffic and will reallocate marketing
spend from traditional channels into this emerging medium. We also
plan to grow the size of this addressable marketplace by adding
high-quality and high volume automotive publishers to our network,
by targeting in-market consumers on a variety of social media
platforms and by continuing to optimize this advertising platform
on our consumer facing websites, whose traffic we believe will
continue to scale. In addition, we believe that the flexibility of
our solution combined with high-quality traffic with automotive
purchase intent may allow us to increase the amount charged per
click as the network grows and as the level of attribution from
this product is understood by advertising partners.
Increasing Display Advertising Revenues.
As traffic to, and time spent on, our
Company Websites by consumers increases, we will seek to increase
our advertising revenues. Through our agreement with
Jumpstart we benefit from Jumpstart's relationships with every
major automotive Manufacturer and/or its advertising agencies
by increasing revenue for our traditional display
advertising. It is our belief that if the volume of our
traffic continues to increase, advertisers will recognize this
increased value by agreeing to purchase additional advertising
space available on our Company Websites. Additionally,
we believe that our AutoWeb Traffic Product provides an
opportunity to increase AutoWeb advertising revenue through
additional monetization opportunities for our existing and growing
traffic.
Focus on Mobile Technologies. As
consumers increasingly engage with Internet content using mobile
devices, AutoWeb will continue to focus on advanced mobile
technologies that facilitate communication between Dealers and
consumers on smart phones and tablets at the time, place, and in a
manner preferred by many consumers. This focus on
the mobile platform is a core part of our strategy moving forward
regarding lead generation, automotive research, website advertising
and traffic generation.
Continuing to Expand our Products and Services. We
gather significant amounts of data on consumer intent as it relates
to purchasing vehicles. We intend to use this data to
create products and services, including direct business database
offerings, that we believe will ultimately help Manufacturers and
Dealers market and sell more new and used vehicles. Our
objective is to generate revenues from this asset in the most
effective and efficient ways possible.
Strategic Acquisitions,
Investments and Alliances. Our
goal is to grow and enhance our business. We may do so, in part,
through strategic acquisitions, investments and alliances. We
continue to review strategic opportunities that may provide
opportunities for growth. We believe that strategic acquisitions,
investments and alliances may allow us to increase market share,
benefit from advancements in technology and strengthen our business
operations by enhancing our product and service
offerings.
Our ability to implement the foregoing strategies and plans is
subject to risks and uncertainties, many of which are beyond our
control. Accordingly, there is no assurance that we will
successfully implement our strategies and plans. See
“Item 1A. Risk Factors” of this Annual Report on Form
10-K.
Seasonality
Our
quarterly revenues and operating results have fluctuated in the
past and may fluctuate in the future due to various factors,
including consumer buying trends, changing economic conditions,
Manufacturer incentive programs and actual or threatened severe
weather events. Excluding the effect of acquisitions in
2015, Lead volume is typically highest in summer (third quarter)
and winter (first quarter) months, followed by spring (second
quarter) and fall (fourth quarter) months.
Intellectual Property
Our intellectual property includes patents related
to our innovations, products and services; trademarks related to
our brands, products and services; copyrights in software and
creative content; trade secrets; and other intellectual property
rights and licenses of various kinds. We seek to protect our
intellectual property assets through patent, copyright, trade
secret, trademark and other laws and through contractual
provisions. We enter into confidentiality and invention assignment
agreements with our employees and contractors, and non-disclosure
agreements with third parties with whom we conduct business in
order to secure our proprietary rights and additionally limit
access to, and disclosure of, our proprietary
information. We have registered trademarks with the
United States Patent and Trademark Office, including
AutoWeb®,
AutoWeb.com®,
the global highway logo, Autobytel, Autobytel.com, MyGarage, Your
Lifetime Automotive Advisor®,
iControl by Autobytel®,
TextShield®,
and Payment Pro®.
We have also been issued patents related to methods and systems for
managing a Lead in data center systems and a method and system for
managing Leads and routing them to one or more destinations. We
cannot provide any assurances that any of our intellectual property
rights will be enforceable by us in litigation.
Additional
information regarding certain risks related to our intellectual
property is included in Part I, Item 1A “Risk
Factors” of this Annual Report on
Form 10-K.
Competition
In
the automotive-related digital marketing services marketplace we
compete for Dealer and Manufacturer
customers. Competition with respect to our core Lead
referral programs continued to be impacted by changing industry
conditions in 2017. We continue to compete with several companies
that maintain business models similar to ours, some with greater
resources. In addition, competition has increased from larger
competitors that traditionally have competed only in the used
vehicle market. Dealers continue to invest in their
proprietary websites and traffic acquisition activities, and we
expect this trend to continue as Dealers strive to own and control
more Lead generating assets under their captive
brands. Additionally, all major Manufacturers that
market their vehicles in the U.S. have their own websites that
market their vehicles direct to consumers and generate Leads for
delivery direct to the Manufacturers’ Dealers.
We
believe that third party Leads have been the standard in our
industry for many years. However, we continue to observe new
and emerging business models, including pay-per-sale and consumer
pay models, relating to the generation and delivery of
Leads. From time to time, new products and services are
introduced that take the focus away from third party Lead
generation, which we believe is a profitable way to sell
vehicles to in-market buyers. Dealers and Manufacturers
may decide to pull back on their third party
Lead programs to test these new approaches.
In
the display advertising marketplace, we compete with major internet
portals, transaction based websites, automotive related companies,
numerous lifestyle websites and emerging entrants in the relatively
new automotive click revenue medium. We also compete with
traditional marketing channels such as print, radio and
television.
In
pay-per-click advertising, we compete with established search
engine providers as well as with a growing number of digital
marketing platforms focused on generating dealership website
traffic from inventory listings and social media campaigns. In
addition, some industry providers who have historically specialized
in inventory aggregation or on providing SEM agency services to
Dealers are now expanding into the area of website traffic
generation. Also, many dealership website providers are now
offering traffic solutions as part of their bundle of
services.
In
addition, some traditional data providers are moving to deliver
personalized digital marketing services at scale. These digital
marketing hubs and data management platforms provide marketers with
standardized access to audience data, content, workflow triggers
and operational analytics to automate execution and optimization of
multichannel campaigns. These services could be used as a source of
lead generation and website traffic by Dealers and Manufacturers
and could replace by our existing product offerings.
Customers
We
have a concentration of credit risk with our automotive industry
related accounts receivable balances, particularly with Urban
Science Applications (which represents several Manufacturer
programs), General Motors and Media.net Advertising. During 2017,
approximately 34% of our total revenues were derived from these
three customers, and approximately 43% or $11.6 million of gross
accounts receivable related to these three customers at December
31, 2017. In 2017, Urban Science Applications accounted
for 15% and 20% of total revenues and accounts receivable as of
December 31, 2017, respectively. In 2017, Media.net Advertising
accounted for 11% of both total revenues and accounts receivable as
of December 31, 2017, respectively.
Operations and Technology
We
believe that our future success is significantly dependent upon our
ability to provide high-performance, reliable and comprehensive
websites, advertising systems; enhance consumer and Dealer product
and service offerings; maintain the highest levels of information
privacy; and ensure transactional security. Our Company Websites
and advertising systems are hosted at secure third-party data
center facilities and public cloud providers. These data centers
and public cloud systems utilize redundant power infrastructure,
redundant network connectivity, multiple locations, distributed
services, fire detection and suppression systems and security
systems to prevent unauthorized access and to provide high
availability of their services, upon which our technology is built,
deployed and operated. Our network and computer systems are built
on industry standard technology.
System
enhancements are primarily intended to accommodate increased
traffic across our Company Websites, improve the speed in which
Leads and advertisements are processed and introduce new and
enhanced products and services. System enhancements entail the
implementation of sophisticated new technology and system
processes. We implement industry standard automation and delivery
processes and employ centralized quality assurance to improve the
quality, scalability, security, and availability of our products.
We plan to continue to make investments in technology as we believe
appropriate.
Government Regulation
We
are subject to laws and regulations generally applicable to
providers of digital marketing services, including federal and
state laws and regulations governing data security and privacy;
voice, email and text messaging communications with consumers;
unfair and deceptive acts and practices; advertising; contests,
sweepstakes and promotions; and content regulation. For additional
important information related to government regulation of our
business, including governmental regulations relating to the
marketing and sale of automobiles, see the information set forth in
Part I, Item 1A“Risk Factors” of this Annual
Report on Form 10-K.
Employees
As of March 12, 2018, we had 228
employees. None of our
employees are represented by labor unions.
Item 1A. Risk
Factors
The risks described below are not the only risks
that we face. The following risks as well as risks and
uncertainties not currently known to us or that we currently deem
to be immaterial may materially and adversely affect our business,
results of operations, financial condition, earnings per share,
cash flow or the trading price of our stock, individually and
collectively referred to in these Risk Factors as our
“financial
performance.” See also the discussion
of “Forward-Looking Statements” immediately preceding
Part I of this Annual Report on Form 10-K.
We may be unable to increase Lead revenues and could suffer a
decline in revenues due to dealer attrition.
We
derive more than 98% of our Lead revenues from Lead fees paid by
Dealers and Manufacturers participating in our Lead programs. Our
Lead fees decreased $23.6 million, or 18%, in 2017 compared to
2016. Our ability to increase revenues from sales of Leads is
dependent on a mix of interrelated factors that include increasing
Lead revenues by attracting and retaining Dealers and Manufacturers
and increasing the number of high-quality Leads we sell to Dealers
and Manufacturers. We are also focused on higher revenue Dealers
that are more cost-effective to support. Our sales strategy is
intended to result in more profitable relationships with our
Dealers both in terms of cost to supply Leads and to support the
Dealers. Dealer churn impacts our revenues, and if our sales
strategy does not mitigate the loss in revenues by maintaining the
overall number of Leads sold by increasing sales to other Dealers
or Manufacturers while maintaining the overall margins we receive
from the Leads sold, our revenues would decrease. We cannot provide
any assurances that we will be able to increase Lead fee revenues,
prevent Dealer attrition or offset the revenues lost due to Dealer
attrition by other means, and our failure to do so could materially
and adversely affect our financial performance.
We may lose customers or quality Lead supplies to our
competitors.
Our
ability to provide increased numbers of high-quality Leads to our
customers is dependent on increasing the number of
Internally-Generated Leads and acquiring high-quality
Non-Internally-Generated Leads from third parties. Originating
Internally-Generated Leads is dependent on our ability to increase
consumer traffic to our Company Websites by providing secure and
easy to use websites with relevant and quality content for
consumers and increasing visibility of our brands to consumers and
by our SEM activities. We compete for Dealer and Manufacturer
customers and for acquisition of Non-Internally-Generated Leads
with companies that maintain automotive Lead referral businesses
that are very similar to ours. Many of these competitors are larger
than us and have greater financial resources than we have. If we
lose customers or quality Lead supply volume to our competitors, or
if our pricing or cost to acquire Leads is impacted, our financial
performance will be materially and adversely impacted.
Our financial performance could be materially and adversely
affected by changes in internet search engine algorithms and
dynamics.
We
use Google to generate a significant portion of the traffic to our
websites, and, to a lesser extent, we use other search engines and
meta-search websites to generate traffic to our websites,
principally through pay-per-click advertising campaigns. The
pricing and operating dynamics on these search engines can
experience rapid change commercially, technically and
competitively. For example, Google frequently updates and changes
the logic that determines the placement and display of results of a
consumer's search, such that the placement of links to our websites
can be negatively affected and our costs to improve or maintain our
placement in search results can increase.
We are affected by general economic and market conditions, and, in
particular, conditions in the automotive industry.
Our
financial performance is affected by general economic and market
factors, conditions in the automotive industry, and the market for
automotive marketing services, including, but not limited to, the
following:
●
Pricing
and purchase incentives for vehicles;
●
The
expectation that consumers will be purchasing fewer vehicles
overall during their lifetime as a result of better quality
vehicles and longer warranties;
●
The
impact of fuel prices on demand for the number and types of
vehicles;
●
Increases
or decreases in the number of retail Dealers or in the number of
Manufacturers and other wholesale customers in our customer
base;
●
Volatility
in spending by Manufacturers and others in their marketing budgets
and allocations;
●
The
competitive impact of consolidation in the online automotive
referral industry;
●
The
effect of changes in transportation policy, including the potential
increase of public transportation options; and
●
The
effect of fewer vehicles being purchased as a result of new
business models and changes in consumer attitudes regarding the
need for vehicle ownership.
Concentration of
credit risk and risks due to significant customers could materially
and adversely affect our financial performance.
Financial
instruments that potentially subject us to concentrations of credit
risk consist primarily of cash and cash equivalents, investments
and accounts receivable. Cash and cash equivalents are primarily
maintained with two financial institutions in the United States.
Deposits held by banks exceed the amount of insurance provided for
such deposits. Generally these deposits may be redeemed upon
demand. Accounts receivable are primarily derived from fees billed
to Dealers and Manufacturers. We have a concentration of credit
risk with our automotive industry related accounts receivable
balances, particularly with Urban Science Applications (which
represents several Manufacturer programs), General Motors and
Media.net Advertising. During 2017 approximately 34% of the
Company’s total revenues were derived from these customers,
and they accounted for approximately 43% or $11.6 million of gross
accounts receivable at December 31, 2017. No collateral is
required to support our accounts receivables, and we maintain an
allowance for bad debts for potential credit losses. If
there is a decline in the general economic environment that
negatively affects the financial condition of our customers or an
increase in the number of customers that are dissatisfied with
their services, additional estimated allowances for bad debts and
customer credits may be required, and the adverse impact on our
financial performance could be material.
We depend on Manufacturers through our third party sales channel
for a significant amount of our advertising revenues, and we may
not be able to maintain or grow these relationships.
We
depend on Manufacturers through our third party sales channel for a
significant amount of our advertising revenues. A decline in the
level of advertising on our websites, reductions in advertising
rates or any significant failure to develop additional sources of
advertising would cause our advertising revenues to decline, which
could have a material adverse effect on our financial performance.
We periodically negotiate revisions to existing agreements and
these revisions could decrease our advertising revenues in future
periods and a number of our advertising agreements with
Manufacturers may be terminated at any time without cause. We may
not be able to maintain our relationship with Manufacturers on
favorable terms or find alternative comparable relationships
capable of replacing advertising revenues on terms satisfactory to
us. If we cannot do so, our advertising revenues would decline,
which could have a material adverse effect on our financial
performance.
Our
ability to maintain and add to our relationships with advertisers
and thereby increase advertising revenues is dependent on our
ability to attract consumers and acquire traffic to our Company
Websites and monetize that traffic at profitable margins with
advertisers. Our consumer facing websites compete with offerings
from the major internet portals, transaction based sites,
automotive-related verticals (websites with content that is
primarily automotive in nature) and numerous lifestyle websites.
Our advertising business is characterized by minimal barriers to
entry, and new competitors may be able to launch competitive
services at relatively low costs. If our Company Websites do not
provide a compelling, differentiated user experience, we may lose
visitors to competing sites, and if our website traffic declines,
we may lose relevance to our major advertisers who may reduce or
eliminate their advertising buys from us, which could have a
material and adverse effect on our financial
performance.
Uncertainty exists in the application of various laws and
regulations to our business. New laws or regulations applicable to
our business, or expansion or interpretation of existing laws and
regulations to apply to our business, could subject us to
licensing, claims, judgments and remedies, including monetary
liabilities and limitations on our business practices, and could
increase administrative costs or materially and adversely affect
our financial performance.
We
operate in a regulatory climate in which there is uncertainty as to
the application of various laws and regulations to our
business. Our business could be significantly affected
by different interpretations or applications of existing laws or
regulations, future laws or regulations, or actions or rulings by
judicial or regulatory authorities. Our operations may
be subjected to adoption, expansion or interpretation of various
laws and regulations, and compliance with these laws and
regulations may require us to obtain licenses at an undeterminable
and possibly significant initial and annual expense. These
additional expenditures may increase future overhead, thereby
potentially reducing our future results of operations. There can be
no assurances that future laws or regulations or interpretations or
expansions of existing laws or regulations will not impose
requirements on internet commerce that could substantially impair
the growth of e-commerce and adversely affect our financial
performance. The adoption of additional laws or regulations may
decrease the popularity or impede the expansion of e-commerce and
internet marketing, restrict our present business practices,
require us to implement costly compliance procedures or expose us
and/or our customers to potential liability.
We
may be deemed to “operate” or “do business”
in states where our customers conduct their business, resulting in
regulatory action. If any state licensing laws were determined to
be applicable to us, and if we are required to be licensed and we
are unable to do so, or we are otherwise unable to comply with laws
or regulations, we could be subject to fines or other penalties or
be compelled to discontinue operations in those
states. In the event any state’s regulatory
requirements impose state specific requirements on us or include us
within an industry-specific regulatory scheme, we may be required
to modify our marketing programs in that state in a manner that may
undermine the program’s attractiveness to consumers or
Dealers. In the alternative, if we determine that the licensing and
related requirements are overly burdensome, we may elect to
terminate operations in that state. In each case, our financial
performance could be materially and adversely
affected. We have identified below areas of government
regulation, which if changed or interpreted to apply to our
business, we believe could be costly for us and could materially
and adversely affect our financial performance.
Automotive
Dealer/ Broker and Vehicle Advertising Laws. All states comprehensively regulate vehicle sales
and lease transactions, including strict licensure requirements for
Dealers (and, in some states, brokers) and vehicle advertising.
Most of these laws and regulations, we believe, specifically
address only traditional vehicle purchase and lease transactions,
not internet-based Lead referral programs such as our programs. If
we determine that the licensing or other regulatory requirements in
a given state are applicable to us or to a particular marketing
services program, we may elect to obtain required licenses and
comply with applicable regulatory requirements. However,
if licensing or other regulatory requirements are overly
burdensome, we may elect to terminate operations or particular
marketing services programs in that state or elect to not operate
or introduce particular marketing services programs in that state.
In some states we have modified our marketing programs or pricing
models to reduce uncertainty regarding our compliance with local
laws. As we introduce new services, we may need to incur additional
costs associated with additional licensing regulations and
regulatory requirements.
Financial
Broker and Consumer Credit Laws. We provide a connection through our websites
that allows consumers to obtain finance information and, through
our display and pay-per-click advertising programs, to be referred
to Dealer, Manufacturer and potential lender websites. All online
applications for quotes are completed on the respective third
party’s websites. We receive marketing fees from financial
institutions and Dealers in connection with this marketing
activity. We do not demand nor do we receive any fees from
consumers for these services. In the event states require us to be
licensed as a financial broker or finder, we may be unable to
comply with a state’s laws or regulations, or we could be
required to incur significant fees and expenses to obtain any
financial broker required license and comply with regulatory
requirements. In addition, the Dodd-Frank Wall Street
Reform and Consumer Protection Act established a new consumer
financial protection bureau with broad regulatory powers, which
could lead to regulation of our advertising business directly or
indirectly through regulation of automotive finance companies and
other financial institutions.
Insurance
Broker Laws. We provide links
on our websites and referrals from call centers enabling consumers
to be referred to third parties to receive quotes for insurance
from such third parties. All online applications for quotes are
completed on the respective insurance carriers’ or other
third party websites, and all applications for quotes obtained
through call center referrals are conducted by the insurance
carrier or other third party. We receive marketing fees from
participants in connection with this marketing activity. We do not
receive any premiums from consumers nor do we charge consumers fees
for our services.
Changes in the taxation of internet commerce may result in
increased costs.
Because
our business is dependent on the internet, the adoption of new
local, state or federal tax laws or regulations or new
interpretations of existing laws or regulations by governmental
authorities may subject us to additional local, state or federal
sales, use or income taxes and could decrease the growth of
internet usage or marketing or the acceptance of internet commerce
which could, in turn, decrease the demand for our services and
increase our costs. As a result, our financial
performance could be materially and adversely affected. State
taxing authorities are reviewing and re-evaluating the tax
treatment of companies engaged in internet commerce, including the
application of sales taxes to internet marketing businesses similar
to ours, as a source of tax revenues. We accrue for tax
contingencies based upon our estimate of the taxes ultimately
expected to be paid, which we update over time as more information
becomes available, new legislation or rules are adopted or taxing
authorities interpret their existing statutes and rules to apply to
internet commerce, including internet marketing businesses similar
to ours. The amounts ultimately paid in resolution of reviews
or audits by taxing authorities could differ materially from the
amounts we have accrued and result in additional tax expense, and
our financial performance could be materially and adversely
affected.
Changes in applicable tax regulations and resolutions of tax
disputes could negatively affect our financial
results.
The Company is subject to taxation in the U.S. On
December 22, 2017, the U.S. government enacted comprehensive tax
legislation commonly referred to as the Tax Cuts and Jobs Act
(“TCJA”). The changes included in the TCJA are
broad and complex and, among other items, reduce the corporate tax
rate. The final transition impacts of the TCJA may differ from the
estimates provided elsewhere in this report, possibly materially,
due to, among other things, changes in interpretations of the TCJA,
any legislative action to address questions that arise because of
the TCJA, and any changes in accounting standards for income taxes
or related interpretations in response to the TCJA. The TCJA, or
future changes in tax laws applicable to us, could materially
increase our future income tax expense.
Data Security and Privacy Risks
Our
business is subject to various laws, rules and regulations relating
to data security and privacy. New data security and privacy laws,
rules and regulations may be adopted regarding the internet or
other online services that could limit our business flexibility or
cause us to incur higher compliance costs. In each case,
our financial performance could be materially and adversely
affected. We have identified below some of these risks
that we believe could materially and adversely affect our financial
performance.
Anti-spam
laws, rules and regulations. Various state and federal laws, rules and
regulations regulate email communications and internet advertising
and restrict or prohibit unsolicited email (commonly known as
“spam”). These laws, rules or regulations may adversely
affect our ability to market our services to consumers in a
cost-effective manner. The federal Controlling the Assault of
Non-Solicited Pornography and Marketing Act of 2003
(“CAN-SPAM”) imposes complex and often burdensome
requirements in connection with sending commercial emails. In
addition, state laws regulating the sending of commercial emails,
including California’s law regulating the sending of
commercial emails, to the extent found to not be preempted by
CAN-SPAM, may impose requirements or conditions more restrictive
than CAN-SPAM. Violation of these laws, rules or regulations may
result in monetary fines or penalties or damage to our
reputation.
Data
privacy laws, rules and regulations. Various laws, rules and regulations govern the
collection, use, retention, sharing and security of data that we
receive from our users, advertisers and affiliates. In addition, we
have and post on our website our own privacy policies and practices
concerning the collection, use and disclosure of user data and
personal information. Any failure, or perceived failure, by us to
comply with our posted privacy policies, Federal Trade Commission
requirements or orders or other federal or state privacy or
consumer protection-related laws, regulations or industry
self-regulatory principles could result in proceedings or actions
against us by governmental entities or others. Further, failure or
perceived failure by us to comply with our policies, applicable
requirements or industry self-regulatory principles related to the
collection, use, sharing or security of personal information or
other privacy-related matters could result in a loss of user
confidence in us, damage to our brands, and ultimately in a loss of
users, advertisers or Lead referral and advertising affiliates. We
cannot predict whether new legislation or regulations concerning
data privacy and retention issues related to our business will be
adopted, or if adopted, whether they could impose requirements that
may result in a decrease in our user registrations and materially
and adversely affect our financial
performance. Proposals that have or are currently being
considered include restrictions relating to the collection and use
of data and information obtained through the tracking of internet
use, including the possible implementation of a “Do Not
Track” list, that would allow internet users to opt-out of
such tracking. Other proposals include enhanced rights for
consumers to obtain information regarding the sharing or sale of
their personal information and rights to opt-out or prevent the
sharing or sale of their personal information to third
parties.
Security
risks associated with online Leads collection and referral,
advertising and e-commerce risks associated with other online fraud
and scams. A
significant issue for online businesses like ours is the secure
transmission of confidential and personal information over public
networks. Concerns over the security of transactions conducted on
the internet, consumer identity theft and user privacy issues have
been significant barriers to growth in consumer use of the
internet, online advertising and e-commerce. Despite our
implementation of security measures, our computer systems or those
of our vendors may be susceptible to electronic or physical
computer break-ins, viruses and other disruptive harms and security
breaches. Advances in computer capabilities, new discoveries in the
field of cryptography or other developments may specifically
compromise our security measures. Because the techniques used to
obtain unauthorized access, disable or degrade service, or sabotage
systems change frequently and often are not recognized until
launched against a target, we may be unable to anticipate these
techniques or to implement adequate preventative measures on a
timely basis. Any perceived or actual unauthorized disclosure of
personally identifiable information that we collect or store,
whether through breach of our network by an unauthorized party,
employee theft or misuse, or otherwise, could harm our reputation
and brands, substantially impair our ability to attract and retain
our audiences, or subject us to claims or litigation arising from
damages suffered by consumers or Lead or traffic suppliers. If
consumers experience identity theft related to personally
identifiable information we collect or store, we may be exposed to
liability, adverse publicity and damage to our reputation. To the
extent that identity theft gives rise to reluctance to use our
websites or to supply us leads or traffic, or a decline in consumer
confidence in financial transactions over the internet, our
business could be adversely affected. Alleged or actual breaches of
the network of one of our business partners or competitors whom
consumers associate with us could also harm our reputation and
brands. In addition, we could incur significant costs in complying
with the multitude of state, federal and foreign laws regarding the
unauthorized disclosure of personal information. For example,
California law requires companies to inform individuals of any
security breaches that result in their personal information being
stolen. Because our success depends on the acceptance of online
services and e-commerce, we may incur significant costs to protect
against the threat of security breaches or to alleviate problems
caused by those breaches. Internet fraud has been increasing over
the past few years, and the Company has experienced fraudulent use
of our name and trademarks on websites in connection with the
purported sale of vehicles offered on third party websites, with
payments to be handled through an online escrow service purported
to be owned and operated by the Company. These
fraudulent online transactions and scams, should they continue to
increase in prevalence, could affect our reputation with consumers
and give rise to claims by consumers for funds transferred to the
fraudulent accounts, which could materially and adversely affect
our financial performance.
We
are insured for some, but not all, of the foregoing
risks. Even for those risks for which we are insured and
have coverage under the terms and conditions of the applicable
policies, there are no assurances given that the coverage limits
would be sufficient to cover all costs, liabilities or losses we
might incur or experience.
Telemarketing
Risks. We are
subject to various federal and state laws, rules, regulations and
orders regarding telemarketing and privacy, including restrictions
on the use of unsolicited emails and restrictions on marketing
activities conducted through the use of telephonic communications
(including text messaging to mobile telephones). Our financial
performance could be adversely affected by newly-adopted or amended
laws, rules, regulations and orders relating to telemarketing and
increased enforcement of such laws, rules, regulations or orders by
governmental agencies or by private litigants. One example of
regulatory changes that may affect our financial performance are
the regulations under the Telephone Consumer Protection Act
(“TCPA”). Regulations adopted by the Federal
Communications Commission under the TCPA require the prior express
written consent of the called party before a caller can initiate
telemarketing calls (i) to wireless numbers (including text
messaging) using an automatic telephone dialing system or an
artificial or prerecorded voice; or (ii) to residential lines using
an artificial or prerecorded voice. Failure to comply with the TCPA
can result in significant penalties, including statutory damages.
We may become subject to lawsuits (including class-action lawsuits)
alleging that our business violated the TCPA. Under the TCPA,
plaintiffs may seek actual monetary loss or statutory damages of
$500 per violation, whichever is greater, and courts may treble the
damage award for willful or knowing violations. Such litigation,
even if not meritorious, could result in substantial costs and
diversion of management attention and an adverse outcome could
materially and adversely affect our financial
performance. Our efforts to comply with these
regulations may negatively affect conversion rates of leads, and
thus, our revenue or profitability.
Technology Risks
Our
business is dependent on keeping pace with advances in technology.
If we are unable to keep pace with advances in technology,
consumers may stop using our services and our revenues will
decrease. If we are required to invest substantial amounts in
technology, our financial performance will be adversely
impacted. The
internet and electronic commerce markets are characterized by rapid
technological change, changes in user and customer requirements,
frequent new service and product introductions embodying new
technologies, including mobile internet applications, and the
emergence of new industry standards and practices that could render
our existing websites and technology obsolete. These market
characteristics are intensified by the evolving nature of the
market and the fact that many companies are expected to introduce
new internet products and services in the near future. If we are
unable to adapt to changing technologies, our financial performance
could be materially and adversely affected. Our performance will
depend, in part, on our ability to continue to enhance our existing
services, develop new technology that addresses the increasingly
sophisticated and varied needs of our prospective customers,
license leading technologies and respond to technological advances
and emerging industry standards and practices on a timely and
cost-effective basis. The development of our websites, mobile
applications and other proprietary technology entails significant
technical and business risks. We may not be successful in using new
technologies effectively or adapting our websites or other
proprietary technology to customer requirements or to emerging
industry standards. In addition, if we are required to invest
substantial amounts in technology in order to keep pace with
technological advances, our financial performance could be
materially and adversely affected.
Interruptions
or failures in our information technology platforms, communication
systems or security systems could materially and adversely affect
our financial performance. Our information technology and communications
systems are susceptible to outages and interruptions due to fire,
flood, earthquake, power loss, telecommunications failures, cyber
attacks, terrorist attacks, failure of redundant systems and
disaster recovery plans and similar events. Such outages and
interruptions could damage our reputation and harm our operating
results. Despite our network security measures, our
information technology platforms are vulnerable to computer
viruses, worms, physical and electronic break-ins, sabotage and
similar disruptions from unauthorized tampering, as well as
coordinated denial-of-service attacks. We do not have multiple site
capacity for all of our services. In the event of delays or
disruptions to services we rely on third party providers to perform
disaster recovery planning and services on our behalf. We are
vulnerable to extended failures to the extent that planning and
services are not adequate to meet our continued technology
platform, communication or security systems’
needs. We rely on third party providers for our primary
and secondary internet connections. Our co-location service and
public cloud services that provide infrastructure and platform
services, environmental and power support for our technology
platforms, communication systems and security systems are received
from third party providers. We have little or no control over these
third party providers. Any disruption of the services they provide
us or any failure of these third party providers to effectively
design and implement sufficient security systems or plan for
increases in capacity could, in turn, cause delays or disruptions
in our services. We are insured for some, but not all, of these
events. Even for those events for which we are insured
and have coverage under the terms and conditions of the applicable
policies, there are no assurances given that the coverage limits
would be sufficient to cover all losses we might incur or
experience.
We are dependent upon third
parties for certain support services and should they fail to
perform, our financial performance could be materially and
adversely affected. We rely on various third parties to
provide certain support services. For example, Dealer X operates
the platform for AutoWeb and provides enhancements, and support for
the DealerX platform for an initial five year period. Should a
third party fail to perform or perform adequately, our financial
performance could be materially and adversely
affected.
We are
exposed to risks associated with overseas operations and
outsourcing. We
currently maintain website, software development and operations in
Guatemala and receive software development and maintenance services
for some of our systems from contractors located in
Pakistan. These overseas operations and contractor
arrangements are subject to many inherent risks, including but not
limited to:
●
Political,
social and economic instability;
●
Exposure to
different business practices and legal standards, particularly with
respect to labor and employment laws and intellectual
property;
●
Continuation of
overseas conflicts and the risk of terrorist attacks and resulting
heightened security;
●
The
imposition of governmental controls and restrictions and unexpected
changes in regulatory requirements;
●
Theft and other
crimes;
●
Nationalization
of business and blocking of cash flows;
●
Changes in
taxation and tariffs;
●
Difficulties in
staffing and managing international operations; and
●
Foreign currency
exchange fluctuations.
These
risks can significantly impact our overseas operations and
outsourcing. Increases in the cost, or disruptions, of such
operations and outsourcing, could materially and adversely affect
our financial performance. In addition, we are subject
to certain anti-corruption laws, including the U.S. Foreign Corrupt
Practices Act, in addition to the laws of the foreign countries in
which we operate. If we or any of our employees or agents violates
these laws, we could become subject to sanctions or significant
penalties that could negatively affect our reputation and financial
performance.
We may
acquire other companies, and there are many risks associated with
acquisitions. As part of our
business strategy we evaluate potential acquisitions that we
believe will complement or enhance our existing business. We
currently do not have any definitive agreements to acquire any
company or business, and we may not be able to identify or complete
any acquisition in the future. Acquisitions involve
numerous risks that include the following, any of which could
materially and adversely affect our financial
performance:
●
We
may not fully realize all of the anticipated benefits of an
acquisition or may not realize them in the timeframe expected,
including due to acquisitions where we expand into product and
service offerings or enter or expand into markets in which we are
not experienced.
●
In
order to complete acquisitions, we may issue common stock or
securities convertible into or exercisable for common stock,
potentially creating dilution for existing stockholders. Issuance
of equity securities may also restrict utilization of net operating
loss carryforwards because of an annual limitation due to ownership
change limitations under the Internal Revenue Code.
●
We
may borrow to finance acquisitions, and the amount and terms of any
potential future acquisition-related or other borrowings may not be
favorable to the Company and could affect our liquidity and
financial condition.
●
Acquisitions
may result in significant costs and expenses and charges to
earnings, including those related to severance pay, early
retirement costs, employee benefit costs, goodwill and asset
impairment charges, charges from the elimination of duplicative
facilities and contracts, assumed litigation and other liabilities,
legal, accounting and financial advisory fees, and required
payments to executive officers and key employees under retention
plans.
●
Our
due diligence process may fail to identify significant issues with
an acquired company that may result in unexpected or increased
costs, expenses or liabilities that could make an acquisition less
profitable or unprofitable.
●
The
failure to further our strategic objectives that may require us to
expend additional resources to develop products, services and
technology internally.
●
An
announced business combination and investment transaction may not
close timely or at all, which may cause our financial results to
differ from expectations in a given quarter.
●
Business
combination and investment transactions may lead to litigation that
can be costly to defend or settle, even if no actual liability
exists.
●
Integrations
of acquisitions are often complex, time-consuming and expensive,
and if acquisitions are not successfully integrated they could
materially and adversely affect our financial performance. The
challenges involved with integration of acquisitions
include:
o
Diversion
of management attention to assimilating the acquired business from
other business operations and concerns.
o
Integration
of management information and accounting systems of the acquired
business into our systems, and the failure to fully realize all of
the anticipated benefits of an acquisition.
o
Difficulties
in assimilating the operations and personnel of an acquired
business into our own business.
o
Difficulties
in integrating management information and accounting systems of an
acquired business into our current systems.
o
Convincing
our customers and suppliers and the customers and suppliers of the
acquired business that the transaction will not diminish client
service standards or business focus and that they should not defer
purchasing decisions or switch to other suppliers.
o
Consolidating
and rationalizing corporate IT infrastructure, which may include
multiple legacy systems from various acquisitions and integrating
software code and business processes.
o
Persuading
employees that business cultures are compatible, maintaining
employee morale, retaining key employees and integrating employees
into the Company.
o
Coordinating
and combining administrative, manufacturing, research and
development and other operations, subsidiaries, facilities and
relationships with third parties in accordance with local laws and
other obligations while maintaining adequate standards, controls
and procedures.
o
Managing
integration issues shortly after or pending the completion of other
independent transactions.
Securities Market Risks
The public
market for our common stock may be volatile, especially because
market prices for internet-related and technology stocks have often
been unrelated to operating
performance. Our
common stock is currently listed on The Nasdaq Capital Market under
the symbol “AUTO,” but we cannot assure that an active
trading market will be sustained or that the market price of the
common stock will not decline. The stock market in general
periodically experiences significant price fluctuations. The market
price of our common stock is likely to be highly volatile and could
be subject to wide fluctuations in response to factors such
as:
●
Actual
or anticipated variations in our quarterly operating
results;
●
Historical
and anticipated operating metrics such as the number of
participating Dealers, volume of Lead deliveries to Dealers, the
number of visitors to Company Websites and the frequency with which
they interact with Company Websites;
●
Announcements
of new product or service offerings;
●
Technological
innovations;
●
Low
trading volumes;
●
Concentration
of holdings in our common stock resulting in low public float for
our shares;
●
Decisions
by holders of large blocks of our stock to sell their holdings on
accelerated time schedules, including by reason of their decision
to liquidate investment funds that hold our stock;
●
Limited
analyst coverage of the Company;
●
Competitive
developments, including actions by Manufacturers;
●
Changes
in financial estimates by securities analysts or our failure to
meet such estimates;
●
Conditions
and trends in the internet, electronic commerce and automotive
industries;
●
Adoption
of new accounting standards affecting the technology or automotive
industry;
●
Rumors,
whether or not accurate, about us, our industry or possible
transactions or other events;
●
The
impact of open market repurchases of our common stock;
and
●
General
market or economic conditions and other factors.
Further, the stock markets, and
in particular The Nasdaq Capital Market, have experienced price and
volume fluctuations that have particularly affected the market
prices of equity securities of many technology companies and have
often been unrelated or disproportionate to the operating
performance of those companies. These broad market factors have
affected and may adversely affect the market price of our common
stock. In addition, general economic, political and market
conditions, such as recessions, interest rates, energy prices,
international currency fluctuations, terrorist acts, political
revolutions, military actions or wars, may adversely affect the
market price of our common stock. In the past, following periods of
volatility in the market price of a company’s securities,
securities class action litigation has often been instituted
against companies with publicly traded securities.
Following
announcement of our financial results for the year ended December
31, 2017 and the departures of our Chief Executive Officer and
Chief Financial Officer, the market price of our common stock
declined significantly and a law firm announced that it is
investigating investor claims. Should securities related litigation
be filed, we could incur substantial costs and a diversion
of management’s attention and resources, which would have a
material adverse effect on our financial
performance.
Our common
stock could be delisted from The Nasdaq Capital Market if we are
not able to satisfy continued listing requirements, in which case
the price of our common stock and our ability to raise
additional capital and issue equity-based compensation may be
adversely affected, and trading in our stock may be less orderly
and efficient. For our common
stock to continue to be listed on The Nasdaq Capital Market, the
Company must satisfy various continued listing requirements
established by The Nasdaq Stock Market LLC. In the event the
Company were not able to satisfy these continued listing
requirements, we expect that our common stock would be quoted on an
over-the-counter market. These markets are generally
considered to be less efficient and less broad than The Nasdaq
Capital Market. Investors may be reluctant to invest in the common
stock if it is not listed on The Nasdaq Capital Market or another
stock exchange. Delisting of our common stock could have a material
adverse effect on the price of our common stock and would also
eliminate our ability to rely on the preemption of state securities
registration and qualification requirements afforded by Section 18
of the Securities Act of 1933 for “covered securities.”
The loss of this preemption could result in higher costs associated
with raising capital, could limit resale of our stock in some
states, and could adversely impact our ability to issue
equity-based compensation to Company employees.
No
assurances can be given that the Company will continue to be able
to meet the continued listing requirements for listing of our
common stock on The Nasdaq Capital Market.
Risks Associated with Litigation
Misappropriation
or infringement of our intellectual property and proprietary
rights, enforcement actions to protect our intellectual property
and claims from third parties relating to intellectual property
could materially and adversely affect our financial
performance. Litigation
regarding intellectual property rights is common in the internet
and technology industries. We expect that internet technologies and
software products and services may be increasingly subject to third
party infringement claims as the number of competitors in our
industry segment grows and the functionality of products in
different industry segments overlaps. Our
ability to compete depends upon our proprietary systems and
technology. While we rely on trademark, trade secret,
patent and copyright law, confidentiality agreements and technical
measures to protect our proprietary rights, we believe that the
technical and creative skills of our personnel, continued
development of our proprietary systems and technology, brand name
recognition and reliable website maintenance are more essential in
establishing and maintaining a leadership position and
strengthening our brands. Despite our efforts to protect our
proprietary rights, unauthorized parties may attempt to copy
aspects of our services or to obtain and use information that we
regard as proprietary. Policing unauthorized use of our proprietary
rights is difficult and may be expensive. We have no assurance that
the steps taken by us will prevent misappropriation of technology
or that the agreements entered into for that purpose will be
enforceable. Effective trademark, service mark, patent, copyright
and trade secret protection may not be available when our products
and services are made available online. In addition, if litigation
becomes necessary to enforce or protect our intellectual property
rights or to defend against claims of infringement or invalidity,
this litigation, even if successful, could result in substantial
costs and diversion of resources and management
attention. We also have no assurances that our products
and services do not infringe on the intellectual property rights of
third parties. Claims of infringement, even if unsuccessful, could
result in substantial costs and diversion of resources and
management attention. If we are not successful, we may be subject
to preliminary and permanent injunctive relief and monetary damages
which may be trebled in the case willful
infringements.
Our
financial performance could be adversely affected by actions of
third parties that could subject us to
litigation. We could
face liability for information retrieved or obtained from or
transmitted over the internet by third parties and liability for
products sold over the internet by third parties. We could be
exposed to liability with respect to third party information that
may be accessible through our websites, links or vehicle review
services. These claims might, for example, be made for defamation,
negligence, patent, copyright or trademark infringement, personal
injury, breach of contract, unfair competition, false advertising,
invasion of privacy or other legal theories based on the nature,
content or copying of these materials. These claims might assert,
among other things that, by directly or indirectly providing links
to websites operated by third parties we should be liable for
copyright or trademark infringement or other wrongful actions by
such third parties through those websites. It is also possible
that, if any third party content provided on our websites contains
errors, consumers could make claims against us for losses incurred
in reliance on such information. Any claims could result in costly
litigation, divert management’s attention and resources,
cause delays in releasing new or upgrading existing services or
require us to enter into royalty or licensing
agreements.
We
also enter into agreements with other companies under which any
revenues that results from the purchase or use of services through
direct links to or from our websites or on our websites is shared.
In addition, we acquire personal information and data in the form
of Leads purchased from third party websites involving consumers
who submitted personally identifiable information and data to the
third parties and not directly to us. These arrangements may expose
us to additional legal risks and uncertainties, including disputes
with these parties regarding revenue sharing, local, state and
federal government regulation and potential liabilities to
consumers of these services, even if we do not provide the services
ourselves or have direct contact with the consumer. These
liabilities can include liability for violations by these third
parties of laws, rules and regulations, including those related to
data security and privacy laws and regulations; unsolicited email,
text messaging, telephone or wireless voice marketing; and
licensing. We have no assurance that any indemnification provided
to us in our agreements with these third parties, if available,
will be adequate.
Our
financial performance could be materially and adversely affected by
other litigation. From time to time, we are involved in
litigation or legal matters not related to intellectual property
rights and arising from the normal course of our business
activities. The actions filed against us and other litigation or
legal matters, even if not meritorious, could result in substantial
costs and diversion of resources and management attention and an
adverse outcome in litigation could materially and adversely affect
our financial performance. Our liability insurance may not cover
all potential claims to which we are exposed and may not be
adequate to indemnify us for all liability that may be imposed. Any
imposition of liability that is not covered by insurance or is in
excess of our insurance coverage could have a material adverse
effect on our financial performance.
Our
certificate of incorporation and bylaws, tax benefit preservation
plan and Delaware law contain provisions that could discourage a
third party from acquiring us or limit the price third parties are
willing to pay for our stock.
Provisions of our restated certificate of
incorporation and bylaws relating to our corporate governance and
provisions in our Tax Benefit Preservation Plan could make it
difficult for a third party to acquire us, and could discourage a
third party from attempting to acquire control of us. These
provisions could limit the price that some investors might be
willing to pay in the future for shares of our common stock and may
have the effect of delaying or preventing a change in control. The
issuance of preferred stock also could decrease the amount of
earnings and assets available for distribution to the holders of
common stock or could adversely affect the rights and powers,
including voting rights, of the holders of the common
stock.
Our
restated certificate of incorporation allows us to issue preferred
stock with rights senior to those of the common stock without any
further vote or action by the stockholders. Our restated
certificate of incorporation also provides that the board of
directors is divided into three classes, which may have the effect
of delaying or preventing changes in control or change in our
management because less than a majority of the board of directors
are up for election at each annual meeting. In addition, provisions
in our restated certificate of incorporation and
bylaws:
●
Require
that actions to be taken by our stockholders may be taken only at
an annual or special meeting of our stockholders and not by written
consent;
●
Specify
that special meetings of our stockholders can be called only by our
board of directors, a committee of the board of directors, the
Chairman of our board of directors or our President;
●
Establish
advance notice procedures for stockholders to submit nominations of
candidates for election to our board of directors and other
proposals to be brought before a stockholders meeting;
●
Provide
that our bylaws may be amended by our board of directors without
stockholder approval;
●
Allow
our board of directors to establish the size of our board of
directors;
●
Provide
that vacancies on our board of directors or newly created
directorships resulting from an increase in the number of our
directors may be filled only by a majority of directors then in
office, even though less than a quorum; and
●
Do
not give the holders of our common stock cumulative voting rights
with respect to the election of directors.
These
provisions could make it more difficult for stockholders to effect
corporate actions such as a merger, asset sale or other change in
control of us.
Under our Tax Benefit Preservation Plan, rights to
purchase capital stock of the Company (“Rights”) have been distributed as a dividend at
the rate of five Rights for each share of common
stock. Each Right entitles its holder, upon triggering
of the Rights, to purchase one one-hundredth of a share of Series A
Junior Participating Preferred Stock of the Company at a price of
$73.00 (as such price may be adjusted under the Tax Benefit
Preservation Plan) or, in certain circumstances, to instead acquire
shares of common stock. The Rights will convert into a right to
acquire common stock or other capital stock of the Company in
certain circumstances and subject to certain
exceptions. The Rights will be triggered upon the
acquisition of 4.90% or more of the Company’s outstanding
common stock or future acquisitions by any existing holders of
4.90% or more of the Company’s outstanding common stock. If a
person or group acquires 4.90% or more of our common stock, all
Rights holders, except the acquirer, will be entitled to acquire at
the then exercise price of a Right that number of shares of our
common stock which, at the time, has a market value of two times
the exercise price of the Right. The Tax Benefit
Preservation Plan authorizes our board of directors to exercise
discretionary authority to deem a person acquiring common stock in
excess of 4.90% not to be an “Acquiring Person” under
the Tax Benefit Preservation Plan, and thereby not trigger the
Rights, if the Board finds that the beneficial ownership of the
shares by the person acquiring the shares will not be likely
to directly or indirectly limit the availability to the Company of
the net operating loss carryovers and other tax attributes that the
plan is intended to preserve or is otherwise in the best
interests of the Company.
We
are also subject to Section 203 of the Delaware General
Corporation Law. In general, the statute prohibits a publicly-held
Delaware corporation from engaging in a “business
combination” with an “interested stockholder” for
a period of three years after the date of the transaction in which
the person became an interested stockholder, unless the business
combination is approved in a prescribed manner. For purposes of
Section 203, a “business combination” includes a
merger, asset sale or other transaction resulting in a financial
benefit to the interested stockholder, and an “interested
stockholder” is a person who, together with affiliates and
associates, owns or did own 15% or more of the corporation’s
voting stock. Section 203 could discourage a third party from
attempting to acquire control of us.
If our
internal controls and procedures fail, our financial condition,
results of operations and cash flow could be materially and
adversely affected.
Management is responsible for establishing and
maintaining adequate internal control over financial reporting. Our
internal control over financial reporting is a process designed to
provide reasonable assurance regarding the reliability of financial
reporting and the preparation of financial statements for external
purposes in accordance with generally accepted accounting
principles. In making its assessment of the effectiveness of our
internal control over financial reporting as of December 31,
2017, management used the criteria described in Internal
Control-Integrated Framework issued by the Committee of Sponsoring
Organizations of the Treadway Commission. As a result of the
identification of the material weakness described below, our
management concluded that our internal control over financial
reporting was not effective as of December 31,
2017
On
March 14, 2018, Moss Adams LLP, our independent registered public
accounting firm, advised us that they believed there were control
deficiencies in our internal controls over financial reporting such
that in the aggregate they constituted a material weakness.
Specifically, our independent accounting firm believed we did not
adequately evidence management’s expectations, criteria for
investigation, and the level of precision used in the performance
of the controls. A material weakness is a deficiency, or
combination of deficiencies, in internal control over financial
reporting, such that there is a reasonable possibility that a
material misstatement of our annual or interim financial statements
will not be prevented or detected on a timely basis.
See
Part II, Item 9A, “Controls and Procedures” of this
Annual Report on Form 10-K.
Our
management is in the process of evaluating the material weakness
described above and intends to promptly remediate it. We are
committed to continuing to improve our internal control processes
and intend to implement controls to better evidence
management’s expectation; however, we cannot be certain of
the effectiveness of such implementation or that, in the future,
additional material weaknesses or significant deficiencies will not
exist or otherwise be discovered. If we are unable to maintain
proper and effective internal controls, we may not be able to
produce timely and accurate financial statements and prevent fraud.
In addition, if we are unable to successfully remediate the
material weaknesses in our internal controls or if we are unable to
produce accurate and timely financial statements, our stock price
may be adversely affected and we may be unable to maintain
compliance with The Nasdaq Capital Market listing
requirements
If we lose
our key personnel or are unable to attract, train and retain
additional highly qualified sales, marketing, managerial and
technical personnel, our business may suffer.
Our future success depends on our ability to
identify, hire, train and retain highly qualified sales, marketing,
managerial and technical personnel. In addition, as we
introduce new services we may need to hire additional personnel. We
may not be able to attract, assimilate or retain such personnel in
the future. The inability to attract and retain the necessary
managerial, technical, sales and marketing personnel could have a
material adverse effect on our financial
performance.
Our
business and operations are substantially dependent on the
performance of our executive officers and key
employees. Each of these executive officers would be
difficult to replace. There is no guarantee that these or any
of our other executive officers and key employees will remain
employed with us. The loss of the services of one or more of our
executive officers or key employees could have a material adverse
effect on our financial performance.
Item 1B.
Unresolved
Staff Comments
Not
applicable.
Item 2.
Properties
Our
headquarters are located in Irvine, California. Our headquarters
consist of approximately 33,000 square feet of leased office space
under a lease that expires in July 2020. Our Tampa, Florida
SEM operations are located in offices consisting of approximately
13,000 square feet under a lease that expires in May 2024. Our
website development operations located in Guatemala City, Guatemala
occupy approximately 10,000 square feet of leased office space
under leases that expire in March 2020. We believe that our
existing facilities are adequate to meet our needs and that
existing needs and future growth can be accommodated by leasing
alternative or additional space.
Item 3.
Legal
Proceedings
From time to time, we may be involved in
litigation matters arising from the normal course of our business
activities. Litigation, even if not meritorious, could result in
substantial costs and diversion of resources and management
attention, and an adverse outcome in litigation could materially
adversely affect our business, results of operations, financial
condition, cash flows, earnings per share and stock
price. Following the announcement of our financial results
for the year ended December 31, 2017 and the departures of our
Chief Executive Officer and Chief Financial Officer, the market
price of our common stock declined significantly and a law firm
announced publicly that it is investigating investor claims. See
Risk Factors—“Securities Market
Risks” in Part I, Item 1A
of this Annual Report on Form 10K.
Item 4.
Mine Safety
Disclosures
Not
applicable.
PART II
Item 5.
Market for Registrant’s Common Equity, Related Stockholder
Matters and Issuer Purchases of Equity Securities
Our
common stock, par value $0.001 per share, is listed on The Nasdaq
Capital Market and trades under the symbol “AUTO.” The
following table sets forth, for the calendar quarters indicated,
the range of high and low sales prices of our common
stock:
|
Year
|
High
|
Low
|
|
2016
|
|
|
|
First
Quarter
|
$21.01
|
$14.56
|
|
Second
Quarter
|
18.74
|
12.34
|
|
Third
Quarter
|
17.80
|
13.49
|
|
Fourth
Quarter
|
18.28
|
11.04
|
|
|
|
|
|
2017
|
|
|
|
First
Quarter
|
14.18
|
12.01
|
|
Second
Quarter
|
14.09
|
11.65
|
|
Third
Quarter
|
12.92
|
6.89
|
|
Fourth
Quarter
|
9.62
|
6.70
|
As
of March 12, 2018, there were 228 holders of record of our common
stock. We have never declared or paid any cash dividends on our
common stock and we do not expect to pay any cash dividends in the
foreseeable future. Payment of any future dividends will
depend on our earnings, cash flows and financial condition and will
be subject to legal and contractual restrictions. As of
March 12, 2018, our common stock closing price was $3.97 per
share.
Purchases of Equity Securities by Issuer
The
following table provides information with respect to Company
purchases of the Company’s common stock during the three
months ended December 31, 2017:
|
Period
|
Total Number of
Shares (or Units) Purchased
|
Average Price Paid
per Share (or Unit)
|
Total Number of
Shares (or Units) Purchased as Part of Publicly Announced Plans or
Programs (1)
|
Maximum Number (or
Approximate Dollar Value) of Shares (or Units) that May Yet Be
Purchased Under the Plans or Programs
|
|
|
|
|
|
|
|
October 1, 2017
– October 31, 2017
|
—
|
—
|
—
|
$3,024,751
|
|
|
|
|
|
|
|
November 1, 2017
– November 30, 2017
|
66,877
|
$8.70
|
66,877
|
2,442,874
|
|
|
|
|
|
|
|
December 1, 2017
– December 31, 2017
|
14,000
|
8.61
|
14,000
|
2,322,352
|
|
|
|
|
|
|
|
Total
|
80,877
|
$8.68
|
80,877
|
$2,322,352
|
(1)
On
September 6, 2017, the Company announced that its board of
directors authorized the Company to repurchase up to $3.0 million
of the Company’s common stock. Shares repurchased under this
program have been retired and returned to the status of authorized
and unissued shares. The authorization may be increased
or otherwise modified, renewed, suspended or terminated by the
Company at any time, without prior notice. The Company
may repurchase the Company’s common stock from time to time
on the open market or in private transactions. The Company funded
repurchases and anticipates that it will fund future repurchases,
if any, through the use of available cash.
Performance Graph
The
following graph shows a comparison of cumulative total stockholder
returns for our common stock, the NASDAQ Composite, the S&P
Automobile Manufacturers Index, and the S&P Smallcap 600
Automotive Retail Index. The comparisons reflected in
the graph and table below are not intended to predict the future
performance of our stock and may not be indicative of our future
performance. The data regarding our common stock assume
an investment in our common stock at the closing price of $3.98 per
share of our common stock on December 31, 2012.
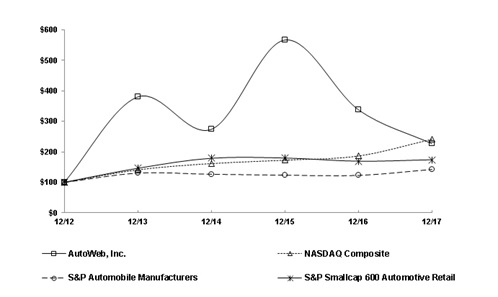
|
|
Cumulative Total Return
|
|||||
|
|
12/12
|
12/13
|
12/14
|
12/15
|
12/16
|
12/17
|
|
AutoWeb,
Inc.
|
$100.00
|
$380.15
|
$273.87
|
$566.83
|
$337.94
|
$226.38
|
|
NASDAQ
Composite
|
100.00
|
141.63
|
162.09
|
173.33
|
187.19
|
242.29
|
|
S&P
Automobile Manufacturers
|
100.00
|
130.10
|
126.21
|
123.53
|
122.70
|
141.93
|
|
S&P
Smallcap 600 Automotive Retail
|
100.00
|
146.11
|
178.96
|
179.73
|
169.27
|
174.03
|
The
tables below set forth our selected consolidated financial
data. We prepared this information using the
consolidated financial statements of AutoWeb for the five years
ended December 31, 2017. Certain amounts in the selected
consolidated financial data have been reclassified to conform to
the current year presentation. You should read
these selected consolidated financial data together with the
Consolidated Financial Statements and related Notes to the
Consolidated Financial Statements contained in this Annual Report
on Form 10-K and also Item 7, “Management’s Discussion
and Analysis of Financial Condition and Results of
Operations.”
|
|
Years ended December 31,
|
||||
|
|
2017 (1)
|
2016
|
2015
|
2014
|
2013 (2)
|
|
|
(Amounts in thousands, except per-share data)
|
||||
|
RESULTS
OF OPERATIONS:
|
|
|
|
|
|
|
Total
revenues
|
$142,125
|
$156,684
|
$133,226
|
$106,278
|
$78,361
|
|
Income
(loss) from continuing operations
|
$(64,964)
|
$3,871
|
$4,646
|
$3,411
|
$38,144
|
|
Net
income (loss)
|
$(64,964)
|
$3,871
|
$4,646
|
$3,411
|
$38,144
|
|
Basic
earnings (loss) per common share
|
$(5.48)
|
$0.36
|
$0.47
|
$0.38
|
$4.29
|
|
Diluted
earnings (loss) per common share
|
$(5.48)
|
$0.29
|
$0.37
|
$0.32
|
$3.61
|
|
Weighted
average diluted shares
|
11,853
|
13,303
|
12,662
|
11,212
|
10,616
|
(1)
Net
income in 2017 included goodwill impairment of $37.7 million and
$16.7 million recording of a valuation allowance.
(2)
Net income in 2013 included a one-time benefit of $35.5
million in connection with the release of a valuation allowance
against deferred tax assets.
|
|
Years ended December 31,
|
||||
|
|
2017
|
2016
|
2015
|
2014
|
2013
|
|
|
(Amounts in thousands)
|
||||
|
FINANCIAL
POSITION (1):
|
|
|
|
|
|
|
Cash
and cash equivalents
|
$24,993
|
$38,512
|
$23,993
|
$20,747
|
$18,930
|
|
Total
assets
|
$92,913
|
$165,281
|
$153,588
|
$104,749
|
$88,193
|
|
Non-current
liabilities
|
$9,000
|
$16,500
|
$21,750
|
$11,061
|
$10,450
|
|
Accumulated
deficit
|
$(288,900)
|
$(230,424)
|
$(234,295)
|
$(238,941)
|
$(242,352)
|
|
Stockholders’
equity
|
$67,167
|
$119,609
|
$108,201
|
$69,258
|
$64,828
|
(1)
See
Part II, Item 7, “Management’s Discussion and Analysis
of Financial Condition and Results of Operations” and
“Notes to the Consolidated Financial Statements” in
Part II, Item 8, of this Annual Report on Form 10-K for information
regarding business combinations and other items that may affect
comparability.
Item 7.
Management’s Discussion and Analysis of
Financial Condition and Results of Operations
You
should read the following discussion of our results of operations
and financial condition in conjunction with the “Risk
Factors” included in Part I, Item 1A and our
Consolidated Financial Statements and related Notes thereto
included in Part II, Item 8 of this Annual Report on
Form 10-K. See also the discussion of
“Forward-Looking Statements” immediately preceding Part
I of this Annual Report on Form 10-K.
For the year ended December 31, 2017, our
business, results of operations and financial condition were
affected and may continue to be affected in the future by the
events that occurred during or subsequent to year end that are
described in Part I, Item 1 “Business –
Significant
Business Developments” of
this Annual report on Form 10-K. Total revenues in
2017 were $142.1 million compared to $156.7 million in 2016. The
decline in revenue was due to unfulfilled demand for our Leads as a
result of higher traffic acquisition costs as well as channel mix
issues resulting from a lower retail dealer count. The lower
revenue was partially offset by continued growth of advertising
click revenues. We believe that a large part of the increase in
traffic acquisition costs were a result of an increased SEM spend
from several of our competitors. We will continue to work with our
traffic partners to optimize our SEM methodologies and rebuild our
high-quality traffic streams. In addition, in order to
mitigate the impact to profitability, we realigned our headcount
and expect it to reduce operating expenses. We cannot provide an
exact timeframe for resolution of these issues, and these trends
may continue into 2018 and beyond.
Results of Operations
The
following table sets forth our results of operations as a
percentage of total revenues:
|
|
Years Ended December 31,
|
||
|
|
2017
|
2016
|
2015
|
|
Revenues:
|
|
|
|
|
Lead
fees
|
75.3%
|
83.4%
|
90.6%
|
|
Advertising
|
24.0
|
15.6
|
7.9
|
|
Other
revenues
|
0.7
|
1.0
|
1.5
|
|
Total
revenues
|
100.0
|
100.0
|
100.0
|
|
Cost
of revenues
|
69.9
|
63.0
|
61.2
|
|
Gross
margin
|
30.1
|
37.0
|
38.8
|
|
Operating
expenses:
|
|
|
|
|
Sales
and marketing
|
10.1
|
11.6
|
12.0
|
|
Technology
support
|
8.8
|
8.9
|
8.8
|
|
General
and administrative
|
8.5
|
9.4
|
9.9
|
|
Depreciation
and amortization
|
3.4
|
3.2
|
2.3
|
|
Litigation
settlements
|
(0.1)
|
—
|
(0.1)
|
|
Goodwill
impairment
|
26.5
|
—
|
—
|
|
Total
operating expenses
|
57.2
|
33.1
|
32.9
|
|
Operating
income (loss)
|
(27.1)
|
3.9
|
5.8
|
|
Interest
and other income (expense), net
|
(0.7)
|
0.4
|
0.2
|
|
Income
tax provision
|
17.9
|
1.8
|
2.5
|
|
Net
income (loss)
|
(45.7%)
|
2.5%
|
3.5%
|
Revenues
by groups of similar services and gross profits are as follows
(dollars in thousands):
|
|
Years Ended
December 31,
|
2017 vs. 2016
Change
|
2016 vs. 2015
Change
|
||||
|
|
2017
|
2016
|
2015
|
$
|
%
|
$
|
%
|
|
Revenues:
|
|
|
|
|
|
|
|
|
Lead
fees
|
$107,045
|
$130,684
|
$120,678
|
$(23,639)
|
(18%)
|
$10,006
|
8%
|
|
Advertising
|
34,142
|
24,508
|
10,534
|
9,634
|
39
|
13,974
|
133
|
|
Other
revenues
|
938
|
1,492
|
2,014
|
(554)
|
(37)
|
(522)
|
(26)
|
|
Total
revenues
|
142,125
|
156,684
|
133,226
|
(14,559)
|
(9)
|
23,458
|
18
|
|
Cost
of revenues
|
99,352
|
98,771
|
81,586
|
581
|
1
|
17,185
|
21
|
|
Gross
profit
|
$42,773
|
$57,913
|
$51,640
|
$(15,140)
|
(26%)
|
$6,273
|
12%
|
2017 Compared to 2016
Lead fees. Lead fees decreased $23.6 million or 18% in 2017
compared to 2016. The decrease in Lead fees was a result of the
elimination of poor quality traffic in the second quarter of 2017,
decreased Lead sales to Dealers combined with increased Dealer
churn and the disposal of our specialty finance leads product in
December 2016.
Advertising. The
$9.6 million or 39% increase in advertising revenues in 2017
compared to 2016 was primarily due to an increase in click revenue
as a result of both increased click volume and
pricing.
Other
revenues. Other
revenues decreased $0.6 million or 37% in 2017 compared to
2016. The decrease in other revenues was primarily due
to lower customer utilization of the mobile offerings and SaleMove
product.
Cost of Revenues.
Cost of revenues consists of Lead and
traffic acquisition costs and other costs. Lead and traffic
acquisition costs consist of payments made to our third party Lead
providers, including internet portals and online automotive
information providers, as well as SEM costs. Other cost of revenues
consists of fees paid to third parties for data and content,
including SEO activity, included on our properties, connectivity
costs, development costs related to our websites, compensation
related expense and technology license fees, server equipment
depreciation and technology amortization directly related to the
Company Websites. SEM, sometimes referred to as paid search
marketing, is the practice of bidding on keywords on search engines
to drive traffic to a website.
The
$0.6 million or 1% increase in cost of revenues in 2017 compared to
2016 was primarily due to the increased costs in traffic
acquisition activity. Cost of revenues increased as a percentage of
total revenues as a result of the $0.6 million increase in cost of
revenues and the $23.6 million, or 18%, decrease in total
revenues.
2016 Compared to 2015
Lead fees. Lead fees increased $10.0 million or 8% in 2016
compared to 2015. The increase in Lead fees was primarily due to
increased lead volume associated with the acquisitions of Dealix
Corporation and Autotegrity, Inc. (collectively,
“Dealix/Autotegrity”)
in May 2015.
Advertising. The
$14.0 million or 133% increase in advertising revenues in 2016
compared to 2015 was primarily due to an increase in click revenue
as a result of both increased click volume and pricing. Increased
click volume was the result of increased investments in traffic
acquisition activity.
Other
revenues. Other
revenues decreased $0.5 million or 26% in 2016 compared to
2015. The decrease in other revenues was primarily due
to the discontinuation of a Manufacturer’s brand using other
non-Lead products.
Cost of Revenues.
The $17.2 million or 21% increase in
cost of revenues in 2016 compared to 2015 was primarily due to
increased lead volume from the Dealix/Autotegrity acquisition in
May 2015 together with increased intangible amortization costs from
both the Dealix/Autotegrity acquisition and the acquisition of
AutoWeb, Inc. in October 2015, and an increased investment in
additional traffic acquisition methodologies.
Operating
expenses were as follows (dollars in thousands):
|
|
Years Ended December 31,
|
2017 vs. 2016
Change
|
2016 vs. 2015
Change
|
||||
|
|
2017
|
2016
|
2015
|
$
|
%
|
$
|
%
|
|
Operating
expenses:
|
|
|
|
|
|
|
|
|
Sales
and marketing
|
$14,315
|
$18,118
|
$15,956
|
$(3,803)
|
(21%)
|
$2,162
|
14%
|
|
Technology
support
|
12,567
|
13,986
|
11,740
|
(1,419)
|
(10)
|
2,246
|
19
|
|
General
and administrative
|
12,110
|
14,663
|
13,189
|
(2,553)
|
(17)
|
1,474
|
11
|
|
Depreciation
and amortization
|
4,781
|
5,068
|
3,106
|
(287)
|
(6)
|
1,962
|
63
|
|
Litigation
settlements
|
(109)
|
(50)
|
(108)
|
(59)
|
118
|
58
|
(54)
|
|
Goodwill
impairment
|
37,688
|
——
|
—
|
37,688
|
—
|
—
|
—
|
|
Total
operating expenses
|
$81,352
|
$51,785
|
$43,883
|
$29,567
|
57%
|
$7,902
|
18%
|
2017 Compared to 2016
Sales and Marketing.
Sales and marketing expense includes
costs for developing our brand, personnel costs, and other costs
associated with Dealer sales, website advertising, Dealer support
and bad debt expense.
Sales
and marketing expense for the year ended December 31, 2017
decreased by $3.8 million or 21% compared to the prior year, due to
a decrease in overall headcount related expenses.
Technology
Support. Technology
support includes compensation, benefits, software licenses and
other direct costs incurred by the Company to enhance, manage,
maintain, support, monitor and operate the Company's websites and
related technologies, and to operate the Company's internal
technology infrastructure.
Technology
support expense for the year ended December 31, 2017 decreased by
$1.4 million or 10% compared to the prior year, primarily due to a
decrease in headcount related costs.
General and
Administrative. General and
administrative expense consists of certain executive, financial,
human resources, legal and facilities personnel expenses and costs
related to being a publicly-traded company.
General
and administrative expense for the year ended December 31,
2017 decreased by $2.6 million or 17% compared to the prior year.
The decrease was due to a decrease in headcount related
costs.
Depreciation and
Amortization. Depreciation and amortization expense for the year
ended December 31, 2017 decreased $0.3 million or 6% from the year
ended December 31, 2016 primarily due to some intangible assets
becoming fully amortized during the year.
Litigation
Settlements. Payments
received primarily from 2010 settlements of patent infringement
claims against third parties relating to the third parties’
methods of Lead delivery were $0.1 million in 2017 compared to
$50,000 in 2016. We also paid $41,000 related to settlement of
claims alleged under the Controlling the Assault of
Non-Solicited Pornography And Marketing Act of 2003 inherited in connection with the acquisition of
Dealix/Autotegrity in 2016.
Goodwill impairment.
As discussed below, we evaluate the
carrying value of enterprise goodwill for impairment, at a minimum,
on an annual basis. During 2017 we performed our annual impairment
test by comparing the carrying value of AutoWeb to its fair value
based on market capitalization at that date. As a result of this
testing, a non-cash impairment charge of $37.7 million was recorded
during 2017.
Interest and Other Income
(Expense), net. Interest and
other expense was $0.9 million for the year ended December 31, 2017
compared to interest and other income of $0.6 million for the year
ended December 31, 2016. Interest expense was $0.8
million and $0.9 million for the years ended December 31, 2017 and
2016, respectively. The year ended December 31, 2017
included an impairment charge of $0.6 million related to SaleMove.
The year ended December 31, 2016 also included gain on disposal of
the finance leads product of $2.2 million offset by a $0.8 million
write-off related to our investment in GoMoto, Inc.
(“GoMoto’).
Income tax
provision. Income
tax expense was $25.4 million for the year ended December 31, 2017
compared to income tax expense of $2.8 million for the year ended
December 31, 2016. The Company’s effective tax
rate of (64.4)% for the year ended December 31, 2017 differed from
the federal statutory rate principally as a result of deferred tax
asset adjustments relating to the change in the U.S. federal rate,
goodwill impairment, and establishing additional valuation
allowances on our deferred tax assets. The Company’s
effective tax rate of 42.1% for the year ended December 31, 2016
differed from the federal statutory rate principally as a result of
deferred tax asset adjustments, state income taxes and permanent
non-deductible tax items. The TCJA reduced the U.S. federal corporate rate to 21%,
effective January 1, 2018. In addition, the TCJA limits the
Company’s annual deduction for business interest expense to
an amount equal to 30% of the Company’s “adjusted
taxable income” (as defined in the Internal Revenue Code) for
the taxable year, also effective January 1, 2018. The amount of any
business interest not allowed as a deduction for any taxable year
may be carried forward indefinitely and utilized in future years,
subject to this and other applicable interest deductibility
limitations.
2016 Compared to 2015
Sales and Marketing.
Sales and marketing expense for the
year ended December 31, 2016 increased by $2.2 million or 14%
compared to the prior year, due to increased headcount related
costs associated with the Dealix/Autotegrity and AutoWeb
acquisitions coupled with severance expense of $0.6 million and
accelerated stock compensation expense of $0.3 million associated
with the termination of two executive officers.
Technology
Support. Technology
support expense for the year ended December 31, 2016 increased by
$2.2 million or 19% compared to the prior year, primarily due to
increased headcount related costs associated with the
Dealix/Autotegrity and AutoWeb acquisitions coupled with severance
expense of $0.3 million and accelerated stock compensation expense
of $0.2 million associated with the termination of an executive
officer.
General and
Administrative. General and
administrative expense for the year ended December 31, 2016
increased by $1.5 million or 11% compared to the prior year. The
increase was due to increased headcount costs and facility fees,
offset with a reduction in professional fees all associated with
the Dealix/Autotegrity and AutoWeb acquisitions, together with $0.3
million in severance expense and $0.2 million in accelerated stock
compensation expense for a terminated executive
officer.
Depreciation and
Amortization. Depreciation and amortization expense for the year
ended December 31, 2016 increased $2.0 million or 63% from the year
ended December 31, 2015 primarily due to the addition of intangible
assets associated with the Dealix/Autotegrity and AutoWeb
acquisitions.
Litigation
Settlements. Payments
received primarily from 2010 settlements of patent infringement
claims against third parties relating to the third parties’
methods of Lead delivery were $50,000 in 2016 compared to $108,000
in 2015. We also paid $41,000 related to settlement of claims
alleged under the Controlling the Assault of Non-Solicited
Pornography And Marketing Act of 2003 inherited in connection with the acquisition of
Dealix/Autotegrity in 2016.
Interest and Other Income
(Expense), net. Interest and
other income was $0.6 million for the year ended December 31, 2016
compared to interest and other income of $0.3 million for the year
ended December 31, 2015. Interest expense was $0.9
million and $0.8 million for the years ended December 31, 2016 and
2015, respectively. The year ended December 31, 2016
also included gain on disposal of the finance leads product of $2.2
million offset by a $0.8 million write-off related to our
investment in GoMoto.
Income tax
provision. Income
tax expense was $2.8 million for the year ended December 31, 2016
compared to income tax expense of $3.4 million for the year ended
December 31, 2015. The Company’s effective tax
rate of 42.1% for the year ended December 31, 2016 differed from
the federal statutory rate principally as a result of deferred tax
asset adjustments and state income taxes and permanent
non-deductible tax items. The Company’s effective
tax rate of 42.5% for the year ended December 31, 2015 differed
from the federal statutory rate principally as a result of deferred
tax asset adjustments and state income taxes.
Segment Information
We
conduct our business within one business segment, which is defined
as providing digital marketing services to the automotive
industry. Our operations are aggregated into a single
reportable operating segment based upon similar economic and
operating characteristics as well as similar
markets.
Liquidity and Capital Resources
The
table below sets forth a summary of our cash flow for the years
ended December 31, 2017, 2016 and 2015 (dollars in
thousands):
|
|
Years Ended December31,
|
||
|
|
2017
|
2016
|
2015
|
|
|
|
|
|
|
Net
cash provided by operating activities
|
$11,488
|
$18,242
|
$12,200
|
|
Net
cash used in investing activities
|
(10,402)
|
(2,774)
|
(28,105)
|
|
Net
cash (used in) provided by financing activities
|
(14,605)
|
(949)
|
19,151
|
Our
principal sources of liquidity are our cash and cash equivalents
and accounts receivable balances. Our cash and cash equivalents
totaled $25.0 million as of December 31, 2017 compared to
$38.5 million as of December 31, 2016.
On
June 7, 2012, we announced that the board of directors had
authorized us to repurchase up to $2.0 million of our common stock,
and on September 17, 2014 we announced that our board of
directors had approved the repurchase of up to an additional $1.0
million of our common stock. On September 6, 2017, we
announced that our board of directors had authorized us to
repurchase up to $3.0 million of our common stock. We repurchased
226,698 shares of our common stock with an average price of $8.37
per share during 2017. No shares were repurchased during 2016. The
authorization may be increased or otherwise modified, renewed,
suspended or terminated by us at any time, without prior
notice. We may repurchase our common stock from time to
time on the open market or in private transactions. Shares
repurchased under this program have been retired and returned to
the status of authorized and unissued shares. We funded
repurchases and anticipate that we would fund future repurchases
through the use of available cash. The repurchase
authorization does not obligate us to repurchase any particular
number of shares. The timing and actual number of
repurchases of additional shares, if any, under our stock
repurchase program will depend upon a variety of factors, including
price, market conditions, release of quarterly and annual earnings,
and other legal, regulatory, and corporate considerations at our
sole discretion. The impact of repurchases on our Tax
Benefit Preservation Plan, as amended, and on the our use of net
operating loss carryovers and other tax attributes if we were to
experience an “ownership change,” as defined in Section
382 of the Internal Revenue Code, is also a factor that we consider
in connection with share repurchases. As of December 31,
2017, $2.3 million remains available for repurchase under the
program.
The Company and MUFG Union Bank, N.A.
(“Union Bank”), have entered into a Loan Agreement dated
February 26, 2013, as amended on September 10, 2013, January 13,
2014, May 20, 2015, June 1, 2016, June 28, 2017 and December 27,
2017 (the original Loan Agreement, as amended to date, is referred
to collectively as the “Credit Facility
Agreement”). Until December 31, 2017, the
Credit Facility Agreement provided for (i) a $9.0 million term loan
(“Term
Loan 1”); (ii) a $15.0
million term loan (“Term Loan 2”); and (iii) an $8.0 million working
capital revolving line of credit (“Revolving
Loan”). Term Loan 1
and Term Loan 2 were fully paid as of December 31, 2017. The
outstanding balance of the Revolving Loan as of December 31, 2017
was $8.0 million.
Borrowings
under the Revolving Loan bear interest at either (i) the LIBOR plus
2.50% or (ii) the bank’s Reference Rate (prime rate) minus
0.50%, at the option of the Company. Interest under the Revolving
Loan adjusts (i) at the end of each LIBOR rate period (1, 2, 3, 6
or 12 months terms) selected by the Company, if the LIBOR rate is
selected; or (ii) with changes in Union Bank’s Reference
Rate, if the Reference Rate is selected. The Company pays a
commitment fee of 0.10% per year on the unused portion of the
Revolving Loan, payable quarterly in arrears. Borrowings under the
Revolving Loan are secured by a first priority security interest on
all of the Company’s personal property (including, but not
limited to, accounts receivable) and proceeds thereof. The maturity
date of the Revolving Loan is January 5, 2021. Borrowings under the
Revolving Loan may be used as a source to finance working capital,
capital expenditures, acquisitions and stock buybacks and for other
general corporate purposes.
The
Credit Facility Agreement contains certain customary affirmative
and negative covenants and restrictive and financial covenants,
which the Company was in compliance with as of December 31, 2017.
The Company is in negotiations with Union Bank regarding possible
amendments to the Credit Facility Agreement to be effective prior
to March 31, 2018, which amendments could require a partial paydown
of the Revolver Loan. In the event these amendments are not entered
into prior to March 31, 2018, the Company anticipates that it will
pay off the Revolving Loan in full.
We
believe our current cash and cash equivalent balances together with
anticipated cash flows from operations will be sufficient to
satisfy our working capital and capital expenditure requirements
for at least the next 12 months.
Net Cash Provided by Operating
Activities. Net cash
provided by operating activities in 2017 of $11.5 million resulted
primarily from net loss of $65.0 million, adjustments for non-cash
charges to earnings of $75.9 million and an increase in working
capital.
Net
cash provided by operating activities in 2016 of $18.2 million
resulted primarily from net income of $3.9 million, adjustments for
non-cash charges to earnings of $13.4 million and an increase in
working capital.
Net Cash Used in Investing
Activities. Net cash
used in investing activities of $10.4 million in 2017 primarily
consisted of $1.8 million in purchases of property and equipment
and expenditures related to capitalized internal use software and
$8.6 million used to purchase intangible
assets.
Net
cash used in investing activities of $2.8 million in 2016 primarily
consisted of a $0.4 million investment in GoMoto, a $0.3 million in
a short-term investment and $2.1 million in purchases of property
and equipment and expenditures related to capitalized internal use
software.
Net Cash (Used in) Provided by
Financing Activities. Net cash
used in financing activities of $14.6 million in 2017 consisted of
payments on term loan borrowings of $14.1 million and cash used to
repurchase Company common stock of $1.9 million. Stock
options for 248,344 shares of the Company’s common stock were
exercised in the year ended December 31, 2017 resulting in $1.4
million of cash
inflow.
Net
cash used in financing activities of $0.9 million in 2016 consisted
of payments on term loan borrowings of $3.9
million. Stock options for 386,001 shares of the
Company’s common stock were exercised in the year ended
December 31, 2016 resulting in $3.1 million of cash
inflow.
Contractual Obligations
The
following table provides aggregated information about our
outstanding contractual obligations as of December 31, 2017
(in thousands):
|
|
Total
|
Less than 1 year
|
1-3 years
|
3-5 years
|
More than 5 years
|
|
Long-term
Debt Obligations (a)
|
$9,000
|
$—
|
$1,000
|
$8,000
|
$—
|
|
Operating
Lease Obligations (b)
|
5,467
|
1,526
|
2,349
|
920
|
672
|
|
Total
|
$14,467
|
$1,526
|
$3,349
|
$8,920
|
$672
|
(a)
Long-term
debt obligations as defined by ASC 470, “Debt,” and
disclosed in Note 5 and 6 of the consolidated
financial statements included in Part II, Item 8 of this Annual
Report on Form 10-K.
(b)
Operating
lease obligations as defined by ASC 840, “Leases,” and
disclosed in Note 7 of the consolidated financial statements
included in Part II, Item 8 of this Annual Report on Form
10-K.
Off-Balance Sheet Arrangements
We
do not have any material off-balance sheet
arrangements.
Critical
Accounting Policies and Estimates
We prepare our financial statements in conformity
with accounting principles generally accepted in the United States
of America (“U.S. GAAP”), which require us to make estimates and
assumptions that affect the reported amounts of assets and
liabilities and disclosure of contingent assets and liabilities at
the date of the financial statements and the reported amounts of
revenues and expenses during the reporting period. We believe the
following critical accounting policies, among others, require
significant judgment in determining estimates and assumptions used
in the preparation of our consolidated financial
statements. Accordingly, actual results could differ
materially from our estimates. To the extent that there are
material differences between these estimates and our actual
results, our financial condition or results of operations may be
affected. For a detailed discussion of the application of these and
other accounting policies, see Note 2 of the “Notes to
Consolidated Financial Statements” in Part II, Item 8
“Financial Statements and Supplementary Data” of this
Annual Report on Form 10-K.
Revenue Recognition.
Leads consist of vehicle buying Leads
for new and used vehicles request fees. Fees paid by
Dealers and Manufacturers participating in our Lead programs are
comprised of monthly transaction and/or subscription
fees. Advertising revenues represent fees for display
advertising on our websites and fees from our click
program.
We
recognize revenues when evidence of an arrangement exists, pricing
is fixed and determinable, collection is reasonably assured, and
delivery or performance of service has occurred. Leads are
generally recognized as revenues in the period the service is
provided. Advertising revenues are generally recognized in the
period the advertisements are displayed on our websites and the
period in which clicks have been delivered. Fees billed prior to
providing services are deferred, as they do not satisfy all U.S.
GAAP revenue recognition criteria. Deferred revenues are recognized
as revenue over the periods services are provided.
Investments. We make strategic
investments because we believe that they may allow us to
increase market share, benefit from advancements in technology and
strengthen our business operations by enhancing our product and
service offerings.
Allowances for Bad Debt and
Customer Credits. We
estimate and record allowances for potential bad debts and customer
credits based on factors such as the write-off percentages, the
current business environment and known concerns within our accounts
receivable balances.
The
allowance for bad debts is our estimate of bad debt expense that
could result from the inability or refusal of our customers to pay
for our services. Additions to the estimated allowance for bad
debts are recorded as an increase in sales and marketing expenses
and are based on factors such as historical write-off percentages,
the current business environment and the known concerns within the
current aging of accounts receivable. Reductions in the estimated
allowance for bad debts due to subsequent cash recoveries are
recorded as a decrease in sales and marketing expenses. As specific
bad debts are identified, they are written-off against the
previously established estimated allowance for bad debts and have
no impact on operating expenses.
The
allowance for customer credits is our estimate of adjustments for
services that do not meet our customers’ requirements.
Additions to the estimated allowance for customer credits are
recorded as a reduction in revenues and are based on historical
experience of: (i) the amount of credits issued; (ii) the
length of time after services are rendered that the credits are
issued; (iii) other factors known at the time; and (iv) future
expectations. Reductions in the estimated allowance for customer
credits are recorded as an increase in revenues. As specific
customer credits are identified, they are written-off against the
previously established estimated allowance for customer credits and
have no impact on revenues.
If
there is a decline in the general economic environment that
negatively affects the financial condition of our customers or an
increase in the number of customers that are dissatisfied with our
services, additional estimated allowances for bad debts and
customer credits may be required and the impact on our business,
results of operations or financial condition could be
material. We generally do not require collateral to
support our accounts receivables.
Fair Value of Financial
Instruments. We record our
financial assets and liabilities at fair value, which is defined
under the applicable accounting standards as the exchange price
that would be received for an asset or paid to transfer a liability
(an exit price) in the principal or most advantageous market for
the asset or liability in an orderly transaction between market
participants on the measure date. We use valuation
techniques to measure fair value, maximizing the use of observable
outputs and minimizing the use of unobservable
inputs. The standard describes a fair value hierarchy
based on three levels of inputs, of which the first two are
considered observable and the last unobservable, that may be used
to measure fair value which are the following:
Level
1 – Quoted prices in active markets for identical assets or
liabilities.
Level
2 – Inputs other than Level 1 that are observable, either
directly or indirectly, such as quoted prices for similar assets or
liabilities; quoted prices in markets that are not active; or other
inputs that are observable or can be corroborated by observable
market data for substantially the full term of the assets or
liabilities.
Level
3 – Inputs include management’s best estimate of what
market participants would use in pricing the asset or liability at
the measurement date. The inputs are unobservable in the
market and significant to the instrument’s
valuation.
Cash
equivalents, accounts receivable, net of allowance, accounts
payable and accrued liabilities, are carried at cost, which
management believes approximates fair value because of the
short-term maturity of these instruments.
Our investments at December 31, 2017 and 2016
consisted primarily of investments in SaleMove, Inc.
(‘SaleMove”) and GoMoto and are accounted for under
the cost method. Although there is no established market for these
investments, we evaluated the investments for impairment by
comparing them to an estimated fair value and determined that there
is no impairment.
The following table presents the Company’s investment
activity for 2017 and 2016 (dollars in thousands):
|
|
Note
|
Note
|
|
|
|
receivable-
|
receivable-
|
|
|
Description
|
long-term
|
current
|
Investments
|
|
|
|
|
|
|
Balance
at December 31, 2015
|
$375
|
$—
|
$680
|
|
Purchases,
(sales), issuances and (settlements), net
|
(375)
|
750
|
—
|
|
Balance
at December 31, 2016
|
—
|
750
|
680
|
|
Reserve
for notes receivable
|
—
|
(750)
|
—
|
|
Net
balance at December 31, 2016
|
—
|
—
|
680
|
|
Write-offs
|
—
|
—
|
(580)
|
|
Net
balance at December 31, 2017
|
$—
|
$—
|
$100
|
The Company recorded an impairment of its
investment in SaleMove as of December 31, 2017 because we do not
believe SaleMove’s cash balance is sufficient to sustain its
cash burn rate as of December 31, 2017. The Company recorded
a reserve against the current notes receivable related to GoMoto as
of December 31, 2016 because the Company believes the amounts may
not be recoverable.
Variable Interest
Entities. We have an
investment in an entity that is considered a variable interest
entity (“VIE”) under U.S. GAAP. We have
concluded that our investment in SaleMove qualifies as a variable
interest and SaleMove is a VIE. VIEs are legal entities in which
the equity investors do not have sufficient equity at risk for the
entity to independently finance its activities or the collective
holders do not have the power through voting or similar rights to
direct the activities of the entity that most significantly impacts
its economic performance, the obligation to absorb the expected
losses of the entity, or the right to receive expected residual
returns of the entity. Consolidation of a VIE is considered
appropriate if a reporting entity is the primary beneficiary, the
party that has both significant influence and control over the VIE.
Management periodically performs a qualitative analysis to
determine if the Company is the primary beneficiary of a VIE. This
analysis includes review of the VIEs’ capital structures,
contractual terms, and primary activities, including the
Company’s ability to direct the activities of the VIEs and
obligations to absorb losses, or the right to receive benefits,
significant to the VIEs. Additionally, changes in our
various equity investments have in the past resulted in a
reconsideration event
Based
on our analysis, AutoWeb is not the primary beneficiary of
SaleMove. Accordingly, SaleMove does not meet the criteria for
consolidation. The SaleMove Advances are classified as an other
long-term asset on the consolidated balance sheet as of December
31, 2017. The carrying value and maximum potential loss
exposure from SaleMove was zero and $0.6 million as of December 31,
2017 and 2016, respectively.
Capitalized Internal Use
Software and Website Development
Costs. We capitalize
costs to develop internal use software in accordance with
Accounting Standards Codification (“ASC”) 350-40, Internal-Use
Software, and ASC 350-50, Website Development Costs, which require
the capitalization of external and internal computer software costs
and website development costs, respectively, incurred during the
application development stage. The application development stage is
characterized by software design and configuration activities,
coding, testing and installation. Training and maintenance costs
are expensed as incurred while upgrades and enhancements are
capitalized if it is probable that such expenditures will result in
additional functionality. Capitalized internal use software
development costs are amortized using the straight-line method over
an estimated useful life of three years. Capitalized website
development costs, once placed in service are amortized using the
straight-line method over the estimated useful lives of the related
websites.
Share-Based Compensation
Expense. We account for
our share-based compensation using the fair value method in
accordance with the Stock Compensation Topic of the
Codification. Under these provisions, we recognize
share-based compensation net of an estimated forfeiture rate and
therefore only recognize compensation cost for those shares
expected to vest over the service period of the award. The
fair value of each stock option award is estimated on the date of
grant using the Black-Scholes option pricing model based on the
underlying common stock closing price as of the date of grant, the
expected term, expected stock price volatility and expected
risk-free interest rates.
Calculating
share-based compensation expense requires the input of highly
subjective assumptions, including the expected term of the
share-based awards, expected stock price volatility and expected
pre-vesting option forfeitures. We estimate the expected life
of options granted based on historical experience, which we believe
is representative of future behavior. We estimate the
volatility of the price of our common stock at the date of grant
based on historical volatility of the price of our common stock for
a period equal to the expected term of the awards. We have
used historical volatility because we have a limited number of
options traded on our common stock to support the use of an implied
volatility or a combination of both historical and implied
volatility. The assumptions used in calculating the fair value of
share-based awards represent our best estimates, but these
estimates involve inherent uncertainties and the application of
management judgment. As a result, if factors change and we use
different assumptions, our share-based compensation expense could
be materially different in the future. In addition, we elected
to estimate the expected forfeiture rate and only recognize expense
for those shares expected to vest. We estimate the forfeiture
rate based on historical experience of our share-based awards that
are granted, exercised or cancelled. If our actual forfeiture
rate is materially different from our estimate, the share-based
compensation expense could be significantly different from what we
have recorded in the current period.
Income Taxes.
We account for income taxes under the
liability method. Deferred tax assets and liabilities are
recognized for the future tax consequences attributable to
temporary differences between the financial statement carrying
amounts of existing assets and liabilities and their respective tax
bases. Deferred tax assets and liabilities are measured using
enacted tax rates expected to apply to taxable income in the years
in which those temporary differences are expected to be recovered
or settled. The effect on deferred tax assets and liabilities of a
change in tax rates is recognized in income in the period that
includes the enactment date. We record a valuation allowance, if
necessary, to reduce deferred tax assets to an amount we believe is
more likely than not to be realized.
As
of December 31, 2017, we had $0.5 million of unrecognized tax
benefits. Our policy is to recognize interest and
penalties accrued on any unrecognized tax benefits as a component
of income tax expense. As of December 31, 2017, we did not
accrue interest associated with our unrecognized tax benefits, and
no interest expense was recognized in 2017.
On December 22, 2017, the U.S. government enacted
comprehensive tax legislation known as the TCJA. The TCJA
establishes new tax laws that will take effect in 2018, including,
but not limited to (1) reduction of the U.S. federal corporate tax
rate from a maximum of 35% to 21%; (2) elimination of the corporate
alternative minimum tax (“AMT”); (3) a new limitation on
deductible interest expense; (4) one-time transition tax on certain
deemed repatriated earnings of foreign subsidiaries
(“Transition
Tax”); (5) limitations on the deductibility of certain
executive compensation; (6) changes to the bonus depreciation rules
for fixed asset additions: and (7) limitations on net operating
losses (“NOLs”) generated
after December 31, 2017, to 80% of taxable
income.
ASC 740, Income Taxes, requires the effects of
changes in tax laws to be recognized in the period in which the
legislation is enacted. However, due to the complexity and
significance of the TCJA's provisions, the SEC staff issued Staff
Accounting Bulletin 118 (“SAB 118”), which provides guidance on accounting
for the tax effects of the TCJA. SAB 118 provides a measurement
period that should not extend beyond one year from the TCJA
enactment date for companies to complete the accounting under ASC
740. In accordance with SAB 118, a company must reflect the income
tax effects of those aspects of the TCJA for which the accounting
under ASC 740 is complete. To the extent that a company’s
accounting for certain income tax effects of the TCJA is incomplete
but it is able to determine a reasonable estimate, it must record a
provisional estimate in the financial statements. If a company
cannot determine a provisional estimate to be included in the
financial statements, it should continue to apply ASC 740 on the
basis of the provisions of the tax laws that were in effect
immediately before the enactment of the TCJA.
At
December 31, 2017, we have not completed our accounting for the tax
effects of enactment of the TCJA; however, we have made a
reasonable estimate of the effects of the TCJA’s change in
the federal rate and revalued our deferred tax assets based on the
rates at which they are expected to reverse in the future, which is
generally the new 21% federal corporate tax rate plus applicable
state tax rate. We recorded a decrease in deferred tax assets
and deferred tax liabilities of $11.7 million and $0.0 million,
respectively, with a corresponding net adjustment to deferred
income tax expense of $11.7 million for the year ended December 31,
2017. In addition, we recognized a deemed repatriation of $0.6
million of deferred foreign income from our Guatemala subsidiary,
which did not result in any incremental tax cost after application
of foreign tax credits. Our provisional estimates will be
adjusted during the measurement period defined under SAB 118, based
upon ongoing analysis of data and tax positions along with the new
guidance from regulators and interpretations of the
law.
Goodwill. Goodwill
represents the excess of the purchase price for business
acquisitions over the fair value of identifiable assets and
liabilities acquired. We evaluate the carrying value of enterprise
goodwill for impairment by comparing the enterprise’s
carrying value to its fair value. If the fair value is less than
the carrying value, enterprise goodwill is potentially impaired. We
evaluate enterprise goodwill, at a minimum, on an annual basis in
the fourth quarter of each year or whenever events or changes in
circumstances suggest that the carrying amount of goodwill may be
impaired. During 2015 we recognized $22.0 million in
goodwill related to the acquisitions of Dealix/Autotegrity and
AutoWeb. As of December 31, 2016, we adjusted goodwill
by $82,000 as a result of purchase price allocation adjustments and
no goodwill impairment was recorded during the year. As a result of
our annual impairment testing, a non-cash impairment charge of
$37.7 million was recorded during 2017.
Impairment of Long-Lived
Assets and Intangible Assets. We periodically review long-lived assets to
determine if there is any impairment of these assets. We assess the
impairment of these assets, or the need to accelerate amortization,
whenever events or changes in circumstances indicate that the
carrying value may not be recoverable. Our judgments regarding the
existence of impairment indicators are based on legal factors,
market conditions and operational performance of our long-lived
assets and other intangibles. Future events could cause us to
conclude that impairment indicators exist and that the assets
should be reviewed to determine their fair value. We assess the
assets for impairment based on the estimated future undiscounted
cash flows expected to result from the use of the assets and their
eventual disposition. If the carrying amount of an asset exceeds
its estimated future undiscounted cash flows, an impairment loss is
recorded for the excess of the asset’s carrying amount over
its fair value. Fair value is generally determined based on a
valuation process that provides an estimate of a fair value of
these assets using a discounted cash flow model, which includes
many assumptions and estimates. Once the valuation is determined,
we will write-down these assets to their determined fair value, if
necessary. Any write-downs could have a material adverse effect on
our financial condition and results of operations. We recorded a
$0.6 million impairment in our investment in SaleMove
because we do not believe
SaleMove’s cash balance is sufficient to sustain its cash
burn rate as of December 31, 2017. We did not record any impairment of long-lived
assets in 2016 and 2015.
Indefinite-lived intangible
assets. Indefinite-lived
intangible assets consists of a domain name, which was acquired as
part of the Dealix/Autotegrity acquisition in 2015, which is tested
for impairment annually, or more frequently if an event occurs or
circumstances changes that would indicate that impairment may
exist. When evaluating indefinite-lived intangible assets for
impairment, we may first perform a qualitative analysis to
determine whether it is more likely than not that the
indefinite-lived intangible assets is impaired. If we do not
perform the qualitative assessment, or if we determine that it is
more likely than not that the fair value of the indefinite-lived
intangible asset exceeds its carrying amount, we will calculate the
estimated fair value of the indefinite-lived intangible asset. Fair
value is the price a willing buyer would pay for the
indefinite-lived intangible asset and is typically calculated using
an income approach. If the carrying amount of the indefinite-lived
intangible asset exceeds the estimated fair value, an impairment
charge is recorded to reduce the carrying value to the estimated
fair value. We did not record any impairment of indefinite-lived
intangible assets in 2017 and 2016.
Recent Accounting Pronouncements
See
Note 2 of the “Notes to Consolidated Financial
Statements” in Part II, Item 8, Financial Statements and
Supplementary Data of this Annual Report on Form 10-K for recent
accounting pronouncements.
Item 7A. Quantitative and Qualitative Disclosures about
Market Risk
The
Company does not use financial instruments for
trading. Our primary exposure to market risk is interest
rate sensitivity related to our Credit Facility
Agreement. The effect of a hypothetical 10% change in
interest rates would have increased our interest expense by $73,000
in the year ended December 31, 2017.
Item 8.
Financial Statements and
Supplementary Data
Our
Consolidated Balance Sheets as of December 31, 2017 and 2016
and our Consolidated Statements of Operations and Comprehensive
Income (Loss), Stockholders’ Equity and Cash Flows for each
of the years in the three-year period ended December 31, 2017,
together with the report of our independent registered public
accounting firm, begin on page F-1 of this Annual Report on Form
10-K and are incorporated herein by reference.
Item 9. Changes in and Disagreements with Accountants on
Accounting and Financial Disclosure
None.
Item 9A. Controls
and Procedures
Disclosure Controls and Procedures
We have established and maintain disclosure
controls and procedures that are designed to ensure that material
information relating to the Company and its subsidiaries required
to be disclosed by us in the reports that are filed under the
Securities Exchange Act of 1934, as amended
(“Exchange Act”), is recorded, processed, summarized and
reported in the time periods specified in the SEC’s rules and
forms, and that this information is accumulated and communicated to
our management, including our chief executive officer and chief
financial officer, as appropriate to allow timely decisions
regarding required disclosure. In designing and evaluating the
disclosure controls and procedures, management recognized that any
controls and procedures, no matter how well designed and operated,
can provide only a reasonable assurance of achieving the desired
control objectives, and management was necessarily required to
apply its judgment in evaluating the cost-benefit relationship of
possible controls and procedures.
Under
the supervision and with the participation of our management,
including our chief executive officer and chief financial officer,
we conducted an evaluation of the effectiveness of the design and
operation of our disclosure controls and procedures as of
December 31, 2017. As a result of the identification of the
material weakness described below under “Management’s
Report on Internal Control Over Financial Reporting,”
management has concluded that the Company’s disclosure
controls and procedures were not effective as of December 31,
2017.
Management’s Report on Internal Control Over Financial
Reporting
Our management is responsible for establishing and
maintaining adequate internal control over financial reporting, as
such term is defined in Rules 13a-15(f) under the Exchange Act.
Under the supervision and with the participation of management,
including the Company’s chief executive officer and chief
financial officer, management conducted an evaluation of the
effectiveness of the Company’s internal control over
financial reporting as of December 31, 2017. Because of its
inherent limitations, internal control over financial reporting may
not prevent or detect misstatements or fraud. In making this
assessment, management used the criteria set forth in the framework
issued by the COSO entitled Internal
Control—Integrated Framework (2013). As a result of the identification of the
material weakness described below, management has concluded that
the Company’s internal control over financial reporting was
not effective as of December 31, 2017.
On
March 14, 2018, Moss Adams LLP, our independent registered public accounting firm,
provided us the following assessment (“Moss Adams
Assessment”) in
connection with their attestation report on our internal control over financial reporting as
of December 31, 2017, which appears in Part IV, Item 15, Exhibits
and Financial Statement Schedules of this Annual Report on Form
10-K:
In
connection with the evaluation and measurement of goodwill for
impairment and valuation of deferred tax assets, we believe the
Company’s management review controls were not effectively
designed to operate at a sufficient level of precision, or there
was not sufficient evidence to demonstrate the controls were
designed to operate at a sufficient level of precision, necessary
to prevent or detect a material misstatement on a timely basis.
Specifically, we believe the Company did not adequately evidence
management’s expectations, criteria for investigation, and
the level of precision used in the performance of the controls. We
also believe the controls did not sufficiently evidence the
completeness and accuracy of key assumptions and other data used by
management in the operation of controls. The aggregation of control
deficiencies in these areas resulted in a material weakness related
to internal control over financial reporting.
Representatives of
Moss Adams discussed their assessment with members of our audit
committee of the board of directors.
A material weakness is a deficiency, or
combination of deficiencies, in internal control over financial
reporting, such that there is a reasonable possibility that a
material misstatement of the Company’s annual or interim
financial statements will not be prevented or detected on a timely
basis. Our management is in the process of evaluating the Moss
Adams Assessment and intends to promptly remediate the material
weakness identified in the Moss Adams Assessment. We note that our
management did in fact perform procedures designed to prevent any
material misstatement of the Company’s annual or interim
financial statements with respect to the evaluation and
measurement of goodwill for impairment and valuation of deferred
tax assets, including the engagement of independent third parties
to assist management in its evaluation and measurement of goodwill
for impairment and valuation of deferred tax assets. We also note
that the material weakness identified in the Moss Adams Assessment
did not result in a material
misstatement of the Company’s consolidated financial
statements for the year ended December 31,
2017.
Any
controls and procedures, no matter how well designed and operated
can only provide reasonable assurance of achieving the desired
control objective and management necessarily applies its judgment
in evaluating the cost-benefit relationship of all possible
controls and procedures.
Changes in Internal Control Over Financial Reporting
There
have been no changes in internal controls over financial reporting
identified in connection with the evaluation required by paragraph
(d) of Rules 13a-15 of the Exchange Act that have occurred during
the fourth quarter of fiscal year 2017 that have materially
affected, or are reasonably likely to materially affect, our
internal control over financial reporting.
Beginning
January 1, 2018, we implemented internal controls to ensure we have
adequately evaluated our contracts and properly assessed the impact
of the new accounting standards related to revenue recognition to
facilitate adoption on that date. We do not expect significant
changes to our internal control over financial reporting due to the
adoption of the new standard.
The
effectiveness of the Company’s internal control over
financial reporting as of December 31, 2017 has been audited by
Moss Adams LLP, the Company’s independent registered public
accounting firm, as stated in their attestation report, which is
included below in Part IV, Item 15, Exhibits and Financial
Statement Schedules of this Annual Report on Form
10-K.
Item 9B.
Other
Information
Not
applicable.
PART III
Information called for by the Items included under this Part III is
incorporated by reference to the sections listed below of our
definitive Proxy Statement for our 2018 Annual Meeting of
Stockholders that will be filed not later than 120 days after
December 31, 2017 (“2018 Proxy
Statement”).
Item 10
Directors, Executive Officers and Corporate Governance
The
information called for by this Item 10 is incorporated by reference
to the following sections of the 2018 Proxy Statement:
“Proposal 1-Nomination and Election of Directors;”
“Board of Directors;” “Executive Officers;”
“Section 16(a) Beneficial Ownership Reporting
Compliance;” and the following paragraphs under the section
“Corporate Governance Matters” “--Committees of
the Board of Directors—Audit Committee,” and
“--Code of Conduct and Ethics.”
Item 11
Executive
Compensation
The
information called for in this Item 11 is incorporated by reference
to the following sections of the 2018 Proxy Statement:
“Executive Compensation,” “Corporate Governance
Matters--Compensation Committee Interlocks and Insider
Participation” and “--Board’s Role in Oversight
of Risk,” and “Executive Compensation--Compensation
Discussion and Analysis” and “--Compensation Committee
Report.”
Item 12
Security Ownership
of Certain Beneficial Owners and Management and Related Stockholder
Matters
The
information called for in this Item 12 is incorporated by reference
to the following sections of the 2018 Proxy Statement:
“Security Ownership of Certain Beneficial Owners and
Management” and “Executive Compensation-- Equity
Compensation Plans.”
The
information called for in this Item 13 is incorporated by reference
to the following sections of the 2018 Proxy Statement:
“Corporate Governance Matters--Certain Relationships and
Related Party Transactions” and “--Director
Independence.”
Item 14
Principal
Accountant Fees and Services
The
information called for in this Item 14 is incorporated by reference
to the following sections of the 2018 Proxy Statement:
“Independent Registered Public Accounting Firm and Audit
Committee Report--Principal Accountant Fees and Services,”
“--Audit Fees,” “--Audit Related Fees,” and
“--Pre-Approval Policy for Services.”
PART
IV
Item 15.
Exhibits and Financial Statement Schedules
(a) The following documents are filed as a part of this Annual
Report on Form 10-K:
(1)
Financial Statements:
|
|
|
Page
|
|
|
|
Index
|
|
|
F-1
|
|
|
Report of
Independent Registered Public Accounting Firm
|
|
|
F-2
|
|
|
Consolidated
Balance Sheets
|
|
|
F-3
|
|
|
Consolidated Statements of Operations and
Comprehensive Income (Loss)
|
|
|
F-4
|
|
|
Consolidated
Statements of Stockholders’ Equity
|
|
|
F-5
|
|
|
Consolidated
Statements of Cash Flows
|
|
|
F-6
|
|
|
Notes to
Consolidated Financial Statements
|
|
|
F-7
|
|
(2)
Financial Statement Schedules:
|
Schedule II-
Valuation Qualifying Accounts
|
|
|
F-32
|
|
All other schedules have been omitted since
the required information is presented in the financial statements
and the related notes or is not applicable.
(3)
Exhibits:
The
exhibits filed or furnished as part of this Annual Report on Form
10-K are those listed in the following Exhibit Index.
EXHIBIT
INDEX
|
Number
|
Description
|
|
|
|
|
|
|
2.1‡
|
Membership Interest Purchase Agreement dated as of January 13, 2014
by and among Company, AutoNation, Inc., a Delaware corporation, and
AutoNationDirect.com, Inc., a Delaware corporation, incorporated by
reference to
Exhibit 2.1 to the Current Report on Form 8-K filed with the
SEC on January 17, 2014 (SEC File No. 001-34761)
(“January 2014 Form
8-K”)
|
|
|
|
|
|
|
2.2 ‡
|
Agreement and Plan of Merger dated as of October 1, 2015 by and
among Company, New Horizon Acquisition Corp., a Delaware
corporation, Autobytel, Inc. (formerly AutoWeb, Inc.), a Delaware
corporation, and José Vargas, incorporated by reference to
Exhibit 2.1 to the Current Report on Form 8-K filed with the
SEC on October 6, 2015 (SEC File No. 001-34761)
(“October 2015
Form 8-K”)
|
|
|
|
|
|
|
2.3‡
|
Asset Purchase and Sale Agreement dated as of December 19, 2016 by
and among Company, Car.com, Inc., a Delaware corporation, and
Internet Brands, Inc., a Delaware corporation, incorporated by
reference to
Exhibit 2.1 to the Current Report on Form 8-K filed with the
SEC on December 21, 2016 (SEC
File No. 001-34761)
|
|
|
|
|
|
|
3.1
|
Sixth
Restated Certificate of Incorporation of AutoWeb, Inc. (filed with
the Secretary of the State of Delaware on October 9, 2017),
incorporated by reference to
Exhibit 3.4 to the Current Report on Form 8-K filed with the
SEC on October 10, 2017 (SEC File No. 001-34761) (“October 2017 Form
8-K”)
|
|
|
|
|
|
|
3.2
|
Seventh Amended and Restated Bylaws of AutoWeb dated October 9,
2017, incorporated by reference to
Exhibit 3.5 to the October 2017 Form 8-K
|
|
|
|
|
|
|
4.1
|
Form of Common Stock Certificate of Company, incorporated by reference to
Exhibit 4.1 to the Quarterly Report on Form 10-Q for the
quarterly period ended September 30, 2001 filed with the SEC on
November 14, 2001 (SEC File No. 000-22239)
|
|
|
|
|
|
|
4.2
|
Tax Benefit Preservation Plan dated as of May 26, 2010 between
Company and Computershare Trust Company, N.A., as rights agent,
together with the following exhibits thereto: Exhibit A –
Form of Right Certificate; and Exhibit B – Summary of Rights
to Purchase Shares of Preferred Stock of Company, incorporated by
reference to
Exhibit 4.1 to the Current Report
on Form 8-K filed with the SEC on June 2, 2010 (SEC File No.
000-22239), Amendment No. 1 to Tax Benefit Preservation Plan dated
as of April 14, 2014, between Company and Computershare Trust
Company, N.A., as rights agent, incorporated by reference to
Exhibit 4.1 to the Current Report on Form 8-K filed with the
SEC on April 16, 2014 (SEC File No. 001-34761), Amendment No. 2 to
Tax Benefit Preservation Plan dated as of April 13, 2017, between
Company and Computershare Trust Company, N.A., as rights agent,
incorporated by reference to
Exhibit 4.1 to the Current Report
on Form 8-K filed with the SEC on April 14, 2017 (SEC File No.
001-34761)
|
|
|
|
|
|
|
4.3
|
Certificate of Adjustment Under Section 11(m) of the Tax Benefit
Preservation Plan, incorporated by reference to
Exhibit 4.3 to the Quarterly Report on Form 10-Q for the
quarterly period ended September 30, 2012 filed with the SEC on
November 8, 2012 (SEC File No. 001-34761)
|
|
|
|
|
|
|
10.1■
|
Autobytel.com Inc. 1998 Stock Option Plan, incorporated by
reference to Exhibit 10.8 to Amendment No. 1 to S-1 Registration
Statement filed with the SEC on February 9, 1999 (SEC File No.
333-70621), as amended by Amendment No. 1 dated September
22, 1999 to Autobytel.com Inc. 1998
Stock Option Plan, incorporated by reference to
Exhibit 10.2 to the Quarterly Report on Form 10-Q for the
quarterly period ended September 30, 1999 filed with the SEC on
November 12, 1999 (SEC File No. 000-22239),
and as amended by Amendment No. 2
dated December 5, 2001 to the Autobytel.com Inc. 1998 Stock
Option Plan and Form of Stock Option Agreement under the
Autobytel.com Inc. 1998 Stock Option Plan, incorporated by
reference to
Exhibits (d)(5) and
(d)(14), respectively, to the Schedule TO filed with the SEC on December 14,
2001 (SEC File No. 005-58067) (“Schedule TO”)
|
|
|
|
|
|
|
10.2■
|
Autobytel.com Inc. 1999 Employee and Acquisition Related Stock
Option Plan, incorporated by reference to
Exhibit 10.1 to the Registration Statement on Form
S-8 filed with the SEC on November 1, 1999 (SEC File No.
333-90045), as amended by Amendment No. 1 dated December 5,
2001 to the Autobytel.com Inc. 1999 Employee and Acquisition
Related Stock Option Plan, and Form of Stock Option Agreement under
the Autobytel.com Inc. 1999 Employee and Acquisition Related Stock
Option Plan, incorporated by reference to Exhibits
(d)(10) and
(d)(16), respectively, to the Schedule TO, and Amendment No. 2 to the Autobytel.com Inc. 1999
Employee and Acquisition Related Stock Option Plan dated May 1,
2009, incorporated by reference to
Exhibit 10.86 to the Quarterly Report on Form 10-Q for the
quarterly period ended June 30, 2009 filed with the SEC on July 24,
2009 (SEC File No. 000-22239) (“Second Quarter 2009 Form
10-Q”)
|
|
|
|
|
|
|
10.3■
|
Form of Employee Stock Option Agreement under the Autobytel.com
Inc. 1998 Stock Option Plan and the Autobytel.com Inc. 1999
Employee and Acquisition Related Stock Option Plan, incorporated by reference to
Exhibit 10.2 to the Current Report on Form 8-K filed with the
SEC on October 3, 2008 (SEC File No. 000-22239)
(“October 2008 Form
8-K”)
|
|
|
|
|
|
|
|
10.4■
|
Autobytel.com Inc. 2000 Stock Option Plan, incorporated by
reference to
Exhibit 99.1 to the Registration Statement on Form S-8 filed
with the SEC on June 15, 2000 (SEC File No. 333-39396); as
amended by Amendment No. 1 dated December 5, 2001 to the
Autobytel.com Inc. 2000 Stock Option Plan and Form of Stock Option
Agreement under the Autobytel.com Inc.
2000 Stock Option Plan, incorporated by reference to
Exhibits
(d)(12) and
(d)(17), respectively, to the Schedule TO; Amendment No. 2 to
the Autobytel.com Inc. 2000 Stock Option Plan, incorporated by
reference to
Exhibit 10.46 to the Annual Report on Form 10-K for the Year
Ended December 31, 2001 filed with the SEC on March 22, 2002 (SEC
File No. 000-22239); and as amended by Amendment No. 3 to
the Autobytel.com Inc. 2000 Stock Option Plan dated May 1, 2009,
incorporated by reference to
Exhibit 10.87 to the Second Quarter 2009 Form 10-Q
|
|
|
|
|
|
||
|
10.5■
|
Autobytel Inc. Amended and Restated 2001 Restricted Stock and
Option Plan, incorporated by reference to
Exhibit 4.7 to the Post-Effective Amendment to Registration
Statement on Form S-8 filed with the SEC on July 31, 2003 (SEC
File No. 333-67692); as amended by Amendment No. 1 to the
Autobytel Inc. Amended and Restated 2001 Restricted Stock and
Option Plan dated May 1, 2009, incorporated by reference to
Exhibit 10.88 to the Second Quarter 2009 Form 10-Q;
and Form of Restricted Stock Award
Agreement under the Autobytel Inc. Amended and Restated 2001
Restricted Stock and Option Plan, incorporated by reference to
Exhibit 10.1 to the October 2008 Form 8-K
|
||
|
|
|
|
|
|
10.6■
|
Form of Employee Stock Option Agreement under the Autobytel Inc.
Amended and Restated 2001 Restricted Stock and Option Plan,
incorporated by reference to
Exhibit 10.8 to the Annual Report on Form 10-K for the Year
Ended December 31, 2014 filed with the SEC on February 26, 2015
(SEC File No. 001-34761)
|
|
|
|
|
|
||
|
10.7■
|
Autobytel Inc. 2004 Restricted Stock and Option Plan and Form of
Employee Stock Option Agreement under the Autobytel Inc. 2004
Restricted Stock and Option Plan, incorporated by reference to
Exhibits 4.8 and
4.9, respectively, to the Registration Statement on Form S-8
filed with the SEC on June 28, 2004 (SEC File
No. 333-116930); as amended by Amendment No. 1 to the
Autobytel Inc. 2004 Restricted Stock and Option Plan dated May 1,
2009, incorporated by reference to
Exhibit 10.89 to the Second Quarter 2009 Form 10-Q; Form of Outside Director Stock Option
Agreement under the Autobytel Inc. 2004 Restricted Stock and Option
Plan, incorporated by reference to
Exhibit 10.2 to the November 2004 Form 8-K; Form of Stock
Option Agreement under the Autobytel Inc. 2004 Restricted Stock and
Option Plan, incorporated by reference to
Exhibit 10.65 to the Annual Report on Form 10-K for the Year
Ended December 31, 2004 filed with the SEC on May 31, 2005 (SEC
File No. 000-22239); and Form of Outside Director Stock Option
Agreement and Form of Letter Agreement (amending certain stock option agreements with
Outside Directors) under the 2004 Restricted Stock and
Option Plan, incorporated by reference to
Exhibits 10.1 and
10.2 to the Current Report on Form 8-K filed with the SEC on
September 14, 2005 (SEC File No. 000-22239)
|
||
|
|
|
||
|
10.8■
|
Autobytel Inc. 2006 Inducement Stock Option Plan and Form of
Employee Inducement Stock Option Agreement, incorporated by reference to
Exhibits 4.9 and
4.10, respectively, to the Registration Statement on Form
S-8 filed with the SEC on June 16, 2006 (SEC File No.
333-135076); and as amended by Amendment No. 1 to the
Autobytel Inc. 2006 Inducement Stock Option Plan dated May 1, 2009,
incorporated by reference to
Exhibit 10.90 to the Second Quarter 2009 Form 10-Q
|
||
|
|
|
||
|
10.9■
|
Autobytel Inc. 2010 Equity Incentive Plan, incorporated by
reference to
Exhibit 10.2 to the Current Report on Form 8-K filed with the
SEC on June 25, 2010 (SEC File No. 001-34761); Form of Employee
Stock Option Award Agreement, Form of 2012 Performance-Based Stock
Option Award Agreement, Form of Non-Employee Director Stock Option
Award Agreement and Form of (Management) Employee Stock Option
Award Agreement under the Autobytel Inc. 2010 Equity Incentive
Plan, incorporated by reference to Exhibits
10.58,
10.59,
10.60 and
10.61, respectively, to the Annual Report on Form 10-K for the
Year Ended December 31, 2011 filed with the SEC on March 1, 2012
(SEC File No. 001-34761) (“2011 Form
10-K”); and Form of 2013
Performance-Based Stock Option Award Agreement under the Autobytel
Inc. 2010 Equity Incentive Plan, incorporated by reference to
Exhibit 10.79 to the Annual Report on Form 10-K for the Year
Ended December 31, 2012 filed with the SEC on February 28, 2013
(SEC File No. 001-34761) (“2012 Form
10-K”)
|
||
|
|
|
||
|
10.10■
|
AutoWeb, Inc. (formerly Autobytel Inc.) 2014 Equity Incentive Plan,
incorporated by reference to
Exhibit 10.1 to the Current Report on Form 8-K filed with the
SEC on June 23, 2014 (SEC File No. 001-34761)
(“June
2014 Form 8-K”)
|
||
|
|
|
||
|
10.11■*
|
Amended and Restated AutoWeb, Inc. (formerly Autobytel Inc.) 2014
Equity Incentive Plan (supersedes and replaces the AutoWeb, Inc.
(formerly Autobytel Inc.) 2014 Equity Incentive Plan filed under
Exhibit 10.1 to the June 2014 Form 8-K)
|
||
|
10.12■*
|
Form of Non-Employee Director Stock Option Award Agreement under
the Amended and Restated AutoWeb, Inc. (formerly Autobytel Inc.)
2014 Equity Incentive Plan
|
|
|
|
|
10.13■*
|
Form of Executive Stock Option Award Agreement under the Amended
and Restated AutoWeb, Inc. (formerly Autobytel Inc.) 2014 Equity
Incentive Plan
|
|
|
|
|
10.14■*
|
Form of Non-Executive Employee Stock Option Award Agreement under
the Amended and Restated AutoWeb, Inc. (formerly Autobytel Inc.)
2014 Equity Incentive Plan
|
|
|
|
|
10.15■*
|
Form of Subsidiary Employee Stock Option Award Agreement under the
Amended and Restated AutoWeb, Inc. (formerly Autobytel Inc.) 2014
Equity Incentive Plan
|
|
|
|
|
10.16■*
|
Form of Restricted Stock Award Agreement under the Amended and
Restated AutoWeb, Inc. (formerly Autobytel Inc.) 2014 Equity
Incentive Plan
|
|
|
|
|
10.17■
|
Letter Agreement dated October 10, 2006 between Company and Glenn
E. Fuller, as amended by Memorandum dated April 18, 2008,
Memorandum dated as of December 8, 2008, and Memorandum dated as of
March 1, 2009, incorporated by reference to
Exhibit 10.77 to the Annual Report on Form 10-K for the Year
Ended December 31, 2008 filed with the SEC on March 13, 2009 (SEC
File No. 000-22239) (“2008 Form
10-K”); and as amended by
Memorandum dated January 31, 2017, incorporated by reference to
Exhibit 10.13 to the Annual Report on Form 10-K for the Year
Ended December 31, 2016 filed with the SEC on March 9, 2017 (SEC
File No. 001-34761) (“2016 Form
10-K”)
|
|
|
|
|
10.18■
|
Amended and Restated Severance Agreement dated as of September 29,
2008 between Company and Glenn E. Fuller, incorporated by reference
to
Exhibit 10.4 to the October 2008 Form 8-K; as amended by
Amendment No. 1 dated December 14, 2012, incorporated by reference
to
Exhibit 10.73 to the 2012 Form 10-K
|
|
|
|
|
10.19■
|
Letter Agreement dated August 6, 2004 between Company and Wesley
Ozima, as amended by Memorandum dated March 1, 2009, incorporated
by reference to
Exhibit 10.81 to the 2008 Form 10-K; and as amended by
Memorandums dated January 22, 2016 and January 31, 2017,
incorporated by reference to
Exhibit 10.16 to the Annual Report on Form 10-K for the Year
Ended December 31, 2016 filed with the 2016 Form 10-K
|
|
|
|
|
10.20■
|
Amended and Restated Severance Agreement dated as of
November 15, 2008 between Company and Wesley Ozima,
incorporated by reference to
Exhibit 10.82 to the 2008 Form 10-K; and as amended by
Amendment No. 1 dated October 16, 2012, incorporated by reference
to
Exhibit 10.74 to the 2012 Form 10-K
|
|
|
|
|
10.21■
|
Stock Option Award Agreement under the Autobytel Inc. 2000 Stock
Option Plan, Stock Option Award Agreement under the Autobytel Inc.
Amended and Restated 2001 Restricted Stock and Option Plan, and
Stock Option Award Agreement under the Autobytel Inc. 2004
Restricted Stock and Option Plan each dated effective as of April
3, 2009 between Company and Jeffrey H. Coats, incorporated by
reference to
Exhibits 10.92,
10.93 and
10.94, respectively, to the Second Quarter 2009 Form 10-Q;
Employee Stock Option Award Agreement under the Amended and
Restated AutoWeb, Inc. (formerly Autobytel Inc.) 2014 Equity
Incentive Plan and Employee Stock Option Award Agreement under the
Amended and Restated AutoWeb, Inc. (formerly Autobytel Inc.) 2014
Equity Incentive Plan, each dated as of January 21, 2016 between
Company and Jeffrey H. Coats, incorporated by reference to
Exhibits 10.2 and
10.3, respectively, to the Current Report on Form 8-K filed
with the SEC January 27, 2016 (SEC File No. 001-34761)
(“January 2016 Form
8-K”)
|
|
|
|
|
10.22■
|
Second Amended and Restated Employment Agreement dated as of April
3, 2014 between Company and Jeffrey H. Coats, incorporated by
reference to
Exhibit 99.1 to the Current Report on Form 8-K filed with the
SEC on April 8, 2014 (SEC File No. 001-34761); as amended by
Amendment No. 1 dated January 21, 2016, incorporated by reference
to
Exhibit 10.1 to the January 2016 Form 8-K; and as amended by
Amendment No. 2 dated September 21, 2016, incorporated by reference
to
Exhibit 10.3 to the Form 8-K filed with the SEC on September
26, 2016 (SEC File No. 001-34761) (“September 2016 Form
8-K”)
|
|
|
|
|
10.23■
|
Form of Amended and Restated Indemnification Agreement between
Company and its directors and officers, incorporated by reference
to
Exhibit 99.1 to the Current Report on Form 8-K filed with the
SEC on July 22, 2010 (SEC File No. 001-34761)
|
|
|
|
|
10.24■*
|
Form of Indemnification Agreement between the Company and its
directors and officers
|
|
10.25■
|
Revised Offer of Employment Letter dated March 9, 2010 between
Company and Kimberly Boren, as amended by Memorandum dated December
21, 2010 and Memorandum dated as of December 1, 2011, is
incorporated by reference to
Exhibit 10.73 to the 2011 Form 10-K; and as amended by
Memorandum dated September 21, 2016, incorporated by reference to
Exhibit 10.4 to September 2016 Form 8-K
|
|
|
|
|
10.26■
|
Amended and Restated Severance Benefits Agreement dated as of
February 25, 2011 between Company and Kimberly Boren, incorporated
by reference to
Exhibit 10.74 to the 2011 Form 10-K; as amended by Amendment
No. 1 to Amended and Restated Severance Benefits Agreement dated
November 14, 2012 between Company and Kimberly Boren, incorporated
by reference to
Exhibit 10.70 to the 2012 Form 10-K
|
|
|
|
|
10.27■
|
Restricted Stock Award Agreement under the AutoWeb, Inc. (formerly
Autobytel Inc.) 2014 Equity Incentive Plan and Amended and Restated
Letter Agreement dated as of April 23, 2015 between Company and
William Ferriolo, incorporated by reference to
Exhibits 10.3 and
10.5, respectively, to the Current Report on Form 8-K filed
with the SEC on April 29, 2015 (SEC File No. 001-34761)
(“April 2015 Form
8-K”)
|
|
|
|
|
10.28■
|
Amended and Restated Letter Agreement dated as of April 23, 2015
between Company and William Ferriolo, incorporated by reference to
Exhibit 10.5 to the April 2015 Form 8-K; as amended by
Amendment No. 1 dated January 22, 2016, incorporated by reference
to
Exhibit 10.4 to the January 2016 Form 8-K; and as amended by
Amendment No. 2 dated December 15, 2016, incorporated by reference
to
Exhibit 10.1 to the Current Report on Form 8-K filed with the
SEC on December 2, 2016 (SEC File No. 001-34761)
(“December 2016 Form
8-K”)
|
|
|
|
|
10.29■
|
Letter Agreement dated May 21, 2007 between Company and John
Steerman, as amended by Memorandum dated March 20, 2009, Memorandum
dated September 30, 2009, and Memorandum dated December 1, 2011,
incorporated by reference to
Exhibit 10.77 to the 2011 Form 10-K; and as amended by
Memorandum dated January 22, 2016, incorporated by reference to
Exhibit 10.29 to the 2016 Form 10-K
|
|
|
|
|
10.30■
|
Severance Agreement dated as of October 1, 2009 between Company and
John Steerman, incorporated by reference to
Exhibit 10.78 to the 2011 Form 10-K; and as amended by
Amendment No. 1 dated September 19, 2012 and Amendment No. 2 dated
November 7, 2012, incorporated by reference to
Exhibits 10.75 and
10.76, respectively, to the 2012 Form 10-K
|
|
|
|
|
10.31■
|
Amended and Restated Employment Agreement dated April 24, 2013
between Company and John Skocilic Jr., as amended by Memorandum
dated January 22, 2016 and Memorandum dated January 31, 2017,
incorporated by reference to
Exhibit 10.51 to the 2016 Form 10-K
|
|
|
|
|
10.32■
|
Amended and Restated Severance Benefits Agreement dated May 1, 2013
between Company and John Skocilic Jr., incorporated by reference to
Exhibit 10.49 to the 2015 Form 10-K
|
|
|
|
|
10.33■
|
Employment Offer Letter Agreement dated September 17, 2010 between
Company and Ralph Smith, as amended by Memorandum dated January 1,
2013, Memorandum dated July 1, 2013, and Memorandum dated January
28, 2016, incorporated by reference to
Exhibit 10.47 to the 2016 Form 10-K
|
|
|
|
|
10.34■
|
Amended and Restated Severance Benefits Agreement dated July 1,
2013 between Company and Ralph Smith, incorporated by reference to
Exhibit 10.48 to the 2016 Form 10-K
|
|
|
|
|
10.35■*
|
Memorandum dated July 16, 2016, amending Employment Offer Letter
Agreement dated September 17, 2010 between Company and Ralph
Smith
|
|
|
|
|
10.36■*
|
Memorandum dated February 20, 2018, amending Employment Offer
Letter Agreement dated September 17, 2010 between Company and Ralph
Smith
|
|
|
|
|
10.37■
|
Employment Offer Letter dated February 14, 2014 between Company and
Taren Peng, as amended by Memorandum dated January 31, 2017,
incorporated by reference to
Exhibit 10.49 to the 2016 Form 10-K
|
|
|
|
|
10.38■
|
Severance Benefits Agreement dated August 25, 2014 between Company
and Taren Peng, incorporated by reference to
Exhibit 10.50 to the 2016 Form 10-K
|
|
|
|
|
10.39■
|
Employee Stock Option Award Agreement under the Amended and
Restated AutoWeb, Inc. (formerly Autobytel Inc.) 2014 Equity
Incentive Plan dated as of September 21, 2016 between Company and
José Vargas, incorporated by reference to
Exhibit 10.3 to the Current Report on Form 8-K filed with the
SEC on October 21, 2016 (SEC File No. 001-34761)
(“October 2016 Form
8-K”)
|
|
10.40■
|
Employment Offer Letter dated February 23, 2016 between Company and
José Vargas, incorporated by reference to
Exhibit 10.54 to the 2015 Form 10-K
|
|
|
|
|
10.41
|
Amended and Restated Stockholder Agreement dated as of October 1,
2015 by and among Company, Auto Holdings Ltd., a British Virgin
Islands business company, Manatee Ventures Inc., a British Virgin
Islands business company, Galeb3 Inc., a Florida corporation,
Matías de Tezanos, and José Vargas, and the other parties
set forth on the signature pages thereto, incorporated by reference
to
Exhibit 10.2 to the October 2015 Form 8-K; as amended by
Second Amended and Restated Stockholder Agreement dated as of
October 19, 2016, incorporated by reference to
Exhibit 10.1 to the October 2016 Form 8-K; as amended by Third
Amended and Restated Stockholder Agreement dated as of November 30,
2016, incorporated by reference to
Exhibit 10.1 to the December 2016 Form 8-K; as amended by
Fourth Amended and Restated Stockholder Agreement dated as of March
1, 2017, incorporated by reference to
Exhibit 10.1 to the Current Report on Form 8-K filed with the
SEC on March 2, 2017 (SEC File No. 001-34761)
|
|
|
|
|
10.42
|
Loan Agreement dated as of February 26, 2013 by and between Company
and Union Bank, N.A., a national banking association
(“Loan
Agreement”); as amended
by First Amendment dated as of September 10, 2013 to Loan
Agreement; as amended by Second Amendment dated as of January 13,
2014 to Loan Agreement, Security Agreement dated January 13, 2014,
Commercial Promissory Note dated January 13, 2014 ($9,000,000 Term
Loan), and Commercial Promissory Note dated January 13, 2014
($8,000,000 Revolving Loan), incorporated by reference to
Exhibit 10.4 to the January 2014 Form 8-K; as amended by Third
Amendment dated as of May 20, 2015 to Loan Agreement, Commercial
Promissory Note dated May 20, 2015 ($15,000,000 Term Loan), and
Commercial Promissory Note dated May 20, 2015 ($8,000,000 Revolving
Loan), incorporated by reference to
Exhibits 10.1,
10.2 and
10.3 to the Current Report on Form 8-K filed with the SEC on
May 27, 2015 (SEC File No. 001-34761); as amended by Fourth
Amendment dated as of June 1, 2016 to Loan Agreement, incorporated
by reference to
Exhibit 10.5 to the Quarterly Report on Form 10-Q for
the quarterly period ended June 30, 2016 filed with the SEC on
August 4, 2016 (SEC File No. 001-34761); as amended by Fifth Amendment dated as of June
28, 2017 to Loan Agreement and Commercial Promissory Note dated on
June 28, 2017 ($8,000,000 Revolving Loan), incorporated by
reference to
Exhibits 10.2 and
10.3 to the Current Report on Form 8-K filed with the SEC on
June 29, 2017 (SEC File No. 001-34761); and as amended by Sixth
Amendment dated as of December 27, 2017 to Loan Agreement,
incorporated by reference to
Exhibit 10.1 to the Current Report on Form 8-K filed with the
SEC on December 27, 2017 (SEC File No.
001-34761)
|
|
|
|
|
10.43
|
Lease Agreement dated April 3, 1997 between The Provider Fund
Partners, The Colton Company (n/k/a: GFE MacArthur Investments,
LLC, as successor-in-interest to The Provider Fund Partners, The
Colton Company) and the Company (“Irvine Lease”), as amended by Amendment No. 12 dated
February 6, 2009 to Irvine Lease, Amendment No. 13 dated February
6, 2009 to Irvine Lease, and Amendment No. 14 to Irvine Lease dated
November 9, 2010, incorporated by reference to
Exhibit 10.79 to the 2011 Form 10-K; as amended by Amendment
No. 15 dated October 31, 2012 to Irvine Lease, incorporated by
reference to
Exhibit 10.69 to the 2012 Form 10-K, and as amended by
Amendment No. 16 to Irvine Lease dated August 7, 2015, incorporated
by reference to
Exhibit 10.32 to the 2015 Form 10-K; and as amended by
Amendment No. 17 dated April 14, 2017 to the Irvine Lease Agreement
dated April 3, 1997 between GFE MacArthur Investments, LLC,
successor-in-interest to TFP Partners, and the Company,
incorporated by reference to
Exhibit 10.3 to the Quarterly Report on Form 10-Q filed with
the SEC on May 4, 2017 (SEC File No. 001-34761)
|
|
|
|
|
10.44‡
|
Master License and Services Agreement as of October 5, 2017 by and
between AutoWeb and DealerX Partners, LLC, incorporated by
reference to
Exhibit 10.1 to the Current Report on Form 8-K filed with the
SEC on October 11, 2017 (SEC File No. 001-34761)
(“October 2017 Form
8-K”)
|
|
|
|
|
10.45‡
|
Stockholder Agreement dated as of October 5, 2017 by and between
AutoWeb, DealerX Partners, LLC and Jeffrey Tognetti, incorporated
by reference to
Exhibit 10.2 to the October 2017 Form 8-K
|
|
|
|
|
10.46
|
Tax Benefit Preservation Plan Exemption Agreement and Irrevocable
Proxy dated November 15, 2017 by and between AutoWeb, Piton Capital
Partners LLC, a Delaware limited liability company
(“Piton
Capital”), and Piton
Capital’s managing members, incorporated by reference to
Exhibits 10.1 and
10.2, respectively, to the Current Report on Form 8-K filed
with the SEC on November 17, 2017 (SEC File No.
001-34761)
|
|
|
|
|
10.47‡
|
Transitional
License and Linking Agreement, made as of January 1, 2017, by and
among Internet Brands, Inc., a Delaware corporation, Car.com, Inc.,
a Delaware corporation, and the Company, incorporated by reference
to
Exhibit 10.1 to the Current Report
on Form 8-K filed with the SEC on January 6, 2017 (SEC File No.
001-34761)
|
|
10.48
|
Convertible
Subordinated Promissory Note dated as of January 13, 2014
(Principal Amount $1,000,000.00) issued by Company to
AutoNationDirect.com, Inc., a Delaware corporation, incorporated by
reference to
Exhibit 10.1 to the January 2014 Form 8-K
|
|
|
|
|
10.49
|
Warrant
to Purchase 69,930 Shares of Company Common Stock dated as of
January 13, 2014 issued by Company to AutoNationDirect.com, Inc., a
Delaware corporation, incorporated by reference to
Exhibit 10.2 to the January 2014 Form 8-K
|
|
|
|
|
10.50
|
Shareholder
Registration Rights Agreement dated as of January 13, 2014 by and
between Company and AutoNationDirect.com, Inc., a Delaware
corporation, incorporated by reference to
Exhibit 10.3 to the January 2014 Form 8-K
|
|
|
|
|
10.51
|
Form
of Warrant to Purchase Common Stock (on an as-converted basis
following the conversion of Series B Junior Preferred Stock) dated
as of October 1, 2015 issued by the Company to the persons listed
on Schedule A thereto, which is incorporated herein by reference to
Exhibit 10.1 to the October 2015 Form 8-K
|
|
|
|
|
21.1*
|
Subsidiaries
of AutoWeb, Inc.
|
|
|
|
|
23.1*
|
Consent
of Independent Registered Public Accounting Firm, Moss Adams
LLP
|
|
|
|
|
24.1*
|
Power
of Attorney (included in the signature page hereto)
|
|
|
|
|
31.1*
|
Chief
Executive Officer Section 302 Certification of Periodic Report
dated March 15, 2018
|
|
|
|
|
31.2*
|
Chief
Financial Officer Section 302 Certification of Periodic Report
dated March 15, 2018
|
|
|
|
|
32.1*
|
Chief
Executive Officer and Chief Financial Officer Section 906
Certification of Periodic Report dated March 15, 2018
|
|
|
|
|
101.INS††
|
XBRL
Instance Document
|
|
|
|
|
101.SCH††
|
XBRL
Taxonomy Extension Schema Document
|
|
|
|
|
101.CAL††
|
XBRL
Taxonomy Calculation Linkbase Document
|
|
|
|
|
101.DEF††
|
XBRL
Taxonomy Extension Definition Document
|
|
|
|
|
101.LAB††
|
XBRL
Taxonomy Label Linkbase Document
|
|
|
|
|
101.PRE††
|
XBRL
Taxonomy Presentation Linkbase Document
|
*
Filed
herewith.
■
Management
Contract or Compensatory Plan or Arrangement.
‡
Certain
schedules in this Exhibit have been omitted in accordance with Item
601(b)(2) of Regulation S-K. AutoWeb, Inc. will furnish
supplementally a copy of any omitted schedule or exhibit to the
Securities and Exchange Commission upon request; provided, however,
that AutoWeb, Inc. may request confidential treatment pursuant to
Rule 24b-2 of the Securities Exchange Act of 1934, as amended, for
any schedule or exhibit so furnished.
††
Furnished with this
report. In accordance with Rule 406T of Regulation S-T,
the information in these exhibits shall not be deemed to be
“filed” for purposes of Section 18 of the Securities
Exchange Act of 1934, as amended, or otherwise subject to liability
under that section, and shall not be incorporated by reference into
any registration statement or other document filed under the
Securities Act of 1933, as amended, except as expressly set forth
by specific reference in such filing.
None
SIGNATURES
Pursuant
to the requirements of Section 13 or 15(d) of the Securities
Exchange Act of 1934, the registrant has duly caused this report to
be signed on its behalf by the undersigned, thereunto duly
authorized, on the 15th day of March, 2018.
|
|
AUTOWEB, INC.
|
|
|
|
|
|
|
|
|
|
By:
|
/s/ JEFFREY H. COATS
|
|
|
|
|
Jeffrey H. Coats
|
|
|
|
|
President, Chief Executive Officer and Director
|
|
POWER OF ATTORNEY
KNOW ALL PERSONS BY THESE PRESENTS, that each of
AutoWeb, Inc., a Delaware corporation (“Company”),
and the undersigned Directors and Officers of AutoWeb, Inc. hereby
constitute and appoint Jeffrey H. Coats, Kimberly Boren or Glenn E.
Fuller as the Company’s or such Director’s or
Officer’s true and lawful attorneys-in-fact and agents, for
the Company or such Director or Officer and in the Company’s
or such Director’s or Officer’s name, place and stead,
in any and all capacities, with full power to act alone, to sign
any and all amendments to this report, and to file each such
amendment to this report, with all exhibits thereto, and any and
all documents in connection therewith, with the Securities and
Exchange Commission, hereby granting unto said attorneys-in-fact
and agents, and each of them, full power and authority to do and
perform any and all acts and things requisite and necessary to be
done in connection therewith, as fully to all intents and purposes
as the Company or such Director or Officer might or could do in
person, hereby ratifying and confirming all that said
attorneys-in-fact and agents, or any of them may lawfully do or
cause to be done by virtue hereof.
Pursuant
to the requirements of the Securities Exchange Act of 1934, this
report has been signed below by the following persons on behalf of
the registrant and in the capacities and on the dates
indicated.
|
Signature
|
Title
|
Date
|
|
|
|
|
|
|
|
/s/ MICHAEL J. FUCHS
Michael J. Fuchs
|
Chairman of the Board and Director
|
March 15, 2018
|
|
|
|
|
|
|
|
/s/ JEFFREY H. COATS
Jeffrey H. Coats
|
President, Chief Executive Officer and Director (Principal
Executive Officer)
|
March 15, 2018
|
|
|
|
|
|
|
|
/s/ KIMBERLY BOREN
Kimberly Boren
|
Executive Vice President and Chief Financial Officer (Principal
Financial Officer)
|
March 15, 2018
|
|
|
|
|
|
|
|
/s/ WESLEY OZIMA
Wesley Ozima
|
Senior Vice President and Controller (Principal
Accounting Officer)
|
March 15, 2018
|
|
|
|
|
|
|
|
/s/ MICHAEL A. CARPENTER
Michael A. Carpenter
|
Director
|
March 15, 2018
|
|
|
|
|
|
|
|
/s/ MARK N. KAPLAN
Mark N. Kaplan
|
Director
|
March 15, 2018
|
|
|
|
|
|
|
|
/s/ JEFFREY M. STIBEL
Jeffrey M. Stibel
|
Director
|
March 15, 2018
|
|
|
|
|
|
|
|
/s/ MATIAS DE TEZANOS
Matias de Tezanos
|
Director
|
March 15, 2018
|
|
|
|
|
|
|
|
/s/ JANET M. THOMPSON
Janet M. Thompson
|
Director
|
March 15, 2018
|
|
|
|
|
|
|
|
/s/ JOSE VARGAS
Jose Vargas
|
Director
|
March 15, 2018
|
|
|
|
|
|
|
AUTOWEB, INC.
INDEX TO CONSOLIDATED FINANCIAL STATEMENTS
|
|
|
|
Page
|
|
|
|
|
F-2
|
|
|
|
|
|
F-3
|
|
|
|
|
|
F-4
|
|
|
|
|
|
F-5
|
|
|
|
|
|
F-6
|
|
|
|
|
|
F-7
|
|
REPORT OF INDEPENDENT REGISTERED
PUBLIC ACCOUNTING FIRM
To the
Shareholders and the Board of Directors of
AutoWeb,
Inc.
Opinions on the Financial Statements and Internal Control over
Financial Reporting
We have
audited the accompanying consolidated balance sheets of AutoWeb,
Inc. (the “Company”) as of December 31, 2017 and
2016, the related consolidated statements of statements of
operations and comprehensive income (loss), stockholders’
equity, and cash flows for each of the three years in the period
ended December 31, 2017, and the related notes and schedule
(collectively referred to as the “consolidated financial
statements”). We also have audited the Company’s
internal control over financial reporting as of December 31,
2017, based on criteria established in Internal Control - Integrated Framework
(2013) issued by the
Committee of Sponsoring Organizations of the Treadway Commission
(COSO).
In our
opinion, the consolidated financial statements referred to above
present fairly, in all material respects, the consolidated
financial position of the Company as of December 31, 2017 and
2016, and the consolidated results of its operations and its cash
flows for each of the three years in the period ended December 31,
2017, in conformity with accounting principles generally accepted
in the United States of America. Also in our opinion, because of
the effect of the material weakness identified below on the
achievement of the objectives of the control criteria, the Company
has not maintained effective internal control over financial
reporting as of December 31, 2017, based on criteria established in
Internal Control - Integrated
Framework (2013) issued by COSO.
Change in Accounting Principle
As
discussed in Note 2 to the consolidated financial statements, the
Company prospectively changed the manner in which it accounts for
the balance sheet classification of deferred taxes due to the
adoption of Accounting Standards Update 2015-17, Balance Sheet Classification of Deferred
Taxes.
As
discussed in Note 2 to the consolidated financial statements, the
Company prospectively changed the manner in which it accounts for
share-based payment transactions and the related excess tax
benefits and tax deficiencies due to the adoption of Accounting
Standards Update 2016-09, Improvements to Employee Share-Based Payment
Accounting.
Basis for Opinions
The
Company’s management is responsible for these consolidated
financial statements, for maintaining effective internal control
over financial reporting, and for its assessment of the
effectiveness of internal control over financial reporting,
included in the accompanying included in the accompanying
Management’s Report on Internal Control over Financial
Reporting appearing under Item 9A. Our responsibility is to express
an opinion on the Company’s consolidated financial statements
and an opinion on the Company’s internal control over
financial reporting based on our audits. We are a public accounting firm registered with
the Public Company Accounting Oversight Board (United States)
(“PCAOB”) and are required to be independent with
respect to the Company in accordance with the U.S. federal
securities laws and the applicable rules and regulations of the
Securities and Exchange Commission and the
PCAOB.
We
conducted our audits in accordance with the standards of the PCAOB.
Those standards require that we plan and perform the audits to
obtain reasonable assurance about whether the consolidated
financial statements are free of material misstatement, whether due
to error or fraud, and whether effective internal control over
financial reporting was maintained in all material
respects.
Our
audits of the consolidated financial statements included performing
procedures to assess the risks of material misstatement of the
consolidated financial statements, whether due to error or fraud,
and performing procedures to respond to those risks. Such
procedures included examining, on a test basis, evidence regarding
the amounts and disclosures in the consolidated financial
statements. Our audits also included evaluating the accounting
principles used and significant estimates made by management, as
well as evaluating the overall presentation of the consolidated
financial statements. Our audit of internal control over financial
reporting included obtaining an understanding of internal control
over financial reporting, assessing the risk that a material
weakness exists, and testing and evaluating the design and
operating effectiveness of internal control based on the assessed
risk. Our audits also included performing such other procedures as
we considered necessary in the circumstances. We believe that our
audits provide a reasonable basis for our opinions.
A
material weakness is a deficiency, or combination of deficiencies,
in internal control over financial reporting, such that there is a
reasonable possibility that a material misstatement of the
Company's annual or interim financial statements will not be
prevented or detected on a timely basis. The following material
weakness has been identified:
In
connection with the evaluation and measurement of goodwill for
impairment and valuation of deferred tax assets, we believe the
Company’s management review controls were not effectively
designed to operate at a sufficient level of precision, or there
was not sufficient evidence to demonstrate the controls were
designed to operate at a sufficient level of precision, necessary
to prevent or detect a material misstatement on a timely basis.
Specifically, we believe the Company did not adequately evidence
management’s expectations, criteria for investigation, and
the level of precision used in the performance of the controls. We
also believe the controls did not sufficiently evidence the
completeness and accuracy of key assumptions and other data used by
management in the operation of controls. The aggregation of control
deficiencies in these areas resulted in a material weakness related
to internal control over financial reporting.
We
considered the material weakness in determining the nature, timing,
and extent of the audit tests applied in our audit of the
Company’s consolidated financial statements as of and for the
year ended December 31, 2017, and our opinion on such consolidated
financial statements was not affected.
Definition and Limitations of Internal Control Over Financial
Reporting
A
company’s internal control over financial reporting is a
process designed to provide reasonable assurance regarding the
reliability of financial reporting and the preparation of financial
statements for external purposes in accordance with generally
accepted accounting principles. A company’s internal control
over financial reporting includes those policies and procedures
that (1) pertain to the maintenance of records that, in reasonable
detail, accurately and fairly reflect the transactions and
dispositions of the assets of the company; (2) provide reasonable
assurance that transactions are recorded as necessary to permit
preparation of financial statements in accordance with generally
accepted accounting principles, and that receipts and expenditures
of the company are being made only in accordance with
authorizations of management and directors of the company; and (3)
provide reasonable assurance regarding prevention or timely
detection of unauthorized acquisition, use, or disposition of the
company’s assets that could have a material effect on the
financial statements.
Because
of its inherent limitations, internal control over financial
reporting may not prevent or detect misstatements. Also,
projections of any evaluation of effectiveness to future periods
are subject to the risk that controls may become inadequate because
of changes in conditions, or that the degree of compliance with the
policies or procedures may deteriorate.
/s/
Moss Adams LLP
San
Diego, California
March
15, 2018
We have
served as the Company’s auditor since 2012.
AUTOWEB, INC.
CONSOLIDATED BALANCE SHEETS
(in thousands, except per-share and share data)
|
|
December 31,
2017
|
December 31,
2016
|
|
Assets
|
|
|
|
Current
assets:
|
|
|
|
Cash
and cash equivalents
|
$24,993
|
$38,512
|
|
Short-term
investment
|
254
|
251
|
|
Accounts
receivable, net of allowances for bad debts and customer credits of
$892 and $1,015 at December 31, 2017 and 2016,
respectively
|
25,911
|
33,634
|
|
Deferred
tax asset
|
—
|
4,669
|
|
Prepaid
expenses and other current assets
|
1,805
|
901
|
|
Total
current assets
|
52,963
|
77,967
|
|
Property
and equipment, net
|
4,311
|
4,430
|
|
Investments
|
100
|
680
|
|
Intangible
assets, net
|
29,113
|
23,783
|
|
Goodwill
|
5,133
|
42,821
|
|
Long-term
deferred tax asset
|
692
|
14,799
|
|
Other
assets
|
601
|
801
|
|
Total
assets
|
$92,913
|
$165,281
|
|
|
|
|
|
Liabilities and Stockholders’ Equity
|
|
|
|
Current
liabilities:
|
|
|
|
Accounts
payable
|
$7,083
|
$9,764
|
|
Accrued
employee-related benefits
|
2,411
|
4,530
|
|
Other
accrued expenses and other current liabilities
|
7,252
|
8,315
|
|
Current
portion of term loan payable
|
—
|
6,563
|
|
Total
current liabilities
|
16,746
|
29,172
|
|
Convertible
note payable
|
1,000
|
1,000
|
|
Long-term
portion of term loan payable
|
—
|
7,500
|
|
Borrowings
under revolving credit facility
|
8,000
|
8,000
|
|
Total
liabilities
|
25,746
|
45,672
|
|
Commitments
and contingencies (Note 7)
|
|
|
|
Stockholders’
equity:
|
|
|
|
Preferred
stock, $0.001 par value; 11,445,187 shares authorized
|
|
|
|
Series
A Preferred stock, none issued and outstanding
|
—
|
—
|
|
Series
B Preferred stock, none and 168,007 shares issued and outstanding
at December 31, 2017 and December 31, 2016,
respectively
|
—
|
—
|
|
Common
stock, $0.001 par value; 55,000,000 shares authorized; 13,059,341
and 11,012,625 shares issued and outstanding at December 31,
2017 and 2016, respectively
|
13
|
11
|
|
Additional
paid-in capital
|
356,054
|
350,022
|
|
Accumulated
deficit
|
(288,900)
|
(230,424)
|
|
Total
stockholders’ equity
|
67,167
|
119,609
|
|
Total
liabilities and stockholders’ equity
|
$92,913
|
$165,281
|
The accompanying notes are an integral part of these consolidated
financial statements.
AUTOWEB, INC.
CONSOLIDATED STATEMENTS OF OPERATIONS AND COMPREHENSIVE INCOME
(LOSS)
(in thousands, except per-share data)
|
|
Years Ended December 31,
|
||
|
|
2017
|
2016
|
2015
|
|
Revenues:
|
|
|
|
|
Lead
fees
|
$107,045
|
$130,684
|
$120,678
|
|
Advertising
|
34,142
|
24,508
|
10,534
|
|
Other
revenues
|
938
|
1,492
|
2,014
|
|
Total
revenues
|
142,125
|
156,684
|
133,226
|
|
Cost
of revenues
|
99,352
|
98,771
|
81,586
|
|
Gross
profit
|
42,773
|
57,913
|
51,640
|
|
Operating
expenses:
|
|
|
|
|
Sales
and marketing
|
14,315
|
18,118
|
15,956
|
|
Technology
support
|
12,567
|
13,986
|
11,740
|
|
General
and administrative
|
12,110
|
14,663
|
13,189
|
|
Depreciation
and amortization
|
4,781
|
5,068
|
3,106
|
|
Litigation
settlements
|
(109)
|
(50)
|
(108)
|
|
Goodwill
impairment
|
37,688
|
—
|
—
|
|
Total
operating expenses
|
81,352
|
51,785
|
43,883
|
|
Operating
income (loss)
|
(38,579)
|
6,128
|
7,757
|
|
Interest
and other income (expense), net
|
(946)
|
558
|
322
|
|
Income
(loss) before income tax provision
|
(39,525)
|
6,686
|
8,079
|
|
Income
tax provision
|
25,439
|
2,815
|
3,433
|
|
Net
income (loss) and comprehensive income (loss)
|
$(64,964)
|
$3,871
|
$4,646
|
|
|
|
|
|
|
Basic
earnings (loss) per common share
|
$(5.48)
|
$0.36
|
$0.47
|
|
Diluted
earnings (loss) per common share
|
$(5.48)
|
$0.29
|
$0.37
|
The accompanying notes are an integral part of these consolidated
financial statements.
AUTOWEB, INC.
CONSOLIDATED STATEMENTS OF STOCKHOLDERS’ EQUITY
(in thousands, except share data)
|
|
Common
Stock
|
Preferred
Stock
|
Additional
|
|
|
||
|
|
Number
of
of
Shares
|
Amount
|
Number
of
Shares
|
Amount
|
Paid-In-
Capital
|
Accumulated
Deficit
|
Total
|
|
|
|
|
|
|
|
|
|
|
Balance
at January 1, 2015
|
8,880,377
|
$9
|
-
|
$-
|
$308,190
|
$(238,941)
|
$69,258
|
|
Share-based
compensation
|
-
|
-
|
-
|
-
|
2,563
|
-
|
2,563
|
|
Issuance
of common stock upon exercise of stock options
|
145,979
|
-
|
-
|
-
|
1,197
|
-
|
1,197
|
|
Issuance
of AWI warrants
|
-
|
-
|
-
|
-
|
2,542
|
-
|
2,542
|
|
Issuance
of preferred shares
|
-
|
-
|
168,007
|
-
|
21,133
|
-
|
21,133
|
|
Issuance
of restricted stock
|
125,000
|
-
|
-
|
-
|
-
|
-
|
-
|
|
Exercise
of warrants
|
400,000
|
1
|
-
|
-
|
1,860
|
-
|
1,861
|
|
Conversion
of note payable
|
1,075,268
|
1
|
-
|
-
|
5,000
|
-
|
5,001
|
|
Net
income
|
-
|
-
|
-
|
-
|
-
|
4,646
|
4,646
|
|
Balance
at December 31, 2015
|
10,626,624
|
11
|
168,007
|
-
|
342,485
|
(234,295)
|
108,201
|
|
Share-based
compensation
|
-
|
-
|
-
|
-
|
4,486
|
-
|
4,486
|
|
Issuance
of common stock upon exercise of stock options
|
386,001
|
-
|
-
|
-
|
3,051
|
-
|
3,051
|
|
Net
income
|
-
|
-
|
-
|
-
|
-
|
3,871
|
3,871
|
|
Balance
at December 31, 2016
|
11,012,625
|
11
|
168,007
|
-
|
350,022
|
(230,424)
|
119,609
|
|
Share-based
compensation
|
-
|
-
|
-
|
-
|
4,106
|
-
|
4,106
|
|
Issuance
of common stock upon exercise of stock options
|
248,344
|
-
|
-
|
-
|
1,355
|
-
|
1,355
|
|
Issuance
of restricted stock
|
345,000
|
-
|
-
|
-
|
-
|
-
|
-
|
|
Conversion
of preferred shares
|
1,680,070
|
2
|
(168,007)
|
-
|
(2)
|
-
|
-
|
|
DealerX
contingent consideration
|
-
|
-
|
-
|
-
|
2,470
|
-
|
2,470
|
|
Repurchase
of common stock
|
(226,698)
|
-
|
-
|
-
|
(1,897)
|
-
|
(1,897)
|
|
Cumulative
effect adjustment
|
-
|
-
|
-
|
-
|
-
|
6,488
|
6,488
|
|
Net
loss
|
-
|
-
|
-
|
-
|
-
|
(64,964)
|
(64,964)
|
|
Balance
at December 31, 2017
|
13,059,341
|
$13
|
-
|
$-
|
$356,054
|
$(288,900)
|
$67,167
|
The accompanying notes are an integral part of these consolidated
financial statements.
AUTOWEB, INC.
CONSOLIDATED STATEMENTS OF CASH FLOWS
(in thousands)
|
|
Years Ended December 31,
|
||
|
|
2017
|
2016
|
2015
|
|
Cash
flows from operating activities:
|
|
|
|
|
Net
income (loss)
|
$(64,964)
|
$3,871
|
$4,646
|
|
Adjustments
to reconcile net income (loss) to net cash provided by operating
activities:
|
|
|
|
|
Depreciation
and amortization
|
7,653
|
7,303
|
4,021
|
|
Provision
for bad debt
|
346
|
344
|
379
|
|
Provision
for customer credits
|
247
|
592
|
803
|
|
Share-based
compensation
|
4,103
|
4,412
|
2,557
|
|
Write-down
of assets
|
8
|
115
|
—
|
|
Gain
on sale of business
|
—
|
(2,183)
|
—
|
|
(Gain)/loss
on long-term strategic investment
|
580
|
777
|
(636)
|
|
Change
in deferred tax assets
|
25,264
|
1,994
|
2,996
|
|
Goodwill
impairment
|
37,688
|
—
|
—
|
|
Changes
in assets and liabilities:
|
|
|
|
|
Accounts
receivable
|
7,130
|
(3,229)
|
(381)
|
|
Prepaid
expenses and other current assets
|
(904)
|
(402)
|
(121)
|
|
Other
non-current assets
|
200
|
946
|
147
|
|
Accounts
payable
|
(2,681)
|
2,121
|
(586)
|
|
Accrued
expenses and other current liabilities
|
(3,182)
|
1,581
|
(1,352)
|
|
Non-current
liabilities
|
—
|
—
|
(273)
|
|
Net
cash provided by operating activities
|
11,488
|
18,242
|
12,200
|
|
Cash
flows from investing activities:
|
|
|
|
|
Purchase
of Dealix/Autotegrity
|
—
|
—
|
(25,011)
|
|
Investment
in GoMoto
|
—
|
(375)
|
(375)
|
|
Change
in short-term investment
|
(3)
|
(251)
|
—
|
|
Purchase
of intangible assets
|
(8,600)
|
—
|
—
|
|
Purchases
of property and equipment
|
(1,799)
|
(2,148)
|
(2,719)
|
|
Net
cash used in investing activities
|
(10,402)
|
(2,774)
|
(28,105)
|
|
Cash
flows from financing activities:
|
|
|
|
|
Repurchase
of common stock
|
(1,897)
|
—
|
—
|
|
Borrowings
under credit facility
|
—
|
—
|
2,750
|
|
Borrowings
under term loan
|
—
|
—
|
15,000
|
|
Payments
on term loan borrowings
|
(14,063)
|
(3,937)
|
(3,750)
|
|
Net
proceeds from stock option exercises
|
1,355
|
3,051
|
1,197
|
|
Proceeds
from exercise of warrants
|
—
|
—
|
1,860
|
|
Proceeds
from issuance of preferred shares
|
—
|
—
|
2,132
|
|
Payment
of contingent fee arrangement
|
—
|
(63)
|
(38)
|
|
Net
cash (used in) provided by financing activities
|
(14,605)
|
(949)
|
19,151
|
|
Net
increase (decrease) in cash and cash equivalents
|
(13,519)
|
14,519
|
3,246
|
|
Cash
and cash equivalents, beginning of period
|
38,512
|
23,993
|
20,747
|
|
Cash
and cash equivalents, end of period
|
$24,993
|
$38,512
|
$23,993
|
|
Supplemental
disclosure of cash flow information:
|
|
|
|
|
Cash
paid for income taxes
|
$650
|
$760
|
$552
|
|
Cash
paid for interest
|
$948
|
$717
|
$884
|
|
|
|
|
|
|
Supplemental
schedule of non-cash investing and financing
activities:
|
|
|
|
|
DealerX
contingent consideration
|
$2,470
|
$—
|
$—
|
|
Purchase
of AutoWeb
|
$—
|
$—
|
$21,543
|
|
Conversion
of Cyber Note
|
$—
|
$—
|
$5,000
|
|
Sale
of specialty finance leads business
|
$—
|
$3,168
|
$—
|
The accompanying notes are an integral part of these consolidated
financial statements.
AUTOWEB, INC.
NOTES TO CONSOLIDATED FINANCIAL STATEMENTS
1.
Organization and Operations of AutoWeb
AutoWeb, Inc. (“AutoWeb” or the “Company”) is a digital marketing company for
the automotive industry that assists automotive retail dealers
(“Dealers”) and
automotive manufacturers (“Manufacturers”) market and sell
new and used vehicles to consumers by utilizing the Company’s
digital sales enhancing products and services.
The Company’s consumer-facing automotive
websites (“Company
Websites”) provide
consumers with information and tools to aid them with their
automotive purchase decisions and gives in-market consumers with
information and tools to aid them with their automotive purchase
decisions and gives in-market consumers the ability to connect with
Dealers regarding purchasing or leasing vehicles. These consumers
are connected to Dealers via the Company’s various programs
for online lead referrals (“Leads”). The Company’s AutoWeb®
consumer traffic referral product engages with car buyers from
AutoWeb’s network of automotive websites and uses our
proprietary technology to present them with highly relevant offers
based on their make and model of interest and their geographic
location. The Company then directs these in-market consumers to key
areas of a Dealer’s or Manufacturer’s website to
maximize conversion for sales, service or other products or
services.
The
Company was incorporated in Delaware on May 17, 1996. Its
principal corporate offices are located in Irvine, California. The
Company’s common stock is listed on The Nasdaq Capital Market
under the symbol AUTO.
On
October 9, 2017, the Company changed its name from Autobytel Inc.
to AutoWeb, Inc., assuming the name of AutoWeb, Inc., which was the
name of the company that was acquired by the Company in October
2015. In connection with this name change, the Company’s
stock ticker symbol was changed from “ABTL” to
“AUTO” on The Nasdaq Capital
Market.
On October 5, 2017, the Company and DealerX
Partners, LLC, a Florida limited liability company
(“DealerX”), entered into a Master License and
Services Agreement (“DealerX License
Agreement”). Pursuant to
the terms of the DealerX License Agreement, AutoWeb was granted a
perpetual license to access and use DealerX’s proprietary
platform and technology for targeted, online marketing. DealerX
will operate the platform for AutoWeb and provide enhancements to
and support for the DealerX platform for at least an initial five
year period (“Platform Support
Obligations”). See Note
5.
On December 19, 2016, AutoWeb and Car.com, Inc., a
wholly owned subsidiary of AutoWeb (“Car.com”), entered into an Asset Purchase and Sale
Agreement, by and among AutoWeb, Car.com, and Internet Brands,
Inc., a Delaware corporation (“Internet
Brands”), in which
Internet Brands acquired substantially all of the assets of the
automotive specialty finance leads group of Car.com. The
transaction was completed effective as of December 31, 2016. The
transaction consideration consisted of $3.2 million in cash and
$1.6 million to be paid over a five year period pursuant to a
Transitional License and Linking Agreement. The Company recorded a
gain on sale of approximately $2.2 million in connection with the
transaction in the fourth quarter of 2016. See Note 3.
On October 1, 2015 (“AWI Merger
Date”), AutoWeb entered
into and consummated an Agreement and Plan of Merger by and among
AutoWeb, New Horizon Acquisition Corp., a Delaware corporation and
a wholly owned subsidiary of AutoWeb (“Merger Sub”), Autobytel, Inc. (formerly AutoWeb,
Inc.), a Delaware corporation (“AWI”), and Jose Vargas, in his capacity as
Stockholder Representative. On the AWI Merger Date,
Merger Sub merged with and into AWI, with AWI continuing as the
surviving corporation and as a wholly owned subsidiary of
AutoWeb. AWI was a privately-owned company providing an
automotive search engine that enables Manufacturers and Dealers to
optimize advertising campaigns and reach highly-targeted car buyers
through an auction-based click marketplace. Prior to the
acquisition, the Company previously owned approximately 15% of the
outstanding shares of AWI, on a fully converted and diluted basis,
and accounted for the investment on the cost basis. See
Note 3.
On May 21, 2015 (“Dealix/Autotegrity Acquisition
Date”), AutoWeb and CDK
Global, LLC, a Delaware limited liability company
(“CDK”), entered into and consummated a Stock
Purchase Agreement in which AutoWeb acquired all of the issued and
outstanding shares of common stock in Dealix Corporation, a
California corporation and subsidiary of CDK, and Autotegrity,
Inc., a Delaware corporation and subsidiary of CDK (collectively,
“Dealix/Autotegrity”). Dealix
Corporation provides new and used car Leads to automotive
dealerships, Dealer groups and Manufacturers, and Autotegrity, Inc.
is a consumer Leads acquisition and analytics
business. See Note 3.
On April 27, 2015, Auto Holdings Ltd.
(“Auto
Holdings”) acquired from
Cyber Ventures, Inc. and Autotropolis, Inc. the $5.0 million
convertible subordinated promissory note and the warrant to
purchase 400,000 shares of AutoWeb common stock issued by the
Company to Cyber Ventures and Autotropolis in September 2010 in
connection with AutoWeb’s acquisition of substantially all of
the assets of Cyber Ventures and Autotropolis (collectively
referred to as “Cyber”). Concurrent with the
acquisition of the Cyber convertible note
(“Cyber Note”) and warrant (“Cyber
Warrant”), Auto Holdings
converted the Cyber Note and fully exercised the Cyber Warrant at
its conversion price of $4.65 per share. As required
under the terms of the conversion for the Cyber Note, AutoWeb
issued 1,075,268 shares of its common stock and under the terms of
exercise for the Cyber Warrant, it issued an additional 400,000
shares of its common stock.
2.
Summary of Significant Accounting Policies
Basis of
Presentation. The
accompanying consolidated financial statements include the accounts
of the Company and its wholly-owned subsidiaries. All intercompany
transactions and balances have been eliminated in
consolidation. Certain prior year amounts have been
reclassified for consistency with the current period
presentation. These reclassifications had no effect on
the reported results of operations.
Use of Estimates in the
Preparation of Financial Statements. The preparation of financial statements in
conformity with accounting principles generally accepted in the
United States of America (“U.S. GAAP”) requires the Company to make estimates
and assumptions that affect the reported amounts of assets and
liabilities and disclosure of contingent assets and liabilities at
the date of the financial statements and the reported amounts of
revenues and expenses during the reporting period. Significant
estimates include, but are not limited to, allowances for bad debts
and customer credits, useful lives of depreciable assets and
capitalized software costs, long-lived asset impairments, goodwill
and purchased intangible asset valuations, accrued liabilities,
contingent payment provisions, debt valuation and valuation
allowance for deferred tax assets, warrant valuation and
stock-based compensation expense. Actual results could differ from
those estimates.
Cash and Cash
Equivalents. For
purposes of the Consolidated Balance Sheets and the Consolidated
Statements of Cash Flows, the Company considers all highly liquid
investments with an original maturity of 90 days or less at the
date of purchase to be cash equivalents. Cash and cash equivalents
represent amounts held by the Company for use by the Company
and are recorded at cost, which approximates fair
value.
Investments. The Company makes strategic
investments because they believe that investments may allow
the Company to increase market share, benefit from advancements in
technology and strengthen its business operations by enhancing
their product and service offerings.
Accounts
Receivable. Credit
is extended to customers based on an evaluation of the
customer’s financial condition, and when credit is extended,
collateral is generally not required. Interest is not normally
charged on receivables.
Allowances for Bad Debts and
Customer Credits. The allowance for bad debts is an estimate of bad
debt expense that could result from the inability or refusal of
customers to pay for services. Additions to the estimated allowance
for bad debts are recorded to sales and marketing expenses and are
based on factors such as historical write-off percentages, the
current business environment and known concerns within the current
aging of accounts receivable. Reductions in the estimated allowance
for bad debts due to subsequent cash recoveries are recorded as a
decrease in sales and marketing expenses. As specific bad debts are
identified, they are written-off against the previously established
estimated allowance for bad debts with no impact on operating
expenses.
The
allowance for customer credits is an estimate of adjustments for
services that do not meet the customer requirements. Additions to
the estimated allowance for customer credits are recorded as a
reduction of revenues and are based on the Company’s
historical experience of: (i) the amount of credits issued;
(ii) the length of time after services are rendered that the
credits are issued; (iii) other factors known at the time; and
(iv) future expectations. Reductions in the estimated allowance for
customer credits are recorded as an increase in revenues. As
specific customer credits are identified, they are written-off
against the previously established estimated allowance for customer
credits with no impact on revenues.
If
there is a decline in the general economic environment that
negatively affects the financial condition of the Company’s
customers or an increase in the number of customers that are
dissatisfied with their services, additional estimated allowances
for bad debts and customer credits may be required, and the impact
on the Company’s business, results of operations, financial
condition, earnings per share, cash flow or the trading price of
our stock could be material.
Contingencies. From
time to time the Company may be subject to proceedings, lawsuits
and other claims. The Company assesses the likelihood of
any adverse judgments or outcomes of these matters as well as
potential ranges of probable losses. The Company records a loss
contingency when an unfavorable outcome is probable and the amount
of the loss can be reasonably estimated. The amount of allowances
required, if any, for these contingencies is determined after
analysis of each individual case. The amount of allowances may
change in the future if there are new material developments in each
matter. Gain contingencies are not recorded until all
elements necessary to realize the revenue are present. Any legal
fees incurred in connection with a contingency are expensed as
incurred.
Fair Value of Financial
Instruments. The
Company records its financial assets and liabilities at fair value,
which is defined under the applicable accounting standards as the
exchange price that would be received for an asset or paid to
transfer a liability (an exit price) in the principal or most
advantageous market for the asset or liability in an orderly
transaction between market participants on the measure
date. The Company uses valuation techniques to measure
fair value, maximizing the use of observable outputs and minimizing
the use of unobservable inputs. The standard describes a
fair value hierarchy based on three levels of inputs, of which the
first two are considered observable and the last unobservable, that
may be used to measure fair value which are the
following:
Level
1 – Quoted prices in active markets for identical assets or
liabilities.
Level
2 – Inputs other than Level 1 that are observable, either
directly or indirectly, such as quoted prices for similar assets or
liabilities; quoted prices in markets that are not active; or other
inputs that are observable or can be corroborated by observable
market data for substantially the full term of the assets or
liabilities.
Level
3 – Inputs include management’s best estimate of what
market participants would use in pricing the asset or liability at
the measurement date. The inputs are unobservable in the
market and significant to the instrument’s
valuation.
Cash
equivalents, accounts receivable, net of allowance, accounts
payable and accrued liabilities, are carried at cost, which
management believes approximates fair value because of the
short-term maturity of these instruments.
The
Company’s investments at December 31, 2017 and 2016 consist
primarily of investments in SaleMove and GoMoto and are accounted
for under the cost method. During the years ended December 31, 2017
and 2016, the Company recorded a write-off related to it its
investments in SaleMove of $0.6 million and GoMoto of $0.7 million
in SaleMove, respectively.
Variable Interest
Entities. The
Company has an investment in an entity that is considered a
variable interest entity (“VIE”) under U.S. GAAP. The Company
has concluded that its investment in SaleMove qualifies as a
variable interest and SaleMove is a VIE. VIEs are legal entities in
which the equity investors do not have sufficient equity at risk
for the entity to independently finance its activities or the
collective holders do not have the power through voting or similar
rights to direct the activities of the entity that most
significantly impacts its economic performance, the obligation to
absorb the expected losses of the entity, or the right to receive
expected residual returns of the entity. Consolidation of a VIE is
considered appropriate if a reporting entity is the primary
beneficiary, the party that has both significant influence and
control over the VIE. Management periodically performs a
qualitative analysis to determine if the Company is the primary
beneficiary of a VIE. This analysis includes review of the
VIEs’ capital structure, contractual terms, and primary
activities, including the Company’s ability to direct the
activities of the VIEs and obligations to absorb losses, or the
right to receive benefits, significant to the
VIE.
Based
on AutoWeb’s analysis for the periods presented in this
report, it is not the primary beneficiary of SaleMove. Accordingly,
SaleMove does not meet the criteria for consolidation.
The SaleMove advances are classified as an other long-term asset on
the consolidated balance sheet as of December 31, 2017 and December
31, 2016. The carrying value and maximum potential loss
exposure from SaleMove was zero and $0.6 million as of December 31,
2017 and 2016, respectively.
Concentration of Credit Risk
and Risks Due to Significant
Customers. Financial
instruments that potentially subject the Company to concentrations
of credit risk consist primarily of cash and cash equivalents,
investments and accounts receivable. Cash and cash equivalents are
primarily maintained with two financial institutions in the United
States. Deposits held by banks exceed the amount of insurance
provided for such deposits. Generally these deposits may be
redeemed upon demand. Accounts receivable are primarily derived
from fees billed to automotive Dealers and automotive
Manufacturers.
The
Company has a concentration of credit risk with its automotive
industry related accounts receivable balances, particularly with
Urban Science Applications (which represents several Manufacturer
programs), General Motors and Media.net
Advertising. During 2017, approximately 34% of the
Company’s total revenues were derived from these three
customers, and approximately 43% or $11.6 million of gross accounts
receivable related to these three customers at December 31,
2017. In 2017, Urban Science Applications accounted for
15% and 20% of total revenues and total accounts receivable as of
December 31, 2017, respectively. In 2017, Media.net Advertising
accounted for 11% of both total revenues and accounts receivable as
of December 31, 2017, respectively.
.
During
2016, approximately 28% of the Company’s total revenues were
derived from Urban Science Applications, General Motors and Ford
Direct, and approximately 36% or $12.6 million of gross accounts
receivable related to these three customers at December 31,
2016. In 2016, Urban Science Applications accounted for
16% and 19% of total revenues and total accounts receivable as of
December 31, 2016, respectively.
Property and
Equipment. Property
and equipment are stated at cost less accumulated depreciation and
amortization. Depreciation is provided using the straight-line
method over the estimated useful lives of the respective assets,
generally three years. Amortization of leasehold improvements is
provided using the straight-line method over the shorter of the
remaining lease term or the estimated useful lives of the
improvements. Repair and maintenance costs are charged to operating
expenses as incurred. Gains or losses resulting from the retirement
or sale of property and equipment are recorded as operating income
or expenses, respectively.
Operating
Leases. The Company
leases office space and certain office equipment under operating
lease agreements which expire on various dates through 2024, with
options to renew on expiration of the original lease
terms.
Reimbursed
tenant improvements are considered in determining straight-line
rent expense and are amortized over the shorter of their estimated
useful lives or the lease term. The lease term begins on the date
of initial possession of the leased property for purposes of
recognizing rent expense on a straight-line basis over the term of
the lease. Lease renewal periods are considered on a lease-by-lease
basis and are generally not included in the initial lease
term.
Capitalized Internal Use
Software and Website Development
Costs. The Company
capitalizes costs to develop internal use software in accordance
with Accounting Standards Codification (“ASC”) 350-40, Internal-Use Software, and ASC
350-50, Website Development Costs, which require the capitalization
of external and internal computer software costs and website
development costs, respectively, incurred during the application
development stage. The application development stage is
characterized by software design and configuration activities,
coding, testing and installation. Training and maintenance costs
are expensed as incurred while upgrades and enhancements are
capitalized if it is probable that such expenditures will result in
additional functionality. Capitalized internal use software
development costs are amortized using the straight-line method over
an estimated useful life of three to five years. Capitalized
website development costs, once placed in service, are amortized
using the straight-line method over the estimated useful life of
the related websites. The Company capitalized $0.5
million, $1.7 million and $1.5 million of such costs for the years
ended December 31, 2017, 2016 and 2015,
respectively.
Impairment of Long-Lived
Assets and Intangible Assets. The Company periodically reviews long-lived
amortizing assets to determine if there is any impairment of these
assets. The Company assesses the impairment of these assets, or the
need to accelerate amortization, whenever events or changes in
circumstances indicate that the carrying value may not be
recoverable. Judgments regarding the existence of impairment
indicators are based on legal factors, market conditions and
operational performance of the long-lived assets and other
intangibles. Future events could cause the Company to conclude that
impairment indicators exist and that the assets should be reviewed
to determine their fair value. The Company assesses the assets for
impairment based on the estimated future undiscounted cash flows
expected to result from the use of the assets and their eventual
disposition. If the carrying amount of an asset exceeds its
estimated future undiscounted cash flows, an impairment loss is
recorded for the excess of the asset’s carrying amount over
its fair value. Fair value is generally determined based on a
valuation process that provides an estimate of a fair value of
these assets using a discounted cash flow model, which includes
many assumptions and estimates. Once the valuation is determined,
the Company would write-down these assets to their determined fair
value, if necessary. Any write-down could have a material adverse
effect on the Company’s financial condition and results of
operations. The Company recorded impairment of $0.6 million related
to its investment in SaleMove in 2017. The Company did not record
any impairment of long-lived assets in 2016 and
2015.
Indefinite-lived intangible
assets. Indefinite-lived
intangible assets consists of a domain name, which was acquired as
part of the Dealix/Autotegrity acquisition in 2015, which is tested
for impairment annually, or more frequently if an event occurs or
circumstances changes that would indicate that impairment may
exist. When evaluating indefinite-lived intangible assets for
impairment, the Company may first perform a qualitative analysis to
determine whether it is more likely than not that the
indefinite-lived intangible assets is impaired. If the Company does
not perform the qualitative assessment, or if the Company
determines that it is more likely than not that the fair value of
the indefinite-lived intangible asset exceeds its carrying amount,
the Company will calculate the estimated fair value of the
indefinite-lived intangible asset. Fair value is the price a
willing buyer would pay for the indefinite-lived intangible asset
and is typically calculated using an income approach. If the
carrying amount of the indefinite-lived intangible asset exceeds
the estimated fair value, an impairment charge is recorded to
reduce the carrying value to the estimated fair value. The Company
did not record any impairment of indefinite-lived intangible assets
in 2017, 2016 and 2015.
Goodwill. Goodwill
represents the excess of the purchase price for business
acquisitions over the fair value of identifiable assets and
liabilities acquired. The Company evaluates the carrying value of
enterprise goodwill for impairment by comparing the
enterprise’s carrying value to its fair value. If the fair
value is less than the carrying value, enterprise goodwill is
potentially impaired. The Company evaluates enterprise goodwill, at
a minimum, on an annual basis in the fourth quarter of each year or
whenever events or changes in circumstances suggest that the
carrying amount of goodwill may be impaired. The Company recorded
goodwill impairment of $37.7 million in
2017.
Revenue
Recognition. Lead
fees consist of fees from the sale of Leads for new and used
vehicles and Leads for vehicle financing. Fees paid by
customers participating in the Company’s Lead programs are
comprised of monthly transaction and/or subscription
fees. Advertising revenues represent fees for display
advertising on Company’s Websites and fees from the
Company’s click programs.
The
Company recognizes revenues when evidence of an arrangement exists,
pricing is fixed and determinable, collection is reasonably assured
and delivery or performance of service has occurred. Lead fees are
generally recognized as revenues in the period the service is
provided. Advertising revenues are generally recognized in the
period the advertisements are displayed on Company Websites and the
period in which clicks have been delivered. Fees billed prior to
providing services are deferred, as they do not satisfy all U.S.
GAAP revenue recognition criteria. Deferred revenues are recognized
as revenue over the periods services are provided.
Cost of Revenues.
Cost of revenues consists of Lead and
traffic acquisition costs and other cost of revenues. Lead and
traffic acquisition costs consist of payments made to the
Company’s Lead providers, including internet portals and
on-line automotive information providers. Other cost of revenues
consists of search engine marketing (“SEM”) and fees paid to third parties for data
and content, including search engine optimization
(“SEO”) activity, included on the Company’s
properties, connectivity costs and development costs related to the
Company Websites, compensation related expense and technology
license fees, server equipment depreciation and technology
amortization directly related to Company Websites. SEM,
sometimes referred to as paid search marketing, is the practice of
bidding on keywords on search engines to drive traffic to a
website.
Income
Taxes. The Company
accounts for income taxes under the asset and liability method.
Deferred tax assets and liabilities are recognized for the future
tax consequences attributable to temporary differences between the
financial statement carrying amounts of existing assets and
liabilities and their respective tax bases. Deferred tax assets and
liabilities are measured using enacted tax rates expected to apply
to taxable income in the years in which those temporary differences
are expected to be recovered or settled. The effect on deferred tax
assets and liabilities of a change in tax rates is recognized in
income in the period that includes the enactment date. The Company
records a valuation allowance, if necessary, to reduce deferred tax
assets to an amount it believes is more likely than not to be
realized.
On December 22, 2017, the U.S. government enacted
comprehensive tax legislation known as the Tax Cuts and Jobs Act
(“TCJA”). The TCJA establishes new tax laws that
will take effect in 2018, including, but not limited to (1)
reduction of the U.S. federal corporate tax rate from a maximum of
35% to 21%; (2) elimination of the corporate alternative minimum
tax (“AMT”); (3)
a new limitation on deductible interest expense; (4) one-time
transition tax on certain deemed repatriated earnings of foreign
subsidiaries (“Transition
Tax”); (5) limitations on the deductibility of certain
executive compensation; (6) changes to the bonus depreciation rules
for fixed asset additions: and (7) limitations on net operating
losses (“NOLs”)
generated after December 31, 2017, to 80% of taxable
income.
ASC 740, Income Taxes, requires the effects of
changes in tax laws to be recognized in the period in which the
legislation is enacted. However, due to the complexity and
significance of the TCJA's provisions, the SEC staff issued Staff
Accounting Bulletin 118 (“SAB 118”), which provides guidance on accounting
for the tax effects of the TCJA. SAB 118 provides a measurement
period that should not extend beyond one year from the TCJA
enactment date for companies to complete the accounting under ASC
740. In accordance with SAB 118, a company must reflect the income
tax effects of those aspects of the TCJA for which the accounting
under ASC 740 is complete. To the extent that a company’s
accounting for certain income tax effects of the TCJA is incomplete
but it is able to determine a reasonable estimate, it must record a
provisional estimate in the financial statements. If a company
cannot determine a provisional estimate to be included in the
financial statements, it should continue to apply ASC 740 on the
basis of the provisions of the tax laws that were in effect
immediately before the enactment of the TCJA.
At
December 31, 2017, the Company has not completed its accounting for
the tax effects of enactment of the TCJA; however, the Company has
made a reasonable estimate of the effects of the TCJA’s
change in the federal rate and revalued its deferred tax assets
based on the rates at which they are expected to reverse in the
future, which is generally the new 21% federal corporate tax rate
plus applicable state tax rate. The Company recorded a
decrease in deferred tax assets and deferred tax liabilities of
$11.7 million and $0.0 million, respectively, with a corresponding
net adjustment to deferred income tax expense of $11.7 million for
the year ended December 31, 2017. In addition, the Company
recognized a deemed repatriation of $0.6 million of deferred
foreign income from its Guatemala subsidiary, which did not result
in any incremental tax cost after application of foreign tax
credits. The Company’s provisional estimates will be
adjusted during the measurement period defined under SAB 118, based
upon ongoing analysis of data and tax positions along with the new
guidance from regulators and interpretations of the
law.
Computation of Basic and
Diluted Net Earnings (Loss) per
Share. Basic net
earnings (loss) per share is computed using the weighted average
number of common shares outstanding during the
period. Diluted net earnings (loss) per share is
computed using the weighted average number of common shares, and if
dilutive, potential common shares outstanding, as determined under
the treasury stock and if-converted method, during the period.
Potential common shares consist of common shares issuable upon the
exercise of stock options, common shares issuable upon the exercise
of warrants described below and common shares issuable upon
conversion of the shares described in Note 3.
The
following are the share amounts utilized to compute the basic and
diluted net earnings (loss) per share for the years ended
December 31:
|
|
2017
|
2016
|
2015
|
|
Basic
Shares:
|
|
|
|
|
Weighted
average common shares outstanding
|
11,910,906
|
10,673,015
|
9,907,066
|
|
Weighted
average common shares repurchased
|
(58,367)
|
—
|
—
|
|
Basic
Shares
|
11,852,539
|
10,673,015
|
9,907,066
|
|
|
|
|
|
|
Diluted
Shares:
|
|
|
|
|
Basic
Shares
|
11,852,539
|
10,673,015
|
9,907,066
|
|
Weighted
average dilutive securities
|
—
|
2,630,194
|
2,755,258
|
|
Dilutive
Shares
|
11,852,539
|
13,303,209
|
12,662,324
|
For
the year ended December 31, 2017, weighted average dilutive
securities were not included since the company had a net loss for
the year. For the years ended December 31, 2016 and 2015, weighted
average dilutive securities included dilutive options, warrants and
convertible preferred shares.
Potentially
dilutive securities representing approximately 3.7 million,
1.9 million and 1.4 million shares of common stock for the
years ended December 31, 2017, 2016 and 2015, respectively,
were excluded from the computation of diluted income per share for
these periods because their effect would have been
anti-dilutive.
Share-Based
Compensation. The
Company grants restricted stock and stock option awards (the
“Awards”) under several of its share-based
compensation Plans (the “Plans”), that are more fully described in Note
9. The Company recognizes share-based compensation based
on the Awards’ fair value, net of estimated forfeitures on a
straight line basis over the requisite service periods, which is
generally over the awards’ respective vesting period, or on
an accelerated basis over the estimated performance periods for
options with performance conditions.
Restricted
stock fair value is measured on the grant date based on the quoted
market price of the Company’s common stock, and the stock
option fair value is estimated on the grant date using the
Black-Scholes option pricing model based on the underlying common
stock closing price as of the date of grant, the expected term,
stock price volatility and risk-free interest rates.
Business Segment.
The Company conducts its business
within the United States and within one business segment which is
defined as providing automotive and marketing
services. The Company’s operations are aggregated
into a single reportable operating segment based upon similar
economic and operating characteristics as well as similar
markets.
Advertising
Expense. Advertising
costs are expensed in the period incurred and the majority of
advertising expense is recorded in sales and marketing expense.
Advertising expense in the years ended December 31, 2017, 2016 and
2015 was $1.7 million, $1.4 million and $2.0 million,
respectively.
Recent Accounting Pronouncements
Issued but not yet adopted by the Company
Accounting Standards
Codification 842
“Leases.” In February 2016, Accounting Standards Update
(“ASU”) No. 2016-02, “Leases (Topic
842)” was issued. This ASU will require lessees to
recognize on the balance sheet the assets and liabilities for the
rights and obligations created by those leases of terms more than
12 months. The ASU will require both capital and
operating leases to be recognized on the balance
sheet. Qualitative and quantitative disclosures will
also be required to help investors and other financial statement
users better understand the amount, timing and uncertainty of cash
flows arising from leases. In January 2018, ASU No.
2018-01, “Land Easement Practical Expedient for Transition to
Topic842” was issued. This ASU permits an entity to elect an
optional transition practical expedient to not evaluate under Topic
842 land easements that exist or expired before the entity’s
adoption of Topic 842 and that were not previously accounted for as
leases under Topic 840. The ASU will take effect for public
companies for fiscal years, and interim periods within those fiscal
years, beginning after December 15, 2018. The Company expects this
standard will have a material effect on its consolidated financial
statements due to the recognition of new right-of-use assets and
lease liabilities on its balance sheet for real estate and
equipment operating leases. The Company is continuing to evaluate
the effect this guidance will have on the consolidated financial
statements and related disclosures.
Accounting Standards
Codification 805 “Business
Combinations.” In January 2017, ASU No. 2017-01,
“Clarifying the Definition of a Business” was
issued. This ASU provides a more robust framework to use
in determining when a set of assets and activities is a
business. The amendments in this ASU are effective for
annual periods beginning after December 15, 2017, and interim
periods within those periods. The Company does not
believe this ASU will have a material effect on the consolidated
financial statements and related disclosures.
Accounting Standards
Codification 718 “Compensation – Stock
Compensation.” In May 2017, ASU No. 2017-09, “Scope of
Modification Accounting” was issued. The
amendments in this update provide guidance about which changes to
the terms or conditions of a share-based payment award require an
entity to apply modification accounting in Topic 718. An entity
should apply this ASU on a prospective basis for an award modified
on or after the adoption date for annual periods, and interim
periods within those annual periods, beginning after December 15,
2017. Early adoption is permitted. The Company does not believe
this ASU will have a material effect on the consolidated financial
statements and related disclosures.
Accounting Standards
Codification 606 “Revenue from Contracts with
Customers.” In
May 2014, ASU 2014-09, “Revenue from Contracts with Customers
(Topic 606)” was issued. This ASU requires the use
of a five-step methodology to depict the transfer of promised goods
and services to customers in an amount that reflects the
consideration to which the entity expects to be entitled in
exchange for those goods or services. In addition, the ASU requires
enhanced disclosure regarding revenue
recognition.
The
standard permits the use of either the retrospective or cumulative
effect transition method (modified retrospective method). The
Company adopted the ASU on a modified retrospective transition
method on January 1, 2018 and will apply the guidance to the most
current period presented in the financial statements issued
subsequent to the adoption date. The Company did not record a
cumulative adjustment to retained earnings as of January 1, 2018
since the Company was recognizing revenue consistent with the
provisions of ASC 606 and any adjustment would have been deemed
immaterial. In preparation for adoption of the standard, the
Company has implemented internal controls to enable the preparation
of financial information and have reached conclusions on key
accounting assessments related to the standard, including that
accounting for variable consideration is immaterial.
Under
ASU 2014-09, revenue is recognized upon transfer of control of
promised products or services to customers. The Company has three
main revenue streams: lead fees, advertising and other revenues.
Lead fees are paid by Dealers and Manufacturers participating in
the Company’s Lead programs and are comprised of monthly
transaction and/or subscription fees. Lead fees are recognized in
the period when service is provided. Advertising revenue represents
fees for display advertising on our website and fees from our click
program. Advertising revenue is recognized in the period the
advertisements are displayed on our websites and the period in
which clicks have been delivered.
The
Company adopted the standard through the application of the
portfolio approach and selected a sample of customer contracts to
assess under the guidance of the new standard that are
characteristically representative of each revenue stream. The
Company has completed its review of the sample contracts, and the
Company does not anticipate a significant change to the pattern or
timing of revenue recognition as a result of adopting the new
standard.
Recently adopted by the Company
Accounting Standards
Codification 350 “Intangibles – Goodwill and
Other.” In
January 2017, ASU No. 2017-04, “Simplifying the Test for
Goodwill Impairment” was issued. Under the
amendments in this ASU, an entity should perform its annual, or
interim, goodwill impairment test by comparing the fair value of a
reporting unit with its carrying amount. An entity
should recognize an impairment charge for the amount by which the
carrying amount exceeds the reporting unit’s fair value;
however, the loss should not exceed the total amount of goodwill
allocated to that reporting unit. The ASU also eliminated the
requirements for any reporting unit with a zero or negative
carrying amount to perform a qualitative assessment and, if it
fails that qualitative test, to perform Step 2 of the goodwill
impairment test. The Company early adopted the provisions of ASU
No. 2017-04 and recorded impairment of goodwill for the year ended
December 31, 2017 of $37.7 million.
Accounting Standards
Codification 740 “Income
Taxes.” In November
2015, ASU No. 2015-17, “Balance Sheet Classification of
Deferred Taxes” was issued. This ASU requires that
deferred tax liabilities and assets be classified as noncurrent in
a classified statement of financial position. The
amendments in this update apply to all entities that present a
classified statement of financial position. The Company
adopted this ASU prospectively on January 1, 2017 and
reclassified $4.7 million of current deferred tax assets to
long-term deferred tax assets. Prior periods were not
retrospectively adjusted.
Accounting Standards
Codification 323 “Investments-Equity Method and Joint
Ventures.” In
March 2016, ASU No. 2016-07, “Simplifying the Transition to
the Equity Method of Accounting” was issued. This
ASU eliminates the requirement that when an investment qualifies
for use of the equity method as a result of an increase in the
level of ownership interest or degree of influence, an investor
must adjust the investment, results of operations, and retained
earnings retroactively on a step-by-step basis as if the equity
method had been in effect during all previous periods that the
investment was held. The amendments require that the
equity method investor add the cost of acquiring the additional
interest in the investee to the current basis of the
investor’s previously held interest and adopt the equity
method of accounting as of the date the investment becomes
qualified for equity method accounting. Thus, upon
qualifying for the equity method of accounting, no retroactive
adjustment of the investment is required. The Company
adopted this ASU on January 1, 2017 and it did not have a material
effect on the consolidated financial
statements.
Accounting Standards
Codification 718 “Compensation-Stock
Compensation.” In March
2016, ASU No. 2016-09, “Improvements to Employee Share-Based
Payment Accounting” was issued. This ASU provides
for areas of simplification for several aspects of the accounting
for share-based payment transactions, including the income tax
consequences, classification of awards as either equity or
liabilities, and classification on the statement of cash
flows.
The changes in the new standard eliminate
the accounting for excess tax benefits to be recognized in
additional paid-in capital and tax deficiencies recognized either
in the income tax provision or in additional paid-in capital. ASU
2016-09 requires recognition of excess tax benefits and tax
deficiencies in the income statement on a prospective basis. The
Company adopted the amendments on January 1, 2017 related to the
timing of when excess tax benefits are recognized on a modified
retrospective transition method. The Company recognized $6.5
million of deferred tax assets relating to unrealized stock option
benefits, resulting in a cumulative $6.5 million adjustment to
retained earnings.
For the twelve months ended December 31, 2017, the Company
recognized all excess tax benefits and tax deficiencies as income
tax expense or benefit as a discrete event. Income tax benefit of
approximately $32,000 was recognized in the twelve months
ended December 31, 2017 as a result of the adoption of ASU
2016-09.
The
treatment of forfeitures has not changed as the Company is electing
to continue its current process of estimating the number of
forfeitures. As such, this has no cumulative effect on retained
earnings. The Company has elected to present the cash flow
statement on a prospective transition method and no prior periods
have been adjusted.
The
Company calculates diluted earnings per share using the treasury
stock method for share-based payment awards. ASU 2016-09 eliminates
excess tax benefits and deficiencies from the calculation of
assumed proceeds under the treasury stock method, which the Company
adopted on a prospective transition method.
Accounting
Standards Codification 230 “Statement of Cash
Flows.” In
August 2016, ASU No. 2016-15, “Classification of Certain Cash
Receipts and Cash Payments” was issued. This ASU
provides guidance on eight specific cash flow issues with the
objective of reducing the existing diversity in practice for those
issues. The amendments in this ASU are effective for
annual periods beginning after December 15, 2017, and interim
periods within those annual periods. The Company early adopted this
ASU on January 1, 2017 and it did not have a material effect on the
consolidated financial statements.
Accounting Standards
Codification 810
“Consolidation.” In October 2016, ASU No. 2016-17, “Interests
Held through Related Parties That Are Under Common Control”
was issued. This ASU amends the consolidation guidance
on how a reporting entity that is the single decision maker of a
variable interest entity (“VIE”) should treat indirect interests in the
entity held through related parties that are under common control
with the reporting entity when determining whether it is the
primary beneficiary of that VIE. The amendments in this
ASU are effective for annual periods beginning after December 15,
2016, and interim periods within those annual
periods. The Company adopted this ASU on January 1, 2017
and it did not have a material effect on the consolidated financial
statements.
3.
Acquisitions and Disposals
Acquisition of AWI
On
the AWI Merger Date, Merger Sub merged with and into AWI, with AWI
continuing as the surviving corporation and as a wholly owned
subsidiary of AutoWeb.
The AWI Merger Date fair value of the
consideration transferred totaled $23.8 million consisting of (i)
168,007 newly issued shares of Series B Junior Participating
Convertible Preferred Stock, par value $0.001 per share, of AutoWeb
(“Series B Preferred
Stock”); (ii) warrants to
purchase up to 148,240 shares of Series B Preferred Stock
“AWI
Warrant”), at an exercise
price of $184.47 (reflecting 10 times the $16.77 closing price of a
share of the Company’s common stock, $0.001 par value per
share (“Common Stock”), plus a ten percent (10%) premium); and
(iii) $0.3 million in cash to cancel vested, in-the-money options
to acquire shares of AWI common stock. As a result of
accounting for the transaction as a business combination achieved
in stages, the Company also recorded $0.6 million as a gain to the
pre-merger investment in AWI. The results of operations
of AWI have been included in the Company’s results of
operations since the AWI Merger Date.
|
|
(in thousands)
|
|
Series
B Preferred Stock
|
$20,989
|
|
Series
B Preferred warrants to purchase 148,240 shares of Series B
Preferred Stock
|
2,542
|
|
Cash
|
279
|
|
Fair
value of prior ownership in AWI
|
4,016
|
|
|
$27,826
|
The
shares of Series B Preferred Stock were converted into ten (10)
shares of Common Stock upon stockholder approval on June 22,
2017.
The AWI Warrant was valued at $1.72 per share
underlying the warrant for a total value of $2.5
million. The Company used a Monte Carlo simulation model
to determine the value of the AWI Warrant. Key
assumptions used in valuing the AutoWeb Warrant are as follows:
risk-free rate of 1.9%, stock price volatility of 74.0% and a term
of 7.0 years. On June 22, 2017, the Company received
stockholder approval which resulted in the automatic conversion of
the AWI Warrant into warrants to acquire up to 1,482,400 shares of
the Company’s common stock at an exercise price of $18.45 per
share of common stock. The AWI Warrant becomes exercisable on
October 1, 2018, subject to the following vesting conditions: (i)
with respect to the first one-third (1/3) of the warrant shares, if
at any time after the issuance date of the AWI Warrant and prior to
the expiration date of the AWI Warrant the weighted average closing
price of the Common Stock for the preceding 30 trading days
(adjusted for any stock splits, stock dividends, reverse stock
splits or combinations of the Common Stock occurring after the
issuance date) (“Weighted Average Closing
Price”) is at or above
$30.00; (ii) with respect to the second one-third (1/3) of the
warrant shares, if at any time after the issuance date of the AWI
Warrant and prior to the expiration date the Weighted Average
Closing Price is at or above $37.50; and (iii) with respect to the
last one-third (1/3) of the warrant shares, if at any time after
the issuance date of the AWI Warrant and prior to the expiration
date the Weighted Average Closing Price is at or above
$45.00. The AWI Warrant expires on October 1,
2022.
The
following table summarizes the fair values of the assets acquired
and liabilities assumed as of the AWI Merger
Date.
|
|
(in thousands)
|
|
Net
identifiable assets acquired:
|
|
|
Total
tangible assets acquired
|
$4,456
|
|
Total
liabilities assumed
|
543
|
|
Net
identifiable assets acquired
|
3,913
|
|
|
|
|
Definite-lived
intangible assets acquired
|
17,690
|
|
Goodwill
|
5,954
|
|
|
$27,557
|
The
fair value of the acquired intangible assets was determined using
the below valuation approaches. In estimating the fair value of the
acquired intangible assets, the Company utilized the valuation
methodology determined to be most appropriate for the individual
intangible asset being valued as described below. The intangible
assets related to the AWI acquisition include the
following:
|
|
Valuation Method
|
Estimated
Fair Value
|
Estimated
Useful Life (1)
|
|
|
|
(in thousands)
|
(years)
|
|
|
|
|
|
|
Customer
relationships
|
Excess
of earnings (2)
|
$7,470
|
4
|
|
Trademark/trade
names
|
Relief
from Royalty (3)
|
2,600
|
6
|
|
Developed
technology
|
Excess
of earnings (4)
|
7,620
|
7
|
|
Total
purchased intangible assets
|
|
$17,690
|
|
|
(1)
|
Determination of the estimated useful lives of the individual
categories of purchased intangible assets was based on the nature
of the applicable intangible asset and the expected future cash
flows to be derived from such intangible asset. Amortization of
intangible assets with definite lives is recognized over the
shorter of the respective life of the agreement or the period of
time the assets are expected to contribute to future cash
flows.
|
|
|
(2)
|
The excess of earnings method estimates a purchased intangible
asset's value based on the present value of the prospective net
cash flows (or excess earnings) attributable to it. The value
attributed to these intangibles was based on projected net cash
inflows from existing contracts or relationships.
|
|
|
(3)
|
The relief from royalty method is an earnings approach which
assesses the royalty savings an entity realizes since it owns the
asset and isn’t required to pay a third party a license fee
for its use.
|
|
|
(4)
|
The excess of earnings method estimates a purchased intangible
asset's value based on the present value of the prospective net
cash flows (or excess earnings) attributable to it. The method
takes into account technological and economic obsolescence of the
technology.
|
|
Additionally,
in connection with the acquisition of AWI, the Company entered into
non-compete agreements with key executives of AWI. The
fair value of the AWI non-compete agreements was $270,000 and was
derived by calculating the difference between the present value of
the Company’s forecasted cash flows with the agreements in
place and without the agreements in place. The Company
amortized the value of the AWI non-compete agreement over two
years.
Some
of the more significant estimates and assumptions inherent in the
estimate of the fair value of the identifiable purchased intangible
assets include all assumptions associated with forecasting cash
flows and profitability. The primary assumptions used for the
determination of the preliminary fair value of the purchased
intangible assets were generally based upon the discounted present
value of anticipated cash flows. Estimated years of projected
earnings generally follow the range of estimated remaining useful
lives for each intangible asset class.
The
goodwill recognized of $6.0 million was attributable primarily to
expected synergies and the assembled workforce of
AWI. The Company incurred approximately $1.1 million of
acquisition-related costs related to the AWI
acquisition.
Acquisition of Dealix/Autotegrity
On
the Dealix/Autotegrity Acquisition Date, AutoWeb acquired all of
the issued and outstanding shares of common stock of Dealix and
Autotegrity. Dealix provides new and used car leads to
automotive dealerships, Dealer groups and Manufacturers, and
Autotegrity is a consumer leads acquisition and analytics
business. The Company acquired Dealix/Autotegrity to
further expand its reach and influence in the industry by
increasing its Dealer network.
The
Dealix/Autotegrity Acquisition Date fair value of the consideration
transferred totaled $25.0 million in cash (plus a working capital
adjustment of $11,000). The results of operations of
Dealix/Autotegrity have been included in the Company’s
results of operations since the Dealix/Autotegrity Acquisition
Date.
The
following table summarizes the estimated fair values of the assets
acquired and liabilities assumed as of the Dealix/Autotegrity
Acquisition Date. During the year ended December 31,
2016, the Company made adjustments to the purchase price allocation
due to changes in accounts receivable and sales tax payable
acquired.
|
|
(in thousands)
|
|
Net
identifiable assets acquired:
|
|
|
Total
tangible assets acquired
|
$9,778
|
|
Total
liabilities assumed
|
2,520
|
|
Net
identifiable assets acquired
|
7,258
|
|
|
|
|
Definite-lived
intangible assets acquired
|
7,655
|
|
Indefinite-lived
intangible assets acquired
|
2,200
|
|
Goodwill
|
7,358
|
|
|
$24,471
|
The
fair value of the acquired intangible assets was determined using
the below valuation approaches. In estimating the fair value of the
acquired intangible assets, the Company utilized the valuation
methodology determined to be most appropriate for the individual
intangible asset being valued as described below. The intangible
assets related to the Dealix/Autotegrity acquisition include the
following:
|
|
Valuation Method
|
Estimated
Fair Value
|
Estimated
Useful Life (1)
|
|
|
|
(in thousands)
|
(years)
|
|
|
|
|
|
|
Customer
relationships
|
Excess
of earnings (2)
|
$7,020
|
10
|
|
Trademark/trade
names – Autotegrity
|
Relief
from Royalty (3)
|
120
|
3
|
|
Trademark/trade
names – UsedCars.com
|
Relief
from Royalty (3)
|
2,200
|
Indefinite
|
|
Developed
technology
|
Cost
Approach (4)
|
515
|
3
|
|
Total
purchased intangible assets
|
|
$9,855
|
|
|
(1)
|
Determination of the estimated useful lives of the individual
categories of purchased intangible assets was based on the nature
of the applicable intangible asset and the expected future cash
flows to be derived from such intangible asset. Amortization of
intangible assets with definite lives is recognized over the
shorter of the respective life of the agreement or the period of
time the assets are expected to contribute to future cash
flows.
|
|
|
(2)
|
The excess of earnings method estimates a purchased intangible
asset's value based on the present value of the prospective net
cash flows (or excess earnings) attributable to it. The value
attributed to these intangibles was based on projected net cash
inflows from existing contracts or relationships.
|
|
|
(3)
|
The relief from royalty method is an earnings approach which
assesses the royalty savings an entity realizes since it owns the
asset and isn’t required to pay a third party a license fee
for its use.
|
|
|
(4)
|
The cost approach estimates the cost required to repurchase or
reproduce the intangible assets. The method takes into account
technological and economic obsolescence of the
technology.
|
|
Additionally,
in connection with the acquisition of Dealix/Autotegrity, the
Company entered into non-compete agreements with CDK and a key
executive of Dealix/Autotegrity. The fair value of the
non-compete agreements with CDK and the key executive from
Dealix/Autotegrity was $0.5 million and $40,000,
respectively, and was derived by calculating the difference between
the present value of the Company’s forecasted cash flows with
the agreements in place and without the agreements in
place. The Company amortized the value of the
non-compete agreement with CDK and the key executive from
Dealix/Autotegrity over two and one year(s),
respectively.
Some
of the more significant estimates and assumptions inherent in the
estimate of the fair value of the identifiable purchased intangible
assets include all assumptions associated with forecasting cash
flows and profitability. The primary assumptions used for the
determination of the preliminary fair value of the purchased
intangible assets were generally based upon the discounted present
value of anticipated cash flows. Estimated years of projected
earnings generally follow the range of estimated remaining useful
lives for each intangible asset class.
The
goodwill recognized of $7.3 million was attributable primarily to
expected synergies and the assembled workforce of
Dealix/Autotegrity. The Company incurred approximately
$1.7 million of acquisition-related costs related to the
Dealix/Autotegrity acquisition.
Disposal of Specialty Finance Leads Product
On December 19, 2016, AutoWeb and Car.com, Inc., a
wholly owned subsidiary of AutoWeb (“Car.com”), entered into an Asset Purchase and Sale
Agreement, by and among AutoWeb, Car.com, and Internet Brands,
Inc., a Delaware corporation (“Internet
Brands”), pursuant to
which Internet Brands acquired substantially all of the assets of
the automotive specialty finance leads group of Car.com
(“Acquired
Group”). The transaction
was completed effective as of December 31, 2016. The transaction
consideration consisted of $3.2 million in cash paid at closing and
$1.6 million to be paid over a five-year period pursuant to a
Transitional License and Linking Agreement
(“Specialty Finance
Leads License
Agreement”). The Company
recorded a gain on sale of approximately $2.2 million in connection
with the transaction in December 2016.
In
connection with the transaction, Internet Brands, Car.com and
AutoWeb entered into the Specialty Finance Leads License Agreement
pursuant to which Car.com and AutoWeb will provide to Internet
Brands certain transition services and arrangements. Pursuant to
the Specialty Finance Leads License Agreement, (i) Internet Brands
will pay AutoWeb $1.6 million in fees over the five-year term of
the Specialty Finance Leads License Agreement, and (ii) Car.com (1)
granted Internet Brands a limited, non-exclusive, non-transferable
license to use the Car.com logo and name solely for sales and
marketing purposes in Internet Brand’s automotive specialty
finance leads business; and (2) provided certain redirect linking
of consumer traffic from the Acquired Group’s current
specialty finance leads application forms to a landing page
designated by Internet Brands. The Company received $0.4 million
during the twelve months ended December 31, 2017 related to the
Specialty Finance Leads License Agreement.
The
disposal of the automotive specialty finance leads product did not
qualify for presentation and disclosure as a discontinued operation
because it did not represent a strategic shift that had or will
have a major effect on the Company’s operations.
4.
Investments
Investments. The
Company’s investments at December 31, 2017 and 2016 consist
primarily of investments in SaleMove and GoMoto and are recorded at
cost.
The
following table presents the Company’s investment activity
for 2017 and 2016 (in thousands):
|
|
Note
|
Note
|
|
|
|
receivable-
|
receivable-
|
|
|
Description
|
long-term
|
current
|
Investments
|
|
|
|
|
|
|
Balance
at December 31, 2015
|
$375
|
$—
|
$680
|
|
Purchases,
(sales), issuances and (settlements), net
|
(375)
|
750
|
—
|
|
Balance
at December 31, 2016
|
—
|
750
|
680
|
|
Reserve
for notes receivable
|
—
|
(750)
|
—
|
|
Net
balance at December 31, 2016
|
—
|
—
|
680
|
|
Write-offs
|
—
|
—
|
(580)
|
|
Net
balance at December 31, 2017
|
$—
|
$—
|
$100
|
In
September 2013, the Company entered into a Convertible Note
Purchase Agreement with SaleMove in which AutoWeb invested $150,000
in SaleMove in the form of an interest bearing, convertible
promissory note. In November 2014, the Company invested an
additional $400,000 in SaleMove in the form of an interest bearing,
convertible promissory note. Upon closing of a preferred
stock financing by SaleMove in July 2015, these two notes were
converted in accordance with their terms into an aggregate of
190,997 Series A Preferred Stock, which shares are classified as a
long-term investment on the consolidated balance sheet as of
December 31, 2016. The Company recorded an impairment charge of
$0.6 million in SaleMove in 2017.
In
October 2013, the Company entered into a Reseller Agreement with
SaleMove to become a reseller of SaleMove’s technology for
enhancing communications with
consumers. SaleMove’s technology allows Dealers
and Manufacturers to enhance the online shopping experience by
interacting with consumers in real-time, including live video,
audio and text-based chat or by phone. The Company and SaleMove
equally share in revenues from automotive-related sales of the
SaleMove products and services. In connection with this reseller
arrangement, the Company advanced to SaleMove $1.0
million to fund SaleMove’s 50% share of various product
development, marketing and sales costs and expenses, with the
advanced funds to be recovered by the Company from SaleMove’s
share of sales revenue. SaleMove advances are repaid to
the Company from SaleMove’s share of net revenues from the
Reseller Agreement. As of December 31, 2017, the net
advances due from SaleMove totaled $424,000.
In December 2014, the Company entered
into a Series Seed Preferred Stock Purchase Agreement with GoMoto
in which the Company paid $100,000 for 317,460 shares of Series
Seed Preferred Stock, $0.001 par value per share. The
$100,000 investment in GoMoto was recorded at cost because the
Company does not have significant influence over
GoMoto. In October 2015 and May 2016, the Company
invested an additional $375,000 and $375,000 for each period in
GoMoto in the form of convertible promissory notes
(“GoMoto Notes”). The GoMoto Notes accrued
interest at an annual rate of 4.0% and are due and payable in full
upon demand or at GoMoto’s option ten days’ written
notice unless converted prior to the maturity date. As
of December 31, 2017, the Company has recorded a reserve of $0.8
million related to the GoMoto Notes and related interest receivable
because the GoMoto Notes are past due and the Company believes the
amounts may not be recoverable.
5.
Selected Balance Sheet Accounts
Property and Equipment
Property
and equipment consists of the following:
|
|
As of December 31,
|
|
|
|
2017
|
2016
|
|
|
(in thousands)
|
|
|
Computer
software and hardware
|
$11,065
|
$12,027
|
|
Capitalized
internal use software
|
5,774
|
5,359
|
|
Furniture
and equipment
|
1,703
|
1,332
|
|
Leasehold
improvements
|
1,539
|
1,139
|
|
|
20,081
|
19,857
|
|
Less—Accumulated
depreciation and amortization
|
(15,770)
|
(15,427)
|
|
Property
and Equipment, net
|
$4,311
|
$4,430
|
As
of December 31, 2017 and 2016, capitalized internal use
software, net of amortization, was $2.0 million and $2.7 million,
respectively. Depreciation and amortization expense
related to property and equipment was $1.9 million for the year
ended December 31, 2017. Of this amount, $1.1
million was recorded in cost of revenues and $0.8 million was
recorded in operating expenses for the year ended December 31,
2017. Depreciation and amortization expense related to property and
equipment was $1.6 million for the year ended December 31,
2016. Of this amount, $0.7 million was recorded in cost
of revenues and $0.8 million was recorded in operating expenses for
the year ended December 31, 2016.
Intangible Assets.
The
Company amortizes specifically identified definite-lived intangible
assets using the straight-line method over the estimated useful
lives of the assets.
On
October 5, 2017, the Company and DealerX entered into the DealerX
License Agreement. Pursuant to the terms of the DealerX License
Agreement, AutoWeb was granted a perpetual license to access and
use DealerX’s proprietary platform and technology for
targeted, online marketing.
The transaction consideration consisted of: (i)
$8.0 million in cash paid to DealerX upon execution of the DealerX
License Agreement and (ii) the right to 710,856 shares of the
Company’s common stock, par value $0.001 per share,
representing approximately five percent of the Company’s
outstanding Common Stock as of the date the parties entered into
the DealerX License Agreement (“Market Capitalization
Shares”) if on or before
October 5, 2022: (i) AutoWeb’s market capitalization averages
at least $225.0 million over a consecutive 90 day period or (ii)
there is a change in control of AutoWeb that reflects a market
capitalization of at least $225.0 million. If the Market
Capitalization Shares are issued to DealerX, DealerX’s
Platform Support Obligations will continue in perpetuity.
Alternatively, upon the occurrence of certain events prior to the
issuance of the Market Capitalization Shares, AutoWeb may elect to
make an additional lump-sum payment of $12.5 million
(Alternative
Cash Payment”) in order
to extend DealerX’s Platform Support Obligations in
perpetuity. If the Alternative Cash payment is made,
DealerX’s contingent right to receive the Market
Capitalization Shares will be terminated. The fair value of the
Market Capitalization Shares was calculated at $2.5 million. The
DealerX perpetual license and related Market Capitalization Shares
is being amortized over seven years.
The
Company’s intangible assets will be amortized over the
following estimated useful lives (in thousands):
|
|
|
December
31, 2017
|
December
31, 2016
|
||||
|
Intangible
Asset
|
Estimated
Useful Life
|
Gross
|
Accumulated
Amortization
|
Net
|
Gross
|
Accumulated
Amortization
|
Net
|
|
Trademarks/trade
names/licenses/domains
|
3
– 7 years
|
$16,589
|
$(4,037)
|
$12,552
|
$9,294
|
$(6,756)
|
$2,538
|
|
Software
and publications
|
3
years
|
1,300
|
(1,300)
|
—
|
1,300
|
(1,300)
|
—
|
|
Customer
relationships
|
2 -
10 years
|
19,563
|
(10,555)
|
9,008
|
19,563
|
(7,454)
|
12,109
|
|
Employment/non-compete
agreements
|
1-5
years
|
1,510
|
(1,493)
|
17
|
1,510
|
(1,273)
|
237
|
|
Developed
technology
|
5-7
years
|
8,955
|
(3,619)
|
5,336
|
8,955
|
(2,256)
|
6,699
|
|
|
$47,917
|
$(21,004)
|
$26,913
|
$40,622
|
$(19,039)
|
$21,583
|
|
|
|
|
December
31, 2017
|
December
31, 2016
|
||||
|
Indefinite-lived
Intangible
Asset
|
Estimated
Useful Life
|
Gross
|
Accumulated
Amortization
|
Net
|
Gross
|
Accumulated
Amortization
|
Net
|
|
Domain
|
Indefinite
|
$2,200
|
$—
|
$2,200
|
$2,200
|
$—
|
$2,200
|
Amortization
expense is included in “Cost of Revenues” and
“Depreciation and amortization” in the Statements of
Operations. Amortization expense was $5.7 million, $5.7
million and $3.0 million in 2017, 2016 and 2015, respectively.
Amortization expense for intangible assets for the next five years
is as follows:
|
Year
|
Amortization
Expense
|
|
|
(in thousands)
|
|
|
|
|
2018
|
$6,610
|
|
2019
|
5,236
|
|
2020
|
3,805
|
|
2021
|
3,697
|
|
2022
|
3,100
|
|
Thereafter
|
4,465
|
|
|
$26,913
|
Goodwill.
Goodwill
represents the excess of the purchase price over the fair value of
net assets acquired. Goodwill is not amortized and is
assessed annually for impairment or whenever events or
circumstances indicate that the carrying value of such assets may
not be recoverable. The Company did not record any
impairment related to goodwill as of December 31, 2016. The Company
impaired goodwill by $37.7 million as of December 31,
2017. As of December 31, 2017 and 2016, goodwill
consisted of the following:
|
|
(in thousands)
|
|
Goodwill
as of December 31, 2015
|
$42,903
|
|
Purchase
price allocation adjustments from Dealix/Autotegrity
acquisition
|
(82)
|
|
Goodwill
as December 31, 2016
|
42,821
|
|
Impairment
charge
|
(37,688)
|
|
Goodwill
as of December 31, 2017
|
$5,133
|
During the year ended December
31, 2016, the Company made adjustments to the Dealix/Autotegrity
purchase price allocation due to changes in accounts receivable and
sales tax payable acquired, and adjusted goodwill
accordingly.
Accrued Expenses and Other Current Liabilities
As
of December 31, 2017 and 2016, accrued expenses and other
current liabilities consisted of the following:
|
|
As of December 31,
|
|
|
|
2017
|
2016
|
|
|
(in thousands)
|
|
|
Accrued
employee-related benefits
|
$2,411
|
$4,530
|
|
Other
accrued expenses and other current liabilities:
|
|
|
|
Other
accrued expenses
|
6,307
|
7,278
|
|
Amounts
due to customers
|
438
|
466
|
|
Other
current liabilities
|
507
|
571
|
|
Total
other accrued expenses and other current liabilities
|
7,252
|
8,315
|
|
|
|
|
|
Total
accrued expenses and other current liabilities
|
$9,663
|
$12,845
|
Convertible Notes
Payable.
In
connection with the acquisition of Cyber, the Company issued the
Cyber Note to the sellers. The fair value of the Cyber
Note as of the Cyber Acquisition Date was $5.9
million. This valuation was estimated using a binomial
option pricing method. Key assumptions used by the
Company's outside valuation consultants in valuing the Cyber Note
included a market yield of 15.0% and stock price volatility of
77.5%. As the Cyber Note was issued with a substantial
premium, the Company recorded the premium as additional paid-in
capital. Interest is payable at an annual interest rate
of 6% in quarterly installments. The Cyber Note was
acquired by Auto Holdings and was converted into 1,075,268 shares
of Company common stock on April 27, 2015, as discussed in Note
1. Upon conversion of the Cyber Note, the Company
removed the liability from the Consolidated Balance
Sheet.
In connection with the acquisition of AutoUSA, LLC
(“AutoUSA”) on January 13, 2014, the Company issued a
convertible subordinated promissory note for $1.0 million
(“AutoUSA Note”)
to AutoNationDirect.com, Inc. The fair value of the AutoUSA
Note as of the AutoUSA Acquisition Date was $1.3 million.
This valuation was estimated using a binomial option pricing
method. Key assumptions used by the Company’s
outside valuation consultants in valuing the AutoUSA Note
included a market yield of 1.6% and stock price volatility of
65.0%. As the AutoUSA Note was issued with a substantial
premium, the Company recorded the premium as additional paid-in
capital. Interest is payable at an annual interest rate of 6%
in quarterly installments. The entire outstanding balance of
the AutoUSA Note is to be paid in full on January 31, 2019.
The holder of the AutoUSA Note may at any time convert all or any
part, but at least 30,600 shares, of the then outstanding and
unpaid principal of the AutoUSA Note into fully paid shares of the
Company's common stock at a conversion price of $16.34 per share
(as adjusted for stock splits, stock dividends, combinations and
other similar events). In the event of default, the
entire unpaid balance of the AutoUSA Note will become immediately
due and payable and will bear interest at the lower of 8% per year
and the highest legal rate permissible under applicable
law.
6.
Credit Facility
The Company and MUFG Union Bank, N.A.
(“Union Bank”), have entered into a Loan Agreement dated
February 26, 2013, as amended on September 10, 2013, January 13,
2014, May 20, 2015, June 1, 2016, June 28, 2017 and December 27,
2017 (the original Loan Agreement, as amended to date, is referred
to collectively as the “Credit Facility
Agreement”). Until December 31, 2017, the
Credit Facility Agreement provided for (i) a $9.0 million term loan
(“Term
Loan 1”); (ii) a $15.0
million term loan (“Term Loan 2”); and (iii) an $8.0 million working
capital revolving line of credit (“Revolving
Loan”). Term Loan 1
and Term Loan 2 were fully paid as of December 31, 2017. The
outstanding balance of the Revolving Loan as of December 31, 2017
was $8.0 million.
Borrowings
under the Revolving Loan bear interest at either (i) the LIBOR plus
2.50% or (ii) the bank’s Reference Rate (prime rate) minus
0.50%, at the option of the Company. Interest under the Revolving
Loan adjusts (i) at the end of each LIBOR rate period (1, 2, 3, 6
or 12 months terms) selected by the Company, if the LIBOR rate is
selected; or (ii) with changes in Union Bank’s Reference
Rate, if the Reference Rate is selected. The Company pays a
commitment fee of 0.10% per year on the unused portion of the
Revolving Loan, payable quarterly in arrears. Borrowings under the
Revolving Loan are secured by a first priority security interest on
all of the Company’s personal property (including, but not
limited to, accounts receivable) and proceeds thereof. The maturity
date of the Revolving Loan was extended from March 31, 2017 to
April 30, 2018. Borrowings under the Revolving Loan may be used as
a source to finance working capital, capital expenditures,
acquisitions and stock buybacks and for other general corporate
purposes.
Term Loan 1 was amortized over a period of four
years, with fixed quarterly principal payments of $562,500.
Borrowings under Term Loan 1 bore interest at either (i) the
bank’s Reference Rate (prime rate) minus 0.50% or (ii) the
London Interbank Offering Rate (“LIBOR”) plus 2.50%, at the option of the Company.
Interest under Term Loan 1 adjusted (i) at the end of each LIBOR
rate period (1, 2, 3, 6 or 12 months terms) selected by the
Company, if the LIBOR rate was selected; or (ii) with changes in
Union Bank’s Reference Rate, if the Reference Rate was
selected. Borrowings under Term Loan 1 were secured by a
first priority security interest on all of the Company’s
personal property (including, but not limited to, accounts
receivable) and proceeds thereof. Borrowing under Term Loan 1 was
limited to use for the acquisition of AutoUSA, and the Company drew
down the entire $9.0 million of Term Loan 1, together with $1.0
million under the Revolving Loan, in financing this
acquisition.
Term
Loan 2 was amortized over a period of five years, with fixed
quarterly principal payments of $750,000. Borrowings under Term
Loan 2 bore interest at either (i) LIBOR plus 3.00% or (ii) the
bank’s Reference Rate (prime rate), at the option of the
Company. Interest under Term Loan 2 adjusted (i) at the end of each
LIBOR rate period (1, 2, 3, 6 or 12 months terms) selected by the
Company, if the LIBOR rate was selected; or (ii) with changes in
Union Bank’s Reference Rate, if the Reference Rate was
selected. The Company paid an upfront fee of 0.10% of the Term Loan
2 principal amount upon drawing upon Term Loan 2. Borrowings under
Term Loan 2 were secured by a first priority security interest on
all of the Company’s personal property (including, but not
limited to, accounts receivable) and proceeds thereof. Borrowing
under Term Loan 2 was limited to use for the acquisition of
Dealix/Autotegrity, and the Company drew down the entire $15.0
million of Term Loan 2, together with $2.75 million under the
Revolving Loan and $6.76 million from available cash on hand, in
financing this acquisition.
The
Credit Facility Agreement contains certain customary affirmative
and negative covenants and restrictive and financial covenants,
which the Company was in compliance with as of December 31,
2017.
7.
Commitments and Contingencies
Operating Leases
The
Company leases its facilities and certain office equipment under
operating leases which expire on various dates through
2024. The Company’s future minimum lease payments
on leases with non-cancelable terms in excess of one year were as
follows (in thousands):
|
Years Ending December 31,
|
|
|
2018
|
$1,526
|
|
2019
|
1,385
|
|
2020
|
964
|
|
2021
|
461
|
|
2022
|
459
|
|
Thereafter
|
672
|
|
|
$5,467
|
Rent
expense included in operating expenses was $2.0 million, $2.0
million and $1.2 million for the years ended December 31,
2017, 2016 and 2015, respectively.
Employment Agreements
The
Company has employment agreements and retention agreements with
certain key employees. A number of these agreements require
severance payments, continuation of certain insurance benefits and
acceleration of vesting of stock options in the event of a
termination of employment without cause or for good
reason.
Litigation
From
time to time, the Company may be involved in litigation matters
arising from the normal course of its business
activities. Such litigation, even if not meritorious,
could result in substantial costs and diversion of resources and
management attention, and an adverse outcome in litigation could
materially adversely affect its business, results of operations,
financial condition and cash flows.
8.
Retirement Savings Plan
The Company has a retirement savings plan which
qualifies as a deferred salary arrangement under
Section 401(k) of the Internal Revenue Code of 1986, as
amended (“IRC”) (the “401(k) Plan”). The 401(k) Plan covers all
employees of the Company who are over 21 years of age and is
effective on the first day of the month following date of hire.
Under the 401(k) Plan, participating employees are allowed to defer
up to 100% of their pretax salaries not to exceed the maximum IRC
deferral amount. The Company contributions to the 401(k) Plan are
discretionary. The Company contribution in the years ended December
31, 2017, 2016 and 2015 was $0.3 million, $0.4 million and $0.4
million, respectively.
9.
Stockholders’ Equity
Stock-Based Incentive Plans
The Company has established several plans that
provide for stock-based awards (“Awards”) primarily in the form of stock options
and restricted stock awards (“RSAs”). Certain of these plans provide for
awards to employees, the Company’s Board of Directors and
independent consultants. The Awards were granted under the 1998
Stock Option Plan, the 1999 Employee and Acquisition Related Stock
Option Plan, the 2000 Stock Option Plan, the Amended and Restated
2001 Restricted Stock and Option Plan, the 2004 Restricted Stock
and Option Plan, the 2006 Inducement Stock Option Plan, 2010 Equity
Incentive Plan and the Amended and Restated 2014 Equity Incentive
Plan. As of June 19, 2014, awards may only be granted
under the Amended and Restated 2014 Equity Incentive
Plan. An aggregate of 0.6 million shares of Company
common stock are reserved for future issuance under the Amended and
Restated 2014 Equity Incentive Plan at December 31,
2017.
Share-based
compensation expense is included in costs and expenses in the
Consolidated Statements of Operations and Comprehensive
Income(Loss) as follows:
|
|
Years Ended December 31,
|
||
|
|
2017
|
2016
|
2015
|
|
|
(in thousands)
|
||
|
Share-based
compensation expense:
|
|
|
|
|
Cost
of revenues
|
$78
|
$67
|
$150
|
|
Sales
and marketing
|
1,703
|
1,777
|
713
|
|
Technology
support
|
586
|
601
|
518
|
|
General
and administrative
|
1,739
|
1,982
|
1,185
|
|
Share-based
compensation expense
|
4,106
|
4,427
|
2,566
|
|
|
|
|
|
|
Amount
capitalized to internal use software
|
3
|
15
|
9
|
|
|
|
|
|
|
Total
share-based compensation expense
|
$4,103
|
$4,412
|
$2,557
|
As
of December 31, 2017, December 31, 2016 and December 31, 2015,
there was approximately $3.9 million, $4.9 million and $2.9
million, respectively, of unrecognized compensation expense related
to unvested stock options. This expense is expected to be
recognized over a weighted average period of approximately 3.9
years.
Stock Options
The
fair value of stock options is estimated on the grant date using
the Black-Scholes option pricing model based on the underlying
common stock closing price as of the date of grant, the expected
term, stock price volatility and risk-free interest rates. The
expected risk-free interest rate is based on United States treasury
yield for a term consistent with the expected life of the stock
option in effect at the time of grant. Expected volatility is based
on the Company’s historical experience for a period equal to
the expected life. The Company has used historical volatility
because it has limited or no options traded on its common stock to
support the use of an implied volatility or a combination of both
historical and implied volatility. The Company estimates the
expected life of options granted based on historical experience,
which it believes is representative of future
behavior. The dividend yield is not considered in the
option-pricing formula since the Company has not paid dividends in
the past and has no current plans to do so in the future. The
Company elected to estimate a forfeiture rate and is based on
historical experience and is adjusted based on actual
experience.
The
Company grants its options at exercise prices that are not less
than the fair market value of the Company’s common stock on
the date of grant. Stock options generally have a seven or ten year
maximum contractual term and generally vest one-third on the first
anniversary of the grant date and ratably over twenty-four months,
thereafter. The vesting of certain stock options is accelerated
under certain conditions, including upon a change in control of the
Company, termination without cause of an employee and voluntary
termination by an employee with good reason.
Awards
granted under the Company’s stock option plans were estimated
to have a weighted average grant date fair value per share of
$6.23, $7.04 and $5.73 for the years ended December 31, 2017,
2016 and 2015, respectively, based on the Black-Scholes
option-pricing model on the date of grant using the following
weighted average assumptions:
|
|
Years Ended December 31,
|
||
|
|
2017
|
2016
|
2015
|
|
Expected
volatility
|
62%
|
58%
|
56%
|
|
Expected
risk-free interest rate
|
1.8%
|
1.2%
|
1.3%
|
|
Expected
life (years)
|
4.4
|
4.4
|
4.4
|
A
summary of the Company’s outstanding stock options as of
December 31, 2017, and changes during the year then ended is
presented below:
|
|
Number of
Options
|
Weighted
Average
Exercise Price
per Share
|
Weighted
Average
Remaining
Contractual
Term
|
Aggregate
Intrinsic
Value
|
|
|
|
|
(years)
|
(thousands)
|
|
Outstanding
at December 31, 2016
|
2,742,531
|
$11.15
|
4.3
|
|
|
Granted
|
466,600
|
12.41
|
|
|
|
Exercised
|
(248,344)
|
5.46
|
|
|
|
Forfeited
or expired
|
(215,503)
|
15.93
|
|
|
|
Outstanding
at December 31, 2017
|
2,745,284
|
$11.50
|
3.9
|
$4,089
|
|
Vested
and expected to vest at December 31, 2017
|
2,677,867
|
$11.45
|
3.9
|
$4,066
|
|
Exercisable
at December 31, 2017
|
1,909,298
|
$10.32
|
3.1
|
$3,920
|
Service-Based
Options. During the
years ended December 31, 2017, 2016 and 2015, the Company granted
466,600, 833,900 and 606,750 service-based stock options, which had
weighted average grant date fair values of $6.23, $7.71 and $5.73,
respectively.
Stock option
exercises. During 2017, 248,344
options were exercised, with an aggregate weighted average exercise
price of $5.46. During 2016, 386,001 options were exercised, with
an aggregate weighted average exercise price of $7.91. During 2015,
145,979 options were exercised, with an aggregate weighted average
exercise price of $8.19. The total intrinsic
value of options exercised during 2017, 2016 and 2015 was $1.6
million, $3.2 million and $1.9 million,
respectively.
Market Condition
Options. On January 21, 2016,
the Company granted 100,000 stock options to its chief executive
officer with an exercise price of $17.09 and grant date fair value
of $1.47 per option, using a Monte Carlo simulation model
(“CEO
Market Condition Options”). The CEO Market Condition
Options were previously valued at $2.94 per option but were
revalued when the requisite stockholder approval for the
Company’s Amended and Restated 2014 Equity Incentive Plan was
obtained in June 2016. The CEO Market Condition Options are subject
to both stock price-based and service-based vesting requirements
that must be satisfied for the CEO Market Condition Options to vest
and become exercisable. The CEO Market Condition Options provide
that the stock price-based vesting condition will be met (i) with
respect to the first one-third (1/3) of the CEO Market Condition
Options, if at any time after the grant date and prior to the
expiration date of the CEO Market Condition Options the weighted
average closing price of the Company’s common stock on The
Nasdaq Capital Market for the preceding thirty (30) trading days
(adjusted for any stock splits, stock dividends, reverse stock
splits or combinations occurring after the issuance date)
(“Weighted Average Closing
Price”) is at or above
$30.00; (ii) with respect to the second one-third (1/3) of the CEO
Market Condition Options, if at any time after the grant date and
prior to the expiration date the Weighted Average Closing Price is
at or above $37.50; and (iii) with respect to the last one-third
(1/3) of the CEO Market Condition Options, if at any time after the
grant date and prior to the expiration date the Weighted Average
Closing Price is at or above $45.00. With respect to any of the CEO
Market Condition Options for which the stock price-based
requirements are met, these options are also subject to the
following service-based vesting schedule: (i) thirty-three and
one-third percent (33 1/3%) of these options will vest and become
exercisable on January 21, 2017 and (ii) one thirty-sixth (1/36th)
of these options will vest and become exercisable on each
successive monthly anniversary thereafter for the following
twenty-four months ending on January 21, 2019. None of the
stock-price based vesting requirements have been met as of December
31, 2017. The CEO Market Condition Options expire on January 21,
2023.
Restricted Stock
Awards. The Company
granted an aggregate of 125,000 RSAs on April 23, 2015 in
connection with the promotion of one of its executive
officers. Of the 125,000 RSAs, 25,000 were service-based
(“Service-Based RSA
Award”) and the
forfeiture restrictions lapse with respect to one-third of the
restricted stock on each of the first, second and third
anniversaries of the date of the award. The
Service-Based RSA Award had a fair market value of $15.37 per
share. This executive officer was also awarded
100,000 shares of the Company’s common stock in the form of
performance-based restricted stock (“Performance-Based RSA
Award”). The
Performance-Based RSA Award had a fair market value of $5.23 per
share. The shares are subject to forfeiture upon the
earlier of (such earliest date being referred to as the
“Termination
Date”) (i) a termination
of the executive officer’s employment with the Company; (ii)
March 31, 2018; and (iii) other events of forfeiture set forth in
the award agreement, subject to the following: (i) the forfeiture
restrictions with respect to 50,000 of the restricted shares will
lapse if any time prior to the Termination Date the weighted
average closing price of the Company’s common stock for the
preceding 30 trading days is at or above $30.00 per share, and (ii)
the forfeiture restrictions with respect to any of the restricted
shares that remain subject to forfeiture restrictions will lapse if
any time prior to the Termination Date the weighted average closing
price of the Company’s common stock for the preceding 30
trading days is at or above $45.00 per share. None of
the forfeiture restrictions had lapsed on the Performance-Based RSA
Awards during 2017.
The
Company granted an aggregate of 345,000 RSAs on September 27, 2017
to executive officers of the Company. The RSAs are
service-based and the forfeiture restrictions lapse with respect to
one-third of the restricted stock on each of the first, second and
third anniversaries of the date of the award. Lapsing of
the forfeiture restrictions may be accelerated in the event of a
change in control of the Company and will accelerate upon the death
or disability of the holder of the RSAs.
Tax Benefit Preservation Plan
The Company’s Tax Benefit Preservation Plan
dated as of May 26, 2010 between AutoWeb and Computershare Trust
Company, N.A., as rights agent, as amended by Amendment No. 1 to
Tax Benefit Preservation Plan dated as of April 14, 2014
(collectively, the “Tax Benefit Preservation
Plan”) was adopted by the
Company’s Board of Directors to protect stockholder value by
preserving the Company’s net operating loss carryovers and
other tax attributes that the Tax Benefit Preservation Plan is
intended to preserve (“Tax Benefits”). Under the Tax Benefit
Preservation Plan, rights to purchase capital stock of the Company
(“Rights”) have been distributed as a dividend at
the rate of five Rights for each share of common
stock. Each Right entitles its holder, upon triggering
of the Rights, to purchase one one-hundredth of a share of Series A
Junior Participating Preferred Stock of the Company at a price of
$75.00 (as such price may be adjusted under the Tax Benefit
Preservation Plan) or, in certain circumstances, to instead acquire
shares of common stock. The Rights will convert into a right to
acquire common stock or other capital stock of the Company in
certain circumstances and subject to certain
exceptions. The Rights will be triggered upon the
acquisition of 4.9% or more of the Company’s outstanding
common stock or future acquisitions by any existing holder of 4.9%
or more of the Company’s outstanding common stock. If a
person or group acquires 4.9% or more of the Company’s common
stock, all rights holders, except the acquirer, will be entitled to
acquire, at the then exercise price of a Right, that number of
shares of the Company common stock which, at the time, has a market
value of two times the exercise price of the Right. The Rights will
expire upon the earliest of: (i) the close of business on May
26, 2017 unless that date is advanced or extended, (ii) the
time at which the Rights are redeemed or exchanged under the Tax
Benefit Preservation Plan, (iii) the repeal of
Section 382 or any successor statute if the Board determines
that the Tax Benefit Preservation Plan is no longer necessary for
the preservation of the Company’s Tax Benefits, (iv) the
beginning of a taxable year of the Company to which the Board
determines that no Tax Benefits may be carried forward, or (v) such
time as the Board determines that a limitation on the use of the
Tax Benefits under Section 382 would no longer be material to the
Company. The Tax Benefit Preservation Plan was reapproved by the
Company’s stockholders at the Company’s 2014 Annual
Meeting of Stockholders.
Series B Preferred Stock
On
the AWI Merger Date, the Company issued the Series B Preferred
Stock. The shares of Series B Preferred Stock were
convertible, subject to certain limitations, into 10 shares of
Common Stock (with such conversion ratio subject to adjustment as
set forth in the certificate of designations for the Series B
Preferred Stock). On June 22, 2017, the Company obtained
stockholder approval for conversion of the then outstanding Series
B Preferred Stock. Upon obtaining stockholder approval for the
conversion, each share of Series B Preferred Stock outstanding was
automatically converted into 10 shares of the Company’s
common stock, which resulted in the outstanding shares of Series B
Preferred Stock being converted into 1,680,070 shares of the
Company’s common stock.
Warrant
On September 17, 2010 (“Cyber Acquisition
Date”), the Company
acquired substantially all of the assets of
Cyber. In connection with the acquisition of
Cyber, the Company issued to the sellers the Cyber Warrant. The
Cyber Warrant was valued at $3.15 per share on the Cyber
Acquisition Date using an option pricing model with the following
key assumptions: risk-free rate of 2.3%, stock price volatility of
77.5% and a term of 8.04 years. The Cyber Warrant was
valued based on historical stock price volatilities of the Company
and comparable public companies as of the Cyber Acquisition
Date. The exercise price of the Cyber Warrant was $4.65
per share (as adjusted for stock splits, stock dividends,
combinations and other similar events). The Cyber
Warrant was acquired by Auto Holdings and exercised on April 27,
2015, as discussed in Note 1. Based upon the terms of
exercise of the Cyber Warrant, the Company issued 400,000 shares of
Company Common stock and received approximately $1.9 million in
cash.
The warrant to purchase 69,930 shares of the
Company’s common stock issued in connection with the
acquisition of AutoUSA was valued at $7.35 per share for a total
value of $0.5 million (“AutoUSA
Warrant”). The
Company used an option pricing model to determine the value of the
AutoUSA Warrant. Key assumptions used in valuing the
AutoUSA Warrant are as follows: risk-free rate of 1.6%, stock price
volatility of 65.0% and a term of 5.0 years. The AutoUSA
Warrant was valued based on long-term stock price volatilities of
the Company. The exercise price of the AutoUSA Warrant
is $14.30 per share (as may be adjusted for stock splits, stock
dividends, combinations and other similar events). The
AutoUSA Warrant became exercisable on January 13, 2017 and expires
on January 13, 2019.
The warrant to purchase up to 148,240 shares of
Series B Preferred Stock issued in connection with the acquisition
of AWI (“AWI Warrant”) was valued at $1.72 per share for a total
value of $2.5 million. The Company used an option
pricing model to determine the value of the AWI
Warrant. Key assumptions used in valuing the AWI Warrant
are as follows: risk-free rate of 1.9%, stock price volatility of
74.0% and a term of 7.0 years. The AWI Warrant was
valued based on long-term stock price volatilities of the
Company’s common stock. On June 22, 2017, the
Company received stockholder approval which resulted in the
automatic conversion of the AWI Warrant into warrants to acquire up
to 1,482,400 shares of the Company’s common stock at an
exercise price of $18.45 per share of common stock. The AWI Warrant
becomes exercisable on October 1, 2018, subject to the following
vesting conditions: (i) with respect to the first one-third (1/3)
of the warrant shares, if at any time after the issuance date of
the AWI Warrant and prior to the expiration date of the AWI Warrant
the Weighted Average Closing Price of the Company’s common
stock is at or above $30.00; (ii) with respect to the second
one-third (1/3) of the warrant shares, if at any time after the
issuance date of the AWI Warrant and prior to the expiration date
the Weighted Average Closing Price is at or above $37.50; and (iii)
with respect to the last one-third (1/3) of the warrant shares, if
at any time after the issuance date of the AWI Warrant and prior to
the expiration date the Weighted Average Closing Price is at or
above $45.00. The AWI Warrant expires on October 1,
2022.
Stock
Repurchase
On June 7, 2012, the Company announced that its
board of directors had authorized the Company to repurchase up to
$2.0 million of the Company’s common stock, and on September
17, 2014, the Company announced that its board of
directors had approved the repurchase of up to an additional $1.0
million of the Company’s common stock. On
September 6, 2017, the Company announced that its board of
directors authorized the Company to repurchase an additional $3.0
million of the Company’s common stock. Under these
repurchase programs, the Company may repurchase common stock from
time to time on the open market or in private transactions. These
authorizations do not require us to purchase a specific number of
shares, and the board of directors may suspend, modify or terminate
the programs at any time. The Company will fund future repurchases
through the use of available cash. During 2017, the Company
repurchased 226,698 shares for an aggregate price of $1.9 million.
The average price paid for all shares repurchased during 2017 was
$8.37. The shares repurchased during 2017 were cancelled and
returned to authorized and unissued shares. No shares were
repurchased in 2016.
Shares Reserved for Future Issuance
The
Company had the following shares of common stock reserved for
future issuance upon the exercise or issuance of equity instruments
as of December 31, 2017:
|
|
Number
of Shares
|
|
Stock
options outstanding
|
2,745,284
|
|
Authorized
for future grants under stock-based incentive plans
|
603,758
|
|
Reserved
for exercise of warrants
|
1,552,330
|
|
Reserved
for conversion of AUSA Note
|
61,200
|
|
Total
|
4,962,572
|
11.
Income Taxes
The
components of income (loss) before income tax provision are as
follows for the years ended December 31:
|
|
2017
|
2016
|
2015
|
|
|
(in
thousands)
|
||
|
|
|
|
|
|
United
States
|
$(40,090)
|
$6,448
|
$8,079
|
|
International
|
565
|
238
|
—
|
|
Total
income (loss) before income tax provision
|
$(39,525)
|
$6,686
|
$8,079
|
Income
tax expense from continuing operations consists of the following
for the years ended December 31:
|
|
2017
|
2016
|
2015
|
|
|
(in
thousands)
|
||
|
Current:
|
|
|
|
|
Federal
|
$—
|
$244
|
$212
|
|
State
|
36
|
508
|
226
|
|
Foreign
|
139
|
69
|
—
|
|
|
175
|
821
|
438
|
|
Deferred:
|
|
|
|
|
Federal
|
(2,916)
|
1,726
|
2,997
|
|
State
|
(175)
|
1,040
|
586
|
|
Foreign
|
—
|
—
|
—
|
|
|
(3,091)
|
2,766
|
3,583
|
|
|
|
|
|
|
Change
in federal tax rate
|
11,693
|
—
|
—
|
|
|
|
|
|
|
Valuation
allowance
|
16,662
|
(772)
|
(588)
|
|
|
|
|
|
|
Total
income tax expense
|
$25,439
|
$2,815
|
$3,433
|
The
reconciliations of the U.S. federal statutory rate to the effective
income tax rate for the years ended December 31, 2017, 2016
and 2015 are as follows:
|
|
2017
|
2016
|
2015
|
|
Tax
provision at U.S. federal statutory rates
|
34.0%
|
34.0%
|
34.0%
|
|
State
income taxes net of federal benefit
|
2.7
|
3.1
|
2.3
|
|
Deferred
tax asset adjustments – NOL related
|
(12.1)
|
16.1
|
6.8
|
|
Non-deductible
permanent items
|
(0.1)
|
—
|
0.7
|
|
Stock
options
|
(0.1)
|
—
|
—
|
|
Acquisition
costs
|
—
|
—
|
7.0
|
|
Goodwill
impairment
|
(17.5)
|
—
|
—
|
|
Other
|
0.3
|
0.4
|
(1.0)
|
|
Transition
tax adjustment
|
0.2
|
—
|
—
|
|
Change
in rate
|
(29.6)
|
—
|
—
|
|
Change
in valuation allowance
|
(42.2)
|
(11.5)
|
(7.3)
|
|
Effective
income tax rate
|
(64.4%)
|
42.1%
|
42.5%
|
Deferred
income taxes reflect the net tax effect of temporary differences
between the carrying amounts of assets and liabilities for
financial reporting purposes and the amounts used for income tax
purposes. Significant components of the Company’s deferred
taxes as of December 31, 2017 and 2016 are as
follows:
|
|
2017
|
2016
|
|
|
(in thousands)
|
|
|
Deferred
tax assets:
|
|
|
|
Allowance
for doubtful accounts
|
$225
|
$381
|
|
Accrued
liabilities
|
574
|
1,596
|
|
Net
operating loss carry-forwards
|
17,286
|
25,563
|
|
Intangible
assets
|
161
|
—
|
|
Share-based
compensation expense
|
2,727
|
3,225
|
|
Other
|
1,062
|
1,191
|
|
Total
gross deferred tax assets
|
22,035
|
31,956
|
|
Valuation
allowance
|
(21,318)
|
(4,656)
|
|
|
717
|
27,300
|
|
|
|
|
|
Deferred
tax liabilities:
|
|
|
|
Fixed
assets
|
(25)
|
(114)
|
|
Intangible
assets
|
—
|
(7,698)
|
|
Unremitted
foreign earnings
|
—
|
(20)
|
|
Total
gross deferred tax liabilities
|
(25)
|
(7,832)
|
|
Net
deferred tax assets
|
$692
|
$19,468
|
On
December 22, 2017, the U.S. government enacted comprehensive tax
legislation known as the TCJA. The TCJA establishes new tax laws
that will take effect in 2018, including, but not limited to (1)
reduction of the U.S. federal corporate tax rate from a maximum of
35% to 21%; (2) elimination of the corporate AMT; (3) a new
limitation on deductible interest expense; (4) the Transition Tax;
(5) limitations on the deductibility of certain executive
compensation; (6) changes to the bonus depreciation rules for fixed
asset additions: and (7) limitations on NOLs generated after
December 31, 2017, to 80% of taxable income.
ASC 740, Income Taxes, requires the effects of
changes in tax laws to be recognized in the period in which the
legislation is enacted. However, due to the complexity and
significance of the TCJA's provisions, the SEC staff issued Staff
Accounting Bulletin 118 (“SAB 118”), which provides guidance on accounting
for the tax effects of the TCJA. SAB 118 provides a measurement
period that should not extend beyond one year from the TCJA
enactment date for companies to complete the accounting under ASC
740. In accordance with SAB 118, a company must reflect the income
tax effects of those aspects of the TCJA for which the accounting
under ASC 740 is complete. To the extent that a company’s
accounting for certain income tax effects of the TCJA is incomplete
but it is able to determine a reasonable estimate, it must record a
provisional estimate in the financial statements. If a company
cannot determine a provisional estimate to be included in the
financial statements, it should continue to apply ASC 740 on the
basis of the provisions of the tax laws that were in effect
immediately before the enactment of the TCJA.
At
December 31, 2017, the Company has not completed its accounting for
the tax effects of enactment of the TCJA; however, the Company has
made a reasonable estimate of the effects of the TCJA’s
change in the federal rate and revalued its deferred tax assets
based on the rates at which they are expected to reverse in the
future, which is generally the new 21% federal corporate tax rate
plus applicable state tax rate. The Company recorded a
decrease in deferred tax assets and deferred tax liabilities of
$11.7 million and $0.0 million, respectively, with a corresponding
net adjustment to deferred income tax expense of $11.7 million for
the year ended December 31, 2017. In addition, the Company
recognized a deemed repatriation of $0.6 million of deferred
foreign income from its Guatemala subsidiary, which did not result
in any incremental tax cost after application of foreign tax
credits. The Company’s provisional estimates will be
adjusted during the measurement period defined under SAB 118, based
upon ongoing analysis of data and tax positions along with the new
guidance from regulators and interpretations of the
law.
The
Company adopted the provisions of ASU 2016-09 as of January 1,
2017, which requires recognition through opening retained earnings
of any pre-adoption date NOL carryforwards from nonqualified stock
options and other employee share-based payments (e.g., restricted
shares and share appreciation rights), as well as recognition of
all income tax effects from share-based payments arising on or
after January 1, 2017 in income tax expense. As a result, the
Company has recognized $18.4 million of pre-adoption date NOL
carryforwards with remaining carryforward periods of at least seven
years. The Company recognized excess tax benefits of $6.5 million
as an increase to deferred tax assets and a cumulative-effect
adjustment to retained earnings of $6.5 million. Based on the
weight of available evidence, the Company believes that it is more
likely than not that these NOLs will not be realized and has placed
a valuation allowance against the deferred tax asset.
During
2017, management assessed the available positive and negative
evidence to estimate if sufficient future taxable income will be
generated to utilize the existing deferred tax assets. A
significant piece of objective negative evidence evaluated was the
cumulative losses incurred over the three-year period ended
December 31, 2017. The Company was projecting pre-tax income for
2017 until the three months ended December 31, 2017, in which the
Company incurred a significant pre-tax loss due to goodwill
impairment. The Company experienced increased costs in servicing
its customers and started to see a decrease in market share as a
result of more competition. The Company also projects that 2018
pre-tax profits may not offset the cumulative three-year pre-tax
loss as of December 31, 2017. Based on this evaluation, the Company
recorded an additional valuation allowance of $16.7 million against
its deferred tax assets during the year. At December 31, 2017, the
Company has recorded a valuation allowance of $21.3 million against
its deferred tax assets.
At December 31, 2017, the Company had federal
and state NOLs of approximately
$74.0 million and $26.2 million, respectively. The
federal NOLs expire through 2035 as follows (in
millions):
|
2025
|
$4.1
|
|
2026
|
25.5
|
|
2027
|
15.5
|
|
2028
|
5.2
|
|
2029
|
7.7
|
|
2030
|
10.6
|
|
2031
|
1.3
|
|
2032
|
—
|
|
2033
|
0.1
|
|
2034
|
2.5
|
|
2035
|
1.5
|
|
|
$74.0
|
The
state NOLs expire through 2035 as follows (in
millions):
|
2028
|
$2.7
|
|
2029
|
5.8
|
|
2030
|
11.0
|
|
2034
|
1.5
|
|
2035
|
0.8
|
|
California
NOLs
|
21.8
|
|
Other
State NOLs
|
4.4
|
|
Total
State NOLs
|
$26.2
|
Utilization
of the net operating loss and tax credit carry-forwards may be
subject to a substantial annual limitation due to ownership change
limitations that may have occurred or that could occur in the
future, as required by Section 382 of the IRC, as well as similar
state provisions. These ownership changes may limit the amount of
NOLs and research and development credit carry-forwards that can be
utilized annually to offset future taxable income and tax,
respectively. A Section 382 ownership change occurred in
2006 and any changes have been reflected in the NOLs presented
above as of December 31, 2017. As a result of an
acquisition in 2001, approximately $9.9 million of the NOLs are
subject to an annual limitation of approximately $0.5 million per
year.
The
federal and state NOLs begin to expire in 2025 and 2028,
respectively. Approximately $10.8 million and $5.0 million,
respectively, of the federal and state NOLs were incurred by
subsidiaries prior to the date of the Company’s acquisition
of such subsidiaries. The Company established a valuation allowance
of $4.1 million at the date of acquisitions related to these
subsidiaries. The tax benefits associated with the realization of
such NOLs was credited to the provision for income
taxes.
At
December 31, 2017, the Company has federal and state research and
development tax credit carry-forwards of $0.3 million and $0.2
million, respectively. The federal credits begin to
expire in 2021. The state credits do not
expire.
As
of December 31, 2017 and 2016, the Company had unrecognized tax
benefits of approximately $0.5 million and $0.5 million,
respectively, all of which, if subsequently recognized, would have
affected the Company’s tax rate. A reconciliation
of the beginning and ending amount of unrecognized tax benefits is
as follows:
|
|
2017
|
2016
|
|
|
(in thousands)
|
|
|
Balance
at January 1,
|
$464
|
$527
|
|
Reductions
based on tax positions related to prior years and
settlements
|
—
|
(63)
|
|
Balance
at December 31,
|
$464
|
$464
|
The
Company is subject to taxation in the United States and various
foreign and state jurisdictions. In general, the Company is no
longer subject to U.S. federal and state income tax examinations
for years prior to 2013 (except for the use of tax losses generated
prior to 2013 that may be used to offset taxable income in
subsequent years). The Company does not anticipate a significant
change to the total amount of unrecognized tax benefits within the
next twelve months.
The
Company’s policy is to recognize interest and penalties
accrued on any unrecognized tax benefits as a component of income
tax expense. The Company has not accrued any interest associated
with its unrecognized tax benefits in the years ended December 31,
2017 and 2016.
12. Quarterly Financial Data
(Unaudited)
Below
is a summary table of the Company’s quarterly data for the
years ended December 31, 2017 and December 31, 2016.
|
|
Quarter Ended
|
|||||||
|
|
Dec 31,
2017 (1)
|
Sep 30,
2017
|
Jun 30,
2017
|
Mar 31,
2017
|
Dec 31,
2016
|
Sep 30,
2016
|
Jun 30,
2016
|
Mar 31,
2016
|
|
|
(in thousands, except per-share amounts)
|
|||||||
|
Total
net revenues
|
$33,321
|
$36,872
|
$34,591
|
$37,341
|
$40,378
|
$43,911
|
$36,148
|
$36,247
|
|
Gross
profit
|
$8,139
|
$11,086
|
$10,636
|
$12,911
|
$14,601
|
$15,755
|
$13,921
|
$13,635
|
|
Net
income (loss)
|
$(65,840)
|
$69
|
$322
|
$484
|
$1,378
|
$2,738
|
$430
|
$(676)
|
|
Basic
earnings (loss) per share
|
$(5.22)
|
$0.01
|
$0.03
|
$0.04
|
$0.13
|
$0.26
|
$0.04
|
$(0.06)
|
|
Diluted
earnings (loss) per share
|
$(5.22)
|
$0.01
|
$0.02
|
$0.04
|
$0.10
|
$0.21
|
$0.03
|
$(0.06)
|
(1)
Net income in the
quarter ended
December 31, 2017 included goodwill impairment of $37.7 million,
tax provision related to valuation allowance of $16.7 million, tax
provision of $11.7 million due to TCJA and a $0.6 million write-off
related to SaleMove.
SCHEDULE II—VALUATION AND QUALIFYING ACCOUNTS
|
|
Years Ended December 31,
|
||
|
|
2017
|
2016
|
2015
|
|
|
|
(in thousands)
|
|
|
Allowance
for bad debts:
|
|
|
|
|
Beginning
balance
|
$643
|
$605
|
$490
|
|
Additions
|
346
|
344
|
379
|
|
Write-offs
|
(311)
|
(306)
|
(264)
|
|
Ending
balance
|
$678
|
$643
|
$605
|
|
Allowance
for customer credits:
|
|
|
|
|
Beginning
balance
|
$371
|
$439
|
$280
|
|
Additions
|
247
|
592
|
803
|
|
Write-offs
|
(405)
|
(660)
|
(644)
|
|
Ending
balance
|
$213
|
$371
|
$439
|
|
Tax
valuation allowance:
|
|
|
|
|
Beginning
balance
|
$4,656
|
$5,427
|
$6,015
|
|
Charged
(credited) to tax expense
|
21,247
|
(771)
|
(588)
|
|
Charged
(credited) to retained earnings
|
(4,585)
|
—
|
—
|
|
Ending
balance
|
$21,318
|
$4,656
|
$5,427
|
F-32