Attached files
| file | filename |
|---|---|
| EX-99.1 - EX-99.1 - Ready Capital Corp | ex-99d1.htm |
| 8-K - 8-K - Ready Capital Corp | f8-k.htm |
Exhibit 99.2
|
|
Supplemental Financial Data Fourth Quarter 2017 |
|
|
This presentation contains statements that constitute "forward-looking statements," as such term is defined in Section 27A of the Securities Act of 1933, as amended, and Section 21E of the Securities Exchange Act of 1934, as amended, and such statements are intended to be covered by the safe harbor provided by the same. These statements are based on management's current expectations and beliefs and are subject to a number of trends and uncertainties that could cause actual results to differ materially from those described in the forward-looking statements; Sutherland Asset Management Corporation (the "Company") can give no assurance that its expectations will be attained. Factors that could cause actual results to differ materially from the Company's expectations include those set forth in the Risk Factors section of the most recent Annual Report on Form 10-K filed with the SEC and other reports filed by the Company with the SEC, copies of which are available on the SEC's website, www.sec.gov. The Company undertakes no obligation to update these statements for revisions or changes after the date of this release, except as required by law. This presentation includes certain non-GAAP financial measures, including Core Earnings. These non-GAAP financial measures should be considered only as supplemental to, and not as superior to, financial measures in accordance with GAAP. Please refer to Appendix A for the most recent GAAP information. This presentation also contains market statistics and industry data which are subject to uncertainty and are not necessarily reflective of market conditions. These have been derived from third party sources and have not been independently verified by the Company or its affiliates. All material presented is compiled from sources believed to be reliable and current, but accuracy cannot be guaranteed. All data is as of December 31, 2017, unless otherwise noted. 1 DISCLAIMER |
|
|
Net income of $12.7 million(1), or $0.38 per common share Core earnings of $12.4 million(1), or $0.37 per common share Declared dividend of $0.37 per share Q4 Return on Equity(2) of 9.1% Q4 Core Return on Equity(3) of 8.9% Q4 Dividend Yield(4) of 9.8% SBC loan originations of $216.5 million SBA loan originations of $38.3 million Residential mortgage loan originations of $458.7 million Acquired $121.6 million of SBC loans Adjusted net book value(6) of $16.69 per common share as of December 31, 2017 Loans increased by 3.6% to $2.1 billion Servicing portfolio increased by 4.4% to $7.5 billion Income to Core Earnings Q4 Dividend yield for the period based on the 12/29/2017 closing share price of $15.15 Represents fully committed amounts Excludes the equity component of our 2017 convertible note issuance (4) (5) (6) (1)Inclusive of non-controlling interest (2)Return on Equity is an annualized percentage equal to quarterly net income over the average monthly total stockholders’ equity for the period (3)Core Return on Equity is an annualized percentage equal to core earnings over the average monthly total stockholders’ equity for the period. Refer to slide 21 for a reconciliation of GAAP Net2 BALANCE SHEET LOAN ORIGINATIONS(5) / ACQUISITIONS RETURNS EARNINGS / DIVIDENDS FOURTH QUARTER 2017 HIGHLIGHTS |
|
|
Net income of $45.8 million(1) and $1.38 per common share Core earnings of $47.0 million(1) and $1.41 per common share Declared dividends of $1.48 per share Return on Equity(2) of 8.3% Core Return on Equity(3) of 8.5% Dividend Yield(4) of 9.8% SBC loan originations of $869.3 million SBA loan originations of $131.7 million Residential mortgage loan originations of $2.0 billion Acquired $206.2 million of SBC loans Adjusted net book value(6) of $16.69 per common share as of December 31, 2017 Loans increased by 12.0% to $2.1 billion Servicing portfolio increased by 22.6% to $7.5 billion Income to Core Earnings Dividend yield for the period based on the 12/29/2017 closing share price of $15.15 Represents fully committed amounts Excludes the equity component of our 2017 convertible note issuance (4) (5) (6) (1)Inclusive of non-controlling interest (2)Return on Equity is a percentage equal to annual net income over the average monthly total stockholders’ equity for the year (3)Core Return on Equity is an annualized percentage equal to core earnings over the average monthly total stockholders’ equity for the period. Refer to slide 21 for a reconciliation of GAAP Net3 BALANCE SHEET LOAN ORIGINATIONS(5) / ACQUISITIONS RETURNS EARNINGS / DIVIDENDS 2017 HIGHLIGHTS |
|
|
Core Levered Levered Equity Q4'17 Q3'17 FY 2017 Q4'17 Q3'17 FY 2017 Segment Yield (1) Allocation Yield (1 ) Loan Acquisitions 19.0 % 19.0 % 13.9 % SBC Originations SBA Originations, Acquisitions, & Servicing 15.9 % 15.9 % 44.1 % 23.4 % 23.4 % 26.2 % Residential Mortgage Banking (3) 14.9 % 15.1 % 15.8 % Corporate finance and non-earning assets, net Gross return on equity Realized & unrealized gains, net Other income and expenses, net Investment advisory fees Income tax benefit (provision) Return on equity and servicing income net of interest expense and amortization of deferred financing costs on an annualized basis. (3) ROE based on net income before tax of the Residential Mortgage Banking business line divided by the business line’s equity. (1) Levered yields include interest income, accretion of discount, MSR creation, realized gains (losses) on loans held for sale, unrealized gains (losses) on loans held for sale4 (2) GAAP ROE is based on GAAP Net Income, while Core ROE is based on Core Earnings, which adjusts GAAP Net Income for the items in slide 21. (2.4) 15.2 % 3.9 (8.6) (1.5) (0.5) 8.5 % (1.8) 16.7 % 3.5 (9.6) (1.5) 0.2 9.3 % (2.5) 15.7 % 4.3 (9.2) (1.5) (0.4) 8.9 % (2.3) 14.7 % 4.1 (8.7) (1.5) (0.3) 8.3 % (1.8) 16.2 % 3.6 (9.6) (1.5) 0.2 8.9 % (2.4) 15.7 % 4.3 (9.2) (1.5) (0.2) 9.1 % 17.6 % 18.5 % 18.2 % 17.0 % 18.0 % 18.1 % RETURN ON EQUITY GAAP ROE (2)Core ROE (2) |
|
|
120 100 $87.2 80 $75.4 60 $52.5 40 20 0 Q4'16 Q1'17 SBA Q2'17 Freddie Mac Q3'17 Q4'17 Conventional Transitional Fully committed ($ in millions) (1) (1) Origination volumes are based on fully committed amounts5 Highlights • Staff growth and operational efficiencies in origination platform results in achievement of origination volume targets for the year • Total SBC loan originations increased by $295.1 million, or 51%, for fiscal year 2017 compared to fiscal year 2016 → Freddie Mac originations increased by $163.9 million, or 71% → Transitional loan originations increased by $96.2 million, or 45% • SBA loan originations increased by $89.6 million, or 213%, for fiscal year 2017 compared to fiscal year 2016 $111.4 $105.2 $91.0 $69.7 $57.4 $47.4 $46.7 $38.3 $39.5 $39.3 $38.9 $33.6 $26.0 $28.5 $29.7 $13.7 SBC ORIGINATION VOLUME BY PRODUCT TYPE $126.9 |
|
|
► Acquired $121.6 million of SBC loans, comprised of 26% non-performing and 74% performing loans. ► Funded $242. LOANS Gross investments(2) Number of loans Average balance(3) Gross Yield(4) Weighted average duration(3) FX / ARM Avg. Advance Rate(5) Debt Cost(6) (3) Based on fully funded loan amount (5) (6) (7) Weighted average advance rate of all assets of this loan type currently financed on the Company’s facilities Weighted average debt cost of all assets of this loan type currently financed on the Company’s facilities Excludes joint venture acquisition of $54.3 million. (1)$ in millions (2)Represents actual disbursements during the quarter.6 (4)Gross yield equals contractual interest rates and accretion of discount based on the Company’s estimates of loan performance, where applicable $9.2 $103.7 48 75 $0.2 $1.4 6.5% 6.5% 20 years 12 years 0% / 100% 28% / 72% 60% 67% Libor + 350 Libor + 320 $62.0 16 $4.6 6.9% 11 years 0% / 100% 64% Libor + 329 $32.5 11 $2.7 5.6% 11 years 92% / 8% 75% Libor + 280 $111.4 $27.5 44 48 $2.5 $0.6 4.1% 6.5% 16 years 20 years 37% / 63% 0% / 100% 100% 60% Libor + 175 Libor + 350 $67.3 132 $0.5 6.0% 12 years 58% / 42% 71% Libor + 334 6 million(2) of SB ACQUISITIONS(1)(7) C and SBA loan originations. ORIGINATIONS(1) HELD FOR INVESTMENTHELD FOR SALE FREDDIE MACSBA HELD FOR INVESTMENT SBCTRANSITIONALSBA TOTAL-HELD FOR INVESTMENT Q4 2017 QUARTERLY SBC INVESTMENT ALLOCATION ► Total investments of $364.2 million added during the quarter. |
|
|
CURRENT QUARTER HIGHLIGHTS GROSS LEVERED YIELD ► Originations of $216.5 million(1), floating rate 18.5% 16.5% 14.5% 12.5% 10.5% 8.5% 6.5% 4.5% 2.5% 61% of which are ► Gains on sales of Freddie Mac loans of $2.5 million, up 39% quarter over prior quarter ► Origination pipeline of $159.8 million(2) ► $105.9 million of Freddie Mac loans ► $29.8 million of conventional SBC loans ► $24.1 million of transitional loans Q4 '16 Q1 '17 Q2 '17 (4) Q3 '17 Q4 '17 (5) (2) As of February 2017. (4) (5) Includes interest income, accretion of discount, and servicing income net of interest expense and amortization of deferred financing costs. Includes realized and unrealized gains (losses) on loans held for sale and MSR creation. Gross Levered Yield (ex. Gains)Gains on Loans, held for sale (1) Represents fully committed amounts.7 (3) $ in millions, as of quarter end. 3.3% 4.5% 13.8% 1.5% 1.7% 1.7% 11.4% 11.2% 11.2% 10.9% Portfolio Me trics (B alance She e t) Q4 2016 Q1 2017 Q2 2017 Q3 2017 Q4 2017 Number of loans 278 297 326 368 365 Unpaid Principal Balance (3) $ 730 $ 785 $ 971 $ 1,068 $ 1,094 Carrying Value (3) $ 746 $ 801 $ 989 $ 1,088 $ 1,108 Weighted Average LTV 62% 62% 63% 60% 61% Weighted Average Coupon 6.1% 6.1% 6.2% 6.3% 6.2% Weighted Average Maturity 5 y ears 5 y ears 5 y ears 5 y ears 5 y ears Weighted Average Principal Balance (3) $ 2.6 $ 2.6 $ 3.0 $ 2.9 $ 3.0 Percentage of loans fixed / floating 80% / 20% 73% / 27% 62% / 38% 64% / 36% 58% / 42% Percentage of fixed, match funded 79.4% 76.8% 70.5% 60.2% 60.4% Percentage of loans 30+ days delinquent 1.3% 1.2% 0.9% 0.2% 1.4% SBC ORIGINATIONS - SEGMENT SNAPSHOT |
|
|
37.5% ► $28.2 million of SBA secondary market loans sales, with an average sale premium of 10.3% 32.5% 27.5% ► Originations of $38.3 million(1) 22.5% ► Origination pipeline in excess of $135 million SBA loans(2) and an acquisition pipeline of $16.0 million in SBA loans 17.5% 12.5% 7.5% 2.5% Q4 '16 Q1 '17 Q2 '17 (4) Q3 '17 Q4 '17 (5) Gross Levered Yield (ex. Gains) Gains on Loans, held for sale (2) As of February 2017. (4) (5) Includes interest income, accretion of discount, and servicing income net of interest expense and amortization of deferred financing costs. Includes realized and unrealized gains (losses) on loans held for sale and MSR creation. (1) Represents fully committed amounts.8 (3) $ in millions, as of quarter end. 4.3% 8.8% 29.7% 3.2% 5.9% 25.6% 6.4% 21.7% 21.9% 17.0% Portfolio Me trics (B alance She e t) Q4 2016 Q1 2017 Q2 2017 Q3 2017 Q4 2017 Number of loans 2,509 2,398 2,280 2,194 2,106 Unpaid Principal Balance (3) $616 $588 $549 $530 $508 Carrying Value (3) $543 $521 $486 $471 $455 Weighted Average LTV 80% 80% 78% 78% 78% Weighted Average Coupon 5.2% 5.4% 5.7% 5.9% 5.9% Weighted Average Maturity 14 y ears 14 y ears 14 y ears 14 y ears 14 y ears Weighted Average Principal Balance (3) $0.2 $0.2 $0.2 $0.2 $0.2 Percentage of loans fixed / floating 1% / 99% 1% / 99% 1% / 99% 1% / 99% 1% / 99% Percentage of loans 30+ days delinquent 7.2% 8.0% 6.0% 6.0% 7.0% CURRENT QUARTER HIGHLIGHTS GROSS LEVERED YIELD SBA ORIGINATIONS, ACQUISITIONS & SERVICING – SEGMENT SNAPSHOT |
|
|
CURRENT QUARTER HIGHLIGHTS GROSS LEVERED YIELD 21.0% 19.0% ► At this stage of the credit cycle, ample inventory opportunistic performing SBC loans of 17.0% 15.0% 13.0% 11.0% ► Acquired $121.6 million of SBC loans ► includes a $54.3 million interest in an SBC loan pool through a joint venture ► Acquisition pipeline of $223.2 million SBC loans(3) 9.0% 7.0% 5.0% Q4 '16 Q1 '17 Q2 '17 Q3 '17 Q4 '17 (2) $ in millions, as of quarter end. (1) Excludes joint venture investment.9 (3) As of February 2017. 19.0% 15.6% 15.0% 14.3% 14.5% Portfolio Me trics (1) (B alance Sheet) Q4 2016 Q1 2017 Q2 2017 Q3 2017 Q4 2017 Number of loans 932 885 882 766 858 Unpaid Principal Balance (2) $ 493 $ 467 $ 411 $ 378 $ 417 Carrying Value (2) $ 429 $ 408 $ 368 $ 335 $ 376 Weighted Average LTV 55% 55% 53% 52% 49% Weighted Average Coupon 5.9% 6.0% 6.1% 6.3% 6.3% Weighted Average Maturity 10 y ears 10 y ears 11 y ears 9 y ears 10 y ears Weighted Average Principal Balance (2) $ 0.5 $ 0.5 $ 0.5 $ 0.5 $ 0.5 Percentage of loans fixed / floating 46% / 54% 46% / 54% 47% / 53% 46% / 54% 49% / 51% Percentage of fixed, match funded 15.1% 14.9% 14.3% 55.1% 43.7% Percentage of loans performing / non-performing 94% / 6% 94% / 6% 95% / 5% 93% / 7% 96% / 4% LOAN ACQUISITIONS – SEGMENT SNAPSHOT
|
|
|
CURRENT QUARTER HIGHLIGHTS MSR SERVICING PORTFOLIO (UPB IN $BILLIONS) $6.8 $6.6 $6.4 $6.2 $6.0 $5.8 $5.6 $5.4 $5.2 $5.0 $4.8 ► MSR portfolio of approximately $6.6 billion in UPB, up 3% compared to Q3 ► Fair market value of $72.3 million, up 5% compared to Q3 ► Originations of $458.7 million(1), down 7% compared to Q3 ► Loan sales of $429.1 million, down 15% compared to Q3 ► Origination pipeline of $147.6 million in commitments to Q4' 16 Q1' 17 Q2' 17 Q3' 17 Q4' 17 originate residential agency loans(2) (2) As of December 31, 2017 Originations (1) Represents fully committed amounts10 (3) $ in millions. Represents activity during the quarter. Fair Q4' 16 Q1' 17 Q2' 17 Q3' 17 Q4' 17 Value ($ mm) $ 61.4 $ 64.6 $ 66.8 $ 68.8 $ 72.3 $6.6 $6.3 $6.1 $5.8 $5.5 Portfolio Me trics (quarte rly activity) Q4 2016 Q1 2017 Q2 2017 Q3 2017 Q4 2017 Unpaid principal balance (3) $ 357.6 $461.0 $560.0 $490.9 $458.7 % of Originations Purchas ed 66.7% 74.4% 80.1% 78.8% 71.9% % of Originations Refinanced 33.3% 25.6% 19.9% 21.2% 28.1% Channel - % Corres pondent 41.4% 43.2% 40.1% 37.7% 38.6% Channel - % Retail 34.6% 33.4% 35.9% 37.6% 41.1% Channel - % Wholes ale 24.0% 23.4% 24.0% 24.7% 20.3% Unpaid principal balance (3) $ 380.2 $481.7 $547.0 $503.9 $429.1 les % of UPB-Fannie/ Freddie s ecuritizations 63.1% 62.0% 62.7% 62.0% 60.6% Sa % of UPB-Ginnie Mae s ecuritizations 27.8% 25.5% 27.3% 26.4% 28.8% % of UPB – Other inves tors 9.1% 12.5% 10.0% 11.6% 10.6% RESIDENTIAL MORTGAGE BANKING – SEGMENT SNAPSHOT |
|
|
11 Recent transactions: ► Recently priced a $165 million securitization of fixed-rate SBC loans, at 6 basis points tighter than AAA-rated large balance CMBS. SBC AND SBA LOAN SECURITIZATION PERFORMANCE S ecuritization Date Original Collateral Balance % Pool - Factor Delinquency 30+ Delinquency 60+ Delinquency 90+ Cumulative Los s Fixed Rat e $ 562,754 29% RCMT 2014-1 Sept ember 2014 181,922 9% 0.38 0.0% 0.0% 0.0% 0.0% RCMT 2015-2 November 2015 218,757 11% 0.83 0.0% 0.0% 0.0% 0.0% RCMT 2016-3 November 2016 162,075 8% 0.72 0.0% 0.0% 0.0% 0.0% Float ing Rat e $ 243,797 12% RCMT 2017-FL1 August 2017 243,797 12% 0.78 2.6% 2.6% 0% 0.0% Freddie Mac $ 447,854 23% FRESB 2016-SB11 January 2016 109,965 6% 0.74 0.0% 0.0% 0.0% 0.0% FRESB 2016-SB18 July 2016 118,037 6% 0.95 0.0% 0.0% 0.0% 0.0% FRESB 2017-SB33 June 2017 219,853 11% 0.98 0.0% 0.0% 0.0% 0.0% SBA $ 189,492 10% RCLT 2015-1 June 2015 189,492 10% 0.51 4.8% 4.0% 3% 0.6% Acquired - Non-performing $ 270,060 14% W VMT 2011-SBC1 February 2011 130,710 7% 0.21 18.9% 7.4% 7.4% N/A SCML 2015-SBC4 August 2015 139,350 7% 0.32 17.3% 15.5% 12.4% N/A Acquired - P erforming $ 252,486 13% W VMT 2011-SBC2 March 2011 97,557 5% 0.29 3.3% 2.8% 2.8% 3.6% SCMT 2017-SBC6 August 2017 154,928 8% 0.81 0.2% 0.0% 0.0% 0.0% Total loan s e cu ritiz ation s $ 1,966,443 100% |
|
|
► 56% of our held-for-investment loan portfolio is floating rate ► 58% of our fixed rate loan portfolio is matched funded ► a 100 basis point increase in LIBOR would increase annual pre-tax net interest income by approximately $0.12 per share(3) Annu al Net Interest Inco me (P re-tax) P er Share % of Total Loan Exposure (1)(2) $0.14 Fixed Rate, not matched funded, 18.7% $0.12 $0.10 $0.08 Fixed Rate, matched funded, 25.6% Floating Rate, 55.7% $0.06 $0.04 $0.02 $-25 basis p oint increase 50 basis p oint increase 75 basis p oint increase 100 basis p oint increase (2) Excludes loans held-for-sale, at fair value (1) As a percent of carrying value12 (3) Assumes no future changes in the composition of the portfolio. PORTFOLIO - FIXED VS FLOATING INTEREST RATE SENSITIVITY INTEREST RATE RISK SENSITIVITY |
|
|
Other, 0.7% Subordinated Mortgage, 1.9% California, 13.6% Texas, 12.6% Florida, 11.6% Other, 49.0% First Mortgage, 97.4% New York, 6.9% Georgia, 6.3% Physicians Offices, 16.2% Industrial, 7.1% Day Care Services, 12.8% Other, 12.6% SBA, 23.7% Other, 47.5% Office, 16.1% Lodging, 10.4% Vets, 7.2% Multi-Family, 22.1% (3) Retail, 18.4% Eating (2) Excludes loans held-for-sale, at fair value (3) Average carrying value of Retail exposure is $1.5 million as of December 31, 2017, compared to $1.6 million as of September 30, 2017 Places, 5.9% (1) As a percent of carrying value13 SBA COLLATERAL TYPE (1)(2) COLLATERAL TYPE (1)(2) LIEN POSITION (1)(2) GEOGRAPHIC LOCATION (1)(2) LOAN PORTFOLIO COMPOSITION AS OF DECEMBER 31, 2017 |
|
|
Gross Assets(1) ► Since going public in Q4 2016, we continue to optimize our capital structure: Issued $255 million in non-recourse debt through 12/31/17 and an additional $40 million in January 2018: -Convertible notes: 6 year notes, 7.0% coupon, $115 million -Senior secured notes: 5 year notes, 7.5% coupon -$75 million in February 2017; YTM of 7.5% -$65 million in June 2017; YTM of 6.75% -$40 million in January 2018, YTM of 6.5% Sponsored two securitizations in 2017 -$198.8 million of bonds issued, collateralized by $243.8 million of originated transitional loans -$139.4 million of bonds issued, collateralized by $154.9 million of acquired SBC owner-occupied loans Paid down recourse debt of approximately $300 million Funding Mix (1) Includes Loans, MBS, Servicing Rights, and an equity method investment as of the quarter end.14 CURRENT SOURCES OF FUNDING HISTORICAL CAPITAL STRUCTURE $1,973$1,957$1,926$2,006$2,034 Q4 2016 Q1 2017 Q2 2017 Q3 2017 Q4 2017 Common Equity Convertible senior notes Senior secured notes Credit facilities and repurchase agreements Securitized debt obligations 25% 22% 21% 34% 29% 43% 46% 47% 31% 26% 7% 7% 7% 5% 5% 4% 28% 29% 28% 27% 28% CAPITAL STRUCTURE |
|
|
HISTORICAL LEVERAGE(1) 2.7x 3 2.5 2 1.5 1 0.5 0 2.4x 1.9 x 2.0x 2.0x 1.6x 1.6x 1.1x 1.1x Q4 2016 Q1 2017 Q2 2017 Q3 2017 Q4 2017 RecourseTotal 15 1.2x 12/31/2017 Total de bt-to-e quity ratio (in millions) Secured borrowings (warehous e credit facilities and borrowings under repo trans actions ) $ 631.3 Promis s ory note 6.1 Securitized debt obligations 598.1 Senior s ecured note 138.1 Convertible note 109.0 Total Debt $ 1,482.6 Total Stockholders ' Equity $ 555.5 Total debt-to-equity ratio 2.67 Total re cours e de bt-to-e quity ratio Total Debt $ 1,482.6 Les s : Securitized debt obligations (598.1) Total recours e debt $ 884.5 Total Stockholders ' Equity $ 555.5 Total recours e debt-to-equity ratio 1.59 FINANCING AND LEVERAGE |
|
|
loan securitization in Q2 CLO issuance of $243.8 million of transitional loans in Q3 2. Transitional Loan CLO channels and SBA loan originations Q2 Q1 resulting in a reduction of our effective tax rate from ASSESSMENT OF 2017 STRATEGIC INITIATIVES InitiativeTargetUpdate Completed issuance of Senior Secured Notes, $140M, Raise up to $250M of corporate debt to7.5%, due 2022 Access Corporate Debt Marketssupport $1B of loan originations and/or acquisitionsCompleted issuance of Convertible Notes, $115M, 7.0%, due 2023 1. Originated Freddie MacPurchased a $14.5 million B-piece of originated Freddie Securitization Issuance Securitization of $154.9 million of acquired SBC owner-3. Acquired SBC Owner Occupiedoccupied loans in Q3 Increased Origination Volumes 1. Hire additional loan officers 2. Enhanced and expanded affinity relationships 3. Origination targets 1. Appointment of Chief Operating Officer 2. Appointment of RCC Chief Executive Officer Reduction in Taxable REIT Subsidiary tax drag and transfer of taxable income to tax efficient entities Approximately 10 new loan officers hired 30% of loan origination volumes sourced through affinity Achieved FY 2017 origination targets with $1.0B in SBC Management Team Carole Mortensen appointed COO of SLD in Anuj Gupta appointed President of RCC in Tax Efficient Structure Optimized tax structure by utilizing tax efficient entities, 14.8% in 2016 to 3.9% in 2017. 16 |
|
|
AVG. DEBT BALANCE LEVERED YIELD DEBT COST(2) INVESTMENT TYPE CARRYING VALUE(1) GROSS YIELD expense is calculated based on interest expense and deferred financing amortization for the quarter ended 12/31/2017 on an annualized basis. (3) Excludes loans, held for sale, at fair value Book Equity Value Metrics (4) Excludes the equity component of our 2017 convertible note issuance Q4 2017 Earnings Data Metrics Management Corporation$12,097 Loan Portfolio Metrics(3) Servicing Portfolio Metrics (1) Average carrying value includes average quarterly carrying value of loan and servicing asset balances (2) Sutherland finances the assets included in the Investment Type through securitizations, repurchase agreements, warehouse facilities and bank credit facilities. Interest17 Net income attributable to Sutherland Asset Earnings per share – Basic and diluted$0.38 Core Earnings per Common Share$0.37 Return on Equity per Common Share9.1% Core Return on Equity per Common Share8.9% Dividend yield9.8% SBA servicing rights - UPB$427,623 SBA servicing rights - carrying value$16,684 Freddie Mac servicing rights - UPB$559,823 Freddie Mac servicing rights - carrying value$5,059 Residential servicing rights - UPB$6,558,455 Residential servicing rights - carrying value$72,295 % Fixed vs Floating Rate44.3% / 55.7% % Originated vs Acquired62.5% / 37.5% Weighted Average LTV-SBC61% Weighted Average LTV-SBA78% Weighted Average LTV-Acquired49% Common Stockholders’ equity$536,073 Common Stockholders’ equity (adjusted)(4)$534,008 Total Common Shares outstanding31,996,440 Net Book value per Common Share$16.75 Adjusted Net Book value per Common Share$16.69 Loan Acquisitions$361,3968.1%$290,2205.5%19.0% SBC origination portfolio$1,096,4147.3%$870,3985.1%15.9% SBA Originations, Acquisitions & Servicing$479,3089.9%$344,9234.6%23.4% Total$1,937,1198.1%$1,505,5405.0%18.7% SUTHERLAND SNAPSHOT ($ AMOUNTS IN THOUSANDS, EXCEPT PER SHARE DATA) AVG. |
|
|
APPENDIX |
|
|
(1) Excludes a bargain purchase gain of $0.48. Q4’17 earnings per share up $0.01, or 3%, compared to the previous quarter Adjusted net book value of $16.69 per common share as of December 31, 2017 18 $0.50 $0.40 $0.30 $0.20 Q4 2016Q1 2017Q2 2017Q3 2017Q4 2017 Earnings Core earnings Dividends declared $0.38 $0.38 $0.37 $0.37 $0.37 $0.37 $0.37 $0.37 $0.35 (1) $0.35 $0.35 $0.34 $0.34 $0.33 $0.29 Per Share Trends PER SHARE FINANCIAL PERFORMANCE |
|
|
Cash and cash equivalent s $ 59,566 $ 40,000 $ 63,931 $ 70,590 $ 63,425 Short -t erm invest ment s 319,984 239,856 — 99,994 — Loans, held for sale, at fair value 181,797 152,231 206,706 200,318 216,022 Loans eligible for repurchase from Ginnie Mae 137,986 117,229 105,244 101,408 95,158 Derivat ive inst rument s 5,785 4,351 4,187 4,131 4,725 Receivable from t hird part ies 7,220 111,221 106,562 6,756 6,756 Asset s of consolidat ed VIEs 691,096 631,765 597,277 944,894 861,662 Liabilitie s P romissory not e, net 7,378 7,046 6,773 6,494 6,107 Convert ible not e, net — — — 109,414 108,991 Guarant eed loan financing 390,555 361,916 332,812 313,388 293,045 Liabilit ies for loans eligible for repurchase from Ginnie Mae 137,986 117,229 105,244 101,408 95,158 Dividends payable 11,505 12,162 12,289 12,289 12,289 Total Liabilitie s $ 2,053,165 $ 1,977,662 $ 1,894,109 $ 1,948,090 $ 1,968,036 Common st ock 3 3 4 3 3 Deficit (201) (2,648) (4,030) (3,952) (3,385) Non-cont rolling int erest s 39,005 38,847 19,394 19,338 19,394 Total Liabilitie s an d S tock h olde rs ’ Equ ity $ 2,605,267 $ 2,527,522 $ 2,446,920 $ 2,503,143 $ 2,523,503 (1) Certain balances have been reclassified to match current period presentation19 (2) Excludes the equity component of our 2017 convertible note issuance. Adjus te d B ook Val ue pe r Share (2 ) $ 16.80 $ 16.73 $ 16.67 $ 16.68 $ 16.69 Total S tock h ol de rs ’ Equ i ty $ 552,102 $ 549,860 $ 552,811 $ 555,053 $ 555,467 T ot al Sut herland Asset Management Corporat ion equit y 513,097 511,013 533,417 535,715 536,073 Addit ional paid-in capit al 513,295 513,658 537,443 539,664 539,455 Stockhol de rs ’ Equi ty Account s payable and ot her accrued liabilit ies 70,207 63,130 53,768 54,579 74,636 Derivat ive inst rument s 643 619 931 358 282 Cont ingent considerat ion 14,487 8,841 8,939 9,037 10,016 Senior secured not e, net — 73,390 138,311 138,074 138,078 Securit ized debt obligat ions of consolidat ed VIEs, net 492,942 434,055 397,911 680,282 598,148 Secured borrowings 927,462 899,274 837,131 522,767 631,286 Total As s e ts $ 2,605,267 $ 2,527,522 $ 2,446,920 $ 2,503,143 $ 2,523,503 Ot her asset s 54,277 60,938 39,452 35,356 56,840 Servicing right s 83,854 84,997 86,751 89,372 94,038 Invest ment in unconsolidat ed joint vent ure — — — — 55,369 Mort gage backed securit ies, at fair value 32,391 31,365 43,877 41,371 39,922 Loans, net 1,011,121 1,033,797 1,175,370 892,896 1,017,920 Rest rict ed cash 20,190 19,772 17,563 16,057 11,666 Ass e ts BALANCE SHEET BY QUARTER (In Thous ands ) 12/31/2016 (1 ) 3/31/2017 (1 ) 6/30/2017 (1 ) 9/30/201712/31/2017 |
|
|
Int erest expense (15,729) (16,441) (17,230) (19,908) (21,067) P rovision for loan losses (3,130) (1,232) (159) (466) (506) Non -i n te re s t i n com e Ot her income 3,826 839 1,588 1,853 4,178 Gain on bargain purchase 15,218 — — — — Non -i n te re s t e xpe n s e Allocat ed employee compensat ion and benefit s from relat ed part y (968) (1,012) (1,008) (990) (833) Management fees – relat ed part y (1,968) (1,977) (2,007) (2,034) (2,041) Ot her operat ing expenses (5,995) (5,534) (6,206) (7,447) (7,752) Ne t re al i z e d gai n on fi nanci al i ns trum e nts 3,194 2,966 4,491 5,695 6,177 Income from cont inuing operat ions before income t ax benefit (provision) $ 34,206 $ 10,591 $ 12,222 $ 12,034 $ 12,806 Net income from cont inuing operat ions $ 27,881 $ 9,557 $ 11,153 $ 12,374 $ 12,730 Less: Net income at t ribut able t o non-cont rolling int erest 2,020 701 657 533 633 Cont inuing operat ions $ 0.89 $ 0.29 $ 0.34 $ 0.37 $ 0.38 Earn i n gs pe r bas i c com m on s h are $ 0.83 $ 0.29 $ 0.34 $ 0.37 $ 0.38 W eight ed-average shares out st anding - Basic 28,963,695 0 30,549,806 30,768,900 32,026,494 32,031,494 Di vi de n ds de cl are d pe r s h are of com m on s tock $ 0.35$ 0.37 $ 0.37 $ 0.37 $ 0.37 (1) Certain balances have been reclassified to match current period presentation 20 W eight ed-average shares out st anding - Dilut ed N/A 30,549,80630,769,33232,028,98032,034,610 Earn i n gs pe r di l u te d com m on s h are$ N/A $ 0.29$ 0.34$ 0.37$ 0.38 Discont inued operat ions$(0.06) $—$—$—$— Ne t i n com e attri bu tabl e to S u th e rl an d As s e t Man age m e n t C orporati on $ 24,054$ 8,856$ 10,496$ 11,841$ 12,097 Earn i n gs (l os s ) pe r bas i c com m on s h are Ne t i n com e $ 26,074$ 9,557$ 11,153$ 12,374$ 12,730 Income t ax benefit (provision) (6,325) (1,034) (1,069) 340 (76) Ne t unre al i z e d gai n on fi nanci al i ns trum e nts 12,137 1,282 974 2,678 2,066 Total n on -i n te re s t e xpe n s e $ (25,322) $ (25,659) $ (27,306) $ (29,725) $ (30,434) Loan servicing expense (722) (1,513) (2,611) (3,388) (2,811) P rofessional fees (4,847) (2,159) (2,023) (2,151) (2,588) Employee compensat ion and benefit s (10,822) (13,464) (13,451) (13,715) (14,409) Total n on -i n te re s t i n com e $ 30,315$ 15,791$ 18,204$ 18,722$ 20,435 Servicing income, net of amort izat ion and impairment 4,238 4,442 5,631 6,134 6,787 Gains on resident ial mort gage banking act ivit ies, net of variable loan expenses $ 7,033$ 10,510$ 10,985$ 10,735$ 9,470 Ne t i n te re s t i n com e afte r provi s i on for l oan l os s e s $ 13,882$ 16,211$ 15,859$ 14,664$ 14,562 Ne t i n te re s t i n com e be fore provi s i on for l oan l os s e s $ 17,012$ 17,443$ 16,018$ 15,130$ 15,068 Int erest income $ 32,741$ 33,884$ 33,248$ 35,038$ 36,135 STATEMENT OF INCOME BY QUARTER (In Th ou s an ds , e xce pt s h are data) Q 4 2016 (1 ) Q 1 2017 (1 ) Q 2 2017 (1 ) Q 3 2017Q 4 2017 |
|
|
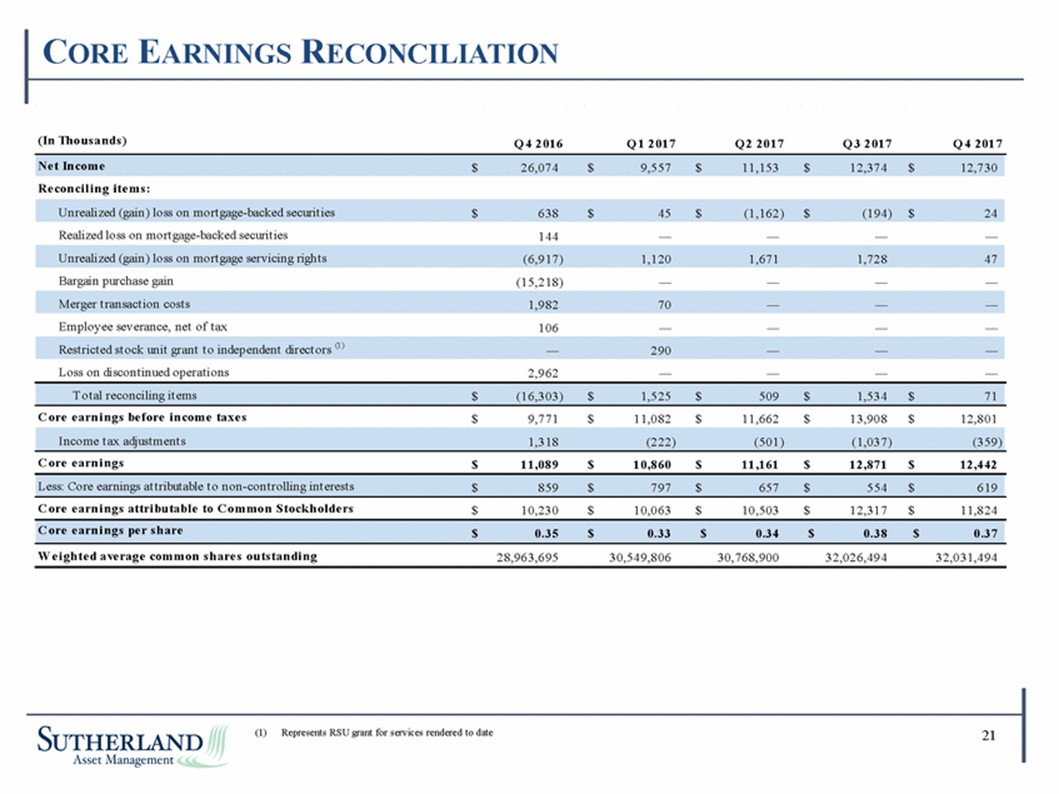
(In Thous ands ) Q 4 2016 Q 1 2017 Q 2 2017 Q 3 2017 Q 4 2017 Re con cilin g ite m s : Realized loss on mort gage-backed securit ies 144 — — — — Bargain purchase gain (15,218) — — — — Employee severance, net of t ax 106 — — — — Loss on discont inued operat ions 2,962 — — — — C ore e arn i n gs be fore i n com e taxe s $ 9,771 $ 11,082 $ 11,662 $ 13,908 $ 12,801 C ore e arn i n gs $ 11,089 $ 10,860 $ 11,161 $ 12,871 $ 12,442 C ore e arn i n gs attri bu tabl e to C om m on S tock h ol de rs $ 10,230 $ 10,063 $ 10,503 $ 12,317 $ 11,824 W e i gh te d ave rage com m on s h are s ou ts tan di n g 28,963,695 30,549,806 30,768,900 32,026,494 32,031,494 (1) Represents RSU grant for services rendered to date21 C ore e arn i n gs pe r s h are $ 0.35 $ 0.33 $ 0.34 $ 0.38 $ 0.37 Less: Core earnings at t ribut able t o non-cont rolling int erest s $ 859 $ 797 $ 657 $ 554 $ 619 Income t ax adjust ment s 1,318 (222) (501) (1,037) (359) T ot al reconciling it ems $ (16,303) $ 1,525 $ 509 $ 1,534 $ 71 Rest rict ed st ock unit grant t o independent direct ors (1 )— 290 — — — Merger t ransact ion cost s 1,982 70 — — — Unrealized (gain) loss on mort gage servicing right s (6,917) 1,120 1,671 1,728 47 Unrealized (gain) loss on mort gage-backed securit ies $ 638 $ 45 $ (1,162) $ (194) $ 24 Ne t In com e $ 26,074 $ 9,557 $ 11,153 $ 12,374 $ 12,730 CORE EARNINGS RECONCILIATION |