Attached files
| file | filename |
|---|---|
| EX-32.2 - CERTIFICATION OF CHIEF FINANCIAL OFFICER - PIXELWORKS, INC | pxlw12312017_ex322.htm |
| EX-32.1 - CERTIFICATION OF CHIEF EXECUTIVE OFFICER - PIXELWORKS, INC | pxlw12312017_ex321.htm |
| EX-31.2 - CERTIFICATION OF CHIEF FINANCIAL OFFICER - PIXELWORKS, INC | pxlw12312017_ex312.htm |
| EX-31.1 - CERTIFICATION OF CHIEF EXECUTIVE OFFICER - PIXELWORKS, INC | pxlw12312017_ex311.htm |
| EX-23 - CONSENT OF KPMG LLP - PIXELWORKS, INC | pxlw12312017_ex23.htm |
| EX-21 - SUBSIDIARIES - PIXELWORKS, INC | exhibit21subsidiaries.htm |
| EX-10.1 - INDEMNITY AGREEMENT - PIXELWORKS, INC | exhibit101indemnityagreeme.htm |
UNITED STATES
SECURITIES AND EXCHANGE COMMISSION
WASHINGTON, D.C. 20549
________________________________
FORM 10-K
________________________________
x | ANNUAL REPORT PURSUANT TO SECTION 13 or 15(d) OF THE SECURITIES EXCHANGE ACT OF 1934 |
For the fiscal year ended December 31, 2017
or
¨ | TRANSITION REPORT PURSUANT TO SECTION 13 or 15(d) OF THE SECURITIES EXCHANGE ACT OF 1934 |
For the transition period from to
Commission File Number: 000-30269
________________________________
PIXELWORKS, INC.
(Exact name of registrant as specified in its charter)
________________________________
Oregon | 91-1761992 | |
(State or other jurisdiction of incorporation or organization) | (I.R.S. Employer Identification No.) | |
224 Airport Parkway, Suite 400, San Jose, CA | 95110 | |
(Address of principal executive offices) | (Zip Code) | |
408-200-9200
(Registrant’s telephone number, including area code)
Securities registered pursuant to Section 12(b) of the Act:
Title of each class | Name of each exchange on which registered | |
Common Stock | Nasdaq Global Market | |
Securities registered pursuant to Section 12(g) of the Act:
None
________________________________
Indicate by check mark if the registrant is a well-known seasoned issuer, as defined in Rule 405 of the Securities Act. Yes ¨ No x
Indicate by check mark if the registrant is not required to file reports pursuant to Section 13 or 15(d) of the Act. Yes ¨ No x
Indicate by check mark whether the registrant (1) has filed all reports required to be filed by Section 13 or Section 15(d) of the Securities Exchange Act of 1934 during the preceding 12 months (or for such shorter period that the registrant was required to file such reports), and (2) has been subject to such filing requirements for the past 90 days. Yes x No ¨
Indicate by check mark whether the registrant has submitted electronically and posted on its corporate Web site, if any, every Interactive Data File required to be submitted and posted pursuant to Rule 405 of Regulation S-T (§ 232.405 of this chapter) during the preceding 12 months (or for such shorter period that the registrant was required to submit and post such files). Yes x No ¨
Indicate by check mark if disclosure of delinquent filers pursuant to Item 405 of Regulation S-K (§229.405 of this chapter) is not contained herein, and will not be contained, to the best of the registrant’s knowledge, in definitive proxy or information statements incorporated by reference in Part III of this Form 10-K or any amendment to this Form 10-K. x
Indicate by check mark whether the registrant is a large accelerated filer, an accelerated filer, a non-accelerated filer, a smaller reporting company or an emerging growth company. See definitions of "large accelerated filer," "accelerated filer,", "smaller reporting company" and "emerging growth company" in Rule 12b-2 of the Exchange Act.
Large accelerated filer | ¨ | Accelerated filer | ¨ | |
Non-accelerated filer | ¨ | (Do not check if a smaller reporting company) | Smaller reporting company | x |
Emerging growth company | ¨ | |||
If an emerging growth company, indicate by check mark if the registrant has elected not to use the extended transition period for complying with any new or revised financial accounting standards provided pursuant to Section 13(a) of the Exchange Act. Yes ¨ No ¨
Indicate by check mark whether the registrant is a shell company (as defined in Rule 12b-2 of the Act). Yes ¨ No x
The aggregate market value of the registrant's common stock held by non-affiliates at June 30, 2017 was $120,445,800 based on the closing price of $4.59 per share of common stock on the Nasdaq Global Market on June 30, 2017 (the last business day of the registrant's most recently completed second fiscal quarter). For purposes of this calculation, executive officers and directors are considered affiliates as well as holders of more than 5% of the registrant's common stock known to the registrant. This determination of affiliate status is not a conclusive determination for other purposes.
Number of shares of common stock of the registrant outstanding as of March 9, 2018: 35,582,126
________________________________
Documents Incorporated by Reference
Part III incorporates information by reference to the registrant’s definitive proxy statement, to be filed with the Securities and Exchange Commission within 120 days after the close of the fiscal year ended December 31, 2017.
PIXELWORKS, INC.
FORM 10-K
FOR THE YEAR ENDED DECEMBER 31, 2017
TABLE OF CONTENTS
Item 1. | ||
Item 1A. | ||
Item 1B. | ||
Item 2. | ||
Item 3. | ||
Item 4. | ||
Item 5. | ||
Item 6. | ||
Item 7. | ||
Item 7A. | ||
Item 8. | ||
Item 9. | ||
Item 9A. | ||
Item 9B. | ||
Item 10. | ||
Item 11. | ||
Item 12. | ||
Item 13. | ||
Item 14. | ||
Item 15. | ||
Item 16. | ||
Forward-looking Statements
This Annual Report on Form 10-K, including Management’s Discussion and Analysis of Financial Condition and Results of Operation in Part II, Item 7, contains "forward-looking statements" that are based on current expectations, estimates, beliefs, assumptions and projections about our business. Words such as "expects," "anticipates," "intends," "plans," "believes," "seeks," "estimates" and variations of such words and similar expressions are intended to identify such forward-looking statements. These statements are not guarantees of future performance and involve numerous risks, uncertainties and assumptions that are difficult to predict. These forward-looking statements include statements regarding: the features, benefits and applications of our technologies and products; market trends and changes, including in the video consumption, mobile, video and digital projection markets; our strategy, including regarding our products, technology, research and development, sales and marketing and acquisition and other growth opportunities; our ability to successfully integrate the business of ViXS Systems Inc. (“ViXS”) with our existing business; the potential impact of the acquisition of ViXS on our financial condition and operating results, including any unanticipated costs related thereto, the calculation of the estimated purchase price and the allocation thereof, and the impact of the final valuation on various financial metrics; the terms of our convertible debt; our expectations with respect to our restructuring plan; amortization expectations; our co-development agreement; the sufficiency of our working capital and need for, or ability to secure, additional financing; the success of our products in expanded markets; customer and distributor concentration; current global economic challenges; exchange rate risk; our competitive advantages in research and development; levels of inventory at distributors and customers; changes in customer ordering patterns or lead times; seasonality; expectations as to revenue associated with sales into certain markets in 2018, including as compared to normalized quarterly revenue; cost expectation; backlog; future contractual obligations; competition; intellectual property; insufficient, excess or obsolete inventory and variations in inventory valuation; income tax valuation allowance; net operating loss utilization; the impact of the Tax Cuts and Jobs Act ("TCJA"); changes in accounting principles; and internal controls. Factors which may cause actual results to vary materially from those contained in the forward-looking statements include, without limitation: our ability to deliver new products in a timely fashion; our new product yield rates; changes in estimated product costs; product mix; restructuring charges; the growth of the markets we serve; supply of products from third-party foundries; failure or difficulty in achieving design wins; timely customer transition to new product designs; competitive factors, such as rival chip architectures, introduction or traction by competing designs, or pricing pressures; litigation related to our intellectual property rights; our limited financial resources; economic and political challenges due to operations in Asia; exchange rate fluctuations; failure to retain or attract qualified employees; the sufficiency of our intellectual property and patent portfolio; fluctuations in foreign currencies; natural disasters; the need for additional income tax valuation allowances; limitations on net operating losses, as well as other risks identified in the risk factors contained in Part I, Item 1A of this Annual Report on Form 10-K. These forward-looking statements speak only as of the date on which they are made, and we do not undertake any obligation to update any forward-looking statement to reflect events or circumstances after the date of this Annual Report on Form 10-K. If we do update or correct one or more forward-looking statements, you should not conclude that we will make additional updates or corrections with respect thereto or with respect to other forward-looking statements. Except where the context otherwise requires, in this Annual Report on Form 10-K, the terms "Pixelworks," the "Company," "we," "us" and "our" mean Pixelworks, Inc., an Oregon corporation, and its wholly-owned subsidiaries.
3
PART I
Item 1. | Business. |
Overview
Pixelworks designs, develops and markets visual display processing semiconductors, intellectual property cores, software and custom application specific integrated circuits ("ASIC") solutions for high-quality energy efficient video applications. In addition, we offer a suite of solutions for advanced media processing and the efficient delivery and streaming of video.
We enable worldwide manufacturers to offer leading-edge consumer electronics and professional display products, as well as video delivery and streaming solutions for content service providers. Our core visual display processing technology intelligently processes digital images and video from a variety of sources and optimizes the content for a superior viewing experience. Pixelworks’ video coding technology reduces storage requirements, significantly reduces bandwidth constraint issues and converts content between multiple formats to enable seamless delivery of video, including over-the-air (OTA) streaming, while also maintaining end-to-end content security.
The rapid growth in video-capable consumer devices, especially mobile, has increased the demand for visual display processing and video delivery technology in recent years. Our technologies can be applied to a wide range of devices from large-screen projectors to low-power mobile tablets, smartphones, high-quality video infrastructure equipment and streaming devices. Our products are architected and optimized for power, cost, bandwidth, and overall system performance, according to the requirements of the specific application. Our primary target markets include digital projection systems, tablets, smartphones, and OTA streaming devices.
As of December 31, 2017, we held an intellectual property portfolio of 536 patents related to the visual display of digital image data. We focus our research and development efforts on developing video algorithms that improve quality, and architectures that reduce system power, cost, bandwidth and increase overall system performance and device functionality. We seek to expand our technology portfolio through internal development and co-development with business partners, and we continually evaluate acquisition opportunities and other ways to leverage our technology into other high-value markets.
High-Resolution Displays
Display technologies have recently begun to transition from an era of higher resolutions, response times and frame rates, with lower power and thinner form factors, to one focused on higher contrast and more colors.
In mobile devices, Apple Inc. has brought wide color gamut to many of their devices including the iPhone, iPad Pro, MacBook Pro and iMac. These devices deliver the same color gamut used in digital cinema theatres ("DCI-P3"). Meanwhile, television ("TV") manufacturers including Samsung, Sony and LG are bringing high contrast, high brightness (High Dynamic Range or "HDR") TVs based on OLED and local-dimming LCD panels to the living room. Furthermore, premium smartphones and some tablets from Apple, Samsung, Sony, LG and Huawei now include HDR as a standard feature.
Hardware improvements in color and contrast are of little value without content that can take advantage of them. In fact, a significant gap now exists between the vast majority of video content available to consumers, and these emerging display devices.
• | Contrast and Brightness: Almost all movies available to consumers today use the "Rec.709" ITU standard format. This format defines brightness levels up to around 100 "nits" (a standard measure of brightness), whereas HDR TVs are five to ten times brighter (from 540 nits upwards). Most mobile devices support over 400 nits and sometimes over 600 nits. |
• | Color Gamut: DCI-P3 has a 25% larger color gamut than Rec.709. |
• | Frame Rate: Most movies are available in 24 or 25 frames per second, a rate at which the human eye still perceives judder, but cannot identify individual still images or frames and sees a video instead. Mobile devices on the other hand have displays that run at 60 frames per second, and TVs commonly display 120 frames per second - frame rates at which the eye perceives smooth motion. In addition to the display frame rate discrepancy, the transmission rates vary based on various factors such as available bandwidth. Standard frame rate conversion requires the original content frames being repeated or dropped in order to match the frame rate of the display. This causes the video to appear to judder. Judder is a common problem in video systems and occurs when there is a sudden jump or discontinuity in motion from one frame of a motion video sequence to the next. This can be caused by content being created at a frame rate per second that is too low, or the original content frames are being repeated or dropped in order to match either a transmission standard or the playback frame rate of the display. |
4
• | Resolution: Finally, TVs have achieved 4k resolutions (3840x2160) and mobile devices commonly achieve 2560x1440, and while some content is available in 4k resolution, most movies are only available in FHD or HD resolutions (typically 1920x1080 and 1280x720 respectively). |
This gap between display capabilities and available content brings significant challenges to video display device manufacturers. Sophisticated video processing is required to accurately reproduce the intended video on today’s displays.
For example, Sony adds their proprietary "4K HDR Processor X1™" to their latest TV sets and Samsung adds their "mDNIe™" video processors to their mobile phones.
Content formats are evolving to take advantage of these display improvements. For example, Dolby introduced the “Dolby Vision™” format for movies and devices, in order to allow consumers to realize the benefits of HDR and wide color gamut. The industry standards body Society of Motion Picture & Television Engineers, released a format specification known as "HDR10" that similarly bridges the gap in contrast and color between content and devices. The Ultra-HD Blu-ray disk format and streaming services such as Netflix and Amazon Video now support 4k HDR, aided by improved compression standards such as H.265.
Managing many content formats across a rapidly evolving range of displays is a significant and growing challenge. Older content tends to not get upgraded to the newer formats, yet consumers expect all content to display correctly. As the number of content formats grows, the technology of video processing becomes increasingly complex.
Bridging the gap in color, contrast and resolution, while delivering the intent of the content creator, requires sophisticated algorithms and hardware circuits. However, frame-rate and motion incompatibilities require a significantly higher level of processing and more sophisticated algorithms in order to avoid creating new problems. Most TVs today include frame-rate conversion chips, but many reviewers complain about artifacts such as halos, breakup in the image and the so-called "soap opera effect". Unfortunately, without frame-rate conversion the video can appear to have judder and blur at levels that have increased substantially as a result of the improvements in contrast, color and detail.
In addition to judder, high-resolution displays suffer from softness and smearing in motion sequences called motion blur. There are numerous causes of motion blur. The materials used in constructing pixels on the display take a finite amount of time to transition from one state to another. If this time is too long, the image does not update swiftly and motion sequences seem to smear or blur. For example, Hollywood movies, TV shows and other premium content are usually authored at 24 frames per second or 24Hz. At this frame rate, the brain can easily notice the transition from one frame to the next. As the brain and eyes track objects in motion, they have to jump in discrete steps due to the low frame rate. This stop-start motion is perceived by the brain as motion blur, reducing the visible clarity and fidelity of objects in motion. Additionally, when a motion sequence is played on a digital display device, the new updated frame is drawn over the top of the still visible previous frame. This "hold" effect is perceived by the brain as blur.
Judder and motion blur artifacts are more noticeable on high contrast, wider gamut displays, regardless of screen size (for example, a 5-inch smartphone screen viewed from ten inches away appears to be the same size as a 60-inch large screen TV viewed from ten feet away). Pixelworks' advanced video display processing provides original equipment manufacturers ("OEMs") with solutions that avoid or minimize these artifacts and help realize the potential of their investment in high-resolution displays. We believe the most effective method for removing both judder and reducing blur is motion estimation/motion compensation ("MEMC") technology. This technology is based on complex mathematical algorithms that insert additional, interpolated frames to create a new, faster sequence of frames that has smooth, continuous motion. This technique works for virtually all types of panel technology.
Video Consumption Trend
With the advent of digital video, it has become possible to deliver video to consumers in an ever increasing number of ways. Traditional delivery mechanisms such as over the air broadcasts, cable, satellite, DVDs and Blu-ray are being supplemented with Internet streaming and download services. With these new video delivery options comes the ability to offer more services and improved quality.
According to recent studies by Cisco, video will constitute 82% of all global consumer Internet traffic by 2021 and global IP video traffic will grow nearly threefold and Internet video traffic will grow fourfold from 2016 to 2021. To put this into perspective, it would take one person over 5 million years to watch the total amount of video crossing global Internet networks each month in 2021. This rapid increase in video consumption is being driven by a variety of connected digital video devices and applications that allow consumers to easily create, share and consume video. In particular, mobile video consumption is rapidly expanding. The "always on" and ease of use of mobile devices are helping to make them the preferred choice as the "first screen" for many consumers.
5
As more content becomes increasingly available via the Internet, consumers have more choices for how and where they can enjoy content. According to DisplaySearch the number of TVs, tablets, smartphones and UltrabookTM devices being sold is expected to increase beyond 2.3 billion devices by 2018.
Mobile Video
There has been continued growth in the share of online video viewed by mobile devices. The Q3 2017 Global Video Index report from Ooyala showed more than 58% of all video views are now on mobile devices and that since Q3 2011, mobile video views have increased more than 4000%, outpacing the growing penetration rate of mobile devices globally as viewers spend more time watching video on the small screen.
Mobile display systems pose a number of unique challenges. Power is of primary importance, impacting form factor, cost and performance. As these systems have added more functionality, new features have had to compete for battery life, internal bandwidth and space. The addition of high-resolution displays has further increased the burden on these resources.
Using the same technology developed for large screen TVs is neither feasible nor desirable. The video display processing pipelines used in TVs consume many watts of power and would be unsuitable for battery powered systems. In TVs, the size constraints on electronics are significantly less stringent when compared to mobile systems. To furnish the mobile market with appropriate solutions, Pixelworks has taken a holistic, system-wide view and re-invented its video display processing technology to fit within the mobile constraints of battery life, bandwidth, form factor and performance. This approach has enabled us to create technology that meets the power and size requirements of mobile as well as offering additional benefits such as reducing the bandwidth burden of high-resolution video and freeing up more bandwidth for the CPU and GPU.
The mobile market today is primarily comprised of smartphones and tablets. Our technology addresses both of these markets.
• | Smartphones. Smartphones have become a popular choice for many consumers. CCS Insight estimates that almost 2 billion smartphones will be sold in 2019, accounting for 88% of all mobile phones sold in 2019. The resolution of smartphone displays is growing, while the color gamut and contrast is moving toward DCI-P3 and HDR. These improvements in displays actually exacerbate the quality issues of video playback, a growing problem as users increasingly use their smartphones as their primary form of video consumption. |
• | Tablets. The line between tablets and smartphones is becoming increasingly indistinct as more tablets are offering mobile connectivity and are now available in sizes similar to those of smartphones. Tablets offer broad appeal to consumers. With the display being the salient component of smartphones and tablets, and the rapidly increasing use of these devices for video consumption, we believe that the incorporation of video display processing is the next logical step. |
Digital Projection Market
Increasingly affordable price points are driving continued adoption of digital projectors in business and education, as well as among consumers. Technology improvements are helping to reduce the size and weight of projection devices while increasing their performance. Projector models range from larger units designed to be permanently installed in a conference hall or other venue, to ultra-portable devices weighing fewer than two pounds for maximum portability. According to PMA Research Limited, the worldwide front projector market shipped 8.7 million units in 2015 and is forecasted to reach 10.2 million units by 2019.
The feature set of projection systems differs from that of a typical large-screen flat panel display such as a TV. This is primarily because the projector is a sharing and collaboration device while the TV is designed for direct consumption of content.
The front projection market serves several different areas such as business, education and home theater. Business users employ multimedia projectors to display both still and video presentation materials from PCs and other sources. Requirements for the business market include portability, compatibility with multiple software and hardware applications, and features that ensure simple operation. In education environments ranging from elementary schools to university campuses, projectors help teachers integrate media-rich instruction into classrooms. Home theater projector systems can drive large-screen displays for content consumption where flat panel displays are either economically not viable or physically incompatible for use.
6
Consistent with the trends of other consumer products, digital projectors are increasingly incorporating networking capabilities that enable the sharing of video and other content among multiple devices. This, in turn, is enabling new use models for digital projection in both the education and business environments. For example, one teacher can present the same material simultaneously in multiple classrooms, and students in different classrooms can display and discuss their work. Such connectivity allows instant access to content and sharing of content, which promotes interaction and collaboration among dispersed groups. In the business setting, this connectivity enables teleconferencing and the seamless sharing of content for more effective meetings.
Video Delivery
With the acquisition of ViXS Systems Inc. in August 2017, Pixelworks has expanded both our market presence and product portfolio. The video industry continues to evolve and adopt new video standards such as High Efficiency Video Coding, 4K Ultra HD and HDR. The technical and processing demands of these standards are complex, and play directly into Pixelworks’ core competencies. Our technologies for video delivery are highly integrated, low power and provide high quality video processing, allowing seamless connectivity between devices while maintaining end-to-end content security.
The markets that we address via our video delivery segment fall into the following categories:
• | Consumer Products - Original Equipment Manufacturer ("OEMs") and Original Design Manufacturer ("ODMs") who design products for the consumer electronics segments. |
• | OTA - Over the Air applications for single, dual, and quad streaming requirements. End users who want to either “cut the cord” or supplement their service offerings. |
• | IP Streaming - network streaming devices capable of content portability, and support for your own screen (phone and tablet devices), deployed by service operators. |
Consumer Products
High resolution (UHD/4K), sustained bitrate decoding (100Mbit) and advanced video formats (HDR10, HDR10+) are key requirements for advanced personal video recorder (PVR) products sold in the Japanese market, where the end consumers rate video quality as a key acquisition criteria. This advanced PVR market in Japan is experiencing rapid growth as products move from 2K to UHD/4K formats. In addition, as the market moves to new broadcast technologies, like ADSB (Advanced Digital Satellite Broadcast) in Japan, and ATSC 3.0 in Korea and North America, there are further growth opportunities in this market segment.
OTA
There is no question that subscribers to video content in the home are making changes and demanding choices. While content is freely available, if it is distributed over an operator network, or even simply over IP, there is a monthly re-transmit fee that is charged to the consumer. As the number of video subscribers to services such as cable TV has been declining, the monthly re-transmit fee has been increasing. These fee increases are leading more consumers to ‘cut the cord’ and replace their TV subscriptions with over the top ("OTT") video services and free OTA broadcast television. As part of their OTA experience, consumers are starting to require multiple stream support of concurrent channels, so various devices can view different channels at the same time.
IP Streaming
Related to OTA applications, the service operators that want to provide their own choice to their video subscribers are taking advantage of Pixelworks’ IP Streaming applications. These re-use common platforms, and connect to the in-home infrastructure, either at the set top box level, or the Wi-Fi router level. This provides a centralized place where the management, and distribution of content can occur.
For service operators, the benefits are:
• | Customer retention |
• | Reduced use of network bandwidth for free OTA channels |
For consumers:
• | One menu that provides aggregation of Linear, Video-on-Demand, OTT, and OTA content |
• | Reduced monthly fees related to lower re-transmission fees |
7
Core Technologies and Products
We have developed a portfolio of advanced video algorithms and IP to address a broad range of challenges in digital video. We believe our technologies can significantly improve video quality and will become increasingly important as the popularity of video content consumption grows, and pixel densities, screen size and image quality increase. Our products are designed with a flexible architecture that allows us to combine algorithms and functional blocks of digital and mixed signal circuitry. Accordingly, our technologies can be implemented across multiple products, in combinations within single products and can be applied to a broad range of applications including smartphones, tablets, and projectors. The majority of our products include one or more technologies to provide optimal high-quality video display processing solutions to our customers, regardless of screen size.
Our core Video Display Processing technologies include:
• | Halo Free MEMC. Our proprietary Halo Free MEMC technology significantly improves the performance and viewing experience of any screen by addressing problems such as judder and motion blur. Unlike competitive solutions it also reduces halo effects that are a byproduct of MEMC. Halos are objectionable blurred regions that surround moving objects as the MEMC algorithms try to reconstruct missing image data caused by the concealing and revealing of objects as they pass over or behind one another. Removing halos dramatically improves image quality and is of particular importance on high-resolution displays where artifacts become more visible. |
• | Advanced Scaling. As display resolutions continue to increase, there is a need to convert lower resolution content to higher resolution in order to display content properly. With the latest wave of high-resolution displays, the quality and quantity demands of scaling have increased significantly. Artifacts become more noticeable on these types of displays as they distract from the realism effect. In addition, with the availability of high resolution content lagging behind the availability of high resolution displays, high-quality scaling is required to ensure high resolution displays do not suffer when compared to Full-HD displays of the same size. Our advanced scaling is designed to ensure that up-conversion of lower resolution content is of the highest quality in maintaining the fidelity of image. |
• | Mobile Video Display Processing. We have developed innovative video display processing solutions, that are designed to optimize power consumption for mobile devices. Beyond MEMC and advanced scaling, these mobile solutions provide the kind of improvements in color, contrast, sharpness and de-blur that are currently only found in high quality TVs today. Furthermore, this technology can reduce system power consumption and extend battery life. |
• | Transcoding/Decoding. Digital Delivery forms the bulk of not just video content, but all internet bandwidth today. However, throughout the entire chain from inception to consumption, there are multiple variations in bitrate, resolution, and codecs used for both audio and video. Transcoding is a fundamental technology used throughout this pipeline that leads to moving pictures viewed on TVs and mobile devices. The XCODE family of ASICs has enabled many devices within this pipeline, from the racks in some service providers all the way down to the home user watching broadcast OTA TV on a smartphone. XCODE technology provides solutions in Japan that deliver UHD Blu-ray PVRs with capability of transcoding recorded content suitable for viewing on smartphones. The technology supports today’s broadcast standards, such as ATSC 1.0, DVB/T/T2/S/S2, and ISDB/T/S, and is scalable to support upcoming broadcast standards such as ADSB and ATSC 3.0. |
• | SDR to HDR conversion. UHD video has standardized on a technology known as HDR to deliver higher dynamic range content. This has resulted in several competing HDR deployments like HDR10 and HLG and HDR+ with support by multiple industry giants. Pixelworks HDR conversion technology can not only convert between SDR (Standard Dynamic Range) and HDR10, it can also convert between HDR10, HLG and HDR+ solving an interconnectivity problem between content formatted in one HDR format to Display devices that supports a different HDR standard. |
Our product development strategy is to leverage our expertise in video display processing to address the evolving needs of the digital projection, mobile and video delivery markets. We plan to continue to focus our development resources to maintain position in these markets by providing leading edge solutions for the advanced digital projection and video delivery markets and to enhance our video processing solutions for mobile markets. Additionally, we plan to leverage our research and development investment into products that address high-value markets, such as mobile and OTA, where our innovative proprietary technology provides differentiation and system power saving benefits. We deliver our technology in a variety of offerings, which take the form of single-purpose chips, highly integrated SoCs that incorporate specialized software, full solutions incorporating software and other tools and IP cores that allow our technology to be incorporated into third party solutions.
8
Our primary video display processor product categories include the following:
• | ImageProcessor ICs. Our ImageProcessor ICs include embedded microprocessors, digital signal processing technology and software that control the operations and signal processing within high-end display systems. ImageProcessor ICs were our first product offerings and continue to comprise the majority of our business. We have continued to refine the architectures for optimal performance, manufacturing our products on process technologies that align with our customers’ requirements. Additionally, we provide a software development environment and operating system that enables our customers to more quickly develop and customize the "look and feel" of their products. |
• | Video Co-Processor ICs. Products in this category work with an image processor to post-process video signals to enhance the performance or feature set of the overall video solution (for example, by significantly reducing judder and motion blur). Our Video Co-Processor ICs can be used with our ImageProcessor ICs or with image processing solutions from other manufacturers, and in most cases can be incorporated without assistance from the supplier of the base image processor. This flexibility enables manufacturers to augment their existing or new designs to enhance their video display products. |
• | Transcoder ICs. Our Transcoder ICs include embedded microprocessors, digital signal processing technology and software that control the operations and signal processing for converting multiple bitrates, resolutions and codecs to provide bandwidth efficient video transmissions based on industry standard protocols. Pixelworks’ transcoder technology allows for single, dual and even quad streaming solutions for OTA products. Like our other ICs, we have continued to refine the architectures for optimal performance, manufacturing our products on process technologies that align with our customers’ requirements. Additionally, we provide a software development environment that enables our customers to more quickly develop and customize their products. |
Customers, Sales and Marketing
The key focus of our global sales and marketing strategy is to achieve design wins with industry leading branded manufacturers in our target markets and to continue building strong customer relationships. Once a design win has been achieved, sales and marketing efforts are focused on building long-term mutually beneficial business relationships with our customers by providing superior technology and reducing their costs, which complements our customers’ product development objectives and meets their expectations for price-performance and time to market. Marketing efforts are focused on building market-leading brand awareness and preference for our solutions.
We utilize direct sales and marketing resources in China, Japan, Korea, Taiwan, and the U.S. as well as indirect resources in several regions. In addition to sales and marketing representatives, we have field application engineers who provide technical expertise and assistance to manufacturing customers on final product development.
Our global distribution channel is multi-tiered and involves both direct and indirect distribution channels, as described below:
• | Distributors. Distributors are resellers in local markets who provide engineering support and stock our semiconductors in direct relation to specific manufacturing customer orders. Our distributors often have valuable and established relationships with our end customers, and in certain countries it is customary to sell to distributors. While distributor payment to us is not dependent upon the distributor’s ability to resell the product or to collect from the end customer, our distributors may provide longer payment terms to end customers than those we would offer. Sales to distributors accounted for 47%, 43% and 48% of revenue in 2017, 2016 and 2015, respectively. |
Our largest distributor, Tokyo Electron Device Ltd. ("TED"), is located in Japan. TED represented more than 10% of revenue in each of 2017, 2016 and 2015, and accounted for more than 10% of accounts receivable as of December 31, 2017. No other distributor accounted for more than 10% of revenue in 2017, 2016 or 2015.
We also have distributor relationships in China, Europe, Korea, Southeast Asia, Taiwan and the U.S.
• | Direct Relationships. We have established direct relationships with companies that manufacture high-end display systems. Some of our direct relationships are supported by commission-based manufacturers’ representatives, who are independent sales agents that represent us in local markets and provide engineering support but do not carry inventory. Revenue through direct relationships accounted for 53%, 57% and 52% of total revenue in 2017, 2016 and 2015, respectively. |
9
We have direct relationships with companies falling into the following three classifications:
• | Integrators. Integrators are OEMs who build display devices based on specifications provided by branded suppliers. |
• | Branded Manufacturers. Branded manufacturers are globally recognized manufacturers who develop display device specifications, and manufacture, market and distribute display devices either directly or through resellers to end-users. |
• | Branded Suppliers. Branded suppliers are globally recognized suppliers who develop display device specifications and then source them from integrators, typically in Asia, and distribute them either directly or through resellers to end-users. |
Revenue attributable to our top five end customers together represented 79%, 82% and 83% of revenue in 2017, 2016 and 2015, respectively. End customers include customers who purchase directly from us as well as customers who purchase products indirectly through distributors. Sales to Seiko Epson Corporation represented more than 10% of revenue in each of 2017, 2016 and 2015, and accounted for more than 10% of accounts receivable as of December 31, 2017 and 2016. Sales to Hitachi Ltd. represented more than 10% of revenue in 2015. No other end customer accounted for more than 10% of revenue in 2017, 2016 or 2015.
Seasonality
Our business is subject to seasonality related to the markets we serve and the location of our customers. We have historically experienced higher revenue from the digital projector market in the third quarter of the year, and lower revenue in the first quarter of the year, as our Japanese customers reduce inventories in anticipation of their March 31 fiscal year end.
Geographic Distribution of Sales
Sales outside the U.S. accounted for approximately 98%, 100% and 100% of revenue in 2017, 2016 and 2015, respectively.
Financial information regarding our domestic and foreign operations is presented in "Note 14: Segment Information" in Part II, Item 8 of this Annual Report on Form 10-K.
Backlog
Our sales are made pursuant to customer purchase orders for delivery of standard products. The volume of product actually purchased by our customers, as well as shipment schedules, are subject to frequent revisions that reflect changes in both the customers’ needs and product availability. With the exception of recent end-of-life orders, our entire order backlog is cancelable, with a portion subject to cancellation fees. In light of industry practice and our own experience, we do not believe that backlog as of any particular date is indicative of future results.
Competition
The semiconductor industry is intensely competitive. Further, the markets for higher performance display and projection devices, including the markets for mobile devices, digital projectors and other applications demanding high quality video, are characterized by rapid technological change, evolving industry standards, compressed product life cycles and declining average selling prices. We believe the principal competitive factors in our markets include product performance, time to market, cost, functional versatility provided by software, customer relationships and reputation, patented innovative designs, levels of product integration, compliance with industry standards and system design cost. We believe we compete favorably with respect to these factors.
Our current products face competition from specialized display controller developers and in-house display controller ICs designed by our customers and potential customers. Additionally, new alternative display processing technologies and industry standards may emerge that compete with technologies we offer.
10
We also compete with specialized and diversified electronics and semiconductor companies that offer display processors or scaling components including: Actions Microelectronics Co., Ltd., ARM Holdings PLC, Dolby Laboratories, Inc., Hisilicon Technologies Co., Ltd., i-Chips Technologies Inc., Lattice Semiconductor Corporation, MediaTek Inc., Novatech Co., Ltd. Inc., NVIDIA Corporation, QUALCOMM Incorporated, Renesas Electronics America, Realtek Semiconductor Corp., Solomon Systech (International) Ltd., Spreadtrum Communications, Inc, STMicroelectronics N.V., Sunplus Technology Co., Ltd., Synaptics Incorporated, Texas Instruments Incorporated, and other companies. Potential and current competitors may include diversified semiconductor manufacturers and the semiconductor divisions or affiliates of some of our customers, including: Broadcom Corporation, LG Electronics, Inc., Matsushita Electric Industrial Co., Ltd., MegaChips Corporation, Mitsubishi Digital Electronics America, Inc., NEC Corporation, Samsung Electronics Co., Ltd., Socionext, Inc., ON Semiconductor Corporation, Seiko Epson Corporation, Sharp Electronics Corporation, Sony Corporation, and Toshiba America, Inc. In addition, start-up companies may seek to compete in our markets.
Research and Development
Our research and development efforts are focused on the development of our solutions for the mobile device, digital projector and video delivery markets. Our development efforts are focused on pursuing higher levels of video performance, integration and new features in order to provide our customers with solutions that enable them to introduce market leading products and help lower final systems costs.
We have invested, and expect to continue to invest, significant resources in research and development activities. Our research and development expenses were $21.4 million, $19.0 million and $24.6 million in 2017, 2016 and 2015, respectively. During 2017, we received a reimbursement related to a co-development arrangement with a customer for costs incurred in connection with our development of an integrated circuit ("IC") product. As a result of the reimbursement, our overall research and development expense was reduced by $4.0 million in 2017. There were no reductions to research and development expense related to co-development arrangements in 2016 and 2015.
Manufacturing
Within the semiconductor industry we are known as a "fabless" company, meaning that we do not manufacture the semiconductors that we design and develop, but instead contract with a limited number of foundries and assembly and test vendors to produce all of our wafers and for completion of finished products. The fabless approach allows us to concentrate our resources on product design and development where we believe we have greater competitive advantages.
See "Risk Factors" in Part I, Item 1A of this Annual Report on Form 10-K for information on risks related to our manufacturing strategy and processes.
Intellectual Property
We rely on a combination of nondisclosure agreements and patent, copyright, trademark and trade secret laws to protect the algorithms, design and architecture of our technology. As of December 31, 2017, we held 536 patents and have 100 patent applications pending, compared to 148 patents and 20 patent applications pending as of December 31, 2016. These patents relate generally to improvements in the visual display of digital image data including, but not limited to, improvements in image scaling, image correction, automatic image optimization and video signal processing for digital displays. Our U.S. and foreign patents are generally enforceable for 20 years from the date they were filed. Accordingly, our issued patents have from approximately 1 to 18 years remaining in their respective term, depending on their filing dates. We believe that the remaining term of our patents is adequate relative to the expected lives of our related products.
We intend to seek patent protection for other significant technologies that we have already developed and expect to seek patent protection for future products and technologies as necessary. Patents may not be issued as a result of any pending applications and any claims allowed under issued patents may be insufficiently broad to protect our technology. Existing or future patents may be invalidated, diluted, circumvented, challenged or licensed to others. Furthermore, the laws of certain foreign countries in which our products are or may be developed, manufactured or sold, including various countries in Asia, may not protect our products or intellectual property rights in the same manner and to the same extent as do the laws of the U.S. and, thus, make the possibility of piracy of our technology and products more likely in these countries.
11
The semiconductor industry is characterized by vigorous protection of intellectual property rights, which have resulted in significant and often protracted and expensive litigation. We, our customers or our foundries from time to time may be notified of claims that we may be infringing patents or other intellectual property rights owned by third parties. Litigation by or against us relating to patent infringement or other intellectual property matters could result in significant expense to us and divert the efforts of our technical and management personnel, whether or not such litigation results in a determination favorable to us. In the event of an adverse result in any such litigation, we could be required to pay substantial damages, cease the manufacture, use and sale of infringing products, expend significant resources to develop non-infringing technology, discontinue the use of certain processes or obtain licenses to the infringing technology. We may not be able to settle any alleged patent infringement claim through a cross-licensing arrangement. In the event any third party made a valid claim against us, our customers or our foundries, and a license was not made available to us on terms that are acceptable to us or at all, we would be adversely affected.
See "Risk Factors" in Part I, Item 1A, and "Note 11: Commitments and Contingencies" in Part II, Item 8 of this Annual Report on Form 10-K for information on various risks related to intellectual property.
Environmental Matters
Environmental laws and regulations are complex, change frequently and have tended to become more stringent over time. We have incurred, and may continue to incur, significant expenditures to comply with these laws and regulations and we may incur additional capital expenditures and asset impairments to ensure that our products and our vendors’ products are in compliance with these regulations. We would be subject to significant penalties for failure to comply with these laws and regulations.
See "Risk Factors" in Part I, Item 1A of this Annual Report on Form 10-K for information on various environmental risks.
Employees
As of December 31, 2017, we had a total of 215 employees, all of which were full-time, compared to 166 employees as of December 31, 2016.
Corporate Information
Pixelworks was founded in 1997 and is incorporated under the laws of the state of Oregon. Our stock is traded on the Nasdaq Global Market under the symbol "PXLW".
Availability of Securities and Exchange Commission Filings
We make available through our website our annual report on Form 10-K, quarterly reports on Form 10-Q, current reports on Form 8-K and amendments to those reports and any filings filed or furnished pursuant to Section 13(a) or 15(d) of the Exchange Act of 1934, free of charge as soon as reasonably practicable after we electronically file or furnish such material with the Securities and Exchange Commission ("SEC"). Our Internet address is www.pixelworks.com. The content on, or that can be accessed through our website is not incorporated by reference into this filing. Our committee charters and code of ethics are also available free of charge on our website.
The SEC maintains an Internet site at http://www.sec.gov that contains our Annual Report on Form 10-K, quarterly reports on Form 10-Q, current reports on Form 8-K and amendments to those reports, if any, or other filings filed or furnished pursuant to Section 13(a) or 15(d) of the Exchange Act, proxy and information statements. All reports that we file with the SEC may be read and copied at the SEC’s Public Reference Room at 100 F Street NE, Room 1580, Washington, DC, 20549. Information about the operation of the Public Reference Room can be obtained by calling the SEC at 1-800-SEC-0330.
12
Item 1A. | Risk Factors. |
The following risks could materially and adversely affect our business, financial condition, and results of operations, and the trading price of our common stock could decline. These risk factors do not identify all of the risks that we face. Our business operations could also be affected by factors that we currently consider to be immaterial or that are unknown to us at the present time. Investors should also refer to the other information contained or incorporated by reference in this Annual Report on Form 10-K for the year ended December 31, 2017, including our consolidated financial statements and related notes, and our other filings made from time to time with the Securities and Exchange Commission ("SEC").
Company Specific Risks
If we fail to meet the evolving needs of our markets, identify new products, services or technologies, or successfully compete in our target markets, our revenue and financial results will be adversely impacted.
Pixelworks’ designs, develops and markets visual processing and advanced media processing solutions in the mobile video, digital projection and video delivery markets. Our success depends to a significant extent on our ability to meet the evolving needs of these markets and to enhance our existing products, solutions and technologies. In addition, our success depends on our ability to identify emerging industry trends and to develop new products, solutions and technologies. Our existing markets and products and new markets and products may require a considerable investment of technical, financial, compliance, sales and marketing resources. We are currently devoting significant resources to the development of technologies and business offerings in markets where our operating history is less extensive, such as the video delivery market where our acquisition of ViXS has allowed us to expand our market presence and product portfolio.
We cannot assure you that our strategic direction will result in innovative products and technologies that provide value to our customers and partners. If we fail to anticipate the changing needs of our target markets and emerging technology trends, or adapt that strategy as market conditions evolve, in a timely manner to exploit potential market opportunities our business will be harmed. In addition, if demand for products and solutions from these markets is below our expectations, if we fail to achieve consumer or market acceptance of them or if we are not able to develop these products and solutions in a cost effective or efficient manner, we may not realize benefits from our strategy.
Our target markets remain extremely competitive, and we expect competition to intensify as current competitors expand their product and/or service offerings, industry standards continue to evolve and new competitors enter these markets. If we are unable to successfully compete in our target markets, demand for our products, solutions and technologies could decrease, which would cause our revenue to decline and our financial results to suffer.
Our product strategy, which is targeted at markets demanding superior video and digital image quality as well as efficient video delivery, may not address the demands of our target customers and may not lead to increased revenue in a timely manner or at all, which could materially adversely affect our results of operations and limit our ability to grow.
We have adopted a product strategy that focuses on our core competencies in visual display processing and delivering high levels of video and digital image quality. With this strategy, we continue to make further investments in the development of our image processor architecture for the digital projector market, with particular focus on adding increased performance and functionality. For the mobile device market, our strategy focuses on implementing our intellectual property ("IP") to improve the video performance of our customers’ image processors through the use of our MotionEngine® advanced video co-processor integrated circuits. This strategy is designed to address the needs of the high-resolution and high-quality segment of these markets. Such markets may not develop or may take longer to develop than we expect. We cannot assure you that the products we are developing will adequately address the demands of our target customers, or that we will be able to produce our new products at costs that enable us to price these products competitively.
13
Achieving design wins involves lengthy competitive selection processes that require us to incur significant expenditures prior to generating any revenue or without any guarantee of any revenue related to this business. If we fail to generate revenue after incurring substantial expenses to develop our products, our business and operating results would suffer.
We must achieve "design wins," that enable us to sell our semiconductor solutions for use in our customers’ products. These competitive selection processes typically are lengthy and can require us to incur significant research and development expenditures and dedicate scarce engineering resources in pursuit of a single customer opportunity. We may not achieve a design win and may never generate any revenue despite incurring significant research and development expenditures. This could cause us to lose revenue and require us to write off obsolete inventory, and could weaken our position in future competitive selection processes.
Even if our product strategy is properly targeted, we cannot assure you that the products we are developing will lead to an increase in revenue from new design wins. To achieve design wins, we must design and deliver cost-effective, innovative and integrated semiconductors that overcome the significant costs associated with qualifying a new supplier and which make developers reluctant to change component sources. Additionally, potential developers may be unwilling to select our products due to concerns over our financial strength. Further, design wins do not necessarily result in developers ordering large volumes of our products. Developers can choose at any time to discontinue using our products in their designs or product development efforts. A design win is not a binding commitment by a developer to purchase our products, but rather a decision by a developer to use our products in its design process. Even if our products are chosen to be incorporated into a developer’s products, we may still not realize significant revenue from the developer if its products are not commercially successful or it chooses to qualify, or incorporate the products, of a second source. Additionally, even if our product strategy is successful at achieving design wins and increasing our revenue, we may continue to incur operating losses due to the significant research and development costs that are required to develop competitive products for the digital projection market and mobile market.
System security and data protection breaches, as well as cyber-attacks, could disrupt our operations, reduce our expected revenue and increase our expenses, which could adversely affect our stock price and damage our reputation.
Security breaches, computer malware and cyber-attacks have become more prevalent and sophisticated in recent years. These attacks have occurred on our systems in the past and are expected to occur in the future. Experienced computer programmers, hackers and employees may be able to penetrate our security controls and misappropriate or compromise our confidential information, or that of our employees or third parties. These attacks may create system disruptions or cause shutdowns. For portions of our IT infrastructure, including business management and communication software products, we rely on products and services provided by third parties. These providers may also experience breaches and attacks to their products which may impact our systems. Data security breaches may also result from non-technical means, such as actions by an employee with access to our systems.
Actual or perceived breaches of our security measures or the accidental loss, inadvertent disclosure or unapproved dissemination of proprietary information or sensitive or confidential data about us, our partners, our customers or third parties could expose the parties affected to a risk of loss, or misuse of this information, resulting in litigation and potential liability, damage to our brand and reputation or other harm to our business. Our efforts to prevent and overcome these challenges could increase our expenses and may not be successful. We may experience interruptions, delays, cessation of service and loss of existing or potential customers. Such disruptions could adversely impact our ability to fulfill orders and interrupt other critical functions. Delayed sales, lower margins or lost customers as a result of these disruptions could adversely affect our financial results, stock price and reputation.
If we fail to retain or attract the specialized technical and management personnel required to successfully operate our business, it could harm our business and may result in lost sales and diversion of management resources.
Our success depends on the continued services of our executive officers and other key management, engineering, and sales and marketing personnel and on our ability to continue to attract, retain and motivate qualified personnel. Competition for skilled engineers and management personnel is intense within our industry, and we may not be successful in hiring and retaining qualified individuals. For example, we have experienced, and may continue to experience, difficulty and increased compensation expense in order to hire and retain qualified engineering personnel in our Shanghai design center. The loss of, or inability to hire, key personnel could limit our ability to develop new products and adapt existing products to our customers’ requirements, and may result in lost sales and a diversion of management resources. Any transition in our senior management team may involve a diversion of resources and management attention, be disruptive to our daily operations or impact public or market perception, any of which could have a negative impact on our business or stock price.
14
We have significantly fewer financial resources than most of our competitors which limits our ability to implement new products or enhancements to our current products and may require us to implement additional future restructuring plans, which in turn could adversely affect our future sales and financial condition.
Financial resource constraints could limit our ability to execute our product strategy or require us to implement additional restructuring plans, particularly if we are unable to generate sufficient cash from operations or obtain additional sources of financing. Any future restructuring actions may slow our development of new or enhanced products by limiting our research and development and engineering activities. Our cash balances are also lower than those of our competitors, which may limit our ability to develop competitive new products on a timely basis or at all. If we are unable to successfully introduce new or enhanced products, our sales, operating results and financial condition will be adversely affected.
If we are not profitable in the future, we may be unable to continue our operations.
Although we recorded net income for the fiscal year ended December 31, 2010, we have otherwise incurred operating losses each fiscal year since 2004 and have an accumulated deficit of $379.5 million as of December 31, 2017. Additionally, while we recorded net income for the three months ending March 31, 2017 and the six months ending June 30, 2017, we have operating losses for the 9 months ending September 30, 2017 and the twelve months ended December 31, 2017. If and when we achieve profitability depends upon a number of factors, including our ability to develop and market innovative products, accurately estimate inventory needs, contract effectively for manufacturing capacity and maintain sufficient funds to finance our activities. We cannot assure our investors that we will ever achieve annual profitability, or that we can maintain profitability if achieved. If we are not profitable in the future, we may be unable to continue our operations.
A significant amount of our revenue comes from a limited number of customers and distributors and from time to time we may enter into exclusive deals with customers, exposing us to increased credit risk and subjecting our cash flow to the risk that any of our customers or distributors could decrease or cancel its orders.
The display manufacturing market is highly concentrated and we are, and will continue to be, dependent on a limited number of customers and distributors for a substantial portion of our revenue. Sales to our top distributor represented 27%, 24% and 31% of revenue for the years ended December 31, 2017, 2016, and 2015, respectively. If any of our distributors ceases to do business with us, it may be difficult for us to find adequate replacements, and even if we do, it may take some time. The loss of any of our top distributors could negatively affect our results of operations. Additionally, revenue attributable to our top five end customers represented 79%, 82% and 83% of revenue for the years ended December 31, 2017, 2016, and 2015, respectively. As of December 31, 2017, we had two accounts that each represented 10% or more of accounts receivable. As of December 31, 2016 we had one account that represented 10% or more of accounts receivable. All of the orders included in our backlog are cancelable. A reduction, delay or cancellation of orders from one or more of our significant customers, or a decision by one or more of our significant customers to select products manufactured by a competitor or to use its own internally-developed semiconductors, would significantly and negatively impact our revenue. Further, the concentration of our accounts receivable with a limited number of customers increases our credit risk. The failure of these customers to pay their balances, or any customer to pay future outstanding balances, would result in an operating expense and reduce our cash flows.
We do not have long-term purchase commitments from our customers and if our customers cancel or change their purchase commitments, our revenue and operating results could suffer.
Substantially all of our sales to date have been made on a purchase order basis. We do not have any long-term commitments with any of our customers. As a result, our customers may cancel, change or delay product purchase commitments with little or no notice to us and without penalty. This, in turn, could cause our revenue to decline and materially and adversely affect our results of operations.
Our revenue and operating results can fluctuate from period to period, which could cause our share price to decline.
Our revenue and operating results have fluctuated in the past and may fluctuate from period to period in the future due to a variety of factors, many of which are beyond our control. Factors that may contribute to these fluctuations include those described in this "Risk Factors" section of this report, such as the timing, changes in or cancellation of orders by customers, market acceptance of our products and our customers’ products and the timing and extent of product development costs. Additionally, our business is subject to seasonality related to the markets we serve and the location of our customers. For example, we have historically experienced higher revenue from the digital projector market in the third quarter of the year, and lower revenue in the first quarter of the year. As a result of these and other factors, the results of any prior quarterly or annual periods should not be relied upon as indications of our future revenue or operating performance. Fluctuations in our revenue and operating results could cause our share price to decline.
15
We may not be able to borrow funds under our credit facility or secure future financing which could affect our ability to fund fluctuations in our working capital requirements.
In December 2010, we entered into a Loan and Security Agreement with Silicon Valley Bank, which was later amended on December 14, 2012, December 4, 2013, December 18, 2015, December 15, 2016, July 21, 2017 and December 21, 2017 (as amended, the "Revolving Loan Agreement"). The Revolving Loan Agreement provides a secured working capital-based revolving line of credit (the "Revolving Line") in an aggregate amount of up to the lesser of (i) $10.0 million or (ii) $1.0 million plus 80% of eligible domestic accounts receivable and certain foreign accounts receivable. The Revolving Line has a maturity date of December 28, 2018. We view this line of credit as a source of available liquidity to fund fluctuations in our working capital requirements, however all credit extensions are subject to the bank’s sole discretion. If we experience an increase in order activity from our customers, our cash balance may decrease due to the need to purchase inventories to fulfill those orders. If this occurs, we may need to draw on this facility in order to maintain our liquidity.
This facility contains various conditions, covenants and representations with which we must be in compliance in order to borrow funds. We cannot assure you that we will be in compliance with these conditions, covenants and representations when we may need to borrow funds under this facility, nor can we assure you that the bank will consent to such borrowings, in which case we may need to seek alternative sources of funding, which may not be available quickly or which may be available only on less favorable terms. Our inability to raise the necessary funding in the event we need it could negatively affect our business. In addition, the amount available to us under this facility depends in part on our accounts receivable balance which could decrease due to a decrease in revenue.
This facility expires on December 28, 2018, after which time we may need to secure new financing to continue funding fluctuations in our working capital requirements. We cannot assure you that we will be able to secure new financing in a timely manner or at all, or secure financing on terms that are acceptable to us.
If we are unable to generate sufficient cash from operations and are forced to seek additional financing alternatives, or in the event we acquire or make an investment in companies that complement our business, our working capital may be adversely affected and our shareholders may experience dilution or our operations may be impaired.
We may be unable to generate or sustain positive cash flow from operating activities and would then be required to use existing cash and cash equivalents to support our working capital and other cash requirements. Additionally, from time to time, we may evaluate acquisitions of, or investments in, businesses, products or technologies that complement our business. For example, on August 2, 2017 we completed the acquisition of ViXS and issued approximately 3.7 million shares of our common stock as consideration. Any additional transactions, if consummated, may consume a material portion of our working capital or require the issuance of equity securities that may result in dilution to existing shareholders. If additional funds are required to support our working capital requirements, acquisitions or other purposes, we may seek to raise funds through debt and equity financing or from other sources. If we raise additional funds through the issuance of equity or convertible debt securities, the percentage ownership of our shareholders could be significantly diluted, and these newly-issued securities may have rights, preferences or privileges senior to those of existing shareholders. If we raise additional funds by obtaining loans from third parties, the terms of those financing arrangements may include negative covenants or other restrictions on our business that could impair our operating flexibility, and would also require us to incur interest expense. We can provide no assurance that additional financing will be available at all or, if available, that we would be able to obtain additional financing on terms favorable to us.
We license our intellectual property, which exposes us to risks of infringement or misappropriation, and may cause fluctuations in our operating results.
We have licensed certain of our intellectual properties to third parties and may enter into additional license arrangements in the future. We cannot assure you, however, that others will be interested in licensing our intellectual property on commercially favorable terms or at all. We also cannot ensure that licensees will honor agreed-upon market restrictions, not infringe upon or misappropriate our intellectual property or maintain the confidentiality of our proprietary information.
16
IP license agreements are complex and earning and recognizing revenue under these agreements depends upon many factors, including completion of milestones, allocation of values to delivered items and customer acceptances. Many of these factors require significant judgments. Also, generating revenue from these arrangements is a lengthy and complex process that may last beyond the period in which efforts begin and, once an agreement is in place, the timing of revenue recognition may depend on events such as customer acceptance of deliverables, achievement of milestones, our ability to track and report progress on contracts, customer commercialization of the licensed technology and other factors, any or all of which may or may not be achieved. The accounting rules associated with recognizing revenue from these transactions are complex and subject to interpretation. Due to these factors, the amount of licensing revenue recognized in any period, if any, and our results of operations, may differ significantly from our expectations.
Finally, because licensing revenue typically has a higher margin compared to product sales, licensing revenue can have a disproportionate impact on our gross profit and results of operations. There is no assurance that we will be able to maintain a consistent level of licensing revenue or mix of licensing revenue and revenue from product sales, which could result in wide fluctuations in our results of operations from period to period, making it difficult to accurately measure the performance of our business.
Our net operating loss carryforwards may be limited or they may expire before utilization.
As of December 31, 2017, we had federal, state and foreign net operating loss carryforwards of approximately $215.3 million, $11.4 million, and $38.6 million respectively, which expire between 2019 and 2037. These net operating loss carryforwards may be used to offset future taxable income and thereby reduce our income taxes otherwise payable. However, we cannot assure you that we will have taxable income in the future before all or a portion of these net operating loss carryforwards expire. Additionally, our federal net operating losses may be limited by Section 382 of the Internal Revenue Code of 1986, as amended (the "Code"), which imposes an annual limit on the ability of a corporation that undergoes an "ownership change" to use its net operating loss carryforwards to reduce its tax liability. An ownership change is generally defined as a greater than 50% increase in equity ownership by 5% shareholders in any three-year period. In the event of certain changes in our shareholder base, we may at some time in the future experience an "ownership change" and the use of our federal net operating loss carryforwards may be limited. In addition, the Tax Cuts and Jobs Act (the "TCJA"), limits the deduction for net operating loss carryforwards to 80 percent of taxable income for losses arising in taxable years beginning after December 31, 2017.
We face a number of risks as a result of the concentration of our operations and customers in Asia.
Many of our customers are located in Japan, China, Korea, or Taiwan. Sales outside the U.S. accounted for approximately 98% , 100% and 100% of revenue for the years ended December 31, 2017, 2016, and 2015, respectively. We anticipate that sales outside the U.S. will continue to account for a substantial portion of our revenue in future periods. In addition, customers who incorporate our products into their products sell a substantial portion of their products outside of the U.S. All of our products are also manufactured outside of the U.S. and most of our current manufacturers are located in China or Taiwan. Furthermore, most of our employees are located in China, Japan and Taiwan. Our Asian operations require significant management attention and resources, and we are subject to many risks associated with operations in Asia, including, but not limited to:
• | difficulties in managing international distributors and manufacturers due to varying time zones, languages and business customs; |
• | compliance with U.S. laws affecting operations outside of the U.S., such as the Foreign Corrupt Practices Act; |
• | reduced or limited protection of our IP, particularly in software, which is more prone to design piracy; |
• | difficulties in collecting outstanding accounts receivable balances; |
• | changes in tax rates, tax laws and the interpretation of those laws; |
• | difficulties regarding timing and availability of export and import licenses; |
• | ensuring that we obtain complete and accurate information from our Asian operations to make proper disclosures in the United States; |
• | political and economic instability; |
• | difficulties in maintaining sales representatives outside of the U.S. that are knowledgeable about our industry and products; |
• | changes in the regulatory environment in China, Japan, Taiwan and Korea that may significantly impact purchases of our products by our customers or our customers’ sales of their own products; |
17
• | outbreaks of health epidemics in China or other parts of Asia; |
• | imposition of new tariffs, quotas, trade barriers and similar trade restrictions on our sales; |
• | varying employment and labor laws; and |
• | greater vulnerability to infrastructure and labor disruptions than in established markets. |
Any of these factors could require a disproportionate share of management’s attention, result in increased costs or decreased revenues, and could materially affect our product sales, financial condition and results of operations.
Our operations in Asia expose us to heightened risks due to natural disasters.
The risk of natural disasters in the Pacific Rim region is significant. Natural disasters in countries where our manufacturers or customers are located could result in disruption of our manufacturers’ and customers’ operations, resulting in significant delays in shipment of, or significant reductions in orders for, our products. There can be no assurance that we can locate additional manufacturing capacity or markets on favorable terms, or find new customers, in a timely manner, if at all. Natural disasters in this region could also result in:
• | reduced end user demand due to the economic impact of any natural disaster; |
• | a disruption to the global supply chain for products manufactured in areas affected by natural disasters that are included in products purchased either by us or by our customers; |
• | an increase in the cost of products that we purchase due to reduced supply; and |
• | other unforeseen impacts as a result of the uncertainty resulting from a natural disaster. |
We face additional risks associated with our operations in China and our results of operations and financial position may
be harmed by changes in China's political, economic or social conditions.
We have, and expect to continue to have, significant operations in China. The economy of China differs from the economies of many countries in important respects such as structure, government involvement, level of development, growth rate, capital reinvestment, allocation of resources, self-sufficiency, rate of inflation, foreign currency flows and balance of payments position, among others. There can be no assurance that China’s economic policies will be consistent or effective and our results of operations and financial position may be harmed by changes in China’s political, economic or social conditions.
Additionally, our Chinese subsidiary is considered a foreign-invested enterprise and is subject to laws and regulations applicable to foreign investment in China and, in particular, laws applicable to foreign-invested enterprises. For example, China's government imposes control over the convertibility of RMB into foreign currencies, which can cause difficulties converting cash held in RMB to other currencies. While the overall effect of legislation over the past two decades has significantly enhanced the protections afforded to various foreign investments in China, China has not developed a fully integrated legal system, and recently enacted laws and regulations may not sufficiently cover all aspects of economic activities in China. Because these laws and regulations are relatively new, and published court decisions are limited and nonbinding in nature, the interpretation and enforcement of these laws and regulations involve uncertainties. In addition, China's legal system is based in part on government policies and internal rules, some of which are not published on a timely basis or at all, which may have a retroactive effect. As a result, we may not be aware of our violation of these policies and rules until after the violation occurs. Any administrative and court proceedings in China may be protracted, resulting in substantial costs and diversion of resources and management attention. However, since Chinese administrative and court authorities have significant discretion in interpreting and implementing statutory and contractual terms, it may be more difficult to evaluate the outcome of administrative and court proceedings. These uncertainties may also impede our ability to enforce the contracts entered into by our Chinese subsidiary and could materially and adversely affect our business and results of operations.
Our international operations expose us to risks resulting from the fluctuations of foreign currencies.
We are exposed to risks resulting from the fluctuations of foreign currencies, primarily those of Japan, Taiwan, Korea and China. Additionally, with the acquisition of ViXS, we will be exposed to risks resulting from fluctuations in the Canadian Dollar. We sell our products to OEMs that incorporate our products into other products that they sell outside of the U.S. While sales of our products to OEMs are denominated in U.S. dollars, the products sold by OEMs are denominated in foreign currencies. Accordingly, any strengthening of the U.S. dollar against these foreign currencies will increase the foreign currency price equivalent of our products, which could lead to a change in the competitive nature of these products in the marketplace. This, in turn, could lead to a reduction in revenue.
18
In addition, a portion of our operating expenses, such as employee salaries and foreign income taxes, are denominated in foreign currencies. Accordingly, our operating results are affected by changes in the exchange rate between the U.S. dollar and those currencies. Any future strengthening of those currencies against the U.S. dollar will negatively impact our operating results by increasing our operating expenses as measured in U.S. dollars.
We may engage in financial hedging techniques in the future as part of a strategy to address potential foreign currency exchange rate fluctuations. These hedging techniques, however, may not be successful at reducing our exposure to foreign currency exchange rate fluctuations and may increase costs and administrative complexity.
Failure to comply with anti-bribery, anti-corruption, and anti-money laundering laws could subject us to penalties and other adverse consequences.
We are subject to the Foreign Corrupt Practices Act (FCPA) and other anti-corruption, anti-bribery and anti-money laundering laws in various jurisdictions. From time to time, we may leverage third parties to help conduct our businesses abroad. We and our third-party intermediaries may have direct or indirect interactions with officials and employees of government agencies or state-owned or affiliated entities and may be held liable for the corrupt or other illegal activities of these third-party business partners and intermediaries, our employees, representatives, contractors, channel partners, and agents, even if we do not explicitly authorize such activities. While we have policies and procedures to address compliance with such laws, we cannot assure you that all of our employees and agents will not take actions in violation of our policies and applicable law, for which we may be ultimately held responsible. Any violation of the FCPA or other applicable anti-bribery, anti-corruption laws, and anti-money laundering laws could result in whistleblower complaints, adverse media coverage, investigations, loss of export privileges, severe criminal or civil sanctions, or suspension or debarment from U.S. government contracts, all of which may have an adverse effect on our reputation, our business, results of operations and financial condition.
Our reported financial results may be materially and adversely affected by changes in accounting principles generally accepted in the United States.
Generally accepted accounting principles in the United Sates are subject to interpretation by the Financial Accounting Standards Board (FASB), the SEC, and various bodies formed to promulgate and interpret appropriate accounting principles. A change in these principles or interpretations could have a significant effect on our reported financial results and could materially and adversely affect the transactions completed before the announcement of a change. Additionally, the adoption of new or revised accounting principles may require that we make significant changes to our systems, processes and controls. In May 2014, the FASB issued Accounting Standards Update No. 2014-09, Revenue from Contracts with Customers (“ASU 2014-09), which we have implemented from January 1, 2018. The adoption of this new standard did not result in a cumulative-effect adjustment to retained earnings as of January 1, 2018, however we cannot guarantee that there will be no unforeseen effects of this new standard on our financial statements. We continue to monitor implementation of this new standard closely.
If we are unable to maintain effective disclosure controls and internal controls over financial reporting, investors may lose confidence in the accuracy and completeness of our financial reports, and the market price of our common stock may be materially and adversely affected.
On August 2, 2017, we acquired ViXS, a Canadian company. Because ViXS utilizes separate information and accounting systems, we implemented changes to our internal controls over financial reporting to include the consolidation of ViXS, as well as acquisition-related accounting and disclosures. Pixelworks’ management is reviewing and evaluating its internal control procedures and the design of those control procedures related to the ViXS acquisition and evaluating when it will complete an evaluation and review of ViXS’s internal controls over financial reporting. If any new internal control procedures or our existing internal control procedures are inadequate, or if we identify material weaknesses in our disclosure controls or internal controls over financial reporting in the future, we will be unable to assert that our internal controls are effective. If we are unable to do so, or if our auditors are unable to attest to management’s report on the effectiveness of our internal controls, we could lose investor confidence in the accuracy and completeness of our financial reports, which would cause the price of our common stock to decline.
19
As we have limited insurance coverage, any incurred liability resulting from uncovered claims could adversely affect our financial condition and results of operations.
Our insurance policies may not be adequate to fully offset losses from covered incidents, and we do not have coverage for certain losses. For example, we do not have earthquake insurance related to our Asian operations because adequate coverage is not offered at economically justifiable rates. If our insurance coverage is inadequate to protect us against catastrophic losses, any uncovered losses could adversely affect our financial condition and results of operations.
Our dependence on selling to distributors and integrators increases the complexity of managing our supply chain and may result in excess inventory or inventory shortages.
Selling to distributors and OEMs that build display devices based on specifications provided by branded suppliers, also referred to as integrators, reduces our ability to forecast sales accurately and increases the complexity of our business. Our sales are made on the basis of customer purchase orders rather than long-term purchase commitments. Our distributors, integrators and customers may cancel or defer purchase orders at any time but we must order wafer inventory from our contract manufacturers three to four months in advance.
The estimates we use for our advance orders from contract manufacturers are based, in part, on reports of inventory levels and production forecasts from our distributors and integrators, which act as intermediaries between us and the companies using our products. This process requires us to make numerous assumptions concerning demand and to rely on the accuracy of the reports and forecasts of our distributors and integrators, each of which may introduce error into our estimates of inventory requirements. Our failure to manage this challenge could result in excess inventory or inventory shortages that could materially impact our operating results or limit the ability of companies using our semiconductors to deliver their products. If we overestimate demand for our products, it could lead to significant charges for obsolete inventory. On the other hand, if we underestimate demand, we could forego revenue opportunities, lose market share and damage our customer relationships.
We may be unable to successfully manage any future growth, including the integration of any acquisition or equity investment, which could disrupt our business and severely harm our financial condition.
If we fail to effectively manage any future internal growth, our operating expenses may increase more rapidly than our revenue, adversely affecting our financial condition and results of operations. To manage any future growth effectively in a rapidly evolving market, we must be able to maintain and improve our operational and financial systems, train and manage our employee base and attract and retain qualified personnel with relevant experience. We could spend substantial amounts of time and money in connection with expansion efforts for which we may not realize any profit. Our systems, procedures, controls or financial resources may not be adequate to support our operations and we may not be able to grow quickly enough to exploit potential market opportunities. In addition, we may not be able to successfully integrate the businesses, products, technologies or personnel of ViXS or any other entity that we might acquire in the future, or we may fail to realize the anticipated benefits of any such acquisition. The successful integration of any acquired business as well as the retention of personnel may require significant attention from our management and could divert resources from our existing business, which in turn could have an adverse effect on our business operations. Acquired assets or businesses may not achieve the anticipated benefits we expect due to a number of factors including: unanticipated costs or liabilities associated with the acquisition, including in the case of acquisitions we may make outside of the United States, including ViXS, difficulty in operating in foreign countries or complying with foreign regulatory requirements, incurrence of acquisition-related costs, harm to our relationships with existing customers as a result of the acquisition, harm to our brand and reputation, the loss of key employees in the acquired businesses, use of resources that are needed in other parts of our business, and use of substantial portions of our available cash to consummate the acquisition. Any failure to successfully integrate ViXS or any other entity we may acquire or any failure to achieve the anticipated benefits of any such acquisition could disrupt our business and seriously harm our financial condition.
20
Continued compliance with regulatory and accounting requirements will be challenging and will require significant resources.
We spend a significant amount of management time and external resources to comply with changing laws, regulations and standards relating to corporate governance and public disclosure, including evolving SEC rules and regulations, Nasdaq Global Market rules, the Dodd-Frank Wall Street Reform and Consumer Protection Act and the Sarbanes-Oxley Act of 2002 which requires management’s annual review and evaluation of internal control over financial reporting. Failure to comply with these laws and rules could lead to investigation by regulatory authorities, de-listing from the Nasdaq Global Market, or penalties imposed on us. Additionally, beginning January 1, 2018, we have ceased to qualify as a smaller reporting company and, as such, we will be required to provide additional disclosures in our periodic reports, which will require additional management time and external resources.
Regulations related to conflict minerals may adversely impact our business.
The SEC has adopted disclosure and reporting rules intended to improve transparency and accountability concerning the supply of certain minerals, known as conflict minerals, originating from the Democratic Republic of Congo (“DRC”) and adjoining countries. These rules require us to conduct a reasonable inquiry to determine the origin of certain materials used in our products and disclose whether we use any materials containing conflict minerals originating from the DRC and adjoining countries. There are costs associated with complying with these rules, including costs incurred to conduct inquiries to determine the sources of any materials containing conflict minerals used in our products, to fulfill our reporting requirements and to develop and implement potential changes to products, processes or sources of supply if it is determined that our products contain or use any conflict minerals from the DRC or adjoining countries. The implementation of these rules could also affect the sourcing, supply and pricing of materials used in our products. For example, there may only be a limited number of suppliers offering “conflict free” materials, we cannot be sure that we will be able to obtain necessary "conflict free" materials from such suppliers in sufficient quantities or at reasonable prices. In addition, we may face reputational challenges if we determine that any of our products contain minerals that are not conflict free or if we are unable to sufficiently verify the origins for all materials containing conflict minerals used in our products through the procedures we may implement.
Our effective income tax rate is subject to unanticipated changes in, or different interpretations of tax rules and regulations and forecasting our effective income tax rate is complex and subject to uncertainty.
As a global company, we are subject to taxation by a number of taxing authorities and as such, our tax rates vary among the jurisdictions in which we operate. Unanticipated changes in our tax rates could affect our future results of operations. Our effective tax rates could be adversely affected by changes in the mix of earnings in countries with differing statutory tax rates, changes in tax laws or the interpretation of tax laws either in the U.S. or abroad, or by changes in the valuation of our deferred tax assets and liabilities. The ultimate outcomes of any future tax audits are uncertain, and we can give no assurance as to whether an adverse result from one or more of them would have a material effect on our operating results and financial position.
The computation of income tax expense is complex as it is based on the laws of numerous tax jurisdictions and requires significant judgment on the application of complicated rules governing accounting for tax provisions under U.S. generally accepted accounting principles. Income tax expense for interim quarters is based on our forecasted tax rate for the year, which includes forward looking financial projections, including the expectations of profit and loss by jurisdiction, and contains numerous assumptions. For these reasons, our tax rate may be materially different than our forecast.
On December 22, 2017, Public Law 115-97, informally referred to as the Tax Cuts and Jobs Act (the "TCJA") into law. The TCJA contains significant changes to U.S. federal corporate income taxation, including reduction of the corporate tax rate from 35% to 21% for US taxable income, resulting in a one-time remeasurement of deferred taxes to reflect their value at a lower tax rate of 21%, limitation of the deduction for net operating losses to 80% of current year taxable income and elimination of net operating loss carrybacks, deemed repatriation, resulting in one-time U.S. taxation of undistributed prior offshore earnings at reduced rates, elimination of U.S. tax on future offshore earnings (subject to certain important exceptions), and immediate deductions for certain new investments instead of deductions for depreciation expense over time. Effective January 1, 2018, the new legislation contains several key tax provisions that will impact us including the reduction of the corporate income tax rate to 21%. ASC 740 requires us to recognize the effect of the tax law change in the period of enactment. The lower tax rate requires us to remeasure our deferred tax assets and liabilities as of December 31, 2017. We continue to examine the impact this tax reform legislation may have on our business.
21
We rely upon certain critical information systems for the operation of our business, and the failure of any critical information system may result in serious harm to our business.
We maintain and rely upon certain critical information systems for the effective operation of our business. These information systems include telecommunications, the Internet, our corporate intranet, various computer hardware and software applications, network communications and e-mail. These information systems are subject to attacks, failures and access denials from a number of potential sources including viruses, destructive or inadequate code, power failures, and physical damage to computers, communication lines and networking equipment. To the extent that these information systems are under our control, we have implemented security procedures, such as virus protection software and firewall monitoring, to address the outlined risks. Security procedures for information systems cannot be guaranteed to be failsafe and our inability to use or access these information systems at critical times could compromise the timely and efficient operation of our business. Additionally, any compromise of our information security could result in the unauthorized publication of our confidential business or proprietary information, cause an interruption in our operations, result in the unauthorized release of customer or employee data, result in a violation of privacy or other laws, or expose us to a risk of litigation or damage our reputation, any or all of which could harm our business and operating results.
Environmental laws and regulations may cause us to incur, significant expenditures to comply with applicable laws and regulations, and we may be assessed considerable penalties for noncompliance.
We are subject to numerous environmental laws and regulations. Compliance with current or future environmental laws and regulations could require us to incur substantial expenses which could harm our business, financial condition and results of operations. We have worked, and will continue to work, with our suppliers and customers to ensure that our products are compliant with enacted laws and regulations. Failure by us or our contract manufacturers to comply with such legislation could result in customers refusing to purchase our products and could subject us to significant monetary penalties in connection with a violation, either of which would have a material adverse effect on our business, financial condition and results of operations.
Company Risks Related to the Semiconductor Industry and Our Markets
Our highly integrated products and high-speed mixed signal products are difficult to manufacture without defects and the existence of defects could result in increased costs, delays in the availability of our products, reduced sales of products or claims against us.
The manufacture of semiconductors is a complex process and it is often difficult for semiconductor foundries to produce semiconductors free of defects. Because many of our products are more highly integrated than other semiconductors and incorporate mixed signal analog and digital signal processing, multi-chip modules and embedded memory technology, they are even more difficult to produce without defects. Defective products can be caused by design or manufacturing difficulties. Identifying quality problems can be performed only by analyzing and testing our semiconductors in a system after they have been manufactured. The difficulty in identifying defects is compounded because the process technology is unique to each of the multiple semiconductor foundries we contract with to manufacture our products. Despite testing by both our customers and us, errors or performance problems may be found in existing or new semiconductors. Failure to achieve defect-free products may result in increased costs and delays in the availability of our products. Defects may also divert the attention of our engineering personnel from our product development efforts to find and correct the issue, which would delay our product development efforts.
Additionally, customers could seek damages from us for their losses, and shipments of defective products may harm our reputation with our customers. If a product liability claim is brought against us, the cost of defending the claim could be significant and would divert the efforts of our technical and management personnel, and harm our business. Further, our business liability insurance may be inadequate or future coverage may be unavailable on acceptable terms, which could adversely impact our financial results.
We have experienced field failures of our semiconductors in certain customer applications that required us to institute additional testing. As a result of these field failures, we have incurred warranty costs due to customers returning potentially affected products and have experienced reductions in revenues due to delays in production. Our customers have also experienced delays in receiving product shipments from us that resulted in the loss of revenue and profits. Additionally, shipments of defective products could cause us to lose customers or to incur significant replacement costs, either of which would harm our reputation and our business. Any defects, errors or bugs could also interrupt or delay sales of our new products to our customers, which would adversely affect our financial results.
22
The development of new products is extremely complex and we may be unable to develop our new products in a timely manner which could result in a failure to obtain new design wins and/or maintain our current revenue levels.
In addition to the inherent difficulty of designing complex integrated circuits, product development delays may result from:
• | difficulties in hiring and retaining necessary technical personnel; |
• | difficulties in reallocating engineering resources and overcoming resource limitations; |
• | difficulties with contract manufacturers; |
• | changes to product specifications and customer requirements; |
• | changes to market or competitive product requirements; and |
• | unanticipated engineering complexities. |
If we are not successful in the timely development of new products, we may fail to obtain new design wins and our financial results will be adversely affected.
Intense competition in our markets may reduce sales of our products, reduce our market share, decrease our gross profit and result in large losses.
We compete with specialized and diversified electronics and semiconductor companies that offer display processors or scaling components including: Actions Microelectronics Co., Ltd., ARM Holdings PLC, Dolby Laboratories, Inc., Hisilicon Technologies Co., Ltd., i-Chips Technologies Inc., Lattice Semiconductor Corporation, MediaTek Inc., Novatech Co., Ltd. Inc., NVIDIA Corporation, QUALCOMM Incorporated, Realtek Semiconductor Corp., Renesas Electronics America, Solomon Systech (International) Ltd., Spreadtrum Communications, Inc, STMicroelectronics N.V., Sunplus Technology Co., Ltd., Synaptics Incorporated, Texas Instruments Incorporated, and other companies. Potential and current competitors may include diversified semiconductor manufacturers and the semiconductor divisions or affiliates of some of our customers, including: Broadcom Corporation, LG Electronics, Inc., Matsushita Electric Industrial Co., Ltd., MegaChips Corporation, Mitsubishi Digital Electronics America, Inc., NEC Corporation, Samsung Electronics Co., Ltd., Socionext, Inc., ON Semiconductor Corporation, Seiko Epson Corporation, Sharp Electronics Corporation, Sony Corporation, and Toshiba America, Inc. In addition, start-up companies may seek to compete in our markets.
Many of our competitors have longer operating histories and greater resources to support development and marketing efforts than we do. Some of our competitors operate their own fabrication facilities. These competitors may be able to react more quickly and devote more resources to efforts that compete directly with our own. Additionally, any consolidation in the semiconductor industry may impact our competitive position. Our current or potential customers have developed, and may continue to develop, their own proprietary technologies and become our competitors. Increased competition from both competitors and our customers’ internal development efforts could harm our business, financial condition and results of operations by, for example, increasing pressure on our profit margin or causing us to lose sales opportunities. For example, frame rate conversion technology similar to that used in our line of MotionEngine® advanced video co-processors continues to be integrated into the SoC and display timing controller products of our competitors. We cannot assure you that we can compete successfully against current or potential competitors.
If we are not able to respond to the rapid technological changes and evolving industry standards in the markets in which we compete, or seek to compete, our products may become less desirable or obsolete.
The markets in which we compete or seek to compete are subject to rapid technological change and miniaturization capabilities, frequent new product introductions, changing customer requirements for new products and features and evolving industry standards. The introduction of new technologies and emergence of new industry standards could render our products less desirable or obsolete, which could harm our business and significantly decrease our revenue. Examples of changing industry standards include the growing use of broadband to deliver video content, increased display resolution and size, faster screen refresh rates, video capability such as High Dynamic Range, the proliferation of new display devices and the drive to network display devices together. Our failure to predict market needs accurately or to timely develop new competitively priced products or product enhancements that incorporate new industry standards and technologies, including integrated circuits with increasing levels of integration and new features, using smaller geometry process technologies, may harm market acceptance and sales of our products.
23
Our products are incorporated into our customers’ products, which have different parts and specifications and utilize multiple protocols that allow them to be compatible with specific computers, video standards and other devices. If our customers’ products are not compatible with these protocols and standards, consumers will return, or not purchase these products and the markets for our customers’ products could be significantly reduced. Additionally, if the technology used by our customers becomes less competitive due to cost, customer preferences or other factors relative to alternative technologies, sales of our products could decline.
Dependence on a limited number of sole-source, third-party manufacturers for our products exposes us to possible shortages based on low manufacturing yield, errors in manufacturing, uncontrollable lead-times for manufacturing, capacity allocation, price increases with little notice, volatile inventory levels and delays in product delivery, any of which could result in delays in satisfying customer demand, increased costs and loss of revenue.
We do not own or operate a semiconductor fabrication facility and do not have the resources to manufacture our products internally. We rely on a limited number of foundries and assembly and test vendors to produce all of our wafers and for completion of finished products. Our wafers are not fabricated at more than one foundry at any given time and our wafers typically are designed to be fabricated in a specific process at only one foundry. Sole sourcing each product increases our dependence on our suppliers. We have limited control over delivery schedules, quality assurance, manufacturing yields, potential errors in manufacturing and production costs. We do not have long-term supply contracts with our third-party manufacturers, so they are not obligated to supply us with products for any specific period of time, quantity or price, except as may be provided in a particular purchase order. Our suppliers can increase the prices of the products we purchase from them with little notice, which may cause us to increase the prices to our customers and harm our competitiveness. Because our requirements represent only a small portion of the total production capacity of our contract manufacturers, they could reallocate capacity to other customers during periods of high demand for our products, as they have done in the past. We expect this may occur again in the future.
Establishing a relationship with a new contract manufacturer in the event of delays or increased prices would be costly and burdensome. The lead time to make such a change would be at least nine months, and the estimated time for us to adapt a product’s design to a particular contract manufacturer’s process is at least four months. Additionally, we have chosen, and may continue to choose new foundries to manufacture our wafers which in turn, may require us to modify our design methodology flow for the process technology and intellectual property cores of the new foundry. If we have to qualify a new foundry or packaging, assembly and testing supplier for any of our products or if we are unable to obtain our products from our contract manufacturers on schedule, at costs that are acceptable to us, or at all, we could incur significant delays in shipping products, our ability to satisfy customer demand could be harmed, our revenue from the sale of products may be lost or delayed and our customer relationships and ability to obtain future design wins could be damaged.
We use a customer-owned tooling process for manufacturing most of our products, which exposes us to the possibility of poor yields and unacceptably high product costs.
We build most of our products on a customer-owned tooling basis, whereby we directly contract the manufacture of our products, including wafer production, assembly and test. As a result, we are subject to increased risks arising from wafer manufacturing yields and risks associated with coordination of the manufacturing, assembly and testing process. Poor product yields result in higher product costs, which could make our products less competitive if we increase our prices to compensate for our higher costs, or could result in lower gross profit margins if we do not increase our prices.
We depend on manufacturers of our semiconductor products not only to respond to changes in technology and industry standards but also to continue the manufacturing processes on which we rely.
To respond effectively to changes in technology and industry standards, we depend on our foundries to implement advanced semiconductor technologies and our operations could be adversely affected if those technologies are unavailable, delayed or inefficiently implemented. In order to increase performance and functionality and reduce the size of our products, we are continuously developing new products using advanced technologies that further miniaturize semiconductors and we are dependent on our foundries to develop and provide access to the advanced processes that enable such miniaturization. We cannot be certain that future advanced manufacturing processes will be implemented without difficulties, delays or increased expenses. Our business, financial condition and results of operations could be materially adversely affected if advanced manufacturing processes are unavailable to us, substantially delayed or inefficiently implemented.
24
Creating the capacity for new technological changes may cause manufacturers to discontinue older manufacturing processes in favor of newer ones. We must then either retire the affected part or port (develop) a new version of the part that can be manufactured with a newer process technology. In the event that a manufacturing process is discontinued, our current suppliers may be unwilling or unable to manufacture our current products. We may not be able to place last time buy orders for the old technology or find alternate manufacturers of our products to allow us to continue to produce products with the older technology while we expend the significant costs for research and development and time to migrate to new, more advanced processes. For example, a portion of our products use 0.11um technology for memory die, which is being phased out in favor of 63nm technology to increase yields and decrease cost. Because of this transition, our customers must re-qualify the affected parts.
Shortages of materials used in the manufacturing of our products and other key components of our customers’ products may increase our costs, impair our ability to ship our products on time and delay our ability to sell our products.
From time to time, shortages of components and materials that are critical to the manufacture of our products and our customers’ products may occur. Such critical components and materials include semiconductor wafers and packages, double data rate memory die, display components, analog-to-digital converters, digital receivers, video decoders and voltage regulators. If material shortages occur, we may incur additional costs or be unable to ship our products to our customers in a timely fashion, both of which could harm our business and adversely affect our results of operations.
Because of our long product development process and sales cycles, we may incur substantial costs before we earn associated revenue and ultimately may not sell as many units of our products as we originally anticipated.
We develop products based on anticipated market and customer requirements and incur substantial product development expenditures, which can include the payment of large up-front, third-party license fees and royalties, prior to generating associated revenue. Our work under these projects is technically challenging and places considerable demands on our limited resources, particularly on our most senior engineering talent. Additionally, the transition to smaller geometry process technologies continues to significantly increase the cost and complexity of new product development, particularly with regards to tooling, software tools, third party IP and engineering resources. Because the development of our products incorporates not only our complex and evolving technology, but also our customers’ specific requirements, a lengthy sales process is often required before potential customers begin the technical evaluation of our products. Our customers typically perform numerous tests and extensively evaluate our products before incorporating them into their systems. The time required for testing, evaluation and design of our products into a customer’s system can take nine months or more. It can take an additional nine months or longer before a customer commences volume shipments of systems that incorporate our products, if at all. Because of the lengthy development and sales cycles, we will experience delays between the time we incur expenditures for research and development, sales and marketing and inventory and the time we generate revenue, if any, from these expenditures.
Furthermore, we have entered into and may in the future enter into, co-development agreements that do not guarantee future sales volumes and limit our ability to sell the developed products to other customers. The exclusive nature of these development agreements increases our dependence on individual customers, particularly since we are limited in the number of products we are able to develop at any one time.
If actual sales volumes for a particular product are substantially less than originally anticipated, we may experience large write-offs of capitalized license fees, software development tools, product masks, inventories or other capitalized or deferred product-related costs, any of which would negatively affect our operating results.
25
Our developed software may be incompatible with industry standards and challenging and costly to implement, which could slow product development or cause us to lose customers and design wins.
We provide our customers with software development tools and with software that provides basic functionality for our integrated circuits and enables enhanced connectivity of our customers’ products. Software development is a complex process and we are dependent on software development languages and operating systems from vendors that may limit our ability to design software in a timely manner. Also, as software tools and interfaces change rapidly, new software languages introduced to the market may be incompatible with our existing systems and tools, requiring significant engineering efforts to migrate our existing systems in order to be compatible with those new languages. Software development disruptions could slow our product development or cause us to lose customers and design wins. The integration of software with our products adds complexity, may extend our internal development programs and could impact our customers’ development schedules. This complexity requires increased coordination between hardware and software development schedules and increases our operating expenses without a corresponding increase in product revenue. This additional level of complexity lengthens the sales cycle and may result in customers selecting competitive products requiring less software integration.
The competitiveness and viability of our products could be harmed if necessary licenses of third-party technology are not available to us on terms that are acceptable to us or at all.
We license technology from independent third parties that is incorporated into our products or product enhancements. Future products or product enhancements may require additional third-party licenses that may not be available to us on terms that are acceptable to us or at all. In addition, in the event of a change in control of one of our licensors, it may become difficult to maintain access to its licensed technology. If we are unable to obtain or maintain any third-party license required to develop new products and product enhancements, we may have to obtain substitute technology with lower quality or performance standards, or at greater cost, either of which could seriously harm the competitiveness of our products.
Our limited ability to protect our IP and proprietary rights could harm our competitive position by allowing our competitors to access our proprietary technology and to introduce similar products.
Our ability to compete effectively with other companies depends, in part, on our ability to maintain the proprietary nature of our technology, including our semiconductor designs and software code. We provide the computer programming code for our software to customers in connection with their product development efforts, thereby increasing the risk that customers will misappropriate our proprietary software. We rely on a combination of patent, copyright, trademark and trade secret laws, as well as nondisclosure agreements and other methods, to help protect our proprietary technologies. As of December 31, 2017, we held 536 patents and had 100 patent applications pending for protection of our significant technologies. Competitors in both the U.S. and foreign countries, many of whom have substantially greater resources than we do, may apply for and obtain patents that will prevent, limit or interfere with our ability to make and sell our products, or they may develop similar technology independently or design around our patents. Effective patent, copyright, trademark and trade secret protection may be unavailable or limited in foreign countries and, thus, make the possibility of piracy of our technology and products more likely in these countries.
We cannot assure you that the degree of protection offered by patent or trade secret laws will be sufficient. Furthermore, we cannot assure you that any patents will be issued as a result of any pending applications or that any claims allowed under issued patents will be sufficiently broad to protect our technology. We may incur significant costs to stop others from infringing our patents. In addition, it is possible that existing or future patents may be invalidated, diluted, circumvented, challenged or licensed to others.
26
Others may bring infringement or indemnification actions against us that could be time-consuming and expensive to defend.
We may become subject to claims involving patents or other intellectual property rights. In recent years, there has been significant litigation in the U.S. and in other jurisdictions involving patents and other intellectual property rights. This litigation is particularly prevalent in the semiconductor industry, in which a number of companies aggressively use their patent portfolios to bring infringement claims. In recent years, there has been an increase in the filing of so-called "nuisance suits," alleging infringement of intellectual property rights. These claims may be asserted initially or as counterclaims in response to claims made by a company alleging infringement of intellectual property rights. These suits pressure defendants into entering settlement arrangements to quickly dispose of such suits, regardless of merit. We may also face claims brought by companies that are organized solely to hold and enforce patents. In addition, we may be required to indemnify our customers against IP claims related to their usage of our products as certain of our agreements include indemnification provisions from third parties relating to our intellectual property.
IP claims could subject us to significant liability for damages and invalidate our proprietary rights. Responding to such claims, regardless of their merit, can be time-consuming, result in costly litigation, divert management’s attention and resources and cause us to incur significant expenses. As each claim is evaluated, we may consider the desirability of entering into settlement or licensing agreements. No assurance can be given that settlements will occur or that licenses can be obtained on acceptable terms or that litigation will not occur. In the event there is a temporary or permanent injunction entered prohibiting us from marketing or selling certain of our products, or a successful claim of infringement against us requiring us to pay damages or royalties to a third-party and we fail to develop or license a substitute technology, our business, results of operations or financial condition could be materially adversely affected. Any IP litigation or claims also could force us to do one or more of the following:
• | stop selling products using technology that contains the allegedly infringing IP; |
• | attempt to obtain a license to the relevant IP, which may not be available on terms that are acceptable to us or at all; |
• | attempt to redesign those products that contain the allegedly infringing IP; or |
• | pay damages for past infringement claims that are determined to be valid or which are arrived at in settlement of such litigation or threatened litigation. |
If we are forced to take any of the foregoing actions, we may incur significant additional costs or be unable to manufacture and sell our products, which could seriously harm our business. In addition, we may not be able to develop, license or acquire non-infringing technology under reasonable terms. These developments could result in an inability to compete for customers or otherwise adversely affect our results of operations.
Our products are characterized by average selling prices that can decline over relatively short periods of time, which will negatively affect our financial results unless we are able to reduce our product costs or introduce new products with higher average selling prices.
Average selling prices for our products can decline over relatively short periods of time, while many of our product costs are relatively fixed. When our average selling prices decline, our gross profit declines unless we are able to sell more units or reduce the cost to manufacture our products. We have experienced declines in our average selling prices and expect that we will continue to experience them in the future, although we cannot predict when they may occur or how severe they will be. Our financial results will suffer if we are unable to offset any reductions in our average selling prices by increasing our sales volumes, reducing our costs, adding new features to our existing products or developing new or enhanced products in a timely manner with higher selling prices or gross profits.
The cyclical nature of the semiconductor industry may lead to significant variances in the demand for our products and could harm our operations.
In the past, the semiconductor industry has been characterized by significant downturns and wide fluctuations in supply and demand. Also, the industry has experienced significant fluctuations in anticipation of changes in general economic conditions, including economic conditions in Asia, Europe and North America. The cyclical nature of the semiconductor industry has also led to significant variances in product demand and production capacity. We have experienced, and may continue to experience, periodic fluctuations in our financial results because of changes in industry-wide conditions.
27
Other Risks
The price of our common stock has and may continue to fluctuate substantially.
Our stock price and the stock prices of technology companies similar to Pixelworks have been highly volatile. The price of our common stock may decline and the value of our shareholders' investment may be reduced regardless of our performance.
The daily trading volume of our common stock has historically been relatively low, although, in the three most recent years, trading volume increased compared to historical levels. As a result of the historically low volume, our shareholders may be unable to sell significant quantities of common stock in the public trading markets without a significant reduction in the price of our common shares. Additionally, market fluctuations, as well as general economic and political conditions, including recessions, interest rate changes or international currency fluctuations, may negatively impact the market price of our common stock. Other factors that could negatively impact our stock price include:
• | actual or anticipated fluctuations in our operating results; |
• | changes in or failure to meet expectations as to our future financial performance; |
• | changes in or failure to meet financial estimates of securities analysts; |
• | announcements by us or our competitors of technological innovations, design wins, contracts, standards, acquisitions or divestitures; |
• | Failure to realize the anticipated benefits of the acquisition of ViXS, and unanticipated costs related thereto; |
• | the operating and stock price performance of other comparable companies; |
• | issuances or proposed issuances of equity, debt or other securities by us, or sales of securities by our security holders; and |
• | changes in market valuations of other technology companies. |
Any inability or perceived inability of investors to realize a gain on an investment in our common stock could have an adverse effect on our business, financial condition and results of operations by potentially limiting our ability to retain our customers, to attract and retain qualified employees and to raise capital. In addition, in the past, following periods of volatility in the overall market and the market price of a particular company's securities, securities class action litigation has often been instituted against these companies. This litigation, if instituted against us, could result in substantial costs and a diversion of our management's attention and resources.
The interest of our current or potential significant shareholders may conflict with other shareholders and they may attempt to effect changes or acquire control, which could adversely affect our results of operations and financial condition.
Our shareholders may from time to time engage in proxy solicitations, advance shareholder proposals, acquire control or otherwise attempt to effect changes, including by directly voting their shares on shareholder proposals. Campaigns by shareholders to effect changes at publicly traded companies are sometimes led by investors seeking to increase short-term shareholder value through actions such as financial restructuring, increased debt, special dividends, stock repurchases or sales of assets or the entire company. Responding to proxy contests and other actions by activist shareholders can be costly and time-consuming, disrupting our operations and diverting the attention of our Board of Directors and senior management from the pursuit of business strategies. Additionally, uncertainty over our direction and leadership may negatively impact our relationship with our customers and make it more difficult to attract and retain qualified personnel and business partners. As a result, shareholder campaigns could adversely affect our results of operations and financial condition.
Future sales of our equity could result in significant dilution to our existing shareholders and depress the market price of our common stock.
It is likely that we will need to seek additional capital in the future and from time to time. If this financing is obtained through the issuance of equity securities, debt convertible into equity securities, options or warrants to acquire equity securities or similar instruments or securities, our existing shareholders will experience dilution in their ownership percentage upon the issuance, conversion or exercise of such securities and such dilution could be significant. For example, we issued approximately 3.7 million and 3.0 million shares of our common stock in underwritten registered public offerings in August 2015 and August 2013, respectively. New equity securities issued by us could have rights, preferences or privileges senior to those of our common stock.
28
In addition, any such issuance by us or sales of our securities by our security holders, including by any of our affiliates, or the perception that such issuances or sales could occur, could negatively impact the market price of our securities. For example, a number of shareholders own significant blocks of our common stock, and we have issued approximately 3.7 million shares of our common stock to the former holders of ViXS, such shares which were freely tradeable upon issuance. If one or more of these large shareholders were to sell large portions of their holdings in a relatively short time, or if the former holders of ViXS were to collectively sell large portions of the stock issued as consideration in the acquisition in a relatively short time, for liquidity or other reasons, the prevailing market price of our common stock could be negatively affected. This could result in further potential dilution to our existing shareholders and the impairment of our ability to raise capital through the sale of equity, debt or other securities.
We may be unable to maintain compliance with Nasdaq Marketplace Rules which could cause our common stock to be delisted from the Nasdaq Global Market. This could result in the lack of a market for our common stock, cause a decrease in the value of our common stock, and adversely affect our business, financial condition and results of operations.
Under the Nasdaq Marketplace Rules our common stock must maintain a minimum price of $1.00 per share for continued inclusion on the Nasdaq Global Market. Our stock price was previously below $1.00 on May 6, 2009 and was $1.22 on February 12, 2016 and we cannot guarantee that our stock price will remain at or above $1.00 per share. If the price again drops below $1.00 per share, our stock could become subject to delisting, and we may seek shareholder approval for a reverse split, which in turn could produce adverse effects and may not result in a long-term or permanent increase in the price of our common stock.
In addition to the minimum $1.00 per share requirement, the Nasdaq Global Market has other listing requirements, including: (i) a minimum of $50.0 million in total asset value and $50.0 million in revenues in the latest fiscal year or in two of the last three fiscal years; (ii) a minimum of $50.0 million in market value of listed securities, $15.0 million in market value of publicly held securities and at least 1.1 million publicly held shares; or (iii) a minimum of $10.0 million in shareholders' equity. As of December 31, 2017, we were in compliance with these listing requirements. However, as recently as June 30, 2013, our shareholders’ equity was below $10.0 million and as recently as June 30, 2017, our total asset value was less than $50.0 million. In addition, as recently as during the first quarter of 2016, the aggregate market value of our listed securities was below $50.0 million. Our stock price is volatile and we believe that we continue to remain susceptible to the market value of our listed securities and/or the market value of our publicly held securities falling below $50.0 million and $15.0 million, respectively. Accordingly, we cannot assure you that we will be able to continue to comply with Nasdaq’s listing requirements. Should we be unable to remain in compliance with these requirements, our stock could become subject to delisting.
If our common stock is delisted, trading of the stock will most likely take place on an over-the-counter market established for unlisted securities. An investor is likely to find it less convenient to sell, or to obtain accurate quotations in seeking to buy, our common stock on an over-the-counter market, and many investors may not buy or sell our common stock due to difficulty in accessing over-the-counter markets, or due to policies preventing them from trading in securities not listed on a national exchange or other reasons. For these reasons and others, delisting would adversely affect the liquidity, trading volume and price of our common stock, causing the value of an investment in us to decrease and having an adverse effect on our business, financial condition and results of operations by limiting our ability to attract and retain qualified executives and employees and limiting our ability to raise capital.
The continued uncertain global economic environment and volatility in global credit and financial markets could materially and adversely affect our business and results of operations.
The state of the global economy continues to be uncertain. As a result of these conditions, our manufacturers, vendors and customers might experience deterioration of their businesses, cash flow shortages and difficulty obtaining financing which could result in interruptions or delays in the performance of any contracts, reductions and delays in customer purchases, delays in or the inability of customers to obtain financing to purchase our products, and bankruptcy of customers. Furthermore, the constraints in the capital and credit markets, may limit the ability of our customers to meet their liquidity needs, which could result in an impairment of their ability to make timely payments to us and reduce their demand for our products, adversely impacting our results of operations and cash flows. This environment has also made it difficult for us to accurately forecast and plan future business activities.
29
The anti-takeover provisions of Oregon law and in our articles of incorporation could adversely affect the rights of the holders of our common stock, including by preventing a sale or takeover of us at a price or prices favorable to the holders of our common stock.
Provisions of our articles of incorporation and bylaws and provisions of Oregon law may have the effect of delaying or preventing a merger or acquisition of us, making a merger or acquisition of us less desirable to a potential acquirer or preventing a change in our management, even if our shareholders consider the merger, acquisition or change in management favorable or if doing so would benefit our shareholders. In addition, these provisions could limit the price that investors would be willing to pay in the future for shares of our common stock. The following are examples of such provisions:
• | if the number of directors is fixed by the board at eight or more, our board of directors is divided into three classes serving staggered terms, which would make it more difficult for a group of shareholders to quickly replace a majority of directors; |
• | our board of directors is authorized, without prior shareholder approval, to create and issue preferred stock with voting or other rights or preferences that could impede the success of any attempt to acquire us or to effect a change of control, commonly referred to as "blank check" preferred stock; |
• | members of our board of directors can be removed only for cause and at a meeting of shareholders called expressly for that purpose, by the vote of 75 percent of the votes then entitled to be cast for the election of directors; |
• | our board of directors may alter our bylaws without obtaining shareholder approval; and shareholders are required to provide advance notice for nominations for election to the board of directors or for proposing matters to be acted upon at a shareholder meeting; |
• | Oregon law permits our board to consider other factors beyond stockholder value in evaluating any acquisition offer (so-called "expanded constituency" provisions); and |
• | a supermajority (67%) vote of shareholders is required to approve certain fundamental transactions. |
Item 1B. | Unresolved Staff Comments. |
Not applicable.
30
Item 2. | Properties. |
We lease facilities around the world to house our engineering, sales, customer support, administrative and operations functions. We do not own any of our facilities. As of December 31, 2017, our major facilities consisted of the following:
Location | Function(s) | Square Feet Utilized | Lease Expiration | |||
China | Engineering; sales; customer support | 77,000 | Various dates through March 2020 | |||
Toronto | Engineering; administration | 24,000 | March 2022 | |||
California | Administration; engineering; sales | 19,000 | December 2018 | |||
Taiwan | Customer support; sales; operations; engineering | 16,000 | Various dates through November 2020 | |||
Oregon | Administration | 5,000 | December 2019 | |||
Hong Kong | Engineering | 5,000 | March 2019 | |||
Japan | Sales; customer support | 3,000 | January 2019 | |||
Item 3. | Legal Proceedings. |
We are subject to legal matters that arise from time to time in the ordinary course of our business. Although we currently believe that resolving such matters, individually or in the aggregate, will not have a material adverse effect on our financial position, our results of operations, or our cash flows, these matters are subject to inherent uncertainties and our view of these matters may change in the future.
Item 4. | Mine Safety Disclosures. |
Not Applicable.
31
PART II
Item 5. | Market for Registrant’s Common Equity, Related Stockholder Matters and Issuer Purchases of Equity Securities. |
Market for Registrant’s Common Equity and Related Stockholder Matters
Our common stock is listed for trading on the Nasdaq Global Market under the symbol "PXLW". Our stock began trading on May 19, 2000. The following table sets forth, for the periods indicated, the highest and lowest sales prices of our common stock as reported on the Nasdaq Global Market.
Fiscal 2017 | High | Low | |||||
Fourth Quarter | $ | 6.73 | $ | 4.75 | |||
Third Quarter | 5.15 | 4.05 | |||||
Second Quarter | 6.22 | 4.21 | |||||
First Quarter | 4.89 | 2.80 | |||||
Fiscal 2016 | High | Low | |||||
Fourth Quarter | $ | 3.49 | $ | 2.17 | |||
Third Quarter | 3.29 | 1.77 | |||||
Second Quarter | 2.48 | 1.55 | |||||
First Quarter | 2.58 | 1.22 | |||||
As of March 9, 2018, there were 126 shareholders of record of our common stock and the last per share sales price of the common stock on that date was $4.66. The number of beneficial owners of our common stock is substantially greater than the number of shareholders of record because a significant portion of our outstanding common stock is held in broker "street name" for the benefit of individual investors.
To date, we have not declared any cash dividends and we currently expect to retain any earnings to finance the expansion and development of our business. In addition, our financial covenants may limit our ability to pay dividends. Accordingly, there is no assurance that we will declare or pay future dividends as they are dependent upon future earnings, capital requirements, our operating and financial condition and approval by our board of directors.
32
Performance Graph
This performance graph shall not be deemed "soliciting material" or to be "filed" with the Securities and Exchange Commission ("SEC") for purposes of Section 18 of the Securities Exchange Act of 1934, or otherwise be subject to the liabilities under that Section, and shall not be deemed to be incorporated by reference into any filing of Pixelworks, Inc. under the Securities Exchange Act of 1934 or the Securities Act of 1933.
Set forth below is a graph that compares the cumulative total shareholder return for our common stock with the cumulative total return on the following indexes:
• | NASDAQ U.S. Benchmark TR Index |
• | NASDAQ OMX Electrical Components and Equipment Index |
The graph assumes that $100 was invested in our common stock and each index on December 31, 2012. In accordance with guidelines of the SEC, the shareholder return for each entity in the peer group index has been weighted on the basis of market capitalization. The stock price performance in the graph is not intended to forecast or indicate future stock price performance.
COMPARISON OF FIVE-YEAR CUMULATIVE TOTAL RETURN
AMONG PIXELWORKS, INC., THE NASDAQ U.S. BENCHMARK TR INDEX AND
THE NASDAQ OMX ELECTRICAL COMPONENTS AND EQUIPMENT INDEX.
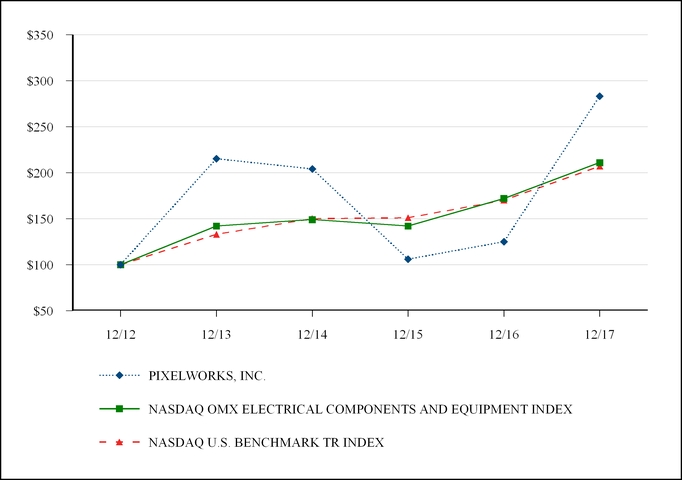
33
Item 6. | Selected Financial Data. |
The following selected consolidated financial data should be read together with the consolidated financial statements and the notes to the consolidated financial statements and “Management’s Discussion and Analysis of Financial Condition and Results of Operations,” which are included elsewhere in this report.
In thousands, except per share data.
Year ended December 31, | |||||||||||||||||||
2017 | 2016 | 2015 | 2014 | 2013 | |||||||||||||||
Consolidated Statements of Operations Data | |||||||||||||||||||
Revenue, net | $ | 80,637 | $ | 53,390 | $ | 59,517 | $ | 60,923 | $ | 48,118 | |||||||||
Cost of revenue | 38,873 | 28,322 | 30,224 | 29,142 | 21,708 | ||||||||||||||
Gross profit | 41,764 | 25,068 | 29,293 | 31,781 | 26,410 | ||||||||||||||
Operating expenses: | |||||||||||||||||||
Research and development | 21,427 | 19,036 | 24,644 | 25,296 | 20,664 | ||||||||||||||
Selling, general and administrative | 20,450 | 13,770 | 14,453 | 15,434 | 13,883 | ||||||||||||||
Restructuring | 1,920 | 2,608 | — | — | — | ||||||||||||||
Total operating expenses | 43,797 | 35,414 | 39,097 | 40,730 | 34,547 | ||||||||||||||
Loss from operations | (2,033 | ) | (10,346 | ) | (9,804 | ) | (8,949 | ) | (8,137 | ) | |||||||||
Other expense, net | (1,647 | ) | (406 | ) | (446 | ) | (493 | ) | (405 | ) | |||||||||
Loss before income taxes | (3,680 | ) | (10,752 | ) | (10,250 | ) | (9,442 | ) | (8,542 | ) | |||||||||
Provision for income taxes | 493 | 355 | 320 | 518 | 328 | ||||||||||||||
Net loss | $ | (4,173 | ) | $ | (11,107 | ) | $ | (10,570 | ) | $ | (9,960 | ) | $ | (8,870 | ) | ||||
Net loss per share - basic and diluted | $ | (0.13 | ) | $ | (0.39 | ) | $ | (0.42 | ) | $ | (0.44 | ) | $ | (0.45 | ) | ||||
Weighted average shares outstanding - basic and diluted | 31,507 | 28,276 | 25,088 | 22,766 | 19,816 | ||||||||||||||
December 31, | |||||||||||||||||||
2017 | 2016 | 2015 | 2014 | 2013 | |||||||||||||||
Consolidated Balance Sheets Data | |||||||||||||||||||
Cash and cash equivalents | $ | 27,523 | $ | 19,622 | $ | 26,591 | $ | 17,926 | $ | 20,805 | |||||||||
Working capital | 18,069 | 16,545 | 21,796 | 11,470 | 15,163 | ||||||||||||||
Total assets | 67,543 | 30,857 | 43,842 | 34,144 | 36,744 | ||||||||||||||
Long-term liabilities, net of current portion | 9,838 | 2,074 | 2,773 | 3,570 | 2,878 | ||||||||||||||
Total shareholders’ equity | 39,437 | 19,049 | 26,376 | 15,684 | 18,942 | ||||||||||||||
34
Item 7. | Management’s Discussion and Analysis of Financial Condition and Results of Operation. |
Overview
Pixelworks designs, develops and markets visual display processing semiconductors, intellectual property cores, software and custom application specific integrated circuits ("ASIC") solutions for high-quality energy efficient video applications. In addition, we offer a suite of solutions for advanced media processing and the efficient delivery and streaming of video.
We enable worldwide manufacturers to offer leading-edge consumer electronics and professional display products, as well as video delivery and streaming solutions for content service providers. Our core visual display processing technology intelligently processes digital images and video from a variety of sources and optimizes the content for a superior viewing experience. Pixelworks’ video coding technology reduces storage requirements, significantly reduces bandwidth constraint issues and converts content between multiple formats to enable seamless delivery of video, including over-the-air (OTA) streaming, while also maintaining end-to-end content security.
The rapid growth in video-capable consumer devices, especially mobile, has increased the demand for visual display processing and video delivery technology in recent years. Our technologies can be applied to a wide range of devices from large-screen projectors to low-power mobile tablets, smartphones, high-quality video infrastructure equipment and streaming devices. Our products are architected and optimized for power, cost, bandwidth, and overall system performance, according to the requirements of the specific application. Our primary target markets include digital projection systems, tablets, smartphones, and OTA streaming devices.
As of December 31, 2017, we had an intellectual property portfolio of 536 patents related to the visual display of digital image data. We focus our research and development efforts on developing video algorithms that improve quality, and architectures that reduce system power, cost, bandwidth and increase overall system performance and device functionality. We seek to expand our technology portfolio through internal development and co-development with business partners, and we continually evaluate acquisition opportunities and other ways to leverage our technology into other high-value markets.
Pixelworks was founded in 1997 and is incorporated under the laws of the state of Oregon. On August 2, 2017, we acquired ViXS Systems Inc., a corporation organized in Canada ("ViXS").
Historically, significant portions of our revenue have been generated by sales to a relatively small number of end customers and distributors. We sell our products worldwide through a direct sales force, distributors and manufacturers’ representatives. We sell to distributors in China, Europe, Japan, Korea, Southeast Asia, Taiwan and the U.S., and our manufacturers’ representatives support some of our Korean and European sales. Our distributors typically provide engineering support to our end customers and often have valuable and established relationships with our end customers. In certain countries in which we operate, it is customary to sell to distributors. While distributor payment to us is not dependent upon the distributor’s ability to resell the product or to collect from the end customer, the distributors may provide longer payment terms to end customers than those we would offer.
Significant portions of our products are sold overseas. Sales outside the U.S. accounted for approximately 98%, 100% and 100% of revenue in 2017, 2016 and 2015, respectively. Our integrators, branded manufacturers and branded suppliers incorporate our products into systems that are sold worldwide. All of our revenue to date has been denominated in U.S. dollars.
Seasonality
Our business is subject to seasonality related to the markets we serve and the location of our customers. We have historically experienced higher revenue from the digital projector market in the third quarter of the year, and lower revenue in the first quarter of the year, as our Japanese customers reduce inventories in anticipation of their March 31 fiscal year end.
35
Results of Operations
Year ended December 31, 2017 compared with year ended December 31, 2016, and year ended December 31, 2016 compared with year ended December 31, 2015.
Revenue, net
Net revenue was as follows (in thousands):
Year ended December 31, | 2017 v. 2016 | 2016 v. 2015 | |||||||||||||||||||||||
2017 | 2016 | 2015 | $ change | % change | $ change | % change | |||||||||||||||||||
Revenue, net | $ | 80,637 | $ | 53,390 | $ | 59,517 | $ | 27,247 | 51 | % | $ | (6,127 | ) | (10 | )% | ||||||||||
2017 v. 2016
Net revenue increased $27.2 million, or 51%, from 2016 to 2017, primarily due to the following factors:
• | An increase in units sold into the digital projector and the TV and panel markets. These increases were primarily the result of implementing an end-of-life for our legacy products. Revenue attributable to end-of-life products for the year ended December 31, 2017 was $15.3 million. |
• | An increase in units sold within the video delivery market, due to the acquisition of products associated with the acquisition of ViXS (the "Acquisition") during 2017. Revenue attributable to the video delivery market for the year ended December 31, 2017 was $4.5 million. |
• | An increase in products sold into the digital projector market, which was primarily due to lower sales in 2016, due to customers' efforts to adjust inventory levels within the digital projector market as well as supply disruptions in Japan. |
• | An increase in average selling price ("ASP") within the digital projector and the TV and panel markets associated with a price increase for some of our products. |
2016 v. 2015
Net revenue decreased $6.1 million, or 10%, from 2015 to 2016 which was primarily attributable to decreased unit sales into the digital projector market, which was due to customers' efforts to adjust inventory levels. A decrease in ASP in 2016 compared to 2015 also contributed to the overall decrease in revenue. The decrease in ASP was primarily due to increased unit sales into the mobile device market in 2016 compared to 2015.
36
Cost of revenue and gross profit
Cost of revenue and gross profit were as follows (in thousands):
Year ended December 31, | ||||||||||||||||||||
2017 | % of revenue | 2016 | % of revenue | 2015 | % of revenue | |||||||||||||||
Direct product costs and related overhead 1 | $ | 35,984 | 45 | % | $ | 26,376 | 49 | % | $ | 29,843 | 50 | % | ||||||||
Inventory step-up and backlog amortization | 1,965 | 2 | — | 0 | — | 0 | ||||||||||||||
Amortization of acquired developed technology | 497 | 1 | — | 0 | — | 0 | ||||||||||||||
Other cost of revenue 2 | 243 | 0 | 190 | 0 | 182 | 0 | ||||||||||||||
Inventory charges 3 | 184 | 0 | (28 | ) | 0 | 199 | 0 | |||||||||||||
Restructuring | — | 0 | 1,784 | 3 | — | 0 | ||||||||||||||
Total cost of revenue | $ | 38,873 | 48 | % | $ | 28,322 | 53 | % | $ | 30,224 | 51 | % | ||||||||
Gross profit | $ | 41,764 | 52 | % | $ | 25,068 | 47 | % | $ | 29,293 | 49 | % | ||||||||
1 | Includes purchased materials, assembly, test, labor, employee benefits and royalties, all of which are related to sales of IC products. |
2 | Includes stock-based compensation and additional amortization of a non-cancelable prepaid royalty. |
3 | Includes charges to reduce inventory to lower of cost or market and a benefit for sales of previously written down inventory. |
2017 v. 2016
Cost of revenue decreased to 48% of revenue in 2017 from 53% of revenue in 2016. Contributing to the majority of this decrease was a decrease in direct product costs and related overhead as a percent of revenue. Direct product costs and related overhead as a percent of revenue was 45% in 2017 compared to 49% of revenue in 2016. The decrease in direct product costs and related overhead as a percent of revenue was primarily due to the following factors:
• | An increase in units sold within 2017 related to an end-of-life for our legacy products. Many of these legacy products have lower direct product costs as a percent of revenue, compared to our other products. |
• | Revenue attributable to the video delivery market as a result of the Acquisition in 2017. The products sold into the video delivery market have lower direct product costs as a percentage of revenue, compared to our existing product offerings. |
• | A decrease in direct product costs and related overhead as a percentage of revenue due to better absorption. As revenue increases our overhead costs stay relatively constant which favorably impacts direct product costs and related overhead as a percent of revenue. |
The decrease in cost of revenue as a percent of revenue was also due to a decrease in restructuring charges from 2016 to 2017. There were no restructuring charges in 2017 that impacted cost of revenue. These decreases were partially offset by an increase in amortization of acquired developed technology and backlog as well as step-up of inventory, all associated with the accounting for the Acquisition.
We expect the remaining inventory step-up of $0.4 million to be recognized in cost of revenue over approximately the next 6 months.
Pixelworks’ gross profit margin is subject to variability based on changes in revenue levels, recognition of licensing revenue and licensing costs, product mix, average selling prices, startup costs, restructuring charges, amortization related to acquired developed technology, inventory step-up and backlog, and the timing and execution of manufacturing ramps as well as other factors.
2016 v. 2015
Cost of revenue increased to 53% of revenue in 2016 from 51% of revenue in 2015. The increase was primarily due to restructuring charges of $1.8 million recorded during 2016, primarily for the abandonment of tooling, inventory and licensed technology associated with markets we are no longer pursuing.
37
Research and development
Research and development expense includes compensation and related costs for personnel, development-related expenses including non-recurring engineering and fees for outside services, depreciation and amortization, expensed equipment, facilities and information technology expense allocations and travel and related expenses.
Co-development agreement
During the first quarter of 2017, we entered into a best efforts co-development agreement (the "Co-development Agreement") with a customer to defray a portion of the research and development expenses we expect to incur in connection with our development of an integrated circuit product to be sold exclusively to the customer. We expect our development costs to exceed the amounts received from the customer, and although we expect to sell units of the product to the customer, there is no commitment or agreement from the customer for such sales at this time. Additionally, we retain ownership of any modifications or improvements to our pre-existing intellectual property and may use such improvements in products sold to other customers.
Under the Co-development Agreement, $4.0 million was payable by the customer within 60 days of the date of the agreement and two additional payments of $2.0 million are each payable upon completion of certain development milestones. As amounts become due and payable, they are offset against research and development expense on a pro rata basis. We recognized an offset to research and development expense of $4.0 million related to the Co-development Agreement during 2017.
During 2018, we expect to complete all of the milestones related to the Co-development Agreement and realize the remaining $4.0 million of reimbursement.
Research and development expense was as follows (in thousands):
Year ended December 31, | 2017 v. 2016 | 2016 v. 2015 | |||||||||||||||||||||||
2017 | 2016 | 2015 | $ change | % change | $ change | % change | |||||||||||||||||||
Research and development | $ | 21,427 | $ | 19,036 | $ | 24,644 | $ | 2,391 | 13 | % | $ | (5,608 | ) | (23 | )% | ||||||||||
2017 v. 2016
Research and development expense increased $2.4 million from 2016 to 2017. The increase was primarily due to a $2.0 million increase in compensation expense due to an increase in headcount as a result of the Acquisition and an increased management bonus accrual. The increase was also due to a $0.4 million increase in rent expense which was primarily due to a non-recurring overlap in rent expense associated with our old and new China facility locations in 2017. Research and development expense in 2017 also included a benefit of $4.0 million recognized in 2017 largely offset by an increase in non-recurring engineering expense. The benefit recognized and the increase in non-recurring engineering expense are both related to the Co-development Agreement.
2016 v. 2015
Research and development expense decreased $5.6 million from 2015 to 2016. The decrease was primarily due to a $2.7 million decrease in compensation expense primarily as a result of the restructuring plan that was executed in April 2016. The decrease was also due to the timing of development activities, which decreased non-recurring engineering expense and depreciation and amortization expense by $2.0 million in 2016 compared to 2015. Lastly, a $0.3 million decrease in stock-based compensation expense primarily due to the timing of awards granted and a $0.3 million decrease in facilities and information technology allocations also contributed to the decrease in research and development expense during this period.
38
Selling, general and administrative
Selling, general and administrative expense includes compensation and related costs for personnel, sales commissions, allocations for facilities and information technology expenses, travel, outside services and other general expenses incurred in our sales, marketing, customer support, management, legal and other professional and administrative support functions.
Selling, general and administrative expense was as follows (in thousands):
Year ended December 31, | 2017 v. 2016 | 2016 v. 2015 | |||||||||||||||||||||||
2017 | 2016 | 2015 | $ change | % change | $ change | % change | |||||||||||||||||||
Selling, general and administrative | $ | 20,450 | $ | 13,770 | $ | 14,453 | $ | 6,680 | 49 | % | $ | (683 | ) | (5 | )% | ||||||||||
2017 v. 2016
Selling, general and administrative expense increased $6.7 million from 2016 to 2017. The increase was primarily due to $2.5 million in acquisition and integration costs associated with the Acquisition and a $1.7 million increase in compensation expense due to an increase in headcount as a result of the Acquisition and an increased management bonus accrual. The increase was also due to a $1.5 million increase in stock-based compensation expense, partially due to awards granted in association with the Acquisition and partially due to a credit in 2016 for the reversal of stock-based compensation expense associated with the February 1, 2016 resignation of our former Chief Executive Officer, Bruce Walicek. These increases were partially offset by a $0.8 million decrease in severance expense. The severance expense in 2016 was also due to the February 1, 2016 resignation of our former Chief Executive Officer, Bruce Walicek. The remaining $1.8 million increase was due to a general increase in most other expense categories as a result of our expanded operations as a result of the Acquisition.
2016 v. 2015
Selling, general and administrative expense decreased $0.7 million from 2015 to 2016. The decrease was primarily due to a $0.9 million decrease in stock-based compensation expense partially due to the timing of awards granted and partially due to a reversal of stock-based compensation expense associated with the February 1, 2016 resignation of our former Chief Executive Officer, Bruce Walicek. This decrease was partially offset by a $0.8 million increase in severance expense also associated with the February 1, 2016 resignation of our former Chief Executive Officer, Bruce Walicek. The remaining decrease was due to a general decrease across most other expense categories as we focused on cost management.
39
Restructurings
In September 2017, in connection with our acquisition of ViXS Systems, Inc., we executed a restructuring plan ("the 2017 Plan") to secure significant synergies between ViXS and Pixelworks. The 2017 Plan included an approximately 15% reduction in workforce, primarily in the area of development, however, it also impacted administration and sales.
In April 2016, we executed a restructuring plan ("the 2016 Plan") to streamline Pixelworks' operations and product offerings and to align our expenses with current revenue levels. The 2016 Plan included an approximately 24% reduction in workforce, primarily in the area of development, however, it also impacted operations, sales and marketing. The 2016 Plan also included abandonment of certain assets resulting in impairment charges to write off the assets associated with markets we are no longer pursuing.
Restructuring expense for the years ended December 31, 2017, 2016 and 2015, was as follows (in thousands):
Year ended December 31, | |||||||||||
2017 | 2016 | 2015 | |||||||||
Employee severance and benefits | $ | 1,920 | $ | 2,618 | $ | — | |||||
Write off of assets | — | 1,744 | — | ||||||||
Other | — | 30 | — | ||||||||
Total restructuring expense | $ | 1,920 | $ | 4,392 | $ | — | |||||
Included in cost of revenue | $ | — | $ | 1,784 | $ | — | |||||
Included in operating expenses | 1,920 | 2,608 | — | ||||||||
During 2017, we incurred expenses of $1.9 million related to the 2017 Plan, which consisted of costs associated with employee severance and benefits. Through December 31, 2017, the cumulative amount incurred related to the 2017 Plan is $1.9 million, none of which is included in cost of revenue. As we continue to implement the 2017 Plan, we expect to incur negligible additional restructuring charges during 2018 related to the plan.
During 2016, we incurred expenses of $4.4 million related to the 2016 Plan, which primarily consisted of costs associated with employee severance and benefits of $2.6 million and the abandonment of certain assets of $1.7 million. The 2016 Plan was completed at the end of 2016 and we did not incur any further restructuring charges related to the 2016 Plan during 2017. Through December 31, 2017, the cumulative amount incurred related to the 2016 Plan is $4.4 million, of which $1.8 million is included in cost of revenue.
Interest expense and other, net
Interest expense and other, net, consisted of the following (in thousands):
Year ended December 31, | |||||||||||
2017 | 2016 | 2015 | |||||||||
Interest expense | $ | (878 | ) | $ | (446 | ) | $ | (450 | ) | ||
Fair value adjustment on convertible debt conversion option | (743 | ) | — | — | |||||||
Discount accretion on convertible debt fair value | (196 | ) | — | — | |||||||
Interest income | 141 | 40 | 4 | ||||||||
Gain on debt extinguishment | 29 | — | — | ||||||||
Total interest expense and other, net | $ | (1,647 | ) | $ | (406 | ) | $ | (446 | ) | ||
The increase in interest expense in 2017 compared to 2016 is due to contractual interest on convertible debt, as well as imputed interest on short and long-term liabilities acquired as a part of the Acquisition.
40
Provision for income taxes
The provision for income taxes was as follows (in thousands):
Year ended December 31, | |||||||||||
2017 | 2016 | 2015 | |||||||||
Provision for income taxes | $ | 493 | $ | 355 | $ | 320 | |||||
The income tax expense recorded for the year ended December 31, 2017 is comprised of $1.0 million in current and deferred tax expense for our profitable cost-plus foreign jurisdictions and accruals for tax contingencies in foreign jurisdictions, partially offset by $0.3 million benefit related to the treatment of AMT tax credits under the Tax Cuts and Jobs Act ("TCJA") and $0.2 million for the reversal of previously recorded tax contingencies due to the expiration of the applicable statute of limitations.
The income tax expense recorded for the year ended December 31, 2016 is comprised of $0.6 million in current and deferred tax expense for our profitable cost-plus foreign jurisdictions and accruals for tax contingencies in foreign jurisdictions, partially offset by $0.2 million for the reversal of previously recorded tax contingencies due to the expiration of the applicable statute of limitations.
The income tax expense recorded for the year ended December 31, 2015 is comprised of $0.6 million in current and deferred tax expense for our profitable cost-plus foreign jurisdictions and accruals for tax contingencies in foreign jurisdictions, partially offset by $0.3 million for the reversal of previously recorded tax contingencies due to the expiration of the applicable statute of limitations.
As of December 31, 2017 and 2016, we continue to record a full valuation allowance against our U.S. net deferred tax assets as it is not more likely than not that we will realize a benefit from these assets in a future period. We have not provided a valuation allowance against any of our other foreign net deferred tax assets, with the exception of Canada, as we have concluded it is more likely than not that we will realize a benefit from these assets in a future period because our subsidiaries in these jurisdictions are cost-plus taxpayers.
As of December 31, 2017, we have federal, state and foreign net operating loss carryforwards of approximately $215.3 million, $11.4 million, and $38.6 million respectively, which will expire between 2019 and 2037. As of December 31, 2017, we have available federal, state and foreign research and experimentation tax credit carryforwards of approximately $9.0 million, $4.0 million and $27.3 million respectively. The federal and state tax credits will begin expiring in 2019 while the foreign tax credits have an indefinite life. In addition, our Canadian subsidiary has unclaimed scientific and experimental expenditures to be carried forward and applied against future income in Canada of approximately $119,447. We have a general foreign tax credit of $1.7 million which will begin expiring in 2018. Our ability to utilize our federal net operating losses may be limited by Section 382 of the Internal Revenue Code of 1986, as amended, which imposes an annual limit on the ability of a corporation that undergoes an "ownership change" to use its net operating loss carryforwards to reduce its tax liability. An ownership change is generally defined as a greater than 50% increase in equity ownership by 5% shareholders in any three-year period.
Additional information regarding our expectations with respect to the impact of the TCJA on our taxes and financial results can be found in "Note 10: Income Taxes." in Part II, Item 8 of this Form 10-K.
Liquidity and Capital Resources
Cash and cash equivalents
Total cash and cash equivalents increased $7.9 million from $19.6 million at December 31, 2016 to $27.5 million at December 31, 2017. The net increase was the result of $12.2 million provided by operating activities, $3.0 million in proceeds from the issuances of common stock under our employee equity incentive plans and $1.9 million net cash acquired in the Acquisition. These increases were partially offset by $4.0 million used in payments on the line of credit associated with the Acquisition, $2.5 million used for purchases of property and equipment, $1.7 million in payments on other asset financings and $1.0 million used in payments on convertible debt.
Total cash and cash equivalents decreased $7.0 million from $26.6 million at December 31, 2015 to $19.6 million at December 31, 2016. The net decrease resulted primarily from $3.0 million used to pay the outstanding balance on our line of credit, $2.1 million used for purchases of property and equipment and $1.4 million used for payments on other asset financings. The decrease was also due to $1.5 million used in operating activities primarily due to our net loss recorded in 2016, partially offset by changes in working capital. These decreases were partially offset by $1.1 million in proceeds from the issuances of common stock under our employee equity incentive plans.
41
As of December 31, 2017, our cash and cash equivalents balance of $27.5 million consisted of $4.1 million in cash and $23.4 million in U.S. denominated money market funds. Although we did not hold short- or long-term investments as of December 31, 2017, our investment policy requires that our portfolio maintains a weighted average maturity of less than 12 months. Additionally, no maturities can extend beyond 24 months and concentrations with individual securities are limited. At the time of purchase, short-term credit rating must be rated at least A-1 / P-1 / F-1 by at least two Nationally Recognized Statistical Rating Organizations ("NRSRO") and securities of issuers with a long-term credit rating must be rated at least A or A2 by at least two NRSROs. Our investment policy is reviewed at least annually by our Audit Committee.
Accounts receivable, net
Accounts receivable, net increased to $4.6 million at December 31, 2017 from $3.1 million at December 31, 2016. Average number of days sales outstanding increased to 23 days at December 31, 2017 from 18 days at December 31, 2016. The increase in accounts receivable and days sales outstanding was partially due to an increase in sales due to the Acquisition and partially due to normal fluctuations in the timing of sales and customer receipts within the fourth quarter of 2017, and the fourth quarter of 2016.
Inventories
Inventories were $2.8 million at December 31, 2017 and $2.8 million at December 31, 2016. Inventory turnover increased to 10.6 at December 31, 2017 from 10.1 at December 31, 2016. Inventory turnover is calculated based on annualized quarterly operating results and average inventory balances during the quarter.
Capital resources
Short-term line of credit
On December 21, 2010, we entered into a Loan and Security Agreement with Silicon Valley Bank (the "Bank"), which was amended on December 14, 2012, December 4, 2013, December 18, 2015, December 15, 2016, July 21, 2017 and December 21, 2017 (as amended, the "Revolving Loan Agreement"). The Revolving Loan Agreement provides a secured working capital-based revolving line of credit (the "Revolving Line") in an aggregate amount of up to the lesser of (i) $10.0 million, or (ii) $1.0 million plus 80% of eligible domestic accounts receivable and certain foreign accounts receivable. The Revolving Line has a maturity date of December 28, 2018. In addition, the Revolving Loan Agreement provides for non-formula advances of up to $10.0 million which may be made solely during the last five business days of any fiscal month or quarter and which must be repaid by us on or before the fifth business day after the applicable fiscal month or quarter end. Due to their repayment terms, non-formula advances do not provide us with usable liquidity.
The Revolving Loan Agreement, as amended, contains customary affirmative and negative covenants as well as customary events of default. The occurrence of an event of default could result in the acceleration of our obligations under the Revolving Loan Agreement, as amended, and an increase to the applicable interest rate, and would permit the Bank to exercise remedies with respect to its security interest. As of December 31, 2017, we were in compliance with all of the terms of the Revolving Loan Agreement, as amended.
As of December 31, 2017 and December 31, 2016, we had no outstanding borrowings under the Revolving Line.
Liquidity
As of December 31, 2017, our cash and cash equivalents balance was highly liquid. We anticipate that our existing working capital will be adequate to fund our operating, investing and financing needs for at least the next twelve months. We may pursue financing arrangements including the issuance of debt or equity securities or reduce expenditures, or both, to meet the Company’s cash requirements, including in the longer term. There is no assurance that, if required, we will be able to raise additional capital or reduce discretionary spending to provide the required liquidity which, in turn, may have an adverse effect on our results of operations, financial position and cash flows.
42
From time to time, we evaluate acquisitions of businesses, products or technologies that complement our business. For example, on August 2, 2017 we closed our acquisition of ViXS and issued 3,708,263 of our shares of common stock as consideration. Any additional transactions, if consummated, may consume a material portion of our working capital or require the issuance of equity securities that may result in dilution to existing shareholders. Our ability to generate cash from operations is also subject to substantial risks described in Part I, “Item 1A., Risk Factors.” If any of these risks occur, we may be unable to generate or sustain positive cash flow from operating activities. We would then be required to use existing cash and cash equivalents to support our working capital and other cash requirements. If additional funds are required to support our working capital requirements, acquisitions or other purposes, we may seek to raise funds through debt financing, equity financing or from other sources. If we raise additional funds through the issuance of equity or convertible debt securities, the percentage ownership of our shareholders could be significantly diluted, and these newly-issued securities may have rights, preferences or privileges senior to those of existing shareholders. If we raise additional funds by obtaining loans from third parties, the terms of those financing arrangements may include negative covenants or other restrictions on our business that could impair our operating flexibility, and would also require us to incur interest expense. We can provide no assurance that additional financing will be available at all or, if available, that we would be able to obtain additional financing on terms favorable to us.
Additionally, in connection with the Acquisition, we assumed convertible debt with an aggregate outstanding principal amount as of December 31, 2017 of approximately $4.7 million U.S. dollars. The convertible debt has a 10% per year interest rate, subject to certain downward adjustments, and $2.1 million of the principal amount of convertible notes is due September 2019 and $2.6 million is due January 2020. The convertible debt is convertible at any time at the option of the holder and we have the option to redeem the convertible debt for 110% of the principal amount plus interest through December 31, 2017 or 100% of the principal amount plus interest thereafter. On January 12, 2018, the Company provided notice to the holders of the convertible debt of its election to redeem the convertible debt in full as of March 13, 2018. Additional information regarding the convertible debt can be found in "Note 5: Convertible Debt." and "Note 16: Subsequent Events" in Part II, Item 8 of this Form 10-K.
Critical Accounting Policies and Estimates
The preparation of financial statements in conformity with U.S. generally accepted accounting principles requires us to make estimates and judgments that affect the amounts reported. On an ongoing basis, we evaluate our estimates, including those related to revenue recognition, product returns, warranty obligations, bad debts, inventories, property and equipment, impairment of long-lived assets, valuation of goodwill, valuation of convertible debt, valuation of share-based payments, income taxes, litigation and other contingencies. We base our estimates on historical experience and various other assumptions that we believe to be reasonable under the circumstances. Actual results may differ from these estimates under different assumptions or conditions.
We believe the following critical accounting policies affect our more significant judgments and estimates used in the preparation of our consolidated financial statements:
Revenue Recognition. We recognize revenue when persuasive evidence of an arrangement exists, delivery has occurred or services have been rendered, the price is fixed and determinable, and collection is reasonably assured. For product sales, we require customers to provide purchase orders prior to shipment and we consider delivery to occur upon shipment provided title and risk of loss have passed to the customer based on the shipping terms. These conditions are generally satisfied upon shipment of the underlying product.
On occasion, we derive revenue from the license of our internally developed IP. IP licensing agreements that we enter into generally provide licensees the right to incorporate our IP components in their products with terms and conditions that vary by licensee. Our license fee arrangements generally include multiple deliverables and we are required to determine whether there is more than one unit of accounting. To the extent that the deliverables are separable into multiple units of accounting, we allocate the total fee on such arrangements to the individual units of accounting using management’s best estimate of selling price ("ESP"), if third party evidence ("TPE") or vendor specific objective evidence ("VSOE") does not exist. We defer revenue recognition for consideration that is contingent upon future performance or other contractual terms.
The Company’s process for determining its ESP for deliverables without VSOE or TPE considers multiple factors that may vary depending upon the unique facts and circumstances related to each deliverable. The key factors considered by the Company in developing the ESPs include the nature and complexity of different technologies being licensed, our cost to provide the deliverables, the availability of substitute technologies in the marketplace and the Company’s historical pricing practices. We then recognize revenue for each unit of accounting depending on the nature of the deliverable(s) comprising the unit of accounting in accordance with the revenue recognition criteria mentioned above.
43
Sales Returns and Allowances. Our customers do not have a stated right to return product except for replacement of defective products under our warranty program discussed below. However, we have accepted customer returns on a case-by-case basis as customer accommodations in the past. As a result, we provide for these returns in our reserve for sales returns and allowances. At the end of each reporting period, we estimate the reserve for returns based on historical experience and knowledge of any applicable events or transactions.
Certain of our distributors have stock rotation provisions in their distributor agreements, which allow them to return a limited amount of their in-stock inventory in exchange for products of equal value. At the end of each reporting period, we estimate the reserve for stock rotations based on historical experience and knowledge of any applicable events or transactions.
Product Warranties. We warrant that our products will be free from defects in materials and workmanship for a period of twelve months from delivery. Warranty repairs are guaranteed for the remainder of the original warranty period. Our warranty is limited to repairing or replacing products, or refunding the purchase price.
At the end of each reporting period, we estimate a reserve for warranty returns based on historical experience and knowledge of any applicable events or transactions. While we engage in extensive product quality programs and processes, which include actively monitoring and evaluating the quality of our suppliers, should actual product failure rates or product replacement costs differ from our estimates, revisions to the estimated warranty liability may be required.
Allowance for Doubtful Accounts. We offer credit to customers after careful examination of their creditworthiness. We maintain an allowance for doubtful accounts for estimated losses that may result from the inability of our customers to make required payments. At the end of each reporting period, we estimate the allowance for doubtful accounts based on our account-by-account risk analysis of outstanding receivable balances. The determination to write-off specific accounts receivable balances is made based on the likelihood of collection and past due status. Past due status is based on invoice date and terms specific to each customer. If the financial condition of our customers were to deteriorate, resulting in an impairment of their ability to make payments, additional allowances may be required.
Inventory Valuation. We value inventory at the lower of cost or market. In addition, we write down any obsolete, unmarketable or otherwise impaired inventory to net realizable value. The determination of obsolete or excess inventory requires us to estimate the future demand for our products. The estimate of future demand is compared to inventory levels to determine the amount, if any, of obsolete or excess inventory. If actual market conditions are less favorable than those we projected at the time the inventory was written down, additional inventory write-downs may be required. Inventory valuation is re-evaluated on a quarterly basis.
Useful Lives and Recoverability of Equipment and Other Long-Lived Assets. We evaluate the remaining useful life and recoverability of equipment and other assets, including identifiable intangible assets, whenever events or changes in circumstances indicate that the carrying amount of the assets may not be recoverable. If there is an indicator of impairment, we prepare an estimate of future, undiscounted cash flows expected to result from the use of each asset and its eventual disposition. If these cash flows are less than the carrying value of the asset, we adjust the carrying amount of the asset to its estimated fair value. While we have concluded that the carrying value of our long-lived assets is recoverable as of December 31, 2017, our analysis is dependent upon our estimates of future cash flows and our actual results may vary.
Goodwill. Goodwill is not amortized, rather tested, at least annually, for impairment at a reporting unit level. Impairment of goodwill is the condition that exists when the carrying amount of a reporting unit that includes goodwill exceeds its fair value. A goodwill impairment loss is recognized for the amount that the carrying amount of the reporting unit, including goodwill, exceeds its fair value, limited to the total amount of goodwill allocated to that reporting unit. If the fair value of a reporting unit exceeds the carrying amount, goodwill of the reporting unit is not considered impaired.
We evaluate impairment using the guidance set forth in FASB Accounting Standards Update No. 2017-04, Intangibles-Goodwill and Other (Topic 350): Simplifying the Test for Goodwill Impairment ("ASU 2017-04") which states that an entity may first assess qualitative factors to determine whether it is necessary to perform the quantitative goodwill impairment test. If determined to be necessary, the quantitative impairment test shall be used to identify goodwill impairment and measure the amount of goodwill impairment loss to be recognized. An entity has an unconditional option to bypass the qualitative assessment for any reporting unit in any period and proceed directly to the quantitative goodwill impairment test. Accordingly, we have elected to bypass the qualitative assessment and proceed directly to the quantitative goodwill impairment test. We tested goodwill for impairment under the quantitative goodwill impairment test as during the fourth quarter and concluded that goodwill was not impaired.
44
Convertible Debt and Conversion Option. The convertible debt was recorded at fair value in our consolidated balance sheet on the date of the Acquisition, however, fair value adjustments are not required after the Acquisition date. The fair value of the conversion feature is calculated using the Tsiveriotis and Fernandes Convertible Debt Model. Three primary assumptions used in the calculations are volatility, credit spread and risk free rate of interest. The embedded conversion feature is measured at fair value on a recurring basis and included with convertible debt in our consolidated balance sheet.
Stock-Based Compensation. Stock-based compensation expense is measured at the grant date, based on the estimated fair value of the award using the Black-Scholes option pricing model for stock options and market price for restricted stock units. The use of the Black-Scholes option pricing model, requires certain estimates, including an expected forfeiture rate and expected term of options granted. We also make decisions regarding the method of calculating expected volatilities and the risk-free interest rate used in the option-pricing model. The resulting calculated fair value of stock options is recognized as compensation expense over the requisite service period, which is generally the vesting period. When there are changes to the assumptions used in the option-pricing model, including fluctuations in the market price of our common stock, there will be variations in the calculated fair value of our future stock option awards, which results in variation in the stock-based compensation expensed recognized. Additionally, any modification of an award that increases its fair value will require us to recognize additional expense.
Income Taxes. We record deferred income taxes for temporary differences between the amount of assets and liabilities for financial and tax reporting purposes and we record a valuation allowance to reduce our deferred tax assets to the amount that is more likely than not to be realized. We also regularly conduct a comprehensive review of our uncertain tax positions. In this regard, an uncertain tax position represents our expected treatment of a tax position taken in a filed tax return, or planned to be taken in a future tax return, that has not been reflected in measuring income tax expense for financial reporting purposes. Until these positions are sustained by the taxing authorities, we do not recognize the tax benefits resulting from such positions and report the tax effects for uncertain tax positions in our consolidated balance sheets.
Contractual Payment Obligations
A summary of our contractual obligations as of December 31, 2017 is as follows:
Payments Due By Period | |||||||||||||||||||
Contractual Obligation | Total | Less than 1 year | 1-3 years | 3-5 years | More than 5 years | ||||||||||||||
Estimated purchase commitments to contract manufacturers | $ | 5,807 | $ | 5,807 | $ | — | $ | — | $ | — | |||||||||
Operating leases | 5,067 | 2,564 | 2,172 | 331 | — | ||||||||||||||
Convertible debt 1 | 4,749 | — | 4,749 | — | — | ||||||||||||||
Payments on accrued balances related to asset financings | 2,546 | 1,904 | 642 | — | — | ||||||||||||||
Interest on convertible debt 1 | 1,082 | 475 | 607 | — | — | ||||||||||||||
Other purchase obligations and commitments | 1,676 | 222 | 548 | 558 | 348 | ||||||||||||||
Total 2 | $ | 20,927 | $ | 10,972 | $ | 8,718 | $ | 889 | $ | 348 | |||||||||
1 | On January 12, 2018, the Company provided notice to the holders of the convertible debt of its election to redeem the convertible debt in full as of March 13, 2018. Additional information regarding the convertible debt can be found in "Note 5: Convertible Debt." and "Note 16: Subsequent Events" in Part II, Item 8 of this Form 10-K. |
2 | We are unable to reliably estimate the timing of future payments related to uncertain tax positions and repatriation of foreign earnings; therefore, $2.3 million of income taxes payable has been excluded from the table above. |
Off-Balance Sheet Arrangements
We do not have any off-balance sheet arrangements that have, or are reasonably likely to have, a material current or future effect on our financial condition, results of operations, liquidity, capital expenditures or capital resources.
Recent Accounting Pronouncements
See "Note 2: Summary of Significant Accounting Policies" in Part II, Item 8 of this Form 10-K for a description of recent accounting pronouncements, including the expected dates of adoption and estimated effects, if any, on our consolidated financial statements.
45
Item 7A. | Quantitative and Qualitative Disclosures about Market Risk. |
Interest Rate Risk
As of December 31, 2017, all of our cash equivalents were held in highly liquid money market accounts, accordingly, we do not have significant exposure to changes in interest rates and do not consider our interest rate risk to be material.
Exchange Rate Risk
We are exposed to risks resulting from the fluctuations of foreign currencies, primarily those of Canada, Japan, Taiwan, Korea and the People's Republic of China, however we do not consider our exchange rate risk to be material. We sell our products to original equipment manufacturers ("OEMs") that incorporate our products into other products that they sell outside of the U.S. While sales of our products to OEMs are denominated in U.S. dollars, the products sold by OEMs are denominated in foreign currencies. Accordingly, any strengthening of the U.S. dollar against these foreign currencies will increase the foreign currency price equivalent of our products, which could lead to a change in the competitive nature of these products in the marketplace.
In addition, a portion of our operating expenses, such as employee salaries and foreign income taxes, are denominated in foreign currencies. Accordingly, our operating results are affected by changes in the exchange rate between the U.S. dollar and those currencies. Any future strengthening of those currencies against the U.S. dollar will negatively impact our operating results by increasing our operating expenses as measured in U.S. dollars. We analyze our exposure to foreign currency fluctuations and may engage in financial hedging techniques in the future to attempt to minimize the effect of these potential fluctuations; however, foreign currency exchange rate fluctuations may adversely affect our financial results in the future.
Item 8. | Financial Statements and Supplementary Data. |
The following financial statements and reports are included in Item 8:
46
Report of Independent Registered Public Accounting Firm
To the Shareholders and Board of Directors
Pixelworks, Inc.:
Opinion on the Consolidated Financial Statements
We have audited the accompanying consolidated balance sheets of Pixelworks, Inc. and subsidiaries (the “Company”) as of December 31, 2017 and 2016, the related consolidated statements of operations, comprehensive loss, shareholders’ equity, and cash flows for each of the years in the three‑year period ended December 31, 2017, and the related notes (collectively, the “consolidated financial statements”). In our opinion, the consolidated financial statements present fairly, in all material respects, the financial position of the Company as of December 31, 2017 and 2016, and the results of its operations and its cash flows for each of the years in the three‑year period ended December 31, 2017, in conformity with U.S. generally accepted accounting principles.
We also have audited, in accordance with the standards of the Public Company Accounting Oversight Board (United States) (“PCAOB”), the Company’s internal control over financial reporting as of December 31, 2017, based on criteria established in Internal Control - Integrated Framework (2013) issued by the Committee of Sponsoring Organizations of the Treadway Commission, and our report dated March 14, 2018 expressed an unqualified opinion on the effectiveness of the Company’s internal control over financial reporting.
Basis for Opinion
These consolidated financial statements are the responsibility of the Company’s management. Our responsibility is to express an opinion on these consolidated financial statements based on our audits. We are a public accounting firm registered with the PCAOB and are required to be independent with respect to the Company in accordance with the U.S. federal securities laws and the applicable rules and regulations of the Securities and Exchange Commission and the PCAOB.
We conducted our audits in accordance with the standards of the PCAOB. Those standards require that we plan and perform the audit to obtain reasonable assurance about whether the consolidated financial statements are free of material misstatement, whether due to error or fraud. Our audits included performing procedures to assess the risks of material misstatement of the consolidated financial statements, whether due to error or fraud, and performing procedures that respond to those risks. Such procedures included examining, on a test basis, evidence regarding the amounts and disclosures in the consolidated financial statements. Our audits also included evaluating the accounting principles used and significant estimates made by management, as well as evaluating the overall presentation of the consolidated financial statements. We believe that our audits provide a reasonable basis for our opinion.
We have served as the Company’s auditor since 1997.
/s/ KPMG LLP |
Portland, Oregon |
March 14, 2018 |
47
PIXELWORKS, INC.
CONSOLIDATED BALANCE SHEETS
(In thousands, except share data)
December 31, | |||||||
2017 | 2016 | ||||||
ASSETS | |||||||
Current assets: | |||||||
Cash and cash equivalents | $ | 27,523 | $ | 19,622 | |||
Accounts receivable, net | 4,640 | 3,118 | |||||
Inventories | 2,846 | 2,803 | |||||
Prepaid expenses and other current assets | 1,328 | 736 | |||||
Total current assets | 36,337 | 26,279 | |||||
Property and equipment, net | 5,605 | 3,793 | |||||
Other assets, net | 1,338 | 785 | |||||
Acquired intangible assets, net | 5,856 | — | |||||
Goodwill | 18,407 | — | |||||
Total assets | $ | 67,543 | $ | 30,857 | |||
LIABILITIES AND SHAREHOLDERS' EQUITY | |||||||
Current liabilities: | |||||||
Accounts payable | $ | 1,436 | $ | 1,734 | |||
Accrued liabilities and current portion of long-term liabilities | 16,387 | 7,860 | |||||
Current portion of income taxes payable | 445 | 140 | |||||
Total current liabilities | 18,268 | 9,734 | |||||
Long-term liabilities, net of current portion | 1,487 | 194 | |||||
Convertible debt | 6,069 | — | |||||
Income taxes payable, net of current portion | 2,282 | 1,880 | |||||
Total liabilities | 28,106 | 11,808 | |||||
Commitments and contingencies (Note 11) | |||||||
Shareholders' equity: | |||||||
Preferred stock, $0.001 par value, 50,000,000 shares authorized, none issued | — | — | |||||
Common stock, $0.001 par value; 250,000,000 shares authorized, 34,651,087 and 28,885,795 shares issued and outstanding as of December 31, 2017 and 2016, respectively | 418,891 | 394,296 | |||||
Accumulated other comprehensive income | 20 | 10 | |||||
Accumulated deficit | (379,474 | ) | (375,257 | ) | |||
Total shareholders' equity | 39,437 | 19,049 | |||||
Total liabilities and shareholders' equity | $ | 67,543 | $ | 30,857 | |||
See accompanying notes to consolidated financial statements.
48
PIXELWORKS, INC.
CONSOLIDATED STATEMENTS OF OPERATIONS
(In thousands, except per share data)
Year Ended December 31, | |||||||||||
2017 | 2016 | 2015 | |||||||||
Revenue, net (1) | $ | 80,637 | $ | 53,390 | $ | 59,517 | |||||
Cost of revenue (2) | 38,873 | 28,322 | 30,224 | ||||||||
Gross profit | 41,764 | 25,068 | 29,293 | ||||||||
Operating expenses: | |||||||||||
Research and development (3) | 21,427 | 19,036 | 24,644 | ||||||||
Selling, general and administrative (4) | 20,450 | 13,770 | 14,453 | ||||||||
Restructuring | 1,920 | 2,608 | — | ||||||||
Total operating expenses | 43,797 | 35,414 | 39,097 | ||||||||
Loss from operations | (2,033 | ) | (10,346 | ) | (9,804 | ) | |||||
Interest expense and other, net (5) | (1,647 | ) | (406 | ) | (446 | ) | |||||
Loss before income taxes | (3,680 | ) | (10,752 | ) | (10,250 | ) | |||||
Provision for income taxes (6) | 493 | 355 | 320 | ||||||||
Net loss | $ | (4,173 | ) | $ | (11,107 | ) | $ | (10,570 | ) | ||
Net loss per share - basic and diluted | $ | (0.13 | ) | $ | (0.39 | ) | $ | (0.42 | ) | ||
Weighted average shares outstanding - basic and diluted | 31,507 | 28,276 | 25,088 | ||||||||
(1) Includes deferred revenue fair value adjustment | $ | 93 | $ | — | $ | — | |||||
(2) Includes: | |||||||||||
Inventory step-up and backlog amortization | 1,965 | — | — | ||||||||
Amortization of acquired intangible assets | 497 | — | — | ||||||||
Stock-based compensation | 243 | 190 | 196 | ||||||||
Restructuring | — | 1,784 | — | ||||||||
Additional amortization of non-cancelable prepaid royalty | — | — | (14 | ) | |||||||
(3) Includes stock-based compensation | 1,648 | 1,600 | 1,927 | ||||||||
(4) Includes: | |||||||||||
Acquisition and integration | 2,460 | — | — | ||||||||
Stock-based compensation | 2,352 | 872 | 1,798 | ||||||||
Amortization of acquired intangible assets | 168 | — | — | ||||||||
(5) Includes: | |||||||||||
Fair value adjustment on convertible debt conversion option | 743 | — | — | ||||||||
Discount accretion on convertible debt fair value | 196 | — | — | ||||||||
Gain on debt extinguishment | (29 | ) | — | — | |||||||
(6) Includes benefit related to tax reform | (343 | ) | — | — | |||||||
See accompanying notes to consolidated financial statements.
49
PIXELWORKS, INC.
CONSOLIDATED STATEMENTS OF COMPREHENSIVE LOSS
(In thousands)
Year Ended December 31, | |||||||||||
2017 | 2016 | 2015 | |||||||||
Net loss | $ | (4,173 | ) | $ | (11,107 | ) | $ | (10,570 | ) | ||
Other comprehensive income (loss): | |||||||||||
Foreign pension adjustment | 14 | 6 | (6 | ) | |||||||
Tax effect of pension adjustment | (4 | ) | (2 | ) | 1 | ||||||
Total comprehensive loss | $ | (4,163 | ) | $ | (11,103 | ) | $ | (10,575 | ) | ||
See accompanying notes to consolidated financial statements.
50
PIXELWORKS, INC.
CONSOLIDATED STATEMENTS OF CASH FLOWS
(In thousands)
Year Ended December 31, | |||||||||||
2017 | 2016 | 2015 | |||||||||
Cash flows from operating activities: | |||||||||||
Net loss | $ | (4,173 | ) | $ | (11,107 | ) | $ | (10,570 | ) | ||
Adjustments to reconcile net loss to net cash provided by (used in) operating activities: | |||||||||||
Stock-based compensation | 4,243 | 2,662 | 3,921 | ||||||||
Depreciation and amortization | 3,577 | 3,466 | 4,263 | ||||||||
Inventory step-up and backlog amortization | 1,965 | — | — | ||||||||
Fair value adjustment on convertible debt conversion option | 743 | — | — | ||||||||
Amortization of acquired intangible assets | 665 | — | — | ||||||||
Discount accretion on convertible debt fair value | 196 | — | — | ||||||||
Reversal of uncertain tax positions | (191 | ) | (170 | ) | (323 | ) | |||||
Gain on debt extinguishment | (29 | ) | — | — | |||||||
Write off of certain assets to restructuring | — | 1,744 | — | ||||||||
Deferred income tax expense | 4 | 22 | 23 | ||||||||
Other | 71 | 47 | 53 | ||||||||
Changes in operating assets and liabilities: | |||||||||||
Accounts receivable, net | (554 | ) | 2,870 | (1,340 | ) | ||||||
Inventories | 1,378 | 179 | (368 | ) | |||||||
Prepaid expenses and other current and long-term assets, net | 650 | (166 | ) | 163 | |||||||
Accounts payable | (2,063 | ) | (1,210 | ) | (210 | ) | |||||
Accrued current and long-term liabilities | 4,819 | 101 | 346 | ||||||||
Income taxes payable | 898 | 27 | 195 | ||||||||
Net cash provided by (used in) operating activities | 12,199 | (1,535 | ) | (3,847 | ) | ||||||
Cash flows from investing activities: | |||||||||||
Purchases of property and equipment | (2,484 | ) | (2,144 | ) | (3,012 | ) | |||||
Cash received in connection with acquisition of business | 1,901 | — | — | ||||||||
Purchases of licensed technology | — | — | (55 | ) | |||||||
Net cash used in investing activities | (583 | ) | (2,144 | ) | (3,067 | ) | |||||
Cash flows from financing activities: | |||||||||||
Payments on line of credit related to acquisition | (4,046 | ) | — | — | |||||||
Proceeds from issuances of common stock under employee equity incentive plans | 3,004 | 1,077 | 990 | ||||||||
Payments on asset financings | (1,673 | ) | (1,367 | ) | (1,767 | ) | |||||
Payments on convertible debt | (1,000 | ) | — | — | |||||||
Payments on line of credit | — | (3,000 | ) | — | |||||||
Net proceeds from equity offering | — | — | 16,356 | ||||||||
Net cash provided by (used in) financing activities | (3,715 | ) | (3,290 | ) | 15,579 | ||||||
Net increase (decrease) in cash and cash equivalents | 7,901 | (6,969 | ) | 8,665 | |||||||
Cash and cash equivalents, beginning of period | 19,622 | 26,591 | 17,926 | ||||||||
Cash and cash equivalents, end of period | $ | 27,523 | $ | 19,622 | $ | 26,591 | |||||
Supplemental disclosure of cash flow information: | |||||||||||
Cash paid during the year for interest | $ | 418 | $ | 139 | $ | 104 | |||||
Cash paid for income taxes, net of refunds received | 160 | 437 | 366 | ||||||||
Non-cash investing and financing activities: | |||||||||||
Value of shares issued in acquisition | $ | 16,975 | $ | — | $ | — | |||||
Acquisitions of property and equipment and other assets under extended payment terms | 3,558 | — | 765 | ||||||||
Value of debt converted into shares | 329 | — | — | ||||||||
See accompanying notes to consolidated financial statements.
51
PIXELWORKS, INC.
CONSOLIDATED STATEMENTS OF SHAREHOLDERS' EQUITY
(In thousands, except share data)
Common Stock | Accumulated Other Comprehensive Income (Loss) | Accumulated Deficit | Total Shareholders' Equity | |||||||||||||||
Shares | Amount | |||||||||||||||||
Balance as of December 31, 2014 | 23,220,534 | 369,253 | 11 | (353,580 | ) | 15,684 | ||||||||||||
Stock issued under employee equity incentive plans | 806,174 | 990 | — | — | 990 | |||||||||||||
Equity offering | 3,737,500 | 16,356 | — | — | 16,356 | |||||||||||||
Stock-based compensation expense | — | 3,921 | — | — | 3,921 | |||||||||||||
Net loss | — | — | — | (10,570 | ) | (10,570 | ) | |||||||||||
Foreign pension adjustment, net of tax of $(1) | — | — | (5 | ) | — | (5 | ) | |||||||||||
Balance as of December 31, 2015 | 27,764.208 | 390,520 | 6 | (364,150 | ) | 26,376 | ||||||||||||
Stock issued under employee equity incentive plans | 1,121,587 | 1,077 | — | — | 1,077 | |||||||||||||
Stock-based compensation expense | — | 2,662 | — | — | 2,662 | |||||||||||||
Other | — | 37 | — | — | 37 | |||||||||||||
Net loss | — | — | — | (11,107 | ) | (11,107 | ) | |||||||||||
Foreign pension adjustment, net of tax of $2 | — | — | 4 | — | 4 | |||||||||||||
Balance as of December 31, 2016 | 28,885,795 | 394,296 | 10 | (375,257 | ) | 19,049 | ||||||||||||
Stock issued under employee equity incentive plans | 2,001,782 | 3,004 | — | — | 3,004 | |||||||||||||
Stock-based compensation expense | — | 4,243 | — | — | 4,243 | |||||||||||||
Other | — | 44 | — | (44 | ) | — | ||||||||||||
Issuance of stock for acquisition | 3,708,262 | 16,975 | — | — | 16,975 | |||||||||||||
Debt conversion | 55,248 | 329 | — | — | 329 | |||||||||||||
Net loss | — | — | — | (4,173 | ) | (4,173 | ) | |||||||||||
Foreign pension adjustment, net of tax of $4 | — | — | 10 | — | 10 | |||||||||||||
Balance as of December 31, 2017 | 34,651,087 | $ | 418,891 | $ | 20 | $ | (379,474 | ) | $ | 39,437 | ||||||||
See accompanying notes to consolidated financial statements.
52
PIXELWORKS, INC.
NOTES TO CONSOLIDATED FINANCIAL STATEMENTS
(In thousands, except share and per share data)
NOTE 1. BASIS OF PRESENTATION
Nature of Business
Pixelworks designs, develops and markets visual display processing semiconductors, intellectual property cores, software and custom application specific integrated circuits ("ASIC") solutions for high-quality energy efficient video applications. In addition, we offer a suite of solutions for advanced media processing and the efficient delivery and streaming of video.
We enable worldwide manufacturers to offer leading-edge consumer electronics and professional display products, as well as video delivery and streaming solutions for content service providers. Our core visual display processing technology intelligently processes digital images and video from a variety of sources and optimizes the content for a superior viewing experience. Pixelworks’ video coding technology reduces storage requirements, significantly reduces bandwidth constraint issues and converts content between multiple formats to enable seamless delivery of video, including over-the-air (OTA) streaming, while also maintaining end-to-end content security.
The rapid growth in video-capable consumer devices, especially mobile, has increased the demand for visual display processing and video delivery technology in recent years. Our technologies can be applied to a wide range of devices from large-screen projectors to low-power mobile tablets, smartphones, high-quality video infrastructure equipment and streaming devices. Our products are architected and optimized for power, cost, bandwidth, and overall system performance, according to the requirements of the specific application. Our primary target markets include digital projection systems, tablets, smartphones, and OTA streaming devices.
As of December 31, 2017, we had an intellectual property portfolio of 536 patents related to the visual display of digital image data. We focus our research and development efforts on developing video algorithms that improve quality, and architectures that reduce system power, cost, bandwidth and increase overall system performance and device functionality. We seek to expand our technology portfolio through internal development and co-development with business partners, and we continually evaluate acquisition opportunities and other ways to leverage our technology into other high-value markets.
Pixelworks was founded in 1997 and is incorporated under the laws of the state of Oregon. On August 2, 2017, we acquired ViXS Systems, Inc., a corporation organized in Canada (“ViXS”).
Our consolidated financial statements include the accounts of Pixelworks and its wholly-owned subsidiaries. Intercompany accounts and transactions have been eliminated. All foreign subsidiaries use the U.S. dollar as the functional currency, and as a result, transaction gains and losses are included in the consolidated statements of operations. Transaction losses were $172, $153 and $125 for the years ended December 31, 2017, 2016 and 2015, respectively.
Use of Estimates
The preparation of condensed consolidated financial statements in conformity with U.S. generally accepted accounting principles ("U.S. GAAP") requires us to make estimates and judgments that affect amounts reported in the financial statements and accompanying notes. Our significant estimates and judgments include those related to revenue recognition, valuation of excess and obsolete inventory, lives and recoverability of equipment and other long-lived assets, valuation of goodwill, valuation of convertible debt, income taxes. The actual results experienced could differ materially from our estimates.
NOTE 2. SUMMARY OF SIGNIFICANT ACCOUNTING POLICIES
Cash and Cash Equivalents
We classify all cash and highly liquid investments with original maturities of three months or less at the date of purchase as cash and cash equivalents. Cash equivalents, which consist of U.S. denominated money market funds totaled $23,402 and $17,960 as of December 31, 2017 and 2016, respectively.
Accounts Receivable
Accounts receivable are recorded at invoiced amount and do not bear interest when recorded or accrue interest when past due. We maintain an allowance for doubtful accounts for estimated losses that may result from the inability of our customers to make required payments. At the end of each reporting period, we estimate the allowance for doubtful accounts based on an account-by-account risk analysis of outstanding receivable balances. The determination to write-off specific accounts receivable balances is made based on the likelihood of collection and past due status. Past due status is based on invoice date and terms specific to each customer.
53
Inventories
Inventories consist of finished goods and work-in-process, and are stated at the lower of standard cost (which approximates actual cost on a first-in, first-out basis) or market (net realizable value).
Property and Equipment
Property and equipment are stated at cost. Depreciation and amortization is calculated on a straight-line basis over the estimated useful life of the assets which are generally as follows:
Software | Lesser of 3 years or contractual license term | ||
Equipment, furniture and fixtures | 2 years | ||
Tooling | 2 to 4 years | ||
Leasehold improvements | Lesser of lease term or estimated useful life | ||
The cost of property and equipment repairs and maintenance is expensed as incurred.
Licensed Technology
We have capitalized licensed technology assets in other long-term assets. These assets are stated at cost and are amortized on a straight-line basis over the term of the license or the estimated life of the asset, if the license is not contractually limited, which is generally two to five years.
Useful Lives and Recoverability of Equipment and Other Long-Lived Assets
We evaluate the remaining useful life and recoverability of equipment and other assets, including identifiable intangible assets, whenever events or changes in circumstances indicate that the carrying amount of the assets may not be recoverable. If there is an indicator of impairment, we prepare an estimate of future, undiscounted cash flows expected to result from the use of each asset and its eventual disposition. If these cash flows are less than the carrying value of the asset, we adjust the carrying amount of the asset to its estimated fair value. We have concluded that the carrying value of our long-lived assets is recoverable as of December 31, 2017.
Goodwill
Goodwill is not amortized, rather tested, at least annually, for impairment at a reporting unit level. Impairment of goodwill is the condition that exists when the carrying amount of a reporting unit that includes goodwill exceeds its fair value. A goodwill impairment loss is recognized for the amount that the carrying amount of the reporting unit, including goodwill, exceeds its fair value, limited to the total amount of goodwill allocated to that reporting unit. If the fair value of a reporting unit exceeds the carrying amount, goodwill of the reporting unit is not considered impaired.
We evaluate impairment using the guidance set forth in FASB Accounting Standards Update No. 2017-04, Intangibles-Goodwill and Other (Topic 350): Simplifying the Test for Goodwill Impairment ("ASU 2017-04") which states that an entity may first assess qualitative factors to determine whether it is necessary to perform the quantitative goodwill impairment test. If determined to be necessary, the quantitative impairment test shall be used to identify goodwill impairment and measure the amount of goodwill impairment loss to be recognized. An entity has an unconditional option to bypass the qualitative assessment for any reporting unit in any period and proceed directly to the quantitative goodwill impairment test. Accordingly, we have elected to bypass the qualitative assessment and proceed directly to the quantitative goodwill impairment test. We tested goodwill for impairment under the quantitative goodwill impairment test during the fourth quarter of 2017 and concluded that goodwill was not impaired.
Revenue Recognition
We recognize revenue when persuasive evidence of an arrangement exists, delivery has occurred or services have been rendered, the price is fixed and determinable, and collection is reasonably assured. For product sales, we require customers to provide purchase orders prior to shipment and we consider delivery to occur upon shipment provided title and risk of loss have passed to the customer based on the shipping terms. These conditions are generally satisfied upon shipment of the underlying product.
54
There are no customer acceptance provisions associated with our products, and except for replacement of defective products under our warranty program discussed below, we have no obligation to accept product returns from end customers; however, we have accepted returns on a case-by-case basis as customer accommodations in the past. As a result, we provide for estimated reductions to gross profit for these sales returns in our reserve for sales returns and allowances. At the end of each reporting period, we estimate the reserve based on historical experience and knowledge of any applicable events or transactions. The reserve is included in accrued liabilities in our consolidated balance sheets.
A portion of our sales are made to distributors under agreements that grant the distributor limited stock rotation rights and price protection on in-stock inventory. The stock rotation rights allow these distributors to exchange a limited amount of their in-stock inventory for other Pixelworks product. As a result, we provide for estimated reductions to gross profit for these stock rotations in our reserve for sales returns and allowances. At the end of each reporting period, we estimate the reserve based on historical experience and knowledge of any applicable events or transactions. The reserve is included in accrued liabilities in our consolidated balance sheets.
On occasion, we derive revenue from the license of our internally developed intellectual property ("IP"). IP licensing agreements that we enter into generally provide licensees the right to incorporate our IP components in their products with terms and conditions that vary by licensee. Our license fee arrangements generally include multiple deliverables and we are required to determine whether there is more than one unit of accounting. To the extent that the deliverables are separable into multiple units of accounting, we allocate the total fee on such arrangements to the individual units of accounting using management’s best estimate of selling price ("ESP"), if third party evidence ("TPE") or vendor specific objective evidence ("VSOE") does not exist. We defer revenue recognition for consideration that is contingent upon future performance or other contractual terms.
The Company's process for determining its ESP for deliverables without VSOE or TPE considers multiple factors that may vary depending upon the unique facts and circumstances related to each deliverable. The key factors considered by the Company in developing the ESPs include the nature and complexity of the licensed technologies, our cost to provide the deliverables, the availability of substitute technologies in the marketplace and the Company's historical pricing practices. We then recognize revenue for each unit of accounting depending on the nature of the deliverable(s) comprising the unit of accounting in accordance with the revenue recognition criteria mentioned above.
Fees under these agreements generally include (a) license fees relating to our IP, (b) engineering services, and (c) support services. Historically, each of these elements have standalone value and therefore each are treated as separate units of accounting. Any future licensing arrangements will be analyzed based on the specific facts and circumstances which may be different than our historical licensing arrangements.
For deliverables related to licenses of our technology that involve significant engineering services, we recognize revenue in accordance with the provisions of the proportional performance method. We determine costs associated with engineering services using actual labor dollars incurred and estimated other direct or incremental costs allocated based on the percentage of time the engineer(s) spent on the project. These costs are deferred until revenue recognition criteria have been met, at which time they are reclassified as cost of revenue.
Warranty Program
We warrant that our products will be free from defects in material and workmanship for a period of twelve months from delivery. Warranty repairs are guaranteed for the remainder of the original warranty period. Our warranty is limited to repairing or replacing products, or refunding the purchase price. At the end of each reporting period, we estimate a reserve for warranty returns based on historical experience and knowledge of any applicable events or transactions. The reserve for warranty returns is included in accrued liabilities in our consolidated balance sheets.
Stock-Based Compensation
We currently sponsor a stock incentive plan that allows for issuance of employee stock options and restricted stock awards, including restricted stock units. We also have an employee stock purchase plan for all eligible employees. The fair value of share-based payment awards is expensed straight-line over the requisite service period, which is generally the vesting period, for the entire award. Additionally, any modification of an award that increases its fair value will require us to recognize additional expense.
The fair value of our stock option grants and purchase rights under our employee stock purchase plan are estimated as of the grant date using the Black-Scholes option pricing model which is affected by our estimates of the risk free interest rate, our expected dividend yield, expected term and the expected share price volatility of our common shares over the expected term. The fair value of our restricted stock awards are based on the market value of our stock on the date of grant.
55
Research and Development
Costs associated with research and development activities are expensed as incurred, except for items with alternate future uses which are capitalized and depreciated over their estimated useful lives.
On occasion, we enter into co-development arrangements with current or prospective integrated circuit ("IC") customers to defray a portion of the research and development expenses we expect to incur in connection with our development of an IC product. As amounts become due and payable, they are offset against research and development expense on a pro-rata basis.
Income Taxes
We account for income taxes under the asset and liability method. This approach requires the recognition of deferred tax assets and liabilities for the expected future tax consequences of temporary differences between financial statement carrying amounts and tax bases of assets and liabilities. Deferred tax assets and liabilities are measured using enacted tax rates expected to apply to taxable income in the years in which those temporary differences are expected to be recovered or settled. The effect on deferred tax assets and liabilities of a change in tax rates is recognized in income in the period that includes the enactment date. We establish a valuation allowance to reduce deferred tax assets if it is "more likely than not" that a portion or all of the asset will not be realized in future tax returns.
An uncertain tax position represents treatment of a tax position taken in a filed tax return, or planned to be taken in a future tax return, that has not been reflected in measuring income tax expense for financial reporting purposes. Until these positions are sustained by the taxing authorities, we do not recognize the tax benefits resulting from such positions and report the tax effects for uncertain tax positions in our consolidated balance sheets.
Accumulated Other Comprehensive Income
Accumulated other comprehensive income, net of tax, consists of the following:
December 31, | |||||||
2017 | 2016 | ||||||
Actuarial income on foreign pension obligation | $ | 35 | $ | 27 | |||
Accumulated transition foreign pension obligation | (15 | ) | (17 | ) | |||
Accumulated other comprehensive income | $ | 20 | $ | 10 | |||
56
Risks and Uncertainties
Concentration of Suppliers
We do not own or operate a semiconductor fabrication facility and do not have the resources to manufacture our products internally. We rely on a limited number of foundries and assembly and test vendors to produce all of our wafers and for completion of finished products. We do not have any long-term agreements with any of these suppliers. In light of these dependencies, it is reasonably possible that failure to perform by one of these suppliers could have a severe impact on our results of operations. Additionally, the concentration of these vendors within Taiwan, and the People’s Republic of China increases our risk of supply disruption due to natural disasters, economic instability, political unrest or other regional disturbances.
Risk of Technological Change
The markets in which we compete, or seek to compete, are subject to rapid technological change, frequent new product introductions, changing customer requirements for new products and features, and evolving industry standards. The introduction of new technologies and the emergence of new industry standards could render our products less desirable or obsolete, which could harm our business.
Concentrations of Credit Risk
Financial instruments that potentially subject us to concentrations of credit risk consist of cash equivalents and accounts receivable. We limit our exposure to credit risk associated with cash equivalent balances by holding our funds in high quality, highly liquid money market accounts. We limit our exposure to credit risk associated with accounts receivable by carefully evaluating creditworthiness before offering terms to customers.
Recent Accounting Pronouncements
In January 2017, the FASB issued Accounting Standards Update No. 2017-01, Business Combinations (Topic 805): Clarifying the Definition of a Business ("ASU 2017-01"). ASU 2017-01 clarifies the definition of a business and provides further guidance for evaluating whether a transaction will be accounted for as an acquisition of an asset or a business. ASU 2017-01 will become effective for us on January 1, 2018, with early adoption permitted. We do not expect the adoption of this update to have a material impact on our financial position, results of operations, or cash flows.
In January 2017, the FASB issued Accounting Standards Update No. 2017-04, Intangibles-Goodwill and Other (Topic 350): Simplifying the Test for Goodwill Impairment ("ASU 2017-04"). ASU 2017-04 simplifies the subsequent measurement of goodwill by eliminating the second step from the quantitative goodwill impairment test. We will continue to have the option to perform a qualitative assessment to determine if a quantitative goodwill impairment test is necessary. As permitted by ASU 2017-04, Pixelworks has elected to early adopt the amendments contained in ASU 2017-04 for our annual impairment test of goodwill during the fourth quarter of 2017. Accordingly, our 2017 goodwill impairment analysis was based on and reflected the requirements of ASU 2017-04. The adoption of this update did not have a material impact on our financial position, results of operations, or cash flows.
In March 2016, the FASB issued Accounting Standards Update No. 2016-09, Compensation - Stock Compensation (Topic 718): Improvements to Employee Shared-Based Payment Accounting ("ASU 2016-09"). ASU 2016-09 simplifies how several aspects of share-based payments are accounted for and presented in the financial statements, for example, an accounting policy election may be made to account for forfeitures as they occur, rather than based on an estimate of future forfeitures. In addition, under previous guidance, excess tax benefits and deficiencies from stock-based compensation arrangements were recorded in equity when the awards vested or were settled. ASU 2016-09 requires prospective recognition of excess tax benefits and deficiencies in the income statement. We adopted ASU 2016-09 on January 1, 2017, which included a policy election to account for forfeitures as they occur, and resulted in a cumulative-effect adjustment to retained earnings of $44 as of January 1, 2017. In addition, upon adoption the balance of the unrecognized excess tax benefits were recognized and the impact was recorded to retained earnings, including any change to the valuation allowance as a result of the adoption. Due to the full valuation allowance on the U.S. net deferred tax assets, this change did not impact our financial position, results of operations or cash flows.
57
In February 2016, the FASB issued Accounting Standards Update No. 2016-02, Leases (Topic 842) ("ASU 2016-02"). ASU 2016-02 requires a dual approach for lessee accounting under which a lessee would account for leases as finance leases or operating leases. Both finance leases and operating leases will result in the lessee recognizing a right-of-use (ROU) asset and a corresponding lease liability. For finance leases, the lessee would recognize interest expense and amortization of the ROU asset and for operating leases the lessee would recognize a straight-line total lease expense. ASU 2016-02 will become effective for us on January 1, 2019. While we are currently assessing the impact ASU 2016-02 will have on our financial statements, we expect the primary impact to our financial position upon adoption will be the recognition, on a discounted basis, of our minimum commitments under noncancelable operating leases on our consolidated balance sheets resulting in the recording of ROU assets and lease obligations.
In July 2015, the FASB issued Accounting Standards Update No. 2015-11, Simplifying the Measurement of Inventory ("ASU 2015-11"), which changes the measurement principle for inventory from the lower of cost or market to the lower of cost and net realizable value. ASU 2015-11 defines net realizable value as estimated selling prices in the ordinary course of business, less reasonably predictable costs of completion, disposal, and transportation. We adopted ASU 2015-11 on January 1, 2017 and it did not have a material impact our financial position, results of operations, or cash flows.
In May 2014, the FASB issued Accounting Standards Update No. 2014-09, Revenue from Contracts with Customers ("ASU 2014-09"), which requires that an entity recognize revenue when it transfers promised goods or services to customers in an amount that reflects the consideration to which the entity expects to be entitled in exchange for those goods or services. ASU 2014-09 will replace most existing revenue recognition guidance in U.S. GAAP when it becomes effective. ASU 2014-09 allows for either full retrospective or modified retrospective adoption and will become effective for us on January 1, 2018. We have developed an implementation plan to adopt this new guidance. As part of this plan, we assessed the impact of the new guidance on our results of operations. Based on our procedures performed to date, we do not expect the adoption of this standard to have a material impact on our financial statements but do anticipate increased disclosures after adoption. We adopted ASU 2014-09 on January 1, 2018 and we have selected the modified retrospective transition method. The adoption of this new standard did not result in a cumulative-effect adjustment to retained earnings as of January 1, 2018.
NOTE 3: ACQUISITION
On August 2, 2017, we acquired 100% of the outstanding shares of ViXS Systems, Inc. (“ViXS”), a Canadian corporation (the "Acquisition"). We issued 0.04836 of a share of our common stock in exchange for each share of ViXS common stock outstanding and for certain ViXS restricted stock units which were vested simultaneously with closing.
ViXS designs and develops advanced video processing semiconductor solutions. The acquisition of ViXS added families of video processor components for consumer applications and cloud, video delivery and infrastructure markets, along with a companion family of networking components to our solutions. These factors contributed to establishing the purchase price and supported the premium paid over the fair value of the tangible and intangible assets acquired.
The aggregate purchase price for ViXS was $16,975 and consisted of $16,316 related to the issuance of 3,586,021 shares of our common stock plus $659 related to: (i) the issuance of 202,043 unvested restricted stock units, in exchange for ViXS’ unvested restricted stock units, plus (ii) the issuance of 122,242 shares to a holder of ViXS restricted stock units which were vested simultaneously with closing. The purchase price calculations were based on the closing price of our common stock on the day the transaction closed.
The ViXS chief executive officer (the "CEO") was terminated in connection with the closing of the transaction. As a result, we recognized expense of $1,115, which consisted of $800 related to a severance agreement, payable over 24 months, and $315 related to accelerated vesting of the CEO’s ViXS restricted stock units which were exchanged for Pixelworks common stock at closing. Such amount is included within selling, general and administrative within our consolidated statement of operations for the year ended December 31, 2017.
58
The purchase price was preliminarily allocated to the assets and liabilities based on fair values as follows:
Purchase price | $ | 16,975 | ||||
Less net liabilities assumed: | ||||||
Assets acquired: | ||||||
Cash and cash equivalents | 1,901 | |||||
Accounts receivable | 968 | |||||
Inventories | 3,175 | |||||
Property and equipment | 964 | |||||
Other assets | 1,562 | |||||
Identifiable intangible assets | 6,730 | |||||
Liabilities assumed: | ||||||
Accounts payable | (1,736 | ) | ||||
Accrued liabilities and other current liabilities | (2,832 | ) | ||||
Revolving bank loan | (4,046 | ) | ||||
Convertible debt | (6,485 | ) | ||||
Other noncurrent liabilities | (1,633 | ) | (1,432 | ) | ||
Goodwill | $ | 18,407 | ||||
The allocation of purchase price consideration to assets and liabilities is not yet finalized. The preliminary allocation of the purchase price was based upon preliminary estimates and assumptions that are subject to change within the measurement period (up to one year from the acquisition date). Below are the significant valuations that were performed associated with the acquisition which were based upon preliminary estimates:
• | We performed a valuation of the convertible debt. We assigned value of $4,762 to convertible debt, consisting of the contractual amount of $6,068 offset by a debt discount of $1,306, and $1,723 related to the embedded conversion feature. No other features of the debt were assigned value at the acquisition date. |
• | We performed a valuation of acquired intangible assets. We have preliminarily assigned $5,050 of the purchase price to acquired developed technology with estimated lives of 5 years or less, $1,270 to customer relationships with estimated lives of 3 years or less, and $410 to backlog and trademark with estimated lives of 2 years or less. ViXS had no in-process research and development. |
• | We recorded an inventory step-up of $2,191 to record inventory at fair value. We are recognizing this within cost of goods sold as the inventory is sold which we expect to be over a period of approximately 12 months. |
During the fourth quarter, after further analysis of estimates and assumptions associated with the acquired ViXS inventory, we reduced the value of acquired inventory by $386 with a corresponding increase to goodwill.
We preliminarily recorded gross deferred tax assets of $62,992, subject to a valuation allowance of $62,972 to recognize book basis and tax basis differences of various balance sheet assets and liabilities and corporate tax attributes acquired.
The goodwill resulting from this transaction is not deductible for tax purposes.
The results of ViXS’ operations are included in our consolidated statement of operations beginning on the date of acquisition. ViXS revenue of $4,489 and net loss of $(6,729), which included $1,920 in restructuring charges, (see Note 7: "Restructurings") and $3,633 of non-cash amortization of acquisition and debt related items are included in our consolidated statement of operations for the year ended December 31, 2017.
59
The following table reflects the unaudited pro forma results of Pixelworks and ViXS as if the merger had taken place as of January 1, 2016:
Year Ended | |||||||
December 31, | |||||||
2017 | 2016 | ||||||
Revenue, net | $ | 90,764 | $ | 81,909 | |||
Net loss | $ | (3,733 | ) | $ | (25,234 | ) | |
Net loss per share: | |||||||
Basic | $ | (0.11 | ) | $ | (0.79 | ) | |
Diluted | $ | (0.11 | ) | $ | (0.79 | ) | |
Weighted average shares outstanding: | |||||||
Basic | 33,670 | 31,984 | |||||
Diluted | 33,670 | 31,984 | |||||
The unaudited pro forma net loss presented above includes adjustments for amortization of acquired intangible assets and other assets, and stock-based compensation as these items are expected to have a continuing effect on the consolidated results of operations of the combined company. The unaudited pro forma net income (loss) presented above does not reflect amortization of the mark-up of acquired inventory to fair value, or acquisition-related costs of $3,010 for the year ended December 31, 2017, as they are not reflective of the ongoing operations of the combined entities. Net loss reported for the year ended December 31, 2017 includes a $4,785 gain ViXS recognized on the sale of a product line during the period.
The pro-forma information does not necessarily reflect the actual results that would have occurred, nor is it necessarily indicative of future results of operations of the combined companies.
NOTE 4. BALANCE SHEET COMPONENTS
Accounts Receivable, Net
Accounts receivable consists of the following:
December 31, | |||||||
2017 | 2016 | ||||||
Accounts receivable, gross | $ | 4,687 | $ | 3,150 | |||
Allowance for doubtful accounts | (47 | ) | (32 | ) | |||
Accounts receivable, net | $ | 4,640 | $ | 3,118 | |||
The following is a summary of the change in our allowance for doubtful accounts:
Year Ended December 31, | |||||||||||
2017 | 2016 | 2015 | |||||||||
Balance at beginning of year | $ | 32 | $ | 60 | $ | 301 | |||||
Additions charged (reductions credited) | 15 | (28 | ) | 9 | |||||||
Accounts written-off, net of recoveries | — | — | (250 | ) | |||||||
Balance at end of year | $ | 47 | $ | 32 | $ | 60 | |||||
60
Inventories
Inventories consist of the following:
December 31, | |||||||
2017 | 2016 | ||||||
Finished goods | $ | 1,115 | $ | 1,707 | |||
Work-in-process | 1,731 | 1,096 | |||||
Inventories | $ | 2,846 | $ | 2,803 | |||
We recorded inventory write-downs, offset by sales of previously written-down inventory of $184 for the year ended December 31, 2017. We recorded inventory write-downs, offset by sales of previously written-down inventory of $257 for the year ended December 31, 2016, of which $285 was included in restructuring and was related to the write off of inventory associated with markets we are no longer pursuing. We recorded inventory write-downs, offset by sales of previously written-down inventory of $199 for the year ended December 31, 2015. The inventory write-downs were for lower of cost or market and excess and obsolescence exposure, offset by sales of previously written-down inventory of $165, $44 and $8 for the years ended December 31, 2017, 2016 and 2015, respectively.
Prepaid Expenses and Other Current Assets
Prepaid expenses and other current assets consist of current prepaid expenses, deposits, income taxes receivable and other receivables.
Property and Equipment, Net
Property and equipment consists of the following:
December 31, | |||||||
2017 | 2016 | ||||||
Equipment, furniture and fixtures | $ | 9,040 | $ | 10,070 | |||
Software | 6,112 | 6,295 | |||||
Tooling | 5,665 | 5,714 | |||||
Leasehold improvements | 2,255 | 2,337 | |||||
23,072 | 24,416 | ||||||
Accumulated depreciation and amortization | (17,467 | ) | (20,623 | ) | |||
Property and equipment, net | $ | 5,605 | $ | 3,793 | |||
Software amortization was $1,501, $1,755 and $2,127 for the years ended December 31, 2017, 2016 and 2015, respectively. Depreciation and amortization expense for equipment, furniture, fixtures, tooling and leasehold improvements was $2,076, $1,705 and $1,483 for the years ended December 31, 2017, 2016 and 2015, respectively.
Other Assets, Net
Other assets consist primarily of deposits, deferred tax assets and licensed technology. Amortization of licensed technology was $0, $6 and $653 for the years ended December 31, 2017, 2016 and 2015, respectively.
61
Acquired Intangible Assets, Net
In connection with the Acquisition, we recorded certain identifiable intangible assets. See Note 3: “Acquisition” for additional information. Acquired intangible assets resulting from this transaction consist of the following:
December 31, | |||||||
2017 | 2016 | ||||||
Developed technology | $ | 5,050 | $ | — | |||
Customer relationships | 1,270 | — | |||||
Backlog and tradename | 410 | — | |||||
6,730 | — | ||||||
Less: accumulated amortization | (874 | ) | — | ||||
Acquired intangible assets, net | $ | 5,856 | $ | — | |||
Intangible assets are amortized over the following estimated useful lives: developed technology and customer relationships, 3 to 5 years; and tradename and backlog, 6 to 18 months.
Amortization expense for intangible assets was $874 for the year ended December 31, 2017, with $706 included in cost of revenue and $168 included in selling, general and administrative on the consolidated statement of operations. As of December 31, 2017, future estimated amortization expense is as follows:
Years ending December 31: | |||
2018 | 1,648 | ||
2019 | 1,505 | ||
2020 | 1,496 | ||
2021 | 1,117 | ||
2022 | 90 | ||
$ | 5,856 | ||
Acquired intangible assets are reviewed for impairment whenever events or changes in circumstances indicate that the carrying amount may not be recoverable. Conditions that would trigger an impairment assessment include, but are not limited to, past, current, or expected cash flow or operating losses associated with the asset and an expectation that the asset will be significantly utilized before the end of its useful life. There were no such triggering events requiring an impairment assessment of other intangible assets as of December 31, 2017.
Goodwill
Goodwill resulted from our acquisition of ViXS on August 2, 2017, whereby we recorded goodwill of $18,407. See Note 3: "Acquisition" for information concerning the acquisition. See Note 2: "Summary of Significant Accounting Policies" for information on our assessment of goodwill impairment.
62
Accrued Liabilities and Current Portion of Long-Term Liabilities
Accrued liabilities and current portion of long-term liabilities consist of the following:
December 31, | |||||||
2017 | 2016 | ||||||
Accrued payroll and related liabilities | $ | 5,400 | $ | 2,169 | |||
Accrued interest payable | 2,770 | 2,078 | |||||
Accrued commissions and royalties | 2,610 | 2,427 | |||||
Current portion of accrued liabilities for asset financings | 1,701 | 389 | |||||
Deferred revenue | 418 | — | |||||
Accrued costs related to restructuring | 352 | 60 | |||||
Liability for warranty returns | 17 | 28 | |||||
Other | 3,119 | 709 | |||||
Accrued liabilities and current portion of long-term liabilities | $ | 16,387 | $ | 7,860 | |||
The following is a summary of the change in our liability for warranty returns:
Year Ended December 31, | |||||||||||
2017 | 2016 | 2015 | |||||||||
Liability for warranty returns: | |||||||||||
Balance at beginning of year | $ | 28 | $ | 49 | $ | 105 | |||||
Provision (benefit) | 2 | 6 | (24 | ) | |||||||
Charge-offs | (13 | ) | (27 | ) | (32 | ) | |||||
Balance at end of year | $ | 17 | $ | 28 | $ | 49 | |||||
63
Short-Term Line of Credit
On December 21, 2010, we entered into a Loan and Security Agreement with Silicon Valley Bank (the "Bank"), which was amended on December 14, 2012, December 4, 2013, December 18, 2015, December 15, 2016, July 21, 2017 and December 21, 2017 (as amended, the "Revolving Loan Agreement"). The Revolving Loan Agreement provides a secured working capital-based revolving line of credit (the "Revolving Line") in an aggregate amount of up to the lesser of (i) $10,000, or (ii) $1,000 plus 80% of eligible domestic accounts receivable and certain foreign accounts receivable. The Revolving Line has a maturity date of December 28, 2018. In addition, the Revolving Loan Agreement provides for non-formula advances of up to $10,000 which may be made solely during the last five business days of any fiscal month or quarter and which must be repaid by the Company on or before the fifth business day after the applicable fiscal month or quarter end.
Amounts advanced under the Revolving Line bear interest at an annual rate equal to the lender's prime rate plus 0.25%. The Revolving Loan Agreement, as amended also provides an option for LIBOR advances that bear interest based on the LIBOR rate. Interest on the Revolving Line is due monthly, with the balance due on December 28, 2018, which is the scheduled maturity date for the Revolving Line.
The Revolving Loan Agreement, as amended contains customary affirmative and negative covenants, including with respect to the following: compliance with laws, provision of financial statements and periodic reports, payment of taxes, maintenance of inventory and insurance, maintenance of operating accounts at the Bank, the Bank's access to collateral, formation or acquisition of subsidiaries, incurrence of indebtedness, dispositions of assets, granting liens, changes in business, ownership or business locations, engaging in mergers and acquisitions, making investments or distributions and affiliate transactions. The covenants also require that the Company maintain a minimum ratio of qualifying financial assets to the sum of qualifying financial obligations.
The Revolving Loan Agreement, as amended also contains customary events of default, including the following: defaults with respect to covenant compliance, the occurrence of a material adverse change, the occurrence of certain bankruptcy or insolvency events, cross-defaults, judgment defaults and material misrepresentations. The occurrence of an event of default could result in the acceleration of the Company's obligations under the Revolving Loan Agreement, as amended and an increase to the applicable interest rate, and would permit the Bank to exercise remedies with respect to its security interest.
To secure the repayment of any amounts borrowed under the Revolving Loan Agreement, as amended, the Company granted to the Bank a security interest in substantially all of its assets, excluding its intellectual property assets. The Company has agreed not to pledge or otherwise encumber its intellectual property assets without prior written permission from the Bank.
As of December 31, 2017 and December 31, 2016, we had no outstanding borrowings on the Revolving Line.
64
NOTE 5: CONVERTIBLE DEBT
As part of the Acquisition, we assumed secured convertible debt, which consists of the following as of December 31, 2017:
10% convertible notes, principal amount | $ | 4,749 | |
Unamortized debt discount | (1,030 | ) | |
Conversion feature, at fair value | 2,350 | ||
$ | 6,069 | ||
As a result of the change in control of ViXS, the convertible debt holders had a right to put the debt to the Company. A majority of the holders agreed to waive their right to accelerate and to accept 0.04836 share of our common stock for each share of ViXS common stock the holder would have been entitled to receive upon the exercise of the conversion option. During the year ended December 31, 2017, we repaid $1,000 to those holders that did not agree to waive their rights.
Key terms of the convertible debt include:
• | Currency - The convertible debt is denominated in Canadian dollars, with principal and interest payments made in Canadian dollars. As a result, we record foreign currency transaction gains or losses in our statement of operations related to the convertible debt. |
• | Interest - Stated rate of 10% per year, payable semi-annually. If the five day volume weighted average market price of our common stock exceeds the U.S. dollar equivalent of CAD $16.54 for 15 consecutive trading days, the interest rate will reset to a fixed rate of 1.0%. The five day volume weighted average market price for our common stock did not exceed such threshold during the year ended December 31, 2017. |
• | Maturity - $2,102 of the principal amount of convertible notes is due September 2019 and $2,647 is due January 2020. |
• | Conversion Option - Convertible at any time at the option of the holders into our common stock at a conversion price of CAD $7.24 per share for the convertible notes due September 2019 (of which the principal outstanding amount in Canadian dollars is CAD $2,640) and CAD $7.03 per share for the convertible notes due January 2020 (of which the principle outstanding amount in Canadian dollars is CAD $3,324), or 837,503 shares. |
• | Redemption - Through December 31, 2017, we may redeem the convertible debt for 110% of the principal amount plus accrued and unpaid interest. Thereafter, we may redeem the convertible debt for 100% of the principal amount plus accrued and unpaid interest. |
• | Default - There are certain events that require us to redeem the outstanding convertible debt for 100% of the principal plus accrued and unpaid interest. Such events include, but are not limited to, the failure to pay principal or interest in accordance with the terms of the agreement, the sale of intellectual property without the consent of the holders, and a change in control. |
For the year ended December 31, 2017, interest expense consisted of $227 related to the contractual rate of interest and $196 related to accretion of the discount. During the year ended December 31, 2017, we recorded net foreign currency gains of approximately $(4) in other expense, $0 of which was related to accretion of the discount.
The unamortized debt discount of $1,030, is expected to be amortized over two years.
On November 21, 2017, a convertible debt holder elected to convert their debt. The principal amount of the debt converted was CAD $400 and resulted in the issuance of 55,248 shares of our common stock which was valued at $329 on the date of conversion.
On January 12, 2018, the Company provided notice to the holders of the convertible debt of its election to redeem the convertible debt in full as of March 13, 2018. For additional information see "Note 16: Subsequent Events".
Conversion Feature
Because our functional currency is the U.S. dollar and the convertible debt, including the conversion option, is denominated in Canadian dollars, it is not indexed to our stock. As a result, the conversion option of the convertible debt is separately identified and recognized at fair value as a derivative liability. For the year ended December 31, 2017, $743 is included in other expense in our consolidated statement of operations for the increase in the fair value of the conversion feature.
Interest Deceleration Feature
The interest deceleration feature also qualifies as a derivative that requires separate accounting from the convertible debt. However, based on the terms of the convertible debt, we concluded that the interest deceleration will never occur because it would always be advantageous for us to call the convertible debt before the common stock reaches the price that triggers the reset. Accordingly, this derivative was assigned $0 value as of December 31, 2017.
65
NOTE 6. FAIR VALUE MEASUREMENTS
Fair value is defined as the price that would be received to sell an asset or paid to transfer a liability in an orderly transaction between market participants at the measurement date. Three levels of inputs may be used to measure fair value:
Level 1: | Valuations based on quoted prices in active markets for identical assets and liabilities. |
Level 2: | Valuations based on inputs other than quoted prices included within Level 1 that are observable for the asset or liability, either directly or indirectly. |
Level 3: | Valuations based on unobservable inputs in which there is little or no market data available, which require the reporting entity to develop its own assumptions. |
The following table presents information about our assets measured at fair value on a recurring basis in the consolidated balance sheets as of December 31, 2017 and 2016:
Level 1 | Level 2 | Level 3 | Total | ||||||||||||
As of December 31, 2017: | |||||||||||||||
Assets: | |||||||||||||||
Money market funds | $ | 23,402 | $ | — | $ | — | $ | 23,402 | |||||||
Liabilities: | |||||||||||||||
Convertible debt - including conversion feature | $ | — | $ | 5,300 | $ | — | $ | 5,300 | |||||||
Conversion feature - convertible debt | — | 2,350 | — | 2,350 | |||||||||||
As of December 31, 2016: | |||||||||||||||
Assets: | |||||||||||||||
Money market funds | $ | 17,960 | $ | — | $ | — | $ | 17,960 | |||||||
We primarily use the market approach to determine the fair value of our financial instruments. The fair value of our current assets and liabilities, including accounts receivable and accounts payable approximates the carrying value due to the short-term nature of these balances. We have currently chosen not to elect the fair value option for any items that are not already required to be measured at fair value in accordance with U.S. GAAP.
The fair value of the convertible debt conversion feature was calculated using the Tsiveriotis and Fernandes Convertible Debt Model. Three primary assumptions used in the calculations were: volatility of 60%, credit spread of 13.13% and risk free rate of 1.87%. The embedded conversion feature is measured at fair value on a recurring basis and included with convertible debt in our consolidated balance sheet. Convertible debt was recorded at fair value in our consolidated balance sheet on the date of the Acquisition, however fair value adjustments are not required after the Acquisition date.
66
NOTE 7: RESTRUCTURINGS
In September 2017, in connection with the Acquisition, we executed a restructuring plan to secure significant synergies between ViXS and Pixelworks. The plan included an approximately 15% reduction in workforce, primarily in the area of development, however, it also impacted administration and sales.
In April 2016, we executed a restructuring plan to streamline the Company’s operations and product offerings and to align the Company’s expenses with current revenue levels. The plan included an approximately 24% reduction in workforce, primarily in the area of development, however, it also impacted operations, sales and marketing. The plan also included abandonment of certain assets resulting in impairment charges to write off the assets associated with markets we are no longer pursuing.
Total restructuring expense included in our statement of operations for the years ended December 31, 2017, 2016 and 2015 is comprised of the following:
Year Ended December 31, | |||||||||||
2017 | 2016 | 2015 | |||||||||
Cost of revenue — restructuring: | |||||||||||
Tooling and inventory write offs | $ | — | $ | 1,679 | $ | — | |||||
Employee severance and benefits | — | 105 | — | ||||||||
— | 1,784 | — | |||||||||
Operating expenses — restructuring: | |||||||||||
Employee severance and benefits | $ | 1,920 | $ | 2,513 | $ | — | |||||
Licensed technology and other asset write offs | — | 65 | — | ||||||||
Other | — | 30 | — | ||||||||
1,920 | 2,608 | — | |||||||||
Total restructuring expense | $ | 1,920 | $ | 4,392 | $ | — | |||||
The following is a rollforward of the accrued liabilities related to restructuring for the year ended December 31, 2017:
Balance as of December 31, 2016 | Expensed | Payments | Balance as of December 31, 2017 | ||||||||||||
Employee severance and benefits | $ | 60 | $ | 1,920 | $ | (1,628 | ) | $ | 352 | ||||||
Accrued costs related to restructuring | $ | 60 | $ | 1,920 | $ | (1,628 | ) | $ | 352 | ||||||
NOTE 8: RESEARCH AND DEVELOPMENT
During the first quarter of 2017, we entered into a best efforts co-development agreement with a customer to defray a portion of the research and development expenses we expect to incur in connection with our development of an integrated circuit product to be sold exclusively to the customer. We expect our development costs to exceed the amounts received from the customer, and although we expect to sell units of the product to the customer, there is no commitment or agreement from the customer for such sales at this time. Additionally, we retain ownership of any modifications or improvements to our pre-existing intellectual property and may use such improvements in products sold to other customers.
Under the co-development agreement, $4,000 was payable by the customer within 60 days of the date of the agreement and two additional payments of $2,000 are each payable upon completion of certain development milestones. As amounts become due and payable, they are offset against research and development expense on a pro rata basis. We recognized an offset to research and development expense of $4,000 during the year ended December 31, 2017.
67
NOTE 9: INTEREST EXPENSE AND OTHER, NET
Interest expense and other, consists of the following:
Year Ended December 31, | |||||||||||
2017 | 2016 | 2015 | |||||||||
Interest expense 1 | $ | (878 | ) | $ | (446 | ) | $ | (450 | ) | ||
Fair value adjustment on convertible debt conversion option | (743 | ) | — | — | |||||||
Discount accretion on convertible debt fair value | (196 | ) | — | — | |||||||
Interest income | 141 | 40 | 4 | ||||||||
Gain on debt extinguishment | 29 | — | — | ||||||||
Total interest expense and other, net | $ | (1,647 | ) | $ | (406 | ) | $ | (446 | ) | ||
1 | Increase in 2017 compared to 2016 due to contractual interest on convertible debt, as well as imputed interest on short and long-term liabilities acquired as a part of the Acquisition. |
NOTE 10. INCOME TAXES
Current and Deferred Income Tax Expense
Domestic and foreign pre-tax income (loss) is as follows:
Year Ended December 31, | |||||||||||
2017 | 2016 | 2015 | |||||||||
Domestic | $ | 903 | $ | (11,881 | ) | $ | (11,675 | ) | |||
Foreign | (4,583 | ) | 1,129 | 1,425 | |||||||
Domestic and foreign pre-tax loss | $ | (3,680 | ) | $ | (10,752 | ) | $ | (10,250 | ) | ||
Income tax expense attributable to operations is comprised of the following:
Year Ended December 31, | |||||||||||
2017 | 2016 | 2015 | |||||||||
Current: | |||||||||||
Federal | $ | (321 | ) | $ | 55 | $ | 55 | ||||
State | 4 | 2 | 2 | ||||||||
Foreign | 806 | 276 | 240 | ||||||||
Total current | 489 | 333 | 297 | ||||||||
Deferred: | |||||||||||
Foreign | 4 | 22 | 23 | ||||||||
Total deferred | 4 | 22 | 23 | ||||||||
Income tax expense | $ | 493 | $ | 355 | $ | 320 | |||||
68
The reconciliation of the U.S. federal statutory income tax rate to our effective income tax rate is as follows:
Year Ended December 31, | ||||||||
2017 | 2016 | 2015 | ||||||
Federal statutory rate | 34 | % | 34 | % | 34 | % | ||
Change in valuation allowance | 887 | (14 | ) | (17 | ) | |||
Tax law change | (789 | ) | — | — | ||||
Expiration of tax attributes | (127 | ) | (11 | ) | (18 | ) | ||
Permanent items | (8 | ) | — | — | ||||
Stock-based compensation | (8 | ) | (13 | ) | (7 | ) | ||
Impact of foreign earnings | (2 | ) | 1 | 1 | ||||
State income taxes, net of federal tax benefit | — | 2 | 3 | |||||
Other | — | (2 | ) | 1 | ||||
Effective income tax rate | (13 | )% | (3 | )% | (3 | )% | ||
Deferred Tax Assets, Liabilities and Valuation Allowance
Deferred income taxes reflect the net tax effects of temporary differences between the carrying amount of assets and liabilities for financial reporting purposes and the amounts for income tax purposes. Significant components of our deferred tax assets and liabilities are as follows:
December 31, | |||||||
2017 | 2016 | ||||||
Deferred tax assets: | |||||||
Net operating loss carryforwards | $ | 56,461 | $ | 77,357 | |||
Research and experimentation credit and deduction carryforwards | 63,796 | 11,849 | |||||
Foreign tax credit carryforwards | 2,216 | 3,575 | |||||
Deferred stock-based compensation | 802 | 1,705 | |||||
Depreciation and amortization | 3,068 | 1,241 | |||||
Reserves and accrued expenses | 511 | 623 | |||||
Other | 705 | 438 | |||||
Total gross deferred tax assets | 127,559 | 96,788 | |||||
Deferred tax liabilities: | |||||||
Foreign earnings | — | (327 | ) | ||||
Other | (485 | ) | (269 | ) | |||
Total gross deferred tax liabilities | (485 | ) | (596 | ) | |||
Less valuation allowance | (126,946 | ) | (96,079 | ) | |||
Net deferred tax assets | $ | 128 | $ | 113 | |||
The Company adopted ASU 2016-09 in the first quarter of 2017. The Company had excess tax benefits for which a benefit could not be previously recognized of approximately $485. Upon adoption the balance of the unrecognized excess tax benefits was reversed with the impact recorded to retained earnings including the change to the valuation allowance as a result of the adoption.
The Tax Cuts and Jobs Act was enacted on December 22, 2017. The Act reduces the U.S. federal corporate tax rate from 35% to 21%, and requires companies to pay a one-time transition tax on earnings of certain foreign subsidiaries that were previously tax deferred and creates new taxes on certain foreign sourced earnings. Due to deficits in certain foreign subsidiaries we reasonably estimate that we will not have a transition tax liability for the repatriation of our foreign earnings. Additionally, a minimum tax on certain foreign earnings in excess of 10 percent of the foreign subsidiaries tangible assets (i.e., global intangible low-taxed income or “GILTI”) will be effective for future tax years. We have evaluated this change and made a policy election to treat the GILTI tax as a period expense. Our estimates may be affected as we gain a more thorough understanding of the tax law.
69
On December 22, 2017, Staff Accounting Bulletin No. 118 was issued to address the application of U.S. GAAP in situations when a registrant does not have the necessary information available, prepared, or analyzed (including computations) in reasonable detail to complete the accounting for certain income tax effects of the Act. In accordance with SAB 118, we have determined that $28,973 of the deferred tax expense recorded in connection with the re-measurement of certain deferred tax assets and liabilities, $343 of current tax benefit recorded in connection with the refundable AMT credit and the transition tax on the mandatory deemed repatriation of foreign earnings were provisional amounts and reasonable estimates as of December 31, 2017. Additional work is necessary to do a more detailed analysis of historical foreign earnings as well as potential adjustments. Any subsequent adjustment to these amounts will be recorded to current tax expense in the quarter of 2018 when the analysis is complete.
We continue to record a full valuation allowance against our U.S. net deferred tax assets as of December 31, 2017 and 2016 as it is not more likely than not that we will realize a benefit from these assets in a future period. We have not provided a valuation allowance against any of our foreign net deferred tax assets, with the exception of Canada, as we have concluded it is more likely than not that we will realize a benefit from these assets in a future period because our subsidiaries in these jurisdictions are cost-plus taxpayers. The net valuation allowance increased $30,867, $1,555 and $1,732 for the years ended December 31, 2017, 2016, and 2015, respectively.
As of December 31, 2017, we had federal, state and foreign net operating loss carryforwards of $215,326, $11,444 and $38,578 respectively, which will expire between 2018 and 2037. As of December 31, 2017, we had available federal, state and foreign research and experimentation tax credit carryforwards of $8,962, $4,019, and $27,322 respectively. The federal and state tax credits will begin expiring in 2019 while the foreign credits have an indefinite life. In addition, our Canadian subsidiary has unclaimed scientific and experimental expenditures to be carried forward and applied against future income in Canada of approximately $119,447. We have a general foreign tax credit of $1,655 which will begin expiring in 2018. As of December 31, 2017 we recorded a receivable for our AMT tax credit carryforwards of $343 which will be refundable under the Tax Cuts and Jobs Act. Our ability to utilize our federal net operating losses may be limited by Section 382 of the Internal Revenue Code of 1986, as amended, which imposes an annual limit on the ability of a corporation that undergoes an "ownership change" to use its net operating loss carryforwards to reduce its tax liability. An ownership change is generally defined as a greater than 50% increase in equity ownership by 5% shareholders in any three-year period.
We recognized all of the earnings of our foreign subsidiaries as part of the transition tax of the Tax Cuts and Jobs Act. As of December 31, 2017, we do not have a liability for unremitted foreign earnings.
Our Chinese subsidiary is designated as an Advanced Technology Service Enterprise, allowing it to benefit from a Chinese tax holiday resulting in a reduction of its tax rate to 15% through 2018.
70
Uncertain Tax Positions
We have recorded tax liabilities to address potential exposures involving positions that could be challenged by taxing authorities. As of December 31, 2017 the amount of our uncertain tax positions was a liability of $1,735 and a reduction to deferred tax assets of $777. As of December 31, 2016, the amount of our uncertain tax positions was a liability of $1,419 and a reduction to deferred tax assets of $560.
The following is a summary of the change in our liability for uncertain tax positions and interest and penalties:
2017 | 2016 | ||||||
Uncertain tax positions: | |||||||
Balance at beginning of year | $ | 1,886 | $ | 1,863 | |||
Accrual for positions taken in a prior year | 40 | (126 | ) | ||||
Accrual for positions taken in current year | 263 | 257 | |||||
Reversals due to lapse of statute of limitations | (120 | ) | (108 | ) | |||
Accrual for positions acquired in acquisition of ViXS Systems | 375 | — | |||||
Balance at end of year | $ | 2,444 | $ | 1,886 | |||
Interest and penalties: | |||||||
Balance at beginning of year | $ | 93 | $ | 129 | |||
Accrual for positions taken in prior year | 8 | 7 | |||||
Accrual for positions taken in current year | 30 | 19 | |||||
Reversals due to lapse of statute of limitations | (71 | ) | (62 | ) | |||
Accrual for positions acquired in acquisition of ViXS Systems | 8 | — | |||||
Balance at end of year | $ | 68 | $ | 93 | |||
During the years ended December 31, 2017, 2016 and 2015, we recognized $46, $26 and $9, respectively, of interest and penalties in income tax expense in our consolidated statements of operations.
We file income tax returns in the U.S. and various foreign jurisdictions. A number of years may elapse before an uncertain tax position is resolved by settlement or statute of limitations. Settlement of any particular position could require the use of cash. If the uncertain tax positions we have accrued for are sustained by the taxing authorities in our favor, the reduction of the liability will reduce our effective tax rate. We reasonably expect reductions in the liability for unrecognized tax benefits and interest and penalties of approximately $8 within the next twelve months due to the expiration of statutes of limitation in foreign jurisdictions.
We are no longer subject to U.S. federal, state, and foreign examinations for years before 2014, 2013 and 2010, respectively. Our net operating loss and tax credit carryforwards from all years may be subject to adjustment for three years following the year in which utilized. We do not anticipate that any potential tax adjustments will have a significant impact on our financial position or results of operations.
We were not subject to, nor have we received any notice of, income tax examinations in any jurisdiction as of December 31, 2017.
NOTE 11. COMMITMENTS AND CONTINGENCIES
Royalties
We license technology from third parties and have agreed to pay certain suppliers a royalty based on the number of chips sold or manufactured, the net sales price of the chips containing the licensed technology or a fixed non-cancelable fee. Royalty expense is recognized based on our estimated average unit cost for royalty contracts with non-cancelable prepayments and the stated contractual per unit rate for all other agreements. Royalty expense was $1,017, $722 and $826 for the years ended December 31, 2017, 2016 and 2015, respectively, which is included in cost of revenue in our consolidated statements of operations.
71
401(k) Plan
We sponsor a 401(k) plan for eligible employees. Participants may defer a percentage of their annual compensation on a pre-tax basis, not to exceed the dollar limit that is set by law. A discretionary matching contribution by the Company is allowed and is equal to a uniform percentage of the amount of salary reduction elected to be deferred, which percentage will be determined each year by the Company. We made no contributions to the 401(k) plan during the years ended December 31, 2017, 2016 or 2015.
Leases
We acquire rights to use certain software engineer design tools under software licenses, accounting for such arrangements is similar to capital leases.
Our various office space and equipment leases are classified as operating leases. Certain of our leases for office space contain provisions under which monthly rent escalates over time and certain leases also contain provisions for reimbursement of a specified amount of leasehold improvements. When lease agreements contain escalating rent clauses, we recognize rent expense on a straight-line basis over the term of the lease. When lease agreements provide allowances for leasehold improvements, we capitalize the leasehold improvement assets and amortize them on a straight-line basis over the lesser of the lease term or the estimated useful life of the asset, and reduce rent expense on a straight-line basis over the term of the lease by the amount of the asset capitalized. When lease agreements provide rent holidays, we reduce rent expense on a straight-line basis over the term of the lease by the amount of the rent holiday.
As of December 31, 2017, future minimum payments under non-cancelable software licenses and operating lease agreements are as follows:
Year Ending December 31, | Software licenses | Operating leases | Total | |||||||||
2018 | $ | 1,904 | $ | 2,564 | $ | 4,468 | ||||||
2019 | 642 | 1,546 | 2,188 | |||||||||
2020 | — | 626 | 626 | |||||||||
2021 | — | 265 | 265 | |||||||||
2022 | — | 66 | 66 | |||||||||
2,546 | $ | 5,067 | $ | 7,613 | ||||||||
Less: Interest component | (271 | ) | ||||||||||
Present value of minimum software license payments | 2,275 | |||||||||||
Less: Current portion | (1,701 | ) | ||||||||||
Long-term portion of obligations | $ | 574 | ||||||||||
Rent expense for the years ended December 31, 2017, 2016 and 2015 was $2,488, $1,770 and $1,735, respectively.
Other Contractual Obligation
As part of the Acquisition discussed in "Note 3: Acquisition", we acquired debt associated with an agreement with the Government of Canada called Technology Partnerships Canada ("TPC"). As part of the TPC agreement, ViXS Systems Inc. was provided funding to assist in research and development expenses of which a portion was later required to be repaid because the conditions for repayment were met. The scheduled payments are made on a quarterly basis and end in January 2024. As of December 31, 2017, $381 is included in accrued liabilities and current portion of long-term liabilities in our consolidated balance sheet and $727 is included in long-term liabilities, net of current portion in our consolidated balance sheet.
Contract Manufacturers
In the normal course of business, we commit to purchase products from our contract manufacturers to be delivered within the next 90 days. In certain situations, should we cancel an order, we could be required to pay cancellation fees. Such obligations could impact our immediate results of operations but would not materially affect our business.
72
Indemnifications
Certain of our agreements include limited indemnification provisions for claims from third-parties relating to our intellectual property. It is not possible for us to predict the maximum potential amount of future payments or indemnification costs under these or similar agreements due to the conditional nature of our obligations and the unique facts and circumstances involved in each particular agreement. We have not made any payments under these agreements in the past, and as of December 31, 2017, we have not incurred any material liabilities arising from these indemnification obligations. In the future, however, such obligations could immediately impact our results of operations but are not expected to materially affect our business.
Legal Proceedings
We are subject to legal matters that arise from time to time in the ordinary course of our business. Although we currently believe that resolving such matters, individually or in the aggregate, will not have a material adverse effect on our financial position, our results of operations, or our cash flows, these matters are subject to inherent uncertainties and our view of these matters may change in the future.
NOTE 12. EARNINGS PER SHARE
Basic earnings per share amounts are computed based on the weighted average number of common shares outstanding. Diluted weighted average shares outstanding include the weighted average number of common shares outstanding plus potentially dilutive common shares outstanding during the period.
The following schedule reconciles the computation of basic and diluted net loss per share (in thousands, except per share data):
Year Ended December 31, | |||||||||||
2017 | 2016 | 2015 | |||||||||
Net loss | $ | (4,173 | ) | $ | (11,107 | ) | $ | (10,570 | ) | ||
Weighted average shares outstanding - basic and diluted | 31,507 | 28,276 | 25,088 | ||||||||
Net loss per share - basic and diluted | $ | (0.13 | ) | $ | (0.39 | ) | $ | (0.42 | ) | ||
The following shares were excluded from the calculation of diluted net loss per share as their effect would have been anti-dilutive (in thousands):
Year Ended December 31, | ||||||||
2017 | 2016 | 2015 | ||||||
Employee equity incentive plans | 3,879 | 4,982 | 4,248 | |||||
Convertible debt | 371 | — | — | |||||
Potentially dilutive common shares from employee equity incentive plans are determined by applying the treasury stock method to the assumed exercise of outstanding stock options, the assumed vesting of outstanding restricted stock units, and the assumed issuance of common stock under the employee stock purchase plan. Potentially dilutive common shares from the convertible debt are determined by applying the if-converted method to the assumed conversion of the outstanding convertible debt.
NOTE 13. SHAREHOLDERS’ EQUITY
Preferred Stock
The Company is authorized to issue 50,000,000 shares of preferred stock with a par value of $0.001 per share. The Board of Directors is authorized to fix or alter the rights, preferences, privileges and restrictions granted to, or imposed on, each series of preferred stock. There were no shares of preferred stock issued as of December 31, 2017 and 2016.
Common Stock
The Company is authorized to issue 250,000,000 shares of common stock with a par value of $0.001 per share. Shareholders of common stock have unlimited voting rights and are entitled to receive the net assets of the Company upon dissolution, subject to the rights of the preferred shareholders, if any.
73
Employee Equity Incentive Plans
On May 23, 2006, our shareholders approved the adoption of the Pixelworks, Inc. 2006 Stock Incentive Plan (the "2006 Plan"). The 2006 Plan has since been amended on certain occasions, most recently on May 10, 2017 when our shareholders approved an increase to the total number of authorized shares to 11,983,333 shares. As of December 31, 2017, 615,913 shares were available for grant under the 2006 Plan.
Stock Options
In May 2009, the 2006 Plan was modified to reduce the contractual life of newly issued stock option awards from ten to six years. Our new hire vesting schedule provides that each option becomes exercisable at a rate of 25% on the first anniversary date of the grant and 2.083% on the last day of every month thereafter for a total of 36 additional increments. Our merit vesting schedule provides that merit-type awards become exercisable monthly over a period of three years.
The following is a summary of stock option activity:
Number of shares | Weighted average exercise price | |||||
Options outstanding as of December 31, 2016: | 2,505,702 | $ | 2.46 | |||
Granted | 44,000 | 4.20 | ||||
Exercised | (991,332 | ) | 2.76 | |||
Canceled and forfeited | (154,061 | ) | 2.13 | |||
Expired | (98,559 | ) | 5.43 | |||
Options outstanding as of December 31, 2017: | 1,305,750 | $ | 2.11 | |||
The following table summarizes information about options outstanding as of December 31, 2017:
Options Outstanding | Options Exercisable | |||||||||||||||
Range of exercise prices | Number outstanding as of December 31, 2017 | Weighted average remaining contractual life | Weighted average exercise price | Number exercisable as of December 31, 2017 | Weighted average exercise price | |||||||||||
$0.60 - $0.60 | 300,000 | 1.22 | $ | 0.60 | 300,000 | $ | 0.60 | |||||||||
0.68 - 2.43 | 205,541 | 1.03 | 1.16 | 201,333 | 1.14 | |||||||||||
2.46 - 2.46 | 352,000 | 3.99 | 2.46 | 169,708 | 2.46 | |||||||||||
2.67 - 3.15 | 385,209 | 1.72 | 3.03 | 312,459 | 3.09 | |||||||||||
3.27 - 6.16 | 63,000 | 3.93 | 4.72 | 27,272 | 4.86 | |||||||||||
$0.60 - $6.16 | 1,305,750 | 2.22 | $ | 2.11 | 1,010,772 | $ | 1.94 | |||||||||
During the years ended December 31, 2017, 2016 and 2015 the total intrinsic value of options exercised was $1,801, $481 and $440, respectively, for which no income tax benefit has been recorded because a full valuation allowance has been provided for our U.S. deferred tax assets. As of December 31, 2017, options outstanding had a total intrinsic value of $5,516.
Options outstanding that have vested and are expected to vest as of December 31, 2017 are as follows:
Number of shares | Weighted average exercise price | Weighted average remaining contractual term | Aggregate intrinsic value | |||||||||
Vested | 1,010,772 | $ | 1.90 | 1.59 | $ | 4,473 | ||||||
Expected to vest | 263,380 | 2.77 | 4.34 | 938 | ||||||||
Total | 1,274,152 | $ | 2.08 | 2.16 | $ | 5,411 | ||||||
74
Restricted Stock
The 2006 Plan provides for the issuance of restricted stock, including restricted stock units. During the years ended December 31, 2017, 2016 and 2015 we granted 1,514,527, 1,572,519, and 530,735 shares, respectively, of restricted stock with a weighted average grant date fair value of $4.87, $2.21, and $4.31 per share, respectively.
The following is a summary of restricted stock activity:
Number of shares | Weighted average grant date fair value | |||||
Unvested at December 31, 2016: | 1,698,500 | $ | 2.93 | |||
Granted | 1,514,527 | 4.87 | ||||
Vested | (857,208 | ) | 3.63 | |||
Canceled | (53,217 | ) | 3.33 | |||
Unvested at December 31, 2017: | 2,302,602 | $ | 3.94 | |||
Expected to vest after December 31, 2017 | 1,925,115 | $ | 3.94 | |||
Employee Stock Purchase Plans
On May 18, 2010, our shareholders approved the adoption of the 2010 Pixelworks, Inc. Employee Stock Purchase Plan (the "ESPP") for U.S. employees and for certain foreign subsidiary employees. The ESPP provides for separate offering periods commencing on February 1 and August 1, with the first offering period beginning August 1, 2010. Each offering period continues for a period of 18 months with purchases every six months. Each eligible employee may purchase up to 3,000 shares of stock on each purchase date, with a maximum annual purchase amount of $25. The purchase price is equal to 85% of the lesser of the fair market value of the shares on the offering date or on the purchase date. A total of 1,300,000 shares of common stock have been reserved for issuance under the ESPP. During the years ended December 31, 2017, 2016 and 2015, we issued 153,242, 141,633 and 92,899 shares, respectively for proceeds of $270, $252 and $352, respectively, under the ESPP.
Stock-Based Compensation Expense
The fair value of stock-based compensation was determined using the Black-Scholes option pricing model and the following weighted average assumptions:
Year Ended December 31, | ||||||||
2017 | 2016 | 2015 | ||||||
Stock Option Plans: | ||||||||
Risk free interest rate | 1.85 | % | 1.37 | % | 1.52 | % | ||
Expected dividend yield | 0 | % | 0 | % | 0 | % | ||
Expected term (in years) | 5.00 | 5.00 | 5.00 | |||||
Volatility | 75 | % | 74 | % | 68 | % | ||
Employee Stock Purchase Plan: | ||||||||
Risk free interest rate | 1.09 | % | 0.20 | % | 0.28 | % | ||
Expected dividend yield | 0 | % | 0 | % | 0 | % | ||
Expected term (in years) | 1.07 | 1.12 | 1.10 | |||||
Volatility | 65 | % | 84 | % | 89 | % | ||
The weighted average fair value of options granted during the years ended December 31, 2017, 2016 and 2015 was $2.58, $1.41 and $2.93, respectively. The risk free interest rate is estimated using an average of treasury bill interest rates. The expected dividend yield is zero as we have not paid any dividends to date and do not expect to pay dividends in the future. Expected volatility is estimated based on the historical volatility of our common stock over the expected term as this represents our best estimate of future volatility. Subsequent to the May 2009 amendment of our 2006 Stock Incentive Plan, which shortened the contractual life of newly issued stock options from ten to six years, we have elected to use the "simplified method" to estimate expected term. Under the simplified method, an option's expected term is calculated as the average of its vesting period and original contractual life. The expected term of ESPP purchase rights is based on the estimated weighted average time to purchase.
75
As of December 31, 2017, unrecognized stock-based compensation expense is $5,979, which is expected to be recognized as stock-based compensation expense over a weighted average period of 2.32 years.
NOTE 14. SEGMENT INFORMATION
We have identified a single operating segment: the design and development of ICs for use in electronic display devices. Substantially all of our assets are located in the U.S.
Geographic Information
Revenue by geographic region, was as follows:
Year Ended December 31, | |||||||||||
2017 | 2016 | 2015 | |||||||||
Japan | $ | 66,041 | $ | 44,186 | $ | 50,436 | |||||
Taiwan | 6,841 | 5,095 | 5,909 | ||||||||
Europe | 2,166 | 634 | 611 | ||||||||
China | 2,117 | 1,616 | 765 | ||||||||
U.S. | 1,697 | 84 | 167 | ||||||||
Korea | 987 | 963 | 942 | ||||||||
Other | 788 | 812 | 687 | ||||||||
$ | 80,637 | $ | 53,390 | $ | 59,517 | ||||||
Significant Customers
The percentage of revenue attributable to our distributors, top five end customers, and individual distributors or end customers that represented more than 10% of revenue in at least one of the periods presented, is as follows:
Year Ended December 31, | ||||||||
2017 | 2016 | 2015 | ||||||
Distributors: | ||||||||
All distributors | 47 | % | 43 | % | 48 | % | ||
Distributor A | 27 | % | 24 | % | 31 | % | ||
End Customers: 1 | ||||||||
Top five end customers | 79 | % | 82 | % | 83 | % | ||
End customer A | 47 | % | 53 | % | 47 | % | ||
End customer B | 9 | % | 8 | % | 13 | % | ||
1 End customers include customers who purchase directly from us, as well as customers who purchase our products indirectly through distributors.
Each of the following accounts represented 10% or more of total accounts receivable in at least one of the periods presented:
December 31, | |||||||
2017 | 2016 | ||||||
Account X | 38 | % | 54 | % | |||
Account Y | 29 | % | 5 | % | |||
76
NOTE 15. QUARTERLY FINANCIAL DATA (UNAUDITED)
Quarterly Period Ended | |||||||||||||||
March 31 | June 30 | September 30 | December 31 1 | ||||||||||||
2017 | |||||||||||||||
Revenue, net | $ | 22,710 | $ | 20,721 | $ | 18,758 | $ | 18,448 | |||||||
Gross profit | 12,392 | 11,201 | 9,011 | 9,160 | |||||||||||
Income (loss) from operations | 3,347 | 2,040 | (4,378 | ) | (3,042 | ) | |||||||||
Income (loss) before income taxes | 3,254 | 1,933 | (4,906 | ) | (3,961 | ) | |||||||||
Net income (loss) | 2,821 | 1,264 | (4,706 | ) | (3,552 | ) | |||||||||
Net income (loss) per share: | |||||||||||||||
Basic | 0.10 | 0.04 | (0.14 | ) | (0.10 | ) | |||||||||
Diluted | 0.09 | 0.04 | (0.14 | ) | (0.10 | ) | |||||||||
2016 | |||||||||||||||
Revenue, net | $ | 11,167 | $ | 12,580 | $ | 13,656 | $ | 15,987 | |||||||
Gross profit | 3,592 | 6,415 | 6,557 | 8,504 | |||||||||||
Income (loss) from operations | (8,486 | ) | (1,336 | ) | (960 | ) | 436 | ||||||||
Income (loss) before income taxes | (8,585 | ) | (1,443 | ) | (1,059 | ) | 335 | ||||||||
Net income (loss) | (8,642 | ) | (1,560 | ) | (1,242 | ) | 337 | ||||||||
Net income (loss) per share: | |||||||||||||||
Basic | (0.31 | ) | (0.06 | ) | (0.04 | ) | 0.01 | ||||||||
Diluted | (0.31 | ) | (0.06 | ) | (0.04 | ) | 0.01 | ||||||||
1 The three months ended December 31, 2017 includes $949 for inventory step-up and backlog amortization, $621 for fair value adjustment on convertible debt conversion feature, and $439 in restructuring expenses.
NOTE 16. SUBSEQUENT EVENTS
On January 12, 2018, Pixelworks provided notice to the holders of the convertible debt of its election to redeem the convertible debt in full as of March 13, 2018. Subsequently, certain holders of the convertible debt have elected to convert their convertible debt into shares of common stock of Pixelworks pursuant to the terms of the convertible debt, which provides a conversion price of CAD $7.24 per share for the convertible debt due September 2019 and CAD $7.03 per share for the convertible debt due January 2020. This resulted in the issuance of 435,353 shares of our common stock to such holders. We paid an aggregate of CAD $2,875 to redeem the convertible debt of those holders who did not elect to convert their convertible debt into shares of common stock.
Item 9. | Changes in and Disagreements with Accountants on Accounting and Financial Disclosure. |
None.
Item 9A. | Controls and Procedures. |
Disclosure Controls and Procedures
As of the end of the period covered by this report, we conducted an evaluation under the supervision and with the participation of our Chief Executive Officer (our Principal Executive Officer) and Chief Financial Officer (our Principal Accounting and Financial Officer) of our disclosure controls and procedures (as defined in Rule 13a-15(e) and Rule 15d-15(f) of the Securities Exchange Act of 1934, as amended (the "Exchange Act")). Based on this evaluation, the Chief Executive Officer and Chief Financial Officer concluded that, as of December 31, 2017, our disclosure controls and procedures were effective to ensure that information required to be disclosed in our periodic reports filed or submitted under the Securities Exchange Act is (i) recorded, processed, summarized and reported within the time periods specified in the Securities and Exchange Commission's rules and forms, and (ii) accumulated and communicated to our management, including our Chief Executive Officer and Chief Financial Officer, as appropriate to allow timely decisions regarding disclosure.
77
Management’s Report on Internal Control Over Financial Reporting
Our management is responsible for establishing and maintaining a system of internal control over financial reporting (as defined in Rules 13a-15(f) and 15d-15(f) under the Exchange Act) to provide reasonable assurance regarding the reliability of financial reporting and the preparation of financial statements for external purposes in accordance with U.S. generally accepted accounting principles ("U.S. GAAP"). All internal control systems, no matter how well designed, have inherent limitations.
We conducted an assessment of the effectiveness of our system of internal control over financial reporting as of December 31, 2017, the last day of our fiscal year. This assessment was based on criteria established in the framework Internal Control—Integrated Framework (2013), issued by the Committee of Sponsoring Organizations of the Treadway Commission and included an evaluation of elements such as the design and operating effectiveness of key financial reporting controls, process documentation, accounting policies, and our overall control environment. Based on our assessment, management has concluded that our internal control over financial reporting was effective as of the end of the fiscal year to provide reasonable assurance regarding the reliability of financial reporting and the preparation of financial statements for external reporting purposes in accordance with U.S. GAAP. We reviewed the results of management’s assessment with the Audit Committee of our Board of Directors.
Management excluded from its assessment of the effectiveness of the Company's internal control over financial reporting, ViXS Systems Inc. ("ViXS") internal control over financial reporting with total assets of $20,642 and total revenues of $4,488 included in the consolidated financial statements of the Company as of December 31, 2017.
Our management, including our Chief Executive Officer and Chief Financial Officer, does not expect that our disclosure controls and procedures will prevent or detect all errors and all fraud. Disclosure controls and procedures, no matter how well designed, operated and managed, can provide only reasonable assurance that the objectives of the disclosure controls and procedures are met. Because of the inherent limitations of disclosure controls and procedures, no evaluation of such disclosure controls and procedures can provide absolute assurance that all control issues and instances of fraud, if any, have been detected.
The effectiveness of our internal control over financial reporting as of December 31, 2017 has been audited by KPMG LLP, our independent registered public accounting firm, as stated in their report, which is presented below.
Changes in Internal Control Over Financial Reporting
There were no changes to our internal control over financial reporting (as defined in Rules 13a-15(f) and 15d-15(f) under the Exchange Act) that occurred during the period covered by this report that have materially affected, or are reasonably likely to materially affect, our internal control over financial reporting.
78
Report of Independent Registered Public Accounting Firm
To the Shareholders and Board of Directors
Pixelworks, Inc.:
Opinion on Internal Control Over Financial Reporting
We have audited Pixelworks, Inc. and subsidiaries’ (the “Company”) internal control over financial reporting as of December 31, 2017, based on criteria established in Internal Control - Integrated Framework (2013) issued by the Committee of Sponsoring Organizations of the Treadway Commission. In our opinion, the Company maintained, in all material respects, effective internal control over financial reporting as of December 31, 2017, based on criteria established in Internal Control - Integrated Framework (2013) issued by the Committee of Sponsoring Organizations of the Treadway Commission.
We also have audited, in accordance with the standards of the Public Company Accounting Oversight Board (United States) (“PCAOB”), the consolidated balance sheets of the Company as of December 31, 2017 and 2016, and the related consolidated statements of operations, comprehensive loss, shareholders’ equity, and cash flows for each of the years in the three-year period ended December 31, 2017, and related notes, and our report dated March 14, 2018 expressed an unqualified opinion on those consolidated financial statements.
The Company acquired ViXS Systems, Inc. during 2017, and management excluded from its assessment of the effectiveness of the Company’s internal control over financial reporting as of December 31, 2017, ViXS System Inc.’s internal control over financial reporting associated with total assets of approximately $21 million and total revenues of approximately $5 million included in the consolidated financial statements of the Company as of and for the year ended December 31, 2017. Our audit of internal control over financial reporting of the Company also excluded an evaluation of the internal control over financial reporting of ViXS Systems, Inc.
Basis for Opinion
The Company’s management is responsible for maintaining effective internal control over financial reporting and for its assessment of the effectiveness of internal control over financial reporting, included in the accompanying Management’s Report on Internal Control over Financial Reporting. Our responsibility is to express an opinion on the Company’s internal control over financial reporting based on our audit. We are a public accounting firm registered with the PCAOB and are required to be independent with respect to the Company in accordance with the U.S. federal securities laws and the applicable rules and regulations of the Securities and Exchange Commission and the PCAOB.
We conducted our audit in accordance with the standards of the PCAOB. Those standards require that we plan and perform the audit to obtain reasonable assurance about whether effective internal control over financial reporting was maintained in all material respects. Our audit of internal control over financial reporting included obtaining an understanding of internal control over financial reporting, assessing the risk that a material weakness exists, and testing and evaluating the design and operating effectiveness of internal control based on the assessed risk. Our audit also included performing such other procedures as we considered necessary in the circumstances. We believe that our audit provides a reasonable basis for our opinion.
Definition and Limitations of Internal Control Over Financial Reporting
A company’s internal control over financial reporting is a process designed to provide reasonable assurance regarding the reliability of financial reporting and the preparation of financial statements for external purposes in accordance with generally accepted accounting principles. A company’s internal control over financial reporting includes those policies and procedures that (1) pertain to the maintenance of records that, in reasonable detail, accurately and fairly reflect the transactions and dispositions of the assets of the company; (2) provide reasonable assurance that transactions are recorded as necessary to permit preparation of financial statements in accordance with generally accepted accounting principles, and that receipts and expenditures of the company are being made only in accordance with authorizations of management and directors of the company; and (3) provide reasonable assurance regarding prevention or timely detection of unauthorized acquisition, use, or disposition of the company’s assets that could have a material effect on the financial statements.
Because of its inherent limitations, internal control over financial reporting may not prevent or detect misstatements. Also, projections of any evaluation of effectiveness to future periods are subject to the risk that controls may become inadequate because of changes in conditions, or that the degree of compliance with the policies or procedures may deteriorate.
/s/ KPMG LLP
Portland, Oregon
March 14, 2018
79
Item 9B. | Other Information. |
On March 12, 2018, in connection with a periodic review of its existing form indemnification agreement, we entered into an updated indemnification agreement (the “Indemnity Agreement”) with each of our directors and with Steven Moore, our Chief Financial Officer. The Indemnity Agreement provides that Pixelworks will indemnify the director or officer party to the agreement against certain expenses arising out of claims to which such individual becomes subject in connection with his or her service to the Company. The Indemnity Agreement further provides procedures for the determination of an indemnitee's right to receive indemnification and the advancement of expenses. The Indemnity Agreement will be the form used for all newly appointed directors and executive officers, as determined by the board of directors.
PART III
Item 10. | Directors, Executive Officers and Corporate Governance. |
Information required by Item 10 with respect to our directors and executive officers will be set forth under the captions "Election of Directors - Director Nominees for Election" and "Information about our Executive Officers" in our Proxy Statement for our 2018 Annual Meeting of Shareholders (the "2018 Proxy Statement") to be filed within 120 days after December 31, 2017 and pursuant to Regulation 14A and is incorporated herein by reference.
Item 405 of Regulation S-K calls for disclosure of any known late filing or failure by an insider to file a report required by Section 16(a) of the Securities Exchange Act of 1934, as amended (the "Exchange Act"). This information is incorporated by reference from the Section called "Section 16(a) Beneficial Ownership Reporting Compliance" in the 2018 Proxy Statement.
We have adopted a Code of Business Conduct and Ethics that applies to all directors and employees, including the Chief Executive Officer (our Principal Executive Officer) and our Chief Financial Officer (our Principal Accounting and Financial Officer). We have also adopted a Code of Ethics for Senior or Designated Financial Personnel (the "Code of Ethics for Senior or Designated Financial Personnel") that applies to our Chief Executive Officer (our Principal Executive Officer), our Chief Financial Officer (our Principal Accounting and Financial Officer) and other designated financial personnel. The Code of Business Conduct and Ethics and the Code of Ethics for Senior or Designated Financial Personnel are each available on our website free of charge at www.pixelworks.com. We intend to disclose any changes in or waivers from our Code of Business Conduct and Ethics or Code of Ethics for Senior or Designated Financial Personnel by posting such information on our website at www.pixelworks.com or by filing a Current Report on Form 8-K.
We have a separately designated standing audit committee established in accordance with the Securities Exchange Act of 1934. The members of the audit committee are Daniel Heneghan, Chairman, C. Scott Gibson and Richard Sanquini. The audit committee has the responsibility and authority described in the Pixelworks, Inc. Charter of the Audit Committee of the Board of Directors, which has been approved by our board of directors. A copy of the audit committee charter is available on our website at www.pixelworks.com. Our board of directors has determined that Mr. Heneghan, Mr. Gibson and Mr. Sanquini meet the independence requirements set forth in Rule 10A-3(b)(1) under the Exchange Act and in the applicable rules of Nasdaq. In addition, our board of directors has determined that Mr. Heneghan, Mr. Gibson and Mr. Sanquini each qualify as an audit committee financial expert as defined by Securities and Exchange Commission rules.
Item 11. | Executive Compensation. |
Information required by Item 11 with respect to executive compensation will be included under the captions "Compensation Committee Report", "Executive Compensation", "Executive Compensation - Compensation Discussion and Analysis" and "Information About Our Board of Directors - Director Compensation" in our 2018 Proxy Statement and is incorporated herein by reference.
Item 12. | Security Ownership of Certain Beneficial Owners and Management and Related Stockholder Matters. |
Information required by Item 12 with respect to security ownership of certain beneficial owners and management and related stockholder matters will be included under the captions "Security Ownership of Certain Beneficial Owners and Management" and "Information about our Equity Compensation Plans" in our 2018 Proxy Statement and is incorporated herein by reference.
Item 13. | Certain Relationships and Related Transactions, and Director Independence. |
Information required by Item 13 with respect to certain relationships and related transactions and director independence will be included under the captions "Certain Relationships and Related Transactions" and "Information About Our Board of Directors" in our 2018 Proxy Statement and is incorporated herein by reference.
80
Item 14. | Principal Accounting Fees and Services. |
Information required by Item 14 with respect to principal accounting fees and services will be set forth under the caption "Information About Our Independent Registered Public Accounting Firm" in our 2018 Proxy Statement and is incorporated herein by reference.
PART IV
Item 15. | Exhibits, Financial Statement Schedules. |
(a) | 1. Financial Statements. |
The following financial statements are included in Item 8 Financial Statements and Supplementary Data:
81
(a) | 2. Financial Statement Schedules. |
All schedules have been omitted because the required information is included in the consolidated financial statements or the notes thereto, or is not applicable or required.
(a) | 3. Exhibits. |
The exhibits are either filed with this report or incorporated by reference into this report.
Exhibit Number | Description |
2.1 | |
2.2 | |
3.1 | |
3.2 | |
3.3 | |
4.1 | |
4.2 | |
10.1 | |
10.2 | |
10.3 | |
82
10.4 | |
10.5 | |
10.6 | |
10.7 | |
10.8 | |
10.9 | |
10.10 | |
10.11 | |
10.12 | |
10.13 | |
10.14 | |
10.15 | |
10.16 | |
10.17 | |
10.18 | |
83
10.19 | |
10.20 | |
10.21 | |
10.22 | |
10.23 | |
10.24 | |
10.25 | |
10.26 | |
10.27 | |
10.28 | |
10.29 | |
10.30 | |
21 | |
23 | |
24.1 | |
31.1 | |
84
31.2 | |
32.1* | |
32.2* | |
101.INS | XBRL Instance Document |
101.SCH | XBRL Taxonomy Extension Schema Document |
101.CAL | XBRL Taxonomy Extension Calculation Linkbase Document |
101.DEF | XBRL Taxonomy Extension Definition Linkbase Document |
101.LAB | XBRL Taxonomy Label Linkbase Document |
101.PRE | XBRL Taxonomy Extension Presentation Linkbase Document |
+ | Indicates a management contract or compensation arrangement. |
* | Exhibits 32.1 and 32.2 are being furnished and shall not be deemed to be "filed" for purposes of Section 18 of the Securities Exchange Act of 1934, as amended (the "Exchange Act"), or otherwise subject to the liability of that section, nor shall such exhibits be deemed to be incorporated by reference in any registration statement or other document filed under the Securities Act of 1933, as amended, or the Exchange Act, except as otherwise stated in such filing. |
(b) Exhibits.
See Item 15 (a) (3) above.
(c) Financial Statement Schedules.
See Item 15 (a) (2) above.
Item 16. Form 10-K Summary.
Not applicable.
85
SIGNATURES
Pursuant to the requirements of Sections 13 or 15(d) of the Securities Exchange Act of 1934, the registrant has duly caused this report to be signed on its behalf by the undersigned, thereunto duly authorized.
PIXELWORKS, INC. | ||||
Dated: | March 14, 2018 | By: | /s/ Todd A. DeBonis | |
Todd A. DeBonis | ||||
President and Chief Executive Officer (Principal Executive Officer) | ||||
POWER OF ATTORNEY
KNOW ALL MEN BY THESE PRESENTS, that each person whose signature appears below constitutes and appoints Todd A. DeBonis and Steven L. Moore, and each of them, his true and lawful attorneys-in-fact, each with full power of substitution, for him or her in any and all capacities, to sign any amendments to this report on Form 10-K and to file the same, with exhibits thereto and other documents in connection therewith, with the Securities and Exchange Commission, hereby ratifying and confirming all that each of said attorneys-in-fact or their substitute or substitutes may do or cause to be done by virtue hereof.
Pursuant to the requirements of the Securities Exchange Act of 1934, this report has been signed by the following persons on behalf of the Registrant and in the capacities and on the dates indicated.
Signature | Title | Date | ||
/s/ Todd A. DeBonis | President and Chief Executive Officer | |||
Todd A. DeBonis | (Principal Executive Officer) | March 14, 2018 | ||
/s/ Steven L. Moore | Vice President, Chief Financial Officer, Secretary and Treasurer (Principal Accounting and Financial Officer) | |||
Steven L. Moore | March 14, 2018 | |||
/s/ Richard L. Sanquini | Chairman of the Board | |||
Richard L. Sanquini | March 14, 2018 | |||
/s/ C. Scott Gibson | Director | |||
C. Scott Gibson | March 14, 2018 | |||
/s/ Daniel J. Heneghan | Director | |||
Daniel J. Heneghan | March 14, 2018 | |||
/s/ David J. Tupman | Director | |||
David J. Tupman | March 14, 2018 | |||
86