Attached files
| file | filename |
|---|---|
| EX-32 - EXHIBIT 32 - FNB BANCORP/CA/ | ex32.htm |
| EX-31.2 - EXHIBIT 31.2 - FNB BANCORP/CA/ | ex31_2.htm |
| EX-31.1 - EXHIBIT 31.1 - FNB BANCORP/CA/ | ex31_1.htm |
| EX-23.1 - EXHIBIT 23.1 - FNB BANCORP/CA/ | ex23_1.htm |
SECURITIES
AND EXCHANGE COMMISSION
WASHINGTON, D.C. 20549
FORM 10-K
| x | Annual report pursuant to Section 13 or 15 (d) of the Securities Exchange Act of 1934 for the fiscal year ended December 31, 2017, or |
| o | Transition report pursuant to Section 13 or 15 (d) of Securities Exchange Act of 1934 |
Commission File No. 000-49693
FNB BANCORP
(Exact name of registrant as specified in its charter)
| California | 91-2115369 | |
| (State or other jurisdiction of incorporation or organization) | (IRS Employer ID Number) | |
| 975 El Camino Real, South San Francisco, California | 94080 | |
| (Address of principal executive offices) | (Zip code) |
(650) 588-6800
(Registrant’s telephone number, including area code)
| Securities registered pursuant to Section 12(b) of the Act: | None | |
| Securities registered pursuant to Section 12(g) of the Act: | ||
| Title of Class: | Common Stock, no par value | |
Indicate
by check mark if the registrant is a well-known seasoned issuer, as defined in Rule 405 of the Securities Act.
Yes o No x
Indicate
by check mark if the registrant is not required to file reports pursuant to Section 13 or Section 15(d) of the Act.
Yes o No x
Indicate by check mark whether the registrant (1) has filed all reports required to be filed by Section 13 or 15(d) of the Securities Exchange Act of 1934 during the preceding 12 months (or for such shorter period that the registrant was required to file such reports), and (2) has been subject to such filing requirements for the past 90 days. Yes x No o
Indicate by check mark whether the registrant has submitted electronically and posted on its Website, if any, every Interactive Data File required to be submitted and posted pursuant to Rule 405 of Regulation S-T during the preceding 12 months (or for such shorter period that the registrant was required to submit and post such files). Yes x No o
Indicate by check mark if disclosure of delinquent filers pursuant to item 405 of Regulation S-K is not contained herein, and will not be contained, to the best of the registrant’s knowledge, in definitive proxy or information statements incorporated by reference in Part III of this Form 10-K or any amendment to this Form 10-K o
Indicate by check mark whether the registrant is a large accelerated filer, an accelerated filer, a non-accelerated filer, or a smaller reporting company or an emerging growth company. See the definitions of “large accelerated filer,” “accelerated filer” “smaller reporting company” and “emerging growth company” in Rule 12b-2 of the Exchange Act. (Check one):
| Large accelerated filer o | Accelerated filer x | Non-accelerated filer o |
| Smaller reporting company o | Emerging growth company o |
|
Indicate by check mark whether the registrant is a shell company (as defined in Rule 12b-2 of the Act). Yes o No x
Aggregate market value of the voting and non-voting common equity held by non-affiliates of the registrant, computed by reference to the price at which the common equity was last sold, or the average bid and asked price of such common equity, as of the last business day of the registrant’s most recently completed second fiscal quarter: $102,868,236
Number of shares outstanding of each of the registrant’s classes of common stock, as of February 01, 2017
No par value Common Stock – 7,459,847 shares outstanding.
DOCUMENTS INCORPORATED BY REFERENCE
The following documents are incorporated by reference into this Form 10-K: Part III, Items 10 through 14 from Registrant’s definitive proxy statement for the 2018 annual meeting of shareholders.
| 2 |
PART I
Forward-Looking Statements: Certain matters discussed or incorporated by reference in this Annual Report on Form 10-K including, but not limited to, matters described in “Item 7 – Management’s Discussion and Analysis of Financial Condition and Results of Operations,” are “forward-looking statements” within the meaning of Section 21E of the Securities Exchange Act of 1934, as amended, and Section 27A of the Securities Act of 1933, as amended. Such forward-looking statements may contain words related to future projections including, but not limited to, words such as “believe,” “expect,” “anticipate,” “intend,” “may,” “will,” “should,” “could,” “would,” and variations of those words and similar words that are subject to risks, uncertainties and other factors that could cause actual results to differ materially from those projected. Factors that could cause or contribute to such differences include, but are not limited to, the following: (1) variances in the actual versus projected growth in assets; (2) return on assets; (3) loan and lease losses; (4) expenses; (5) changes in the interest rate environment including interest rates charged on loans, earned on securities investments and paid on deposits; (6) competition effects; (7) fee and other noninterest income earned; (8) general economic conditions nationally, regionally, and in the operating market areas of FNB Bancorp (the “Company”) including State and local issues being addressed in California; (9) changes in the regulatory environment; (10) changes in business conditions and inflation; (11) changes in securities markets; (12) data processing problems; (13) a decline in real estate values in the operating market areas of the Company; (14) the effects of terrorism, the threat of terrorism or the impact of the current military conflicts, and the conduct of the war on terrorism by the United States and its allies, worsening financial and economic conditions, natural disasters, and disruption of power supplies and communications; and (15) changes in accounting standards, tax laws or regulations and interpretations of such standards, laws or regulations, as well as other factors. The factors set forth under “Item 1A – Risk Factors” in this report and other cautionary statements and information set forth in this report should be read carefully, considered and understood as being applicable to all related forward-looking statements contained in this report when evaluating the business prospects of the Company and its subsidiary.
Forward-looking statements are not guarantees of performance. By their nature, they involve risks, uncertainties and assumptions. Actual results and shareholder values in the future may differ significantly from those expressed in forward-looking statements. You are cautioned not to put undue reliance on any forward-looking statement. Any such statement speaks only as of the date of the report, and in the case of any documents that may be incorporated by reference, as of the date of those documents. We do not undertake any obligation to update or release any revisions to any forward-looking statements, or to report any new information, future event or other circumstances after the date of this report or to reflect the occurrence of unanticipated events, except as required by law. However, your attention is directed to any further disclosures made on related subjects in our subsequent reports filed with the Securities and Exchange Commission on Forms 10-K, 10-Q and 8-K.
Recent Development – Proposed Merger with TriCo Bancshares
As announced by the Company on December 11, 2017 and reported in the Company’s Current Report on Form 8-K, filed with the Securities and Exchange Commission on December 12, 2017 (the “Current Report”), the Company has entered into an Agreement and Plan of Merger and Reorganization dated December 11, 2017 (the “Merger Agreement”), pursuant to which the Company would merge with and into TriCo Bancshares, a California corporation (“TriCo”), with TriCo being the surviving corporation. Immediately thereafter, the Company’s subsidiary bank, First National Bank of Northern California, would be merged with and into TriCo’s subsidiary bank, Tri Counties Bank. Under the terms of the Merger Agreement, the Company shareholders would receive a fixed exchange ratio of 0.9800 shares of TriCo common stock for each share of Company common stock, providing the Company shareholders with aggregate ownership on a pro forma basis of approximately 24% of the common stock of the combined company. Holders of the Company’s outstanding in-the-money stock options would receive cash, net of applicable taxes withheld, for the value of their unexercised stock options. The merger is expected to qualify as a tax-free exchange for shareholders who receive shares of TriCo common stock. The transactions contemplated by the Merger Agreement are expected to close in the second or third quarter of 2018, pending approvals of the Company shareholders and the TriCo shareholders, the receipt of all necessary regulatory approvals, and the satisfaction of other closing conditions which are customary for such transactions. For additional information, reference should be made to the text of the Agreement and Plan of Merger and Reorganization, filed as an exhibit to the Current Report, and to other information regarding TriCo and the Company, their respective businesses and the status of their proposed merger, as reported from time to time in other filings with the Securities and Exchange Commission.
| 3 |
Overview
FNB Bancorp (the “Company”) is a bank holding company registered under the Bank Holding Company Act of 1956, as amended. The Company was incorporated under the laws of the State of California on February 28, 2001. As a bank holding company, the Company is authorized to engage in the activities permitted under the Bank Holding Company Act of 1956, as amended, and regulations thereunder. Its principal office is located at 975 El Camino Real, South San Francisco, California, 94080, and its telephone number is (650) 588-6800. The Company owns all of the issued and outstanding shares of common stock of First National Bank of Northern California (“the Bank”), a national banking association. The Company has no other subsidiary.
The Bank was organized in 1963 as “First National Bank of Daly City.” In 1995, the shareholders approved a change in the name to “First National Bank of Northern California.” The administrative headquarters of the Bank is located at 975 El Camino Real, South San Francisco, California. The Bank presently operates twelve full service banking offices in the cities of Daly City, South San Francisco, Millbrae, Pacifica, Half Moon Bay, San Mateo, Redwood City, Pescadero, San Francisco and Sunnyvale. The Bank’s primary business is servicing the business and commercial banking needs of individuals and small to mid-sized businesses within San Mateo, San Francisco and Santa Clara Counties. The Bank is chartered under the laws of the United States and is governed by the National Bank Act, and as a national bank is a member of the Federal Reserve System. The Federal Deposit Insurance Corporation insures the deposits of the Bank up to the applicable legal limits, currently $250,000 per separately insured depositor. The Bank is subject to regulation, supervision and regular examination by the Office of the Comptroller of the Currency. The regulations of the Federal Deposit Insurance Corporation, the Board of Governors of the Federal Reserve System, and the Office of the Comptroller of the Currency govern many aspects of the Bank’s business and activities, including investments, loans, borrowings, branching, mergers and acquisitions, reporting and numerous other areas. The Bank is also subject to applicable provisions of California law to the extent those provisions are not in conflict with or preempted by federal banking law. See “Supervision and Regulation” below.
National banks that are well capitalized, have a higher overall rating and a satisfactory CRA rating, and are not subject to an enforcement order, may engage in activities related to banking through operating subsidiaries subject to an expedited application process. In addition, a national bank may apply to the Office of the Comptroller of the Currency to engage in an activity through a subsidiary in which the Bank itself may not engage.
The Bank offers a broad range of services to individuals and businesses in its primary service area, including a full line of business financial products and specialized services such as courier, appointment banking and business internet banking. The Bank offers personal and business checking and savings account, including individual interest-bearing negotiable orders of withdrawal (“NOW”), money market accounts and/or accounts combining checking and savings accounts with automatic transfer capabilities, IRA accounts, time certificates of deposit, direct deposit services and computer cash management with access through the internet. The Bank also makes available commercial loans and standby letters of credit, construction loans, accounts receivable financing, inventory financing, automobile loans, home improvement loans, residential real estate loans, commercial loans and lines of credit, commercial real estate loans and lines of credit, Small Business Administration loans, equipment financing, leasehold improvement financing and consumer loans and lines of credit. In addition, the Bank sells cashier’s checks, offers automated teller machine (ATM) services that are tied in with statewide and national payment networks and offers other customary commercial banking services.
Most of the Bank’s deposits are obtained from commercial and non-profit businesses, professionals and individuals. As of December 31, 2017, the Bank had a total of 20,986 deposit accounts. The Bank has obtained some deposits through brokers for which it pays a broker fee. As of December 31, 2017, the Bank had $264,000 in such deposits.
Employees
At December 31, 2017, the Company employed 167 persons on a full time equivalent basis. The Company believes its employee relations are good. The Company is not a party to any collective bargaining agreement.
| 4 |
Market Area
The Bank’s market area consists primarily of the counties of San Francisco, San Mateo and Santa Clara. Based on latest available reports from the U. S. Department of Commerce Bureau of Economic Analysis, per capita incomes in the counties of San Francisco, San Mateo and Santa Clara for the year 2016 were $110,418, $105,721 and $88,920, respectively.
Management believes per capita income levels grew at single digit growth rates during the year ended December 31, 2017, based upon expected economic activity levels and overall employment prospects. Unemployment data published by the California Employment Development Department reported unemployment levels in December 2017 of 2.3% in San Francisco County, 2.0% in San Mateo County, 2.6% in Santa Clara County, and 5.0% for the State of California. The unemployment levels in San Francisco County were 2.8%, in San Mateo County they were 2.8%, in Santa Clara County they were 3.4% and for the State of California, 5.0% in December 2016. In December 2015, San Francisco County unemployment was 3.3%, San Mateo County was 3.1%, Santa Clara County was 3.7% and the State of California was 5.8%.
A report from the California Employment Development Department (“EDD”), based on information published by America’s Labor Market Information System (ALMIS) Employer Database 2018 1st Edition, lists the following major employers in San Francisco County: Bechtel, California Pacific Medical Center, Deloitte, Ernst & Young, Federal Reserve Bank, Golden Gate University, Kaiser Permanente Medical Center, Laguna Honda Hospital & Rehabilitation Center, Pacific Gas & Electric, San Francisco Chronicle, San Francisco State University, UCSF-Medical Center, U.S. Veterans Medical Center and University of California-San Francisco.
The following were listed as major employers in San Mateo County: Electronic Arts, Inc., Facebook, Inc., Fisher Investments, Franklin Templeton Investments, Genentech, Inc., Gilead Sciences, Kaiser Permanente Medical Group, Mills-Peninsula Medical Center, Oracle Corp., San Francisco International Airport, San Mateo County Behavior, SRI International, U. S. Interior Department, and Visa International Services Association. The major labor force in San Francisco County and San Mateo County is represented by the service industries, including financial services, educational and health services, professional and business services, leisure and hospitality, biotech, technology and state government.
The following were listed as major employers in Santa Clara County: Adobe Systems, Inc., Advanced Micro Devices, Inc., Apple Inc., Applied Materials, Avaya, Inc., Christopher Ranch, Inc., Cisco Systems Inc., E Bay Inc., Great America Pavilion, Hewlett-Packard Co., Intel Corp, Lockheed Martin Space Systems, Microsoft Corp, NASA, Net App Inc, Prime Materials, SAP Center at San Jose, Silicon Valley Sports & Entertainment, Stanford University School of Medicine and VA Medical Center-Palo Alto.
At December 31, 2017, the Company had total assets of $1,265,238,000, net loans of $829,766,000, deposits of $1,050,295,000 and stockholders’ equity of $119,280,000. The Company competes with approximately 120 other banking or savings institutions in its San Francisco, San Mateo and Santa Clara County service area. The Company’s market share of Federal Deposit Insurance Corporation insured deposits in the service area of Santa Clara County is less than 0.03%; of San Mateo County is approximately 2.13%, and 0.08% in the San Francisco County market area (based upon the most recent information available from the Federal Deposit Insurance Corporation through June 30, 2017). See “Competitive Data” below.
Competition
General Competitive Factors. In order to compete with the financial institutions in their primary service areas, community banks use the flexibility that has come to define independent community banking. This includes an emphasis on service, local promotional activity and extensive use of the personal contacts of the employees, officers and directors of the Bank. The Bank’s management and employees have developed thorough a knowledge of local businesses and markets.
Community banks also seek to provide special services and programs for individuals in their primary service area who are employed in the agricultural, professional and business fields. These services include loans for equipment, furniture and tools used in the operation and expansion of their businesses. In the event there are customers whose loan demands exceed their respective lending limits, they seek to arrange for such loans on a participation basis with other financial institutions.
| 5 |
Banking is a business that depends on interest rate differentials. In general, the difference between the interest rate paid by a bank to obtain their deposits and other borrowings and the interest rate received by a bank on loans extended to customers and on securities held in a bank’s investment portfolio comprise the major portion of a bank’s earnings. The Bank competes with savings and loan associations, credit unions, other financial institutions and other entities for funds.
The interest rate differentials of a bank, and therefore its earnings, are affected not only by general economic conditions, but also by statutes, as implemented by federal and state agencies. The Federal Reserve Board can and does implement national monetary policy, such as seeking to curb inflation and combat recession, by its open market operations in United States government securities and adjustments to the discount rates applicable to borrowing by banks from the Federal Reserve banks.
These activities influence growth of bank loans, investments and deposits and also affect interest rates charged on loans and paid on deposits. The nature and timing of any future changes in monetary policies and their impact on the Bank are not predictable.
Competitive Data. In its market area, the Bank competes for deposit and loan customers with other banks (including those with much greater resources), thrifts and credit unions, finance companies and other financial service providers. Larger banks may have a competitive advantage because of higher lending limits and major advertising and marketing campaigns, along with significant investment banking, trust and insurance operations.
For borrowers requiring loans in excess of the Bank’s legal lending limits, the Bank has offered, and intends to offer in the future, such loans on a participating basis with other insured financial institutions, retaining the portion of such loans which are within its legal lending limits. As of December 31, 2017, the Bank’s aggregate legal lending limit to a single borrower and such borrower’s related business interests were $19,129,000 on an unsecured basis and $31,882,000 on a fully secured basis, computed based on the Bank’s December 31, 2017 Total Risk-Based Capital of $127,528,000. The Bank’s business is concentrated in its service area, which primarily encompasses San Mateo County and Santa Clara County and the City and County of San Francisco. The economy of the Bank’s service area is dependent upon government, manufacturing, tourism, retail sales, population growth and smaller, service-oriented businesses.
Based upon the most recent information made available by the FDIC Summary of Deposits at June 30, 2017, there were 29 commercial and savings banking institutions in San Mateo County with a total of $38,477,689,000 in deposits. The Bank had a total of 8 offices in San Mateo County with total deposits of $817,835,000 at the same date. There were 45 banking and savings institutions in the City and County of San Francisco with a total of $212,299,667,000 in deposits. The Bank had a total of 4 offices in the City and County of San Francisco with total deposits of $167,319,000. There were 45 commercial and savings banking institutions in Santa Clara County with a total of $134,865,696,000 in deposits. The Bank had one office in Santa Clara County with total deposits of $39,209,000.
Website Information
The Company and the Bank maintain an Internet website at http://www.fnbnorcal.com which allows access to the Company’s financial reports that have been filed with the SEC. The Company’s annual report on Form 10-K and quarterly reports on Form 10-Q and amendments to those reports, filed or furnished pursuant to Section 13(a) or 15(d) of the Securities Exchange Act of 1934, are made available free of charge on or through such website as soon as reasonably practicable after such material is electronically filed with, or furnished to, the Securities and Exchange Commission. Also filed and made available through the SEC’s website located at http://www.sec.gov are the Form 8-K and Section 16 reports of ownership and changes in ownership of the Company’s common stock which are filed with the Securities and Exchange Commission by the directors and executive officers of the Company and by any persons who own more than 10 percent of the outstanding shares of such stock. Information on the Company’s website is not incorporated by reference into this report.
| 6 |
SUPERVISION AND REGULATION
General
FNB Bancorp. The Company is a bank holding company within the meaning of the Bank Holding Company Act of 1956, as amended (the “Bank Holding Company Act”), and is registered as such with, and subject to supervision and regulation by, the Board of Governors of the Federal Reserve System (the “Board of Governors”). As a registered bank holding company, the Company is required to file quarterly and annual reports with the Board of Governors, along with such additional information as the Board of Governors may require. The Company is also a bank holding company within the meaning of the California Financial Code and, as such, is subject to examination by, and may be required to file reports with, the California Department of Business Oversight.
The common stock of the Company is subject to the registration requirements of the Securities Act of 1933, as amended, and the qualification requirements of the California Corporate Securities Law of 1968, as amended. FNB Bancorp has registered its common stock under Section 12 (g) of the Securities Exchange Act of 1934, as amended. The Company is also subject to the periodic reporting requirements of Section 13 of the Securities Exchange Act of 1934, as amended, which include, but are not limited to, annual, quarterly and other current reports required to be filed with the Securities and Exchange Commission. The common stock of the Company is traded on the Nasdaq Global Select Market under the trading symbol, “FNBG.”
The California Corporate Disclosure Act requires publicly traded corporations incorporated or qualified to do business in California to disclose information about their past history, auditors, directors and officers. Consequently, the Company files disclosures annually with the California Secretary of State as to the name of the Company’s independent auditor, the compensation paid to each of its directors and the five most highly compensated non-director executive officers, any loans made to a director or executive officer at a “preferential” loan rate, whether any director or executive officer has been convicted of fraud or has filed in bankruptcy and any material pending legal proceedings other than ordinary routine litigation.
The Company is required to obtain the approval of the Board of Governors before it may acquire all or substantially all of the assets of any bank, or ownership or control of the voting shares of any bank if, after giving effect to such acquisition of shares, the Company would own or control more than 5% of the voting shares of such bank. The Bank Holding Company Act prohibits the Company from acquiring any voting shares of, or interest in, all or substantially all of the assets of a bank located outside the State of California unless such an acquisition is specifically authorized by the laws of the state in which such bank is located. Any such interstate acquisition is also subject to the provisions of the Riegle-Neal Interstate Banking and Branching Efficiency Act of 1994.
The Company, and any non-bank subsidiary which it may acquire or organize, are deemed to be “affiliates” of the Bank within the meaning of that term as defined in the Federal Reserve Act. This means, for example, that there are limitations (a) on loans by the Bank to its affiliates, and (b) on investments by the Bank in affiliates’ stock as collateral for loans to any borrower. The Company and the Bank are also subject to certain restrictions with respect to engaging in the underwriting, public sale and distribution of securities.
In addition, regulations of the Board of Governors under the Federal Reserve Act require that reserves be maintained by the Bank in conjunction with any liability of the Company under any obligation (promissory note, acknowledgment of advance, banker’s acceptance or similar obligation) with a weighted average maturity of less than seven (7) years to the extent that the proceeds of such obligations are used for the purpose of supplying funds to the Bank for use in its banking business, or to maintain the availability of such funds.
As provided in the Dodd-Frank Wall Street Reform and Consumer Protection Act of 2010, a bank holding company (such as the Company) must serve as a source of financial strength for any subsidiary of the bank holding company that is a depository institution (such as the Bank) and the federal banking agencies are directed to issue joint rules to carry out this mandate. The term “source of financial strength” means the ability to provide financial assistance to the depository institution in the event of the financial distress of the institution. See “Impact of Certain Legislation and Regulation – Dodd-Frank Wall Street Reform and Consumer Protection Act of 2010” below.
First National Bank of Northern California. As a national banking association licensed under the national banking laws of the United States, the Bank is regularly examined by the Office of the Comptroller of the Currency and is further subject to supervision and regulation by the Federal Deposit Insurance Corporation and the Board of Governors of the Federal Reserve System.
This supervision and regulation includes comprehensive reviews of all major aspects of the Bank’s business and condition, including its capital ratios, allowance for possible loan losses and other factors. However, no inference should be drawn that such authorities have approved any such factors. The Bank is required to file reports with the Office of the Comptroller of the Currency and the Federal Deposit Insurance Corporation. The Bank’s deposits are insured by the Federal Deposit Insurance Corporation up to the applicable legal limits.
| 7 |
The Company and the Bank are also subject to the applicable provisions of California law to the extent those provisions are not in conflict with or preempted by Federal banking law. This includes regulations of the California Department of Business Oversight.
General. Bank holding companies, such as the Company, and commercial banks, such as the Bank, are subject to extensive supervision and regulation by federal and state regulators. Various and multiple requirements and restrictions under federal and state law affect our operations, as summarized below.
Capital Standards
Risk-Based Capital. The Board of Governors, the Office of the Comptroller of the Currency and the Federal Deposit Insurance Corporation have adopted risk-based capital guidelines for evaluating the capital adequacy of bank holding companies and banks. The guidelines were designed to make capital requirements sensitive to differences in risk profiles among banking organizations, to take into account off-balance sheet exposures and to aid in making the definition of bank capital uniform internationally. Under the risk-based guidelines and prior to amendments to the capital rules effective January 1, 2015, as described below in “Basel III - New Capital and Prompt Corrective Action Regulations,” the Company and the Bank were required to maintain capital equal to at least 8% of its assets and commitments to extend credit, weighted by risk, of which at least 4% was required to consist primarily of common equity (including retained earnings) and the remainder was to consist of subordinated debt, cumulative preferred stock, or a limited amount of loan and lease loss reserves.
Assets, commitments to extend credit, and off-balance sheet items were categorized according to risk and certain assets considered to present less risk than others permitted maintenance of capital at less than the 8% ratio. For example, most home mortgage loans were placed in a 50% risk category and therefore required maintenance of capital equal to 4% of those loans, while commercial loans were placed in a 100% risk category and therefore required maintenance of capital equal to 8% of those loans.
Under the risk-based capital guidelines, assets reported on an institution’s balance sheet and certain off-balance sheet items are assigned to risk categories, each of which has an assigned risk weight. Capital ratios are calculated by dividing the institution’s qualifying capital by its period-end risk-weighted assets. The guidelines established two categories of qualifying capital: Tier 1 capital (core capital including common shareholders’ equity and noncumulative perpetual preferred stock) and Tier 2 capital (supplementary capital which includes, among other items, limited life (and in the case of banks, cumulative) preferred stock, mandatory convertible securities, subordinated debt and a limited amount of reserve for credit losses. Each institution was required to maintain a minimum risk-based capital ratio (including Tier 1 and Tier 2 capital) of 8%, of which at least half was to be Tier 1 capital.
A leverage capital standard was adopted as a supplement to the risk-weighted capital guidelines. Under the leverage capital standard, an institution was required to maintain a minimum ratio of Tier 1 capital to the sum of its quarterly average total assets and quarterly average reserve for loan losses, less intangible assets not included in Tier 1 capital. Period-end assets may be used in place of quarterly average total assets on a case-by-case basis. A minimum leverage ratio was also adopted for bank holding companies as a supplement to the risk-weighted capital guidelines. The leverage ratio establishes a minimum Tier 1 ratio of 3% (Tier 1 capital to total assets) for the highest rated bank holding companies or those that have implemented the risk-based capital market risk measure. All other bank holding companies must maintain a minimum Tier 1 leverage ratio of 4% with higher leverage capital ratios required for bank holding companies that have significant financial and/or operational weakness, a high-risk profile, or are undergoing or anticipating rapid growth.
Effective January 1, 2015, the risk-based capital regulations described above were amended to the extent described below in “Basel III - New Capital and Prompt Corrective Action Regulations.”
Basel III – New Capital and Prompt Corrective Action Regulations. “Basel III” refers to a comprehensive set of reform measures developed by the Bank for International Settlements to strengthen the regulation, supervision and risk management of the banking sector. In July 2013, the federal bank regulatory agencies issued interim final rules that revised and replaced the risk-based capital requirements (summarized above) in order to implement the Basel III regulatory capital reforms released by the Basel Committee on Banking Supervision and changes required by the Dodd-Frank Wall Street Reform and Consumer Protection Act of 2010. The Basel III reforms reflected in the final rules include an increase in the risk-based capital requirements and certain changes to capital components, as well as changes to the calculation and categories of risk-weighted assets. For example, changes to risk weighted assets include increasing the original risk weight to 150% on assets past due 90 days or more or on nonaccrual, utilizing loan to value ratios in the risk weighting of mortgage loans and assigning a 150% risk weight to certain higher risk commercial real estate loans.
| 8 |
Effective January 1, 2015, bank holding companies with consolidated assets of $1 billion or more and banks like the Bank must comply with new minimum capital ratio requirements to be phased-in between January 1, 2015 and January 1, 2019, which consist of the following: (i) a new common equity Tier 1 capital to total risk weighted assets ratio of 4.5%; (ii) a Tier 1 capital to total risk weighted assets ratio of 6% (increased from 4%); (iii) a total capital to total risk weighted assets ratio of 8% (unchanged); and (iv) a Tier 1 capital to adjusted average total assets (“leverage”) ratio of 4%.
In addition, a “capital conservation buffer” is established which when fully phased-in will require maintenance of a minimum of 2.5% of common equity Tier 1 capital to total risk weighted assets in excess of the regulatory minimum capital ratio requirements described above. The 2.5% buffer will increase the minimum capital ratios to (i) a common equity Tier 1 capital ratio of 7%, (ii) a Tier 1 capital ratio of 8.5%, and (iii) a total capital ratio of 10.5%. The new buffer requirement will be phased-in between January 1, 2016 and January 1, 2019. If the capital ratio levels of a banking organization fall below the capital conservation buffer amount, the organization will be subject to limitations on (i) the payment of dividends; (ii) discretionary bonus payments; (iii) discretionary payments under Tier 1 instruments; and (iv) engaging in share repurchases.
| Transition for New Ratios and Capital Definitions for Community Banks | ||||||||||||
| 2019 and | ||||||||||||
| Years (as of Jan. 1) | 2017 | 2018 | Thereafter | |||||||||
| Minimum CET1 ratio | 4.500 | % | 4.500 | % | 4.500 | % | ||||||
| Capital Conservation buffer | 1.250 | % | 1.875 | % | 2.500 | % | ||||||
| CET1 plus capital conservation buffer | 5.750 | % | 6.375 | % | 7.000 | % | ||||||
| Phase-in of deduction from CET1 * | 80.000 | % | 100.000 | % | 100.000 | % | ||||||
| Minimum Tier 1 capital | 6.000 | % | 6.000 | % | 6.000 | % | ||||||
| Minimum Tier 1 capital plus capped conservation buffer | 7.250 | % | 7.875 | % | 8.500 | % | ||||||
| Minimum total capital | 8.000 | % | 8.000 | % | 8.000 | % | ||||||
| Minimum total capital plus conservation buffer | 9.250 | % | 9.875 | % | 10.500 | % | ||||||
| * Including threshold deduction items that are over the limits | ||||||||||||
The federal bank regulatory agencies also implemented changes to the prompt corrective action framework, described below in “Prompt Corrective Action,” which are designed to place restrictions on insured depository institutions if their capital ratios begin to show signs of weakness. These changes took effect beginning January 1, 2015 and require insured depository institutions to meet the following increased capital ratio requirements in order to qualify as “well capitalized:” (i) a new common equity Tier 1 capital ratio of 6.5%; (ii) a Tier 1 capital ratio of 8%; (iii) a total capital ratio of 10%; and (iv) a Tier 1 leverage ratio of 5%. In order to qualify as “adequately capitalized,” institutions must have (i) a new common equity Tier 1 capital ratio of 4.5%; (ii) a Tier 1 capital ratio of 6%; (iii) a total capital ratio of 8%; and (iv) a Tier 1 leverage ratio of 4%. See also the additional requirements of the prompt corrective action framework discussed below in “Prompt Corrective Action.”
Management believes that the Bank is in compliance with the minimum capital requirements, including the fully phased-in capital conservation buffer requirement, based upon its capital position at December 31, 2017. See “Capital” under “Management’s Discussion and Analysis of Financial Condition and the Results of Operations” set forth in Item 7 below and Note 19 “Regulatory Matters” in the “Financial Statements and Supplementary Data” set forth in Item 8 below.
| 9 |
Prompt Corrective Action
The Board of Governors, the Office of the Comptroller of the Currency and the Federal Deposit Insurance Corporation have adopted regulations implementing a system of prompt corrective action pursuant to Section 38 of the Federal Deposit Insurance Act and Section 131 of the FDIC Improvement Act of 1991 (“FDICIA”). Prior to amendments to the capital rules effective January 1, 2015, as described above in “Basel III - New Capital and Prompt Corrective Action Regulations,” the regulations established five capital categories with the following characteristics: (1) “Well capitalized” - consisting of institutions with a total risk-based capital ratio of 10% or greater, a Tier 1 risk-based capital ratio of 6% or greater and a leverage ratio of 5% or greater, and the institution is not subject to an order, written agreement, capital directive or prompt corrective action directive; (2) “Adequately capitalized” - consisting of institutions with a total risk-based capital ratio of 8% or greater, a Tier 1 risk-based capital ratio of 4% or greater and a leverage ratio of 4% or greater, and the institution does not meet the definition of a “well capitalized” institution; (3) “Undercapitalized” - consisting of institutions with a total risk-based capital ratio less than 8%, a Tier 1 risk-based capital ratio of less than 4%, or a leverage ratio of less than 4%; (4) “Significantly undercapitalized” - consisting of institutions with a total risk-based capital ratio of less than 6%, a Tier 1 risk-based capital ratio of less than 3%, or a leverage ratio of less than 3%; (5) “Critically undercapitalized” - consisting of an institution with a ratio of tangible equity to total assets that is equal to or less than 2%.
The regulations established procedures for classification of financial institutions within the capital categories, and for filing and reviewing capital restoration plans required under the regulations and procedures for issuance of directives by the appropriate regulatory agency, among other matters. The regulations imposed restrictions upon all institutions to refrain from certain actions which would cause an institution to be classified within any one of the three “undercapitalized” categories, such as declaration of dividends or other capital distributions or payment of management fees, if following the distribution or payment the institution would be classified within one of the “undercapitalized” categories. In addition, institutions which are classified in one of the three “undercapitalized” categories are subject to certain mandatory and discretionary supervisory actions. Mandatory supervisory actions include (1) increased monitoring and review by the appropriate federal banking agency; (2) implementation of a capital restoration plan; (3) total asset growth restrictions; and (4) limitations upon acquisitions, branch expansion, and new business activities without prior approval of the appropriate federal banking agency. Discretionary supervisory actions may include (a) requirements to augment capital; (b) restrictions upon affiliate transactions; (c) restrictions upon deposit gathering activities and interest rates paid; (d) replacement of senior executive officers and directors; (e) restrictions upon activities of the institution and its affiliates; (f) requiring divestiture or sale of the institution; and (g) any other supervisory action that the appropriate federal banking agency determines is necessary to further the purposes of the regulations. Further, the federal banking agencies may not accept a capital restoration plan without determining, among other things, that the plan is based on realistic assumptions and is likely to succeed in restoring the depository institution’s capital. In addition, for a capital restoration plan to be acceptable, the depository institution’s parent holding company must guarantee that the institution will comply with such capital restoration plan. The aggregate liability of the parent holding company under the guaranty is limited to the lesser of (i) an amount equal to 5 percent of the depository institution’s total assets at the time it became undercapitalized, and (ii) the amount that is necessary (or would have been necessary) to bring the institution into compliance with all capital standards applicable with respect to such institution as of the time it fails to comply with the plan. If a depository institution fails to submit an acceptable plan, it is treated as if it were “significantly undercapitalized.” FDICIA also restricts the solicitation and acceptance of and interest rates payable on brokered deposits by insured depository institutions that are not “well capitalized.” An “undercapitalized” institution is not allowed to solicit deposits by offering rates of interest that are significantly higher than the prevailing rates of interest on insured deposits in the particular institution’s normal market areas or in the market areas in which such deposits would otherwise be accepted.
Any financial institution which is classified as “critically undercapitalized” must be placed in conservatorship or receivership within ninety days of such determination unless it is also determined that some other course of action would better serve the purposes of the regulations. Critically undercapitalized institutions are also prohibited from making (but not accruing) any payment of principal or interest on subordinated debt without prior regulatory approval and regulators must prohibit a critically undercapitalized institution from taking certain other actions without prior approval, including (1) entering into any material transaction other than in the usual course of business, including investment expansion, acquisition, sale of assets or other similar actions; (2) extending credit for any highly leveraged transaction; (3) amending articles or bylaws unless required to do so to comply with any law, regulation or order; (4) making any material change in accounting methods; (5) engaging in certain affiliate transactions; (6) paying excessive compensation or bonuses; and (7) paying interest on new or renewed liabilities at rates which would increase the weighted average costs of funds beyond prevailing rates in the institution’s normal market areas.
| 10 |
On November 18, 2014, the Federal Deposit Insurance Corporation adopted the “Assessments Final Rule” which revises the FDIC’s risk-based deposit insurance assessment system to reflect changes in the regulatory capital rules, effective commencing January 1, 2015. For smaller financial institutions (with total assets less than $1 billion and which are not custodial banks), the Assessments Final Rule revised and conformed capital ratios and ratio thresholds to the new prompt corrective action capital ratios and ratio thresholds for “well capitalized” and “adequately capitalized” evaluations which were adopted by the federal banking agencies as part of the Basel III capital regulations. Consequently, effective January 1, 2015, the prompt corrective action regulations were amended to the extent described above in “Basel III – New Capital and Prompt Corrective Action Regulations.”
Uniform Rating System
The Federal Financial Institutions Examination Council (“FFIEC”) utilizes the Uniform Financial Institutions Rating System (“UFIRS”), commonly referred to as “CAMELS,” to classify and evaluate the soundness of financial institutions. Bank examiners use the CAMELS measurements to evaluate capital adequacy, asset quality, management, earnings, liquidity and sensitivity to market risk.
Effective January 1, 2005, bank holding companies such as the Company became subject to evaluation and examination under a revised bank holding company rating system.
The federal financial institution agencies have established bases for analysis and standards for assessing financial institution’s capital adequacy in conjunction with the risk-based and Basel III capital guidelines, including analysis of interest rate risk, concentrations of credit risk, risk posed by non-traditional activities, and factors affecting overall safety and soundness. The safety and soundness standards for insured financial institutions include analysis of (1) internal controls, information systems and internal audit systems; (2) loan documentation; (3) credit underwriting; (4) interest rate exposure; (5) asset growth; (6) compensation, fees and benefits; and (7) excessive compensation for executive officers, directors or principal shareholders which could lead to material financial loss. If an agency determines that an institution fails to meet any standard, the agency may require the financial institution to submit to the agency an acceptable plan to achieve compliance with the standard. If the agency requires submission of a compliance plan and the institution fails to timely submit an acceptable plan or to implement an accepted plan, the agency will require the institution to correct the deficiency. The agencies may elect to initiate enforcement action in certain cases rather than rely on an existing plan, particularly where failure to meet one or more of the standards could threaten the safe and sound operation of the institution.
CRA Compliance
Community Reinvestment Act (“CRA”) regulations evaluate banks’ lending to low and moderate income individuals and businesses across a four-point scale from “outstanding” to “substantial noncompliance,” and are a factor in regulatory review of applications to merge, establish new branches or form bank holding companies. In addition, any bank rated in “substantial noncompliance” with the CRA regulations may be subject to enforcement proceedings. The Bank has a current rating of “satisfactory” for CRA compliance.
FDIC Insurance
The Federal Deposit Insurance Corporation (“FDIC”) is an independent federal agency that insures deposits of federally insured banks (such as the Bank) and savings institutions up to prescribed limits through the Deposit Insurance Fund (“DIF”). All depository accounts of the Bank are covered by FDIC insurance up to established maximum limits (currently $250,000 per separately insured depositor). The amount of FDIC assessments paid by each DIF member institution for insurance coverage is based on its risk profile as measured by regulatory capital ratios and other supervisory factors. In 2011, as required by the Dodd-Frank Act, the FDIC revised the assessment rates and the deposit insurance assessment base used to calculate premiums paid to DIF. The amount of FDIC assessments paid by each DIF member institution for insurance coverage is now based on an average/total assets less average tangible equity, defined as Tier 1 capital and an institution’s risk profile as measured by regulatory capital ratios and other supervisory factors, with assessments ranging from 2.5 to 9 basis points for institutions in the lowest risk category to 30 to 45 basis points for those in the highest risk category.
| 11 |
Dividends
FNB Bancorp. The Company’s ability to pay cash dividends is subject to restrictions set forth in the California General Corporation Law. Funds for payment of any cash dividends by the Company could be obtained from its investments, equity sales or dividends received from the Bank. The Bank’s ability to pay cash dividends to the Company is subject to restrictions imposed under the National Bank Act and regulations promulgated by the Office of the Comptroller of the Currency. The Company has paid cash dividends for each quarter of operations commencing with the second quarter of 2002. Future dividends will continue to be determined after consideration of the Company’s earnings, financial condition, future capital funds, regulatory requirements and other relevant factors.
The California General Corporation Law provides that neither a corporation nor any of its subsidiaries shall make a distribution to the corporation’s shareholders unless the board of directors has determined in good faith either of the following: (1) the amount of retained earnings of the corporation immediately prior to the distribution equals or exceeds the sum of (A) the amount of the proposed distribution plus (B) the preferential dividends arrears amount; or (2) immediately after the distribution, the value of the corporation’s assets would equal or exceed the sum of its total liabilities plus the preferential rights amount. The good faith determination of the board of directors may be based upon (1) financial statements prepared on the basis of reasonable accounting practices and principles, (2) a fair valuation, or (3) any other method reasonable under the circumstances; provided, that a distribution may not be made if the corporation or subsidiary making the distribution is, or is likely to be, unable to meet its liabilities (except those whose payment is otherwise adequately provided for) as they mature. The term “preferential dividends arrears amount” means the amount, if any, of cumulative dividends in arrears on all shares having a preference with respect to payment of dividends over the class or series to which the applicable distribution is being made, provided that if the articles of incorporation provide that a distribution can be made without regard to preferential dividends arrears amount, then the preferential dividends arrears amount shall be zero. The term “preferential rights amount” means the amount that would be needed if the corporation were to be dissolved at the time of the distribution to satisfy the preferential rights, including accrued but unpaid dividends, of other shareholders upon dissolution that are superior to the rights of the shareholders receiving the distribution, provided that if the articles of incorporation provide that a distribution can be made without regard to any preferential rights, then the preferential rights amount shall be zero.
The Board of Governors generally prohibits a bank holding company from declaring or paying a cash dividend which would impose undue pressure on the capital of subsidiary banks or would be funded only through borrowing or other arrangements that might adversely affect a bank holding company’s financial position. The Federal Reserve Board policy is that a bank holding company should not continue its existing rate of cash dividends on its common stock unless its net income is sufficient to fully fund each dividend and its prospective rate of earnings retention appears consistent with its capital needs, asset quality and overall financial condition.
First National Bank of Northern California. As the Bank’s sole shareholder, the Company is entitled to receive dividends when and as declared by the Bank’s Board of Directors, out of funds legally available therefore, subject to the restrictions set forth in the National Bank Act.
The payment of cash dividends by the Bank may be subject to the approval of the Office of the Comptroller of the Currency, as well as restrictions established by federal banking law and the FDIC. Approval of the Office of the Comptroller of the Currency is required if the total of all dividends declared by the Bank’s Board of Directors in any calendar year will exceed the Bank’s net profits for that year combined with its retained net profits for the preceding two years, less any required transfers to surplus or to a fund for the retirement of preferred stock.
Additionally, the FDIC and/or the Office of the Comptroller of the Currency, might, under some circumstances, place restrictions on the ability of a bank to pay dividends.
Impact of Certain Legislation and Regulation
Gramm-Leach-Bliley Act of 1999. The Gramm-Leach-Bliley Act of 1999 (the “GLB Act”) eliminated most of the remaining depression-era “firewalls” between banks, securities firms and insurance companies which were established by the Banking Act of 1933, also known as the Glass-Steagall Act (“Glass-Steagall”). Glass-Steagall sought to insulate banks as depository institutions from the perceived risks of securities dealing and underwriting, and related activities. The GLB Act repealed Section 20 of Glass-Steagall, which prohibited banks from affiliating with securities firms. Bank holding companies that can qualify as “financial holding companies” can now, among other matters, acquire securities firms or create them as subsidiaries, and securities firms can now acquire banks or start banking activities through a financial holding company. The GLB Act includes provisions which permit national banks to conduct financial activities through a subsidiary that are permissible for a national bank to engage in directly, as well as certain activities authorized by statute, or that are financial in nature or incidental to financial activities to the same extent as permitted to a “financial holding company” or its affiliates. This liberalization of United States banking and financial services regulation applies both to domestic institutions and foreign institutions conducting business in the United States. Consequently, the common ownership of banks, securities firms and insurance is now possible, as is the conduct of commercial banking, merchant banking, and investment management, securities underwriting and insurance within a single financial institution using a structure authorized by the GLB Act. Neither the Company nor the Bank has determined whether or when it may seek to acquire and exercise new powers or activities under the GLB Act.
| 12 |
Financial holding companies are also permitted to engage in activities that are complementary to financial activities if the Board of Governors determines that the activity does not pose a substantial risk to the safety or soundness of depository institutions or the financial system in general. These standards expand upon the list of activities “closely related to banking” which have defined the permissible activities of bank holding companies under the Bank Holding Company Act. One further effect of the Act was to require that federal financial institution and securities regulatory agencies prescribe regulation to implement the policy that financial institutions must respect the privacy of their customers and protect the security and confidentiality of customers’ non-public personal information. These regulations require, in general, that financial institutions (1) may not disclose non-public information of customers to non-affiliated third parties without notice to their customers, who must have an opportunity to direct that such information not be disclosed; (2) may not disclose customer account numbers except to consumer reporting agencies; and (3) must give prior disclosure of their privacy policies before establishing new customer relationships.
The Patriot Act. On October 26, 2001, President Bush signed the USA Patriot Act (the “Patriot Act”), which included provisions pertaining to domestic security, surveillance procedures, border protection, and terrorism laws to be administered by the Secretary of the Treasury. Title III of the Patriot Act entitled, “International Money Laundering Abatement and Anti-Terrorist Financing Act of 2001” includes amendments to the Bank Secrecy Act which expand the responsibilities of financial institutions in regard to anti-money laundering activities with particular emphasis upon international money laundering and terrorism financing activities through designated correspondent and private banking accounts.
The Patriot Act contains various provisions that affect the operations of financial institutions by encouraging cooperation among financial institutions, regulatory authorities and law enforcement authorities with respect to individuals, entities and organizations engaged in, or reasonably suspected of engaging in, terrorist acts or money laundering activities. The Company and the Bank are not currently aware of any account relationships between the Bank and any foreign bank or other person or entity which would not be in compliance with the Patriot Act.
Certain surveillance provisions of the Patriot Act expired on June 1, 2015 but were renewed the next day by the passage of the USA Freedom Act on June 2, 2015 and extended through 2019. However, the provision under which the National Security Agency (“NSA”) conducted mass phone data collection on individuals was changed to require the NSA to seek permission from a federal court in order to obtain such data from phone companies.
The effects which the Patriot Act and any amendments to the Patriot Act or any additional legislation enacted by Congress may have upon financial institutions is uncertain; however, such legislation could increase compliance costs and thereby potentially may have an adverse effect upon the Company’s results of operations.
Sarbanes-Oxley Act of 2002. On July 30, 2002, President Bush signed into law the Sarbanes-Oxley Act of 2002 (“Sarbanes-Oxley”), legislation designed to address certain issues of corporate governance and accountability. Among other matters, key provisions of Sarbanes-Oxley and rules promulgated by the Securities and Exchange Commission pursuant to Sarbanes-Oxley include enhancement of financial disclosures and related certification requirements, rules related to audit committees, auditor independence, ethics requirements, securities trading prohibitions, securities reporting requirements, and securities listing requirements. The Company’s common stock is traded on the Nasdaq Global Select Market and therefore is required to comply with the Nasdaq listing standards in addition to the rules promulgated by the Securities and Exchange Commission pursuant to Sarbanes-Oxley. The effect of Sarbanes-Oxley on the Company is uncertain; however, the Company has incurred, and it is anticipated that it will continue to incur costs to comply with Sarbanes-Oxley and the rules and regulations promulgated pursuant to Sarbanes-Oxley by the Securities and Exchange Commission and other regulatory agencies having jurisdiction over the Company on the issuance and listing of its securities. The Company does not currently anticipate, however, that compliance with Sarbanes-Oxley and such rules and regulations will have a material effect upon its financial position or results of its operations or its cash flows.
| 13 |
Small Business Jobs Act of 2010. On September 27, 2010, President Obama signed into law the Small Business Jobs Act of 2010 (the “SBJ Act”), which, among other matters, authorized the U.S. Treasury to buy preferred stock or subordinated debt issued by community banks with assets less than $10 billion. On September 15, 2011, as part of the Small Business Lending Fund program established under the SBJ Act, the Company issued and sold to the Secretary of the Treasury a total of 12,600 shares of the Company’s Senior Non-Cumulative Perpetual Preferred Stock, Series C (the “Series C Preferred Stock”) for a purchase price of $12,600,000. The Series C Preferred Stock qualified as Tier 1 capital. All of the $12,600,000 proceeds from the Company’s sale of its Series C Preferred Stock were immediately applied to the Company’s repurchase of outstanding shares of preferred stock which had been issued to the United States Department of the Treasury on February 27, 2009, pursuant to the TARP Capital Purchase Program authorized by the Emergency Economic Stabilization Act of 2008, as amended by the American Recovery and Reinvestment Act of 2009. On May 6, 2013, the Company redeemed 25% of the original issue $12,600,000 of Series C Preferred Stock for a cash payment of $3,150,000. Subsequently, on January 23, 2014, the remaining $9,450,000 of Series C Preferred Stock was redeemed by the Company, also in a cash transaction.
Dodd-Frank Wall Street Reform and Consumer Protection Act of 2010. On July 21, 2010, President Obama signed into law the Dodd-Frank Wall Street Reform and Consumer Protection Act of 2010 (the “Dodd-Frank Act”). The Dodd-Frank Act is intended to restructure the regulation of the financial services sector by, among other things, (i) establishing a framework to identify systemic risks in the financial system implemented by a newly created Financial Stability Oversight Council and other federal banking agencies; (ii) expanding the resolution authority of the federal banking agencies over troubled financial institutions; (iii) authorizing changes to capital and liquidity requirements; (iv) changing deposit insurance assessments; and (v) enhancing regulatory supervision to improve the safety and soundness of the financial services sector. Below is a summary of certain provisions of the Dodd-Frank Act which, directly or indirectly, may affect the Company and the Bank.
| · | Changes to Capital Requirements. The federal banking agencies are required to establish minimum leverage and risk-based capital requirements for banks and bank holding companies which will not be lower and could be higher than established regulatory capital and leverage standards for insured depository institutions. Under these requirements, trust preferred securities will be excluded from Tier 1 capital unless such securities were issued prior to May 19, 2010 by a bank holding company with less than $15 billion in assets. The Company has no trust preferred securities outstanding. The Dodd-Frank Act requires capital increases in times of economic expansion and decreases in times of economic contraction consistent with safety and soundness. |
| · | Enhanced Regulatory Supervision. The Dodd-Frank Act increases regulatory oversight, supervision and examination of banks, bank holding companies and their respective subsidiaries by the appropriate regulatory agency. |
| · | Consumer Protection. The Dodd-Frank Act created the Consumer Financial Protection Bureau (“CFPB”) within the Federal Reserve System. The CFPB is responsible for establishing and implementing rules and regulations under various federal consumer protection laws governing certain consumer products and services. |
| · | The CFPB has primary enforcement authority over large financial institutions with assets of $10 billion or more, while smaller institutions will be subject to the CFPB’s rules and regulations through the enforcement authority of the federal banking agencies. States are permitted to adopt consumer protection laws and regulations that are more stringent than those laws and regulations adopted by the CFPB and state attorneys general are permitted to enforce consumer protection laws and regulations adopted by the CFPB. |
| · | Deposit Insurance. The Dodd-Frank Act permanently increased the deposit insurance limit for insured deposits to $250,000 per depositor and extended unlimited deposit insurance to non-interest bearing transaction accounts until December 31, 2012. Other deposit insurance changes under the Dodd-Frank Act include (i) amendment of the assessment base used to calculate an insured depository institution’s deposit insurance premiums paid to the Deposit Insurance Fund (“DIF”) by elimination of deposits and substitution of average consolidated total assets less average tangible equity during the assessment period as the revised assessment base; (ii) increasing the minimum designated reserve ratio of the DIF from 1.15% to 1.35% of the estimated amount of total insured deposits; (iii) eliminating the requirement that the FDIC pay dividends to depository institutions when the reserve ratio exceeds certain thresholds; and (iv) repeal of the prohibition upon the payment of interest on demand deposits to be effective one year after the date of enactment of the Dodd-Frank Act. |
| 14 |
| · | Transactions with Affiliates. The Dodd-Frank Act enhanced the requirements for certain transactions with affiliates under Section 23A and 23B of the Federal Reserve Act, including an expansion of the definition of “covered transactions” and increasing the amount of time for which collateral requirements regarding covered transactions must be maintained. |
| · | Transactions with Insiders. Insider transaction limitations were expanded through the strengthening of loan restrictions to insiders and the expansion of the types of transactions subject to various limits, including derivative transactions, repurchase agreements, reverse repurchase agreements and securities lending or borrowing transactions. Restrictions were also placed on certain asset sales to and from an insider to an institution, including requirements that such sales be on market terms and, in certain circumstances, approved by the institution’s board of directors. |
| · | Enhanced Lending Limitations. The Dodd-Frank Act strengthened the existing limits on a depository institution’s credit exposure to include credit exposure arising from derivative transactions, repurchase agreements, and securities lending and borrowing transactions. |
| · | Debit Card Interchange Fees. The Dodd-Frank Act required that the amount of any interchange fee charged by a debit card issuer with respect to a debit card transaction must be reasonable and proportional to the cost incurred by the issuer. Within nine months of enactment of the Dodd-Frank Act, the Federal Reserve Board was required to establish standards for reasonable and proportional fees which may take into account the costs of preventing fraud. The restrictions on interchange fees, however, do not apply to banks that, together with their affiliates, have assets of less than $10 billion. |
| · | Interstate Branching. The Dodd-Frank Act authorized national and state banks to establish branches in other states to the same extent as a bank chartered by that state would be permitted to branch. Previously, banks could only establish branches in other states if the host state expressly permitted out-of-state banks to establish branches in that state. Accordingly, banks will be able to enter new markets more freely. |
| · | Charter Conversions. Effective one year after enactment of the Dodd-Frank Act, depository institutions that are subject to a cease and desist order or certain other enforcement actions issued with respect to a significant supervisory matter were prohibited from changing their federal or state charters, except in accordance with certain notice, application and other procedures involving the applicable regulatory agencies. |
| · | Compensation Practices. The Dodd-Frank Act provided that the appropriate federal banking regulators must establish standards prohibiting as an unsafe and unsound practice any compensation plan of a bank holding company or other “covered financial institution” that provides an insider or other employee with “excessive compensation” or could lead to a material financial loss to such firm. In June 2010, prior to the enactment of the Dodd-Frank Act, the federal bank regulatory agencies jointly issued the Interagency Guidance on Sound Incentive Compensation Policies (“Guidance”), which requires that financial institutions establish metrics for measuring the risk to the financial institution of such loss from incentive compensation arrangements and implement policies to prohibit inappropriate risk taking that may lead to material financial loss to the institution. |
| · | Corporate Governance. The Dodd-Frank Act has enhanced corporate governance requirements to include (i) requiring publicly traded companies to give shareholders a non-binding vote on executive compensation at their first annual meeting taking place six months after the enactment and at least every three years thereafter and on so-called “golden parachute” payments in connection with approvals of mergers and acquisitions unless previously voted on by shareholders; (ii) authorizing the SEC to promulgate rules that would allow shareholders to nominate their own candidates for election as directors using a company’s proxy materials; (iii) directing the federal banking regulators to promulgate rules prohibiting excessive compensation paid to executives of depository institutions and their holding companies with assets in excess of $1.0 billion, regardless of whether or not the company is publicly traded; and (iv) authorizing the SEC to prohibit broker discretionary voting on the election of directors and on executive compensation matters. |
| 15 |
Many of the requirements under the Dodd-Frank Act are being implemented over an extended period of time and therefore, the nature and extent of regulations that will be issued by various regulatory agencies and the impact such regulations will have on the operations of financial institutions such as the Company and the Bank is unclear. Such regulations resulting from the Dodd-Frank Act may impact the profitability of our business activities, require changes to certain of our business practices, impose upon us more stringent capital, liquidity and leverage ratio requirements or otherwise adversely affect our business. These changes may also require us to invest significant management attention and resources to evaluate and make necessary changes in order to comply with new statutory and regulatory requirements.
Volcker Rule. On December 10, 2013, the federal banking agencies jointly issued a final rule implementing the so-called “Volcker Rule” (set forth in Section 619 of the Dodd-Frank Act). The Volcker rule prohibits depository institutions, companies that control such institutions, bank holding companies, and the affiliates and subsidiaries of such banking entities, from engaging as principal for the trading account of the banking entity in any purchase or sale of one or more covered financial instruments (so-called “proprietary trading”) and imposes limitations upon retaining interests in, sponsoring, investing in and transacting with certain investment funds, including hedge funds and private equity funds. The effective date of the final rule restricting proprietary trading was extended to July 21, 2015, and certain other matters were extended to July 21, 2017. Neither the Company nor the Bank engages in activities prohibited by the Volcker Rule and management does not expect the Volcker Rule to have a material impact upon the Company or the Bank.
Tax Cuts and Jobs Act
On December 22, 2017, President Donald Trump signed into law the Tax Cuts and Jobs Act ( the “Act”), which among other things reduced the federal corporate income tax rate to 21% effective January 1, 2018. As a result, the Company has concluded that this Act caused a reduction in the net deferred tax asset of the Company of $3 million, as of December 31, 2017, due to the revaluation of the Company’s net timing differences at the lower statutory income tax rate. The estimated fourth quarter of 2017 earnings impact was $(0.39) per average diluted share outstanding.
Future Legislation and Regulations
Certain legislative and regulatory proposals that could affect the Company, the Bank, and the banking business in general are periodically introduced before the United States Congress, the California State Legislature and federal and state government agencies. It is not known to what extent, if any, legislative proposals will be enacted and what effect such legislation would have on the structure, regulation and competitive relationships of financial institutions. It is likely, however, that such legislation could subject the Company and the Bank to increased regulation, disclosure and reporting requirements, more competition, and increased costs of doing business. In addition to legislative changes, the various federal and state financial institution regulatory agencies frequently propose rules and regulations to implement and enforce already existing legislation. It cannot be predicted whether or in what form any such rules or regulations will be enacted or the effect that such regulations may have on the Company and the Bank.
In addition to the risks associated with the business of banking generally, as described above under Item 1 (Description of Business), the Company’s business, financial condition, operating results, future prospects and stock price can be adversely impacted by certain risk factors, as set forth below, any of which could cause the Company’s actual results to vary materially from the recent results or from the Company’s anticipated future results.
Extensive Regulation of Banking. The Company’s operations are subject to extensive regulation by federal, state and local governmental authorities and are subject to various laws and judicial and administrative decisions imposing requirements and restrictions on part or all of its operations. The Company believes that it is in substantial compliance in all material respects with laws, rules and regulations applicable to the conduct of its business. Because the Company’s business is highly regulated, the laws, rules and regulations applicable to it are subject to regular modification and change. There can be no assurance that these laws, rules and regulations, or any other laws, rules or regulations, will not be adopted in the future, which could make compliance much more difficult or expensive, restrict the Company’s ability to originate, broker or sell loans, further limit or restrict the amount of commissions, interest or other charges earned on loans originated or sold by the Company, or otherwise adversely affect the Company’s results of operations, financial condition, or future prospects.
| 16 |
Governmental Fiscal and Monetary Policies. The business of banking is affected significantly by the fiscal and monetary policies of the federal government and its agencies. Such policies are beyond the control of the Company. The Company is particularly affected by the policies established by the Board of Governors of the Federal Reserve System in relation to the supply of money and credit in the United States, and the target federal funds rate.
The instruments of monetary policy available to the Board of Governors can be used in varying degrees and combinations to directly affect the availability of bank loans and deposits, as well as the interest rates charged on loans and paid on deposits, and this can and does have a material effect on the Company’s business, results of operations and financial condition. Federal monetary policy may also affect the longer-term inflation rate which directly affects the national and local economy.
The Effects of Legislation in Response to Credit Conditions. Legislation passed at the federal level and/or by the State of California in response to conditions affecting credit markets could cause the Company to experience higher credit losses if such legislation reduces the amount that borrowers are otherwise contractually required to pay under existing loan contracts with the Bank. Such legislation could also result in the imposition of limitations upon the Bank’s ability to foreclose on property or other collateral or make foreclosure less economically feasible. Such events could result in increased loan losses and require a material increase in the allowance for loan losses and thereby adversely affect the Company’s results of operations, financial condition, future prospects, profitability and stock price.
Geographic Concentration. All of the banking offices of the Company are located in the Northern California Counties of San Mateo, Santa Clara and San Francisco. The Company and the Bank conduct business primarily in the San Francisco Bay Area. As a result, our financial condition, results of operations and cash flows are subject to changes in the economic conditions in this area, in addition to statewide economic conditions. Our success depends upon the business activity, population, income levels, deposits and real estate activity in these markets, and adverse economic conditions could reduce our growth rate, or affect the ability of our customers to repay their loans, and generally impact our financial condition and results of operations.
Competition. Increased competition in the market areas served by the Bank may result in reduced loans and deposits. Ultimately, the Bank may not be able to compete successfully against current and future bank and non-bank competitors.
Many competitors offer the banking services that are offered by the Bank in its service area. These competitors include national and super-regional banks, finance companies, investment banking and brokerage firms, credit unions, government-assisted farm credit programs, other community banks and technology-oriented financial institutions offering online services. In particular, the Bank’s competitors include several major financial companies whose greater resources may afford them a marketplace advantage by enabling them to maintain numerous banking locations and mount extensive promotional and advertising campaigns. Additionally, banks and other financial institutions with larger capitalization and financial intermediaries not subject to bank regulatory restrictions have larger lending limits and are thereby able to serve the credit needs of larger customers. Areas of competition include interest rates for loans and deposits, efforts to obtain deposits, and range and quality of products and services provided, including new technology-driven products and services. Technological innovation continues to contribute to greater competition in domestic and international financial services markets as technological advances, such as Internet-based banking services that cross traditional geographic bounds, enable more companies to provide financial services.
The Effects of Changes to FDIC Insurance Coverage Limits and Assessments. FDIC insurance assessments are uncertain and increased premiums may adversely affect the Company’s earnings. The FDIC charges insured financial institutions premiums to maintain the Deposit Insurance Fund. A deterioration in economic conditions would increase expectations for bank failures. In such event, the FDIC would be expected to take control of failed banks and guarantee payment of deposits up to applicable insured limits from the Deposit Insurance Fund. Insurance premium assessments to insured financial institutions may then increase as necessary to maintain adequate funding of the Deposit Insurance Fund. Thus, a deterioration in economic conditions may cause losses which require premium increases to replenish the Deposit Insurance Fund and such increases could adversely impact the Bank’s earnings.
Interest Rate Risk. Our earnings and cash flows are largely dependent upon our net interest income. Net interest income is the difference between interest income earned on interest-earning assets, such as loans and securities, and interest expense paid on interest-bearing liabilities, such as deposits and borrowed funds.
| 17 |
Interest rates are sensitive to many factors outside our control, including general economic conditions and policies of various governmental and regulatory agencies and, in particular, the Board of Governors of the Federal Reserve System, which regulates the supply of money and credit in the United States. Changes in monetary policy, including changes in interest rates, could influence not only the interest we receive on loans and securities and interest we pay on deposits and borrowings, but could also affect (i) our ability to originate loans and obtain deposits, (ii) the fair value of our financial assets and liabilities, and (iii) the average duration of our mortgage-backed securities portfolio. Our portfolio of securities is subject to interest rate risk and will generally decline in value if market interest rates increase, and generally increase in value if market interest rates decline.
Technology and Technological Change. The financial services industry is continually undergoing rapid technological change with frequent introductions of new technology-driven products and services. The effective use of technology will enable efficiency and meeting customers’ changing needs. Our future success depends, in part, upon our ability to address the needs of our customers by using technology to provide products and services that will satisfy customer demands, as well as to create additional efficiencies in our operations. Many of our competitors have substantially greater resources to invest in technological improvements. We may not be able to effectively implement new technology-driven products and services or be successful in marketing these products and services to retain and compete for customers. Failure to successfully keep pace with technological change affecting the financial services industry could have a material adverse impact of the long-term aspect of our business and, in turn, our financial condition and results of operations.
Dependence on Key Officers and Employees. We are dependent on the successful recruitment and retention of highly qualified personnel. Our ability to implement our business strategies is closely tied to the strengths of our executive officers who have extensive experience in the banking industry but who are not easily replaced. In addition, business banking, one of the Company’s principal lines of business, is dependent on relationship banking, in which the Bank personnel develop professional relationships with small business owners and officers of larger business customers who are responsible for the financial management of the companies they represent. If these employees were to leave the Bank and become employed by a local competing bank, we could potentially lose business customers. In addition, we rely on our customer service staff to effectively serve the needs of our consumer customers. We actively recruit for all open positions and management believes that its relations with employees are good.
Growth Strategy. The Company continues to pursue a growth strategy which depends primarily on generating an increasing level of loans and deposits at acceptable risk levels. We may not be able to sustain our growth strategy without establishing new branches or developing new products. We may attempt to expand by opening new branch offices or acquiring other financial institutions or branch offices or through a purchase, in whole or in part, of other financial institutions. This expansion may require significant investments in equipment, technology, personnel and site locations. We cannot assure you of our success in implementing our growth strategy either through expansion of our existing branch system or through mergers and acquisitions, and there may be significant increases in our noninterest expenses, without any corresponding balance sheet growth. Mergers and acquisitions may not add to the growth of the Bank’s loans, deposits or the Bank’s profitability due to integration problems, collateral differences, changes in business conditions, or other unforeseen circumstances.
Commercial Loans. As of December 31, 2017, approximately 7% of our loan portfolio consisted of commercial business loans, which could have a higher degree of risk than other types of loans. Commercial lending is dependent on borrowers making payments on their loans and lines of credit in accordance with the terms of their notes. Worsening economic conditions could make it difficult for many commercial borrowers to make their required loan payments. This credit risk is increased when there is a concentration of principal in a limited number of loans and borrowers, the mobility of collateral, and the increased difficulty of evaluating and monitoring these types of loans. The availability of funds for the repayment of commercial business loans may be substantially dependent on the success of the business itself and the general economic environment. If the cash flow from business operations is reduced, the borrower’s ability to repay the loan may be impaired.
In addition, unlike residential mortgage loans, which generally are made on the basis of the borrower’s ability to make repayment from his or her employment and other income and which are secured by real property whose value tends to be more easily ascertainable, commercial business loans typically are made on the basis of the borrower’s ability to make repayment from the cash flow of the borrower’s business. If the Bank is required to repossess equipment or pursue collection efforts under personal guarantees, there could be a substantial decrease in value of collateral, if any, increased legal costs, and an increased risk of loss on the amount outstanding.
| 18 |
Real Estate Values. A large portion of the loan portfolio of the Company is dependent on the performance of our real estate loan portfolio. At December 31, 2017, real estate secured loans (including construction loans) served as the principal source of collateral and represented approximately 92% of the Company’s loan portfolio. Within the real estate secured loan portfolio, commercial real estate loans represent 59%, 1 to 4 single family residential loans represent 22%, multi-family residential loans represent 14% and construction loans represent 5% of the total.
A substantial decline in the economy in general, coupled with a continued decline in real estate values in the Company’s primary operating market areas could have an adverse effect on the demand for new loans, the ability of borrowers to repay outstanding loans, and the value of real estate and other collateral securing loans. Real estate values have declined, due in part to reduced construction lending, tighter underwriting requirements, and reduced borrower ability to make payments. Real estate loans may pose collection problems, resulting in increased collection expenses, and delays in the ultimate collection of these loans. In addition, acts of nature, including fires, earthquakes and floods, which may cause uninsured damage and other loss of value to real estate that secures these loans, may also negatively impact the Company’s financial condition.
Allowance for Loan and Lease Losses. The Company maintains an allowance for loan losses to provide for inherent loan defaults and non-performance, but its allowance for loan losses may not be adequate to cover actual loan and lease losses. In addition, future provisions for loan and lease losses could materially and adversely affect the Company and therefore the Company’s operating results. The Company’s allowance for loan and lease losses is based on prior experience, as well as an evaluation of the risks in the current portfolio. The amount of future losses is susceptible to changes in economic, operating and other conditions, including changes in interest rates that may be beyond the Company’s control, and these losses current estimates. Federal regulatory agencies, as an integral part of their examination process, review the Company’s loans and the allowance for loan and lease losses. Although we believe that the Company’s allowance for loan and lease losses is adequate to cover inherent future losses, we cannot assure you that we will not further increase the allowance for loan and lease losses or that the regulators will not require us to increase this allowance. Either of these occurrences could materially and adversely affect the Company’s earnings.
Other Real Estate Owned (“OREO”). Real estate acquired through, or in lieu of, loan foreclosures is expected to be sold and is recorded at its fair value less estimated costs to sell. The amount, if any, by which the recorded amount of the loan exceeds the fair value (less estimated costs to sell) are charged to the allowance for loan or lease losses, if necessary. The Company’s earnings could be materially and adversely affected by various expenses associated with property ownership, including legal expenses, personnel costs, insurance and taxes, completion and repair costs, valuation adjustments, and environmental related liabilities discussed below. Also, any further decrease in market prices of real estate in our market areas may lead to additional OREO write downs, with a corresponding expense in our income statement. At December 31, 2017 and 2016, our OREO net book value totaled $3,300,000 and $1,427,000, respectively. For additional information, see “Nonperforming Assets” in Item 7, Management’s Discussion and Analysis of Financial Condition and Results of Operations, and footnotes 7 and 23 to the Company’s 2017 Consolidated Financial Statements in Item 8, herein. One property that was acquired through foreclosure and subsequently sold is subject to contractual performance obligations related to toxic soil and water quality remediation. See “Environmental Related Liabilities” and “Contracts with Performance Obligations” below.
Environmental Related Liabilities. In the ordinary course of our business, we may foreclose and take title to real estate and could become subject to environmental related liabilities with respect to these properties. We may be held liable to a government entity or third parties for property damage, personal injury, investigation and clean-up costs incurred by these parties in connection with environmental contamination or may be required to investigate or clean-up hazardous or toxic substances, or chemical releases at a property. The costs associated with investigations or remediation activities could be substantial. In addition, as the owner or former owner of a contaminated site, we could become subject to common law claims by third parties based on damages and costs resulting from environmental contamination emanating from the property. If we become subject to significant environmental liabilities, our business prospects, financial condition, liquidity, results of operations and stock price could be materially and adversely affected. See “Contracts with Performance Obligation” below.
| 19 |
Contracts with Performance Obligations. The Company utilizes purchase and sale contracts when entering into the purchase or sale of certain assets. Such a contract may contain performance obligations that are imbedded in the terms and conditions of the contract. These performance obligations may require the Company to perform a service or services where the ultimate cost and the length of time required to perform the service or services cannot be predicted with certainty. When these circumstances exist, the Company is required to review all the facts and circumstances related to its performance obligations and use sound business judgement in the quantification of the cost of these performance obligations. On July 12, 2011, we foreclosed on a commercial real estate property that was known to have soil and ground water contamination. Since acquiring title to the property, the property has been held as OREO and the Company has conducted remediation efforts, with the guidance of an environmental consultant and others, in the pursuit of a final remediation plan acceptable to the San Francisco Bay Regional Water Quality Control Board (the “Water Board”). The Company entered into a contract to sell the property to an unrelated third party on February 22, 2018. The sale transaction was completed using a purchase and sale contract that included Company performance obligations. Under the terms of the contract, the buyer of the property obtained title to the property, including the legal right to lease revenue being generated by the property, and the Company agreed to perform certain remediation activities and to continue work with the Water Board toward the objective of obtaining a mutually acceptable final remediation plan for the property. The Company remains responsible for additional remediation costs, assuming further remediation becomes necessary, and could be liable to governmental entities or third parties for future investigation and clean-up costs or other expenses, which could be substantial. The Company has established a contingent liability reserve for this purpose based on future expected cost estimates provided to the Company by its soil engineering and consulting company consultant. If the actual liabilities, costs and expenses related to these obligations are determined to be substantially in excess of the reserve established by the Company, these excess costs could potentially have an adverse material effect on the business prospects, financial condition, liquidity, results of operations and stock price of the Company. See additional information under “Nonperforming Assets” in Item 7 of this report and in footnotes 7 and 23 of the Company’s Consolidated Financial Statements in Item 8 of this report.
Limited Trading in our Common Stock and Dilution. The common stock of the Company is listed on the Nasdaq Global Select Market under the trading symbol “FNBG”; however, our trading volume is less than that of larger financial institutions.
We are not restricted from issuing additional shares of common stock, or securities that are convertible into or exchangeable for or that represent the right to receive common stock, including stock options. The issuance of substantial amounts of the Company’s newly issued common stock in the public market could be substantially dilutive to shareholders of our common stock and could adversely affect the market price of the Company’s common stock. The Articles of Incorporation of the Company authorize the issuance of 10,000,000 shares of common stock, of which 7,442,279 were issued and outstanding at December 31, 2017. Pursuant to its 1997, 2002 and 2008 Stock Option Plans, at December 31, 2017, there were outstanding options to purchase a total of 455,291 shares of common stock. As of December 31, 2017, no additional stock option grants can be issued as per the terms of the Merger Agreement signed with TriCo on December 11, 2017.
Controls and Procedures. Management regularly reviews and updates the Company’s internal control over financial reporting, disclosure controls and procedures, and corporate governance policies and procedures. We maintain controls and procedures to mitigate risks such as processing system failures or errors and customer or employee fraud, and we maintain insurance coverage for certain of these risks. Any system of controls and procedures, however well designed and operated, is based in part on certain assumptions and provides only reasonable, not absolute, certainty that the objectives of the system will be met. Events could occur which are not prevented or detected by our internal controls, are not insured against, or are in excess of our insurance limits. Any failure or circumvention of our controls and procedures, or failure to comply with regulations related to controls and procedures, could have an adverse effect on our business.
Cybersecurity Losses. The Company is subject to certain operations risks, including, but not limited to, data processing system or cybersecurity failures and customer or employee fraud. The Company maintains a system of internal controls to mitigate against such occurrences and maintains insurance coverage for such risks, but should such an event occur that is not prevented or detected by the Company’s internal controls, uninsured or in excess of applicable insurance limits, it could have a significant adverse impact on the Company’s business, financial condition or results of operations. Additionally, the Company is dependent on network and computer systems. If these systems and their back-up systems were to fail or were breached, the Company could be adversely affected. The company cannot be certain that the continued implementation of safeguards will eliminate the risk of vulnerability to technological difficulties or failures or ensure the absence of a breach of information or security, including as a result of a cybersecurity breach. The bank regulatory agencies have recently emphasized cybersecurity as a critical challenge facing the financial services industry in light of the frequency and sophistication of cyber attacks. The Company and the Bank will continue to enhance their information security programs consistent with regulatory requirements, including reliance on the services of various vendors who provide data processing and communications services to the financial services industry. Nonetheless, if information security is compromised or other technology difficulties or failures occur at the Bank or with one of its vendors, information may be lost or misappropriated, services and operations may be interrupted and the Bank could be exposed to claims from its customers.
| 20 |
Business Confidence Uncertainty. Terrorist activities in the future and the actions taken by the United States and its allies in combating terrorism on a worldwide basis could adversely impact the Company and the extent of such impact is uncertain. Even more so, the problems in the mortgage and credit markets, the government conservatorship of Fannie Mae and Freddie Mac, as well as large write-offs at some major financial institutions have had a negative impact on the entire financial services industry. Such events have had an adverse effect on the economy in the Company’s market areas.
Federal Home Loan Bank Risk. The failure of the Federal Home Loan Bank (“FHLB”) of San Francisco or the national Federal Home Loan Bank System may have a material negative impact on our earnings and liquidity.
Even though the FHLB of San Francisco has announced it does not anticipate that additional capital will be necessary, nor does it believe that its capital level is inadequate to support realized losses in the future, the FHLB of San Francisco could require its members, including the Bank, to contribute additional capital in order to return the FHLB of San Francisco to compliance with capital guidelines.
At December 31, 2017, the Bank held $6.0 million of common stock in the FHLB of San Francisco. Should the FHLB of San Francisco fail, we anticipate that our investment in the FHLB’s common stock would be “other than temporarily” impaired and may have limited value.
At December 31, 2017, the Bank maintained a line of credit with the FHLB of San Francisco with a maximum borrowing capacity of $509,371,400 of which $433,861,400 was available. Advances under the line of credit are secured by a blanket collateral agreement, a pledge of our FHLB common stock and certain other qualifying collateral, such as commercial and mortgage loans. The Bank is highly dependent on the FHLB of San Francisco as the primary source of wholesale funding for immediate liquidity and borrowing needs. The failure of the FHLB of San Francisco or the FHLB system in general, may materially impair our ability to meet our growth plans or to meet short and long term liquidity demands.
Tax Changes. The Tax Cuts and Jobs Act enacted on December 22, 2017 has had, and is expected to continue to have, far-reaching and significant effects on the Company, our customers and the U.S. economy. The Act lowered the corporate federal statutory tax rate and eliminated or limited certain federal corporate deductions. It is too early to evaluate all of the potential consequences of the Act but such consequences could include lower commercial customer borrowings, either due to the increase in cash flows as a result of the reduction in the corporate statutory tax rate or the utilization by businesses in certain sectors of alternative non-debt financing and/or early retirement of existing debt. Further, there can be no assurance that any benefits realized by us as a result of the reduction in the corporate federal statutory tax rate will ultimately result in increased net income, whether due to decreased loan yields as a result of competition or to other factors. Uncertainty also exists related to the response of state and other taxing jurisdictions to the Act. Federal income tax treatment of corporations may be further clarified and modified by other legislative, administrative or judicial changes or interpretations at any time. Any such changes could adversely impact our business and operations.
ITEM 1B. UNRESOLVED STAFF COMMENTS
None.
Since its incorporation on February 28, 2001, the Company has conducted its operations at the administrative offices of the Bank, located at 975 El Camino Real, South San Francisco, CA 94080.
The Bank owns the land and building at 975 El Camino Real, South San Francisco, CA 94080. The premises consist of a three-story building of approximately 15,000 square feet and off-street parking for employees and customers of approximately 45 vehicles.
| 21 |
The Buri Buri Branch Office of the Bank is located on the ground floor of the building at 975 El Camino Real, South San Francisco, CA 94080, and administrative offices, including the offices of senior management and credit administration, occupy the second and third floors.
The Bank owns the land and two-story building occupied by the Daly City Branch Office (6600 Mission Street, Daly City, CA 94014); the land and two-story building occupied by the Colma Branch Office (1300 El Camino Real, Colma, CA 94014); the land and two-story building occupied by the Redwood City Branch Office (700 El Camino Real, Redwood City, CA 94063); the land and two-story building occupied by the Millbrae Branch Office (1551 El Camino Real, Millbrae, CA 94030); the land and single-story building occupied by the Half Moon Bay Branch Office (756 Main Street, Half Moon Bay, CA 94019); the land and two-story building occupied by the Pescadero Branch Office (239 Stage Road, Pescadero, CA 94060); and the land and one story building occupied by the Sunnyvale Branch Office (425 South Mathilda Avenue, Sunnyvale, CA 94086). All properties include adequate vehicle parking for customers and employees.
The Bank leases premises at 1450 Linda Mar Shopping Center, Pacifica, California 94044, for its Linda Mar Branch Office. This ground floor space is approximately 4,100 square feet. The lease will expire on August 31, 2019.
The Bank leases premises at 6599 Portola Drive, San Francisco, CA 94127, for its Portola Office. The current lease expired June 30, 2012, and the premises are currently leased on a month-to-month basis. The location consists of approximately 1,325 square feet of street level space.
The Bank subleases premises at 2197 Chestnut Street, San Francisco, CA 94123, for its Chestnut Street Branch, which opened for business on April 4, 2011, and consists of 2,150 square feet at street level and approximately 2,000 square feet on the second floor. The sublease ends on July 15, 2024.
The Bank leases premises at 150 East Third Avenue, San Mateo, CA 94401, for its San Mateo Branch Office. The Bank exercised the remaining option to extend the lease term to August 12, 2018. The location consists of approximately 4,000 square feet of ground floor usable commercial space.
The Bank leases premises at 130 Battery Street, San Francisco, CA, 94000, for its Battery Street Branch Office. The lease has been renewed with the maturity extended to February 28, 2023. The location consists of approximately 13,000 square feet, consisting of ground floor, mezzanine and lower level.
The Bank leased a warehouse facility at 450 Cabot Road, South San Francisco, CA 94080. The lease expired February 28, 2011. The facility is currently leased on a month-to-month basis and consists of approximately 7,600 square feet of office/warehouse space.
The foregoing summary descriptions of leased premises are qualified in their entirety by reference to the full text of the lease agreements listed as exhibits to this report.
As of December 31, 2017, the Bank’s net investment in premises and equipment totaled $9,322,000. See Note 9 to the Company’s Consolidated Financial Statements in Item 8 below.
There are no material legal proceedings adverse to the Company or the Bank to which any director, officer, affiliate of the Company, or 5% shareholder of the Company, or any associate of any such director, officer, affiliate or 5% shareholder of the Company are a party, and none of the foregoing persons has a material interest adverse to the Company or the Bank.
From time to time, the Company and/or the Bank are a party to claims and legal proceedings arising in the ordinary course of business. The Company’s management is not aware of any material pending legal proceedings to which either it or the Bank may be a party or has recently been a party, which will have a material adverse effect on the financial condition or results of operations of the Company and the Bank, taken as a whole.
ITEM 4. MINE SAFETY DISCLOSURES
Not applicable.
| 22 |
PART II
ITEM 5. MARKET FOR REGISTRANT’S COMMON EQUITY, RELATED STOCKHOLDER MATTERS AND ISSUER PURCHASES OF EQUITY SECURITIES
The common stock of the Company is listed on the Nasdaq Global Select Market, with trades quoted under the trading symbol, “FNBG.” There is limited trading in the shares of the common stock of the Company. As of December 31, 2017, the Company had approximately 900 shareholders of common stock of record.
The following table summarizes the range of high and low bid information reported on the Nasdaq Global Select Market (since April 13, 2017) and on the OTCQB marketplace during the periods indicated of which management has knowledge, including the per share cash dividends declared for the periods indicated. These over-the-counter quotations reflect inter-dealer prices, without retail mark-up, mark-down or commission and may not necessarily represent actual transactions. All information has been adjusted to reflect all stock dividends and the 3 for 2 stock split that occurred in May 2017.
| Closing Price of FNB Bancorp | Cash | |||||||||||
| Common Stock | Dividends | |||||||||||
| 2016 | High | Low | Declared (1) | |||||||||
| First Quarter | $ | 19.52 | $ | 18.42 | $ | 0.10 | ||||||
| Second Quarter | 18.50 | 17.97 | 0.10 | |||||||||
| Third Quarter | 19.37 | 17.78 | 0.10 | |||||||||
| Fourth Quarter | 22.67 | 19.08 | 0.11 | |||||||||
| 2017 | ||||||||||||
| First Quarter | $ | 24.50 | $ | 21.73 | $ | 0.11 | ||||||
| Second Quarter | 30.00 | 27.37 | 0.12 | |||||||||
| Third Quarter | 34.14 | 27.10 | 0.13 | |||||||||
| Fourth Quarter | 38.62 | 32.54 | 0.13 | |||||||||
(1) See “Dividends” (following “FDIC Insurance”) in Item 1 (above), for a description of the limitations applicable to the payment of dividends by the Company.
| 23 |
STOCK PERFORMANCE GRAPH
Set forth below is a line graph comparing the annual percentage change in the cumulative total return on the Company’s Common Stock with the cumulative total return of the KBW Bank Index and the Russell 2000 Index as of the end of each of the last five fiscal years.
The graph assumes that $100.00 was invested on December 31, 2012 in the Company’s Common Stock and each index, and that all dividends were reinvested. Returns have been adjusted for any stock dividends and stock splits declared by the Company. Shareholder returns over the indicated period should not be considered indicative of future shareholder returns.
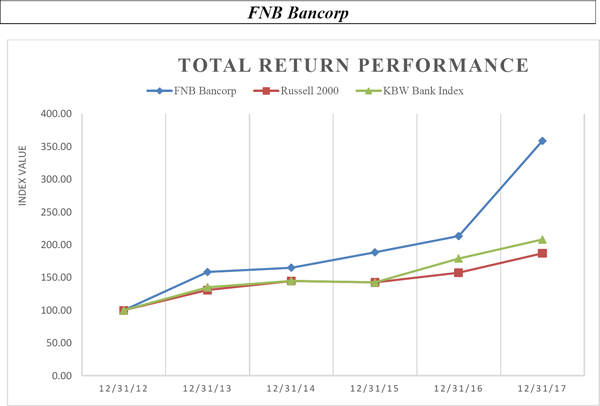
| Period Ending | ||||||||||||||||||||||||
| Index | 12/31/12 | 12/31/13 | 12/31/14 | 12/31/15 | 12/31/16 | 12/31/17 | ||||||||||||||||||
| FNB Bancorp | 100.00 | 158.49 | 164.93 | 188.46 | 213.29 | 358.66 | ||||||||||||||||||
| Russell 2000 | 100.00 | 130.95 | 144.63 | 142.50 | 157.34 | 187.01 | ||||||||||||||||||
| KBW Bank Index | 100.00 | 135.06 | 144.81 | 142.51 | 179.00 | 208.09 | ||||||||||||||||||
| 24 |
ITEM 6 - SELECTED FINANCIAL DATA
The following table presents a summary of selected financial information that should be read in conjunction with the Company’s consolidated financial statements and notes thereto included under Item 8 - “FINANCIAL STATEMENTS AND SUPPLEMENTARY DATA.”
| Dollar amounts in thousands, except | At and for the years ended December 31, | |||||||||||||||||||
| per share amounts and ratios | 2017 | 2016 | 2015 | 2014 | 2013 | |||||||||||||||
| STATEMENT OF EARNINGS DATA | ||||||||||||||||||||
| Total interest income | $ | 50,218 | $ | 45,513 | $ | 39,282 | $ | 36,859 | $ | 37,389 | ||||||||||
| Total interest expense | 3,871 | 3,069 | 2,597 | 2,093 | 2,395 | |||||||||||||||
| Net interest income | 46,347 | 42,444 | 36,685 | 34,766 | 34,994 | |||||||||||||||
| (Recovery) provision for loan losses | (360 | ) | 150 | (305 | ) | (1,020 | ) | 1,385 | ||||||||||||
| Net interest income after (recovery) provision for loan losses | 46,707 | 42,294 | 36,990 | 35,786 | 33,609 | |||||||||||||||
| Total noninterest income | 3,860 | 4,595 | 4,496 | 6,589 | 4,183 | |||||||||||||||
| Total noninterest expenses | 30,549 | 30,692 | 29,925 | 27,868 | 29,028 | |||||||||||||||
| Earnings before provision for income taxes | 20,018 | 16,197 | 11,561 | 14,507 | 8,764 | |||||||||||||||
| Provision for income taxes | 9,307 | 5,696 | 3,364 | 5,098 | 1,325 | |||||||||||||||
| Net earnings | 10,711 | 10,501 | 8,197 | 9,409 | 7,439 | |||||||||||||||
| Dividends and discount accretion on preferred stock | — | — | — | 170 | 567 | |||||||||||||||
| Net earnings available to common stockholders | 10,711 | 10,501 | $ | 8,197 | $ | 9,239 | $ | 6,872 | ||||||||||||
| PER SHARE DATA - see note (1) | ||||||||||||||||||||
| Net earnings per share: | ||||||||||||||||||||
| Basic | $ | 1.46 | $ | 1.45 | $ | 1.15 | $ | 1.32 | $ | 1.01 | ||||||||||
| Diluted | $ | 1.41 | $ | 1.42 | $ | 1.12 | $ | 1.28 | $ | 0.98 | ||||||||||
| Cash dividends per share | $ | 0.61 | $ | 0.61 | $ | 0.33 | $ | 0.27 | $ | 0.07 | ||||||||||
| Weighted average shares outstanding: | ||||||||||||||||||||
| Basic | 7,361,000 | 7,233,000 | 7,113,000 | 6,999,000 | 6,834,000 | |||||||||||||||
| Diluted | 7,607,000 | 7,417,000 | 7,314,000 | 7,221,000 | 6,987,000 | |||||||||||||||
| Shares outstanding at period end | 7,442,000 | 7,280,000 | 7,159,500 | 7,044,000 | 6,907,500 | |||||||||||||||
| Book value per common share | $ | 16.03 | $ | 15.15 | $ | 14.55 | $ | 13.78 | $ | 13.64 | ||||||||||
| Investment securities | 355,857 | 360,105 | 329,207 | 264,881 | 263,988 | |||||||||||||||
| Net loans | 829,766 | 782,485 | 722,747 | 583,715 | 552,343 | |||||||||||||||
| Allowance for loan losses | 10,171 | 10,167 | 9,970 | 9,700 | 9,879 | |||||||||||||||
| Total assets | 1,265,238 | 1,219,394 | 1,124,349 | 917,164 | 891,930 | |||||||||||||||
| Total deposits | 1,050,295 | 1,019,506 | 983,189 | 792,194 | 773,615 | |||||||||||||||
| Stockholders’ equity | 119,280 | 110,314 | 104,162 | 97,088 | 94,249 | |||||||||||||||
| SELECTED PERFORMANCE DATA | ||||||||||||||||||||
| Return on average assets (2) | 0.85 | % | 1.02 | % | 0.81 | % | 1.02 | % | 0.76 | % | ||||||||||
| Return on average equity (2) | 8.86 | % | 10.88 | % | 8.15 | % | 10.16 | % | 7.38 | % | ||||||||||
| Net interest margin | 3.97 | % | 3.92 | % | 4.06 | % | 4.21 | % | 4.31 | % | ||||||||||
| Average loans as a percentage of average deposits | 79.69 | % | 73.41 | % | 70.74 | % | 72.83 | % | 70.09 | % | ||||||||||
| Average total stockholders’ equity as a percentage of average total assets | 9.61 | % | 9.44 | % | 9.96 | % | 10.09 | % | 10.31 | % | ||||||||||
| Common dividend payout ratio | 33.46 | % | 27.52 | % | 29.85 | % | 19.27 | % | 21.13 | % | ||||||||||
| SELECTED ASSET QUALITY RATIOS | ||||||||||||||||||||
| Net loan (recoveries) charge-offs/ total loans | -0.04 | % | 0.01 | % | 0.08 | % | -0.14 | % | 0.11 | % | ||||||||||
| Allowance for loan losses/Total Loans | 1.21 | % | 1.28 | % | 1.36 | % | 1.63 | % | 1.76 | % | ||||||||||
| CAPITAL RATIOS (3) | ||||||||||||||||||||
| Total Regulatory Capital Ratio | 12.61 | % | 12.42 | % | 12.76 | % | 14.60 | % | 14.30 | % | ||||||||||
| Tier 1 Capital Ratio | 11.57 | % | 11.32 | % | 11.54 | % | 13.34 | % | 13.05 | % | ||||||||||
| Leverage Ratio | 9.09 | % | 9.02 | % | 8.64 | % | 10.30 | % | 9.81 | % | ||||||||||
| Common Equity Tier 1 Capital Ratio | 11.57 | % | 11.32 | % | 11.54 | % | N/A | N/A | ||||||||||||
(1) Per share data has been adjusted for stock dividends and stock splits.
(2) Calculated using net earnings available to common shareholders.
(3) Ratios are for the Company, which are substantially same as the Bank regulatory capital ratios.
(4) Quarterly cash dividends/share and annual dividends/share may not be the same due to rounding considerations.
| 25 |
ITEM 7. MANAGEMENT’S DISCUSSION AND ANALYSIS OF FINANCIAL CONDITION AND RESULTS OF OPERATIONS OF FNB BANCORP AND SUBSIDIARY
Critical Accounting Policies and Estimates
Management’s discussion and analysis of its financial condition and results of operations are based upon the Company’s financial statements, which have been prepared in accordance with accounting principles generally accepted in the United States of America. The preparation of these financial statements requires the Company to make estimates and judgments that affect the reported amounts of assets, liabilities, revenues and expenses, and related disclosure of contingent assets and liabilities. On an on-going basis, the Company evaluates its estimates, including those related to its loans and allowance for loan losses. The Company bases its estimates on current market conditions, historical experience and on various other assumptions that are believed to be reasonable under the circumstances, the results of which form the basis for making judgments about the carrying values of assets and liabilities that are not readily apparent from other sources. Actual results may differ from these estimates under different assumptions or conditions. All adjustments that, in the opinion of management, are necessary for a fair presentation for the periods presented have been reflected as required by Regulation S-X, Rule 10-01. The Company believes the following critical accounting policies requires significant judgments and estimates used in the preparation of the consolidated financial statements.
Allowance for Loan Losses
The allowance for loan losses is periodically evaluated for adequacy by management. Factors considered include the Company’s loan loss experience, known and inherent risks in the portfolio, current economic conditions, known adverse situations that may affect the borrower’s ability to repay, regulatory policies, and the estimated value of underlying collateral. The evaluation of the adequacy of the allowance is based on the above factors along with prevailing and anticipated economic conditions that may impact our borrowers’ ability to repay their loans. Determination of the allowance is based upon objective and subjective judgments by management from the information currently available. Adverse changes in information could result in higher charge-offs and loan loss provisions.
Goodwill
Goodwill arises when the Company’s purchase price exceeds the fair value of net assets of an acquired business. Goodwill represents the value attributable to intangible elements acquired. The value of goodwill is supported ultimately by profit from the acquired business. A decline in earnings could lead to impairment, which would be recorded as a write-down in the Company’s consolidated statements of earnings. Events that may indicate goodwill impairment include significant or adverse changes in results of operations of the acquired business or asset, economic or political climate; an adverse action or assessment by a regulator; unanticipated competition; and a more-likely-than-not expectation that a reporting unit will be sold or disposed of at a loss.
Other Than Temporary Impairment
Other than temporary impairment (“OTTI”) is triggered if the Company has the intent to sell the security, it is likely that it will be required to sell the security before recovery, or if the Company does not expect to recover the entire amortized cost basis of the security.
If the Company intends to sell the security or it is likely it will be required to sell the security before recovering its cost basis, the entire impairment loss would be recognized in earnings as an OTTI. If the Company does not intend to sell the security and it is not likely that the Company will be required to sell the security but the Company does not expect to recover the entire amortized cost basis of the security, only the portion of the impairment loss representing credit losses would be recognized in earnings as an OTTI. The credit loss is measured as the difference between the amortized cost basis and the present value of the cash flows expected to be collected of a security. Projected cash flows are discounted by the original or current effective interest rate depending on the nature of the security being measured for potential OTTI. The remaining impairment loss related to all other factors, the difference between the present value of the cash flows expected to be collected and fair value, would be recognized as a charge to other comprehensive income (“OCI”). Impairment losses related to all other factors are to be presented as a separate category within OCI. For investment securities held to maturity, this amount is accreted over the remaining life of the debt security prospectively based on the amount and timing of future estimated cash flows. The accretion of the OTTI amount recorded in OCI will increase the carrying value of the investment, and would not affect earnings. If there is an indication of additional credit losses the security is re-evaluated accordingly based on the procedures described above.
| 26 |
Provision for and Deferred Income Taxes
The Company is subject to income tax laws of the United States, its states, and municipalities in which it operates. The Company considers its income tax provision methodology to be critical, as the determination of current and deferred taxes based on complex analyses of many factors including interpretation of federal and state laws, the difference between tax and financial reporting bases of assets and liabilities (temporary differences), estimates of amounts due or owed, the timing of reversals of temporary differences and current financial standards. Actual results could differ significantly from the estimates due to tax law interpretations used in determining the current and deferred income tax liabilities. Additionally, there can be no assurances that estimates and interpretations used in determining income tax liabilities may not be challenged by federal and state taxing authorities.
Fair Values of Financial Instruments
Certain assets and liabilities are either carried at fair value on a recurring or non-recurring basis or are required to be disclosed at fair value. Accounting principles have established a fair value measurement model which establishes a framework that quantifies fair value estimates by the level of pricing precision. The degree of judgment utilized in measuring the fair value of assets generally correlates to the level of pricing precision. Financial instruments rarely traded or not quoted will generally have a higher degree of judgment utilized in measuring fair value. Pricing precision is impacted by a number of factors including the type of asset or liability, the availability of the asset or liability, the market demand for the asset or liability, and other conditions that were considered at the time of the valuation.
Recent Accounting Pronouncements
Information pertaining to Recent Accounting Pronouncements is included in Note 1 of the Notes to the Company’s Consolidated Financial Statements in Item 8 below.
Recent Development – Proposed Merger with TriCo Bancshares
As announced by the Company on December 11, 2017 and reported in the Company’s Current Report on Form 8-K, filed with the Securities and Exchange Commission on December 12, 2017 (the “Current Report”), the Company has entered into an Agreement and Plan of Merger and Reorganization dated December 11, 2017 (the “Merger Agreement”), pursuant to which the Company would merge with and into TriCo Bancshares, a California corporation (“TriCo”), with TriCo being the surviving corporation. Immediately thereafter, the Company’s subsidiary bank, First National Bank of Northern California, would be merged with and into TriCo’s subsidiary bank, Tri Counties Bank. Under the terms of the Merger Agreement, the Company shareholders would receive a fixed exchange ratio of 0.9800 shares of TriCo common stock for each share of Company common stock, providing the Company shareholders with aggregate ownership on a pro forma basis of approximately 24% of the common stock of the combined company. Holders of the Company’s outstanding in-the-money stock options would receive cash, net of applicable taxes withheld, for the value of their unexercised stock options. The merger is expected to qualify as a tax-free exchange for shareholders who receive shares of TriCo common stock. The transactions contemplated by the Merger Agreement are expected to close in the second or third quarter of 2018, pending approvals of the Company shareholders and the TriCo shareholders, the receipt of all necessary regulatory approvals, and the satisfaction of other closing conditions which are customary for such transactions. For additional information, reference should be made to the text of the Agreement and Plan of Merger and Reorganization, filed as an exhibit to the Current Report, and to other information regarding TriCo and the Company, their respective businesses and the status of their proposed merger, as reported from time to time in other filings with the Securities and Exchange Commission.
Earnings Analysis
The principal source of the Company’s income is interest income on loans. The level of interest income can be affected by changes in interest rate, volume of loans outstanding, and the quality of our loan portfolio. Loans that are 90 days or more past due are placed on non-accrual status. Income on such loans is then recognized only to the extent that cash is received, and where the future collection of principal is probable. All other loans accrue interest at the stated contract rate.
| 27 |
Net interest income totaled $46,347,000, $42,444,000 and $36,685,000 in 2017, 2016 and 2015, respectively. Total interest income was $50,218,000, $45,513,000 and $39,282,000 for 2017, 2016, and 2015, respectively. Most of the interest earning assets are tied to the prime lending rate, which did not change during all of 2015 and the first eleven months of 2016 when the rate was 3.25%. The rate was raised 25 basis points on December 14, 2017, June 15, 2017, March 16, 2017, December 15, 2016 and December 17, 2015. These increases in the prime lending rate were loosely connected with short term interest rate changes initiated by the Federal Open Market Committee of the Federal Reserve Bank. Total nonaccrual loans were $1,940,000 and $6,647,000 as of December 31, 2017 and 2016, respectively. Payments received for loans on nonaccrual status, where principal is believed to be fully collectible, are credited to interest income when they are received. Average interest earning assets were $1,192,081 in 2017 compared to $1,099,192 in 2016, an increase of $92,889,000. Average interest earning assets were $923,700,000 in 2015. The principal earning assets were loans. Loan growth in 2017 and 2016 was obtained through the existing operating facilities of the Company. Interest expense totaled $3,871,000, $3,069,000 and $2,597,000 for 2017, 2016 and 2015, respectively. During 2017, the Bank increased their deposit rates slightly, as the interest rates that were available in the general marketplace rose. We also maintained FHLB advances throughout 2017. The cost of the FHLB advances increased 52 basis points during 2017 and decreased 16 basis points in 2016 compared to 2015. Time deposit interest rates increased 22 basis points in 2017 compared to 2016 and increased 10 basis points in 2016 compared to 2015. The Bank slowly raised the interest rates paid on our time deposits during 2017.
| TABLE 1 | Net Interest Income and Average Balances | |||||||||||||||||||||||||||||||||||
| 2017 | 2016 | 2015 | ||||||||||||||||||||||||||||||||||
| (Dollar amounts in thousands) | Interest | Average | Interest | Average | Interest | Average | ||||||||||||||||||||||||||||||
| Average | Income | Yield | Average | Income | Yield | Average | Income | Yield | ||||||||||||||||||||||||||||
| Balance | Expense | Cost | Balance | Expense | Cost | Balance | Expense | Cost | ||||||||||||||||||||||||||||
| INTEREST EARNING ASSETS | ||||||||||||||||||||||||||||||||||||
| Loans, gross (1) (2) | $ | 823,333 | $ | 41,956 | 5.10 | % | $ | 746,829 | $ | 38,313 | 5.13 | % | $ | 629,814 | $ | 33,235 | 5.28 | % | ||||||||||||||||||
| Taxable securities | 224,600 | 5,209 | 2.32 | % | 209,257 | 4,213 | 2.01 | % | 188,286 | 3,554 | 1.89 | % | ||||||||||||||||||||||||
| Nontaxable securities (3) | 133,467 | 3,653 | 2.74 | % | 135,412 | 3,916 | 2.89 | % | 103,611 | 3,272 | 3.16 | % | ||||||||||||||||||||||||
| Interest on deposits-other financial institutions | 10,681 | 126 | 1.18 | % | 7,694 | 44 | 0.57 | % | 1,989 | 39 | 1.96 | % | ||||||||||||||||||||||||
| Total interest earning assets | 1,192,081 | 50,944 | 4.27 | % | 1,099,192 | 46,486 | 4.23 | % | 923,700 | 40,100 | 4.34 | % | ||||||||||||||||||||||||
| Cash and due from banks | 15,168 | 92,889 | 15,041 | 44,774 | ||||||||||||||||||||||||||||||||
| Premises and equipment | 9,500 | 10,086 | 10,557 | |||||||||||||||||||||||||||||||||
| Other assets | 41,087 | 39,135 | 31,404 | |||||||||||||||||||||||||||||||||
| Total noninterest earning assets | 65,755 | 64,262 | 86,735 | |||||||||||||||||||||||||||||||||
| TOTAL ASSETS | $ | 1,257,836 | $ | 1,163,454 | $ | 1,010,435 | ||||||||||||||||||||||||||||||
| Deposits: | ||||||||||||||||||||||||||||||||||||
| Demand, interest bearing | $ | 124,267 | $ | 121 | 0.10 | % | $ | 113,121 | $ | 123 | 0.11 | % | $ | 92,267 | 104 | 0.11 | % | |||||||||||||||||||
| Money market | 395,960 | 1,559 | 0.39 | % | 424,981 | 1,824 | 0.43 | % | 368,858 | 1,589 | 0.43 | % | ||||||||||||||||||||||||
| Savings | 88,249 | 91 | 0.10 | % | 84,229 | 88 | 0.10 | % | 75,861 | 77 | 0.10 | % | ||||||||||||||||||||||||
| Time deposits | 123,971 | 1,036 | 0.84 | % | 120,115 | 745 | 0.62 | % | 112,414 | 589 | 0.52 | % | ||||||||||||||||||||||||
| Federal Home Loan Bank advances | 86,603 | 850 | 0.98 | % | 14,497 | 67 | 0.46 | % | 1,452 | 9 | 0.62 | % | ||||||||||||||||||||||||
| Note payable | 4,050 | 214 | 5.28 | % | 4,663 | 222 | 4.76 | % | 5,263 | 229 | 4.35 | % | ||||||||||||||||||||||||
| Total interest bearing liabilities | 823,100 | 3,871 | 0.47 | % | 761,606 | 3,069 | 0.40 | % | 656,115 | 2,597 | 0.40 | % | ||||||||||||||||||||||||
| NONINTEREST BEARING LIABILITIES: | ||||||||||||||||||||||||||||||||||||
| Demand deposits | 300,670 | 274,952 | 240,969 | |||||||||||||||||||||||||||||||||
| Other liabilities | 17,252 | 17,042 | 12,730 | |||||||||||||||||||||||||||||||||
| Total noninterest bearing liabilities | 317,922 | 291,994 | 253,699 | |||||||||||||||||||||||||||||||||
| TOTAL LIABILITIES | 1,141,022 | 1,053,600 | 909,814 | |||||||||||||||||||||||||||||||||
| Stockholders’ equity | 116,814 | 109,854 | 100,621 | |||||||||||||||||||||||||||||||||
| TOTAL LIABILITIES AND STOCKHOLDERS’ EQUITY | $ | 1,257,836 | $ | 1,163,454 | $ | 1,010,435 | ||||||||||||||||||||||||||||||
| NET INTEREST INCOME AND MARGIN ON TOTAL EARNING ASSETS (4) | $ | 47,073 | 3.95 | % | $ | 43,417 | 3.95 | % | $ | 37,503 | 4.06 | % | ||||||||||||||||||||||||
(1) Interest on non-accrual loans is recognized into income on a cash received basis if the loan has demonstrated performance and full collection is considered probable.
(2) Amounts of interest earned include loan fees of $1,856,000, $1,844,000 and $1,514,000 for the years ended December 31, 2017, 2016 and 2015, respectively.
(3) Tax equivalent adjustments recorded at the statutory rate of 35% that are included in the nontaxable securities portfolio are $726,000, $973,000, and $818,000 for the years ended December 31, 2017, 2016 and 2015, respectively, and were derived from nontaxable municipal interest income.
(4) The net interest margin is computed by dividing net interest income by total average interest earning assets.
| 28 |
The following table analyzes the dollar amount of change in interest income and expense and the changes in dollar amounts attributable to (a) changes in volume (changes in volume at the current year rate), (b) changes in rate (changes in rate times the prior year’s volume) and (c) changes in rate/volume (changes in rate times changes in volume). In this table, the dollar change in rate/volume is prorated to volume and rate proportionately.
| TABLE 2 | Rate/Volume Variance Analysis | |||||||||||||||||||||||
| (Dollar amounts in thousands) | Year Ended December 31 | |||||||||||||||||||||||
| 2017 compared to 2016 | 2016 compared to 2015 | |||||||||||||||||||||||
| Increase (decrease) (2) | Increase (decrease) (2) | |||||||||||||||||||||||
| Interest | Interest | |||||||||||||||||||||||
| Income/ | Variance | Income/ | Variance | |||||||||||||||||||||
| Expense | Attributable To | Expense | Attributable To | |||||||||||||||||||||
| Variance | Rate | Volume | Variance | Rate | Volume | |||||||||||||||||||
| INTEREST EARNING ASSETS: | ||||||||||||||||||||||||
| Loans | $ | 3,643 | $ | (280 | ) | $ | 3,923 | $ | 5,078 | $ | (925 | ) | $ | 6,003 | ||||||||||
| Taxable securities | 996 | 687 | 309 | 659 | 263 | 396 | ||||||||||||||||||
| Nontaxable securities (1), (3) | (263 | ) | (207 | ) | (56 | ) | 644 | (360 | ) | 1,004 | ||||||||||||||
| Deposits with other financial institutions | 82 | 65 | 17 | 5 | (107 | ) | 112 | |||||||||||||||||
| Total | $ | 4,458 | $ | 265 | $ | 4,193 | $ | 6,386 | $ | (1,129 | ) | $ | 7,515 | |||||||||||
| INTEREST BEARING LIABILITIES: | ||||||||||||||||||||||||
| Demand deposits | $ | (2 | ) | $ | (14 | ) | $ | 12 | $ | 19 | $ | (5 | ) | $ | 24 | |||||||||
| Money market | (265 | ) | (151 | ) | (114 | ) | 235 | (6 | ) | 241 | ||||||||||||||
| Savings deposits | 3 | (1 | ) | 4 | 11 | 2 | 9 | |||||||||||||||||
| Time deposits | 291 | 267 | 24 | 156 | 116 | 40 | ||||||||||||||||||
| Federal Home Loan Bank advances | 783 | 450 | 333 | 58 | (23 | ) | 81 | |||||||||||||||||
| Interest on note payable | (8 | ) | 21 | (29 | ) | (7 | ) | 19 | (26 | ) | ||||||||||||||
| Total | 802 | 572 | 230 | 472 | 103 | 369 | ||||||||||||||||||
| NET INTEREST INCOME | $ | 3,656 | $ | (307 | ) | $ | 3,963 | $ | 5,914 | $ | (1,232 | ) | $ | 7,146 | ||||||||||
(1) Nontaxable securities in this Table are shown on a tax equivalent basis.
(2) Increases (decreases) shown are in relation to their effect on net interest income.
(3) Tax equivalent adjustments recorded at the statutory rate of 35% that are included in the nontaxable portfolio are $726,000, $973,000 and $818,000 for the years ended December 31, 2017, 2016 and 2015, respectively, and were derived from nontaxable municipal interest income.
There were no fed funds sold in 2017 and 2016 and nominal amounts of federal funds sold in 2015. Yields on deposits at other financial institutions averaged 1.18%, 0.57% and 1.96% in 2017, 2016 and 2015, respectively. On the interest expense side, the interest rate increase in Time Deposits and FHLB advances during 2017 was due to increases in short term market interest rate increases that occurred due to actions taken by the Federal Open Market Committee of the Federal Reserve Bank.
| 29 |
Allowance for Loan Losses
The Board of Directors has the ultimate oversight responsibility over the processes utilized in assessing the overall risks in the Company’s loan portfolio, assessing the specific loss expectancy, and determining the adequacy of the loan loss reserve. The level of reserves is determined by management and documented with internally generated credit quality ratings, a review of the local economic conditions in the Bank’s market area, and consideration of the Bank’s historical loan loss experience. The Bank is committed to maintaining adequate reserves, identifying credit weaknesses through frequent loan reviews, and updating loan risk ratings and changing those risk ratings in a timely manner as circumstances change.
Loans outstanding (net of deferred loan fees and allowance for loan losses) increased by $47,281,000 to $829,766,000 in 2017; $59,738,000 to $782,485,000 in 2016 compared to 2015, and $139,032,000 to $722,747,000 in 2015. Bank management has consistently maintained conservative underwriting standards which generally require borrowers to maintain at most a loan-to-value ratio of 70%; maintain a debt service coverage ratio of at least 1.25; and requires borrowers to make monthly mortgage payments out of documented cash flows.
The allowance for loan losses totaled $10,171,000, $10,167,000, and $9,970,000 at December 31, 2017, 2016 and 2015, respectively. This represented 1.21%, 1.28%, and 1.36% of total loans outstanding on those dates. These balances reflect amounts that, in management’s judgment, are adequate to provide for probable loan losses based on the considerations listed above. Management performs stress testing of our loan portfolio to gain a better understanding of the portfolio effects of additional declines in real estate values and expected cash values. Management also evaluates all commercial loans, secured and unsecured, at least quarterly.
Loans acquired in the Oceanic Bank acquisition in 2012 and the America California Bank acquisition in 2015 were accounted for at fair value, resulting in a discount at the time of the acquisition, due in part to credit quality. If expected potential credit losses are actually incurred, they will be evaluated against the net book discount remaining. Only those losses that occur after the acquisition date or exceed the amount of discount remaining on the acquired Oceanic Bank loan portfolio will be charged to the allowance for loan losses. At December 31, 2017, 2016, and 2015, the remaining discount related to the Oceanic Bank and America California Bank acquisitions totaled $443,425 $1,336,000, and $1,397,000, respectively.
| TABLE 3 | Allocation of the Allowance for Loan Losses | |||||||||||||||||||||||||||||||||||||||
| (Dollar amounts in thousands) | ||||||||||||||||||||||||||||||||||||||||
| 2017 | 2016 | 2015 | 2014 | 2013 | ||||||||||||||||||||||||||||||||||||
| Percent | Percent | Percent | Percent | Percent | ||||||||||||||||||||||||||||||||||||
| of loans | of loans | of loans | of loans | of loans | ||||||||||||||||||||||||||||||||||||
| in each | in each | in each | in each | in each | ||||||||||||||||||||||||||||||||||||
| category | category | category | category | category | ||||||||||||||||||||||||||||||||||||
| to total | to total | to total | to total | to total | ||||||||||||||||||||||||||||||||||||
| Amount | Loans | Amount | Loans | Amount | Loans | Amount | Loans | Amount | Loans | |||||||||||||||||||||||||||||||
| Commercial real estate | $ | 5,495 | 54.4 | % | $ | 6,392 | 53.1 | % | $ | 6,059 | 54.5 | % | $ | 5,549 | 53.6 | % | $ | 5,763 | 57.8 | % | ||||||||||||||||||||
| Real estate construction | 388 | 4.2 | % | 617 | 5.5 | % | 589 | 6.1 | % | 849 | 6.7 | % | 734 | 6.1 | % | |||||||||||||||||||||||||
| Real estate multi family | 1,496 | 12.5 | % | 389 | 13.3 | % | 243 | 8.7 | % | 206 | 9.1 | % | 293 | 8.2 | % | |||||||||||||||||||||||||
| Real estate 1 to 4 family | 2,008 | 20.6 | % | 2,082 | 21.5 | % | 2,176 | 23.4 | % | 1,965 | 21.7 | % | 1,788 | 19.0 | % | |||||||||||||||||||||||||
| Commercial & industrial | 440 | 6.6 | % | 650 | 6.2 | % | 853 | 7.1 | % | 1,073 | 8.7 | % | 1,237 | 8.6 | % | |||||||||||||||||||||||||
| Consumer | 344 | 1.7 | % | 37 | 0.4 | % | 50 | 0.2 | % | 58 | 0.2 | % | 64 | 0.3 | % | |||||||||||||||||||||||||
| Total | $ | 10,171 | 100.0 | % | $ | 10,167 | 100.0 | % | $ | 9,970 | 100.0 | % | $ | 9,700 | 100.0 | % | $ | 9,879 | 100.0 | % | ||||||||||||||||||||
| 30 |
Table 4 summarizes transactions in the allowance for loan losses and details the charge-offs, recoveries and net loan losses by loan category for each of the last five fiscal years ended December 31, 2017. The amount added to the provision and charged to operating expenses for each period is based on the risk profile of the loan portfolio.
| TABLE 4 | Allowance for Loan Losses | |||||||||||||||||||
| Historical Analysis | ||||||||||||||||||||
| (Dollar amounts in thousands) | For the year ended December 31, | |||||||||||||||||||
| 2017 | 2016 | 2015 | 2014 | 2013 | ||||||||||||||||
| Balance at Beginning of Period | $ | 10,167 | $ | 9,970 | $ | 9,700 | $ | 9,879 | $ | 9,124 | ||||||||||
| (Recovery of) provision for loan losses | (360 | ) | 150 | (305 | ) | (1,020 | ) | 1,385 | ||||||||||||
| Charge-offs: | ||||||||||||||||||||
| Real Estate | (91 | ) | (35 | ) | (45 | ) | (328 | ) | (728 | ) | ||||||||||
| Commercial | (39 | ) | (165 | ) | (23 | ) | (28 | ) | (57 | ) | ||||||||||
| Consumer | (8 | ) | (18 | ) | (13 | ) | (26 | ) | (7 | ) | ||||||||||
| Total | (138 | ) | (218 | ) | (81 | ) | (382 | ) | (792 | ) | ||||||||||
| Recoveries: | ||||||||||||||||||||
| Real Estate | 183 | 52 | 591 | 1,065 | 88 | |||||||||||||||
| Commercial | 319 | 213 | 60 | 154 | 73 | |||||||||||||||
| Consumer | — | — | 5 | 4 | 1 | |||||||||||||||
| Total | 502 | 265 | 656 | 1,223 | 162 | |||||||||||||||
| Net recoveries (charge-offs) | 364 | 47 | 575 | 841 | (630 | ) | ||||||||||||||
| Balance at End of Period | $ | 10,171 | $ | 10,167 | $ | 9,970 | $ | 9,700 | $ | 9,879 | ||||||||||
| Percentages | ||||||||||||||||||||
| Allowance for loan losses/total loans | 1.21 | % | 1.28 | % | 1.36 | % | 1.63 | % | 1.76 | % | ||||||||||
| Net (recoveries) charge-offs/real estate loans | -0.08 | % | -0.08 | % | -0.08 | % | -0.14 | % | 0.13 | % | ||||||||||
| Net (recoveries) charge-offs/commercial loans | -0.50 | % | -0.10 | % | -0.07 | % | -0.24 | % | -0.03 | % | ||||||||||
| Net charge-offs/consumer loans | 0.06 | % | 0.51 | % | 0.51 | % | 1.52 | % | 0.36 | % | ||||||||||
| Net (recoveries) charge-offs/total loans | -0.04 | % | -0.01 | % | -0.08 | % | -0.14 | % | 0.11 | % | ||||||||||
| Allowance for loan losses/non-performing loans | 524.28 | % | 118.65 | % | 118.65 | % | 171.74 | % | 134.39 | % | ||||||||||
The level of yearly charge-offs were primarily attributable to problems that were identified with specific borrowers rather than problems with a particular segment of the loan portfolio. In particular, borrowers who had exposure to real estate projects outside of San Mateo and San Francisco counties were identified as having a relatively higher risk profile than those operating solely within these two counties. If real estate values or lease rates decline in the future, additional increases in our allowance for loan losses may be warranted.
| 31 |
Nonperforming Assets
Nonperforming assets consist of nonaccrual loans, foreclosed assets, and loans that are 90 days or more past due but are still accruing interest. The accrual of interest on non-accrual loans is discontinued when, in management’s opinion, the borrower may be unable to meet payments as they become due. For the years ended December 31, 2017, 2016 and 2015, had non-accrual loans performed as agreed, approximately $664,000, $569,000, and $460,000, respectively, would have been recognized in additional interest income.
Table 5 provides a summary of nonperforming assets for the most recent five years. Nonperforming loans were 0.2%, 0.8% and 1.2% of total loans at December 31, 2017, 2016 and 2015. Management believes the current list of past due loans as of December 31, 2015 are collectible and does not anticipate future significant losses that exceed the current allowance for loan losses.
| TABLE 5 | Analysis of Nonperforming Assets | |||||||||||||||||||
| (Dollar amounts in thousands) | December 31 | |||||||||||||||||||
| 2017 | 2016 | 2015 | 2014 | 2013 | ||||||||||||||||
| Nonaccrual loans | $ | 1,940 | $ | 6,647 | $ | 7,915 | $ | 5,648 | $ | 7,351 | ||||||||||
| Other real estate owned | 3,300 | 1,427 | 1,026 | 763 | 5,318 | |||||||||||||||
| Total | $ | 5,240 | $ | 8,074 | $ | 8,941 | $ | 6,411 | $ | 12,669 | ||||||||||
Nonaccrual loans at December 31, 2017 consist of commercial real estate loans, single family residence loans, commercial loans and some commercial and industrial loans. The Bank is working with its borrowers to develop strategies that can give the borrowers time to work through their financial difficulties.
There are two properties reported in other real estate owned. The first property is a commercial building with a net book balance of $1,483,000, $1,427,000 and $1,026,000 as of December 31. 2017, 2016 and 2015, respectively. This commercial property has environmental issues related to soil contamination from the property’s use by previous owners. The building is fully leased on a triple net lease and the market value of the building, supported by appraisal and other market data, is greater than the net book value of the property as of December 31, 2017. During February 2018, the property was sold to an unrelated third party for $2.8 million. The Bank loaned $1.2 million to the buyer and in accordance with the purchase and sale agreement has agreed to incur the costs necessary to continue monitoring the property and continue our efforts to obtain a final signed remediation agreement with the local Water Board. The purchase and sale agreement requires a set-aside reserve of $500,000 to cover the costs that are anticipated to be incurred by the Company. The set-aside reserve will be funded with a portion of the net cash provided by the sale of the property. During 2017, 2016 and 2015, toxic remediation costs were incurred with the goal of obtaining a final definitive remediation agreement with the Water Board. All remediation costs leading up to the sale date were capitalized into the net carrying value of the property. The remediation efforts performed included soil replacement, soil treatment and drilling water monitoring wells. These capitalized costs have increased the carrying value of the property while at the same time the appraised market value of the property has steadily increased. On an annual basis, the net investment in the property has been reviewed for potential impairment, and to date, no impairment has been found. From the time this property was obtained through foreclosure until the date of the sale and the transfer of ownership of the property, the estimated market value of the property has consistently been more than the property’s net book value plus estimated future toxic remediation costs. However, the Company does not yet have a signed final remediation plan with the Water Board and the Company has no guarantee as to when or if that might occur. Management has obtained cost estimates from our soil engineering and consulting company consultant related to the estimated future cost of remediation using a remediation plan that has been submitted for approval to the local Water Board. The estimated future costs are expected to total approximately $725,000, but could vary in the future. At the time of sale, management established a set-aside monetary fund of $500,000 which was deposited into an insured depository account that was funded from the purchase and sale contract that closed escrow in February 2018. The second property is an elderly care facility located in Lafayette, California that was acquired in November 2017 and has a net book balance of $1,817,000. A potential purchaser of this facility has been identified and the Bank is working with the potential buyer to complete the sale of this property, which is expected to occur in either March or April of 2018. For additional information regarding these two properties, please see Note 7 and Note 23 to the Company’s 2017 Consolidated Financial Statements.
| 32 |
A troubled debt restructuring occurs when the Bank offers, at favorable terms, a modification of loan terms and conditions because management believes the borrower may not be able to make payments at their original note rate and terms. There were no troubled debt restructurings in 2017 or 2016. There was one troubled debt restructuring in 2015 that consisted of one 1 to 4 family real estate loan. Total restructured loans outstanding as of December 31, 2017 and 2016 were $7,708,000 and $13,268,000, respectively.
Noninterest Income
The following table sets forth the principal components of noninterest income:
| TABLE 6 | Noninterest Income | Variance | Variance | |||||||||||||||||||||||||
| Years ended December 31, | 2017 vs. 2016 | 2016 vs. 2015 | ||||||||||||||||||||||||||
| (Dollar amounts in thousands) | 2017 | 2016 | 2015 | Amount | Percent | Amount | Percent | |||||||||||||||||||||
| Service charges | $ | 2,264 | $ | 2,461 | $ | 2,501 | (197 | ) | -8 | % | (40 | ) | -2 | % | ||||||||||||||
| Net gain on sale of available-for-sale securities | 210 | 438 | 339 | (228 | ) | -52 | % | 201 | 59 | % | ||||||||||||||||||
| Earnings on bank-owned life insurance | 390 | 402 | 364 | (12 | ) | -3 | % | 5 | 1 | % | ||||||||||||||||||
| Other income | 996 | 1,294 | 1,292 | (298 | ) | -23 | % | 333 | 26 | % | ||||||||||||||||||
| Total noninterest income | $ | 3,860 | $ | 4,595 | $ | 4,496 | $ | (735 | ) | -16 | % | $ | 499 | 11 | % | |||||||||||||
Total noninterest income consists mainly of service charges on deposits. The gain on sale of available-for-sale securities during 2017, 2016 and 2015 was derived primarily from the sale of U. S. government agency, mortgage-backed securities, municipal securities and U. S. Treasury securities. A significant source of other income was dividends on equity securities, which totaled $558,000, $775,000, and $651,000, in the years 2017, 2016, and 2015, respectively. The equity securities that are owned by the Bank are either highly illiquid securities or investments in government sponsored entities that cannot be bought and sold in open market transactions.
| 33 |
Noninterest Expenses
The following table sets forth the various components of noninterest expense:
| TABLE 7 | Noninterest Expenses | Variance | Variance | |||||||||||||||||||||||||
| (Dollar amounts in thousands) | Years ended December 31, | 2017 vs. 2016 | 2016 vs. 2015 | |||||||||||||||||||||||||
| 2017 | 2016 | 2015 | Amount | Percent | Amount | Percent | ||||||||||||||||||||||
| Salaries and employee benefits | $ | 19,366 | $ | 19,474 | $ | 18,523 | $ | (108 | ) | -1 | % | 951 | 5 | % | ||||||||||||||
| Occupancy expense | 2,747 | 2,528 | 2,517 | 219 | 9 | % | 11 | 0 | % | |||||||||||||||||||
| Equipment expense | 1,646 | 1,765 | 1,926 | (119 | ) | -7 | % | (161 | ) | -8 | % | |||||||||||||||||
| Professional fees | 1,482 | 1,363 | 1,471 | 119 | 9 | % | (108 | ) | -7 | % | ||||||||||||||||||
| FDIC assessment | 400 | 600 | 600 | (200 | ) | -33 | % | 0 | 0 | % | ||||||||||||||||||
| Telephone, postage, supplies | 1,267 | 1,199 | 1,074 | 68 | 6 | % | 125 | 12 | % | |||||||||||||||||||
| Advertising expense | 451 | 524 | 500 | (73 | ) | -14 | % | 24 | 5 | % | ||||||||||||||||||
| Data processing expense | 571 | 657 | 1,076 | (86 | ) | -13 | % | (419 | ) | -39 | % | |||||||||||||||||
| Low income housing expense | 472 | 284 | 283 | 188 | 66 | % | 1 | 0 | % | |||||||||||||||||||
| Surety insurance | 349 | 347 | 381 | 2 | 1 | % | (34 | ) | -9 | % | ||||||||||||||||||
| Directors expense | 288 | 288 | 288 | — | — | — | — | |||||||||||||||||||||
| Other real estate owned expense (recovery), net | 80 | (5 | ) | 4 | 85 | -1700 | % | (9 | ) | -225 | % | |||||||||||||||||
| Other expense | 1,430 | 1,668 | 1,282 | (238 | ) | -14 | % | 386 | 30 | % | ||||||||||||||||||
| Total noninterest expense | $ | 30,549 | $ | 30,692 | $ | 29,925 | $ | (143 | ) | 0 | % | $ | 767 | 3 | % | |||||||||||||
Salaries and employee benefits were $19,366,000, 19,474,000 and $18,523,000 in 2017, 2016 and 2015, respectively. Salaries and employee benefits represented 63%, 63%, and 62% of noninterest expense for the years 2017, 2016, and 2015, respectively. Decreases in salary and employee benefits in 2017 were primarily related to open, unfilled positions within the Company. Increases in salaries and employee benefits in 2016 and 2015 were related to normal salary progression, changes related to executive salary continuation agreements and the purchase of America California Bank.
Occupancy expense increased $219,000 and $11,000 in 2017 and 2016, respectively and decreased $256,000 in 2015. The increase in occupancy expense during 2017 was primarily due to maintenance and repair costs of heating and air conditioning systems and the resurfacing of our parking lots at our branch and home office facilities. The decrease in 2015 was primarily related to the sale of our South San Francisco South Airport Boulevard branch late in 2014.
The increase in other real estate owned expense during 2017 was primarily related to the foreclosure of an assisted living facility located in Lafayette, California during 2017. Toxic remediation costs incurred at the other OREO property were capitalized during 2017, 2016 and 2015 and were not a factor in the increased OREO costs during 2017.
Provision for Loan Losses
The allowance for loan losses in 2017, 2016 and 2015 was recorded at levels management believed reflected the estimated loss exposure identified in the loan portfolio during each of these years. The allowance for loan losses was $10,171,000 or 1.21% of total gross loans at December 31, 2017. During 2016 and 2015 the allowance for loan losses was $10,167,000 and $9,970,000 or 1.28% and 1.26% of total gross loans as of December 31, 2016 and 2015. During 2017, improvement in the credit characteristics of the loan portfolio resulted in a recovery of provision for loan losses of $360,000. During 2016, the Bank incurred a loan loss provision of $150,000 primarily attributable to growth that occurred within the loan portfolio. During the fourth quarter of 2015, a reversal of $530,000 in loan loss provision was recorded to reflect improving credit metrics that occurred within the loan portfolio during 2015.
| 34 |
The allowance for loan losses is maintained at a level considered adequate to provide for probable loan losses inherent in the loan portfolio. Management is taking steps necessary to work with borrowers and has granted modified loan terms to certain borrowers willing to make payments on loans secured by their primary residence, even though they were delinquent, and/or the value of their home had declined substantially. The purchased Oceanic Bank and America California Bank loans have a fair value discount that was created at acquisition pursuant to acquisition accounting and representing, in part, expected credit losses inherent in the acquired loan portfolio. The fair value discount is not part of the allowance for loan losses.
Balance Sheet Analysis
Total assets were $1,265,238,000, $1,219,394,000 and $1,124,349,000 as of December 31, 2017, 2016 and 2015, respectively. Total assets averaged $1,257,836, $1,163,454 and $1,010,435 during 2017, 2016 and 2015 respectively. Average earning assets represented 95%, 94% and 93% of total average assets during 2017, 2016 and 2015, respectively. Asset growth in 2017 and 2016 was through increased business developed through our existing facilities. In 2015, a significant portion of our growth was obtained from the America California Bank acquisition as well as growth in customer business generated through our branch offices.
Loans
The loan portfolio is the principal earning asset of the Bank. Gross loans outstanding (net of loan fees) totaled $839,937,000, $792,652,000 and $732,717,000 as of December 31, 2017, 2016 and 2015, respectively. During 2017 and 2016, the growth in our loan portfolio was obtained through our existing branch network. During 2015, total growth in the loan portfolio was $140,113,000. $93,000,000 of this amount was the result of our acquisition of America California Bank. The remainder was from organic growth.
Table 8 presents a detailed analysis of loans outstanding at December 31, 2013 through December 31, 2017.
| TABLE 8 | Loan Portfolio | ||||||||||||||||||||||||||||||||||||||
| December 31 | |||||||||||||||||||||||||||||||||||||||
| 2017 | 2016 | 2015 | 2014 | 2013 | |||||||||||||||||||||||||||||||||||
| (Dollar amounts in thousands) | |||||||||||||||||||||||||||||||||||||||
| Commercial real estate | $ | 456,992 | 54 | % | $ | 421,222 | 53 | % | $ | 399,993 | 55 | % | $ | 318,427 | 54 | % | $ | 325,199 | 58 | % | |||||||||||||||||||
| Real estate construction | 35,206 | 4 | % | 43,683 | 6 | % | 44,816 | 6 | % | 39,771 | 7 | % | 34,318 | 6 | % | ||||||||||||||||||||||||
| Real estate multi family | 105,138 | 12 | % | 105,963 | 13 | % | 63,597 | 9 | % | 53,824 | 9 | % | 46,143 | 8 | % | ||||||||||||||||||||||||
| Real estate 1 to 4 family | 173,476 | 21 | % | 170,523 | 22 | % | 171,964 | 23 | % | 128,732 | 22 | % | 106,903 | 21 | % | ||||||||||||||||||||||||
| Commercial & industrial | 55,727 | 7 | % | 48,874 | 6 | % | 52,033 | 7 | % | 51,662 | 9 | % | 48,504 | 9 | % | ||||||||||||||||||||||||
| Consumer | 14,057 | 2 | % | 3,533 | — | 1,574 | — | 1,448 | — | 1,650 | 0 | % | |||||||||||||||||||||||||||
| Sub total | 840,596 | 100 | % | 793,798 | 100 | % | 733,977 | 100 | % | 593,864 | 100 | % | 562,717 | 100 | % | ||||||||||||||||||||||||
| Net deferred loan fees | (659 | ) | — | (1,146 | ) | — | (1,260 | ) | — | (449 | ) | — | (495 | ) | — | ||||||||||||||||||||||||
| Total | $ | 839,937 | 100 | % | $ | 792,652 | 100 | % | $ | 732,717 | 100 | % | $ | 593,415 | 100 | % | $ | 562,222 | 100 | % | |||||||||||||||||||
Loans that are not guaranteed by the U. S. Government contain some level of risk of principal repayment. Real estate and loans supported by UCC filing requirements contain less risk of loss than unsecured loans. By securing loans with various types of collateral, the Bank is able to better assure repayment, either from the liquidation of collateral or from the borrower. For commercial loans, both secured and unsecured, the Bank will generally require personal guarantees from our borrowers. These financial guarantees allow the Bank to initiate collection activity against the borrowers individually if the liquidation of collateral is insufficient to repay the loan. The underwriting policies of the Bank require our borrowers to document the source of repayment for their loans, maintain equity positions in any secured financings, and provide ongoing financial statement information. Current appraisals, financial statements, and tax returns allow Bank management to evaluate our borrower’s repayment ability on at least an annual basis. Commercial loans are generally variable rate in nature. Real estate loans more than five years to maturity generally contain variable interest rates. Loans that mature in five years or less may be either fixed or variable rate in nature, with fixed rate loans containing initial rates that are higher than those with variable rates. A borrower’s preference and interest rate risk tolerance will generally dictate whether to utilize fixed or variable rate financing. The following table shows the Bank’s loan maturities and sensitivities to changes in interest rates as of December 31, 2017.
| 35 |
| TABLE 9 | ||||||||||||||||
| Maturing | ||||||||||||||||
| Maturing | After 1 | Maturing | ||||||||||||||
| (Dollar amounts in thousands) | Within | But Within | After 5 | |||||||||||||
| 1 Year | 5 Years | Years | Total | |||||||||||||
| Commercial real estate | $ | 25,702 | $ | 76,323 | $ | 354,967 | $ | 456,992 | ||||||||
| Real estate construction | 27,279 | 4,740 | 3,187 | 35,206 | ||||||||||||
| Real estate multi family | 3,130 | 18,892 | 83,116 | 105,138 | ||||||||||||
| Real estate 1 to 4 family | 11,007 | 22,777 | 139,692 | 173,476 | ||||||||||||
| Commercial & industrial | 33,604 | 17,958 | 4,165 | 55,727 | ||||||||||||
| Consumer | 1,294 | 391 | 12,372 | 14,057 | ||||||||||||
| Sub total | 102,016 | 141,081 | 597,499 | 840,596 | ||||||||||||
| Net deferred loan fees | (104 | ) | (323 | ) | (232 | ) | (659 | ) | ||||||||
| Total | $ | 101,912 | $ | 140,758 | $ | 597,267 | $ | 839,937 | ||||||||
| With predetermined fixed interest rates | $ | 15,459 | $ | 55,977 | $ | 195,757 | $ | 267,193 | ||||||||
| With floating interest rates | 86,453 | 84,781 | 401,510 | 572,744 | ||||||||||||
| Total | $ | 101,912 | $ | 140,758 | $ | 597,267 | $ | 839,937 | ||||||||
Investment Portfolio
The primary purpose of the Bank’s investment portfolio is to ensure the Bank has sufficient available funds to fund the Company’s liquidity needs, including the ability to fund loans or pay down liabilities. The Company’s primary source of funds is the deposit base. If more funds are needed, investment maturities, calls and sales from the investment portfolio may be used. The Bank’s investment portfolio is composed primarily of debt securities of U. S. Government Agencies, mortgage-backed securities that have their principal guaranteed by U. S. Government Agencies, and in obligations of States and their political subdivisions. The Bank believes this provides for an appropriate liquidity level and minimal credit risk.
The following table sets forth the maturity distribution and interest rate sensitivity of investment securities at December 31, 2017:
| TABLE 10 | ||||||||||||||||||||||||||||||||||||||||||||
| After | After | |||||||||||||||||||||||||||||||||||||||||||
| Due | 1 Year | 5 Years | Due | Maturity | ||||||||||||||||||||||||||||||||||||||||
| (Dollar amounts | In 1 Year | Through | Through | After | Fair | In | Average | |||||||||||||||||||||||||||||||||||||
| in thousands) | Or Less | Yield | 5 Years | Yield | 10 Years | Yield | 10 Years | Yield | Value | Years | Yield | |||||||||||||||||||||||||||||||||
| U. S. Treasury securities | $ | — | — | % | $ | 1,975 | 1.88 | % | $ | — | — | % | $ | — | — | % | $ | 1,975 | 2.92 | 1.83 | % | |||||||||||||||||||||||
| Obligations of U. S. Government Agencies | 6,000 | 1.10 | % | 35,822 | 1.74 | % | — | 1.77 | % | — | — | 41,823 | 3.12 | 1.59 | % | |||||||||||||||||||||||||||||
| Mortgage-backed securities | — | — | 44,580 | 2.48 | % | 31,732 | 2.61 | % | 43,481 | 2.78 | % | 119,792 | 11.03 | 2.35 | % | |||||||||||||||||||||||||||||
| Asset-backed securities | — | — | — | — | 1,628 | 2.43 | % | 2,058 | 3.95 | % | 3,686 | 9.71 | 3.32 | % | ||||||||||||||||||||||||||||||
| Obligations of states and political subdivisions | 4,636 | 2.54 | % | 81,470 | 2.33 | % | 54,503 | 2.62 | % | 10,493 | 3.73 | % | 151,103 | 5.11 | 2.45 | % | ||||||||||||||||||||||||||||
| Corporate debt | 2,011 | 1.70 | % | 26,272 | 2.64 | % | 8,136 | 5.14 | % | 1,060 | 5.84 | % | 37,478 | 4.32 | 3.95 | % | ||||||||||||||||||||||||||||
| Total | $ | 12,647 | 1.72 | % | $ | 190,119 | 2.29 | % | $ | 95,999 | 2.83 | % | $ | 57,092 | 3.06 | % | $ | 355,857 | 6.76 | 2.54 | % | |||||||||||||||||||||||
| 36 |
The following table shows the securities portfolio mix at December 31, 2017, 2016 and 2015.
| TABLE 11 | ||||||||||||||||||||||||
| Years Ended December 31, | ||||||||||||||||||||||||
| 2017 | 2016 | 2015 | ||||||||||||||||||||||
| (Dollar amounts in thousands) | Amortized | Fair | Amortized | Fair | Amortized | Fair | ||||||||||||||||||
| Cost | Value | Cost | Value | Cost | Value | |||||||||||||||||||
| U. S. Treasury securities | $ | 1,989 | $ | 1,975 | $ | 977 | $ | 987 | $ | 7,004 | $ | 7,000 | ||||||||||||
| Obligations of U.S. Government Agencies | 42,247 | 41,823 | 60,773 | 60,545 | 84,842 | 84,609 | ||||||||||||||||||
| Mortgage-backed securities | 121,087 | 119,792 | 85,709 | 84,284 | 61,579 | 61,663 | ||||||||||||||||||
| Asset-backed securities | 3,734 | 3,686 | — | — | — | — | ||||||||||||||||||
| Obligations of states and political subdivisions | 150,724 | 151,103 | 151,988 | 151,618 | 132,125 | 135,190 | ||||||||||||||||||
| Corporate debt | 37,409 | 37,478 | 63,277 | 62,671 | 41,045 | 40,745 | ||||||||||||||||||
| Total | $ | 357,190 | $ | 355,857 | $ | 362,724 | $ | 360,105 | $ | 326,595 | $ | 329,207 | ||||||||||||
Deposits
During 2017, 2016 and 2015 total average deposits were $1,033,117,000, $1,017,398,000 and $890,369,000. The prime lending rate was revised upwards on three separate occasions in 2017, and once in both 2016 and 2015. Time deposit interest rates have moved higher in a steady fashion over the last few years. Average time deposit interest rates were 0.84%, 0.62% and 0.52% in 2017, 2016 and 2015, respectively. Bank management has made a conscious effort to keep transaction based deposit account, such as interest bearing demand, savings and money market rates stable.
The following table summarizes the distribution of average deposits and the average rates paid for them in the periods indicated:
| TABLE 12 | ||||||||||||||||||||||||||||||||||||
| Average Deposits and Average Rates paid for the period ending December 31, | ||||||||||||||||||||||||||||||||||||
| 2017 | 2016 | 2015 | ||||||||||||||||||||||||||||||||||
| (Dollar amounts | Average | Average | % of total | Average | Average | % of total | Average | Average | % of total | |||||||||||||||||||||||||||
| in thousands) | Balance | Rate | Deposits | Balance | Rate | Deposits | Balance | Rate | Deposits | |||||||||||||||||||||||||||
| Interest-bearing demand | $ | 124,267 | 0.10 | % | 12 | % | $ | 113,121 | 0.11 | % | 11 | % | 92,267 | 0.11 | % | 10 | % | |||||||||||||||||||
| Money market | 395,960 | 0.39 | % | 38 | % | 424,981 | 0.43 | % | 42 | % | 368,858 | 0.43 | % | 42 | % | |||||||||||||||||||||
| Savings | 88,249 | 0.10 | % | 9 | % | 84,229 | 0.10 | % | 8 | % | 75,861 | 0.10 | % | 8 | % | |||||||||||||||||||||
| Time deposits $100,000 or more | 89,594 | 0.91 | % | 9 | % | 83,942 | 0.43 | % | 8 | % | 78,842 | 0.36 | % | 9 | % | |||||||||||||||||||||
| Time deposits under $100,000 | 34,377 | 0.66 | % | 3 | % | 36,173 | 0.19 | % | 4 | % | 33,572 | 1.60 | % | 4 | % | |||||||||||||||||||||
| Total interest bearing deposits | 732,447 | 0.38 | % | 71 | % | 742,446 | 0.37 | % | 73 | % | 649,400 | 0.36 | % | 73 | % | |||||||||||||||||||||
| Demand deposits | 300,670 | — | 29 | % | 274,952 | — | 27 | % | 240,969 | — | 27 | % | ||||||||||||||||||||||||
| Total deposits | $ | 1,033,117 | 0.27 | % | 100 | % | $ | 1,017,398 | 0.21 | % | 100 | % | $ | 890,369 | 0.21 | % | 100 | % | ||||||||||||||||||
| 37 |
The following table indicates the maturity schedule of time deposits of $250,000 or more:
TABLE 13
| Analysis of Time Deposits $250,000 or more at December 31, 2017 | ||||||||||||||
| (Dollar amounts in thousands) | ||||||||||||||
| Total | ||||||||||||||
| Deposits of | Over Three | Over Six | Over | |||||||||||
| $250,000 or | Three Months | To Six | To Twelve | Twelve | ||||||||||
| More | Or Less | Months | Months | Months | ||||||||||
| $ 63,678 | $ | 8,397 | $ | 26,580 | $ | 14,932 | $ | 13,769 | ||||||
Capital
The increases in retained earnings were primarily attributable to retention of net earnings less cash dividends paid in 2017, 2016 and 2015. Net earnings totaled $10,711,000, $10,501,000 and $8,197,000 in 2017, 2016, and 2016 respectively. Cash dividend payments totaled $3,634,000, $2,890,000 and $2,447,000 in 2017, 2016 and 2015, respectively.
Under regulatory capital guidelines, qualifying capital is classified into two tiers, referred to as Tier 1 (core) and Tier 2 (supplementary) capital. The Company’s Tier 1 capital consists of common shareholders’ equity and preferred stock issued to the U.S. Treasury during 2011. The Company’s Tier 2 capital consists of eligible reserves for possible loan losses. Total capital is the sum of Tier 1 plus Tier 2 capital. Risk-weighted assets are calculated by applying risk percentages specified by the FDIC to categories of both balance sheet assets and off-balance sheet obligations. The FDIC also requires the calculation of a leverage ratio requirement. This ratio supplements the risk-based capital ratios and is defined as Tier 1 capital divided by quarterly average assets during the reporting period. This requirement established a minimum leverage ratio of 3.0% for the highest rated banks and ratios of 100 to 200 basis points higher for most other banks. To qualify as “well-capitalized” as defined by regulation, the Banks must maintain a leverage ratio, common equity Tier 1, Tier 1 and total capital ratios of at least 5.00%, 6.50%, 8.00% and 10.00% respectively. “Well-capitalized” financial institutions must also maintain a capped conservation buffer in additional capital across all capital ratios as of December 31, 2017.
| 38 |
Table 14
The capital ratios for the Company and the Bank are presented in the table below:
| Required | ||||||||||||||||||||||||
| for Capital | To be Well-Capitalized | |||||||||||||||||||||||
| Adequacy Purposes | Under Prompt Correction | |||||||||||||||||||||||
| Dollars in thousands | Effective January 1, 2017 | Action Regulations | ||||||||||||||||||||||
| At December 31, 2017 | ||||||||||||||||||||||||
| Regulatory Capital Ratios | Amount | Ratio | Amount | Ratio | Amount | Ratio | ||||||||||||||||||
| Leverage Ratio(1) | ||||||||||||||||||||||||
| Company | $ | 115,364 | 9.09 | % | ≥ | $ | 50,768 | 4.00 | %(2) | N/A | N/A | |||||||||||||
| Bank | 117,180 | 9.23 | % | ≥ | 50,768 | 4.00 | %(2) | $ | 63,460 | 5.00 | % | |||||||||||||
| Tier 1 Common Equity Capital Ratio | ||||||||||||||||||||||||
| Company | 115,364 | 11.57 | % | ≥ | 57,342 | 5.75 | %(2) | N/A | N/A | |||||||||||||||
| Bank | 117,180 | 11.75 | % | ≥ | 57,342 | 5.75 | %(2) | 64,822 | 6.50 | % | ||||||||||||||
| Tier 1 Capital Ratio | ||||||||||||||||||||||||
| Company | 115,364 | 11.57 | % | ≥ | 72,301 | 7.25 | %(2) | N/A | N/A | |||||||||||||||
| Bank | 117,180 | 11.75 | % | ≥ | 72,301 | 7.25 | %(2) | 79,781 | 8.00 | % | ||||||||||||||
| Total Capital Ratio | ||||||||||||||||||||||||
| Company | 125,712 | 12.61 | % | ≥ | 92,246 | 9.25 | %(2) | N/A | N/A | |||||||||||||||
| Bank | 127,528 | 12.79 | % | ≥ | 92,246 | 9.25 | %(2) | 99,726 | 10.00 | % | ||||||||||||||
| (1) | The leverage ratio consists of Tier 1 Capital divided by the most recent quarterly average total assets, excluding certain intangible assets. |
| (2) | Includes 125% capital conservation buffer. |
| Required | ||||||||||||||||||||||||
| for Capital | To be Well-Capitalized | |||||||||||||||||||||||
| Adequacy Purposes | Under Prompt Correction | |||||||||||||||||||||||
| Dollars in thousands | Effective January 1, 2016 | Action Regulations | ||||||||||||||||||||||
| At December 31, 2016 | ||||||||||||||||||||||||
| Regulatory Capital Ratios | Amount | Ratio | Amount | Ratio | Amount | Ratio | ||||||||||||||||||
| Leverage Ratio(1) | ||||||||||||||||||||||||
| Company | $ | 106,971 | 9.02 | % | ≥ | $ | 47,443 | 4.000 | %(2) | N/A | N/A | |||||||||||||
| Bank | 109,538 | 9.27 | % | ≥ | 47,248 | 4.000 | %(2) | $ | 59,060 | 5.00 | % | |||||||||||||
| Tier 1 Common Equity Capital Ratio | ||||||||||||||||||||||||
| Company | 106,971 | 11.32 | % | ≥ | 48,441 | 5.125 | %(2) | N/A | N/A | |||||||||||||||
| Bank | 109,538 | 11.59 | % | ≥ | 48,441 | 5.125 | %(2) | 61,437 | 6.50 | % | ||||||||||||||
| Tier 1 Capital Ratio | ||||||||||||||||||||||||
| Company | 106,971 | 11.32 | % | ≥ | 62,618 | 6.625 | %(2) | N/A | N/A | |||||||||||||||
| Bank | 109,538 | 11.59 | % | ≥ | 62,618 | 6.625 | %(2) | 75,615 | 8.00 | % | ||||||||||||||
| Total Capital Ratio | ||||||||||||||||||||||||
| Company | 117,315 | 12.42 | % | ≥ | 81,522 | 8.625 | %(2) | N/A | N/A | |||||||||||||||
| Bank | 119,882 | 12.68 | % | ≥ | 81,522 | 8.625 | %(2) | 94,518 | 10.00 | % | ||||||||||||||
| (1) | The leverage ratio consists of Tier 1 Capital divided by the most recent quarterly average total assets, excluding certain intangible assets. |
| (2) | Includes 125% capital conservation buffer. |
Liquidity
The Company’s primary source of liquidity on a stand-alone basis is dividends from the Bank. The payment of dividends by the Bank is subject to regulatory restrictions. See the discussion under “Dividends” in Item 1 above.
Liquidity is a measure of the Company’s ability to convert assets into cash. Liquidity consists of cash and due from correspondent bank accounts, including time deposits, federal funds sold, and securities available for sale. The Company’s policy is to maintain a liquidity ratio of 5% or greater of total assets. As of December 31, 2017, the Company’s primary liquidity was 29.6%, compared to 30.8% and 30.4% as of December 31, 2016 and 2015, respectively. There were total liquid assets of $374,340,000, $376,068,000 and $341,726,000 as of December 31, 2017, 2016 and 2015, respectively. The objective of liquidity management is to ensure that the Company has funds available to meet all present and future financial obligations and to take advantage of business opportunities as they occur. Financial obligations arise from withdrawals of deposits, repayment on maturity of purchased funds, extension of loans or other forms of credit, payment of operating expenses and payment of dividends.
Core deposits, which consist of all deposits other than time deposits, have provided the Company with a sizeable source of relatively stable low-cost funds. The Company’s average core deposits represented 87% of average total liabilities of $1,050,295 for the year ended December 31, 2017, 85% of average total liabilities of $1,053,600,000 for the year ended December 31, 2016 and 71% of average total liabilities of $909,814,000 for the year ended December 31, 2015.
| 39 |
As of December 31, 2017, the Company had contractual obligations and other commercial commitments totaling approximately $284,438,000. The following table sets forth the Company’s contractual obligations and other commercial commitments as of December 31, 2017. These obligations and commitments can be funded from other loan repayments, the Company’s liquidity sources such as cash and due from other banks, federal funds sold, securities available for sale, as well as from the Bank’s lines of credit with the Federal Home Loan Bank of San Francisco and the Federal Reserve Bank of San Francisco. For additional information, please see the Consolidated Statements of Cash Flows, in Item 8 of this Form 10-K.
| TABLE 15 | Payments Due by Period | |||||||||||||||||||
| (Dollar amounts in thousands) | 1 year | Over 1 to | Over 3 to | Over | ||||||||||||||||
| Contractual Obligations | Total | or less | 3 years | 5 years | 5 years | |||||||||||||||
| Operating Leases | $ | 4,991 | $ | 1,150 | $ | 1,701 | $ | 1,612 | $ | 528 | ||||||||||
| Salary Continuation Agreements | 13,399 | 172 | 344 | 294 | 12,589 | |||||||||||||||
| Federal Home Loan Bank Advances | 75,000 | 75,000 | — | — | — | |||||||||||||||
| Note payable | 3,750 | 600 | 3,150 | — | — | |||||||||||||||
| Total Contractual Cash Obligations | $ | 97,140 | $ | 76,922 | $ | 5,195 | $ | 1,906 | $ | 13,117 | ||||||||||
| Amount of Commitment Expirations Per Period | ||||||||||||||||||||
| Total | ||||||||||||||||||||
| (Dollar amounts in thousands) | Amounts | 1 year | Over 1 to | Over 3 to | Over | |||||||||||||||
| Other Commercial Commitments | Committed | or less | 3 years | 5 years | 5 years | |||||||||||||||
| Lines of Credit | $ | 131,737 | $ | 43,272 | $ | 38,992 | $ | 29,064 | $ | 20,409 | ||||||||||
| Standby Letters of Credit | 5,286 | 5,286 | — | — | — | |||||||||||||||
| Other Commercial Commitments | 51,472 | 49,333 | 842 | — | 1,297 | |||||||||||||||
| Total Commercial Commitments | $ | 188,495 | $ | 97,891 | $ | 39,834 | $ | 29,064 | $ | 21,706 | ||||||||||
The largest component of the Company’s earnings is net interest income, which can fluctuate widely when significant interest rate movements occur. The Company’s management is responsible for minimizing the Bank’s exposure to interest rate risk and assuring an adequate level of liquidity. By developing objectives, goals and strategies designed to enhance profitability and performance, management is also able to manage the Bank’s interest rate exposure to within predefined Board approved levels.
In order to ensure that sufficient funds are available for loan growth and deposit withdrawals, as well as to provide for general needs, the Company must maintain an adequate level of liquidity. Asset liquidity comes from the Company’s ability to convert short-term investments into cash and from the maturity and repayment of loans and investment securities. Liability liquidity is provided by the Company’s ability to attract deposits and obtain short term credit through established borrowing lines.
The primary source of liability liquidity is the Bank’s depository customer base. The overall liquidity position of the Company is closely monitored and evaluated on a daily basis. The Company has Federal Funds borrowing facilities for a total of $30,000,000, a Federal Home Loan Bank line of credit of up to 30% of eligible total assets, and a Federal Reserve Bank of San Francisco borrowing facility of approximately $56,000,000. Management believes the Company’s liquidity sources at December 31, 2017 are adequate to meet its operating needs in 2018 and into the foreseeable future.
| 40 |
Effect of Changing Prices
The results of operations and financial conditions presented in this report are based on historical cost information and are not adjusted for the effects of inflation. Since the assets and liabilities of banks are primarily monetary in nature (payable in fixed, determinable amounts), the performance of the Company is affected more by changes in interest rates than by inflation. Interest rates generally increase as the rate of inflation increases, but the magnitude of the change in rates may not be the same.
The effect of inflation on banks is normally not as significant as its influence on those businesses that have large investments in plant and inventories. During periods of high inflation, there are normally corresponding increases in the money supply, and banks will usually experience above average growth in assets, loans and deposits. Also, increases in the price of goods and services will result in increased operating expenses. The following table includes key ratios, including returns on average assets and equity for the Company.
| TABLE 16 | ||||||||||||
| Return on Equity and Assets | ||||||||||||
| (Key financial ratios are computed on average balances) | ||||||||||||
| Year Ended December 31, | ||||||||||||
| 2017 | 2016 | 2015 | ||||||||||
| Return on average assets | 0.85 | % | 1.02 | % | 0.81 | % | ||||||
| Return on average equity | 8.86 | % | 10.88 | % | 8.15 | % | ||||||
| Dividend payout ratio (accrual basis) | 33.46 | % | 27.52 | % | 29.85 | % | ||||||
| Average equity to assets ratio | 9.61 | % | 9.44 | % | 9.96 | % | ||||||
ITEM 7A. QUANTITATIVE AND QUALITATIVE DISCLOSURES ABOUT MARKET RISK
Interest Rate Risk
Closely related to the concept of liquidity is the concept of interest rate sensitivity (i. e., the extent to which assets and liabilities are sensitive to changes in interest rates). Management uses an asset/liability model that considers the relative sensitivities of the balance sheet, including the effect of interest rate caps on adjustable rate mortgages and the relatively stable aspects of core deposits. As such, management can model a change in economic value of equity and net interest income simulation that is designed to address the probability of interest rate changes and behavioral response of the balance sheet and net interest income to those changes. The economic value of equity represents the fair value of the net present value of assets, liabilities and off-balance sheet items as of a point in time. The projected net interest income represents the amount of net interest income expected during the subsequent 12 calendar months. The starting point (or “base case”) for the following table is the Company’s net equity position at December 31, 2017 and the Company’s net interest income for the year ended December 31, 2017. Using current discount rates and accountholder behavior assumptions, a simulation is run designed to produce an estimate of the economic value of equity and the Company’s annual net interest income under a variety of changing interest rates assuming that the Company’s interest-sensitive assets and liabilities remain at December 31, 2017 levels.
The “rate shock” information in the table shows estimates the changes in the economic value of portfolio equity from levels that existed at December 31, 2017. Net interest income changes are based on the initial value of net interest income that was recorded for the year ended December 31, 2017 assuming fluctuations or “rate shocks” of plus and minus 100 and 200 basis points above and below current market rates. Rate shocks assume that current interest rates change immediately and then remain constant once the change has occurred. The information set forth in the following table is based on significant estimates and assumptions, and constitutes a forward-looking statement within the meaning of that term set forth in Rule 175 under the Securities Act of 1933 and Rule 3b-6(c) of the Securities Exchange Act of 1934.
| 41 |
| TABLE 17 | ||||||||||||||||||||
| Interest Rate Risk Simulation | ||||||||||||||||||||
| (Dollar amounts in thousands) | Change in Economic Value of Equity | |||||||||||||||||||
| As of December 31, 2017 | ||||||||||||||||||||
| Rates Decline | Rates Increase | |||||||||||||||||||
| Rate change | (2%) | (1%) | Current | +1% | +2% | |||||||||||||||
| Projected market value of equity | $ | 99,814 | $ | 112,398 | $ | 119,280 | $ | 118,648 | $ | 115,773 | ||||||||||
| Change from current | $ | (19,466 | ) | $ | (6,882 | ) | $ | (632 | ) | $ | (3,507 | ) | ||||||||
| Change in Annual Net Interest Income | ||||||||||||||||||||
| 12 Month Time Period | ||||||||||||||||||||
| (Dollar amounts in thousands) | Rates Decline | Rates Increase | ||||||||||||||||||
| Rate change | (2%) | (1%) | Current | +1% | +2% | |||||||||||||||
| Projected net interest income | $ | 45,267 | $ | 46,092 | 46,347 | 44,206 | 41,888 | |||||||||||||
| Change from current | $ | (1,080 | ) | $ | (255 | ) | (2,141 | ) | (4,175 | ) | ||||||||||
| 42 |
ITEM 8. FINANCIAL STATEMENTS AND SUPPLEMENTARY DATA
INDEX TO FINANCIAL STATEMENTS
| 43 |
MANAGEMENT’S REPORT ON INTERNAL CONTROL OVER FINANCIAL REPORTING
Management of FNB Bancorp (the “Company”) is responsible for establishing and maintaining adequate internal control over financial reporting, and for performing an assessment of the effectiveness of internal control over financial reporting as of December 31, 2017. Internal control over financial reporting is a process designed to provide reasonable assurance regarding the reliability of financial reporting and the preparation of financial statements for external purposes in accordance with generally accepted accounting principles. The Company’s system of internal control over financial reporting includes those policies and procedures that (i) pertain to the maintenance of records that, in reasonable detail, accurately and fairly reflect the transactions and dispositions of the assets of the Company; (ii) provide reasonable assurance that transactions are recorded as necessary to permit preparation of financial statements in accordance with generally accepted accounting principles, and that receipts and expenditures of the Company are being made only in accordance with authorizations of Management and Directors of the Company; and (iii) provide reasonable assurance regarding prevention or timely detection of unauthorized acquisition, use or disposition of the Company’s assets that could have a material effect on the financial statements.
Management performed an assessment of the effectiveness of the Company’s internal control over financial reporting as of December 31, 2017 based upon criteria in Internal Control — Integrated Framework (2013) issued by the Committee of Sponsoring Organizations of the Treadway Commission (“COSO”). Based on this assessment, Management determined that the Company’s internal control over financial reporting was effective as of December 31, 2017 based on the criteria in Internal Control - Integrated Framework (2013) issued by COSO.
Management’s assessment of the effectiveness of the Company’s internal control over financial reporting as of December 31, 2017 has been audited by Moss Adams LLP, an independent registered public accounting firm, which expresses an unmodified opinion, as stated in their report which appears on the following page.
Dated: March 13, 2018
| 44 |
Report of Independent Registered Public Accounting Firm
To the Shareholders and
Board of Directors of
FNB Bancorp
Opinions on the Financial Statements and Internal Control over Financial Reporting
We have audited the accompanying consolidated balance sheets of FNB Bancorp and subsidiary (the “Company”) as of December 31, 2017 and 2016, the related consolidated statements of earnings, comprehensive earnings, changes in stockholders' equity and cash flows for each of the three years in the period ended December 31, 2017, and the related notes (collectively referred to as the “consolidated financial statements”). We also have audited the Company's internal control over financial reporting as of December 31, 2017, based on criteria established in Internal Control - Integrated Framework (2013) issued by the Committee of Sponsoring Organizations of the Treadway Commission (COSO).
In our opinion, the consolidated financial statements referred to above present fairly, in all material respects, the consolidated financial position of the Company as of December 31, 2017 and 2016, and the consolidated results of its operations and its cash flows for each of the three years in the period ended December 31, 2017, in conformity with accounting principles generally accepted in the United States of America. Also in our opinion, the Company maintained, in all material respects, effective internal control over financial reporting as of December 31, 2017, based on criteria established in Internal Control - Integrated Framework (2013) issued by COSO.
Basis for Opinions
The Company’s management is responsible for these consolidated financial statements, for maintaining effective internal control over financial reporting, and for its assessment of the effectiveness of internal control over financial reporting, included in the accompanying Management's Report on Internal Control over Financial Reporting. Our responsibility is to express an opinion on the Company's consolidated financial statements and an opinion on the Company's internal control over financial reporting based on our audits. We are a public accounting firm registered with the Public Company Accounting Oversight Board (United States) (“PCAOB”) and are required to be independent with respect to the Company in accordance with the U.S. federal securities laws and the applicable rules and regulations of the Securities and Exchange Commission and the PCAOB.
We conducted our audits in accordance with the standards of the PCAOB. Those standards require that we plan and perform the audits to obtain reasonable assurance about whether the consolidated financial statements are free of material misstatement, whether due to error or fraud, and whether effective internal control over financial reporting was maintained in all material respects.
| 45 |
To the Shareholders and
Board of Directors of
FNB Bancorp
Page 2
Our audits of the consolidated financial statements included performing procedures to assess the risks of material misstatement of the consolidated financial statements, whether due to error or fraud, and performing procedures to respond to those risks. Such procedures included examining, on a test basis, evidence regarding the amounts and disclosures in the consolidated financial statements. Our audits also included evaluating the accounting principles used and significant estimates made by management, as well as evaluating the overall presentation of the consolidated financial statements. Our audit of internal control over financial reporting included obtaining an understanding of internal control over financial reporting, assessing the risk that a material weakness exists, and testing and evaluating the design and operating effectiveness of internal control based on the assessed risk. Our audits also included performing such other procedures as we considered necessary in the circumstances. We believe that our audits provide a reasonable basis for our opinions.
Definition and Limitations of Internal Control Over Financial Reporting
A company’s internal control over financial reporting is a process designed to provide reasonable assurance regarding the reliability of financial reporting and the preparation of financial statements for external purposes in accordance with generally accepted accounting principles. A company's internal control over financial reporting includes those policies and procedures that (1) pertain to the maintenance of records that, in reasonable detail, accurately and fairly reflect the transactions and dispositions of the assets of the company; (2) provide reasonable assurance that transactions are recorded as necessary to permit preparation of financial statements in accordance with generally accepted accounting principles, and that receipts and expenditures of the company are being made only in accordance with authorizations of management and directors of the company; and (3) provide reasonable assurance regarding prevention or timely detection of unauthorized acquisition, use, or disposition of the company's assets that could have a material effect on the financial statements.
Because of its inherent limitations, internal control over financial reporting may not prevent or detect misstatements. Also, projections of any evaluation of effectiveness to future periods are subject to the risk that controls may become inadequate because of changes in conditions, or that the degree of compliance with the policies or procedures may deteriorate.
/s/ Moss Adams LLP
Sacramento, CA
March 13, 2018
We have served as the Company’s auditor since 2005.
| 46 |
| FNB BANCORP AND SUBSIDIARY | ||||||||||||||||||||
| Consolidated Balance Sheets | ||||||||||||||||||||
| December 31, 2017 and 2016 | ||||||||||||||||||||
| Assets | ||||||||
| (Dollar amounts in thousands) | 2017 | 2016 | ||||||
| Cash and due from banks | $ | 18,353 | $ | 15,758 | ||||
| Interest-bearing time deposits with financial institutions | 130 | 205 | ||||||
| Securities available-for-sale, at fair value | 355,857 | 360,105 | ||||||
| Other equity securities | 7,567 | 7,206 | ||||||
| Loans, net of deferred loan fees and allowance for loan losses of $10,171 and $10,167 on December 31, 2017 and December 31, 2016 | 829,766 | 782,485 | ||||||
| Bank premises, equipment, and leasehold improvements, net | 9,322 | 9,837 | ||||||
| Bank owned life insurance | 16,637 | 16,247 | ||||||
| Accrued interest receivable | 5,317 | 4,942 | ||||||
| Other real estate owned, net | 3,300 | 1,427 | ||||||
| Goodwill | 4,580 | 4,580 | ||||||
| Prepaid expenses | 825 | 856 | ||||||
| Other assets | 13,584 | 15,746 | ||||||
| Total assets | $ | 1,265,238 | $ | 1,219,394 | ||||
| Liabilities and Stockholders’ Equity | ||||||||
| Deposits | ||||||||
| Demand, noninterest bearing | $ | 313,435 | $ | 296,273 | ||||
| Demand, interest bearing | 130,988 | 121,086 | ||||||
| Savings and money market | 467,788 | 487,763 | ||||||
| Time | 138,084 | 114,384 | ||||||
| Total deposits | 1,050,295 | 1,019,506 | ||||||
| Federal Home Loan Bank advances | 75,000 | 71,000 | ||||||
| Note payable | 3,750 | 4,350 | ||||||
| Accrued expenses and other liabilities | 16,913 | 14,224 | ||||||
| Total liabilities | 1,145,958 | 1,109,080 | ||||||
| Commitments and Contingencies (Note 12) | ||||||||
| Stockholders’ equity | ||||||||
| Common stock, no par value, authorized 10,000,000 shares; issued and outstanding 7,442,279 shares at December 31, 2017 and 7,280,122 shares at December 31, 2016 | 85,565 | 84,283 | ||||||
| Retained earnings | 34,654 | 27,577 | ||||||
| Accumulated other comprehensive loss, net of tax | (939 | ) | (1,546 | ) | ||||
| Total stockholders’ equity | 119,280 | 110,314 | ||||||
| Total liabilities and stockholders’ equity | $ | 1,265,238 | $ | 1,219,394 | ||||
See accompanying notes to consolidated financial statements.
| 47 |
| FNB BANCORP AND SUBSIDIARY | ||||||||||||||||||||||||||||||||||||||||||||
| Consolidated Statements of Earnings | ||||||||||||||||||||||||||||||||||||||||||||
| Years ended December 31, 2017, 2016 and 2015 | ||||||||||||||||||||||||||||||||||||||||||||
| (Dollar amounts and average shares are in thousands, except earnings per share amounts) | ||||||||||||||||||||||||||||||||||||||||||||
| 2017 | 2016 | 2015 | ||||||||||
| Interest income: | ||||||||||||
| Interest and fees on loans | $ | 41,956 | $ | 38,313 | $ | 33,235 | ||||||
| Interest and dividends on taxable securities | 5,209 | 4,213 | 3,554 | |||||||||
| Interest on tax-exempt securities | 2,927 | 2,943 | 2,454 | |||||||||
| Interest on deposits with other financial institutions | 126 | 44 | 39 | |||||||||
| Total interest income | 50,218 | 45,513 | 39,282 | |||||||||
| Interest expense: | ||||||||||||
| Interest on deposits | 2,807 | 2,780 | 2,359 | |||||||||
| Interest on FHLB advances | 850 | 67 | 9 | |||||||||
| Interest on note payable | 214 | 222 | 229 | |||||||||
| Total interest expense | 3,871 | 3,069 | 2,597 | |||||||||
| Net interest income | 46,347 | 42,444 | 36,685 | |||||||||
| (Recovery of) provision for loan losses | (360 | ) | 150 | (305 | ) | |||||||
| Net interest income after provision for (recovery of) loan losses | 46,707 | 42,294 | 36,990 | |||||||||
| Noninterest income: | ||||||||||||
| Service charges | 2,264 | 2,461 | 2,501 | |||||||||
| Net gain on sale of available-for-sale securities | 210 | 438 | 339 | |||||||||
| Earnings on bank-owned life insurance | 390 | 402 | 364 | |||||||||
| Other income | 996 | 1,294 | 1,292 | |||||||||
| Total noninterest income | 3,860 | 4,595 | 4,496 | |||||||||
| Noninterest expense: | ||||||||||||
| Salaries and employee benefits | 19,366 | 19,474 | 18,523 | |||||||||
| Occupancy expense | 2,747 | 2,528 | 2,517 | |||||||||
| Equipment expense | 1,646 | 1,765 | 1,926 | |||||||||
| Professional fees | 1,482 | 1,363 | 1,471 | |||||||||
| FDIC assessment | 400 | 600 | 600 | |||||||||
| Telephone, postage, supplies | 1,267 | 1,199 | 1,074 | |||||||||
| Advertising expense | 451 | 524 | 500 | |||||||||
| Data processing expense | 571 | 657 | 1,076 | |||||||||
| Low income housing expense | 472 | 284 | 283 | |||||||||
| Surety insurance | 349 | 347 | 381 | |||||||||
| Director expense | 288 | 288 | 288 | |||||||||
| Other real estate owned expense (recovery) | 80 | (5 | ) | 4 | ||||||||
| Other expense | 1,430 | 1,668 | 1,282 | |||||||||
| Total noninterest expense | 30,549 | 30,692 | 29,925 | |||||||||
| Earnings before provision for income taxes | 20,018 | 16,197 | 11,561 | |||||||||
| Provision for income taxes | 9,307 | 5,696 | 3,364 | |||||||||
| Net earnings | $ | 10,711 | $ | 10,501 | $ | 8,197 | ||||||
| Earnings per share available to common stockholders: | ||||||||||||
| Basic | $ | 1.46 | $ | 1.45 | $ | 1.15 | ||||||
| Diluted | $ | 1.41 | $ | 1.42 | $ | 1.12 | ||||||
| Weighted average shares outstanding: | ||||||||||||
| Basic | 7,361 | 7,233 | 7,113 | |||||||||
| Diluted | 7,607 | 7,417 | 7,314 | |||||||||
See accompanying notes to consolidated financial statements.
| 48 |
| FNB BANCORP AND SUBSIDIARY | ||||||||||
| CONSOLIDATED STATEMENTS OF COMPREHENSIVE EARNINGS |
| Years ended | ||||||||||||
| (Dollar amounts in thousands) | December 31, | |||||||||||
| 2017 | 2016 | 2015 | ||||||||||
| Net earnings | $ | 10,711 | $ | 10,501 | $ | 8,197 | ||||||
| Other comprehensive earnings (loss): | ||||||||||||
| Unrealized holding gain (loss) on available-for-sale securities net of tax (expense) benefit of ($321), $1,966, and ($120) | 755 | (2,828 | ) | 173 | ||||||||
| Reclassification adjustment for gains recognized on available-for-sale securities sold, net of tax benefit of ($62), ($179) and ($139) | (148 | ) | (259 | ) | (200 | ) | ||||||
| Total other comprehensive earnings (loss) | 607 | (3,087 | ) | (27 | ) | |||||||
| Total comprehensive earnings | $ | 11,318 | $ | 7,414 | $ | 8,170 | ||||||
See accompanying notes to consolidated financial statements.
| 49 |
| FNB BANCORP AND SUBSIDIARY | ||||||||||
| Consolidated Statement of Changes in Stockholders’ Equity | ||||||||||
| Years ended December 31, 2017, 2016 and 2015 |
| Accumulated | ||||||||||||||||||||
| (Shares and dollar amounts in thousands) | other | |||||||||||||||||||
| comprehensive | ||||||||||||||||||||
| Common stock | Retained | earnings | ||||||||||||||||||
| Shares | Amount | earnings | (loss) | Total | ||||||||||||||||
| Balance at December 31, 2014 | 6,389 | $ | 66,791 | $ | 28,729 | $ | 1,568 | $ | 97,088 | |||||||||||
| Net earnings | — | — | 8,197 | — | 8,197 | |||||||||||||||
| Other comprehensive loss | — | — | — | (27 | ) | (27 | ) | |||||||||||||
| Cash dividends declared on common stock | — | — | (2,447 | ) | — | (2,447 | ) | |||||||||||||
| Stock dividend of 5% | 324 | 6,663 | (6,663 | ) | — | — | ||||||||||||||
| Stock options exercised net of shares tendered | 100 | 924 | — | — | 924 | |||||||||||||||
| Stock-based compensation expense | — | 427 | — | — | 427 | |||||||||||||||
| Balance at December 31, 2015 | 6,813 | 74,805 | 27,816 | 1,541 | 104,162 | |||||||||||||||
| Net earnings | — | — | 10,501 | — | 10,501 | |||||||||||||||
| Other comprehensive loss | — | — | — | (3,087 | ) | (3,087 | ) | |||||||||||||
| Cash dividends declared on common stock | — | — | (2,890 | ) | — | (2,890 | ) | |||||||||||||
| Stock dividend of 5% | 347 | 7,850 | (7,850 | ) | — | — | ||||||||||||||
| Stock options exercised net of shares tendered | 120 | 1,115 | — | — | 1,115 | |||||||||||||||
| Stock-based compensation expense | — | 513 | — | — | 513 | |||||||||||||||
| Balance at December 31, 2016 | 7,280 | 84,283 | 27,577 | (1,546 | ) | 110,314 | ||||||||||||||
| Net earnings | — | — | 10,711 | — | 10,711 | |||||||||||||||
| Other comprehensive earnings | — | — | — | 607 | 607 | |||||||||||||||
| Cash dividends declared on common stock | — | — | (3,634 | ) | — | (3,634 | ) | |||||||||||||
| Stock options exercised, net of shares tendered | 162 | 864 | — | — | 864 | |||||||||||||||
| Stock-based compensation expense | — | 418 | — | — | 418 | |||||||||||||||
| Balance at December 31, 2017 | 7,442 | $ | 85,565 | $ | 34,654 | $ | (939 | ) | $ | 119,280 | ||||||||||
See accompanying notes to consolidated financial statements.
| 50 |
FNB BANCORP
AND SUBSIDIARY
Consolidated Statements of Cash Flows
Years ended December 31, 2017, 2016 and 2015
| (Dollar amounts in thousands) | ||||||||||||
| 2017 | 2016 | 2015 | ||||||||||
| Cash flows from operating activities: | ||||||||||||
| Net earnings | $ | 10,711 | $ | 10,501 | $ | 8,197 | ||||||
| Adjustments to reconcile net earnings to net cash provided by operating activities: | ||||||||||||
| Depreciation, amortization and accretion | 3,940 | 3,923 | 3,458 | |||||||||
| Gain on sale of securities available-for-sale | (210 | ) | (438 | ) | (339 | ) | ||||||
| Stock-based compensation expense | 418 | 513 | 427 | |||||||||
| Excess tax benefit from stock option exercises | (340 | ) | — | — | ||||||||
| Earnings on bank owned life insurance | (390 | ) | (402 | ) | (364 | ) | ||||||
| (Recovery of) provision for loan losses | (360 | ) | 150 | (305 | ) | |||||||
| Tax Cut and Jobs Act rate reduction | 2,987 | — | — | |||||||||
| Deferred tax expense (benefit) | (802 | ) | (1,150 | ) | (886 | ) | ||||||
| Change in net deferred loan fees | (487 | ) | (114 | ) | (133 | ) | ||||||
| Increase in accrued interest receivable | (375 | ) | (431 | ) | (473 | ) | ||||||
| Decrease in prepaid expense | 31 | 141 | 1,856 | |||||||||
| Decrease in other assets | 1,514 | 2,155 | 1,852 | |||||||||
| Increase (decrease) in accrued expenses and other liabilities | 812 | 583 | (2,414 | ) | ||||||||
| Net cash provided by operating activities | 17,449 | 15,431 | 10,876 | |||||||||
| Cash flows from investing activities: | ||||||||||||
| Proceeds from matured/called/sold securities available-for-sale | 77,210 | 76,979 | 50,247 | |||||||||
| Purchases of securities available-for-sale | (74,458 | ) | (115,541 | ) | (116,640 | ) | ||||||
| Purchases of other equity securities | (361 | ) | (458 | ) | (300 | ) | ||||||
| Acquisition, net of cash paid | — | — | (10,855 | ) | ||||||||
| Maturities of time deposits of other banks | 75 | — | 2,789 | |||||||||
| Net increase in loans | (48,251 | ) | (59,821 | ) | (45,625 | ) | ||||||
| Net investment in other real estate owned | (56 | ) | (401 | ) | (263 | ) | ||||||
| Purchases of bank premises, equipment, and leasehold improvements | (432 | ) | (687 | ) | (287 | ) | ||||||
| Net cash used in investing activities | (46,273 | ) | (99,929 | ) | (120,934 | ) | ||||||
See accompanying notes to consolidated financial statements.
| 51 |
| FNB BANCORP AND SUBSIDIARY | ||||||||||
| Consolidated Statements of Cash Flows | ||||||||||
| Years ended December 31, 2017, 2016 and 2015 |
| (Dollar amounts in thousands) | ||||||||||||
| 2017 | 2016 | 2015 | ||||||||||
| Cash flows from financing activities: | ||||||||||||
| Net increase in demand and savings deposits | $ | 7,089 | $ | 47,363 | $ | 107,422 | ||||||
| Net increase (decrease) in time deposits | 23,700 | (11,046 | ) | (6,553 | ) | |||||||
| Net advances (repayment) of FHLB borrowings | 4,000 | 54,000 | 8,000 | |||||||||
| Principal repayment on note payable | (600 | ) | (600 | ) | (600 | ) | ||||||
| Cash dividends paid on common stock | (3,634 | ) | (2,890 | ) | (1,786 | ) | ||||||
| Cash in lieu of franctional shares | — | — | (13 | ) | ||||||||
| Exercise of stock options | 864 | 1,115 | 924 | |||||||||
| Net cash provided by financing activities | 31,419 | 87,942 | 107,394 | |||||||||
| Net increase (decrease) in cash and cash equivalents | 2,595 | 3,444 | (2,664 | ) | ||||||||
| Cash and cash equivalents at beginning of year | 15,758 | 12,314 | 14,978 | |||||||||
| Cash and cash equivalents at end of year | $ | 18,353 | $ | 15,758 | $ | 12,314 | ||||||
| Additional cash flow information: | ||||||||||||
| Interest paid | $ | 3,607 | $ | 3,059 | $ | 2,543 | ||||||
| Income taxes paid | 7,875 | 6,335 | 4,737 | |||||||||
| Non-cash investing and financing activities: | ||||||||||||
| Accrued dividends | 961 | 738 | 648 | |||||||||
| Change in fair value of available-for-sale securities, net of tax effect | 607 | (3,087 | ) | (27 | ) | |||||||
| Loans transferred to other real estate owned | 1,817 | — | — | |||||||||
| Stock dividend of 5% | — | 7,850 | 6,663 | |||||||||
| Acquisition: | ||||||||||||
| Fair value of assets acquired | ||||||||||||
| Fair value of liabilities assumed | — | — | 115,119 | |||||||||
| — | — | 93,619 | ||||||||||
See accompanying notes to consolidated financial statements.
| 52 |
FNB Bancorp and Subsidiary
Notes to Consolidated Financial Statements
December 31, 2017, 2016 and 2015
| (1) | The Company and Summary of Significant Accounting Policies |
FNB Bancorp (the “Company”) is a bank holding company registered under the Bank Holding Company Act of 1956, as amended. The Company was incorporated under the laws of the State of California on February 28, 2001. The consolidated financial statements include the accounts of FNB Bancorp and its wholly-owned subsidiary, First National Bank of Northern California (the “Bank”). The Bank provides traditional banking services in San Mateo, San Francisco and Santa Clara Counties.
The preparation of consolidated financial statements in conformity with accounting principles generally accepted in the United States of America requires management to make estimates and assumptions that affect the reported amounts of assets and liabilities and the disclosure of contingent assets and liabilities at the date of the financial statements and revenue and expenses during the reporting period. Actual results could differ from those estimates. The significant accounting estimates are the allowance for loan losses, the valuation of goodwill, the valuation of the allowance for deferred tax assets and fair value determinations such as OREO and impaired loans. A summary of the significant accounting policies applied in the preparation of the accompanying consolidated financial statements follows.
On December 11, 2017, the Company’s Board of Directors signed a definitive agreement to sell FNB Bancorp and its wholly owned subsidiary, First National Bank of Northern California, in an all stock transaction, to TriCo Bancshares. The details of the definitive agreement are discussed in Note 2 – The Agreement and Plan of Merger and Reorganization.
| (a) | Basis of Presentation |
The accounting and reporting policies of the Company and its wholly-owned subsidiary are in accordance with accounting principles generally accepted in the United States of America. All intercompany balances and transactions have been eliminated.
| (b) | Cash and Cash Equivalents |
Cash and cash equivalents include cash on hand, amounts due from banks, and federal funds sold. Generally, federal funds are sold for one-day periods. The cash equivalents are readily convertible to known amounts of cash and present insignificant risk of changes in value due to original maturity dates of 90 days or less. Included in cash and cash equivalents are restricted balances at the Federal Reserve Bank of San Francisco which relate to a minimum cash reserve requirement of approximately $0 and $1,810,000 at December 31, 2017 and 2016, respectively.
| (c) | Investment Securities |
Investment securities consist of U.S. Treasury securities, U.S. agency securities, obligations of states and political subdivisions, obligations of U.S. corporations, mortgage-backed securities and other securities. At the time of purchase of a security, the Company designates the security as held-to-maturity or available-for-sale, based on its investment objectives, operational needs, and intent to hold. The Company classifies securities as held to maturity only if and when it has the positive intent and ability to hold the security to maturity. The Company does not purchase securities with the intent to engage in trading activity. Held to maturity securities are recorded at amortized cost, adjusted for amortization of premiums or accretion of discounts.
The Company did not have any investments in the held-to-maturity portfolio at December 31, 2017 or 2016. Securities available-for-sale are recorded at fair value with unrealized holding gains or losses, net of the related tax effect, reported as a separate component of stockholders’ equity until realized.
| 53 |
FNB Bancorp and Subsidiary
Notes to Consolidated Financial Statements
December 31, 2017, 2016 and 2015
An impairment charge will be recorded if the Company has the intent to sell a security that is currently in an unrealized loss position or where the Company may be required to sell a security that is currently in an unrealized loss position. A decline in the fair value of any security available-for-sale or held-to-maturity below cost that is deemed other than temporary will cause a charge to earnings to be recorded and the corresponding establishment of a new cost basis for the security. Amortization of premiums and accretion of discounts on debt securities are included in interest income over the life of the related security held-to-maturity or available-for-sale using the effective interest method. Dividend and interest income are recognized when earned. Realized gains and losses for securities classified as available-for-sale and held-to-maturity are included in earnings and are derived using the specific identification method for determining the cost of securities sold.
Investments with fair values that are less than amortized cost are considered impaired. Impairment may result from either a decline in the financial condition of the issuing entity or, in the case of fixed interest rate investments, from rising interest rates. At each consolidated financial statement date, management assesses each investment to determine if impaired investments are temporarily impaired or if the impairment is other than temporary. This assessment includes a determination of whether the Company intends to sell the security, or if it is more likely than not that the Company will be required to sell the security before recovery of its amortized cost basis less any current-period credit losses. For debt securities that are considered other than temporarily impaired and that the Company does not intend to sell and will not be required to sell prior to recovery of the amortized cost basis, the amount of impairment is separated into the amount that is credit related (credit loss component) and the amount due to all other factors. The credit loss component is recognized in earnings and is calculated as the difference between the security’s amortized cost basis and the present value of its expected future cash flows. The remaining difference between the security’s fair value and the present value of the future expected cash flows is deemed to be due to factors that are not credit related and is recognized in other comprehensive earnings.
| (d) | Derivatives |
All derivatives contracts and instruments are recognized as either assets or liabilities in the consolidated balance sheet and measured at fair value. The Company did not hold any derivative contracts at December 31, 2017 or 2016.
| (e) | Loans |
Loans are reported at the principal amount outstanding, net of deferred loan fees and the allowance for loan losses. An unearned discount on installment loans is recognized as income over the terms of the loans by the interest method. Interest on other loans is calculated by using the simple interest method on the daily balance of the principal amount outstanding. Loan fees net of certain direct costs of origination, which represent an adjustment to interest yield, are deferred and amortized over the contractual term of the loan using the interest method.
Loans on which the accrual of interest has been discontinued are designated as nonaccrual loans. Accrual of interest on loans is discontinued either when reasonable doubt exists as to the full and timely collection of interest or principal when a loan becomes contractually past due by 90 days or more with respect to interest or principal. When a loan is placed on nonaccrual status, all interest previously accrued but not collected is reversed against current period interest income. Interest accruals are resumed on such loans only when they are brought fully current with respect to interest and principal and when, in the judgment of management, the loans are estimated to be fully collectible as to both principal and interest.
| 54 |
FNB Bancorp and Subsidiary
Notes to Consolidated Financial Statements
December 31, 2017, 2016 and 2015
A loan is considered impaired if, based on current information and events, it is probable that the Company will be unable to collect the scheduled payments of principal or interest when due, according to the contractual terms of the loan agreement. An impaired loan is measured based upon the present value of future cash flows discounted at the loan’s effective rate, the loan’s observable market price, or the fair value of collateral if the loan is collateral dependent. Interest on impaired loans is recognized on a cash basis. If the measurement of the impaired loan is less than the recorded investment in the loan, an impairment is recognized by a charge to the allowance for loan losses. Large groups of smaller balance loans are collectively evaluated for impairment.
Restructured loans are loans on which concessions in terms have been granted because of the borrowers’ financial difficulties. Interest is generally accrued on such loans in accordance with the new terms, once the borrower has demonstrated a history of at least six months repayment. A loan is considered to be a troubled debt restructuring when the Company, for economic or legal reasons related to the debtor’s financial difficulties grants a concession to the debtor that makes it easier for the debtor to make their required loan payments. The concession may take the form of a temporary reduction in the interest rate or monthly payment amount due or may extend the maturity date of the loan. Other financial concessions may be agreed to as conditions warrant. Troubled debt restructured loans are accounted for as impaired loans. For an impaired loan that has been restructured, the contractual terms of the loan agreement refer to the contractual terms specified by the original loan agreement, not the contractual terms specified by the restructuring agreement.
Loans acquired in business combinations are recorded on a loan-by-loan basis at their estimated fair value. The Company uses third party valuation specialists to determine the estimated fair value on all acquired loans. The Company acquires both performing and impaired loans (loans acquired with evidence of credit quality deterioration at the time of purchase) in its acquisitions. For acquired performing loans, any discount or premium related to fair value adjustments at the time of purchase is recognized as interest income over the estimated life of the loan using the effective yield method. Loans acquired with evidence of credit quality deterioration, at the time of purchase, are accounted for under ASC 310-30 Loans and Debt Securities Acquired with Deteriorated Credit Quality (“ASC 310-30 Loans”). For ASC 310-30 loans, the excess of cash flows expected to be collected over a loan’s carrying value is considered to be the accretable yield and is recognized as interest income over the estimated life of the loan using the effective yield method. The acquisition date estimates of accretable yield may subsequently change due to changes in management’s estimates of timing and amounts of expected cash flows.
The excess of the contractual amounts due over the cash flows expected to be collected is considered to be the nonaccretable difference. The nonaccretable difference represents the Company’s estimate of the credit losses expected to occur and is considered in determining the fair value of the loans as of the acquisition date. Subsequent to the acquisition date, any increases in expected cash flows over those expected at acquisition date in excess of fair value are adjusted through an increase to the accretable yield on a prospective basis. Any subsequent decreases in cash flows attributable to credit deterioration are recognized by recording additional provision for loan losses.
| 55 |
FNB Bancorp and Subsidiary
Notes to Consolidated Financial Statements
December 31, 2017, 2016 and 2015
| (f) | Allowance for Loan Losses |
The allowance for loan losses is established through a provision for loan losses charged to expense. Loans are charged off against the allowance for loan losses when management believes that the collectability of the principal is unlikely. The allowance is an amount that management believes will be adequate to absorb probable losses inherent in existing loans, standby letters of credit, overdrafts, and commitments to extend credit based on evaluations of collectability and prior loss experience. The evaluations take into consideration such factors as changes in the nature and volume of the portfolio, overall portfolio quality, loan concentrations, specific problem loans and current and anticipated economic conditions that may affect the borrowers’ ability to pay. While management uses these evaluations to determine the level of the allowance for loan losses, future provisions may be necessary based on changes in the factors used in the evaluations. Material estimates relating to the determination of the allowance for loan losses are particularly susceptible to significant change in the near term. Management believes that the allowance for loan losses is adequate as of December 31, 2017. While management uses available information to recognize losses on loans, future additions to the allowance may be necessary based on changes in economic conditions, and our borrowers’ ability to pay. In addition, the banking regulators, as an integral part of its examination process, periodically review the Bank’s allowance for loan losses. The banking regulators may require the Bank to recognize additions to the allowance based on their judgment about information available to them at the time of their examination.
| (g) | Premises and Equipment |
Premises and equipment are reported at cost less accumulated depreciation using the straight-line method over the estimated service lives of related assets ranging from 3 to 50 years. Leasehold improvements are amortized over the estimated lives of the respective leases or the service lives of the improvements, whichever is shorter.
| (h) | Impairment of long-lived assets |
Long-lived assets are evaluated for impairment whenever events or changes in circumstances indicate that the carrying value of an asset may not be recoverable. No impairment loss was recognized in 2017 or 2016.
| (i) | Other Real Estate Owned |
Real estate properties acquired through, or in lieu of, loan foreclosure are initially recorded at the lower of the carrying amount of the loan or fair value of the property at the date of foreclosure, less anticipated selling costs. Subsequent to foreclosure, valuations are periodically performed, and any subsequent revisions in the estimate of fair value are reported as an adjustment to the carrying value of the real estate, provided the adjusted carrying amount does not exceed the original amount at foreclosure. Revenues and expenses from operations and changes in the valuation allowance are included in other operating expenses.
The Company may make loans to facilitate the sale of foreclosed real estate. Gains and losses on financed sales are recorded in accordance with the appropriate accounting standard, taking into account the buyer’s initial and continuing investment in the property, potential subordination and transfer of ownership.
| (j) | Goodwill and Other Intangible Assets |
Goodwill is recognized in a business acquisition transaction when the acquisition purchase price exceeds the fair value of identified tangible and intangible assets and liabilities. Goodwill is subsequently evaluated for possible impairment at least annually. If impairment is determined to exist, it is recorded in the period it is identified. The Company evaluated goodwill at December 31, 2017 and found no impairment.
Other intangible assets consist of core deposit and customer intangible assets that are initially recorded at fair value and subsequently amortized over their estimated useful lives, usually no longer than a seven year period.
| 56 |
FNB Bancorp and Subsidiary
Notes to Consolidated Financial Statements
December 31, 2017, 2016 and 2015
| (k) | Cash Dividends |
The Company’s ability to pay cash dividends is subject to restrictions set forth in the California General Corporation Law. Funds for payment of any cash dividends by the Company would be obtained from its investments as well as dividends and/or management fees from the Bank. The Bank’s ability to pay cash dividends is also subject to restrictions imposed under the National Bank Act and regulations promulgated by the Office of the Comptroller of the Currency.
| (l) | Stock Dividends and Stock Split |
On March 31, 2017, the Company announced that its board of directors had declared a 3 for 2 stock split aggregating approximately 2,436,057 shares. The stock split had a record date of May 5, 2017 and a payable date of May 26, 2017. On October 28, 2016, the Company announced that its Board of Directors had declared a five percent (5%) stock dividend which resulted in approximately 231,000 shares being issued, payable to investors at the rate of one share of Common Stock for every twenty (20) shares of Common Stock owned. The stock dividend was paid on December 30, 2016. The earnings per share data for all periods presented have been adjusted for the stock split and the stock dividend. Stock splits are reflected retroactively back to the earliest period presented. However, the Consolidated Statement of Changes in Stockholders’ Equity shows the historical roll forward of stock dividends declared.
| (m) | Other Income |
Other income includes the following major items for the year ended December 31:
| (Dollar amounts in thousands) | 2017 | 2016 | 2015 | |||||||||
| Dividend income-other equity securities | $ | 558 | $ | 775 | $ | 651 | ||||||
| Rental income-other real estate owned | 152 | 144 | 144 | |||||||||
| All other items | 286 | 375 | 497 | |||||||||
| Total other income | $ | 996 | $ | 1,294 | $ | 1,292 | ||||||
| (n) | Other Expense |
Other expense includes the following major items for the year ended December 31:
| (Dollar amounts in thousands) | 2017 | 2016 | 2015 | |||||||||
| Dues and memberships | $ | 176 | $ | 146 | $ | 125 | ||||||
| Real estate appraisals | 58 | 75 | 75 | |||||||||
| Training and seminars | 99 | 54 | 66 | |||||||||
| Amortization of deposit premium | 171 | 207 | 82 | |||||||||
| Card based third party fees | 113 | 104 | 96 | |||||||||
| Armored transit | 86 | 113 | 113 | |||||||||
| Regulatory assessment | 290 | 269 | 238 | |||||||||
| Operating losses | 100 | 188 | 97 | |||||||||
| All other items | 337 | 512 | 390 | |||||||||
| $ | 1,430 | $ | 1,668 | $ | 1,282 | |||||||
| 57 |
FNB Bancorp and Subsidiary
Notes to Consolidated Financial Statements
December 31, 2017, 2016 and 2015
| (o) | Income Taxes |
Deferred income taxes are determined using the asset and liability method. Under this method, net deferred tax assets and liabilities are recognized by applying current tax rates to temporary timing differences between the financial reporting and tax basis of existing assets and liabilities. Deferred tax assets and liabilities are reflected at currently enacted income tax rates applicable to the period in which the deferred tax assets or liabilities are expected to be realized or settled. A valuation allowance is established through the provision for income taxes for any deferred tax assets where the utilization of the asset is in doubt. As changes in tax laws or rates are enacted, or as significant changes are made in financial projections, deferred tax assets and liabilities are adjusted through the provision for income taxes.
On December 22, 2017, President Donald Trump signed into law the Tax Cuts and Jobs Act of 2017 (the “Act”), which reduced the federal income tax rate from 35% to 21% beginning in 2018. Pursuant to the passage of the Act, the Company has revalued our deferred assets and liabilities in accordance with the lower federal income tax rate resulting in a reduction in our net deferred tax asset and an additional income tax expense of $2,987,000 during 2017.
The Company had no unrecognized tax benefits as of December 31, 2017, 2016 and 2015, respectively. The Company recognizes interest accrued and penalties related to unrecognized tax benefits in tax expense. During the years ended December 31, 2017, 2016 and 2015, the Company believes that any penalties and interest that may exist are not material and the Company has not accrued for them.
At December 31, 2017, the Bank had a $1,358,000 net investment in five partnerships, which own low-income affordable housing projects that generate tax benefits in the form of federal and state housing tax credits. As a limited partner investor in these partnerships, the Company receives tax benefits in the form of tax deductions from partnership operating losses and federal and state income tax credits.
The federal and state income tax credits are earned over a 10-year period as a result of the investment properties meeting certain criteria and are subject to recapture for noncompliance with such criteria over a 15-year period.
The expected benefit resulting from the low-income housing tax credits is recognized in the period for which the tax benefit is recognized in the Company’s consolidated tax returns. These investments are accounted for using the historical cost method less depreciation and amortization and are recorded in other assets on the balance sheet. The Company recognizes tax credits as they are allocated and amortizes the initial cost of the investments over the period that tax credits are allocated to the Company. There is no residual value for the investment at the end of the tax credit allocation period. Cash received from operations of the limited partnership or sale of the properties, if any, will be included in earnings when realized.
| (p) | Earnings per Share |
Earnings per common share (EPS) are computed based on the weighted average number of common shares outstanding during the period. Basic EPS excludes dilution and is computed by dividing net earnings available to common stockholders by the weighted average of common shares outstanding. Diluted EPS reflects the potential dilution that could occur if securities or other contracts to issue common stock were exercised or converted into common stock. The number of potential common shares included in the quarterly diluted EPS is computed using the average market price during the three months included in the reporting period under the treasury method. In years where a stock split or stock dividend occurs, all weighted average shares reported are adjusted to reflect the stock split retroactively applied to each of the periods presented. The number of potential common shares included in year-to-date diluted EPS is a year-to-date weighted average of potential shares included in each quarterly diluted EPS computation. All common stock equivalents are anti-dilutive when a net loss occurs. A 3-for-2 stock split occurred in 2017, and a 5% stock dividend was declared in both 2016 and 2015 and therefore prior per share amounts and weighted average shares outstanding have been adjusted for the stock split and stock dividends that occurred.
| 58 |
FNB Bancorp and Subsidiary
Notes to Consolidated Financial Statements
December 31, 2017, 2016 and 2015
| (Number of shares in thousands) | 2017 | 2016 | 2015 | |||||||||
| Weighted average common shares outstanding-used in computing basic earnings per share | 7,361 | 7,233 | 7,113 | |||||||||
| Dilutive effect of stock options outstanding, using the treasury stock method | 246 | 184 | 201 | |||||||||
| Shares used in computing diluted earnings per share | 7,607 | 7,417 | 7,314 | |||||||||
| (q) | Stock Option Plans |
Measurement of the cost of stock options granted is based on the grant-date fair value of each stock option granted using the Black-Scholes valuation model. The cost is then amortized to expense on a straight-line basis over each option’s requisite service period. The amortized expense of the stock option’s fair value has been included in salaries and employee benefits expense on the consolidated statements of earnings for the three years ended December 31, 2017, 2016 and 2015. The expected term of options granted is derived from the output of the option valuation model and represents the period of time that options granted are expected to be outstanding. The risk-free rate for periods within the expected term of the option is based on the U. S. Treasury yield curve in effect at the time of the grant. Volatility was calculated using historical price changes on a monthly basis over the expected life of the option. The dividend yield was calculated using the annual projected cash dividends divided by the market value of the Company’s stock.
| (r) | Fair Values of Financial Instruments |
The accounting standards provide for a fair value measurement framework that quantifies fair value estimates by the level of pricing precision. The degree of judgment utilized in measuring the fair value of assets generally correlates to the level of pricing precision. Financial instruments rarely traded or not quoted will generally have a higher degree of judgment utilized in measuring fair value. Pricing precision is impacted by a number of factors including the type of asset or liability, the availability of the asset or liability, the market demand for the asset or liability, and other conditions that were considered at the time of the valuation.
In general, fair values determined by Level 1 inputs utilize quoted prices (unadjusted) in active markets for identical assets or liabilities that the Company has the ability to access. Level 2 inputs include quoted prices for similar assets and liabilities in active markets, and inputs other than quoted prices that are observable for the asset or liability, such as interest rates and yield curves that are observable at commonly quoted intervals. Level 3 inputs are unobservable inputs for the asset or liability, and include situations where there is little, if any, market activity for the asset or liability. In certain cases, the inputs used to measure fair value may fall into different levels of the fair value hierarchy. In such cases, the level in the fair value hierarchy within which the fair value measurement in its entirety falls has been determined based on the lowest level input that is significant to the fair value measurement in its entirety. The Company’s assessment of the significance of a particular input to the fair value measurement in its entirety requires judgment and considers factors specific to the asset or liability. Transfers between levels of the fair values hierarchy are recognized at the actual date of the event or circumstance that caused the transfer.
| 59 |
FNB Bancorp and Subsidiary
Notes to Consolidated Financial Statements
December 31, 2017, 2016 and 2015
| (s) | Bank Owned Life Insurance |
The Company purchased insurance on the lives of certain executives. The policies accumulate asset values to meet future liabilities including the payment of employee benefits such as the deferred compensation plan. Changes in the cash surrender value are recorded as other noninterest income in the consolidated statements of earnings.
| (t) | Federal Home Loan Bank Borrowings |
The Bank maintains a collateralized line of credit with the Federal Home Loan Bank (“FHLB”) of San Francisco. Under this line, the Bank may borrow on a short term or a long term (over one year) basis at the then stated interest rate. FHLB advances are recorded and carried at their historical cost. FHLB advances are not transferable and may contain prepayment penalties. In addition to the collateral pledged, the Company is required to hold prescribed amounts of FHLB stock that vary with the usage of FHLB borrowings.
| (u) | Comprehensive Earnings |
Certain changes in assets and liabilities, such as unrealized gain and losses on available-for-sale securities are reported as a separate component of the equity section of the consolidated balance sheet, such items, along with net income, are components of comprehensive income.
| (v) | Note Payable |
The Company obtained a corporate loan with a five year term, for $6,000,000, payable at $50,000 principal monthly, plus interest, and is based on the 3-month LIBOR rate plus 4%.
| (w) | Federal Home Loan Bank Stock |
Federal Home Loan Bank (FHLB) stock represents an equity interest that does not have a readily determinable fair value because its ownership is restricted and it lacks a market (liquidity). FHLB stock is recorded at cost.
| (x) | Reclassifications |
Certain prior year information has been reclassified to conform to current year presentation. The reclassifications had no impact on consolidated net earnings or retained earnings.
| (y) | Recent Accounting Pronouncements |
In May 2014, the Financial Accounting Standards Board (FASB) issued Accounting Standard Update (ASU) 2014-9, Revenue from Contracts with Customers. The core principal of ASU 2014-09 is that an entity should recognize revenue to depict the transfer of promised goods or services to customers in an amount that reflects the consideration to which the entity expects to be entitled in exchange for those goods or services. The guidance also specifies the accounting for some costs to obtain or fulfill a contract with a customer, as well as enhanced disclosure requirements. In August 2015, the FASB issued 2015-14 which deferred the effective date of ASU 2014-09 to fiscal years, and interim reporting periods within those fiscal years, beginning after December 31, 2017. In March 2016, the FASB issued ASU 2016-08 which clarified the revenue recognition implementation guidance on principal versus agent considerations and is effective during the same period as ASU 2014-09. In April 2016, The FASB issued ASU 2016-10 which clarified the revenue recognition guidance regarding the identification of performance obligations and the licensing implementation and is effective during the same period as ASU 2014-09. In May 2016, the FASB issued ASU 2016-12 which narrowly amended the revenue recognition guidance regarding collectability, noncash consideration, presentation of sales tax and transition. ASU 2016-12 is effective during the same period as ASU 2014-09.
| 60 |
FNB Bancorp and Subsidiary
Notes to Consolidated Financial Statements
December 31, 2017, 2016 and 2015
The majority of the Company’s revenue consists of net interest income on financial assets and financial liabilities, which is explicitly excluded from the scope of ASU 2014-09. The Company adopted the new standard beginning January 1, 2018. The Company completed its analysis for determining the extent ASU 2014-09 will affect its noninterest income, primarily in the area of fees and service charges on deposit accounts. Based on the analysis performed, the Company did not have a material change in timing or measurement of revenues related to noninterest income. The Company will continue to evaluate the effect that this guidance will have on other revenue steams within its scope, as well as changes in disclosures required by the new guidance. However, the Company does not expect this to have a material impact on the Company’s consolidated financial statements.
In January 2016 FASB issued ASU 2016-01, Financial Instruments-overall (subtopic 825-10) Recognition and Measurement of Financial Assets and Financial Liabilities. Before the global financial crisis that began in 2008, both the Financial Accounting Standards Board (FASB) and the International Accounting Standards Board (IASB) began a joint project to improve and to achieve convergence of their respective standards on the accounting for financial instruments. The global economic crisis further highlighted the need for improvement in the accounting models for financial instruments in today’s complex economic environment. As a result, the main objective in developing this Update is enhancing the reporting model for financial instruments to provide users of financial statements with more decision-useful information. For public business entities, the amendments in this Update address certain aspects of recognition measurement. The amendments in this Update are effective for fiscal years beginning after December 15, 2017, including interim periods within those fiscal years. The adoption of this Update is not expected to have a material impact on the Company’s consolidated financial statements.
In February 2016 FASB issued ASU 2016-02, Leases (Topic 842). The FASB is issuing this Update to increase transparency and comparability among organizations by recognizing lease assets and lease liabilities on the balance sheet and disclosing key information about leasing arrangements. The core principle of Topic 842 is that a lessee should recognize the assets and liabilities that arise from leases. All leases create an asset and a liability for the lessee in accordance with FASB Concepts Statement No. 6, Elements of Financial Statements, and, therefore, recognition of those lease assets and lease liabilities represents an improvement over previous GAAP, which did not require lease assets and lease liabilities to be recognized for most leases. ASU 2016-02 is effective for fiscal years beginning after December 15, 2018, including interim periods within those fiscal years. Although an estimate of the impact on the new leasing standard has not yet been determined, the Company expects a significant new lease asset and related liability to be recorded on the consolidated balance sheet due to the number of branch facilities that are subject to a formal Lease agreement.
In March 2016, the FASB issued ASU 2016-08, Revenue from Contracts with Customers (Topic 606); Principal versus agent considerations (reporting revenue gross versus net). The core principle of the guidance in Topic 606 is that an entity should recognize revenue to depict the transfer of promised goods or services to customers in an amount that reflects the consideration to which the entity expects to be entitled in exchange for those goods or services. The amendments in this Update do not change the core principle of the guidance. The amendments clarify the implementation guidance on principal versus agent considerations. When another party is involved in providing goods or services to a customer, an entity is required to determine whether the nature of its promise to provide the specified good or service itself (that is, the entity is a principal) or to arrange for that good or service to be provided by the other party (that is, the entity is an agent). When (or as) an entity that is a principal satisfies a performance obligation, the entity recognizes revenue in the gross amount of consideration to which it expects to be entitled in exchange for the specified good or service transferred to the customer. When (or as) an entity that is an agent satisfies a performance obligation, the entity recognizes revenue in the amount of any fee or commission to which it expects to be entitled in exchange for arranging for the specified good or service to be provided by the other party. ASU 2016-08 is effective for fiscal years beginning after December 15, 2017, including interim periods within those fiscal years. The Company has reviewed all our customer relationships in order to determine whether an agency relationship exists and if it does, whether the Company needed to change the way we recognize income related to these relationships. The Company does not believe the adoption of this ASU will have a material impact on the Company’s consolidated financial statements.
| 61 |
FNB Bancorp and Subsidiary
Notes to Consolidated Financial Statements
December 31, 2017, 2016 and 2015
In March 2016, the FASB issued ASU No. 2016-09, Compensation – Stock Compensation (Topic 718). ASU 2016-09, among other things, requires: (i) that all excess tax benefits and tax deficiencies (including tax benefits of dividends on share-based payment awards) should be recognized as income tax expense or benefit in the income statement, (ii) the tax effects of exercised or vested awards should be treated as discrete items in the reporting period in which they occur, (iii) an entity also should recognize excess tax benefits regardless of whether the benefit reduces taxes payable in the current period, (iv) excess tax benefits should be classified along with other income tax cash flows as an operating activity, (v) an entity can make an entity-wide accounting policy election to either estimate the number of awards that are expected to vest (current GAAP) or account for forfeitures when they occur, (vi) the threshold to qualify for equity classification permits withholding up to the maximum statutory tax rates in the applicable jurisdictions, and (vii) cash paid by an employer when directly withholding shares for tax withholding purposes should be classified as a financing activity. ASU 2016-09 was effective for the Company on January 1, 2017 and did not have a significant impact on the Company’s consolidated financial statements.
In June 2016 FASB issued ASU 2016-13, Financial Instruments-Credit Losses (Topic 326). Measurement of Credit Losses. The amendments in this Update require a financial asset (or a group of financial assets) measured at amortized cost to be presented at the net amount expected to be collected. The allowance for credit losses is a valuation account that is deducted from the amortized cost basis of the financial asset(s) to present the net carrying value at the amount expected to be collected on the financial asset. The income statement reflects the measurement of credit losses for newly recognized financial assets, as well as the expected increases or decreases of expected credit losses that have taken place during the period. ASU 2016-13 is effective for fiscal years beginning after December 15, 2019, including interim periods within those fiscal years. The Company is currently evaluating the impact of this ASU on the Company’s consolidated financial statements.
In August 2016, FASB issued ASU 2016-15, Statement of Cash Flows (Topic 230; Classification of Certain Cash Receipts and Cash Payments. This ASU update addresses eight cash flow classification issues related to: debt prepayment or debt extinguishment costs; settlement of zero coupon debt instruments; contingent consideration payments made after a business combination; proceeds from the payment of insurance claims; proceeds from the settlement of corporate owned life insurance policies, including bank owned life insurance policies; distributions received from equity method investees; beneficial interests in securitization transactions; and separately identifiable cash flows and application of the predominance principal. ASU 2016-15 is effective for fiscal years beginning after December 15, 2017. The adoption of this Update is not expected to have a material impact on the Company’s consolidated financial statements.
| 62 |
FNB Bancorp and Subsidiary
Notes to Consolidated Financial Statements
December 31, 2017, 2016 and 2015
In January 2017, FASB issued ASU 2017-01, Business Combinations, (Topic 805) Clarifying the Definition of a Business. The amendments are intended to provide guidance to companies in evaluating whether transactions should be accounted for as acquisitions (or disposals) of assets or businesses. The definition of a business affects many areas of accounting including acquisitions, disposals, goodwill and consolidation. The amendments are effective for annual and interim reporting periods after December 31, 2017. The Company has begun the process to implement this guidance. The guidance, is not, however, expected to have a material impact on the Company’s financial statements.
In January 2017, FASB issued ASU 2017-03, Accounting Changes and Error Corrections (Topic 250) and Investments – Equity Method and Joint Ventures (Topic 323). This ASU amends the Codification for SEC Staff Announcements made at recent Emerging Issues Task Force (EITF) meetings. The SEC staff expressed their expectations about the extent of disclosures registrant should make about the effects of the new FASB guidance as well as any amendments issued prior to adoption, or revenue (ASU 2014-09), leases (ASU 2016-02) and credit losses on financial instruments (ASU 2106-013). In accordance with SAB Topic M, Registrants are required to disclose the effect that recently issued accounting standards will have on their financial statements when adopted in a future period. In cases where a registrant cannot reasonably estimate the impact of the adoption, then additional qualitative disclosures should be considered. The amendments are effective for annual and interim periods after December 31, 2017. The adoption of this ASU in not expected to have a material impact on the Company’s consolidated financial statements.
In January 2017, FASB issued ASU 2017-04, Intangibles-Goodwill and Other (Topc350). Simplifying the Test for Goodwill Impairment. To simplify the subsequent measurement of goodwill, the Board eliminated Step 2 from the goodwill impairment test. In computing the implied fair value of goodwill under Step 2, an entity had to perform procedures to determine the fair value, at the impairment testing date, of its assets and liabilities (including unrecognized assets and liabilities) following the procedure that would be required in determining the fair value of assets acquired and liabilities assumed in a business combination. Instead, under the amendments in this Update, an entity should perform its annual, or interim, goodwill impairment testing by comparing the fair value of a reporting unit with its carrying amount. An entity should recognize an impairment charge for the amount by which the carrying amount exceeds the reporting unit’s fair value; however, the loss recognized should not exceed the total amount of goodwill allocated to that reporting unit. Additionally, an entity should consider income tax effects from any tax deductible goodwill on the carrying amount of the reporting unit when measuring the goodwill impairment loss, if applicable. The Board also eliminated the requirements for any reporting unit with a zero or negative carrying amount of net assets. An entity still has the option to perform the qualitative assessment for a reporting unit to determine if the quantitative impairment test is necessary. This Update also includes amendments to the Overview and Background Sections of the Codification (as discussed in Part II of the amendments) as part of the Board’s initiative to unify and improve the Overview and Background Sections across Topics and Subtopics. This ASU is effective for fiscal years beginning after December 15, 2019. The adoption of this Update is not expected to have a material impact on the Company’s consolidated financial statements.
In March 2017, FASB issued ASU 2017-08, Receivables – Nonrefundable Fees and Other Costs (Subtopic 310-20). Premium Amortization on Purchased Callable Debt Securities. This Update was issued in order to shorten the amortization period for certain purchased callable debt securities held at a premium to the earliest call date. This amendment does not require an accounting change for securities held at a discount; the discount continues to be amortized to maturity. Before this update was issued, previous generally accepted accounting principles (GAAP) allowed purchased premiums to be amortized as an adjustment of yield over the contractual life of the instrument.
| 63 |
FNB Bancorp and Subsidiary
Notes to Consolidated Financial Statements
December 31, 2017, 2016 and 2015
Stakeholders raised concerns that current GAAP excludes certain callable debt securities from consideration of early repayment of principal even if the holder is certain that the call will be exercised.
As a result, upon the exercise of a call on a callable debt security held at a premium, the unamortized premium is recorded as a loss in earnings. Additionally, stakeholders told the Board that there is diversity in practice (1) in the amortization period for premiums of callable debt securities and (2) in how the potential for exercise of a call is factored into current impairment assessments. Stakeholders noted that generally, in the United States, callable debt securities are quoted, priced, and traded assuming a model that incorporates consideration of calls (also referred to as “yield-to-worst” pricing). For public business entities, the amendments in this Update are effective for fiscal years, and interim periods within those fiscal years, beginning after December 15, 2018. The adoption of this Update is not expected to have a material impact on the Company’s consolidated financial statements.
In May 2017, FASB issued ASU 2017-09, Compensation – Stock Compensation (Topic 718). Scope of Modification Accounting. This update was issued in order to provide clarity regarding accounting for changes to terms and conditions of share-based payment awards. This amendment requires a company to account for the effects of a share based payment award modification unless (i) the fair value of the modified award is the same as the original award; (ii) the vesting of the modified award is the same as the original award; and (iii) the classification of the modified award as an equity instrument or a liability instrument is the same as the original award. The amendments in this Update are effective for fiscal years, and interim periods within those fiscal years, beginning after December 15, 2017. The adoption of this Update is not expected to have a material impact on the Company’s consolidated financial statements.
In July, 2017, FASB issued ASU 2017-11, Earnings Per Share (Topic 260);Distinguishing Liabilities from Equity (Topic 480); Derivatives and Hedging (Topic 815); (Part I) Accounting for Certain Financial Instruments with Down Round Features, (PartII) Replacement of the Indefinite Deferral for Mandatorily Redeemable Financial Instruments of Certain Nonpublic Entities and Certain Mandatorily Redeemable Noncontrolling Interests with a Scope Exception. This update was issued in order to provide additional clarity related to accounting for certain financial instruments that have characteristics of both liabilities and equity. In particular, this update addresses freestanding and embedded financial instruments with down round features and whether they should be treated as a liability or equity instrument. Part II of the Update addresses the accounting and disclosure requirements of mandatorily redeemable financial instruments. For public business entities, the amendments in this Update are effective for fiscal years, and interim periods within those fiscal years, beginning after December 15, 2018. The adoption of this Update is not expected to have a material impact on the Company’s consolidated financial statements.
In August 2017, FASB issued ASU 2017-12, Derivatives and Hedging (Topic 815): Targeted Improvements to Accounting for Hedging Activities. This Update was issued in order to improve the financial reporting of hedging relationships and to portray the economic results of an entity’s risk management activities in a manner that is easier to understand. For public business entities, the amendments in this Update are effective for fiscal years, and interim periods within those fiscal years, beginning after December 15, 2018. The adoption of this Update is not expected to have a material impact on the Company’s consolidated financial statements.
| 64 |
FNB Bancorp and Subsidiary
Notes to Consolidated Financial Statements
December 31, 2017, 2016 and 2015
In February 2018, FASB issued 2018-02, Income Statement – Reporting Comprehensive Income (Topic 220). The Update was issued in order to allow a reclassification from accumulated other comprehensive income to retained earnings in order to eliminate the “stranded” tax effects resulting from the federal income tax rate reduction contained in the Tax Cuts and Jobs Act that was signed into law on December 22, 2017. However, because the amendments only relate to the reclassification of the income tax effects of the Tax Cuts and Jobs Act, the underlying guidance that requires the effect of a change in tax law or rates to be included in income from continuing operations is not affected. For all business entities, the amendments in this Update are effective for fiscal years, and interim periods within those fiscal years, beginning after December 15, 2018. Early adoption for public business entities for which financial statements have not yet been issued is allowed. The adoption of this Update is expected to result in a reduction in retained earnings of approximately $165,000.
| (2) | Agreement and Plan of Merger and Reorganization |
On December 11, an Agreement and Plan of Merger and Reorganization (the “Agreement”) was entered into between FNB Bancorp and TriCo Bancshares whereby FNB Bancorp agreed to be merged with and into TriCo Bancshares, with TriCo as the surviving corporation in the merger. Immediately following the merger, First National Bank of Northern California will merge with and into Tri Counties Bank (“TriCo”), with TriCo as the surviving bank. The respective boards of both FNB Bancorp and TriCo Bancshares have approved the merger, but the merger must still receive shareholder and regulatory approval to proceed. Under the terms of the agreement, so long as the market price of TriCo Bancshares stays within prescribed limits, shareholders of FNB Bancorp will exchange each of their FNB Bancorp shares for 0.98 shares of TriCo Bancshares. The upcoming FNB Bancorp shareholder meeting where shareholders of record will be asked to vote on this merger is expected to occur in April 2018 with the merger closing date expected sometime in either May or June 2018.
| 65 |
FNB Bancorp and Subsidiary
Notes to Consolidated Financial Statements
December 31, 2017, 2016 and 2015
| (3) | Acquisition |
FNB Bancorp acquired all of the assets and liabilities of America California Bank on September 4, 2015, using the acquisition method of accounting for cash consideration of $21,500,000, and accordingly, the operating results of the acquired entities have been included in the consolidated financial statements from the date of the acquisition. On the date of the acquisition, the fair value of the assets acquired and the liabilities assumed were as follows:
| America | ||||
| California | ||||
| Bank | ||||
| September 4, | ||||
| (In thousands) | 2015 | |||
| Assets acquired: | ||||
| Cash and due from banks, net of cash paid | $ | 10,855 | ||
| Loans | 92,962 | |||
| Premises and equipment, net | 62 | |||
| Bank owned life insurance | 2,971 | |||
| Goodwill | 2,739 | |||
| Core deposit intangible | 727 | |||
| Other assets | 4,803 | |||
| Total assets acquired | $ | 115,119 | ||
| Liabilities assumed: | ||||
| Noninterest-bearing deposits | $ | 14,500 | ||
| Interest-bearing deposits | 75,626 | |||
| Other liabilities | 3,493 | |||
| Total liabilities assumed: | 93,619 | |||
| Merger consideration (all cash) | $ | 21,500 | ||
| 66 |
FNB Bancorp and Subsidiary
Notes to Consolidated Financial Statements
December 31, 2017, 2016 and 2015
| America | ||||
| California | ||||
| Bank | ||||
| September 4, | ||||
| (In thousands) | 2015 | |||
| Book value of net assets acquired from | ||||
| America California Bank | $ | 18,138 | ||
| Fair value adjstments: | ||||
| Loans | 2,171 | |||
| Core deposit intangible asset | 727 | |||
| Time deposits | (1,732 | ) | ||
| Other liabilities | (243 | ) | ||
| Total purchase accounting adjustments | 19,061 | |||
| Deferred tax liabilities | (300 | ) | ||
| Fair value of net assets acquired from America California Bank | $ | 18,761 | ||
| Merger consideration | 21,500 | |||
| Less fair value of net assets acquired | (18,761 | ) | ||
| Goodwill | $ | 2,739 | ||
As a result of this acquisition, the Company recorded $2.7 million in goodwill, which represents the excess of the total purchase price paid over the fair value of the assets acquired, net of the fair values of liabilities assumed. Goodwill reflects the expected value created through the combination of the Company and the acquired company. The entire amount of recorded goodwill in the America California Bank acquisition is expected to be deductible. In the case of the America California Bank acquisition, the Company gains greater customer relationships to the Asian community in San Francisco, we can increase the borrowing to loan customers due to higher loan borrower concentration limits, and we leverage our capital to help improve our return on equity. At December 31, 2017 and 2016, management determined that the market value of our Company exceeded our carrying value; therefore, there was no goodwill impairment. The following is a description of the methods used to determine the fair values of significant assets and liabilities at acquisition date:
Loans
As discussed in Note 1, the fair values of acquired loans are derived from the present values of the expected cash flows for Each acquired loan were projected based on contractual cash flows adjusted for expected prepayment, probability of default and expected prepayment, probability of default and expected loss given default, and principal recovery.
Prepayment rates were applied to the principal outstanding based on the type of loan acquired. Prepayments were based on a constant prepayment rate (“CPR”) applied over the life of the loan. The Company used a CPR of between 6% and 24%, depending on the characteristics of the loan acquired.
| 67 |
FNB Bancorp and Subsidiary
Notes to Consolidated Financial Statements
December 31, 2017, 2016 and 2015
Non-credit-impaired loans with similar characteristics were grouped together and were treated in the aggregate when applying the discount rate to the expected cash flows. Aggregation factors, considered included in the type of loan and related collateral, risk classification, fixed or variable interest rate, term of loan and whether or not the loan was amortizing.
Core Deposit Intangible
The core deposit intangible represents the estimated future benefits of acquired deposits and is recorded separately from the related deposits. The value of the core deposit intangible asset was determined using a discounted cash flow approach to arrive at the cost differential between the core deposits
| 2022 | ||||||||||||||||||||||||
| and | ||||||||||||||||||||||||
| In thousands | 2018 | 2019 | 2020 | 2021 | later | Total | ||||||||||||||||||
| Core deposit intangible amortization | $ | 1 | $ | 66 | $ | 45 | $ | 29 | $ | 174 | $ | 315 | ||||||||||||
Pro Forma Results of Operations
The contribution of the acquired operations of America California Bank to our results of operation for the period September 5, 2015 to December 31, 2015 is as follows: interest income of $1,889,000, interest expense of $152,000, non-interest income of $58,000, non-interest expense of $551,018, and income before taxes of $1,244,000. These amounts include acquisition-related costs, accretion or amortization of the discount or premium on the acquired loans, amortization of the fair value markup on time deposits, and core deposit intangible amortization. America California Bank’s results of operations prior to the acquisition date are not included in our operating results for 2015.
The following table presents America California Bank’s revenue and earnings included in the Company’s consolidated statement of comprehensive income for the year ended December 31, 2015 on a pro forma basis as if the acquisition date had been December 31 in the year before the pro forma year presented. This pro forma information does not necessarily reflect the results of operations that would have resulted had the acquisition been completed at the beginning of the periods presented, nor is it indicative of the results of operations in future periods.
| Pro Forma Revenue and Earnings | ||||||||
| Net | ||||||||
| (in thousands) | Revenue | Earnings | ||||||
| Actual from September 5, 2015 to December 31, 2015 for America California Bank only | $ | 1,889 | $ | 734 | ||||
| 2015 supplemental pro forma of the combined entity for the year ended December 31, 2015 | 42,749 | 9,458 | ||||||
| 68 |
FNB Bancorp and Subsidiary
Notes to Consolidated Financial Statements
December 31, 2017, 2016 and 2015
Acquisition-related expenses are recognized as incurred and continue until all systems have been converted and operational functions become fully integrated. The Bank incurred one-time third-party acquisition related expenses in the consolidated statement of comprehensive earnings during 2015 as follows:
| December 31, | ||||
| (in thousands) | 2015 | |||
| Data processing expense | $ | 515 | ||
| Occupancy expense | 342 | |||
| Surety insurance | 35 | |||
| Equipment expense | 2 | |||
| Total | $ | 894 | ||
| (4) | Restricted Cash Balance |
Cash and due from banks includes balances with the Federal Reserve Bank of San Francisco (the FRB). The Bank is required to maintain specified minimum average balances with the FRB, based primarily upon the Bank’s deposit balances. As of December 31, 2017, and 2016, the Bank maintained deposits in excess of the FRB reserve requirement, which was $0 and $1,810,000, respectively.
| 69 |
FNB Bancorp and Subsidiary
Notes to Consolidated Financial Statements
December 31, 2017, 2016 and 2015
| (5) | Securities Available-for-Sale |
The amortized cost and fair values of securities available-for-sale are as follows:
| (Dollar amounts in thousands) | Amortized | Unrealized | Unrealized | Fair | ||||||||||||
| cost | gains | losses | value | |||||||||||||
| December 31, 2017: | ||||||||||||||||
| U.S. Treasury securities | $ | 1,989 | $ | — | $ | (14 | ) | $ | 1,975 | |||||||
| Obligations of U.S. government agencies | 42,247 | 10 | (434 | ) | 41,823 | |||||||||||
| Mortgage-backed securities | 121,087 | 421 | (1,716 | ) | 119,792 | |||||||||||
| Asset-backed securities | 3,734 | — | (48 | ) | 3,686 | |||||||||||
| Obligations of states and political subdivisions | 150,724 | 1,325 | (946 | ) | 151,103 | |||||||||||
| Corporate debt | 37,409 | 199 | (130 | ) | 37,478 | |||||||||||
| $ | 357,190 | $ | 1,955 | $ | (3,288 | ) | $ | 355,857 | ||||||||
| December 31, 2016: | ||||||||||||||||
| U.S. Treasury securities | $ | 977 | $ | 10 | $ | — | $ | 987 | ||||||||
| Obligations of U.S. government agencies | 60,773 | 112 | (340 | ) | 60,545 | |||||||||||
| Mortgage-backed securities | 85,709 | 397 | (1,822 | ) | 84,284 | |||||||||||
| Obligations of states and political subdivisions | 151,988 | 1,458 | (1,828 | ) | 151,618 | |||||||||||
| Corporate debt | 63,277 | 121 | (727 | ) | 62,671 | |||||||||||
| $ | 362,724 | $ | 2,098 | $ | (4,717 | ) | $ | 360,105 | ||||||||
At December 31, 2017, there were 65 securities in an unrealized loss position for greater than 12 consecutive months, and 135 securities in an unrealized loss position for under 12 months. At December 31, 2016, there were no securities in an unrealized loss position for greater than 12 consecutive months, and 227 securities in an unrealized loss position for under 12 months. Management periodically evaluates each security in an unrealized loss position to determine if the impairment is temporary or other-than-temporary. Management has determined that no investment security is other-than-temporarily impaired at December 31, 2017 and 2016. The unrealized losses are due solely to interest rate changes, and the Company does not intend to sell nor expects it will be required to sell investment securities identified with impairments resulting from interest rate declines prior to the earliest of forecasted recovery or the maturity of the underlying investment security.
| 70 |
FNB Bancorp and Subsidiary
Notes to Consolidated Financial Statements
December 31, 2017, 2016 and 2015
| Total | < 12 Months | Total | 12 Months or > | Total | Total | |||||||||||||||||||
| December 31, 2017: | Fair | Unrealized | Fair | Unrealized | Fair | Unrealized | ||||||||||||||||||
| (Dollar amounts in thousands) | Value | Losses | Value | Losses | Value | Losses | ||||||||||||||||||
| U. S. Treasury securities | $ | 1,975 | $ | (14 | ) | $ | — | $ | — | $ | 1,975 | $ | (14 | ) | ||||||||||
| Obligations of U.S. government agencies | 22,364 | (195 | ) | 16,461 | (236 | ) | 38,825 | (434 | ) | |||||||||||||||
| Mortgage-backed securities | 46,515 | (424 | ) | 38,003 | (1,292 | ) | 84,518 | (1,716 | ) | |||||||||||||||
| Asset-backed securities | 3,685 | (48 | ) | — | — | 3,685 | (48 | ) | ||||||||||||||||
| Obligations of states and political subdivisions | 46,919 | (460 | ) | 15,243 | (486 | ) | 62,162 | (946 | ) | |||||||||||||||
| Corporate debt | 13,255 | (112 | ) | 1,982 | (18 | ) | 15,237 | (130 | ) | |||||||||||||||
| Total | $ | 134,713 | $ | (1,253 | ) | $ | 71,689 | $ | (2,032 | ) | $ | 206,402 | $ | (3,288 | ) | |||||||||
| Total | < 12 Months | Total | 12 Months or > | Total | Total | |||||||||||||||||||
| December 31, 2016: | Fair | Unrealized | Fair | Unrealized | Fair | Unrealized | ||||||||||||||||||
| (Dollar amounts in thousands) | Value | Losses | Value | Losses | Value | Losses | ||||||||||||||||||
| U. S. Treasury securities | $ | — | $ | — | $ | — | $ | — | $ | — | $ | — | ||||||||||||
| Obligations of U.S. government agencies | 36,828 | (340 | ) | — | — | 36,828 | (340 | ) | ||||||||||||||||
| Mortgage-backed securities | 67,990 | (1,822 | ) | — | — | 67,990 | (1,822 | ) | ||||||||||||||||
| Obligations of states and political subdivisions | 84,728 | (1,828 | ) | — | — | 84,728 | (1,828 | ) | ||||||||||||||||
| Corporate debt | 41,012 | (727 | ) | — | — | 41,012 | (727 | ) | ||||||||||||||||
| Total | $ | 230,558 | $ | (4,717 | ) | $ | — | $ | — | $ | 230,558 | $ | (4,717 | ) | ||||||||||
| 71 |
FNB Bancorp and Subsidiary
Notes to Consolidated Financial Statements
December 31, 2017, 2016 and 2015
The amortized cost and fair value of debt securities as of December 31, 2017, by contractual maturity, are shown below. Expected maturities may differ from contractual maturities because borrowers may have the right to call or prepay obligations with or without call or prepayment penalties.
| Amortized | Fair | |||||||
| (Dollar amounts in thousands) | Cost | Value | ||||||
| Available for sale: | ||||||||
| Due in one year or less | $ | 12,653 | $ | 12,647 | ||||
| Due after one year through five years | 190,357 | 190,119 | ||||||
| Due after five years through ten years | 96,147 | 95,999 | ||||||
| Due after ten year | 58,033 | 57,092 | ||||||
| $ | 357,190 | $ | 355,857 | |||||
At December 31, 2017 and 2016, securities with an amortized cost of $131,613,000 and $116,240,000, and fair value of $130,546,000 and $115,315,000, respectively, were pledged as collateral for public deposits and for other purposes required by law.
During the years ended December 31, 2107, 2016, and 2015 there were no investment securities that were sold for a loss. The investment securities sold totaled $34,056,000, $43,647,000 and $16,017,000 resulting in a pretax gain on sale of $210,000, $438,000 and $339,000 for the twelve months ended December 31, 2017, 2016, and 2016, respectively.
The following table summarizes Other Equity Securities Outstanding:
| (Dollar amounts in thousands) | December 31, | December 31, | ||||||
| Equity Securities | 2017 | 2016 | ||||||
| Federal Home Loan Bank stock | $ | 5,969 | $ | 5,613 | ||||
| Federal Reserve Bank stock | 1,273 | 1,268 | ||||||
| Pacific Coast Bankers Bank stock | 145 | 145 | ||||||
| Texas Independent Bank stock | 176 | 176 | ||||||
| Community Bank of the Bay stock | 4 | 4 | ||||||
| Totals | $ | 7,567 | $ | 7,206 | ||||
These investments are carried at cost and evaluated periodically for impairment. Federal Home Loan Bank and FRB stock can be redeemed at par by the government agencies. These securities cannot be sold to other investors. Management reviews the financial statements, credit rating and other pertinent financial information of these entities to determine if impairment has occurred. So long as there is sufficient evidence to support the ability of these entities to continue to redeem their stock, management believes these securities are not impaired.
| 72 |
FNB Bancorp and Subsidiary
Notes to Consolidated Financial Statements
December 31, 2017, 2016 and 2015
| (6) | Loans |
Loans are summarized as follows at December 31:
| Total | ||||||||||||||||
| FNB | Balance | |||||||||||||||
| Bancorp | December 31, | |||||||||||||||
| (Dollar amounts in thousands) | Originated | PNCI | PCI | 2017 | ||||||||||||
| Commercial real estate | $ | 401,157 | $ | 55,835 | $ | — | $ | 456,992 | ||||||||
| Real estate construction | 35,206 | — | — | 35,206 | ||||||||||||
| Real estate multi-family | 91,642 | 13,496 | — | 105,138 | ||||||||||||
| Real estate 1 to 4 family | 160,425 | 13,051 | — | 173,476 | ||||||||||||
| Commercial & industrial | 52,270 | 3,457 | — | 55,727 | ||||||||||||
| Consumer loans | 14,057 | — | — | 14,057 | ||||||||||||
| Gross loans | 754,757 | 85,839 | — | 840,596 | ||||||||||||
| Net deferred loan fees | (659 | ) | — | — | (659 | ) | ||||||||||
| Allowance for loan losses | (10,171 | ) | — | — | (10,171 | ) | ||||||||||
| Net loans | $ | 743,927 | $ | 85,839 | $ | — | $ | 829,766 | ||||||||
| Total | ||||||||||||||||
| FNB | Balance | |||||||||||||||
| Bancorp | December 31, | |||||||||||||||
| (Dollar amounts in thousands) | Originated | PNCI | PCI | 2016 | ||||||||||||
| Commercial real estate | 351,261 | 68,736 | 1,225 | 421,222 | ||||||||||||
| Real estate construction | 43,683 | — | — | 43,683 | ||||||||||||
| Real estate multi-family | 90,763 | 15,200 | — | 105,963 | ||||||||||||
| Real estate 1 to 4 family | 153,843 | 16,680 | — | 170,523 | ||||||||||||
| Commercial & industrial | 40,140 | 8,734 | — | 48,874 | ||||||||||||
| Consumer loans | 3,533 | — | — | 3,533 | ||||||||||||
| Gross loans | 683,223 | 109,350 | 1,225 | 793,798 | ||||||||||||
| Net deferred loan fees | (1,142 | ) | — | — | (1,146 | ) | ||||||||||
| Allowance for loan losses | (10,167 | ) | — | — | (10,167 | ) | ||||||||||
| Net loans | 671,914 | 109,350 | 1,225 | 782,485 | ||||||||||||
Note: PNCI means Purchased, Not Credit Impaired. PCI means Purchased, Credit Impaired. These designations are assigned to the purchased loans on their date of purchase. Once the loan designation has been made, each loan will retain its designation for the life of the loan.
| 73 |
FNB Bancorp and Subsidiary
Notes to Consolidated Financial Statements
December 31, 2017, 2016 and 2015
Commercial Real Estate Loans
Commercial Real Estate loans consist of loans secured by non-farm, non-residential properties, including, but not limited to industrial, hotel, assisted care, retail, office and mixed use buildings. Our commercial real estate loans are made primarily to investors or small businesses where our primary source of repayment is from cash flows generated by the properties, either through rent collection or business profits. The borrower’s promissory notes are secured with recorded liens on the underlying property. The borrowers would normally also be required to personally guarantee repayment of the loan. The Bank uses conservative underwriting standards in reviewing applications for credit. Generally, our borrowers have multiple sources of income, so if cash flow generated from the property declines, at least in the short term, the borrowers can normally cover these short term cash flow deficiencies from their available cash reserves. Risk of loss to the Bank is increased when there are cash flow decreases sufficiently large and for such a prolonged period of time that loan payments can no longer be made by the borrowers.
Real Estate Construction Loans
Our real estate construction loans are generally made to borrowers who are rehabilitating a building, converting a building use from one type of use to another, or developing land and building residential or commercial structures for sale or lease.
The borrower’s promissory notes are secured with recorded liens on the underlying property. The borrowers would normally also be required to personally guarantee repayment of the loan. The Bank uses conservative underwriting standards in reviewing applications for credit. Generally, our borrowers have sufficient resources to make the required construction loan payments during the construction and absorption or lease-up period.
After construction is complete, the loans are normally paid off from proceeds from the sale of the building or through a refinance to a commercial real estate loan. Risk of loss to the Bank is increased when there are material construction cost overruns, significant delays in the time to complete the project and/or there has been a material drop in the value of the projects in the marketplace since the inception of the loan.
Real Estate – Multi-Family
Our multi-family commercial real estate loans are secured by multi-family properties located primarily in San Mateo and San Francisco Counties. These loans are made to investors where the primary source of loan repayment is from cash flows generated by the properties, through rent collections. The borrowers’ promissory notes are secured with recorded liens on the underlying properties. The borrowers would normally also be required to personally guarantee repayment of the loans. The Bank uses conservative underwriting standards in reviewing applications for credit. Generally, our borrowers have multiple sources of income, so if cash flow generated from the property declines, at least in the short term, the borrowers can normally cover these short term cash flow deficiencies from their available cash reserves. Risk of loss to the Bank is increased when there are cash flow decreases sufficiently large and for such a prolonged period of time that loan payments can no longer be made by the borrowers.
Real Estate-1 to 4 family Loans
Our residential real estate loans are generally made to borrowers who are buying or refinancing their primary personal residence or a rental property of 1-4 single family residential units. The Bank uses conservative underwriting standards in reviewing applications for credit. Risk of loss to the Bank is increased when borrowers lose their primary source of income and/or property values decline significantly.
| 74 |
FNB Bancorp and Subsidiary
Notes to Consolidated Financial Statements
December 31, 2017, 2016 and 2015
Commercial and Industrial Loans
Our commercial and industrial loans are generally made to small businesses to provide them with at least some of the working capital necessary to fund their daily business operations. These loans are generally either unsecured or secured by fixed assets, accounts receivable and/or inventory. The borrowers would normally also be required to personally guarantee repayment of the loan. The Bank uses conservative underwriting standards in reviewing applications for credit. Risk of loss to the Bank is increased when our small business customers experience a significant business downturn, incur significant financial losses, or file for relief from creditors through bankruptcy proceedings.
Consumer Loans
Our consumer and installment loans generally consist of personal loans, credit card loans, automobile loans or other loans secured by personal property. The Bank uses conservative underwriting standards in reviewing applications for credit. Risk of loss to the Bank is increased when borrowers lose their primary source of income, or file for relief from creditors through bankruptcy proceedings.
| Recorded Investment in Loans at December 31, 2017 | ||||||||||||||||||||||||||||
| Real | Real | |||||||||||||||||||||||||||
| Estate | Estate | |||||||||||||||||||||||||||
| Commercial | Real Estate | Multi | 1 to 4 | Commercial | ||||||||||||||||||||||||
| (Dollar amounts in thousands) | Real Estate | Construction | family | family | & industrial | Consumer | Total | |||||||||||||||||||||
| Loans: | ||||||||||||||||||||||||||||
| Ending balance | $ | 456,992 | $ | 35,206 | $ | 105,138 | $ | 173,476 | $ | 55,727 | $ | 14,057 | $ | 840,596 | ||||||||||||||
| Ending
balance: individually evaluated for impairment | $ | 6,530 | $ | 814 | $ | — | $ | 2,750 | $ | 860 | $ | — | $ | 10,954 | ||||||||||||||
| Ending
balance: collectively evaluated for impairment | $ | 450,462 | $ | 34,392 | $ | 105,138 | $ | 170,726 | $ | 54,867 | $ | 14,057 | $ | 829,642 | ||||||||||||||
| 75 |
FNB Bancorp and Subsidiary
Notes
to Consolidated Financial Statements
December 31, 2017, 2016 and 2015
| Recorded Investment in Loans at December 31, 2016 | ||||||||||||||||||||||||||||
| Real | Real | |||||||||||||||||||||||||||
| Estate | Estate | |||||||||||||||||||||||||||
| Commercial | Real Estate | Multi | 1 to 4 | Commercial | ||||||||||||||||||||||||
| (Dollar amounts in thousands) | Real Estate | Construction | family | family | & industrial | Consumer | Total | |||||||||||||||||||||
| Loans: | ||||||||||||||||||||||||||||
| Ending balance | $ | 421,222 | $ | 43,683 | $ | 105,963 | $ | 170,523 | $ | 48,874 | $ | 3,533 | $ | 793,798 | ||||||||||||||
| Ending
balance: individually evaluated for impairment | $ | 10,023 | $ | 843 | $ | — | $ | 3,530 | $ | 1,065 | $ | — | $ | 15,461 | ||||||||||||||
| Ending
balance: collectively evaluated for impairment | $ | 411,199 | $ | 42,840 | $ | 105,963 | $ | 166,993 | $ | 47,809 | $ | 3,533 | $ | 778,337 | ||||||||||||||
| Recorded Investment in Loans at December 31, 2015 | ||||||||||||||||||||||||||||
| Real | Real | |||||||||||||||||||||||||||
| Estate | Estate | |||||||||||||||||||||||||||
| Commercial | Real Estate | Multi | 1 to 4 | Commercial | ||||||||||||||||||||||||
| (Dollar amounts in thousands) | Real Estate | Construction | family | family | & industrial | Consumer | Total | |||||||||||||||||||||
| Loans: | ||||||||||||||||||||||||||||
| Ending balance | $ | 399,993 | $ | 44,816 | $ | 63,597 | $ | 171,964 | $ | 52,033 | $ | 1,574 | $ | 733,977 | ||||||||||||||
| Ending
balance: individually evaluated for impairment | $ | 11,292 | $ | 2,154 | $ | — | $ | 4,218 | $ | 1,782 | $ | — | $ | 19,446 | ||||||||||||||
| Ending
balance: collectively evaluated for impairment | $ | 388,701 | $ | 42,662 | $ | 63,597 | $ | 167,746 | $ | 50,251 | $ | 1,574 | $ | 714,531 | ||||||||||||||
| 76 |
FNB Bancorp and Subsidiary
Notes to Consolidated Financial Statements
December 31, 2017, 2016 and 2015
A summary of impaired loans, the related allowance for loan losses, average investment and income recognized on impaired loans follows. The following tables include originated and purchased non-credit impaired loans.
| Impaired Loans | ||||||||||||||||||||
| As of and for the year ended December 31, 2017 | ||||||||||||||||||||
| Unpaid | Average | |||||||||||||||||||
| Recorded | Principal | Related | Recorded | Income | ||||||||||||||||
| (Dollar amounts in thousands) | Investment | Balance | Allowance | Investment | Recognized | |||||||||||||||
| With no related allowance recorded | ||||||||||||||||||||
| Commercial real estate | $ | 5,785 | $ | 5,785 | $ | — | $ | 8,317 | $ | 212 | ||||||||||
| Commercial real estate construction | — | — | — | 520 | 22 | |||||||||||||||
| Real estate multi-family | — | — | — | 764 | 12 | |||||||||||||||
| Residential- 1 to 4 family | 464 | 464 | — | 561 | 21 | |||||||||||||||
| Commercial and industrial | 115 | 115 | — | 117 | 7 | |||||||||||||||
| Consumer | — | — | — | — | — | |||||||||||||||
| Total | 6,364 | 6,364 | — | 10,279 | 274 | |||||||||||||||
| With an allowance recorded | ||||||||||||||||||||
| Commercial real estate | $ | 745 | $ | 745 | $ | 15 | $ | 2,294 | $ | 72 | ||||||||||
| Commercial real estate construction | 814 | 814 | 4 | 556 | 52 | |||||||||||||||
| Residential- 1 to 4 family | 2,286 | 2,286 | 318 | 1,503 | 69 | |||||||||||||||
| Commercial and industrial | 745 | 745 | 72 | 841 | — | |||||||||||||||
| Consumer | — | — | — | — | — | |||||||||||||||
| Total | 4,590 | 4,590 | 409 | 5,194 | 193 | |||||||||||||||
| Total | ||||||||||||||||||||
| Commercial real estate | $ | 4,182 | $ | 4,182 | $ | 15 | $ | 10,611 | $ | 284 | ||||||||||
| Commercial real estate construction | 814 | 814 | 4 | 556 | 74 | |||||||||||||||
| Real estate multi-family | — | — | — | 764 | 12 | |||||||||||||||
| Residential- 1 to 4 family | 2,750 | 2,750 | 318 | 2,064 | 90 | |||||||||||||||
| Commercial and industrial | 860 | 860 | 72 | 958 | 7 | |||||||||||||||
| Consumer | — | — | — | — | — | |||||||||||||||
| $ | 10,954 | $ | 10,954 | $ | 409 | 14,953 | $ | 467 | ||||||||||||
| 77 |
FNB Bancorp and Subsidiary
Notes to Consolidated Financial Statements
December 31, 2017, 2016 and 2015
| Impaired Loans | ||||||||||||||||||||
| As of and for the year ended December 31, 2016 | ||||||||||||||||||||
| Unpaid | Average | |||||||||||||||||||
| Recorded | Principal | Related | Recorded | Income | ||||||||||||||||
| (Dollar amounts in thousands) | Investment | Balance | Allowance | Investment | Recognized | |||||||||||||||
| With no related allowance recorded | ||||||||||||||||||||
| Commercial real estate | $ | 8,516 | $ | 9,026 | $ | — | $ | 9,730 | $ | 716 | ||||||||||
| Commercial real estate construction | 843 | 843 | — | 857 | 53 | |||||||||||||||
| Residential- 1 to 4 family | 678 | 678 | — | 685 | — | |||||||||||||||
| Commercial and industrial | 120 | 120 | — | 322 | 25 | |||||||||||||||
| Total | 10,157 | 10,667 | — | 11,594 | 794 | |||||||||||||||
| With an allowance recorded | ||||||||||||||||||||
| Commercial real estate | $ | 1,507 | $ | 1,507 | $ | 50 | $ | 1,528 | $ | 89 | ||||||||||
| Residential- 1 to 4 family | 2,852 | 2,852 | 442 | 3,202 | 157 | |||||||||||||||
| Commercial and industrial | 945 | 945 | 96 | 1,240 | 1 | |||||||||||||||
| Total | 5,304 | 5,304 | 588 | 5,970 | 247 | |||||||||||||||
| Total | ||||||||||||||||||||
| Commercial real estate | $ | 10,023 | $ | 10,533 | $ | 50 | $ | 11,258 | $ | 805 | ||||||||||
| Commercial real estate construction | 843 | 843 | — | 857 | 53 | |||||||||||||||
| Residential- 1 to 4 family | 3,530 | 3,530 | 442 | 3,887 | 157 | |||||||||||||||
| Commercial and industrial | 1,065 | 1,065 | 96 | 1,562 | 26 | |||||||||||||||
| $ | 15,461 | $ | 15,971 | $ | 588 | $ | 17,564 | $ | 1,041 | |||||||||||
| 78 |
FNB Bancorp and Subsidiary
Notes to Consolidated Financial Statements
December 31, 2017, 2016 and 2015
| Impaired Loans | ||||||||||||||||||||
| As of and for the year ended December 31, 2015 | ||||||||||||||||||||
| Unpaid | Average | |||||||||||||||||||
| Recorded | Principal | Related | Recorded | Income | ||||||||||||||||
| (Dollar amounts in thousands) | Investment | Balance | Allowance | Investment | Recognized | |||||||||||||||
| With no related allowance recorded | ||||||||||||||||||||
| Commercial real estate | $ | 8,169 | $ | 9,271 | $ | — | $ | 8,379 | $ | 282 | ||||||||||
| Commercial real estate construction | 2,154 | 2,337 | — | 2,264 | 130 | |||||||||||||||
| Residential- 1 to 4 family | 457 | 457 | — | 460 | 36 | |||||||||||||||
| Commercial and industrial | 524 | 524 | — | 731 | 27 | |||||||||||||||
| Total | 11,304 | 12,589 | — | 11,834 | 475 | |||||||||||||||
| With an allowance recorded | ||||||||||||||||||||
| Commercial real estate | $ | 2,634 | $ | 2,638 | $ | 96 | $ | 2,664 | $ | 160 | ||||||||||
| Residential- 1 to 4 family | 3,761 | 3,782 | 479 | 3,786 | 149 | |||||||||||||||
| Commercial and industrial | 1,258 | 1,497 | 182 | 1,484 | 7 | |||||||||||||||
| Total | 7,653 | 7,917 | 757 | 7,934 | 316 | |||||||||||||||
| Total | ||||||||||||||||||||
| Commercial real estate | $ | 10,803 | $ | 11,909 | $ | 96 | $ | 11,043 | $ | 442 | ||||||||||
| Commercial real estate construction | 2,154 | 2,337 | — | 2,264 | 130 | |||||||||||||||
| Residential- 1 to 4 family | 4,218 | 4,239 | 479 | 4,246 | 185 | |||||||||||||||
| Commercial and industrial | 1,782 | 2,021 | 182 | 2,215 | 34 | |||||||||||||||
| $ | 18,957 | $ | 20,506 | $ | 757 | $ | 19,768 | $ | 791 | |||||||||||
There has been no additional impairment recognized on previous credit impairment loans subsequent to acquisition. Not all impaired loans are in a nonaccrual status. The majority of the difference between impaired loans and nonaccrual loans represents loans that are restructured and performing under modified loan agreements, and where principal and interest is considered to be collectible.
| 79 |
FNB Bancorp and Subsidiary
Notes to Consolidated Financial Statements
December 31, 2017, 2016 and 2015
The following is a summary of non-accrual loans outstanding as of December 31, 2107 and 2016:
| Loans on Nonaccrual Status as of | ||||||||
| (Dollar amounts in thousands) | December 31, | December 31, | ||||||
| 2017 | 2016 | |||||||
| Commercial real estate | $ | 731 | $ | 5,553 | ||||
| Real estate 1 to 4 family | 464 | 149 | ||||||
| Commercial & industrial | 745 | 945 | ||||||
| Total | $ | 1,940 | $ | 6,647 | ||||
Interest income on impaired loans of $374,000, $1,041,000 and $791,000 was recognized based upon cash payments received in 2017, 2016, and 2015, respectively. The amount of interest on impaired loans not collected in 2017, 2016 and 2015, was $6,000, $569,000 and $460,000, respectively. The cumulative amount of unpaid interest on impaired loans was $22,000, $3,973,000 and $3,405,000 at December 31, 2017, 2016 and 2015, respectively.
The following is a summary of the total outstanding principal of troubled debt restructurings as of December 31, 2017 and 2016:
| Total troubled debt restructurings outstanding at year end | ||||||||||||||||||||||||
| (dollars in thousands) | December 31, 2017 | December 31, 2016 | ||||||||||||||||||||||
| Non- | Non- | |||||||||||||||||||||||
| Accrual | accrual | Total | Accrual | accrual | Total | |||||||||||||||||||
| status | status | modifications | status | status | modifications | |||||||||||||||||||
| Commercial real estate | $ | 3,451 | $ | 646 | 4,097 | $ | 4,466 | $ | 4,494 | 8,960 | ||||||||||||||
| Real estate construction | — | — | — | — | — | — | ||||||||||||||||||
| Real estate 1 to 4 family | 2,286 | $ | 464 | 2,750 | 3,381 | — | 3,381 | |||||||||||||||||
| Commercial & industrial | 115 | 746 | 861 | 120 | 902 | 1,022 | ||||||||||||||||||
| Total | $ | 5,852 | $ | 1,856 | $ | 7,708 | $ | 7,967 | $ | 5,396 | $ | 13,363 | ||||||||||||
| Modifications | ||||||||||||
| For the Year Ended December 31, 2017 | ||||||||||||
| Pre- | Post- | |||||||||||
| Modification | Modification | |||||||||||
| Outstanding | Outstanding | |||||||||||
| Number of | Recorded | Recorded | ||||||||||
| Contracts | Investment | Investment | ||||||||||
| (Dollar amounts in thousands) | ||||||||||||
| Commercial real estate | 1 | $ | 646 | $ | 646 | |||||||
| Total | 1 | $ | 646 | $ | 646 | |||||||
| 80 |
FNB Bancorp and Subsidiary
Notes to Consolidated Financial Statements
December 31, 2017, 2016 and 2015
| Modifications | ||||||||||||
| For the Year Ended December 31, 2016 | ||||||||||||
| Pre- | Post- | |||||||||||
| Modification | Modification | |||||||||||
| Outstanding | Outstanding | |||||||||||
| Number of | Recorded | Recorded | ||||||||||
| Contracts | Investment | Investment | ||||||||||
| (Dollar amounts in thousands) | ||||||||||||
| Commercial real estate | 2 | $ | 3,527 | $ | 3,527 | |||||||
| Total | 2 | $ | 3,527 | $ | 3,527 | |||||||
| Modifications | ||||||||||||
| For the Year Ended December 31, 2015 | ||||||||||||
| Pre- | Post- | |||||||||||
| Modification | Modification | |||||||||||
| Outstanding | Outstanding | |||||||||||
| Number of | Recorded | Recorded | ||||||||||
| Contracts | Investment | Investment | ||||||||||
| (Dollar amounts in thousands) | ||||||||||||
| Commercial real estate | 1 | $ | 472 | $ | 472 | |||||||
| Total | 1 | $ | 472 | $ | 472 | |||||||
During the years ended December 31, 2017, 2016 and 2015, no loans defaulted within twelve months following the date of restructure. All restructurings were a modification of interest rate and/or payment. There were no principal reductions granted.
| 81 |
FNB Bancorp and Subsidiary
Notes to Consolidated Financial Statements
December 31, 2017, 2016 and 2015
| Allowance for Credit Losses | ||||||||||||||
| As of and For the Year Ended December 31, 2017 |
| (Dollar amounts in thousands) | Real | Real | ||||||||||||||||||||||||||
| Estate | Estate | |||||||||||||||||||||||||||
| Commercial | Real Estate | Multi | 1 to 4 | Commercial | ||||||||||||||||||||||||
| Real estate | Construction | family | family | & industrial | Consumer | Total | ||||||||||||||||||||||
| Allowance for credit losses | ||||||||||||||||||||||||||||
| Beginning balance | $ | 6,392 | $ | 617 | $ | 389 | $ | 2,082 | $ | 650 | $ | 37 | $ | 10,167 | ||||||||||||||
| Charge-offs | (91 | ) | — | — | — | (39 | ) | (8 | ) | (138 | ) | |||||||||||||||||
| Recoveries | 8 | — | — | 175 | 319 | — | 502 | |||||||||||||||||||||
| (Recovery of) / provision for loan losses | (814 | ) | (229 | ) | 1,107 | (249 | ) | (490 | ) | 315 | (360 | ) | ||||||||||||||||
| Ending balance | $ | 5,495 | $ | 388 | $ | 1,496 | $ | 2,008 | $ | 440 | $ | 344 | $ | 10,171 | ||||||||||||||
| Ending
balance: individually evaluated for impairment | $ | 15 | $ | 4 | $ | — | $ | 318 | $ | 72 | $ | — | $ | 409 | ||||||||||||||
| Ending
balance: collectively evaluated for impairment | $ | 5,480 | $ | 384 | $ | 1,496 | $ | 1,690 | $ | 368 | $ | 344 | $ | 9,762 | ||||||||||||||
| 82 |
FNB Bancorp and Subsidiary
Notes to Consolidated Financial Statements
December 31, 2017, 2016 and 2015
| Allowance for Credit Losses | ||||||||||||||||||||||||||||
| As of and For the Year Ended December 31, 2016 | ||||||||||||||||||||||||||||
| (Dollar amounts in thousands) | Real | Real | ||||||||||||||||||||||||||
| Estate | Estate | |||||||||||||||||||||||||||
| Commercial | Real Estate | Multi | 1 to 4 | Commercial | ||||||||||||||||||||||||
| Real estate | Construction | family | family | & industrial | Consumer | Total | ||||||||||||||||||||||
| Allowance for credit losses | ||||||||||||||||||||||||||||
| Beginning balance | $ | 6,059 | $ | 589 | $ | 243 | $ | 2,176 | $ | 853 | $ | 50 | $ | 9,970 | ||||||||||||||
| Charge-offs | — | — | — | (36 | ) | (164 | ) | (18 | ) | (218 | ) | |||||||||||||||||
| Recoveries | 8 | — | — | 53 | 204 | — | 265 | |||||||||||||||||||||
| Provision for / (recovery of) loan losses | 325 | 28 | 146 | (111 | ) | (243 | ) | 5 | 150 | |||||||||||||||||||
| Ending balance | $ | 6,392 | $ | 617 | $ | 389 | $ | 2,082 | $ | 650 | $ | 37 | $ | 10,167 | ||||||||||||||
| Ending balance: individually evaluated for impairment | $ | 50 | $ | — | $ | — | $ | 442 | $ | 96 | $ | — | $ | 588 | ||||||||||||||
| Ending balance: collectively evaluated for impairment | $ | 6,342 | $ | 617 | $ | 389 | $ | 1,640 | $ | 554 | $ | 37 | $ | 9,579 | ||||||||||||||
| 83 |
FNB Bancorp and Subsidiary
Notes to Consolidated Financial Statements
December 31, 2017, 2016 and 2015
| Allowance for Credit Losses | ||||||||||||||||||||||||||||
| As of and For the Year Ended December 31, 2015 | ||||||||||||||||||||||||||||
| (Dollar amounts in thousands) | Real | Real | ||||||||||||||||||||||||||
| Estate | Estate | |||||||||||||||||||||||||||
| Commercial | Real Estate | Multi | 1 to 4 | Commercial | ||||||||||||||||||||||||
| Real estate | Construction | family | family | & industrial | Consumer | Total | ||||||||||||||||||||||
| Allowance for credit losses | ||||||||||||||||||||||||||||
| Beginning balance | $ | 5,549 | $ | 849 | $ | 206 | $ | 1,965 | $ | 1,073 | $ | 58 | $ | 9,700 | ||||||||||||||
| Charge-offs | — | — | — | (45 | ) | — | (36 | ) | (81 | ) | ||||||||||||||||||
| Recoveries | 576 | — | — | 15 | 60 | 5 | 656 | |||||||||||||||||||||
| (Recovery of) / provision for loan losses | (66 | ) | (260 | ) | 37 | 241 | (280 | ) | 23 | (305 | ) | |||||||||||||||||
| Ending balance | $ | 6,059 | $ | 589 | $ | 243 | $ | 2,176 | $ | 853 | $ | 50 | $ | 9,970 | ||||||||||||||
| Ending balance: individually evaluated for impairment | $ | 96 | $ | — | $ | — | $ | 479 | $ | 182 | $ | — | $ | 757 | ||||||||||||||
| Ending balance: collectively evaluated for impairment | $ | 5,963 | $ | 589 | $ | 243 | $ | 1,697 | $ | 671 | $ | 50 | $ | 9,213 | ||||||||||||||
| 84 |
FNB Bancorp and Subsidiary
Notes to Consolidated Financial Statements
December 31, 2017, 2016 and 2015
The following is a summary of the aging analysis of loans outstanding at December 31, 2017 and 2016:
| Age Analysis of Past Due Loans | ||||||||||||||||||||||||
| As of December 31, 2017 | ||||||||||||||||||||||||
| (Dollar amounts in thousands) | ||||||||||||||||||||||||
| 30-59 | 60-89 | |||||||||||||||||||||||
| Days | Days | Over | Total | |||||||||||||||||||||
| Past | Past | 90 | Past | Total | ||||||||||||||||||||
| Originated | Due | Due | Days | Due | Current | Loans | ||||||||||||||||||
| Commercial real estate | $ | 989 | $ | 597 | $ | — | $ | 1,586 | $ | 399,571 | $ | 401,157 | ||||||||||||
| Real estate construction | — | — | — | — | 35,206 | 35,206 | ||||||||||||||||||
| Real estate multi family | — | 2,348 | — | 2,348 | 89,294 | 91,642 | ||||||||||||||||||
| Real estate 1 to 4 family | 1,603 | 1,082 | 464 | 3,149 | 157,276 | 160,425 | ||||||||||||||||||
| Commercial & industrial | 69 | 250 | 745 | 1,064 | 51,206 | 52,270 | ||||||||||||||||||
| Consumer | 52 | — | — | 52 | 14,005 | 14,057 | ||||||||||||||||||
| $ | 2,713 | $ | 4,277 | $ | 1,209 | $ | 8,199 | $ | 746,558 | $ | 754,757 | |||||||||||||
| Purchased | ||||||||||||||||||||||||
| Not credit impaired | ||||||||||||||||||||||||
| Commercial real estate | $ | — | $ | 85 | $ | — | $ | 85 | $ | 55,750 | $ | 55,835 | ||||||||||||
| Real estate multi-family | — | — | — | — | 13,496 | 13,496 | ||||||||||||||||||
| Real estate 1 to 4 family | — | — | — | — | 13,051 | 13,051 | ||||||||||||||||||
| Commercial & industrial | — | — | — | — | 3,457 | 3,457 | ||||||||||||||||||
| Total | $ | — | $ | 85 | $ | — | $ | 85 | $ | 85,754 | $ | 85,839 | ||||||||||||
| Purchased | ||||||||||||||||||||||||
| Credit impaired | ||||||||||||||||||||||||
| Commercial real estate | $ | — | $ | — | $ | — | $ | — | $ | — | $ | — | ||||||||||||
| Real estate construction | — | — | — | — | — | — | ||||||||||||||||||
| Real estate multi-family | — | — | — | — | — | — | ||||||||||||||||||
| Real estate 1 to 4 family | — | — | — | — | — | — | ||||||||||||||||||
| Commercial & industrial | — | — | — | — | — | — | ||||||||||||||||||
| Total | $ | — | $ | — | $ | — | $ | — | $ | — | $ | — | ||||||||||||
| 85 |
FNB Bancorp and Subsidiary
Notes to Consolidated Financial Statements
December 31, 2017, 2016 and 2015
| Age Analysis of Past Due Loans | ||||||||||||||||||||||||
| As of December 31, 2016 | ||||||||||||||||||||||||
| (Dollar amounts in thousands) | ||||||||||||||||||||||||
| 30-59 | 60-89 | |||||||||||||||||||||||
| Days | Days | Over | Total | |||||||||||||||||||||
| Past | Past | 90 | Past | Total | ||||||||||||||||||||
| Originated | Due | Due | Days | Due | Current | Loans | ||||||||||||||||||
| Commercial real estate | $ | 835 | $ | 2 | $ | — | $ | 837 | $ | 350,424 | $ | 351,261 | ||||||||||||
| Real estate construction | 645 | — | — | 645 | 43,038 | 43,683 | ||||||||||||||||||
| Real estate multi family | — | — | — | — | 90,763 | 90,763 | ||||||||||||||||||
| Real estate 1 to 4 family | 1,365 | 61 | 74 | 1,500 | 152,343 | 153,843 | ||||||||||||||||||
| Commercial & industrial | 241 | — | 945 | 1,186 | 38,954 | 40,140 | ||||||||||||||||||
| Consumer | — | — | — | — | 3,533 | 3,533 | ||||||||||||||||||
| $ | 3,086 | $ | 63 | $ | 1,019 | $ | 4,168 | $ | 679,055 | $ | 683,223 | |||||||||||||
| Purchased | ||||||||||||||||||||||||
| Not credit impaired | ||||||||||||||||||||||||
| Commercial real estate | $ | 1,869 | $ | 1,909 | 550 | 4,328 | 64,408 | 68,736 | ||||||||||||||||
| Real estate multi-family | — | — | — | — | 15,200 | 15,200 | ||||||||||||||||||
| Real estate 1 to 4 family | — | — | 75 | 75 | 16,605 | 16,680 | ||||||||||||||||||
| Commercial & industrial | 285 | — | — | 285 | 8,449 | 8,734 | ||||||||||||||||||
| Total | $ | 2,154 | $ | 1,909 | $ | 625 | $ | 4,688 | $ | 104,662 | $ | 109,350 | ||||||||||||
| Purchased | ||||||||||||||||||||||||
| Credit impaired | ||||||||||||||||||||||||
| Commercial real estate | $ | — | $ | — | $ | — | $ | — | $ | 1,225 | $ | 1,225 | ||||||||||||
| Real estate construction | — | — | — | — | — | — | ||||||||||||||||||
| Real estate multi-family | — | — | — | — | — | — | ||||||||||||||||||
| Real estate 1 to 4 family | — | — | — | — | — | — | ||||||||||||||||||
| Commercial & industrial | — | — | — | — | — | — | ||||||||||||||||||
| Total | $ | — | $ | — | $ | — | $ | — | $ | 1,225 | $ | 1,225 | ||||||||||||
| 86 |
FNB Bancorp and Subsidiary
Notes to Consolidated Financial Statements
December 31, 2017, 2016 and 2015
Risk rating system
Loans to borrowers graded as pass or pooled loans represent loans to borrowers of acceptable or better credit quality. They demonstrate sound financial positions, repayment capacity and credit history. They have an identifiable and stable source of repayment.
Special mention loans have potential weaknesses that deserve management’s attention. If left uncorrected these potential weaknesses may result in a deterioration of the repayment prospects for the asset or in the Bank’s credit position at some future date. These assets are “not adversely classified” and do not expose the Bank to sufficient risk to warrant adverse classification.
Substandard loans are inadequately protected by current sound net worth, paying capacity of the borrower, or pledged collateral. Loans are normally classified as Substandard when there are unsatisfactory characteristics causing more than acceptable levels of risk. A substandard loan normally has one or more well-defined weakness that could jeopardize the repayment of the debt. For example, a) cash flow deficiency, which may jeopardize future payments; b) sale of non-collateral assets has become primary source of repayment; c) the borrower is bankrupt; or d) for any other reason, future repayment is dependent on court action.
Doubtful loans represent credits with weakness inherent in the Substandard classification and where collection or liquidation in full is highly questionable. To be classified Doubtful, there must be specific pending factors which prevent the Loan Review Officer from determining the amount of loss contained in the credit. When the amount of loss can be reasonably estimated, that amount is classified as “loss” and the remainder is classified as Substandard.
| 87 |
FNB Bancorp and Subsidiary
Notes to Consolidated Financial Statements
December 31, 2017, 2016 and 2015
The following is a summary of the credit quality indicators in the loan portfolio as of December 31, 2017 and 2016:
| Credit Quality Indicators | ||||||||||||||||||||
| As of December 31, 2017 | ||||||||||||||||||||
| (Dollar amounts in thousands) | Special | Sub- | Total | |||||||||||||||||
| Originated | Pass | mention | standard | Doubtful | loans | |||||||||||||||
| Commercial real estate | $ | 397,311 | $ | — | $ | 3,846 | $ | — | $ | 401,157 | ||||||||||
| Real estate construction | 34,392 | — | 814 | — | 35,206 | |||||||||||||||
| Real estate multi-family | 91,642 | — | — | — | 91,642 | |||||||||||||||
| Real estate 1 to 4 family | 159,881 | — | 544 | — | 160,425 | |||||||||||||||
| Commercial & industrial | 51,968 | — | 302 | — | 52,270 | |||||||||||||||
| Consumer loans | 14,057 | — | — | — | 14,057 | |||||||||||||||
| Totals | $ | 749,251 | $ | — | $ | 5,506 | $ | — | $ | 754,757 | ||||||||||
| Purchased | ||||||||||||||||||||
| Not credit impaired | ||||||||||||||||||||
| Commercial real estate | $ | 53,656 | $ | 873 | $ | 1,306 | $ | — | $ | 55,835 | ||||||||||
| Real estate multi-family | 13,496 | — | — | — | 13,496 | |||||||||||||||
| Real estate 1 to 4 family | 13,051 | — | — | — | 13,051 | |||||||||||||||
| Commercial & industrial | 3,457 | — | — | — | 3,457 | |||||||||||||||
| Total | $ | 83,660 | $ | 873 | $ | 1,306 | $ | — | $ | 85,839 | ||||||||||
| Purchased | ||||||||||||||||||||
| Credit impaired | ||||||||||||||||||||
| Commercial real estate | $ | — | ||||||||||||||||||
| Total | $ | — | ||||||||||||||||||
| 88 |
FNB Bancorp and Subsidiary
Notes to Consolidated Financial Statements
December 31, 2017, 2016 and 2015
| Credit Quality Indicators | ||||||||||||||||||||
| As of December 31, 2016 | ||||||||||||||||||||
| (Dollar amounts in thousands) | Special | Sub- | Total | |||||||||||||||||
| Originated | Pass | mention | standard | Doubtful | loans | |||||||||||||||
| Commercial real estate | $ | 348,785 | $ | 902 | $ | 1,574 | $ | — | $ | 351,261 | ||||||||||
| Real estate construction | 42,840 | — | 843 | — | 43,683 | |||||||||||||||
| Real estate multi-family | 90,763 | — | — | — | 90,763 | |||||||||||||||
| Real estate 1 to 4 family | 153,769 | — | 74 | — | 153,843 | |||||||||||||||
| Commercial & industrial | 39,752 | — | 384 | 4 | 40,140 | |||||||||||||||
| Consumer loans | 3,533 | — | — | — | 3,533 | |||||||||||||||
| Totals | $ | 679,442 | $ | 902 | $ | 2,875 | $ | 4 | $ | 683,223 | ||||||||||
| Purchased | ||||||||||||||||||||
| Not credit impaired | ||||||||||||||||||||
| Commercial real estate | $ | 61,705 | $ | — | $ | 7,031 | $ | — | $ | 68,736 | ||||||||||
| Real estate multi-family | 15,200 | — | — | — | 15,200 | |||||||||||||||
| Real estate 1 to 4 family | 16,605 | — | 75 | — | 16,680 | |||||||||||||||
| Commercial & industrial | 8,644 | — | 90 | — | 8,734 | |||||||||||||||
| Total | $ | 102,154 | $ | — | $ | 7,196 | $ | — | $ | 109,350 | ||||||||||
| Purchased | ||||||||||||||||||||
| Credit impaired | ||||||||||||||||||||
| Commercial real estate | $ | 1,225 | ||||||||||||||||||
| Total | $ | 1,225 | ||||||||||||||||||
Purchased credit impaired loans are not included in the Company’s risk-rated methodology
| 89 |
FNB Bancorp and Subsidiary
Notes to Consolidated Financial Statements
December 31, 2017, 2016 and 2015
| (7) | Other Real Estate Owned |
A summary of the activity in the balance of foreclosed assets follows:
| Year ended December 31, | ||||||||||||
| (Dollar amounts in thousands) | 2017 | 2016 | 2015 | |||||||||
| Beginning foreclosed asset balance, net | $ | 1,427 | $ | 1,026 | $ | 763 | ||||||
| Additions/transfers from loans | 1,817 | — | — | |||||||||
| Capitalized expenditures | 56 | 401 | 263 | |||||||||
| Disposition/sales | — | — | — | |||||||||
| Valuation adjustments | — | — | — | |||||||||
| Ending foreclosed asset balance, net | $ | 3,300 | $ | 1,427 | $ | 1,026 | ||||||
| Ending valuation allowance | — | — | — | |||||||||
| Ending number of foreclosed properties | 2 | 2 | 1 | |||||||||
| Proceeds from sale of foreclosed properties | — | — | — | |||||||||
| Loans to finance sale of foreclosed properties | — | — | — | |||||||||
| Gain on sale of foreclosed properties | — | — | — | |||||||||
At December 31, 2017, there were two properties reported in other real estate owned. The first property was a commercial building located at 416 Browning Way, South San Francisco, California that had a net book balance of $1,483,000, $1,427,000 and $1,026,000 as of December 31, 2017, 2016 and 2015, respectively. This commercial property has toxic issues related to soil and water contamination related to the property’s use by previous owners. The building is fully leased on a triple net lease and the market value of the building, supported by appraisal and other market data, is greater than the net book value of the property. Remediation efforts to date include, but are not limited to, removal of contaminated soil around the building down to the water table, water detoxification treatments, drilling of water monitoring wells, obtaining air samples inside the building, and engaging in ongoing discussions with the San Francisco Bay Regional Water Quality Control Board (the “Water Board”) with the stated objective of obtaining a final approved remediation plan. The Bank has engaged a soil engineering and consulting company consultant to provide cost estimates related to the final clean-up costs that are expected to be incurred as part of any final remediation plan that would be acceptable to the Water Board. Those costs, along with reimbursable costs incurred by the Water Board, are expected to total approximately $725,000, but could vary depending on the extent of final remediation requirements and the time required to complete them. The Bank developed this cost estimate based on advice from its soil engineering expert and consulting company consultant and over six years of coordinated remediation efforts with the Water Board. The second property is an elderly care facility located in Lafayette, California that was acquired in November 2017 and has a net book balance of $1,817,000.
Subsequent to December 31, 2017, the other real estate owned property located at 416 Browning Way, South San Francisco, California was sold subject to a purchase and sale agreement between the Bank and the buyer of the property. Please see Note 23 – Subsequent Event for additional information.
| 90 |
FNB Bancorp and Subsidiary
Notes to Consolidated Financial Statements
December 31, 2017, 2016 and 2015
| (8) | Related Party Transactions |
In the ordinary course of business, the Bank made loans and advances under lines of credit to directors, officers, and their related interests. The Bank’s policies require that all such loans be made at substantially the same terms as those prevailing at the time for comparable transactions with unrelated parties and do not involve more than normal risk or unfavorable features. The following summarizes activities of loans to such parties at December 31:
| (Dollar amounts in thousands) | 2017 | 2016 | ||||||
| Balance, beginning of year | $ | 6,397 | $ | 3,988 | ||||
| Additions | 4,093 | 2,474 | ||||||
| Repayments | (678 | ) | (65 | ) | ||||
| Balance, end of year | $ | 9,812 | $ | 6,397 | ||||
| 2017 | 2016 | |||||||
| Related party deposits | $ | 3,670 | $ | 3,316 | ||||
| 91 |
FNB Bancorp and Subsidiary
Notes to Consolidated Financial Statements
December 31, 2017, 2016 and 2015
| (9) | Bank Premises, Equipment, and Leasehold Improvements |
Bank premises, equipment and leasehold improvements are stated at cost, less accumulated depreciation and amortization, and are summarized as follows at December 31:
| (Dollar amounts in thousands) | 2017 | 2016 | ||||||
| Buildings | $ | 10,087 | $ | 10,099 | ||||
| Equipment & furniture | 8,767 | 8,803 | ||||||
| Leasehold improvements | 1,428 | 1,496 | ||||||
| 20,282 | 20,398 | |||||||
| Accumulated depreciation and amortization | (15,702 | ) | (15,275 | ) | ||||
| 4,580 | 5,123 | |||||||
| Land | 4,742 | 4,714 | ||||||
| $ | 9,322 | $ | 9,837 | |||||
Depreciation and amortization expense for the years ended December 31, 2017, 2016, and 2015 were $947,000, $1,051,000, and $1,098,000, respectively.
| (10) | Deposits |
The aggregate amount of time certificates, each with a minimum denomination of $250,000 or more, was $63,678,000 and $46,553,000 at December 31, 2017 and 2016, respectively.
At December 31, 2017, the scheduled maturities of all time certificates of deposit are as follows:
| (Dollar amounts in thousands) | ||||||||||||
| Year ending December 31: | Under | $250,000 | ||||||||||
| $ | 250,000 | or more | Total | |||||||||
| 2018 | $ | 47,906 | $ | 49,908 | $ | 97,814 | ||||||
| 2019 | 20,423 | 12,461 | 32,884 | |||||||||
| 2020 | 4,944 | 1,309 | 6,253 | |||||||||
| 2021 | 967 | — | 967 | |||||||||
| 2022 | 166 | — | 166 | |||||||||
| $ | 74,406 | $ | 63,678 | $ | 138,084 | |||||||
| 92 |
FNB Bancorp and Subsidiary
Notes to Consolidated Financial Statements
December 31, 2017, 2016 and 2015
| (11) | Federal Home Loan Bank Advances |
| As of December 31, 2017 | As of December 31, 2016 | |||||||||||||||||||||||
| Maturity | Interest | Amount | Maturity | Interest | Amount | |||||||||||||||||||
| (Dollar amounts in thousands) | Date | Rate | Outstanding | Date | Rate | Outstanding | ||||||||||||||||||
| FHLB Overnight Advance | — | $ | — | 01/03/17 | 0.61 | % | $ | 10,000 | ||||||||||||||||
| FHLB Term Advance | — | — | 01/05/17 | 0.55 | % | 7,000 | ||||||||||||||||||
| FHLB Term Advance | 01/02/18 | 1.35 | % | 15,000 | 01/09/17 | 0.49 | % | 7,000 | ||||||||||||||||
| FHLB Term Advance | 01/04/18 | 1.39 | % | 10,000 | 01/27/17 | 0.63 | % | 11,000 | ||||||||||||||||
| FHLB Term Advance | 01/22/18 | 1.49 | % | 10,000 | 01/30/17 | 0.63 | % | 6,000 | ||||||||||||||||
| FHLB Term Advance | 01/29/18 | 1.49 | % | 20,000 | 01/30/17 | 0.61 | % | 10,000 | ||||||||||||||||
| FHLB Term Advance | 01/29/18 | 1.49 | % | 20,000 | 02/28/17 | 0.67 | % | 20,000 | ||||||||||||||||
| Totals | $ | 75,000 | $ | 71,000 | ||||||||||||||||||||
At December 31, 2017, the Bank had a maximum borrowing capacity under Federal Home Loan Bank advances of $508,861,000 of which $433,861,000 was available. The Federal Home Loan Bank advances are secured by a blanket collateral agreement pledge of FHLB stock and certain other qualifying collateral, such as commercial and mortgage loans. Interest rates are at the prevailing rate when advances are made.
| (12) | Commitments and Contingencies |
Operating Lease Commitments
The Bank leases a portion of its facilities and equipment under non-cancelable operating leases expiring at various dates through 2024. Some of these leases provide that the Bank pay taxes, maintenance, insurance, and other occupancy expenses applicable to leased premises.
The minimum rental commitments under the operating leases as of December 31, 2017 are as follows:
| (Dollars in thousands) | ||||
| 2018 | $ | 1,150 | ||
| 2019 | 895 | |||
| 2020 | 806 | |||
| 2021 | 806 | |||
| 2022 | 806 | |||
| Thereafter | 528 | |||
| $ | 4,991 | |||
Total rent expense for operating leases was $1,121,000, $1,127,000 and $1,092,000, in 2017, 2016, and 2015, respectively.
Legal Commitments
The Bank is engaged in various lawsuits either as plaintiff or defendant in the ordinary course of business and, in the opinion of management, based upon the advice of counsel, the ultimate outcome of these lawsuits does not expect to have a material effect on the Bank’s financial condition or results of operations.
| 93 |
FNB Bancorp and Subsidiary
Notes to Consolidated Financial Statements
December 31, 2017, 2016 and 2015
| (13) | Salary Deferral 401(k) Plan |
The Company maintains a salary deferral 401(k) plan covering substantially all employees, known as the FNB Bancorp Savings Plan (the “Plan”). The Plan allows employees to make contributions to the Plan up to a maximum allowed by law, and the Company’s contribution is discretionary. Beginning in 2008, the Board approved a safe harbor election related to the Plan which requires the Company to contribute 3% of qualifying employees’ wages as a profit sharing contribution. The Bank’s accrued contribution to the Plan on the safe harbor basis for the years ended December 31, 2017, 2016, and 2015 was $366,000, $375,000, and $355,000, respectively.
| (14) | Salary Continuation and Deferred Compensation Plans |
The Company maintains Salary Continuation Agreements for certain Executive officers. Executives participating in the Salary Continuation Plan are entitled to receive a monthly payment for a period of twenty years beginning six months after their retirement. The Company accrues the present value of such post-retirement benefits over the individual’s employment period. The Salary Continuation Plan expense for the years ended December 31, 2017, 2016, and 2015 was $1,838,000, $1,860,000 and $1,786,000, respectively. Accrued compensation payable under the salary continuation plan totaled $8,270,000 and $6,659,000 at December 31, 2017 and 2016, respectively. All salary continuation agreements are fully vested and accrued for as of December 31, 2017.
Beginning January 1, 2015 and for all subsequent periods the Company elected to utilize straight line service cost amortization accounting. In December 2015, the current executive officers of the Bank and the Company’s Board of Directors agreed to amend and restate the salary agreements. The effect of these agreed upon amendments and restatements was to reduce the remaining time to retirement which accelerated the vesting and increased the service cost component of the Salary Continuation Agreement expense. Expense recognition was recorded using a straight line service cost amortization method. There was no change in benefit payment amounts recorded in 2017, 2016 or 2015.
The Deferred Compensation Plan allows eligible officers to defer annually their compensation up to a maximum 80% of their base salary and 100% of their cash bonus. The officers are entitled to receive distributions upon reaching a specified age, passage of at least five years or termination of employment. As of December 31, 2017 and 2016, the related liability included in accrued expenses and other liabilities on the consolidated balance sheets was $3,131,000 and $1,790,000, respectively.
| 94 |
FNB Bancorp and Subsidiary
Notes to Consolidated Financial Statements
December 31, 2017, 2016 and 2015
| (15) | Income Taxes |
The provision (benefit) for income taxes for the years ended December 31, consists of the following:
| (Dollar amounts in thousands) | 2017 | 2016 | 2015 | |||||||||
| Current: | ||||||||||||
| Federal | $ | 4,991 | $ | 4,597 | $ | 2,929 | ||||||
| State | 2,131 | 2,249 | 1,321 | |||||||||
| $ | 7,122 | $ | 6,846 | $ | 4,250 | |||||||
| Deferred: | ||||||||||||
| Federal | $ | 2,782 | $ | (808 | ) | $ | (158 | ) | ||||
| State | (597 | ) | (342 | ) | (728 | ) | ||||||
| 2,185 | (1,150 | ) | (886 | ) | ||||||||
| Total provision for taxes | $ | 9,307 | $ | 5,696 | $ | 3,364 | ||||||
The reason for the differences between the statutory federal income tax rate and the effective tax rates for the years ending December 31, are summarized as follows:
| 2017 | 2016 | 2015 | ||||||||||
| Statutory rates | 35.0 | % | 35.0 | % | 34.0 | % | ||||||
| Increase (decrease) resulting from: | ||||||||||||
| Tax exempt Income for federal purposes | -5.1 | % | -7.1 | % | -8.2 | % | ||||||
| State taxes on income, net of federal benefit | 5.0 | % | 7.8 | % | 3.4 | % | ||||||
| Benefits from low income housing credits | -1.3 | % | -1.6 | % | -2.3 | % | ||||||
| Stock based compensation | -0.9 | % | 1.7 | % | 2.0 | % | ||||||
| Tax Cut and Jobs Act rate reduction | 14.9 | % | -% | -% | ||||||||
| Other, net | -0.6 | % | -0.6 | % | 0.2 | % | ||||||
| Effective tax rate | 47.0 | % | 35.2 | % | 29.1 | % | ||||||
| 95 |
FNB Bancorp and Subsidiary
Notes to Consolidated Financial Statements
December 31, 2017, 2016 and 2015
The tax effects of temporary differences giving rise to the Company’s net deferred tax asset are as follows:
| December 31, | ||||||||||||
| (Dollar amounts in thousands) | 2017 | 2016 | 2015 | |||||||||
| Deferred tax assets | ||||||||||||
| Allowance for loan losses | $ | 3,295 | $ | 4,661 | $ | 4,470 | ||||||
| Accrued salaries and officers compensation | 3,130 | 3,717 | 2,770 | |||||||||
| Expenses accrued on books, not yet deductible in tax return | 1,236 | 1,908 | 1,766 | |||||||||
| Depreciation | 254 | 388 | 399 | |||||||||
| Net operating loss carryforward | 824 | 1,069 | 1,335 | |||||||||
| Acquisition accounting differences | 141 | 325 | — | |||||||||
| Unrealized depreciation on available-for-sale securities | 394 | 1,074 | — | |||||||||
| 9,274 | 13,142 | 10,740 | ||||||||||
| Deferred tax liabilities | ||||||||||||
| Unrealized appreciation on available-for-sale securities | $ | — | $ | — | $ | 1,075 | ||||||
| State income taxes | 713 | 1,156 | 1,070 | |||||||||
| Core deposit intangible | 109 | 236 | 323 | |||||||||
| Expenses and credits deducted on tax return, not on books | 314 | 933 | 754 | |||||||||
| Total deferred tax liabilities | 1,136 | 2,325 | 3,222 | |||||||||
| Net deferred tax assets (included in other assets) | $ | 8,138 | $ | 10,817 | $ | 7,518 | ||||||
As of December 31, 2017, management believes that it is more likely than not that the deferred tax assets will be realized through recovery of taxes previously paid and/or future taxable income. In assessing the Company’s ability to realize the tax benefits of deferred tax assets, management considers whether it is more likely than not that some portion or all of the deferred tax assets will be realized. The ultimate realization of deferred tax assets is dependent upon the generation of future taxable income during the periods in which those temporary differences become deductible. Management considers the scheduled reversal of deferred tax liabilities, projected future taxable income, and tax planning strategies in making this assessment. Based upon the level of historical taxable income and projections for future taxable income over the periods which the deferred tax assets are deductible, management believes it is more likely than not that the Company will realize the recorded benefits of these deductible differences.
On December 22, 2017, President Donald Trump signed into law the Tax Cuts and Jobs Act (the “Act”), which among other things reduced the federal corporate income tax rate to 21% effective January 1, 2018. As a result, the Company has concluded that this Act caused a reduction in the net deferred tax asset and an increase in the income tax expense of the Company of approximately $3 million, as of December 31, 2017, due to the revaluation of the Company’s net timing differences at the lower statutory income tax rate.
| 96 |
FNB Bancorp and Subsidiary
Notes to Consolidated Financial Statements
December 31, 2017, 2016 and 2015
| (16) | Financial Instruments |
The Bank is a party to financial instruments with off-balance-sheet risk in the normal course of business. These financial instruments include commitments to extend credit in the form of loans or through standby letters of credit. These instruments involve, to varying degrees, elements of credit and interest-rate risk in excess of the amount recognized in the balance sheet. The Bank’s exposure to credit loss is represented by the contractual amount of those instruments and is usually limited to amounts funded or drawn. The contract or notional amounts of these agreements, which are not included in the balance sheets, are an indicator of the Bank’s credit exposure. Commitments to extend credit generally carry variable interest rates and are subject to the same credit standards used in the lending process for on-balance-sheet instruments. Additionally, the Bank periodically reassesses the customer’s creditworthiness through ongoing credit reviews. The Bank generally requires collateral or other security to support commitments to extend credit. The following table provides summary information on financial instruments whose contract amounts represent credit risk as of December 31:
| (Dollars amounts in thousands) | December 31 | |||||||
| 2017 | 2016 | |||||||
| Financial instruments whose contract amounts represent credit risk: | ||||||||
| Lines of credit | $ | 131,737 | $ | 103,316 | ||||
| Other Commercial Commitments: | ||||||||
| Undisbursed loan commitments | 45,718 | 59,249 | ||||||
| Mastercard/Visa lines | 5,754 | 5,696 | ||||||
| Standby Letters of credit | 5,286 | 4,995 | ||||||
| $ | 188,495 | $ | 173,256 | |||||
Commitments to extend credit are agreements to lend to a customer as long as there is no violation of any condition established in the contract. Commitments generally have fixed expiration dates or other termination clauses and may require payment of a fee. Since many of the commitments are expected to expire without being drawn upon, the total commitment amounts do not necessarily represent future cash requirements. The Bank evaluates each customer’s creditworthiness on a case-by-case basis, following normal lending policies. The amount of collateral obtained, if deemed necessary by the Bank upon extension of credit, is based on management’s credit evaluation. Collateral held varies, but may include accounts receivable, inventory, property, plant and equipment, and income-producing commercial and residential properties. Equity reserves and unused credit card lines are additional commitments to extend credit. Many of these customers are not expected to draw down their total lines of credit, and therefore, the total contract amount of these lines does not necessarily represent future cash requirements. Standby letters of credit are conditional commitments issued by the Bank to guarantee the performance of a customer to a third party. The credit risk involved in issuing letters of credit is essentially the same as that involved in extending loan facilities to customers.
The Bank issues both financial and performance standby letters of credit. The financial standby letters of credit are primarily to guarantee payment to third parties. As of December 31, 2017, there were financial standby letters of credit of $5,274,000 issued. The performance standby letters of credit are typically issued to municipalities as specific performance bonds.
As of December 31, 2017 there were performance letters of credit of $12,000,000 issued. The terms of the guarantees will expire in 2018. The Bank has experienced no draws on these letters of credit and does not expect to in the future. However, should a triggering event occur, the Bank either has collateral in excess of the letters of credit or embedded agreements of recourse from the customer.
| 97 |
FNB Bancorp and Subsidiary
Notes to Consolidated Financial Statements
December 31, 2017, 2016 and 2015
| (17) | Fair Value Measurements |
The following tables present information about the Company’s assets and liabilities measured at fair value on a recurring basis as of December 31, 2017 and 2016. Management has also described the fair value techniques used by the Company to determine such fair value. During 2017 and 2016 there were no transfers of assets and liabilities that are valued using different valuation technologies.
Fair values established for available-for-sale investment securities are based on estimates of fair values quoted for similar types of securities with similar maturities, risk and yield characteristics. The following tables present the recorded amount of assets measured at fair value on a recurring basis:
| Fair Value Measurements | ||||||||||||||||
| (Dollar amounts in thousands) | at December 31, 2017, Using | |||||||||||||||
| Quoted Prices | ||||||||||||||||
| in Active | ||||||||||||||||
| Markets | Other | Significant | ||||||||||||||
| for Identical | Observable | Unobservable | ||||||||||||||
| Fair Value | Assets | Inputs | Inputs | |||||||||||||
| Description | 12/31/2017 | (Level 1) | (Level 2) | (Level 3) | ||||||||||||
| U. S. Treasury securities | $ | 1,975 | $ | 1,975 | $ | — | $ | — | ||||||||
| Obligations of U.S. | ||||||||||||||||
| Government agencies | 41,823 | — | 41,823 | — | ||||||||||||
| Mortgage-backed securities | 119,792 | — | 119,792 | — | ||||||||||||
| Asset-backed securities | 3,686 | — | 3,686 | — | ||||||||||||
| Obligations of states and political subdivisions | 151,103 | — | 151,103 | — | ||||||||||||
| Corporate debt | 37,478 | — | 37,478 | — | ||||||||||||
| Total assets measured at fair value | $ | 355,857 | $ | 1,975 | $ | 353,882 | $ | — | ||||||||
| 98 |
FNB Bancorp and Subsidiary
Notes to Consolidated Financial Statements
December 31, 2017, 2016 and 2015
| Fair Value Measurements | ||||||||||||||||
| (Dollar amounts in thousands) | at December 31, 2016, Using | |||||||||||||||
| Quoted Prices | ||||||||||||||||
| in Active | ||||||||||||||||
| Markets | Other | Significant | ||||||||||||||
| for Identical | Observable | Unobservable | ||||||||||||||
| Fair Value | Assets | Inputs | Inputs | |||||||||||||
| Description | 12/31/2016 | (Level 1) | (Level 2) | (Level 3) | ||||||||||||
| U. S. Treasury securities | $ | 987 | $ | 987 | $ | — | $ | — | ||||||||
| Obligations of U.S. | ||||||||||||||||
| Government agencies | 60,545 | — | 60,545 | — | ||||||||||||
| Mortgage-backed securities | 84,284 | — | 84,284 | — | ||||||||||||
| Obligations of states and political subdivisions | 151,618 | — | 151,618 | — | ||||||||||||
| Corporate debt | 62,671 | — | 62,671 | — | ||||||||||||
| Total assets measured at fair value | $ | 360,105 | $ | 987 | $ | 359,118 | $ | — | ||||||||
| 99 |
FNB Bancorp and Subsidiary
Notes to Consolidated Financial Statements
December 31, 2017, 2016 and 2015
The following tables present the recorded amounts of assets measured at fair value on a non-recurring basis:
| Fair Value Measurements | ||||||||||||||||
| (Dollar amounts in thousands) | at December 31, 2017, Using | |||||||||||||||
| Quoted Prices in | ||||||||||||||||
| Active Markets | Other | Significant | ||||||||||||||
| for Identical | Observable | Unobservable | ||||||||||||||
| Fair Value | Assets | Inputs | Inputs | |||||||||||||
| Description | 12/31/2017 | (Level 1) | (Level 2) | (Level 3) | ||||||||||||
| Impaired loans: | ||||||||||||||||
| Commercial real estate | $ | 745 | $ | — | $ | — | $ | 745 | ||||||||
| Commercial real estate construction | 814 | — | — | 814 | ||||||||||||
| Residential-1 to 4 family | 2,286 | — | — | 2,286 | ||||||||||||
| Commercial and industrial | 745 | — | — | 745 | ||||||||||||
| Other real estate owned | 3,300 | — | — | 3,300 | ||||||||||||
| Total impaired assets measured at fair value | $ | 7,890 | $ | — | $ | — | $ | 7,890 | ||||||||
| Fair Value Measurements | ||||||||||||||||
| (Dollar amounts in thousands) | at December 31, 2016, Using | |||||||||||||||
| Quoted Prices in | ||||||||||||||||
| Active Markets | Other | Significant | ||||||||||||||
| for Identical | Observable | Unobservable | ||||||||||||||
| Fair Value | Assets | Inputs | Inputs | |||||||||||||
| Description | 12/31/2016 | (Level 1) | (Level 2) | (Level 3) | ||||||||||||
| Impaired loans: | ||||||||||||||||
| Commercial real estate | $ | — | $ | — | $ | — | $ | — | ||||||||
| Residential-1 to 4 family | 67 | — | — | 67 | ||||||||||||
| Commercial and industrial | 815 | — | — | 815 | ||||||||||||
| Other real estate owned | 1,427 | — | — | 1,427 | ||||||||||||
| Total impaired assets measured at fair value | $ | 2,309 | $ | — | $ | — | $ | 2,309 | ||||||||
| 100 |
FNB Bancorp and Subsidiary
Notes to Consolidated Financial Statements
December 31, 2017, 2016 and 2015
The following methods and assumptions were used by the Company in estimating the fair value disclosures for financial instruments that are not carried at fair value on either a recurring or non-recurring basis:
Cash and Cash Equivalents including Interest Bearing Time Deposits with Financial Institutions.
The carrying amounts reported in the balance sheet for cash and short-term instruments are a reasonable estimate of fair value, which will approximate their historical cost.
Securities Available-for-Sale.
Fair values for investment securities are based on quoted market prices, where available. If quoted market prices are not available, fair values are based on quoted market prices of comparable instruments.
Loans.
For variable-rate loans that reprice frequently and with no significant change in credit risk, fair values are based on carrying values. For fixed rate loans, fair values are based on discounted cash flows, credit risk factors, and liquidity factors.
Other equity securities.
These are mostly Federal Reserve Bank stock and Federal Home Loan Bank stock, carried in other assets on the consolidated balance sheet. These securities can only be issued and redeemed at par by the issuing entities. They cannot be sold in in open market transactions. Fair value is estimated to be carrying value.
Deposit liabilities.
The fair values disclosed for demand deposits (e.g., interest and non-interest checking, savings, and money market accounts) are, by definition, equal to the amount payable on demand at reporting date (i.e., their carrying amounts). The fair values for fixed-rate certificates of deposit are based on discounted cash flows.
Federal Home Loan Bank Advances.
The fair values of Federal Home Loan Bank Advances are based on discounted cash flows. The discount rate is equal to the market currently offered on similar products.
Note payable.
Fair value is equal to the current balance. They represent a corporate loan with a monthly variable rate, based on the 3-month LIBOR rate plus 4%.
Accrued Interest Receivable and Payable.
The interest receivable and payable balances approximate their fair value due to the short-term nature of their settlement dates.
Undisbursed loan commitments, lines of credit, Mastercard line and standby letters of credit.
The fair value of these off-balance sheet items are based on discounted cash flows of expected fundings.
| 101 |
FNB Bancorp and Subsidiary
Notes to Consolidated Financial Statements
December 31, 2017, 2016 and 2015
The Company has excluded non-financial assets and non-financial liabilities defined by the Codification (ASC 820-10-15-A), such as Company premises and equipment, deferred taxes and other liabilities. In addition, the Company has not disclosed the fair value of financial instruments specifically excluded from disclosure requirements of the Financial Instruments Topic of the Codification (ASC 825-10-50-8), such as Bank-owned life insurance policies.
The following table provides summary information on the estimated fair value of financial instruments at December 31, 2017 and 2016:
| December 31, 2017 | Carrying | Fair | Fair value measurements | |||||||||||||||||
| (Dollar amounts in thousands) | amount | value | Level 1 | Level 2 | Level 3 | |||||||||||||||
| Financial assets: | ||||||||||||||||||||
| Cash and cash equivalents | $ | 18,353 | $ | 18,353 | $ | 18,353 | $ | — | $ | — | ||||||||||
| Interest-bearing time deposits with financial institutions | 130 | 130 | — | 130 | — | |||||||||||||||
| Securities available for sale | 355,857 | 355,857 | 1,975 | 350,196 | — | |||||||||||||||
| Loans | 829,766 | 811,382 | — | — | 811,382 | |||||||||||||||
| Other equity securities | 7,567 | 7,567 | — | — | 7,567 | |||||||||||||||
| Accrued interest receivable | 5,317 | 5,317 | 5,317 | — | — | |||||||||||||||
| Financial liabilities: | ||||||||||||||||||||
| Deposits | 1,050,295 | 1,050,858 | 912,211 | 138,647 | — | |||||||||||||||
| Federal Home Loan Bank advances | 75,000 | 75,000 | — | 75,000 | — | |||||||||||||||
| Note payable | 3,750 | 3,750 | — | 3,750 | — | |||||||||||||||
| Accrued interest payable | 510 | 510 | 510 | — | — | |||||||||||||||
| Off-balance-sheet liabilities: | ||||||||||||||||||||
| Undisbursed loan commitments, lines of credit, standby letters of credit and Mastercard lines of credit | — | 1,884 | — | — | 1,884 | |||||||||||||||
| 102 |
FNB Bancorp and Subsidiary
Notes to Consolidated Financial Statements
December 31, 2017, 2016 and 2015
| December 31, 2016 | Carrying | Fair | Fair value measurements | |||||||||||||||||
| (Dollar amounts in thousands) | amount | value | Level 1 | Level 2 | Level 3 | |||||||||||||||
| Financial assets: | ||||||||||||||||||||
| Cash and cash equivalents | $ | 15,758 | $ | 15,758 | $ | 15,758 | $ | — | $ | — | ||||||||||
| Interest-bearing time deposits with financial institutions | 205 | 205 | — | 205 | — | |||||||||||||||
| Securities available for sale | 360,105 | 360,105 | 987 | 359,118 | — | |||||||||||||||
| Loans | 782,485 | 769,661 | — | — | $ | 769,661 | ||||||||||||||
| Other equity securities | 7,206 | 7,206 | — | — | 7,206 | |||||||||||||||
| Accrued interest receivable | 4,942 | 4,942 | 4,942 | — | — | |||||||||||||||
| Financial liabilities: | ||||||||||||||||||||
| Deposits | 1,019,506 | 1,020,088 | 951,743 | 68,345 | — | |||||||||||||||
| Federal Home Loan Bank advances | 71,000 | 71,000 | — | 71,000 | — | |||||||||||||||
| Note payable | 4,350 | 4,350 | — | 4,350 | — | |||||||||||||||
| Accrued interest payable | 246 | 246 | 246 | |||||||||||||||||
| Off-balance-sheet liabilities: | ||||||||||||||||||||
| Undisbursed loan commitments, lines of credit, standby letters of credit and Mastercard lines of credit | — | 1,733 | — | — | 1,733 | |||||||||||||||
| (18) | Significant Group Concentrations of Credit Risk |
Most of the Bank’s business activity is with customers located within San Mateo and San Francisco counties. Generally, loans are secured by assets of the borrowers. Loans are expected to be repaid from cash flows or proceeds from the sale of selected assets of the borrowers. The Bank does not have significant concentrations of loans to any one industry, but does have loan concentrations in commercial real estate loans that are considered high by regulatory standards. The Bank has mitigated this concentration to a large extent by utilizing underwriting standards that are more conservative than regulatory guidelines, and performing stress testing on this segment of the portfolio to insure that the commercial real estate loan portfolio will perform within management expectations given an additional downturn in commercial lease rates and commercial real estate valuations. The distribution of commitments to extend credit approximates the distribution of loans outstanding. Commercial and standby letters of credit were granted primarily to commercial borrowers. The contractual amounts of credit-related financial instruments such as commitments to extend credit, credit-card arrangements, and letters of credit represent the amounts of potential accounting loss should the contract be fully drawn upon, the customer default, and the value of any existing collateral become worthless.
| (19) | Regulatory Matters |
The Company, as a bank holding company, is subject to regulation by the Board of Governors of the Federal Reserve System under the Bank Holding Company Act of 1956, as amended. The Bank is subject to various regulatory capital requirements administered by the federal banking agencies. Failure to meet minimum capital requirements can initiate certain mandatory and possibly additional discretionary actions by regulators that, if undertaken, could have a direct material effect on the Company’s financial statements.
| 103 |
FNB Bancorp and Subsidiary
Notes to Consolidated Financial Statements
December 31, 2017, 2016 and 2015
Under capital adequacy guidelines and the regulatory framework for prompt corrective action, the Company and the Bank must meet specific capital guidelines that involve quantitative measures of the Company’s and the Bank’s assets, liabilities and certain off balance-sheet items as calculated under regulatory accounting practices.
The capital amounts and classification are also subject to qualitative judgments by the regulators about asset groupings, risk weightings and other factors. Quantitative measures established by regulation to ensure capital adequacy require the Company and the Bank to maintain minimum amounts and ratios (set forth in the table below) of total, Tier 1 Common Equity and Tier 1 capital (as defined in the regulations) to risk-weighted assets (as defined), and leverage capital (as defined) to average assets (as defined). Management believes, as of December 31, 2017, that the Company and the Bank have met all regulatory capital requirements.
As of December 31, 2017, the most recent notification from the regulatory agencies categorized the Bank as well capitalized under the regulatory framework for prompt corrective action. To be categorized as well capitalized the Bank must maintain minimum total risk-based, Tier 1 risk-based, and Tier 1 leverage ratios as set forth in the table. There are no conditions or events since that notification that management believes have changed the Bank’s categories.
| 104 |
FNB Bancorp and Subsidiary
Notes to Consolidated Financial Statements
December 31, 2017, 2016 and 2015
The consolidated actual capital amounts and ratios of the Company and the Bank are presented in the following table:
| Required | ||||||||||||||||||||||||
| for Capital | To be Well-Capitalized | |||||||||||||||||||||||
| Adequacy Purposes | Under Prompt Correction | |||||||||||||||||||||||
| Dollars in thousands | Effective January 1, 2017 | Action Regulations | ||||||||||||||||||||||
| At December 31, 2017 | ||||||||||||||||||||||||
| Regulatory Capital Ratios | Amount | Ratio | Amount | Ratio | Amount | Ratio | ||||||||||||||||||
| Leverage Ratio(1) | ||||||||||||||||||||||||
| Company | $ | 115,364 | 9.09 | % | ≥ | $ | 50,768 | 4.00 | %(2) | N/A | N/A | |||||||||||||
| Bank | 117,180 | 9.23 | % | ≥ | 50,768 | 4.00 | %(2) | $ | 63,460 | 5.00 | % | |||||||||||||
| Tier 1 Common Equity Capital Ratio | ||||||||||||||||||||||||
| Company | 115,364 | 11.57 | % | ≥ | 57,342 | 5.75 | %(2) | N/A | N/A | |||||||||||||||
| Bank | 117,180 | 11.75 | % | ≥ | 57,342 | 5.75 | %(2) | 64,822 | 6.50 | % | ||||||||||||||
| Tier 1 Capital Ratio | ||||||||||||||||||||||||
| Company | 115,364 | 11.57 | % | ≥ | 72,301 | 7.25 | %(2) | N/A | N/A | |||||||||||||||
| Bank | 117,180 | 11.75 | % | ≥ | 72,301 | 7.25 | %(2) | 79,781 | 8.00 | % | ||||||||||||||
| Total Capital Ratio | ||||||||||||||||||||||||
| Company | 125,712 | 12.61 | % | ≥ | 92,246 | 9.25 | %(2) | N/A | N/A | |||||||||||||||
| Bank | 127,528 | 12.79 | % | ≥ | 92,246 | 9.25 | %(2) | 99,726 | 10.00 | % | ||||||||||||||
| (1) | The leverage ratio consists of Tier 1 Capital divided by the most recent quarterly average total assets, excluding certain intangible assets. |
| (2) | Includes 125% capital conservation buffer. |
| Required | ||||||||||||||||||||||||
| for Capital | To be Well-Capitalized | |||||||||||||||||||||||
| Adequacy Purposes | Under Prompt Correction | |||||||||||||||||||||||
| Dollars in thousands | Effective January 1, 2016 | Action Regulations | ||||||||||||||||||||||
| At December 31, 2016 | ||||||||||||||||||||||||
| Regulatory Capital Ratios | Amount | Ratio | Amount | Ratio | Amount | Ratio | ||||||||||||||||||
| Leverage Ratio(1) | ||||||||||||||||||||||||
| Company | $ | 106,971 | 9.02 | % | ≥ | $ | 47,443 | 4.000 | %(2) | N/A | N/A | |||||||||||||
| Bank | 109,538 | 9.27 | % | ≥ | 47,248 | 4.000 | %(2) | $ | 59,060 | 5.00 | % | |||||||||||||
| Tier 1 Common Equity Capital Ratio | ||||||||||||||||||||||||
| Company | 106,971 | 11.32 | % | ≥ | 48,441 | 5.125 | %(2) | N/A | N/A | |||||||||||||||
| Bank | 109,538 | 11.59 | % | ≥ | 48,441 | 5.125 | %(2) | 61,437 | 6.50 | % | ||||||||||||||
| Tier 1 Capital Ratio | ||||||||||||||||||||||||
| Company | 106,971 | 11.32 | % | ≥ | 62,618 | 6.625 | %(2) | N/A | N/A | |||||||||||||||
| Bank | 109,538 | 11.59 | % | ≥ | 62,618 | 6.625 | %(2) | 75,615 | 8.00 | % | ||||||||||||||
| Total Capital Ratio | ||||||||||||||||||||||||
| Company | 117,315 | 12.42 | % | ≥ | 81,522 | 8.625 | %(2) | N/A | N/A | |||||||||||||||
| Bank | 119,882 | 12.68 | % | ≥ | 81,522 | 8.625 | %(2) | 94,518 | 10.00 | % | ||||||||||||||
| (1) | The leverage ratio consists of Tier 1 Capital divided by the most recent quarterly average total assets, excluding certain intangible assets. |
| (2) | Includes 125% capital conservation buffer. |
| 105 |
FNB Bancorp and Subsidiary
Notes to Consolidated Financial Statements
December 31, 2017, 2016 and 2015
Management believes that the Company and the Bank are both “well capitalized” by regulatory definitions for all required regulatory capital ratios, including leverage, Tier 1 common equity, Tier 1 risk based and total risk based capital requirements for all periods presented. The capital position of the Company is stable, composed primarily of common stock and retained earnings. Management believes that relations with our regulatory agencies are good, as evidenced by the regulatory approval received to purchase America California Bank.
The Federal Reserve and the Federal Deposit Insurance Corporation approved final capital rules in July 2013, that substantially amend the existing capital rules for banks. These new rules reflect, in part, certain standards initially adopted by the Basel Committee on Banking Supervision in December 2010 (which standards are commonly referred to as “Basel III”) as well as requirements contemplated by the Dodd-Frank Act.
Under these capital rules, the Bank is required to meet certain minimum capital requirements. The Bank will also be required to establish a “conservation buffer,” consisting of a common equity Tier 1 capital amount equal to 2.5% of risk-weighted assets to be phased in by 2019. An institution that does not meet the conservation buffer will be subject to restrictions on certain activities including payment of dividends, stock repurchases, and discretionary bonuses to executive officers.
The prompt corrective action rules are modified to include the common equity Tier 1 capital ratio and to increase the Tier 1 capital ratio requirements for the various thresholds. For example, the requirements for the Bank to be considered well-capitalized under the rules will be a 5.0% leverage ratio, a 6.5% common equity Tier l capital ratio, an 8.0% Tier 1 capital ratio, and a 10.0% total capital ratio. To be adequately capitalized, those ratios are 4.0%, 4.5%, 6.0%, and 8.0%, respectively.
The rules modify the manner in which certain capital elements are determined. The rules make changes to the methods of calculating the risk-weighting of certain assets, which in turn affects the calculation of the risk-weighted capital ratios. Higher risk weights are assigned to various categories of assets, including commercial real estate loans, credit facilities that finance the acquisition, development or construction of real property, certain exposures or credit that are 90 days past due or are nonaccrual, securitization exposures, and in certain cases mortgage servicing rights and deferred tax assets.
The Bank was required to comply with all capital requirements on December 31, 2017. The conservation buffer began to be phased-in beginning in 2016 and will take full effect on January 1, 2019. Certain calculations under the rules will also have phase-in periods.
| (20) | Stock Option Plans |
In 1997, the Board of Directors of the Bank adopted the First National Bank of Northern California 1997 stock option plan. Pursuant to the holding company reorganization effective March 15, 2002, the Bank stock option plan became the FNB Bancorp stock option Plan. In 2002, the Company adopted an incentive employee stock option plan known as the 2002 FNB Bancorp plan. In 2008, the Company adopted an incentive employee stock option plan known as the 2008 FNB Bancorp stock option plan. The plans allow the Company as of December 31, 2017 to grant options to employees covering 404,766 shares.
Incentive stock options currently outstanding become exercisable in one to five years from the grant date, based on a vesting schedule of 20% per year and expire 10 years after the grant date. Nonqualified options to directors become vested on the date of grant. The options exercise price is the fair value of the per share price of the underlying stock options at the grant date.
| 106 |
FNB Bancorp and Subsidiary
Notes to Consolidated Financial Statements
December 31, 2017, 2016 and 2015
The amount of compensation expense for options recorded in the years ended December 31, 2017, 2016, and 2015 was $418,000, $513,000 and $427,000, respectively. There was an income tax benefit related to stock option exercises for the year ended December 31, 2017 of $340,000 that was reflected as an excess income tax benefit. During 2016 and 2015, the tax benefit related to disqualified stock option exercises and non-qualified stock option exercises totaled $600,000 and $553,000, respectively. During 2016 and 2015, this tax benefit was reflected as an increase in common equity and a decrease in income taxes payable. The amount of unrecognized compensation expense related to non-vested options at December 31, 2017 was $947,000, and the remaining weighted average amortization period was 3.1 years. There were no new stock options granted during 2017.
The amount of total unrecognized compensation expense related to non-vested options at December 31, 2016 was $1,409,000, and the weighted average period it will be amortized over was 3.9 years. The assumptions for options granted in 2016 were as follows: dividend yield of 1.94% for the year; risk-free interest rate of 2.15%; expected volatility of 37%; expected life of 7.2 years. This resulted in a weighted average fair value of $7.43 per share. The amount of total unrecognized compensation expense related to non-vested options at December 31, 2015 was $1,061,000, and the weighted average period it will be amortized over is 4.0 years. The assumptions for options granted in 2015 were as follows: dividend yield of 1.96% for the year; risk-free interest rate of 2.14%; expected volatility of 41%; expected life of 8.9 years. This resulted in a weighted average option fair value of $2.72 per share.
A summary of option activity, adjusted for stock dividends and stock splits, issued under the 2008 FNB Bancorp Plan as of December 31, 2017 and changes during the year then ended is presented below.
| Weighted- | ||||||||||||||||
| Average | ||||||||||||||||
| 2008 FNB Bancorp Plan | Weighted | Remaining | Aggregate | |||||||||||||
| Average | Contractual | Intrinsic | ||||||||||||||
| Exercise | Term | Value | ||||||||||||||
| Options | Shares | Price/share | (in years) | per share | ||||||||||||
| Outstanding at January 1, 2017 | 632,635 | $ | 13.99 | $ | 22.50 | |||||||||||
| Granted | — | $ | — | |||||||||||||
| Exercised | (164,389 | ) | $ | 10.71 | $ | 20.35 | ||||||||||
| Forfeited or expired | (12,955 | ) | $ | 15.35 | ||||||||||||
| Outstanding at December 31, 2017 | 455,291 | $ | 15.14 | 6.4 | $ | 21.35 | ||||||||||
| Exercisable at December 31, 2017 | 278,911 | $ | 13.20 | 5.6 | $ | 23.29 | ||||||||||
| 107 |
FNB Bancorp and Subsidiary
Notes to Consolidated Financial Statements
December 31, 2017, 2016 and 2015
The following supplemental information applies to the three years ended December 31:
| 2008 FNB Bancorp Plan | ||||||||||||
| 2017 | 2016 | 2015 | ||||||||||
| Options outstanding | 455,291 | 632,635 | 586,344 | |||||||||
| Range of exercise prices/share | $ | 3.53 to $20.95 | $ | 3.53 to $20.95 | $ | 3.53-$16.27 | ||||||
| Weighted average remaining contractual life (in years) | 6.4 | 6.9 | 7.0 | |||||||||
| Fully vested options | 278,911 | 366,286 | 326,461 | |||||||||
| Weighted average exercise price/sh | $ | 13.20 | $ | 11.35 | $ | 11.83 | ||||||
| Aggregate intrinsic value | $ | 6,496,216 | $ | 4,876,927 | $ | 4,307,190 | ||||||
| Weighted average remaining contractual life (in years) | 5.6 | 5.7 | 5.9 | |||||||||
A summary of option activity, adjusted for stock dividends, under the 2002 FNB Bancorp Plan as of December 31, 2017 and changes during the year then ended is presented below.
| Weighted- | ||||||||||||||||
| Average | ||||||||||||||||
| 2002 FNB Bancorp Plan | Weighted | Remaining | Aggregate | |||||||||||||
| Average | Contractual | Intrinsic | ||||||||||||||
| Exercise | Term | Value | ||||||||||||||
| Options | Shares | Price/share | (in years) | per share | ||||||||||||
| Outstanding at January 1, 2017 | 28,555 | $ | 12.48 | $ | 24.01 | |||||||||||
| Granted | — | $ | — | |||||||||||||
| Exercised | (28,555 | ) | $ | 12.48 | $ | 14.14 | ||||||||||
| Forfeited or expired | — | $ | — | |||||||||||||
| Outstanding at December 31, 2017 | — | $ | — | — | $ | — | ||||||||||
| Exercisable at December 31, 2017 | — | $ | — | — | $ | — | ||||||||||
| 108 |
FNB Bancorp and Subsidiary
Notes to Consolidated Financial Statements
December 31, 2017, 2016 and 2015
The following supplemental information applies to the three years ended December 31:
| 2002 FNB Bancorp Plan | ||||||||||||
| 2017 | 2016 | 2015 | ||||||||||
| Options outstanding | — | 28,555 | 96,023 | |||||||||
| Range of exercise prices/share | $ | — | $ | 12.48 to $12.48 | $ | 12.48 to $14.13 | ||||||
| Weighted average remaining contractual life (in years) | — | 0.5 | 0.9 | |||||||||
| Fully vested options | — | 28,555 | 96,023 | |||||||||
| Weighted average exercise price/sh | $ | — | $ | 12.48 | $ | 13.48 | ||||||
| Aggregate intrinsic value | $ | — | $ | 263,324 | $ | 547,108 | ||||||
| Weighted average remaining contractual life (in years) | — | 0.5 | 0.9 | |||||||||
| 109 |
FNB Bancorp and Subsidiary
Notes to Consolidated Financial Statements
December 31, 2017, 2016 and 2015
A summary of option activity, adjusted for stock dividends, under the 1997 FNB Bancorp Plan as of December 31, 2017 and changes during the year then ended is presented below.
| Weighted- | ||||||||||||||||
| Average | ||||||||||||||||
| 1997 First National Bank Plan | Weighted | Remaining | Aggregate | |||||||||||||
| Average | Contractual | Intrinsic | ||||||||||||||
| Exercise | Term | Value | ||||||||||||||
| Options | Shares | Price | (in years) | per share | ||||||||||||
| Outstanding at January 1, 2016 | 16,616 | $ | 12.48 | $ | 9.15 | |||||||||||
| Granted | — | $ | — | |||||||||||||
| Exercised | (16,616 | ) | 12.48 | $ | 15.93 | |||||||||||
| Forfeited or expired | — | — | ||||||||||||||
| Outstanding at December 31, 2017 | — | $ | — | — | $ | — | ||||||||||
| Exercisable at December 31, 2017 | — | $ | — | — | $ | — | ||||||||||
The following supplemental information applies to the three years ended December 31
| 1997 FNB Bancorp Plan | ||||||||||||
| 2017 | 2016 | 2015 | ||||||||||
| Options outstanding | — | 16,616 | 50,823 | |||||||||
| Range of exercise prices | $ | — | $ | 12.48 | $ | 12.48 | ||||||
| Weighted average remaining contractual life (in years) | — | 0.5 | 1.5 | |||||||||
| Fully vested options | — | 16,616 | 50,823 | |||||||||
| Weighted average exercise price/sh | $ | — | $ | 12.48 | $ | 12.48 | ||||||
| Aggregate intrinsic value | $ | — | $ | 152,593 | $ | 340,094 | ||||||
| Weighted average remaining contractual life (in years) | — | 0.5 | 1.5 | |||||||||
| 110 |
FNB Bancorp and Subsidiary
Notes to Consolidated Financial Statements
December 31, 2017, 2016 and 2015
| (21) | Quarterly Data (Unaudited) |
Per share amounts adjusted for stock splits and stock dividends
| 2017 | ||||||||||||||||
| (Dollars in thousands) | First | Second | Third | Fourth | ||||||||||||
| Interest income | $ | 12,027 | $ | 12,378 | $ | 12,785 | $ | 13,028 | ||||||||
| Interest expense | 835 | 946 | 1,032 | 1,058 | ||||||||||||
| Net interest income | 11,192 | 11,432 | 11,753 | 11,970 | ||||||||||||
| Provision for loan losses | — | (140 | ) | — | (220 | ) | ||||||||||
| Net interest income, after provision for loan losses | 11,192 | 11,572 | 11,753 | 12,190 | ||||||||||||
| Noninterest income | 1,010 | 1,012 | 972 | 866 | ||||||||||||
| Noninterest expense | 7,605 | 7,678 | 7,648 | 7,618 | ||||||||||||
| Earnings before income taxes | 4,597 | 4,906 | 5,077 | 5,438 | ||||||||||||
| Provision for income taxes | 1,508 | 1,555 | 1,766 | 4,478 | ||||||||||||
| Net earnings | $ | 3,089 | $ | 3,351 | $ | 3,311 | $ | 960 | ||||||||
| Basic earnings per share | $ | 0.42 | $ | 0.46 | $ | 0.45 | $ | 0.13 | ||||||||
| Diluted earnings per share | $ | 0.41 | $ | 0.44 | $ | 0.43 | $ | 0.13 | ||||||||
Per share amounts adjusted for stock splits and stock dividends.
| 111 |
FNB Bancorp and Subsidiary
Notes to Consolidated Financial Statements
December 31, 2017, 2016 and 2015
| 2016 | ||||||||||||||||
| (Dollars in thousands) | First | Second | Third | Fourth | ||||||||||||
| Interest income | $ | 11,565 | $ | 11,316 | $ | 11,122 | $ | 11,510 | ||||||||
| Interest expense | 848 | 766 | 721 | 734 | ||||||||||||
| Net interest income | 10,717 | 10,550 | 10,401 | 10,776 | ||||||||||||
| Provision for (recovery) of loan losses | 75 | 75 | — | — | ||||||||||||
| Net interest income, after provision for loan losses | 10,642 | 10,475 | 10,401 | 10,776 | ||||||||||||
| Non-interest income | 1,134 | 1,036 | 1,102 | 1,323 | ||||||||||||
| Non-interest expense | 7,787 | 7,649 | 7,513 | 7,743 | ||||||||||||
| Income before income taxes | 3,989 | 3,862 | 3,990 | 4,356 | ||||||||||||
| Provision for income taxes | 1,422 | 1,414 | 1,546 | 1,314 | ||||||||||||
| Net earnings | $ | 2,567 | $ | 2,448 | $ | 2,444 | $ | 3,042 | ||||||||
| Basic earnings per share | $ | 0.36 | $ | 0.34 | $ | 0.33 | $ | 0.42 | ||||||||
| Diluted earnings per share | $ | 0.35 | $ | 0.33 | $ | 0.33 | $ | 0.41 | ||||||||
| 112 |
FNB Bancorp and Subsidiary
Notes to Consolidated Financial Statements
December 31, 2017, 2016 and 2015
| (22) | Condensed Financial Information of Parent Company |
The parent company-only condensed balance sheets, condensed statements of earnings, and condensed statements of cash flows information are presented as of and for the years ended December 31, as follows:
| FNB Bancorp | Condensed balance sheets | |||||||
| December 31, | ||||||||
| (Dollars in thousands) | 2017 | 2016 | ||||||
| Assets: | ||||||||
| Cash and due from banks | $ | 1,947 | $ | 1,795 | ||||
| Investments in subsidiary | 121,096 | 112,881 | ||||||
| Dividend receivable from subsidiary | 964 | 739 | ||||||
| Other assets | 242 | 243 | ||||||
| Total assets | $ | 124,249 | $ | 115,658 | ||||
| Liabilities: | ||||||||
| Dividend declared | $ | 964 | $ | 739 | ||||
| Income tax payable to subsidiary | 244 | 244 | ||||||
| Note payable | 3,750 | 4,350 | ||||||
| Other liabilities | 11 | 11 | ||||||
| Total liabilities | 4,969 | 5,344 | ||||||
| Stockholders’equity | 119,280 | 110,314 | ||||||
| Total liabilities and stockholders’ equity | $ | 124,249 | $ | 115,658 | ||||
| FNB Bancorp | Condensed statements of earnings | |||||||||||
| Years Ended December 31, | ||||||||||||
| (Dollars in thousands) | 2017 | 2016 | 2015 | |||||||||
| Income: | ||||||||||||
| Dividends from subsidiary | $ | 3,634 | $ | 2,890 | $ | 2,439 | ||||||
| Total income | 3,634 | 2,890 | 2,439 | |||||||||
| Expense: | ||||||||||||
| Interest on note payable | 214 | 222 | 229 | |||||||||
| Other expense | 317 | 135 | 128 | |||||||||
| Total expense | 531 | 357 | 357 | |||||||||
| Income before income tax benefit and equity in undistributed earnings of subsidiary | 3,103 | 2,533 | 2,082 | |||||||||
| Income tax benefit | — | — | (56 | ) | ||||||||
| Income before equity in undistributed earnings of subsidiary | 3,103 | 2,533 | 2,138 | |||||||||
| Equity in undistributed earnings of subsidiary | 7,608 | 7,968 | 6,059 | |||||||||
| Net earnings | $ | 10,711 | $ | 10,501 | $ | 8,197 | ||||||
| 113 |
FNB Bancorp and Subsidiary
Notes to Consolidated Financial Statements
December 31, 2017, 2016 and 2015
| FNB Bancorp | Condensed statement of cash flows | |||||||||||
| Years ended December 31, | ||||||||||||
| (Dollars in thousands) | 2017 | 2016 | 2015 | |||||||||
| Net earnings | $ | 10,711 | $ | 10,501 | $ | 8,197 | ||||||
| Decrease in income tax receivable from subsidiary | — | 166 | 165 | |||||||||
| Net increase in dividend receivable and other assets | (224 | ) | (90 | ) | (163 | ) | ||||||
| Net increase in other liabilities | 565 | — | 147 | |||||||||
| Excess tax benefit from exercised stock options | (340 | ) | (600 | ) | (222 | ) | ||||||
| Undistributed earnings of subsidiary | (7,608 | ) | (8,044 | ) | (6,059 | ) | ||||||
| Stock-based compensation expense | 418 | 513 | 427 | |||||||||
| Cash flows from operating activities | 3,522 | 2,446 | 2,492 | |||||||||
| Investment in subsidiary | — | — | (882 | ) | ||||||||
| Cash flows from investing activities | — | — | (882 | ) | ||||||||
| Payment on note payable | (600 | ) | (600 | ) | (600 | ) | ||||||
| Exercise of stock options | 864 | 1,115 | 924 | |||||||||
| Excess tax benefit from exercised stock options | — | 600 | 222 | |||||||||
| Dividends on common stock | (3,634 | ) | (2,890 | ) | (1,786 | ) | ||||||
| Cash flows provided by financing activities | (3,370 | ) | (1,775 | ) | (1,240 | ) | ||||||
| Net increase (decrease) in cash | 152 | 671 | 370 | |||||||||
| Cash, beginning of year | 1,795 | 1,124 | 754 | |||||||||
| Cash, end of year | $ | 1,947 | $ | 1,795 | $ | 1,124 | ||||||
| Non-cash investing and financing activities: | ||||||||||||
| Accrued dividends | 964 | 739 | 649 | |||||||||
| Stock dividend of 5% | — | 7,850 | 6,663 | |||||||||
| 114 |
FNB Bancorp and Subsidiary
Notes to Consolidated Financial Statements
December 31, 2017, 2016 and 2015
| (23) | Subsequent Event |
During 2017, the Company entered into a purchase and sale contract to sell the Company’s OREO property located at 416 Browning Way, South San Francisco, California. This property was acquired by the Company through foreclosure on July 12, 2011 and contained soil and ground water contamination in and around the property. The sale closed escrow on February 22, 2018 and the contract sales price of $2.8 million consisted of a down payment by the buyer of $1,600,000 as well as the Company providing the buyer a $1.2 million 15 year fully amortized loan at an interest rate of 4.25% fixed.
The purchase and sale contract required the Company to transfer title of the property to the buyer, and the buyer obtained all rights and responsibilities of ownership of the property including the right to the lease revenue generated by the tenant that currently leases the building. The Company retained the obligation to continue working with the Water Board to obtain and complete a final remediation plan for the property. Included in the sale agreement is the requirement that the Company set aside $500,000 in the form of a good faith deposit that is to be used to fund the ongoing efforts remediation efforts. If the Company spends more than $500,000, the Company is required to fund certain remediation costs beyond the initial $500,000 good faith deposit. Those costs along with reimbursable costs incurred by the Water Board are currently estimated to be approximately $725,000 by the Company’s soil engineering and consulting company consultant but could vary in the future depending on the extent of final remediation requirements and the time required to complete them. |
ITEM 9. CHANGES IN AND DISAGREEMENTS WITH ACCOUNTANTS ON ACCOUNTING AND FINANCIAL DISCLOSURE
Not applicable.
ITEM 9A. CONTROLS AND PROCEDURES
Disclosure Controls and Procedures. Disclosure controls and procedures are designed with the objective of ensuring that information required to be disclosed in reports filed by the Company under the Exchange Act, such as this Annual Report, is recorded, processed, summarized and reported within the time periods specified in the rules and forms of the Securities and Exchange Commission. Disclosure controls and procedures are also designed with the objective of ensuring that such information is accumulated and communicated to management, including the Chief Executive Officer and the Chief Financial Officer, as appropriate to allow timely decisions regarding required disclosure.
| 115 |
Evaluation of Disclosure Controls and Procedures and Internal Control over Financial Reporting. The Company’s management, including the Chief Executive Officer and the Chief Financial Officer, evaluated the Company’s disclosure controls and procedures (as defined in Rule 13a-15(e) under the Exchange Act) as of December 31, 2017. Based on this evaluation, the Chief Executive Officer and the Chief Financial Officer concluded that the Company’s disclosure controls and procedures were effective as of December 31, 2017.
There was no change in the Company’s internal control over financial reporting that occurred during the quarter ended December 31, 2017 that has materially affected, or is reasonably likely to materially affect, the Company’s internal control over financial reporting.
Management’s Report on Internal Control over Financial Reporting. Management of the Company is responsible for establishing and maintaining adequate internal control over financial reporting. As defined in Rule 13a-15(f) under the Exchange Act, internal control over financial reporting is a process designed by, or under the supervision of, a company’s principal executive and principal financial officers and effected by a company’s board of directors, management and other personnel, to provide reasonable assurance regarding the reliability of financial reporting and the preparation of financial statements for external purposes in accordance with generally accepted accounting principles. It includes those policies and procedures that:
| a) | Pertain to the maintenance of records that in reasonable detail accurately and fairly reflect the transactions and dispositions of the assets of a company; |
| b) | Provide reasonable assurance that transactions are recorded as necessary to permit preparation of financial statements in accordance with generally accepted accounting principles, and that receipts and expenditures of a company are being made only in accordance with authorizations of management and the board of directors of the company; and |
| c) | Provide reasonable assurance regarding prevention or timely detection of unauthorized acquisition, use or disposition of a company’s assets that could have a material effect on its financial statements. |
Because of the inherent limitations, internal control over financial reporting may not prevent or detect misstatements. Also, projections of any evaluation of effectiveness to future periods are subject to the risk that controls may become inadequate because of changes in conditions, or that the degree of compliance with the policies or procedures may deteriorate.
The Company’s management has used the criteria established in updated “Internal Control-Integrated Framework-2013” issued May 14, 2013 by the Committee of Sponsoring Organizations of the Treadway Commission (“COSO”) to evaluate the effectiveness of the Company’s internal control over financial reporting. Management has selected the COSO framework for its evaluation as it is a control framework recognized by the SEC and the Public Company Accounting Oversight Board, that is free from bias, permits reasonably consistent qualitative and quantitative measurement of the Company’s internal controls, is sufficiently complete so that relevant controls are not omitted and is relevant to an evaluation of internal controls over financial reporting.
Based on our evaluation, the principal executive officer and principal financial officer have concluded that our internal control over financial reporting, based on criteria established in “Internal Control-Integrated Framework-2013” issued in 2013 by COSO, including disclosure controls and procedures, are effective to ensure that material information required to be disclosed by the Company in the reports that it files and submits under the Exchange Act is recorded, processed, summarized and reported as and when required and that such information is communicated to the Company’s management, including the principal executive officer and the principal financial officer, to allow timely decisions regarding required disclosures. The evaluation did not identify any change in the Company’s internal control over financial reporting that occurred during the quarter ended December 31, 2017 that has materially affected or is reasonably likely to materially affect the Company’s internal control over financial reporting.
Date: March 13, 2018
| /s/ Thomas C. Mc Graw | /s/ David A. Curtis | |
| Thomas C. Mc Graw | David A. Curtis | |
| Chief Executive Officer | Principal Financial and Accounting Officer |
| 116 |
The Report of Independent Registered Public Accounting Firm required to be furnished pursuant to this item is set forth in Item 8 and is incorporated by reference.
Inherent Limitations on Effectiveness of Controls
The Company’s management, including the Chief Executive Officer and Chief Financial Officer, does not expect that our disclosure controls or our internal control over financial reporting will prevent or detect all errors and all fraud.
A control system, no matter how well designed and operated, can provide only reasonable, not absolute, assurance that the control system’s objectives will be met. The design of a control system must reflect the fact that there are resource constraints, and the benefits of controls must be considered relative to their costs. Further, because of the inherent limitations in all control systems, no evaluation of controls can provide absolute assurance that misstatements due to error or fraud will not occur or that all control issues and instances of fraud, if any, within the Company have been detected. These inherent limitations include the realities that judgments in decision-making can be faulty and that breakdowns can occur because of simple error or mistake. Controls can also be circumvented by the individual acts of some persons, by collusion of two or more people, or by management override of the controls. The design of any system of controls is based in part on certain assumptions about the likelihood of future events, and there can be no assurance that any design will succeed in achieving its stated goals under all potential future conditions. Projections of any evaluation of controls effectiveness to future periods are subject to risks. Over time, controls may become inadequate because of changes in conditions or deterioration in the degree of compliance with policies or procedures.
Not applicable.
| 117 |
PART III
ITEM 10. DIRECTORS, EXECUTIVE OFFICERS AND CORPORATE GOVERNANCE
The information required by Item 10 of Form 10-K is incorporated by reference to the applicable information contained in the Company’s Proxy Statement for the 2018 Annual Meeting of Shareholders which will be filed pursuant to Regulation 14A.
ITEM 11. EXECUTIVE COMPENSATION
The information required by Item 11 of Form 10-K is incorporated by reference to the applicable information contained in the Company’s Proxy Statement for the 2018 Annual Meeting of Shareholders which will be filed pursuant to Regulation 14A.
ITEM 12. SECURITY OWNERSHIP OF CERTAIN BENEFICIAL OWNERS AND MANAGEMENT AND RELATED STOCKHOLDER MATTERS
The information required by Item 12 of Form 10-K is incorporated by reference to the applicable information contained in the Company’s Proxy Statement for the 2018 Annual Meeting of Shareholders which will be filed pursuant to Regulation 14A.
ITEM 13. CERTAIN RELATIONSHIPS AND RELATED TRANSACTIONS, AND DIRECTOR INDEPENDENCE
The information required by Item 13 of Form 10-K is incorporated by reference to the applicable information contained in the Company’s Proxy Statement for the 2018 Annual Meeting of Shareholders which will be filed pursuant to Regulation 14A.
ITEM 14. PRINCIPAL ACCOUNTING FEES AND SERVICES
The information required by Item 14 of Form 10-K is incorporated by reference to the applicable information contained in the Company’s Proxy Statement for the 2018 Annual Meeting of Shareholders which will be filed pursuant to Regulation 14.
| 118 |
PART IV
ITEM 15. EXHIBITS, FINANCIAL STATEMENTS, SCHEDULES
| (a)(1) | Financial Statements. Listed and included in Part II, Item 8. |
| (3) | Exhibits. |
| 119 |
| 120 |
| 121 |
| 122 |
| 123 |
| 124 |
|
10.67 |
||
10.68 |
||
10.69 |
||
10.70 |
||
10.71 |
||
10.72 |
||
10.73 |
||
10.74 |
||
10.75 |
||
| ******14.0 | Code of Ethics | |
| 21.1 | The Registrant has one subsidiary, First National Bank of Northern California | |
| 23.1 | Consent of Moss Adams LLP | |
| 31.1 | Rule 13a-14(a)/15d-14(a) Certification | |
| (principal executive officer) | ||
| 31.2 | Rule 13a-14(a)/15d-14(a) Certification | |
| (principal financial officer) | ||
| 32.0 | Section 1350 Certifications | |
| 101.INS | XBRL Instance Document (furnished herewith) | |
| 101.SCH | XBRL Taxonomy Extension Schema Document (furnished herewith) | |
| 101.CAL | XBRL Taxonomy Extension Calculation Linkbase Document (furnished herewith) | |
| 101.DEF | XBRL Taxonomy Extension Definition Linkbase Document (furnished herewith) | |
| 101.LAB | XBRL Taxonomy Extension Label Linkbase Document (furnished herewith) |
| 125 |
| 101.PRE | XBRL Taxonomy Extension Presentation Linkbase Document (furnished herewith) | |
| * | Denotes management contracts, compensatory plans or arrangements. | |
| ** | Incorporated by reference to registrant’s Statement on Form S-4 filed with the Commission on December 12, 2001. | |
| *** | Incorporated by reference to registrant’s Annual Report on Form 10-K filed with the Commission on March, 29, 2002. | |
| **** | Incorporated by reference to registrant’s Statement on Form S-8 (No. 333-91596) filed with the Commission on July 1, 2002. | |
| ***** | Incorporated by reference to the registrant’s Registration Statement on Form S-8 (No. 333-98293) filed with the Commission on August 16, 2002. | |
| ****** | Incorporated by reference to registrant’s Annual Report on Form 10-K filed with the Commission on March 30, 2004. | |
| ******* | Incorporated by reference to registrant’s Annual Report on Form 10-K filed with the Commission on March 29, 2006. | |
| ******** | Incorporated by reference from Appendix A to the Registrant’s Definitive Proxy Statement for its 2008 Annual Meeting of Shareholders, filed with the Commission on April 21, 2008. | |
An Annual Report for the fiscal year ended December 31, 2017, and Notice of Annual Meeting and Proxy Statement for the Company’s 2018 Annual Meeting will be mailed to security holders subsequent to the date of filing this report. Copies of said materials will be furnished to the Commission in accordance with the Commission’s Rules and Regulations.
Not applicable.
| 126 |
Pursuant to the requirements of Section 13 or 15(d) of the Securities and Exchange Act of 1934, the registrant has duly caused this report to be signed on its behalf by the undersigned, thereunto duly authorized.
| FNB BANCORP | ||
| Dated: March 13, 2018 | By: | /s/ Thomas C. McGraw |
| Thomas C. McGraw | ||
| Chief Executive Officer | ||
| (Principal Executive Officer) | ||
Pursuant to the requirements of the Securities and Exchange Act of 1934, this report has been signed below by the following persons on behalf of the registrant in the capacities and on the dates indicated.
| Signature | Title | Date | ||
| /s/ Lisa Angelot | Chairwoman of the Board | March 13, 2018 | ||
| Lisa Angelot | of Directors | |||
| /s/ Thomas C. McGraw | Director, Chief Executive | March 13, 2018 | ||
| Thomas C. McGraw | Officer | |||
| /s/ David A. Curtis | Senior Vice President | March 13, 2018 | ||
| David A. Curtis | and Chief Financial Officer | |||
| (Principal Financial Officer | ||||
| and Principal Accounting | ||||
| Officer) | ||||
| /s/ Thomas G. Atwood | ||||
| Thomas G. Atwood, D. D. S. | Director | March 13, 2018 | ||
| /s/ Ronald R. Barels | Director | March 13, 2018 | ||
| Ronald R. Barels, D.D.S. | ||||
| /s/ Merrie Turner Lightner | Director | March 13, 2018 | ||
| Merrie Turner Lightner | ||||
| /s/ Michael Pacelli | Director | March 13, 2018 | ||
| Michael Pacelli | ||||
| /s/ Edward J. Watson | Director and Secretary | March 13, 2018 | ||
| Edward J. Watson | ||||
| /s/ Jim D. Black | Director and President | March 13, 2018 | ||
| Jim D. Black | ||||
| /s/ Anthony J. Clifford | Director and Executive | March 13, 2018 | ||
| Anthony J. Clifford | Vice President and Chief | |||
| Operating Officer |
| 127 |