Attached files
| file | filename |
|---|---|
| EX-99.3 - ADOPTION OF ASC 606 REVENUE RECOGNITION - EXPRESS, INC. | exhibit993-adoptionofasc60.htm |
| EX-99.1 - PRESS RELEASE - EXPRESS, INC. | exhibit991-q42017earningsr.htm |
| 8-K - 8-K - EXPRESS, INC. | a8-kq42017earningsreleasec.htm |

Q4 & FY 2017
Earnings

Cautionary Statement Regarding
Forward-Looking Statements
Forward Looking Statements:
Certain statements are “forward-looking statements” made pursuant to the safe harbor provisions of the Private Securities Litigation
Reform Act of 1995. Forward-looking statements include any statement that does not directly relate to any historical or current fact and
include, but are not limited to: (1) guidance and expectations for the first quarter and full year 2018, including statements regarding
expected comparable sales, interest expense, effective tax rates, net income, earnings per diluted share, and capital expenditures; (2)
statements regarding expected store openings, closures, conversions, and gross square footage; and (3) statements regarding the
Company's future plans and initiatives. Forward looking statements are based on our current expectations and assumptions, which may
not prove to be accurate. These statements are not guarantees and are subject to risks, uncertainties, and changes in circumstances that
are difficult to predict, and significant contingencies, many of which are beyond the Company's control. Many factors could cause actual
results to differ materially and adversely from these forward-looking statements. Among these factors are (1) changes in consumer
spending and general economic conditions; (2) our ability to identify and respond to new and changing fashion trends, customer
preferences, and other related factors; (3) fluctuations in our sales, results of operations, and cash levels on a seasonal basis and due to a
variety of other factors, including our product offerings relative to customer demand, the mix of merchandise we sell, promotions, and
inventory levels; (4) competition from other retailers; (5) customer traffic at malls, shopping centers, and at our stores and online; (6) our
dependence on a strong brand image; (7) our ability to develop and maintain a relevant and reliable omni-channel experience for our
customers; (8) the failure or breach of information systems upon which we rely; (9) our ability to protect customer data from fraud and
theft; (10) our dependence upon third parties to manufacture all of our merchandise; (11) changes in the cost of raw materials, labor, and
freight; (12) supply chain or other business disruption; (13) our dependence upon key executive management; (14) our ability to achieve
our strategic objectives; (15) our substantial lease obligations; (16) our reliance on third parties to provide us with certain key services for
our business; (17) claims made against us resulting in litigation or changes in laws and regulations applicable to our business; (18) our
inability to protect our trademarks or other intellectual property rights which may preclude the use of our trademarks or other intellectual
property around the world; (19) restrictions imposed on us under the terms of our asset-based loan facility; (20) impairment charges on
long-lived assets; and (21) changes in tax requirements, results of tax audits, and other factors that may cause fluctuations in our effective
tax rate. Additional information concerning these and other factors can be found in Express, Inc.'s filings with the Securities and Exchange
Commission. We undertake no obligation to publicly update or revise any forward looking statement as a result of new information, future
events, or otherwise, except as required by law.
2

♦ One of the largest specialty retail apparel brands with
$2.1 billion in annual sales
♦ Enduring dual-gender brand appealing to 20-30 year
olds
♦ Address fashion needs across multiple wearing
occasions
♦ Strong, tenured leadership team
3
Express Is A Large Fashion Apparel Brand
Men’s
38%
62%
Women’s
Work
Casual
Jeanswear
Going out
Sales Profile1,2 Wearing Occasions
1. For the fiscal year ended February 3, 2018. 2. Excludes “other revenue” of $38 million.

4
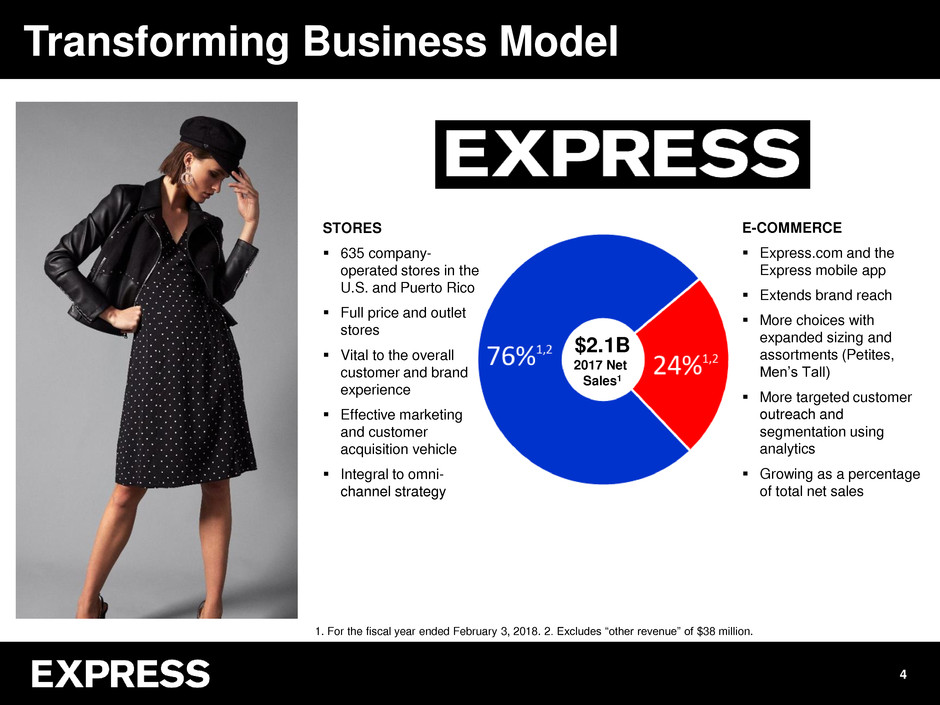
Transforming Business Model
$2.1B
2017 Net
Sales1
STORES
635 company-
operated stores in the
U.S. and Puerto Rico
Full price and outlet
stores
Vital to the overall
customer and brand
experience
Effective marketing
and customer
acquisition vehicle
Integral to omni-
channel strategy
E-COMMERCE
Express.com and the
Express mobile app
Extends brand reach
More choices with
expanded sizing and
assortments (Petites,
Men’s Tall)
More targeted customer
outreach and
segmentation using
analytics
Growing as a percentage
of total net sales
1. For the fiscal year ended February 3, 2018. 2. Excludes “other revenue” of $38 million.

Q4 & 2017
Results

6
Key 2017 Achievements
♦ Record e-commerce sales of $509 million, increasing
22% on a comparable sales basis, and accounting for
24% of net sales, up from 19% in the prior year period
♦ Successful relaunch of NEXT loyalty program, with
significant year-over-year growth in customer sign-ups
♦ Expanded omni-channel capabilities through the launch
of “ship from store” in 200 stores and the pilot of “buy
online, pick up in store”
♦ Further optimization of retail store footprint, closing 38
retail stores and converting another 24 stores to outlets
♦ Execution of outlet strategy, with a nearly 40% increase
in outlet store base through new openings and conversions
♦ Proactive management of our cost base, achieving
target of $20 million in cost savings through SG&A
expense reduction and lower sourcing costs
♦ Strengthening our balance sheet to $236 million in cash
at year-end with no debt obligations and repurchasing 2.1
million shares for $17 million

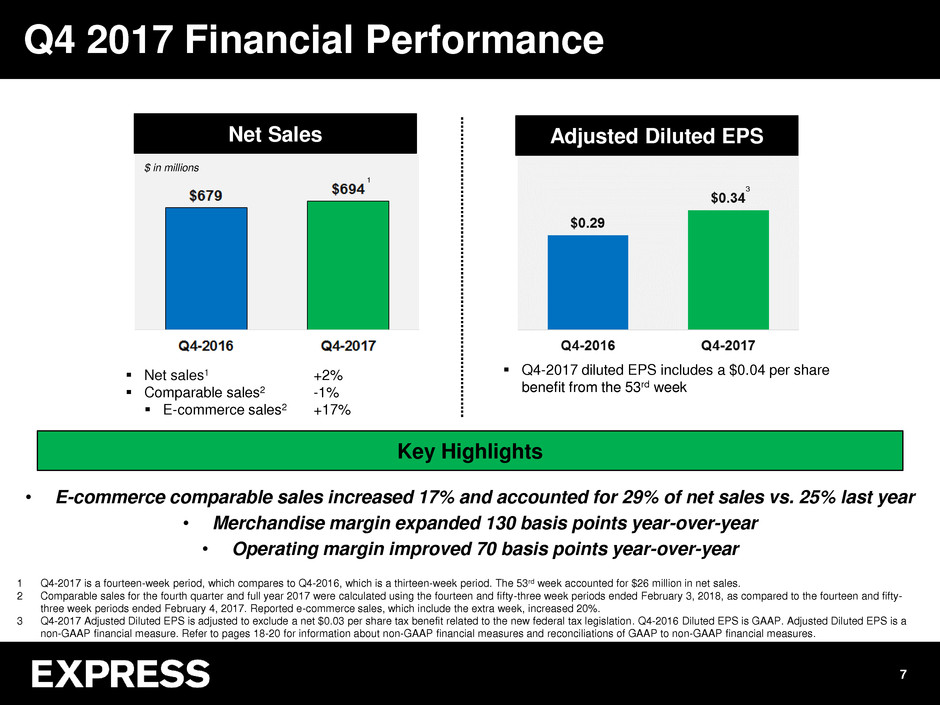
Q4-2017 diluted EPS includes a $0.04 per share
benefit from the 53rd week
7
Q4 2017 Financial Performance
$ in millions
Net Sales Adjusted Diluted EPS
Net sales1 +2%
Comparable sales2 -1%
E-commerce sales2 +17%
• E-commerce comparable sales increased 17% and accounted for 29% of net sales vs. 25% last year
• Merchandise margin expanded 130 basis points year-over-year
• Operating margin improved 70 basis points year-over-year
Key Highlights
1 Q4-2017 is a fourteen-week period, which compares to Q4-2016, which is a thirteen-week period. The 53rd week accounted for $26 million in net sales.
2 Comparable sales for the fourth quarter and full year 2017 were calculated using the fourteen and fifty-three week periods ended February 3, 2018, as compared to the fourteen and fifty-
three week periods ended February 4, 2017. Reported e-commerce sales, which include the extra week, increased 20%.
3 Q4-2017 Adjusted Diluted EPS is adjusted to exclude a net $0.03 per share tax benefit related to the new federal tax legislation. Q4-2016 Diluted EPS is GAAP. Adjusted Diluted EPS is a
non-GAAP financial measure. Refer to pages 18-20 for information about non-GAAP financial measures and reconciliations of GAAP to non-GAAP financial measures.
3
1

8
Fiscal Year 2017 Performance
$ in millions
Net Sales Adjusted Diluted EPS
Net sales1 -2%
Comparable sales2 -3%
E-commerce sales2 +22%
• E-commerce comparable sales increased 22%, accounting for 24% of net sales vs. 19% last year
• Successful expansion of our omni-channel capabilities
• Further optimized retail store footprint and expanded outlet strategy
• Achieved target of $20 million in cost savings
Key Highlights
2017 adjusted diluted EPS includes a $0.04
per share benefit from the 53rd week
1 2017 is a 53-week year, which compares to 2016, which is a 52-week year. The 53rd week accounted for $26 million in net sales.
2 Comparable sales for the fourth quarter and full year 2017 were calculated using the fourteen and fifty-three week periods ended February 3, 2018, as compared to the fourteen and fifty-
three week periods ended February 4, 2017. Reported e-commerce sales, which include the extra week, increased 23%.
3 Adjusted Diluted EPS is calculated based on Adjusted Net Income which excludes the impact of non-core items. Adjusted Diluted EPS is a non-GAAP financial measure. Refer to pages 18-
20 for information about non-GAAP financial measures and reconciliations of GAAP to non-GAAP financial measures.
3
1
3

9
2017 Balance Sheet And Cash Flow
$ in millions
Cash Capital Expenditures
No debt outstanding
Untapped revolver of up to $250M
• Strengthened balance sheet to $236 million in cash and no debt
• Generated solid operating cash flow of $119 million and free cash flow of $61 million1
• Repurchased 2.1 million shares for $17 million in 2017
• Subsequent to year-end, repurchased an additional 1.1 million shares for $8 million
$ in millions
Key Highlights
1. Free cash flow is a non-GAAP financial measure. Free cash flow represents cash flow from operations less capital expenditures. Refer to page 18 for information about non-
GAAP financial measures. Free cash flow of $61 million noted above is operating cash flow of $119 million less capital expenditures of $57 million.

2018 Financial
Guidance

11
♦ Our key 2018 initiatives include:
Delivering compelling new product and improving
upon key existing categories
Growing e-commerce and mobile sales
Expanding omni-channel capabilities
Investing in growing brand awareness and focusing
on customer acquisition and retention
Increasing NEXT loyalty and Express NEXT credit
card customers
Optimizing store footprint and executing outlet
strategy
Managing overall cost structure
2018 Key Initiatives

12
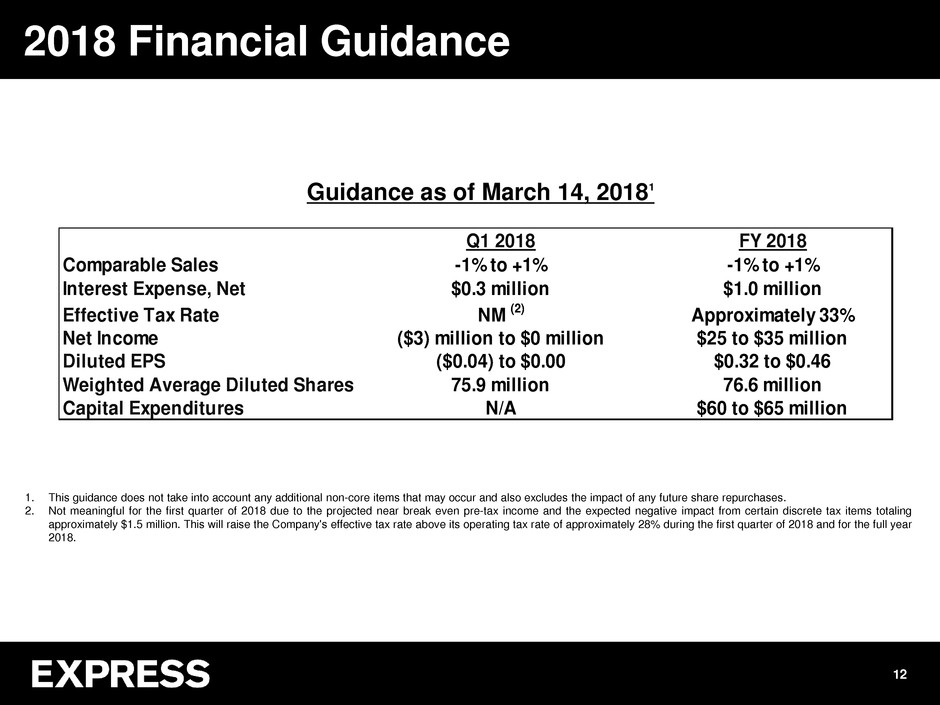
2018 Financial Guidance
Guidance as of March 14, 20181
Q1 2018 FY 2018
Comparable Sales -1% to +1% -1% to +1%
Interest Expense, Net $0.3 million $1.0 million
Effe tive Tax Rate NM (2) Approximately 33%
Net Income ($3) million to $0 million $25 to $35 million
Diluted EPS ($0.04) to $0.00 $0.32 to $0.46
75.9 million 76.6 million
Capital Expenditures N/A $60 to $65 million
Weighted Average Diluted Shares
1. This guidance does not take into account any additional non-core items that may occur and also excludes the impact of any future share repurchases.
2. Not meaningful for the first quarter of 2018 due to the projected near break even pre-tax income and the expected negative impact from certain discrete tax items totaling
approximately $1.5 million. This will raise the Company's effective tax rate above its operating tax rate of approximately 28% during the first quarter of 2018 and for the full year
2018.

Appendix

14
Projected 2018 Real Estate Activity

15
Our Store Portfolio
Net Sq Ft Growth 3% 3% 1% 2% 0% 0% -4% 0%
# of Stores
1 Projection for the period ending February 2, 2019.
1

16
New Revenue Recognition Standard
Our fiscal 2018 guidance reflects the adoption of new revenue recognition standards. While the adoption of the
new standard will not have a material impact on our overall results, it will change the timing and classification of
certain items on our income statement. As illustrated below, the new standard changes the timing of e-
commerce revenue recognition and impacts the accounting treatment for our loyalty and private label credit card
programs.
Revenue Recognition Impact
Net Sales
Cost of Goods Sold
SG&A Expense
Private Label Credit Card
Pre Adoption: recognized as an
offset to SG&A expense
Post Adoption: recognized in net
sales
Loyalty Program
Pre Adoption: recognized on a cost
basis
Post Adoption: recognized as a
deferral of revenue
E-Commerce Revenue
Pre Adoption: recognized when
merchandise is received by customer
Post Adoption: recognized when
merchandise is shipped
The Company is utilizing the full retrospective method of adoption and accordingly, has recast its income statements for 2016 and 2017. The Company has included the
recast statements in Exhibit 99.3 to its Form 8-K filed with the SEC on March 14, 2018 and posted them on its Investor Relations website.

Non-GAAP
Reconciliations

Cautionary Statement Regarding
Non-GAAP Financial Measures
Non-GAAP Financial Measures
This presentation contains references to Adjusted Net Income, Adjusted Diluted Earnings per Share (EPS), and Free Cash
Flow which are non-GAAP financial measures. These measures should be considered supplemental to and not a substitute
for financial information prepared in accordance with generally accepted accounting principles (GAAP) included in Express,
Inc.’s filings with the Securities and Exchange Commission and may differ from similarly titled measures used by others.
Please refer to slides 19-20 in this presentation for additional information and reconciliations of Adjusted Net Income and
Adjusted Diluted EPS to the most directly comparable financial measures calculated in accordance with GAAP. Management
believes that Adjusted Net Income and Adjusted Diluted EPS provide useful information because they exclude items that may
not be indicative of or are unrelated to our underlying business results, and provide a better baseline for analyzing trends in
our underlying business. In addition, Adjusted Diluted EPS is used as a performance measure in our executive compensation
program for purposes of determining the number of equity awards that are ultimately earned. Management believes that
Free Cash Flow provides useful information regarding liquidity as it shows our operating cash flow generation less cash
reinvested back into the business (capital expenditures).
18

19
Non-GAAP Reconciliations
Q4 2017 Adjusted Net Income and Adjusted Diluted EPS
Q4-2017 Adjusted Net Income and Adjusted Diluted EPS exclude a one-time gain related to tax reform, specifically the re-measurement
of the Company's deferred taxes, of $3.1 million, or $0.04 per share, as well as a tax impact of $0.4 million, or $0.01 per share, related
to the exit of Canada.
*
*

Fifty-Three Weeks Ended February 3, 2018
(in thousands, except per share amounts) Net Loss
Diluted
Earnings per
Share
Weighted
Average
Diluted
Shares
Outstanding
Reported GAAP Measure $ 19,366 $ 0.25 78,870
Impact of Canadian Exit 24,151 0.31
Income Tax Benefit - Canadian Exit (12,067 ) (0.15 )
Impact of Tax Reform (3,051 ) (0.04 )
Adjusted Non-GAAP Measure $ 28,399 $ 0.36
20
Non-GAAP Reconciliations
2016 and 2017 Adjusted Net Income and Adjusted Diluted EPS
* Does not foot due to rounding.
*

