Attached files
| file | filename |
|---|---|
| EX-99.1 - EXHIBIT 99.1 - 3D SYSTEMS CORP | exh_991.htm |
| 8-K - FORM 8-K - 3D SYSTEMS CORP | f8k_031418.htm |
EXHIBIT 99.2

Fourth Quarter and Full Year 2017 March 14, 2018

Welcome and Participants • Vyomesh Joshi – President & Chief Executive Officer • John McMullen – Executive Vice President & Chief Financial Officer • Andy Johnson – Executive Vice President & Chief Legal Officer • Stacey Witten – Vice President, Investor Relations To participate via phone, please dial: In the US : 1 - 877 - 407 - 8291 Outside the US: 1 - 201 - 689 - 8345 2

Forward Looking Statements This presentation contains certain statements that are not statements of historical or current facts are forward - looking stateme nts within the meaning of the Private Securities Litigation Reform Act of 1995. Forward - looking statements include statements concerning plans, objectives, goals, strategies, expectations , intentions, projections, developments, future events, performance or products, underlying assumptions, and other statements which are other than statements of historical facts. I n s ome cases, you can identify forward - looking statements by terms such as “believes,” “beliefs,” ''may,'' ''will,'' ''should,'' expects,'' ''intends,'' ''plans,'' ''anticipates,'' ''est ima tes,'' ''predicts,'' ''projects,'' ''potential,'' ''continue,'' and other similar terminology or the negative of these terms. From time to time, we may publish or otherwise make available forward - looking statements of thi s nature. All such forward - looking statements, whether written or oral, and whether made by us or on our behalf, are expressly qualified by the cautionary statements described on t his message including those set forth below. Forward - looking statements are based upon management’s beliefs, assumptions and current expectations concerning future events and trends, usi ng information currently available, and are necessarily subject to uncertainties, many of which are outside our control. In addition, we undertake no obligation to u pda te or revise any forward - looking statements made by us or on our behalf, whether as a result of future developments, subsequent events or circumstances, or otherwise, or to reflect the o ccu rrence or likelihood of unanticipated events, and we disclaim any such obligation. Forward - looking statements are only predictions that relate to future events or our future performance and are subject to known and unknown r isk s, uncertainties, assumptions, and other factors, many of which are beyond our control, that may cause actual results, outcomes, levels of activity, performance, deve lop ments, or achievements to be materially different from any future results, outcomes, levels of activity, performance, developments, or achievements expressed, anticipated, or implied b y t hese forward - looking statements. Although we believe that the expectations reflected in the forward - looking statements are reasonable, forward - looking statements are not, and should not be relied upon as a guarantee of future performance or results, nor will they necessarily prove to be accurate indications of the times at or by which any such performance or resul ts will be achieved. 3D System’s actual results could differ materially from those stated or implied in forward - looking statements. Past performance is not necessarily indicative of future results. We do not undertake any obligation to and do not intend to update any forward - looking statements whether as a result of future developments, subsequent events or circumstances o r otherwise. Further , we encourage you to review “Risk Factors” in Part 1 of our Annual Report on Form 10 - K and Part II of our quarterly reports on Form 10 - Q filed with the SEC as well as other information about us in our filings with the SEC. These are available at www.SEC.gov. 3

Vyomesh Joshi (VJ) President & Chief Executive Officer

Building the Foundation 5 • We are in a multi - year transformation, and actions last year centered around building the foundation to enable us to capitalize on the significant opportunity ahead • We focused on building the infrastructure, processes, analytics and organizational structure necessary to take the company forward • We have prioritized the critical needs and actions to stabilize the company and enable our market - based strategy to drive the expansion in 3D production • We believe we have built a foundation for a stronger company and closed the year in a position of strength for the future • Our energy and focus are on execution, improving efficiency and introducing disruptive new products to drive customers’ shift to 3D production
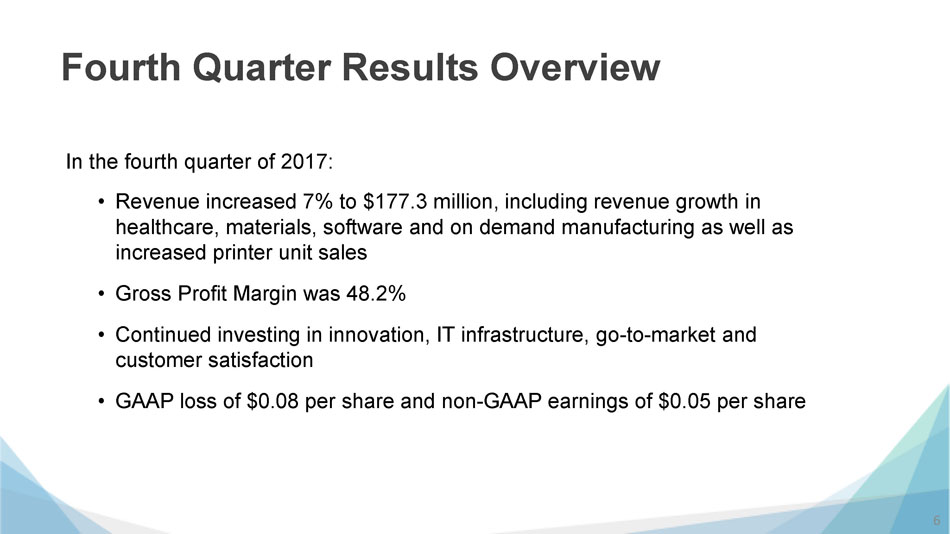
Fourth Quarter Results Overview 6 • Revenue increased 7% to $177.3 million, including revenue growth in healthcare, materials, software and on demand manufacturing as well as increased printer unit sales • Gross Profit Margin was 48.2% • Continued investing in innovation, IT infrastructure, go - to - market and customer satisfaction • GAAP loss of $0.08 per share and non - GAAP earnings of $ 0.05 per share In the fourth quarter of 2017:

John McMullen Executive Vice President & Chief Financial Officer
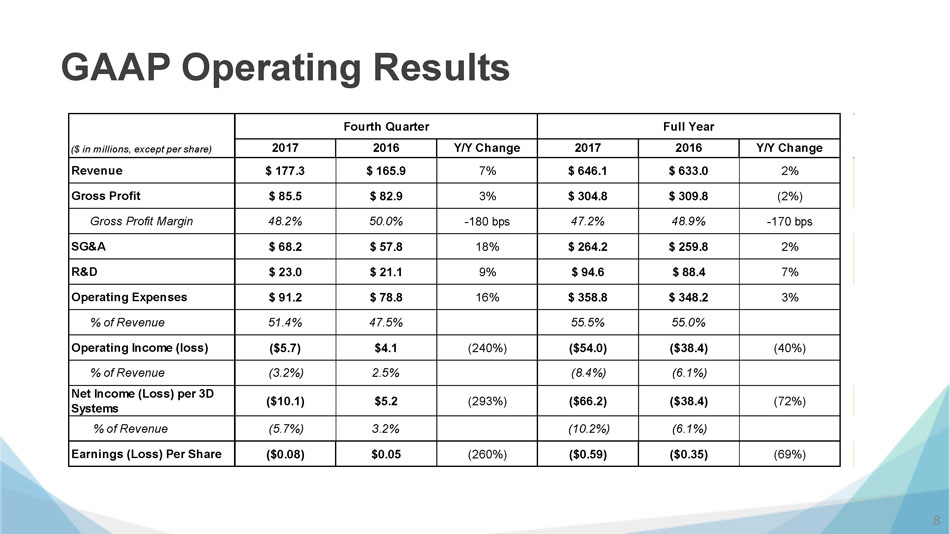
GAAP Operating Results 8 2017 2016 Y/Y Change 2017 2016 Y/Y Change $ 177.3 $ 165.9 7% $ 646.1 $ 633.0 2% $ 85.5 $ 82.9 3% $ 304.8 $ 309.8 (2%) 48.2% 50.0% -180 bps 47.2% 48.9% -170 bps $ 68.2 $ 57.8 18% $ 264.2 $ 259.8 2% $ 23.0 $ 21.1 9% $ 94.6 $ 88.4 7% $ 91.2 $ 78.8 16% $ 358.8 $ 348.2 3% 51.4% 47.5% 55.5% 55.0% ($5.7) $4.1 (240%) ($54.0) ($38.4) (40%) (3.2%) 2.5% (8.4%) (6.1%) ($10.1) $5.2 (293%) ($66.2) ($38.4) (72%) (5.7%) 3.2% (10.2%) (6.1%) ($0.08) $0.05 (260%) ($0.59) ($0.35) (69%) Operating Expenses Gross Profit Margin Gross Profit SG&A R&D Full YearFourth Quarter Earnings (Loss) Per Share % of Revenue Net Income (Loss) per 3D Systems % of Revenue Revenue ($ in millions, except per share) Operating Income (loss) % of Revenue

Non - GAAP Financial Measures 9 - We use non - GAAP measures to supplement our financial statements presented on a GAAP basis because management believes non - GAAP financial measures are useful to investors in evaluating our operating performance and to facilitate a better understanding o f t he impact that strategic acquisitions, non - recurring charges and certain non - cash expenses had on our financial results . - See appendix for reconciliation of non - GAAP items 2017 2016 Y/Y Change 2017 2016 Y/Y Change Non-GAAP R&D Expense $23.0 $21.1 9% $94.6 $82.3 15% Non-GAAP SG&A Expense $54.6 $45.2 21% $202.0 $187.9 8% Non-GAAP Operating Expenses $77.6 $66.2 17% $296.6 $270.2 10% Non-GAAP Net Income (Loss) $5.3 $16.7 (68%) ($1.7) $50.8 (103%) Non-GAAP Earnings (Loss) per Share $0.05 $0.15 (67%) ($0.02) $0.46 (104%) ($ in millions, except per share amounts) Fourth Quarter Full Year

Revenue Drivers • Healthcare solutions increased 13% to $50.4 million • Materials increased 8% to $42.8 million • Software increased 8% to $26.0 million • On demand manufacturing increased 10 % to $26.5 million • Printers revenue was approximately flat at $34.9 million Q4 2017 compared to Q4 2016: 10

Gross Profit and Margin • GPM was 48.2% in the fourth quarter and 47.2% in full year 2017 • Cost reduction initiatives were offset by additional investments in services and on demand manufacturing in 2017 11 - Q3 2016 GAAP GPM was negatively impacted by charges of $10.7 million related to project and product discontinuations, and Q3 2017 GAAP and non - GAAP GPM was negatively impacted by an inventory adjustment of $12.9 million $ in millions

Operating Expenses 12 • GAAP operating expenses increased 16% in Q4 and 3% for the full year • Non - GAAP operating expenses increased 17% in Q4 and 10% for the full year • SG&A expenses increased primarily from investments in go to market and IT • R&D expenses included investment in plastics, metals, materials and software in support of new products we plan to launch throughout 2018 - See appendix for a reconciliation of non - GAAP operating expenses $ in millions

Cash and Balance Sheet • Generated $8.2 million of cash from operations during Q4 • Generated $25.9 million of cash from operations in full year 2017 • Cash balance of $136.3 million at December 31, 2017 13

Outlook 14 • We are in the midst of a multi - year transformation of the company • We have made significant progress in many areas and completed a lot of foundational work in 2017, but we still have more work to do • We remain focused on continuing to improve our organization and operational efficiency and building the company for long - term growth, profitability and success • We have plans in place to improve P&L leverage and drive down operating costs over the next couple of years • Over the same period, we plan to balance investments with cost reductions, drive profitability, maintain a solid cash position, and ultimately, improve our earnings power

Vyomesh Joshi (VJ) President & Chief Executive Officer

Transformation and Driving Growth 16 • In 2017, we made significant progress to stabilize and turn around the company, addressed many legacy issues and put in place the foundation for scalable growth • We believe 2018 is a corner turn year in a multi - year transformation project • We are focused on execution, driving operational efficiencies and bringing our disruptive and innovative new products to market • We have a strong portfolio of additive manufacturing solutions for the entire digital manufacturing workflow, with a series of new product introductions planned throughout 2018 to further solidify our market leading portfolio

Enhance Market Leading Portfolio 17 • NextDent 5100, a Figure 4 - based 3D printer designed for dental labs, combined with a total of 30 dental materials for a wide range of indications • FabPro 1000, a low - cost , high - productivity, DLP - based 3D printer designed for dental and jewelry production and high functionality, industrial prototyping • ProX SLS 6100 with six production - grade materials to deliver superior part quality with greater efficiency and lower total cost of operation versus our competitors • Figure 4 platform with standalone, modular and fully automated solutions designed to meet various production environment needs across our targeted vertical markets • DMP 8500, a scalable, automated, fully - integrated next generation metals platform to deliver a true end - to - end solution for metal additive manufacturing

Q&A Session In the USA: 1 - 877 - 407 - 8291 Outside the USA: 1 - 201 - 689 - 8345
Thank You

Appendix

Revenue Summary by Category 21 $ in millions Q4 2017 Q3 2017 Q4 2016 YOY Change Sequential Change Printers $ 34.9 $ 29.4 $ 35.1 (1%) 19% Software Products $ 14.6 $ 10.6 $ 12.8 14% 38% Other Products $ 10.1 $ 8.2 $ 12.3 (18%) 23% Total Products $ 59.6 $ 48.2 $ 60.2 (1%) 24% Total Materials $ 42.8 $ 39.4 $ 39.7 8% 9% On Demand Manufacturing $ 26.5 $ 27.2 $ 24.2 10% (3%) Software Services $ 11.4 $ 10.7 $ 11.2 2% 7% Other Services $ 37.0 $ 27.4 $ 30.6 9% 35% Total Services $ 74.9 $ 65.3 $ 66.0 13% 15% Total Revenue $ 177.3 $ 152.9 $ 165.9 7% 16% Software $ 26.0 $ 21.3 $ 24.0 8% 22% Healthcare $ 50.4 $ 46.6 $ 44.6 13% 8%

Non - GAAP Reconciliation 22 Q4 and Full Year Non - GAAP Earnings (Loss) Per Share 2017 2016 2017 2016 GAAP Net income (loss) attributable to 3D Systems Corporation ($10.1) $5.2 ($66.2) ($38.4) Adjustments: Amortization, stock-based compensation & other 1 $15.1 $12.7 $62.9 $78.3 Legal and acquisition-related 2 ($1.4) $0.0 ($0.1) $4.5 Portfolio restructuring 3 $0.0 $0.0 $0.0 $6.1 Impairment of cost-method investments 4 $1.7 $0.0 $1.7 $0.0 Tax effect of adjustments 5 $0.0 ($1.2) $0.0 $0.3 Non-GAAP net income (loss) attributable to 3D Systems Corporation $5.3 $16.7 ($1.7) $50.8 Non-GAAP net income (loss) per share available to 3D Systems common stock holders - basic and diluted 6 $0.05 $0.15 ($0.02) $0.46 5 Tax effect for the quarter ended March 31, 2016 was calculated quarterly based on the Company's overall tax rate. Tax effect for each quarter ended after March 31, 2016 was calculated based on the Company's quarterly U.S. tax rate of 0%, which is due to valuation allowances in connection with GAAP net losses. The amount in the fourth quarter of 2016 also includes $1.2 million related to an adjustment for a prior period. 6 Denominator based on weighted average shares used in the GAAP EPS calculation. ($ in millions, except per share amounts) Fourth Quarter Full Year 1 For the quarter ended December 31, 2017, the adjustment included $0.1 in COGS and $15.0 in SG&A. For the quarter ended December 31, 2016, the adjustment included $0.1 in COGS and $12.6 in SG&A. For the year ended December 31, 2017, the adjustment included $0.4 in COGS and $62.5 in SG&A. For the year ended December 31, 2016, the adjustment included $11.1 in COGS and $67.2 in SG&A. 2 For the quarter ended December 31, 2017, the adjustment included ($1.4) in SG&A. For the year ended December 31, 2017, the adjustment included ($0.3) in SG&A and $0.2 in interest and other expense, net. For the year ended December 31, 2016 the adjustment included $4.5 in SG&A. 3 For the year ended December 31, 2016, the adjustment included $6.1 in R&D. 4 The Company has minority investments of less than 20% ownership in enterprises that benefit from, or are powered by its technology portfolio. The value of each of these investments is assessed periodically, and impairment recorded when required. For the quarter and year ended December 31, 2017, the adjustment included $1.7 in interest and other expense, net. The Company excluded this amount as it is not related to on-going operations, and intends to exclude these impairment amounts from non- GAAP net income going forward. For the quarter and year ended December 31, 2016, the Company recorded a $1.2 million impairment, but did not record an adjustment to non-GAAP net income.

Non - GAAP Reconciliation 23 Q4 and Full Year Gross Profit & Margin 2017 2016 2017 2016 GAAP Gross Profit $85.5 $82.9 $304.8 $309.8 GAAP Gross Profit Margin 48.2% 50.0% 47.2% 48.9% Adjustments: Amortization, stock-based compensation & other $0.1 $0.1 $0.4 $11.1 Legal and acquisition-related 1 $0.0 $0.0 $0.0 $0.0 Non-GAAP Gross Profit $85.6 $83.0 $305.3 $320.9 Non-GAAP Gross Profit Margin 48.3% 50.0% 47.2% 50.7% ($ in millions) Fourth Quarter Full Year
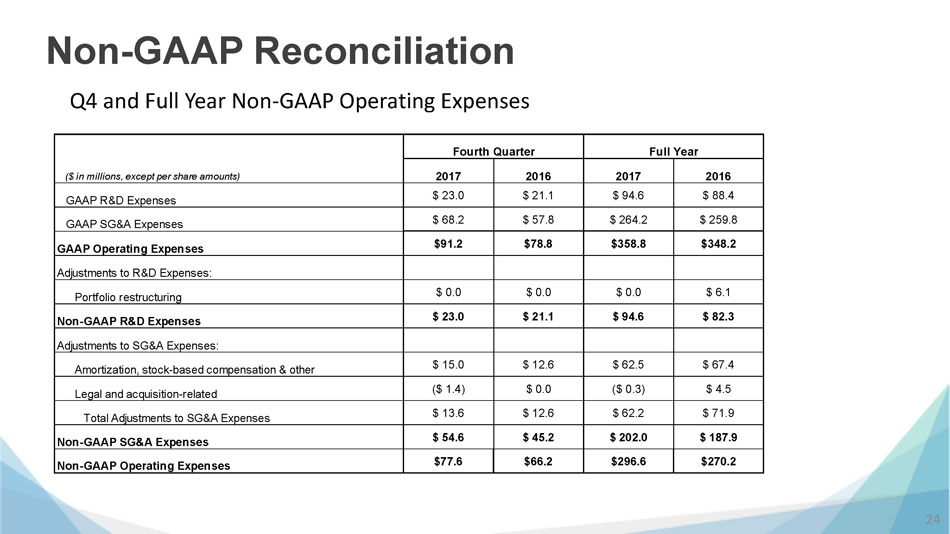
Non - GAAP Reconciliation 24 Q4 and Full Year Non - GAAP Operating Expenses 2017 2016 2017 2016 GAAP R&D Expenses $ 23.0 $ 21.1 $ 94.6 $ 88.4 GAAP SG&A Expenses $ 68.2 $ 57.8 $ 264.2 $ 259.8 GAAP Operating Expenses $91.2 $78.8 $358.8 $348.2 Adjustments to R&D Expenses: Portfolio restructuring $ 0.0 $ 0.0 $ 0.0 $ 6.1 Non-GAAP R&D Expenses $ 23.0 $ 21.1 $ 94.6 $ 82.3 Adjustments to SG&A Expenses: Amortization, stock-based compensation & other $ 15.0 $ 12.6 $ 62.5 $ 67.4 Legal and acquisition-related ($ 1.4) $ 0.0 ($ 0.3) $ 4.5 Total Adjustments to SG&A Expenses $ 13.6 $ 12.6 $ 62.2 $ 71.9 Non-GAAP SG&A Expenses $ 54.6 $ 45.2 $ 202.0 $ 187.9 Non-GAAP Operating Expenses $77.6 $66.2 $296.6 $270.2 ($ in millions, except per share amounts) Fourth Quarter Full Year

Non - GAAP Reconciliation 25 Q3 and Nine Months Non - GAAP Earnings (Loss) Per Share 2017 2016 2017 2016 GAAP Net loss attributable to 3D Systems Corporation ($37.7) ($21.2) ($56.1) ($43.6) Adjustments: Amortization, stock-based compensation & other 1 $15.5 $29.1 $47.7 $65.6 Legal and acquisition-related 2 ($0.4) $1.8 $1.4 $4.5 Portfolio restructuring 3 $0.0 $6.1 $0.0 $6.1 Tax effect of adjustments 4 $0.0 $0.0 $0.0 $1.5 Non-GAAP net income attributable to 3D Systems Corporation ($22.6) $15.8 ($7.0) $34.1 Non-GAAP net income per share available to 3D Systems common stock holders - basic and diluted 5 ($0.20) $0.14 ($0.06) $0.31 5 Denominator based on diluted shares used in the GAAP EPS calculation. ($ in millions, except per share amounts) Third Quarter Nine Months 1 For the quarter ended September 30, 2017, the adjustment included $0.1 in COGS and $15.4 in SG&A. For the quarter ended September 30, 2016, the adjustment included $10.8 in COGS and $18.3 SG&A. For the nine months ended September 30, 2017, the adjustment included $0.3 in COGS and $47.4 in SG&A. For the nine months ended September 30, 2016, the adjustment included $10.9 in COGS and $54.7 in SG&A. 2 For the quarter ended September 30, 2017, the adjustment included ($0.4) in SG&A. For the quarter ended September 30, 2016 the adjustment included $1.8 in SG&A. For the nine months ended September 30, 2017, the adjustment included $1.2 in SG&A and $0.2 in interest and other income, net. For the nine months ended September 30, 2016 the adjustment included $4.5 in SG&A. 4 Tax effect for the quarter ended March 31, 2016 was calculated quarterly based on the Company's overall tax rate. Tax effect for the quarters ended after March 31, 2016 were calculated based on the Company's quarterly U.S. tax rate of 0%, which is due to valuation allowances in connection with GAAP net losses. 3 For the quarter and nine months ended September 30, 2016, the adjustment included $6.1 in R&D.

Non - GAAP Reconciliation 26 Q3 and Nine Months Gross Profit & Margin 2017 2016 2017 2016 GAAP Gross Profit $58.5 $68.9 $219.4 $226.9 GAAP Gross Profit Margin 38.3% 44.1% 46.8% 48.6% Adjustments: Amortization, stock-based compensation & other $0.1 $10.8 $0.3 $11.0 Legal and acquisition-related 1 $0.0 $0.0 $0.0 $0.0 Non-GAAP Gross Profit $58.6 $79.7 $219.7 $237.9 Non-GAAP Gross Profit Margin 38.3% 51.0% 46.9% 50.9% 1 For the nine months ended September 30, 2016, the adjustment included $20,000 and therefore rounded down. ($ in millions) Third Quarter Nine Months

Non - GAAP Reconciliation 27 Q3 and Nine Months Non - GAAP Operating Expenses 2017 2016 2017 2016 GAAP R&D Expenses $ 24.4 $ 26.1 $ 71.7 $ 67.4 GAAP SG&A Expenses $ 66.5 $ 64.8 $ 196.0 $ 202.0 GAAP Operating Expenses $90.9 $90.9 $267.7 $269.4 Adjustments to R&D Expenses: Portfolio restructuring $ 0.0 $ 6.1 $ 0.0 $ 6.1 Non-GAAP R&D Expenses $ 24.4 $ 20.0 $ 71.7 $ 61.3 Adjustments to SG&A Expenses: Amortization, stock-based compensation & other $ 15.8 $ 18.3 $ 47.4 $ 56.5 Legal and acquisition-related ($ 0.8) $ 1.7 $ 1.2 $ 2.7 Portfolio restructuring $ 0.0 $ 0.0 $ 0.0 $ 0.0 Total Adjustments to SG&A Expenses $ 15.0 $ 20.0 $ 48.6 $ 59.2 Non-GAAP SG&A Expenses $ 51.5 $ 44.8 $ 147.4 $ 142.8 Non-GAAP Operating Expenses $75.9 $64.8 $219.1 $204.1 ($ in millions, except per share amounts) Third Quarter Nine Months

Non - GAAP Reconciliation 28 Q2 and Six Months Non - GAAP Earnings (Loss) Per Share 2017 2016 2017 2016 GAAP Net loss attributable to 3D Systems Corporation ($8.4) ($4.6) ($18.4) ($22.4) Adjustments: Amortization, stock-based compensation & other 1 $ 16.3 $ 16.1 $ 32.3 $ 36.6 Legal and acquisition-related 2 $ 0.7 $ 1.8 $ 1.7 $ 2.7 Tax effect of adjustments 3 - - - $ 1.5 Non-GAAP net income attributable to 3D Systems Corporation $8.6 $13.2 $15.6 $18.4 Non-GAAP net income per share available to 3D Systems common stock holders - basic and diluted 4 $ 0.08 $ 0.12 $ 0.14 $ 0.17 4 Denominator based on diluted shares used in the GAAP EPS calculation. ($ in millions, except per share amounts) Second Quarter Six Months 1 For the quarter ended June 30, 2017, the adjustment included $0.1 in COGS and $16.2 in SG&A. For the quarter ended June 30, 2016, the adjustment included $0.1 in COGS and $16.0 SG&A. For the six months ended June 30, 2017, the adjustment included $0.2 in COGS and $32.1 in SG&A. For the six months ended June 30, 2016, the adjustment included $0.2 in COGS and $36.4 in SG&A. 2 For the quarter ended June 30, 2017, the adjustment included $0.5 in SG&A and $0.2 in interest and other income, net. For the quarter ended June 30, 2016 the adjustment included $1.8 in SG&A. For the six months ended June 30, 2017, the adjustment included $1.5 in SG&A and $0.2 in interest and other income, net. For the six months ended June 30, 2016 the adjustment included $2.7 in SG&A. 3 Tax effect for the quarter ended March 31, 2016 was calculated quarterly based on the Company's overall tax rate. Tax effect for the quarters ended after March 31, 2016 were calculated based on the Company's quarterly U.S. tax rate of 0%, which is due to valuation allowances in connection with GAAP net losses.

Non - GAAP Reconciliation 29 Q2 and Six Months Non - GAAP Operating Expenses 2017 2016 2017 2016 GAAP R&D Expenses $ 24.4 $ 20.9 $ 47.3 $ 41.2 GAAP SG&A Expenses $ 63.1 $ 63.2 $ 129.5 $ 137.2 GAAP Operating Expenses $87.5 $84.1 $176.8 $178.4 Adjustments 1 : Amortization, stock-based compensation & other $ 16.2 $ 16.0 $ 32.1 $ 36.4 Legal and acquisition-related $ 0.5 $ 1.8 $ 1.5 $ 2.7 Non-GAAP Operating Expenses $70.8 $66.3 $143.2 $139.3 ($ in millions, except per share amounts) Second Quarter Six Months 1 For the quarter and six months ended June 30, 2017, the adjustments only impacted SG&A expenses.

Non - GAAP Reconciliation 30 Q1 Non - GAAP Earnings (Loss) Per Share 2017 2016 GAAP Net loss attributable to 3D Systems Corporation ($10.0) ($17.8) Adjustments: Amortization, stock-based compensation & other 1 $ 16.0 $ 20.5 Legal and acquisition-related 2 $ 1.1 $ 1.0 Tax effect of adjustments 3 - $ 1.5 Non-GAAP net income attributable to 3D Systems Corporation $7.1 $5.2 Non-GAAP net income per share available to 3D Systems common stock holders - basic and diluted 4 $ 0.06 $ 0.05 4 Denominator based on diluted shares used in the GAAP EPS calculation. ($ in millions, except per share amounts) First Quarter 1 For the quarter ended March 31, 2017, the adjustment included $0.1 in COGS and $15.9 in SG&A. For the quarter ended March 31, 2016, the adjustment included $0.1 in COGS and $20.4 SG&A. 2 For the quarter ended March 31, 2017, the adjustment included $1.1 in SG&A. For the quarter ended March 31, 2016 the adjustment included $0.9 in SG&A. 3 Tax effect for the quarter ended March 31, 2016 was calculated quarterly based on the Company's overall tax rate. Tax effect for the quarters ended after March 31, 2016 were calculated based on the Company's quarterly U.S. tax rate of 0%, which is due to valuation allowances in connection with GAAP net losses.

Non - GAAP Reconciliation 31 Q1 Non - GAAP Operating Expenses 2017 2016 GAAP R&D Expenses $ 22.9 $ 20.3 GAAP SG&A Expenses $ 66.4 $ 74.0 GAAP Operating Expenses $89.3 $94.3 Adjustments 1 : Amortization, stock-based compensation & other $ 15.9 $ 20.4 Legal and acquisition-related $ 1.1 $ 1.0 Non-GAAP Operating Expenses $72.3 $72.9 ($ in millions, except per share amounts) First Quarter 1 For the quarter ended March 31, 2017, the adjustments only impacted SG&A expenses.
Thank You