Attached files
| file | filename |
|---|---|
| EX-32.2 - EX-32.2 - TriplePoint Venture Growth BDC Corp. | tpvg-ex322_26.htm |
| EX-32.1 - EX-32.1 - TriplePoint Venture Growth BDC Corp. | tpvg-ex321_27.htm |
| EX-31.2 - EX-31.2 - TriplePoint Venture Growth BDC Corp. | tpvg-ex312_28.htm |
| EX-31.1 - EX-31.1 - TriplePoint Venture Growth BDC Corp. | tpvg-ex311_29.htm |
| EX-21.1 - EX-21.1 - TriplePoint Venture Growth BDC Corp. | tpvg-ex211_30.htm |
| EX-14.1 - EX-14.1 - TriplePoint Venture Growth BDC Corp. | tpvg-ex141_31.htm |
UNITED STATES
SECURITIES AND EXCHANGE COMMISSION
Washington, D.C. 20549
Form 10-K
(Mark One)
|
☒ |
ANNUAL REPORT PURSUANT TO SECTION 13 OR 15(d) OF THE SECURITIES EXCHANGE ACT OF 1934 |
FOR THE FISCAL YEAR ENDED DECEMBER 31, 2017
OR
|
☐ |
TRANSITION REPORT PURSUANT TO SECTION 13 OR 15(d) OF THE SECURITIES EXCHANGE ACT OF 1934 |
FOR THE TRANSITION PERIOD FROM TO
COMMISSION FILE NUMBER: 814-01044
TriplePoint Venture Growth BDC Corp.
(Exact name of registrant as specified in its charter)
|
MARYLAND |
|
46-3082016 |
|
(State or other jurisdiction of incorporation or organization) |
|
(I.R.S. Employer Identification No.) |
TriplePoint Venture Growth BDC Corp.
2755 Sand Hill Road, Suite 150, Menlo Park, California 94025
(Address of principal executive office)
(650) 854-2090
(Registrant’s telephone number, including area code)
Securities registered pursuant to Section 12(b) of the Act:
|
Title of Each Class |
|
Name of Each Exchange on Which Registered |
|
Common Stock, par value $0.01 per share 5.75% Notes due 2022 |
|
The New York Stock Exchange The New York Stock Exchange |
Securities registered pursuant to Section 12(g) of the Act:
None
Indicate by check mark if the registrant is a well-known seasoned issuer, as defined in Rule 405 of the Securities Act. Yes ☐ No ☒
Indicate by check mark if the registrant is not required to file reports pursuant to Section 13 or Section 15(d) of the Act. Yes ☐ No ☒
Indicate by check mark whether the registrant (1) has filed all reports required to be filed by Section 13 or 15(d) of the Securities Exchange Act of 1934 during the preceding 12 months (or for such shorter period that the registrant was required to file such reports), and (2) has been subject to such filing requirements for the past 90 days. Yes ☒ No ☐ .
Indicate by check mark whether the registrant has submitted electronically and posted on its corporate Web site, if any, every Interactive Data File required to be submitted and posted pursuant to Rule 405 of Regulation S-T (§ 232.405 of this chapter) during the preceding 12 months (or for such shorter period that the registrant was required to submit and post such files). Yes ☐ No ☐
Indicate by check mark if disclosure of delinquent filers pursuant to Item 405 of Regulation S-K is not contained herein, and will not be contained, to the best of Registrant’s knowledge, in definitive proxy or information statements incorporated by reference in Part III of this Form 10-K or any amendment to this Form 10-K. ☒
Indicate by check mark whether the registrant is a large accelerated filer, an accelerated filer, a non-accelerated filer, smaller reporting company, or an emerging growth company. See the definitions of “large accelerated filer,” “accelerated filer,” “smaller reporting company,” and “emerging growth company” in Rule 12b-2 of the Exchange Act.
|
Large accelerated filer |
☐ |
Accelerated filer |
☒ |
|
Non-accelerated filer |
☐ |
Smaller reporting company |
☐ |
|
Emerging growth company |
☒ |
|
|
If an emerging growth company, indicate by check mark if the registrant has elected not to use the extended transition period for complying with any new or revised financial accounting standards provided pursuant to Section 13(a) of the Exchange Act. ☒
Indicate by check mark whether the registrant is a shell company (as defined in Rule 12b-2 of the Exchange Act). Yes ☐ No ☒
The aggregate market value of common stock held by non-affiliates of the Registrant on June 30, 2017 based on the closing price on that date of $13.31 on the New York Stock Exchange was $210.2 million. For the purposes of calculating this amount only, all directors and executive officers of the Registrant have been treated as affiliates. There were 17,730,091 shares of the Registrant’s common stock outstanding as of March 9, 2018.
Documents Incorporated by Reference: Portions of the Registrant’s Proxy Statement relating to the Registrant’s 2018 Annual Meeting of Stockholders to be filed not later than 120 days after the end of the fiscal year covered by this Annual Report on Form 10-K are incorporated by reference into Part III of this Annual Report on Form 10-K.
TRIPLE POINT VENTURE GROWTH BDC CORP
FORM 10-K
FOR THE YEAR ENDED DECEMBER 31, 2017
TABLE OF CONTENTS
|
|
|
|
|
|
|
Page |
|
|
PART I |
|
|
Item 1. |
1 |
|
|
Item 1A. |
30 |
|
|
Item 1B. |
57 |
|
|
Item 2. |
57 |
|
|
Item 3. |
57 |
|
|
Item 4. |
57 |
|
|
|
|
|
|
|
PART II |
|
|
Item 5. |
58 |
|
|
Item 6. |
61 |
|
|
Item 7. |
Management’s Discussion and Analysis of Financial Condition and Results of Operations |
62 |
|
Item 7A. |
83 |
|
|
Item 8. |
84 |
|
|
Item 9. |
Changes in and Disagreements with Accountants on Accounting and Financial Disclosure |
121 |
|
Item 9A. |
121 |
|
|
Item 9B. |
122 |
|
|
|
|
|
|
|
PART III |
|
|
|
|
|
|
Item 10. |
123 |
|
|
Item 11. |
123 |
|
|
Item 12. |
Security Ownership of Certain Beneficial Owners and Management and Related Stockholder Matters |
123 |
|
Item 13. |
Certain Relationships and Related Transactions and Director Independence |
123 |
|
Item 14. |
123 |
|
|
|
|
|
|
|
PART IV |
|
|
Item 15. |
124 |
|
|
Item 16. |
126 |
|
|
|
127 |
Except as otherwise indicated in this annual report on Form 10-K, the terms:
|
|
• |
“we,” “us” and “our” refer to TriplePoint Venture Growth BDC Corp., a Maryland corporation, and its wholly owned subsidiaries; |
|
|
• |
“Adviser” refers to TPVG Advisers LLC, a Delaware limited liability company, our investment adviser and a subsidiary of TPC; |
|
|
• |
“Administrator” refers to TPVG Administrator LLC, a Delaware limited liability company, our administrator and a subsidiary of our Adviser; |
|
|
• |
“TPC” and “TriplePoint Capital” refers to TriplePoint Capital LLC, a Delaware limited liability company; and |
|
|
• |
“Financing Subsidiary” refers to TPVG Variable Funding Company LLC, a Delaware limited liability company and our wholly owned subsidiary. |
Overview
We are an externally managed, closed-end, non-diversified management investment company that has elected to be treated as a business development company, or “BDC,” under the Investment Company Act of 1940, as amended, or the “1940 Act.” We also have elected to be treated, and intend to qualify annually thereafter, as a regulated investment company, or “RIC,” under Subchapter M of the Internal Revenue Code of 1986, as amended, or the “Code,” for U.S. federal income tax purposes beginning with our taxable year ended December 31, 2014. We are an “emerging growth company” under the Jumpstart Our Business Startups Act of 2012, as amended, or the “JOBS Act.” For so long as we remain an emerging growth company under the JOBS Act, we will be subject to reduced public company reporting requirements.
We serve as the primary financing source for the venture growth stage business segment of TriplePoint Capital’s global investment platform. Our investment objective is to maximize our total return to stockholders primarily in the form of current income and, to a lesser extent, capital appreciation by primarily lending with warrant investments to venture growth stage companies focused in technology, life sciences and other high growth industries that are backed by TPC’s select group of leading venture capital investors.
We originate and invest primarily in loans that have a secured collateral position and are used by venture growth stage companies to finance their continued expansion and growth, equipment financings and, on a select basis, revolving loans, together with, in many cases, attached equity “kickers” in the form of warrant investments, and direct equity investments. We underwrite our investments seeking an unlevered yield-to-maturity on our growth capital loans and equipment financings generally ranging from 10% to 18% and on our revolving loans generally ranging from 1% above the applicable prime rate to 10%, in each case, with potential for higher returns in the event we are able to exercise warrant investments and realize gains or sell our related equity investments at a profit. We also generally underwrite our secured loans seeking a loan-to-enterprise value of less than 25%.
We make investments that our Adviser’s senior investment team believes have a low probability of loss due to our expertise and the revenue profile, product validation, customer commitments, intellectual property, financial condition and enterprise value of the potential opportunity. We believe these investments provide us with a stable, fixed-income revenue stream along with the potential for equity-related gains on a risk-adjusted basis. We believe that the venture growth stage debt market presents a compelling growth channel for us because it has high barriers to entry and is underserved by both traditional lenders and existing debt financing providers to venture capital-backed companies given the brand, reputation and market acceptance, industry relationships, venture lending and leasing expertise, specialized skills, track record, and other factors required to lend to companies backed by leading venture capital investors. Additionally, we believe our investments are distinct compared with the investments made by more traditional lenders because our investments provide us the ability to invest alongside leading venture capital investors in companies focused in technology, life sciences and other high growth industries. We also believe that our investments are distinct compared to the investments made by existing debt financing providers to venture capital backed companies given our primary focus on venture growth stage companies backed by TPC’s select group of leading venture capital investors.
We believe we are able to successfully structure these investments as a result of the strong value proposition our secured loans offer to both borrowers and their venture capital investors. Our secured loans provide venture growth stage companies with an opportunity to:
|
|
• |
diversify their funding sources; |
|
|
• |
augment their existing capital base and extend operating capital; |
1
|
|
• |
fund administrative expenses ahead of anticipated corresponding revenue; |
|
|
• |
expand product offerings through internal development or acquisitions; |
|
|
• |
lower the upfront costs of capital expenditures; |
|
|
• |
build and/or expand their leadership positions within their respective markets; |
|
|
• |
accelerate and/or smooth out the timing of cash collections; and |
|
|
• |
delay and/or postpone the need for its next round of equity financing, |
in each case, extending its cash available to fund operations without incurring substantial equity dilution during a critical time in their lifecycle when they are meaningfully building enterprise value.
We commenced investment activities on March 5, 2014. In order to expedite the ramp-up of our investment activities and further our ability to meet our investment objectives, on March 5, 2014, we acquired our initial portfolio. On March 11, 2014, we completed our initial public offering and received $141.6 million of net proceeds in connection with the initial public offering and concurrent private placement, net of the portion of the underwriting sales load and offering costs we paid. In 2015, we completed a follow-on public offering of our common stock raising approximately $95.9 million after offering costs. On October 25, 2017, we sold in a private placement transaction: (i) 1,594,007 shares of our common stock at a price of $13.54 per share to certain investment funds managed by the Alternative Investments & Manager Selection Group of Goldman Sachs Asset Management, L.P. and (ii) 73,855 shares of our common stock at a price of $13.65 per share to certain of our executive officers, for total gross proceeds of approximately $22.6 million.
In February 2014, we entered into a credit agreement with Deutsche Bank acting as administrative agent and a lender, and KeyBank National Association, Everbank Commercial Lender Finance, Inc., and AloStar Bank of Commerce, as other lenders, which provided us with a $150.0 million commitment, subject to borrowing base requirements (the “Credit Facility”). In January 2018 we amended and renewed the Credit Facility. Deutsche Bank AG, New York Branch serves as administrative agent and as a lender together with existing lenders KeyBank National Association and EverBank Commercial Lender Finance, Inc., and new lender MUFG Union Bank, N.A, under the Credit Facility. The amendment and renewal, among other things, increased the total commitments by $10.0 million to $210.0 million, extended the revolving period from February 21, 2018 to February 21, 2020 and extended the maturity date from February 21, 2019 to August 21, 2021. In addition, the amended Credit Facility includes a reduction in the undrawn rate from 0.75% to 0.50% and a reduction in the applicable margin during the revolving period to 2.80% if facility utilization is greater than or equal to 75%, 2.90% if utilization is greater than or equal to 50%, and 3.00% if utilization is less than 50%. Borrowings under the Credit Facility are subject to its various covenants and the leverage restrictions contained in the 1940 act.
On July 14, 2017, we completed a public offering of $65.0 million in aggregate principal amount of 5.75% Notes due 2022 (the "2022 Notes") and received net proceeds of approximately $62.8 million, after the payment of fees and offering costs. On July 24, 2017, as a result of the underwriters’ full exercise of their option to purchase additional 2022 Notes, we issued an additional $9.75 million in aggregate principal amount of the 2022 Notes and received net proceeds of approximately $9.4 million, after the payment of fees and offering costs. The interest on the 2022 Notes is payable quarterly on January 15, April 15, July 15 and October 15, beginning October 15, 2017. The 2022 Notes are currently listed on the New York Stock Exchange (“NYSE”) under the symbol “TPVY”. The 2022 Notes were issued in integral principal amount multiples of $25.
TriplePoint Capital, Adviser, and Administrator
TriplePoint Capital
TriplePoint Capital is widely recognized as a leading global financing provider devoted to serving venture capital-backed companies with creative, flexible and customized debt financing, equity capital and complementary services throughout their lifespan. TPC is located on Sand Hill Road in Silicon Valley and has a primary focus in technology, life sciences and other high growth industries. TPC’s portfolio of venture capital-backed companies included and/or includes widely recognized and industry-leading companies, including, among others, Facebook, YouTube, AppNexus, Bloom Energy, Chegg, Etsy, Oncomed, Proteolix, Ring Central, Ruckus Wireless, Segway, Shazam, Splunk, Square, Varonis, and Workday.
2
TPC’s global investment platform serves venture capital-backed companies backed by its select group of leading venture capital investors across all stages of development of a venture capital-backed company’s lifecycle with dedicated business segments focused on providing creative, flexible and customized debt financings and complementary services at each stage. TPC categorizes venture capital-backed companies into the following five lifecycle stages of development: seed, early, later, venture growth and public. For additional information on how we define each market stage, see “Business—Market Opportunity”. In addition, TPC has a business segment targeting equity investing in seed, early and later stage venture capital-backed companies called TriplePoint Ventures. TPC also has a “fund of funds” business segment that seeks to selectively invest in venture capital funds established by certain of its select group of leading venture capital investors.
TPC utilizes a unique, relationship-based lending strategy that primarily targets companies funded by a select group of leading venture capital investors. TPC refers to this approach as the “TriplePoint Lifespan Approach.” Key elements of the TriplePoint Lifespan Approach include:
|
|
• |
establishing debt financing relationships with select venture capital-backed companies across all five lifecycle stages of development; |
|
|
• |
working with TPC’s select group of leading venture capital investors to identify debt financing opportunities within their portfolio companies that we believe have established management teams, strong investor support, large market opportunities, innovative technology or intellectual property and sufficient cash on hand and equity backing to support a potential debt financing opportunity on attractive risk-adjusted terms; |
|
|
• |
developing debt financing relationships as early as possible in a venture capital-backed company’s lifecycle in order to have a real-time understanding of the company’s capital needs and be in a strategic position to evaluate and capitalize on additional investment opportunities as the company matures; |
|
|
• |
diligently monitoring the progress and ongoing creditworthiness of a borrower; and |
|
|
• |
serving as a creative, flexible and dependable financing partner with a focus on efficiency, responsiveness and customer service. |
Our Adviser
Our investment activities are managed by our Adviser, which is registered as an investment adviser under the Investment Advisers Act of 1940, as amended, or the “Advisers Act” and is a wholly owned subsidiary of TPC. Our Adviser is responsible for sourcing, reviewing and structuring investment opportunities for us, underwriting and performing due diligence on our investments and monitoring our investment portfolio on an ongoing basis. Our Adviser was organized in August 2013 and, pursuant to an investment advisory agreement (the “Investment Advisory Agreement”), we pay our Adviser a base management fee and an incentive fee for its services. Our Adviser has retained Mr. Carl M. Rizzo to act as its Chief Compliance Officer under the terms of an agreement between our Adviser and Alaric Compliance Services LLC. For information regarding our Adviser, see “Business—Management Agreements—Investment Advisory Agreement” and “Notes to Consolidated Financial Statements—Related Party Agreements and Transactions—Investment Advisory Agreement.”
Our Administrator
Our administrative functions are provided by our Administrator. Our Administrator is responsible for furnishing us with office facilities and equipment and provides us with clerical, bookkeeping, recordkeeping and other administrative services at such facilities. In February 2014, we entered into an administration agreement with our Administrator, or the “Administration Agreement,” under which we pay our Administrator an amount equal to our allocable portion (subject to the review of our Board) of our Administrator’s overhead resulting from its obligations under the Administration Agreement, including rent and the allocable portion of the cost of our Chief Compliance Officer and Chief Financial Officer and their respective staffs associated with performing compliance and financial reporting functions. For information regarding our Administrator, see “Business—Management Agreements—Administration Agreement” and “Notes to Consolidated Financial Statements—Related Party Agreements and Transactions—Administration Agreement.”
3
Overview
Our investment objective is to maximize our total return to stockholders primarily in the form of current income and, to a lesser extent, capital appreciation. We pursue our investment objective by relying on a core investment philosophy described as the “Four Rs.” The Four Rs stand for:
|
|
• |
Relationships—We seek to develop and maintain deep, longstanding and mutually beneficial relationships with TPC’s select group of leading venture capital investors, borrowers and entrepreneurs. |
|
|
• |
Reputation—We seek to preserve and extend the strong reputation of TPC’s brand and franchise as a creative, flexible and dependable financing partner with a focus on efficiency, responsiveness and customer service when interacting with venture capital investors, borrowers and entrepreneurs and when originating, structuring, underwriting and monitoring our investments. |
|
|
• |
References—We seek to make every venture capital investor, borrower and entrepreneur with whom we work a reference so that they not only work with us again but encourage others to work with us also. We believe that receiving referrals from TPC’s select group of leading venture capital investors, borrowers and entrepreneurs is a critical part of our investment origination process and differentiates us from other lenders. |
|
|
• |
Returns—We believe that by focusing on relationships, reputation and references, in addition to utilizing our specialized and established credit and monitoring process, we generate attractive risk-adjusted returns over the long-term. |
We invest primarily in (i) growth capital loans that have a secured collateral position and that are used by venture growth stage companies to finance their continued expansion and growth, (ii) equipment financings, which may be structured as loans or leases, that have a secured collateral position on specified mission-critical equipment, (iii) on a select basis, revolving loans that have a secured collateral position and that are used by venture growth stage companies to advance against inventory, components, accounts receivable, contractual or future billings, bookings, revenues, sales or cash payments and collections including proceeds from a sale, financing or equivalent and (iv) direct equity investments in venture growth stage companies. We also generally underwrite our secured loans seeking a loan-to-enterprise value of less than 25%. In connection with our growth capital loans, equipment financings and revolving loans, we generally receive warrant investments that allow us to participate in any equity appreciation of our borrowers and enhance our overall investment returns.
Target Venture Growth Stage Companies
We primarily target investment opportunities in venture growth stage companies backed by venture capital investors. However, having backing from a venture capital investor does not guarantee financing from us. Prospective borrowers must further qualify based on our Adviser’s rigorous and established investment selection and underwriting criteria and generally have many of the following characteristics:
|
|
• |
financing from a member of TPC’s select group of leading venture capital investors with whom TPC has an established history of providing secured loans alongside equity investments made by these venture capital investors; |
|
|
• |
focused in technology, life sciences or other high growth industries and targeting an industry segment with a large and/or growing market opportunity; |
|
|
• |
completion of their primary technology and product development; |
|
|
• |
meaningful customer sales, commitments or orders and have generated or we believe are reasonably expected to generate within the current fiscal year or on an annualized run rate at least $20 million in revenues and a strong outlook for continued and/or potentially rapid revenue growth; |
|
|
• |
a leadership position in its market (or the potential to establish a leadership position) with potential and/or defensible barriers to entry; |
|
|
• |
an experienced and relatively complete senior management team with a successful track record; |
|
|
• |
support from existing venture capital investors in the form of meaningful invested equity capital relative to our investment amount and/or reserved capital or willingness to invest additional capital as needed; |
|
|
• |
strong likelihood of raising additional equity capital or achieving an exit in the form of an initial public offering or sale based on our determination; |
4
|
|
• |
differentiated products, unique technology, proprietary intellectual property, and/or positive clinical results that may have intrinsic value on a stand-alone and/or liquidation basis; |
|
|
• |
meaningful enterprise value relative to the size of our investment as indicated by a recent equity round valuation or as determined by a third-party with, in our Adviser’s senior investment team’s opinion, the potential for upside; |
|
|
• |
a balanced current financial condition typically with 12 months or more of operating cash runway based on its projected cash burn and/or a path to profitability typically over a three to five year period from the date of our investment; and |
|
|
• |
upcoming strategic and potential enterprise valuation-accreting business milestones that our investment can help provide operating cash runway for the company to achieve. |
For many venture capital-backed companies, we believe that the venture growth stage is generally the point in their lifecycle at which they begin operational and financial preparations for a liquidity event, such as an initial public offering or private sale. We believe these investments provide us with a stable, fixed-income revenue stream along with the potential for equity-related gains on a risk-adjusted basis. We invest opportunistically in venture capital-backed companies at other lifecycle stages of development when our Adviser’s senior investment team believes that they present an attractive investment opportunity for us, subject to our compliance with applicable requirements under the 1940 Act.
Invest with TPC’s Select Group of Leading Venture Capital Investors
We generally expect to (i) benefit from the relationships developed by TPC as part of its TriplePoint Lifespan Approach and (ii) target investment opportunities backed by a select group of leading venture capital investors with whom our Adviser’s senior investment team has an established history of providing secured loans alongside equity investments made by these venture capital investors. We believe these well-recognized firms have consistently generated strong returns through superior selection processes and access to experienced entrepreneurs and quality investment opportunities based upon their strong reputations and track records, specialized knowledge and experienced investment professionals. As a result of this strategy, we focus and narrow our investment sourcing efforts to those investment opportunities backed by these leading venture capital investors with established track records targeting investments in Silicon Valley, Boston, Chicago, Los Angeles, New York City, Northern Virginia, San Diego, Seattle, the United Kingdom, Israel and other geographic areas of venture capital investments. We believe these relationships serve as an important source of investment opportunity referrals for us. We work with our select group of leading venture capital investors to identify debt financing opportunities within their portfolio companies that we believe have established management teams, strong venture capital investor support, large market opportunities, innovative technology or intellectual property, potential for meaningful warrant and/or equity investment returns and sufficient cash reserves to complement a potential debt financing opportunity.
Focus in Technology, Life Sciences and other High Growth Industries
We generally target technology, life sciences and other high growth industries and further specialize in subsectors within each of these industries including:
|
|
• |
Technology—areas of focus include: big data, cloud computing, communications, consumer, data storage, electronics, energy efficiency, hardware, information services, internet and media, networking, semiconductors, software, software as a service, wireless communications and other technology related subsectors; |
|
|
• |
Life Sciences—areas of focus include: biotechnology, diagnostic testing and bioinformatics, drug delivery, drug discovery, healthcare information systems, healthcare services, medical, surgical and therapeutic devices, pharmaceuticals and other life science related subsectors; and |
|
|
• |
Other High Growth Industries—areas of focus vary depending upon our Adviser’s investment strategy. |
Our Adviser seeks to invest in those subsectors where our Adviser sees opportunities for innovation, globalization, demand and other drivers of change which create significant business opportunities for venture growth stage companies with cutting edge technology, differentiated value propositions and sustainable competitive advantages. As a result, we believe that companies in these subsectors are more likely to attract significant investment from venture capital investors, private equity firms or strategic partners and are a more attractive candidate for a liquidity event than a company in a non-high growth industry.
5
Offer Creative Financing Solutions with Attractive Risk-Adjusted Pricing
Debt financings for venture growth stage companies are extremely diverse with use of proceeds, repayment structures and value propositions varying considerably among different company types. Our debt financings are customized based on a host of factors, including our review, assessment and analysis of each company’s management team, business outlook, underlying technology, support from its venture capital investors, products or services, current and future financial profile, intended use of our proceeds and anticipated payback structure, timing of a liquidity event and return potential. The diversity of debt financing possibilities requires prospective lenders to demonstrate a high degree of venture lending and leasing expertise and technology, life sciences and other high growth industries knowledge, specialization, willingness to provide customized products and flexibility. We believe the members of our Adviser’s senior investment team are uniquely situated given their extensive industry background, track record, knowledge and lending experience in the technology, life sciences and other high growth industries, as well as venture capital, private equity and credit, to analyze, structure and underwrite such debt financings. We believe that we have the ability to appropriately price the investment opportunities we originate based upon the debt structures we employ and the individual risk profiles of our borrowers to generate attractive risk-adjusted returns for us and our stockholders.
Generate Equity Upside over Time through Warrant and Equity Investments
In connection with our secured loans, we generally receive warrant investments to acquire preferred or common stock in a venture growth stage company with an exercise price typically equal to the same price per share paid by the company’s venture capital investors in its last round of equity financing or a recent valuation of the venture growth stage company as determined by a third-party. Our warrant investment coverage generally ranges from 2% to 10% of the committed loan amount. The warrant investments we obtain typically include a “cashless exercise” provision to allow us to exercise these rights without any additional cash investment. We also generally receive the opportunity to invest equity directly in our venture growth stage companies. We believe that making equity investments and receiving warrant investments in venture growth stage companies with exit events on the horizon, such as an initial public offering or private sale, increases the likelihood of equity appreciation and enhanced investment returns. As a venture growth stage company’s enterprise value changes we expect to recognize unrealized gains or losses from the fair value changes in our warrant and equity investments, and in conjunction with either a sale of the company or in connection with or following an initial public offering, we expect to achieve additional investment returns and realized gains from the exercise of these warrant investments and the sale of the underlying stock.
Utilize a Disciplined Investment Process
Our Adviser’s senior investment team leverages the more than 25 years of experience and expertise of Mr. Labe, one of TPC’s co-founders, and the track record developed by Messrs. Labe and Srivastava at TPC since its inception for reviewing prospective borrowers and potential financings, structuring those financings and subsequently monitoring those that are pursued and made, through which our Adviser’s senior investment team has succeeded in making profitable investments and minimizing credit losses. Additionally, we believe that the credit performance of our venture growth stage companies and the returns associated with lending to these companies are enhanced through our Adviser’s focus on originating investments primarily backed by TPC’s select group of leading venture capital investors and having an understanding of their outlook and/or support of our prospective and existing borrowers.
Employ Active Portfolio Management Processes
Our Adviser utilizes an extensive internal credit tracking and monitoring approach to regularly follow a venture growth stage company’s actual financial performance and achievement of business-related milestones to ensure that the internal risk rating assigned to each venture growth stage company investment is appropriate. This process has been refined and validated by Messrs. Labe and Srivastava, TPC’s co-founders, and the track record developed by TPC since its inception and is based, in part, on its expertise, familiarity and deep understanding of the risk associated with investing in various stages of a venture capital-backed company’s lifespan. The analysis focuses on both quantitative metrics, such as cash balance and cash burn, and our Adviser’s qualitative assessment in various areas, such as the outlook for the borrower’s industry segment, progress of product development, overall adherence to the business plan, financial condition, future growth potential and ability to raise additional equity capital. Our Adviser maintains dialogue and contact with our borrowers’ management teams to discuss, among other topics, business progress, cash flow, financial condition and capital structure issues. Our Adviser also typically engages in dialogue with the venture capital investors in our borrowers to understand and assess the company’s progress and development and the venture capital investor’s outlook and/or level of support for our borrower and in conjunction with the Four Rs, our core investment philosophy, determines the appropriate course of action for borrowers on our Credit Watch List.
6
We offer a full range of creative, flexible and customized secured financing products which may include a combination of an initial facility fee, interest and principal payments, end-of-term payments, warrant and/or equity investment rights. Although the general components for each type of our debt financing products are substantially the same, we select and customize the specific debt financing product on a case-by-case basis based on our Adviser’s senior investment team’s experience and their analysis of a prospective borrower, its financing needs and its intended use of the proceeds from our debt financing product. For example, the type of debt financing transaction, the total repayment period, the interest-only period, the amortization period, the collateral position, the warrant investment coverage and the overall yield-to-maturity may vary. We make investments that our Adviser’s senior investment team believes have a low probability of loss due to their expertise and the revenue profile, product validation, customer commitments, intellectual property, financial condition and enterprise value of the potential opportunity. Our debt financing products are typically structured as lines of credit, whereby a prospective borrower may be required to draw some of the commitment amount at close but may have up to 18 months from document execution to access the debt financing capital and in limited cases future advances may be subject to certain predetermined performance milestones.
Growth Capital Loans
Key typical attributes of our growth capital loans include:
|
|
• |
Size ranges from $5 million to $50 million. We generally target and balance our growth capital loan size to the total equity capital base, the current or near term enterprise value, revenue run rate and current and near term cash and liquidity profile of a prospective borrower; |
|
|
• |
Short total repayments typically ranging from 36 to 60 months or less and provide for interest only or moderate loan amortization in the early period of the loan, with the majority of the amortization deferred until 24 to 48 months after the loan’s funding date or a large lump sum payment on its maturity; |
|
|
• |
Unlevered yield-to-maturity generally ranging from 10% to 18%, which may include current interest payments, upfront and facility fees, an end-of-term payment and/or a payment-in-kind (“PIK”) interest payment. Our end-of-term payments are contractual and fixed interest payments due at the maturity date of the loan, including upon prepayment, and are a fixed percentage of the original principal balance of the loan. A meaningful portion of the difference between our yield-to-maturity and the stated interest rate on the loan is recognized as non-cash income until it is paid; |
|
|
• |
Equity “kickers” in the form of warrant investments to acquire preferred or common stock in the prospective borrower that allow us to participate in any potential equity appreciation and enhance our overall returns; |
|
|
• |
Secured by a senior secured lien on all of the prospective borrower’s assets including a pledge or negative pledge on its intellectual property. For certain prospective borrowers we are the only form of secured debt (other than potentially specific equipment financing). Other prospective borrowers may also have a revolving loan, typically from a bank, to finance receivables, cash, billings, bookings or inventory, and the collateral for such financing may be the underlying financed asset, bank accounts and/or a senior lien in priority to our senior lien. In addition, there may be prospective borrowers that have a term loan facility, with or without an accompanying revolving loan, typically from a bank, that may be in priority to our senior lien; and |
|
|
• |
Limited and/or flexible covenant structures and with certain affirmative and negative covenants, default penalties, lien protection, investor abandonment provisions, material adverse change provisions, change-of-control provisions, restrictions on additional use of leverage, reimbursement for upfront and regular internal and third party expenses as well as prepayment penalties. |
Equipment Financings
Key typical attributes of our equipment financings include:
|
|
• |
Size ranges from $5 million to $25 million. We generally target the size of our equipment financing to anticipate the capital equipment needs for a prospective borrower over a twelve month period balanced by the total equity capital base, the current or near term enterprise value, revenue run rate and current and near term cash and liquidity profile of a prospective borrower; |
|
|
• |
Short total repayments typically ranging from 36 to 48 months or less and provide for short interest only periods followed by full amortization; |
|
|
• |
Structured as full payout loans or leases with either buyout provisions based on the fair market value of the financed equipment or a fixed end-of term payment; |
7
|
|
• |
Equity “kickers” in the form of warrant investments to acquire preferred or common stock in the prospective borrower that allow us to participate in any potential equity appreciation and enhance our overall returns; |
|
|
• |
Secured solely by the underlying equipment being financed. We expect that much of the equipment financed by us will consist of standard, off-the-shelf equipment, such as computers, electronic test and measurement, telecommunications, laboratory equipment, manufacturing or production equipment. In certain cases, a portion of an equipment financing may finance customized equipment, software and/or expenses or soft-costs which may not have any substantial resale value; and |
|
|
• |
Limited and/or flexible covenant structures with certain affirmative and negative covenants, default penalties, lien protection, investor abandonment provisions, material adverse change provisions, change-of-control provisions, reimbursement for upfront and regular internal and third party expenses as well as prepayment penalties. |
Revolving Loans
On a select basis, we offer revolving loans. Key typical attributes of our revolving loans include:
|
|
• |
Size ranges from $1 million to $25 million. We generally structure our revolving loans subject to an advance rate against the company’s inventory, components, accounts receivable, contractual or future billings, bookings, revenues, sales or cash payments and collections including proceeds from a sale, financing or equivalent, that serve as our sole or primary collateral in support of the repayment of such loans; |
|
|
• |
Short total repayments typically ranging from 12 to 36 months or less and typically provide for interest only periods and/or moderate loan amortization in the early period of the loan, with the majority of the amortization deferred until 12 to 24 months after the loan’s funding date or on its maturity date; |
|
|
• |
Unlevered yield-to-maturity generally ranging from 1% above the applicable prime rate to 10%, which may include current interest payments, upfront and facility fees, an end-of-term payment and/or a PIK interest payment. Our end-of-term payments are contractual and fixed interest payments due at the maturity date of the loan, including upon prepayment, and are a fixed percentage of the original principal balance of the loan. The portion of our end-of-term payments that equal the difference between our yield-to-maturity and the stated interest rate on the loan are recognized as non-cash income until they are paid; |
|
|
• |
Equity “kickers” in the form of warrant investments to acquire preferred or common stock in the prospective borrower that allow us to participate in any equity appreciation and enhance our overall returns; |
|
|
• |
Secured by a senior secured lien on all of the prospective borrower’s assets including a pledge or negative pledge on its intellectual property or on all of the specific assets financed specifically by the revolving loan such as the company’s inventory, components, accounts receivable, contractual or future billings, bookings, revenues, sales or cash payments and collections including proceeds from a sale, financing or equivalent; and |
|
|
• |
Some financial covenants which may include advance rates, borrowing formulas, excess concentrations, cash requirements, business contracts or milestones along with certain affirmative and negative covenants, default penalties, lien protection, investor abandonment provisions, material adverse change provisions, change-of-control provisions, restrictions on additional use of leverage, reimbursement for upfront and regular internal and third party expenses as well as prepayment penalties. |
8
In connection with our secured loans, we generally receive warrant investments to acquire preferred or common stock in a venture growth stage company typically at the same price per share paid by the company’s venture capital investors in its last round of equity financing, a recent valuation of the venture growth stage company as determined by a third-party or in its next round of equity financing. As a venture growth stage company’s enterprise value changes we recognize unrealized gains or losses from the fair value changes in our warrant investments, and in conjunction with either a sale of the company or in connection with or following an initial public offering, we may achieve additional investment returns and realized gains from the exercise of these warrant investments and the sale of the underlying stock. Warrant investments granted in connection with our secured loans are typically based on a percentage of the committed loan amount, are treated as original issue discount (“OID”) and may be earned at document execution and/or as the loan is funded. Warrant coverage generally ranges from 2% to 10% of the committed loan amount.
Direct Equity Investments
In connection with our secured loans, we may obtain equity investment rights that allow us to invest in a venture growth stage company’s current or next round of private equity financing on the same terms and conditions as the company’s venture capital investors and/or other equity investors in the round. As a venture growth stage company’s enterprise value changes we recognize unrealized gains or losses from the fair value changes in our direct equity investments, and in conjunction with either a sale of the company or in connection with or following an initial public offering, we may achieve additional investment returns and realized gains from the sale of the underlying stock. These equity investment rights typically range from $100,000 to $5 million in size (generally not exceeding 5% of the company’s total equity), although we are under no obligation to make any such investment. Typically, these are passive investments (we do not take a board of directors seat in the company) but can be strategically valuable and beneficial as an enhancement to our relationship with the venture growth stage company and to our economic return by generating meaningful return on capital committed.
Investment Criteria
Our Adviser (i) benefits from the relationships developed by TPC as part of its TriplePoint Lifespan Approach and (ii) typically sources investment opportunities with TPC’s select group of leading venture capital investors or directly from prospective borrowers who are seeking debt financing. Many of these prospective borrowers are attracted to TPC’s reputation, extensive track record in the venture growth stage debt market, Four Rs’ core investment philosophy, and/or may have previously had a lending relationship with TPC. Additional origination sources for our Adviser include an extensive network of strategic industry contacts, including former and current venture growth stage companies, financial advisers, commercial banks and accounting and law firms. Our Adviser also identifies companies with strong management teams and innovative technology to proactively generate debt financing opportunities.
We primarily target investment opportunities in venture growth stage companies backed by venture capital investors. However, having backing from a venture capital investor does not guarantee financing from us. Prospective borrowers must further qualify based on our Adviser’s rigorous and established investment selection and underwriting criteria and generally have many of the following characteristics:
|
|
• |
financing from a member of TPC’s select group of leading venture capital investors with whom TPC has an established history of providing secured loans alongside equity investments made by these venture capital investors; |
|
|
• |
focused in technology, life sciences or other high growth industries and targeting an industry segment with a large and/or growing market opportunity; |
|
|
• |
completion of their primary technology and product development; |
|
|
• |
meaningful customer sales, commitments or orders and have generated or we believe are reasonably expected to generate within the current fiscal year or on an annualized run rate at least $20 million in revenues and a strong outlook for continued and/or potentially rapid revenue growth; |
|
|
• |
a leadership position in its market (or the potential to establish a leadership position) with potential and/or defensible barriers to entry; |
|
|
• |
an experienced and relatively complete senior management team with a successful track record; |
|
|
• |
support from existing venture capital investors in the form of meaningful invested equity capital relative to our investment amount and/or reserved capital or willingness to invest additional capital as needed; |
9
|
|
• |
strong likelihood of raising additional equity capital or achieving an exit in the form of an initial public offering or sale based on our determination; |
|
|
• |
differentiated products, unique technology, proprietary intellectual property, and/or positive clinical results that may have intrinsic value on a stand-alone and/or liquidation basis; |
|
|
• |
meaningful enterprise value relative to the size of our investment as indicated by a recent equity round valuation or as determined by a third-party with, in our Adviser’s senior investment team’s opinion, the potential for upside; |
|
|
• |
a balanced current financial condition typically with 12 months or more of operating cash runway based on its projected cash burn and/or a path to profitability typically over a three to five year period from the date of our investment; and |
|
|
• |
upcoming strategic and potential enterprise valuation-accreting business milestones that our investment can help provide operating cash runway for the company to achieve. |
We underwrite our transactions to ensure that our portfolio companies have a strategic and balanced intended use of our investment proceeds without us taking excessive risk and with a low likelihood of default. We believe that the profiles of the venture growth stage companies that we target mitigate our risk because we expect these companies have several options to repay our debt financing through:
|
|
• |
cash flow either from achieving the strong and rapid revenue and profitability plans targeted at the time of our underwriting or in a downside risk scenario from reducing growth and associated operating expenses; |
|
|
• |
receiving additional cash from new equity investors based on the progress and development made by the company and their outlook for growth or in a downside risk scenario from existing equity investors to avoid them from otherwise losing all of their invested capital given our ability to foreclose on our collateral; |
|
|
• |
receiving acquisition offers from strategic or other financial investors or undertaking an initial public offering, given their large and growing market opportunities, the stage of development of their underlying technology and products and their financial profile; or |
|
|
• |
in a worst case scenario, liquidating underlying assets including any proceeds from the sale of equipment, inventory, accounts receivable and/or intellectual property. |
Upon referral or contact, a prospective borrower is added to our Adviser’s on-line client management system and assigned to one of our Adviser’s Originations professionals who becomes the prospective borrower’s primary contact with us. The Originations professional evaluates the prospective borrower in more depth to understand its debt financing needs and to determine whether or not it is qualified under our criteria. Upon initial screening, the Originations professional generally meets with the prospective borrower and performs a preliminary investigation of the prospective borrower’s management, operations and business outlook. The Originations professional generally consults with, and gathers information from, a wide variety of industry sources to assess the prospective borrower and its industry. In addition, the Originations professional may reach out to the prospective borrower’s venture capital investors to understand the background of their investment in the company, their outlook for the company, the company’s market and products, the company’s goals and objectives associated with the proposed debt financing and the venture capital investor’s level of support for the company. If the Originations professional is satisfied with the preliminary assessment of the prospective borrower’s management, operations and business prospects, the Originations professional submits an internal pre-screen memorandum of the proposed debt transaction to our Adviser’s senior investment team for discussion and review, as well as for pricing and structuring guidance. Each potential investment opportunity that our Adviser’s Originations professionals determine merits investment consideration is presented and evaluated at a weekly meeting in which our Adviser’s senior investment team discusses the merits and risks of a potential investment opportunity, as well as the due diligence process and the pricing and structure. If our Adviser’s senior investment team believes an investment opportunity fits our investment profile, the Originations professional submits a non-binding term sheet to the prospective borrower.
Diligence Process
Assuming the non-binding term sheet submitted to the prospective borrower is subsequently executed, the investment opportunity is then subject to our Adviser’s rigorous diligence and credit analysis process, which is based on its senior investment team’s extensive experience and tailored specifically for venture growth stage companies. This process differs notably from traditional lending analysis, combining both qualitative and quantitative analysis and assessment, versus traditional, purely quantitative credit analyses. There is a heavy orientation towards a qualitative and subjective investment-oriented review, taking into account such factors as:
|
|
• |
investor quality, track record and expected level of participation in future financing events; |
|
|
• |
management team experience, completeness, performance to date, and ability to perform; |
|
|
• |
industry segment/market attractiveness and outlook, competitive dynamics, and growth potential; |
10
|
|
• |
current and future financial position, including financial projections and sensitivity analyses, historical performance, cash balance and burn analysis, capitalization structure, feasibility of financial plan and underlying assumptions, break-even/profitability timing, future cash needs and future financing plans; |
|
|
• |
stage of development and execution timeline and milestones and the likelihood and feasibility of achieving such milestones; and |
|
|
• |
transaction risk/return profile—assessing the strengths, weaknesses, risks, loan-to-value, liquidation values and outlook of the borrower compared to the structure, pricing, potential returns, likelihood of repayment and collateral structure of the proposed debt financing. |
Our Adviser’s diligence and credit analysis process typically includes on-site visits by one of our Adviser’s Investment and Credit Analysis professionals to a prospective borrower’s headquarters and other facilities, interviews with key management and board members and reference checks on senior management. In addition, the diligence process may include discussions with key industry research analysts, other industry participants, customers and suppliers, where appropriate. One of our Adviser’s professionals also typically reviews the prospective borrower’s organizational documents and structure, capital structure, assets, liabilities, employee plans, key customer or supplier contracts, legal and tax matters and other relevant legal documentation. The Investment and Credit Analysis professional submits a detailed credit and due diligence memorandum describing and analyzing the proposed transaction, as well as the outcome of the diligence and credit analysis activities. This memorandum is circulated to members of our Adviser’s Investment Committee in advance of its meetings.
Investment Committee
The objective of our Adviser’s Investment Committee is to leverage its members’ broad historical experience, including significant entrepreneurial, credit, venture capital, venture lending and leasing expertise and technology, life sciences and other high growth industries knowledge assessing the risk and needs of venture growth stage companies and appropriateness of prospective transactions, assessing the risk/return profile of proposed transactions, assessing the independent diligence and credit analysis and providing a forum for independent and unbiased thought, discussion, and assessment.
Our Adviser’s Investment Committee is comprised of Messrs. Labe and Srivastava. Some or all of the members of our Adviser’s senior investment team are asked to attend the Investment Committee meeting and are asked for a “vote,” which the Investment Committee members use as a factor in the formal Investment Committee vote. The Investment Committee meets weekly and more frequently on an as-needed basis. The applicable Originations and Investment and Credit Analysis professional presents the transaction, results of the professional’s diligence review and credit analysis and the professional’s recommendations to the Investment Committee. During the presentation, Investment Committee members typically ask questions, ask for clarifications, state opinions and assessments and make other comments. When there are no further questions and the discussions have concluded, the Investment Committee holds a vote and approves the proposed transaction if it receives unanimous consent from all of the Investment Committee members. In certain situations, the Investment Committee may ask the Originations and Investment and Credit Analysis professional to perform additional analysis and resubmit the transaction at a later Investment Committee meeting. No single criterion determines a decision to invest. The Investment Committee members weigh all the factors, both qualitative and quantitative, when making an investment decision. Our Adviser has the discretion to modify the members of the Investment Committee and its approval process at any time without our consent.
Investment Monitoring and Portfolio Management
Our Adviser utilizes an extensive internal credit tracking and monitoring approach to follow a borrower’s actual financial performance and achievement of business-related milestones to ensure that the internal risk rating assigned to each borrower is appropriate. This process has been refined and validated by Messrs. Labe and Srivastava, TPC’s co-founders, and the track record developed by TPC since its inception and is based in part on its expertise and deep understanding of the risk associated with investing in various stages of a venture capital-backed company’s lifespan. The analysis focuses on both quantitative metrics, such as cash balance and cash burn, and our Adviser’s qualitative assessment in various areas, such as the progress of product development, overall adherence to the business plan, future growth potential and ability to raise additional equity capital. Our Adviser maintains dialogue and contact with our borrowers’ management teams to discuss, among other topics, business progress, cash flow, financial condition and capital structure issues. Our Adviser also typically engages in dialogue with the venture capital investors in our borrowers to understand and assess the company’s progress and development and the venture capital investor’s outlook and/or level of support for our borrower.
11
Each of our borrowers is assigned a “Customer Team” consisting of staff from our Adviser’s Originations, Investment and Credit Analysis, Customer Monitoring and Legal teams. We believe having a dedicated Customer Team for each borrower further strengthens the relationship we have with the borrower, which is a key component of our Adviser’s strategy and affords our Adviser consistent and continuous interaction with our borrowers. A Customer Monitoring professional is assigned to all borrowers to ensure compliance with financial statement reporting, insurance filing and timely payment requirements. These professionals review the various financial statements, compliance reports and other documents received from our borrowers on a monthly or quarterly basis, as well as publicly filed financing statements, such as UCC financing statements and press releases, and enter them into our Adviser’s online platform for review by the rest of the Customer Team. In the event of a missed payment or if other credit issues arise, the Customer Monitoring professional contacts other members of the Customer Team to initiate escalation procedures.
On a weekly basis, our Adviser’s Investment Committee and our Adviser’s senior investment team review material events and information on our borrowers and discuss in detail those borrowers that are performing below expectations. On a quarterly basis, or more frequently as needed, our Originations and Investment and Credit Analysis undertakes an extensive re-evaluation of each borrower and prepares a portfolio update. Key topics that are reviewed include timing/status of the next equity financing round, cash balance and burn rate, financial and operational progress, and covenant adherence. All of these meetings are attended by each member of our Adviser’s Investment Committee, senior investment team and the Customer Team for the specific borrower being reviewed.
If the outlook for a borrower, its industry or a borrower’s available cash balance or credit rating is deteriorating, or there is material downturn in the borrower’s standing since our last review, we change the standing of the borrower on our Credit Watch List and our Originations and Investment and Credit Analysis professionals contact the borrower and its venture capital investors to discuss and understand any changes. Our Originations and Investment and Credit Analysis professionals generally actively work to maintain an open dialogue with borrowers on the Credit Watch List to work to limit the likelihood of a default. Utilizing the Four Rs, our core investment philosophy, our Adviser assesses each borrower on our Credit Watch List and, based on the recommendations from our Originations and Investment and Credit Analysis professionals and potentially from our discussions with and representations made from the borrower’s venture capital investors, determines the appropriate course of action, including decisions to enforce our rights and remedies, modify or waive a provision of our investments, declare a default, request early pay-off, or wait for an external event, such as an acquisition or financing, to restructure a secured loan or receive additional consideration in the form of fees or warrant investments. In a worst case scenario, a member of our Customer Team sells collateral with the help of management, repossesses and auctions assets or negotiates and structures other potential outcomes. If bankruptcy is a possibility, a member of our Customer Team may utilize outside counsel to provide advice on avoiding this outcome or to minimize the adverse effects on us.
Consistent with TPC’s existing policies, our Adviser maintains a Credit Watch List with borrowers placed into five groups based upon our Adviser’s senior investment team’s judgment, where 1 is the highest rating and all new loans are generally assigned a rating of 2.
The following table shows the credit rankings for the portfolio companies that had outstanding obligations to us as of December 31, 2017.
|
Category |
|
Category Definition |
|
Action Item |
|
|
|
|
|
|
|
Clear (1) |
|
Performing above expectations and/or strong financial or enterprise profile, value or coverage. |
|
Review quarterly. |
|
White (2) |
|
Performing at expectations and/or reasonably close to it. Reasonable financial or enterprise profile, value or coverage. All new loans are initially graded White. |
|
Contact portfolio company regularly in no event less than quarterly. |
|
Yellow (3) |
|
Performing generally below expectations and/or some proactive concern. Adequate financial or enterprise profile, value or coverage. |
|
Contact portfolio company monthly or more frequently as determined by our Adviser’s Investment Committee; contact investors. |
|
Orange (4) |
|
Needs close attention due to performance materially below expectations, weak financial and/or enterprise profile, concern regarding additional capital or exit equivalent. |
|
Contact portfolio company weekly or more frequently as determined by our Adviser’s Investment Committee; contact investors regularly; our Adviser forms a workout group to minimize risk of loss. |
|
Red (5) |
|
Serious concern/trouble due to pending or actual default or equivalent. May experience partial and/or full loss. |
|
Maximize value from assets. |
12
|
|
|
As of December 31, 2017 |
|
|||||||||
|
Credit Category (dollars in thousands) |
|
Fair Value |
|
|
Percentage of Total Debt Investments |
|
|
Number of Portfolio Companies |
|
|||
|
Clear (1) |
|
$ |
54,071 |
|
|
|
15.4 |
|
% |
|
3 |
|
|
White (2) |
|
|
243,915 |
|
|
|
69.3 |
|
|
|
12 |
|
|
Yellow (3) |
|
|
46,187 |
|
|
|
13.1 |
|
|
|
3 |
|
|
Orange (4) |
|
|
7,879 |
|
|
|
2.2 |
|
|
|
1 |
|
|
Red (5) |
|
|
— |
|
|
|
— |
|
|
|
— |
|
|
|
|
$ |
352,052 |
|
|
|
100.0 |
|
% |
|
19 |
|
As of December 31, 2017, the weighted average investment ranking of our debt investment portfolio was 2.02. During the year ended December 31, 2017, changes to portfolio companies within the credit categories, excluding fundings and repayments occurring within category White (2), consisted of: one portfolio company, with a principal balance of $13.1 million, was upgraded from White (2) to Clear (1); two portfolio companies, with a combined principal balance of $15.8 million were downgraded from White (2) to Yellow (3); one portfolio company rated Yellow (3), repaid its outstanding obligations, resulting in the removal of $22.5 million of principal balance from the credit watch list; one portfolio company, rated Orange (4), was removed from the credit watch list due to a distribution of proceeds from bankruptcy proceedings and the conversion of any and all remaining receivables from a debt investment to an equity instrument and two portfolio companies were removed from category Clear (1) due to payoffs of their outstanding obligations in the amount of $65.0 million.
SBIC
We have submitted our management assessment questionnaire and supporting documentation to receive a Small Business Investment Company, or “SBIC” license from the U.S. Small Business Administration, or “SBA,” under Section 301(c) of the Small Business Investment Company Act of 1958, as amended, as we believe that it will further our investment strategy and enhance our returns. The SBIC license would allow our SBIC to obtain leverage by issuing SBA-guaranteed debentures subject to the issuance of a capital commitment by the SBA and other customary procedures. SBA regulations currently limit the amount that a SBIC may borrow to a maximum of $150 million when it has at least $75 million in regulatory capital, receives a capital commitment from the SBA and has been through an examination by the SBA subsequent to licensing. SBA-guaranteed debentures generally have longer maturities and lower interest rates than other forms of debt that may be available to us, and we believe therefore would represent an attractive source of debt capital. There is no assurance that our application for an SBIC license will be approved, or that, if approved, we will be able to draw up to the maximum amount of leverage funds available under the SBIC program.
Competition
Debt financing for venture capital-backed companies is particularly heterogeneous—the type, structures and sizes of debt financings often vary significantly depending on a particular company’s industry and its current or near-term stage of development. The profile and underwriting characteristics of an early stage venture capital-backed company are very different from those of a later stage venture capital-backed company and/or those of a venture growth stage company. Furthermore, within venture growth stage companies, the uses, structures and value propositions of debt financing vary considerably among companies and industries and require a high degree of venture lending and leasing expertise and technology, life sciences and other high growth industries knowledge, specialization and flexibility from a lender. The availability of debt financing for venture growth stage companies is further limited by factors such as the brand, reputation and market acceptance, industry relationships, track record, and other factors required to lend to companies backed by leading venture capital investors, in addition to the distinct credit profiles of these companies and the deep experience and specialized set of skills required to (i) source deal flow and receive investment referrals; (ii) evaluate high growth industries and sectors, business prospects, operating characteristics and collateral; (iii) analyze potential transactions; and (iv) customize unconventional transaction structures for these companies.
We believe that venture-oriented banks tend to be the primary form of traditional lenders participating in the market for venture growth stage companies and that they generally focus on providing lower risk and lower return financings, which tend to require and impose many restrictive covenants and conditions on borrowers, such as limitations on outflows and borrowing formulas and requiring a significant depository relationship to facilitate rapid liquidation. In addition, we believe that most existing non-traditional debt providers do not regularly or actively participate in venture growth stage lending due to their reluctance to underwrite the large financings required by venture growth stage companies, as well as the desire of these providers to structure deals with lower current return but with the potential for significantly higher equity upside through warrant investments by lending to companies with lower valuations than would be possible in the venture growth stage lending market. As a result, most existing providers of debt financing tend to focus on seed, early and late stage venture capital-backed companies instead of venture growth stage companies.
13
Our competitors include both existing and newly formed equity and debt focused public and private funds, other BDCs, investment banks, venture-oriented banks, commercial financing companies and, to the extent they provide an alternative form of financing, private equity and hedge funds. Many of our competitors are substantially larger and have considerably greater financial, technical and marketing resources than us. For example, we believe some of our competitors may have access to funding sources that are not available to us. In addition, some of our competitors may have higher risk tolerances or different risk assessments, which expose them to a wider variety of investments. Furthermore, many of our competitors are not subject to the regulatory restrictions that the 1940 Act imposes on us as a BDC or to the distribution and other requirements we must satisfy to maintain our ability to be subject to tax treatment as a RIC.
We believe we compete effectively with these entities primarily on the basis of TPC’s reputation, track record, experience, industry knowledge and relationships and our Adviser’s senior investment team’s contacts, efficient investment analysis, decision-making processes, creative financing products and highly customized investment terms. We believe that the Four Rs, our core investment philosophy, enable us to continue to grow our brand name reputation and differentiate us from our competitors. We do not compete primarily on the financing terms we offer and believe that some competitors make loans with rates that are comparable or lower than our rates. We also believe that our relationship-based approach to investing, which leverages our Adviser’s senior investment team’s expertise in developing strong relationships with venture capital investors and venture capital-backed companies, understanding the capital needs of venture growth stage companies, structuring and customizing attractive financing solutions to meet the financing needs throughout a company’s growth stage, enables us to identify, attract and proactively capitalize on venture growth stage companies’ debt needs as they grow and become successful enterprises.
Employees
We do not have any employees as our day-to-day investment operations are managed by our Adviser. We reimburse our Administrator for our allocable portion of expenses incurred pursuant to our Administration Agreement.
Management Agreements
Investment Advisory Agreement
Subject to the overall supervision of our Board and in accordance with the 1940 Act, our Adviser manages our day-to-day operations and provides investment advisory services to us. Under the terms of the Investment Advisory Agreement, our Adviser:
|
|
• |
determines the composition of our portfolio, the nature and timing of the changes to our portfolio and the manner of implementing such changes; |
|
|
• |
identifies, evaluates and negotiates the structure of the investments we make; |
|
|
• |
executes, closes, services and monitors the investments we make; |
|
|
• |
determines the securities and other assets that we will purchase, retain or sell; |
|
|
• |
performs due diligence on prospective investments; and |
|
|
• |
provides us with such other investment advisory, research and related services as we may, from time to time, reasonably require for the investment of our funds. |
Pursuant to the Investment Advisory Agreement, we have agreed to pay our Adviser a fee for its investment advisory and management services consisting of two components—a base management fee and an incentive fee. The cost of both the base management fee and the incentive fee are ultimately borne by our stockholders.
Base Management Fee
The base management fee is calculated at an annual rate of 1.75% of our average adjusted gross assets, including assets purchased with borrowed funds. For services rendered under the Investment Advisory Agreement, the base management fee is payable quarterly in arrears. The base management fee is calculated based on the average value of our gross assets at the end of our two most recently completed calendar quarters. Such amount is appropriately adjusted (based on the actual number of days elapsed relative to the total number of days in such calendar quarter) for any share issuances or repurchases during a calendar quarter. Base management fees for any partial month or quarter are appropriately pro-rated.
14
The incentive fee, which provides our Adviser with a share of the income that it generates for us, consists of two components—investment income and capital gains—which are largely independent of each other, with the result that one component may be payable even if the other is not payable.
Under the investment income component, we pay our Adviser each quarter 20.0% of the amount by which our pre-incentive fee net investment income for the quarter exceeds a hurdle rate of 2.0% (which is 8.0% annualized) of our net assets at the end of the immediately preceding calendar quarter, subject to a “catch-up” provision pursuant to which our Adviser receives all of such income in excess of the 2.0% level but less than 2.5% and subject to a total return requirement. The effect of the “catch-up” provision is that, subject to the total return provision discussed below, if pre-incentive fee net investment income exceeds 2.5% in any calendar quarter, our Adviser receives 20.0% of our pre-incentive fee net investment income as if the 2.0% hurdle rate did not apply. The foregoing incentive fee is subject to a total return requirement, which provides that no incentive fee in respect of our pre-incentive fee net investment income is payable except to the extent that 20.0% of the cumulative net increase in net assets resulting from operations since the effective date of our election to be regulated as a BDC (March 5, 2014) exceeds the cumulative incentive fees accrued and/or paid since March 5, 2014. In other words, any investment income incentive fee that is payable in a calendar quarter is limited to the lesser of (i) 20.0% of the amount by which our pre-incentive fee net investment income for such calendar quarter exceeds the 2.0% hurdle, subject to the “catch-up” provision and (ii) (x) 20.0% of the cumulative net increase in net assets resulting from operations since March 5, 2014 minus (y) the cumulative incentive fees accrued and/or paid since March 5, 2014. For the foregoing purpose, the “cumulative net increase in net assets resulting from operations” is the sum of our pre-incentive fee net investment income, realized gains and losses and unrealized gains and losses since March 5, 2014.
Pre-incentive fee net investment income does not include any realized capital gains, realized capital losses or unrealized capital gains or losses. Because of the structure of the incentive fee, it is possible that we may pay an incentive fee in a quarter where we incur a loss, subject to the total return requirement described in the preceding paragraph. For example, if we receive pre-incentive fee net investment income in excess of the quarterly minimum hurdle rate, we will pay the applicable incentive fee even if we have incurred a loss in that quarter due to realized and unrealized capital losses. Our net investment income used to calculate this component of the incentive fee is also included in the amount of our assets used to calculate the 1.75% base management fee. These calculations are appropriately pro-rated for any period of less than three months and adjusted for any share issuance or repurchase during the current quarter.
The following is a graphical representation of the calculation of the income-related portion of the incentive fee.
Quarterly Incentive Fee Based on Net Investment Income
Pre-incentive fee net investment income (expressed as a percentage of the value of net assets)
Percentage of pre-incentive fee net investment income allocated to first component of incentive fee
Under the capital gains component of the incentive fee, we pay our Adviser at the end of each calendar year 20.0% of our aggregate cumulative realized capital gains from inception through the end of that year, computed net of our aggregate cumulative realized capital losses and our aggregate cumulative unrealized losses through the end of such year, less the aggregate amount of any previously paid capital gain incentive fees. For the foregoing purpose, our “aggregate cumulative realized capital gains” does not include any unrealized gains. It should be noted that we accrue an incentive fee for accounting purposes taking into account any unrealized gains in accordance with GAAP. The capital gains component of the incentive fee is not subject to any minimum return to stockholders. If such amount is negative, then no capital gains incentive fee is payable for such year. Additionally, if the Investment Advisory Agreement is terminated as of a date that is not a calendar year end, the termination date is treated as though it were a calendar year end for purposes of calculating and paying the capital gains incentive fee.
15
Examples of Quarterly Incentive Fee Calculation
Example 1: Income Portion of Incentive Fee before Total Return Requirement Calculation:
Assumptions
|
|
• |
Hurdle rate(1) = 2.0% |
|
(1) |
Represents 8.0% annualized hurdle rate. |
|
|
• |
Base management fee(2) = 0.4375% |
|
(2) |
Represents 1.75% annualized base management fee. |
|
|
• |
Other expenses (legal, accounting, custodian, transfer agent, etc.)(3) = 0.2% |
|
(3) |
Excludes organizational and offering expenses. |
Alternative 1
Additional Assumptions
|
|
• |
Investment income (including interest, dividends, fees, etc.) = 1.25% |
|
|
• |
Pre-incentive fee net investment income (investment income – (base management fee + other expenses)) = 0.6125% |
Pre-incentive fee net investment income does not exceed hurdle rate, therefore there is no incentive fee.
Alternative 2
Additional Assumptions
|
|
• |
Investment income (including interest, dividends, fees, etc.) = 2.90% |
|
|
• |
Pre-incentive fee net investment income (investment income – (base management fee + other expenses)) = 2.2625% |
Pre-incentive fee net investment income exceeds hurdle rate, therefore there is an incentive fee
Incentive Fee = (100% × “Catch-Up”) + (the greater of 0% AND (20.0% × (pre-incentive fee net investment income – 2.0%)))
= (100% × (2.2625% – 2.0%)) + 0%
= 100% × 0.2625%
= 0.2625%
Alternative 3
Additional Assumptions
|
|
• |
Investment income (including interest, dividends, fees, etc.) = 3.50% |
|
|
• |
Pre-incentive fee net investment income (investment income – (base management fee + other expenses)) = 2.8625% |
Pre-incentive fee net investment income exceeds hurdle rate, therefore there is an incentive fee
Incentive Fee = (100% × “Catch-Up”) + (the greater of 0% AND (20.0% × (pre-incentive fee net investment income – 2.5%)))
= (100% × (2.5% – 2.0%)) + (20.0% × (2.8625% – 2.5%))
= 0.5% + (20.0% × 0.3625%)
= 0.5% + 0.0725%
= 0.5725%
Example 2: Income Portion of Incentive Fee with Total Return Requirement Calculation:
Assumptions
|
|
• |
Hurdle rate(4) = 2.0% |
16
|
|
• |
Base management fee(5) = 0.4375% |
|
(5) |
Represents 1.75% annualized base management fee. |
|
|
• |
Other expenses (legal, accounting, custodian, transfer agent, etc.)(6) = 0.2% |
|
(6) |
Excludes organizational and offering expenses. |
|
|
• |
Cumulative incentive compensation accrued and/or paid since March 5, 2014 = $9,000,000 |
Alternative 1
Additional Assumptions
|
|
• |
Investment income (including interest, dividends, fees, etc.) = 3.50% |
|
|
• |
Pre-incentive fee net investment income (investment income – (base management fee + other expenses)) = 2.8625% |
|
|
• |
20.0% of cumulative net increase in net assets resulting from operations since March 5, 2014 = $8,000,000 |
Although our pre-incentive fee net investment income exceeds the hurdle rate of 2.0% (as shown in Alternative 3 of Example 1 above), no incentive fee is payable because 20.0% of the cumulative net increase in net assets resulting from operations since March 5, 2014 did not exceed the cumulative income and capital gains incentive fees accrued and/or paid since March 5, 2014.
Alternative 2
Additional Assumptions
|
|
• |
Investment income (including interest, dividends, fees, etc.) = 3.50% |
|
|
• |
Pre-incentive fee net investment income (investment income – (management fee + other expenses)) = 2.8625%. |
|
|
• |
20.0% of cumulative net increase in net assets resulting from operations since March 5, 2014 = $10,000,000 |
Because our pre-incentive fee net investment income exceeds the hurdle rate of 2.0% and because 20.0% of the cumulative net increase in net assets resulting from operations since March 5, 2014 exceeds the cumulative income and capital gains incentive fees accrued and/or paid since March 5, 2014, an incentive fee would be payable, as shown in Alternative 3 of Example 1 above.
Example 3: Capital Gains Portion of Incentive Fee:
Alternative 1:
Assumptions
|
|
• |
Year 1: $20.0 million investment made in Company A, or “Investment A,” and $30.0 million investment made in Company B, or “Investment B.” |
|
|
• |
Year 2: Investment A sold for $50.0 million and fair market value, or “FMV,” of Investment B determined to be $32.0 million |
|
|
• |
Year 3: FMV of Investment B determined to be $25.0 million |
|
|
• |
Year 4: Investment B sold for $31.0 million |
The capital gains portion of the incentive fee would be:
|
|
• |
Year 1: None |
|
|
• |
Year 2: Capital gains incentive fee of $6 million ($30 million realized capital gains on sale of Investment A multiplied by 20.0%) |
|
|
• |
Year 3: None; $5 million (20.0% multiplied by ($30 million cumulative capital gains less $5 million cumulative capital loss)) less $6 million (previous capital gains fee paid in Year 2) |
|
|
• |
Year 4: Capital gains incentive fee of $0.2 million; $6.2 million ($31 million cumulative realized capital gains multiplied by 20.0%) less $6 million (capital gains fee paid in Year 2) |
17
Assumptions
|
|
• |
Year 1: $20.0 million investment made in Company A, or “Investment A,” $30.0 million investment made in Company B, or “Investment B,” and $25.0 million investment made in Company C, or “Investment C.” |
|
|
• |
Year 2: Investment A sold for $50.0 million, FMV of Investment B determined to be $25.0 million and FMV of Investment C determined to be $25.0 million |
|
|
• |
Year 3: FMV of Investment B determined to be $27.0 million and Investment C sold for $30.0 million |
|
|
• |
Year 4: FMV of Investment B determined to be $35.0 million |
|
|
• |
Year 5: Investment B sold for $20.0 million |
The capital gains portion of the incentive fee would be:
|
|
• |
Year 1: None |
|
|
• |
Year 2: Capital gains incentive fee of $5 million; 20.0% multiplied by $25 million ($30 million realized capital gains on Investment A less $5 million unrealized capital loss on Investment B) |
|
|
• |
Year 3: Capital gains incentive fee of $1.4 million; $6.4 million (20.0% multiplied by $32 million ($35 million cumulative realized capital gains less $3 million unrealized capital loss on Investment B)) less $5 million capital gains fee received in Year 2 |
|
|
• |
Year 4: None |
|
|
• |
Year 5: None; $5 million of capital gains incentive fee (20.0% multiplied by $25 million (cumulative realized capital gains of $35 million less realized capital losses of $10 million)) less $6.4 million cumulative capital gains fee paid in Year 2 and Year 3 |
Payment of Our Expenses
All professionals of our Adviser, when and to the extent engaged in providing investment advisory and management services to us, and the compensation and routine overhead expenses of personnel allocable to these services to us, are provided and paid for by TPC and not by us. We bear all other out-of-pocket costs and expenses of our operations and transactions, including, without limitation, those relating to:
|
|
• |
organization; |
|
|
• |
calculating our net asset value (including the cost and expenses of any independent valuation firm); |
|
|
• |
indemnification payments; |
|
|
• |
providing managerial assistance to those portfolio companies that request it; |
|
|
• |
marketing expenses; |
|
|
• |
expenses relating to the development and maintenance of our website; |
|
|
• |
fees and expenses payable to third-parties, including agents, consultants or other advisors, in connection with monitoring financial and legal affairs for us and in monitoring our investments and performing due diligence on our prospective portfolio companies or otherwise relating to, or associated with, evaluating and making investments; |
|
|
• |
fees and expenses incurred in connection with obtaining debt financing; |
|
|
• |
interest payable on debt, if any, incurred to finance our investments and expenses related to unsuccessful portfolio acquisition efforts; |
|
|
• |
offerings of our common stock and other securities; |
|
|
• |
investment advisory and management fees; |
|
|
• |
administration fees, expenses and/or payments payable under the Administration Agreement; |
|
|
• |
fees payable to third parties, including agents, consultants and other advisors, relating to, or associated with, evaluating and making investments, including costs associated with meeting potential financial sponsors; |
18
|
|
• |
federal and state registration fees; |
|
|
• |
all costs of registration of listing our securities with appropriate regulatory agencies; |
|
|
• |
all cost of listing our securities on any securities exchange; |
|
|
• |
U.S. federal, state and local taxes; |
|
|
• |
independent directors’ fees and expenses; |
|
|
• |
costs of preparing and filing reports or other documents required by the Securities and Exchange Commission (“SEC”), the Financial Industry Regulatory Authority or other regulators; |
|
|
• |
costs of any reports, proxy statements or other notices to stockholders, including printing costs; |
|
|
• |
costs associated with individual or groups of stockholders; |
|
|
• |
our allocable portion of any fidelity bond, directors and officers’ errors and omissions liability insurance, and any other insurance premiums; |
|
|
• |
direct costs and expenses of administration, including printing, mailing, long distance telephone, copying, secretarial and other staff, independent auditors and outside legal costs; |
|
|
• |
and all other expenses incurred by us or our Administrator in connection with administering our business, including payments under the Administration Agreement based on our allocable portion of our Administrator’s overhead in performing its obligations under the Administration Agreement, including rent and the allocable portion of the cost of our Chief Compliance Officer and Chief Financial Officer and their respective staffs. |
Duration and Termination
Unless terminated earlier as described below, the Investment Advisory Agreement will continue in effect from year to year if (i) (A) approved annually by our Board or (B) by the affirmative vote of the holders of a majority of our outstanding voting securities and (ii) approved by a majority of our directors who are not “interested persons” as defined in the 1940 Act. The Investment Advisory Agreement automatically terminates in the event of its assignment, as defined in the 1940 Act, by our Adviser and may be terminated by either party without penalty upon 60 days’ written notice to the other. The holders of a majority of our outstanding voting securities may also terminate the Investment Advisory Agreement without penalty upon 60 days’ written notice. See “Risk Factors—Risks Relating to our Business and Structure”—We are dependent upon our executive officers and our Adviser’s senior investment team and members of its Investment Committee, in particular, Messrs. Labe and Srivastava, for our success and upon our Adviser’s access to such individuals pursuant to the Staffing Agreement. If our Adviser were to lose such access, our ability to achieve our investment objective could be significantly harmed.
The Investment Advisory Agreement provides that, absent criminal conduct, willful misfeasance, bad faith or gross negligence in the performance of its duties or by reason of the reckless disregard of its duties and obligations under the Investment Advisory Agreement, our Adviser and its professionals and any other person or entity affiliated with it are entitled to indemnification from us for any damages, liabilities, costs and expenses (including reasonable attorneys’ fees and amounts reasonably paid in settlement) arising from the rendering of our Adviser’s services under the Investment Advisory Agreement or otherwise as our investment adviser.
Board Approval of the Investment Advisory Agreement
The Investment Advisory Agreement between us and our Adviser was initially approved by our Board at an in-person meeting in November 2013 and entered into in February 2014. Our Board most recently determined to re-approve the Investment Advisory Agreement at an in-person meeting held in October 2017. In reaching a decision to re-approve the Investment Advisory Agreement, the Board reviewed a significant amount of information and considered, among other things:
|
|
• |
the nature, extent and quality of services to be provided by the Adviser; |
|
|
• |
the investment performance of the Adviser with respect to the Company, and concluded that such advisory and other services are satisfactory and the Company’s investment performance is reasonable; |
|
|
• |
the proposed fees and expenses under the Advisory Agreement in comparison to other business development companies with similar investment objectives, and concluded that the current fee structure is reasonable; |
19
|
|
• |
the Company’s projected operating expenses and the economics of scale expected to be achieved, and concluded that the Company’s projected operating expenses and expense ratio are reasonable; |
|
|
• |
any existing and potential sources of indirect income to the Adviser from its relationship with the Company, and concluded that the direct and indirect costs, including the allocation of such costs, are reasonable; |
|
|
• |
information about the services to be performed and the personnel performing such services under the Investment Advisory Agreement, and concluded that the services to be performed and the personnel of the Adviser have extensive experience and are well qualified to provide advisory and other services to the Company; |
|
|
• |
the Adviser’s profitability in providing the service, and concluded that the Adviser’s profitability in providing the service and reasonable; and |
|
|
• |
the possibility of obtaining similar services from other third party service providers or through an internally managed structure, and concluded that our current externally managed structure with the Adviser as our investment adviser was satisfactory. |
Based on the information reviewed and the discussions detailed above, the Board, including all of the directors who are not “interested persons” as defined in the 1940 Act, concluded that the investment advisory fee rates and terms are reasonable in relation to the services provided and re-approved the Investment Advisory Agreement as being in the best interests of our stockholders. The Board did not assign relative weights to the above factors or the other factors considered by it. Individual members of the Board may have given different weights to different factors.
Administration Agreement
The Administration Agreement provides that our Administrator is responsible for furnishing us with office facilities and equipment and providing us with clerical, bookkeeping, recordkeeping and other administrative services at such facilities. Under the Administration Agreement, our Administrator performs, or oversees, or arranges for, the performance of, our required administrative services, which includes being responsible for the financial and other records that we are required to maintain and preparing reports to our stockholders and reports and other materials filed with the SEC or any other regulatory authority. In addition, our Administrator assists us in determining and publishing our net asset value, oversees the preparation and filing of our tax returns and the printing and dissemination of reports and other materials to our stockholders, and generally oversees the payment of our expenses and the performance of administrative and professional services rendered to us by others. Under the Administration Agreement, our Administrator also provides managerial assistance on our behalf to those companies that have accepted our offer to provide such assistance.
Payments under the Administration Agreement are equal to an amount equal to our allocable portion (subject to the review of our Board) of our Administrator’s overhead resulting from its obligations under the Administration Agreement, including rent and the allocable portion of the cost of our Chief Compliance Officer and Chief Financial Officer and their respective staffs. In addition, if requested to provide significant managerial assistance to our portfolio companies, our Administrator is paid an additional amount based on the services provided, which shall not exceed the amount we receive from such companies for providing this assistance. The Administration Agreement between us and the Administrator was initially approved by our Board at an in-person meeting in November 2013 and was entered into in February 2014. Our Board most recently determined to re-approve the Administration Agreement at an in-person meeting held in October 2017. In connection with such approval the Board, including a majority of independent directors, reviewed the compensation we pay to the Administrator to determine that the provisions of the Administrative Agreement are carried out satisfactorily and to determine, among other things, whether the fees payable under the Administration Agreement are reasonable in light of the services provided. The Board also reviewed the methodology employed in determining how the expenses are allocated to us and the proposed allocation of administrative expenses among us and the affiliates of TPC. The Board then assessed the reasonableness of such reimbursements for expenses allocated to us based on the nature and quality of the administrative services provided to us by the Administrator, our projected operating expenses and expense ratio compared to BDCs with similar investment objectives, any existing and potential sources of indirect income to the Administrator from its relationship with us, information about the administrative services to be performed and the personnel performing such administrative services, the organizational capability of the Administrator, and the possibility of obtaining similar services from other third-party service providers.
The Administration Agreement will continue in effect from year to year if (i) (A) the approval of our Board or (B) by the affirmative vote of the holders of a majority of our outstanding voting securities and (ii) the approval by a majority of our directors who are not “interested persons.” The Administration Agreement may be terminated by either party without penalty upon 60 days’ written notice to the other party. Stockholder approval is not required to amend the Administration Agreement.
20
The Administration Agreement provides that, absent criminal conduct, willful misfeasance, bad faith or gross negligence in the performance of its duties or by reason of the reckless disregard of its duties and obligations, our Administrator and any person or entity affiliated with it are entitled to indemnification from us for any damages, liabilities, costs and expenses (including reasonable attorneys’ fees and amounts reasonably paid in settlement) arising from the rendering of our Administrator’s services under the Administration Agreement or otherwise as our administrator.
Pursuant to a sub-administration agreement, our Administrator has engaged Conifer Asset Solutions LLC to provide certain administrative services to us on behalf of our Administrator.
Staffing Agreement
In February 2014, our Adviser entered into the Staffing Agreement with TPC (the “Staffing Agreement”). Pursuant to the Staffing Agreement, TPC has made and will continue to make, subject to the terms of the Staffing Agreement, its investment and portfolio management and monitoring teams available to our Adviser. We believe that the Staffing Agreement (i) provides us with access to deal flow generated by TPC in the ordinary course of its business; (ii) provides us with access to TPC’s investment professionals, including its senior investment team led by Messrs. Labe and Srivastava, and TPC’s non-investment employees; and (iii) commits certain key senior members of TPC’s Investment Committee to serve as members of our Adviser’s Investment Committee. Our Adviser is responsible for determining if we will participate in deal flow generated by TPC. Our Adviser takes advantage of the significant deal origination channels, rigorous due diligence process, disciplined underwriting methods, creative investment structuring and hands-on portfolio management and investment monitoring capabilities of TPC’s senior investment team. The Staffing Agreement may be terminated with 60 days’ prior written notice.
License Agreement
In February 2014, we entered into the License Agreement with TPC under which TPC granted us a non-exclusive, royalty-free license to use the name “TriplePoint” and the TriplePoint logo. Under the License Agreement, we have a right to use the “TriplePoint” name for so long as our Adviser or one of its affiliates remains our Adviser. Other than with respect to this limited license, we have no legal right to the “TriplePoint” name. The License Agreement remains in effect for so long as the Investment Advisory Agreement with our Adviser is in effect.
Determination of Net Asset Value
Quarterly Determinations
We determine the net asset value per share of our common stock quarterly. The net asset value per share is equal to the value of our total assets minus liabilities and any preferred stock outstanding divided by the total number of shares of common stock outstanding. As of the date of this annual report on Form 10-K, we do not have any preferred stock outstanding.
Our investment assets are carried at fair value in accordance with the 1940 Act and Accounting Standards Codification Topic 820, Fair Value Measurements and Disclosure, or ASC Topic 820. Value, as defined in Section 2(a)(41) of the 1940 Act, is (i) the market price for those securities for which a market quotation is readily available and (ii) for all other securities and assets, fair value is as determined in good faith by our Board. Our investments are primarily made to venture growth stage companies in technology, life sciences and other high growth industries. Given the nature of lending to these types of companies, our investments are generally considered Level 3 assets under ASC Topic 820 because there is no known or accessible market or market indexes for these investments to be traded or exchanged. As such, we value substantially all of our investments at fair value as determined in good faith pursuant to a consistent valuation policy and our Board in accordance with the provisions of ASC Topic 820 and the 1940 Act. Due to the inherent uncertainty in determining the fair value of investments that do not have a readily available market value, the fair value of our investments determined in good faith by our Board may differ significantly from the value that would have been used had a readily available market existed for such investments, and the differences could be material.
The valuation process is conducted at the end of each fiscal quarter, with a portion of our valuations of portfolio companies without market quotations subject to review by one or more independent valuation firms each quarter. When an external event with respect to one of our portfolio companies, such as a purchase transaction, public offering or subsequent equity sale occurs, we use the pricing indicated by the external event to corroborate our valuation.
21
We have adopted ASC Topic 820. ASC Topic 820 specifies a hierarchy of valuation techniques based on whether the inputs to those valuation techniques are observable or unobservable. ASC Topic 820 also provides guidance regarding a fair value hierarchy, which prioritizes information used to measure fair value and the effect of fair value measurements on earnings and provides for enhanced disclosures determined by the level within the hierarchy of information used in the valuation. In accordance with ASC Topic 820, these inputs are summarized in the three levels listed below:
|
|
• |
Level 1—Valuations are based on quoted prices in active markets for identical assets or liabilities that are accessible at the measurement date. |
|
|
• |
Level 2—Valuations are based on quoted prices in markets that are not active or for which all significant inputs are observable, either directly or indirectly and model-based valuation techniques for which all significant inputs are observable. |
|
|
• |
Level 3—Valuations based on inputs that are unobservable and significant to the overall fair value measurement. Level 3 assets and liabilities include financial instruments whose value is determined using pricing models incorporating significant unobservable inputs, such as discounted cash flow models and other similar valuations techniques. The valuation of Level 3 assets and liabilities generally requires significant management judgment due to the inability to observe inputs to valuation. |
In certain cases, the inputs used to measure fair value may fall into different levels of the fair value hierarchy. In such cases, an investment’s level within the fair value hierarchy is based on the lowest level of observable input that is significant to the fair value measurement. The assessment of the significance of a particular input to the fair value measurement in its entirety requires judgment, and considers factors specific to the investment.
Under ASC Topic 820, the fair value measurement also assumes that the transaction to sell an asset occurs in the principal market for the asset or, in the absence of a principal market, the most advantageous market for the asset, which may be a hypothetical market, and excludes transaction costs. The principal market for any asset is the market with the greatest volume and level of activity for such asset in which the reporting entity would or could sell or transfer the asset. In determining the principal market for an asset or liability under ASC Topic 820, it is assumed that the reporting entity has access to such market as of the measurement date. Market participants are defined as buyers and sellers in the principal or most advantageous market that are independent, knowledgeable and willing and able to transact.
With respect to investments for which market quotations are not readily available, our Board undertakes a multi-step valuation process each quarter, as described below:
|
|
• |
Our quarterly valuation process begins with each portfolio company or investment being initially valued by our Adviser’s professionals that are responsible for the portfolio investment; |
|
|
• |
Preliminary valuation conclusions are then documented and discussed with our Adviser’s senior investment team; |
|
|
• |
At least once annually, the valuation for each non-deminimis (greater than 1% of gross assets) portfolio investment will be reviewed by an independent valuation firm; |
|
|
• |
The Valuation Committee then reviews these preliminary valuations and makes fair value recommendations to the Board; and |
|
|
• |
Our Board then discusses valuations and determines the fair value of each investment in our portfolio in good faith, based on the input of our Adviser, the respective independent valuation firms and our Valuation Committee. |
Determinations in Connection with our Offerings
In connection with each offering of shares of our common stock, our Board or an authorized committee thereof is required by the 1940 Act to make the determination that we are not selling shares of our common stock at a price below our then current net asset value at the time at which the sale is made. Our Board or an authorized committee thereof considers the following factors, among others, in making such determination:
|
|
• |
the net asset value of our common stock disclosed in the most recent periodic report we filed with the SEC; |
|
|
• |
our management’s assessment of whether any material change in the net asset value has occurred (including through the realization of net gains on the sale of our investments) from the period beginning on the date of the most recently disclosed net asset value per share of our common stock and ending as of a time within 48 hours (excluding Sundays and holidays) of the sale of our common stock; and |
22
Moreover, to the extent that there is even a remote possibility that we may (i) issue shares of our common stock at a price below the then current net asset value of our common stock at the time at which the sale is made or (ii) trigger the undertaking (which we provided to the SEC) to suspend the offering of shares of our common stock if the net asset value fluctuates by certain amounts in certain circumstances, our Board or an authorized committee thereof will elect, in the case of clause (i) above, either to postpone the offering until such time that there is no longer the possibility of the occurrence of such event or to undertake to determine net asset value within two days prior to any such sale to ensure that such sale will not be below our then current net asset value, and, in the case of clause (ii) above, to comply with such undertaking or to undertake to determine net asset value to ensure that such undertaking has not been triggered.
These processes and procedures are part of our compliance policies and procedures. Records are made contemporaneously with all determinations described in this section and these records are maintained with other records we are required to maintain under the 1940 Act.
Material U.S. Federal Income Tax Considerations
Taxation of the Company
We have elected to be treated and intend to qualify each year as a RIC under Subchapter M of the Code. As a RIC, we generally do not pay corporate-level U.S. federal income taxes on any ordinary income or capital gains that we timely distribute (or are deemed to timely distribute) to our stockholders as dividends.
To qualify as a RIC, we must, among other things:
|
|
• |
derive in each taxable year at least 90% of our gross income from dividends, interest, payments with respect to certain securities loans, gains from the sale or other disposition of stock, securities or foreign currencies, other income derived with respect to our business of investing in stock, securities or currencies, or net income derived from an interest in a “qualified publicly traded partnership,” or “QPTP,” hereinafter the “90% Gross Income Test;” and |
|
|
• |
diversify our holdings so that, at the end of each quarter of each taxable year: |
|
|
• |
at least 50% of the value of our total assets is represented by cash and cash items, U.S. Government securities, the securities of other RICs, and other securities, with other securities limited, in respect of any one issuer, to an amount not greater than 5% of the value of our total assets and not more than 10% of the outstanding voting securities of such issuer, and |
|
|
• |
not more than 25% of the value of our total assets is invested in the securities of any issuer (other than U.S. Government securities and the securities of other regulated investment companies), the securities of any two or more issuers that we control and that are determined to be engaged in the same business or similar or related trades or businesses, or the securities of one or more QPTPs, the Diversification Tests. |
In the case of a RIC that furnishes capital to development corporations, there is an exception relating to the Diversification Tests described above. This exception is available only to RICs which the SEC determines to be principally engaged in the furnishing of capital to other corporations which are principally engaged in the development or exploitation of inventions, technological improvements, new processes, or products not previously generally available, which we refer to as “SEC Certification.” We have not sought SEC Certification, but we may seek SEC Certification in future years. If we receive SEC Certification, we generally will be entitled to include, in the computation of the 50% value of our assets (described above), the value of any securities of an issuer, whether or not we own more than 10% of the outstanding voting securities of the issuer, if the basis of the securities, when added to our basis of any other securities of the issuer that we own, does not exceed 5% of the value of our total assets.
23
As a RIC, we (but not our stockholders) generally are not subject to U.S. federal income tax on investment company taxable income and net capital gains that we distribute to our stockholders in any taxable year with respect to which we distribute an amount equal to at least 90% of the sum of our (i) investment company taxable income (which includes, among other items, dividends, interest and the excess of any net realized short-term capital gains over net realized long-term capital losses and other taxable income (other than any net capital gain), reduced by deductible expenses) determined without regard to the deduction for dividends and distributions paid and (ii) net tax-exempt interest income (which is the excess of our gross tax-exempt interest income over certain disallowed deductions), (the “Annual Distribution Requirement”). We intend to distribute annually all or substantially all of such income. Generally, if we fail to meet this Annual Distribution Requirement for any taxable year, we will fail to qualify for tax treatment as a RIC for such taxable year. Although we may meet our Annual Distribution requirement, we will be subject to a nondeductible 4% U.S. federal excise tax on certain of our undistributed income, unless we timely distribute (or are deemed to have timely distributed) an amount equal to the sum of:
|
|
• |
at least 98% of our ordinary income (not taking into account any capital gains or losses) for the calendar year; |
|
|
• |
at least 98.2% of the amount by which our capital gains exceed our capital losses (adjusted for certain ordinary losses) for a one-year period generally ending on October 31 of the calendar year (unless an election is made by us to use our taxable year); and |
|
|
• |
certain undistributed amounts from previous years on which we paid no U.S. federal income tax. |
For the tax years ended December 31, 2014, 2015 and 2017, we were subject to a 4% U.S. excise tax and we may be subject to this tax in future years. In such cases, we will be liable for the tax only on the amount by which we do not meet the foregoing distribution requirement.
We are authorized to borrow funds and to sell assets in order to satisfy distribution requirements. However, under the 1940 Act, we are not permitted to make distributions to our stockholders while any senior securities are outstanding unless we meet the applicable asset coverage ratios. See “—Regulation—Senior Securities.” Moreover, our ability to dispose of assets to meet our distribution requirements may be limited by (1) the illiquid nature of our portfolio and/or (2) other requirements relating to our status as a RIC, including the Diversification Tests. If we dispose of assets in order to meet the Annual Distribution Requirement or to avoid the 4% U.S. federal excise tax, we may make such dispositions at times that, from an investment standpoint, are not advantageous.
A RIC is limited in its ability to deduct expenses in excess of its “investment company taxable income” (which is, generally, ordinary income plus the excess of net short-term capital gains over net long-term capital losses). If our expenses in a given year exceed investment company taxable income, we would experience a net operating loss for that year. However, a RIC is not permitted to carry forward net operating losses to subsequent years. In addition, expenses can be used only to offset investment company taxable income, not net capital gain. Due to these limits on the deductibility of expenses, we may for tax purposes have aggregate taxable income for several years that we are required to distribute and that is taxable to our stockholders even if such income is greater than the aggregate net income we actually earned during those years. Such required distributions may be made from our cash assets or by liquidation of investments, if necessary. We may realize gains or losses from such liquidations. In the event we realize net capital gains from such transactions, you may receive a larger capital gain distribution than you would have received in the absence of such transactions.
Taxation of Company Investments
Certain of our investment practices are subject to special and complex U.S. federal income tax provisions that may, among other things, (i) disallow, suspend or otherwise limit the allowance of certain losses or deductions, including the dividends received deduction, (ii) convert lower taxed long-term capital gains and qualified dividend income into higher taxed short-term capital gains or ordinary income, (iii) convert ordinary loss or a deduction into capital loss (the deductibility of which is more limited), (iv) cause us to recognize income or gain without a corresponding receipt of cash, (v) adversely affect the time as to when a purchase or sale of stock or securities is deemed to occur, (vi) adversely alter the characterization of certain complex financial transactions and (vii) produce income that will not qualify as good income for purposes of the 90% Gross Income Test. We monitor our transactions and may make certain tax elections and may be required to borrow money or dispose of securities to mitigate the effect of these rules and to prevent disqualification of us as a RIC but there can be no assurance that we will be successful in this regard.
24
Debt Instruments. In certain circumstances, we may be required to recognize taxable income prior to which we receive cash. For example, if we hold debt instruments that are treated under applicable tax rules as having OID (such as debt instruments with an end-of-term payment and/or PIK interest payment or, in certain cases, increasing interest rates or issued with warrant investments), we must include in taxable income each year a portion of the OID that accrues over the life of the obligation, regardless of whether cash representing such income is received by us in the same taxable year. We may also have to include in income other amounts that we have not yet received in cash, such as PIK interest, deferred loan origination fees that are paid after origination of the loan or are paid in non-cash compensation such as warrant investments or stock, or certain income with respect to equity investments in foreign corporations. Because any OID or other amounts accrued will be included in our investment company taxable income for the year of accrual, we may be required to make a distribution to our stockholders in order to satisfy the Annual Distribution Requirement and to avoid the 4% U.S. federal excise tax, even though we will not have received any corresponding cash amount.
Warrant Investments. Gain or loss realized by us from the sale or exchange of warrant investments acquired by us as well as any loss attributable to the lapse of such warrant investments generally are treated as capital gain or loss. The treatment of such gain or loss as long-term or short-term generally depends on how long we held a particular warrant.
Foreign Investments. In the event we invest in foreign securities, we may be subject to withholding and other foreign taxes with respect to those securities. We do not expect to satisfy the requirement to pass through to our stockholders their share of the foreign taxes paid by us.
Passive Foreign Investment Companies. We may invest in the stock of a foreign corporation which is classified as a “passive foreign investment company” (within the meaning of Section 1297 of the Code), or “PFIC.” In general, unless a special tax election has been made, we are required to pay tax at ordinary income rates on any gains and “excess distributions” with respect to PFIC stock as if such items had been realized ratably over the period during which we held the PFIC stock, plus an interest charge. Certain adverse tax consequences of a PFIC investment may be limited if we are eligible to elect alternative tax treatment with respect to such investment. No assurances can be given that any such election will be available or that, if available, we will make such an election. Additionally, even if we make any such election, the U.S. Treasury Department and IRS have issued proposed regulations that provide that the income inclusion resulting from the election will not be considered qualifying income for purposes of the 90% Gross Income Test unless we receive a cash distribution from the PFIC during the same year. These regulations, if finalized, could make it more difficult to qualify as a RIC if we invest in PFICs and elect the alternative tax treatment with respect to those entities.
Foreign Currency Transactions. Under the Code, gains or losses attributable to fluctuations in exchange rates which occur between the time we accrue income or other receivables or accrue expenses or other liabilities denominated in a foreign currency and the time we actually collect such receivables or pay such liabilities generally are treated as ordinary income or loss. Similarly, on disposition of debt instruments and certain other instruments denominated in a foreign currency, gains or losses attributable to fluctuations if the value of the foreign currency between the date of acquisition of the instrument and the date of disposition also are treated as ordinary gain or loss. These currency fluctuations related gains and losses may increase or decrease the amount of our investment company taxable income to be distributed to our stockholders as ordinary income.
Failure to Qualify as a RIC
If we were unable to qualify for treatment as a RIC, and if certain cure provisions described below are not available, we would be subject to tax on all of our taxable income (including our net capital gains) at regular corporate rates. We would not be able to deduct distributions to stockholders, nor would they be required to be made. Distributions, including distributions of net long-term capital gain, would generally be taxable to our stockholders as ordinary dividend income to the extent of our current and accumulated earnings and profits. Subject to certain limitations under the Code, corporate stockholders would be eligible to claim a dividend received deduction with respect to such dividend; non-corporate stockholders would generally be able to treat such dividends as “qualified dividend income,” which is subject to reduced rates of U.S. federal income tax. Distributions in excess of our current and accumulated earnings and profits would be treated first as a return of capital to the extent of the stockholder’s tax basis, and any remaining distributions would be treated as a capital gain. If we fail to qualify as a RIC for a period greater than two taxable years, to qualify as a RIC in a subsequent year we may be subject to regular corporate tax on any net built-in gains with respect to certain of our assets (i.e., the excess of the aggregate gains, including items of income, over aggregate losses that would have been realized with respect to such assets if we had been liquidated) that we elect to recognize on requalification or when recognized over the next five years.
25
We are a BDC under the 1940 Act and have elected to be treated as a RIC under Subchapter M of the Code. The 1940 Act contains prohibitions and restrictions relating to transactions between BDCs and their affiliates (including any investment advisers), principal underwriters and affiliates of those affiliates or underwriters and requires that a majority of the directors of a BDC be persons other than “interested persons,” as that term is defined in the 1940 Act. In addition, the 1940 Act provides that we may not change the nature of our business so as to cease to be, or withdraw our election as, a BDC without the approval of a majority of our outstanding voting securities.
We do not intend to acquire securities issued by any investment company in excess of the limits imposed by the 1940 Act. Under these limits, we generally cannot acquire more than 3% of the voting stock of any registered investment company, invest more than 5% of the value of our total assets in the securities of one investment company or invest more than 10% of the value of our total assets in the securities of more than one investment company. None of the policies in this paragraph is fundamental and each may be changed without stockholder approval.
Qualifying Assets
Under the 1940 Act, a BDC may not acquire any asset other than assets of the type listed in Section 55(a) of the 1940 Act, which are referred to as “qualifying assets,” unless, at the time the acquisition is made, qualifying assets represent at least 70% of the BDC’s total assets. The principal categories of qualifying assets that are applicable to us are the following:
|
|
(1) |
securities purchased in transactions not involving any public offering from the issuer of such securities, which issuer (subject to certain limited exceptions) is an eligible portfolio company, or from any person who is, or has been during the preceding 13 months, an affiliated person of an eligible portfolio company, or from any other person, subject to such rules as may be prescribed by the SEC. An “eligible portfolio company” is defined in the 1940 Act as any issuer that: |
|
|
• |
is organized under the laws of, and has its principal place of business in, the United States; |
|
|
• |
is not an investment company (other than a small business investment company wholly owned by the BDC) or a company that would be an investment company but for certain exclusions under the 1940 Act; and |
|
|
• |
satisfies either of the following: |
|
|
i. |
does not have any class of securities listed on a national securities exchange or has any class of securities listed on a national securities exchange subject to a $250 million market capitalization maximum; or |
|
|
ii. |
is controlled by a BDC or a group of companies including a BDC, the BDC actually exercises a controlling influence over the management or policies of the eligible portfolio company, and, as a result, the BDC has an affiliated person who is a director of the eligible portfolio company. |
|
|
(2) |
securities purchased in a private transaction from a U.S. issuer that is not an investment company or from an affiliated person of the issuer, or in transactions incident to such a private transaction, if the issuer is in bankruptcy and subject to reorganization or if the issuer, immediately prior to the purchase of its securities, was unable to meet its obligations as they came due without material assistance other than conventional lending or financing arrangements. |
|
|
(3) |
securities received in exchange for or distributed on or with respect to securities described above, or pursuant to the exercise of warrant investments or rights relating to such securities. |
|
|
(4) |
cash, cash equivalents, U.S. government securities or high-quality debt securities that mature in one year or less from the date of investment. |
The regulations defining and interpreting qualifying assets may change over time. We may adjust our investment focus as needed to comply with and/or take advantage of any regulatory, legislative, administrative or judicial actions in this area.
We look through our subsidiaries to the underlying holdings (considered together with portfolio assets held outside of our subsidiaries) for purposes of determining compliance with the 70% qualifying assets requirement of the 1940 Act. On a consolidated basis, at least 70% of our assets will be eligible assets.
Under Section 55(b) of the 1940 Act, the value of a BDC’s assets shall be determined as of the date of the most recent financial statements filed by such company with the SEC pursuant to Section 13 of the 1934 Act, and shall be determined no less frequently than annually.
26
Managerial Assistance to Portfolio Companies
BDCs generally must offer to make available to the issuer of its securities significant managerial assistance, except in circumstances where either (i) the BDC controls such issuer of securities or (ii) the BDC purchases such securities in conjunction with one or more other persons acting together and one of the other persons in the group makes available such managerial assistance. Making available managerial assistance means any arrangement whereby the BDC, through its directors, officers or employees, offers to provide, and, if accepted, does so provide, significant guidance and counsel concerning the management, operations or business objectives and policies of a portfolio company.
Temporary Investments
Pending investment in other types of qualifying assets, as described above, our investments may consist of cash, cash equivalents, U.S. government securities, repurchase agreements and high-quality debt investments that mature in one year or less from the date of investment, which we refer to, collectively, as “temporary investments,” so that 70% of our assets are qualifying assets or temporary investments. Typically, we invest in U.S. Treasury bills or in repurchase agreements, so long as the agreements are fully collateralized by cash or securities issued by the U.S. government or its agencies. A repurchase agreement involves the purchase by an investor, such as us, of a specified security and the simultaneous agreement by the seller to repurchase it at an agreed-upon future date and at a price that is greater than the purchase price by an amount that reflects an agreed-upon interest rate. There is no percentage restriction on the proportion of our assets that may be invested in such repurchase agreements. However, if more than 25% of our total assets constitute repurchase agreements from a single counterparty, we would not meet the “Diversification Tests,” in order to qualify as a RIC for U.S. federal income tax purposes. Accordingly, we do not intend to enter into repurchase agreements with a single counterparty in excess of this limit. Our Adviser monitors the creditworthiness of any counterparties with which we enter into repurchase agreement transactions.
Senior Securities
We are permitted, under specified conditions, to issue multiple classes of indebtedness and one class of stock senior to our common stock if our asset coverage, as that term is defined in the 1940 Act, is at least equal to 200% immediately after each such issuance. In addition, while any senior securities remain outstanding, we must make provisions to prohibit any distribution to our stockholders or the repurchase of such securities or shares unless we meet the applicable asset coverage ratios at the time of the distribution or repurchase. We may also borrow amounts up to 5% of the value of our total assets for temporary or emergency purposes without regard to asset coverage. We consolidate our financial results with all of our wholly owned subsidiaries for financial reporting purposes and measure our compliance with the leverage test applicable to BDCs under the 1940 Act on a consolidated basis. For a discussion of the risks associated with leverage, see “Risk Factors—Relating to our Business and Structure—Regulations governing our operation as a BDC affect our ability to, and the way in which we, raise additional capital.” As a BDC, the necessity of raising additional capital may expose us to risks, including the typical risks associated with leverage.
Codes of Ethics
We and our Adviser have each adopted a code of ethics pursuant to Rule 17j-1 under the 1940 Act and Rule 204A-1 under the Advisers Act, respectively, that establish procedures for personal investments and restricts certain personal securities transactions. Personnel subject to each code may invest in securities for their personal investment accounts, including securities that may be purchased or held by us, so long as such investments are made in accordance with the code’s requirements. You may read and copy the code of ethics at the SEC’s Public Reference Room in Washington, D.C. You may obtain information on the operation of the Public Reference Room by calling the SEC at 1-800-SEC-0330. In addition, each code of ethics is incorporated by reference as an exhibit to this annual report on Form 10-K, and is available on the EDGAR Database on the SEC’s website at www.sec.gov. You may also obtain copies of each code of ethics, after paying a duplicating fee, by electronic request at the following e-mail address: publicinfo@sec.gov, or by writing the SEC’s Public Reference Section, 100 F Street, N.E., Washington, D.C. 20549-0102.
Proxy Voting Policies and Procedures
We have delegated our proxy voting responsibility to our Adviser. The proxy voting policies and procedures of our Adviser are set out below. The guidelines are reviewed periodically by our Adviser and our directors who are not “interested persons,” and, accordingly, are subject to change.
27
As an investment adviser registered under the Advisers Act, our Adviser has a fiduciary duty to act solely in our best interests. As part of this duty, our Adviser recognizes that it must vote our securities in a timely manner free of conflicts of interest and in our best interests.
Our Adviser’s policies and procedures for voting proxies for its investment advisory clients are intended to comply with Section 206 of, and Rule 206(4)-6 under, the Advisers Act.
Proxy Policies
Our Adviser votes proxies relating to any of our portfolio equity securities in what it perceives to be the best interest of our stockholders. Our Adviser reviews on a case-by-case basis each proposal submitted to a stockholder vote to determine its effect on any of the portfolio equity securities we hold. In most cases our Adviser will vote in favor of proposals that our Adviser believes are likely to increase the value of any of the portfolio equity securities we hold. Although our Adviser generally votes against proposals that may have a negative effect on any of our portfolio equity securities, our Adviser may vote for such a proposal if there exist compelling long-term reasons to do so.
Our proxy voting decisions are made by our Adviser’s senior investment team. To ensure that our Adviser’s vote is not the product of a conflict of interest, our Adviser requires that (1) anyone involved in the decision-making process disclose to our Chief Compliance Officer any potential conflict that he or she is aware of and any contact that he or she has had with any interested party regarding a proxy vote and (2) employees involved in the decision-making process or vote administration are prohibited from revealing how our Adviser intends to vote on a proposal in order to reduce any attempted influence from interested parties. Where conflicts of interest may be present, our Adviser discloses such conflicts to us, including our independent directors and may request guidance from us on how to vote such proxies.
Proxy Voting Records
You may obtain information without charge about how our Adviser voted proxies by making a written request for proxy voting information to: 2755 Sand Hill Road, Suite 150, Menlo Park, California 94025, Attention: Corporate Secretary.
Privacy Principles
We are committed to maintaining the privacy of our stockholders and to safeguarding their nonpublic personal information. The following information is provided to help you understand what personal information we collect, how we protect that information and why, in certain cases, we may share information with select other parties.
Generally, we do not receive any nonpublic personal information relating to our stockholders, although certain nonpublic personal information of our stockholders may become available to us. We do not disclose any nonpublic personal information about our stockholders or former stockholders to anyone, except as permitted by law or as are necessary in order to service stockholder accounts (for example, to a transfer agent or third-party administrator).
We restrict access to nonpublic personal information about our stockholders to employees of our Adviser and its affiliates with a legitimate business need for the information. We maintain physical, electronic and procedural safeguards designed to protect the nonpublic personal information of our stockholders.
Other
Under the 1940 Act, we are required to provide and maintain a bond issued by a reputable fidelity insurance company to protect us against larceny and embezzlement. Furthermore, as a BDC, we are prohibited from protecting any director or officer against any liability to us or our stockholders arising from willful misfeasance, bad faith, gross negligence or reckless disregard of the duties involved in the conduct of such person’s office.
We and our Adviser are each required to adopt and implement written policies and procedures reasonably designed to prevent violation of relevant federal securities laws, review these policies and procedures annually for their adequacy and the effectiveness of their implementation, and designate a Chief Compliance Officer to be responsible for administering these policies and procedures.
28
We are prohibited under the 1940 Act from participating in certain transactions with our affiliates without the prior approval of our independent directors and, in some cases, the SEC. Any person that owns, directly or indirectly, 5% or more of our outstanding voting securities will be our affiliate for purposes of the 1940 Act and we are generally prohibited from buying or selling any security from or to such affiliate without the prior approval of our independent directors. The 1940 Act also prohibits certain “joint” transactions with certain of our affiliates, which could include concurrent investments in the same company, without prior approval of our independent directors and, in some cases, the SEC. We are prohibited from buying or selling any security from or to any person that controls us or who owns more than 25% of our voting securities or certain of that person’s affiliates, or entering into prohibited joint transactions with such persons, absent the prior approval of the SEC. As a result of these restrictions, we may be prohibited from buying or selling any security (other than any security of which we are the issuer) from or to any company that is advised or managed by TPC, our Adviser or their affiliates without the prior approval of the SEC, which may limit the scope of investment opportunities that would otherwise be available to us.
In the future, we may co-invest with TPC and/or investment funds, accounts and vehicles managed by TPC where doing so is consistent with our investment strategy as well as applicable law and SEC staff interpretations. We generally are only permitted to co-invest with TPC and/or such investment funds, accounts and vehicles where the only term that is negotiated is price. However, we, TPC and our Adviser have filed an exemptive application with the SEC to permit greater flexibility to negotiate the terms of co-investments with TPC and/or investment funds, accounts and investment vehicles managed by TPC in a manner consistent with our investment objective, positions, policies, strategies and restrictions as well as regulatory requirements and other pertinent factors. On February 28, 2018, the SEC issued a public “notice” with regard to the exemptive application that we filed. Assuming that no requests for a hearing are received by the SEC in response to the notice, we expect the SEC to issue the exemptive order after the notice period expires on March 26, 2018.
Sarbanes-Oxley Act
The Sarbanes-Oxley Act of 2002, as amended, or the “Sarbanes-Oxley Act,” imposes a wide variety of regulatory requirements on publicly held companies and their insiders. Many of these requirements affect us. For example:
|
|
(1) |
pursuant to Rule 13a-14 under the Securities Exchange Act of 1934, as amended, or the “Exchange Act,” our principal executive officer and principal financial officer must certify the accuracy of the financial statements contained in our periodic reports; |
|
|
(2) |
pursuant to Item 307 under Regulation S-K, our periodic reports must disclose our conclusions about the effectiveness of our disclosure controls and procedures; |
|
|
(3) |
pursuant to Rule 13a-15 under the Exchange Act, our management must prepare an annual report regarding its assessment of our internal control over financial reporting. When we are no longer an emerging growth company under the JOBS Act, our independent registered public accounting firm will be required to audit our internal controls over financial reporting; and |
|
|
(4) |
pursuant to Item 308 of Regulation S-K and Rule 13a-15 under the Exchange Act, our periodic reports must disclose whether there were significant changes in our internal controls over financial reporting or in other factors that could significantly affect these controls subsequent to the date of their evaluation, including any corrective actions with regard to significant deficiencies and material weaknesses. |
The Sarbanes-Oxley Act requires us to review our current policies and procedures to determine whether we comply with the Sarbanes-Oxley Act and the regulations promulgated under such act. We continue to monitor our compliance with all regulations that are adopted under the Sarbanes-Oxley Act and will take actions necessary to ensure that we comply with that act.
29
We are an emerging growth company as defined in the JOBS Act and we have taken and will continue to be able to take advantage of certain specified reduced disclosure and other requirements that are otherwise generally applicable to public companies that are not “emerging growth companies” including, but not limited to, not being required to comply with the auditor attestation requirements of Section 404 of the Sarbanes-Oxley Act, reduced disclosure obligations regarding executive compensation in our periodic reports and proxy statements and exemptions from the requirements of holding a nonbinding advisory vote on executive compensation and stockholder approval of any golden parachute payments not previously approved. We expect to remain an emerging growth company for up to five years following the completion of our initial public offering or until the earliest of (i) the last day of the first fiscal year in which our total annual gross revenues exceed $1.07 billion, (ii) the last day of our fiscal year following the fifth anniversary of the date of the first sale of our common equity securities pursuant to an effective registration statement under the Securities Act of 1933, as amended, or the “Securities Act,” (iii) the date on which we have, during the previous three year period, issued more than $1 billion in non-convertible debt, or (iv) the date that we become a “large accelerated filer” as defined in Rule 12b-2 under the Exchange Act which would occur if the market value of our common stock that is held by non-affiliates exceeds $700 million as of the last business day of our most recently completed second fiscal quarter and we have been publicly reporting pursuant to Section 13(a) or 15(d) of the Exchange Act for at least 12 months. In addition, we have irrevocably opted-out of the extended transition period provided in Section 7(a)(2)(B) of the Securities Act for complying with new or revised accounting standards. As a result, we comply with new or revised accounting standards on the same time frames as other public companies that are not “emerging growth companies.”
Corporate Governance Regulations
The NYSE has adopted corporate governance regulations that listed companies must comply with. We are in compliance with these corporate governance listing standards. We monitor our compliance with all future listing standards and take all necessary actions to ensure that we are in compliance therewith.
Available Information
Our address is 2755 Sand Hill Road, Suite 150, Menlo Park, CA 94025. Our phone number is (650) 854-2090 and our internet website is at www.tpvg.com. We make available free of charge on our website our proxy statement, annual report on Form 10-K, quarterly reports on Form 10-Q, current reports on Form 8-K, and amendments to those reports as soon as reasonably practical after we electronically file such material with, or furnish to, the SEC. Information contained on our website is not incorporated by reference into this annual report on Form 10-K and you should not consider information contained on our website to be part of this annual report on Form 10-K or any other report we file with the SEC.
The SEC also maintains a website that contains reports, proxy and information statements and other information we file with the SEC at www.sec.gov. Copies of these reports, proxy and information statements and other information may also be obtained, after paying a duplicating fee, by electronic request at publicinfo@sec.gov, or by writing to the SEC’s Public Reference Section, 100 F Street, N.E., Washington, D.C. 20549-0102. Information on the operation of the Public Reference Room may be obtained by calling the SEC at 1-800-SEC-0330.
You should carefully consider these risk factors, together with all of the other information included in this annual report on Form 10-K and other reports and documents filed by us with the SEC. The risks set out below are not the only risks we face. Additional risks and uncertainties not presently known to us or not presently deemed material by us may also impair our operations and performance. If any of the following events occur, our financial condition, results of operations and cash flows could be materially and adversely affected. In such case, our net asset value and the trading price of our common stock could decline and you may lose all or part of your investment. The risk factors presented below are those we believe to be the principal risk factors associated with our Company given our investment objectives, investment policies and capital structure.
30
Risks Relating to our Business and Structure
Global capital markets could enter a period of severe disruption and instability. These market conditions have historically and could again have a materially adverse effect on debt and equity capital markets in the United States, which could have a materially negative impact on our business, financial condition and results of operations.
The U.S. and global capital markets have experienced periods of disruption characterized by the freezing of available credit, a lack of liquidity in the debt capital markets, significant losses in the principal value of investments, the re-pricing of credit risk in the broadly syndicated credit market, the failure of certain major financial institutions and general volatility in the financial markets. During these periods of disruption, general economic conditions deteriorated with material and adverse consequences for the broader financial and credit markets, and the availability of debt and equity capital for the market as a whole, and financial services firms in particular, was reduced significantly. These conditions may reoccur for a prolonged period of time or materially worsen in the future. In addition, signs of deteriorating sovereign debt conditions in Europe and concerns of economic slowdown in China create uncertainty that could lead to further disruptions and instability. We may in the future have difficulty accessing debt and equity capital, and a severe disruption in the global financial markets, deterioration in credit and financing conditions or uncertainty regarding U.S. government spending and deficit levels, European sovereign debt, Chinese economic slowdown or other global economic conditions could have a material adverse effect on our business, financial condition and results of operations.
Further downgrades of the U.S. credit rating, impending automatic spending cuts or another government shutdown could negatively impact our liquidity, financial condition and earnings.
Recent U.S. debt ceiling and budget deficit concerns have increased the possibility of additional credit-rating downgrades and economic slowdowns, or a recession in the United States. Although U.S. lawmakers passed legislation to raise the federal debt ceiling on multiple occasions, ratings agencies have lowered or threatened to lower the long-term sovereign credit rating on the United States. In the future, the U.S. government may not be able to meet its debt payments unless the federal debt ceiling is raised. If legislation increasing the debt ceiling is not enacted, as needed, and the debt ceiling is reached, the U.S. federal government may stop or delay making payments on its obligations, which could negatively impact the U.S. economy and our portfolio companies. In addition, the impact of the federal debt ceiling or any further downgrades to the U.S. government's sovereign credit rating or its perceived creditworthiness could adversely affect the U.S. and global financial markets and economic conditions. Absent further quantitative easing by the Federal Reserve, these developments could cause interest rates and borrowing costs to rise, which may negatively impact our ability to access the debt markets on favorable terms. In the past, disagreement over the federal budget has caused the U.S. federal government to shut down for periods of time. Continued adverse political and economic conditions could have a material adverse effect on our business, financial condition and results of operations.
Global economic, political and market conditions may adversely affect our business, results of operations and financial condition, including our revenue growth and profitability.
The current worldwide financial market situation, as well as various social and political tensions in the U.S. and around the world, may contribute to increased market volatility, may have long-term effects on the U.S. and worldwide financial markets, and may cause economic uncertainties or deterioration in the U.S. and worldwide. The global capital markets experienced extreme volatility and disruption during the economic downturn that began in mid-2007, and the U.S. economy was in a recession for several consecutive calendar quarters during the same period. In 2010, a financial crisis emerged in Europe, triggered by high budget deficits and rising direct and contingent sovereign debt, which created concerns about the ability of certain nations to continue to service their sovereign debt obligations. Risks resulting from such debt crisis, including any austerity measures taken in exchange for bailout of certain nations, and any future debt crisis in Europe or any similar crisis elsewhere could have a detrimental impact on the global economic recovery, sovereign and non-sovereign debt in certain countries and the financial condition of financial institutions generally. In June 2016, the United Kingdom held a referendum in which voters approved an exit from the European Union (“Brexit”), and, subsequently, on March 29, 2017, the U.K. government began the formal process of leaving the European Union, which is set to occur on March 29, 2019. Brexit has created political and economic uncertainty and instability in the global markets (including currency and credit markets), and especially in the United Kingdom and the European Union, and this uncertainty and instability may last indefinitely. Because of the election results in the U.K. in June 2017, there is increased uncertainty on the timing of Brexit. There is continued concern about national-level support for the Euro and the accompanying coordination of fiscal and wage policy among European Economic and Monetary Union member countries. In addition, the fiscal and monetary policies of foreign nations, such as Russia and China, may have a severe impact on the worldwide and U.S. financial markets.
31
As a result of the 2016 U.S. election, the Republican Party currently controls both the executive and legislative branches of government, which increases the likelihood that legislation may be adopted that could significantly affect the regulation of U.S. financial markets. Areas subject to potential change, amendment or repeal include the Dodd-Frank Act and the authority of the Federal Reserve and the Financial Stability Oversight Council. The United States may also potentially withdraw from or renegotiate various trade agreements and take other actions that would change current trade policies of the United States. We cannot predict the effects of these or similar events in the future on the U.S. economy and securities markets or on our investments. We monitor developments and seek to manage our investments in a manner consistent with achieving our investment objective, but there can be no assurance that we will be successful in doing so.
We may not be able to operate our business successfully or generate sufficient revenue to make or sustain distributions to our stockholders.
We were formed in June 2013. Our Adviser was formed in August 2013. We commenced operations in March 2014. As a result, we are subject to many of the business risks and uncertainties associated with recently formed businesses, including the risk that we will not achieve our investment objective and that the value of your investment could decline substantially. As a BDC, we are subject to the regulatory requirements of the SEC, in addition to the specific regulatory requirements applicable to BDCs under the 1940 Act and RICs under the Code. In addition, our Adviser is subject to the regulatory requirements applicable to registered investment advisers under the Advisers Act. We and our Adviser have limited experience operating or advising under this regulatory framework, and we may incur substantial additional costs, and expend significant time or other resources operating under this regulatory framework.
We are dependent upon our executive officers and our Adviser’s senior investment team and members of its Investment Committee, in particular, Messrs. Labe and Srivastava, for our success and upon our Adviser’s access to such individuals pursuant to the Staffing Agreement. If our Adviser were to lose such access, our ability to achieve our investment objective could be significantly harmed.
Our Adviser has entered into the Staffing Agreement with TPC. Pursuant to the Staffing Agreement, TPC has made and will continue to make, subject to the terms of the Staffing Agreement, its investment and portfolio management and monitoring teams available to our Adviser. We believe that the Staffing Agreement (i) provides us with access to deal flow generated by TPC in the ordinary course of its business; (ii) provides us with access to TPC’s investment professionals, including its senior investment team led by Messrs. Labe and Srivastava, and TPC’s non-investment employees; and (iii) commits certain key senior members of TPC’s Investment Committee to serve as members of our Adviser’s Investment Committee. TPC is obligated under the Staffing Agreement to allocate investment opportunities among its affiliates fairly and equitably over time in accordance with its allocation policy. We depend on the diligence, skill and network of business contacts of our Adviser’s senior investment team and our executive officers to achieve our investment objective. We cannot assure you that TPC will fulfill its obligations under the Staffing Agreement or its allocation policy. Further, the Staffing Agreement may be terminated with 60 days’ prior written notice, and we cannot assure you that the Staffing Agreement will not be terminated by TPC or that our Adviser will continue to have access to the professionals and Investment Committee of TPC or its information and deal flow. The loss of any such access would limit our ability to achieve our investment objective and operate as we anticipate. This could have a material adverse effect on our financial condition, results of operations and cash flows.
Our business model depends, in part, upon TPC’s relationships with a select group of leading venture capital investors. Any inability of TPC to maintain or develop these relationships, or the failure of these relationships to result in referrals of investment opportunities for us, could materially and adversely affect our business.
We depend, in part, upon TPC to maintain industry relationships, including with a select group of leading venture capital investors, and we utilize these relationships to source and identify potential investment opportunities, although this group of leading venture capital investors, which may be modified from time to time, is not obligated to provide us with referrals for investment opportunities. If TPC fails to maintain or develop such relationships, or if we fall out of favor with such venture capital investors, it could decrease our access to these investors or their support and we may not be able to grow our investment portfolio. We can offer no assurance that these relationships will result in any investment opportunities for us in the future. In addition, any harm to the reputation of TPC and/or its select group of leading venture capital investors or their relationships could decrease our deal flow and the outlook of our investments which could have a material adverse effect on our financial condition, results of operations and cash flows.
32
Our success depends on the ability of TPC and our Adviser to attract and retain qualified personnel in a competitive environment.
Our growth requires that TPC and our Adviser retain and attract new investment and administrative personnel in a competitive market. Their ability to attract and retain personnel with the requisite credentials, experience and skills depends on several factors including, but not limited to, their and our reputations and their ability to offer competitive wages, benefits and professional growth opportunities. Many of the entities with whom they compete for experienced personnel, including investment funds, have greater resources than they have.
We may not replicate the historical results achieved by TPC or members of its senior investment team.
Our focus in making investments differs from that of TPC. For example, while TPC’s portfolio consists primarily of providing financing to venture capital-backed companies across all stages of their development, including the venture growth stage, we pursue an investment strategy that is focused primarily on the venture growth stage. The profile and underwriting characteristics of an early stage venture capital-backed company are very different from those of a later stage venture capital-backed company and/or those of a venture growth stage company. Furthermore, within venture growth stage companies, the uses, structures and value propositions of debt financing vary considerably among companies and industries and require a high degree of venture lending and leasing expertise and technology, life sciences and other high growth industries knowledge, specialization and flexibility from a lender. As a result, we cannot assure you that we will replicate the historical results achieved by TPC or members of its senior investment team and we caution you that our investment returns could be substantially lower than the returns achieved by them in prior periods.
The nature of our approach to our business may lead to volatility and variability from period to period with respect to new originations. Our financial condition and results of operations depends upon our ability to effectively manage credit, deploy capital and grow our business.
Our ability to achieve our investment objective depends on our Adviser’s ability to manage our business and to grow our investments and earnings. This depends on our Adviser’s ability to identify, invest in and monitor companies that meet our underwriting criteria. Furthermore, our Adviser may choose to slow or accelerate new business originations depending on market conditions, rate of investment of TPC’s select group of leading venture capital investors, our Adviser’s knowledge, expertise and experience, and other market dynamics. The achievement of our investment objective on a cost-effective basis depends upon our Adviser’s execution of our investment process, its ability to provide competent, attentive and efficient services to us and, to a lesser extent, our access to financing on acceptable terms. Accomplishing this result on a cost-effective basis is largely a function of our Adviser’s origination capabilities, management of the investment process, ability to provide efficient services and access to financing sources on acceptable terms. Our Adviser’s senior investment team also has substantial responsibilities in connection with the management of TPC’s investment vehicles and business segments. These activities may distract them from servicing new investment opportunities for us or slow our rate of investment. Any failure to manage our business and our future growth effectively could have a material adverse effect on our financial condition, results of operations and cash flows.
Our ability to enter into transactions with our affiliates and to make investments in venture growth stage companies along with our affiliates is restricted by the 1940 Act which may limit the scope of investment opportunities available to us.
We are prohibited under the 1940 Act from participating in certain transactions with our affiliates without the prior approval of our independent directors and, in some cases, the SEC. Any person that owns, directly or indirectly, 5% or more of our outstanding voting securities will be our affiliate for purposes of the 1940 Act. In addition, any venture growth stage company in which we or TPC or its affiliates own 5% or more of its outstanding voting securities will be our affiliate for purposes of the 1940 Act. We are generally prohibited from buying or selling any security from or to such affiliate without the prior approval of our independent directors and, in certain cases, the SEC. The 1940 Act also prohibits certain “joint” transactions with certain of our affiliates, which could include concurrent investments in the same company, without prior approval of our independent directors and, in some cases, the SEC. We are prohibited from buying or selling any security from or to any person that controls us or who owns more than 25% of our voting securities or certain of that person’s affiliates, or entering into prohibited joint transactions with such persons, absent the prior approval of the SEC. As a result of these restrictions, we may be prohibited from (i) buying or selling any security (other than any security of which we are the issuer) from or to any company that is advised or managed by TPC or our Adviser or any of their affiliates or in which TPC or our Adviser or any of their affiliates also hold an interest or (ii) modifying any security that we hold in a company in which TPC or our Adviser or any of their affiliates also hold an interest without the prior approval of the SEC, which may limit our ability to take any action with respect to an existing investment or potential investment regardless of whether we conclude that the action may be in the best interest of our stockholders.
33
Our investment strategy includes investments in secured loans, together with, in many cases, attached equity “kickers” in the form of warrant investments, and direct equity investments. TPC also manages, and in the future may manage, other investment funds, accounts or vehicles that invest or may invest in these investments. Although we are the primary vehicle through which TPC focuses its venture growth stage business, other vehicles sponsored or managed by our Adviser’s senior investment team may also invest in venture growth stage companies or may have prior investments outstanding to our borrowers. As a result, members of our Adviser’s senior investment team and Investment Committee, in their roles at TPC, may face conflicts in the allocation of investment opportunities among us and other investment vehicles managed by TPC with similar or overlapping investment objectives in a manner that is fair and equitable over time and consistent with TPC’s allocation policy. Generally, when a particular investment would be appropriate for us as well as one or more other investment funds, accounts or vehicles managed by our Adviser’s senior investment team, such investment is apportioned by our Adviser’s senior investment team in accordance with (1) our Adviser’s internal conflict of interest and allocation policies, (2) the requirements of the Advisers Act and (3) certain restrictions under the 1940 Act regarding co-investments with affiliates. Such apportionment may not be strictly pro rata, depending on the good faith determination of all relevant factors, including differing investment objectives, diversification considerations and the terms of our or the respective governing documents of such investment funds, accounts or investment vehicles. These procedures could, in certain circumstances, limit whether or not a co-investment opportunity is available to us, the timing of acquisitions and dispositions of investments, the price paid or received by us for investments or the size of the investment purchased or sold by us.
We have co-invested and, in the future, may co-invest with TPC and/or investment funds, accounts and vehicles managed by TPC where doing so is consistent with our investment strategy as well as applicable law and SEC staff interpretations. We generally are only permitted to co-invest with TPC and/or such investment funds, accounts and vehicles where the only term that is negotiated is price and generally in accordance with SEC guidance. However, we, TPC and our Adviser have filed an exemptive application with the SEC to permit greater flexibility to negotiate the terms of co-investments with TPC and/or investment funds, accounts and investment vehicles managed by TPC in a manner consistent with our investment objective, positions, policies, strategies and restrictions as well as regulatory requirements and other pertinent factors. On February 28, 2018, the SEC issued a public “notice” with regard to the exemptive application that we filed. Assuming that no requests for a hearing are received by the SEC in response to the notice, we expect the SEC to issue the exemptive order after the notice period expires on March 26, 2018.
We operate in a highly competitive market for investment opportunities and we may not be able to compete effectively.
Our competitors include both existing and newly formed equity and debt focused public and private funds, other BDCs, investment banks, venture-oriented banks, commercial financing companies and, to the extent they provide an alternative form of financing, private equity and hedge funds. One or more of our competitors may have or develop relationships with TPC’s select group of leading venture capital investors. We may also be limited in our ability to make an investment pursuant to the restrictions under the 1940 Act to the extent one or more of our affiliates has an existing investment with such obligor. Additionally, many of our competitors are substantially larger and have considerably greater financial, technical and marketing resources than us. For example, we believe some of our competitors may have access to funding sources that are not available to us. In addition, some of our competitors may have higher risk tolerances or different risk assessments, which expose them to a wider variety of investments. Furthermore, many of our competitors are not subject to the regulatory restrictions that the 1940 Act imposes on us as a BDC or to the distribution and other requirements we must satisfy to maintain our ability to be subject to tax as a RIC.
The competitive pressures we face may have a material adverse effect on our financial condition, results of operations and cash flows. We do not compete primarily on the financing terms we offer and believe that some competitors make loans with rates that are comparable or lower than our rates. We may lose some investment opportunities if we do not match our competitors’ pricing, terms and structure. However, if we match our competitors’ pricing, terms and structure, we may experience decreased net interest income, lower yields and increased risk of credit loss. As a result of this competition, we may not be able to take advantage of attractive investment opportunities from time to time, and we may not be able to identify and make investments that are consistent with our investment objective.
34
We will be subject to corporate-level income tax and may default under the Credit Facility if we are unable to qualify or maintain our qualification and tax treatment as a RIC under Subchapter M of the Code.
To qualify for tax treatment as a RIC under Subchapter M of the Code, we must meet certain source-of-income, asset diversification and distribution requirements. The distribution requirement for a RIC generally is satisfied if we distribute at least 90% of our net ordinary income and net realized short-term capital gains in excess of net realized long-term capital losses, if any, to our stockholders on an annual basis. Because we incur debt, we are subject to certain asset coverage ratio requirements under the 1940 Act and financial covenants under loan and credit agreements that could, under certain circumstances, restrict us from making distributions necessary to qualify for tax treatment as a RIC. If we are unable to obtain cash from other sources, we may fail to qualify for tax treatment as a RIC and, thus, may be subject to corporate-level income tax. To qualify as a RIC, we must also meet certain asset diversification requirements at the end of each calendar quarter. Failure to meet these tests may result in our having to dispose of certain investments quickly in order to prevent the loss of our qualification as a RIC. Because most of our investments are in private companies, any such dispositions may be made at disadvantageous prices and may result in substantial losses. If we fail to qualify as a RIC for any reason and become subject to corporate income tax, the resulting corporate income taxes could substantially reduce our net assets, the amount of funds available for distributions to our stockholders and the amount of funds available for new investments.
We may need to raise additional capital to grow. If additional capital is not available or not available on favorable terms, our ability to grow will be impaired.
We may need additional capital to fund new investments or unfunded commitments and grow our portfolio of investments. We intend to access the capital markets periodically to issue debt or equity securities or borrow from financial institutions in order to obtain such additional capital. Unfavorable economic conditions could increase our funding costs, limit our access to the capital markets or result in a decision by lenders not to extend credit to us. In addition, there may be fewer lenders familiar with, or willing to provide credit to, firms in our industry. The availability of debt from lenders may be more limited than it is for firms that are not in our industry due to the credit profile of our targeted borrowers or the structure and risk profile of our unrated loans. As a result, we may have difficulty raising additional capital in order to fund our loans and grow our business.
In order to maintain our ability to be subject to tax as a RIC, we will be required to distribute at least 90% of our net ordinary income and net realized short-term capital gains in excess of net realized long-term capital losses, if any, to our stockholders. As a result, these earnings will not be available to fund new investments. As a BDC, we generally are required to meet a coverage ratio of total assets to total borrowings and other senior securities, which includes all of our borrowings and any preferred stock that we may issue in the future, of at least 200%. This requirement limits the amount that we may borrow. This limitation may prevent us from incurring debt and require us to raise additional equity at a time when it may be disadvantageous for us to do so. We cannot assure you that debt and equity financing will be available to us on favorable terms, or at all, and debt financings may be restricted by the terms of any of our outstanding borrowings.
In addition, shares of closed-end investment companies have recently traded at discounts to their net asset values. If our common stock trades below its net asset value, we will not be able to issue additional shares of our common stock at its market price without first obtaining the approval for such issuance from our stockholders and our independent directors. If additional funds are not available to us, we could be forced to curtail or cease new lending and investment activities and our net asset value could decline.
A reduction in the availability of new capital or an inability on our part to access the capital markets successfully could limit our ability to grow our business and execute our business strategy fully and could decrease our earnings, if any, which would have a material and adverse effect on our financial condition, results of operations and cash flows.
We may have difficulty paying our required distributions if we recognize income before, or without, receiving cash representing such income.
For U.S. federal income tax purposes, in certain circumstances, we may be required to recognize taxable income prior to when we receive cash, such as the accrual of end-of-term payments, PIK, interest payments and/or OID. Our end-of-term payments are contractual and fixed interest payments due at the maturity date of the loan, including upon prepayment, and are a fixed percentage of the original principal balance of the loan. OID decreases our loan balance by an amount equal to the cost basis of the upfront warrant investment received and certain capitalized fees we receive in connection with our loan and is recognized by us as non-cash income over the life of the secured loan. Our secured loans generally include an end-of-term payment and/or PIK interest payment. Such payments, which could be significant relative to our overall investment activities are included in income before we receive any corresponding cash payment. We are also required to include in income certain other amounts that we will not receive in cash, including OID.
35
To the extent OID instruments, such as zero coupon bonds and PIK loans, constitute a significant portion of our income, investors will be exposed to typical risks associated with such income that are required to be included in taxable and accounting income prior to receipt of cash, including the following: (a) the higher interest rates of PIK loans reflect the payment deferral and increased credit risk associated with these instruments, and PIK instruments generally represent a significantly higher credit risk than coupon loans; (b) PIK loans may have unreliable valuations because their accruals require continuing judgments about the collectability of the deferred payments and the value of any associated collateral; (c) an election to defer PIK interest payments by adding them to loan principal increases our gross assets, thus increasing our Adviser’s future base management fees, and increases future investment income, thus increasing the Adviser’s future income incentive fees at a compounding rate; (d) market prices of zero-coupon or PIK securities are affected to a greater extent by interest rate changes and may be more volatile than securities that pay interest periodically and in cash; (e) because OID income is accrued without any cash being received by us, required cash distributions may have to be paid from offering proceeds or the sale of our assets without investors being given any notice of this fact; (f) the deferral of PIK interest increases the loan-to-value ratio, which is a measure of the riskiness of a loan; (g) even if the accounting conditions for income accrual are met, the borrower could still default when our actual payment is due at the maturity of the loan; (h) OID creates risk of non-refundable cash payments to the advisor our Adviser on-cash accruals that may never be realized; and (i) because OID will be included in our “investment company taxable income” for the year of the accrual, we may be required to make distributions to stockholders to satisfy the Annual Distribution Requirement applicable to RICs, even where we have not received any corresponding cash amount.
Since, in these cases we may recognize income before or without receiving cash representing such income, we may have difficulty meeting the requirement to distribute at least 90% of our net ordinary income and net realized short-term capital gains in excess of net realized long-term capital losses, if any, to maintain our tax treatment as a RIC and to avoid a 4% U.S. federal excise tax on certain of our undistributed income. In such a case, we may have to sell some of our investments at times we would not consider advantageous, raise additional debt or equity capital or reduce new investment originations to meet these distribution requirements. If we are not able to obtain sufficient cash from other sources, we may fail to qualify for tax treatment as a RIC and thus be subject to corporate-level income tax.
You may not receive distributions or our distributions may not grow over time.
We intend to make distributions on a quarterly basis to our stockholders out of assets legally available for distribution. We cannot assure you that we will achieve investment results that will allow us to make a specified level of cash distributions or year-to-year increases in cash distributions. Our ability to pay distributions might be materially and adversely affected by the impact of one or more of the risks described herein. Due to the asset coverage test applicable to us under the 1940 Act as a BDC, we may be limited in our ability to make distributions. All distributions will be made at the discretion of our Board and will depend on our earnings, financial condition, maintenance of RIC status, compliance with applicable BDC, SBA regulations (when and if applicable) and such other factors as our Board may deem relevant from time to time. We cannot assure you that we will make distributions to our stockholders in the future.
Regulations governing our operation as a BDC affect our ability to, and the way in which we, raise additional capital. As a BDC, the necessity of raising additional capital may expose us to risks, including the typical risks associated with leverage.
We may issue debt securities or preferred stock and/or borrow money from banks or other financial institutions, which we refer to collectively as “senior securities,” up to the maximum amount permitted by the 1940 Act. Under the provisions of the 1940 Act, we are permitted as a BDC to issue senior securities in amounts such that our asset coverage ratio, as defined in the 1940 Act, equals at least 200% of our gross assets less all liabilities and indebtedness not represented by senior securities, after each issuance of senior securities. If the value of our assets declines, we may be unable to satisfy this test. If that happens, we may be required to sell a portion of our investments at a time when such sales may be disadvantageous to us in order to repay a portion of our indebtedness. Also, any amounts that we use to service our indebtedness would not be available for distributions to our common stockholders. If we issue senior securities, we will be exposed to typical risks associated with leverage, including an increased risk of loss.
We are not generally able to issue and sell our common stock at a price below net asset value per share. We may, however, sell our common stock or warrant investments, options or rights to acquire our common stock that expire more than 120 days from issuance, at a price below then-current net asset value per share of our common stock if our Board determines that such sale is in our best interests, and if our stockholders approve such sale. In any such case, the price at which our securities are to be issued and sold may not be less than a price that, in the determination of our Board, closely approximates the market value of such securities (less any distributing commission or discount). If we raise additional funds by issuing common stock or senior securities convertible into, or exchangeable for, our common stock, then the percentage ownership of our stockholders at that time will decrease and you may experience dilution.
36
Pending legislation may allow us to incur additional leverage.
As a BDC, under the 1940 Act we generally are not permitted to incur indebtedness unless immediately after such borrowing we have an asset coverage for total borrowings of at least 200% (i.e., the amount of debt may not exceed 50% of the value of our total assets or we may borrow an amount equal to 100% of net assets). The U.S. Senate recently introduced legislation which, if passed, would modify this section of the 1940 Act and increase the amount of debt that BDCs may incur by modifying the asset coverage percentage from 200% to 150%. As a result, we may be able to incur additional indebtedness in the future and therefore your risk of an investment in us may increase.
We finance certain of our investments with borrowed money, which magnifies the potential for gain or loss on amounts invested and increases the risk of investing in us.
We finance certain of our investments with borrowed money when we expect the return on our investment to exceed the cost of borrowing. As of December 31, 2017, we have $67.0 million of principal outstanding under our Credit Facility and $74.8 million of principal outstanding on our 2022 Notes. The use of leverage magnifies the potential for gain or loss on amounts invested. The use of leverage is generally considered a speculative investment technique and increases the risks associated with investing in shares of our common stock. Lenders will have fixed dollar claims on our assets that are superior to the claims of our common stockholders and we would expect such lenders to seek recovery against our assets in the event of a default. We may pledge up to 100% of our assets or the assets of a subsidiary under the terms of any debt instruments we may enter into with lenders. In addition, under the terms of the Credit Facility and the 2022 Notes and any borrowing facility or other debt instrument we may enter into in the future, we are or will likely be required to use the net proceeds of any investments that we sell to repay a portion of the amount borrowed under such facility or instrument before applying such net proceeds to any other uses. If the value of our assets decreases, leveraging would cause our net asset value to decline more sharply than it otherwise would have had we not leveraged, thereby magnifying losses, potentially triggering mandatory debt payments or asset contributions under the Credit Facility or eliminating our stake in a leveraged investment. Similarly, any decrease in our revenue or income will cause our net income to decline more sharply than it would have had we not borrowed. Such a decline would also negatively affect our ability to make distributions with respect to our common stock. Our ability to service any debt depends largely on our financial performance and is subject to prevailing economic conditions and competitive pressures.
As a BDC, we generally are required to meet a coverage ratio of total assets to total borrowings and other senior securities, which include all of our borrowings (other than potential leverage in future SBIC, subsidiaries, should we receive an SBIC license(s), subject to exemptive relief) and any preferred stock that we may issue in the future, of at least 200%. If this ratio declines below 200%, we will not be able to incur additional debt and could be required to sell a portion of our investments to repay some debt when it is otherwise disadvantageous for us to do so. This could have a material adverse effect on our operations, and we may not be able to make distributions. The amount of leverage that we employ depends on our Adviser’s and our Board’s assessment of market and other factors at the time of any proposed borrowing. We cannot assure you that we will be able to obtain credit at all or on terms acceptable to us.
In addition, the Credit Facility imposes, and any debt facilities we may enter into in the future may impose, financial and operating covenants that restrict our business activities, including limitations that hinder our ability to finance additional loans and investments or to make the distributions required to maintain our ability to be subject to tax treatment as a RIC under the Code.
We may default under the Credit Facility or the 2022 Notes or any future indebtedness or be unable to amend, repay or refinance any such facility on commercially reasonable terms, or at all, which could have a material adverse effect on our financial condition, results of operations and cash flows.
In the event we default under the Credit Facility or the 2022 Notes or any future indebtedness or are unable to amend, repay or refinance any such future indebtedness on commercially reasonable terms, or at all, our business could be materially and adversely affected as we may be forced to sell all or a portion of our investments quickly and prematurely at what may be disadvantageous prices to us in order to meet our outstanding payment obligations and/or support working capital requirements under the Credit Facility and the 2022 Notes or any future indebtedness, any of which would have a material adverse effect on our financial condition, results of operations and cash flows. In addition, following any such default, the administrative agent under the Credit Facility could assume control of the disposition of any or all of our assets or restrict our utilization of any indebtedness, including the selection of such assets to be disposed and the timing of such disposition, including decisions with respect to our warrant investments, which would have a material adverse effect on our business, financial condition, results of operations and cash flows. Events of default under the Credit Facility include, among other things, (i) a payment default; (ii) a change of control; (iii) bankruptcy; (iv) a covenant default; and (v) our failure to maintain compliance with RIC provisions at all times.
37
Because we use debt to finance certain of our investments, if market interest rates were to increase, our cost of capital could increase, which could reduce our net income. In addition, if the Credit Facility were to become unavailable, it could have a materially adverse effect on our business, financial condition and results of operations.
Because we borrow money to finance certain of our investments, including under the Credit Facility, our net income will depend, in part, upon the difference between the rate at which we borrow funds and the rate at which we invest those funds. As a result, we can offer no assurance that a significant change in market interest rates would not have a material adverse effect on our net income in the event we use debt to finance our investments. In periods of rising interest rates, our cost of funds would increase, which could reduce our net income. In addition, if the Credit Facility were to become unavailable to us and attractive alternative financing sources were not available, it could have a materially adverse effect on our business, financial condition and results of operations.
In addition, a rise in the general level of interest rates typically leads to higher interest rates applicable to our secured loans. Accordingly, an increase in interest rates may result in an increase of our income and, as a result, an increase in the incentive fee payable to our Adviser.
Provisions in the Credit Facility and the 2022 Notes or any future indebtedness may limit our discretion in operating our business.
The Credit Facility and the 2022 Notes are, and any future indebtedness may be, backed by all or a portion of our assets on which the lenders may have a security interest. We may pledge up to 100% of our assets or the assets of our Financing Subsidiary and may grant a security interest in all of our assets under the terms of any debt instrument we enter into with lenders. Any security interests that we grant will be set forth in a security agreement and evidenced by the filing of financing statements by the agent for the lenders. Any restrictive provision or negative covenant in the Credit Facility, including diversification and eligibility requirements, or any of our future indebtedness limits or may limit our operating discretion, which could have a material adverse effect on our financial condition, results of operations and cash flows. A failure to comply with the restrictive provisions or negative covenants in the Credit Facility or any of our future indebtedness would or may result in an event of default and/or restrict our ability to control the disposition of our assets and our utilization of any indebtedness. See “Management’s Discussion and Analysis of Financial Condition and Results of Operations—Contractual Obligations.”
Adverse developments in the credit markets may impair our ability to enter into any other future borrowing facility.
During the economic downturn in the United States that began in mid-2007, many commercial banks and other financial institutions stopped lending or significantly curtailed their lending activity. In addition, in an effort to stem losses and reduce their exposure to segments of the economy deemed to be high risk, some financial institutions limited refinancing and loan modification transactions and reviewed the terms of existing facilities to identify bases for accelerating the maturity of existing lending facilities. If these conditions recur, it may be difficult for us to enter into a new borrowing facility, obtain other financing to finance the growth of our investments or refinance any outstanding indebtedness on acceptable economic terms or at all.
If we do not invest a sufficient portion of our assets in qualifying assets, we could fail to qualify as a BDC or be precluded from investing according to our current business strategy.
As a BDC, we may not acquire any assets other than “qualifying assets” unless, at the time of and after giving effect to such acquisition, at least 70% of our total assets are qualifying assets. See “Business—Regulation.”
We believe that most of the investments that we may acquire in the future will constitute qualifying assets. However, we may be precluded from investing in what we believe to be attractive investments if such investments are not qualifying assets for purposes of the 1940 Act. If we do not invest a sufficient portion of our assets in qualifying assets, we could violate the 1940 Act provisions applicable to BDCs. As a result of such violation, specific rules under the 1940 Act could require us to dispose of investments at inappropriate times in order to come into compliance with the 1940 Act. If we need to dispose of such investments quickly, it could be difficult to dispose of such investments on favorable terms or at all. We may not be able to find a buyer for such investments and, even if we do find a buyer, we may have to sell the investments at a substantial loss. Any such outcomes would have a material adverse effect on our financial condition, results of operations and cash flows.
If we do not maintain our tax treatment as a BDC, we would be subject to regulation as a registered closed-end investment company under the 1940 Act. As a registered closed-end investment company, we would be subject to substantially more regulatory restrictions under the 1940 Act, which would significantly decrease our operating flexibility.
38
Our investment portfolio is recorded at fair value, with our Board having final responsibility for overseeing, reviewing and approving, in good faith, its estimate of fair value and, as a result, there is uncertainty as to the value of our portfolio investments, which may impact our net asset value.
Most of our investments take the form of secured loans, warrant and direct equity investments that are not publicly traded. The fair value of loans and other investments that are not publicly traded may not be readily determinable, and we value these investments at fair value as determined in good faith by our Board. Most, if not all, of our investments (other than cash and cash equivalents) are classified as Level 3 under ASC Topic 820. This means that our valuations are based on unobservable inputs and our own assumptions about how market participants would price the asset or liability in question. Inputs into the determination of the fair value of our investments require significant management judgment or estimation. We retain the services of one or more independent third-party valuation firms to review the valuation of these loans and other investments. The valuation for each portfolio investment, including our Level 3 investments, is reviewed at least annually by an independent third-party valuation firm. However, the Board does not intend to have de minimis investments of less than 1.0% of our gross assets (up to an aggregate of 10.0% of our gross assets) reviewed by an independent third-party valuation firm, given the expenses involved in connection therewith. The Board quarterly discusses valuations and determines, in good faith, the fair value of each investment in our portfolio based on the input of our Adviser, the independent third-party valuation firm and the Valuation Committee. The types of factors that our Board takes into account in determining the fair value of our investments generally include, as appropriate, such factors as yield, maturity and measures of credit quality, the enterprise value of the company, the nature and realizable value of any collateral, the company’s ability to make payments and its earnings and discounted cash flow, our assessment of the support of their venture capital investors, the markets in which the company does business, comparisons to similar publicly traded companies and other relevant factors. Because such valuations, and particularly valuations of private companies, are inherently uncertain, may fluctuate over short periods of time and may be based on estimates, our determinations of fair value may differ materially from the values that would have been used if a ready market for these loans and other investments existed. Our net asset value could be materially and adversely affected if our determinations regarding the fair value of our loans and other investments were materially higher than the values that we ultimately realize upon the disposal of such loans and other investments.
We may experience fluctuations in our quarterly operating results.
We could experience fluctuations in our quarterly operating results due to a number of factors, including our originations and underwriting processes, the interest rate payable on the secured loans we acquire, any prepayment made on our secured loans, the timing and amount of any warrant or equity investment returns, the timing of any drawdowns requested by our borrowers, the level of our expenses, variations in and the timing of the recognition of realized and unrealized gains or losses, the degree to which we encounter competition in our markets and general economic conditions. In light of these factors, results for any period should not be relied upon as being indicative of performance in future periods.
We are an emerging growth company under the JOBS Act, and we cannot be certain if the reduced disclosure requirements applicable to emerging growth companies will make our common stock less attractive to investors.
We are and we will remain an emerging growth company as defined in the JOBS Act for up to five years following the completion of our initial public offering or until the earliest of (i) the last day of the first fiscal year in which our annual gross revenues exceed $1.07 billion, (ii) the last day of our fiscal year following the fifth anniversary of the date of the first sale of our common equity securities pursuant to an effective registration statement under the Securities Act. (iii) the date on which we have, during the previous three year period, issued more than $1 billion in non-convertible debt, or (iv) the date that we become a “large accelerated filer” as defined in Rule 12b-2 under the Exchange Act, which would occur if the market value of our common stock that is held by non-affiliates exceeds $700 million as of the last business day of our most recently completed second fiscal quarter and we have been publicly reporting pursuant to Section 13(a) or 15(d) of the Exchange Act for at least 12 months. For so long as we remain an emerging growth company we have taken and will continue to be able to take advantage of certain specified reduced disclosure and other requirements that are otherwise generally applicable to public companies that are not “emerging growth companies” including, but not limited to, not being required to comply with the auditor attestation requirements of Section 404 of the Sarbanes-Oxley Act reduced disclosure obligations regarding executive compensation in our periodic reports and proxy statements and exemptions from the requirements of holding a nonbinding advisory vote on executive compensation and stockholder approval of any golden parachute payments not previously approved. In addition, we have irrevocably opted-out of the extended transition period provided in Section 7(a)(2)(B) of the Securities Act for complying with new or revised accounting standards. As a result, we comply with new or revised accounting standards on the same time frames as other public companies that are not “emerging growth companies.” We cannot predict if investors will find our common stock less attractive because we will rely on some or all of these exemptions. If some investors find our common stock less attractive as a result, there may be a less active trading market for our common stock and our stock price may be more volatile.
39
Because of the exemptions from various reporting requirements provided to us as an emerging growth company under the JOBS Act, we may be less attractive to investors and it may be difficult for us to raise additional capital as and when we need it. Investors may be unable to compare our business with other companies in our industry if they believe that our financial accounting is not as transparent as other companies in our industry. If we are unable to raise additional capital as and when we need it, our financial condition and results of operations may be materially and adversely affected.
If we fail to maintain an effective system of internal control over financial reporting, we may not be able to accurately report our financial results or prevent fraud. As a result, stockholders could lose confidence in our financial and other public reporting, which would harm our business and the trading price of our common stock.
Effective internal controls over financial reporting are necessary for us to provide reliable financial reports and, together with adequate disclosure controls and procedures, are designed to prevent fraud. Any failure to implement required new or improved controls, or difficulties encountered in their implementation could cause us to fail to meet our reporting obligations. In addition, any testing by us conducted in connection with Section 404 of the Sarbanes-Oxley Act, or the subsequent testing by our independent registered public accounting firm (when undertaken, as noted below), may reveal deficiencies in our internal controls over financial reporting that are deemed to be material weaknesses or that may require prospective or retroactive changes to our consolidated financial statements or identify other areas for further attention or improvement. Inferior internal controls could also cause investors and lenders to lose confidence in our reported financial information, which could have a negative effect on the trading price of our common stock.
We are required to disclose changes made in our internal controls and procedures over financial reporting on a quarterly basis and our management is required to assess the effectiveness of these controls annually. However, for as long as we are an emerging growth company under the recently enacted JOBS Act, our independent registered public accounting firm is not required to attest to the effectiveness of our internal controls over financial reporting pursuant to Section 404 of the Sarbanes-Oxley Act. We could be an emerging growth company for up to five years following the completion of our initial public offering. An independent assessment of the effectiveness of our internal controls could detect problems that our management’s assessment might not. Undetected material weaknesses in our internal controls could lead to financial statement restatements and require us to incur the expense of remediation.
Changes in laws or regulations governing our operations may adversely affect our business or cause us to alter our business strategy.
We are subject to regulation by laws at the U.S. federal, state and local levels. These laws and regulations, as well as their interpretation, may change from time to time, and new laws, regulations and interpretations may also come into effect. Any such new or changed laws or regulations or any new or changed interpretations of existing laws or regulations could have a material adverse effect on our financial condition, results of operations and cash flows.
Additionally, changes to the laws and regulations governing our operations related to permitted investments may cause us to alter our investment strategy in order to avail ourselves of new or different opportunities. Such changes could result in material differences to the strategies and plans set forth herein and may shift our investment focus to other types of investments in which our Adviser’s senior investment team may have little or no expertise or experience. Any such changes, if they occur, could have a material adverse effect on our financial condition, results of operations and cash flows.
We cannot predict how tax reform legislation will affect us, our investments, or our stockholders, and any such legislation could adversely affect our business.
Legislative or other actions relating to taxes could have a negative effect on us. The rules dealing with U.S. federal income taxation are constantly under review by persons involved in the legislative process and by the Internal Revenue Service and the U.S. Treasury Department. In December 2017, the U.S. House of Representatives and U.S. Senate passed tax reform legislation, which the President signed into law. Such legislation has made many changes to the Code, including significant changes to the taxation of business entities, the deductibility of interest expense, and the tax treatment of capital investment. We cannot predict with certainty how any changes in the tax laws might affect us, our stockholders, or our portfolio investments. New legislation and any U.S. Treasury regulations, administrative interpretations or court decisions interpreting such legislation could significantly and negatively affect our ability to qualify for tax treatment as a RIC or the U.S. federal income tax consequences to us and our stockholders of such qualification, or could have other adverse consequences. Stockholders are urged to consult with their tax advisor regarding tax legislative, regulatory, or administrative developments and proposals and their potential effect on an investment in our securities.
40
The effect of global climate change may impact the operations of our portfolio companies.
There may be evidence of global climate change. Climate change creates physical and financial risk and some of our portfolio companies may be adversely affected by climate change. Extreme weather conditions in general require more system backup, adding to costs, and can contribute to increased system stresses, including service interruptions. In December 2015 the United Nations, of which the U.S. is a member, adopted a climate accord (the “Paris Agreement”) with the long-term goal of limiting global warming and the short-term goal of significantly reducing greenhouse gas emissions. The U.S. ratified the Paris Agreement, which entered into force on November 4, 2016; however, on August 4, 2017, the United States submitted communication to the United Nations regarding its intent to withdraw from the Paris Agreement and the earliest date for their complete withdrawal from the Paris Agreement is November 4, 2020. As a result, some of our portfolio companies may become subject to new or strengthened regulations or legislation that could increase their operating costs and/or decrease their revenues.
Our Board may change our investment objective, operating policies and strategies without prior notice or stockholder approval, the effects of which may be adverse.
Our Board has the authority, except as otherwise provided in the 1940 Act, to modify or waive certain of our operating policies and strategies without prior notice and without stockholder approval. However, absent stockholder approval, we may not change the nature of our business so as to cease to be, or withdraw our election as, a BDC. We cannot predict the effect any changes to our current operating policies and strategies would have on our business, operating results and the market price of our common stock. Nevertheless, any such changes could materially and adversely affect our business and impair our ability to make distributions to our stockholders.
Provisions of the Maryland General Corporation Law and of our charter and bylaws could deter takeover attempts and have an adverse impact on the price of our common stock.
The Maryland General Corporation Law, our charter and our bylaws contain provisions that may discourage, delay or make more difficult a change in control or the removal of our directors. We are subject to the Maryland Business Combination Act, or the “Business Combination Act,” the application of which is subject to and may not conflict with any applicable requirements of the 1940 Act. Our Board has adopted a resolution exempting from the Business Combination Act any business combination between us and any other person, subject to prior approval of such business combination by our Board, including approval by a majority of our directors who are not “interested persons” as such term is defined in the 1940 Act. If the resolution exempting business combinations is repealed or our Board does not approve a business combination, the Business Combination Act may discourage third-parties from trying to acquire control of us and increase the difficulty of consummating such an offer. Our bylaws exempt from the Maryland Control Share Acquisition Act, or the “Control Share Acquisition Act,” acquisitions of our common stock by any person. If we amend our bylaws to repeal the exemption from the Control Share Acquisition Act, the Control Share Acquisition Act also may make it more difficult for a third-party to obtain control of us and increase the difficulty of consummating such an offer. However, we will amend our bylaws to be subject to the Control Share Acquisition Act only if our Board determines that it would be in our best interests and if the SEC staff does not object to our determination that our being subject to the Control Share Acquisition Act does not conflict with the 1940 Act. The SEC staff has issued informal guidance setting forth its position that certain provisions of the Control Share Acquisition Act would, if implemented, violate Section 18(i) of the 1940 Act.
Our charter and bylaws contain other provisions that may make it difficult for a third-party to obtain control of us, including supermajority vote requirements for business transactions that are not approved by a majority of our “continuing directors,” provisions of our charter classifying our Board in three classes serving staggered three-year terms, and provisions of our charter authorizing our Board to classify or reclassify shares of our stock in one or more classes or series and to cause the issuance of additional shares of our stock, and to amend our charter, without stockholder approval, to increase or decrease the number of shares of stock of any class or series that we have authority to issue. These provisions, as well as other provisions of our charter and bylaws, may delay, defer or prevent a transaction or a change in control that might otherwise be in the best interests of our stockholders.
41
Our Adviser or our Administrator can resign upon 60 days’ notice and we may not be able to find a suitable replacement within that time, or at all, resulting in a disruption in our operations that could materially and adversely affect our financial condition, results of operations and cash flows.
Our Adviser has the right under the Investment Advisory Agreement to resign at any time upon 60 days’ written notice, whether we have found a replacement or not. Similarly, our Administrator has the right under the Administration Agreement to resign at any time upon 60 days’ written notice, whether we have found a replacement or not. In addition, our Administrator has entered into a sub-administration agreement with Conifer Asset Solutions LLC to provide certain sub-administrative services to us on behalf of our Administrator. If our Adviser, our Administrator or our sub-administrator were to resign, we may not be able to find a new investment adviser, administrator or sub-administrator or hire internal management with similar expertise and ability to provide the same or equivalent services on acceptable terms within 60 days, or at all. If we are unable to do so quickly, our operations are likely to experience a disruption, our financial condition, results of operations and cash flows as well as our ability to pay distributions to our stockholders are likely to be materially and adversely affected and the market price of our shares may decline. In addition, the coordination of our internal management and investment or administrative activities, as applicable, is likely to suffer if we are unable to identify and reach an agreement with a single institution or group of executives having the expertise possessed by our Adviser, our Administrator and our sub-administrator. Even if we are able to retain comparable management, whether internal or external, the integration of such management and their lack of familiarity with our investment objective may result in additional costs and time delays that may materially and adversely affect our financial condition, results of operations and cash flows.
The failure in cyber security systems, as well as the occurrence of events unanticipated in our Adviser’s disaster recovery systems and management continuity planning or a support failure from external providers during a disaster could impair our ability to conduct business effectively.
The occurrence of a disaster, such as a cyber-attack against us or against a third-party that has access to our data or networks, a natural catastrophe, an industrial accident, failure of our disaster recovery systems, or consequential employee error, could have an adverse effect on our ability to communicate or conduct business, negatively impacting our operations and financial condition. This adverse effect can become particularly acute if those events affect our electronic data processing, transmission, storage, and retrieval systems, or impact the availability, integrity, or confidentiality of our data.
We depend heavily upon computer systems to perform necessary business functions. Despite our implementation of a variety of security measures, our computer systems, networks, and data, like those of other companies, could be subject to cyber-attacks and unauthorized access, use, alteration, or destruction, such as from physical and electronic break-ins or unauthorized tampering If one or more of these events occurs, it could potentially jeopardize the confidential, proprietary, and other information processed, stored in, and transmitted through our computer systems and networks. Such an attack could cause interruptions or malfunctions in our operations, which could result in financial losses, litigation, regulatory penalties, client dissatisfaction or loss, reputational damage, and increased costs associated with mitigation of damages and remediation.
Third parties with which we do business may also be sources of cybersecurity or other technological risk. We outsource certain functions and these relationships allow for the storage and processing of our information, as well as client, counterparty, employee, and borrower information. While we engage in actions to reduce our exposure resulting from outsourcing, ongoing threats may result in unauthorized access, loss, exposure, destruction, or other cybersecurity incident that affects our data, resulting in increased costs and other consequences as described above.
We incur significant costs as a result of being a publicly traded company.
As a publicly traded company, we incur legal, accounting and other expenses, including costs associated with the periodic reporting requirements applicable to a company whose securities are registered under the Exchange Act, as well as additional corporate governance requirements, including requirements under the Sarbanes-Oxley Act and other rules implemented by the SEC.
If we are unable to manage our growth, our results of operations could suffer.
Rapid growth of our portfolio would require expanded portfolio monitoring, increased personnel, expanded operational and financial systems and new and expanded control procedures. Our Adviser may be unable to attract sufficient qualified personnel or successfully manage expanded operations. As our portfolio expands, we may periodically experience constraints that would adversely affect our Adviser’s ability to identify and capitalize on investment opportunities, conduct a thorough and efficient diligence and credit analysis, close financing transactions in a timely fashion and/or effectively monitor our portfolio companies. Failure to manage growth effectively could materially and adversely affect our financial condition, results of operations and cash flows.
42
Risks Relating to our Conflicts of Interest
There are potential conflicts of interest that could negatively affect our investment returns.
Our investment strategy includes investments in secured loans to companies, together with, in many cases, attached equity “kickers” in the form of warrant investments, and direct equity investments. TPC also manages, and in the future may manage, other investment funds, accounts or vehicles that invest or may invest in these companies. Although we are the primary vehicle through which TPC focuses its venture growth stage business, subject to its allocation policy and applicable law, other vehicles sponsored or managed by our Adviser’s senior investment team may also invest in venture growth stage companies or may have prior investments outstanding to our borrowers. As a result, members of our Adviser’s senior investment team and the Investment Committee, in their roles at TPC, may face conflicts in the allocation of investment opportunities among us and other investment vehicles managed by TPC with similar or overlapping investment objectives in a manner that is fair and equitable over time and consistent with TPC’s allocation policy. Generally, when a particular investment would be appropriate for us as well as one or more other investment funds, accounts or vehicles managed by our Adviser’s senior investment team, such investment will be apportioned by our Adviser’s senior investment team in accordance with (1) our Adviser’s internal conflict of interest and allocation policies, (2) the requirements of the Advisers Act and (3) certain restrictions under the 1940 Act regarding co-investments with affiliates. Such apportionment may not be strictly pro rata, depending on the good faith determination of all relevant factors, including differing investment objectives, diversification considerations and the terms of our or the respective governing documents of such investment funds, accounts or investment vehicles. These procedures could, in certain circumstances, limit whether or not a co-investment opportunity is available to us, the timing of acquisitions and dispositions of investments, the price paid or received by us for investments or the size of the investment purchased or sold by us.
Our Adviser may be subject to conflicts of interest with respect to taking actions regarding many investments in which TPC or its affiliates also have an interest.
Although our Adviser has adopted a compliance program that includes conflicts of interest policies and procedures, that are designed to mitigate the potential actual or perceived conflicts between us, on the one hand, and TPC and its affiliates, on the other hand, it may not eliminate all potential conflicts. TPC and its affiliates may have previously made investments in secured loans, together with, in many cases, attached equity “kickers” in the form of warrant investments, and direct equity investments in some of the same venture growth stage companies in which we expect to invest. In certain of these circumstances, we may have rights and privileges that give us priority over others associated with the issuer, such as TPC or its affiliates. These rights, if exercised, could have a detrimental impact on the value of the investment made by TPC or its affiliates in the issuer, and as a result our Adviser may not exercise the Company’s rights if the Adviser believes TPC or its affiliates would be disadvantaged by the Company taking such action, even if it is in the best interests of our stockholders. In addition, our Adviser may be subject to a conflict in seeking to make an investment in an issuer in which TPC or its affiliates have already invested, and we may still choose to make such investment, where permissible, subject to the approval of a majority of our directors who have no financial interest in the investment and a majority of our independent directors. In such a scenario, our Adviser may be influenced to make an investment or take actions in order to protect the interests of TPC or its affiliates in the issuer.
The base management and incentive fee structure we have with our Adviser may create incentives that are not fully aligned with the interests of our stockholders.
In the course of our investing activities, we pay a base management fee and an incentive fee to our Adviser. The Investment Advisory Agreement that we entered into with our Adviser provides that these fees are based on the value of our adjusted gross assets. As a result, investors in our common stock will invest on a “gross” basis and receive distributions on a “net” basis after expenses, resulting in a lower rate of return than one might achieve through direct investments. Because these fees are based on the value of our total assets, our Adviser benefits when we incur debt or use leverage. This fee structure may encourage our Adviser to cause us to borrow money to finance additional investments. Our Board is charged with protecting our interests by monitoring how our Adviser addresses these and other conflicts of interest associated with its management services and compensation. While our Board does not review or approve each investment decision, borrowing or incurrence of leverage, our independent directors periodically review our Adviser’s services and fees as well as its portfolio management decisions and portfolio performance. In connection with these reviews, our independent directors consider whether our fees and expenses (including those related to leverage) remain appropriate. As a result of this arrangement, our Adviser may from time to time have interests that differ from those of our stockholders, giving rise to a conflict.
43
Our incentive fee may induce our Adviser to pursue speculative investments and to use leverage when it may be unwise to do so.
The incentive fee payable by us to our Adviser may create an incentive for our Adviser to make investments on our behalf that are risky or more speculative than would be the case in the absence of such compensation arrangement. The way in which the incentive fee payable to our Adviser is determined, which is calculated separately in two components as a percentage of the interest and other investment income in excess of a quarterly minimum hurdle rate and as a percentage of the realized gain on invested capital, may encourage our Adviser to use leverage or take additional risk to increase the return on our investments. Under certain circumstances, the use of leverage may increase the likelihood of default, which would disfavor the holders of our common stock or of securities convertible into our common stock or warrant investments representing rights to purchase our common stock or securities convertible into our common stock. In addition, our Adviser receives the incentive fee based, in part, upon net capital gains realized on our investments. Unlike the portion of the incentive fee based on investment income, there is no minimum level of gain applicable to the portion of the incentive fee based on net capital gains. As a result, our Adviser may have an incentive to invest more in investments that are likely to result in capital gains as compared to income producing securities or to advance or delay realizing a gain in order to enhance its incentive fee. This practice could result in our investing in more speculative securities than would otherwise be the case, which could result in higher investment losses, particularly during economic downturns. A rise in the general level of interest rates can be expected to lead to higher interest rates applicable to certain of our debt investments and may accordingly result in a substantial increase of the amount of incentive fees payable to our Adviser with respect to our pre-incentive fee net investment income.
We may pay our Adviser an incentive fee on certain investments that include a deferred interest feature.
We underwrite our loans to generally include an end-of-term payment, a PIK interest payment and/or OID. Our end-of-term payments are contractual and fixed interest payments due at the maturity date of the loan, including upon prepayment, and are a fixed percentage of the original principal balance of the loan. The portion of our end-of-term payments which equal the difference between our yield-to-maturity and the stated interest rate on the loan are recognized as non-cash income or OID until they are paid. In addition, in connection with our equity related investments, we may be required to accrue OID which decreases the balance on our secured loans by an amount equal to the value of the warrant investment we receive in connection with the applicable secured loan over its lifetime. Under these types of investments, we accrue interest during the life of the loan on the end-of-term payment, PIK interest payment and/or OID but do not receive the cash income from the investment until the end of the term. However, our pre-incentive fee net investment income, which is used to calculate the income portion of our incentive fee, includes accrued interest. Thus, a portion of this incentive fee is based on income that we have not yet received in cash, such as an end-of-term payment, a PIK interest payment and/or OID.
The valuation process for certain of our investments may create a conflict of interest.
For many of our investments, no market-based price quotation is available. As a result, our Board determines the fair value of these secured loans, warrant and equity investments in good faith as described above in “—Relating to our Business and Structure—Our investment portfolio is recorded at fair value, with our Board having final responsibility for overseeing, reviewing and approving, in good faith, its estimate of fair value and, as a result, there is uncertainty as to the value of our portfolio investments.” In connection with that determination, our Adviser’s senior investment team provides our Board with valuation recommendations based upon the most recent and available information, including industry outlook, capitalization, financial statements and projected financial results of each portfolio company. Other than de minimis investments of less than 1% of our gross assets (up to an aggregate of 10% of our gross assets), the valuation for each investment is reviewed by an independent valuation firm annually and the ultimate determination of fair value is made by our Board, including our interested directors, and not by such independent valuation firm. The Board, however, may request at its discretion to have such de minimis investments valued by an independent valuation firm. In addition, Messrs. Labe and Srivastava, each an interested member of our Board, have a material pecuniary interest in our Adviser. The participation of our Adviser’s senior investment team in our valuation process, and the pecuniary interest in our Adviser by certain members of our Board, could result in a conflict of interest as our Adviser’s base management fee is based, in part, on the value of our average adjusted gross assets, and our Adviser’s incentive fee is based, in part, on realized gains and realized and unrealized losses.
44
There are conflicts related to our arrangements with TPC and our Administrator.
In February 2014, we entered into the License Agreement with TPC under which TPC granted us a non-exclusive, royalty-free license to use the name “TriplePoint” and the TriplePoint logo. In addition, in February 2014, we entered into the Administration Agreement with our Administrator pursuant to which we are required to pay our Administrator an amount equal to the allocable portion of our Administrator’s overhead resulting from its obligations under the Administration Agreement, including rent and the allocable portion of the cost of our Chief Compliance Officer and Chief Financial Officer and their respective staffs. This creates conflicts of interest that our Board will monitor. For example, under the terms of the License Agreement, we are unable to preclude TPC from licensing or transferring the ownership of the “TriplePoint” name to third-parties, some of whom may compete against us. Consequently, we are unable to prevent any damage to goodwill that may occur as a result of the activities of TPC or others. Furthermore, in the event the License Agreement is terminated, we will be required to change our name and cease using “TriplePoint” as part of our name. Any of these events could disrupt our recognition in the market place, damage any goodwill we may have generated and otherwise harm our business.
The Investment Advisory Agreement was not negotiated at arm’s length and may not be as favorable to us as if it had been negotiated with an unaffiliated third-party.
Pursuant to the terms of the Investment Advisory Agreement, our Adviser is responsible for sourcing, reviewing and structuring investment opportunities for us, underwriting and performing diligence of our investments and monitoring our investment portfolio on an ongoing basis. The Investment Advisory Agreement was negotiated between related parties. Consequently, its terms, including fees payable to our Adviser, may not be as favorable to us as if it had been negotiated with an unaffiliated third-party. In addition, we may choose not to enforce, or to enforce less vigorously, our rights and remedies under the Investment Advisory Agreement because of our desire to maintain our ongoing relationship with our Adviser.
Our Adviser’s liability is limited under the Investment Advisory Agreement and we have agreed to indemnify our Adviser against certain liabilities, which may lead our Adviser to act in a riskier manner on our behalf than it would when acting for its own account.
Under the Investment Advisory Agreement, our Adviser has not assumed any responsibility to us other than to render the services called for under that agreement. It is not responsible for any action of our Board in following or declining to follow our Adviser’s advice or recommendations. Under the Investment Advisory Agreement, our Adviser and its professionals and any person controlling or controlled by our Adviser are not liable to us, any subsidiary of ours, our directors, our stockholders or any subsidiary’s stockholders or partners for acts or omissions performed in accordance with and pursuant to the Investment Advisory Agreement, except those resulting from acts constituting gross negligence, willful misfeasance, bad faith or reckless disregard of the duties that our Adviser owes to us under the Investment Advisory Agreement. In addition, as part of the Investment Advisory Agreement, we have agreed to indemnify our Adviser and its professionals from and against any claims or liabilities, including reasonable legal fees and other expenses reasonably incurred, arising out of or in connection with our business and operations or any action taken or omitted on our behalf pursuant to authority granted by the Investment Advisory Agreement, except where attributable to gross negligence, willful misfeasance, bad faith or reckless disregard of such person’s duties under the Investment Advisory Agreement.
Risks Relating to our Investments
Our investments are concentrated in technology, life sciences and other high growth industries, including clean technology, some of which are subject to extensive government regulation, which exposes us to the risk of significant loss if any of these industry sectors experiences a downturn.
A consequence of our investment strategy is that our investment returns will be materially and adversely affected if the companies or the industries we target perform poorly. Beyond the asset diversification requirements to which we will be subject as a RIC and any concentration limitations we have agreed or may agree to as part of the Credit Facility or any future indebtedness, we do not have fixed guidelines for diversification or limitations on the size of our investments in any one company and our investments could be concentrated in relatively few industries.
45
Our investments may be subject to extensive regulation by U.S. and foreign federal, state and/or local agencies. Changes in existing laws, rules or regulations, or judicial or administrative interpretations thereof, or new laws, rules or regulations could have an adverse impact on the business and industries of our portfolio companies. In addition, changes in government priorities or limitations on government resources could also adversely impact our portfolio companies. We are unable to predict whether any such changes in laws, rules or regulations will occur and, if they do occur, the impact of these changes on our portfolio companies and our investment returns. Furthermore, if any of our portfolio companies fail to comply with applicable regulations, they could be subject to significant penalties and claims that could materially and adversely affect their operations. Our portfolio companies may be subject to the expense, delay and uncertainty of the regulatory approval process for their products and, even if approved, these products may not be accepted in the marketplace.
Our portfolio is composed of investments exclusively in the technology, life sciences and other high growth industries, including clean technology. As a result, a downturn in any of these industries and particularly those in which we are heavily concentrated could materially and adversely affect our financial condition, results of operations and cash flows.
Our portfolio may lack diversification among portfolio companies which may subject us to a risk of significant loss if one or more of these companies defaults on its obligations under any of its debt instruments.
Our portfolio consists of a limited number of portfolio companies. Beyond the asset diversification requirements associated with our qualification as a RIC under the Code, we do not have fixed guidelines for diversification, and our investments may be concentrated in relatively few companies. As our portfolio is currently less diversified than the portfolios of others, we are more susceptible to failure if a single loan fails. Similarly, the aggregate returns we realize may be significantly adversely affected if a small number of investments perform poorly or if we need to write down the value of any one investment.
Our financial condition, results of operations and cash flows would be negatively affected if a significant portfolio investment fails to perform as expected.
Our total investment in an individual company may be significant. As a result, if a significant investment fails to perform as expected, it may be subject to multiple credit rating downgrades on our internal rating scale within a short period of time. As a result of such deterioration in the performance of a significant investment, our financial condition, results of operations and cash flows could be more negatively affected and the magnitude of the loss could be more significant than if we had made smaller investments in more companies.
Our investment strategy includes a primary focus on venture growth stage companies, which are subject to many risks, including dependence on the need to raise additional capital, volatility, intense competition, shortened product life cycles, changes in regulatory and governmental programs, periodic downturns, below investment grade ratings, which could cause you to lose all or part of your investment in us.
We invest primarily in venture growth stage companies, many of which may have narrow product lines and small market shares, which tend to render them more vulnerable to competitors’ actions and market conditions, as well as to general economic downturns, compared to more mature companies. The revenues, income (or losses), and projected financial performance and valuations of venture growth stage companies can and often do fluctuate suddenly and dramatically. For these reasons, investments in our portfolio companies, if rated by one or more ratings agency, would typically be rated below “investment grade,” which refers to securities rated by ratings agencies below the four highest rating categories. Our target venture growth stage companies are geographically concentrated and are therefore highly susceptible to materially negative local, political, natural and economic events. In addition, high growth industries are generally characterized by abrupt business cycles and intense competition. Overcapacity in high growth industries, together with cyclical economic downturns, may result in substantial decreases in the value of many venture growth stage companies and/or their ability to meet their current and projected financial performance to service our debt. Furthermore, venture growth stage companies also typically rely on venture capital and private equity investors, or initial public offerings, or sales for additional capital.
Venture capital firms in turn rely on their limited partners to pay in capital over time in order to fund their ongoing and future investment activities. To the extent that venture capital firms’ limited partners are unable or choose not to fulfill their ongoing funding obligations, the venture capital firms may be unable to continue operationally and/or financially supporting the ongoing operations of our portfolio companies, which could materially and adversely impact our financing arrangement with the portfolio company.
These companies, their industries, their products and customer demand and the outlook and competitive landscape for their industries are all subject to change, which could adversely impact their ability to execute their business plans and generate cash flow or raise additional capital that would serve as the basis for repayment of our loans. Therefore, our venture growth stage companies may face considerably more risk of loss than do companies at other stages of development.
46
Some of our portfolio companies may need additional capital, which may not be readily available.
Venture growth stage companies may require additional equity financing if their cash flow from operating activities is insufficient to satisfy their continuing growth, working capital and other requirements. Each round of venture financing is typically intended to provide a venture capital-backed company with only enough capital to reach the next stage of development. We cannot predict the circumstances or market conditions under which our venture growth stage companies will seek additional capital. It is possible that one or more of our venture growth stage companies will not be able to raise additional financing or may be able to do so only at a price or on terms unfavorable to us, either of which would negatively impact our investment returns, the fair value of our portfolio and our ability to restructure our investments. Some of these companies may be unable to obtain sufficient financing from private investors, public or private capital markets or traditional lenders. This may have a significant impact if the companies are unable to obtain certain federal, state or foreign agency approval for their products or the marketing thereof, if regulatory review processes extend longer than anticipated and the companies need continued funding for their operations during these times. Accordingly, financing these types of companies may entail a higher risk of loss than would financing companies that are able to utilize traditional credit sources.
Our existing and/or future portfolio companies may not draw on any of our unfunded obligations or may draw our outstanding unfunded obligations at a time when our capital is not readily available.
A commitment to extend credit is a formal agreement to lend funds to our portfolio companies as long as there is no violation of any condition established under the agreement. The actual borrowing needs of our portfolio companies under these commitments have historically been lower than the contractual amount of the commitments. A portion of these commitments expire without being drawn upon, and as such, the total amount of unfunded commitments does not reflect our expected future cash funding requirements.
As of December 31, 2017, our unfunded obligations to ten portfolio companies totaled approximately $100.1 million. Our credit agreements contain customary lending provisions that allow us relief from funding obligations for previously made commitments in instances where the underlying company experiences materially adverse events that affect the financial condition or business outlook for the company. We cannot assure you that any of these unfunded or any future obligations will be drawn by the venture growth stage companies. Of these unfunded commitments, $18.0 million are dependent upon the portfolio companies reaching certain milestones before the debt commitment becomes available to the portfolio company. Of the approximately $100.1 million of unfunded obligations, approximately $87.1 million expire during 2018 and $13.0 million expire during 2019, if not drawn prior to expiration. In addition, of the approximately $100.1 million of unfunded obligations, $98.4 million represent obligations for growth capital loans and approximately $1.7 million for equipment financing. We had $120.0 million of commitments to six portfolio companies expire during the year ended December 31, 2017. We entered into commitments with certain portfolio companies that permit an increase in the commitment amount in the future in the event that conditions to such increases are met. If such conditions to increase are met, these amounts may become unfunded commitments if not drawn prior to expiration. As of December 31, 2017, this backlog of potential future commitments totaled $35.4 million.
The actual borrowing needs of our portfolio companies may exceed our expected funding requirements, especially during a challenging economic environment when our portfolio companies may be more dependent on our credit commitments due to the lack of available credit elsewhere, an increasing cost of credit or the limited availability of financing from venture capital firms. In addition, investors in some of our portfolio companies may fail to meet their underlying investment commitments due to liquidity or other financing issues, which may increase our portfolio companies’ borrowing needs. Any failure to meet our unfunded credit commitments in accordance with the actual borrowing needs of our portfolio companies may have a material adverse effect on our business, financial condition and results of operations. We intend to use cash flow from normal and early principal repayments, indebtedness, any proceeds from any subsequent equity or debt offerings, and available cash to fund our outstanding unfunded obligations. However, there can be no assurance that we will have sufficient capital available to fund these commitments as they come due. We may rely on assumptions, estimates, assurances and other information related to potential non-utilization of unfunded commitments by our portfolio companies as well as related to potential exit events, principal prepayments, and fee payments. To the extent these assumptions, estimates, assurances and other information are incorrect or events are delayed, we may not be able to fund commitments as they come due. To the extent we are not able to fund commitments as they come due, we may be forced to sell assets, modify the terms of our commitments or default on our commitments, and as a result, our business could be materially and adversely affected.
Unlike traditional lenders, we offer a flexible payment and covenant structure to our portfolio companies and may choose not to take advantage of certain opportunities due to our long-term investment philosophy to develop and maintain deep and longstanding relationships with TPC’s select group of leading venture capital investors, borrowers and entrepreneurs and to preserve our reputation.
47
As part of the Four Rs, our core investment philosophy, we seek to develop and maintain deep and longstanding relationships with TPC’s select group of leading venture capital investors, borrowers and entrepreneurs and to preserve our reputation. Accordingly, our debt-financing products generally offer borrowers a flexible payment and covenant structure that may not provide us with the same level of protection as more restrictive conditions that traditional lenders typically impose on borrowers. Furthermore, there may be situations with borrowers on our Credit Watch List where we believe that a member of TPC’s select group of venture capital investors intends to, expresses their intent to, or provides subject to milestones or contingencies, continued support, assistance and/or financial commitment to the borrower and our Adviser, based on such representation, may determine to modify or waive a provision or term of our existing loan which we would otherwise be entitled to enforce. The terms of any such modification or waiver may not be as favorable to us as we could have required, or had the right to require, and we may choose to enforce less vigorously our rights and remedies under our loans than traditional lenders due to our investment philosophy to preserve our reputation and maintain a strong relationship with the applicable venture capital investor or borrower based on their representations made to us.
Worldwide economic conditions, economic recessions or downturns, as well as political and economic conditions, could impair our venture growth stage companies and harm our operating results.
The business and operating results of our venture growth stage companies may be impacted by worldwide economic conditions. Although the U.S. economy has in recent quarters shown signs of recovery from the global recession, the strength and duration of any economic recovery will be impacted by worldwide economic growth. Any conflict or uncertainty, including due to regulatory changes, natural disasters, public health concerns, political unrest or safety concerns, could harm their financial condition and results of operations and cash flows. In addition, if the government of any country in which products are developed, manufactured or sold sets technical or regulatory standards for products developed or manufactured in or imported into their country that are not widely shared, it may lead some of their customers to suspend imports of their products into that country, require manufacturers or developers in that country to manufacture or develop products with different technical or regulatory standards and disrupt cross-border manufacturing, marketing or business relationships which, in each case, could harm the business of our venture growth stage companies.
Many of the venture growth stage companies in which we make investments are susceptible to economic slowdowns or recessions and may be unable to repay our secured loans during such periods. Adverse economic conditions may decrease the value of collateral securing some of our secured loans. Economic slowdowns or recessions could lead to financial losses in our portfolio and a decrease in revenues, net income and assets. Unfavorable economic conditions also could increase our funding costs, limit our access to the capital markets or result in a decision by lenders not to extend credit to us. These events could prevent us from increasing our investments and materially and adversely impact our financial condition, result of operations and cash flows.
Changes to United States tariff and import/export regulations may have a negative effect on our portfolio companies and, in turn, harm us.
There has been on-going discussion and commentary regarding potential significant changes to United States trade policies, treaties and tariffs. The current administration, along with Congress, has created significant uncertainty about the future relationship between the United States and other countries with respect to the trade policies, treaties and tariffs. These developments, or the perception that any of them could occur, may have a material adverse effect on global economic conditions and the stability of global financial markets, and may significantly reduce global trade and, in particular, trade between the impacted nations and the United States. Any of these factors could depress economic activity and restrict our portfolio companies’ access to suppliers or customers and have a material adverse effect on their business, financial condition and results of operations, which in turn would negatively impact us.
If our portfolio companies are unable to protect their intellectual property rights, our business and prospects could be harmed. If our portfolio companies are required to devote significant resources to protecting their intellectual property rights, then the value of our investment could be reduced.
Our future success and competitive position depend in part upon the ability of our venture growth stage companies to obtain and maintain proprietary technology used in their products and services, which will often represent a significant portion of the collateral securing our loans. Venture growth stage companies will rely, in part, on patent, trade secret and trademark law to protect that technology, but competitors may misappropriate their intellectual property, and disputes as to ownership of intellectual property may arise. Venture growth stage companies may have also failed to properly obtain intellectual property ownership that, under intellectual property laws, by default resides with the personnel who created the intellectual property. Consequently, venture growth stage companies may, from time to time, be required to institute litigation in order to enforce their patents, copyrights or other intellectual property rights, to protect their trade secrets, to determine the validity and scope of the proprietary rights of others or to defend against claims of infringement. Such litigation could result in substantial costs and diversion of resources. Similarly, if a venture growth stage company is found to infringe upon or misappropriate a third-party’s patent or other proprietary rights, that company could be required to pay damages to such third-party, alter its own products or processes, obtain a license from the third-party and/or cease activities utilizing
48
such proprietary rights, including making or selling products utilizing such proprietary rights. Any of the foregoing events could negatively affect both the company’s ability to service our debt obligation and the value of any equity securities that we own, as well as any collateral securing our obligation.
Our relationship with certain portfolio companies may expose us to our portfolio companies’ trade secrets and confidential information which may require us to be parties to non-disclosure agreements and restrict us from engaging in certain transactions.
Our relationship with some of our portfolio companies may expose us to our portfolio companies’ trade secrets and confidential information (including transactional data and personal data about their employees and clients) that may require us to be parties to non-disclosure agreements and restrict us from engaging in certain transactions. Unauthorized access or disclosure of such information may occur, resulting in theft, loss or other misappropriation. Any theft, loss, improper use, such as insider trading or other misappropriation of confidential information could have a material adverse impact on our competitive positions, our relationship with our portfolio companies and our reputation and could subject us to regulatory inquiries, enforcement and fines, civil litigation and possible financial liability or costs.
Our financial condition, results of operations and cash flows could be negatively affected if we are unable to recover our principal investment as a result of a negative pledge or lack of a security interest on the intellectual property of our venture growth stage companies.
In some cases, we collateralize our loans with a secured collateral position in a venture growth stage company’s assets, which may include a negative pledge or, to a lesser extent, no security on their intellectual property. In the case of a negative pledge, the venture growth stage company cannot encumber or pledge their intellectual property without our permission. In the event of a default on a loan, the intellectual property of the venture growth stage company will most likely be liquidated to provide proceeds to pay the creditors of the company. There can be no assurance that our security interest, if any, in the proceeds of the intellectual property will be enforceable in a court of law or bankruptcy court or that there will not be others with senior or pari passu credit interests.
If the assets securing the loans that we make decrease in value, then we may lack sufficient collateral to cover losses.
We believe that our borrowers generally are able to repay our loans from their available capital, future capital-raising transactions or current and/or future cash flow from operations. However, to attempt to mitigate credit risks, we typically take a secured collateral position. There is a risk that the collateral securing our secured loans may decrease in value over time, may be difficult to sell in a timely manner, may be difficult to appraise, may be liquidated at a price lower than what we consider to be fair value and may fluctuate in value based upon the success of the business and market conditions, including as a result of the inability of a borrower to raise additional capital.
In some circumstances, other creditors have claims in priority to our senior lien. Although for certain borrowers, we may be the only form of secured debt (other than potentially specific equipment financing), other borrowers may also have other senior secured debt, such as revolving loans and/or term loans, in priority to our senior lien. At the time of underwriting our loans, we generally only consider growth capital loans for prospective borrowers with sufficient collateral that covers the value of our loan as well as the revolving and/or term loans that may be in priority to our senior lien; however, there may be instances in which we have incorrectly estimated the current or future potential value of the underlying collateral or the underlying collateral value has decreased, in which case our ability to recover our investment may be materially and adversely affected.
In addition, a substantial portion of the assets securing our investment may be in the form of intellectual property, inventory and equipment and, to a lesser extent, cash and accounts receivable. Intellectual property that is securing our loan could lose value if, among other things, the borrower’s rights to the intellectual property are challenged or if the borrower’s license to the intellectual property is revoked or expires. Inventory may not be adequate to secure our loan if our valuation of the inventory at the time that we made the loan was not accurate or if there is a reduction in the demand for the inventory.
Similarly, any equipment securing our loan may not provide us with the anticipated security if there are changes in technology or advances in new equipment that render the particular equipment obsolete or of limited value, or if the borrower fails to adequately maintain or repair the equipment. The residual value of the equipment at the time we would take possession may not be sufficient to satisfy the outstanding debt and we could experience a loss on the disposition of the equipment. Any one or more of the preceding factors could materially impair our ability to recover our investment in a foreclosure.
49
Our portfolio companies may have limited operating histories and financial resources.
Our portfolio consists of investments in companies that have relatively limited operating histories. Generally, very little public information exists about these companies, and we are required to rely on the ability of our Adviser to obtain adequate information to evaluate the potential returns from investing in these companies. If we are unable to uncover all material information about these companies, we may not make a fully informed investment decision, and we may lose money on our investments. These companies may be particularly vulnerable to U.S. and foreign economic downturns such as the recent recession and may have limited access to capital. These businesses also frequently have less diverse product lines and a smaller market presence than larger competitors and may experience substantial variations in operating results. They may face intense competition, including from companies with greater financial, technical, operational and marketing resources, and typically depend upon the expertise and experience of a single individual executive or a small management team. Our success depends, in large part, upon the abilities of the key management personnel of our portfolio companies, who are responsible for the day-to-day operations of our portfolio companies. Competition for qualified personnel is intense at any stage of a company’s development. The loss of one or more key managers can hinder or delay a company’s implementation of its business plan and harm its financial condition. Our portfolio companies may not be able to attract and retain qualified managers and personnel. Any inability to do so may negatively affect our investment returns.
In addition, our existing and future portfolio companies may compete with each other for investment or business opportunities and the success of one could negatively impact the other. Furthermore, some of our portfolio companies do business in regulated industries and could be affected by changes in government regulation. Accordingly, these factors could impair their cash flow or result in other events, such as bankruptcy, which could limit their ability to repay their obligations to us, and may materially and adversely affect the return on, or the recovery of, our investment. As a result, we may lose our entire investment in any or all of our portfolio companies.
We make debt investments in venture growth stage companies that generally do not have sufficient cash resources to repay our loan in full at the time of its origination.
We invest primarily in venture growth stage companies that generally do not have sufficient cash-on-hand to satisfy our loan in full at the time we originate the loan. Following our investment, these companies may be unable to successfully scale operations and increase revenue as we had anticipated at the time we made the investment. In certain circumstances, these companies may not be able to generate meaningful customer sales, commitments or orders due to unfavorable market conditions. As a result, the company may not generate sufficient cash flow to service our loan and/or the company’s venture capital investors may no longer provide the company with meaningful invested equity capital to provide a debt financing cushion to our loan. As a consequence, the company may (i) request us to restructure our loan resulting in the delay of principal repayment, the reduction of fees and/or future interest rates and/or the possible loss of principal or (ii) experience bankruptcy, liquidation or similar financial distress. We may be unable to accommodate any such restructuring request due to the eligibility requirements under the Credit Facility. The bankruptcy, liquidation and/or recovery process has a number of significant inherent risks for us as a creditor. Many events in a bankruptcy proceeding are the product of contested matters and adversary proceedings and are beyond the control of the creditors. A bankruptcy filing by one of our portfolio companies may adversely and permanently affect our investment in that company. If the proceeding is converted to liquidation, the liquidation value of the company may not equal the fair value that was believed to exist at the time of our investment. The duration of a bankruptcy, liquidation and/or recovery proceeding is also difficult to predict, and a creditor’s return on investment can be materially and adversely affected by delays until the plan of reorganization or liquidation ultimately becomes effective. The administrative costs in connection with a bankruptcy proceeding are frequently high and would be paid out of the debtor’s estate prior to any return to creditors. Because the standards for classification of claims under bankruptcy law are vague, our influence with respect to the obligations we own may be lost by increases in the number and amount of claims or by different treatment. In the early stages of the bankruptcy process, it is often difficult to estimate the extent of, or even to identify, any contingent claims that might be made. In addition, certain claims that have priority by law (for example, claims for taxes) may be substantial.
50
There may be circumstances when our debt investments could be subordinated to claims of other creditors or we could be subject to lender liability claims.
Even though we structure many investments as secured loans, if one of our portfolio companies were to go bankrupt, depending on the facts and circumstances, and based upon principles of equitable subordination as defined by existing case law, a bankruptcy court could subordinate all or a portion of our claim to that of other creditors and transfer any lien securing such subordinated claim to the bankruptcy estate. The principles of equitable subordination defined by case law have generally indicated that a claim may be subordinated only if its holder is guilty of misconduct or where the senior loan is re-characterized as an equity investment and the senior lender has actually provided significant managerial assistance to the bankrupt debtor. We may also be subject to lender liability claims for actions taken by us with respect to a borrower’s business or instances where we exercise control over the borrower. It is possible that we could become subject to a lender’s liability claim, including as a result of actions taken in rendering significant managerial assistance or actions to compel and collect payments from the borrower outside the ordinary course of business. Such risk of equitable subordination may be potentially heightened with respect to various portfolio investments that we may be deemed to control.
The lack of liquidity in our investments may materially and adversely affect our ability to meet our investment objectives.
The majority of our assets are invested in illiquid loans and a substantial portion of our investments in leveraged companies are subject to legal and other restrictions on resale or are otherwise less liquid than more broadly traded public securities. The illiquidity of these investments may make it difficult for us to sell such investments if the need arises. In addition, if we are required to liquidate all or a portion of our portfolio quickly, we may realize significantly less than the value at which we have previously recorded our investments.
To the extent that we invest in equity or equity-linked securities of privately-held companies, there can be no assurances that a trading market will develop for the securities that we wish to liquidate, or that the subject companies will permit their shares to be sold through such marketplaces. A lack of initial public offering opportunities for venture capital-backed companies could lead to companies staying longer in our portfolio as private entities that continue to require private funding. This situation may adversely affect the amount of available funding for venture growth stage companies. A lack of initial public offering opportunities for venture capital-backed companies can also cause some venture capital firms to change their strategies, leading some of them to reduce funding of their portfolio companies and making it more difficult for such companies to access capital and to fulfill their potential, which can result in unrealized depreciation and realized losses in such companies by other companies such as ourselves who are co-investors in such companies.
Even if a subject portfolio company completes an initial public offering, we are typically subject to lock-up provisions that prohibit us from selling our investments into the public market for specified periods of time after the initial public offering. As a result, the market price of securities that we hold may decline substantially before we are able to sell these securities following an initial public offering.
Any unrealized losses we experience on our investment portfolio may be an indication of future realized losses, which could reduce our funds available for distribution and could materially and adversely affect our ability to service our outstanding borrowings.
As a BDC, we are required to carry our investments at fair value as determined in good faith by or under the direction of our Board. Decreases in the market values or fair values of our investments are recorded as unrealized losses. Any unrealized losses in our investment portfolio could be an indication of a portfolio company’s inability to meet its repayment obligations to us with respect to the affected investments. This could result in realized losses in the future and ultimately in reductions of our funds available for distribution in future periods and could materially and adversely affect our ability to service our outstanding borrowings.
Our stockholders do not have any input in our Adviser’s investment decisions.
Our investments are selected by our Adviser, subject to the approval of its Investment Committee. Our stockholders do not have input into our Adviser’s investment decisions. As a result, our stockholders are unable to evaluate any of our potential portfolio investments. These factors increase the uncertainty, and thus the risk, of investing in shares of our common stock.
51
Because we do not hold controlling equity interests in our portfolio companies, we are not able to exercise control over our portfolio companies or prevent decisions by management that could decrease the value of our investment.
We do not hold controlling equity positions in any of our portfolio companies. As a result, we are subject to the risk that a portfolio company may make business decisions with which we disagree and that the management and/or stockholders of a portfolio company may take risks or otherwise act in ways that are materially adverse to our interests. Due to the lack of liquidity of the debt and equity investments that we hold in our portfolio, we may not be able to dispose of our investments in the event we disagree with the actions of a portfolio company and may therefore suffer a decrease in the value of our investment.
We may suffer a loss if a portfolio company defaults on a loan, including the entire or partial loss of the accrued PIK interest, the end-of-term payment and/or OID, such as warrant investments and facility fees due to us.
Our debt-financing products generally offer a flexible payment and covenant structure to our portfolio companies that may not provide the same level of protection to us as more restrictive conditions that traditional lenders typically impose on borrowers. For example, our secured loans generally include an end-of-term payment, PIK interest payment and/or OID, such as warrant investments and facility fees. If a portfolio company fails to satisfy financial or operating covenants imposed by us or other lenders, the company may default on our loan which could potentially lead to termination of its loans and foreclosure on its assets. If a portfolio company defaults under our loan, this could trigger cross-defaults under other agreements and jeopardize such portfolio company’s ability to meet its obligations under the loans or equity securities that we hold, including payment to us of the end-of-term payment, PIK interest payment and/or OID, such as warrant investments and facility fees. We may incur expenses to the extent necessary to seek recovery upon default or to negotiate new terms, which may include the waiver of certain financial covenants, with a defaulting portfolio company.
Prepayments of our loans could materially and adversely impact our results of operations and ability to make stockholder distributions and result in a decline in the market price of our shares.
We are subject to the risk that the loans we make to our portfolio companies may be repaid prior to maturity. We expect that our investments generally allow for repayment at any time subject to penalties in certain limited circumstances. When this occurs, we generally reinvest these proceeds in temporary investments, pending their future investment in accordance with our investment strategy. These temporary investments typically have substantially lower yields than the loan being prepaid and we could experience significant delays in reinvesting these amounts. Any future investment may also be at lower yields than the loan that was repaid. As a result, our financial condition, results of operations and cash flows could be materially and adversely affected if one or more of our portfolio companies elect to prepay amounts owed to us. Additionally, prepayments could negatively impact our ability to make, or the amount of, stockholder distributions with respect to our common stock, which could result in a decline in the market price of our shares.
Our portfolio companies may incur debt that ranks equally with, or senior to, our investments in such companies.
We invest a portion of our capital in loans that have a secured collateral position. Our portfolio companies may have, or may be permitted to incur, other debt that is secured by and ranks equally with, or senior to, all or a portion of the collateral secured by the loans in which we invest. By their terms, such debt instruments may provide that the holders are entitled to receive payment of interest or principal on or before the dates on which we are entitled to receive payments in respect of the loans in which we invest or are entitled to receive payment from the disposition of certain collateral or all collateral senior to us. Also, in the event of insolvency, liquidation, dissolution, reorganization or bankruptcy of a portfolio company, holders of debt instruments ranking senior to our investment in that portfolio company would typically be entitled to receive payment in full before we receive any distribution in respect of our investment. After repaying senior creditors, a portfolio company may not have any remaining assets to use for repaying its obligation to us. In the case of debt ranking equally with loans in which we invest, we would have to share any distributions on an equal and ratable basis with other creditors holding such debt in the event of an insolvency, liquidation, dissolution, reorganization or bankruptcy of the company.
The senior liens on the collateral secure the company’s obligations under any outstanding senior debt and may secure certain other future debt that may be permitted to be incurred by the company under the agreements governing the loans. The holders of obligations secured by senior liens on the collateral generally control the liquidation of, and are entitled to receive proceeds from, any realization of the collateral to repay their obligations in full before us. In addition, the value of the collateral in the event of liquidation depends on market and economic conditions, the availability of buyers and other factors. There can be no assurance that the proceeds, if any, from sales of all of the collateral would be sufficient to satisfy the loan obligations secured by the senior liens after payment in full of all obligations secured by other liens on the collateral. If such proceeds were not sufficient to repay amounts outstanding under the loan obligations secured by other liens, then we, to the extent not repaid from the proceeds of the sale of the collateral, will only have an unsecured claim against the company’s remaining assets, if any.
52
The rights we may have with respect to the collateral securing the loans we make to our portfolio companies with senior debt outstanding may also be limited pursuant to the terms of one or more intercreditor agreements that we enter into with the holders of such senior debt. Under a typical intercreditor agreement, at any time that obligations that have the benefit of the senior liens are outstanding, any of the following actions that may be taken in respect of the collateral will be at the direction of the holders of the obligations secured by the senior liens:
|
|
• |
the ability to cause the commencement of enforcement proceedings against the collateral; |
|
|
• |
the ability to control the conduct of such proceedings; |
|
|
• |
the approval of amendments to collateral documents; |
|
|
• |
releases of liens on the collateral; |
|
|
• |
waivers of past defaults under collateral documents; and |
|
|
• |
we may not have the ability to control or direct such actions, even if our rights, including our security interest in the collateral, are materially and adversely affected. |
The disposition of our investments may result in contingent liabilities.
A substantial majority of our investments are loans. In connection with the disposition of an investment in loans, we may be required to make representations about the business and financial affairs of the portfolio company typical of those made in connection with the sale of a business. We may also be required to indemnify the purchasers of such investment to the extent that any such representations turn out to be inaccurate or with respect to potential liabilities. These arrangements may result in contingent liabilities that ultimately result in funding obligations that we must satisfy through our return of distributions previously made to us.
Our equity related investments are highly speculative, and we may not realize gains from these investments.
When we make a secured loan, we generally acquire warrant investments in the company. From time to time we may also acquire equity participation rights in connection with an investment which will allow us, at our option, to participate in current or future rounds of equity financing through direct capital investments in our portfolio companies. In addition, we may be required to accrue OID which decreases the balance on our secured loans by an amount equal to the value of the warrant investment we receive in connection with the applicable secured loan over its lifetime. To the extent we hold these equity related investments, we attempt to dispose of them and realize gains upon our disposition of them. However, the equity related investments we receive and make may not appreciate in value or may decline in value. We also may be unable to realize any value if a portfolio company does not have a liquidity event, such as a sale of the business or public offering, or if the portfolio company defaults under its outstanding indebtedness, which could materially decrease the value of, or prevent us from being able to sell, the underlying equity related investment. As a result, we may not be able to realize gains from our equity related investments and any gains that we do realize on the disposition of any equity related investment may not be sufficient to offset any other losses or OID we experience or accrue.
Our investments in the life sciences industry are subject to extensive government regulation, litigation risk and certain other risks particular to that industry.
We have invested and plan to continue investing in venture growth stage companies in the life sciences industry that are subject to extensive regulation by the Food and Drug Administration and, to a lesser extent, federal, state and other foreign agencies. If any of these companies fail to comply with applicable regulations, they could be subject to significant penalties and claims that could materially and adversely affect their operations. In addition, governmental budgetary constraints affecting the regulatory approval process, new laws, regulations or judicial interpretations of existing laws and regulations might materially and adversely affect a company in this industry. Venture growth stage companies in the life sciences industry may also have a limited number of suppliers of necessary components or a limited number of manufacturers for their products, and therefore face a risk of disruption to their manufacturing process if they are unable to find alternative suppliers when needed. Any of these factors could materially and adversely affect the operations of a company in this industry and, in turn, impair our ability to timely collect principal and interest payments owed to us.
53
Investments in secured loans to companies with foreign operations may involve significant risks in addition to the risks inherent in U.S. investments.
Our investment strategy contemplates making secured loans to companies with foreign operations. As of December 31, 2017, 19.9% of our portfolio consisted of companies not domiciled in the United States as they did not have their principal place of business in the United States. Investing in such companies may expose us to additional risks not typically associated with investing in U.S. companies or U.S. companies with no foreign operations. These risks include changes in exchange control regulations, intellectual property laws, political and social instability, limitations in our ability to perfect our security interests, expropriation, imposition of foreign taxes, less liquid markets and less available information than is generally the case in the United States, higher transaction costs, less government supervision of exchanges, brokers and issuers, less developed bankruptcy laws, difficulty in enforcing contractual obligations, lack of uniform accounting and auditing standards and greater price volatility. In addition, we expect investing in such companies will expose us to higher administrative, legal and monitoring costs and expenses not typically associated with investing in U.S. companies or U.S. companies with no foreign operations.
We may expose ourselves to risks resulting from our use of interest rate hedging transactions.
As of December 31, 2017, 65% of our portfolio had a floating interest rate indexed to the prime rate. The remaining 35% of our portfolio had a fixed interest rate. Our Credit Facility bears interest at a floating rate indexed to LIBOR. We may utilize instruments such as interest rate swaps, caps, collars and/or floors to seek to hedge against fluctuations in the relative values of our fixed-rate portfolio positions and/or to hedge against the impact on our net investment income from changes in market interest rates. When we engage in interest rate hedging transactions, we may expose ourselves to risks associated with such transactions. We believe that any hedging transactions that we enter into in the future will not be considered “qualifying assets” under the 1940 Act, which may limit our hedging strategy more than other companies that are not subject to the 1940 Act.
Hedging transactions do not eliminate the risks associated with possible interest rate fluctuations on the value of our investments. These risks include: (i) the possibility that the market will move in a manner or direction that would have resulted in gain for us had an interest rate hedging transaction not been utilized, in which case our performance would have been better had we not engaged in the interest rate hedging transaction; (ii) the risk of imperfect correlation between the risk sought to be hedged and the interest rate hedging transaction used; (iii) potential illiquidity for the hedging instrument used, which may make it difficult for us to close-out or unwind an interest rate hedging transaction; and (iv) the possibility that the counterparty fails to honor its obligation. Furthermore, it may not be possible to hedge against an interest rate fluctuation that is so generally anticipated that we are not able to enter into a hedging transaction at an acceptable price. Moreover, for a variety of reasons, we may not seek to establish a perfect correlation between such hedging instruments and the interest rate being hedged. Any such imperfect correlation may prevent us from achieving the intended hedge and expose us to risk of loss.
Our failure to make protective or follow-on investments in our portfolio companies could impair the value of our portfolio.
Following an initial investment in a portfolio company, we may make additional investments in that portfolio company as “protective” and/or “follow-on” investments, in order to attempt to preserve or enhance the value of our initial investment. We may elect not to make follow-on investments or otherwise lack sufficient funds to make those investments. We have the discretion to make any follow-on investments, subject to the availability of capital resources. The failure to make follow-on investments may, in some circumstances, jeopardize the continued viability of a portfolio company, result in a diminished current value or impair the ability or likelihood for a full recovery of the value of our initial investment, or may result in a missed opportunity for us to increase our participation in a successful operation. Even if we have sufficient capital to make a desired follow-on investment, we may elect not to make a follow-on investment because we do not want to increase our concentration of risk, we prefer other opportunities, we are subject to BDC requirements that would prevent such follow-on investments or the follow-on investment would affect our qualification as a RIC.
Risks Relating to our Common Stock and Public Debt
Our common stock may trade below our net asset value per share, which limits our ability to raise additional equity capital.
If our common stock is trading below our net asset value per share, we are not able to issue additional shares of our common stock at the market price without first obtaining the approval for such issuance from our stockholders and our independent directors. If our common stock trades below our net asset value per share, the higher cost of equity capital may result in it being unattractive to raise new equity, which may limit our ability to grow. The risk of our common stock trading below our net asset value per share is separate and distinct from the risk that our net asset value per share may decline. We cannot predict whether shares of our common stock will trade above, at or below our net asset value per share.
54
Our stockholders will experience dilution in their ownership percentage if they opt out of our dividend reinvestment plan and participating stockholders can experience dilution in the value of their shares if we distribute shares through our dividend reinvestment plan at a price below the then current NAV.
All dividends declared in cash payable to stockholders that are participants in our dividend reinvestment plan may be reinvested in newly-issued shares of our common stock. As a result, our stockholders that opt out of our dividend reinvestment plan will experience dilution in their ownership percentage of our common stock over time. In addition, we may distribute shares through our dividend reinvestment plan at a price that is below the then current NAV, which would result in dilution of the value of the shares held by stockholders who participate in our dividend reinvestment plan.
Investing in our common stock may involve an above average degree of risk.
The investments we make in accordance with our investment strategy may result in a higher amount of risk and higher volatility or loss of principal than alternative investment options. Our investments in venture growth stage companies with secured loans, warrant investments and direct equity investments may be speculative and, therefore, an investment in our common stock may not be suitable for someone with lower risk tolerance.
The market price of our common stock may fluctuate significantly.
The market price and liquidity of the market for shares of our common stock may be significantly affected by numerous factors, some of which are beyond our control and may not be directly related to our operating performance. These factors include:
|
|
• |
price and volume fluctuations in the overall stock market from time to time; |
|
|
• |
significant volatility in the market price and trading volume of securities of BDCs or other companies in our sector, which is not necessarily related to the operating performance of these companies; |
|
|
• |
any inability to deploy or invest our capital; |
|
|
• |
fluctuations in interest rates; |
|
|
• |
any inability to access the capital markets; |
|
|
• |
realized and unrealized losses in investments in our portfolio companies; |
|
|
• |
the financial performance of the industries in which we invest; |
|
|
• |
announcement of strategic developments, acquisitions, and other material events by us or our competitors or operating performance of companies comparable to us; |
|
|
• |
changes in regulatory policies or tax guidelines, particularly with respect to RICs or BDCs; |
|
|
• |
perception or reputation of TPC; |
|
|
• |
loss of our qualification as a RIC or BDC; |
|
|
• |
changes in earnings or variations in operating results; |
|
|
• |
changes in accounting guidelines governing valuation of our investments; |
|
|
• |
any shortfall in revenue or net income or any increase in losses from levels expected by investors or securities analysts; |
|
|
• |
departure of, or loss of access to, our Adviser’s senior investment team; |
|
|
• |
operating performance of companies comparable to us; and |
|
|
• |
general economic trends and other external factors. |
55
Our business and operation could be negatively affected if we become subject to any securities litigation or shareholder activism, which could cause us to incur significant expense, hinder execution of investment strategy and impact our stock price.
In the past, following periods of volatility in the market price of a company’s securities, securities class action litigation has often been brought against that company. Shareholder activism, which could take many forms or arise in a variety of situations, has been increasing in the BDC space recently. While we are currently not subject to any securities litigation or shareholder activism, due to the potential volatility of our stock price and for a variety of other reasons, we may in the future become the target of securities litigation or shareholder activism. Securities litigation and shareholder activism, including potential proxy contests, could result in substantial costs and divert management’s and our board of directors’ attention and resources from our business. Additionally, such securities litigation and shareholder activism could give rise to perceived uncertainties as to our future, adversely affect our relationships with service providers and make it more difficult to attract and retain qualified personnel. Also, we may be required to incur significant legal fees and other expenses related to any securities litigation and activist shareholder matters. Further, our stock price could be subject to significant fluctuation or otherwise be adversely affected by the events, risks and uncertainties of any securities litigation and shareholder activism.
Sales of substantial amounts of our common stock in the public market may have an adverse effect on the market price of our common stock.
Sales of substantial amounts of our common stock, or the availability of such common stock for sale, could adversely affect the prevailing market prices for our common stock. If this occurs and continues, it could impair our ability to raise additional capital through the sale of securities should we desire to do so.
The trading market or market value of our publicly issued debt securities may fluctuate.
Our publicly issued debt securities may or may not continue to have an established trading market. We cannot provide assurance that a trading market for our publicly issued debt securities will be maintained. In addition to our creditworthiness, many factors may materially adversely affect the trading market for, and market value of, our publicly issued debt securities. These factors include, but are not limited to, the following:
|
|
• |
the time remaining to the maturity of these debt securities; |
|
|
• |
the outstanding principal amount of debt securities with terms identical to these debt securities; |
|
|
• |
the ratings assigned by national statistical ratings agencies; |
|
|
• |
the general economic environment; |
|
|
• |
the supply of debt securities trading in the secondary market, if any; |
|
|
• |
the redemption or repayment features, if any, of these debt securities; |
|
|
• |
the level, direction and volatility of market interest rates generally; and |
|
|
• |
market rates of interest higher or lower than rates borne by the debt securities. |
An investor should also be aware that there may be a limited number of buyers when such investor decides to sell its debt securities. This too may materially adversely affect the market value of the debt securities or the trading market for the debt securities.
Terms relating to redemption may materially adversely affect the return on any debt securities that we may issue.
If debt securities are redeemable at our option, we may choose to redeem debt securities at times when prevailing interest rates are lower than the interest rate paid on debt securities. In addition, if debt securities are subject to mandatory redemption, we may be required to redeem debt securities also at times when prevailing interest rates are lower than the interest rate paid on debt securities. In this circumstance, an investor may not be able to reinvest the redemption proceeds in a comparable security at an effective interest rate as high as the debt securities being redeemed.
56
The 2022 Notes are unsecured and therefore are effectively subordinated to any secured indebtedness we have currently incurred or may incur in the future.
The 2022 Notes are not secured by any of our assets or any of the assets of our subsidiaries. As a result, the 2022 Notes are effectively subordinated to any secured indebtedness we or our subsidiaries have currently incurred and may incur in the future (or any indebtedness that is initially unsecured to which we subsequently grant security) to the extent of the value of the assets securing such indebtedness. In any liquidation, dissolution, bankruptcy or other similar proceeding, the holders of any of our existing or future secured indebtedness and the secured indebtedness of our subsidiaries may assert rights against the assets pledged to secure that indebtedness in order to receive full payment of their indebtedness before the assets may be used to pay other creditors, including the holders of the 2022 Notes.
An active trading market for the 2022 Notes may not develop or be sustained, which could limit the market price of the 2022 Notes or your ability to sell them.
Although the 2022 Notes are listed on the NYSE under the symbol “TPVY,” we cannot provide any assurances that an active trading market will develop or be sustained for the 2022 Notes or that any of the notes will be able to be sold. At various times, the 2022 Notes may trade at a discount from their initial offering price depending on prevailing interest rates, the market for similar securities, our credit ratings, general economic conditions, our financial condition, performance and prospects and other factors. To the extent an active trading market is not sustained, the liquidity and trading price for the 2022 Notes may be harmed.
None.
We do not own any real estate or other physical properties materially important to our operations. Our executive offices are located at 2755 Sand Hill Road, Suite 150, Menlo Park, California 94025. These offices are provided by our Administrator pursuant to the Administration Agreement. We believe that our facilities are suitable and adequate for our business.
We, our Adviser or our Administrator are not currently subject to any material legal proceedings, nor, to our knowledge, is any material legal proceeding threatened against us, our Adviser or our Administrator. From time to time, we, our Adviser or our Administrator may be a party to certain legal proceedings in the ordinary course of business, including proceedings relating to the enforcement of our rights under contracts with our portfolio companies. While the outcome of these legal proceedings cannot be predicted with certainty, we do not expect that these proceedings will have a material effect upon our financial condition or results of operations.
Not applicable.
57
|
Item 5. |
Market for Registrant’s Common Equity, Related Stockholder Matters and Issuer Purchases of Equity Securities |
Price Range of Common Stock
Our common stock is traded on the NYSE under the symbol “TPVG.” The following table lists the high and low closing sale price for our common stock, the closing sale price as a percentage of net asset value, or “NAV,” and distributions per share for each fiscal quarter during the two most recently completed fiscal years as reported on the NYSE.
|
|
|
|
|
|
|
Closing Sales Price (2) |
|
|
Premium/ (Discount) of High Sales |
|
|
Premium/ (Discount) of Low Sales |
|
|
Declared |
|
||||||||
|
Period |
|
NAV (1) |
|
|
High |
|
|
Low |
|
|
Price to NAV (3) |
|
|
Price to NAV (3) |
|
|
Distributions |
|
||||||
|
Fourth Quarter of 2017 |
|
$ |
13.25 |
|
|
$ |
14.00 |
|
|
$ |
12.69 |
|
|
|
5.7 |
% |
|
|
(4.2 |
)% |
|
$ |
0.36 |
|
|
Third Quarter of 2017 |
|
$ |
13.39 |
|
|
$ |
14.15 |
|
|
$ |
12.59 |
|
|
|
5.7 |
% |
|
|
(6.0 |
)% |
|
$ |
0.36 |
|
|
Second Quarter of 2017 |
|
$ |
13.52 |
|
|
$ |
14.32 |
|
|
$ |
13.08 |
|
|
|
5.9 |
% |
|
|
(3.3 |
)% |
|
$ |
0.36 |
|
|
First Quarter of 2017 |
|
$ |
13.38 |
|
|
$ |
14.01 |
|
|
$ |
12.16 |
|
|
|
4.7 |
% |
|
|
(9.1 |
)% |
|
$ |
0.36 |
|
|
Fourth Quarter of 2016 |
|
$ |
13.51 |
|
|
$ |
12.99 |
|
|
$ |
10.43 |
|
|
|
(3.8 |
)% |
|
|
(22.8 |
)% |
|
$ |
0.36 |
|
|
Third Quarter of 2016 |
|
$ |
13.44 |
|
|
$ |
12.00 |
|
|
$ |
10.45 |
|
|
|
(10.7 |
)% |
|
|
(22.2 |
)% |
|
$ |
0.36 |
|
|
Second Quarter of 2016 |
|
$ |
13.05 |
|
|
$ |
10.87 |
|
|
$ |
10.21 |
|
|
|
(16.7 |
)% |
|
|
(21.8 |
)% |
|
$ |
0.36 |
|
|
First Quarter of 2016 |
|
$ |
13.40 |
|
|
$ |
12.17 |
|
|
$ |
8.95 |
|
|
|
(9.2 |
)% |
|
|
(33.2 |
)% |
|
$ |
0.36 |
|
__________________
|
(1) |
NAV per share is determined as of the last day in the relevant quarter and therefore may not reflect the NAV per share on the date of the high and low sales prices. The NAVs shown are based on outstanding shares at the end of each period. |
|
(2) |
Closing sales price as provided by the NYSE. |
|
(3) |
Calculated as of the respective high or low closing sales price divided by the quarter end NAV and subtracting 1. |
On March 9, 2018, the reported sales price of our common stock was $11.65 per share. As of March 9, 2018, we had 23 stockholders of record.
Distributions
It is our intention to distribute all or substantially all of our taxable income earned over the course of the year. During the year ended December 31, 2017, we recorded $19 thousand for federal excise tax in our consolidated statements of operations. For the year ended December 31, 2017, total distributions of $1.44 per share were declared and paid. On March 12, 2018, we announced that our Board declared a first quarter 2018 dividend of $0.36 per share payable on April 6, 2018, to stockholders of record on March 23, 2018. We will not be able to determine whether any specific distribution will be treated as made out of our taxable earnings or as a return of capital until after the end of our taxable year. Any amount treated as a return of capital will reduce a stockholder’s adjusted tax basis in his or her common stock, thereby increasing his or her potential gain or reducing his or her potential loss on the subsequent sale or other disposition of his or her common stock. For purposes of issuing and publishing the Rule 19a-1 notice required under the 1940 Act, we will calculate both our current and accumulated earnings and profits on a tax basis in order to determine the amount of any distribution that constituted a return of capital to our stockholders. While such distributions are not taxable, they reduce a stockholder’s basis in his, her, or its shares of common stock, which may result in the stockholder recognizing more taxable capital gains, or a lower capital loss, when the shares of common stock are eventually sold.
We have elected to be treated, and intend to qualify annually, as a RIC under the Code, beginning with our taxable year ended December 31, 2014. To obtain and maintain RIC tax treatment, we must distribute at least 90% of our net ordinary income and net realized short-term capital gains in excess of our net realized long-term capital losses, if any, to our stockholders. In order to avoid a nondeductible 4% U.S. federal excise tax on certain of our undistributed income, we would need to distribute during each calendar year an amount at least equal to the sum of: (a) 98% of our ordinary income (not taking into account any capital gains or losses) for such calendar year; (b) 98.2% of the amount by which our capital gains exceed our capital losses (adjusted for certain ordinary losses) for a one-year period ending on October 31 of the calendar year (unless an election is made by us to use our taxable year); and (c) certain undistributed amounts from previous years on which we paid no U.S. federal income tax. For the tax years ended December 31, 2014, 2015 and 2017, we were subject to a 4% U.S. excise tax and we may be subject to this tax in future years. In such cases, we will be liable for the tax only on the amount by which we do not meet the foregoing distribution requirement.
58
We currently intend to distribute net long-term capital gains if any, at least annually out of the assets legally available for such distributions. However, we may in the future decide to retain some or all of our long-term capital gains but designate the retained amount as a “deemed distribution.” In that case, among other consequences, we will pay tax on the retained amount, each U.S. stockholder will be required to include their share of the deemed distribution in income as if it had been distributed to the U.S. stockholder, and the U.S. stockholder will be entitled to claim a credit equal to their allocable share of the tax paid on the deemed distribution by us. The amount of the deemed distribution net of such tax will be added to such stockholder’s tax basis in such stockholder’s common stock. Since we expect to pay tax on any retained capital gains at our regular corporate tax rate, and since that rate is in excess of the maximum rate currently payable by individuals on long-term capital gains, the amount of tax that individual stockholders will be treated as having paid and for which they will receive a credit will exceed the tax they owe on the retained net capital gain. Such excess generally may be claimed as a credit against such individual stockholder’s other U.S. federal income tax obligations or may be refunded to the extent it exceeds such individual stockholder’s liability for U.S. federal income tax. We cannot assure any stockholder that we will achieve results that will permit us to pay any cash distributions, and if we issue senior securities, we may be prohibited from making distributions if doing so would cause us to fail to maintain the asset coverage ratios stipulated by the 1940 Act or if such distributions are limited by the terms of any of our borrowings.
Unless a stockholder elects to receive distributions in cash, we intend to make such distributions in additional shares of our common stock under our dividend reinvestment plan. Although distributions paid in the form of additional shares of our common stock will generally be subject to U.S. federal, state and local taxes in the same manner as cash distributions, investors participating in our dividend reinvestment plan will not receive any corresponding cash distributions with which to pay any such applicable taxes. If a stockholder holds shares of our common stock in the name of a broker or financial intermediary, such stockholder should contact such broker or financial intermediary regarding the election to receive distributions in cash in lieu of shares of our common stock. Any distributions reinvested through the issuance of shares through our dividend reinvestment plan will increase our assets on which the base management fee and the incentive fee are determined and paid to our Adviser.
The following table summarizes our cash distributions per share that have been authorized by our board of directors since our initial public offering. From March 5, 2014 (commencement of operations) to December 31, 2015 and during the year ended December 31, 2017, these distributions represent ordinary income as our earnings exceed distributions. Approximately $1.20 per share of the distributions during the year ended December 31, 2016 represent a return of capital.
|
Period Ended |
|
Date Announced |
|
Record Date |
|
Payment Date |
|
Per Share Amount |
|||
|
March 31, 2014 |
|
April 3, 2014 |
|
April 15, 2014 |
|
April 30, 2014 |
|
$ |
0.09 |
|
(1) |
|
June 30, 2014 |
|
May 13, 2014 |
|
May 30, 2014 |
|
June 17, 2014 |
|
$ |
0.30 |
|
|
|
September 30, 2014 |
|
August 11, 2014 |
|
August 29, 2014 |
|
September 16, 2014 |
|
$ |
0.32 |
|
|
|
December 31, 2014 |
|
October 27, 2014 |
|
November 28, 2014 |
|
December 16, 2014 |
|
$ |
0.36 |
|
|
|
December 31, 2014 |
|
December 3, 2014 |
|
December 22, 2014 |
|
December 31, 2014 |
|
$ |
0.15 |
|
(2) |
|
March 31, 2015 |
|
March 16, 2015 |
|
March 26, 2015 |
|
April 16, 2015 |
|
$ |
0.36 |
|
|
|
June 30, 2015 |
|
May 6, 2015 |
|
May 29, 2015 |
|
June 16, 2015 |
|
$ |
0.36 |
|
|
|
September 30, 2015 |
|
August 11, 2015 |
|
August 31, 2015 |
|
September 16, 2015 |
|
$ |
0.36 |
|
|
|
December 31, 2015 |
|
November 10, 2015 |
|
November 30, 2015 |
|
December 16, 2015 |
|
$ |
0.36 |
|
|
|
March 31, 2016 |
|
March 14, 2016 |
|
March 31, 2016 |
|
April 15, 2016 |
|
$ |
0.36 |
|
|
|
June 30, 2016 |
|
May 9, 2016 |
|
May 31, 2016 |
|
June 16, 2016 |
|
$ |
0.36 |
|
|
|
September 30, 2016 |
|
August 8, 2016 |
|
August 31, 2016 |
|
September 16, 2016 |
|
$ |
0.36 |
|
|
|
December 31, 2016 |
|
November 7, 2016 |
|
November 30, 2016 |
|
December 16, 2016 |
|
$ |
0.36 |
|
|
|
March 31, 2017 |
|
March 13, 2017 |
|
March 31, 2017 |
|
April 17, 2017 |
|
$ |
0.36 |
|
|
|
June 30, 2017 |
|
May 9, 2017 |
|
May 31, 2017 |
|
June 16, 2017 |
|
$ |
0.36 |
|
|
|
September 30, 2017 |
|
August 8, 2017 |
|
August 31, 2017 |
|
September 15, 2017 |
|
$ |
0.36 |
|
|
|
December 31, 2017 |
|
November 6, 2017 |
|
November 17, 2017 |
|
December 1, 2017 |
|
$ |
0.36 |
|
|
|
Total cash distributions |
|
|
|
|
|
|
|
$ |
5.54 |
|
|
_______________
|
|
(1) |
The amount of this initial distribution reflected a quarterly dividend rate of $0.30 per share, prorated for the 27 days for the period from the pricing of our initial public offering on March 5, 2014 (commencement of operations), through March 31, 2014. |
|
|
(2) |
Represents a special distribution. |
59
The graph below compares the cumulative total stockholder return on our common stock from March 6, 2014 (the first day of trading following our initial public offering) to December 31, 2017 with that of the NASDAQ Financial 100 Stock Index and the Standard & Poor’s 500 Stock Index. This graph assumes that on March 6, 2014, $100 was invested in our common stock, the NASDAQ Financial 100 Stock Index, and the Standard & Poor’s 500 Stock Index, as we do not believe there is an appropriate index of companies with an investment strategy similar to our own with which to compare the return on our common stock. The graph also assumes the reinvestment of dividends into additional shares of the same class of equity securities at the frequency with which dividends are paid on such securities during the applicable fiscal year. The graph and other information furnished under this Part II Item 5 of this annual report on Form 10-K shall not be deemed to be “soliciting material” or to be “filed” with the SEC or subject to Regulation 14A or 14C under, or to the liabilities of Sections 18 of, the Exchange Act. The stock price performance included in this graph is not necessarily indicative of future stock performance.
COMPARISON OF CUMULATIVE TOTAL RETURNS
For the Period from March 5, 2014 (TPVG’s IPO) to December 31, 2017
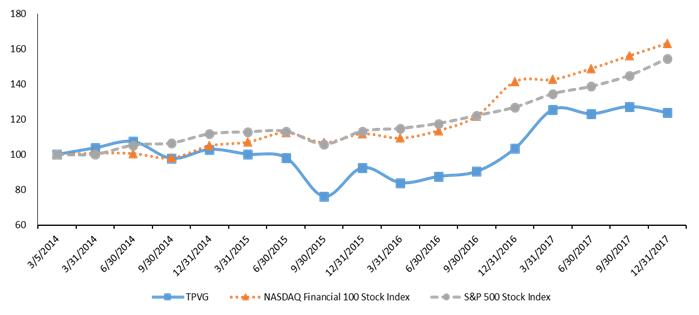
Our IPO was priced at $15.00 per share and the chart is based on what our stock price was at the end of the first trading day, which was $15.65 per share.
Sales of Unregistered Securities
During the year ended December 31, 2017, we issued 81,461 shares of common stock under our dividend reinvestment plan. These issuances were not subject to the registration requirements under the Securities Act of 1933, as amended. The cash paid for shares of common stock issued under our dividend reinvestment plan during the year ended December 31, 2017 was approximately $1.0 million.
On October 25, 2017, we sold in a private placement transaction: (i) 1,594,007 shares of our common stock at a price of $13.54 per share to certain investment funds managed by the Alternative Investments & Manager Selection Group of Goldman Sachs Asset Management, L.P. and (ii) 73,855 shares of our common stock at a price of $13.65 per share to certain of our executive officers, for total gross proceeds of approximately $22.6 million. The private placement transaction was exempt from registration under Section 4(a)(2) of the Securities Act of 1933 and Regulation D thereunder. Proceeds from this private placement will be used to further grow our investment portfolio.
60
Issuer Purchases of Equity Securities
We did not repurchase any of our securities during the fourth quarter of the fiscal year ended December 31, 2017.
The following selected financial and other data for the years ended December 31, 2017, December 31, 2016, December 31, 2015, and the period from our commencement of operations to December 31, 2014, respectively, has been derived from our audited financial statements. This data should be read in conjunction with our consolidated financial statements and related notes thereto and “Management’s Discussion and Analysis of Financial Condition and Results of Operations” included elsewhere in this annual report on Form 10-K. Historical data is not necessarily indicative of results to be expected for any future period.
|
Selected Consolidated Financial Data (in thousands, except per share data) |
|
For the Year Ended December 31, 2017 or as of December 31, 2017 |
|
|
For the Year Ended December 31, 2016 or as of December 31, 2016 |
|
|
For the Year Ended December 31, 2015 or as of December 31, 2015 |
|
|
For the Period from March 5, 2014 (Commencement of Operations) to December 31, 2014 or as of December 31, 2014 |
|
||||
|
Statement of Operations Data: |
|
|
|
|
|
|
|
|
|
|
|
|
|
|
|
|
|
Total investment and other income |
|
$ |
51,510 |
|
|
$ |
43,635 |
|
|
$ |
42,086 |
|
|
$ |
25,346 |
|
|
Base management fee |
|
|
6,268 |
|
|
|
5,525 |
|
|
|
5,428 |
|
|
|
2,723 |
|
|
Income and capital gains incentive fee |
|
|
5,614 |
|
|
|
2,775 |
|
|
|
4,064 |
|
|
|
2,865 |
|
|
Interest expense and amortization of fees |
|
|
9,061 |
|
|
|
7,859 |
|
|
|
6,285 |
|
|
|
3,897 |
|
|
All other operating expenses |
|
|
4,301 |
|
|
|
4,465 |
|
|
|
4,350 |
|
|
|
3,053 |
|
|
Net investment income |
|
|
26,266 |
|
|
|
23,011 |
|
|
|
21,959 |
|
|
|
12,808 |
|
|
Net realized losses |
|
|
(1,276 |
) |
|
|
(20,718 |
) |
|
|
(317 |
) |
|
|
— |
|
|
Net change in unrealized gains (losses) on investments |
|
|
(5,763 |
) |
|
|
8,833 |
|
|
|
(6,121 |
) |
|
|
1,483 |
|
|
Net increase in net assets resulting from operations |
|
$ |
19,227 |
|
|
$ |
11,126 |
|
|
$ |
15,521 |
|
|
$ |
14,291 |
|
|
Share Data: |
|
|
|
|
|
|
|
|
|
|
|
|
|
|
|
|
|
Net investment income per share |
|
$ |
1.61 |
|
|
$ |
1.42 |
|
|
$ |
1.46 |
|
|
$ |
1.30 |
|
|
Net realized loss per share |
|
$ |
(0.01 |
) |
|
$ |
(1.28 |
) |
|
$ |
(0.02 |
) |
|
$ |
— |
|
|
Net change in unrealized gains (losses) per share |
|
$ |
(0.35 |
) |
|
$ |
0.55 |
|
|
$ |
(0.40 |
) |
|
$ |
0.15 |
|
|
Net realized loss on extinguishment of debt per share |
|
$ |
(0.07 |
) |
|
$ |
— |
|
|
$ |
— |
|
|
$ |
— |
|
|
Net increase in net assets per share |
|
$ |
1.18 |
|
|
$ |
0.69 |
|
|
$ |
1.03 |
|
|
$ |
1.45 |
|
|
Distributions per share |
|
$ |
1.44 |
|
|
$ |
1.44 |
|
|
$ |
1.44 |
|
|
$ |
1.22 |
|
|
Basic and diluted weighted average shares of common stock outstanding |
|
|
16,324 |
|
|
|
16,160 |
|
|
|
15,041 |
|
|
|
9,870 |
|
|
Common stock outstanding at period end |
|
|
17,730 |
|
|
|
15,981 |
|
|
|
16,302 |
|
|
|
9,924 |
|
|
Balance Sheet Data at Period End: |
|
|
|
|
|
|
|
|
|
|
|
|
|
|
|
|
|
Investments at fair value |
|
$ |
372,103 |
|
|
$ |
374,311 |
|
|
$ |
271,717 |
|
|
$ |
257,971 |
|
|
Short-term investments at fair value |
|
|
124,909 |
|
|
|
39,990 |
|
|
|
69,995 |
|
|
|
49,995 |
|
|
Cash and restricted cash |
|
|
10,006 |
|
|
|
15,478 |
|
|
|
38,479 |
|
|
|
14,939 |
|
|
Other assets |
|
|
3,266 |
|
|
|
4,443 |
|
|
|
2,132 |
|
|
|
3,424 |
|
|
Total assets |
|
|
510,284 |
|
|
|
434,222 |
|
|
|
382,323 |
|
|
|
326,329 |
|
|
Revolving Credit Facility |
|
|
67,000 |
|
|
|
115,000 |
|
|
|
18,000 |
|
|
|
118,000 |
|
|
2020 Notes, net |
|
|
— |
|
|
|
53,288 |
|
|
|
52,910 |
|
|
|
— |
|
|
2022 Notes, net |
|
|
72,433 |
|
|
|
— |
|
|
|
— |
|
|
|
— |
|
|
Payable for U.S. Treasury bill assets |
|
|
124,909 |
|
|
|
39,990 |
|
|
|
69,998 |
|
|
|
49,998 |
|
|
Other liabilities |
|
|
10,997 |
|
|
|
10,081 |
|
|
|
9,769 |
|
|
|
13,352 |
|
|
Total liabilities |
|
|
275,339 |
|
|
|
218,359 |
|
|
|
150,677 |
|
|
|
181,350 |
|
|
Net assets |
|
$ |
234,945 |
|
|
$ |
215,863 |
|
|
$ |
231,646 |
|
|
$ |
144,979 |
|
|
Other Data: |
|
|
|
|
|
|
|
|
|
|
|
|
|
|
|
|
|
Number of portfolio companies |
|
|
42 |
|
|
|
33 |
|
|
|
34 |
|
|
|
27 |
|
|
Weighted average portfolio yield on debt investments during period |
|
|
16.4 |
% |
|
|
14.4 |
% |
|
|
17.0 |
% |
|
|
15.4 |
% |
61
Forward-Looking Statements
The information contained in this section should be read in conjunction with our consolidated financial statements and related notes and schedules thereto appearing elsewhere in this annual report on Form 10-K. Except as otherwise specified, references to “the Company”, “we”, “us”, and “our” refer to TriplePoint Venture Growth BDC Corp. and its subsidiaries.
This annual report on Form 10-K contains forward-looking statements that involve substantial risks and uncertainties. These forward-looking statements are not historical facts, but rather are based on current expectations, estimates and projections about TriplePoint Venture Growth BDC Corp., our current and prospective portfolio investments, our industry, our beliefs, and our assumptions. Words such as “anticipates,” “expects,” “intends,” “plans,” “will,” “may,” “continue,” “believes,” “seeks,” “estimates,” “would,” “could,” “should,” “targets,” “projects,” and variations of these words and similar expressions are intended to identify forward-looking statements. The forward-looking statements contained in this annual report on Form 10-K include statements as to:
|
|
• |
our future operating results; |
|
|
• |
our business prospects and the prospects of our portfolio companies; |
|
|
• |
our relationships with third parties, including venture capital investors; |
|
|
• |
the impact and timing of our unfunded commitments; |
|
|
• |
the expected market for venture capital investments; |
|
|
• |
the performance of our existing portfolio and other investments we may make in the future; |
|
|
• |
the impact of investments that we expect to make; |
|
|
• |
actual and potential conflicts of interest with TPC and TPVG Advisers LLC’s (“Adviser”) and its senior investment team and Investment Committee; |
|
|
• |
our contractual arrangements and relationships with third parties; |
|
|
• |
the dependence of our future success on the general economy and its impact on the industries in which we invest; |
|
|
• |
the ability of our portfolio companies to achieve their objectives; |
|
|
• |
our expected financings and investments; |
|
|
• |
the ability of our Adviser to attract, retain and have access to highly talented professionals, including our Adviser’s senior management team; |
|
|
• |
our ability to qualify and maintain our qualification as a RIC and as a BDC; |
|
|
• |
the adequacy of our cash resources and working capital; and |
|
|
• |
the timing of cash flows, if any, from the operations of our portfolio companies. |
These statements are not guarantees of future performance and are subject to risks, uncertainties, and other factors, some of which are beyond our control and difficult to predict and could cause actual results to differ materially from those expressed or forecasted in the forward-looking statements, including without limitation:
|
|
• |
an economic downturn could impair our portfolio companies’ ability to continue to operate, which could lead to the loss of some or all of our investments in such portfolio companies; |
|
|
• |
a contraction of available credit and/or an inability to access the equity markets could impair our lending and investment activities; |
|
|
• |
interest rate volatility could adversely affect our results, particularly when we elect to use leverage as part of our investment strategy; |
|
|
• |
currency fluctuations could adversely affect the results of our investments in foreign companies, particularly to the extent that we receive payments denominated in foreign currency rather than U.S. dollars; and |
|
|
• |
the risks, uncertainties and other factors we identify in “Risk Factors” in this annual report on Form 10-K under Part 1A and in our other filings with the SEC. |
62
Although we believe that the assumptions on which these forward-looking statements are based are reasonable, any of those assumptions could prove to be inaccurate, and as a result, the forward-looking statements based on those assumptions also could be inaccurate. Important assumptions include our ability to originate new loans and investments, certain margins and levels of profitability and the availability of additional capital. In light of these and other uncertainties, the inclusion of a projection or forward-looking statement in this annual report on Form 10-K should not be regarded as a representation by us that our plans and objectives will be achieved. These risks and uncertainties include those described in “Risk Factors” in this annual report on Form 10-K under Part 1A. You should not place undue reliance on these forward-looking statements, which apply only as of the date of this annual report on Form 10-K.
Overview
We are an externally managed, closed-end, non-diversified management investment company that has elected to be regulated as a BDC under the 1940 Act. We have elected to be treated, and intend to qualify annually, as a RIC under Subchapter M of the Code for U.S. federal income tax purposes beginning with our taxable year ending December 31, 2014.
Our shares are currently listed on the New York Stock Exchange (the “NYSE”) under the symbol “TPVG”. Our 5.75% Notes due 2022 (the "2022 Notes") are currently listed on the NYSE under the symbol “TPVY”.
Our investment objective is to maximize our total return to stockholders primarily in the form of current income and, to a lesser extent, capital appreciation by primarily lending with warrant investments to venture growth stage companies focused in technology, life sciences and other high growth industries that are backed by TPC’s select group of leading venture capital investors.
We serve as the primary financing source for the venture growth stage business segment of TriplePoint Capital’s global investment platform. TPC is widely recognized as a leading global financing provider devoted to serving venture capital-backed companies with creative, flexible and customized debt financing, equity capital and complementary services throughout their lifespan. TPC is located on Sand Hill Road in Silicon Valley and has a primary focus in technology, life sciences and other high growth industries.
We commenced investment activities on March 5, 2014. In order to expedite the ramp-up of our investment activities and further our ability to meet our investment objectives, on March 5, 2014, we acquired our initial portfolio. On March 11, 2014, we completed our initial public offering and received $141.6 million of net proceeds in connection with the initial public offering and concurrent private placement, net of the portion of the underwriting sales load and offering costs we paid. In 2015, we completed a follow-on public offering of our common stock raising approximately $95.9 million after offering costs. On October 25, 2017, we sold in a private placement transaction: (i) 1,594,007 shares of our common stock at a price of $13.54 per share to certain investment funds managed by the Alternative Investments & Manager Selection Group of Goldman Sachs Asset Management, L.P. and (ii) 73,855 shares of our common stock at a price of $13.65 per share to certain of our executive officers, for total gross proceeds of approximately $22.6 million.
Borrowings
In February 2014, we entered into a credit agreement with Deutsche Bank AG acting as administrative agent and a lender, and KeyBank National Association, Everbank Commercial Lender Finance, Inc., and AloStar Bank of Commerce, as other lenders, which provided us with a $150.0 million commitment, subject to borrowing base requirements (the “Revolving Credit Facility”). In August 2014, we amended the Revolving Credit Facility to increase the total commitments by $50.0 million to $200.0 million in aggregate. Effective as of a January 2016 amendment to the Revolving Credit Facility, borrowings under the Revolving Credit Facility bore interest at the sum of (i) a floating rate based on certain indices, including LIBOR and commercial paper rates, plus (ii) a margin of 3.0% during the Revolving Credit Facility’s revolving period.
In January 2018 we amended and renewed the Revolving Credit Facility. MUFG Union Bank, N.A, replaced AloStar Bank of Commerce as a lender, under the amended Revolving Credit Facility. The amendment and renewal, among other things, increased the total commitment by $10.0 million to $210.0 million, extended the revolving period from February 21, 2018 to February 21, 2020, and extended the maturity date from February 21, 2019 to August 21, 2021. In addition, the amended Revolving Credit Facility includes a reduction in the undrawn rate from 0.75% to 0.50% and a reduction in the applicable margin during the revolving period to 2.80% if facility utilization is greater than or equal to 75%, 2.90% if utilization is greater than or equal to 50%, and 3.00% if utilization is less than 50%. Borrowings under the Revolving Credit Facility are subject to its various covenants and the leverage restrictions contained in the 1940 Act.
On August 4, 2015, we completed a public offering of $50.0 million in aggregate principal amount of our 6.75% Notes due 2020 (the “2020 Notes”) and received net proceeds of $48.3 million after the payment of fees and offering costs. On September 2, 2015, we issued an additional $4.6 million in aggregate principal amount of our 2020 Notes and received net proceeds of approximately $4.5 million, after the payment of the underwriting sales load and offering costs, as a result of the underwriters’ partial exercise of their option to purchase additional 2020 Notes. The interest on the 2020 Notes were payable quarterly on January 15, April 15, July 15 and October 15, beginning on October 15, 2015.
63
On July 14, 2017, we elected to exercise our option to redeem, in full, the 2020 Notes. On August 13, 2017, we redeemed all of the issued and outstanding 2020 Notes in an aggregate principal amount of $54.6 million and paid an aggregate accrued interest of approximately $0.3 million. The 2020 Notes have been delisted on the NYSE effective August 15, 2017.
On July 14, 2017, we completed a public offering of $65.0 million in aggregate principal amount of our newly issued 2022 Notes and received net proceeds of approximately $62.8 million, after the payment of fees and offering costs. On July 24, 2017, as a result of the underwriters’ full exercise of their option to purchase additional 2022 Notes, we issued an additional $9.75 million in aggregate principal amount of the 2022 Notes and received net proceeds of approximately $9.5 million, after the payment of fees and offering costs. The interest on the 2022 Notes is payable quarterly on January 15, April 15, July 15 and October 15, beginning October 15, 2017.
Portfolio Composition, Investment Activity and Asset Quality
Portfolio Composition
We originate and invest primarily in venture growth stage companies. Companies at the venture growth stage have distinct characteristics differentiating them from venture capital-backed companies at other stages in their development lifecycle. We invest primarily in (i) growth capital loans that have a secured collateral position and that are used by venture growth stage companies to finance their continued expansion and growth, (ii) equipment financings, which may be structured as loans or leases, that have a secured collateral position on specified mission-critical equipment, (iii) on a select basis, revolving loans that have a secured collateral position and that are used by venture growth stage companies to advance against inventory, components, accounts receivable, contractual or future billings, bookings, revenues, sales or cash payments and collections including proceeds from a sale, financing or the equivalent and (iv) direct equity investments in venture growth stage companies. In connection with our growth capital loans, equipment financings and revolving loans, we generally receive warrant investments that allow us to participate in any equity appreciation of our borrowers and enhance our overall investment returns.
As of December 31, 2017, we had 106 investments in 42 companies. Our investments included 60 debt investments, 32 warrant investments, and 14 direct equity and related investments. As of December 31, 2017, the total cost and fair value of these investments were approximately $373.7 million and approximately $372.1 million, respectively. As of December 31, 2017, one of our portfolio companies was publicly traded. As of December 31, 2017, the 60 debt investments had an aggregate fair value of approximately $352.1 million and a weighted average loan to enterprise value ratio at the time of underwriting of approximately 7.4%. Enterprise value of a portfolio company is estimated based on information available, including any information regarding the most recent rounds of borrower funding, at the time of origination.
As of December 31, 2016, we held 99 investments in 33. Our investments included 63 debt investments, 29 warrant investments, and seven direct equity and related investments. As of December 31, 2016, the total cost and fair value of these investments were approximately $370.1 million and approximately $374.3 million, respectively. As of December 31, 2016, one of our portfolio companies was publicly traded. As of December 31, 2016, the 63 debt investments with an aggregate fair value of approximately $360.0 million had a weighted average loan to enterprise value ratio at the time of underwriting of approximately 8.6%.
The following tables provide information on the cost and fair value of our investments in companies along with the number of companies in our portfolio as of December 31, 2017 and December 31, 2016.
|
|
|
As of December 31, 2017 |
|
|
|||||||||||||||||
|
Investments by Type (dollars in thousands) |
|
Cost |
|
|
Fair Value |
|
|
Net Unrealized Gains (losses) |
|
|
Number of Investments |
|
|
Number of Companies |
|
|
|||||
|
Debt investments |
|
$ |
355,456 |
|
|
$ |
352,052 |
|
|
$ |
(3,404 |
) |
|
|
60 |
|
|
|
19 |
|
|
|
Warrant investments |
|
|
9,074 |
|
|
|
11,062 |
|
|
|
1,988 |
|
|
|
32 |
|
|
|
32 |
|
|
|
Equity investments |
|
|
9,139 |
|
|
|
8,989 |
|
|
|
(150 |
) |
|
|
14 |
|
|
|
11 |
|
|
|
Total Investments in Portfolio Companies |
|
$ |
373,669 |
|
|
$ |
372,103 |
|
|
$ |
(1,566 |
) |
|
|
106 |
|
|
|
42 |
|
* |
|
|
|
As of December 31, 2016 |
|
|
|||||||||||||||||
|
(dollars in thousands) |
|
Cost |
|
|
Fair Value |
|
|
Net Unrealized Gains (losses) |
|
|
Number of Investments |
|
|
Number of Companies |
|
|
|||||
|
Debt investments |
|
$ |
359,059 |
|
|
$ |
360,007 |
|
|
$ |
948 |
|
|
|
63 |
|
|
19 |
|
|
|
|
Warrant investments |
|
|
8,034 |
|
|
|
8,238 |
|
|
|
204 |
|
|
|
29 |
|
|
29 |
|
|
|
|
Equity investments |
|
|
3,023 |
|
|
|
6,066 |
|
|
|
3,043 |
|
|
|
7 |
|
|
6 |
|
|
|
|
Total Investments in Portfolio Companies |
|
$ |
370,116 |
|
|
$ |
374,311 |
|
|
$ |
4,195 |
|
|
|
99 |
|
|
|
33 |
|
* |
______________
|
* |
Represents non-duplicative number of companies. |
64
The following tables present the fair value of the portfolio of investments, by industry and the percentage of the total investment portfolio, as of December 31, 2017 and December 31, 2016.
|
|
|
As of December 31, 2017 |
|
|
|||||
|
Investments in Portfolio Companies by Industry (dollars in thousands) |
|
At Fair Value |
|
|
Percentage of Total Investments |
|
|
||
|
Financial Institution and Services |
|
$ |
71,812 |
|
|
|
19.3 |
|
% |
|
Business Applications Software |
|
|
51,915 |
|
|
|
14.0 |
|
|
|
Security Products |
|
|
50,232 |
|
|
|
13.5 |
|
|
|
E-Commerce - Clothing and Accessories |
|
|
43,824 |
|
|
|
11.8 |
|
|
|
Building Materials/Construction Machinery |
|
|
40,366 |
|
|
|
10.8 |
|
|
|
Network Systems Management Software |
|
|
30,021 |
|
|
|
8.1 |
|
|
|
Wireless Communications Equipment |
|
|
16,768 |
|
|
|
4.5 |
|
|
|
Security Services |
|
|
13,973 |
|
|
|
3.8 |
|
|
|
Biofuels / Biomass |
|
|
13,878 |
|
|
|
3.7 |
|
|
|
Business to Business Marketplace |
|
|
7,947 |
|
|
|
2.1 |
|
|
|
Entertainment |
|
|
7,879 |
|
|
|
2.1 |
|
|
|
Database Software |
|
|
6,952 |
|
|
|
1.9 |
|
|
|
Food & Drug |
|
|
5,038 |
|
|
|
1.4 |
|
|
|
Restaurant / Food Service |
|
|
2,686 |
|
|
|
0.7 |
|
|
|
Communications Software |
|
|
1,993 |
|
|
|
0.5 |
|
|
|
E-Commerce - Personal Goods |
|
|
1,613 |
|
|
|
0.4 |
|
|
|
General Media and Content |
|
|
1,362 |
|
|
|
0.4 |
|
|
|
Household & Office Goods |
|
|
1,022 |
|
|
|
0.3 |
|
|
|
Software Development Tools |
|
|
1,020 |
|
|
|
0.3 |
|
|
|
Conferencing Equipment / Services |
|
|
639 |
|
|
|
0.2 |
|
|
|
Travel & Arrangements/ Tourism |
|
|
300 |
|
|
|
0.1 |
|
|
|
Travel & Leisure |
|
|
253 |
|
|
|
0.1 |
|
|
|
Shopping Facilitators |
|
|
250 |
|
|
* |
|
|
|
|
Educational/Training Software |
|
|
180 |
|
|
* |
|
|
|
|
Advertising / Marketing |
|
|
106 |
|
|
* |
|
|
|
|
Medical Software and Information Services |
|
|
74 |
|
|
* |
|
|
|
|
Total portfolio company investments |
|
$ |
372,103 |
|
|
|
100.0 |
|
% |
______________
|
* |
Amount represents less than 0.05% of the total portfolio investments. |
65
|
|
As of December 31, 2016 |
|
|
||||||
|
Investments in Portfolio Companies by Industry (dollars in thousands) |
|
At Fair Value |
|
|
Percentage of Total Investments |
|
|
||
|
Database Software |
|
$ |
50,888 |
|
|
|
13.6 |
|
% |
|
Business Applications Software |
|
|
48,065 |
|
|
|
12.8 |
|
|
|
E-Commerce - Clothing and Accessories |
|
|
45,969 |
|
|
|
12.3 |
|
|
|
Conferencing Equipment / Services |
|
|
40,524 |
|
|
|
10.8 |
|
|
|
Security Services |
|
|
34,122 |
|
|
|
9.1 |
|
|
|
Wireless Communications Equipment |
|
|
29,422 |
|
|
|
7.9 |
|
|
|
Network Systems Management Software |
|
|
27,947 |
|
|
|
7.5 |
|
|
|
Financial Institution and Services |
|
|
25,122 |
|
|
|
6.7 |
|
|
|
E-Commerce - Personal Goods |
|
|
22,076 |
|
|
|
5.9 |
|
|
|
Shopping Facilitators |
|
|
20,838 |
|
|
|
5.6 |
|
|
|
Biofuels / Biomass |
|
|
16,065 |
|
|
|
4.3 |
|
|
|
Entertainment |
|
|
7,430 |
|
|
|
2.0 |
|
|
|
Restaurant / Food Service |
|
|
3,146 |
|
|
|
0.8 |
|
|
|
General Media and Content |
|
|
1,422 |
|
|
|
0.4 |
|
|
|
Software Development Tools |
|
|
622 |
|
|
|
0.2 |
|
|
|
Travel and Leisure |
|
|
298 |
|
|
|
0.1 |
|
|
|
Multimedia / Streaming Software |
|
|
166 |
|
|
* |
|
|
|
|
Advertising / Marketing |
|
|
106 |
|
|
* |
|
|
|
|
Medical Software and Information Services |
|
|
74 |
|
|
* |
|
|
|
|
Business to Business Marketplace |
|
|
9 |
|
|
* |
|
|
|
|
Total portfolio company investments |
|
$ |
374,311 |
|
|
|
100.0 |
|
% |
______________
|
* |
Amount represents less than 0.05% of the total portfolio investments. |
The following tables present the financing product type of our debt investments as of December 31, 2017 and December 31, 2016.
|
|
|
As of December 31, 2017 |
|
|
|||||
|
Debt Investments By Financing Product (dollars in thousands) |
|
Fair Value |
|
|
Percentage of Total Debt Investments |
|
|
||
|
Growth capital loans |
|
$ |
299,305 |
|
|
|
85.0 |
|
% |
|
Equipment leases |
|
|
9,694 |
|
|
|
2.8 |
|
|
|
Equipment loans |
|
|
41,886 |
|
|
|
11.9 |
|
|
|
Convertible notes |
|
|
1,167 |
|
|
|
0.3 |
|
|
|
Total debt investments |
|
$ |
352,052 |
|
|
|
100.0 |
|
% |
|
|
|
As of December 31, 2016 |
|
|
|||||
|
Debt Investments By Financing Product (dollars in thousands) |
|
Fair Value |
|
|
Percentage of Total Debt Investments |
|
|
||
|
Growth capital loans |
|
$ |
341,006 |
|
|
|
94.7 |
|
% |
|
Equipment leases |
|
|
15,303 |
|
|
|
4.3 |
|
|
|
Equipment loans |
|
|
3,698 |
|
|
|
1.0 |
|
|
|
Total debt investments |
|
$ |
360,007 |
|
|
|
100.0 |
|
% |
Growth capital loans in which the borrower held a term loan facility, with or without an accompanying revolving loan, in priority to our senior lien represent approximately 22.5% and 18.7% of the debt investments at fair value as of December 31, 2017 and December 31, 2016, respectively.
Investment Activity
During the year ended December 31, 2017, we entered into fifteen new debt commitments with twelve new portfolio companies and three existing portfolio companies totaling $329.9 million, funded thirty-six debt investments for approximately $231.8 million in principal value, acquired warrant investments representing approximately $3.8 million of value, and made nine equity and related investments of approximately $5.0 million and sold equity in one portfolio company for $4.5 million.
66
During the year ended December 31, 2016, we entered into seventeen new commitments with eight new portfolio companies and nine existing portfolio companies totaling $286.9 million, funded twenty-eight debt investments for approximately $158.3 million in principal value, acquired warrant investments representing approximately $2.5 million of value, and made two equity and related investments of approximately $0.2 million.
During the year ended December 31, 2017, one portfolio company repaid its outstanding growth capital loans at maturity in the amount of approximately $22.5 million, eight portfolio companies prepaid prior to maturity all of their outstanding growth capital loans of approximately $193.1 million, one portfolio company prepaid one of their equipment leases of approximately $0.6 million and one portfolio company made a partial principal prepayment of $1.8 million. In addition, during the year ended December 31, 2017, we received $2.4 million of cash proceeds and anticipate further distributions of $0.4 million from bankruptcy proceedings related to the liquidation of KnCMiner AB and converted any and all remaining receivables to an equity investment in GoGreenHost AB.
During the year ended December 31, 2016, three portfolio companies fully prepaid their outstanding principal of approximately $36.1 million and one portfolio company made a partial principal prepayment of its outstanding growth capital loan of $5.0 million.
Total portfolio investment activity for the years ended December 31, 2017 and December 31, 2016 was as follows:
|
|
|
For the Year Ended December 31, |
|
|||||
|
(in thousands) |
|
2017 |
|
|
2016 |
|
||
|
Beginning portfolio at fair value |
|
$ |
374,311 |
|
|
$ |
271,717 |
|
|
New debt investments |
|
|
224,381 |
|
|
|
153,771 |
|
|
Scheduled principal payments from debt investments |
|
|
(11,995 |
) |
|
|
(8,074 |
) |
|
Early principal payments, repayments and recoveries |
|
|
(218,011 |
) |
|
|
(41,115 |
) |
|
Accretion of debt investment fees |
|
|
2,962 |
|
|
|
6,358 |
|
|
Payment-in-kind coupon |
|
|
2,124 |
|
|
|
2,856 |
|
|
New warrant investments |
|
|
3,847 |
|
|
|
2,382 |
|
|
New equity investments |
|
|
5,003 |
|
|
|
196 |
|
|
Proceeds from the sale of investments |
|
|
(4,596 |
) |
|
|
(1,892 |
) |
|
Net realized gains (losses) |
|
|
(162 |
) |
|
|
(20,719 |
) |
|
Net unrealized gains (losses) on investments |
|
|
(5,761 |
) |
|
|
8,831 |
|
|
Ending portfolio at fair value |
|
$ |
372,103 |
|
|
$ |
374,311 |
|
As of December 31, 2017, our unfunded commitments to ten companies totaled approximately $100.1 million. During the year ended December 31, 2017, $120.0 million in unfunded commitments expired or were terminated and approximately $231.8 million were funded.
As of December 31, 2016, our unfunded commitments to nine companies totaled approximately $117.4 million. During the year ended December 31, 2016, $161.2 million in unfunded commitments expired or were terminated and approximately $158.3 million were funded.
The following table provides additional information on our unfunded commitments regarding milestones, expirations, and types of loans.
|
Unfunded Commitments* (in thousands) |
|
As of December 31, 2017 |
|
|
As of December 31, 2016 |
|
||
|
Dependent on milestones |
|
$ |
18,000 |
|
|
$ |
60,000 |
|
|
Expiring during: |
|
|
|
|
|
|
|
|
|
2017 |
|
|
— |
|
|
|
102,352 |
|
|
2018 |
|
|
87,097 |
|
|
|
10,000 |
|
|
2019 |
|
|
13,000 |
|
|
|
5,000 |
|
|
|
|
|
|
|
|
|
|
|
|
Growth capital loans |
|
|
98,376 |
|
|
|
113,000 |
|
|
Equipment leases and loans |
|
|
1,721 |
|
|
|
4,352 |
|
_______________
* Does not include backlog of potential future commitments.
67
Our credit agreements with our portfolio companies contain customary lending provisions that allow us relief from funding obligations for previously made commitments in instances where the underlying company experiences materially adverse events that affect the financial condition or business outlook for the company. Since these commitments may expire without being drawn upon, unfunded commitments do not necessarily represent future cash requirements or future earning assets for the Company. We generally expect 65% - 75% of our gross unfunded commitments to eventually be drawn before the expiration of their corresponding availability periods.
The fair value at the inception of the delay draw credit agreements with our portfolio companies is equal to the fees and/or warrant investments received to enter into these agreements, taking into account the remaining terms of the agreements and the counterparties’ credit profile. The unfunded commitment liability reflects the fair value of these future funding commitments. As of December 31, 2017 and December 31, 2016, the fair value for these unfunded commitments totaled approximately $1.3 million and $1.2 million, respectively, and was included in “other accrued expenses and liabilities” in our consolidated statements of assets and liabilities.
Our level of investment activity can vary substantially from period to period as our Adviser chooses to slow or accelerate new business originations depending on market conditions, rate of investment of TPC’s select group of leading venture capital investors, our Adviser’s knowledge, expertise and experience, our funding capacity (including availability under the Revolving Credit Facility and our ability or inability to raise equity or debt capital), and other market dynamics.
The following table shows the debt commitments, fundings of debt investments (principal balance) and equity investments and non-binding term sheet activity for the years ended December 31, 2017 and December 31, 2016.
|
Commitments and Fundings |
|
For the Year Ended December 31, |
|
|||||
|
(in thousands) |
|
2017 |
|
|
2016 |
|
||
|
Debt Commitments |
|
|
|
|
|
|
|
|
|
New portfolio companies |
|
$ |
307,879 |
|
|
$ |
190,000 |
|
|
Existing portfolio companies |
|
|
22,000 |
|
|
|
96,850 |
|
|
Total * |
|
$ |
329,879 |
|
|
$ |
286,850 |
|
|
|
|
|
|
|
|
|
|
|
|
Funded Debt Investments |
|
$ |
231,758 |
|
|
$ |
158,303 |
|
|
|
|
|
|
|
|
|
|
|
|
Equity Investments |
|
$ |
5,003 |
|
|
$ |
195 |
|
|
|
|
|
|
|
|
|
|
|
|
Non-Binding Term Sheets |
|
$ |
514,718 |
|
|
$ |
324,500 |
|
_______________
* Includes backlog of potential future commitments.
We may enter into commitments with certain portfolio companies that permit an increase in the commitment amount in the future in the event that conditions to such increases are met (“backlog of potential future commitments”). If such conditions to increase are met, these amounts may become unfunded commitments if not drawn prior to expiration. As of December 31, 2017 and December 31, 2016, this backlog of potential future commitments totaled $35.4 million and $40.0 million, respectively.
Payables
On December 31, 2017, we acquired $125.0 million in U.S. Treasury bills which we subsequently sold on January 3, 2018. On December 31, 2016, we acquired $40.0 million in U.S. Treasury bills which we subsequently sold on January 4, 2017. The purchase and sale of U.S. Treasury bills were done to efficiently meet certain RIC diversification tests.
68
Consistent with TPC’s existing policies, our Adviser maintains a credit watch list which places borrowers into five risk categories based on our Adviser’s senior investment team’s judgment, where 1 is the highest rating and all new loans are generally assigned a rating of 2.
|
Category |
|
Category Definition |
|
Action Item |
|
|
|
|
|
|
|
Clear (1) |
|
Performing above expectations and/or strong financial or enterprise profile, value or coverage. |
|
Review quarterly. |
|
White (2) |
|
Performing at expectations and/or reasonably close to it. Reasonable financial or enterprise profile, value or coverage. All new loans are initially graded White. |
|
Contact portfolio company regularly in no event less than quarterly. |
|
Yellow (3) |
|
Performing generally below expectations and/or some proactive concern. Adequate financial or enterprise profile, value or coverage. |
|
Contact portfolio company monthly or more frequently as determined by our Adviser’s Investment Committee; contact investors. |
|
Orange (4) |
|
Needs close attention due to performance materially below expectations, weak financial and/or enterprise profile, concern regarding additional capital or exit equivalent. |
|
Contact portfolio company weekly or more frequently as determined by our Adviser’s Investment Committee; contact investors regularly; our Adviser forms a workout group to minimize risk of loss. |
|
Red (5) |
|
Serious concern/trouble due to pending or actual default or equivalent. May experience partial and/or full loss. |
|
Maximize value from assets. |
As of December 31, 2017, the weighted average investment ranking of our debt investment portfolio was 2.02. During the year ended December 31, 2017, changes to portfolio companies within the credit categories, excluding fundings and repayments occurring within category White (2), consisted of: one portfolio company, with a principal balance of $13.1 million, was upgraded from White (2) to Clear (1); two portfolio companies, with a combined principal balance of $15.8 million were downgraded from White (2) to Yellow (3); one portfolio company rated Yellow (3), repaid its outstanding obligations, resulting in the removal of $22.5 million of principal balance from the credit watch list; one portfolio company, rated Orange (4), was removed from the credit watch list due to a distribution of proceeds from bankruptcy proceedings and the conversion of any and all remaining receivables from a debt investment to an equity instrument and two portfolio companies were removed from category Clear (1) due to payoffs of their outstanding obligations in the amount of $65.0 million.
During the year ended December 31, 2016, there were seven changes within the credit categories. Three portfolio companies, with a combined principal balance of $82.0 million was upgraded from White (2) to Clear (1). One portfolio company, with a principal balance of $41.6 million was downgraded from Clear (1) to White (2) and subsequently upgraded back to Clear (1). One portfolio company, with a principal balance of $31.2 million was upgraded from Orange (4) to Yellow (3). One portfolio company, with a principal balance of $20.5 million was downgraded from White (2) to Yellow (3). One portfolio company, with a principal balance of $5.6 million was downgraded from White (2) to Yellow (3) and subsequently to Orange (4).
The following tables show the credit rankings for the portfolio companies that had outstanding obligations to us as of December 31, 2017 and December 31, 2016.
|
|
|
As of December 31, 2017 |
|
|||||||||
|
Credit Category (dollars in thousands) |
|
Fair Value |
|
|
Percentage of Total Debt Investments |
|
|
Number of Portfolio Companies |
|
|||
|
Clear (1) |
|
$ |
54,071 |
|
|
|
15.4 |
|
% |
|
3 |
|
|
White (2) |
|
|
243,915 |
|
|
|
69.3 |
|
|
|
12 |
|
|
Yellow (3) |
|
|
46,187 |
|
|
|
13.1 |
|
|
|
3 |
|
|
Orange (4) |
|
|
7,879 |
|
|
|
2.2 |
|
|
|
1 |
|
|
Red (5) |
|
|
— |
|
|
|
— |
|
|
|
— |
|
|
|
|
$ |
352,052 |
|
|
|
100.0 |
|
% |
|
19 |
|
69
|
|
As of December 31, 2016 |
|
||||||||||
|
Credit Category (dollars in thousands) |
|
Fair Value |
|
|
Percentage of Total Debt Investments |
|
|
Number of Portfolio Companies |
|
|||
|
Clear (1) |
|
$ |
129,878 |
|
|
|
36.1 |
|
% |
|
4 |
|
|
White (2) |
|
|
166,908 |
|
|
|
46.4 |
|
|
|
11 |
|
|
Yellow (3) |
|
|
51,014 |
|
|
|
14.2 |
|
|
|
2 |
|
|
Orange (4) |
|
|
12,207 |
|
|
|
3.3 |
|
|
|
2 |
|
|
Red (5) |
|
|
— |
|
|
|
— |
|
|
|
— |
|
|
|
|
$ |
360,007 |
|
|
|
100.0 |
|
% |
|
19 |
|
Results of Operations
Comparison of operating results for the years ended December 31, 2017, December 31, 2016 and December 31, 2015
An important measure of our financial performance is net increase (decrease) in net assets resulting from operations, which includes net investment income (loss), net realized gains (losses) and net unrealized gains (losses). Net investment income (loss) is the difference between our income from interest, dividends, fees and other investment income and our operating expenses including interest on borrowed funds. Net realized gains (losses) on investments are the difference between the proceeds received from dispositions of portfolio investments and their amortized cost. Net unrealized gains (losses) on investments is the net change in the fair value of our investment portfolio.
For the year ended December 31, 2017, our net increase in net assets resulting from operations was approximately $19.2 million, which was comprised of approximately $26.2 million of net investment income and approximately $7.0 million of net realized and unrealized losses. On a per share basis for the year ended December 31, 2017, net investment income was $1.61 per share and the net increase in net assets from operations was $1.18 per share. Our core net investment income for the year ended December 31, 2017 was approximately $26.2 million, or $1.61 per share (please refer to the reconciliation of net investment income to core net investment income below).
For the year ended December 31, 2016, our net increase in net assets resulting from operations was approximately $11.1 million, which was comprised of approximately $23.0 million of net investment income and approximately $11.9 million of net realized and unrealized losses. On a per share basis for the year ended December 31, 2016, net investment income was $1.42 per share and the net increase in net assets from operations was $0.69 per share. Our core net investment income for the year ended December 31, 2016 was approximately $23.0 million, or $1.42 per share (please refer to the reconciliation of net investment income to core net investment income below).
For the year ended December 31, 2015, our net increase in net assets resulting from operations was approximately $15.5 million, which was comprised of approximately $22.0 million of net investment income and approximately $6.4 million of net realized and unrealized losses. On a per share basis for the year ended December 31, 2015, net investment income was $1.46 per share and the net increase in net assets from operations was $1.03 per share. Our core net investment income for the year ended December 31, 2015 was approximately $21.6 million, or $1.44 per share (please refer to the reconciliation of net investment income to core net investment income below).
Investment Income
Total investment income for the year ended December 31, 2017 was approximately $51.5 million as compared to approximately $43.6 million and approximately $42.1 million for the years ended December 31, 2016 and December 31, 2015, respectively.
The increase in investment and other income for the year ended December 31, 2017 compared to the comparable period of 2016 of $7.9 million is primarily related to the acceleration of unamortized fees and other income due to higher prepayment activity between periods. The increase in total investment income for the year ended December 31, 2016 compared to the comparable period of 2015 of $1.5 million is primarily due to the increase in the average portfolio balance in 2016.
For the year ended December 31, 2017, we recognized approximately $1.5 million in other income consisting of approximately $0.5 million due to the termination or expiration of unfunded commitments and approximately $1.0 million from the realization of certain fees paid by portfolio companies and other income related to prepayment activity. For the year ended December 31, 2016, we recognized approximately $1.9 million in other income consisting of approximately $1.7 million due to the termination or expiration of unfunded commitments and approximately $0.2 million from the realization of certain fees paid by portfolio companies and other income. For the year ended December 31, 2015, we recognized approximately $2.2 million in other income consisting of approximately $1.7 million due to the termination or expiration of unfunded commitments and approximately $0.5 million from the realization of certain fees paid by portfolio companies and other income.
70
Total operating expenses consist of base management fee, income incentive fee, capital gains incentive fee, interest expense and amortization of fees, administration agreement expenses, and general and administrative expenses and is summarized in the statement of operations. In determining the base management fee, our Adviser has agreed to exclude the U.S. Treasury bill assets acquired at the end of the applicable quarters in 2017, 2016 and 2015 in the calculation of the gross assets. We anticipate operating expenses will increase over time as our portfolio continues to grow. However, we anticipate operating expenses, as a percentage of totals assets and net assets, will decrease over time as our portfolio and capital base expand. We expect base management and income incentive fees will increase as we grow our asset base and our earnings. Capital gains incentive fee will depend on realized and unrealized gains and losses. Interest expense will increase as we utilize more of the Revolving Credit Facility, and we expect expenses per the administration agreement and general and administrative expenses will increase to meet the additional requirements associated with servicing a larger portfolio.
Total operating expenses for the year ended December 31, 2017 were approximately $25.2 million as compared to approximately $20.6 million for the year ended December 31, 2016 and compared to approximately $20.1 million for the year ended December 31, 2015.
Base management fee totaled approximately $6.3 million, $5.5 million, and $5.4 million for the years ended December 31, 2017, December 31, 2016 and December 31, 2015. Base management fee for the year ended December 31, 2017, as compared to December 31, 2016, increased primarily due to an increase in the average size of our portfolio between periods. Base management fee for the year ended December 31, 2016, as compared to December 31, 2015, increased primarily due to an increase in the average size of our portfolio.
Income incentive fee totaled approximately $5.6 million, $2.8 million, and $4.4 million for the years ended December 31, 2017, December 31, 2016 and December 31, 2015, respectively. The increase in income based fees for the year ended December 31, 2017 from the comparable period in 2016 was primarily due to higher investment income from our investment portfolio driven by higher prepayment activity between periods. The decrease in income based fees for the year ended December 31, 2016 from the comparable period in 2015 was primarily related to the effect of the total return provision under the income component of our incentive fee structure. For the year ended December 31, 2017, our income incentive fee was reduced by $0.7 million due to the total return requirement under the income component of our incentive fee structure, which resulted in an increase of approximately $0.7 million or, $0.05 per share, in net income. For the year ended December 31, 2016, our income incentive fee was reduced by $2.0 million due to the total return requirement under the income component of our incentive fee structure, which resulted in approximately $2.0 million or, $0.12 per share, in net income.
There was no capital gains incentive fee expense calculated for the years ended December 31, 2017 and December 31, 2016. For the year ended December 31, 2015, we reversed previously accrued capital gains incentive fee of approximately $0.3 million.
Interest and fees on our borrowings totaled approximately $9.1 million, $7.9 million and $6.3 million for the years ended December 31, 2017, December 31, 2016 and December 31, 2015, respectively. Interest and fee expense for the year ended December 31, 2017, as compared to December 31, 2016, increased due to a higher weighted average principal balance outstanding between periods related to the issuance of our 2022 Notes, increased use of our Revolving Credit Facility, offset by the redemption of our 6.75% Notes due 2020 (“2020 Notes”) during the year. The increase in weighted average debt outstanding was consistent with the increase in portfolio funding activity. Interest and fee expense for the year ended December 31, 2016, as compared to December 31, 2015, increased due to a higher weighted average principal balance outstanding and higher usage on our Revolving Credit Facility.
Administration agreement and general and administrative expenses totaled approximately $4.3 million, $4.5 million and $4.4 million for the years ended December 31, 2017, December 31, 2016 and December 31, 2015. The decrease for the year ended December 31, 2017, as compared to December 31, 2016 was primarily due to lower overhead allocation between periods. The increase for the year ended December 31, 2016, as compared to December 31, 2015 was primarily due to increased use of professional services.
Net Realized Gains and Losses and Net Unrealized Gains and Losses
During the year ended December 31, 2017, we recognized net realized losses from the sale of investments of approximately $0.2 million, consisting of gross realized gains of $3.4 million from the sale of equity in one portfolio company, offset by gross realized losses of $3.6 million, of which $3.0 million consisted of warrant and equity investment losses related to the acquisition of 5 portfolio companies and $0.6 million related to the reversal of accrued loan modification fees in conjunction with the pay-off of one portfolio company. During the same period, we recognized a realized loss on debt extinguishment of approximately $1.1 million relating to the acceleration of unamortized fees on our 2020 Notes redemption.
During the year ended December 31, 2016, we recognized net realized losses of approximately $20.7 million, which consisted of realized losses on two debt investments of $20.4 million, and net realized losses of $1.5 million on warrant investments, which were offset by realized gains of $1.2 million on warrant and equity investments.
71
During the year ended December 31, 2015, we recognized net realized losses of approximately $0.3 million, which consisted of realized losses on one warrant investment.
Net change in unrealized losses during the year ended December 31, 2017 was approximately $5.8 million, which primarily consisted of the reversal and recognition of previously recorded net unrealized gains of $5.9 million into income or realized gains from nine companies, offset by $0.1 million of net unrealized gains on the investment portfolio related to mark to market activity.
Net change in unrealized gains of approximately $8.8 million during the year ended December 31, 2016 consisted of $5.1 million related to the reversal and recognition of unrealized losses into realized losses and $3.7 million of net unrealized appreciation related to mark to market activity on the investment portfolio. Net change in unrealized losses of approximately $6.1 million during the year ended December 31, 2015 consisted of $0.1 million related to the reversal and recognition of unrealized losses into realized losses, offset by $6.2 million of net unrealized depreciation related to mark to market activity on the investment portfolio.
Net change in realized and unrealized gains or losses in subsequent periods may be volatile as it depends on changes in the market, changes in the underlying performance of our portfolio companies and their respective industries, and other market factors.
The table below presents our statement of operations for the years ended December 31, 2017, December 31, 2016 and December 31, 2015.
|
Net Increase in Net Assets |
|
For the Year Ended December 31, |
|
|||||||||
|
(in thousands, except per share amounts) |
|
2017 |
|
|
2016 |
|
|
2015 |
|
|||
|
Investment and Other Income |
|
|
|
|
|
|
|
|
|
|
|
|
|
Interest income from investments |
|
$ |
50,035 |
|
|
$ |
41,767 |
|
|
$ |
39,904 |
|
|
Other income |
|
|
|
|
|
|
|
|
|
|
|
|
|
Expirations / terminations of unfunded commitments |
|
|
458 |
|
|
|
1,657 |
|
|
|
1,741 |
|
|
Other fees |
|
|
1,017 |
|
|
|
211 |
|
|
|
441 |
|
|
Total Investment and Other Income |
|
|
51,510 |
|
|
|
43,635 |
|
|
|
42,086 |
|
|
|
|
|
|
|
|
|
|
|
|
|
|
|
|
Operating Expenses |
|
|
|
|
|
|
|
|
|
|
|
|
|
Base management fee |
|
|
6,268 |
|
|
|
5,525 |
|
|
|
5,428 |
|
|
Income incentive fee |
|
|
5,614 |
|
|
|
2,775 |
|
|
|
4,360 |
|
|
Capital gains incentive fee |
|
|
— |
|
|
|
— |
|
|
|
(296 |
) |
|
Interest expense and amortization of fees |
|
|
9,061 |
|
|
|
7,859 |
|
|
|
6,285 |
|
|
Administration agreement expenses |
|
|
1,404 |
|
|
|
1,552 |
|
|
|
1,517 |
|
|
General and administrative expenses |
|
|
2,897 |
|
|
|
2,913 |
|
|
|
2,833 |
|
|
Total Operating Expenses |
|
|
25,244 |
|
|
|
20,624 |
|
|
|
20,127 |
|
|
|
|
|
|
|
|
|
|
|
|
|
|
|
|
Net investment income |
|
|
26,266 |
|
|
|
23,011 |
|
|
|
21,959 |
|
|
|
|
|
|
|
|
|
|
|
|
|
|
|
|
Net realized and unrealized gains (losses) |
|
|
|
|
|
|
|
|
|
|
|
|
|
Net realized (losses) on investments |
|
|
(164 |
) |
|
|
(20,718 |
) |
|
|
(317 |
) |
|
Net change in unrealized (losses) gains on investments |
|
|
(5,763 |
) |
|
|
8,833 |
|
|
|
(6,121 |
) |
|
Net realized loss on extinguishment of debt |
|
|
(1,112 |
) |
|
|
— |
|
|
|
— |
|
|
Net realized and unrealized gains (losses) |
|
|
(7,039 |
) |
|
|
(11,885 |
) |
|
|
(6,438 |
) |
|
|
|
|
|
|
|
|
|
|
|
|
|
|
|
Net Increase (Decrease) in Net Assets Resulting from Operations |
|
$ |
19,227 |
|
|
$ |
11,126 |
|
|
$ |
15,521 |
|
|
|
|
|
|
|
|
|
|
|
|
|
|
|
|
Net investment income per share |
|
$ |
1.61 |
|
|
$ |
1.42 |
|
|
$ |
1.46 |
|
|
Net increase (decrease) in net assets per share |
|
$ |
1.18 |
|
|
$ |
0.69 |
|
|
$ |
1.03 |
|
|
Core net investment income per share |
|
$ |
1.61 |
|
|
$ |
1.42 |
|
|
$ |
1.44 |
|
|
Weighted average shares of common stock outstanding |
|
|
16,324 |
|
|
|
16,160 |
|
|
|
15,041 |
|
72
The table below reconciles generally accepted accounting principles in the United States of America ("GAAP”) net income to core net investment income for the years ended December 31, 2017, December 31, 2016 and December 31, 2015.
|
Net Investment Income and Core Net Investment Income |
|
For the Year Ended December 31, |
|
|||||||||
|
(in thousands, except per share amounts) |
|
2017 |
|
|
2016 |
|
|
2015 |
|
|||
|
Net Investment Income |
|
$ |
26,266 |
|
|
$ |
23,011 |
|
|
$ |
21,959 |
|
|
Capital gains incentive fee |
|
|
— |
|
|
|
— |
|
|
|
(296 |
) |
|
Core Net Investment Income |
|
$ |
26,266 |
|
|
$ |
23,011 |
|
|
$ |
21,663 |
|
|
|
|
|
|
|
|
|
|
|
|
|
|
|
|
Net Investment Income per Share |
|
$ |
1.61 |
|
|
$ |
1.42 |
|
|
$ |
1.46 |
|
|
Capital gains incentive fee per share |
|
|
— |
|
|
|
— |
|
|
|
(0.02 |
) |
|
Core Net Investment Income per Share |
|
$ |
1.61 |
|
|
$ |
1.42 |
|
|
$ |
1.44 |
|
We believe an important measure of the investment income that we will be required to distribute each year is core net investment income, to the extent it is divergent from GAAP net investment income. Core net investment income, unlike GAAP net investment income, excludes accrued, but as yet unearned, capital gains incentive fees on net unrealized gains. Specifically, the capital gains component of the incentive fee is paid at the end of each calendar year and is 20.0% of our aggregate cumulative realized capital gains from commencement of operations through the end of the year, computed net of our aggregate cumulative realized capital losses and our aggregate cumulative unrealized losses through the end of such year. For the foregoing purpose, our “aggregate cumulative realized capital gains” does not include any unrealized gains. The capital gains component of the incentive fee is not subject to any minimum return to stockholders. No capital gains incentive fee was earned or was payable during the years ended December 31, 2017 and December 31, 2016. Therefore, GAAP net investment income and core net investment income were the same during the respective periods. For the year ended December 31, 2015, we reversed previously accrued capital gains incentive fee of approximately $0.3 million.
Portfolio Yield and Total Return
Investment income includes interest income on our debt investments utilizing the effective yield method including cash interest income as well as the amortization of any purchase premium, accretion of purchase discount, OID, facilities fees, and the amortization and payment of the end-of-term payments. For the years ended December 31, 2017, December 31, 2016 and December 31, 2015 interest income totaled approximately $50.0 million, $41.8 million and $39.9 million, respectively, representing a weighted average annualized portfolio yield on debt investments for the period held of approximately 16.4%, 14.4% and 17.0%, respectively.
We calculate weighted average annualized portfolio yields for periods shown as the annualized rates of the interest income recognized during the period divided by the average amortized cost of debt investments in the portfolio at the beginning of each month in the period. The weighted average yields reported for these periods are annualized and reflect the weighted average yields to maturities. Should the portfolio companies choose to repay their loans earlier, our weighted average yields will increase for those debt investments affected but may reduce our weighted average yields on the remaining portfolio in future quarters.
The yield on our portfolio, excluding the impact of prepayments, was approximately 13.2%, 13.7% and 15.4%, respectively, for the years ended December 31, 2017, December 31, 2016 and December 31, 2015.
The following table provides the weighted average annualized portfolio yield on our portfolio comprising of cash interest income, accretion of the net purchase discount, facilities fees and the value of warrant investments received, accretion of end of term payments and the accelerated receipt of end of term payments on prepayments.
|
Returns on Net Asset Value and Total Assets |
|
For the Year Ended December 31, |
|
|||||||||
|
|
2017 |
|
|
2016 |
|
|
2015 |
|
||||
|
Weighted average annualized portfolio yield on debt investments |
|
|
16.4 |
% |
|
|
14.4 |
% |
|
|
17.0 |
% |
|
Coupon income |
|
|
10.4 |
% |
|
|
10.4 |
% |
|
|
10.6 |
% |
|
Accretion of discount |
|
|
0.8 |
% |
|
|
0.8 |
% |
|
|
0.8 |
% |
|
Accretion of end-of-term payments |
|
|
2.0 |
% |
|
|
2.5 |
% |
|
|
4.0 |
% |
|
Impact of prepayments during the period |
|
|
3.2 |
% |
|
|
0.7 |
% |
|
|
1.6 |
% |
______________
|
(1) |
The yields for periods shown are the annualized rates of interest income or the components of interest income recognized during the period divided by the average amortized cost of debt investments in the portfolio at the beginning of each month in the period. |
73
Our weighted average annualized portfolio yield on debt investments may be higher than an investor’s yield on an investment in shares of our common stock. Our weighted average annualized portfolio yield on debt investments does not reflect operating expenses that may be incurred by us. In addition, our weighted average annualized portfolio yield on debt investments and total return figures disclosed above do not consider the effect of any sales commissions or charges that may be incurred in connection with the sale of shares of our common stock. Our weighted average annualized portfolio yield on debt investments and total return based on NAV do not represent actual investment returns to stockholders. Our weighted average annualized portfolio yield on debt investments and total return figures are subject to change and, in the future, may be greater or less than the rates set forth above. Total return based on NAV is the change in ending NAV per share plus distributions per share paid during the period assuming participation in the Company’s dividend reinvestment plan divided by the beginning NAV per share. Total return based on stock price is the change in the ending stock price of the Company’s common stock plus distributions paid during the period assuming participation in the Company’s dividend reinvestment plan divided by the beginning stock price of the Company’s common stock. The total return is for the period shown and is not annualized.
For the year ended December 31, 2017, our total return per period based on the change in NAV plus distributions reinvested as of the distribution date per share was 9.6% and our total return per period based on the change in stock price plus distributions reinvested as of the distribution date was 20.4%. For the year ended December 31, 2016, our total return per period based on the change in NAV plus distributions reinvested as of the distribution date per share was 8.9% and our total return per period based on the change in stock price plus distributions reinvested as of the distribution date was 12.9%. For the year ended December 31, 2015, our total return per period based on the change in NAV plus distributions reinvested as of the distribution date per share was 9.5% and our total return per period based on the change in stock price plus distributions reinvested as of the distribution date was (9.4)%.
The table below summarizes our return on average total assets and return on average NAV for the years ended December 31, 2017, December 31, 2016 and December 31, 2015.
|
Returns on Net Asset Value and Total Assets |
|
For the Year Ended December 31, |
|
|||||||||
|
(dollars in thousands) |
|
2017 |
|
|
2016 |
|
|
2015 |
|
|||
|
Net investment income |
|
$ |
26,266 |
|
|
$ |
23,011 |
|
|
$ |
21,959 |
|
|
Net increase (decrease) in net assets |
|
|
19,227 |
|
|
|
11,126 |
|
|
|
15,521 |
|
|
|
|
|
|
|
|
|
|
|
|
|
|
|
|
Average net asset value (1) |
|
|
219,457 |
|
|
|
218,881 |
|
|
|
218,623 |
|
|
Average total assets (1) |
|
|
356,324 |
|
|
|
327,798 |
|
|
|
305,118 |
|
|
|
|
|
|
|
|
|
|
|
|
|
|
|
|
Net investment income to average net asset value (2) |
|
|
12.0 |
% |
|
|
10.5 |
% |
|
|
10.0 |
% |
|
Net increase (decrease) in net assets to average net asset value (2) |
|
|
8.8 |
% |
|
|
5.1 |
% |
|
|
7.1 |
% |
|
|
|
|
|
|
|
|
|
|
|
|
|
|
|
Net investment income to average total assets (2) |
|
|
7.4 |
% |
|
|
7.0 |
% |
|
|
7.2 |
% |
|
Net increase (decrease) in net assets to average total assets (2) |
|
|
5.4 |
% |
|
|
3.4 |
% |
|
|
5.1 |
% |
_______________
|
(1) |
The average net asset values and the average total assets are computed based on daily balances. |
|
(2) |
Percentage is presented on an annualized basis. |
Critical Accounting Policies
The preparation of our financial statements in accordance with GAAP requires us to make estimates and assumptions that affect the reported amounts of assets, liabilities, revenues and expenses. Changes in the economic environment, financial markets and any other parameters used in determining such estimates could cause actual results to differ. In addition to the discussion below, we describe our critical accounting policies in the notes to our consolidated financial statements included elsewhere in this annual report on Form 10-K.
Valuation of Investments
We measure the value of our investments at fair value in accordance with Accounting Standards Codification Topic 820, Fair Value Measurements and Disclosure, or “ASC Topic 820,” issued by the Financial Accounting Standards Board, or “FASB.” Fair value is the price that would be received to sell an asset or paid to transfer a liability in an orderly transaction between market participants at the measurement date.
74
The Valuation Committee of the Board is responsible for assisting the Board in valuing investments that are not publicly traded or for which current market values are not readily available. Investments for which market quotations are readily available are valued using market quotations, which are generally obtained from independent pricing services, broker-dealers or market makers. With respect to portfolio investments for which market quotations are not readily available, the Board, with the assistance of the Adviser and its senior investment team and independent valuation agents, is responsible for determining, in good faith, the fair value in accordance with the valuation policy approved by the Board. If more than one valuation method is used to measure fair value, the results are evaluated and weighted, as appropriate, considering the reasonableness of the range indicated by those results. The Adviser considers a range of fair values based upon the valuation techniques utilized and selects a value within that range that most represents fair value based on current market conditions as well as other factors the Adviser’s senior investment team considers relevant. The Board makes this fair value determination on at least a quarterly basis or at such other times when the Board feels it would be appropriate to do so given the circumstances. A determination of fair value involves subjective judgments and estimates and depends on the facts and circumstances. Due to the inherent uncertainty of determining the fair value of portfolio investments that do not have a readily available market value, the fair value of the investments may differ significantly from the values that would have been used had a readily available market value existed for such investments, and the differences could be material.
ASC Topic 820 specifies a hierarchy of valuation techniques based on whether the inputs to those valuation techniques are observable or unobservable. ASC Topic 820 also provides guidance regarding a fair value hierarchy, which prioritizes information used to measure fair value and the effect of fair value measurements on earnings and provides for enhanced disclosures determined by the level within the hierarchy of information used in the valuation. In accordance with ASC Topic 820, these inputs are summarized in the three levels listed below.
Level 1—Valuations are based on quoted prices in active markets for identical assets or liabilities that are accessible at the measurement date.
Level 2—Valuations are based on quoted prices in markets that are not active or for which all significant inputs are observable, either directly or indirectly and model-based valuation techniques for which all significant inputs are observable.
Level 3—Valuations are based on inputs that are unobservable and significant to the overall fair value measurement. Level 3 assets and liabilities include financial instruments whose value is determined using pricing models incorporating significant unobservable inputs, such as discounted cash flow models and other similar valuations techniques. The valuation of Level 3 assets and liabilities generally requires significant management judgment due to the inability to observe inputs to valuation.
In certain cases, the inputs used to measure fair value may fall into different levels of the fair value hierarchy. In such cases, an investment’s level within the fair value hierarchy is based on the lowest level of observable input that is significant to the fair value measurement. The assessment of the significance of a particular input to the fair value measurement in its entirety requires judgment, and it considers factors specific to the investment.
Under ASC 820, the fair value measurement also assumes that the transaction to sell an asset occurs in the principal market for the asset or, in the absence of a principal market, the most advantageous market for the asset, which may be a hypothetical market, and excludes transaction costs. The principal market for any asset is the market with the greatest volume and level of activity for such asset in which the reporting entity would or could sell or transfer the asset. In determining the principal market for an asset or liability, it is assumed that the reporting entity has access to such market as of the measurement date. Market participants are defined as buyers and sellers in the principal or most advantageous market that are independent, knowledgeable and willing and able to transact.
With respect to investments for which market quotations are not readily available, the Board undertakes a multi-step valuation process each quarter, as described below:
|
|
• |
The quarterly valuation process begins with each portfolio company or investment being initially valued by the Adviser’s professionals that are responsible for the portfolio investment; |
|
|
• |
Preliminary valuation conclusions are then documented and discussed with the Adviser’s senior investment team; |
|
|
• |
At least once annually, the valuation for each non-deminimis (greater than 1% of gross assets) portfolio investment will be reviewed by an independent valuation firm; |
|
|
• |
The Valuation Committee then reviews these preliminary valuations and makes fair value recommendations to the Board; and |
|
|
• |
The Board then discusses valuations and determines, in good faith, the fair value of each investment in our portfolio based on the input of the Adviser, the respective independent valuation firms and the Valuation Committee. |
75
The debt investments identified on the consolidated schedule of investments are loans and equipment financings made to venture growth stage companies focused in technology, life sciences and other high growth industries that are backed by a select group of leading venture capital investors. These investments are considered Level 3 assets under ASC Topic 820 because there is no known or accessible market or market indices for these types of debt instruments and thus the Adviser’s senior management team must estimate the fair value of these investment securities based on models utilizing unobservable inputs.
To estimate the fair value of debt investments, we compare the cost basis of each debt investment, which includes OID, to the resulting fair value determined using a discounted cash flow model, unless another model is more appropriate based on the circumstances at the measurement date. The discounted cash flow approach entails analyzing the interest rate spreads for recently completed financing transactions that are similar in nature to these debt investments, in order to determine a comparable range of effective market interest rates. The range of interest rate spreads utilized is based on borrowers with similar credit profiles. All remaining expected cash flows of the investment are discounted using this range of interest rates to determine a range of fair values for the debt investment.
This valuation process includes, among other things, evaluating the underlying investment performance and the portfolio company’s current financial condition and ability to raise additional capital, as well as macro-economic events that may impact valuations. These events include, but are not limited to, current market yields and interest rate spreads of similar securities as of the measurement date. Changes in these unobservable inputs could result in significantly different fair value measurements.
Under certain circumstances, an alternative technique may be used to value certain debt investments that better reflected the fair value of the investment, such as the price paid or realized in a recently completed transaction or a binding offer received in an arm’s length transaction, the use of multiple probability weighted cash flow models when the expected future cash flows contain elements of variability or estimates of proceeds that would be received in a liquidation scenario.
Warrant Investments
The fair value of the warrant investments is primarily estimated using a Black Scholes option pricing model. Privately held warrant investments and equity-related securities are valued based on an analysis of various factors, but not limited to, the following:
|
|
• |
Underlying enterprise value of the issuer is estimated based on information available, including any information regarding the most recent rounds of borrower funding. Valuation techniques to determine enterprise value include market multiple approaches, income approaches or approaches that utilize recent rounds of financing and the portfolio company’s capital structure to determine enterprise value. Valuation techniques are also utilized to allocate the enterprise fair value of a portfolio company to the specific class of common or preferred stock exercisable in the warrant. Such techniques take into account the rights and preferences of the portfolio company’s securities, expected exit scenarios, and volatility associated with such outcomes to allocate the fair value to the specific class of stock held in the portfolio. Such techniques included option pricing models, including back solve techniques, probability weighted expected return models and other techniques as determined to be appropriate. |
|
|
• |
Volatility, or the amount of uncertainty or risk about the size of the changes in the warrant investment price, is based on comparable publicly traded companies within indices similar in nature to the underlying company issuing the warrant. Increases (decreases) in this unobservable input could result in a significantly higher (lower) fair value. |
|
|
• |
The risk-free interest rates are derived from the U.S. Treasury yield curve. The risk-free interest rates are calculated based on a weighted average of the risk-free interest rates that correspond closest to the expected remaining life of the warrant. Increases (decreases) in this unobservable input could result in a significantly higher (lower) fair value. |
|
|
• |
Other adjustments, including a marketability discount on private company warrant investments, are estimated based on the Adviser’s judgment about the general industry environment. Changes in this unobservable input could result in a significantly different fair value. |
|
|
• |
Historical portfolio experience on cancellations and exercises of warrant investments are utilized as the basis for determining the estimated life of the warrant investment in each financial reporting period. Warrant investments may be exercised in the event of acquisitions, mergers or initial public offerings, and cancelled due to events such as bankruptcies, restructuring activities or additional financings. These events cause the expected remaining life assumption to be shorter than the contractual term of the warrant investment. Increases (decreases) in this unobservable input could result in a significantly higher (lower) fair value. |
76
Under certain circumstances alternative techniques may be used to value certain warrant investments that better reflect the warrant investments’ fair values, such as an expected settlement of a warrant investment in the near term, a model that incorporates a put feature associated with the warrant, or the price paid or realized in a recently completed transaction or binding offer received in an arm’s length transaction. The fair value may be determined based on the expected proceeds to be received from such settlement or based on the net present value of the expected proceeds from the put option.
These valuation methodologies involve a significant degree of judgment. There is no single standard for determining the estimated fair value of investments which do not have an active public market. Valuations of privately held investments are inherently uncertain, as they are based on estimates, and their values may fluctuate over time. The determination of fair value may differ materially from the values that would have been used if an active market for these investments existed. In some cases, the fair value of such investments is best expressed as a range of values derived utilizing different methodologies from which a single estimate may then be determined.
Equity Investments
The fair value of an equity investment in a privately held company is initially the amount invested. We adjust the fair value of equity investments in private companies upon the completion of a new third party round of equity financing subsequent to its investment. We may make adjustments to fair value, absent a new equity financing event, based upon positive or negative changes in a portfolio company’s financial or operational performance. We may also reference comparable transactions and/or secondary market transactions of comparable companies to estimate fair value. These valuation methodologies involve a significant degree of judgment. The fair value of an equity investment in a publicly traded company is based upon the closing public share price on the date of measurement. These assets are recorded at fair value on a recurring basis. There is no single standard for determining the estimated fair value of investments that do not have an active public market. Valuations of privately held investments are inherently uncertain, as they are based on estimates, and their values may fluctuate over time. The determination of fair value may differ materially from the values that would have been used if an active market for these investments existed. In some cases, the fair value of such investments is best expressed as a range of values derived utilizing different methodologies from which a single estimate may then be determined.
Income Recognition
Interest income, adjusted for amortization of market premium and accretion of market discount, is recorded on an accrual basis to the extent that we expect to collect such amounts. OID, principally representing the estimated fair value of detachable equity or warrant investments obtained in conjunction with our debt investments, and market discount or premium are capitalized and accreted or amortized into interest income over the life of the respective security using the effective interest method. Loan origination fees received in connection with the closing of investments are reported as unearned income which is included as amortized cost of the investment; the unearned income from such fees is accreted over the contractual life of the loan based on the effective interest method as interest income. Upon prepayment of a loan or debt security, unamortized loan origination fees and unamortized market discounts are recorded as interest income. End-of-term payments are contractual and fixed interest payments due in cash at the maturity date of the loan, including upon prepayment, and are a fixed percentage of the original principal balance of the loan unless otherwise noted. Interest is accrued during the life of the loan on the end-of-term payment using the effective interest method as non-cash income. The EOT payment generally ceases accruing to the extent the borrower is unable to pay the remaining principal and interest due. The EOT payment may also include a cash success fee due upon the earlier of the maturity date of the loans or in the event of a certain milestone reached by the portfolio company.
For debt investments with contractual PIK interest, which represents contractual interest accrued and added to the principal balance that generally becomes due at maturity, we do not accrue PIK interest if it is deemed uncollectible.
Other income includes certain fees paid by portfolio companies (for example, extension fees, revolver loan facility fees, prepayment fees) and the recognition of the value of unfunded commitments that expired during the reporting period.
Realized/Unrealized Gains or Losses
We measure realized gains or losses from the repayment or sale of investments using the specific identification method. The amortized cost basis of investments represents the original cost adjusted for the accretion/amortization of discounts and premiums and upfront loan origination fees. We report changes in fair value of investments that are measured at fair value as a component of net change in unrealized gain (loss) on investments in the consolidated statements of operations.
77
We have elected to be treated, and intend to qualify annually, as a RIC under Subchapter M the Code, for U.S. federal income tax purposes, beginning with our taxable year ending December 31, 2014. Generally, a RIC is not subject to U.S. federal income taxes on the income and gains it distributes to stockholders if it distributes at least 90% of its net ordinary income and net short-term capital gains in excess of its net long-term capital losses, if any. Additionally, a RIC must distribute at least 98% of its ordinary income and 98.2% of its capital gain net income on an annual basis and any net ordinary income and net capital gains for preceding years that were not distributed during such years and on which the RIC previously paid no U.S. federal income tax to avoid a U.S. federal excise tax. We intend to distribute sufficient dividends to maintain our RIC status each year and do not anticipate paying any material U.S. federal income taxes in the future.
Liquidity and Capital Resources
During the year ended December 31, 2017, cash provided by operating activities, consisting primarily of purchases, sales and repayments of investments and the items described in “Results of Operations,” was approximately $25.1 million and cash used by financing activities was approximately $30.5 million due to repayments under the Revolving Credit Facility of $48.0 million, approximately $22.6 million in distributions, $54.6 million due to the redemption of the 2020 Notes, $72.2 million of net proceeds from the issuance of the 2022 Notes, and $22.5 million in net proceeds from the issuance of common stock. As of December 31, 2017, cash, including restricted cash, was approximately $10.0 million.
During the year ended December 31, 2016, cash used by operating activities, consisting primarily of purchases, sales and repayments of investments and the items described in “Results of Operations,” was approximately $92.0 million and cash provided by financing activities was approximately $69.0 million due to borrowings under the Revolving Credit Facility of $97.0 million, approximately $5.4 million in repurchases of common stock, approximately $21.5 million in distributions, and approximately $1.1 million of deferred credit facility costs. As of December 31, 2016, cash, including restricted cash, was approximately $15.5 million.
As a BDC, we generally have an ongoing need to raise additional capital for investment purposes. As a result, we expect, from time to time, to access the debt and equity markets when we believe it is necessary and appropriate to do so. In this regard, we continue to explore various options for obtaining additional debt or equity capital for investments. This may include expanding or extending the Revolving Credit Facility, or the issuance of additional shares of our common stock or debt securities. If we are unable to obtain leverage or raise equity capital on terms that are acceptable to us, our ability to grow our portfolio could be substantially impacted.
Contractual Obligations
In February 2014, we entered into our Revolving Credit Facility which provided us with a $150.0 million commitment, subject to borrowing base requirements. In August 2014, we amended our Revolving Credit Facility to increase the total commitments available thereunder by $50.0 million to $200.0 million in aggregate. In January 2016, we amended and renewed our Revolving Credit Facility which included a reduction in the applicable margin from 3.50% to 3.00%. In January 2018, we amended and renewed our Revolving Credit Facility to increase the total commitments available by $10.0 million to $210.0 million which includes a reduction in the undrawn rate from 0.75% to 0.50% and a reduction in the applicable margin during the revolving period to 2.80% if facility utilization is greater than or equal to 75%, 2.90% if utilization is greater than or equal to 50%, and 3.00% if utilization is less than 50%.
As of December 31, 2017 and December 31, 2016, we had outstanding borrowings of $67.0 million and $115.0 million, respectively, under our Revolving Credit Facility, which is included in the consolidated statements of assets and liabilities. We had $133.0 million and $85.0 million of remaining capacity on our Revolving Credit Facility as of December 31, 2017 and December 31, 2016, respectively.
On August 4, 2015, we completed a public offering of $50.0 million in aggregate principal amount of our 2020 Notes and received net proceeds of $48.3 million after the payment of fees and offering costs. On September 2, 2015, we issued an additional $4.6 million in aggregate principal amount of our 2020 Notes and received net proceeds of approximately $4.5 million, after the payment of the underwriting sales load and offering costs, as a result of the underwriters’ partial exercise of their option to purchase additional 2020 Notes. On July 14, 2017, we elected to exercise our option to redeem, in full, the 2020 Notes. On August 13, 2017, we redeemed all of the issued and outstanding 2020 Notes in an aggregate principal amount of $54.6 million and paid an aggregate accrued interest of approximately $0.3 million. The 2020 Notes have been delisted on the NYSE effective August 15, 2017.
On July 14, 2017, we completed a public offering of $65.0 million in aggregate principal amount of our newly issued 2022 Notes and received net proceeds of approximately $62.8 million after the payment of fees and offering costs. On July 24, 2017, as a result of the underwriters’ full exercise of their option to purchase additional 2022 Notes, we issued an additional $9.75 million in aggregate principal amount of the 2022 Notes and received net proceeds of approximately $9.5 million after the payment of fees and offering costs. The interest on the 2022 Notes is payable quarterly on January 15, April 15, July 15 and October 15, beginning October 15, 2017.
78
The table below provides a summary of when payments are due under our Revolving Credit Facility, 2022 Notes and 2020 Notes as of December 31, 2017 and December 31, 2016.
|
Payments Due By Period |
|
As of December 31, 2017 |
|
|||||||||||||||||
|
(in thousands) |
|
Total |
|
|
Less than 1 year |
|
|
1-3 years |
|
|
3-5 years |
|
|
More than 5 years |
|
|||||
|
Revolving Credit Facility |
|
$ |
67,000 |
|
|
$ |
— |
|
|
$ |
67,000 |
|
|
$ |
— |
|
|
$ |
— |
|
|
2022 Notes |
|
|
74,750 |
|
|
|
— |
|
|
|
— |
|
|
|
74,750 |
|
|
|
— |
|
|
Total |
|
$ |
141,750 |
|
|
$ |
— |
|
|
$ |
67,000 |
|
|
$ |
74,750 |
|
|
$ |
— |
|
|
Payments Due By Period |
|
As of December 31, 2016 |
|
|||||||||||||||||
|
(in thousands) |
|
Total |
|
|
Less than 1 year |
|
|
1-3 years |
|
|
3-5 years |
|
|
More than 5 years |
|
|||||
|
Revolving Credit Facility |
|
$ |
115,000 |
|
|
$ |
— |
|
|
$ |
115,000 |
|
|
$ |
— |
|
|
$ |
— |
|
|
2020 Notes |
|
|
54,625 |
|
|
|
— |
|
|
|
— |
|
|
|
54,625 |
|
|
|
— |
|
|
Total |
|
$ |
169,625 |
|
|
$ |
— |
|
|
$ |
115,000 |
|
|
$ |
54,625 |
|
|
$ |
— |
|
We are a party to certain delay draw credit agreements with our portfolio companies, which require us to make future advances at the companies’ discretion during a defined loan availability period. Our credit agreements contain customary lending provisions that allow us relief from funding obligations for previously made commitments in instances where the underlying company experiences materially adverse events that affect the financial condition or business outlook for the company. As of December 31, 2017 and December 31, 2016, our unfunded commitments totaled approximately $100.1 million to ten portfolio companies and $117.4 million to nine portfolio companies, respectively. See “-Investment Activity” above for additional information on our unfunded commitments.
Since these commitments may expire without being drawn upon, unfunded commitments do not necessarily represent future cash requirements or future earning assets for us. Over time, we generally expect approximately 65% - 75% of our gross unfunded commitments to be drawn before the expiration of their corresponding availability periods. We evaluate funding needs and expectations for each company at the time of commitment and as the company progresses and develops during the availability period.
As of December 31, 2017, we had a payable of approximately $125.0 million in face value due January 3, 2018, for the acquisition of U.S. Treasury bills. On January 3, 2018, we sold the U.S. Treasury bills and settled the payable in full. As of December 31, 2016, we had a payable of approximately $40.0 million in face value due January 4, 2017, for the acquisition of U.S. Treasury bills. On January 4, 2017, we sold the U.S. Treasury bills and settled the payable in full.
In addition to the contractual obligations set forth above, we have certain obligations with respect to the investment advisory and administration services we received. As of December 31, 2017 and December 31, 2016, these outstanding obligations totaled approximately $2.8 million and $3.0 million, respectively.
Off-Balance Sheet Arrangements
Commitments
We are a party to financial instruments with off-balance sheet risk in the normal course of business to meet the financial needs of our portfolio companies. As of December 31, 2017 and December 31, 2016, our off-balance sheet arrangements consisted of approximately, $100.1 million and $117.4 million, respectively, of unfunded commitments, of which $18.0 million and $60.0 million, respectively, was dependent upon the portfolio companies reaching certain milestones before the debt commitment becomes available to them. Our credit agreements with our portfolio companies contain customary lending provisions that allow us relief from funding obligations for previously made commitments in instances where the underlying portfolio company experiences materially adverse events that affect the financial condition or business outlook for the portfolio company.
79
The table below provides our unfunded commitments by customer as of December 31, 2017 and December 31, 2016.
|
Unfunded Commitments for Growth Capital Loans (unless otherwise noted)* (in thousands) |
|
As of December 31, 2017 |
|
|
As of December 31, 2016 |
|
||
|
CrowdStrike,Inc. |
|
|
— |
|
|
|
5,000 |
|
|
Eero, Inc. |
|
|
5,000 |
|
|
|
15,000 |
|
|
FabFitFun, Inc. |
|
|
10,000 |
|
|
|
— |
|
|
Farfetch UK Limited |
|
|
— |
|
|
|
5,000 |
|
|
FinancialForce.com,Inc. |
|
|
— |
|
|
|
15,000 |
|
|
Green Chef Corporation |
|
|
— |
|
|
|
10,000 |
|
|
Innovid, Inc. |
|
|
3,000 |
|
|
|
— |
|
|
MapR Technologies, Inc. (Equipment Lease) |
|
|
1,721 |
|
|
|
4,352 |
|
|
Optoro, Inc. |
|
|
— |
|
|
|
25,000 |
|
|
Outfittery GMBH |
|
|
2,376 |
|
|
|
— |
|
|
PillPack, Inc. |
|
|
30,000 |
|
|
|
— |
|
|
Rent the Runway, Inc. |
|
|
15,000 |
|
|
|
28,000 |
|
|
RetailNext, Inc. |
|
|
3,000 |
|
|
|
— |
|
|
Stance, Inc. |
|
|
15,000 |
|
|
|
— |
|
|
Varsity Tutors LLC |
|
|
15,000 |
|
|
|
— |
|
|
WorldRemit Ltd. |
|
|
— |
|
|
|
10,000 |
|
|
Total |
|
$ |
100,097 |
|
|
$ |
117,352 |
|
_______________
*Does not include backlog of potential future commitments. Refer to “Investment Activity” above.
Distributions
We have elected to be treated, and intend to qualify annually, as a RIC under the Code, beginning with our taxable year ended December 31, 2014. To obtain and maintain RIC tax treatment, we must distribute at least 90% of our net ordinary income and net realized short-term capital gains in excess of our net realized long-term capital losses, if any, to our stockholders. In order to avoid a non-deductible 4% U.S. federal excise tax on certain of our undistributed income, we would need to distribute during each calendar year an amount at least equal to the sum of: (a) 98% of our ordinary income (not taking into account any capital gains or losses) for such calendar year; (b) 98.2% of the amount by which our capital gains exceed our capital losses (adjusted for certain ordinary losses) for a one-year period ending on October 31 of the calendar year (unless an election is made by us to use our taxable year); and (c) certain undistributed amounts from previous years on which we paid no U.S. federal income tax. For the tax years ended December 31, 2014, 2015 and 2017, we were subject to a 4% U.S. federal excise tax and we may be subject to this tax in future years. In such cases, we will be liable for the tax only on the amount by which we do not meet the foregoing distribution requirement.
To the extent our taxable earnings fall below the total amount of our distributions for the year, a portion of those distributions may be deemed a return of capital to our stockholders. Our Adviser monitors available taxable earnings, including net investment income and realized capital gains, to determine if a return of capital may occur for the year. The tax character of distributions will be determined at the end of the taxable year. Stockholders should read any written disclosure accompanying a dividend payment carefully and should not assume that the source of any distribution is our taxable ordinary income or capital gains. The specific tax characteristics of our distributions will be reported to stockholders after the end of the taxable year.
The following table summarizes our cash distributions per share that have been authorized by our board of directors since our initial public offering. From March 5, 2014 (commencement of operations) to December 31, 2015 and during the year ended December 31, 2017, these distributions represent ordinary income as our earnings exceed distributions. Approximately $1.20 per share of the distributions during the year ended December 31, 2016 represent a return of capital.
80
|
|
Date Announced |
|
Record Date |
|
Payment Date |
|
Per Share Amount |
||||
|
March 31, 2014 |
|
April 3, 2014 |
|
April 15, 2014 |
|
April 30, 2014 |
|
$ |
0.09 |
|
(1) |
|
June 30, 2014 |
|
May 13, 2014 |
|
May 30, 2014 |
|
June 17, 2014 |
|
$ |
0.30 |
|
|
|
September 30, 2014 |
|
August 11, 2014 |
|
August 29, 2014 |
|
September 16, 2014 |
|
$ |
0.32 |
|
|
|
December 31, 2014 |
|
October 27, 2014 |
|
November 28, 2014 |
|
December 16, 2014 |
|
$ |
0.36 |
|
|
|
December 31, 2014 |
|
December 3, 2014 |
|
December 22, 2014 |
|
December 31, 2014 |
|
$ |
0.15 |
|
(2) |
|
March 31, 2015 |
|
March 16, 2015 |
|
March 26, 2015 |
|
April 16, 2015 |
|
$ |
0.36 |
|
|
|
June 30, 2015 |
|
May 6, 2015 |
|
May 29, 2015 |
|
June 16, 2015 |
|
$ |
0.36 |
|
|
|
September 30, 2015 |
|
August 11, 2015 |
|
August 31, 2015 |
|
September 16, 2015 |
|
$ |
0.36 |
|
|
|
December 31, 2015 |
|
November 10, 2015 |
|
November 30, 2015 |
|
December 16, 2015 |
|
$ |
0.36 |
|
|
|
March 31, 2016 |
|
March 14, 2016 |
|
March 31, 2016 |
|
April 15, 2016 |
|
$ |
0.36 |
|
|
|
June 30, 2016 |
|
May 9, 2016 |
|
May 31, 2016 |
|
June 16, 2016 |
|
$ |
0.36 |
|
|
|
September 30, 2016 |
|
August 8, 2016 |
|
August 31, 2016 |
|
September 16, 2016 |
|
$ |
0.36 |
|
|
|
December 31, 2016 |
|
November 7, 2016 |
|
November 30, 2016 |
|
December 16, 2016 |
|
$ |
0.36 |
|
|
|
March 31, 2017 |
|
March 13, 2017 |
|
March 31, 2017 |
|
April 17, 2017 |
|
$ |
0.36 |
|
|
|
June 30, 2017 |
|
May 9, 2017 |
|
May 31, 2017 |
|
June 16, 2017 |
|
$ |
0.36 |
|
|
|
September 30, 2017 |
|
August 8, 2017 |
|
August 31, 2017 |
|
September 15, 2017 |
|
$ |
0.36 |
|
|
|
December 31, 2017 |
|
November 6, 2017 |
|
November 17, 2017 |
|
December 1, 2017 |
|
$ |
0.36 |
|
|
|
Total cash distributions |
|
|
|
|
|
|
|
$ |
5.54 |
|
|
______________
|
|
(1) |
The amount of this initial distribution reflected a quarterly dividend rate of $0.30 per share, prorated for the 27 days for the period from the pricing of our initial public offering on March 5, 2014 (commencement of operations), through March 31, 2014. |
|
|
(2) |
Represents a special distribution. |
For the years ended December 31, 2017, December 31, 2016 and December 31, 2015, distributions paid were comprised of interest-sourced distributions (qualified interest income) in amounts equal to 97.1%, 95.8%, and 95.1% of total distributions paid, respectively.
Related Parties
We have entered into a number of business relationships with affiliated or related parties, including the following:
|
|
• |
We have entered into an investment advisory agreement, dated February 18, 2014, with our Adviser. Certain of our officers are also principals of the Adviser. |
|
|
• |
We have entered into an Administration Agreement, dated February 18, 2014, with our Administrator. Pursuant to the terms of the Administration Agreement, our Administrator provides us with the office facilities and administrative services necessary to conduct our day-to-day operations. Certain of our officers are also principals of the Administrator. |
|
|
• |
We have entered into a license agreement with TPC pursuant to which TPC has agreed to grant us a non-exclusive, royalty-free license to use the name “TriplePoint.” |
In the future, we may co-invest with TPC and/or investment funds, accounts and vehicles managed by TPC where doing so is consistent with our investment strategy as well as applicable law and SEC staff interpretations. We generally are only permitted to co-invest with TPC and/or such investment funds, accounts and vehicles where the only term that is negotiated is price. However, we, TPC and our Adviser have filed an exemptive application with the SEC to permit greater flexibility to negotiate the terms of co-investments with TPC and/or investment funds, accounts and investment vehicles managed by TPC in a manner consistent with our investment objective, positions, policies, strategies and restrictions as well as regulatory requirements and other pertinent factors. On February 28, 2018, the SEC issued a public “notice” with regard to the exemptive application that we filed. Assuming that no requests for a hearing are received by the SEC in response to the notice, we expect the SEC to issue the exemptive order after the notice period expires on March 26, 2018.
We have also adopted a Code of Ethics that applies to our senior officers, including our Chief Executive Officer and Chief Financial Officer, as well as all of our officers, directors and employees. Our Code of Ethics requires that all employees and directors avoid any conflict, or the appearance of a conflict, between an individual’s personal interests and our interests. Pursuant to our Code of Ethics, each employee and director must disclose any conflicts of interest, or actions or relationships that might give rise to a conflict, to our Chief Compliance Officer. Our Audit Committee is charged with approving any waivers under our Code of Business Conduct and Ethics. As required by the NYSE corporate governance listing standards, the Audit Committee of our board of directors (the “Board”) is also required to review and approve any transactions with related parties (as such term is defined in Item 404 of Regulation S-K).
81
Recent Accounting Pronouncements
In May 2014, The FASB issued Accounting Standards Update (“ASU”) 2014-9, “Revenue from Contracts with Customers (Topic 606)” and subsequently issued several amendments to the standard. ASU 2014-9, and related amendments, provide comprehensive guidance for recognizing revenue from contracts with customers. Entities will be able to recognize revenue when the entity transfers promised goods or services to customers in an amount that reflects the consideration to which the entity expects to be entitled to in exchange for those goods or services. The guidance includes a five-step framework that requires an entity to: (i) identify the contract(s) with a customer, (ii) identify the performance obligations in the contract, (iii) determine the transaction price, (iv) allocate the transaction price to the performance obligations in the contract, and (v) recognize revenue when the entity satisfies a performance obligation. The guidance in ASU 2014-9, and the related amendments, is effective on January 1, 2018. We have elected to adopt this ASU on January 1, 2018, which did not have a material impact on our consolidated financial statements.
In October 2016, the SEC adopted new rules and forms and amended other rules to enhance the reporting and disclosure of information by registered investment companies. As part of these changes, the SEC amended Regulation S-X to standardize and enhance disclosures in investment company financial statements. Implementation of the new or amended rules is required for reporting periods ending after August 1, 2017. We have reviewed the requirements and adopted the amendments to Regulation S-X in our consolidated financial statements and related disclosures for the periods presented.
In November 2016, the FASB issued ASU 2016-18, “Statement of Cash Flows (Topic 230): Restricted Cash, a consensus of the FASB Emerging Issues Task Force”, which requires that a statement of cash flows explain the change during the period in the total of cash, cash equivalents, and amounts generally described as restricted cash or restricted cash equivalents. This guidance is effective for annual reporting periods, and the interim periods within those periods, beginning after December 15, 2017 and early adoption is permitted. We have adopted this ASU, which did not have a material impact on our consolidated financial statements. Prior to adoption, we presented the change in restricted cash and cash equivalents separately as a cash flow from operating activity. Upon adoption, we included the restricted cash and cash equivalents in each of the balances of the cash, cash equivalents and restricted cash at the beginning of and end of periods and included the change in restricted cash and cash equivalents as part of the net change in cash, cash equivalents, and restricted cash in our Consolidated Statements of Cash Flows. and retrospectively restated the years ended December 31, 2016 and 2015.
Recent Developments
Dividends
On March 12, 2018, we announced that our Board declared a $0.36 per share regular quarterly dividend, payable on April 6, 2018 to stockholders of record on March 23, 2018.
Recent Portfolio Activity
From January 1, 2018 through March 12, 2018, we closed $85.0 million of additional debt commitments and funded $38.1 million in new investments. TPC’s direct originations platform entered into $100.0 million of additional non-binding signed term sheets with venture growth stage companies, subject to due diligence, definitive documentation and investment committee approval, as well as compliance with TPC’s allocation policy.
Amendment to our Credit Facility
In January 2018, we amended and renewed the Revolving Credit Facility (the “Amended Credit Facility”). Under the Amended Credit Facility, Deutsche Bank AG, New York Branch serves as administrative agent and as a lender together with existing lenders KeyBank National Association and EverBank Commercial Lender Finance, Inc., and new lender MUFG Union Bank, N.A. The Amended Credit Facility, among other things, increased the total commitments by $10.0 million to $210.0 million, extended the revolving period from February 21, 2018 to February 21, 2020, and extended the maturity date from February 21, 2019 to August 21, 2021. In addition, the Amended Credit Facility includes a reduction in the undrawn rate from 0.75% to 0.50% and a reduction in the applicable margin during the revolving period to 2.80% if facility utilization is greater than or equal to 75%, 2.90% if utilization is greater than or equal to 50%, and 3.00% if utilization is less than 50%. Borrowings under the Amended Credit Facility are subject to its various covenants and the leverage restrictions contained in the 1940 Act.
82
SEC Notice of Exemptive Application
On February 28, 2018, the SEC issued a public notice with regard to our exemptive application to permit co-investment with TPC and/or investment funds, accounts and investment vehicles managed by TPC with the exemptive order issuance expected after the notice period expires on March 26, 2018.
We are subject to financial market risks, including changes in interest rates.
Interest Rate Risk
Interest rate sensitivity refers to the change in our earnings and in the relative values of our portfolio that may result from changes in the level of interest rates. Because we fund a portion of our investments with borrowings, our net investment income is affected by the difference between the rate at which we invest and the rate at which we borrow. As a result, there can be no assurance that a change in market interest rates will not have a material adverse effect on our net investment income.
As of December 31, 2017, a majority of the debt investments (approximately 65% and approximately $231.2 million in principal balance) in our debt investment portfolio bore interest at floating rates, all of which have interest rate floors and some of them have interest rate caps for a limited period. In the future, we may increase the amount of loans in our portfolio subject to floating interest rates. Almost all of our unfunded commitments float with changes in the prime rate from the date we enter into the commitment to the date of the actual draw. Our Revolving Credit Facility bears interest at a floating rate. Our 2022 Notes bear interest at a fixed rate. As of December 31, 2017, our floating rate borrowings totaled $67.0 million, so an increase in interest rates would currently benefit us as we would generate additional interest income in excess of the additional interest expense. This is illustrated in the following table which shows the annual impact on net income of base rate changes in interest rates (considering interest rate floors for variable rate instruments) assuming no changes in our investment and borrowing structure from the December 31, 2017 consolidated statement of assets and liabilities.
|
Change in Interest Rates (in thousands) |
|
Increase (decrease) in interest income |
|
(Increase) decrease in interest expense |
|
Net increase (decrease) in net investment income |
||||||
|
Up 300 basis points |
|
$ |
6,058 |
|
|
$ |
(2,038 |
) |
|
$ |
4,020 |
|
|
Up 200 basis points |
|
$ |
4,039 |
|
|
$ |
(1,359 |
) |
|
$ |
2,680 |
|
|
Up 100 basis points |
|
$ |
2,019 |
|
|
$ |
(679 |
) |
|
$ |
1,340 |
|
|
Up 50 basis points |
|
$ |
1,010 |
|
|
$ |
(340 |
) |
|
$ |
670 |
|
|
Down 25 basis points |
|
$ |
(543 |
) |
|
$ |
170 |
|
|
$ |
(373 |
) |
This analysis is indicative of the potential impact on our investment income as of December 31, 2017, assuming an immediate and sustained change in interest rates as noted. It should be noted that we anticipate growth in our portfolio funded in part with additional borrowings and such additional borrowings, all else being equal, will increase our investment income sensitivity to interest rates, and such changes could be material. In addition, this analysis does not adjust for potential changes in our portfolio or our borrowing facilities nor does it take into account any changes in the credit performance of our loans that might occur should interest rates change.
Since it is our intention to hold loans to maturity, the fluctuating relative value of these loans that may occur due to changes in interest rate may have an impact on unrealized gains and losses during quarterly reporting periods. Based on our assessment of the interest rate risk, as of December 31, 2017, we had no hedging transactions in place as we deemed the risk acceptable and we did not believe it was necessary to mitigate this risk at that time.
While hedging activities may mitigate our exposure to adverse fluctuations in interest rates, certain hedging transactions that we may enter into in the future, such as interest rate swap agreements, may also limit our ability to participate in the benefits of lower interest rates with respect to our portfolio investments. In addition, there can be no assurance that we will be able to effectively hedge our interest rate risk.
Substantially all of our assets and liabilities are financial in nature. As a result, changes in interest rates and other factors drive our performance more directly than does inflation. Changes in interest rates do not necessarily correlate with inflation rates or changes in inflation rates.
83
INDEX TO CONSOLIDATED FINANCIAL STATEMENTS
84
REPORT OF INDEPENDENT REGISTERED PUBLIC ACCOUNTING FIRM
To the Board of Directors and Shareholders of
TriplePoint Venture Growth BDC Corp.
Menlo Park, California
Opinion on the Financial Statements and Financial Highlights
We have audited the accompanying consolidated statements of assets and liabilities of TriplePoint Venture Growth BDC Corp. and subsidiaries (the "Company"), including the consolidated schedules of investments, as of December 31, 2017 and 2016, and the related consolidated statements of operations, changes in net assets and cash flows for each of the three years in the period ended December 31, 2017, the consolidated financial highlights for the years ended December 31, 2017, 2016, 2015 and for the period from March 5, 2014 (commencement of operations) to December 31, 2014, and the related notes. In our opinion, the consolidated financial statements and consolidated financial highlights present fairly, in all material respects, the financial position of the Company as of December 31, 2017 and 2016, and the results of its operations, changes in net assets, and cash flows for each of the three years in the period ended December 31, 2017, and the financial highlights for the years ended December 31, 2017, 2016, 2015 and for the period from March 5, 2014 (commencement of operations) to December 31, 2014, in conformity with accounting principles generally accepted in the United States of America.
Basis for Opinion
These financial statements and financial highlights are the responsibility of the Company’s management. Our responsibility is to express an opinion on the Company’s financial statements and financial highlights based on our audits. We are a public accounting firm registered with the PCAOB and are required to be independent with respect to the Company in accordance with the U.S. federal securities laws and the applicable rules and regulations of the Securities and Exchange Commission and the PCAOB.
We conducted our audits in accordance with the standards of the PCAOB. Those standards require that we plan and perform the audit to obtain reasonable assurance about whether the financial statements and financial highlights are free of material misstatement, whether due to error or fraud. The Company is not required to have, nor were we engaged to perform, an audit of its internal control over financial reporting. As part of our audits we are required to obtain an understanding of internal control over financial reporting but not for the purpose of expressing an opinion on the effectiveness of the Company’s internal control over financial reporting. Accordingly, we express no such opinion.
Our audits included performing procedures to assess the risks of material misstatement of the financial statements and financial highlights, whether due to error or fraud, and performing procedures that respond to those risks. Such procedures included examining, on a test basis, evidence regarding the amounts and disclosures in the financial statements and financial highlights. Our audits also included evaluating the accounting principles used and significant estimates made by management, as well as evaluating the overall presentation of the financial statements and financial highlights. Our procedures included confirmation of investments owned as of December 31, 2017 and 2016, by correspondence with the custodian, loan agents, and borrowers; when replies were not received, we performed other auditing procedures. We believe that our audits provide a reasonable basis for our opinion.
/s/ Deloitte & Touche LLP
San Francisco, California
March 12, 2018
We have served as the Company’s auditor since 2013.
85
TRIPLEPOINT VENTURE GROWTH BDC CORP. AND SUBSIDIARIES
CONSOLIDATED STATEMENTS OF ASSETS AND LIABILITIES
(in thousands, except per share data)
|
|
|
December 31, 2017 |
|
|
December 31, 2016 |
|
||
|
|
|
|
|
|
|
|
|
|
|
Assets |
|
|
|
|
|
|
|
|
|
Investments at fair value (amortized cost of $373,669 and $370,116, respectively) |
|
$ |
372,103 |
|
|
$ |
374,311 |
|
|
Short-term investments at fair value (cost of $124,909 and $39,990, respectively) |
|
|
124,909 |
|
|
|
39,990 |
|
|
Cash |
|
|
4,484 |
|
|
|
7,776 |
|
|
Restricted cash |
|
|
5,522 |
|
|
|
7,702 |
|
|
Deferred credit facility costs |
|
|
946 |
|
|
|
1,774 |
|
|
Prepaid expenses and other assets |
|
|
2,320 |
|
|
|
2,669 |
|
|
Total assets |
|
$ |
510,284 |
|
|
$ |
434,222 |
|
|
|
|
|
|
|
|
|
|
|
|
Liabilities |
|
|
|
|
|
|
|
|
|
Revolving Credit Facility |
|
$ |
67,000 |
|
|
$ |
115,000 |
|
|
2020 Notes, net |
|
|
— |
|
|
|
53,288 |
|
|
2022 Notes, net |
|
|
72,433 |
|
|
|
— |
|
|
Payable for U.S. Treasury bill assets |
|
|
124,909 |
|
|
|
39,990 |
|
|
Base management fee payable |
|
|
1,463 |
|
|
|
1,449 |
|
|
Income incentive fee payable |
|
|
1,094 |
|
|
|
1,208 |
|
|
Accrued capital gains incentive fee |
|
|
— |
|
|
|
— |
|
|
Payable to directors and officers |
|
|
68 |
|
|
|
63 |
|
|
Other accrued expenses and liabilities |
|
|
8,372 |
|
|
|
7,361 |
|
|
Total liabilities |
|
$ |
275,339 |
|
|
$ |
218,359 |
|
|
Commitments and Contingencies (Note 7) |
|
|
|
|
|
|
|
|
|
|
|
|
|
|
|
|
|
|
|
Net assets |
|
|
|
|
|
|
|
|
|
Preferred stock, par value $0.01 per share (50,000 shares authorized; no shares issued and outstanding, respectively) |
|
$ |
— |
|
|
$ |
— |
|
|
Common stock, par value $0.01 per share (450,000 shares authorized; 17,730 and 15,981 shares issued and outstanding, respectively) |
|
|
177 |
|
|
|
160 |
|
|
Paid-in capital in excess of par value |
|
|
235,488 |
|
|
|
212,013 |
|
|
Undistributed net investment income |
|
|
976 |
|
|
|
82 |
|
|
Accumulated net realized losses |
|
|
(128 |
) |
|
|
(587 |
) |
|
Accumulated net unrealized (losses) gains on investments |
|
|
(1,568 |
) |
|
|
4,195 |
|
|
Total net assets |
|
$ |
234,945 |
|
|
$ |
215,863 |
|
|
Total liabilities and net assets |
|
$ |
510,284 |
|
|
$ |
434,222 |
|
|
|
|
|
|
|
|
|
|
|
|
Net asset value per share |
|
$ |
13.25 |
|
|
$ |
13.51 |
|
See accompanying notes to consolidated financial statements.
86
TRIPLEPOINT VENTURE GROWTH BDC CORP. AND SUBSIDIARIES
CONSOLIDATED STATEMENTS OF OPERATIONS
(in thousands, except per share data)
|
|
|
For the Year Ended December 31, |
|
|||||||||
|
|
|
2017 |
|
|
2016 |
|
|
2015 |
|
|||
|
Investment income |
|
|
|
|
|
|
|
|
|
|
|
|
|
Interest income from investments |
|
$ |
50,035 |
|
|
$ |
41,767 |
|
|
$ |
39,904 |
|
|
Other income |
|
|
|
|
|
|
|
|
|
|
|
|
|
Expirations / terminations of unfunded commitments |
|
|
458 |
|
|
|
1,657 |
|
|
|
1,741 |
|
|
Other fees |
|
|
1,017 |
|
|
|
211 |
|
|
|
441 |
|
|
Total investment and other income |
|
|
51,510 |
|
|
|
43,635 |
|
|
|
42,086 |
|
|
|
|
|
|
|
|
|
|
|
|
|
|
|
|
Operating expenses |
|
|
|
|
|
|
|
|
|
|
|
|
|
Base management fee |
|
|
6,268 |
|
|
|
5,525 |
|
|
|
5,428 |
|
|
Income incentive fee |
|
|
5,614 |
|
|
|
2,775 |
|
|
|
4,360 |
|
|
Capital gains incentive fee |
|
|
— |
|
|
|
— |
|
|
|
(296 |
) |
|
Interest expense and amortization of fees |
|
|
9,061 |
|
|
|
7,859 |
|
|
|
6,285 |
|
|
Administration agreement expenses |
|
|
1,404 |
|
|
|
1,552 |
|
|
|
1,517 |
|
|
General and administrative expenses |
|
|
2,897 |
|
|
|
2,913 |
|
|
|
2,833 |
|
|
Total operating expenses |
|
|
25,244 |
|
|
|
20,624 |
|
|
|
20,127 |
|
|
|
|
|
|
|
|
|
|
|
|
|
|
|
|
Net investment income |
|
|
26,266 |
|
|
|
23,011 |
|
|
|
21,959 |
|
|
|
|
|
|
|
|
|
|
|
|
|
|
|
|
Net realized and unrealized gains (losses) |
|
|
|
|
|
|
|
|
|
|
|
|
|
Net realized (losses) on investments |
|
|
(164 |
) |
|
|
(20,718 |
) |
|
|
(317 |
) |
|
Net change in unrealized (losses) gains on investments |
|
|
(5,763 |
) |
|
|
8,833 |
|
|
|
(6,121 |
) |
|
Net realized loss on extinguishment of debt |
|
|
(1,112 |
) |
|
|
— |
|
|
|
— |
|
|
Net realized and unrealized gains (losses) |
|
|
(7,039 |
) |
|
|
(11,885 |
) |
|
|
(6,438 |
) |
|
|
|
|
|
|
|
|
|
|
|
|
|
|
|
Net increase in net assets resulting from operations |
|
$ |
19,227 |
|
|
$ |
11,126 |
|
|
$ |
15,521 |
|
|
|
|
|
|
|
|
|
|
|
|
|
|
|
|
Basic and diluted net investment income per share |
|
$ |
1.61 |
|
|
$ |
1.42 |
|
|
$ |
1.46 |
|
|
Basic and diluted net increase in net assets per share |
|
$ |
1.18 |
|
|
$ |
0.69 |
|
|
$ |
1.03 |
|
|
Basic and diluted weighted average shares of common stock outstanding |
|
|
16,324 |
|
|
|
16,160 |
|
|
|
15,041 |
|
See accompanying notes to consolidated financial statements.
87
TRIPLEPOINT VENTURE GROWTH BDC CORP. AND SUBSIDIARIES
CONSOLIDATED STATEMENTS OF CHANGES IN NET ASSETS
(in thousands)
|
|
Common stock |
|
|
|
|
|
|
|
|
|
|
|
|
|
|
|
|
||||
|
|
Shares |
|
Par value |
|
Paid-in capital in excess of par value |
|
Undistributed net investment income |
|
Realized gains (losses) |
|
Accumulated net unrealized gains (losses) on investments |
|
Net assets |
|
|||||||
|
Balance at December 31, 2014 |
|
9,924 |
|
$ |
99 |
|
$ |
142,635 |
|
$ |
762 |
|
$ |
— |
|
$ |
1,483 |
|
$ |
144,979 |
|
|
Net increase (decrease) in net assets resulting from operations |
|
— |
|
|
— |
|
|
— |
|
|
21,959 |
|
|
(317 |
) |
|
(6,121 |
) |
|
15,521 |
|
|
Issuance of common stock |
|
6,654 |
|
|
67 |
|
|
95,871 |
|
|
— |
|
|
— |
|
|
— |
|
|
95,938 |
|
|
Distributions reinvested in common stock |
|
190 |
|
|
2 |
|
|
2,246 |
|
|
— |
|
|
— |
|
|
— |
|
|
2,248 |
|
|
Acquisition of common stock under repurchase plan |
|
(466 |
) |
|
(5 |
) |
|
(5,547 |
) |
|
— |
|
|
— |
|
|
— |
|
|
(5,552 |
) |
|
Distributions from net investment income |
|
— |
|
|
— |
|
|
— |
|
|
(21,488 |
) |
|
— |
|
|
— |
|
|
(21,488 |
) |
|
Balance at December 31, 2015 |
|
16,302 |
|
$ |
163 |
|
$ |
235,205 |
|
$ |
1,233 |
|
$ |
(317 |
) |
$ |
(4,638 |
) |
$ |
231,646 |
|
|
Net increase (decrease) in net assets resulting from operations |
|
— |
|
$ |
— |
|
$ |
— |
|
$ |
23,011 |
|
$ |
(20,718 |
) |
$ |
8,833 |
|
$ |
11,126 |
|
|
Issuance of common stock |
|
— |
|
|
— |
|
|
— |
|
|
— |
|
|
— |
|
|
— |
|
|
— |
|
|
Distributions reinvested in common stock |
|
165 |
|
|
2 |
|
|
1,685 |
|
|
— |
|
|
— |
|
|
— |
|
|
1,687 |
|
|
Acquisition of common stock under repurchase plan |
|
(486 |
) |
|
(5 |
) |
|
(5,372 |
) |
|
— |
|
|
— |
|
|
— |
|
|
(5,377 |
) |
|
Return of Capital |
|
— |
|
|
— |
|
|
(19,419 |
) |
|
— |
|
|
— |
|
|
— |
|
|
(19,419 |
) |
|
Distributions from net investment income |
|
— |
|
|
— |
|
|
— |
|
|
(3,800 |
) |
|
— |
|
|
— |
|
|
(3,800 |
) |
|
Tax reclassification |
|
— |
|
|
— |
|
|
(86 |
) |
|
(20,362 |
) |
|
20,448 |
|
|
— |
|
|
— |
|
|
Balance at December 31, 2016 |
|
15,981 |
|
$ |
160 |
|
$ |
212,013 |
|
$ |
82 |
|
$ |
(587 |
) |
$ |
4,195 |
|
$ |
215,863 |
|
|
Net increase (decrease) in net assets resulting from operations |
|
— |
|
$ |
— |
|
$ |
— |
|
$ |
26,266 |
|
$ |
(1,276 |
) |
$ |
(5,763 |
) |
$ |
19,227 |
|
|
Issuance of common stock |
|
1,668 |
|
|
16 |
|
|
22,456 |
|
|
— |
|
|
— |
|
|
— |
|
|
22,472 |
|
|
Distributions reinvested in common stock |
|
81 |
|
|
1 |
|
|
1,038 |
|
|
— |
|
|
— |
|
|
— |
|
|
1,039 |
|
|
Acquisition of common stock under repurchase plan |
|
— |
|
|
— |
|
|
— |
|
|
— |
|
|
— |
|
|
— |
|
|
— |
|
|
Distributions from net investment income |
|
— |
|
|
— |
|
|
— |
|
|
(23,656 |
) |
|
— |
|
|
— |
|
|
(23,656 |
) |
|
Tax reclassification |
|
— |
|
|
— |
|
|
(19 |
) |
|
(1,716 |
) |
|
1,735 |
|
|
— |
|
|
— |
|
|
Balance at December 31, 2017 |
|
17,730 |
|
$ |
177 |
|
$ |
235,488 |
|
$ |
976 |
|
$ |
(128 |
) |
$ |
(1,568 |
) |
$ |
234,945 |
|
See accompanying notes to consolidated financial statements.
88
TRIPLEPOINT VENTURE GROWTH BDC CORP. AND SUBSIDIARIES
CONSOLIDATED STATEMENTS OF CASH FLOWS
(in thousands)
|
|
|
For the Year Ended December 31, |
|
|||||||||
|
|
|
2017 |
|
|
2016 |
|
|
2015 |
|
|||
|
Cash Flows from Operating Activities: |
|
|
|
|
|
|
|
|
|
|
|
|
|
Net increase in net assets resulting from operations |
|
$ |
19,227 |
|
|
$ |
11,126 |
|
|
$ |
15,521 |
|
|
Adjustments to reconcile net increase in net assets resulting from operations to net cash provided by (used in) operating activities: |
|
|
|
|
|
|
|
|
|
|
|
|
|
Fundings and purchases of investments |
|
|
(233,232 |
) |
|
|
(156,349 |
) |
|
|
(101,095 |
) |
|
(Purchase) sale of short-term investments, net |
|
|
(84,919 |
) |
|
|
30,007 |
|
|
|
(20,000 |
) |
|
Principal payments and proceeds from investments |
|
|
234,594 |
|
|
|
49,475 |
|
|
|
90,357 |
|
|
Payment-in-kind interest on investments |
|
|
(2,124 |
) |
|
|
(2,856 |
) |
|
|
(409 |
) |
|
Net change in unrealized losses (gains) on investments |
|
|
5,763 |
|
|
|
(8,833 |
) |
|
|
6,121 |
|
|
Realized losses |
|
|
1,276 |
|
|
|
20,718 |
|
|
|
317 |
|
|
Amortization and accretion of premiums and discounts, net |
|
|
(2,305 |
) |
|
|
(2,220 |
) |
|
|
(1,788 |
) |
|
Accretion of end-of-term payments, net of prepayments |
|
|
(660 |
) |
|
|
(4,138 |
) |
|
|
(7,249 |
) |
|
Amortization of debt fees and issuance costs |
|
|
1,298 |
|
|
|
1,243 |
|
|
|
1,478 |
|
|
Change in operating assets and liabilities: |
|
|
|
|
|
|
|
|
|
|
|
|
|
Payable for U.S. Treasury bill assets |
|
|
84,919 |
|
|
|
(30,008 |
) |
|
|
20,000 |
|
|
Prepaid expenses and other assets |
|
|
349 |
|
|
|
(489 |
) |
|
|
(456 |
) |
|
Base management fee payable |
|
|
14 |
|
|
|
74 |
|
|
|
(530 |
) |
|
Income incentive fee payable |
|
|
(114 |
) |
|
|
(245 |
) |
|
|
(897 |
) |
|
Accrued capital gains incentive fee |
|
|
— |
|
|
|
— |
|
|
|
(296 |
) |
|
Payable to directors and officers |
|
|
5 |
|
|
|
(9 |
) |
|
|
(24 |
) |
|
Other accrued expenses and liabilities |
|
|
1,011 |
|
|
|
492 |
|
|
|
(909 |
) |
|
Net cash provided by (used in) operating activities |
|
|
25,102 |
|
|
|
(92,012 |
) |
|
|
141 |
|
|
Cash Flows from Financing Activities: |
|
|
|
|
|
|
|
|
|
|
|
|
|
(Repayments) borrowings under revolving credit facility, net |
|
|
(48,000 |
) |
|
|
97,000 |
|
|
|
(100,000 |
) |
|
Repurchase of common stock |
|
|
— |
|
|
|
(5,376 |
) |
|
|
(5,552 |
) |
|
Distributions paid, net |
|
|
(22,617 |
) |
|
|
(21,533 |
) |
|
|
(19,240 |
) |
|
Deferred credit facility costs |
|
|
— |
|
|
|
(1,080 |
) |
|
|
(503 |
) |
|
Net proceeds from issuance of 2020 Notes |
|
|
— |
|
|
|
— |
|
|
|
52,756 |
|
|
Repayment of 2020 Notes |
|
|
(54,625 |
) |
|
|
— |
|
|
|
— |
|
|
Net proceeds from issuance of 2022 Notes |
|
|
72,196 |
|
|
|
— |
|
|
|
— |
|
|
Net proceeds from issuance of common stock |
|
|
22,472 |
|
|
|
— |
|
|
|
95,938 |
|
|
Net cash (used in) provided by financing activities |
|
|
(30,574 |
) |
|
|
69,011 |
|
|
|
23,399 |
|
|
Net change in cash and restricted cash |
|
|
(5,472 |
) |
|
|
(23,001 |
) |
|
|
23,540 |
|
|
Cash and restricted cash at beginning of period |
|
|
15,478 |
|
|
|
38,479 |
|
|
|
14,939 |
|
|
Cash and restricted cash at end of period |
|
$ |
10,006 |
|
|
$ |
15,478 |
|
|
$ |
38,479 |
|
|
Supplemental Disclosure of Non-Cash Financing Activities: |
|
|
|
|
|
|
|
|
|
|
|
|
|
Distributions reinvested |
|
$ |
1,039 |
|
|
$ |
1,687 |
|
|
$ |
2,248 |
|
|
|
|
|
|
|
|
|
|
|
|
|
|
|
|
Supplemental Disclosures of Cash Flow Information: |
|
|
|
|
|
|
|
|
|
|
|
|
|
Cash paid for interest |
|
$ |
7,520 |
|
|
$ |
6,345 |
|
|
$ |
4,087 |
|
|
|
|
|
|
|
|
|
|
|
|
|
|
|
|
|
|
For the Year Ended December 31, |
|
|||||||||
|
|
|
2017 |
|
|
2016 |
|
|
2015 |
|
|||
|
Cash |
|
$ |
4,484 |
|
|
$ |
7,776 |
|
|
$ |
32,451 |
|
|
Restricted cash |
|
|
5,522 |
|
|
|
7,702 |
|
|
|
6,028 |
|
|
Total cash and restricted cash shown in the statement of cash flows |
|
$ |
10,006 |
|
|
$ |
15,478 |
|
|
$ |
38,479 |
|
|
See Note 2. Significant Accounting Policies for a description of cash and restricted cash. |
|
|
|
|
|
|
|
|
|
|
|
|
See accompanying notes to consolidated financial statements.
89
TRIPLEPOINT VENTURE GROWTH BDC CORP. AND SUBSIDIARIES
CONSOLIDATED SCHEDULE OF INVESTMENTS
(in thousands)
As of December 31, 2017
|
Venture Growth Stage Company |
|
Industry |
|
Type of Investment |
|
Outstanding Principal |
|
|
Cost (7) |
|
|
Fair Value |
|
|
Maturity Date |
|||
|
Debt Investments |
|
|
|
|
|
|
|
|
|
|
|
|
|
|
|
|
|
|
|
Biofuels / Biomass |
|
|
|
|
|
|
|
|
|
|
|
|
|
|
|
|
|
|
|
Harvest Power, Inc. |
|
Biofuels / Biomass |
|
Growth Capital Loan (7.00% interest rate, 9.00% EOT payment) |
|
$ |
13,251 |
|
|
$ |
14,438 |
|
|
$ |
13,878 |
|
|
4/30/2020 |
|
Total Biofuels / Biomass - 5.91%* |
|
|
|
|
|
|
13,251 |
|
|
|
14,438 |
|
|
|
13,878 |
|
|
|
|
Building Materials/Construction Machinery |
|
|
|
|
|
|
|
|
|
|
|
|
|
|
|
|
|
|
|
View, Inc. |
|
Building Materials/Construction Machinery |
|
Equipment Loan (Prime + 8.00% interest rate, 14.00% EOT payment) |
|
|
13,276 |
|
|
|
12,882 |
|
|
|
12,961 |
|
|
6/30/2021 |
|
|
|
Building Materials/Construction Machinery |
|
Equipment Loan (Prime + 8.00% interest rate, 14.00% EOT payment) |
|
|
6,356 |
|
|
|
6,157 |
|
|
|
6,194 |
|
|
6/30/2021 |
|
|
|
Building Materials/Construction Machinery |
|
Equipment Loan (Prime + 8.00% interest rate, 14.00% EOT payment) |
|
|
8,568 |
|
|
|
8,271 |
|
|
|
8,323 |
|
|
7/31/2021 |
|
|
|
Building Materials/Construction Machinery |
|
Equipment Loan (Prime + 8.00% interest rate, 14.00% EOT payment) |
|
|
1,935 |
|
|
|
1,853 |
|
|
|
1,863 |
|
|
9/30/2021 |
|
|
|
Building Materials/Construction Machinery |
|
Equipment Loan (Prime + 8.00% interest rate, 14.00% EOT payment) |
|
|
2,379 |
|
|
|
2,265 |
|
|
|
2,266 |
|
|
11/30/2021 |
|
|
|
Building Materials/Construction Machinery |
|
Equipment Loan (Prime + 8.00% interest rate, 14.00% EOT payment) |
|
|
1,908 |
|
|
|
1,812 |
|
|
|
1,813 |
|
|
11/30/2021 |
|
|
|
Building Materials/Construction Machinery |
|
Equipment Loan (Prime + 8.00% interest rate, 14.00% EOT payment) |
|
|
2,724 |
|
|
|
2,579 |
|
|
|
2,578 |
|
|
12/31/2021 |
|
|
|
Building Materials/Construction Machinery |
|
Equipment Loan (Prime + 8.00% interest rate, 14.00% EOT payment) |
|
|
2,854 |
|
|
|
2,702 |
|
|
|
2,701 |
|
|
12/31/2021 |
|
|
|
Building Materials/Construction Machinery |
|
Convertible Note (10.10% PIK interest rate, 14.00% EOT Payment) |
|
|
1,057 |
|
|
|
1,080 |
|
|
|
1,167 |
|
|
1/25/2020 |
|
Total Building Materials/Construction Machinery - 16.97%* |
|
|
|
|
41,057 |
|
|
|
39,601 |
|
|
|
39,866 |
|
|
|
||
|
Business Applications Software |
|
|
|
|
|
|
|
|
|
|
|
|
|
|
|
|
|
|
|
FinancialForce.com, Inc. |
|
Business Applications Software |
|
Growth Capital Loan (Prime + 7.50% interest rate, 4.00% EOT payment) |
|
|
15,000 |
|
|
|
14,650 |
|
|
|
14,829 |
|
|
12/31/2020 |
|
|
|
Business Applications Software |
|
Growth Capital Loan (Prime + 7.50% interest rate, 4.00% EOT payment) |
|
|
15,000 |
|
|
|
14,476 |
|
|
|
14,653 |
|
|
6/30/2021 |
|
|
|
Business Applications Software |
|
Growth Capital Loan (Prime + 7.50% interest rate, 4.00% EOT payment) |
|
|
15,000 |
|
|
|
14,367 |
|
|
|
14,464 |
|
|
9/30/2021 |
|
|
|
|
|
|
|
|
45,000 |
|
|
|
43,493 |
|
|
|
43,946 |
|
|
|
|
MapR Technologies, Inc. |
|
Business Applications Software |
|
Equipment Loan (8.00% interest rate,10.00% EOT payment) |
|
|
1,208 |
|
|
|
1,455 |
|
|
|
1,461 |
|
|
9/30/2018 |
|
|
|
Business Applications Software |
|
Equipment Lease (8.25% interest rate, 10.00% EOT payment) (1) |
|
|
89 |
|
|
|
89 |
|
|
|
90 |
|
|
1/31/2019 |
|
|
|
Business Applications Software |
|
Equipment Lease (8.25% interest rate, 10.00% EOT payment) (1) |
|
|
1,169 |
|
|
|
1,169 |
|
|
|
1,178 |
|
|
6/30/2019 |
|
|
|
Business Applications Software |
|
Equipment Loan (6.50% interest rate,10.00% EOT payment) |
|
|
533 |
|
|
|
573 |
|
|
|
575 |
|
|
6/30/2019 |
|
|
|
Business Applications Software |
|
Equipment Lease (8.50% interest rate, 10.00% EOT payment) (1) |
|
|
142 |
|
|
|
142 |
|
|
|
142 |
|
|
12/31/2019 |
|
|
|
Business Applications Software |
|
Equipment Loan (6.75% interest rate,10.00% EOT payment) |
|
|
244 |
|
|
|
253 |
|
|
|
254 |
|
|
10/31/2019 |
|
|
|
Business Applications Software |
|
Equipment Lease (8.75% interest rate, 10.00% EOT payment) (1) |
|
|
414 |
|
|
|
414 |
|
|
|
415 |
|
|
4/30/2020 |
|
|
|
Business Applications Software |
|
Equipment Loan (7.00% interest rate,10.00% EOT payment) |
|
|
125 |
|
|
|
127 |
|
|
|
127 |
|
|
1/31/2020 |
|
|
|
Business Applications Software |
|
Equipment Lease (9.00% interest rate, 10.00% EOT payment) (1) |
|
|
509 |
|
|
|
510 |
|
|
|
511 |
|
|
7/31/2020 |
|
|
|
Business Applications Software |
|
Equipment Loan (7.00% interest rate,10.00% EOT payment) |
|
|
774 |
|
|
|
771 |
|
|
|
770 |
|
|
4/30/2020 |
|
|
|
Business Applications Software |
|
Equipment Lease (9.00% interest rate, 10.00% EOT payment) (1) |
|
|
405 |
|
|
|
405 |
|
|
|
406 |
|
|
10/31/2020 |
|
|
|
|
|
|
|
|
5,612 |
|
|
|
5,908 |
|
|
|
5,929 |
|
|
|
|
Total Business Applications Software - 21.23%* |
|
|
|
|
50,612 |
|
|
|
49,401 |
|
|
|
49,875 |
|
|
|
||
|
Business to Business Marketplace |
|
|
|
|
|
|
|
|
|
|
|
|
|
|
|
|
|
|
|
RetailNext, Inc. |
|
Business to Business Marketplace |
|
Growth Capital Loan (Prime + 7.50% interest rate, 8.50% EOT payment) |
|
|
8,000 |
|
|
|
7,861 |
|
|
|
7,858 |
|
|
11/30/2020 |
|
Total Business to Business Marketplace - 3.34%* |
|
|
|
|
8,000 |
|
|
|
7,861 |
|
|
|
7,858 |
|
|
|
||
|
Database Software |
|
|
|
|
|
|
|
|
|
|
|
|
|
|
|
|
|
|
|
SimpliVity Corporation |
|
Database Software |
|
Equipment Lease (6.75% interest rate, 10.00% EOT payment) (1) |
|
|
1,677 |
|
|
|
1,677 |
|
|
|
1,802 |
|
|
12/31/2018 |
|
|
|
Database Software |
|
Equipment Lease (7.00% interest rate, 10.00% EOT payment) (1) |
|
|
781 |
|
|
|
781 |
|
|
|
836 |
|
|
12/31/2018 |
|
|
|
Database Software |
|
Equipment Lease (7.00% interest rate, 10.00% EOT payment) (1) |
|
|
557 |
|
|
|
557 |
|
|
|
603 |
|
|
2/28/2019 |
|
|
|
Database Software |
|
Equipment Lease (7.00% interest rate, 10.00% EOT payment) (1) |
|
|
35 |
|
|
|
35 |
|
|
|
38 |
|
|
3/31/2019 |
|
|
|
Database Software |
|
Equipment Lease (9.00% interest rate, 10.00% EOT payment) (1) |
|
|
3,348 |
|
|
|
3,348 |
|
|
|
3,673 |
|
|
9/30/2018 |
|
Total Database Software - 2.96%* |
|
|
|
|
|
|
6,398 |
|
|
|
6,398 |
|
|
|
6,952 |
|
|
|
|
E-Commerce - Clothing and Accessories |
|
|
|
|
|
|
|
|
|
|
|
|
|
|
|
|
|
|
|
Outfittery GMBH (1) (2) (3) |
|
E-Commerce - Clothing and Accessories |
|
Growth Capital Loan (12.25% interest rate, 9.00% EOT payment) |
|
|
7,127 |
|
|
|
6,788 |
|
|
|
6,852 |
|
|
8/31/2021 |
|
|
|
|
|
|
|
|
7,127 |
|
|
|
6,788 |
|
|
|
6,852 |
|
|
|
|
Rent the Runway, Inc. |
|
E-Commerce - Clothing and Accessories |
|
Growth Capital Loan (Prime + 7.00% interest rate, 6.25% EOT payment) |
|
|
9,211 |
|
|
|
9,642 |
|
|
|
9,879 |
|
|
11/30/2018 |
|
|
|
E-Commerce - Clothing and Accessories |
|
Growth Capital Loan (Prime + 6.25% interest rate, 6.25% EOT payment) |
|
|
6,000 |
|
|
|
6,147 |
|
|
|
6,354 |
|
|
6/30/2019 |
|
|
|
E-Commerce - Clothing and Accessories |
|
Growth Capital Loan (Prime + 6.25% interest rate, 6.25% EOT payment) |
|
|
2,000 |
|
|
|
2,029 |
|
|
|
2,112 |
|
|
10/31/2019 |
|
|
|
E-Commerce - Clothing and Accessories |
|
Growth Capital Loan (Prime + 6.25% interest rate, 4.50% EOT payment) |
|
|
4,000 |
|
|
|
4,008 |
|
|
|
4,096 |
|
|
11/30/2019 |
|
|
|
E-Commerce - Clothing and Accessories |
|
Growth Capital Loan (Prime + 6.50% interest rate, 5.25% EOT payment) |
|
|
5,500 |
|
|
|
5,212 |
|
|
|
5,236 |
|
|
6/30/2021 |
|
|
|
E-Commerce - Clothing and Accessories |
|
Growth Capital Loan (Prime + 6.50% interest rate, 5.25% EOT payment) |
|
|
4,500 |
|
|
|
4,228 |
|
|
|
4,230 |
|
|
9/30/2021 |
|
|
|
E-Commerce - Clothing and Accessories |
|
Growth Capital Loan (Prime + 7.50% interest rate, 10.25% EOT payment) |
|
|
3,000 |
|
|
|
2,959 |
|
|
|
2,959 |
|
|
10/31/2021 |
|
|
|
|
|
|
|
|
34,211 |
|
|
|
34,225 |
|
|
|
34,866 |
|
|
|
|
Total E-Commerce - Clothing and Accessories - 17.76%* |
|
|
|
|
41,338 |
|
|
|
41,013 |
|
|
|
41,718 |
|
|
|
||
|
Entertainment |
|
|
|
|
|
|
|
|
|
|
|
|
|
|
|
|
|
|
|
Mind Candy Limited (1) (3) |
|
Entertainment |
|
Growth Capital Loan (11.00% PIK, 3.00% Cash, 9.50% EOT payment) |
|
|
9,423 |
|
|
|
10,323 |
|
|
|
7,879 |
|
|
1/31/2019 |
|
Total Entertainment - 3.35%* |
|
|
|
|
|
|
9,423 |
|
|
|
10,323 |
|
|
|
7,879 |
|
|
|
|
Financial Institution and Services |
|
|
|
|
|
|
|
|
|
|
|
|
|
|
|
|
|
|
|
BlueVine Capital, Inc. |
|
Financial Institution and Services |
|
Growth Capital Loan (8.75% interest rate, 3.05% EOT payment) |
|
|
10,000 |
|
|
|
9,912 |
|
|
|
9,910 |
|
|
3/31/2019 |
|
|
|
Financial Institution and Services |
|
Growth Capital Loan (8.75% interest rate, 3.05% EOT payment) |
|
|
10,000 |
|
|
|
9,867 |
|
|
|
9,864 |
|
|
5/31/2019 |
|
|
|
|
|
|
|
|
20,000 |
|
|
|
19,779 |
|
|
|
19,774 |
|
|
|
|
Prodigy Finance Limited (1) (3) |
|
Financial Institution and Services |
|
Growth Capital Loan (Prime + 7.75% interest rate, 10.00% EOT payment) |
|
|
18,000 |
|
|
|
17,542 |
|
|
|
17,536 |
|
|
12/31/2020 |
|
WorldRemit Limited (1) (3) |
|
Financial Institution and Services |
|
Growth Capital Loan (Prime + 8.75% interest rate, 10.00% EOT payment) |
|
|
5,000 |
|
|
|
5,270 |
|
|
|
5,313 |
|
|
12/31/2018 |
|
|
|
Financial Institution and Services |
|
Growth Capital Loan (Prime + 8.75% interest rate, 10.00% EOT payment) |
|
|
5,000 |
|
|
|
5,143 |
|
|
|
5,231 |
|
|
6/30/2019 |
|
|
|
Financial Institution and Services |
|
Growth Capital Loan (Prime + 8.75% interest rate, 10.00% EOT payment) |
|
|
5,000 |
|
|
|
5,138 |
|
|
|
5,231 |
|
|
6/30/2019 |
|
|
|
Financial Institution and Services |
|
Growth Capital Loan (Prime + 8.75% interest rate, 10.00% EOT payment) |
|
|
5,000 |
|
|
|
5,039 |
|
|
|
5,166 |
|
|
11/30/2019 |
|
|
|
Financial Institution and Services |
|
Growth Capital Loan (Prime + 3.75% interest rate, 4.00% EOT payment) |
|
|
5,000 |
|
|
|
5,105 |
|
|
|
5,111 |
|
|
3/31/2018 |
|
|
|
Financial Institution and Services |
|
Growth Capital Loan (Prime + 8.75% interest rate, 4.00% EOT payment) |
|
|
5,000 |
|
|
|
4,916 |
|
|
|
4,940 |
|
|
7/31/2020 |
|
|
|
|
|
|
|
|
30,000 |
|
|
|
30,611 |
|
|
|
30,992 |
|
|
|
|
Total Financial Institution and Services - 29.07%* |
|
|
|
|
68,000 |
|
|
|
67,932 |
|
|
|
68,302 |
|
|
|
||
See accompanying notes to consolidated financial statements.
90
TRIPLEPOINT VENTURE GROWTH BDC CORP. AND SUBSIDIARIES
CONSOLIDATED SCHEDULE OF INVESTMENTS
(in thousands)
As of December 31, 2017
|
Venture Growth Stage Company |
|
Industry |
|
Type of Investment |
|
Outstanding Principal |
|
|
Cost (7) |
|
|
Fair Value |
|
|
Maturity Date |
|||
|
Debt Investments (continued) |
|
|
|
|
|
|
|
|
|
|
|
|
|
|
|
|
|
|
|
Food & Drug |
|
|
|
|
|
|
|
|
|
|
|
|
|
|
|
|
|
|
|
PillPack, Inc. |
|
Food & Drug |
|
Growth Capital Loan (Prime + 5.75% interest rate, 9.00% EOT payment) |
|
|
5,000 |
|
|
|
4,956 |
|
|
|
4,983 |
|
|
8/31/2020 |
|
Total Food & Drug - 2.12%* |
|
|
|
|
|
|
5,000 |
|
|
|
4,956 |
|
|
|
4,983 |
|
|
|
|
Network Systems Management Software |
|
|
|
|
|
|
|
|
|
|
|
|
|
|
|
|
|
|
|
Virtual Instruments Corporation |
|
Network Systems Management Software |
|
Growth Capital Loan (10.00% interest rate) |
|
|
5,000 |
|
|
|
5,000 |
|
|
|
4,994 |
|
|
4/4/2020 |
|
|
|
Network Systems Management Software |
|
Growth Capital Loan (5.00% PIK interest rate) |
|
|
22,212 |
|
|
|
22,212 |
|
|
|
20,028 |
|
|
4/4/2021 |
|
|
|
Network Systems Management Software |
|
Growth Capital Loan (5.00% PIK interest rate) |
|
|
5,329 |
|
|
|
5,329 |
|
|
|
4,601 |
|
|
4/4/2021 |
|
Total Network Systems Management Software - 12.61%* |
|
|
|
|
32,541 |
|
|
|
32,541 |
|
|
|
29,623 |
|
|
|
||
|
Restaurant / Food Service |
|
|
|
|
|
|
|
|
|
|
|
|
|
|
|
|
|
|
|
Munchery, Inc. |
|
Restaurant / Food Service |
|
Growth Capital Loan (Prime + 8.25% interest rate, 8.75% EOT payment) |
|
|
2,589 |
|
|
|
2,697 |
|
|
|
2,686 |
|
|
6/30/2019 |
|
Total Restaurant / Food Service - 1.14%* |
|
|
|
|
|
|
2,589 |
|
|
|
2,697 |
|
|
|
2,686 |
|
|
|
|
Security Products |
|
|
|
|
|
|
|
|
|
|
|
|
|
|
|
|
|
|
|
Ring, Inc. |
|
Security Products |
|
Growth Capital Loan (Prime + 2.75% interest rate, 3.50% EOT payment) |
|
|
20,000 |
|
|
|
20,065 |
|
|
|
20,094 |
|
|
8/31/2018 |
|
|
|
Security Products |
|
Growth Capital Loan (Prime + 5.50% interest rate, 6.75% EOT payment) |
|
|
5,000 |
|
|
|
4,929 |
|
|
|
4,931 |
|
|
4/30/2021 |
|
|
|
Security Products |
|
Growth Capital Loan (Prime + 5.00% interest rate, 5.00% EOT payment) |
|
|
25,000 |
|
|
|
24,440 |
|
|
|
24,454 |
|
|
10/31/2020 |
|
Total Security Products - 21.06%* |
|
|
|
|
|
|
50,000 |
|
|
|
49,434 |
|
|
|
49,479 |
|
|
|
|
Security Services |
|
|
|
|
|
|
|
|
|
|
|
|
|
|
|
|
|
|
|
Forgerock, Inc. |
|
Security Services |
|
Growth Capital Loan (Prime + 3.75% interest rate, 8.50% EOT payment) |
|
$ |
7,269 |
|
|
$ |
7,713 |
|
|
$ |
7,713 |
|
|
9/30/2019 |
|
|
|
Security Services |
|
Growth Capital Loan (Prime + 3.75% interest rate, 8.50% EOT payment) |
|
|
4,401 |
|
|
|
4,540 |
|
|
|
4,540 |
|
|
2/29/2020 |
|
Total Security Services - 5.22%* |
|
|
|
|
|
|
11,670 |
|
|
|
12,253 |
|
|
|
12,253 |
|
|
|
|
Wireless Communications Equipment |
|
|
|
|
|
|
|
|
|
|
|
|
|
|
|
|
|
|
|
Cambridge Broadband Network Limited (1) (3) |
Wireless Communications Equipment |
|
Growth Capital Loan (Prime + 10.75% interest rate) |
|
|
6,701 |
|
|
|
6,701 |
|
|
|
6,701 |
|
|
12/31/2021 |
|
|
Eero, Inc. |
|
Wireless Communications Equipment |
|
Growth Capital Loan (Prime + 8.25% interest rate) |
|
|
10,000 |
|
|
|
9,907 |
|
|
|
9,999 |
|
|
11/30/2019 |
|
Total Wireless Communications Equipment - 7.11%* |
|
|
|
|
16,701 |
|
|
|
16,608 |
|
|
|
16,700 |
|
|
|
||
|
Total Debt Investments - 149.84%* |
|
|
|
|
|
$ |
356,580 |
|
|
$ |
355,456 |
|
|
$ |
352,052 |
|
|
|
See accompanying notes to consolidated financial statements.
91
TRIPLEPOINT VENTURE GROWTH BDC CORP. AND SUBSIDIARIES
CONSOLIDATED SCHEDULE OF INVESTMENTS
(in thousands)
As of December 31, 2017
|
Venture Growth Stage Company |
|
Industry |
|
Type of Warrant |
|
Shares |
|
|
Cost (7) |
|
|
Fair Value |
|
|||
|
Warrant Investments |
|
|
|
|
|
|
|
|
|
|
|
|
|
|
|
|
|
Advertising / Marketing |
|
|
|
|
|
|
|
|
|
|
|
|
|
|
|
|
|
InMobi Pte Ltd. (1) (2) (3) |
|
Advertising / Marketing |
|
Ordinary Shares |
|
|
48,500 |
|
|
$ |
33 |
|
|
$ |
106 |
|
|
Total Advertising / Marketing - 0.05%* |
|
|
|
|
|
|
48,500 |
|
|
|
33 |
|
|
|
106 |
|
|
Building Materials/Construction Machinery |
|
|
|
|
|
|
|
|
|
|
|
|
|
|
|
|
|
View, Inc. |
|
Building Materials/Construction Machinery |
|
Preferred Stock |
|
|
2,222,222 |
|
|
|
500 |
|
|
|
500 |
|
|
Total Building Materials/Construction Machinery - 0.21%* |
|
|
|
|
|
|
2,222,222 |
|
|
|
500 |
|
|
|
500 |
|
|
Business Applications Software |
|
|
|
|
|
|
|
|
|
|
|
|
|
|
|
|
|
FinancialForce.com, Inc. |
|
Business Applications Software |
|
Preferred Stock |
|
|
547,440 |
|
|
|
1,540 |
|
|
|
1,655 |
|
|
Lattice Engines, Inc. (2) |
|
Business Applications Software |
|
Preferred Stock |
|
|
396,652 |
|
|
|
48 |
|
|
|
95 |
|
|
MapR Technologies, Inc. |
|
Business Applications Software |
|
Preferred Stock |
|
|
250,365 |
|
|
|
40 |
|
|
|
54 |
|
|
Medallia, Inc. (2) |
|
Business Applications Software |
|
Preferred Stock |
|
|
55,814 |
|
|
|
11 |
|
|
|
76 |
|
|
Total Business Applications Software - 0.80%* |
|
|
|
|
|
|
1,250,271 |
|
|
|
1,639 |
|
|
|
1,880 |
|
|
Business to Business Marketplace |
|
|
|
|
|
|
|
|
|
|
|
|
|
|
|
|
|
Optoro, Inc. (2) |
|
Business to Business Marketplace |
|
Preferred Stock |
|
|
10,346 |
|
|
|
40 |
|
|
|
9 |
|
|
RetailNext, Inc. |
|
Business to Business Marketplace |
|
Preferred Stock |
|
|
89,760 |
|
|
|
80 |
|
|
|
80 |
|
|
Total Business to Business Marketplace - 0.04%* |
|
|
|
|
|
|
100,106 |
|
|
|
120 |
|
|
|
89 |
|
|
Conferencing Equipment / Services |
|
|
|
|
|
|
|
|
|
|
|
|
|
|
|
|
|
Fuze, Inc. (fka Thinking Phone Networks, Inc.) (2) |
|
Conferencing Equipment / Services |
|
Preferred Stock |
|
|
323,381 |
|
|
|
670 |
|
|
|
639 |
|
|
Total Conferencing Equipment / Services - 0.27%* |
|
|
|
|
|
|
323,381 |
|
|
|
670 |
|
|
|
639 |
|
|
E-Commerce - Clothing and Accessories |
|
|
|
|
|
|
|
|
|
|
|
|
|
|
|
|
|
FabFitFun, Inc. (2) |
|
E-Commerce - Clothing and Accessories |
|
Preferred Stock |
|
|
9,700 |
|
|
|
123 |
|
|
|
123 |
|
|
JackThreads, Inc. (2) |
|
E-Commerce - Clothing and Accessories |
|
Common Stock |
|
|
283,401 |
|
|
|
88 |
|
|
|
— |
|
|
Outfittery GMBH (1) (2) (3) (6) |
|
E-Commerce - Clothing and Accessories |
|
Cash Exit Fee |
|
|
— |
|
|
|
404 |
|
|
|
407 |
|
|
Rent the Runway, Inc. |
|
E-Commerce - Clothing and Accessories |
|
Preferred Stock |
|
|
88,037 |
|
|
|
213 |
|
|
|
520 |
|
|
Rent the Runway, Inc. |
|
E-Commerce - Clothing and Accessories |
|
Common Stock |
|
|
116,047 |
|
|
|
793 |
|
|
|
1,015 |
|
|
Stance, Inc. (2) |
|
E-Commerce - Clothing and Accessories |
|
Preferred Stock |
|
|
75,000 |
|
|
|
41 |
|
|
|
41 |
|
|
Total E-Commerce - Clothing and Accessories - 0.90%* |
|
|
|
|
|
|
572,185 |
|
|
|
1,662 |
|
|
|
2,106 |
|
|
E-Commerce - Personal Goods |
|
|
|
|
|
|
|
|
|
|
|
|
|
|
|
|
|
Birchbox, Inc. (2) |
|
E-Commerce - Personal Goods |
|
Preferred Stock |
|
|
60,052 |
|
|
|
690 |
|
|
|
1,175 |
|
|
Total E-Commerce - Personal Goods - 0.50%* |
|
|
|
|
|
|
60,052 |
|
|
|
690 |
|
|
|
1,175 |
|
|
Educational/Training Software |
|
|
|
|
|
|
|
|
|
|
|
|
|
|
|
|
|
Varsity Tutors LLC (2) (6) |
|
Educational/Training Software |
|
Preferred Stock |
|
|
240,590 |
|
|
|
65 |
|
|
|
180 |
|
|
Total Educational/Training Software - 0.08%* |
|
|
|
|
|
|
240,590 |
|
|
|
65 |
|
|
|
180 |
|
|
Entertainment |
|
|
|
|
|
|
|
|
|
|
|
|
|
|
|
|
|
Mind Candy, Inc. (1) (3) |
|
Entertainment |
|
Preferred Stock |
|
|
9,754 |
|
|
|
751 |
|
|
|
— |
|
|
Total Entertainment - 0.00%* |
|
|
|
|
|
|
9,754 |
|
|
|
751 |
|
|
|
— |
|
|
Financial Institution and Services |
|
|
|
|
|
|
|
|
|
|
|
|
|
|
|
|
|
BlueVine Capital, Inc. |
|
Financial Institution and Services |
|
Preferred Stock |
|
|
180,865 |
|
|
|
241 |
|
|
|
241 |
|
|
Prodigy Finance Limited (1) (3) |
|
Financial Institution and Services |
|
Preferred Stock |
|
|
16,955 |
|
|
|
320 |
|
|
|
320 |
|
|
WorldRemit Limited (1) (3) |
|
Financial Institution and Services |
|
Preferred Stock |
|
|
128,288 |
|
|
|
382 |
|
|
|
536 |
|
|
Total Financial Institution and Services - 0.47%* |
|
|
|
|
|
|
326,108 |
|
|
|
943 |
|
|
|
1,097 |
|
|
Food & Drug |
|
|
|
|
|
|
|
|
|
|
|
|
|
|
|
|
|
PillPack, Inc. |
|
Food & Drug |
|
Common Stock |
|
|
28,297 |
|
|
|
55 |
|
|
|
55 |
|
|
Total Food & Drug - 0.02%* |
|
|
|
|
|
|
28,297 |
|
|
|
55 |
|
|
|
55 |
|
|
General Media and Content |
|
|
|
|
|
|
|
|
|
|
|
|
|
|
|
|
|
TechMediaNetwork, Inc. (2) |
|
General Media and Content |
|
Preferred Stock |
|
|
72,234 |
|
|
|
31 |
|
|
|
38 |
|
|
Thrillist Media Group, Inc. (2) |
|
General Media and Content |
|
Common Stock |
|
|
774,352 |
|
|
|
624 |
|
|
|
1,324 |
|
|
Total General Media and Content - 0.58%* |
|
|
|
|
|
|
846,586 |
|
|
|
655 |
|
|
|
1,362 |
|
|
Medical Software and Information Services |
|
|
|
|
|
|
|
|
|
|
|
|
|
|
|
|
|
AirStrip Technologies, Inc. (2) |
|
Medical Software and Information Services |
|
Preferred Stock |
|
|
31,063 |
|
|
|
112 |
|
|
|
74 |
|
|
Total Medical Software and Information Services - 0.03%* |
|
|
|
|
|
|
31,063 |
|
|
|
112 |
|
|
|
74 |
|
|
Restaurant / Food Service |
|
|
|
|
|
|
|
|
|
|
|
|
|
|
|
|
|
Munchery, Inc. |
|
Restaurant / Food Service |
|
Preferred Stock |
|
|
21,537 |
|
|
|
45 |
|
|
|
— |
|
|
Total Restaurant / Food Service - 0.00%* |
|
|
|
|
|
|
21,537 |
|
|
|
45 |
|
|
|
— |
|
|
Security Products |
|
|
|
|
|
|
|
|
|
|
|
|
|
|
|
|
|
Ring, Inc. |
|
Security Products |
|
Preferred Stock |
|
|
288,530 |
|
|
|
525 |
|
|
|
753 |
|
|
Total Security Products - 0.32%* |
|
|
|
|
|
|
288,530 |
|
|
|
525 |
|
|
|
753 |
|
|
Security Services |
|
|
|
|
|
|
|
|
|
|
|
|
|
|
|
|
|
CrowdStrike, Inc. (2) |
|
Security Services |
|
Preferred Shares |
|
|
99,344 |
|
|
|
72 |
|
|
|
261 |
|
|
Forgerock, Inc. |
|
Security Services |
|
Preferred Stock |
|
|
195,992 |
|
|
|
155 |
|
|
|
459 |
|
|
Total Security Services - 0.31%* |
|
|
|
|
|
|
295,336 |
|
|
|
227 |
|
|
|
720 |
|
|
Shopping Facilitators |
|
|
|
|
|
|
|
|
|
|
|
|
|
|
|
|
|
Farfetch UK Limited (1) (2) (3) |
|
Shopping Facilitators |
|
Preferred Stock |
|
|
37,998 |
|
|
|
170 |
|
|
|
250 |
|
|
Total Shopping Facilitators - 0.11%* |
|
|
|
|
|
|
37,998 |
|
|
|
170 |
|
|
|
250 |
|
|
Travel & Leisure |
|
|
|
|
|
|
|
|
|
|
|
|
|
|
|
|
|
Inspirato, LLC (2) |
|
Travel & Leisure |
|
Preferred Units |
|
|
1,994 |
|
|
|
37 |
|
|
|
8 |
|
|
Total Travel & Leisure - 0.00%* |
|
|
|
|
|
|
1,994 |
|
|
|
37 |
|
|
|
8 |
|
|
Wireless Communications Equipment |
|
|
|
|
|
|
|
|
|
|
|
|
|
|
|
|
|
Cambridge Broadband Network Limited (1) (3) |
|
Wireless Communications Equipment |
|
Preferred Shares |
|
|
33,000 |
|
|
|
95 |
|
|
|
— |
|
|
Eero, Inc. |
|
Wireless Communications Equipment |
|
Preferred Stock |
|
|
63,204 |
|
|
|
80 |
|
|
|
68 |
|
|
Total Wireless Communications Equipment - 0.03%* |
|
|
|
|
|
|
96,204 |
|
|
|
175 |
|
|
|
68 |
|
|
Total Warrant Investments - 4.71%* |
|
|
|
|
|
|
|
|
|
$ |
9,074 |
|
|
$ |
11,062 |
|
See accompanying notes to consolidated financial statements.
92
TRIPLEPOINT VENTURE GROWTH BDC CORP. AND SUBSIDIARIES
CONSOLIDATED SCHEDULE OF INVESTMENTS
(in thousands)
As of December 31, 2017
|
Venture Growth Stage Company |
|
Industry |
|
Type of Equity |
|
Shares |
|
|
Cost (7) |
|
|
Fair Value |
|
|||
|
Equity Investments (2) |
|
|
|
|
|
|
|
|
|
|
|
|
|
|
|
|
|
Business Applications Software |
|
|
|
|
|
|
|
|
|
|
|
|
|
|
|
|
|
MapR Technologies, Inc. |
|
Business Applications Software |
|
Preferred Stock |
|
|
39,018 |
|
|
$ |
161 |
|
|
$ |
160 |
|
|
Total Business Applications Software - 0.07%* |
|
|
|
|
|
|
39,018 |
|
|
|
161 |
|
|
|
160 |
|
|
Communications Software |
|
|
|
|
|
|
|
|
|
|
|
|
|
|
|
|
|
Pluribus Networks, Inc. |
|
Communications Software |
|
Preferred Stock |
|
|
722,073 |
|
|
|
2,000 |
|
|
|
1,993 |
|
|
Total Communications Software - 0.85%* |
|
|
|
|
|
|
722,073 |
|
|
|
2,000 |
|
|
|
1,993 |
|
|
E-Commerce - Personal Goods |
|
|
|
|
|
|
|
|
|
|
|
|
|
|
|
|
|
Birchbox, Inc. |
|
E-Commerce - Personal Goods |
|
Preferred Stock |
|
|
2,839 |
|
|
|
250 |
|
|
|
319 |
|
|
Birchbox, Inc. |
|
E-Commerce - Personal Goods |
|
Convertible Note (8.00% interest rate) |
— |
|
|
|
45 |
|
|
|
119 |
|
||
|
Total E-Commerce - Personal Goods - 0.19%* |
|
|
|
|
|
|
2,839 |
|
|
|
295 |
|
|
|
438 |
|
|
Financial Institution and Services |
|
|
|
|
|
|
|
|
|
|
|
|
|
|
|
|
|
GoGreenHost AB (1) (3) |
|
Financial Institution and Services |
|
Preferred Stock |
|
|
1 |
|
|
|
2,441 |
|
|
|
2,121 |
|
|
Revolut Ltd. (1) (3) |
|
Financial Institution and Services |
|
Preferred Stock |
|
|
25,920 |
|
|
|
292 |
|
|
|
292 |
|
|
Total Financial Institution and Services - 1.03%* |
|
|
|
|
|
|
25,921 |
|
|
|
2,733 |
|
|
|
2,413 |
|
|
Household & Office Goods |
|
|
|
|
|
|
|
|
|
|
|
|
|
|
|
|
|
Casper Sleep Inc. |
|
Household & Office Goods |
|
Preferred Stock |
|
|
8,000 |
|
|
|
250 |
|
|
|
262 |
|
|
Casper Sleep Inc. |
|
Household & Office Goods |
|
Common Stock |
|
|
26,669 |
|
|
|
750 |
|
|
|
760 |
|
|
Total Household & Office Goods - 0.44%* |
|
|
|
|
|
|
34,669 |
|
|
|
1,000 |
|
|
|
1,022 |
|
|
Network Systems Management Software |
|
|
|
|
|
|
|
|
|
|
|
|
|
|
|
|
|
Cohesity Inc. |
|
Network Systems Management Software |
|
Preferred Stock |
|
|
60,342 |
|
|
|
400 |
|
|
|
398 |
|
|
Total Network Systems Management Software - 0.17%* |
|
|
|
|
|
|
60,342 |
|
|
|
400 |
|
|
|
398 |
|
|
Security Services |
|
|
|
|
|
|
|
|
|
|
|
|
|
|
|
|
|
CrowdStrike, Inc. |
|
Security Services |
|
Preferred Stock |
|
|
87,849 |
|
|
|
500 |
|
|
|
500 |
|
|
|
|
Security Services |
|
Common Stock |
|
|
97,656 |
|
|
|
500 |
|
|
|
500 |
|
|
Total Security Services - 0.43%* |
|
|
|
|
|
|
185,505 |
|
|
|
1,000 |
|
|
|
1,000 |
|
|
Software Development Tools |
|
|
|
|
|
|
|
|
|
|
|
|
|
|
|
|
|
MongoDB, Inc. (5) |
|
Software Development Tools |
|
Common Stock |
|
|
37,371 |
|
|
|
1,000 |
|
|
|
1,020 |
|
|
Total Software Development Tools - 0.43%* |
|
|
|
|
|
|
37,371 |
|
|
|
1,000 |
|
|
|
1,020 |
|
|
Travel & Arrangements/ Tourism |
|
|
|
|
|
|
|
|
|
|
|
|
|
|
|
|
|
GoEuro Corp. |
|
Travel & Arrangements/ Tourism |
|
Preferred Stock |
|
|
2,362 |
|
|
|
300 |
|
|
|
300 |
|
|
Total Travel & Arrangements/ Tourism - 0.13%* |
|
|
|
|
|
|
2,362 |
|
|
|
300 |
|
|
|
300 |
|
|
Travel & Leisure |
|
|
|
|
|
|
|
|
|
|
|
|
|
|
|
|
|
Inspirato, LLC (1) (4) |
|
Travel & Leisure |
|
Preferred Units |
|
|
1,948 |
|
|
|
250 |
|
|
|
245 |
|
|
Total Travel & Leisure - 0.10%* |
|
|
|
|
|
|
1,948 |
|
|
|
250 |
|
|
|
245 |
|
|
Total Equity Investments - 3.83%* |
|
|
|
|
|
|
|
|
|
$ |
9,139 |
|
|
$ |
8,989 |
|
|
|
|
|
|
|
|
|
|
|
|
|
|
|
|
|
|
|
|
Total Investments in Portfolio Companies - 158.39%* |
|
|
|
|
|
|
|
|
|
$ |
373,669 |
|
|
$ |
372,103 |
|
|
|
|
|
|
|
|
|
|
|
|
|
|
|
|
|
|
|
|
Short-Term Investments (2) |
|
|
|
|
|
|
|
|
|
Cost |
|
|
Fair Value |
|
||
|
U.S. Treasury Bills |
|
$125,000 Face Value, Maturity Date 1/25/2018, Yield to Maturity 1.20% |
|
|
|
|
|
$ |
124,909 |
|
|
$ |
124,909 |
|
||
|
Total Short-Term Investments - 53.17%* |
|
|
|
|
|
|
|
|
|
$ |
124,909 |
|
|
$ |
124,909 |
|
|
|
|
|
|
|
|
|
|
|
|
|
|
|
|
|
|
|
|
Total Investments - 211.56%* |
|
|
|
|
|
|
|
|
|
$ |
498,578 |
|
|
$ |
497,012 |
|
______________
|
(1) |
Investment is a non-qualifying asset under Section 55(a) of the Investment Company Act of 1940, as amended (the “1940 Act”). As of December 31, 2017, non-qualifying assets as a percentage of total assets were 16.4%. |
|
(2) |
As of December 31, 2017, these debt investments, warrant and equity investments, and short-term investments were not pledged as collateral as part of the Company’s revolving credit facility. |
|
(3) |
Entity is not domiciled in the United States and does not have its principal place of business in the United States. |
|
(4) |
Investment is owned by TPVG Investment LLC, a wholly owned taxable subsidiary of the Company. |
|
(5) |
Entity is publicly traded and listed on The Nasdaq Global Select Market (the “NASDAQ”). |
|
(6) |
Investment is a cash success fee or a cash exit fee payable on the consummation of certain trigger events. |
|
(7) |
Gross unrealized gains, gross unrealized losses, and net unrealized losses for federal income tax purposes totaled $5.8 million, $7.4 million and $1.6 million respectively. The tax cost of investments is $498.6 million. |
|
* |
Value as a percentage of net assets. |
See accompanying notes to consolidated financial statements.
93
TRIPLEPOINT VENTURE GROWTH BDC CORP. AND SUBSIDIARIES
CONSOLIDATED SCHEDULE OF INVESTMENTS
(in thousands)
As of December 31, 2016
|
Venture Growth Stage Company |
|
Industry |
|
Type of Investment |
|
Outstanding Principal |
|
|
Cost (9) |
|
|
Fair Value |
|
|
Maturity Date |
|||
|
Debt Investments |
|
|
|
|
|
|
|
|
|
|
|
|
|
|
|
|
|
|
|
Biofuels / Biomass |
|
|
|
|
|
|
|
|
|
|
|
|
|
|
|
|
|
|
|
Harvest Power, Inc. |
|
Biofuels / Biomass |
|
Growth Capital Loan (13.00% interest rate, 9.00% EOT payment) |
|
$ |
15,000 |
|
|
$ |
16,121 |
|
|
$ |
16,065 |
|
|
11/30/2017 |
|
Total Biofuels / Biomass - 7.44%* |
|
|
|
|
|
|
15,000 |
|
|
|
16,121 |
|
|
|
16,065 |
|
|
|
|
Business Applications Software |
|
|
|
|
|
|
|
|
|
|
|
|
|
|
|
|
|
|
|
Birst, Inc. |
|
Business Applications Software |
|
Growth Capital Loan (Prime + 6.90% interest rate, 2.00% EOT payment) |
|
|
10,000 |
|
|
|
10,086 |
|
|
|
10,109 |
|
|
11/30/2017 |
|
|
|
Business Applications Software |
|
Growth Capital Loan (Prime + 6.90% interest rate, 2.00% EOT payment) |
|
|
15,000 |
|
|
|
14,908 |
|
|
|
14,990 |
|
|
3/31/2019 |
|
|
|
Business Applications Software |
|
Growth Capital Loan (Prime + 6.90% interest rate, 2.00% EOT payment) |
|
|
2,000 |
|
|
|
1,983 |
|
|
|
1,995 |
|
|
6/30/2019 |
|
|
|
|
|
|
|
|
27,000 |
|
|
|
26,977 |
|
|
|
27,094 |
|
|
|
|
FinancialForce.com, Inc. |
|
Business Applications Software |
|
Growth Capital Loan (Prime + 7.50% interest rate, 4.00% EOT payment) |
|
|
15,000 |
|
|
|
14,308 |
|
|
|
14,396 |
|
|
12/31/2020 |
|
MapR Technologies, Inc. |
|
Business Applications Software |
|
Equipment Loan (8.00% interest rate,10.00% EOT payment) |
|
|
2,708 |
|
|
|
2,810 |
|
|
|
2,853 |
|
|
9/30/2018 |
|
|
|
Business Applications Software |
|
Equipment Lease (8.25% interest rate, 10.00% EOT payment) (1) |
|
|
145 |
|
|
|
145 |
|
|
|
146 |
|
|
1/31/2019 |
|
|
|
Business Applications Software |
|
Equipment Lease (8.25% interest rate, 10.00% EOT payment) (1) |
|
|
1,434 |
|
|
|
1,434 |
|
|
|
1,441 |
|
|
6/30/2019 |
|
|
|
Business Applications Software |
|
Equipment Loan (6.50% interest rate,10.00% EOT payment) |
|
|
860 |
|
|
|
845 |
|
|
|
845 |
|
|
6/30/2019 |
|
|
|
Business Applications Software |
|
Equipment Lease (8.50% interest rate, 10.00% EOT payment) (1) |
|
|
135 |
|
|
|
135 |
|
|
|
135 |
|
|
12/31/2019 |
|
|
|
|
|
|
|
|
5,282 |
|
|
|
5,369 |
|
|
|
5,420 |
|
|
|
|
Total Business Applications Software - 21.73%* |
|
|
|
|
47,282 |
|
|
|
46,654 |
|
|
|
46,910 |
|
|
|
||
|
Conferencing Equipment / Services |
|
|
|
|
|
|
|
|
|
|
|
|
|
|
|
|
|
|
|
Fuze, Inc. (fka Thinking Phone Networks, Inc.) |
Conferencing Equipment / Services |
|
Growth Capital Loan (11.25% interest rate, 2.85% EOT payment) |
|
|
30,000 |
|
|
|
29,453 |
|
|
|
30,096 |
|
|
9/30/2019 |
|
|
|
|
Conferencing Equipment / Services |
|
Growth Capital Loan (11.50% interest rate, 2.85% EOT payment) |
|
|
5,000 |
|
|
|
4,900 |
|
|
|
4,898 |
|
|
9/30/2019 |
|
|
|
Conferencing Equipment / Services |
|
Growth Capital Loan (11.50% interest rate, 2.85% EOT payment) |
|
|
5,000 |
|
|
|
4,899 |
|
|
|
4,897 |
|
|
9/30/2019 |
|
Total Conferencing Equipment / Services - 18.48% |
|
|
|
|
40,000 |
|
|
|
39,252 |
|
|
|
39,891 |
|
|
|
||
|
Database Software |
|
|
|
|
|
|
|
|
|
|
|
|
|
|
|
|
|
|
|
SimpliVity Corporation |
|
Database Software |
|
Growth Capital Loan (10.00% interest rate, 8.50% EOT payment) |
|
|
7,000 |
|
|
|
7,241 |
|
|
|
7,631 |
|
|
6/30/2018 |
|
|
|
Database Software |
|
Growth Capital Loan (10.00% interest rate, 8.50% EOT payment) |
|
|
3,000 |
|
|
|
3,074 |
|
|
|
3,271 |
|
|
10/31/2018 |
|
|
|
Database Software |
|
Growth Capital Loan (11.50% interest rate, 9.00% EOT payment) |
|
|
7,000 |
|
|
|
7,175 |
|
|
|
7,684 |
|
|
10/31/2018 |
|
|
|
Database Software |
|
Growth Capital Loan (11.50% interest rate, 9.00% EOT payment) |
|
|
3,000 |
|
|
|
3,057 |
|
|
|
3,293 |
|
|
12/31/2018 |
|
|
|
Database Software |
|
Growth Capital Loan (12.75% interest rate, 9.50% EOT payment) |
|
|
10,000 |
|
|
|
10,158 |
|
|
|
11,047 |
|
|
1/31/2019 |
|
|
|
Database Software |
|
Equipment Lease (6.75% interest rate, 10.00% EOT payment) (1) |
|
|
2,808 |
|
|
|
2,808 |
|
|
|
3,176 |
|
|
12/31/2018 |
|
|
|
Database Software |
|
Equipment Lease (6.75% interest rate, 7.50% EOT payment) (1) |
|
|
1,939 |
|
|
|
1,939 |
|
|
|
2,133 |
|
|
6/30/2018 |
|
|
|
Database Software |
|
Equipment Lease (7.00% interest rate, 10.00% EOT payment) (1) |
|
|
1,311 |
|
|
|
1,311 |
|
|
|
1,475 |
|
|
12/31/2018 |
|
|
|
Database Software |
|
Equipment Lease (7.00% interest rate, 10.00% EOT payment) (1) |
|
|
885 |
|
|
|
885 |
|
|
|
1,010 |
|
|
2/28/2019 |
|
|
|
Database Software |
|
Equipment Lease (7.00% interest rate, 10.00% EOT payment) (1) |
|
|
54 |
|
|
|
54 |
|
|
|
61 |
|
|
3/31/2019 |
|
|
|
Database Software |
|
Equipment Lease (9.00% interest rate, 10.00% EOT payment) (1) |
|
|
4,556 |
|
|
|
4,554 |
|
|
|
5,677 |
|
|
9/30/2018 |
|
Total Database Software - 21.52%* |
|
|
|
|
|
|
41,553 |
|
|
|
42,256 |
|
|
|
46,458 |
|
|
|
|
E-Commerce - Clothing and Accessories |
|
|
|
|
|
|
|
|
|
|
|
|
|
|
|
|
|
|
|
ModCloth, Inc. |
|
E-Commerce - Clothing and Accessories |
|
Growth Capital Loan (11.50% interest rate, 13.42% EOT payment) |
|
|
684 |
|
|
|
809 |
|
|
|
789 |
|
|
6/30/2017 |
|
|
|
E-Commerce - Clothing and Accessories |
|
Growth Capital Loan (11.50% interest rate, 13.69% EOT payment) |
|
|
1,475 |
|
|
|
1,725 |
|
|
|
1,688 |
|
|
6/30/2017 |
|
|
|
E-Commerce - Clothing and Accessories |
|
Growth Capital Loan (13.00% interest rate, 15.50% EOT payment) |
|
|
2,000 |
|
|
|
2,232 |
|
|
|
2,255 |
|
|
8/31/2017 |
|
|
|
E-Commerce - Clothing and Accessories |
|
Growth Capital Loan (13.00% interest rate, 16.00% EOT payment) |
|
|
5,000 |
|
|
|
5,545 |
|
|
|
5,606 |
|
|
11/30/2017 |
|
|
|
E-Commerce - Clothing and Accessories |
|
Growth Capital Loan (13.00% interest rate, 16.50% EOT payment) |
|
|
5,000 |
|
|
|
5,504 |
|
|
|
5,574 |
|
|
2/28/2018 |
|
|
|
E-Commerce - Clothing and Accessories |
|
Growth Capital Loan (13.00% interest rate, 11.61% EOT payment) |
|
|
4,114 |
|
|
|
4,548 |
|
|
|
4,571 |
|
|
6/30/2017 |
|
|
|
E-Commerce - Clothing and Accessories |
|
Equipment Lease (7.50% interest rate, 15.00% EOT payment) (1) |
|
|
36 |
|
|
|
36 |
|
|
|
37 |
|
|
3/31/2017 |
|
|
|
E-Commerce - Clothing and Accessories |
|
Equipment Lease (7.50% interest rate, 15.00% EOT payment) (1) |
|
|
7 |
|
|
|
7 |
|
|
|
7 |
|
|
6/30/2017 |
|
|
|
E-Commerce - Clothing and Accessories |
|
Equipment Lease (7.50% interest rate, 15.00% EOT payment) (1) |
|
|
5 |
|
|
|
5 |
|
|
|
5 |
|
|
7/31/2017 |
|
|
|
|
|
|
|
|
18,321 |
|
|
|
20,411 |
|
|
|
20,532 |
|
|
|
|
Rent the Runway, Inc. |
|
E-Commerce - Clothing and Accessories |
|
Growth Capital Loan (Prime + 7.00% interest rate, 6.25% EOT payment) |
|
|
10,000 |
|
|
|
10,116 |
|
|
|
10,554 |
|
|
11/30/2018 |
|
|
|
E-Commerce - Clothing and Accessories |
|
Growth Capital Loan (Prime + 6.25% interest rate, 6.25% EOT payment) |
|
|
6,000 |
|
|
|
5,970 |
|
|
|
6,221 |
|
|
6/30/2019 |
|
|
|
E-Commerce - Clothing and Accessories |
|
Growth Capital Loan (Prime + 6.25% interest rate, 6.25% EOT payment) |
|
|
2,000 |
|
|
|
1,972 |
|
|
|
2,065 |
|
|
10/31/2019 |
|
|
|
E-Commerce - Clothing and Accessories |
|
Growth Capital Loan (Prime + 6.25% interest rate, 4.50% EOT payment) |
|
|
4,000 |
|
|
|
3,934 |
|
|
|
4,034 |
|
|
11/30/2019 |
|
|
|
|
|
|
|
|
22,000 |
|
|
|
21,992 |
|
|
|
22,874 |
|
|
|
|
Total E-Commerce - Clothing and Accessories - 20.11%* |
|
|
|
|
40,321 |
|
|
|
42,403 |
|
|
|
43,406 |
|
|
|
||
|
E-Commerce - Personal Goods |
|
|
|
|
|
|
|
|
|
|
|
|
|
|
|
|
|
|
|
Birchbox, Inc. |
|
E-Commerce - Personal Goods |
|
Growth Capital Loan (10.00% interest rate, 8.00% EOT payment) |
|
|
5,000 |
|
|
|
5,104 |
|
|
|
5,095 |
|
|
2/28/2019 |
|
|
|
E-Commerce - Personal Goods |
|
Growth Capital Loan (10.00% interest rate, 7.00% EOT payment) |
|
|
5,000 |
|
|
|
5,111 |
|
|
|
5,057 |
|
|
2/28/2019 |
|
|
|
E-Commerce - Personal Goods |
|
Growth Capital Loan (10.25% interest rate, 8.00% EOT payment) |
|
|
10,000 |
|
|
|
10,082 |
|
|
|
10,096 |
|
|
7/31/2019 |
|
Total E-Commerce - Personal Goods - 9.38%* |
|
|
|
|
20,000 |
|
|
|
20,297 |
|
|
|
20,248 |
|
|
|
||
|
Entertainment |
|
|
|
|
|
|
|
|
|
|
|
|
|
|
|
|
|
|
|
Mind Candy Limited (1) (3) |
|
Entertainment |
|
Growth Capital Loan (12.00% interest rate, 9.50% EOT payment) |
|
|
9,000 |
|
|
|
9,781 |
|
|
|
7,430 |
|
|
6/30/2017 |
|
Total Entertainment - 3.44%* |
|
|
|
|
|
|
9,000 |
|
|
|
9,781 |
|
|
|
7,430 |
|
|
|
|
Financial Institution and Services |
|
|
|
|
|
|
|
|
|
|
|
|
|
|
|
|
|
|
|
KnCMiner AB (1) (3) (7) |
|
Financial Institution and Services |
|
Growth Capital Loan (9.00% interest rate, 6.00% EOT payment) |
|
|
3,758 |
|
|
|
3,809 |
|
|
|
3,231 |
|
|
6/30/2018 |
|
|
|
Financial Institution and Services |
|
Growth Capital Loan (9.25% interest rate, 6.00% EOT payment) |
|
|
1,798 |
|
|
|
1,795 |
|
|
|
1,546 |
|
|
6/30/2018 |
|
|
|
|
|
|
|
|
5,556 |
|
|
|
5,604 |
|
|
|
4,777 |
|
|
|
|
WorldRemit Limited (1) (3) |
|
Financial Institution and Services |
|
Growth Capital Loan (Prime + 8.75% interest rate, 10.00% EOT payment) |
|
|
5,000 |
|
|
|
5,075 |
|
|
|
5,088 |
|
|
12/31/2018 |
|
|
|
Financial Institution and Services |
|
Growth Capital Loan (Prime + 8.75% interest rate, 10.00% EOT payment) |
|
|
5,000 |
|
|
|
4,950 |
|
|
|
5,005 |
|
|
6/30/2019 |
|
|
|
Financial Institution and Services |
|
Growth Capital Loan (Prime + 8.75% interest rate, 10.00% EOT payment) |
|
|
5,000 |
|
|
|
4,941 |
|
|
|
5,005 |
|
|
6/30/2019 |
|
|
|
Financial Institution and Services |
|
Growth Capital Loan (Prime + 8.75% interest rate, 10.00% EOT payment) |
|
|
5,000 |
|
|
|
4,851 |
|
|
|
4,940 |
|
|
11/30/2019 |
|
|
|
|
|
|
|
|
20,000 |
|
|
|
19,817 |
|
|
|
20,038 |
|
|
|
|
Total Financial Institution and Services - 11.50%* |
|
|
|
|
25,556 |
|
|
|
25,421 |
|
|
|
24,815 |
|
|
|
||
|
Network Systems Management Software |
|
|
|
|
|
|
|
|
|
|
|
|
|
|
|
|
|
|
|
Virtual Instruments Corporation |
|
Network Systems Management Software |
|
Growth Capital Loan (10.00% interest rate) |
|
|
5,000 |
|
|
|
5,000 |
|
|
|
4,994 |
|
|
4/4/2020 |
|
|
|
Network Systems Management Software |
|
Growth Capital Loan (5.00% interest rate) (5) |
|
|
21,155 |
|
|
|
21,155 |
|
|
|
18,662 |
|
|
4/4/2021 |
|
|
|
Network Systems Management Software |
|
Growth Capital Loan (5.00% interest rate) (5) |
|
|
5,076 |
|
|
|
5,076 |
|
|
|
4,291 |
|
|
4/4/2021 |
|
Total Network Systems Management Software - 12.95%* |
|
|
|
|
31,231 |
|
|
|
31,231 |
|
|
|
27,947 |
|
|
|
||
|
Restaurant / Food Service |
|
|
|
|
|
|
|
|
|
|
|
|
|
|
|
|
|
|
|
Munchery, Inc. |
|
Restaurant / Food Service |
|
Growth Capital Loan (Prime + 7.00% interest rate, 6.75% EOT payment) |
|
|
3,000 |
|
|
|
2,972 |
|
|
|
3,003 |
|
|
6/30/2019 |
|
Total Restaurant / Food Service - 1.39%* |
|
|
|
|
|
|
3,000 |
|
|
|
2,972 |
|
|
|
3,003 |
|
|
|
|
Security Services |
|
|
|
|
|
|
|
|
|
|
|
|
|
|
|
|
|
|
|
CrowdStrike, Inc. |
|
Security Services |
|
Growth Capital Loan (Prime + 7.75% interest rate, 0.50% EOT payment) |
|
|
20,000 |
|
|
|
18,715 |
|
|
|
18,715 |
|
|
12/31/2020 |
|
Forgerock, Inc. |
|
Security Services |
|
Growth Capital Loan (Prime + 6.75% interest rate, 8.50% EOT payment) |
|
|
10,000 |
|
|
|
10,085 |
|
|
|
10,150 |
|
|
9/30/2019 |
|
|
|
Security Services |
|
Growth Capital Loan (Prime + 6.75% interest rate, 8.50% EOT payment) |
|
|
5,000 |
|
|
|
4,948 |
|
|
|
4,976 |
|
|
2/29/2020 |
|
|
|
|
|
|
|
|
15,000 |
|
|
|
15,033 |
|
|
|
15,126 |
|
|
|
|
Total Security Services - 15.68%* |
|
|
|
|
|
|
35,000 |
|
|
|
33,748 |
|
|
|
33,841 |
|
|
|
See accompanying notes to consolidated financial statements.
94
TRIPLEPOINT VENTURE GROWTH BDC CORP. AND SUBSIDIARIES
CONSOLIDATED SCHEDULE OF INVESTMENTS
(in thousands)
As of December 31, 2016
|
Venture Growth Stage Company |
|
Industry |
|
Type of Investment |
|
Outstanding Principal |
|
|
Cost (9) |
|
|
Fair Value |
|
|
Maturity Date |
|||
|
Debt Investments (continued) |
|
|
|
|
|
|
|
|
|
|
|
|
|
|
|
|
|
|
|
Shopping Facilitators |
|
|
|
|
|
|
|
|
|
|
|
|
|
|
|
|
|
|
|
Farfetch UK Limited (1) (3) |
|
Shopping Facilitators |
|
Growth Capital Loan (Prime + 8.25% interest rate, 9.00% EOT payment) |
|
$ |
10,000 |
|
|
$ |
9,975 |
|
|
$ |
10,410 |
|
|
3/31/2020 |
|
|
|
Shopping Facilitators |
|
Growth Capital Loan (Prime + 6.75% interest rate, 8.50% EOT payment) |
|
|
5,000 |
|
|
|
5,008 |
|
|
|
5,211 |
|
|
1/31/2020 |
|
|
|
Shopping Facilitators |
|
Growth Capital Loan (Prime + 6.75% interest rate, 8.50% EOT payment) |
|
|
5,000 |
|
|
|
4,842 |
|
|
|
5,034 |
|
|
6/30/2020 |
|
Total Shopping Facilitators - 9.57%* |
|
|
|
|
|
|
20,000 |
|
|
|
19,825 |
|
|
|
20,655 |
|
|
|
|
Wireless Communications Equipment |
|
|
|
|
|
|
|
|
|
|
|
|
|
|
|
|
|
|
|
Cambridge Broadband Network Limited (1) (3) |
Wireless Communications Equipment |
|
Growth Capital Loan (Prime + 10.75% interest rate) |
|
|
6,045 |
|
|
|
6,271 |
|
|
|
6,271 |
|
|
12/31/2017 |
|
|
Xirrus, Inc. |
|
Wireless Communications Equipment |
|
Growth Capital Loan (Prime + 10.25% interest rate, 12.04% EOT payment) (5) |
1,378 |
|
|
|
1,719 |
|
|
|
1,684 |
|
|
12/31/2016 (8) |
||
|
|
|
Wireless Communications Equipment |
|
Growth Capital Loan (Prime + 10.25% interest rate, 13.01% EOT payment) (5) |
3,029 |
|
|
|
3,627 |
|
|
|
3,566 |
|
|
12/31/2016 (8) |
||
|
|
|
Wireless Communications Equipment |
|
Growth Capital Loan (Prime + 10.25% interest rate, 13.75% EOT payment) (5) |
3,547 |
|
|
|
4,135 |
|
|
|
4,106 |
|
|
3/31/2017 |
||
|
|
|
Wireless Communications Equipment |
|
Growth Capital Loan (Prime + 10.25% interest rate, 15.82% EOT payment) (5) |
9,982 |
|
|
|
10,794 |
|
|
|
11,224 |
|
|
12/31/2017 |
||
|
|
|
Wireless Communications Equipment |
|
Growth Capital Loan (12.00% interest rate) (2) (5) |
|
|
2,564 |
|
|
|
2,552 |
|
|
|
2,487 |
|
|
10/16/2017 |
|
|
|
|
|
|
|
|
20,500 |
|
|
|
22,827 |
|
|
|
23,067 |
|
|
|
|
Total Wireless Communications Equipment - 13.59%* |
|
|
|
|
26,545 |
|
|
|
29,098 |
|
|
|
29,338 |
|
|
|
||
|
Total Debt Investments - 166.78%* |
|
|
|
|
|
$ |
354,488 |
|
|
$ |
359,059 |
|
|
$ |
360,007 |
|
|
|
See accompanying notes to consolidated financial statements.
95
TRIPLEPOINT VENTURE GROWTH BDC CORP. AND SUBSIDIARIES
CONSOLIDATED SCHEDULE OF INVESTMENTS
(in thousands)
As of December 31, 2016
|
Venture Growth Stage Company |
|
Industry |
|
Type of Warrant |
|
Shares |
|
|
Cost (9) |
|
|
Fair Value |
|
|||
|
Warrant Investments |
|
|
|
|
|
|
|
|
|
|
|
|
|
|
|
|
|
Advertising / Marketing |
|
|
|
|
|
|
|
|
|
|
|
|
|
|
|
|
|
InMobi Pte Ltd. (1) (2) (3) |
|
Advertising / Marketing |
|
Ordinary Shares |
|
|
48,500 |
|
|
$ |
35 |
|
|
$ |
106 |
|
|
Total Advertising / Marketing - 0.05%* |
|
|
|
|
|
|
48,500 |
|
|
|
35 |
|
|
|
106 |
|
|
Biofuels / Biomass |
|
|
|
|
|
|
|
|
|
|
|
|
|
|
|
|
|
Harvest Power, Inc. |
|
Biofuels / Biomass |
|
Common Stock |
|
|
350 |
|
|
|
77 |
|
|
|
— |
|
|
Total Biofuels / Biomass - 0.00%* |
|
|
|
|
|
|
350 |
|
|
|
77 |
|
|
|
— |
|
|
Business Applications Software |
|
|
|
|
|
|
|
|
|
|
|
|
|
|
|
|
|
Birst, Inc. |
|
Business Applications Software |
|
Preferred Stock |
|
|
428,491 |
|
|
|
129 |
|
|
|
39 |
|
|
FinancialForce.com, Inc. (2) |
|
Business Applications Software |
|
Preferred Stock |
|
|
195,170 |
|
|
|
508 |
|
|
|
508 |
|
|
Lattice Engines, Inc. (2) |
|
Business Applications Software |
|
Preferred Stock |
|
|
396,652 |
|
|
|
48 |
|
|
|
95 |
|
|
MapR Technologies, Inc. |
|
Business Applications Software |
|
Preferred Stock |
|
|
256,388 |
|
|
|
42 |
|
|
|
92 |
|
|
Medallia, Inc. (2) |
|
Business Applications Software |
|
Preferred Stock |
|
|
55,814 |
|
|
|
11 |
|
|
|
87 |
|
|
Total Business Applications Software - 0.38%* |
|
|
|
|
|
|
1,332,515 |
|
|
|
738 |
|
|
|
821 |
|
|
Business to Business Marketplace |
|
|
|
|
|
|
|
|
|
|
|
|
|
|
|
|
|
Optoro, Inc. (2) |
|
Business to Business Marketplace |
|
Preferred Stock |
|
|
10,346 |
|
|
|
40 |
|
|
|
9 |
|
|
Total Business to Business Marketplace - 0.00%* |
|
|
|
|
|
|
10,346 |
|
|
|
40 |
|
|
|
9 |
|
|
Conferencing Equipment / Services |
|
|
|
|
|
|
|
|
|
|
|
|
|
|
|
|
|
Fuze, Inc. (fka Thinking Phone Networks, Inc.) |
|
Conferencing Equipment / Services |
|
Preferred Stock |
|
|
323,471 |
|
|
|
670 |
|
|
|
633 |
|
|
Total Conferencing Equipment / Services - 0.29%* |
|
|
|
|
|
|
323,471 |
|
|
|
670 |
|
|
|
633 |
|
|
Database Software |
|
|
|
|
|
|
|
|
|
|
|
|
|
|
|
|
|
SimpliVity Corporation |
|
Database Software |
|
Preferred Stock |
|
|
770,201 |
|
|
|
936 |
|
|
|
— |
|
|
Total Database Software - 0.00%* |
|
|
|
|
|
|
770,201 |
|
|
|
936 |
|
|
|
— |
|
|
E-Commerce - Clothing and Accessories |
|
|
|
|
|
|
|
|
|
|
|
|
|
|
|
|
|
JackThreads, Inc. (2) |
|
E-Commerce - Clothing and Accessories |
|
Common Stock |
|
|
283,401 |
|
|
|
88 |
|
|
|
77 |
|
|
ModCloth, Inc. |
|
E-Commerce - Clothing and Accessories |
|
Preferred Stock |
|
|
5,590,041 |
|
|
|
746 |
|
|
|
503 |
|
|
Rent the Runway, Inc. |
|
E-Commerce - Clothing and Accessories |
|
Preferred Stock |
|
|
88,037 |
|
|
|
213 |
|
|
|
828 |
|
|
Rent the Runway, Inc. |
|
E-Commerce - Clothing and Accessories |
|
Common Stock |
|
|
82,891 |
|
|
|
331 |
|
|
|
1,155 |
|
|
Total E-Commerce - Clothing and Accessories - 1.19%* |
|
|
|
|
|
|
6,044,370 |
|
|
|
1,378 |
|
|
|
2,563 |
|
|
E-Commerce - Personal Goods |
|
|
|
|
|
|
|
|
|
|
|
|
|
|
|
|
|
Birchbox, Inc. |
|
E-Commerce - Personal Goods |
|
Preferred Stock |
|
|
60,052 |
|
|
|
690 |
|
|
|
1,406 |
|
|
Total E-Commerce - Personal Goods - 0.65%* |
|
|
|
|
|
|
60,052 |
|
|
|
690 |
|
|
|
1,406 |
|
|
Entertainment |
|
|
|
|
|
|
|
|
|
|
|
|
|
|
|
|
|
Mind Candy, Inc. (1) (3) |
|
Entertainment |
|
Preferred Stock |
|
|
287,187 |
|
|
|
751 |
|
|
|
— |
|
|
Total Entertainment - 0.00%* |
|
|
|
|
|
|
287,187 |
|
|
|
751 |
|
|
|
— |
|
|
Financial Institution and Services |
|
|
|
|
|
|
|
|
|
|
|
|
|
|
|
|
|
WorldRemit Limited (1) (3) |
|
Financial Institution and Services |
|
Preferred Stock |
|
|
96,216 |
|
|
|
279 |
|
|
|
307 |
|
|
Total Financial Institution and Services - 0.14%* |
|
|
|
|
|
|
96,216 |
|
|
|
279 |
|
|
|
307 |
|
|
General Media and Content |
|
|
|
|
|
|
|
|
|
|
|
|
|
|
|
|
|
TechMediaNetwork, Inc. (2) |
|
General Media and Content |
|
Preferred Stock |
|
|
72,234 |
|
|
|
31 |
|
|
|
28 |
|
|
Thrillist Media Group, Inc. (2) |
|
General Media and Content |
|
Common Stock |
|
|
774,352 |
|
|
|
624 |
|
|
|
1,394 |
|
|
Total General Media and Content - 0.66%* |
|
|
|
|
|
|
846,586 |
|
|
|
655 |
|
|
|
1,422 |
|
|
Medical Software and Information Services |
|
|
|
|
|
|
|
|
|
|
|
|
|
|
|
|
|
AirStrip Technologies, Inc. (2) |
|
Medical Software and Information Services |
|
Preferred Stock |
|
|
31,063 |
|
|
|
112 |
|
|
|
74 |
|
|
Total Medical Software and Information Services - 0.03%* |
|
|
|
|
|
|
31,063 |
|
|
|
112 |
|
|
|
74 |
|
|
Multimedia / Streaming Software |
|
|
|
|
|
|
|
|
|
|
|
|
|
|
|
|
|
Shazam Entertainment Limited (1) (2) (3) |
|
Multimedia / Streaming Software |
|
Ordinary Shares |
|
|
2,669,479 |
|
|
|
134 |
|
|
|
166 |
|
|
Total Multimedia / Streaming Software - 0.08%* |
|
|
|
|
|
|
2,669,479 |
|
|
|
134 |
|
|
|
166 |
|
|
Restaurant / Food Service |
|
|
|
|
|
|
|
|
|
|
|
|
|
|
|
|
|
Green Chef Corporation (2) |
|
Restaurant / Food Service |
|
Preferred Stock |
|
|
315,211 |
|
|
|
98 |
|
|
|
98 |
|
|
Munchery, Inc. |
|
Restaurant / Food Service |
|
Preferred Stock |
|
|
222,640 |
|
|
|
45 |
|
|
|
45 |
|
|
Total Restaurant / Food Service - 0.07%* |
|
|
|
|
|
|
537,851 |
|
|
|
143 |
|
|
|
143 |
|
|
Security Services |
|
|
|
|
|
|
|
|
|
|
|
|
|
|
|
|
|
CrowdStrike, Inc. |
|
Security Services |
|
Preferred Shares |
|
|
99,344 |
|
|
|
72 |
|
|
|
72 |
|
|
Forgerock, Inc. |
|
Security Services |
|
Preferred Stock |
|
|
97,996 |
|
|
|
155 |
|
|
|
209 |
|
|
Total Security Services - 0.13%* |
|
|
|
|
|
|
197,340 |
|
|
|
227 |
|
|
|
281 |
|
|
Shopping Facilitators |
|
|
|
|
|
|
|
|
|
|
|
|
|
|
|
|
|
Farfetch UK Limited (1) (3) |
|
Shopping Facilitators |
|
Preferred Stock |
|
|
37,998 |
|
|
|
170 |
|
|
|
183 |
|
|
Total Shopping Facilitators - 0.08%* |
|
|
|
|
|
|
37,998 |
|
|
|
170 |
|
|
|
183 |
|
|
Travel and Leisure |
|
|
|
|
|
|
|
|
|
|
|
|
|
|
|
|
|
Inspirato, LLC (2) |
|
Travel and Leisure |
|
Preferred Units |
|
|
1,994 |
|
|
|
37 |
|
|
|
40 |
|
|
Total Travel and Leisure - 0.02%* |
|
|
|
|
|
|
1,994 |
|
|
|
37 |
|
|
|
40 |
|
|
Wireless Communications Equipment |
|
|
|
|
|
|
|
|
|
|
|
|
|
|
|
|
|
Cambridge Broadband Network Limited (1) (3) |
|
Wireless Communications Equipment |
|
Preferred Shares |
|
|
33,000 |
|
|
|
95 |
|
|
|
4 |
|
|
Eero, Inc. (2) |
|
Wireless Communications Equipment |
|
Preferred Stock |
|
|
35,446 |
|
|
|
80 |
|
|
|
80 |
|
|
Xirrus, Inc. |
|
Wireless Communications Equipment |
|
Preferred Stock |
|
|
6,446,763 |
|
|
|
787 |
|
|
|
— |
|
|
Total Wireless Communications Equipment - 0.04%* |
|
|
|
|
|
|
6,515,209 |
|
|
|
962 |
|
|
|
84 |
|
|
Total Warrant Investments - 3.82%* |
|
|
|
|
|
|
|
|
|
$ |
8,034 |
|
|
$ |
8,238 |
|
See accompanying notes to consolidated financial statements.
96
TRIPLEPOINT VENTURE GROWTH BDC CORP. AND SUBSIDIARIES
CONSOLIDATED SCHEDULE OF INVESTMENTS
(in thousands)
As of December 31, 2016
|
Venture Growth Stage Company |
|
Industry |
|
Type of Warrant |
|
Shares |
|
|
Cost (9) |
|
|
Fair Value |
|
|||
|
Equity Investments (2) |
|
|
|
|
|
|
|
|
|
|
|
|
|
|
|
|
|
Business Applications Software |
|
|
|
|
|
|
|
|
|
|
|
|
|
|
|
|
|
Birst, Inc. |
|
Business Applications Software |
|
Preferred Stock |
|
|
42,801 |
|
|
$ |
250 |
|
|
$ |
184 |
|
|
MapR Technologies, Inc. |
|
Business Applications Software |
|
Preferred Stock |
|
|
36,264 |
|
|
|
150 |
|
|
|
150 |
|
|
Total Business Applications Software - 0.15%* |
|
|
|
|
|
|
79,065 |
|
|
|
400 |
|
|
|
334 |
|
|
Database Software |
|
|
|
|
|
|
|
|
|
|
|
|
|
|
|
|
|
Nutanix, Inc. (6) |
|
Database Software |
|
Common Stock |
|
|
173,731 |
|
|
|
1,078 |
|
|
|
4,430 |
|
|
Total Database Software - 2.05%* |
|
|
|
|
|
|
173,731 |
|
|
|
1,078 |
|
|
|
4,430 |
|
|
E-Commerce - Personal Goods |
|
|
|
|
|
|
|
|
|
|
|
|
|
|
|
|
|
Birchbox, Inc. |
|
E-Commerce - Personal Goods |
|
Preferred Stock |
|
|
2,839 |
|
|
|
250 |
|
|
|
292 |
|
|
Birchbox, Inc. |
|
E-Commerce - Personal Goods |
|
Convertible Note (8.00% interest rate) |
— |
|
|
|
45 |
|
|
|
130 |
|
||
|
Total E-Commerce - Personal Goods - 0.20%* |
|
|
|
|
|
|
2,839 |
|
|
|
295 |
|
|
|
422 |
|
|
Software Development Tools |
|
|
|
|
|
|
|
|
|
|
|
|
|
|
|
|
|
Inspirato, LLC (1) (4) |
|
Travel and Leisure |
|
Preferred Units |
|
|
1,948 |
|
|
|
250 |
|
|
|
258 |
|
|
Total Software Development Tools - 0.12%* |
|
|
|
|
|
|
1,948 |
|
|
|
250 |
|
|
|
258 |
|
|
Software Development Tools |
|
|
|
|
|
|
|
|
|
|
|
|
|
|
|
|
|
MongoDB, Inc. |
|
Software Development Tools |
|
Common Stock |
|
|
74,742 |
|
|
|
1,000 |
|
|
|
622 |
|
|
Total Software Development Tools - 0.29%* |
|
|
|
|
|
|
74,742 |
|
|
|
1,000 |
|
|
|
622 |
|
|
Total Equity Investments - 2.81%* |
|
|
|
|
|
|
|
|
|
$ |
3,023 |
|
|
$ |
6,066 |
|
|
|
|
|
|
|
|
|
|
|
|
|
|
|
|
|
|
|
|
Total Investments in Portfolio Companies - 173.40%* |
|
|
|
|
|
|
|
|
|
$ |
370,116 |
|
|
$ |
374,311 |
|
|
|
|
|
|
|
|
|
|
|
|
|
|
|
|
|
|
|
|
Short-Term Investments (2) |
|
|
|
|
|
|
|
|
|
Cost |
|
|
Fair Value |
|
||
|
U.S. Treasury Bills |
|
$40,000 Face Value Maturity Date 1/26/2017 Yield to Maturity 0.40% |
|
|
|
|
|
$ |
39,990 |
|
|
$ |
39,990 |
|
||
|
Total Short-Term Investments - 18.53%* |
|
|
|
|
|
|
|
|
|
$ |
39,990 |
|
|
$ |
39,990 |
|
|
|
|
|
|
|
|
|
|
|
|
|
|
|
|
|
|
|
|
Total Investments - 191.93%* |
|
|
|
|
|
|
|
|
|
$ |
410,106 |
|
|
$ |
414,301 |
|
______________
|
(1) |
Investment is a non-qualifying asset under Section 55(a) of the Investment Company Act of 1940, as amended (the “1940 Act”). As of December 31, 2016, non-qualifying assets as a percentage of total assets were 17.4%. |
|
(2) |
As of December 31, 2016, these debt investments, warrant and equity investments, and short-term investments were not pledged as collateral as part of the Company’s revolving credit facility. |
|
(3) |
Entity is not domiciled in the United States and does not have its principal place of business in the United States. |
|
(4) |
Investment is owned by TPVG Investment LLC, a wholly owned taxable subsidiary of the Company. |
|
(5) |
Debt investment has a payment-in-kind (“PIK”) feature |
|
(6) |
Entity is publicly traded and listed on The Nasdaq Global Select Market (the “NASDAQ”). |
|
(7) |
As of December 31, 2016, the Company’s debt investments in KnCMiner AB include risk and time discounted expected recoveries of cash from completed asset sales and equity in GoGreenHost AB (fka GoGreen Light AB), which acquired certain assets from KnCMiner AB. |
|
(8) |
The maturity date was extended to March 31, 2017 during the first quarter of 2017. |
|
(9) |
Gross unrealized gains, gross unrealized losses, and net unrealized gains for federal income tax purposes totaled $14.6 million, $10.3 million and $4.3 million respectively. The tax cost of investments is $410.0 million. |
|
* |
Value as a percentage of net assets. |
See accompanying notes to consolidated financial statements.
97
TRIPLEPOINT VENTURE GROWTH BDC CORP. AND SUBSIDIARIES
CONSOLIDATED SCHEDULES OF INVESTMENTS
As of December 31, 2017 and December 31, 2016
NOTES TO CONSOLIDATED SCHEDULES OF INVESTMENTS
Notes applicable to the investments presented in the foregoing tables:
No investment represents a 5% or greater interest in any outstanding class of voting security of the portfolio company.
Notes applicable to the debt investments presented in the foregoing tables:
Interest rate is the annual interest rate on the debt investment and does not include any original issue discount, end-of-term (“EOT”) payment, or any additional fees related to the investments, such as deferred interest, commitment fees or prepayment fees.
For each debt investment tied to the Prime Rate, “Prime”, the current rate is 4.50% as of December 31, 2017.
The EOT payments are contractual and fixed interest payments due in cash at the maturity date of the loan, including upon prepayment, and are a fixed percentage of the original principal balance of the loan unless otherwise noted. The EOT payment is amortized and recognized as non-cash income over the loan or lease prior to its payment.
Some of the terms noted in the foregoing tables are subject to change based on certain events such as prepayments.
Notes applicable to the equipment leases presented in the foregoing tables:
At the end of the term of certain equipment leases, the lessee has the option to purchase the underlying assets at fair market value in certain cases subject to a cap, return the equipment or continue to finance the assets. The fair market values of the financed assets have been estimated as a percentage of original cost for purposes of the EOT payment value.
Notes applicable to the warrant investments presented in the foregoing tables:
Warrant investments are associated with funded debt instruments as well as certain commitments to provide future funding.
See accompanying notes to consolidated financial statements.
98
TRIPLEPOINT VENTURE GROWTH BDC CORP. AND SUBSIDIARIES
NOTES TO CONSOLIDATED FINANCIAL STATEMENTS
TriplePoint Venture Growth BDC Corp. (the “Company”), a Maryland corporation, was formed on June 28, 2013 and priced its initial public offering and commenced investment operations on March 5, 2014. The Company is structured as an externally-managed non-diversified, closed-end investment company that has elected to be treated as a business development company (“BDC”) under the Investment Company Act of 1940, as amended (the “1940 Act”). As a BDC, the Company expects to qualify annually as a regulated investment company (“RIC”) under Subchapter M of the Internal Revenue Code of 1986, as amended (the “Code”).
The Company was formed to expand the venture growth stage business segment of TriplePoint Capital LLC’s (“TPC”) investment platform. TPC is widely recognized as a leading global financing provider devoted to serving venture capital-backed companies with creative, flexible and customized debt financing, equity capital and complementary services throughout their lifespan. The Company’s investment objective is to maximize total return to stockholders primarily in the form of current income and, to a lesser extent, capital appreciation by primarily lending to venture growth stage companies focused in technology, life sciences and other high growth industries backed by TPC’s select group of leading venture capital investors. The Company is externally managed by TPVG Advisers LLC (the “Adviser”) which is registered as an investment adviser under the 1940 Act and is a wholly owned subsidiary of TPC. The Adviser is responsible for sourcing, reviewing and structuring investment opportunities, underwriting and performing due diligence on investments and monitoring the investment portfolio on an ongoing basis. The Adviser was organized in August 2013 and, pursuant to an investment advisory agreement entered into between the Company and the Adviser, the Company pays the Adviser a base management fee and an incentive fee for its services. The Company has also entered into an administration agreement with TPVG Administrator LLC (the “Administrator”), a wholly owned subsidiary of the Adviser, and pays fees and expenses for services provided.
The Company has two wholly owned subsidiaries: TPVG Variable Funding Company LLC (the “Financing Subsidiary”), a bankruptcy remote special purpose entity established for utilizing the Company’s revolving credit facility, and TPVG Investment LLC, an entity established for holding certain of the Company’s investments in order to benefit from the tax treatment of these investments and create a tax structure that is more advantageous with respect to the Company’s RIC status. These subsidiaries are consolidated in the financial statements of the Company.
Note 2. Significant Accounting Policies
Basis of Presentation and Principles of Consolidation
The accompanying financial statements of the Company and related financial information have been prepared in accordance with generally accepted accounting principles in the United States of America (“GAAP”) and include the accounts of the Company and its consolidated subsidiaries. The consolidated financial statements reflect all adjustments and reclassifications that are necessary for the fair representation of financial results as of and for the periods presented. All intercompany account balances and transactions have been eliminated. Certain balances from prior years have been reclassified in order to conform to the current year presentation. As an investment company, the Company follows accounting and reporting guidance as set forth in Topic 946 (“Financial Services – Investment Companies”) of the Financial Accounting Standards Board’s (“FASB”) Accounting Standards Codification, as amended (“ASC”).
Use of Estimates
The preparation of the accompanying consolidated financial statements in conformity with GAAP requires estimates and assumptions to be made that affect the reported amounts of assets and liabilities at the date of the consolidated financial statements and the reported amounts of income and expenses during the reporting period. Changes in the economic environment, financial markets, creditworthiness of portfolio companies and any other parameters used in determining these estimates could cause actual results to differ from those estimates.
Investments
Investment transactions are recorded on a trade-date basis. The Company’s investments are carried at fair value in accordance with the 1940 Act and ASC Topic 946 and measured in accordance with ASC Topic 820 (“Fair Value Measurements”). Fair value is a market-based measure considered from the perspective of the market’s participant who holds the financial instrument rather than an entity specific measure. When market assumptions are not readily available, the Company’s own assumptions are set to reflect those that the Adviser believes market participants would use in pricing the financial instruments on the measurement date.
99
The availability of observable inputs can vary depending on the financial instrument and is affected by a variety of factors. To the extent the valuation is based on models or inputs that are less observable the determination of fair value requires more judgment. The Company’s valuation methodology is approved by the Company’s Board of Directors (the “Board”) and the Board is responsible for the fair values determined. As markets change, new types of investments are made, or pricing for certain investments becomes more or less observable, the Board may refine its valuation methodologies to best reflect the fair value of its investments appropriately.
Cash
The Company places its cash with financial institutions and at times, cash held in such accounts may exceed the Federal Deposit Insurance Corporation insured limit. The Company may invest a portion of its cash in money market funds, within the limitations of the 1940 Act.
Restricted Cash
Restricted cash consists of collections of interest and principal payments on investments maintained in segregated trust accounts for the benefit of the lenders and administrative agent of the Company’s revolving credit facility.
Deferred Credit Facility Costs
Deferred credit facility costs represent fees and other expenses incurred in connection with the Company’s revolving credit facility. These amounts are amortized and included in interest expense in the consolidated statements of operations over the estimated term of the facility.
Other Accrued Expenses and Liabilities
Other accrued expenses and liabilities include interest payable, accounts payable and the fair value of unfunded commitment liabilities. Unfunded commitment liabilities reflect the fact that the Company is a party to certain delay draw credit agreements with its portfolio companies, which requires the Company to make future advances at the borrowers’ discretion during a defined loan availability period. The Company’s credit agreements contain customary lending provisions that allow the Company relief from funding previously made commitments in instances where the underlying portfolio company experiences materially adverse events that affect the financial condition or business outlook for the portfolio company. In certain instances, the borrower may be required to achieve certain milestones before they may request a future advance. The unfunded obligation associated with these credit agreements is equal to the amount by which the contractual funding commitment exceeds the sum of the amount of funded debt unless the availability period has expired. The fair value at the inception of the agreement of the delay draw credit agreements approximates the fair value of the warrant investments received to enter into these agreements, taking into account the remaining terms of the agreements and the counterparties’ credit profile. The unfunded commitment liability included in the Company’s consolidated statements of assets and liabilities reflects the fair value of these future funding commitments.
Paid-in Capital
The Company records the proceeds from the sale of its common stock on a net basis to capital stock and paid-in capital in excess of par value, excluding all offering costs.
Income Recognition
Interest income, adjusted for amortization of market premium and accretion of market discount, is recorded on an accrual basis to the extent that the Company expects to collect such amounts. Original issue discount, principally representing the estimated fair value of detachable equity or warrant investments obtained in conjunction with the Company’s debt investments, and market discount or premium are capitalized and accreted or amortized into interest income over the life of the respective security using the effective interest method. Loan origination fees received in connection with the closing of investments are reported as unearned income which is included as amortized cost of the investment; the unearned income from such fees is accreted over the contractual life of the loan based on the effective interest method as interest income. Upon prepayment of a loan or debt security, unamortized loan origination fees and unamortized market discounts are recorded as interest income. End-of-term (EOT) payments are contractual and fixed interest payments due in cash at the maturity date of the loan, including upon prepayment, and are a fixed percentage of the original principal balance of the loan unless otherwise noted. Interest is accrued during the life of the loan on the EOT payment using the effective interest method as non-cash income. The EOT payment generally ceases accruing to the extent the borrower is unable to pay the remaining principal and interest due. The EOT payment may also include a cash success fee due upon the earlier of the maturity date of the loans or in the event of a certain milestone reached by the portfolio company.
100
For debt investments with contractual payment-in-kind (“PIK”) interest, which represents contractual interest accrued and added to the principal balance that generally becomes due at maturity, the Company does not accrue PIK interest if it is deemed uncollectible.
Other income includes certain fees paid by portfolio companies (for example, extension fees, revolver loan facility fees, prepayment fees) and the recognition of the value of unfunded commitments that expired during the reporting period.
Non-accrual loans
A loan may be left on accrual status during the period the Company is pursuing repayment of the loan. The Company reviews all loans that become 90 days or more past due on principal and interest, or when there is reasonable doubt that principal or interest will be collected, for possible placement on non-accrual status. When a loan is placed on non-accrual status, unpaid interest credited to income is reversed. Additionally, any original issue discount and market discount are no longer accreted to interest income as of the date the loan is placed on non-accrual status. Interest payments received on non-accrual loans may be recognized as income or applied to principal depending upon the Company’s judgment. Non-accrual loans are restored to accrual status when past due principal and interest is paid and, in the Company’s judgment, payments are probable to remain current.
Realized/Unrealized Gains or Losses
The Company measures realized gains or losses from the repayment or sale of investments using the specific identification method. The amortized cost basis of investments represents the original cost adjusted for the accretion/amortization of discounts and premiums and upfront loan origination fees. The Company reports changes in fair value of investments that are measured at fair value as a component of net change in unrealized gain (loss) on investments in the consolidated statements of operations.
Management Fees
The Company accrues for the base management fee and incentive fee. The accrual for incentive fee includes the recognition of incentive fees on unrealized gains, even though such incentive fees are neither earned nor payable to the Adviser until the gains are both realized and in excess of unrealized losses on investments.
U.S. Federal Income Taxes
The Company has elected to be treated, and intends to qualify annually, as a RIC under Subchapter M the Code, for U.S. federal income tax purposes, beginning with the Company’s taxable year ending December 31, 2014. Generally, a RIC is not subject to U.S. federal income taxes on the income and gains it distributes to stockholders if it distributes at least 90% of its net ordinary income and net short-term capital gains in excess of its net long-term capital losses, if any. Additionally, a RIC must distribute at least 98% of its ordinary income and 98.2% of its capital gain net income on an annual basis and any net ordinary income and net capital gains for preceding years that were not distributed during such years and on which the RIC previously paid no U.S. federal income tax to avoid a U.S. federal excise tax. The Company intends to distribute sufficient dividends to maintain the Company’s RIC status each year and does not anticipate paying any material U.S. federal income taxes in the future.
Dividends and Distributions
Dividends to common stockholders are recorded on the ex-dividend date. The Board determines the amount of dividends to be paid each quarter based on a variety of factors including estimates of future earnings. Net realized capital gains, if any, are intended to be distributed at least annually. The Company will calculate both its current and accumulated earnings and profits on a tax basis in order to determine the amount of any distribution that constituted a return of capital to the Company’s stockholders and that while such distributions are not taxable, they may result in higher capital gains taxes when the shares are eventually sold.
Debt Issuance Costs
Debt issuance costs are fees and other direct incremental costs incurred by the Company in obtaining debt financing. Debt issuance costs are amortized and included in interest expense over the life of the related debt instrument using the effective yield method. The respective debt payable is presented net of the unamortized debt issuance costs in the consolidated statements of assets and liabilities.
Per Share Information
Basic and diluted earnings per common share are calculated using the weighted average number of common shares outstanding for the periods presented. For the periods presented, basic and diluted earnings per share are the same since there are no potentially dilutive securities outstanding.
101
The Company’s books and records are maintained in U.S. dollars. Any foreign currency amounts are translated into U.S. dollars on the following basis:
|
|
• |
Fair value of investment securities, other assets and liabilities—at the exchange rates prevailing at the end of the period; and |
|
|
• |
Purchases and sales of investment securities, income and expenses—at the exchange rates prevailing on the respective dates of such transactions, income or expenses. |
Net assets and fair values are presented based on the applicable foreign exchange rates described above and the Company does not isolate that portion of the results of operations resulting from changes in foreign exchange rates on investments from the fluctuations arising from changes in fair values of investments held; therefore, fluctuations related to foreign exchange rate conversions are included with the net realized gains (losses) and unrealized gains (losses) on investments.
Recent Accounting Pronouncements
In May 2014, The FASB issued Accounting Standards Update (“ASU”) 2014-9, “Revenue from Contracts with Customers (Topic 606)” and subsequently issued several amendments to the standard. ASU 2014-9, and related amendments, provide comprehensive guidance for recognizing revenue from contracts with customers. Entities will be able to recognize revenue when the entity transfers promised goods or services to customers in an amount that reflects the consideration to which the entity expects to be entitled to in exchange for those goods or services. The guidance includes a five-step framework that requires an entity to: (i) identify the contract(s) with a customer, (ii) identify the performance obligations in the contract, (iii) determine the transaction price, (iv) allocate the transaction price to the performance obligations in the contract, and (v) recognize revenue when the entity satisfies a performance obligation. The guidance in ASU 2014-9, and the related amendments, is effective for the Company on January 1, 2018. The Company has elected to adopt this ASU on January 1, 2018, which did not have a material impact on the Company’s consolidated financial statements.
In October 2016, the SEC adopted new rules and forms and amended other rules to enhance the reporting and disclosure of information by registered investment companies. As part of these changes, the SEC amended Regulation S-X to standardize and enhance disclosures in investment company financial statements. Implementation of the new or amended rules is required for reporting periods ending after August 1, 2017. The Company has reviewed the requirements and adopted the amendments to Regulation S-X in the consolidated financial statements and related disclosures for the periods presented.
In November 2016, the FASB issued ASU 2016-18, “Statement of Cash Flows (Topic 230): Restricted Cash, a consensus of the FASB Emerging Issues Task Force”, which requires that a statement of cash flows explain the change during the period in the total of cash, cash equivalents, and amounts generally described as restricted cash or restricted cash equivalents. This guidance is effective for annual reporting periods, and the interim periods within those periods, beginning after December 15, 2017 and early adoption is permitted. The Company has adopted this ASU, which did not have a material impact on the Company’s consolidated financial statements. Prior to adoption, the Company presented the change in restricted cash and cash equivalents separately as a cash flow from operating activity. Upon adoption, the Company included the restricted cash and cash equivalents in each of the balances of the cash, cash equivalents and restricted cash at the beginning of and end of periods and included the change in restricted cash and cash equivalents as part of the net change in cash, cash equivalents, and restricted cash in the Consolidated Statements of Cash Flows and retrospectively restated the years ended December 31, 2016 and 2015.
Note 3. Related Party Agreements and Transactions
Investment Advisory Agreement
In accordance with the Board approved investment advisory agreement (the “Advisory Agreement”), subject to the overall supervision of the Board and in accordance with 1940 Act, the Adviser manages the day-to-day operations and provides investment advisory services to the Company. Under the terms of the Advisory Agreement, the Adviser:
|
|
• |
determines the composition of the Company’s portfolio, the nature and timing of changes to the Company’s portfolio and the manner of implementing such changes; |
|
|
• |
identifies, evaluates and negotiates the structure of investments; |
|
|
• |
executes, closes, services and monitors investments; |
|
|
• |
determines the securities and other assets purchased, retained or sold; |
102
|
|
• |
provides the Company with such other investment advisory, research and related services as the Company may, from time to time, reasonably require for the investment of its funds. |
As consideration for the investment advisory and management services provided, and pursuant to the Advisory Agreement, the Company has agreed to pay the Adviser a fee consisting of two components—a base management fee and an incentive fee. The cost of both the base management fee and incentive fee is ultimately borne by the Company’s stockholders.
The base management fee is calculated at an annual rate of 1.75% of the Company’s average adjusted gross assets, including assets purchased with borrowed funds. For services rendered under the Advisory Agreement, the base management fee is payable quarterly in arrears. The base management fee is calculated based on the average value of the Company’s gross assets at the end of its two most recently completed calendar quarters. Such amount is appropriately adjusted (based on the actual number of days elapsed relative to the total number of days in such calendar quarter) for any share issuance or repurchases during a calendar quarter. Base management fees for any partial month or quarter are appropriately pro-rated.
The incentive fee, which provides the Adviser with a share of the income it generates for the Company, consists of two components— net investment income and net capital gains—which are largely independent of each other, and may result in one or both components payable in a given period.
Under the investment income component, the Company pays the Adviser 20.0% of the amount by which the Company’s pre-incentive fee net investment income for the quarter exceeds a hurdle rate of 2.0% (8.0% annualized) of the Company’s net assets at the end of the immediately preceding calendar quarter, subject to a “catch-up” provision pursuant to which the Adviser receives all of such income in excess of 2.0% but less than 2.5%, subject to a total return requirement. The effect of the “catch-up” provision is that, subject to the total return provision discussed below, if pre-incentive fee net investment income exceeds 2.5% in any calendar quarter, the Adviser receives 20.0% of the Company’s pre-incentive fee net investment income as if the 2.0% hurdle rate did not apply. The foregoing incentive fee is subject to a total return requirement, which provides that no incentive fee in respect of the Company’s pre-incentive fee net investment income is payable except to the extent that 20.0% of the cumulative net increase in net assets resulting from operations since the effective date of the Company’s election to be regulated as a BDC exceeds the cumulative incentive fees accrued and/or paid since the effective date of the Company’s election to be regulated as a BDC. In other words, any investment income incentive fee that is payable in a calendar quarter is limited to the lesser of (i) 20.0% of the amount by which the Company’s pre-incentive fee net investment income for such calendar quarter exceeds the 2.0% hurdle, subject to the “catch-up” provision and (ii) (x) 20.0% of the cumulative net increase in net assets resulting from operations since the effective date of the Company’s election to be regulated as a BDC minus (y) the cumulative incentive fees accrued and/or paid since the effective date of the Company’s election to be regulated as a BDC. For the foregoing purpose, the “cumulative net increase in net assets resulting from operations” is the sum of the Company’s pre-incentive fee net investment income, realized gains and losses and unrealized appreciation and depreciation since the effective date of the Company’s election to be regulated as a BDC. The Company elected to be regulated as a BDC under the 1940 Act on March 5, 2014.
Pre-incentive fee net investment income does not include any realized capital gains, realized capital losses or unrealized capital gains or losses. Because of the structure of the incentive fee, it is possible that the Company may pay an incentive fee in a quarter where it incurs a loss, subject to the total return requirement described in the preceding paragraph. For example, if the Company receives pre-incentive fee net investment income in excess of the quarterly minimum hurdle rate, the Company may pay the applicable incentive fee even if it has incurred a loss in that quarter due to realized and unrealized losses, subject to the total return requirement. The Company’s net investment income used to calculate this component of the incentive fee is also included in the amount of the Company’s assets used to calculate the 1.75% base management fee. These calculations are appropriately pro-rated for any period of less than three months and adjusted for any share issuance or repurchase during the current quarter.
Under the capital gains component of the incentive fee, the Company pays the Adviser at the end of each calendar year 20.0% of the Company’s aggregate cumulative realized capital gains from inception through the end of that year, computed net of aggregate cumulative realized capital losses and aggregate cumulative unrealized losses through the end of such year, less the aggregate amount of any previously paid capital gains incentive fees. For the foregoing purpose, the Company’s “aggregate cumulative realized capital gains” does not include any unrealized gains. It should be noted that the Company accrues an incentive fee for accounting purposes taking into account any unrealized gains in accordance with GAAP. The capital gains component of the incentive fee is not subject to any minimum return to stockholders. If such amount is negative, then no capital gains incentive fee is payable for such year. Additionally, if the Advisory Agreement is terminated as of a date that is not a calendar year end, the termination date will be treated as though it were a calendar year end for purposes of calculating and paying the capital gains incentive fee.
103
The base management fee accrued and payable, income incentive fee accrued and payable, and capital gains incentive fee accrued are included in the Company’s consolidated financial statements and summarized in the table below. The Adviser has agreed to exclude the U.S. Treasury bills acquired at the end of each applicable quarter in the calculation of gross assets for purposes of determining its base management fee. There were no net realized capital gains since the inception of the Company and, thus, no capital gains incentive fee was earned or is payable. The Company had cumulative realized and unrealized losses during the years ended December 31, 2017 and December 31, 2016, and, as a result, no capital gains incentive fees were recorded for the years ended December 31, 2017 and December 31, 2016. The Company had net unrealized losses during the year ended December 31, 2015, and, as a result, recorded a reversal in previously accrued capital gains incentive fee.
|
Management and Incentive Fees |
|
For the Year Ended December 31, |
|
|||||||||
|
(in thousands) |
|
2017 |
|
|
2016 |
|
|
2015 |
|
|||
|
Base management fee |
|
$ |
6,268 |
|
|
$ |
5,525 |
|
|
$ |
5,428 |
|
|
Income incentive fee |
|
$ |
5,614 |
|
|
$ |
2,775 |
|
|
$ |
4,360 |
|
|
Capital gains incentive fee |
|
$ |
— |
|
|
$ |
— |
|
|
$ |
(296 |
) |
The table above presents the base management and incentive fees accrued during the period and these fees are paid in the quarter after they are earned. During the year ended December 31, 2017, approximately $6.3 million of base management fee earned in prior and current periods was paid and $5.7 million of income incentive fee earned in prior and current periods was paid. During the year ended December 31, 2016, approximately $5.5 million of the base management fee was paid and $3.0 million of the income incentive fee was paid.
Administration Agreement
The Board approved administration agreement (the “Administration Agreement”) provides that the Administrator is responsible for furnishing the Company with office facilities and equipment and providing the Company with clerical, bookkeeping, recordkeeping services and other administrative services at such facilities. Under the Administration Agreement, the Administrator performs, or oversees, or arranges for, the performance of the Company’s required administrative services, which includes being responsible for the financial and other records which the Company is required to maintain and preparing reports to the Company’s stockholders and reports and other materials filed with the Securities and Exchange Commission (the “SEC”) and any other regulatory authority. In addition, the Administrator assists the Company in determining and publishing net asset value (“NAV”), overseeing the preparation and filing of the Company’s tax returns and printing and disseminating reports and other materials to the Company’s stockholders, and generally oversees the payment of the Company’s expenses and the performance of administrative and professional services rendered to the Company by others. Under the Administration Agreement, the Administrator also provides managerial assistance on the Company’s behalf to those companies that have accepted the Company’s offer to provide such assistance.
Payments under the Administration Agreement are equal to the Company’s allocable portion (subject to the review of the Board) of the Administrator’s overhead resulting from its obligations under the Administration Agreement, including rent and the allocable portion of the cost of the chief compliance officer and chief financial officer and their respective staffs. In addition, if requested to provide significant managerial assistance to the Company’s portfolio companies, the Administrator is paid an additional amount based on the services provided, which shall not exceed the amount the Company receives from such companies for providing this assistance.
For the years ended December 31, 2017, December 31, 2016 and December 31, 2015, expenses paid or payable by the Company to the Administrator under the Administration Agreement were approximately $1.4 million, $1.6 million and $1.5 million, respectively, of which approximately $0.2 million were paid or payable to third party service providers in each of their respective periods.
The Company measures the fair value of its investments in accordance with Accounting Standards Codification Topic 820, Fair Value Measurements and Disclosure, or “ASC Topic 820,” issued by the FASB. ASC Topic 820 defines fair value as the price that would be received to sell an asset or paid to transfer a liability in an orderly transaction between market participants at the measurement date.
104
The Valuation Committee of the Board is responsible for assisting the Board in valuing investments that are not publicly traded or for which current market values are not readily available. Investments for which market quotations are readily available are valued using market quotations, which are generally obtained from independent pricing services, broker-dealers or market makers. With respect to portfolio investments for which market quotations are not readily available, the Board, with the assistance of the Adviser and its senior investment team and independent valuation agents, is responsible for determining, in good faith, the fair value in accordance with the valuation policy approved by the Board. If more than one valuation method is used to measure fair value, the results are evaluated and weighted, as appropriate, considering the reasonableness of the range indicated by those results. The Adviser considers a range of fair values based upon the valuation techniques utilized and selects a value within that range that most accurately represents fair value based on current market conditions as well as other factors the Adviser’s senior investment team considers relevant. The Board determines fair value of its investments on at least a quarterly basis or at such other times when the Board feels it would be appropriate to do so given the circumstances. A determination of fair value involves subjective judgments and estimates and depends on the facts and circumstances present at each valuation date. Due to the inherent uncertainty of determining fair value of portfolio investments that do not have a readily available market value, fair value of investments may differ significantly from the values that would have been used had a readily available market value existed for such investments, and the differences could be material.
ASC Topic 820 specifies a hierarchy of valuation techniques based on whether the inputs to those valuation techniques are observable or unobservable. ASC Topic 820 also provides guidance regarding a fair value hierarchy, which prioritizes information used to measure fair value and the effect of fair value measurements on earnings and provides for enhanced disclosures determined by the level of information used in the valuation. In accordance with ASC Topic 820, these inputs are summarized in the three levels listed below.
Level 1—Valuations are based on quoted prices in active markets for identical assets or liabilities that are accessible at the measurement date.
Level 2—Valuations are based on quoted prices in markets that are not active or for which all significant inputs are observable, either directly or indirectly and model-based valuation techniques for which all significant inputs are observable.
Level 3—Valuations are based on inputs that are unobservable and significant to the overall fair value measurement. Level 3 assets and liabilities include financial instruments whose value is determined using pricing models incorporating significant unobservable inputs, such as discounted cash flow models and other similar valuations techniques. The valuation of Level 3 assets and liabilities generally requires significant management judgment due to the inability to observe inputs to valuation.
In certain cases, the inputs used to measure fair value may fall into different levels of the fair value hierarchy. In such cases, an investment’s level within the fair value hierarchy is based on the lowest level of observable input that is significant to the fair value measurement. The Company’s assessment of the significance of a particular input to the fair value measurement in its entirety requires judgment, and it considers factors specific to the investment.
Under ASC 820, fair value measurement also assumes that the transaction to sell an asset occurs in the principal market for the asset or, in the absence of a principal market, the most advantageous market for the asset, which may be a hypothetical market, excluding transaction costs. The principal market for any asset is the market with the greatest volume and level of activity for such asset in which the reporting entity would or could sell or transfer the asset. In determining the principal market for an asset or liability, it is assumed that the reporting entity has access to such market as of the measurement date. Market participants are defined as buyers and sellers in the principal or most advantageous market that are independent, knowledgeable and willing and able to transact.
With respect to investments for which market quotations are not readily available, the Board undertakes a multi-step valuation process each quarter, as described below:
|
|
• |
The quarterly valuation process begins with each portfolio company or investment being initially valued by the Adviser’s professionals that are responsible for the portfolio investment; |
|
|
• |
Preliminary valuation conclusions are then documented and discussed with the Adviser’s senior investment team; |
|
|
• |
At least once annually, the valuation for each non-deminimis (greater than 1% of gross assets) portfolio investment will be reviewed by an independent valuation firm; |
|
|
• |
The Valuation Committee then reviews these preliminary valuations and makes fair value recommendations to the Board; and |
|
|
• |
The Board then discusses valuations and determines, in good faith, the fair value of each investment in the Company’s portfolio based on the input of the Adviser, the respective independent valuation firms and the Valuation Committee. |
105
The debt investments identified on the consolidated schedules of investments are loans and equipment leases made to venture growth stage companies focused in technology, life sciences and other high growth industries. These investments are considered Level 3 assets under ASC Topic 820 as there is no known or accessible market or market indices for these types of debt instruments and thus the Adviser’s senior management team must estimate the fair value of these investment securities based on models utilizing unobservable inputs.
To estimate the fair value of debt investments, the Company compares the cost basis of each debt investment, including any OID, to the resulting fair value determined using a discounted cash flow model, unless another model is more appropriate based on the circumstances at the measurement date. The discounted cash flow approach entails analyzing the interest rate spreads for recently completed financing transactions which are similar in nature to these debt investments, in order to determine a comparable range of effective market interest rates. The range of interest rate spreads utilized is based on borrowers with similar credit profiles. All remaining expected cash flows of the investment are discounted using this range of interest rates to determine a range of fair values for the debt investment.
The valuation process includes, among other things, evaluating the underlying investment performance of the portfolio company’s current financial condition and ability to raise additional capital, as well as macro-economic events that may impact valuations. These events include, but are not limited to, current market yields and interest rate spreads of similar securities as of the measurement date. Changes in these unobservable inputs could result in significantly different fair value measurements.
Under certain circumstances, an alternative technique may be used to value certain debt investments that better reflect the fair value of the investment, such as the price paid or realized in a recently completed transaction or a binding offer received in an arm’s length transaction, the use of multiple probability weighted cash flow model when the expected future cash flows contain elements of variability or estimates of proceeds that would be received in a liquidation scenario.
Warrant Investments
Warrant investments’ fair values are primarily determined using a Black Scholes option pricing model. Privately held warrant investments and equity-related securities are valued based on an analysis of various factors, including, but not limited to, those listed below. Increases or decreases in any of the unobservable inputs described below could result in a material change in fair value:
|
|
• |
Underlying enterprise value of the issuer based on available information, including any information regarding the most recent financing round of borrower. Valuation techniques to determine enterprise value include market multiple approaches, income approaches or the use of recent rounds of financing and the portfolio company’s capital structure. Valuation techniques are also utilized to allocate the enterprise fair value of a portfolio company to the specific class of common or preferred stock exercisable in the warrant. Such techniques take into account the rights and preferences of the portfolio company’s securities, expected exit scenarios, and volatility associated with such outcomes to allocate the fair value to the specific class of stock held in the portfolio. Such techniques included option pricing models, including back solve techniques, probability weighted expected return models and other techniques determined to be appropriate. |
|
|
• |
Volatility, or the amount of uncertainty or risk about the size of the changes in the warrant investment price, is based on comparable publicly traded companies within indices similar in nature to the underlying company issuing the warrant. |
|
|
• |
The risk-free interest rates are derived from the U.S. Treasury yield curve. The risk-free interest rates are calculated based on a weighted average of the risk-free interest rates that correspond closest to the expected remaining life of the warrant investment. |
|
|
• |
Other adjustments, including a marketability discount on private company warrant investments, are estimated based on the Adviser’s judgment about the general industry environment. |
|
|
• |
Historical portfolio experience on cancellations and exercises of warrant investments are utilized as the basis for determining the estimated life of the warrant investment in each financial reporting period. Warrant investments may be exercised in the event of acquisitions, mergers or initial public offerings, and cancelled due to events such as bankruptcies, restructuring activities or additional financings. These events cause the expected remaining life assumption to be shorter than the contractual term of the warrant investment. |
Under certain circumstances alternative techniques may be used to value certain warrant investments that more accurately reflect the warrant investments’ fair values, such as an expected settlement of a warrant investment in the near term, a model that incorporates a put feature associated with the warrant investment, or the price paid or realized in a recently completed transaction or binding offer received in an arm’s-length transaction. The fair value may be determined based on the expected proceeds to be received from such settlement or based on the net present value of the expected proceeds from the put option.
106
These valuation methodologies involve a significant degree of judgment. There is no single standard for determining the estimated fair value of investments that do not have an active observable market. Valuations of privately held investments are inherently uncertain, as they are based on estimates, and their values may fluctuate over time. The determination of fair value may differ materially from the values that would have been used if an active market for these investments existed. In some cases, the fair value of such investments is best expressed as a range of values derived utilizing different methodologies from which a single estimate may then be determined.
Equity Investments
The fair value of an equity investment in a privately held company is initially the amount invested. The Company adjusts the fair value of equity investments in private companies upon the completion of a new third party round of equity financing subsequent to its investment. The Company may make adjustments to fair value, absent a new equity financing event, based upon positive or negative changes in a portfolio company’s financial or operational performance. The Company may also reference comparable transactions and/or secondary market transactions of comparable companies to estimate fair value. These valuation methodologies involve a significant degree of judgment.
The fair value of an equity investment in a publicly traded company is based upon the closing public share price on the date of measurement. These assets are recorded at fair value on a recurring basis. There is no single standard for determining the estimated fair value of investments that do not have an active public market. Valuations of privately held investments are inherently uncertain, as they are based on estimates, and their values may fluctuate over time. The determination of fair value may differ materially from the values that would have been used if an active market for these investments existed. In some cases, the fair value of such investments is best expressed as a range of values derived utilizing different methodologies from which a single estimate may then be determined.
Investment Valuation
Investments measured at fair value on a recurring basis are categorized in the tables below based upon the lowest level of significant input to the valuations as of December 31, 2017 and as of December 31, 2016. The Company transfers investments in and out of Level 1, 2 and 3 as of the beginning balance sheet date, based on changes in the use of observable and unobservable inputs utilized to perform the valuation for the period.
|
Investment Type |
|
As of December 31, 2017 |
|
|||||||||||||
|
(in thousands) |
|
Level 1 |
|
|
Level 2 |
|
|
Level 3 |
|
|
Total |
|
||||
|
Debt investments |
|
$ |
— |
|
|
$ |
— |
|
|
$ |
352,052 |
|
|
$ |
352,052 |
|
|
Warrant investments |
|
|
— |
|
|
|
— |
|
|
|
11,062 |
|
|
|
11,062 |
|
|
Equity investments |
|
|
— |
|
|
|
1,020 |
|
|
|
7,969 |
|
|
|
8,989 |
|
|
Short-term investments |
|
|
124,909 |
|
|
|
— |
|
|
|
— |
|
|
|
124,909 |
|
|
Total investments |
|
$ |
124,909 |
|
|
$ |
1,020 |
|
|
$ |
371,083 |
|
|
$ |
497,012 |
|
|
Investment Type |
|
As of December 31, 2016 |
|
|||||||||||||
|
(in thousands) |
|
Level 1 |
|
|
Level 2 |
|
|
Level 3 |
|
|
Total |
|
||||
|
Debt investments |
|
$ |
— |
|
|
$ |
— |
|
|
$ |
360,007 |
|
|
$ |
360,007 |
|
|
Warrant investments |
|
|
— |
|
|
|
— |
|
|
|
8,238 |
|
|
|
8,238 |
|
|
Equity investments |
|
|
— |
|
|
|
4,430 |
|
|
|
1,636 |
|
|
|
6,066 |
|
|
Short-term investments |
|
|
39,990 |
|
|
|
— |
|
|
|
— |
|
|
|
39,990 |
|
|
Total investments |
|
$ |
39,990 |
|
|
$ |
4,430 |
|
|
$ |
369,881 |
|
|
$ |
414,301 |
|
The following tables present information about Level 3 investments measured at fair value for the years ended December 31, 2017 and December 31, 2016. Both observable and unobservable inputs were used to determine the fair value of positions that the Company has classified within the Level 3 category. As a result, the net unrealized gains and losses for assets within the Level 3 category may include changes in fair value that were attributable to both observable (e.g., changes in market interest rates) and unobservable (e.g., changes in unobservable long-dated volatilities) inputs.
107
|
|
For the Year Ended December 31, 2017 |
|
||||||||||||||
|
Investment Activity (in thousands) |
|
Debt Investments |
|
|
Warrant Investments |
|
|
Equity Investments |
|
|
Total Investments |
|
||||
|
Fair value as of January 1, 2017 |
|
$ |
360,007 |
|
|
$ |
8,238 |
|
|
$ |
1,636 |
|
|
$ |
369,881 |
|
|
Funding and purchases of investments, at cost |
|
|
221,941 |
|
|
|
3,847 |
|
|
|
7,444 |
|
|
|
233,232 |
|
|
Principal payments and sale proceeds received from investments |
|
|
(230,006 |
) |
|
|
— |
|
|
|
(74 |
) |
|
|
(230,080 |
) |
|
Amortization and accretion of premiums and discounts, net and end-of term payments |
|
|
2,965 |
|
|
|
— |
|
|
|
— |
|
|
|
2,965 |
|
|
Realized losses on investments |
|
|
(626 |
) |
|
|
(2,808 |
) |
|
|
(176 |
) |
|
|
(3,610 |
) |
|
Net change in unrealized gains (losses) included in earnings |
|
|
(4,353 |
) |
|
|
1,785 |
|
|
|
(239 |
) |
|
|
(2,807 |
) |
|
Payment-in-kind coupon |
|
|
2,124 |
|
|
|
— |
|
|
|
— |
|
|
|
2,124 |
|
|
Gross transfers out of Level 3 (1) |
|
|
— |
|
|
|
— |
|
|
|
(622 |
) |
|
|
(622 |
) |
|
Totals |
|
$ |
352,052 |
|
|
$ |
11,062 |
|
|
$ |
7,969 |
|
|
$ |
371,083 |
|
|
|
|
|
|
|
|
|
|
|
|
|
|
|
|
|
|
|
|
Net change in unrealized gains (losses) on Level 3 investments held as of December 31, 2017 |
|
$ |
(866 |
) |
|
$ |
(317 |
) |
|
$ |
(305 |
) |
|
$ |
(1,488 |
) |
|
Level 3 |
|
For the Year Ended December 31, 2016 |
|
|||||||||||||
|
Investment Activity (in thousands) |
|
Debt Investments |
|
|
Warrant Investments |
|
|
Equity Investments |
|
|
Total Investments |
|
||||
|
Fair value as of January 1, 2016 |
|
$ |
259,585 |
|
|
$ |
8,067 |
|
|
$ |
3,639 |
|
|
$ |
271,291 |
|
|
Fundings of investments, at cost |
|
|
153,771 |
|
|
|
2,382 |
|
|
|
196 |
|
|
|
156,349 |
|
|
Principal payments and sale proceeds received from investments |
|
|
(48,786 |
) |
|
|
(1,096 |
) |
|
|
(792 |
) |
|
|
(50,674 |
) |
|
Amortization and accretion of premiums and discounts, net and end-of term payments |
|
|
6,358 |
|
|
|
— |
|
|
|
— |
|
|
|
6,358 |
|
|
Realized gains (losses) on investments |
|
|
(20,447 |
) |
|
|
(594 |
) |
|
|
292 |
|
|
|
(20,749 |
) |
|
Net change in unrealized gains included in earnings |
|
|
6,670 |
|
|
|
(147 |
) |
|
|
110 |
|
|
|
6,633 |
|
|
Payment-in-kind coupon |
|
|
2,856 |
|
|
|
— |
|
|
|
— |
|
|
|
2,856 |
|
|
Gross transfers out of Level 3 (1) |
|
|
— |
|
|
|
(374 |
) |
|
|
(1,809 |
) |
|
|
(2,183 |
) |
|
Totals |
|
$ |
360,007 |
|
|
$ |
8,238 |
|
|
$ |
1,636 |
|
|
$ |
369,881 |
|
|
|
|
|
|
|
|
|
|
|
|
|
|
|
|
|
|
|
|
Net change in unrealized gains (losses) on Level 3 investments held as of December 31, 2016 |
|
$ |
2,638 |
|
|
$ |
(1,105 |
) |
|
$ |
(66 |
) |
|
$ |
1,467 |
|
_______________
|
(1) |
Transfers out of Level 3 are measured as of the date of the transfer. During the years ended December 31, 2017 and December 31, 2016, these transfers relate to warrant and equity investments, as the result of exercising warrant investments in publicly traded companies. |
Realized gains and losses are included as a component of net realized gains (losses) in the consolidated statements of operations.
During the year ended December 31, 2017, we recognized net realized losses from the sale of investments of approximately $0.2 million, consisting of gross realized gains of $3.4 million from the sale of equity in one portfolio company, offset by gross realized losses of $3.6 million, of which $3.0 million consisted of warrant and equity investment losses related to the acquisition of 5 portfolio companies and $0.6 million related to the reversal of accrued loan modification fees in conjunction with the pay-off of one portfolio company. During the same period, we recognized a realized loss on debt extinguishment of approximately $1.1 million relating to the acceleration of unamortized fees on the 2020 Notes redemption.
During the year ended December 31, 2016, we recognized net realized losses of approximately $20.7 million, which consisted of realized losses on two debt investments of $20.4, and net realized losses of $1.5 million on warrant investments, which were offset by realized gains of $1.2 million on warrant and equity investments.
Unrealized gains and losses are included in net change in unrealized gains (losses) on investments in the consolidated statements of operations.
Net change in unrealized losses during the year ended December 31, 2017 was approximately $5.8 million, which primarily consisted of the reversal and recognition of previously recorded net unrealized gains of $5.9 million into income or realized gains from nine companies, offset by $0.1 million of net unrealized gains on the investment portfolio related to mark to market activity.
Net change in unrealized gains of approximately $8.8 million during the year ended December 31, 2016 consisted of $5.1 million related to the reversal and recognition of unrealized losses into realized losses and $3.7 million of net unrealized appreciation related to mark to market activity on the investment portfolio.
For the year ended December 31, 2017, the Company recognized approximately $1.5 million in other income, consisting of approximately $0.5 million from the termination or expiration of unfunded commitments and approximately $1.0 million from the amortization of certain fees paid by portfolio companies and other income related to prepayment activity. For the year ended December 31, 2016, the Company recognized approximately $1.9 million in other income, consisting of approximately $1.7 million from the termination or expiration of unfunded commitments and approximately $0.2 million from the amortization of certain fees paid by portfolio companies and other income.
108
The following tables provide a summary of quantitative information about the Level 3 fair value measurements of investments as of December 31, 2017 and December 31, 2016. In addition to the techniques and inputs noted in the tables below, the Company may also use other valuation techniques and methodologies when determining fair value measurements. The tables below are not intended to be all inclusive, but rather provide information on significant Level 3 inputs as they relate to the fair value measurements of investments.
|
Level 3 Investments |
|
As of December 31, 2017 |
|
|||||||||||||
|
(dollars in thousands) |
|
Fair Value |
|
|
Valuation Technique |
|
Unobservable Inputs |
|
Range |
|
|
Weighted Average |
|
|||
|
Debt investments |
|
$ |
352,052 |
|
|
Discounted Cash Flows |
|
Discount Rate |
|
2.50% - 38.43% |
|
|
14.92% |
|
||
|
Warrant investments |
|
|
10,394 |
|
|
Black Scholes Option Pricing Model |
|
Revenue Multiples |
|
0.90x – 4.00x |
|
|
2.89x |
|
||
|
|
|
|
|
|
|
|
|
Volatility |
|
26.60% - 75.00% |
|
|
55.00% |
|
||
|
|
|
|
|
|
|
|
|
Term |
|
1.00– 3.50 Years |
|
|
2.47 Years |
|
||
|
|
|
|
|
|
|
|
|
Discount for Lack of Marketability |
|
0.00% - 30.00% |
|
|
17.30% |
|
||
|
|
|
|
|
|
|
|
|
Risk Free Rate |
|
1.43% - 2.00% |
|
|
1.92% |
|
||
|
|
|
|
261 |
|
|
Option-Pricing Method and Probability-Weighted Expected Return Method |
|
Weighted Average Cost of Capital |
|
33.60% |
|
|
33.60% |
|
||
|
|
|
|
|
|
|
|
|
Term |
|
2.0 years |
|
|
2.0 years |
|
||
|
|
|
|
407 |
|
|
Discounted Expected Return |
|
Discount Rate |
|
17.25% |
|
|
17.25% |
|
||
|
|
|
|
|
|
|
|
|
Term |
|
3.25 Years |
|
|
3.25 Years |
|
||
|
|
|
|
|
|
|
|
|
Expected Recovery Rate |
|
75.00% |
|
|
75.00% |
|
||
|
Equity investments |
|
|
4,848 |
|
|
Black Scholes Option Pricing Model |
|
Revenue Multiples |
|
0.90x – 4.00x |
|
|
2.37x |
|
||
|
|
|
|
|
|
|
|
|
Volatility |
|
26.60% - 85.00% |
|
|
60.10% |
|
||
|
|
|
|
|
|
|
|
|
Term |
|
1.50– 4.50 Years |
|
|
2.24 Years |
|
||
|
|
|
|
|
|
|
|
|
Discount for Lack of Marketability |
|
0.00% - 1.30% |
|
|
1.30% |
|
||
|
|
|
|
|
|
|
|
|
Risk Free Rate |
|
1.80% - 2.10% |
|
|
1.93% |
|
||
|
|
|
|
1,000 |
|
|
Option-Pricing Method and Probability-Weighted Expected Return Method |
|
Weighted Average Cost of Capital |
|
27.50%- 33.60% |
|
|
31.20% |
|
||
|
|
|
|
|
|
|
|
|
Term |
|
2.08 -3.50 years |
|
|
2.70 Years |
|
||
|
|
|
|
2,121 |
|
|
Discounted Expected Recovery |
|
Expected Recovery Rate |
|
87.00% |
|
|
87.00% |
|
||
|
Total investments |
|
$ |
371,083 |
|
|
|
|
|
|
|
|
|
|
|
|
|
|
Level 3 Investments |
|
As of December 31, 2016 |
|
|||||||||||
|
(dollars in thousands) |
|
Fair Value |
|
|
Valuation Technique |
|
Unobservable Inputs (1) |
|
Range |
|
Weighted Average |
|
||
|
Debt investments |
|
$ |
355,230 |
|
|
Discounted Cash Flows |
|
Discount Rate |
|
2.50% - 25.00% |
|
14.32% |
|
|
|
|
|
|
4,777 |
|
|
Discounted Expected Recovery |
|
N/A |
|
N/A |
|
N/A |
|
|
|
Warrant investments |
|
|
6,089 |
|
|
Black Scholes Option Pricing Model |
|
Share Price and Equity Value |
|
N/A |
|
N/A |
|
|
|
|
|
|
|
|
|
|
|
Revenue Multiples |
|
0.34x – 8.00x |
|
3.43x |
|
|
|
|
|
|
|
|
|
|
|
Volatility |
|
40.00% - 70.00% |
|
53.30% |
|
|
|
|
|
|
|
|
|
|
|
Term |
|
1.00– 7.00 Years |
|
2.98 Years |
|
|
|
|
|
|
|
|
|
|
|
Discount for Lack of Marketability |
|
0.00% - 32.70% |
|
14.10% |
|
|
|
|
|
|
2,149 |
|
|
Option-Pricing Method and Probability-Weighted Expected Return Method |
|
Weighted Average Cost of Capital |
|
25.00% – 30.00% |
|
25.40% |
|
|
|
|
|
|
|
|
|
|
|
Term |
|
1.25 – 2.25 Years |
|
1.33 Years |
|
|
|
Equity investments |
|
|
1,636 |
|
|
Black Scholes Option Pricing Model |
|
Share Price and Equity Value |
|
N/A |
|
N/A |
|
|
|
|
|
|
|
|
|
|
|
Revenue Multiples |
|
1.50x – 6.00x |
|
3.57x |
|
|
|
|
|
|
|
|
|
|
|
Volatility |
|
45.00% - 60.00% |
|
51.70% |
|
|
|
|
|
|
|
|
|
|
|
Term |
|
1.00– 2.50 Years |
|
1.55 Years |
|
|
|
|
|
|
|
|
|
|
|
Discount for Lack of Marketability |
|
0.00% - 23.70% |
|
12.90% |
|
|
|
Total investments |
|
$ |
369,881 |
|
|
|
|
|
|
|
|
|
|
|
_______________
|
(1) |
Significant increases (decreases) in the inputs in isolation may result in a significantly higher (lower) fair value measurement, depending on the materiality of the investment. |
109
As of December 31, 2017, the fair values for all of the Company’s debt investments were estimated using discounted cash flow models based on anticipated cash flows and a discount rate deemed most appropriate for each investment given the facts and circumstances specific to each portfolio company and market yields as of the reporting date. As of December 31, 2016, the fair values for all of the Company’s debt investments, other than KnCMiner AB, were estimated using discounted cash flow models based on anticipated cash flows and a discount rate deemed most appropriate for each investment given the facts and circumstances specific to each portfolio company and market yields at the reporting date. The fair values for the Company’s debt investments in KnCMiner AB include risk and time discounted expected recoveries as well as preferred shares received from GoGreen Host AB, which acquired certain assets from KnCMiner AB. Such preferred shares entitle the Company to receive annual cash distributions based on a percentage of the net income of GoGreen Host AB (fka GoGreen Light AB).
As of December 31, 2017 and December 31, 2016, fair values for all but one warrant investment position were estimated using an Option-Pricing Method that values individual equity classes based on their economic rights and preferences using the Black Scholes Option-Pricing Model. One warrant investment position was valued using a combination of the Option-Pricing Method and the Probability-Weighted Expected Return Method. Certain investments within the portfolio contain fee conditions which may result in cash proceeds to the Company upon a qualifying liquidity event. These fees were valued using a discounted expected return method. As of December 31, 2017, all but five equity investments were valued using the market approach. The fair market value for two investments as of December 31, 2017 was derived based on the last equity financing round. The fair market value for two investments as of December 31, 2017 was derived based on a combination of the Option-Pricing Method and the Probability-Weighted Expected Return Method. The fair market value for one investment as of December 31, 2017 was based on time discounted expected recovery. As of December 31, 2016, all the equity investments were valued using the market approach.
The range of the various assumptions and weighted averages of these assumptions are summarized in the tables above.
As of December 31, 2017 and December 31, 2016, approximately $350.3 million and $363.0 million, respectively, of the Company’s assets were pledged for borrowings under its revolving credit facility.
Note 5. Credit Risk
Debt investments may be affected by business, financial market or legal uncertainties. Prices of investments may be volatile, and a variety of factors that are inherently difficult to predict, such as domestic, economic and political developments, may significantly affect the value of these investments. In addition, the value of these investments may fluctuate as the general level of interest rates fluctuate.
In many instances, the portfolio company’s ability to repay the debt investments is dependent on additional funding by its venture capital investors, a future sale or an initial public offering. The value of these investments may be detrimentally affected to the extent a borrower defaults on its obligations, there is insufficient collateral and/or there are extensive legal and other costs incurred in collecting on a defaulted loan.
Note 6. Borrowings
Revolving Credit Facility
In February 2014, the Company, along with its Financing Subsidiary as borrower, entered into a credit agreement with Deutsche Bank AG, acting as administrative agent and a lender, and KeyBank National Association, Everbank Commercial Lender Finance, Inc., and AloStar Bank of Commerce, as other lenders, which provided the Company with a $150.0 million commitment, subject to borrowing base requirements (the “Revolving Credit Facility”). In August 2014, the Company amended the Revolving Credit Facility to increase the total commitments available thereunder to $200.0 million in aggregate.
110
Pursuant to an amendment to the Revolving Credit Facility, effective as of January 2016, borrowings under the Revolving Credit Facility bear interest at the sum of (i) a floating rate based on certain indices, including LIBOR and commercial paper rates, plus (ii) a margin of 3.0% during the revolving period and 4.5% during the amortization period. Borrowings under the Revolving Credit Facility are secured only by the assets of the Financing Subsidiary. The Company agreed to pay Deutsche Bank AG a syndication fee in 12 monthly installments, of approximately 1% of the committed facility amount. The Company also agreed to pay to Deutsche Bank AG a fee to act as administrative agent under the Revolving Credit Facility and to pay each lender (i) a commitment fee of 0.65% multiplied by such lender’s commitment on the effective date payable in 12 equal monthly installments and (ii) a fee of approximately 0.75% per annum for any unused borrowings under the Revolving Credit Facility on a monthly basis. The Revolving Credit Facility contains affirmative and restrictive covenants, including but not limited to an advance rate limitation of approximately 55% of the applicable net loan balance of assets held by the Financing Subsidiary, maintenance of minimum net worth at an agreed level, a ratio of total assets to total indebtedness of not less than approximately 2:1, a key man clause relating to the Company’s Chief Executive Officer, Mr. James P. Labe, and the Company’s President and Chief Investment Officer, Mr. Sajal K. Srivastava, and eligibility requirements, including but not limited to geographic and industry concentration limitations and certain loan grade classifications. Furthermore, events of default under the Revolving Credit Facility include, among other things, (i) a payment default; (ii) a change of control; (iii) bankruptcy; (iv) a covenant default; and, (v) the Company’s failure to maintain compliance with RIC provisions at all times. The revolving period of the Revolving Credit Facility ends on February 21, 2018 and the maturity date of the Revolving Credit Facility is February 21, 2019. As of December 31, 2017 and December 31, 2016, the Company was in compliance with all covenants under the Revolving Credit Facility.
At December 31, 2017 and December 31, 2016, the Company had outstanding borrowings under the Revolving Credit Facility of $67.0 million and $115.0 million, respectively, which is included in the Company’s consolidated statements of assets and liabilities. The book value of the Revolving Credit Facility approximates fair value due to the relatively short maturity, cash repayments and market interest rates of the instrument. The fair value of the Revolving Credit Facility would be categorized as Level 3 of the fair value hierarchy if determined as of the reporting date.
Interest expense on these borrowings includes the interest cost charged on borrowings, the unused fee on the Revolving Credit Facility, paying and administrative agent fees, and the amortization of deferred Revolving Credit Facility fees and expenses. These expenses are summarized in the table below.
|
Interest Expense and Amortization of Fees |
|
For the Year Ended December 31, |
|
|||||||||
|
|
2017 |
|
|
2016 |
|
|
2015 |
|
||||
|
Revolving Credit Facility |
|
|
|
|
|
|
|
|
|
|
|
|
|
Interest cost charged on borrowings |
|
$ |
2,278 |
|
|
$ |
1,597 |
|
|
$ |
2,113 |
|
|
Unused fee |
|
|
1,091 |
|
|
|
1,185 |
|
|
|
1,091 |
|
|
Amortization of costs and other fees |
|
|
930 |
|
|
|
992 |
|
|
|
1,414 |
|
|
Revolving Credit Facility Total |
|
$ |
4,299 |
|
|
$ |
3,774 |
|
|
$ |
4,618 |
|
|
2020 Notes |
|
|
|
|
|
|
|
|
|
|
|
|
|
Interest cost |
|
$ |
2,274 |
|
|
$ |
3,687 |
|
|
$ |
1,505 |
|
|
Amortization of costs and other fees |
|
|
248 |
|
|
|
398 |
|
|
|
162 |
|
|
2020 Notes Total |
|
$ |
2,522 |
|
|
$ |
4,085 |
|
|
$ |
1,667 |
|
|
2022 Notes |
|
|
|
|
|
|
|
|
|
|
|
|
|
Interest cost |
|
$ |
1,994 |
|
|
$ |
— |
|
|
$ |
— |
|
|
Amortization of costs and other fees |
|
|
246 |
|
|
|
— |
|
|
|
— |
|
|
2022 Notes Total |
|
$ |
2,240 |
|
|
$ |
— |
|
|
$ |
— |
|
|
Total Interest Expense and Amortization of Fees |
|
$ |
9,061 |
|
|
$ |
7,859 |
|
|
$ |
6,285 |
|
111
During the years ended December 31, 2017 and December 31, 2016, the Company had an average outstanding borrowings of $56.4 million and $44.6 million, respectively, under its Revolving Credit Facility at a weighted average interest of 3.97% and 3.52%, respectively.
2020 Notes
On August 4, 2015, the Company completed a public offering of $50.0 million in aggregate principal amount of its 2020 Notes and received net proceeds of approximately $48.3 million after the payment of fees and offering costs. On September 2, 2015, the Company issued an additional $4.6 million in aggregate principal amount of its 2020 Notes and received net proceeds of approximately $4.5 million after the payment of fees and offering costs as a result of the underwriters’ partial exercise of their option to purchase additional 2020 Notes. The 2020 Notes are disclosed under “2020 Notes” in the consolidated statements of assets and liabilities, net of unamortized issuance costs. The interest expense, including amortization of debt issuance costs are summarized in the table above. The interest on the 2020 Notes was payable quarterly on January 15, April 15, July 15 and October 15, beginning on October 15, 2015. Until August 15, 2017, the 2020 Notes were listed on the New York Stock Exchange (“NYSE”) under the symbol “TPVZ”. The 2020 Notes were issued in integral principal amount multiples ("units") of $25.
At December 31, 2016, the 2020 Notes had a market price of $25.50 per unit, resulting in an aggregate fair value of approximately $55.7 million. The 2020 Notes are recorded at amortized cost in the consolidated statements of assets and liabilities. Amortized cost includes approximately $1.3 million at December 31, 2016, of deferred issuance cost which is amortized and expensed over the five year term of the 2020 Notes based on an effective yield method.
On July 14, 2017, the Company elected to exercise its option to redeem, in full, the 2020 Notes and on August 13, 2017 (the “Redemption Date”). The 2020 Notes were redeemed at par plus accrued and unpaid interest which resulted in a realized loss on debt extinguishment of approximately $1.1 million. As of the Redemption Date, the outstanding 2020 Notes had an aggregate principal amount of $54.6 million and accrued but unpaid interest of approximately $0.3 million. The 2020 Notes were delisted on the NYSE effective as of August 15, 2017.
2022 Notes
On July 14, 2017, the Company completed a public offering of $65.0 million in aggregate principal amount of its 5.75% notes due 2022 (the “2022 Notes”) and received net proceeds of approximately $62.8 million after the payment of fees and offering costs. On July 24, 2017, as a result of the underwriters’ full exercise of their option to purchase additional 2022 Notes, the Company issued an additional $9.75 million in aggregate principal amount of the 2022 Notes and received net proceeds of approximately $9.5 million after the payment of fees and offering costs. The interest on the 2022 Notes is payable quarterly on January 15, April 15, July 15 and October 15, beginning October 15, 2017. The 2022 Notes are listed on the NYSE under the symbol “TPVY”. The 2022 Notes were issued in integral principal amount multiples ("units") of $25. The Company used a portion of the net proceeds from the offering of the 2022 Notes to redeem all of the outstanding 2020 Notes.
At December 31, 2017, the 2022 Notes had a market price of $25.88 per unit, resulting in an aggregate fair value of approximately $77.4 million. The 2022 Notes are recorded at amortized cost in the consolidated statements of assets and liabilities. Amortized cost includes approximately $2.3 million of deferred issuance cost at December 31, 2017, which is amortized and expensed over the five year term of the 2022 Notes based on an effective yield method.
The following tables provide additional information about the level in the fair value hierarchy of the Company’s liabilities at December 31, 2017 and December 31, 2016.
|
Liability |
|
As of December 31, 2017 |
|
|||||||||||||
|
(in thousands) |
|
Level 1 |
|
|
Level 2 |
|
|
Level 3 |
|
|
Total |
|
||||
|
Revolving Credit Facility |
|
$ |
— |
|
|
$ |
— |
|
|
$ |
67,000 |
|
|
$ |
67,000 |
|
|
2022 Notes, net * |
|
|
— |
|
|
|
75,061 |
|
|
|
— |
|
|
|
75,061 |
|
|
Total |
|
$ |
— |
|
|
$ |
75,061 |
|
|
$ |
67,000 |
|
|
$ |
142,061 |
|
|
* |
Net of approximately $2.3 million of deferred issuance cost. |
112
|
|
As of December 31, 2016 |
|
||||||||||||||
|
(in thousands) |
|
Level 1 |
|
|
Level 2 |
|
|
Level 3 |
|
|
Total |
|
||||
|
Revolving Credit Facility |
|
$ |
— |
|
|
$ |
— |
|
|
$ |
115,000 |
|
|
$ |
115,000 |
|
|
2020 Notes, net * |
|
|
— |
|
|
|
54,381 |
|
|
|
— |
|
|
|
54,381 |
|
|
Total |
|
$ |
— |
|
|
$ |
54,381 |
|
|
$ |
115,000 |
|
|
$ |
169,381 |
|
|
* |
Net of approximately $1.3 million of deferred issuance cost. |
Other Payables
On December 29, 2017, the Company purchased $125.0 million of U.S. Treasury bills for settlement on January 3, 2018. On December 30, 2016, the Company purchased $40.0 million of U.S. Treasury bills for settlement on January 4, 2017. The associated payable is included in the Company’s consolidated statements of assets and liabilities as of December 31, 2017 and December 31, 2016, respectively.
Note 7. Commitments and Contingencies
Commitments
As of December 31, 2017 and December 31, 2016, the Company’s unfunded commitments totaled approximately $100.1 million to ten portfolio companies and approximately $117.4 million to nine portfolio companies, respectively, of which $18.0 million and $60.0 million, respectively, was dependent upon the portfolio companies reaching certain milestones before the debt commitment becomes available to them. Of the approximately $100.1 million of unfunded commitments as of December 31, 2017, approximately $87.1 million will expire during 2018 and $13.0 million will expire during 2019, if not drawn prior to expiration.
The Company’s credit agreements contain customary lending provisions that allow it relief from funding obligations for previously made commitments in instances where the underlying company experiences materially adverse events that affect the financial condition or business outlook for the company. Since these commitments may expire without being drawn upon, unfunded commitments do not necessarily represent future cash requirements or future earning assets for the Company. The Company generally expects more than 60% of its gross unfunded commitments to eventually be drawn before the expiration of their corresponding availability periods.
The table below provides the Company’s unfunded commitments by portfolio company as of December 31, 2017 and December 31, 2016.
|
|
|
As of December 31, 2017 |
|
|||||
|
Unfunded Commitments for Growth Capital Loans (unless otherwise noted)* (in thousands) |
|
Principal Balance |
|
|
Fair Value of Unfunded Commitment Liability |
|
||
|
Eero, Inc. |
|
$ |
5,000 |
|
|
$ |
— |
|
|
FabFitFun, Inc. |
|
|
10,000 |
|
|
|
235 |
|
|
Innovid, Inc. |
|
|
3,000 |
|
|
|
45 |
|
|
MapR Technologies, Inc. (Equipment Lease) |
|
|
1,721 |
|
|
|
4 |
|
|
Outfittery GmbH |
|
|
2,376 |
|
|
|
150 |
|
|
PillPack, Inc. |
|
|
30,000 |
|
|
|
200 |
|
|
Rent the Runway, Inc. |
|
|
15,000 |
|
|
|
273 |
|
|
RetailNext, Inc. |
|
|
3,000 |
|
|
|
30 |
|
|
Stance, Inc. |
|
|
15,000 |
|
|
|
166 |
|
|
Varsity Tutors LLC |
|
|
15,000 |
|
|
|
159 |
|
|
Total |
|
$ |
100,097 |
|
|
$ |
1,262 |
|
_______________
* Does not includes $35.4 million backlog of potential future commitments. Refer to the “Backlog of Potential Future Commitments” below.
113
|
|
|
As of December 31, 2016 |
|
|||||
|
Unfunded Commitments for Growth Capital Loans (unless otherwise noted)* (in thousands) |
|
Principal Balance |
|
|
Fair Value of Unfunded Commitment Liability |
|
||
|
CrowdStrike, Inc. |
|
$ |
5,000 |
|
|
$ |
81 |
|
|
Eero, Inc. |
|
|
15,000 |
|
|
|
130 |
|
|
Farfetch UK Limited |
|
|
5,000 |
|
|
|
53 |
|
|
FinancialForce.com, Inc. |
|
|
15,000 |
|
|
|
94 |
|
|
Green Chef Corporation |
|
|
10,000 |
|
|
|
173 |
|
|
MapR Technologies, Inc. (Equipment Lease) |
|
|
4,352 |
|
|
|
12 |
|
|
Optoro, Inc. |
|
|
25,000 |
|
|
|
40 |
|
|
Rent the Runway, Inc. |
|
|
28,000 |
|
|
|
511 |
|
|
WorldRemit Ltd. |
|
|
10,000 |
|
|
|
124 |
|
|
Total |
|
$ |
117,352 |
|
|
$ |
1,218 |
|
_______________
* Does not includes $40.0 million backlog of potential future commitments. Refer to the “Backlog of Potential Future Commitments” below.
The tables above also provide the fair value of the Company’s unfunded commitment liability as of December 31, 2017 and December 31, 2016 totaling approximately $1.3 million and $1.2 million, respectively. The fair value at the inception of the delay draw credit agreements is equal to the fees and warrant investments received to enter into these agreements, taking into account the remaining terms of the agreements and the counterparties’ credit profile. The unfunded commitment liability reflects the fair value of these future funding commitments and is included in “Other accrued expenses and liabilities” in the Company’s consolidated statements of assets and liabilities.
These liabilities are considered Level 3 liabilities under ASC Topic 820 as there is no known or accessible market or market indices for these types of financial instruments. Both observable and unobservable inputs were used to determine the fair value of positions that the Company has classified within the Level 3 category. The below table provides additional details of unfunded commitments during the years ended December 31, 2017 and December 31, 2016.
|
|
|
For the Year Ended December 31, |
|
|||||
|
Commitments Activity (in thousands) |
|
2017 |
|
|
2016 |
|
||
|
Activity during the period: |
|
|
|
|
|
|
|
|
|
New commitments * |
|
|
329,879 |
|
|
|
286,850 |
|
|
Fundings |
|
|
(231,758 |
) |
|
|
(158,303 |
) |
|
Expirations / Terminations |
|
|
(120,000 |
) |
|
|
(161,156 |
) |
|
|
|
|
|
|
|
|
|
|
|
Unfunded commitments at beginning of period |
|
$ |
117,352 |
|
** |
$ |
189,961 |
|
|
Unfunded commitments at end of period ** |
|
$ |
100,097 |
|
|
$ |
117,352 |
|
|
Backlog of potential future commitments |
|
$ |
35,376 |
|
|
$ |
40,000 |
|
_______________
*Includes backlog of potential future commitments. Refer to the “Backlog of Potential Future Commitments” below.
**Does not include backlog of potential future commitments. Refer to the “Backlog of Potential Future Commitments” below.
The following table provides additional information on the Company’s unfunded commitments regarding milestones, expirations, and types of loans.
|
Unfunded Commitments* (in thousands) |
|
As of December 31, 2017 |
|
|
As of December 31, 2016 |
|
||
|
Dependent on milestones |
|
$ |
18,000 |
|
|
$ |
60,000 |
|
|
Expiring during: |
|
|
|
|
|
|
|
|
|
2017 |
|
|
— |
|
|
|
102,352 |
|
|
2018 |
|
|
87,097 |
|
|
|
10,000 |
|
|
2019 |
|
|
13,000 |
|
|
|
5,000 |
|
|
|
|
|
|
|
|
|
|
|
|
Growth capital loans |
|
|
98,376 |
|
|
|
113,000 |
|
|
Equipment leases and loans |
|
|
1,721 |
|
|
|
4,352 |
|
_______________
*Does not include backlog of potential future commitments. Refer to the “Backlog of Potential Future Commitments” below.
114
Backlog of Potential Future Commitments
The Company entered into commitments with certain portfolio companies which permit an increase in the commitment amount in the future in the event that conditions to such increases are met. If such conditions to increase are met, these amounts may become unfunded commitments if not drawn prior to expiration. As of December 31, 2017 and December 31, 2016, this backlog of potential future commitments totaled approximately $35.4 million and $40.0 million, respectively.
Note 8. Financial Highlights
The financial highlights presented below are for the years ended December 31, 2017, December 31, 2016 and December 31, 2015.
|
Financial Highlights |
|
For the Year Ended December 31, or as of December 31, |
|
|||||||||
|
(in thousands, except per share data) |
|
2017 |
|
|
2016 |
|
|
2015 |
|
|||
|
Per Share Data (1) |
|
|
|
|
|
|
|
|
|
|
|
|
|
Net asset value at beginning of period |
|
$ |
13.51 |
|
|
$ |
14.21 |
|
|
$ |
14.61 |
|
|
Changes in net asset value due to: |
|
|
|
|
|
|
|
|
|
|
|
|
|
Offering costs related to public offering of common stock |
|
|
— |
|
|
|
— |
|
|
|
(0.05 |
) |
|
Share repurchases |
|
|
— |
|
|
|
0.07 |
|
|
|
0.08 |
|
|
Dividend reinvestment plan |
|
|
— |
|
|
|
(0.02 |
) |
|
|
(0.03 |
) |
|
Net investment income |
|
|
1.61 |
|
|
|
1.42 |
|
|
|
1.46 |
|
|
Net realized losses on investments |
|
|
(0.01 |
) |
|
|
(1.28 |
) |
|
|
(0.02 |
) |
|
Net change in unrealized (losses) gains on investments |
|
|
(0.35 |
) |
|
|
0.55 |
|
|
|
(0.40 |
) |
|
Net realized loss on extinguishment of debt |
|
|
(0.07 |
) |
|
|
— |
|
|
|
— |
|
|
Return of capital |
|
|
— |
|
|
|
(1.20 |
) |
|
|
— |
|
|
Distributions from net investment income |
|
|
(1.44 |
) |
|
|
(0.24 |
) |
|
|
(1.44 |
) |
|
Distributions from net realized gains |
|
|
— |
|
|
|
— |
|
|
|
— |
|
|
Net asset value at end of period |
|
$ |
13.25 |
|
|
$ |
13.51 |
|
|
$ |
14.21 |
|
|
|
|
|
|
|
|
|
|
|
|
|
|
|
|
Net investment income per share |
|
$ |
1.61 |
|
|
$ |
1.42 |
|
|
$ |
1.46 |
|
|
Net increase in net assets resulting from operations per share |
|
$ |
1.18 |
|
|
$ |
0.69 |
|
|
$ |
1.03 |
|
|
Weighted average shares of common stock outstanding for period |
|
|
16,324 |
|
|
|
16,160 |
|
|
|
15,041 |
|
|
Shares of common stock outstanding at end of period |
|
|
17,730 |
|
|
|
15,981 |
|
|
|
16,302 |
|
|
|
|
|
|
|
|
|
|
|
|
|
|
|
|
Ratios / Supplemental Data |
|
|
|
|
|
|
|
|
|
|
|
|
|
Net asset value at beginning of period |
|
$ |
215,863 |
|
|
$ |
231,646 |
|
|
$ |
144,979 |
|
|
Net asset value at end of period |
|
$ |
234,945 |
|
|
$ |
215,863 |
|
|
$ |
231,646 |
|
|
Average net asset value |
|
$ |
219,457 |
|
|
$ |
218,881 |
|
|
$ |
218,623 |
|
|
|
|
|
|
|
|
|
|
|
|
|
|
|
|
Total return based on net asset value per share (2) |
|
|
9.6 |
% |
|
|
8.9 |
% |
|
|
9.5 |
% |
|
Net asset value per share at end of period |
|
$ |
13.25 |
|
|
$ |
13.51 |
|
|
$ |
14.21 |
|
|
|
|
|
|
|
|
|
|
|
|
|
|
|
|
Total return based on stock price (3) |
|
|
20.4 |
% |
|
|
12.9 |
% |
|
|
(9.4 |
)% |
|
Stock price at end of period |
|
$ |
12.69 |
|
|
$ |
11.78 |
|
|
$ |
11.96 |
|
|
|
|
|
|
|
|
|
|
|
|
|
|
|
|
Net investment income to average net asset value (4) |
|
|
12.0 |
% |
|
|
10.5 |
% |
|
|
10.0 |
% |
|
Net increase (decrease) in net assets to average net asset value (4) |
|
|
8.8 |
% |
|
|
5.1 |
% |
|
|
7.1 |
% |
|
Ratio of expenses to average net asset value (4) |
|
|
11.5 |
% |
|
|
9.4 |
% |
|
|
9.2 |
% |
|
|
|
|
|
|
|
|
|
|
|
|
|
|
|
Operating expenses excluding incentive fees to average net asset value |
|
|
8.9 |
% |
|
|
8.1 |
% |
|
|
7.3 |
% |
|
Income component of incentive fees to average net asset value |
|
|
2.6 |
% |
|
|
1.3 |
% |
|
|
2.0 |
% |
|
Capital gains component of incentive fees to average net asset value |
|
|
0.0 |
% |
|
|
0.0 |
% |
|
|
(0.1 |
)% |
__________________
|
(1) |
All per share activity is calculated based on the weighted average shares outstanding for the relevant period, except net increase (decrease) in net assets from capital share transactions, which is based on the common shares outstanding as of the relevant balance sheet date. |
|
(2) |
Total return based on NAV is the change in ending NAV per share plus distributions per share paid during the period assuming participation in the Company’s dividend reinvestment plan divided by the beginning NAV per share. |
|
(3) |
Total return based on stock price is the change in the ending stock price of the Company’s common stock plus distributions paid during the period assuming participation in the Company’s dividend reinvestment plan divided by the beginning stock price of the Company’s common stock. The total return is for the period shown and is not annualized. |
|
(4) |
Percentage is presented on an annualized basis. |
115
The weighted average portfolio yield on debt investments presented below is for the years ended December 31, 2017, December 31, 2016 and December 31, 2015.
|
Ratios |
|
For the Year Ended December 31, or as of December 31, |
|
|||||||||
|
(Percentages, on an annualized basis) (1) |
|
2017 |
|
|
2016 |
|
|
2015 |
|
|||
|
Weighted average portfolio yield on debt investments |
|
|
16.4 |
% |
|
|
14.4 |
% |
|
|
17.0 |
% |
|
Coupon income |
|
|
10.4 |
% |
|
|
10.4 |
% |
|
|
10.6 |
% |
|
Accretion of discount |
|
|
0.8 |
% |
|
|
0.8 |
% |
|
|
0.8 |
% |
|
Accretion of end-of-term payments |
|
|
2.0 |
% |
|
|
2.5 |
% |
|
|
4.0 |
% |
|
Impact of prepayments during the period |
|
|
3.2 |
% |
|
|
0.7 |
% |
|
|
1.6 |
% |
_______________
|
(1) |
Weighted average portfolio yields on debt investments for periods shown are the annualized rates of interest income recognized during the period divided by the average amortized cost of debt investments in the portfolio at the beginning of each month in the period. |
Note 9. Net Increase in Net Assets per Share
The following information sets forth the computation of basic and diluted net increase in net assets per share for the years ended December 31, 2017, December 31, 2016 and December 31, 2015.
|
Basic and Diluted Share Information |
|
For the Year Ended December 31, |
|
|||||||||
|
(in thousands, except per share data) |
|
2017 |
|
|
2016 |
|
|
2015 |
|
|||
|
Net investment income |
|
$ |
26,266 |
|
|
$ |
23,011 |
|
|
$ |
21,959 |
|
|
Net increase in net assets resulting from operations |
|
$ |
19,227 |
|
|
$ |
11,126 |
|
|
$ |
15,521 |
|
|
Basic and diluted weighted average shares of common stock outstanding |
|
|
16,324 |
|
|
|
16,160 |
|
|
|
15,041 |
|
|
Basic and diluted net investment income per share of common stock |
|
$ |
1.61 |
|
|
$ |
1.42 |
|
|
$ |
1.46 |
|
|
Basic and diluted net increase in net assets resulting from operations per share of common stock |
|
$ |
1.18 |
|
|
$ |
0.69 |
|
|
$ |
1.03 |
|
Note 10. Equity
Since inception through December 31, 2017, the Company has issued 18,162,545 shares of common stock through an initial public offering, a concurrent private placement offering, a follow-on offering, and a private placement offering. The Company received net proceeds from these offerings of approximately $260.0 million, net of the portion of the underwriting sales load and offering costs paid by the Company.
The Company has adopted a dividend reinvestment plan for its stockholders, which is an “opt out” dividend reinvestment plan. Under this plan, if the Company declares a cash distribution to stockholders, the amount of such distribution is automatically reinvested in additional shares of common stock unless a stockholder specifically “opts out” of the dividend reinvestment plan. If a stockholder opts out, that stockholder receives cash distributions.
Information on the proceeds raised along with any related underwriting sales load and associated offering expenses, and the price at which common stock was issued by the Company, during the years ended December 31, 2017, December 31, 2016 and December 31, 2015, is provided in the following tables.
|
Issuance of Common Stock for the Year Ended December 31, 2017 (in thousands, except per share data) |
|
Date |
|
Number of Shares of Common Stock Issued |
|
Gross Proceeds Raised |
|
Underwriting Sales Load |
|
Offering Expenses |
|
Gross Offering Price |
||||
|
First quarter 2017 distribution reinvestment |
|
4/17/2017 |
|
|
21 |
|
$ |
271 |
|
$ |
— |
|
$ |
— |
|
$13.21 per share |
|
Second quarter 2017 distribution reinvestment |
|
6/16/2017 |
|
|
17 |
|
|
214 |
|
|
— |
|
|
— |
|
$12.73 per share |
|
Third quarter 2017 distribution reinvestment |
|
9/15/2017 |
|
|
25 |
|
|
314 |
|
|
— |
|
|
— |
|
$12.43 per share |
|
Private Placement |
|
10/25/2017 |
|
|
1,594 |
|
|
21,583 |
|
|
— |
|
|
— |
|
$13.54 per share |
|
Private Placement |
|
10/25/2017 |
|
|
74 |
|
|
1,010 |
|
|
— |
|
|
— |
|
$13.65 per share |
|
Fourth quarter 2017 distribution reinvestment |
|
12/1/2017 |
|
|
19 |
|
|
240 |
|
|
— |
|
|
— |
|
$12.69 per share |
|
Total issuance |
|
|
|
|
1,750 |
|
$ |
23,632 |
|
$ |
— |
|
$ |
— |
|
|
116
|
Issuance of Common Stock for the Year Ended December 31, 2016 (in thousands, except per share data) |
|
Date |
|
Number of Shares of Common Stock Issued |
|
Gross Proceeds Raised |
|
Underwriting Sales Load |
|
Offering Expenses |
|
Gross Offering Price |
||||
|
First quarter 2016 distribution reinvestment |
|
4/15/2016 |
|
|
46 |
|
$ |
452 |
|
$ |
— |
|
$ |
— |
|
$9.80 per share |
|
Second quarter 2016 distribution reinvestment |
|
6/16/2016 |
|
|
69 |
|
|
691 |
|
|
— |
|
|
— |
|
$10.03 per share |
|
Third quarter 2016 distribution reinvestment |
|
9/16/2016 |
|
|
27 |
|
|
273 |
|
|
— |
|
|
— |
|
$10.29 per share |
|
Fourth quarter 2016 distribution reinvestment |
|
12/16/2016 |
|
|
23 |
|
|
271 |
|
|
— |
|
|
— |
|
$11.68 per share |
|
Total issuance |
|
|
|
|
165 |
|
$ |
1,687 |
|
$ |
— |
|
$ |
— |
|
|
|
Issuance of Common Stock for the Year Ended December 31, 2015 (in thousands, except per share data) |
|
Date |
|
Number of Shares of Common Stock Issued |
|
Gross Proceeds Raised |
|
Underwriting Sales Load |
|
Offering Expenses |
|
Gross Offering Price |
||||
|
Public offering of common stock |
|
3/27/2015 |
|
|
6,500 |
|
$ |
94,575 |
|
$ |
— |
|
$ |
847 |
|
$14.55 per share (1) |
|
First quarter 2015 dividend reinvestment |
|
4/16/2015 |
|
|
29 |
|
|
390 |
|
|
— |
|
|
— |
|
$13.33 per share |
|
Exercise of over-allotment option |
|
4/24/2015 |
|
|
154 |
|
|
2,242 |
|
|
— |
|
|
32 |
|
$14.55 per share (1) |
|
Second quarter 2015 dividend reinvestment |
|
6/16/2015 |
|
|
35 |
|
|
449 |
|
|
— |
|
|
— |
|
$12.92 per share |
|
Third quarter 2015 dividend reinvestment |
|
9/16/2015 |
|
|
38 |
|
|
410 |
|
|
— |
|
|
— |
|
$10.80 per share |
|
Fourth quarter 2015 dividend reinvestment |
|
12/16/2015 |
|
|
88 |
|
|
999 |
|
|
— |
|
|
— |
|
$11.34 per share |
|
Total issuance |
|
|
|
|
6,844 |
|
$ |
99,065 |
|
$ |
— |
|
$ |
879 |
|
|
______________
|
(1) |
In connection with this offering, the Adviser paid the underwriters a supplemental payment of approximately $0.7 million, or $0.11 per share, which reflected the difference between the public offering price and the proceeds per share received by the Company in the offering. |
During the fourth quarter of 2015, the Board authorized the repurchase of up to $25 million of its common stock at prices below the Company’s NAV per share as reported in its most recent financial statements. This repurchase program expired on October 31, 2017. There was no repurchase of common stock during the year ended December 31, 2017. The Company repurchased 485,986 shares and 466,220 shares of common stock for approximately $5.4 million and $5.6 million during the years ended December 31, 2016 and December 31, 2015, respectively.
|
Shares Repurchased for the Year Ended December 31, 2016 (in thousands, except per share data) |
|
Date |
|
Number of Shares Repurchased |
|
|
Approximate Dollar Value of Shares Repurchased |
|
|
Average Price per Share |
||
|
Shares Repurchased |
|
5/12/2016 to 6/16/2016 |
|
|
190 |
|
|
$ |
2,002 |
|
|
$ 10.52 per share |
|
Shares Repurchased |
|
8/11/2016 to 8/29/2016 |
|
|
296 |
|
|
|
3,374 |
|
|
$ 11.41 per share |
|
Total Shares Repurchased |
|
|
|
|
486 |
|
|
$ |
5,376 |
|
|
|
|
Shares Repurchased for the Year Ended December 31, 2015 (in thousands, except per share data) |
|
Date |
|
Number of Shares Repurchased |
|
|
Approximate Dollar Value of Shares Repurchased |
|
|
Average Price per Share |
||
|
Shares Repurchased |
|
11/13/2015 to 12/23/2015 |
|
|
466 |
|
|
$ |
5,552 |
|
|
$ 11.91 per share |
|
Total Shares Repurchased |
|
|
|
|
466 |
|
|
$ |
5,552 |
|
|
|
The Company had 17,730,091 and 15,980,768 shares of common stock outstanding as of December 31, 2017 and December 31, 2016, respectively.
Note 11. Distributions
The Company has elected to be treated, and intends to comply with the requirements to continue to qualify annually, as a RIC under the Code, beginning with the Company’s taxable year ended December 31, 2014. In order to maintain its ability to be subject to tax as a RIC, among other things, the Company is required to distribute at least 90% of its net ordinary income and net realized short-term capital gains in excess of its net realized long-term capital losses, if any, to its stockholders. Additionally, to avoid a nondeductible 4% U.S. federal excise tax on certain of the Company’s undistributed income, the Company must distribute during each calendar year an amount at least equal to the sum of: (a) 98% of the Company’s ordinary income (not taking into account any capital gains or losses) for such calendar year; (b) 98.2% of the amount by which the Company’s capital gains exceed the Company’s capital losses (adjusted for certain ordinary losses) for a one-year period ending on October 31 of the calendar year (unless an election is made by the Company to use its taxable year); and (c) certain undistributed amounts from previous years on which the Company paid no U.S. federal income tax.
117
For the tax years ended December 31, 2014, 2015 and 2017, the Company was subject to a 4% U.S. federal excise tax and the Company may be subject to this tax in future years. In such cases, the Company is liable for the tax only on the amount by which the Company does not meet the foregoing distribution requirement. The character of income and gains that the Company distributes is determined in accordance with income tax regulations that may differ from GAAP. Book and tax basis differences relating to stockholder dividends and distributions and other permanent book and tax differences are reclassified to paid-in capital. The Company incurred a non-deductible U.S. federal excise tax of approximately $19 thousand and $38 thousand for the years ended December 31, 2017 and December 31, 2015, respectively.
The following table summarizes cash distributions per share that have been authorized by the board of directors since the Company’s initial public offering. From March 5, 2014 (commencement of operations) to December 31, 2015 and during the year ended December 31, 2017, these distributions represent ordinary income as earnings exceeded distributions. Approximately $1.20 per share of the distributions during the year ended December 31, 2016 represent a return of capital.
|
Period Ended |
|
Date Announced |
|
Record Date |
|
Payment Date |
|
Per Share Amount |
|||
|
March 31, 2014 |
|
April 3, 2014 |
|
April 15, 2014 |
|
April 30, 2014 |
|
$ |
0.09 |
|
(1) |
|
June 30, 2014 |
|
May 13, 2014 |
|
May 30, 2014 |
|
June 17, 2014 |
|
$ |
0.30 |
|
|
|
September 30, 2014 |
|
August 11, 2014 |
|
August 29, 2014 |
|
September 16, 2014 |
|
$ |
0.32 |
|
|
|
December 31, 2014 |
|
October 27, 2014 |
|
November 28, 2014 |
|
December 16, 2014 |
|
$ |
0.36 |
|
|
|
December 31, 2014 |
|
December 3, 2014 |
|
December 22, 2014 |
|
December 31, 2014 |
|
$ |
0.15 |
|
(2) |
|
March 31, 2015 |
|
March 16, 2015 |
|
March 26, 2015 |
|
April 16, 2015 |
|
$ |
0.36 |
|
|
|
June 30, 2015 |
|
May 6, 2015 |
|
May 29, 2015 |
|
June 16, 2015 |
|
$ |
0.36 |
|
|
|
September 30, 2015 |
|
August 11, 2015 |
|
August 31, 2015 |
|
September 16, 2015 |
|
$ |
0.36 |
|
|
|
December 31, 2015 |
|
November 10, 2015 |
|
November 30, 2015 |
|
December 16, 2015 |
|
$ |
0.36 |
|
|
|
March 31, 2016 |
|
March 14, 2016 |
|
March 31, 2016 |
|
April 15, 2016 |
|
$ |
0.36 |
|
|
|
June 30, 2016 |
|
May 9, 2016 |
|
May 31, 2016 |
|
June 16, 2016 |
|
$ |
0.36 |
|
|
|
September 30, 2016 |
|
August 8, 2016 |
|
August 31, 2016 |
|
September 16, 2016 |
|
$ |
0.36 |
|
|
|
December 31, 2016 |
|
November 7, 2016 |
|
November 30, 2016 |
|
December 16, 2016 |
|
$ |
0.36 |
|
|
|
March 31, 2017 |
|
March 13, 2017 |
|
March 31, 2017 |
|
April 17, 2017 |
|
$ |
0.36 |
|
|
|
June 30, 2017 |
|
May 9, 2017 |
|
May 31, 2017 |
|
June 16, 2017 |
|
$ |
0.36 |
|
|
|
September 30, 2017 |
|
August 8, 2017 |
|
August 31, 2017 |
|
September 15, 2017 |
|
$ |
0.36 |
|
|
|
December 31, 2017 |
|
November 6, 2017 |
|
November 17, 2017 |
|
December 1, 2017 |
|
$ |
0.36 |
|
|
|
Total cash distributions |
|
|
|
|
|
|
|
$ |
5.54 |
|
|
_______________
|
(1) |
The amount of this initial distribution reflected a quarterly dividend rate of $0.30 per share, prorated for the 27 days for the period from the pricing of the Company’s initial public offering on March 5, 2014 through March 31, 2014. |
|
(2) |
Represents a special distribution. |
It is the Company’s intention to distribute all or substantially all of its taxable income earned over the course of the year; thus, no provision for income tax has been recorded in the consolidated statements of operations through December 31, 2017, December 31, 2016 and December 31, 2015, respectively. For the year ended December 31, 2017, total distributions of $1.44 per share were declared and paid and represented a distribution of ordinary income as the Company’s earnings and profits for 2017 exceeded its distributions. For the year ended December 31, 2016, total distributions of $1.44 per share were declared and paid. Approximately $1.20 of the declared distribution in 2016 represents a return of capital due to realized losses on debt investments. The balance represents a distribution of ordinary income. For the year ended December 31, 2015, total dividends of $1.44 per share have been declared and paid and represented a distribution of ordinary income as the Company’s earnings and profits for 2015 exceeded its distributions. As of December 31, 2017, the Company estimated it had undistributed 2017 taxable earnings of approximately $1.0 million. This “spillover” income will be paid as part of the first quarter 2018 dividends. Since March 5, 2014 (commencement of operations) to December 31, 2017, total distributions of $5.54 per share have been declared and paid.
Note 12. Taxable Income
The Company has elected to be treated and intends to qualify each year as a RIC under Subchapter M of the Code. As a RIC, the Company generally does not pay corporate-level U.S. federal income taxes on any ordinary income or capital gains that the Company timely distributes to its stockholders as dividends. Taxable income includes the Company’s taxable interest and other income, reduced by certain deductions, as well as taxable net realized capital gains. Taxable income generally differs from net income for financial reporting purposes due to temporary and permanent differences in the recognition of income and expenses, and generally excludes net unrealized gains or losses, as such gains or losses are not included in taxable income until they are realized.
118
To qualify and be subject to tax as a RIC, the Company is required to meet certain income and asset diversification tests in addition to distributing dividends of an amount generally at least equal to 90% of its investment company taxable income, as defined by the Code and determined without regard to any deduction for distributions paid, to its stockholders. The amount to be paid out as a distribution is determined by the Board of Directors each quarter and is based upon the annual earnings estimated by the management of the Company. To the extent that the Company’s earnings fall below the amount of dividend distributions declared, however, a portion of the total amount of the Company’s distributions for the fiscal year may be deemed a return of capital for tax purposes to the Company’s stockholders.
Because federal income tax regulations differ from accounting principles generally accepted in the United States, distributions in accordance with tax regulations may differ from net investment income and realized gains recognized for financial reporting purposes. Differences may be permanent or temporary in nature. Permanent differences are reclassified among capital accounts in the financial statements to reflect their appropriate tax character. Permanent differences may also result from the change in the classification of short-term gains as ordinary income for tax purposes. Temporary differences arise when certain items of income, expense, gain or loss are recognized at some time in the future. Also, recent tax legislation requires that certain income be recognized for tax purposes no later than when recognized for financial reporting purposes.
It is the Company’s intention to distribute 100% of its annual taxable income to its stockholders and thus, no provision for income tax has been recorded in the Company’s consolidated statements of operations for the years ended December 31, 2017, December 31, 2016 and December 31, 2015. The table below provides taxable income before deductions of distributions.
|
Taxable Income before Deductions for Distributions |
|
For the Year Ended December 31, |
|
|||||||||
|
|
2017 |
|
|
2016 |
|
|
2015 |
|
||||
|
Net increase (decrease) in net assets resulting from operations |
|
$ |
19,227 |
|
|
$ |
11,126 |
|
|
$ |
15,521 |
|
|
Less: Net realized and unrealized gains (losses) |
|
|
5,302 |
|
|
|
(9,598 |
) |
|
|
6,438 |
|
|
Plus: Other GAAP / tax differences |
|
|
102 |
|
|
|
614 |
|
|
|
(21 |
) |
|
Taxable income before deductions for distributions |
|
$ |
24,631 |
|
|
$ |
2,142 |
|
|
$ |
21,938 |
|
Subsequent to the issuance of the Company’s 2016 Consolidated Financial Statements, the Company reclassified distributions related to permanent book/tax differences within net assets pertaining to $20.4 million of loans that were charged off in 2016. The distributions were disclosed as a component of net assets instead of as a reduction of paid-in capital in excess of par value and the losses were disclosed as accumulated realized losses instead of as a permanent reduction of undistributed net investment income on the Consolidated Statements of Assets and Liabilities. The Company revised the previously reported amounts in accumulated net realized losses, undistributed net investment income and paid-in capital in excess of par value in the Consolidated Statements of Assets and Liabilities. The impact of the adjustments to the previously reported 2016 capital accounts is shown in the table below. The misclassification did not change the Company’s previously reported total net assets and net asset value per share as of December 31, 2016. Management has evaluated qualitative and quantitative factors to determine the misclassification adjustment to be immaterial to the 2016 Consolidated Financial Statements.
In addition, during the year ended December 31, 2017, the Company adjusted net assets for permanent differences between financial reporting and tax reporting. These differences relate to losses arising from the ordinary course of business, losses from extinguishment of 2020 Notes, return of capital and non-deductible excise taxes that were reclassified between the following components of net assets:
|
|
|
For the Year Ended December 31, |
|
|||||
|
(in thousands) |
|
2017 |
|
|
2016 |
|
||
|
Paid-in capital in excess of par value |
|
$ |
(19 |
) |
|
$ |
(19,505 |
) |
|
Undistributed net investment income |
|
$ |
(1,716 |
) |
|
$ |
(943 |
) |
|
Realized gains (losses) |
|
$ |
1,735 |
|
|
$ |
20,448 |
|
The Company distributed approximately $23.7 million, $23.2 million and $21.5 million, respectively, through four regular quarterly distributions during the years ended December 31, 2017, December 31, 2016 and December 31, 2015. The Company will distribute approximately $1.0 million of undistributed taxable income in 2018 to meet its intention of distributing all of the taxable income earned in the calendar year 2017. The entire amount of undistributed taxable income in the calendar year 2017 arises from ordinary income. The Company distributed approximately $1.7 million of undistributed taxable income in 2016 to meet its intention of distributing all of the taxable income earned in the calendar year 2015. There are no differences between book and tax cost as of December 31, 2017. The Company has non-expiring capital loss carryforwards available to offset future realized capital gains of $128 thousand.
119
At December 31, 2017 and 2016, the components of distributable earnings on a tax basis are as follows:
|
|
|
For the Year Ended December 31, |
|
|||||
|
(in thousands) |
|
2017 |
|
|
2016 |
|
||
|
Undistributed ordinary income |
|
$ |
976 |
|
|
$ |
- |
|
|
Capital loss carryforward |
|
$ |
(128 |
) |
|
$ |
(587 |
) |
|
Unrealized gains (losses) |
|
$ |
(1,568 |
) |
|
$ |
4,277 |
|
Note 13. Selected Quarterly Financial Results
The following tables set forth selected quarterly financial data for the three months ended March 31, 2017, June 30, 2017, September 30, 2017, and December 31, 2017 and for the three months ended March 31, 2016, June 30, 2016, September 30, 2016, and December 31, 2016.
|
Selected Quarterly Financial Results (unaudited) |
|
For the Three Months Ended |
|
|||||||||||||
|
(in thousands, except per share data) |
|
March 31, 2017 |
|
|
June 30, 2017 |
|
|
September 30, 2017 |
|
|
December 31, 2017 |
|
||||
|
Total investment and other income |
|
$ |
14,304 |
|
|
$ |
15,682 |
|
|
$ |
10,419 |
|
|
$ |
11,105 |
|
|
Net investment income |
|
$ |
7,919 |
|
|
$ |
8,831 |
|
|
$ |
4,367 |
|
|
$ |
5,149 |
|
|
Net realized gains (losses) |
|
$ |
(1,681 |
) |
|
$ |
(1,714 |
) |
|
$ |
(68 |
) |
|
$ |
2,187 |
|
|
Net unrealized gains (losses) |
|
$ |
(2,461 |
) |
|
$ |
804 |
|
|
$ |
(620 |
) |
|
$ |
(3,486 |
) |
|
Net increase (decrease) in net assets resulting from operations |
|
$ |
3,777 |
|
|
$ |
7,921 |
|
|
$ |
3,679 |
|
|
$ |
3,850 |
|
|
|
|
|
|
|
|
|
|
|
|
|
|
|
|
|
|
|
|
Basic and diluted net investment income per share |
|
$ |
0.50 |
|
|
$ |
0.55 |
|
|
$ |
0.27 |
|
|
$ |
0.30 |
|
|
Basic and diluted net increase (decrease) in net assets per share |
|
$ |
0.24 |
|
|
$ |
0.50 |
|
|
$ |
0.23 |
|
|
$ |
0.22 |
|
|
Net asset value per common share at period end |
|
$ |
13.38 |
|
|
$ |
13.52 |
|
|
$ |
13.39 |
|
|
$ |
13.25 |
|
|
Selected Quarterly Financial Results (unaudited) |
|
For the Three Months Ended |
|
|||||||||||||
|
(in thousands, except per share data) |
|
March 31, 2016 |
|
|
June 30, 2016 |
|
|
September 30, 2016 |
|
|
December 31, 2016 |
|
||||
|
Total investment and other income |
|
$ |
11,079 |
|
|
$ |
9,405 |
|
|
$ |
12,502 |
|
|
$ |
10,649 |
|
|
Net investment income |
|
$ |
6,728 |
|
|
$ |
4,958 |
|
|
$ |
6,495 |
|
|
$ |
4,830 |
|
|
Net realized gains (losses) |
|
$ |
(651 |
) |
|
$ |
(21,336 |
) |
|
$ |
1,081 |
|
|
$ |
188 |
|
|
Net unrealized gains (losses) |
|
$ |
(13,334 |
) |
|
$ |
16,381 |
|
|
$ |
3,859 |
|
|
$ |
1,927 |
|
|
Net increase (decrease) in net assets resulting from operations |
|
$ |
(7,257 |
) |
|
$ |
3 |
|
|
$ |
11,435 |
|
|
$ |
6,945 |
|
|
|
|
|
|
|
|
|
|
|
|
|
|
|
|
|
|
|
|
Basic and diluted net investment income per share |
|
$ |
0.41 |
|
|
$ |
0.30 |
|
|
$ |
0.40 |
|
|
$ |
0.30 |
|
|
Basic and diluted net increase (decrease) in net assets per share |
|
$ |
(0.45 |
) |
|
* |
|
|
$ |
0.71 |
|
|
$ |
0.44 |
|
|
|
Net asset value per common share at period end |
|
$ |
13.40 |
|
|
$ |
13.05 |
|
|
$ |
13.44 |
|
|
$ |
13.51 |
|
_______________
*Less than $0.005
Note 14. Subsequent Events
Dividends
On March 12, 2018, the Company announced that its Board declared a $0.36 per share regular quarterly dividend, payable on April 6, 2018 to stockholders of record on March 23, 2018.
Recent Portfolio Activity
From January 1, 2018 through March 12, 2018, the Company closed $85.0 million of additional debt commitments and funded $38.1 million in new investments. TPC’s direct originations platform entered into $100.0 million of additional non-binding signed term sheets with venture growth stage companies, subject to due diligence, definitive documentation and investment committee approval, as well as compliance with TPC’s allocation policy.
120
Amendment to the Credit Facility
In January 2018, the Company amended and renewed the Revolving Credit Facility (the “Amended Credit Facility”). Under the Amended Credit Facility, Deutsche Bank AG, New York Branch serves as administrative agent and as a lender together with existing lenders KeyBank National Association and EverBank Commercial Lender Finance, Inc., and new lender MUFG Union Bank, N.A. The Amended Credit Facility, among other things, increased the total commitments by $10.0 million to $210.0 million, extended the revolving period from February 21, 2018 to February 21, 2020, and extended the maturity date from February 21, 2019 to August 21, 2021. In addition, the Amended Credit Facility includes a reduction in the undrawn rate from 0.75% to 0.50% and a reduction in the applicable margin during the revolving period to 2.80% if facility utilization is greater than or equal to 75%, 2.90% if utilization is greater than or equal to 50%, and 3.00% if utilization is less than 50%. Borrowings under the Amended Credit Facility are subject to its various covenants and the leverage restrictions contained in the 1940 Act.
SEC Notice of Exemptive Application
On February 28, 2018, the SEC issued a public notice with regard to our exemptive application to permit co-investment with TPC and/or investment funds, accounts and investment vehicles managed by TPC with the exemptive order issuance expected after the notice period expires on March 26, 2018.
None.
1. Evaluation of Disclosure Controls and Procedures
The Company’s management, with the participation of the Company’s chief executive officer and the Company’s principal financial and accounting officer for purposes of signing the certifications required to be filed with this report, conducted an evaluation of the Company’s disclosure controls and procedures, as defined in Rules 13a-15(e) and 15d-15(e) of the Securities Exchange Act of 1934 (“Exchange Act”). As of the end of the period covered by this annual report on Form 10-K, the Company’s chief executive officer and principal financial and accounting officer have concluded that the Company’s disclosure controls and procedures were effective, and provided reasonable assurance, to ensure that information required to be disclosed by the Company in reports that the Company files or submits under the Exchange Act is recorded, processed, summarized, and reported within the time periods specified in the Securities and Exchange Commission (the “SEC”) rules and forms, and that information required to be disclosed by the Company in the reports that the Company files or submits under the Exchange Act is accumulated and communicated to the Company’s management, including the Company’s chief executive officer and principal financial and accounting officer, as appropriate to allow timely decisions regarding required disclosure. However, in evaluating the disclosure controls and procedures, management recognized that any controls and procedures, no matter how well designed and operated can provide only reasonable assurance of achieving the desired control objectives, and management necessarily was required to apply its judgment in evaluating the cost-benefit relationship of such possible controls and procedures.
2. Management’s Report on Internal Control Over Financial Reporting
The Company’s management is responsible for establishing and maintaining adequate internal control over financial reporting and for the assessment of the effectiveness of internal control over financial reporting. As defined by the SEC, internal control over financial reporting is a process designed under the supervision of the Company’s principal executive and principal financial and accounting officer, approved and monitored by the Company’s Board of Directors, and implemented by management and other personnel, to provide reasonable assurance regarding the reliability of financial reporting and the preparation of financial statements in accordance with U.S. generally accepted accounting principles (“GAAP”).
The Company’s internal control over financial reporting is supported by written policies and procedures, that (1) pertain to the maintenance of records that, in reasonable detail, accurately and fairly reflect the transactions and dispositions of the Company’s assets; (2) provide reasonable assurance that transactions are recorded as necessary to permit preparation of financial statements in accordance with GAAP, and that receipts and expenditures of the Company are being made only in accordance with authorizations of the Company’s management and directors; and (3) provide reasonable assurance regarding prevention or timely detection of unauthorized acquisition, use or disposition of the Company’s assets that could have a material effect on the financial statements.
121
Because of its inherent limitations, internal control over financial reporting may not prevent or detect misstatements. Therefore, even those systems determined to be effective can provide only reasonable assurance with respect to financial statement preparation and presentation. Also, projections of any evaluation of effectiveness to future periods are subject to the risk that controls may become inadequate because of changes in conditions, or that the degree of compliance with the policies or procedures may deteriorate.
Management of the Company conducted an assessment of the effectiveness of the Company’s internal control over financial reporting as of December 31, 2017 based on criteria established in Internal Control—Integrated Framework (2013) issued by the Committee of Sponsoring Organizations of the Treadway Commission (“the COSO Framework”). Based on this assessment, management has concluded that the Company’s internal control over financial reporting was effective as of December 31, 2017.
Due to the Company’s status as an “emerging growth company” under the Jumpstart Our Business Startups Act of 2012, the Company was not required to obtain an attestation report from the Company’s independent registered public accounting firm on the Company’s internal control over financial reporting as of December 31, 2017.
3. Changes in Internal Control Over Financial Reporting
There have been no changes in the Company’s internal control over financing reporting, as defined in Rules 13a-15(f) and 15d-15(f) of the Exchange Act that occurred during the fourth quarter of 2017 that have materially affected, or are reasonably likely to materially affect, the Company’s internal control over financial reporting.
None.
122
The information required by Item 10 is hereby incorporated by reference from our definitive Proxy Statement relating to our 2018 Annual Meeting of Stockholders, to be filed with the SEC within 120 days following the end of our fiscal year.
The information required by Item 11 is hereby incorporated by reference from our definitive Proxy Statement relating to our 2018 Annual Meeting of Stockholders, to be filed with the SEC within 120 days following the end of our fiscal year.
|
Item 12. |
Security Ownership of Certain Beneficial Owners and Management and Related Stockholder Matters |
The information required by Item 12 is hereby incorporated by reference from our definitive Proxy Statement relating to our 2018 Annual Meeting of Stockholders, to be filed with the SEC within 120 days following the end of our fiscal year.
The information required by Item 13 is hereby incorporated by reference from our definitive Proxy Statement relating to our 2018 Annual Meeting of Stockholders, to be filed with the SEC within 120 days following the end of our fiscal year.
The information required by Item 14 is hereby incorporated by reference from our definitive Proxy Statement relating to our 2018 Annual Meeting of Stockholders, to be filed with the SEC within 120 days following the end of our fiscal year.
123
|
(a) |
Documents Filed as Part of this Report |
The following financial statements are set forth in Item 8:
124
The following exhibits are filed as part of this report or hereby incorporated by reference to exhibits previously filed with the United States Securities and Exchange Commission:
125
|
(2) |
Incorporated by reference to Exhibit (b) to the Registrant’s Pre-Effective Amendment No. 1 to TriplePoint Venture Growth BDC Corp.’s registration statement on Form N-2 (File No. 333-191871) filed on January 22, 2014. |
|
(3) |
Incorporated by reference to Exhibit (d) to the Registrant’s Pre-Effective Amendment No. 1 to TriplePoint Venture Growth BDC Corp.’s registration statement on Form N-2 (File No. 333-191871) filed on January 22, 2014. |
|
(4) |
Previously filed on Form 8-A (File No. 001-36328) on August 4, 2015. |
|
(5) |
Incorporated by reference to Exhibit d(6) to the Registrant’s Post-Effective Amendment No. 6 to TriplePoint Venture Growth BDC Corp.’s Registration Statement on Form N-2 (File No. 333-204933) filed on July 14, 2017. |
|
(6) |
Incorporated by reference to Exhibit d(7) to the Registrant’s Post-Effective Amendment No. 6 to TriplePoint Venture Growth BDC Corp.’s Registration Statement on Form N-2 (File No. 333-204933) filed on July 14, 2017. |
|
(7) |
Incorporated by reference to Exhibit (e) to the Registrant’s Pre-Effective Amendment No. 1 to TriplePoint Venture Growth BDC Corp.’s registration statement on Form N-2 (File No. 333-191871) filed on January 22, 2014. |
|
(8) |
Incorporated by reference to Exhibit (g) to the Registrant’s Pre-Effective Amendment No. 2 to TriplePoint Venture Growth BDC Corp.’s registration statement on Form N-2 (File No. 333-191871) filed on February 24, 2014. |
|
(9) |
Incorporated by reference to Exhibit (j) to the Registrant’s Pre-Effective Amendment No. 3 to TriplePoint Venture Growth BDC Corp.’s registration statement on Form N-2 (File No. 333-191871) filed on March 3, 2014. |
|
(10) |
Incorporated by reference to Exhibit (k)(1) to the Registrant’s Pre-Effective Amendment No. 2 to TriplePoint Venture Growth BDC Corp.’s registration statement on Form N-2 (File No. 333-191871) filed on February 24, 2014. 9 |
|
(11) |
Incorporated by reference to Exhibit (k)(2) to the Registrant’s Pre-Effective Amendment No. 2 to TriplePoint Venture Growth BDC Corp.’s registration statement on Form N-2 (File No. 333-191871) filed on February 24, 2014. |
|
(12) |
Incorporated by reference to Exhibit (k)(3) to the Registrant’s Pre-Effective Amendment No. 1 to TriplePoint Venture Growth BDC Corp.’s registration statement on Form N-2 (File No. 333-191871) filed on January 22, 2014. |
|
(13) |
Incorporated by reference to Exhibit (k)(6) to the Registrant’s Pre-Effective Amendment No. 3 to TriplePoint Venture Growth BDC Corp.’s registration statement on Form N-2 (File No. 333-191871) filed on March 3, 2014. |
|
(14) |
Incorporated by reference to Exhibit (k)(9) to the Registrant’s Pre-Effective Amendment No. 3 to TriplePoint Venture Growth BDC Corp.’s registration statement on Form N-2 (File No. 333-191871) filed on March 3, 2014. |
|
(15) |
Incorporated by reference to Exhibit (k)(10) to the Registrant’s Pre-Effective Amendment No. 3 to TriplePoint Venture Growth BDC Corp.’s registration statement on Form N-2 (File No. 333-191871) filed on March 3, 2014. |
|
(16) |
Incorporated by reference to Exhibit 10.1 to the Registrant’s Form 8-K (File No. 814-01044) filed on June 10, 2014. |
|
(17) |
Incorporated by reference to Exhibit 10.1 to the Registrant’s Form 8-K (File No. 814-01044) filed on July 23, 2014. |
|
(18) |
Incorporated by reference to Exhibit 10.1 to the Registrant’s Form 8-K (File No. 814-01044) filed on August 11, 2014. |
|
(19) |
Incorporated by reference to Exhibit 10.1 to the Registrant’s Form 8-K (File No. 814-01044) filed on November 20, 2014. |
|
(20) |
Incorporated by reference to Exhibit 10.1 to the Registrant’s Form 8-K (File No. 814-01044) filed on January 29, 2016 |
|
(21) |
Incorporated by reference to Exhibit 10.1 to the Registrant’s Form 8-K (File No. 814-01044) filed on January 29, 2018 |
|
(22) |
Incorporated by reference to Exhibit 10.1 to the Registrant’s Form 8-K filed on October 26, 2017. |
|
(23) |
Included in the notes to the financial statements contained in this Report. |
|
(*) |
Filed herewith. |
|
(c) |
Financial Statement Schedules |
No financial statement schedules are filed herewith because (1) such schedules are not required or (2) the information has been presented in the aforementioned financial statements.
None.
126
Pursuant to the requirements of Section 13 or 15(d) of the Securities Exchange Act of 1934, the registrant has duly caused this Report on Form 10-K to be signed on its behalf by the undersigned, thereunto duly authorized.
|
|
|
TriplePoint Venture Growth BDC Corp |
|
Date: March 12, 2018 |
By: |
/S/ JAMES P. LABE |
|
|
|
James P. Labe |
|
|
|
Chief Executive Officer |
In accordance with the Securities Exchange Act of 1934, this report has been signed below by the following persons on behalf of the registrant and in the following capacities on March 12, 2018.
|
|
Signatures |
|
Title |
|
Date |
|
|
|
|
|
|
|
|
By: |
/s/ JAMES P. LABE |
|
Chief Executive Officer and Chairman of the Board (Principal Executive Officer) |
|
March 12, 2018 |
|
|
James P. Labe |
|
|
|
|
|
|
|
|
|
|
|
|
/s/ ANDREW J. OLSON |
|
Chief Financial Officer (Principal Financial and Accounting Officer) |
|
March 12, 2018 |
|
|
|
Andrew J. Olson |
|
|
|
|
|
|
|
|
|
|
|
|
By: |
/s/ SAJAL K. SRIVASTAVA |
|
Chief Investment Officer, President, Secretary, Treasurer and Director |
|
March 12, 2018 |
|
|
Sajal K. Srivastava |
|
|
|
|
|
|
|
|
|
|
|
|
By: |
/s/ GILBERT E. AHYE |
|
Director |
|
March 12, 2018 |
|
|
Gilbert E. Ahye |
|
|
|
|
|
|
|
|
|
|
|
|
By: |
/s/ STEVEN P. BIRD |
|
Director |
|
March 12, 2018 |
|
|
Steven P. Bird |
|
|
|
|
|
|
|
|
|
|
|
|
By: |
/s/ STEPHEN A. CASSANI |
|
Director |
|
March 12, 2018 |
|
|
Stephen A. Cassani |
|
|
|
|
|
|
|
|
|
|
|
|
|
|
|
|
|
|
|
|
|
|
|
|
|
127