Attached files
| file | filename |
|---|---|
| EX-99.1 - EXHIBIT 99.1 - BlueLinx Holdings Inc. | tv488240_ex99-1.htm |
| EX-10.2 - EXHIBIT 10.2 - BlueLinx Holdings Inc. | tv488240_ex10-2.htm |
| EX-10.1 - EXHIBIT 10.1 - BlueLinx Holdings Inc. | tv488240_ex10-1.htm |
| EX-2.1 - EXHIBIT 2.1 - BlueLinx Holdings Inc. | tv488240_ex2-1.htm |
| 8-K - FORM 8-K - BlueLinx Holdings Inc. | tv488240_8k.htm |
Exhibit 99.2
0 America’s Building Products Distributor March 2018 BlueLinx Holdings to Acquire Cedar Creek Holdings Creating a Leading Building Products Wholesale Distributor

1 Forward - Looking Statements This presentation contains “forward - looking statements” within the meaning of the Private Securities Litigation Reform Act of 19 95, including statements regarding the proposed combination. Forward - looking statements can be identified by such words and phrases as “believes,” “anticipates,” “expects,” “intends,” “estimates,” “may,” “will,” “should,” “continue” and similar expressions, co mpa rable terminology or the negative thereof, and includes the statements in this presentation related to the combination. All of the se forward - looking statements are based on estimates and assumptions made by our management that, although believed by BlueLinx Holdings (“ BlueLinx ”) to be reasonable, are inherently uncertain. Forward - looking statements involve risks and uncertainties, including, but not limited to, economic, competitive, governmental, and technological factors outside of BlueLinx’s control that may cause its business, strategy or actual results to differ materially from the forward - looking statements. Forward looking statements in this presentation regarding the amount, composition and timing of potential synergies and cost sav ings that may or are expected to result from the combination involve risks and uncertainties in addition to those enumerated below , i ncluding, but not limited to, that the substantial challenges inherent in the combination of the two companies prevents identified cost sy nergies from being realized without adversely affecting current revenues and investments in future growth, that the integration process re sul ts in the distraction of the combined company’s management, the disruption of BlueLinx’s ongoing business or inconsistencies in its services, standards, controls, procedures and policies, any of which could adversely affect its relationships with customers, vendors a nd employees or its ability to achieve the anticipated benefits of the combination, that the integration of the two companies may take mor e t ime and be more costly than anticipated, and that identified cost saving opportunities might not be fully or timely realized. Risks and uncertainties that relate to the proposed combination may include, among other things: the occurrence of any event, ch ange or other circumstances that could give rise to the termination of the definitive agreement; the failure to realize the benefits exp ected from the combination; the acquisition - related combination costs and BlueLinx’s restructuring and integration related costs and charges; BlueLinx’s projections as to the timing of the consummation of the combination; risks related to disruption of management time from ongo ing business operations due to the combination; the risk that the necessary regulatory approvals may not be obtained or may be ob tai ned subject to conditions that are not anticipated or that may be burdensome; risks that any of the conditions to the consummatio n o f the combination may not be satisfied in a timely manner; the impact of the combination on BlueLinx’s business; the expected terms, types and amount of the expected financing for the combination; failure to close the expected financing for the combination; and other factors described in the “Risk Factors” section in BlueLinx’s Annual Report on Form 10 - K for the year ended December 30, 2017, and in other documents filed with the Securities and Exchange Commission by BlueLinx from time to time. Although BlueLinx believes that the expectations reflected in any forward - looking statements are based on reasonable assumptions at the time made, BlueLinx can give no assurance that BlueLinx’s expectations will be achieved. Undue reliance should not be placed on these forward - looking statements, which speak only as of the date hereof. BlueLinx undertakes no obligation to publicly update or revise any forward - looking statement as a result of new information, future events, and changes in expectations or otherwise, except as required by applicable law .

2 Non - GAAP Financial Measures BlueLinx reports its financial results in accordance with accounting principles generally accepted in the United States (“GAAP”) . The Company also believes that presentation of certain non - GAAP measures may be useful to investors . Any non - GAAP measures used herein are reconciled to the financial tables set forth in the appendices hereto . The Company cautions that non - GAAP measures should be considered in addition to, but not as a substitute for, the Company’s reported GAAP results . We define Adjusted EBITDA as an amount equal to net income plus interest expense and all interest expense related items, income taxes, depreciation and amortization, and further adjusted to exclude certain non - cash items and other adjustments to Consolidated Net Income .
3 Today’s Presenters Mitchell B. Lewis Chief Executive Officer, President & Director Susan C. O’Farrell Chief Financial Officer & Treasurer

4 An Exciting Opportunity for Shareholders, Customers and Suppliers x Comprehensive Product and Services Portfolio Provides Opportunity for Accelerated Growth ▪ Enhanced combined company product portfolio by providing greater breadth and depth of building products and services for customers and suppliers ▪ Consistent top - line growth strategies focused on increasing sales from value - added products and services x Enhances Geographic Presence, Creating a Market Leader ▪ Creates a leading, diversified building products wholesale distribution platform with $3.2 billion of combined 2017 revenues ▪ Extends geographic reach and local market presence throughout the Northeast, Midwest, and Southern United States x Diversified and Established Customer Base ▪ Deep, longstanding relationships with an extensive roster of high - quality national and regional customers, many of which average more than 20 years ▪ Strong customer diversification with no single customer representing more than 5 percent of combined sales x Well Positioned to Grow with Housing Recovery ▪ Combination creates a market leader that is well positioned to capitalize on a continued recovery in the U.S. housing market x Significant Cost Savings Opportunities ▪ Significant cost savings anticipated of at least $50 million run - rate annually to be achieved within 18 months ▪ Implementation actions include network and fleet optimization, procurement opportunities, and G&A consolidation x Enhanced Financial Flexibility & Commitment to Deleveraging ▪ Pro - Forma capitalization improves financial flexibility to support growth ▪ High - quality ABL collateral significantly exceeds the total net ABL debt ▪ Real estate portfolio appraised at ~$150 – $160 million, ~4.0x 2017 year - end net book value ▪ Commitment to utilizing significant free cash flow to support deleveraging Attractive value creating combination for all stakeholders Note: Cedar Creek results unaudited for 2017

5 Transaction Overview Purchase Price ▪ $413 million purchase price o $345 million cash and $68 million as the agreed value of capital leases Cost Savings ▪ At least $50 million of annual run - rate cost savings expected to be achieved within 18 months Combined Financial Metrics ▪ $3.2 billion of combined Pro - Forma 2017 revenue ▪ Over $ 150 million of combined Pro - Forma 2017 Adj. EBITDA 1 ▪ Transaction is expected to be significantly and immediately accretive to EPS ▪ Combined company is expected to generate significant cash flow Financing ▪ $580 million Pro - Forma total funded debt 2 ▪ Commitments to arrange a revolving credit facility (the “ABL Revolver”) and term loan o $750 million ABL Revolver inclusive of a $150 million accordion feature o $180 million term loan ▪ Pro - Forma Total Debt 2 / 2017 Adj. EBITDA 3 of approximately 4.0x Cedar Creek Management ▪ Cedar Creek CEO to be COO of combined entity ▪ Cedar Creek Chairman to be Vice Chairman of operating companies Timing and Closing Conditions ▪ Customary regulatory approvals and closing conditions ▪ Expected to close end of Q1 2018 BlueLinx Holdings, a leading distributor of building and industrial products in the United States, announced today that it has entered into an agreement to acquire Cedar Creek Holdings (“Cedar Creek”) Note: Cedar Creek results unaudited for 2017; 2017 BlueLinx audited Financials as of 12/30/2017 1. Assumes $50M of annual run - rate cost savings 2. ABL Revolver and term loan debt as of Q1 2018 (projected close in early Q2 2018) 3. 2017 BlueLinx Adj. EBITDA of $44M, plus $60M of unaudited Cedar Creek Adj. EBITDA; assumes $50M of run - rate cost savings; excludes one - time c osts to achieve of $40 – $55M

6 6.9x 3.8x Cedar Creek Standalone Cedar Creek Pro-Forma 2017 NET INCOME AND ADJUSTED EBITDA Attractive Transaction Economics BlueLinx enters into strategic merger agreement to acquire Cedar Creek for $413 million Attractive Purchase Multiple Driving Cash Flow Growth and EPS Accretion PURCHASE MULTIPLE 1 Expected Run - Rate Cost Savings: $50M ($ in millions) 2 Note: Cedar Creek results unaudited for 2017 1. Based on $413M purchase price 2. Cedar Creek purchase multiple Pro - Forma for $50M in run - rate cost savings $18M $60M $110M Cedar Creek Standalone Net Income Cedar Creek Standalone Adj. EBITDA Cedar Creek Pro-Forma Adj. EBITDA

7 Overview of Cedar Creek COMPANY OVERVIEW Cedar Creek is a differentiated distributor with a proven growth and expansion strategy ▪ One of the leading wholesale building products distribution companies in the U.S. ▪ Operates 31 locations to service five customer groups – local lumber yards, pro dealers, “big box” retailers, industrial customers and one - step siding distributors ▪ Diverse customer makeup provides Cedar Creek with a stable base of revenues throughout various market conditions ▪ Maintains longstanding relationships with approximately 1,000 suppliers ▪ 2017 Financials o Revenue of $1,420 million o Net Income of $18 million o Adjusted EBITDA of $60 million PROVEN AND ESTABLISHED LEADERSHIP D. Wayne Trousdale Executive Chairman Alex Averitt CEO ▪ Cedar Creek executive and shareholder since 1987 ▪ Promoted to CEO in 2015 and assumed Executive Chairman role in 2017 ▪ Approximately 20 years of experience in the sector ▪ Promoted to COO in 2015 and assumed CEO role in 2017 Note: Cedar Creek results unaudited for 2017

8 A Complementary Combination Poised for Growth OPERATIONS NATIONAL FOOTPRINT SERVICES 31 locations Headquarters in Oklahoma City, OK 11 wood manufacturing, 6 moulding , 6 timber and 2 prefinished siding facilities $1.42 billion sales ~1,300 associates 39 locations Headquarters in Atlanta, GA $1.82 billion sales ~1,500 associates Distribution, milling & fabrication, “less - than - truckload” delivery, inventory stocking & automated order processing and backhaul services Distribution , milling & fabrication, custom mouldings , inventory stocking & automated order processing, backhaul services and prefinished painting and staining services Compelling combination creates a market leader with a strong breadth of product / service offering Cedar Creek Locations BlueLinx Locations

9 ▪ Longstanding and deep customer relationships o Customers include household names with the national reach and financial stability to gain market share in a housing market rebound o Long - term relationships with top customers, averaging 20+ years ▪ No single customer represents more than ~5% of sales with limited churn ▪ Comprehensive product portfolio with strong brand recognition and addressable market leadership across key categories o Breadth and depth of building products and services should strengthen customer relationships and act as a strong selling point in winning new accounts ▪ Key path to market for the building products industry ▪ Fill the step between building products manufacturers and “Pro dealers,” local lumber yards, specialty distributors and big box retailers ▪ Particularly value - added with specialty products , which require a commitment to inventory, logistics efficiency and service Providing the Right Products to the Right Place Product resources, knowledgeable staff and a geographically broad distribution platform make us a valuable partner to suppliers and customers Building Product Manufacturers Industrial Manufactured Housing Dealer, National Pro Dealer, & Specialty Distributor National Retail Home Centers Multi Family & Exports

10 Comprehensive Product and Service Offering ▪ A combination of structural and specialty products are utilized in every home construction o BlueLinx will offer a variety of branded and private - label products encompassing 50,000 SKUs PRODUCT DETAIL The combined company’s product suite provides a competitive shopping experience for customers Structural Products Specialty Products Decking & Fencing Flooring Metals Specialty Lumber Molding & Millwork Industrial & Decorative Panels Structural Framing/ Engineered Lumber Insulation Roofing Siding & Trim VALUE - ADDED SERVICES & PROCESSES SAMPLE PRODUCT OFFERING ▪ The combined company will provide a wide - range of value - added services to its customers and suppliers: o Almost 700 customer facing sales personnel o Approximately 70 plan design drawers for residential builders o Inventory stocking & automated order processing o Deliveries available within 24 hours of order VALUE - ADDED PROCESS NO.OF FACILITIES COMPANY DIFFERENTIATION Prefinished Siding 2 x Providing next - day service on stock colors and quick turn - around on customer colors to the mid - west siding market Moulding Operations 5 x In - house manufacturing provides consistently high service levels and customized capabilities Hardwood / Softwood Fabrication 16 x Offers next - day delivery on custom orders x Provides enhanced product reducing customers inventory requirements Timber Operations 6 x Provides customers with immediate availability of custom products otherwise difficult to procure or subject to long lead - times

11 0.0 0.5 1.0 1.5 2.0 1995A 1996A 1997A 1998A 1999A 2000A 2001A 2002A 2003A 2004A 2005A 2006A 2007A 2008A 2009A 2010A 2011A 2012A 2013A 2014A 2015A 2016A 2017A 2018E 2019E 2020E Accelerating Market Demand Drivers Creates a Long Runway for Ongoing Value Creation REPAIR & REMODELING SPENDING RESIDENTIAL CONSTRUCTION HOME IMPROVEMENT SPENDING NEW RESIDENTIAL CONSTRUCTION MARKET EVOLUTION ▪ Strong and consistent recovery expected in R&R spending o Powerful ongoing, long - term demand drivers such as home ownership and housing prices o Consumer trends rebounding after prolonged period of “austerity” during the downturn ▪ Meaningful multi - year growth projected o Supportive population demographics combined with aging housing stock o Favorable credit availability o Economics of buying remain favorable to renting 1980 - 2015 median total starts: 1.42M ($bn) Consumer Market Professional Market Single - family Housing Starts Multi - family Housing Starts Source: Historical information from U.S. Census Bureau and Home Improvement Research Institute; future projections for housing starts and home improvement spending based on median of industry research projections through 2018 and management extrapolations thereafter ▪ The combined company is well - positioned to continue to grow sales as leading economic indicators continue to paint a favorable picture for building products and its distribution Room To Run: Growth of over 20% to reach historical average annual single family starts Prolonged period of below - average construction leaves room for significant “ catch - up” growth Housing Starts (in millions) $0 $50 $100 $150 $200 $250 $300 $350 $400 1992A 1993A 1994A 1995A 1996A 1997A 1998A 1999A 2000A 2001A 2002A 2003A 2004A 2005A 2006A 2007A 2008A 2009A 2010A 2011A 2012A 2013A 2014A 2015A 2016A 2017E 2018E 2019E 2020E

12 Significant Cost Savings Potential Expense Category 2017 Pro - Forma Combined Opportunity ($ in millions) Illustrative Savings Opportunities G & A Expense $ 200M ▪ Professional services ▪ General maintenance and supply ▪ Marketing, travel & entertainment ▪ Employee benefit harmonization ▪ Insurance, licenses, cell phones, etc. ▪ Administrative expense Network & Fleet Spend ¹ $ 154M ▪ Route optimization ▪ Occupancy cost reductions (rent, tax, utilities, telecom, etc.) ▪ Maintenance and supplies ▪ Material handling efficiencies ▪ Fuel ▪ Rentals and maintenance ▪ Lower third party freight costs ▪ Trucks, trailers and forklifts ▪ Facility fixed costs Procurement Opportunities ² $ 2 , 813M ▪ Consolidated purchase volume opportunities ▪ In - bound freight ▪ Import savings ▪ Expansion of brands to support growth in additional geographic territories Over $3 billion of addressable spend for savings opportunities Note: Cedar Creek results unaudited for 2017; 2017 BlueLinx audited Financials as of 12/30/2017 1. Total warehouse, delivery and logistics expenses 2. Total COGS expense Consolidated operations provide excellent efficiency opportunities
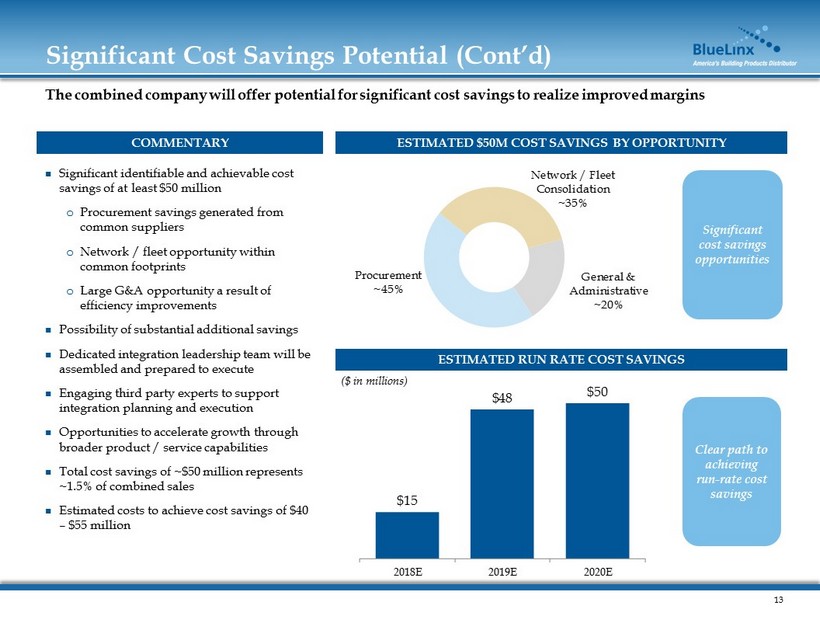
13 Significant Cost Savings Potential (Cont’d) ESTIMATED RUN RATE COST SAVINGS COMMENTARY The combined company will offer potential for significant cost savings to realize improved margins ESTIMATED $50M COST SAVINGS BY OPPORTUNITY Significant identifiable and achievable cost savings of at least $50 million o Procurement savings generated from common suppliers o Network / fleet opportunity within common footprints o Large G&A opportunity a result of efficiency improvements Possibility of substantial additional savings Dedicated integration leadership team will be assembled and prepared to execute Engaging third party experts to support integration planning and execution Opportunities to accelerate growth through broader product / service capabilities Total cost savings of ~$50 million represents ~1.5% of combined sales Estimated costs to achieve cost savings of $40 – $55 million Clear path to achieving run - rate cost savings Significant cost savings opportunities ($ in millions) $15 $48 $50 2018E 2019E 2020E General & Administrative ~20% Procurement ~45% Network / Fleet Consolidation ~35%

14 $44M $60M $154M Highly Attractive Combined Financial Profile 2017 REVENUE The combined company will offer potential for significant cost savings to realize improved margins Expected Run - Rate Cost Savings: ~$50M 2.4% 4.1% 4.8% Note: Cedar Creek results unaudited for 2017; 2017 BlueLinx audited Financials as of 12/30/2017 1. Pro - Forma c ombined net income not available 2017 ADJUSTED EBITDA 2017 NET INCOME 1 $1.82B $1.42B $3.24B BlueLinx Cedar Creek Combined $63M $18M $131M Expected Run - Rate Cost Savings: ~$50M

15 6.4x ~4.0x BXC 2017 YE Pro-Forma Q1 2018 Projected Q4 2019 Cash Flow Generation Supports Deleveraging Leverage Pro - Forma total funded debt of ~$580 million at close 1 o ~$400M drawn at close (estimated cost of L + 225bps) o $180M First Lien Term Loan (estimated cost of L + 700bps with 1.0% LIBOR floor) Liquidity ▪ The combined c ompany has high - quality ABL collateral, significantly exceeding the total net ABL debt o Inventory with quick turnover and low obsolescence o Relatively low bad debt expense over the last three years ~$150 - $160M value of owned real estate based on recent appraisals o Real estate appraised at ~4.0x 2017 year - end net book value Anticipated excess availability of $110M at closing The combined company will generate significant cost savings with strong working capital and real estate to provide strong asset coverage and ability to quickly delever Note: Cedar Creek results unaudited for 2017 1. ABL Revolver and term loan debt as of Q1 2018 ( projected close in early Q2 2018 ) 2. ABL debt of $183M plus $98M mortgage / 2017 Adj. EBITDA of $44M 3. ABL Revolver and term loan debt as of Q1 2018 (projected close in early Q2 2018); Adj. EBITDA includes run - rate cost savings of $50M ENHANCED LEVERAGE PROFILE ~2.5x – 3.0x 2 3

16 • Enhances geographic presence and creates a leading building products wholesale distributor East of the Rockies with over 700 customer facing sales associates • Comprehensive product and services portfolio provides opportunity for accelerated growth • Diversified and established customer base will benefit from the combined company’s expanded capabilities • Well positioned to capitalize on a continued recovery in the U.S. housing market • Significant cost savings anticipated to be at least $50 million annually • Pro - Forma capitalization improves financial flexibility to support growth and deleveraging Compelling Transaction for BlueLinx Shareholders STRATEGIC RATIONALE The combined company’s combined facilities and expanded product offerings position the business for industry leadership

17 America’s Building Products Distributor Appendix

18 Reconciliation of GAAP to Adjusted Measures 2017 Adjusted EBITDA Reconciliation BlueLinx Cedar Creek (unaudited) Combined Net income (loss) $63 $18 $81 Adjustments: Depreciation and amortization 9 17 26 Interest expense 21 10 31 Provision for (benefit from) income taxes (53) 12 (41) Other 4 3 7 Adjusted EBITDA $44 $60 $104 (In millions) Note: 2017 BlueLinx audited Financials as of 12/30/2017; Cedar Creek 2017 YE unaudited; Combined Adjusted EBITDA shown exclusive of cost savings benefits