Attached files
| file | filename |
|---|---|
| EX-32.1 - EXHIBIT 32.1 - Envirotech Vehicles, Inc. | exh_321.htm |
| EX-31.2 - EXHIBIT 31.2 - Envirotech Vehicles, Inc. | exh_312.htm |
| EX-31.1 - EXHIBIT 31.1 - Envirotech Vehicles, Inc. | exh_311.htm |
UNITED STATES
SECURITIES AND EXCHANGE COMMISSION
Washington, D.C. 20549
FORM 10-K
☒ ANNUAL REPORT PURSUANT TO SECTION 13 OR 15(d) OF THE SECURITIES EXCHANGE ACT OF 1934
For the fiscal year ended December 31, 2017
or
☐ TRANSITION REPORT UNDER SECTION 13 OR 15(d) OF THE SECURITIES EXCHANGE ACT OF 1934
For the transition period from __________to_________
Commission file number: 001-38078
ADOMANI, INC.
(Name of registrant as specified in its charter)
| Delaware | 46-0774222 | |
| (State or other jurisdiction of incorporation or organization) |
(I.R.S. Employer Identification No.) |
4740 Green River Road, Suite 106
Corona, California 92880
(Address of principal executive offices, including zip code)
Registrant’s telephone number including area code: (951) 407-9860
Securities registered pursuant to Section 12(b) of the Act:
| Common Stock, $0.00001 par value | The Nasdaq Stock Market LLC | |
| Title of class | Name of exchange on which registered |
Securities registered pursuant to Section 12(g) of the Act: None
Indicate by check mark if the registrant is a well-known seasoned issuer, as defined in Rule 405 of the Securities Act. Yes ☐ No ☒
Indicate by check mark if the registrant is not required to file reports pursuant to Section 13 or 15(d) of the Exchange Act. Yes ☐ No ☒
Indicate by check mark if the registrant (1) has filed all reports required to be filed by Section 13 or 15(d) of the Securities Exchange Act of 1934 during the past 12 months (or for such shorter period that the registrant was required to file such reports), and (2) has been subject to such filing requirements for the past 90 days. Yes ☒ No ☐
Indicate by check mark whether the registrant has submitted electronically and posted on its corporate Web site, if any, every Interactive Data File required to be submitted and posted pursuant to Rule 405 of Regulation S-T (§ 232.405 of this chapter) during the preceding 12 months (or for such shorter period that the registrant was required to submit and post such files). Yes ☒ No ☐
Indicate by check mark if disclosure of delinquent filers in response to Item 405 of Regulation S-K is not contained herein, and will not be contained, to the best of the registrant’s knowledge, in definitive proxy or information statements incorporated by reference in Part III of this Form 10-K or any amendment to this Form 10-K. ☒
Indicate by check mark whether the registrant is a large accelerated filer, an accelerated filer, a non-accelerated filer, a smaller reporting company, or emerging growth company. See the definitions of “large accelerated filer,” “accelerated filer,” “smaller reporting company,” and “emerging growth company” in Rule 12b-2 of the Exchange Act:
| Large accelerated filer ☐ | Accelerated filer ☐ | Non-accelerated filer ☒ (Do not check if a smaller reporting company) |
Smaller reporting company ☐ |
| Emerging growth company ☒ |
If an emerging growth company, indicate by check mark if the registrant has elected not to use the extended transition period for complying with any new or revised financial accounting standards provided pursuant to Section 13(a) of the Exchange Act. ☒
Indicate by check mark whether the registrant is a shell company (as defined in Rule 12b-2 of the Exchange Act). Yes ☐ No ☒
The aggregate market value of the common stock held by non-affiliates of the registrant, based on the closing price reported by the Nasdaq Capital Market on June 30, 2017, was approximately $602.7 million.
As of March 7, 2018, 71,737,597 shares of the registrant’s common stock were issued and outstanding.
DOCUMENTS INCORPORATED BY REFERENCE
The information that is required to be included in Part III of this Annual Report on Form 10-K is incorporated by reference to either a definitive proxy statement or an amendment to this Annual Report on Form 10-K to be filed by the registrant within 120 days of December 31, 2017. Only those portions of any such definitive proxy statement that are specifically incorporated by reference herein shall constitute a part of this Annual Report on Form 10-K.
ADOMANI, INC.
TABLE OF CONTENTS
FORWARD-LOOKING STATEMENTS
This Annual Report on Form 10-K (Annual Report), contains “forward-looking statements” that involve substantial risks and uncertainties. Forward-looking statements relate to future events or our future financial performance or condition and involve known and unknown risks, uncertainties and other factors that could cause our actual results, levels of activity, performance or achievement to differ materially from those expressed or implied by these forward-looking statements. In some cases, you can identify forward-looking statements by terms such as “anticipate,” “believe,” “could,” “estimate,” “expect,” “intend,” “may,” “plan,” “potential,” “should,” “will” and “would” or the negatives of these terms or other comparable terminology.
You should not place undue reliance on forward-looking statements. The cautionary statements set forth in this Annual Report, including in “Risk Factors” and elsewhere, identify important factors which you should consider in evaluating our forward-looking statements. These factors include, among other things:
| · | Our ability to generate demand for our zero-emission or hybrid drivetrains and conversion kits in order to generate revenue; | |
| · | Our dependence upon external sources for the financing of our operations; | |
| · | Our ability to effectively execute our business plan; | |
| · | Our ability to scale our manufacturing, assembling, and converting processes effectively and quickly from low volume production to high volume production; | |
| · | Our ability to manage our expansion, growth and operating expenses and reduce and adequately control the costs and expenses associated with operating our business; | |
| · | Our ability to obtain, retain and grow our customers; | |
| · | Our ability to enter into, sustain and renew strategic relationships on favorable terms; | |
| · | Our ability to achieve and sustain profitability; | |
| · | Our ability to evaluate and measure our current business and future prospects; | |
| · | Our ability to compete and succeed in a highly competitive and evolving industry; | |
| · | Our ability to respond and adapt to changes in electric or hybrid drivetrain technology; and | |
| · | Our ability to protect our intellectual property and to develop, maintain and enhance a strong brand. |
You should read this Annual Report and the documents that we reference elsewhere in this Annual Report completely and with the understanding that our actual results may differ materially from what we expect as expressed or implied by our forward-looking statements. Factors that may cause or contribute to such differences include, but are not limited to, those discussed in more detail in Item 1 (Business) and Item 1A (Risk Factors) of Part I and Item 7 (Management’s Discussion and Analysis of Financial Condition and Results of Operations) of Part II of this Annual Report. In light of the significant risks and uncertainties to which our forward-looking statements are subject, you should not place undue reliance on or regard these statements as a representation or warranty by us or any other person that we will achieve our objectives and plans in any specified timeframe, or at all. These forward-looking statements represent our estimates and assumptions only as of the date of this Annual Report regardless of the time of delivery of this Annual Report. Except as required by law, we undertake no obligation to update or revise publicly any forward-looking statements, whether as a result of new information, future events or otherwise after the date of this Annual Report.
| 1 |
Unless expressly indicated or the context
requires otherwise, references in this Annual Report to “ADOMANI,” “the Company,” “we,”
“our,” and “us” refer to ADOMANI, Inc. and our consolidated subsidiaries, unless the context
indicates otherwise.
| 2 |
Part I
| Item 1. | BUSINESS |
Overview
We design and cause to be designed advanced zero-emission electric and hybrid drivetrain systems for integration in new school buses and medium to heavy-duty commercial fleet vehicles. We also design and cause to be designed patented conversion kits to replace conventional drivetrain systems for combustion powered vehicles with zero-emission electric or hybrid drivetrain systems. The hybrid drivetrain systems are available in both an assistive hybrid format and a full-traction format for use in private and commercial fleet vehicles of all sizes. We expect to expand our product offerings to include the sale of zero-emission systems in vehicles manufactured by outside original equipment manufacture (OEM) partners, can be marketed, sold, warrantied and serviced through our developing distribution and service network.
Our drivetrain systems can be built with optional telemetrics for remote monitoring, electric power-export and various levels of grid-connectivity. Our zero-emission systems may also grow to include automated charging infrastructure and “intelligent” stationary energy storage that enables fast vehicle charging, emergency back-up facility power, and access to the developing, grid-connected opportunities for the aggregate power available from groups of large battery packs.
We are a provider of new zero-emission electric and hybrid vehicles and replacement drivetrains focused on total cost of ownership. Our drivetrain systems are designed to help fleet operators unlock the benefits of green technology and address the challenges of local, state and federal regulatory compliance and traditional-fuel price cost instability.
We generated virtually no revenue from inception through December 31, 2016, and generated $425,000 of revenue in 2017. For the years ended December 31, 2017, 2016 and 2015, our net losses were $21.9 million, $10.7 million and $6.0 million, respectively.
On January 9, 2018, we completed a public offering of 3,666,667 units for aggregate gross proceeds of $11.0 million. For each unit sold in the offering, we issued one share of our common stock and a warrant to purchase 1.5 shares of our common stock at an exercise price of $4.50. Net proceeds received after deducting commissions, expenses and fees of approximately $1.2 million were approximately $9.8 million. As discussed elsewhere in this Annual Report, the proceeds from our offering under Regulation A of the Securities Act of 1933, as amended (Securities Act) of $12.6 million, net of payments to selling stockholders of approximately $1.7 million, when combined with the follow-on raise discussed above is a total of approximately $23.6 million, which resulted in net proceeds to us of approximately $19.8 million
Market Overview
Concerns regarding climate change and other environmental considerations have led to the implementation of laws and regulations that restrict, cap, or tax emissions in the automotive industry and throughout other industries. In particular, Environmental Protection Agency (EPA) Tier 4 emission standards, California Air Resources Board (CARB) regulations, and recently implemented policies in Europe, generally referred to as Stage I, II, III and IV regulations, require a significant reduction in the level of emissions and particulate matter produced by diesel power systems and are increasing the costs associated with producing carbon-intensive fuels. These regulations are expected to increase both the cost and size of emission-compliant diesel power products, primarily due to the need to incorporate additional combustion and after-treatment components.
A variety of market factors are contributing to the increased use of alternative fuels and growth of alternative fuel technology, including economics, energy independence, environmental concerns, and the widespread availability of alternative fuels. As the price of crude oil remains volatile and the threats of climate change and air pollution remain public concerns, we believe the search for more cost effective and cleaner fuels has become more important. Electricity has emerged as a cleaner-fuel solution to these challenges. The price of alternative fuels such as electricity is often substantially less than diesel or gasoline, and alternative fuels can result in the production of lower amounts of greenhouse gases and other air pollutants.
| 3 |
In 2016, the number of electric cars surpassed two million in cumulative global car stock to date after reaching one million in cumulative global car stock in September 2015, up from about 665,000 as of the end of 2014. Additionally, in 2016, the number of electric buses grew to approximately 345,000 vehicles, double the number on the road in 2015 and an increase from 46,000 in 2014. Despite significant increases, including global sales of over 750,000 electric cars in 2016, electric vehicles (EVs) still represent only approximately 0.2% of the total number of passenger light-duty vehicles in circulation as of June 2017 and the EV market share exceeds 1% of total car sales in only six countries: the Netherlands, Norway, Sweden, France, the United Kingdom and China, with Norway leading with a 29% market share. Further, while the United States accounted for the largest portion of the global stock of electric cars in 2015 and accounted for approximately 20% of all new EVs sold worldwide in 2016, in 2016, China surpassed the United States, accounting for approximately 45% of all new EVs sold worldwide.
In the United States, sales of new EVs increased by 37% in 2016 as compared to 2015, and more than half of such sales occurred in California, likely driven by the state’s zero-emission vehicle mandate, buy-down and grants for EVs which require that a certain percentage of an automobile manufacturer’s sales must be zero-emission vehicles.
By 2019, global sales of EVs are estimated to exceed two million units, which would represent an increase from the 549,000 units sold in 2015, and by 2020, the global stock of electric cars may range between 9 million and 20 million. Further, in North America, some estimates suggest that the annual sales of hybrid and electric buses and trucks may increase 20.5% and 30.9% year-over-year through 2025, respectively. It is estimated that China has more than 200 million electric two-wheelers, between three and four million low-speed EVs and more than 300,000 electric buses in 2017, up from more than 170,000 and 112,400 buses in 2016 and 2015, respectively, and continues to seek electrification of other modes of transportation. Additionally, the output of the special purpose vehicle market in China increased 10.7 times year-over-year to 47,800 in 2015, and in the first two months of 2016, increased by approximately 116%. In September 2017, China announced that it intends to compel automobile manufacturers to accelerate the production of EVs by 2019, suggesting a concerted effort by the government of China to phase out traditional internal combustion engines as soon as practicable.
The overall market for EVs consists of multiple, discrete markets for various vehicle types, including passenger cars, buses, two-wheelers and others. Passenger cars are the most prominent, but two-wheelers are far more prevalent, particularly in Asia, and buses and trucks, although smaller in number are significantly higher in price and often purchased in bulk by major corporate customers or government or transit agencies. Because light duty passenger vehicles represent the largest potential market and have received the most attention from both analysts and policymakers, most global forecasts look at light duty EV sales.
Charging infrastructure is another important factor in EV adoption rates. The United States currently has 12,845 public electric charging stations and 32,069 public charging outlets. Some areas have considerably more charging stations than others, contributing to greater EV usage in those regions. Examples of particularly well equipped areas include the East and West Coasts of the United States, Japan, and Western Europe.
Electric Vehicle Markets
EVs include those that plug in to sources of electricity to recharge, such as: plug-in hybrid electric vehicles (PHEVs), and pure electric battery electric vehicles (BEVs), as well as simple hybrid vehicles that combine a conventional powertrain with some kind of electric propulsion. Electric motors all share simple mechanics and high energy conversion efficiency, which can reach 90% over a range of speeds and power outputs. Especially in start-stop city driving, regenerative braking can help convert motive energy back into electricity and reduce wear on brakes. Electric motors can also provide high torque from rest and do not need multiple gears to match power curves, obviating the need for gearboxes and torque converters.
| 4 |
Passenger Vehicles
Total worldwide sales of passenger EVs only surpassed two million in 2016. Despite recent growth, this still represents only 10% of the multi-nation Electric Vehicles Initiative’s goal of 20 million passenger EVs on the roads by 2020, or 2% of global cars.
In 2015, sales of plug-in EVs (including both pure plug-in electric vehicles (PEVs) and PHEVs, light trucks in the United States and Canada and light commercial vehicles in Europe) significantly increased. Global sales reached almost 540,000, a nearly 70% increase from 2014, which itself saw an approximate 50% increase from 2013. Notwithstanding this positive trend, EVs still comprised only 0.86% of the global auto market in 2016. In 2016, sales of plug-in EVs (including both pure PEVs and PHEVs, light trucks in the United States and Canada and light commercial vehicles in Europe) increased further to 773,600, a 42% increase from 2015.
Regionally, the largest increase occurred in China, which more than tripled EV sales in 2015 and accounted for more than 40% of the electric cars sold globally in 2016, more than double the amount sold in the United States, followed by Europe and the United States. Globally, approximately 95% of electric car sales occur in just ten countries: China, the United States, Japan, Canada, Norway, the United Kingdom, France, Germany, the Netherlands and Sweden. China and Europe, in particular, have been able to accelerate sales growth, likely due to stronger government support, particularly in the form of rebates, tax abatements, and other financial incentives for purchasing EVs.
Commercial Vehicles
As relatively simple as the pricing analysis is for individual consumers, the purchase and deployment of heavy duty commercial vehicles involve consideration of many more variables. Here, the type of customer is a major determinant, whether it is a commercial customer buying trucks for a fleet or a municipal entity purchasing buses for public use. Navigant Research forecasts global sales of electric drive and electric-assisted medium and heavy duty commercial vehicles (over 10,000 gross vehicle weight rating (GVWR)) to grow from 16,000 in 2014 to almost 160,000 in 2023, for total sales of over 800,000 of such vehicles during the period. Navigant Research expects the EV market share to increase from 0.4% to 2.9% of all medium and heavy duty commercial vehicle sales over the same period.
Environmental Benefits
Because heavy-duty commercial vehicles consume considerably more fuel than light duty passenger vehicles, the environmental benefits of replacing conventionally fueled commercial vehicles with EVs can also be substantial. Whereas an electric passenger car will reduce greenhouse gas (GHG) emissions by 3 tons per year as compared to a conventional car, replacing a conventional Class 8 port drayage truck with an electric equivalent can bring an 18 metric ton annual reduction in GHG emissions. Replacing a conventional diesel bus with an all-electric bus can achieve a 78 metric ton reduction in GHG emissions. Electric buses can also reduce nitrous oxide emissions by 47 kg per year compared to a diesel bus and 19 kg compared to a Clean Natural Gas (CNG) bus. As discussed below, these pollution reductions have had the greatest impact in the electric bus market, where municipalities are the principal purchasers.
Electricity Cost Considerations
Despite the higher electricity consumption of electric trucks, more widespread adoption could lead to more efficient utilization of utility and power generation assets and thus not necessarily lead to higher rates. At this point, deployment of electric trucks and buses is still too small to assess their full impact on electricity prices. As a study by the clean transportation nonprofit CALSTART emphasizes, evaluating this impact will involve weighing potential efficiency benefits, the impact on utility distribution grids, including the cost of potential upgrades, and the need for additional infrastructure.
Trucks
Some of the main markets for electric trucks include delivery vans, shuttle buses, and utility or work trucks, each of which has its own set of challenges. Where PHEVs have greater operational flexibility, and require less charging infrastructure, BEVs can be either short range, which can charge quickly and operate with limited interruption, or long range, requiring longer charging times but more intraday operational flexibility. The table below presents a few of the examples of different kinds of vehicles, battery sizes, and electricity demands.
| 5 |
Table 1: Electricity Needs of Electric Truck and Bus Types
| Technology Type | Example | Average Peak Demand | Battery Size |
| Short Range PHEV | Volvo PHEV Class 8 Drayage Truck | 10 kW | 10kWh |
| Work Truck PHEV | Odyne Advanced Diesel PHEV Truck | 3.3 kW | 14/28 kWh |
| Long Range PHEV | Efficient Drivetrain PHEV/CNG Class 4 Truck | Up to 6.6 kW | 40 kWh |
| Short Range BEV | Proterra Fast Charge Catalyst | 280 to 380 kW* | 53 or 131 kWh |
| Medium Range BEV | Transpower Electric Drayage Drive | 70 kW | 215 kWh |
| Long Range BEV | BYD 40-foot Electric Transit Bus | 80 kW or 200 kW | 324 kWh |
* For deployments of 4 to 8 buses per fast charger
Because of charging needs and restrictions, short-haul fleet vehicles that operate in a limited geographic area and return to central locations, such as delivery vans and shuttle buses, are the best candidates for electrification.
Buses—Transit
For a number of reasons, we believe buses present a more promising near-term market for electrification than other commercial vehicles. First, most bus purchases are public in nature, coming from transit agencies or school districts. As a later survey of government policies in the United States and abroad will show, many locales require public transportation operators to purchase and operate low-emissions vehicles. For public entities, cleaner transportation systems can provide benefits beyond reduced operating costs, in the form of less pollution and lower abatement and cleanup costs. Second, electric drive buses are likely to have lower fuel and maintenance costs, typically a large cost area for transit operators, compared to conventional diesel buses. Third, we believe electric buses have smoother, faster acceleration and provide a quieter, smoother ride, benefiting both passengers and the surrounding urban environment.
Similar to passenger cars and commercial fleets, high initial costs and the logistics of charging remain the greatest drawbacks. As detailed in the table below, depending on the market, hybrid buses can cost at least 40% more than, and sometimes over twice as much as, conventional diesel or CNG buses. Electric buses can be anywhere from two to nearly five times as expensive as conventional buses.
Table 2: Hybrid and Electric Transit Bus Estimated Prices by Region, 2014
| Market | Conventional (Diesel and CNG) | Hybrid | Electric | |||||||||
| China | $ | 60,000–90,000 | $ | 125,000–200,000 | $ | 280,000–350,000 | ||||||
| India | $ | 75,000–110,000 | $ | 175,00–255,000 | $ | 325,000–410,000 | ||||||
| Russia | $ | 130,000–180,000 | $ | 245,000–325,000 | $ | 400,000–500,000 | ||||||
| South America | $ | 200,000–225,000 | $ | 280,000–340,000 | $ | 410,000–500,000 | ||||||
| North America | $ | 420,000–580,000 | $ | 620,000–700,000 | $ | 850,000–980,000 | ||||||
| Europe | $ | 300,000–410,000 | $ | 450,000–540,000 | $ | 595,000–680,000 | ||||||
| Rest of World | $ | 100,000–350,000 | $ | 195,000–500,000 | $ | 300,000–700,000 | ||||||
Hybrid buses have gained greater traction than pure electric models in China and India, the two largest markets for electric buses. Both countries have some of the world’s worst urban pollution, as well as cities where buses form a greater part of public transportation than rail systems. Both China and India have a number of domestic hybrid and electric bus manufacturers, including Yutong, Xiamen King Long Motor Group, BYD, Nanjing Golden Dragon Bus, and Zhongtong Bus in China and Tata and Ashok Leyland in India. Of the 500,000 city buses in operation in China in 2014, analysts estimate that 80,000 were electric (presumably including hybrid electric models), with 27,000 more sold in 2014 and about 20,000 sold through the first half of 2015. The five companies just mentioned accounted for 62.5%, or 17,011, of the buses sold in 2014.
| 6 |
Electric drive or hybrid electric buses made up 17% of bus fleets in the United States in 2014, with most being gasoline or diesel hybrids, which made up between 30% and 40% of new bus sales. At the end of 2016, there were over 300 zero-emissions buses, that is, fully electric or fuel cell-powered buses, operating in transit fleets throughout the nation. A CALSTART executive has estimated that that zero-emissions models will make up 20% of the transit bus market by 2030. As an example of the cost impact of purchasing new electric buses, the Chicago Transit Authority recently committed to purchase 20–30 buses over the next few years, at a total pre-subsidy cost of $30 million to $40 million.
In the United States, the major sellers of battery electric buses through 2014 were Proterra and BYD, having sold 110 and 102 electric buses respectively. BYD expected to sell an additional 200 electric buses in the United States in 2015, and has sold approximately 5,200 worldwide.
Buses—School
School buses present another significant potential market for electrification. The United States has 480,000 school buses carrying 25 million children to school every day. The typically short, predictable routes of school buses are particularly suited to running solely on electricity. Traditional diesel school buses, which make up over half the total fleet, not only consume large amounts of fuel—more than 800 million gallons of diesel a year in the United States, at a fuel economy of only 4 mpg—but also directly impact children with tailpipe emissions. In response, a number of states have included school buses in clean transportation mandates, and some school districts, notably in California and Illinois, have begun to replace diesel buses with electric. Navistar introduced the first known hybrid model in 2007, improving fuel economy by 30%, or up to 65% for a plug-in hybrid model, and other manufacturers followed suit, but we are not aware of any current hybrid manufacturing of school buses taking place.
As of 2016, the number of electric buses in China had already reached approximately 343,500 units, including 300,000 BEVs. Efforts by the government of China, including its use of subsidies and ambitious efforts by certain cities regarding electrification of their bus fleets, continue to influence substantially the rate of growth of the electric bus market. For example, Shenzhen has sought to convert 100% of its bus fleet to electric buses in 2017.
Market Drivers
A number of factors impact both the supply and demand for various types of EVs and we believe that we are well positioned to benefit as a result of these driving forces. Except for energy storage technologies, discussed earlier, subsequent sections will address these market drivers in greater detail.
We believe prominent drivers of supply include:
| · | The declining cost and higher availability of energy storage technologies, specifically the cost and capacity of rechargeable lithium ion batteries; | |
| · | Grants, loans, tax breaks, and other financial support available for energy storage and EV research and development; | |
| · | Requirements that a specific percentage of automakers’ models be electric or other zero-emission vehicles; and | |
| · | Fuel economy standards that require automakers to meet certain fleet-wide benchmarks. |
We believe prominent drivers of demand include:
| · | Mandates that government fleets purchase certain percentages of low emission, energy efficient, or other alternative fuel vehicles; | |
| · | Mandates for transport agencies, ports or school districts to purchase or convert to electric or other alternative fuel vehicles; | |
| 7 |
| · | Rebates, tax credits, and other incentives for purchasing or leasing electric or other alternative fuel vehicles; | |
| · | The availability of charging stations and other charging infrastructure, driven in turn by government funding, tax credits, rebates, and other incentives and regulatory initiatives aimed at increasing the number of charging stations; | |
| · | The cost of electricity to recharge PEVs, impacted by special rates introduced by utilities; | |
| · | Preferential treatment in registration, emissions testing, and access to highways, city centers, and HOV lanes; and | |
| · | The cost of traditional petroleum-based fuels compared to the resultant incremental costs of owning and operating an EV. |
United States—Federal Laws and Incentives
As numerous as U.S. policies at the state and federal levels may at first appear, unlike in China and many European nations, few federal and state policies directly single out EVs. More broadly, federal U.S. policies encourage greater use of vehicles that run on some kind of alternative fuel, whether electricity, natural gas, hydrogen, biodiesel or ethanol. In addition, the U.S. federal government has less of a comprehensive, coherent framework aimed at increasing EV use than do countries like China and many European nations.
United States—State Laws and Incentives
Among U.S. states, California is notable for pioneering a number of measures that have encouraged EV production and adoption, often later copied by other jurisdictions. These include financial incentives like tax credits and rebates for both individual and fleet owners, HOV lane access, and various grant and loan programs. Besides setting the nation’s most stringent tailpipe emissions standards, California has required automakers to produce increasing percentages of zero-emission vehicles, of which EVs make up a significant portion, along with creating a market that allows manufacturers to buy and sell credits awarded for selling EVs. Assembly Bill (AB) AB 923 became effective January 1, 2005 and effective January 1, 2012, AB 470 authorized using AB 923 funding for the purchase of new school buses or retrofit of existing buses to accomplish the primary goal of reducing children’s exposure to both cancer-causing and smog-forming pollutants. Administered by CARB, AB 923 authorizes state funding of up to $400,000 per new zero-emission school buses and up to $200,000 for the conversion of existing school buses ten years old or newer. The purchase of new buses, restricted to replacement of existing buses prior to AB 923, is now permitted for fleet expansion as well. The buses’ GVWR to be eligible for funding must exceed 14,000,001 GVWR. All-electric school bus conversions that use technologies already demonstrated on school buses, and with engineering plans, are eligible for AB 923 funding. All vehicles receiving AB 923 funding must have CHP Safety Certifications that are submitted to CARB prior to receiving funding. AB 923 contains other legal and technical requirements for the buses, with which we believe all of our products comply.
Fleet Operator Challenges
Fleet operators and their companies face a number of challenges in the market today, including:
| · | Difficulty complying with existing and new federal and state emission restrictions and compliance requirement. Federal regulatory agencies, such as the EPA, and state regulatory agencies, such as CARB, have set forth mandates designed to reduce emissions from mobile sources. At least 10 other states follow CARB rules and regulations making similar requirements and more are expected to join along with the EPA at the federal level. | |
| · | Finding cost savings while managing high fuel, maintenance and repair costs. The federal Global Warming Pollution Reduction Act of 2007 set strict air quality standards for particulate matter, nitrous oxide and GHG reductions from new manufactured vehicles which were further tightened in 2010 to further reduce the amounts of particulate matter, nitrous oxide and GHG emitted by newly manufactured vehicles. | |
| 8 |
| · | Extending the lives of existing vehicles. Due to reductions in capital expenditure budgets and the legislatively mandated addition of expensive and limiting emission reduction equipment, it is challenging to prolong the lives of existing vehicles because of the increased cost of expensive maintenance, service and repairs. | |
| · | Difficulty planning for the operation of their fleet when fuel supplies are interrupted, such as during a natural disaster. Existing vehicles rely on fuel that must be pumped (using electricity) which may be a challenge to source when supply is interrupted during natural or man-made disasters. It may be possible for emergency service organizations to use the large battery packs of electric drive, commercial fleet vehicles as a mobile source of stored electrical energy. This electrical energy could supplement traditionally fueled back-up generators. | |
| · | Difficulty in improving the environment around these heavy-duty commercial fleets. Many studies have shown that the air quality in and around vehicles fueled by fossil-fuels poses a health risk not only to drivers of these vehicles but to their passengers and those in and around these vehicles. Especially at risk are children as passengers on older diesel fueled buses, as their lungs, brains and other organs have not fully developed and the air quality surrounding a typical school bus using diesel fuel can pose serious health risks. By using zero-emission buses, trucks and cars, we believe we are creating a healthier environment in and around the vehicles they operate for their employees, customers and the communities they serve. |
Our Solution
We design advanced zero-emission electric and hybrid vehicles and replacement drivetrain systems that improve fuel economy and reduce emissions. Our drivetrain systems are designed to help vehicles run more efficiently and cost effectively. We subcontract the manufacturing of our completed drivetrains to two facilities in Northern California, to which we provide our patented zero-emission drivetrain design and which is completed under our supervision. At this time, we do not manufacture complete vehicles. We sell our zero-emission drivetrains to third party OEMs with whom we partner and they manufacture the complete vehicle after installing the drivetrain under our supervision. As of December 31, 2017, we have built 15 drivetrains, six of which we have installed and the balance of which we have used for proof-of-concept and testing.
We enable our customers to:
| · | Add Emission-Compliant ADOMANI Vehicles and Drivetrain Systems to Their Fleets. Our commercial fleet vehicles and drivetrain systems are designed to reduce or eliminate the use of traditional petroleum-based fuels that create greenhouse gases and particulate matter. | |
| · | Reduce Total Cost of Ownership. Our technology is designed to reduce fuel budgets by eliminating or reducing the reliance on traditional petroleum-based fuels, instead using the more energy efficient and less variably priced grid-provided electricity. | |
| · | Prolong Lives of Existing Vehicles. Zero-emission electric and hybrid vehicles generally have lower maintenance costs. These reduced maintenance costs may take the form of longer service intervals between brake system maintenance, reduction or elimination of internal combustion engine oil and oil filter changes, reduction or elimination of transmission oil and oil filter changes, reduction or elimination of air filter changes, reduction or elimination of emissions systems services, reduction or elimination of diesel emission fluid use, elimination of emissions tests on traditional fuel vehicles (if converted to a zero-emission electric drivetrain) and the elimination of certification tests of high pressure tanks on propane, liquefied natural gas and compressed natural gas powered vehicles (if converted to a zero-emission electric drivetrain). | |
| 9 |
| · | Plan for Natural Disasters When Fuel Supply May be Interrupted. Our zero-emissions systems can serve as on-site emergency back-up energy storage if grid power becomes intermittent or fails temporarily during natural or man-made disasters. | |
| · | Improve the Environment Around Vehicles. As a result of our zero-emission systems, drivers, operators, customers and the communities they serve could have healthier environments in and around these vehicles. |
Development of the Business to Date
We have developed and commercialized our products and services, which primarily include:
| · | Zero-emission electric drivetrain systems for use in “new” school bus and medium to heavy-duty commercial fleet vehicles. | |
| · | Zero-emission electric drivetrain systems for use in “existing fleet” school bus and medium to heavy-duty commercial fleet vehicles. | |
| · | Conversion hybrid drivetrain systems in an assistive hybrid format for use in private and commercial fleet vehicles of all sizes. | |
| · | Conversion hybrid drivetrain systems in a “full-traction” format for use in private and commercial fleet vehicles of all sizes. | |
| · | Purpose-built, zero-emission vehicles of all sizes manufactured by outside OEM partners but to be marketed, sold, warrantied and serviced through the developing ADOMANI distribution and service network. | |
| · | Optional drivetrain components that allow for advanced remote monitoring features of vehicle location (geofencing), driver behavior, drivetrain health (error codes) and battery management systems. | |
| · | Optional drivetrain components that allow for electric power-export and various levels of grid connectivity. |
We have taken an active role in building awareness and support for our zero-emission electric and hybrid drivetrain systems in industry specific target groups and at all levels of government and regulatory agencies and the constituencies they serve. We have accomplished this through prior and current memberships in industry groups (private and governmental) and participation in their events; speaking engagements; management interviews; pilot product exhibits; fleet vehicle demonstrations and responses to Requests For Information and Requests For Proposals. In addition to the visibility we have achieved through these efforts, we believe that having an office in Silicon Valley will assist us in finding and recruiting appropriately trained engineers and technicians.
As discussed below under the section entitled “—Partnerships/Teaming Agreements”, we have entered into a number of agreements with third parties and continue to explore additional alliances, to establish our decentralized assembly, sales and service model. We believe we can preserve cash resources and yet still scale-up quickly when demand requires by leveraging the unused or underutilized service technician time, specific vehicle type expertise and service facility equipment of specific partners in ways to off-load some defined tasks, providing seasonal demand adjustments to technician headcount that will partially mitigate the human resource costs and challenges associated with scaling-up or down an employee base.
Our Strengths
We believe the following attributes and capabilities provide us with long-term competitive advantages:
| 10 |
| · | Product Diversity. We have multiple product offerings including zero-emission electric and hybrid drivetrains, new purpose-built zero-emission EVs and stationary energy storage solutions and, as a result, the ability to scale-up, scale-down or refine a specific product line in response to market demands and the evolving local, state and federal regulatory and incentive programs. Also, within each product area, we have multiple suppliers of key drivetrain components, allowing price flexibility both for our final products and replacement parts required over the product lifespan. This allows us to meet the expectations and budget constraints of public or private commercial fleet operators. | |
| · | Regulatory Agency Familiarity. By taking an active role in many trade industry groups and related events, we have developed and continually strive to maintain strong relationships with key local, state and federal regulatory agencies involved in the growing zero-emission and hybrid vehicle industry. To meet their own aggressive emissions targets, these regulatory agencies have encouraged the growth of zero-emission EVs and hybrid drivetrains, especially in connection with heavy-duty commercial fleets. | |
| · | Relationships With Purchasers. To help shorten the sales cycles for our products, we have identified and built relationships with key commercial operators that have purchasing authority or influence over their organizations. We are also able to leverage past sales and marketing relationships that were built by our experienced management team. | |
| · | Additional Sales Potential. We have additional sales potential with commercial fleet customers. These potential additional sales could include: automated charging infrastructure, intelligent stationary energy storage systems that enable higher levels of vehicle fast-charging, emergency back-up facility power for use during grid power outages, enabling technologies to access the developing grid-connected opportunities for the aggregate power available from groups of large battery packs, or enabling technologies that allow for the avoidance of electric utility demand charges. | |
| · | Unique Market Knowledge. We have specific and tailored sales cycle knowledge based on the over 30 years of experience of our management team. |
Our Strategy
We intend to capitalize on these opportunities by pursuing the following key strategies:
| · | Develop Sales Staff. We plan to hire and train our initial sales staff to complement our current group. Training will include familiarizing them with the many and varied funding options available, and how to access those opportunities, or help our customers access them. | |
| · | Build Dealership Networks. We intend to build dealership networks for the local sales and service of our zero-emission replacement drivetrain vehicles and new purpose-built zero-emission electric and hybrid commercial vehicles either manufactured by or for us. | |
| · | Develop Third Party Relationships. We plan to complete existing negotiations with partners and seek additional partners for the manufacture of our zero-emission systems. | |
| · | Provide Demonstrations. We will seek out and respond to local, state and federal pilot demonstration opportunities in interest areas for which we have relevant current product offerings or, in areas of interest that are congruent with product(s) that are on our product development roadmap but still in early stage development. | |
| · | Obtain Approvals From Incentive Programs. We will seek to have our products approved for various local, state and federal vehicle designations and incentive programs, like the California Heavy Duty Voucher Incentive Project administered by CARB, meant to accelerate the purchase of cleaner, more efficient trucks and buses in California. | |
| 11 |
| · | Grow Our Manufacturing, Installation and Service Capability. As facility space and technician time requirements at partners are exceeded, we intend to expand or relocate to larger ADOMANI-owned or leased facilities dedicated to the manufacture, installation and service of our zero-emission systems. | |
| · | Introduce New Products. As new markets develop, we plan to expand our zero-emission systems into ancillary product verticals, such as charging infrastructure also called Electric Vehicle Service Equipment, stationary energy storage, vehicle-to-grid hardware and capabilities. | |
| · | Develop Our International Business. We plan to develop our business internationally. For example, we intend to pursue opportunities in China through our wholly-owned subsidiary, ADOMANI China. While we believe that China is an important market for us due in part to its publicly announced emphasis on hybrid and all-EVs and large population, we remain in the early stages of the development of our business plan to pursue such opportunities, including the consideration of a proposal to develop a facility in Nantong, China to fulfill conversion kit orders within China, and continue to assess the logistics and costs associated with the production and sale of our zero-emission drivetrains into China. |
Our Customers
Our current primary focus is school buses and transit buses. Our target customers primarily include all public and private fleet operators that have an interest in meeting or exceeding local, state and federal emission regulatory guidelines while saving money in fuel and maintenance costs over the lifecycle of their fleet vehicles and that also have an interest in tangible demonstrations (publicity) of their GHG reducing efforts. These targets include:
| · | Public and private K-12 schools that operate Type-A, C and D school buses and special-needs student buses. | |
| · | Public and private schools that operate “white fleet” vehicles for non-student transportations use, such as facility service trucks, food service delivery vans/trucks and campus security vehicles. | |
| · | Public and private transportation services that cater to a prison system; | |
| · | Student transportation contractors that serve public and private schools. | |
| · | Community based, public/privately funded shuttle buses serving special-needs community members. | |
| · | Public and private colleges and universities that operate shuttle buses, transit style buses, facility service vans and trucks on their campuses. | |
| · | Large companies that operate shuttle buses, transit style buses and facility based vehicles for employee transport to/from remote parking areas, to/from special events and the various vehicles used for facilities maintenance, services and security. | |
| · | Private transportation contractors that shuttle large companies’ employees from common public transportation hubs to their campuses. | |
| · | Commercial fleet operators that provide high daily mileage vehicles for use on routes in and around airports, hotels and offsite parking facilities. | |
| · | Port, railway, distribution center operators that use traditionally-fueled loading equipment, tractors, material handling equipment, forklifts, Class 1 through 8 trucks, delivery vans, yard goats, etc., that could be replaced with zero-emission alternatives. | |
| · | Large agricultural (farming) and food processing industry focused companies that operate Class 1 through 8 trucks, buses and/or delivery vans. | |
| 12 |
| · | Mining companies with fleets of above ground service vehicles and underground staff transport and support vehicles. | |
| · | Oil and gas companies with fleets of field trucks. | |
| · | Electric utility companies with fleets of service trucks that are in the public eye. | |
| · | Package delivery companies with fleets of delivery vans, short haul trucks and distribution/sorting facility center vehicles. | |
| · | Military based fleet operators that have non-combat fleet vehicles of all sizes. |
Our Products and Services
Our products and services primarily include:
| · | Zero-emission electric drivetrain systems for use in new school buses and medium to heavy-duty commercial fleet vehicles. | |
| · | Zero-emission electric drivetrain systems for use in existing fleet school buses and medium to heavy-duty commercial fleet vehicles. | |
| · | Conversion hybrid drivetrain systems in either an assistive hybrid or a full traction format for use in private and commercial fleet vehicles of all sizes. | |
| · | Purpose-built, zero-emission vehicles of all sizes manufactured by outside OEM partners but to be marketed, sold, warrantied and serviced through the developing ADOMANI distribution and service network. | |
| · | Optional drivetrain components that allow for advanced remote monitoring features of vehicle location (geofencing), driver behavior, drivetrain health (error codes) and battery management systems. | |
| · | Optional drivetrain components that allow for electric power-export and various levels of grid connectivity. |
Zero-emission electric drivetrain systems for use in new school buses and medium to heavy-duty commercial fleet vehicles.
This drivetrain system results in a zero-emission EV with similar performance specifications (except range) to a traditionally fueled version. The major drivetrain components systems include appropriately sized traction motor/generator(s), motor controller(s) and power-flow set up for either a direct-drive configuration, a single speed gearbox (speed reduction) or, a multi-gear ration transmission system. Other integrated drivetrain components include lithium iron phosphate (LiFePO4 or similar) battery packs, a battery management system (BMS), inverters, chargers, electrically driven systems for power steering and power (hydraulic or air) brakes, a vehicle control unit (VCU), wiring harnesses, a flat screen user-interface (dash board) and fleet technician diagnostic tools. We recently entered into an agreement with Blue Bird pursuant to which we intend to supply them with zero-emission electric drivetrains for use in Type C and D school buses on a purchase order basis.
Zero-emission electric conversion drivetrain systems for use in existing fleet, school buses and medium to heavy-duty commercial fleet vehicles.
This drivetrain system results in the same zero-emission EV described immediately above. However, this drivetrain systems allows for the removal of the OEM’s internal combustion engine (ICE), radiator cooling systems, fuel tanks, exhaust and emission systems (manifolds, pipes, mufflers, particulate filters, DEF system, etc.) and usually the OEM transmission and associated transmission cooling system.
| 13 |
Conversion hybrid drivetrain systems in an assistive hybrid format for use in private and commercial fleet vehicles of all sizes to improve overall miles per gallon (mpg) performance.
This conversion drivetrain system integrates a modest sized motor/generator, motor controller, modest sized energy storage system (battery packs) of high C-rated batteries or ultra-capacitors and a user-interface for system monitoring by the vehicle operator.
Conversion hybrid drivetrain systems in a “full-traction” format for use in private and commercial fleet vehicles of all sizes.
This hybrid conversion drivetrain system retains the OEM drivetrain system and adds an electric drive system that results in a vehicle with OEM performance as well as the ability to run the vehicle in various drivetrain power-flow modes including an all-electric mode when zero-emission operations are required. The major drivetrain components systems include the same items enumerated above. Optional equipment for this system can provide significant power export capabilities.
Purpose-built, zero-emission vehicles of all sizes manufactured by outside OEM partners but to be marketed, sold, warrantied and serviced through the developing ADOMANI distribution and service network.
GreenPower Motor Company, Inc. (GreenPower), a manufacturer of zero-emission electric transit-style buses and school buses of various sizes, has appointed us as its authorized factory representative for California for Types A, C and D zero-emission electric school buses on a non-exclusive basis. These vehicles are designed to our specifications where possible. We intend to utilize the services of GreenPower and other OEMs to support our efforts to sell, warranty and supply zero-emission electric school, transit and shuttle buses and vans through our developing ADOMANI distribution and service network.
Optional drivetrain components that allow for electric power-export and various levels of grid connectivity.
These systems integrate bi-directional changers and inverters and require additional facility-based, stationary charging hardware and control systems.
In addition, our products and services may in the future include some or all of the following:
| · | Zero-emission electric drivetrain systems for ship-through integration by outside OEMs into their own privately branded medium to heavy-duty commercial fleet vehicles. | |
| · | Automated charging infrastructure for commercial fleet vehicles. | |
| · | “Intelligent” stationary energy storage that enables fast vehicle charging. | |
| · | “Intelligent” stationary energy storage that enables emergency back-up facility power during grid power outages. | |
| · | “Intelligent” stationary energy storage that enables access to the developing grid-connected opportunities for the aggregate power available from groups of large battery packs. | |
| · | “Intelligent” stationary energy storage that enables avoidance of electric utility demand charges for commercial customers integrated with or independent of ADOMANI-supplied, zero-emission fleet vehicle(s). | |
| · | Energy storage systems (battery packs) replacements with better energy density and/or expected lifecycles for existing EVs and equipment that has outlived their OEM-provided energy storage systems. For example, replace Flooded Lead Acid (FLA) battery packs of existing industrial forklifts and underground mining equipment with more energy dense and higher cycle-life battery packs composed of Lithium Iron Phosphate (LiFePO4) or similar cell chemistry. |
| 14 |
Testing
Our suppliers are vetted before their products are accepted for use in our products. Our drivetrains and finished products are inspected, road-tested and receive a complete quality control report prior to delivery.
Customer Service, Support and Training
The sales team, both direct and contractors, will be used as the first point of customer contact for customer support and training. At the point that the sales force can no longer handle the volume of these requirements, we will hire, train and support an additional internal staff.
Technology
Zero-emission electric drivetrain systems for purpose-built new vehicles generally include the following; electric traction motor/generator of sufficient kW power for grade, speed, acceleration and efficiency requirements, a motor controller/inverter system that modulates electrical power flow between the battery packs and traction motor, a gear reduction system or multispeed transmission, systems to electrify power steering/brakes, a vehicle control unit (VCU), high-voltage traction battery packs with integrated battery management system (BMS), battery disconnect units (BDU), thermal management systems, vehicle charging hardware, electric HVAC systems, DC to DC inverter(s) to reduce traction battery pack voltage sufficient to operate on-board, low voltage systems, wiring harnesses, user/driver interface and remote diagnostic/tracking/fault code/data logging systems. Although clear industry power-export standards have not yet been adopted, systems and options for a variety of vehicle-to-other power management options (such as grid, building, stationary energy storage, etc.) that are being developed by multiple vendors.
Re-power drivetrain systems to convert existing traditionally-fueled fleet vehicles with internal combustion engines (ICE) to zero-emission operation include many of the same components as described above for purpose-built vehicle systems. For simplicity, cost saving and maintenance technician familiarity, some OEM systems of the subject vehicle may be retained/utilized and these could include cooling systems for the engine and transmission, mounting brackets and bolts, power steering and brake systems and 12 and/or 24 volt systems and accessories. Items that are typically not retained/repurposed include the OEM internal combustion engine, transmission, liquid or gaseous fuel tanks and exhaust/treatment systems.
Our post-transmission hybrid drivetrain systems uses power from an electric motor to assist traditionally-fueled vehicles to allow for a range of either better overall miles-per-gallon fuel use or increased performance levels (when both ICE and electric motor are in use).
Our research and development expenses were $586,899, $37,000 and $549,000 for the years ended December 31, 2017, 2016 and 2015, respectively. The increase in 2017 is primarily due to $420,000 incurred in the second quarter of 2017 to build and install our drivetrain system on a chassis of a Type D school bus, on a promotional basis, for a potential customer. The project also enabled us to evaluate a third party firm that performed the work. The balance of the increase occurred because we were required to pay other research and development consultants under the terms of an employment agreement with our former Chief Technology Officer. The decrease in 2016 was due to much of this work being capitalized related to building a specific demonstration vehicle.
Sales and Marketing
Sales
We intend to expand our marketing and sales force as we open our sales, service and assembly facilities. We expect that each facility will have a team of dedicated marketing and sales employees with responsibility for the geographic region in which the facility is located. As a result, we believe we can efficiently and cost-effectively build out our marketing and sales network.
| 15 |
Marketing
We plan to focus our marketing efforts on increasing brand awareness, generating demand for our products, communicating product advantages and generating qualified leads for our sales force. We intend to rely on a variety of marketing vehicles, including participation in industry conferences and trade shows, public relations, industry research and our collaborative relationships with our business and teaming partners to share our technical message with customers. We also market our products on our website.
Manufacturing
We intend initially to contract with third party suppliers to manufacture our products. Currently, we utilize the services of a third party manufacturer with whom we do not have a long-term or exclusive contractual relationship, and we continue to seek additional third party suppliers and other manufacturing support.
Distribution
We intend to distribute products to regional locations for installation into the motor vehicle.
Partnerships/Teaming Agreements
We have agreements with Blue Bird, GreenPower, Central States Bus Sales, Efficient Drivetrains Inc. and Envirotech Drive Systems Incorporated. None of these agreements contain any binding purchase or sales minimums.
Blue Bird Corporation
Blue Bird offers a complete line of Type A, C and D school buses in a variety of options and configurations. In October 2017, we entered into a three-year agreement with Blue Bird pursuant to which we will provide them, on an exclusive basis, with zero-emission electric drivetrains for use in their Type C and D school bus product lines. The agreement sets forth the applicable pricing for the products to be purchased thereunder, but does not include any binding minimum purchase obligations on behalf of Blue Bird. During the term of the agreement, Blue Bird must purchase all zero-emission electric drivetrains to be used in their Type C and Type D school bus product lines from us, and we have agreed that we will not sell any zero-emission electric drivetrains to any similar manufacturer of school and activity buses, or to suppliers or subcontractors who would resell such products to such bus manufacturers. The agreement, however, does not prevent us from selling zero-emission electric drivetrains for any other application. The agreement provides that we will indemnify Blue Bird against certain losses resulting from our breach of the agreement and certain other losses. Blue Bird may terminate the agreement immediately for cause upon certain events or without cause upon thirty days prior written notice to us. In November 2017 at the National Association for Pupil Transportation industry event, Blue Bird unveiled the Type C bus in which our zero emission electric drivetrain was installed, and conducted ride-and-drive tours in the Type D bus that they completed after the STN show. We also organized an extensive ride-and-drive tour for them in California in early 2018.
GreenPower Motor Company, Inc.
GreenPower produces a range of bus models deploying electric drivetrain and battery technologies with a lightweight chassis. GreenPower integrates key components from such global suppliers as Siemens, Knorr, ZF and Parker, among others, providing an OEM platform that allows them to meet the specifications of various operators. GreenPower has appointed us as its authorized factory representative for California for Types A, C and D zero-emission electric school buses on a non-exclusive basis pursuant to a three-year agreement. Assuming various milestones are achieved, the agreement with us will be ongoing and may expand into additional states or regions. The agreement may be terminated for cause upon thirty days prior written notice and the failure of the other party to cure the breach that resulted in such cause.
Central States Bus Sales (Central States)
Central States, a large Blue Bird school bus dealer and a large commercial bus dealer covering Arkansas, Illinois, Kentucky, Tennessee and Missouri, entered into a teaming agreement with us pursuant to which both companies have agreed to work together on the conversion, marketing, selling and servicing of the many types of buses that Central States currently sells. Either party may request the other’s participation in the development of a project pursuant to the agreement. The agreement may be terminated by either party, for cause, on ninety days prior written notice.
| 16 |
Efficient Drivetrains, Inc.
Efficient Drivetrains, Inc. (EDI) develops and markets a range of state-of-the-art PHEV and EV drivetrain solutions worldwide. EDI’s leading-edge hybrid-electric and electric drivetrain systems and technologies enable OEMs to meet zero-emissions requirements while providing cost and efficiency advantages across nearly all platform classes and configurations. In October 2017, we entered into a three-year agreement with EDI pursuant to which EDI will build for ADOMANI, on an exclusive basis, zero-emission electric drivetrains for sale to Blue Bird’s Type C and D school bus product lines. The agreement sets forth the applicable pricing for the products to be purchased thereunder, but does not include any binding minimum purchase obligations on behalf of ADOMANI. During the term of the agreement, we must purchase all of our production requirements of zero-emission electric drivetrains to be used in Type C and Type D school bus product lines from EDI, and we have agreed that we will not contract with any other manufacturer to produce any zero-emission electric drivetrains for use in any Type C or Type D school buses. The agreement, however, does not prevent us from purchasing zero-emission electric drivetrains for any other application. The agreement provides that we and EDI will indemnify each other against certain losses resulting from our breach of the agreement and certain other losses. Either party may terminate the agreement for cause upon certain events occurring and not being cured within prescribed time frames or without cause upon one hundred eighty days prior written notice to the other.
Envirotech Drive Systems Incorporated
Envirotech Drive Systems Incorporated (Envirotech) is a Canadian-based company that is engaged in the design, prototyping and certification of electric components and vehicles, including complete drivetrains. ADOMANI has engaged Envirotech to design and build a series of zero-emission electric Class 3-6 trucks, built to ADOMANI specifications and requirements. The trucks are comprised of a cab, chassis and electric drivetrain. Any customer can then customize the trucks by adding a box or stake bed to the vehicle as per their needs. Once tested and validated by ADOMANI, Envirotech will submit the vehicle emissions information to CARB for certification and sale via the issuing of an Executive Order (EO). Once the EO is received, ADOMANI will be able to provide the EO along with additional information to the Hybrid and Zero-Emission Truck and Bus Voucher Incentive Project (HVIP) Department of CARB and apply for HVIP listing, making the trucks eligible for buy-down funding based on the GVWR. These buy-down funds will enable companies to purchase zero-emission electric trucks and receive a discount to aid in the purchase. The HVIP buy-down funding is currently between $55,000 for Class 3 trucks and $100,000 for Class 6 trucks.
Raw Materials and Supply Chain
Prices for the systems, components and raw materials we use in our drivetrain systems, many of which are OEM items used by many companies in different applications, can fluctuate depending on market conditions and global demand. Our purchase of raw materials is currently limited due to sales volume, but we attempt to limit our exposure to raw material price increases and availability fluctuations by having relationships with a dynamic group of vendors that sell us value-added hardware, components and systems. We have further mitigated these supply chain risks by establishing purchasing relationships with multiple vendors that are diversified by type of product offered, brand of products offered, country of origin of products (which is relevant for “Buy American” provisions that we encounter with our customers), individual specification requirements, purchase quantity requirements, quality, availability and price. Our drivetrain systems allow for component substitution, which further mitigates our exposure to any one supplier or component. For example, for different drivetrain systems, our recent traction motor choices have included the following brands: UQM (US), Yasa (UK) and TM4 (China). We believe that we have adequate supplies and access to the sources of the systems, components and materials to meet our current and anticipated future production and supply requirements.
| 17 |
Backlog
As of March 7, 2018, our backlog consisted of purchase orders for 6 zero-emission electric school buses and 10 zero-emission electric drivetrains. As of December 31, 2017, our backlog consisted of purchaser orders for 4 zero-emission electric school buses and 2 zero-emission electric drivetrains. We believe our cost of the current backlog will be approximately $3.85 million (against which deposits of $1.02 million have been made), and that the sale price of the current backlog will be in excess of $4.0 million. We believe that deliveries will begin in the second half of 2018.
Employees
As of March 7, 2018, we had eleven full-time employees. None of our employees are covered by collective bargaining agreements and we believe our employee relations are good.
Seasonality
While we are not generally prone to seasonal fluctuations in our business, many state and federal agencies operate on a July 1 to June 30 fiscal year and, as such, in the event that grants are over-subscribed during a given fiscal year, we may be unable to obtain funds in connection with any such state or federal grants until after June 30 of the subsequent fiscal year.
Competition
The power conversion vehicle market is highly competitive and we expect it to become even more so in the future as additional companies launch competing products and vehicle offerings. We compete with other alternative energy technologies, such as natural gas and hybrid technologies. These competitors include Ford, which produces the Ford Transit Connect EV®; Navistar, which produces the Navistar eStar®; Freightliner, which produces the MT E-CELL; Odyne Systems, which produces plug-in hybrid heavy- and medium-duty trucks; ZeroTruck, which produces an all-electric medium-duty truck; Electric Vehicles International, which produces an all-electric walk-in van and light- and medium-duty commercial electric trucks; BYD which manufactures new electric transit buses; Proterra, which manufactures new electric transit buses; TransPower which converts Type D school buses; and Motiv, which converts Type A school buses.
Intellectual Property
The protection of our technology and intellectual property is an important component of our success. We rely on intellectual property laws, including trade secret, copyright, trademark and patent laws in the United States and abroad, and use contracts, confidentiality procedures, non-disclosure agreements, employee disclosure and invention assignment agreements and other contractual rights to protect our intellectual property.
As of December 31, 2017, we own three issued U.S. Patents which will expire in 2030 and 2033, and one issued Chinese utility model that will expire in 2026. Domestic and foreign applications are also pending on new inventions. In addition, we maintain a trademark portfolio including common law trademarks and service marks and have two service marks registered in the United States.
Circumstances outside of our control could pose a threat to our intellectual property rights. Effective intellectual property protection may not be available in the United States or other countries in which we provide our solution. In addition, the efforts we have taken to protect our intellectual property rights may not be sufficient or effective. Any impairment of our intellectual property rights could harm our business, our ability to compete and harm our operating results. In addition, as the number of competitors grows and solutions of competitors overlap, we may in the future face claims by third parties that we infringe upon or misappropriate their intellectual property rights, and we may be found to be infringing upon or to have misappropriated such rights. In the future, we, or our customers, may be the subject of legal proceedings alleging that our solutions or underlying technology infringe or violate the intellectual property rights of others.
| 18 |
Governmental Programs and Incentives
We believe that the availability of government subsidies and incentives currently is an important factor considered by our customers when purchasing vehicles that utilize our technology, and that our growth depends in part on the availability and amounts of these subsidies and incentives. Over time, we believe that the importance of the availability of government subsidies and incentives will decrease, as we continue to reduce the upfront cost of vehicles that utilize our technology. In order to help ensure that we and our customers benefit from available subsidies and incentive programs in the United States, Canada, Mexico, Asia and in Europe, we have incentive specialists that work directly with our sales team and our customers on these issues.
Overview of Incentive Programs Most Applicable to Our Products
We intend to seek to have our products approved for various local, state and federal incentive programs, including those set forth below. In particular, California’s zero-emission vehicle mandate, which requires that a certain percentage of an automobile manufacturer’s sales must be zero-emission vehicles, has resulted in numerous incentive programs meant to accelerate the purchase and/or repower of cleaner, more efficient vehicles in California. We anticipate that the relevant aggregate funding available in California alone over the next several years may be in excess of $500 million.
California Hybrid and Zero-Emissions Truck and Bus Voucher Incentive Project
We believe our customers may be eligible for purchase under HVIP. HVIP is a partnership between CARB and CALSTART, the purpose of which is to help speed the early market introduction of clean, low-carbon hybrid and electric trucks and buses. Under HVIP, dealers and fleet operators may request vouchers from HVIP on a first-come first-serve basis, up to the funding amount available for that year, to reduce the cost of purchasing hybrid and zero-emission medium- and heavy-duty trucks and buses.
HVIP vouchers range in amount of up to $220,000, depending on the gross vehicle weight of the purchased vehicle and the number of vehicles purchased. School buses would be entitled to $220,000 for each new school bus.
HVIP funds the purchase of only fully commercialized hybrid and zero-emission trucks and buses. Vehicles still in the demonstration or evaluation stage are not eligible for inclusion in HVIP. Vehicle manufacturers must apply to have their hybrid and zero-emissions trucks and buses included in HVIP’s voucher program. Once a make and model is included in the program, the manufacturer is not required to submit a full application for the succeeding year’s program unless the vehicle has been modified. We intend to comply with the HVIP guidelines and qualify our school buses and vehicles for the HVIP vouchers. Blue Bird received HVIP approval for a school bus powered by the ADOMANI drivetrain on November 7, 2017.
New York Truck Voucher Incentive Program (NYT-VIP)
NYT-VIP is a first-come, first-served $19 million incentive program funded by the New York State Energy Research & Development Authority (NYSERDA). Eligible vehicles include all-electric, hybrid-electric, and CNG trucks and buses, along with retrofit diesel-emission control devices (DECD). Funding for eligible vehicles domiciled in New York State and New York City can reach $150,000 per vehicle. With the successful listing on the HVIP eligibility list of the Blue Bird bus mentioned above, ADOMANI has secured eligibility on the NYT-VIP list and currently qualifies for a $150,000 voucher per vehicle.
Drive Clean Chicago—Drive Clean Truck Program
Drive Clean Chicago is accelerating the adoption of advanced vehicle technologies for the commercial truck and taxi sectors in the Chicago six-county area by reducing the cost of new alternative fuel vehicles and public alternative fuel stations. The program from the Chicago Department of Transportation (CDOT) offers incentives including $10,000 for CNG and electric taxis, up to $150,000 for hybrid and all-electric trucks, and 30% of the capital cost for CNG and fast-charge electric fueling stations.
In addition to these programs, there are many other state and federal programs that range from providing tax credits to providing funding to providing grants and loans for the purchase of zero-emission and hybrid vehicles. Many of the programs provide funding for up to 60% of the cost an all-electric repower conversion.
| 19 |
Volkswagen Environmental Mitigation Trust Funds
We anticipate that the 23 states that we have prioritized may allocate approximately $260 million in funds per year for three years beginning in 2018 to on-road vehicle projects. These states are currently in the process of developing specific funding plans and we have successfully engaged with several of these states to support the development of such plans. We expect that these plans will be developed by the end of the first half of 2018 and that the first rounds of funding may become available thereafter in 2018.
California Air Resources Board
CARB gathers air quality data for the State of California, ensures the quality of this data, designs and implements air models, and sets ambient air quality standards for the state, with a particular focus on regulating tailpipe emissions and other mobile sources. CARB compiles the state’s emissions inventory and performs air quality and emissions inventory special studies. CARB uses the Emissions Inventory and Air Quality Models to evaluate air quality and reduce emissions in each of California’s 35 local air districts.
CARB also manages several incentive and rebate programs and awards hundreds of millions of dollars in grants to reduce emissions from on- and off-road vehicles and equipment. CARB is responsible for program oversight. CARB awards grants and funds through the Air Quality Improvement Program (AB 118); the Carl Moyer Program; the Voucher Incentive Program for enhanced fleet modernization and emission reduction; and the Lower-Emission School Bus Program/School Bus Retrofit and Replacement Account.
California Energy Commission
The California Energy Commission (CEC) has several core responsibilities, including but not limited to setting energy policy, developing renewable energy, achieving energy efficiency, and transforming California’s transportation infrastructure. One goal of the CEC is to mitigate GHG emissions and reduce the impact of climate change. The CEC carries out its responsibilities pursuant to several of California’s landmark environmental laws. In 2006, the Legislature passed and then Governor Arnold Schwarzenegger signed two landmark pieces of legislation with far-reaching implications for energy policy. The most comprehensive is AB 32, the California Global Warming Solutions Act of 2006, which sets an economy-wide cap on California GHG emissions at 1990 levels by no later than 2020. At the time, this was an aggressive goal that represented an approximately 11 percent reduction from then-current emissions levels and nearly a 30 percent reduction from projected business-as-usual levels in 2020. In 2015, California passed Senate Bill (SB) 350, which further committed California to reducing GHG emissions by establishing a 2030 greenhouse gas reduction target of 40 percent below 1990 levels. The transportation sector represents a significant portion of California’s GHG emissions.
In 2007, AB 118 created the Alternative and Renewable Fuel and Vehicle Technology Program. The program is intended to increase the use of alternative and renewable fuels and innovative technologies that will transform California’s fuel and vehicle types to help attain the state’s climate change policies. AB 118 authorizes the CEC to provide approximately $100 million annually as incentives to public agencies, vehicle and technology consortia, businesses, public-private partnerships, workforce training partnerships and collaboratives, fleet owners, consumers, recreational boaters, and academic institutions for projects that: develop and improve alternative and renewable low-carbon fuels; optimize alternative and renewable fuels for existing and developing engine technologies; improve light-, medium-, and heavy-duty vehicle technologies; and retrofit medium-and heavy-duty on-road and non-road vehicle fleets.
Air Quality Management Districts (AQMD) and Air Pollution Control Districts (APCD)
California’s AQMDs/APCDs are responsible for controlling emissions primarily from stationary sources of air pollution such as large power plants and refineries, but also have a role in distributing funds and administering incentive programs from mobile sources—primarily cars, trucks and buses, but also construction equipment, ships and trains, from which approximately seventy five percent of emissions are generated. The largest AQMD/APCDs are the South Coast AQMD, Bay Area AQMD, San Joaquin Valley APCD, and the San Diego APCD. Local AQMDs/APCDs develop and adopt an Air Quality Improvement Plans (AQIP), which serves as the blueprint to bring the respective areas into compliance with federal and state clean air standards. Rules are adopted to reduce emissions from various sources, including specific types of equipment, industrial processes, paints and solvents, even consumer products. Permits are issued to many businesses and industries to ensure compliance with air quality rules. Local AQMDs award grants to help reduce emissions in their local communities. These grants and incentive programs include programs aimed at reducing emissions from mobile sources such as buses and trucks.
| 20 |
Clean Cities
Clean Cities is a program administered by the federal Department of Energy’s (DOE) Office of Efficiency and Renewable Energy, Vehicle Technology Program. According to the DOE, the mission of Clean Cities is to advance the energy, economic, and environmental security of the United States by supporting local decisions to adopt practices that reduce the use of petroleum in the transportation sector. Clean Cities is a government-industry partnership. Under the program, public and private stakeholders from businesses, city and state governments, the automotive industry, fuel providers, and community organizations form coalitions throughout the country, which then work with the DOE to establish a plan for reducing petroleum consumption in their respective geographic areas.
National Clean Diesel Program / Diesel Emissions Reduction Act
The National Clean Diesel Funding Assistance Program, which is administered by the EPA National Clean Diesel Campaign, provides funding under the Diesel Emissions Reduction Act for projects that seek to reduce emissions from existing diesel engines. Eligible applicants include U.S. regional, state and local agencies that have jurisdiction over transportation or air quality and certain nonprofit institutions that provide pollution reduction or educational services to owners and operators of diesel fleets or that have as their principal purpose the promotion of transportation or air quality. Among the eligible uses of funding under this program are the purchase of buses and medium and heavy-duty trucks that result in reduced diesel emissions.
Congestion Mitigation and Air Quality (CMAQ) Improvement Program
The CMAQ Improvement program, which is jointly administered by the Department of Transportation Federal Highway Administration and Federal Transit Administration, provides funding to states to support surface transportation projects and other related efforts that contribute air quality improvements and provide congestion relief. CMAQ funding is allocated to the states annually based on a statutory formula that is based on population and air quality classification as designated by the EPA. Each state’s transportation department then is responsible for distributing the funds. State transportation departments may spend CMAQ funds on projects that reduce ozone precursors, and at least 16 states have used CMAQ funds for alternative fuel vehicle projects (such as purchasing electric or hybrid vehicles).
Other State Incentives
A number of states and municipalities in the United States, as well as certain private enterprises, offer incentive programs to encourage the adoption of alternative fuel vehicles, including tax exemptions, tax credits, exemptions and special privileges. For example, Maryland has introduced a voucher program that provides financial assistance for the purchase of electric trucks registered in that state, and Arizona exempts use tax and lowers registration fees for the purchase of an EV. Other states, including Colorado, Georgia, Utah, Florida and West Virginia, provide for substantial state tax credits for the purchase of EVs.
Government Regulation
Our products are designed to comply with a significant number of governmental regulations and industry standards, some of which are evolving as new technologies are deployed. Government regulations regarding the manufacture, sale and implementation of products and systems similar to ours are subject to future change. We cannot predict what impact, if any, such changes may have upon our business. We believe that vehicles that utilize our technology are in conformity with all applicable laws in all relevant jurisdictions.
| 21 |
Emission and Fuel Economy Standards
Government regulation related to climate change is under consideration at the U.S. federal and state levels. The EPA and National Highway Traffic Safety Administration (NHTSA) issued a final rule for greenhouse gas emissions and fuel economy requirements for trucks and heavy-duty engines on August 9, 2011, which had an initial phase-in starting with model year 2014 and a final phase-in occurring in model year 2017. NHTSA standards for model years 2014 and 2015 were voluntary, while mandatory standards first went into effect in 2016. In August 2016, the EPA and NHTSA jointly finalized Phase 2 standards for medium- and heavy-duty vehicles through model year 2027 to improve fleet fuel efficiency and cut carbon emissions.
The rule provides emission standards for carbon dioxide and fuel consumption standards for three main categories of vehicles: (i) combination tractors, (ii) heavy-duty pickup trucks and vans, and (iii) vocational vehicles. According to the EPA and NHTSA, vocational vehicles consist of a wide variety of truck and bus types, including delivery, refuse, utility, dump, cement, transit bus, shuttle bus, school bus, emergency vehicles, motor homes and tow trucks, and are characterized by a complex build process, with an incomplete chassis often built with an engine and transmission purchased from other manufacturers, then sold to a body manufacturer.
The EPA and NHTSA rule also establishes multiple flexibility and incentive programs for manufacturers of alternatively fueled vehicles, including an engine averaging banking and trading (ABT), program, a vehicle ABT program and additional credit programs for early adoption of standards or deployment of advanced or innovative technologies. The ABT programs allows for emission and/or fuel consumption credits to be averaged, banked or traded within defined groupings of the regulatory subcategories. The additional credit programs allow manufacturers of engines and vehicles to be eligible to generate credits if they demonstrate improvements in excess of the standards established in the rule prior to the model year the standards become effective or if they introduce advanced or innovative technology engines or vehicles.
Vehicle Safety and Testing
The National Traffic and Motor Vehicle Safety Act of 1966 (Safety Act), regulates motor vehicles and motor vehicle equipment in the United States in two primary ways. First, the Safety Act prohibits the sale in the United States of any new vehicle or equipment that does not conform to applicable motor vehicle safety standards established by NHTSA. Meeting or exceeding many safety standards is costly, in part because the standards tend to conflict with the need to reduce vehicle weight in order to meet emissions and fuel economy standards. Second, the Safety Act requires that defects related to motor vehicle safety be remedied through safety recall campaigns. A manufacturer is obligated to recall vehicles if it determines that the vehicles do not comply with a safety standard. Should we or NHTSA determine that either a safety defect or noncompliance exists with respect to any of our modified vehicles, the cost of such recall campaigns could be substantial.
Battery Safety and Testing
We believe our battery packs conform to mandatory regulations that govern transport of “dangerous goods,” which includes lithium-ion batteries that may present a risk in transportation. The governing regulations, which are issued by PHMSA, are based on the UN Recommendations on the Safe Transport of Dangerous Goods Model Regulations, and related UN Manual of Tests and Criteria. The requirements for shipments of these goods vary by mode of transportation, such as ocean vessel, rail, truck and air.
Our battery suppliers have completed the applicable transportation tests including:
| · | Altitude simulation, which involves simulating air transport; | |
| · | Thermal cycling, which involves assessing cell and battery seal integrity; | |
| · | Vibration, which involves simulating vibration during transport; | |
| · | Shock, which involves simulating possible impacts during transport; | |
| · | External short circuit, which involves simulating an external short circuit; and | |
| · | Overcharge, which involves evaluating the ability of a rechargeable battery to withstand overcharging. |
| 22 |
Available Information
We were incorporated in Florida on August 6, 2012 and reincorporated in Delaware in November 2016. Our principal executive offices and mailing address are: 4740 Green River Road, Suite 106, Corona, California 92880. Our telephone number is (951) 407-9860. Our corporate website address is www.adomanielectric.com. Information contained on, or that can be accessed through, our website does not constitute part of this Annual Report and inclusion of our website address in this report is an inactive textual reference only. Our Annual Reports on Form 10-K, Quarterly Reports on Form 10-Q, Current Reports on Form 8-K and amendments to those reports are accessible free of charge at our website. The Securities and Exchange Commission (SEC) also maintains an internet site that contains reports, proxy and information statements and other information regarding our filings at www.sec.gov.
| Item 1A. | RISK FACTORS |
Investing in our securities involves significant risks, including the potential loss of all or part of your investment. These risks could materially affect our business, financial condition and results of operations and cause a decline in the market price of our common stock. You should carefully consider all of the risks described in this Annual Report, in addition to the other information contained in this Annual Report, before you make an investment in our securities. In addition to other matters identified or described by us from time to time in filings with the SEC, there are several important factors that could cause our future results to differ materially from historical results or trends, results anticipated or planned by us, or results that are reflected from time to time in any forward-looking statement. Some of these important factors, but not necessarily all important factors, include the following:
Risks Related to Our Business
We may not successfully execute our business plan to generate revenue and create a sustainable growth trajectory.
We have not generated significant revenues to date. Our ability to generate revenue and grow our revenue will depend, in part, on our ability to execute on our business plan, expand our business model and develop new products in a timely manner. We may fail to do so. A variety of factors outside of our control could affect our ability to generate revenue and our revenue growth. Our success in implementing our strategy of producing zero-emission conversions and selling new zero-emission buses, trucks and other fleet vehicles could also slow our revenue growth.
We have a history of losses and we may not achieve or sustain profitability in the future.
We have incurred losses in each fiscal year since our incorporation in 2012. In the years ended December 31, 2017, 2016 and 2015, we incurred net losses of $21.9 million, $10.69 million, and $6.03 million, respectively. As of December 31, 2017, we had working capital of $1.8 million, an accumulated deficit of $43 million and stockholders’ equity of $2.3 million. To date, we have financed our operations primarily through issuing equity capital, convertible notes, notes payable and, most recently, with the completion of an offering of our common stock. Our products have been recently developed and they may not be commercially successful or generate significant revenue, if at all. If we are to ever achieve profitability it will be dependent upon the successful development and successful commercial introduction and acceptance of zero-emission electric and hybrid drivetrains such as ours; the demand for new buses, trucks and other fleet vehicles with zero-emission or hybrid drivetrains; and the demand for conversion of existing buses, trucks and other fleet vehicles to zero-emission electric or hybrid drivetrains, any of which may not occur. We may not achieve profitability in the future as we anticipate that our operating expenses will increase significantly in the foreseeable future as we:
| · | continue to invest in research and development to enhance our zero-emission products and services; | |
| · | design, develop and manufacture our drivetrains and their components; | |
| · | increase our sales and marketing to acquire new customers; and | |
| · | increase our general and administrative functions to support our growing operations. |
| 23 |
Because we will incur the costs and expenses from these efforts before we receive any significant incremental revenues with respect thereto, our losses in future periods will be significantly greater than the losses we would incur if we developed our business more slowly. In addition, these efforts may prove more expensive than we currently anticipate, or may not result in increases in our revenues, and we may not succeed in increasing our revenue sufficiently to offset these higher expenses. Even if we are successful in generating revenue and increasing our customer base, we may not become profitable in the future or may be unable to maintain any profitability achieved if we fail to increase our revenue and manage our operating expenses or if we incur unanticipated liabilities. And even if our revenue increases, we may not be able to sustain this rate of revenue growth. Revenue growth may slow or revenue may decline for a number of reasons, including lack of demand for our zero-emission systems, increasing competition, lengthening sales cycles, decelerating growth of, or declines in, our overall market, or our failure to capitalize on growth opportunities or to introduce new offerings. Any failure by us to achieve and maintain revenue or profitability could cause the price of our common stock to decline significantly.
While we believe that our existing cash and cash equivalents, including the net proceeds from the foregoing offerings, will be sufficient to fund our operations at least through April 2019, we may not successfully execute our business plan, and if we do not, we may need additional capital to continue our operations.
Our limited operating history makes it difficult to evaluate our current business and future prospects.
Our short operating history and developing business model make it difficult to evaluate our current business and our future prospects. It is difficult to predict our future revenues and appropriately budget for our expenses, and we have limited insight into trends that may emerge and affect our business. We have encountered and will continue to encounter risks and difficulties frequently experienced by growing companies in rapidly developing and changing industries, including challenges in forecasting accuracy, determining appropriate investments of our limited resources, market acceptance of our products and services and future products and services, competition from new and established companies, including those with greater financial and technical resources, acquiring and retaining customers and increasing revenue from existing customers, enhancing our products and services and developing new products and services. You should consider our business and prospects in light of the risks and difficulties that we will encounter as we continue to develop our business model. We may not be able to address these risks and difficulties successfully, which would materially harm our business and operating results and cause the market price of our Common Stock to decline.
We may experience quarterly fluctuations in our operating results due to a number of factors which make our future results difficult to predict and could cause our operating results to fall below expectations.
Our quarterly operating results may fluctuate due to a variety of factors, many of which are outside of our control. As a result, comparing our operating results on a period-to-period basis may not be meaningful. You should not consider our past results, including our recent success in having funding approved in California through AB 923 for conversions and new zero-emission electric or hybrid drivetrains in any projected growth rate or as indicative of our future performance.
We expect our period-to-period operating results to vary based on our operating costs which we anticipate will increase significantly in future periods as we, among other things, design and develop our zero-emission drivetrains, open new design, sales and service facilities, hire additional technology staff, increase our travel and operational budgets, increase our facility costs, hire and train service personnel, increase our sales and marketing activities, and increase our general and administrative functions to support our growing operations. As a result of these factors, we believe that quarter-to-quarter comparisons of our operating results, especially in the short-term, are not necessarily meaningful and that these comparisons cannot be relied upon as indicators of future performance. Moreover, our operating results may not meet expectations of equity research analysts or investors. If any of this occurs, the trading price of our stock could fall substantially, either suddenly or over time.
| 24 |
In addition to other risk factors described in this section, factors that may affect our quarterly operating results include the following: our ability to hire, train and retain key personnel, develop new products that the market demands, receive government support funding to offset the increased product cost to the end user, keep our supply chain intact, source required materials to build our zero-emission systems and maintain them once they are delivered.
Based upon all of the factors described above, we have a limited ability to forecast our future revenue, costs and expenses and, as a result, our operating results may from time to time fall below our estimates.
Our future growth is dependent upon demand for conversion of existing diesel- and gasoline-powered buses, truck and other fleet vehicles to zero-emission electric or hybrid drivetrain systems and demand for new buses, trucks and other fleet vehicles with zero-emission drivetrains.
Our growth is highly dependent upon the market acceptance of, and we are subject to an elevated risk of any reduced demand for, zero-emission vehicles and conversion of existing buses, trucks and other fleet vehicles to zero-emission electric or hybrid vehicles and the demand for new buses, truck and other fleet vehicles with zero-emission drivetrains in particular. If this market does not develop as we expect or develops more slowly than we expect, our business, prospects, financial condition and operating results will be harmed and we may need to raise additional capital. This market is relatively new, rapidly evolving, characterized by rapidly changing technologies, price competition, additional competitors, evolving government regulation and industry standards, frequent new vehicle announcements and changing consumer demands and behaviors. Factors that may influence the market acceptance of zero-emission vehicles, and specifically conversion of existing buses and fleet vehicles to zero-emission electric or hybrid and the demand for new buses and fleet vehicles with zero-emission drivetrains, include:
| · | perceptions about zero-emission EV quality, safety design, performance and cost, especially if adverse events or accidents occur that are linked to the quality or safety of any EV; | |
| · | perceptions about the limitations in the technology resulting in a limited range over which zero-emission EVs may be driven on a single battery charge (increases in distance requires additional batteries, which increases weight, and, at some point, too much weight diminishes the additional distance being sought before requiring a charge); | |
| · | perceptions about vehicle safety in general, in particular safety issues that may be attributed to the use of advanced technology; | |
| · | the availability of alternative fuel vehicles, including competitive vehicles and improvements in the fuel economy of the internal combustion engine may cause a slow-down in the demand to switch to zero-emission EVs; | |
| · | the availability of service for zero-emission EVs; | |
| · | the environmental consciousness of owners of diesel- and gasoline-powered buses, truck and other fleet vehicles; | |
| · | changes in the cost of oil and gasoline; | |
| · | government regulations and economic incentives, including a change in the administrations and legislations of federal and state governments, promoting fuel efficiency and alternate forms of energy; | |
| · | access to charging stations both public and private, standardization of EV charging systems and perceptions about convenience and cost to charge an EV; | |
| · | the availability of tax and other governmental incentives and rebates to purchase and operate EVs or future regulation requiring increased use of zero-emission or hybrid vehicles; | |
| · | perceptions about and the actual cost of alternative fuel; and | |
| · | macroeconomic factors. |
| 25 |
Additionally, we have limited experience in introducing new products. To date, we have been a research and development company and we have only recently commenced production and deliveries of our products. To the extent that we are not able to build our products in accordance with customer expectations, our future sales could be harmed.
Additionally, we may become subject to regulations that may require us to alter the design of our drivetrains, which could negatively impact consumer interest in our drivetrains.
The influence of any of the factors described above may cause current or potential customers not to purchase our EVs or drivetrains, which would materially adversely affect our business, operating results, financial condition and prospects.
We may not be able to compete successfully against current and future competitors.
The market for commercial zero-emission electric and hybrid vehicles is relatively new, rapidly evolving, characterized by rapidly changing technologies, price competition, additional competitors, evolving government regulation and industry standards, frequent new vehicle announcements and changing consumer demands and behaviors.
Most of our existing and potential competitors, including Ford, Navistar, Freightliner, PACCAR, Hino, Fuso, Volvo, BYD, Proterra, TransPower, Lion Bus or Motiv, have substantially greater financial resources, more extensive engineering, manufacturing, marketing and customer service and support capabilities, longer operating histories and greater name recognition than we do. They may be able to devote greater resources to the design, development, manufacturing, distribution, promotion, sale and support of their products. Virtually all of our competitors have more extensive customer bases and broader customer and industry relationships than we do. Our competitors may be in a stronger position to respond quickly to new technologies and may be able to design, develop, market and sell their products more effectively. As a result, our competitors may be able to compete more aggressively and sustain that competition over a longer period of time than we can. Each of these competitors has the potential to capture market share in our target market, which could have an adverse effect on our position in our industry and on our business and operating results.
We expect competition in our industry to intensify in the future in light of anticipated increased demand for alternative fuel vehicles and to continued globalization and consolidation in the worldwide automotive industry. Factors affecting competition include product quality and features, innovation and development time, pricing, reliability, safety, fuel economy, customer service and financing terms. Increased competition may lead to lower vehicle unit sales and increased inventory, which may result in further downward price pressure and adversely affect our business, financial condition, operating results and prospects. Our ability to successfully compete in our industry will be fundamental to our future success in existing and new markets and to our market share. There can be no assurances that we will be able to compete successfully in our markets. If our competitors introduce new products or services that compete with or surpass the quality, price or performance of our products or services, we may be unable to satisfy existing customers or attract new customers at the prices and levels that would allow us to generate attractive rates of return on our investment. A disruptive technology advancement in the EV industry by a competitor, such as in energy storage, traction motors or power electronics, could affect the sales of our products.
Demand in the zero-emission electric and hybrid vehicle industry is volatile, which may lead to lower vehicle unit sales, which could adversely affect our operating results. Volatility of demand in the zero-emission electric and hybrid vehicle industry may materially and adversely affect our business, prospects, operating results and financial condition. The markets in which we currently compete and plan to compete in the future have been subject to considerable volatility in demand in recent periods. As a low volume producer, we have fewer financial resources than more established providers have to withstand changes in the market and disruptions in demand. Volatility in demand may lead to lower vehicle unit sales and increased inventory, which may result in further downward price pressure and adversely affect our business, prospects, financial condition and operating results. These effects may have a more pronounced impact on our business given our relatively smaller scale and financial resources as compared to many incumbent providers.
| 26 |
Competition could result in price reductions and revenue shortfalls, loss of customers and loss of market share. If we cannot compete successfully against current and future competitors, our business, prospects, results of operations and financial condition could be negatively impacted.
Our sales cycle can be long and unpredictable and require considerable time and expense before executing a customer agreement,
which may make it difficult to project when, if at all, we will obtain new customers and generate revenue from those customers.
The sales cycle for our business, from initial contact with a potential lead to contract execution and implementation, typically takes significant time and is difficult to predict. Our sales cycle in some cases has been up to six to nine months or more. Our sales efforts involve educating our customers about the use, capabilities and benefits of our products and services. Some of our customers undertake a significant evaluation process that frequently involves not only our products and services but also the offerings of our competitors. This process can be costly and time-consuming. As a result, it is difficult to predict when we will obtain new customers and begin generating revenue from these new customers. As part of our sales cycle, we may incur significant expenses before executing a definitive agreement with a prospective customer and before we are able to generate any revenue from such agreement. The substantial time and money spent on our sales efforts may not generate significant revenue. If conditions in the marketplace generally or with a specific prospective customer change negatively, it is possible that no definitive agreement will be executed, and we will be unable to recover any of these expenses. If we are not successful in targeting, supporting and streamlining our sales processes, our ability to grow our business, and our operating results and financial condition may be adversely affected. If our sales cycles lengthen, our future revenue could be lower than expected, which would have an adverse impact on our consolidated operating results and could cause our stock price to decline.
Developments in alternative technologies or improvements in the internal combustion engine may materially adversely affect the demand for EVs and our drivetrains.
Significant developments in alternative technologies, such as advanced diesel, ethanol and other renewable fuels, fuel cells or compressed natural gas, or improvements in the fuel economy of the internal combustion engine, may materially and adversely affect our business and prospects in ways we do not currently anticipate. For example, fuel which is abundant and relatively inexpensive in North America, such as compressed natural gas, may emerge as consumers’ preferred alternative to petroleum-based propulsion. Any failure by us to develop new or enhanced technologies or processes, or to react to changes in existing technologies, could materially delay our development and introduction of new and enhanced zero-emission electric or hybrid drivetrains which could result in the loss of competitiveness of our drivetrains, decreased revenue and a loss of market share to competitors.
If we are unable to keep up with advances in zero-emission electric drivetrain or hybrid vehicle technology, we may suffer an inability to obtain a competitive position in the market or suffer a decline in our competitive position.
There are companies in the zero-emission electric and hybrid vehicle industry that have developed or are developing vehicles and technologies that compete or will compete with the vehicles that utilize our technology. Our competitors could be able to duplicate our technology or provide products and services similar to ours more efficiently or at greater scale. We may be unable to keep up with changes in zero-emission electric or hybrid drivetrain technology and, as a result, may suffer a decline in our competitive position. Any failure to keep up with advances in zero-emission electric or hybrid drivetrain technology would result in a decline in our competitive position, which would materially and adversely affect our business, prospects, operating results and financial condition. Our research and development efforts may not be sufficient to adapt to changes in zero-emission electric or hybrid drivetrain technology. As technologies change, we plan to upgrade or adapt our drivetrains and introduce new drivetrains in order to continue to provide drivetrains with the latest technology, in particular battery cell technology. However, our drivetrains may not compete effectively with alternatives if we are not able to source and integrate the latest technology into our drivetrains. For example, we do not manufacture most of the high cost items required for our conversion kits, including battery cells, which makes us dependent upon other suppliers of battery cell technology for our battery packs. If for any reason we are unable to keep pace with changes in commercial electric and hybrid vehicle technology, particularly battery technology, our competitive position may be adversely affected.
| 27 |
The demand for commercial zero-emission electric and hybrid vehicles depends, in part, on the continuation of current trends resulting from historical dependence on fossil fuels. Extended periods of low diesel or other petroleum-based fuel prices could adversely affect demand for vehicles that utilize our technology, which could adversely affect our business, prospects, financial condition and operating results.
We believe that much of the present and projected demand for commercial zero-emission electric and hybrid vehicles results from concerns about volatility in the cost of petroleum-based fuel, the dependency of the United States on oil from unstable or hostile countries, government regulations and economic incentives promoting fuel efficiency and alternative forms of energy, as well as the belief that poor air quality and climate change results in part from the burning of fossil fuels. If the cost of petroleum-based fuel decreased significantly, or the long-term supply of oil in the United States improved, the government may eliminate or modify its regulations or economic incentives related to fuel efficiency and alternative forms of energy. If there is a change in the perception that the burning of fossil fuels does not negatively impact the environment, the demand for commercial zero-emission electric or hybrid vehicles could be reduced, and our business and revenue may be harmed. Diesel and other petroleum-based fuel prices have been extremely volatile, and we believe this continuing volatility will persist. Lower diesel or other petroleum-based fuel prices over extended periods of time may lower the current perception in government and the private sector that cheaper, more readily available energy alternatives should be developed and produced. If diesel or other petroleum-based fuel prices remain at deflated levels for extended periods of time, the demand for commercial electric or plug-in hybrid vehicles may decrease, which could have an adverse effect on our business, prospects, financial condition and operating results.
We may not be able to reduce and adequately control the costs and expenses associated with operating our business, including our material and production costs.
If we are unable to reduce and/or maintain a sufficiently low level of costs for designing, manufacturing, marketing, selling and distributing and servicing our zero-emission drivetrains relative to their selling prices, our operating results, gross margins, business and prospects could be materially and adversely impacted. We have made, and will be required to continue to make, significant investments for the design, manufacture and sales of our zero-emission drivetrains. Our marginal costs of producing our drivetrains to date have exceeded our revenue from selling them. This is not expected to change for the foreseeable future until we are able to generate adequate sales volume to offset the cost of our drivetrains. Our costs of producing and delivering any future products may not be less than the revenue we generate from sales at the time we introduce any future products and we may never ever achieve a positive gross margin on sales of our zero-emission drivetrains or future products, if any.
We incur significant costs related to procuring the materials and components required to build our drivetrains and convert electric and hybrid vehicles. As a result, without including the impact of government or other subsidies and incentives, our costs and therefore the purchase prices for our commercial zero-emission electric and hybrid vehicles and/or converting commercial vehicles currently are substantially higher than the purchase prices for gas or diesel-fueled vehicles with comparable features.
Additionally, in the future we may be required to incur substantial marketing costs and expenses to promote our zero-emission drivetrains, including through the use of traditional media such as television, radio and print, even though our marketing expenses to date have been relatively limited. If we are unable to keep our operating costs aligned with the level of revenues we generate, our operating results, business and prospects will be harmed. Many of the factors that impact our operating costs are beyond our control. For example, global demand from all manufacturers of zero-emission vehicles for the same resources could create shortages and drive the costs of our raw materials and certain components, such as lithium-ion battery cells, to a higher level and reduce profit or create or increase losses. Indeed, if the popularity of zero-emission electric and hybrid vehicles exceeds current expectations without significant expansion in battery cell production capacity and advancements in battery cell technology, shortages could occur which would result in increased materials costs to us, and could also negatively impact our ability to meet production requirements if the batteries were simply not available.
If we fail to manage our anticipated growth effectively, we may be unable to execute our business plan, maintain high levels of service or address competitive challenges adequately.
| 28 |
Any failure to manage our anticipated growth effectively could materially and adversely affect our business, prospects, operating results and financial condition. We have recently expanded our operations and further significant expansion will be required, especially in connection with kit manufacturing, service and warranty requirements. The requirements of being a public company will significantly increase our general and administrative costs. Our future operating results depend to a large extent on our ability to manage this expansion and growth successfully. Risks that we face in undertaking this expansion include:
| · | establishing sufficient sales, service and service facilities in a timely manner; | |
| · | forecasting production and revenue; | |
| · | training new personnel; | |
| · | controlling expenses and investments in anticipation of expanded operations; | |
| · | establishing or expanding design, manufacturing, sales and service facilities; | |
| · | implementing and enhancing administrative infrastructure, systems and processes; | |
| · | addressing new markets; and | |
| · | expanding operations and finding and hiring a significant number of additional personnel, including manufacturing personnel, design personnel, engineers and service technicians. |
We intend to hire a significant number of additional personnel, including design and manufacturing personnel and service technicians for our zero-emission electric and hybrid vehicles. Because vehicles that utilize our technology are based on a different technology platform than traditional internal combustion engines, individuals with sufficient training in zero-emission electric and hybrid vehicles may not be available to hire, and we may need to expend significant time and expense training the employees we do hire. Competition for individuals with experience designing, manufacturing and servicing zero-emission electric and hybrid vehicles is intense, and we may not be able to attract, assimilate, train or retain additional highly qualified personnel in the future, which could seriously harm our business and prospects.
In this regard, we will be required to continue to improve our operational, financial and management controls and our reporting procedures and we may not be able to do so effectively. Further, to accommodate our expected growth we must continually improve and maintain our technology, systems and network infrastructure. We therefore may be unable to manage our expenses effectively in the future, which would negatively impact our gross margin or operating expenses in any particular quarter. If we fail to manage our anticipated growth and change in a manner that preserves the quality of our zero-emission systems and services and our ability to deliver in a timely manner, it will negatively affect our brand and reputation and harm our ability to retain and attract customers.
If our zero-emission electric and hybrid drivetrains fail to perform as expected, our ability to develop, market and sell our drivetrains could be harmed.
Our zero-emission drivetrains or vehicles that contain our drivetrains may not perform in a manner that is consistent with our customers’ expectations for a variety of reasons. If our drivetrains or vehicles that contain our drivetrains were to contain defects in design and manufacture that cause them not to perform as expected or that require repair, or any other failure of vehicles that contain our drivetrains to perform as expected could harm our reputation and result in delivery delays, product recalls, product liability claims, significant warranty and other expenses, which could have a material adverse impact on our ability to develop, market and sell our zero-emission drivetrains. For example, should we have a significant sale of either new vehicles or conversion kits and a defect (from supplier-purchased product or internally assembled components) were to be discovered after delivery that could not be corrected in a timely manner, we could suffer an adverse public relations event that harms the company in a way that it may not be able to recover from, or which turns out to be so costly as to cause a significant loss. Although we attempt to remedy any issues we observe in our drivetrains as effectively and as rapidly as possible, such efforts may not be timely, may hamper production or may not provide satisfaction to our customers. While we have performed extensive internal testing, we currently have a limited frame of reference by which to evaluate the long-term performance of our zero-emission drivetrains. There can be no assurance that we will be able to detect and fix any defects in our products prior to their sale to customers. Further, the performance of our zero-emission drivetrains may be negatively impacted by other factors, such as limitations inherent in existing battery technology and extreme weather conditions. Our zero-emission drivetrains have not yet been evaluated by NHTSA for its 5-Star Safety Ratings, and while based on our internal testing we expect to obtain acceptable ratings, this may not occur.
| 29 |
Any vehicle product defects or any other failure of our commercial zero-emission electric or hybrid drivetrains to perform as expected could harm our reputation and result in delivery delays, product recalls, product liability claims, significant warranty and other expenses, customer losses and lost revenue, any of which could have a material adverse impact on our business, financial condition, operating results and prospects.
We are dependent on third parties to deliver raw materials, parts, components and services in adequate quantity in a timely manner and at reasonable prices, quality levels, and volumes acceptable to us. Our business, prospects, financial condition and operating results could be adversely affected if we experience disruptions in our supply chain.
We build zero-emission electric and hybrid drivetrains and conversion kits for drivetrains from components supplied by third parties. For example, we rely on third parties for batteries, traction motors, power electronics, connectors, cables, and metal fabrication for battery storage boxes. As a result, we are particularly dependent on those third parties to deliver raw materials, parts, components and services in adequate quality and quantity in a timely manner and at reasonable prices. Some components of our drivetrain systems include materials such as copper, lithium, rare-earth and strategic metals that have historically experienced price volatility and supply interruptions. In addition, we do not currently maintain long-term agreements with our suppliers with guaranteed pricing because we cannot at this time guarantee them adequate volume, which exposes us to fluctuations in component, materials and equipment prices and availability.
Furthermore, currency fluctuations weakening the U.S. dollar against foreign currencies may adversely affect our purchasing power for such raw materials, parts and components and manufacturing equipment from foreign suppliers. Substantial increases in the prices for such raw materials, components and equipment would increase our operating costs, and could reduce our margins if we cannot recoup the increased costs through increased prices. We may not be able to recoup these increased costs by increasing the prices of our products.
In cases where we rely on a sole supplier for a component or system, if there is an interruption of supply or increased industry demand it may be difficult for us to substitute one supplier for another, increase the number of suppliers or change one component for another in a timely manner or at all. Additionally, many of our current suppliers are small companies that produce a limited number of specialized products. If any of these suppliers were to go out of business or be acquired by a competitor of ours or any other third party that decides to discontinue our supply relationship, we would need to find an alternative supplier, which we may not be able to do. If we are unable to maintain a consistent, high quality and cost-effective supply chain, our business, prospects, financial condition and operating results could be adversely affected.
This limited supply chain exposes us to multiple potential sources of delivery failure or component shortages for the production of our zero-emission electric or hybrid drivetrains. We may experience delays due to supply chain disruptions with respect to any of our zero-emission drivetrains and any other future products we may produce. In addition, our currently ongoing transition from low to high volume production tooling for our zero-emission drivetrains may take longer than expected which may adversely impact our short-term financial results.
Changes in business conditions, domestic and foreign regulations, labor issues, wars, governmental changes, natural disasters and other factors beyond our control or which we do not presently anticipate, could also affect our suppliers’ ability to deliver components to us on a timely basis. Furthermore, if we experience significantly increased demand, or need to replace certain existing suppliers, there can be no assurance that additional supplies of component parts will be available when required on terms that are favorable to us, or that any supplier would allocate sufficient supplies to us in order to meet our requirements or fill our orders in a timely manner, or that we could engineer replacement components ourselves.
| 30 |
Changes in our supply chain may result in increased costs in the future. We have also experienced cost increases from certain of our suppliers in order to meet our quality targets and development timelines as well as due to design changes that we made, and we may experience similar cost increases in the future. Additionally, we are negotiating with existing suppliers for cost reductions, seeking new and less expensive suppliers for certain parts, and attempting to redesign certain parts to make them less expensive to produce. If we are unsuccessful in our efforts to control and reduce supplier costs, our operating results will suffer.
If we encounter unexpected difficulties with our current suppliers, and if we are unable to fill these needs from other suppliers, we could experience production delays, which could have a material adverse effect on our financial condition and operating results.
The inability of these suppliers to deliver, or their refusal to deliver, necessary raw materials, parts and components of our zero-emission drivetrains and services in a timely manner at prices, quality levels, and volumes acceptable to us would have a material adverse effect on our financial condition and operating results. Our business, prospects, financial condition and operating results could be adversely affected if we experience disruptions in our supply chain.
The facilities or operations of our third party providers could be damaged or adversely affected as a result of disasters or unpredictable events.
Some of our third party providers have production facilities in California, a state known for seismic activity and wildfires. If major disasters such as earthquakes, fires, floods, hurricanes, wars, terrorist attacks, computer viruses, pandemics or other events occur, the production facilities of some of our third party providers may be seriously damaged, or they may have to stop or delay production and shipment of our products. We may also experience downtime due to a third party provider’s delay in production and shipment of our products due to, among other reasons, their inability to obtain supplies and materials. Either of these delays could have a material adverse impact on our business, operating results and financial condition.
If our suppliers fail to use ethical business practices and comply with applicable laws and regulations, our brand image could be harmed due to negative publicity.
We do not control our independent suppliers or their business practices. A They may not comply with ethical or legal business practices, such as environmental responsibility, fair wage practices, appropriate sourcing of raw materials, and compliance with child labor laws, among others. A lack of demonstrated compliance could lead us to seek alternative suppliers, which could increase our costs and result in delayed delivery of our products, product shortages or other disruptions of our operations.
Violation of labor or other laws by our suppliers or the divergence of an independent supplier’s labor or other practices from those generally accepted as ethical in the United States or other markets in which we do business could also attract negative publicity for us and our brand. This could diminish the value of our brand image and reduce demand for our zero-emission drivetrains or hybrid vehicle technology if, as a result of such violation, we were to attract negative publicity. If we, or others in our industry, encounter similar problems in the future, it could harm our brand image, business, prospects, financial condition and operating results.
Our business success will depend in part on the success of our strategic relationships with third parties. We may not be able to identify adequate strategic relationship opportunities, or form strategic relationships, in the future.
Our business success will depend in part on our ability to continue to successfully manage and enter into productive strategic relationships with third parties. We depend on various third parties to provide critical parts for our process. We currently maintain strategic relationships with all of the key manufacturers of components we require for conversion kit builds. As an example, we source our batteries from Chinese suppliers. However, several large market leaders in the battery manufacturing arena have gone out of business in the past several years which requires us to continue to vet and seek new suppliers. Maintaining and expanding our strategic relationships with third parties is critical to our continued success. Further, our relationships with these third parties are typically non-exclusive and do not prohibit the other party from working with our competitors. These relationships may not result in additional customers or enable us to generate significant revenue. Identifying suitable business partners and negotiating and documenting relationships with them require significant time and resources. If we are unsuccessful in establishing or maintaining our relationships with these third parties, our ability to successfully sell our products and services, compete in the marketplace or to grow our revenue could be impaired and our operating results would suffer.
| 31 |
While we may be able to establish alternate supply relationships or engineer replacement components for our single source components, we may be unable to do so in the short term, or at all, at prices or costs that are favorable to us. In particular, while we believe that we will be able to secure alternate sources of supply for most of our single sourced components in a relatively short time frame, qualifying alternate suppliers or developing our own replacements for certain highly customized components of our drivetrains may be time consuming, costly and may force us to make additional modifications to a drivetrain’s design, or at a minimum require us to delay delivery of orders.
We currently have and are seeking to establish new relationships with third parties to provide alternative parts sources, such as batteries, controllers and battery management systems. For example, we continue to test additional battery manufacturers’ products in order to have back-up systems in place should our existing supplier have delivery or quality issues. In addition, this helps keep our prices in line with our competition and allows us to monitor various output and costs per unit in real time. However, we may not be able to identify or secure suitable business relationship opportunities in the future or that our competitors will not capitalize on such opportunities before we do. Our strategic relationships within China for batteries and domestically for motors and controllers will keep us competitive if maintained properly. We may not be able to offer benefits to companies that we would like to establish and maintain strategic relationships with. Moreover, identifying such opportunities could demand substantial management time and resources, and negotiating and financing relationships involves significant costs and uncertainties. If we are unable to successfully source and execute on strategic relationship opportunities in the future, our overall growth could be impaired, and our business, prospects and operating results could be materially adversely affected.
We must scale our zero-emission drivetrain manufacturing, assembling, and converting processes effectively and quickly from low volume production to high volume production.
We have no experience to date in high volume manufacturing, assembling, and converting to commercial electric and hybrid vehicles. Our existing production model utilizing third parties may not be well suited for the high-volume production we hope to require to scale our business. We do not know whether we will be able to develop efficient, low-cost manufacturing, assembly and converting capability and processes, and reliable sources of component supply that will enable us to meet the quality, price, engineering, design and production standards, as well as the production volumes required, to successfully develop our business. Any failure to develop such manufacturing, assembly and converting processes and capabilities and reliable sources of component supply within our projected costs and timelines could have a material adverse effect on our business, prospects, operating results and financial condition.
Our ability to scale our zero-emission drivetrain manufacturing, assembling, and converting processes is in part dependent on our supply chain and on our ability to execute on our decentralized production strategy. Even if we are successful in developing our high-volume manufacturing, assembly and converting capability and processes, and reliable sources of component supply, we do not know whether we will be able to do so in a manner that avoids significant delays and cost overruns, including as a result of factors beyond our control such as problems with suppliers and vendors, or in time to meet our commercialization schedules or to satisfy the requirements of customers. In addition, certain components we integrate may not be available on a consistent basis or in large quantities. Our business, prospects, financial condition and operating results could be adversely affected if we experience disruptions in our supply chain or if we cannot obtain materials of sufficient quality at reasonable prices.
The complexity in our business is expected to grow as we introduce new products and services. We have limited experience in simultaneously designing, testing, manufacturing, upgrading, adapting and selling our zero-emission drivetrains as well as limited experience allocating our available resources among the design and production of multiple zero-emission drivetrains. As we add complexity to our product line and introduce new products and services, we may experience unexpected delays.
| 32 |
If we are unable to scale our existing assembly processes and systems quickly while maintaining our current quality level, including as a result of supply chain constraints and inability to manage complexity in our business, we may be unable to meet our customers’ vehicle quality and quantity requirements or our forecasted production schedule or lower our cost of sales. As a result, we may not be able to meet our customers’ delivery schedules and could face the loss of customers, or be exposed to liability to customers to which we promised delivery, which could adversely affect our business, prospects, financial condition and operating results.
We may become subject to product liability claims, which could harm our financial condition and liquidity if we are not able to successfully defend or insure against such claims.
We may become subject to product liability claims, which could harm our business, prospects, operating results and financial condition if we are not able to successfully defend or insure against such claims. The zero-emission electric and hybrid vehicle industry experiences significant product liability claims and we face inherent risk of exposure to claims in the event our zero-emission drivetrains do not perform as expected or malfunction and personal injury or death results. Our risks in this area are particularly pronounced given the limited field experience of our zero-emission systems, number of vehicles delivered to date and limited field experience of those vehicles. A successful product liability claim against us could require us to pay a substantial monetary award. Moreover, a product liability claim could generate substantial negative publicity about our drivetrains and business and inhibit or prevent commercialization of other future vehicle candidates which would have a material adverse effect on our brand, business, prospects and operating results. We currently do not have product liability insurance coverage, as we have not sold many vehicles. We intend to add product liability insurance on a claims-made basis for all our zero-emission systems with appropriate annual limits when we commence production. However, our insurance may not be sufficient to cover all potential product liability claims. Any lawsuit seeking significant monetary damages either in excess of our coverage, or outside of our coverage, may have a material adverse effect on our reputation, business and financial condition. We may not be able to secure product liability insurance coverage on commercially acceptable terms or at reasonable costs when needed, particularly if we do face liability for our products and are forced to make a claim under any policy we have.
In connection with the development and sale of our zero-emission drivetrains, we may need to comply with various safety regulations and requirements with which it may be expensive or difficult to comply. For example, we may be subject to compliance from CARB and NHTSA. In addition, we may be subject to various other federal and state-level requirements.
We may be compelled to undertake product recalls.
Any product recall in the future may result in adverse publicity, damage our brand and adversely affect our business, prospects, operating results and financial condition. We may at various times, voluntarily or involuntarily, initiate a recall if any of our zero-emission drivetrain components prove to be defective. Such recalls, voluntary or involuntary, involve significant expense and diversion of management attention and other resources, which would adversely affect our brand image in our target markets and could adversely affect our business, prospects, financial condition and results of operations.
Our warranty reserves may be insufficient to cover future warranty claims which could adversely affect our financial performance.
If our warranty reserves are inadequate to cover future warranty claims on vehicles that utilize our technology, our business, prospects, financial condition and operating results could be materially and adversely affected. We provide a two-year warranty on parts and workmanship and a five-year warranty on batteries with every zero-emission drivetrain. Most of our warranty offering, with the exception of workmanship, is covered by the component manufacturers’ warranty. In addition, customers have the opportunity to purchase an Extended Service Plan for the period after the end of the standard warranty to cover additional services for an additional three-year period or 100,000 miles, whichever comes first. The warranty is similar to other providers’ warranty programs and is intended to cover all parts and labor to repair defects in material or workmanship in the drivetrain. We plan to establish an initial warranty reserve of 3.0% of the cost of each delivery. We plan to record and adjust warranty reserves based on changes in estimated costs and actual warranty costs. However, because we have not yet begun delivering our first zero-emission drivetrains, and we have extremely limited operating experience with our drivetrains, we therefore have little experience with warranty claims for these zero-emission drivetrains or with estimating warranty reserves. Once we begin initiating sales of our drivetrains, we will monitor our warranty reserves based on our actual warranty claim experience. We may be required to provide for increases in warranty reserves in the future. As of December 31, 2017, we recorded warranty reserves of $12,750 against the sale recorded in November. Our future warranty reserves may not be sufficient to cover all claims or our limited experience with warranty claims may not adequately address the needs of our customers to their satisfaction.
| 33 |
Our insurance strategy may not be adequate to protect us from all business risks.
We may be subject, in the ordinary course of business, to losses resulting from products liability, accidents, acts of God and other claims against us, for which we may have no insurance coverage. Additionally, our insurance coverage may not be sufficient to cover all future claims against us. A loss that is uninsured or which exceeds policy limits may require us to pay substantial amounts, which could adversely affect our financial condition and operating results.
If we are unable to design, develop, market and sell zero-emission electric and hybrid drivetrains and other product offerings that address additional market opportunities, our business, prospects and operating results will suffer.
We may not be able to successfully develop new zero-emission electric or hybrid drivetrains or vehicles containing them, or address new market segments or develop a broader customer base. To date, we have focused our business on the sale of zero-emission electric drivetrains and have targeted owners of buses and commercial fleets. We will need to address additional markets and expand our customer demographic in order to further grow our business. In particular, we intend to additionally target trucks (all classes inclusive of 1–8) and vans under 14,000 pounds GVWR, which is a much different market from that of our current zero-emission drivetrains. Successfully offering a drivetrain in this market requires delivering a drivetrain with different characteristics at a price that is competitive with other similar drivetrains. We have not completed the design, component sourcing or manufacturing process for these drivetrains, so it is difficult to forecast its eventual cost, manufacturability or quality. Therefore, there can be no assurance that we will be able to deliver a drivetrain that is ultimately competitive in this market at a compelling price point and in volumes as we currently intend, if at all. Our failure to address additional market opportunities would harm our business, financial condition, operating results and prospects.
Our growth depends in part on the availability and amounts of government subsidies and incentives and the application of regulations that encourage conversion to electric or hybrid vehicles. These subsidies and incentives are limited and unpredictable and could expire or change to benefit competing technologies
We believe that the availability of government subsidies, rebates, and economic incentives is currently a critical factor considered by our customers when purchasing our zero-emission systems or converting their existing vehicles to zero-emission-electric or hybrids, and that our growth depends in large part on the availability and amounts of these subsidies and economic incentives. Any unavailability, reduction, elimination or adverse application of government subsidies, rebates, and economic incentives because of budgetary challenges, expiration, policy changes, the reduced need for such subsidies, rebates, and incentives due to the perceived success of electric or hybrid vehicles or other reasons may result in the diminished price competitiveness of the alternative fuel vehicle industry generally and our zero-emission electric and hybrid vehicles in particular, especially prior to our ability to significantly reduce our costs. For example, in the United States, we and our customers benefit from significant subsidies in connection with the purchase of our vehicles under the California HVIP, CARB, local air quality management districts, the EV Demonstration Project, and state-level Clean Cities programs. Under these programs, purchasers of qualifying vehicles and those who convert their existing vehicles are eligible to receive subsidies or incentives of up to $55,000, $71,000 and $110,000, respectively, per qualifying vehicle purchased or converted. Certain regulations and programs that encourage sales of zero-emission electric and hybrid vehicles could expire, be exhausted, be eliminated or applied in a way that adversely impacts sales of our commercial zero-emission electric and hybrid vehicles, either currently or at any time in the future. For example, the U.S. federal government and many state governments, as well as many national governments within the European Union, are facing political changes, fiscal crises and budgetary constraints, which could result in the elimination of programs, subsidies and incentives that encourage the purchase or conversion of zero-emission electric and hybrid vehicles. In addition, grants made by the DOE under the U.S. Recovery and Reinvestment Act of 2009 to clean technology companies, such as the EV Demonstration Project grant, may be subject to a high level of scrutiny in part due to recent financial difficulties experienced by recipients of DOE loan guarantees. In addition, currently some purchase subsidies are limited in total annual amounts and have been exhausted before all willing buyers have been able to consummate a purchase. We currently benefit from certain government and economic incentives supporting the development and adoption of zero-emission electric or hybrid vehicles. If government subsidies and economic incentives to produce and purchase zero-emission electric or hybrid vehicles were no longer available to us or our customers, or the amounts of such subsidies and incentives were reduced or eliminated, it could have a negative impact on demand for our vehicles and our business, prospects, financial condition and operating results would be adversely affected.
| 34 |
In addition, we anticipate that in the future there may be new opportunities for us to apply for grants, loans and other incentives from federal, state, local and foreign governments on our own behalf and on behalf of our customers. Our ability to obtain funds or incentives from government sources is subject to the availability of funds under applicable government programs and approval of our applications to participate in such programs. The application process for these funds and other incentives is and will continue to be highly competitive.
Our service model may be costly for us to operate and may not address the service requirements of our prospective customers.
Our business plan is not to develop company owned and operated service and warranty centers but to leverage existing third party bus and truck facilities to process our vehicle conversions and new vehicles. This plan may not prove to be workable and we may be forced to establish our own facilities at some point, resulting in substantial capital expenditures and increased operating costs. Zero-emission electric and hybrid commercial vehicles incorporate new and evolving technologies and require specialized service. These special service arrangements are now and in the future may continue to be costly and we may not be able to recoup the costs of providing these services to our customers. In addition, a number of potential customers may choose not to purchase our commercial zero-emission electric or hybrid vehicles because of the lack of a more widespread service network. If we are unable to satisfactorily service vehicles that utilize our technology, our ability to generate customer loyalty, grow our business and sell additional vehicles could be impaired. There can be no assurance that these service arrangements or our limited experience servicing vehicles that utilize our technology will adequately address the service requirements of our customers to their satisfaction, or that we will have sufficient resources to meet these service requirements in a timely manner as the volume of vehicles we are able to deliver annually increases. If we do not adequately address our customers’ service needs, our brand and reputation may be adversely affected, which, in turn, could have an adverse effect on our business, prospects, financial condition and operating results.
Traditional providers do not provide maintenance and repair services directly. Customers must instead service their vehicles through franchised dealerships or through third party maintenance service providers. We are pursuing a number of agreements to provide third party service for us. However, it is unclear when or even whether such third party service providers will be able to acquire the expertise to service our zero-emission electric and hybrid commercial vehicles. As vehicles that utilize our technology are placed in more locations, we may encounter negative reactions from our customers who are frustrated that they cannot use local service stations to the same extent as they have with their conventional commercial vehicles and this frustration may result in negative publicity and reduced sales, thereby harming our business and prospects
Our decentralized assembly, sales and service model will present numerous challenges and we may not be able to execute on our plan to establish sales, service and assembly facilities in the urban areas we have targeted and our facilities in any of those markets may underperform relative to our expectations.
Our strategy of establishing sales, service, and assembly facilities in selected urban areas in the United States is substantially different from the prevailing centralized manufacturing and franchised distribution and service model used currently by our zero-emission and conversion manufacturing competitors. For example, we will not be able to utilize long established sales channels developed through a traditional franchise system to increase our sales volume, which may harm our business, prospects, financial condition and operating results. Moreover, we will be competing with companies with well established distribution channels. If we determine that our decentralized model is inadequate, opening our own sales, service and assembly facility in any market generally will be capital intensive and require, among other things, establishing a local order volume that is sufficient to support the facility, finding a suitable and available location, negotiating a satisfactory lease agreement for the facility, obtaining permits and approvals from local and state authorities (which, in the case of facilities to be opened in foreign countries, may require obtaining approvals from national governments), building out the facility to our specifications and hiring and training employees to assemble, sell and service our zero-emission electric or hybrid vehicles and converting existing vehicles to zero-emission electric or hybrid vehicles. If we decide we must open our own facilities, we plan to seek state and local government incentives to defray the costs of opening facilities in the markets we have selected, but we may not be successful in this effort, or the incentives may not be as significant as we would like. As with any development project, the development and build-out of a facility will subject us to the risk of cost overruns and delays, which may be significant. Once our sales, service and assembly facilities are open for business, we will need to ensure that they maintain a high level of quality in order to satisfy customers and enhance the brand. Even if we are able to address all of the challenges discussed above, we have little experience in sales, service or assembly and our sales, service and assembly facilities in one or more markets may not adequately address customer service needs or be profitable and we may lose sales and our entire investment in such facilities, damaging our reputation in the process. If we are unable to establish the local order volume we require in order to open new sales, service and assembly facilities or are unable to successfully assemble, sell, and service our zero-emission electric and hybrid commercial vehicles adequately for customers and profitably operate these new facilities in our target markets, our business, prospects, financial condition and operating results may be adversely affected. If we do not adequately address our customers’ service needs, our brand and reputation will be adversely affected, which in turn could have a material and adverse impact on our business, financial condition, operating results and prospects.
| 35 |
We are subject to substantial regulation, which is evolving, and unfavorable changes or any failure by us to comply with these regulations could substantially harm our business and operating results.
Our commercial zero-emission electric and hybrid drivetrains, the sale of motor vehicles in general and the electronic components used in vehicles are subject to substantial regulation under international, federal, state and local laws. We may incur in the future increased costs in complying with these regulations. Regulations related to the EV industry and alternative and renewable energy currently are evolving and we face risks associated with changes to these regulations or new regulations. These risks include the following:
| · | Changes to the regulations governing the assembly, transportation and disposal of lithium-ion batteries; | |
| · | Revisions in motor carrier safety laws in the United States to further enhance motor vehicle safety generally and to ensure that EVs achieve levels of safety commensurate with other cars, trucks, and buses could increase the costs associated with the component parts and the manufacture, assembly, and conversion of our drivetrains; and | |
| · | Revisions in consumer protection laws to ensure that consumers are fully informed of the particular operational characteristics of vehicles could increase our costs associated with warning labels or other related customer information dissemination. |
To the extent the laws governing our business and vehicles change, some or all of our zero-emission drivetrains may not comply with applicable international, federal, state or local laws, and certain of the competitive advantages of our drivetrains may be reduced or eliminated, which could have an adverse effect on our business. Furthermore, compliance with changing regulations could be burdensome, time consuming, and expensive. To the extent compliance with changes in regulations or new regulations is cost prohibitive, our business, prospects, financial condition and operating results will be adversely affected.
Vehicle dealer and distribution laws could adversely affect our ability to sell our commercial zero-emission electric or hybrid vehicles.
Sales of our zero-emission electric and hybrid vehicles are subject to international, state and local vehicle dealer and distribution laws. To the extent such laws prevent us from selling our drivetrains to customers located in a particular jurisdiction or require us to retain a local dealer or distributor or establish and maintain a physical presence in a jurisdiction in order to sell drivetrains in that jurisdiction, our business, prospects, financial condition and operating results could be adversely affected. We intend to contract with vehicle dealers to sell our drivetrains but we have no assurance at this time that we will successfully contract with vehicle dealers and distributors to sell our drivetrains.
| 36 |
We may face risks associated with our international business.
We plan to develop our business internationally, including the pursuit of certain opportunities in China through our wholly-owned subsidiary, ADOMANI China. The sale and shipment of our products across international borders, as well as the purchase of components and products from international sources, would subject us to extensive United States, European Economic Area and other foreign governmental trade, import and export and customs regulations and laws. Compliance with these regulations and laws would be costly and may expose us to penalties for non-compliance. If we are successful in developing our international activities, we expect that such operations would be subject to a variety of risks, including:
| · | difficulties in staffing and managing foreign and geographically dispersed operations; | |
| · | having to comply with various United States and international laws, including export control laws and the U.S. Foreign Corrupt Practices Act of 1977 and anti-money laundering laws; | |
| · | differing regulatory requirements for obtaining clearances or approvals to market our products; | |
| · | changes in, or uncertainties relating to, foreign rules and regulations that may impact our ability to sell our products, perform services or repatriate profits to the United States; | |
| · | tariffs and trade barriers, export regulations and other regulatory and contractual limitations on our ability to sell our products in certain foreign markets; | |
| · | fluctuations in foreign currency exchange rates; | |
| · | imposition of limitations on or increase of withholding and other taxes on remittances and other payments by foreign subsidiaries or joint ventures; | |
| · | imposition of differing labor laws and standards; | |
| · | economic, political or social instability in foreign countries and regions; | |
| · | an inability, or reduced ability, to protect our intellectual property, including our patented zero-emission drivetrain design, including any effect of compulsory licensing imposed by government action; and | |
| · | availability of government subsidies or other incentives that benefit competitors in their local markets that are not available to us. |
While we plan to expand into other markets in the future, our expansion plans may not be realized, or if realized, may not be successful. We expect each market to have particular regulatory and funding hurdles to overcome and future developments in these markets, including the uncertainty relating to governmental policies and regulations, could harm our business. If we expend significant time and resources on expansion plans that fail or are delayed, our reputation, business and financial condition may be harmed.
We are subject to various environmental laws and regulations that could impose substantial costs upon us and cause delays in opening our sales, service and assembly facilities.
We and our operations may, once we begin production of our drivetrains through third party agreements, be subject to federal, state and/or local environmental laws and regulations, including laws relating to the use, handling, storage, transportation, disposal and human exposure to hazardous substances and wastes. Environmental and health and safety laws and regulations can be complex, and we expect that our business and operations may be affected by future amendments to such laws or other new environmental and health and safety laws which may require us to change our operations. These laws can give rise to liability for investigatory costs, administrative oversight costs, cleanup costs, property damage, bodily injury and fines and penalties. Capital and operating expenses needed to comply with environmental laws and regulations can be significant, and violations may result in substantial fines and penalties, third party damages, responsibilities to investigate and take corrective or remedial actions, suspension of production or a cessation of our operations.
| 37 |
Contamination at properties we might in the future own and operate, and properties to which hazardous substances and wastes have been and may be sent by us, may result in liability for us under environmental laws and regulations, including, but not limited to the Comprehensive Environmental Response, Compensation and Liability Act, which can impose liability for the full amount of remediation-related costs without regard to fault, for the investigation and cleanup of contaminated soil and ground water, for building contamination and impacts to human health and for damages to natural resources. The costs of complying with environmental laws and regulations and any claims concerning noncompliance, or liability with respect to contamination in the future, could have a material adverse effect on our financial condition or operating results. We may face unexpected delays in obtaining the necessary permits and approvals required by environmental laws and regulations in connection with any planned manufacturing or operational facilities that could require significant time and financial resources and delay our ability to operate these facilities, which would adversely impact our business prospects and operating results.
Any failure to protect our intellectual property rights could impair our ability to protect our proprietary technology.
Our success and ability to compete depend in part upon our intellectual property. We primarily rely on intellectual property laws, including trade secret, copyright, trademark and patent laws in the United States and abroad, and use contracts, confidentiality procedures, non-disclosure agreements, employee disclosure and invention assignment agreements and other contractual rights to protect our intellectual property. However, the steps we take to protect our intellectual property rights may be inadequate or we may be unable to secure intellectual property protection for all of our products and services.
If we are unable to protect our intellectual property, our competitors could use our intellectual property to market products, services or products and services similar to ours and our ability to compete effectively would be impaired. Moreover, others may independently develop technologies that are competitive to ours or infringe our intellectual property. Any of our intellectual property rights may be challenged by others or invalidated through administrative processes or litigation. The enforcement of our intellectual property rights depends on our legal actions against these infringers being successful, but e these actions may not be successful, even when our rights have been infringed. In addition, we might be required to spend significant resources to monitor and protect our intellectual property rights, and our efforts to enforce our intellectual property rights may be met with defenses, counterclaims and countersuits attacking the validity and enforceability of our intellectual property rights. Litigation to protect and enforce our intellectual property rights could be costly, time-consuming and distracting to management, whether or not it is resolved in our favor, and could ultimately result in the impairment or loss of portions of our intellectual property. Any patents issued in the future may not provide us with competitive advantages or may be successfully challenged by third parties.
Furthermore, legal standards relating to the validity, enforceability and scope of protection of intellectual property rights are uncertain. Effective protection of our intellectual property may not be available to us in every country in which our products and services are available. The laws of some foreign countries may not be as protective of intellectual property rights as those in the United States, and mechanisms for enforcement of intellectual property rights may be inadequate. Accordingly, despite our efforts, we may be unable to prevent third parties from infringing upon or misappropriating our intellectual property.
We could incur substantial costs as a result of any claim of infringement of another party’s intellectual property rights.
Companies, organizations or individuals, including our competitors, may hold or obtain patents, trademarks or other proprietary rights that could prevent, limit or interfere with our ability to produce, use, develop or sell our zero-emission electric or hybrid vehicles or components, which could make it more difficult for us to operate our business. Companies in our industry are increasingly bringing and becoming subject to suits alleging infringement of proprietary rights, particularly patent rights, and our competitors may hold patents or have pending patent applications, which could be related to our business. These risks have been amplified by the increase in third parties, or non-practicing entities, whose sole primary business is to assert such claims. We have not received in the past, but may receive in the future, notices that claim we or our customers using our products and services have misappropriated or misused other parties’ intellectual property rights. In those cases, we intend to investigate the validity of these claims and, if we believe these claims have merit, to respond through licensing or other appropriate actions. If we are sued by a third party that claims that our technology infringes its rights, the litigation could be expensive and could divert our management resources. We do not currently have an extensive patent portfolio of our own, which may limit the defenses available to us in any such litigation.
| 38 |
In addition, in many instances, we have agreed to indemnify our customers against certain claims that our products and services infringe the intellectual property rights of third parties. The results of any intellectual property litigation to which we might become a party, or for which we are required to provide indemnification, may require us to do one or more of the following:
| · | cease offering or using technologies or producing, using, developing or selling vehicles or conversions that incorporate the challenged intellectual property; | |
| · | make substantial payments for legal fees, settlement payments or other costs or damages; | |
| · | obtain a license, which may not be available on reasonable terms or at all, to sell or use the relevant technology; or | |
| · | redesign technology or vehicles that utilize our technology to avoid infringement. |
If we are required to make substantial payments or undertake any of the other actions noted above as a result of any intellectual property infringement claims against us or any obligation to indemnify our customers for such claims, such payments or costs could have a material adverse effect upon our business and financial results. Furthermore, our business could be adversely affected by any significant disputes between us and our customers as to the applicability or scope of our indemnification obligations to them.
In many of our zero-emission electric or hybrid drivetrains we use battery packs composed of lithium-ion battery cells, which, if not appropriately managed and controlled, on rare occasions have been observed to catch fire or vent smoke and flames. If any such events occur in our commercial EVs, we could face liability for damage or injury, adverse publicity and a potential safety recall.
The battery packs in our manufactured or converted vehicles will use lithium-ion cells, which have been used for years in laptop computers, cell phones and EVs. On rare occasions, if not appropriately managed and controlled, lithium-ion cells can rapidly release the energy they contain by venting smoke and flames in a manner that can ignite nearby materials as well as other lithium-ion cells. Highly publicized incidents of laptop computers, cell phones, and Tesla, Inc.’s EVs bursting into flames have focused consumer attention on the safety of these cells. More recently, a limited number of side-impact tests carried out by NHTSA on non-commercial passenger vehicles containing lithium-ion batteries and thermal management systems containing liquid coolant have resulted in post-collision fires under certain conditions. Any failure of a competitor’s EV may cause indirect adverse publicity for us and our EVs. These events have raised questions about the suitability of lithium-ion cells for automotive applications. A field failure of our battery packs may occur, particularly if one of our manufactured or converted vehicles is involved in a collision, which could damage the vehicle or lead to personal injury or death and may subject us to lawsuits, product recalls, or redesign efforts, all of which would be time consuming and expensive. Furthermore, there is some risk of electrocution if individuals who attempt to repair battery packs on our manufactured or converted vehicles do not follow applicable maintenance and repair protocols. Any such damage or injury would likely lead to adverse publicity and potentially a safety recall. Any such adverse publicity or negative public perceptions regarding the suitability of lithium-ion cells for automotive applications or any future incident involving lithium-ion cells such as a vehicle or other fire, even if such incident does not involve vehicles that utilize our technology, could seriously harm our business, prospects, financial condition and operating results.
Unfavorable conditions in the global economy, rising interest rates and capital market liquidity issues could limit our ability to grow our business and negatively affect our operating results.
| 39 |
Revenue growth and potential profitability of our business depends on the level of demand in the markets we serve. To the extent that weak economic conditions cause our customers and potential customers to freeze or reduce their capital expenditure or operational budgets, particularly those for zero-emission electric or hybrid vehicles, demand for our products and services may be negatively affected. Historically, economic downturns have resulted in overall reductions in these budgets and corresponding spending. If economic conditions deteriorate or do not materially improve, our customers and potential customers may elect to decrease their operational budgets or defer or reconsider product and service purchases, which would limit our ability to grow our business and negatively affect our operating results.
Our business depends on our founders and management team, retaining and attracting qualified management, key employees and technical personnel and expanding our sales and marketing capabilities.
Our success depends upon the continued service of Mr. Reynolds, our Chairman, CEO and President, as well as other members of our senior management team. It also depends on our ability to continue to attract and retain additional highly qualified management, technical, engineering, operating and sales and marketing personnel. We do not currently maintain key person life insurance policies on any of our employees. While we have employment contracts with Mr. Reynolds and Mr. Menerey, our Chief Financial Officer, we do not have fixed term employment agreements with any of our other management employees, all who could terminate their relationship with us at any time. Our business also requires skilled technical, engineering, product and sales personnel, who are in high demand and are difficult to recruit and retain. As we continue to innovate and develop our products and services and develop our business, we will require personnel with expertise in these areas. There is increasing competition, especially in California, for talented individuals such as design engineers, manufacturing engineers, and other skilled employees with specialized knowledge of EVs, zero-emission electric and hybrid drivetrains and conversions. This competition affects both our ability to retain key employees and hire new ones. Key talent may leave us due to various factors, such as a very competitive labor market for talented individuals with automotive or transportation experience. Our success depends upon our ability to hire new employees in a timely manner and retain current employees. Additionally, we compete with both mature and prosperous companies that have far greater financial resources than we do and start-ups and emerging companies that promise short-term growth opportunities. The loss of Mr. Reynolds, Mr. Menerey or any other member of our senior management team, or an inability to attract, retain and motivate additional highly skilled employees required for the planned development and expansion of our business, could delay or prevent the achievement of our business objectives and could materially harm our business.
The forecasts of market growth may prove to be inaccurate, and even if the markets in which we compete achieve the forecasted growth, our business may not grow at similar rates, if at all.
Growth forecasts are subject to significant uncertainty and are based on assumptions and estimates, which may not prove to be accurate. Forecasts relating to the expected growth in zero-emission electric and hybrid vehicles, electric and hybrid drivetrains and conversions and other markets may prove to be inaccurate. Even if these markets experience the forecasted growth, we may not grow our business at similar rates, or at all. Our growth is subject to many factors, including our success in implementing our business strategy, which is subject to many risks and uncertainties.
We will require additional capital to support business growth, and this capital might not be available on acceptable terms, if at all.
We need sufficient capital to fund our ongoing operations and continue our development. We intend to continue to make investments to support our business growth and will require additional funds to respond to business challenges, such as keeping pace with technological developments in order to remain competitive in our evolving industry, improve our operating infrastructure or acquire complementary businesses and technologies. While we believe that our existing cash and cash equivalents, including the net proceeds from our equity offerings in June 2017 and January 2018, respectively, will be sufficient to fund our operations at least through April 2019, we will need to engage in additional equity or debt financings to secure additional funds. We do not expect to be able to satisfy our cash requirements solely through product sales in the near future, therefore we expect to rely on the net proceeds from our previous offering and this offering to fund our operations. If we raise additional funds through further issuances of equity or convertible debt securities, our existing stockholders could suffer significant dilution, and any new equity securities we issue could have rights, preferences and privileges superior to those of holders of our common stock. Any debt financing secured by us in the future could involve restrictive covenants relating to our capital raising activities and other financial and operational matters, which may make it more difficult for us to obtain additional capital and to pursue business opportunities, including potential acquisitions. In addition, we may not be able to obtain additional financing on terms favorable to us, if at all. If we are unable to obtain adequate financing or financing on terms satisfactory to us, when and if we require it, our ability to continue to support our business growth, and to respond to business challenges could be significantly impaired.
| 40 |
We may selectively pursue acquisitions of complementary businesses and technologies, which could divert capital and our management’s attention, result in additional dilution to our stockholders and otherwise disrupt our operations and adversely affect our operating results.
We may selectively pursue acquisitions of complementary businesses and technologies that we believe could complement or expand our applications, enhance our technical capabilities or otherwise offer growth opportunities. The pursuit of potential acquisitions may divert the attention of management and cause us to incur various expenses in identifying, investigating and pursuing suitable acquisitions, whether or not they are consummated.
In addition, we have limited experience with acquiring other businesses or technologies. If we acquire businesses or technologies, we may not be able to integrate the acquired personnel, operations and technologies successfully, or effectively manage the combined business following the acquisition. We also may not achieve the anticipated benefits from the acquired business due to a number of factors, including:
| · | inability to integrate or benefit from acquired technologies or services in a profitable manner; | |
| · | unanticipated costs or liabilities associated with the acquisition; | |
| · | incurrence of acquisition-related costs; | |
| · | difficulty integrating the accounting systems, operations and personnel of the acquired business; | |
| · | difficulties and additional expenses associated with supporting legacy products and hosting infrastructure of the acquired business; | |
| · | difficulty converting the customers of the acquired business onto our applications and contract terms, including disparities in the revenue, licensing, support or professional services model of the acquired company; | |
| · | diversion of management’s attention from other business concerns; | |
| · | adverse effects to our existing business relationships with business partners and customers as a result of the acquisition; | |
| · | the potential loss of key employees; and | |
| · | use of resources that are needed in other parts of our business; and use of substantial portions of our available cash to consummate the acquisition. |
In addition, a significant portion of the purchase price of companies we acquire may be allocated to acquired goodwill and other intangible assets, which must be assessed for impairment at least annually. In the future, if our acquisitions do not yield expected returns, we may be required to take charges to our operating results based on this impairment assessment process, which could adversely affect our results of operations.
Acquisitions could also result in dilutive issuances of equity securities or the incurrence of debt, which could adversely affect our operating results. We may also unknowingly inherit liabilities from acquired businesses or assets that arise after the acquisition and that are not adequately covered by indemnities. In addition, if an acquired business fails to meet our expectations, our operating results, business and financial position may suffer.
| 41 |
If we are unable to implement and maintain effective internal control over financial reporting and effective disclosure controls and procedures, investors may lose confidence in the accuracy and completeness of our financial reports and the market price of our common stock may be negatively affected.
As a public company, we will not be required to comply with the requirements to assess and report on internal control over financial reporting until the filing of our annual report for the year ending December 31, 2018. Section 404 of the Sarbanes-Oxley Act of 2002 (Sarbanes-Oxley Act), requires that we evaluate and determine the effectiveness of our internal control over financial reporting and, beginning with our annual report for the fiscal year ending December 31, 2018, provide a management report on the internal control over financial reporting. Once we are no longer either an “emerging growth company” or a smaller reporting company, such report must be attested to by our independent registered public accounting firm. The Sarbanes-Oxley Act also requires that our principal executive officer and principal financial officer conclude as to the effectiveness of our disclosure controls and procedures on a quarterly basis. As of December 31, 2017, our chief executive officer and chief financial officer concluded that our disclosure controls and procedures were effective. Due to our size, we rely heavily on key management for day-to-day operations and internal controls, and our size and correspondingly limited resources give rise to additional internal control weaknesses, including our disclosure controls.
If we fail to detect errors on a timely basis, our financial statements may be materially misstated and if we are unable to comply with the requirements of Section 404 of the Sarbanes Oxley Act, or if our independent registered public accounting firm is unable to express an opinion as to the effectiveness of our internal control over financial reporting, if and when required, investors may lose confidence in the accuracy and completeness of our financial reports and the market price of our common stock could be negatively affected, and we could become subject to investigations by the stock exchange on which our securities are listed, the SEC, or other regulatory authorities, which could require additional financial and management resources.
We are an emerging growth company and the reduced disclosure requirements applicable to emerging growth companies may make our common stock less attractive to investors.
For as long as we continue to be an emerging growth company, we intend to take advantage of certain exemptions from various reporting requirements that are applicable to other public companies including, but not limited to, reduced disclosure obligations regarding executive compensation in our periodic reports and proxy statements, and exemptions from the requirements of holding a nonbinding advisory vote on executive compensation and stockholder approval of any golden parachute payments not previously approved. Investors may find our common stock less attractive because we will rely on these exemptions. If some investors find our common stock less attractive as a result, there may be a less active trading market for our common stock and our stock price may be more volatile.
We will remain an emerging growth company until the earliest of (i) the date on which we are deemed to be a “large accelerated filer,” (ii) the end of the fiscal year in which we have total annual gross revenue of $1.07 billion or more during such fiscal year, (iii) the date on which we issue more than $1 billion in non-convertible debt in a three-year period or (iv) the end of the fiscal year in which the fifth anniversary of our initial public offering occurs.
We may not be able to utilize a significant portion of our net operating loss or research and development tax credit carryforwards, which could adversely affect our profitability.
As of December 31, 2017, we had federal and state net operating loss carryforwards due to prior period losses, which if not utilized will begin to expire from 2032 through 2036 for federal and state purposes, respectively. These net operating loss carryforwards could expire unused and be unavailable to offset future income tax liabilities, which could adversely affect our profitability.
In addition, under Section 382 of the Internal Revenue Code of 1986, as amended, our ability to utilize net operating loss carryforwards or other tax attributes in any taxable year may be limited if we experience an “ownership change.” A Section 382 “ownership change” generally occurs if one or more stockholders or groups of stockholders who own at least 5% of our stock increase their ownership by more than 50 percentage points over their lowest ownership percentage within a rolling three-year period. Similar rules may apply under state tax laws.
| 42 |
Future issuances of our stock could cause an “ownership change.” It is possible that any future ownership change could have a material effect on the use of our net operating loss carryforwards or other tax attributes, which could adversely affect our profitability.
Our reported financial results may be adversely affected by changes in accounting principles generally accepted in the United States.
Generally accepted accounting principles in the United States are subject to interpretation by the Financial Accounting Standards Board, the SEC, and various bodies formed to promulgate and interpret appropriate accounting principles. A change in these principles or interpretations could have a significant effect on our reported financial results, and could affect the reporting of transactions completed before the announcement of a change.
Risks Related to the Ownership of Our Securities
The price of our common stock is and is likely to continue to be volatile and fluctuate substantially, which could result in substantial losses for our stockholders and may prevent you from reselling your shares at or above the price you paid for your shares.
The market price of our common stock is and is likely to remain volatile and may fluctuate significantly in response to numerous factors, many of which are beyond our control, including:
| · | overall performance of the equity markets; | |
| · | the development and sustainability of an active trading market for our common stock; | |
| · | our operating performance and the performance of other similar companies; | |
| · | changes in the estimates of our operating results that we provide to the public, our failure to meet these projections or changes in recommendations by securities analysts that elect to follow our common stock; | |
| · | press releases or other public announcements by us or others, including our filings with the SEC; | |
| · | changes in the market perception of all-electric and hybrid products and services generally or in the effectiveness of our products and services in particular; | |
| · | announcements of technological innovations, new applications, features, functionality or enhancements to products, services or products and services by us or by our competitors; | |
| · | announcements of acquisitions, strategic alliances or significant agreements by us or by our competitors; | |
| · | announcements of customer additions and customer cancellations or delays in customer purchases; | |
| · | announcements regarding litigation involving us; | |
| · | recruitment or departure of key personnel; | |
| · | changes in our capital structure, such as future issuances of debt or equity securities; | |
| · | our entry into new markets; | |
| · | regulatory developments in the United States or foreign countries; | |
| · | the economy as a whole, market conditions in our industry, and the industries of our customers; | |
| · | the expiration of market standoff or contractual lock-up agreements; | |
| 43 |
| · | the size of our market float; and | |
| · | any other factors discussed in this report. |
The market price and volume of our common stock could fluctuate, and in the past has fluctuated, relative to our limited public float. We are particularly subject to fluctuations—as reported on the Nasdaq Capital Market (Nasdaq) during the year ended December 31, 2017, our stock price reached highs of $18.31 and lows of $2.35, with daily trade volumes reaching a high of 2,694,000 and a low of 18,000. In addition, the stock markets have experienced extreme price and volume fluctuations that have affected and continue to affect the market prices of equity securities of many technology companies. Stock prices of many technology companies have fluctuated in a manner unrelated or disproportionate to the operating performance of those companies.
In the past, stockholders have filed securities class action litigation following periods of market volatility. We could in the future be the target of similar litigation. If we were to become involved in securities litigation, it could subject us to substantial costs, divert resources and the attention of management from our business, and adversely affect our business, results of operations and financial condition.
We will incur increased costs and demands upon management as a result of complying with the laws and regulations affecting public companies, which could adversely affect our operating results.
As a newly public company, and particularly after we are no longer an emerging growth company, we are incurring and will continue to incur significant legal, accounting and other expenses that we did not incur as a private company, including costs associated with public company reporting and corporate governance requirements. The Sarbanes-Oxley Act, the Dodd-Frank Wall Street Reform and Consumer Protection Act, the listing requirements of Nasdaq and other applicable securities rules and regulations impose various requirements on public companies, including establishment and maintenance of effective disclosure and financial controls and corporate governance practices. Our management and other personnel will have to adapt to the requirements of being a public company and will need to devote a substantial amount of time to these compliance initiatives. Moreover, these rules and regulations will increase our legal and financial compliance costs and will make some activities more time-consuming and costly. For example, we expect that these rules and regulations may make it more difficult and more expensive for us to obtain director and officer liability insurance, and we may be required to accept reduced policy limits and coverage or incur substantially higher costs to obtain the same or similar coverage. As a result, it may be more difficult for us to attract and retain qualified individuals to serve on our board of directors or as our executive officers.
The increased costs associated with operating as a public company will decrease our net income or increase our net loss, and may require us to reduce costs in other areas of our business or increase the prices of our products or services. Additionally, if these requirements divert our management’s attention from other business concerns, they could have a material adverse effect on our business, prospects, financial condition and operating results.
Nasdaq may delist our common stock from trading on its exchange, which could limit stockholders’ ability to trade our common stock.
As a listed company on Nasdaq, we are required to meet certain financial, public float, bid price and liquidity standards on an ongoing basis in order to continue the listing of our common stock. If we fail to meet these continued listing requirements, our common stock may be subject to delisting. If our common stock is delisted and we are not able to list our common stock on another national securities exchange, we expect our securities would be quoted on an over-the-counter market. If this were to occur, our stockholders could face significant material adverse consequences, including limited availability of market quotations for our common stock and reduced liquidity for the trading of our securities. In addition, we could experience a decreased ability to issue additional securities and obtain additional financing in the future.
If securities or industry analysts do not publish research or publish inaccurate or unfavorable research about our business, our stock price and trading volume could decline.
| 44 |
The trading market for our common stock will depend in part on the research and reports that securities or industry analysts publish about us or our business. If few securities analysts commence coverage of us, or if industry analysts cease coverage of us, the trading price for our common stock would be negatively affected. If one or more of the analysts who cover us downgrade our common stock or publish inaccurate or unfavorable research about our business, our common stock price would likely decline. If one or more of these analysts cease coverage of us or fail to publish reports on us regularly, demand for our common stock could decrease, which might cause our common stock price and trading volume to decline.
We may fail to meet our publicly announced guidance or other expectations about our business, which would cause our stock price to decline.
We may provide guidance regarding our expected financial and business performance, such as projections regarding sales and production, as well as anticipated future revenues, gross margins, profitability and cash flows. Correctly identifying key factors affecting business conditions and predicting future events is inherently an uncertain process and our guidance may not ultimately be accurate. Our guidance is based on certain assumptions such as those relating to anticipated production and sales volumes and average sales prices, supplier and commodity costs, and planned cost reductions. If our guidance is not accurate or varies from actual results due to our inability to meet our assumptions or the impact on our financial performance that could occur as a result of various risks and uncertainties, the market value of our common stock could decline significantly.
A significant portion of our total outstanding shares are eligible to be sold into the market in the near future, which could cause the market price of our common stock to drop significantly, even if our business is doing well.
Sales of a substantial number of shares of our common stock in the public market, or the perception in the market that the holders of a large number of shares intend to sell shares, could reduce the market price of our common stock. Other than the shares of common stock issued and sold in connection with our offerings of common stock in June 2017 and January 2018, substantially all of the remaining shares of common stock outstanding, based on shares outstanding as of March 7, 2018, will be restricted as a result of securities laws, lock-up agreements or other contractual restrictions that restrict transfers through June 15, 2018, subject to certain leak-out periods and exceptions.
We may release all or some portion of the shares subject to lock-up agreements prior to expiration of the lock-up period. Shares held by directors, executive officers and other affiliates will be subject to volume limitations under Rule 144 under the Securities Act and various vesting agreements, after the aforementioned lock-up and leak-out periods.
Furthermore, our equity incentive plan allows us to issue stock options. We intend to register all shares of common stock that we may issue under our equity compensation plans so that such shares may be freely sold in the public market upon issuance, subject to volume limitations applicable to affiliates and the lock-up agreements executed in connection with our offering of common stock in June 2017. Moreover, we may in the future create additional equity incentive plans, which may at that time require us to file a registration statement under the Securities Act as soon as practicable after the expiration of the lock-up period to cover the issuance of shares upon the exercise or vesting of awards granted or otherwise purchased under those plans. As a result, any shares issued or granted under the plans after the lock-up period has expired also may be freely tradable in the public market. If equity securities are issued under the plans, if implemented, and it is perceived that they will be sold in the public market, then the price of our common stock could decline substantially.
No holders of any shares of our common stock have rights to require us to file registration statements for the public resale of such shares.
The concentration of our common stock ownership with our executive officers, directors and affiliates will limit your ability to influence corporate matters.
Our executive officers, directors and owners of 5% or more of our outstanding common stock and their respective affiliates beneficially owned, in the aggregate 39.9% of our outstanding common stock as of March 7, 2018. This percentage includes both outstanding shares of common stock and stock options that are vested and exercisable as of that date. These stockholders will therefore have significant influence over management and affairs and over all matters requiring stockholder approval, including the election of directors and significant corporate transactions, such as a merger or other sale of our company or its assets, for the foreseeable future. This concentrated control will limit our stockholders’ ability to influence corporate matters and, as a result, we may take actions that our stockholders do not view as beneficial. This ownership could affect the value of our common stock.
| 45 |
We do not intend to pay dividends for the foreseeable future.
We have never declared nor paid cash dividends on our capital stock. We currently intend to retain any future earnings to finance the operation and expansion of our business, and we do not expect to declare or pay any dividends in the foreseeable future. Consequently, stockholders must rely on sales of their common stock after price appreciation, which may never occur, as the only way to realize any future gains on their investment.
Provisions in our charter documents and under Delaware law could discourage a takeover that stockholders may consider favorable.
Provisions in our certificate of incorporation and bylaws may have the effect of delaying or preventing a change of control or changes in our management. These provisions include the following:
| · | authorize the issuance of “blank check” preferred stock that could be issued by our board of directors to defend against a takeover attempt; | |
| · | establish a classified board of directors, as a result of which the successors to the directors whose terms have expired will be elected to serve from the time of election and qualification until the third annual meeting following their election; | |
| · | require that directors only be removed from office for cause and only upon a supermajority stockholder vote; | |
| · | provide that vacancies on the board of directors, including newly created directorships, may be filled only by a majority vote of directors then in office rather than by stockholders; | |
| · | prevent stockholders from calling special meetings; and | |
| · | prohibit stockholder action by written consent, requiring all actions to be taken at a meeting of the stockholders. |
In addition, we are governed by the provisions of Section 203 of the Delaware General Corporation Law, which generally prohibits a Delaware corporation from engaging in a broad range of business combinations with any “interested” stockholder for a period of three years following the date on which the stockholder becomes an “interested” stockholder.
| Item 1B. | Unresolved Staff Comments |
Not applicable.
| Item 2. | PROPERTIES |
We maintain our principal office in Corona, California and additional office and storage space in Los Altos, Pomona, Santa Ana and Stockton, California, as well as Phoenix, Arizona, under a combination of leases and subleases that are month-to-month or expire in February 2023. We believe that our facilities are adequate to meet our needs for the immediate future, and that, should it be needed, we will be able to secure additional space to accommodate any such expansion of our operations.
| 46 |
| Item 3. | LEGAL PROCEEDINGS |
We are not currently a party to any legal proceedings, litigation, or claims that could materially affect our business, results of operations, cash flows, or financial position. We may, from time to time, be party to litigation and subject to claims incident to the ordinary course of business. As our growth continues, we may become party to an increasing number of litigation matters and claims. The outcome of litigation and claims cannot be predicted with certainty, and the resolution of any future matters could materially affect our future results of operations, cash flows or financial position.
| Item 4. | MINE SAFETY DISCLOSURES |
Not applicable.
| 47 |
Part II
| Item 5. | Market for Registrant’s Common Equity, Related Stockholder Matters and Issuer Purchases of Equity Securities |
Market Information
On June 15, 2017, our common stock began trading on the Nasdaq under the symbol “ADOM”. The following table sets forth the high and low sale prices for our common stock for the periods presented.
| Period | High ($) | Low ($) | ||||||
| Fiscal Year Ended December 31, 2017 | ||||||||
| Second Quarter (from June 15, 2017 through June 30, 2017) | 17.30 | 6.53 | ||||||
| Third Quarter | 18.31 | 6.11 | ||||||
| Fourth Quarter | 7.20 | 2.35 | ||||||
Prior to June 15, 2017, there was no established public trading market for our securities.
Holders
As of March 7, 2018, we had approximately 261 record holders of our common stock. The actual number of stockholders is greater than this number of record holders and includes stockholders who are beneficial owners but whose shares are held in street name by brokers and other nominees. The number of holders of record also does not include stockholders whose shares may be held in trust by other entities.
Dividend Policy
We have never declared or paid any dividends on our common stock and do not anticipate that we will pay any dividends to holders of our common stock in the foreseeable future. Instead, we currently plan to retain any earnings to finance the growth of our business. Any future determination relating to dividend policy will be made at the discretion of our board of directors and will depend on our financial condition, results of operations and capital requirements as well as other factors deemed relevant by our board of directors.
Securities Authorized for Issuance under Equity Compensation Plans
The information required hereunder is incorporated herein by reference to either a definitive proxy statement or an amendment to this Annual Report on Form 10-K to be filed within 120 days of December 31, 2017.
Recent Sales of Unregistered Securities
Set forth below is information regarding securities sold and issued by us during the year ended December 31, 2017 that were not registered under the Securities Act, as well as the consideration received by us for such securities and information relating to the section of the Securities Act, or rule of the SEC, under which exemption from registration was claimed.
| (1) | On January 30, 2017, we issued 6,771,762 shares of our common stock to 23 accredited investors upon conversion by such investors of outstanding principal, plus accrued interest, under convertible secured promissory notes issued during 2013, 2014, 2015 and 2016 at a conversion price of $0.10 per share. |
| (2) | On January 30, 2017, we issued 96,816 shares of our common stock to two accredited investors upon conversion by such investors of outstanding principal, plus accrued interest, under convertible secured promissory notes issued during 2014 at a conversion price of $0.50 per share. |
| 48 |
No underwriters were involved in the foregoing sales of securities. The securities described in (1) and (2) were issued to investors in reliance upon the exemption from the registration requirements of the Securities Act, as set forth in Section 3(a)(9) and/or Section 4(a)(2) under the Securities Act and Regulation D promulgated thereunder relative to transactions by an issuer not involving any public offering, to the extent an exemption from such registration was required. All purchasers described above represented to us in connection with their purchase that they were accredited investors and were acquiring the shares for their own account for investment purposes only and not with a view to, or for sale in connection with, any distribution thereof and that they could bear the risks of the investment and could hold the securities for an indefinite period of time. The purchasers received written disclosures that the securities had not been registered under the Securities Act and that any resale must be made pursuant to a registration statement or an available exemption from such registration. We did not engage in any general solicitation or advertising in connection with the foregoing issuances.
All of the foregoing securities are deemed restricted securities for purposes of the Securities Act. All certificates representing the issued shares of capital stock described here included appropriate legends setting forth that the securities had not been registered and the applicable restrictions on transfer.
Use of Proceeds from Registered Securities
On April 25, 2017, our Offering Statement on Form 1-A (File No. 024-10656) was declared qualified by the SEC for our public offering of common stock under Regulation A of the Securities Act, pursuant to which we sold an aggregate of 2,510,002 shares of our common stock at a public offering price of $5.00 per share. There has been no material change in the planned use of proceeds from our public offering as described in our Offering Statement on Form 1-A (File No. 024-10656) filed with the SEC.
Repurchases of Equity Securities
We did not purchase any of our equity securities during the period covered by this Annual Report.
Performance Graph
The following graph reflects the total cumulative return on our common stock as compared to the NASDAQ Composite Index and a composite index of peer stocks for the period beginning on June 15, 2017 (the date our common stock began trading on the Nasdaq) and ending on December 31, 2017. Total cumulative return assumes $100 invested at the beginning of the period in our common stock, the stocks represented by the NASDAQ Composite Index and the composite index of a Peer Group of companies, respectively. Total return assumes reinvestment of dividends. Because no published index of comparable companies is currently available, we have used a peer group of companies for the purposes of this graph in accordance with the requirements of the SEC. The Peer Group is made up of UQM Technologies, Inc., Plug Power, Inc., Blue Bird Corporation, Allison Transmission Holdings, Inc., Enova International, Inc., REV Group, Inc., and Workhorse Group, Inc. Not all of the companies included in the Peer Group engage in all the lines of business in which we are engaged, and some of the companies are engaged in lines of business in which we do not participate. Additionally, the market capitalization of some of the companies included in the Peer Group are different from ours.
| 49 |
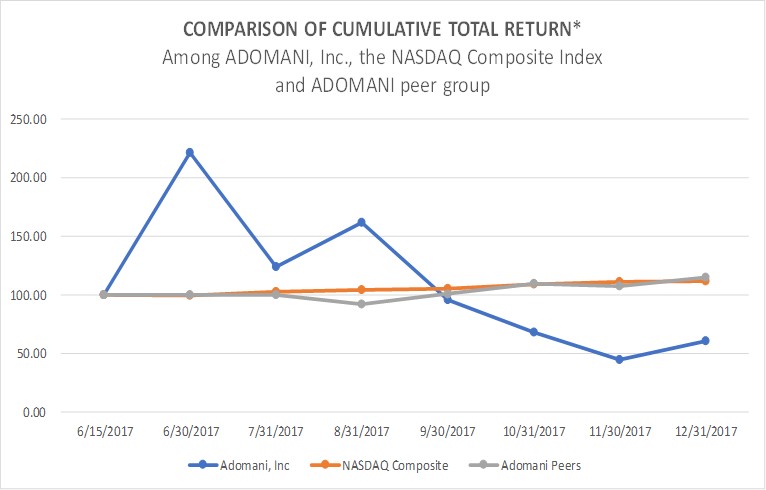
*Note: Stock price performance shown in the Performance Graph for our common stock is historical and not necessarily indicative of future price performance.
The material in this performance graph shall not be considered “soliciting material” and shall not be deemed “filed” for purposes of Section 18 of the Securities Exchange Act of 1934, as amended (Exchange Act), or otherwise subject to the liabilities of that section, nor shall it be deemed incorporated by reference in any filing of ADOMANI under the Securities Act, or the Exchange Act, whether made on, before or after the date hereof and irrespective of any general incorporation language in such filing.
| Item 6. | Selected Financial Data |
The following table sets forth our selected consolidated financial data. The consolidated statement of operations data for the years ended December 31, 2017, 2016, and 2015, and the selected consolidated balance sheet data as of December 31, 2017 and 2016 are derived from our audited consolidated financial statements and related notes included elsewhere in this Annual Report. Our historical results are not necessarily indicative of the results to be expected in any future period. You should read the following selected consolidated financial data in conjunction with “Management’s Discussion and Analysis of Financial Condition and Results of Operations” and our consolidated financial statements and the related notes appearing elsewhere in this Annual Report.
| 50 |
| Year Ended December 31, | ||||||||||||
| 2017 | 2016 | 2015 | ||||||||||
| (in thousands, except per share data) | ||||||||||||
| Consolidated Statement of Operations: | ||||||||||||
| Gross profit (loss) | $ | (54 | ) | $ | 18 | $ | - | |||||
| Loss from operations | $ | (21,598 | ) | $ | (9,534 | ) | $ | (5,317 | ) | |||
| Net loss | $ | (21,903 | ) | $ | (10,685 | ) | $ | (6,035 | ) | |||
| Net loss per share to common shareholders: | ||||||||||||
| Basic and diluted | $ | (0.33 | ) | $ | (0.16 | ) | $ | (0.07 | ) | |||
| Weighted shares used in the computation of net loss per share: | ||||||||||||
| Basic and diluted | 66,537,525 | 66,585,580 | 82,611,477 | |||||||||
| December 31, | ||||||||
| 2017 | 2016 | |||||||
| (in thousands) | ||||||||
| Consolidated Balance Sheet: | ||||||||
| Current assets | $ | 4,449 | $ | 2,745 | ||||
| Working capital | $ | 1,756 | $ | (3,368 | ) | |||
| Total assets | $ | 5,322 | $ | 3,406 | ||||
| Total liabilities | $ | 2,982 | $ | 6,113 | ||||
| Total stockholders' equity (deficit) | $ | 2,340 | $ | (2,707 | ) | |||
(1) See Note 2 of the notes to our consolidated financial statements included in Item 8 “Financial Statements and Supplementary Data” for a description of how we compute basic and diluted net loss per share attributable to common shareholders.
| Item 7. | Management’s Discussion and Analysis of Financial Condition and Results of Operations |
The following discussion should be read in conjunction with our financial statements and related notes included in Part IV of this Annual Report. This discussion contains forward-looking statements that reflect our plans, estimates, beliefs and expectations that involve risks and uncertainties. Our actual results could differ materially from those anticipated in these forward-looking statements as a result of various factors including, but not limited to, those discussed in Item 1 (Business) and Item 1A (Risk Factors) of Part I of this Annual Report.
Overview
We are a provider of advanced zero-emission electric and hybrid vehicles and replacement drivetrains that is focused on reducing the total cost of vehicle ownership. Our drivetrain systems are designed to help fleet operators unlock the benefits of green technology and address the challenges of traditional fuel price cost instability and local, state and federal environmental regulatory compliance.
We design and cause to be designed advanced zero-emission electric and hybrid drivetrain systems for integration in new school buses and medium to heavy-duty commercial fleet vehicles. We also design and cause to be designed patented conversion kits to replace conventional drivetrain systems for combustion powered vehicles with zero-emission electric or hybrid drivetrain systems. The hybrid drivetrain systems are available in both an assistive hybrid format and a full-traction format for use in private and commercial fleet vehicles of all sizes. We seek to expand our product offerings to include the sale of zero-emission systems in vehicles manufactured by outside OEM partners, but to be marketed, sold, warrantied and serviced through our developing distribution and service network.
Our drivetrain systems can be built with options for remote monitoring, electric power-export and various levels of grid-connectivity. Our zero-emission systems may also grow to include automated charging infrastructure and “intelligent” stationary energy storage that enables fast vehicle charging, emergency back-up facility power, and access to the developing, grid-connected opportunities for the aggregate power available from groups of large battery packs.
| 51 |
We generated virtually no revenue from inception through December 31, 2016, and generated $425,000 in 2017. For the years ended December 31, 2017, 2016, and 2015, our net losses were $21.9 million, $10.7 million, and $6 million, respectively.
Factors Affecting Our Performance
We believe that the growth and future success of our business depend on various opportunities, challenges and other factors, including the following.
New Customers. We are competing with other companies and technologies to help fleet managers and their districts/companies more efficiently and cost-effectively manage their fleet operations. Once these fleet managers have decided they want to buy from us, we still face challenges helping them obtain financing options to reduce the cost barriers to purchasing. We may also encounter customers with inadequate electrical services at their facilities that may delay their ability to purchase from us.
Investment in Growth. We plan to continue to invest for long-term growth. We anticipate that our operating expenses will increase in the foreseeable future as we invest in research and development to enhance our zero-emission systems; design, develop and manufacture our drivetrains and their components; increase our sales and marketing to acquire new customers; and increase our general and administrative functions to support our growing operations. We believe that these investments will contribute to our long-term growth, although they will adversely affect our results of operations in the near term. In addition, the timing of these investments can result in fluctuations in our annual and quarterly operating results.
Zero-emission electric and hybrid drivetrain experience. Our dealer and service network is not currently established, although we do have certain agreements in place. One issue they may have, and we may encounter, is finding appropriately trained technicians with zero-emission electric and hybrid drivetrain experience. Our performance will depend on having a robust dealer and service network, which will require appropriately trained technicians to be successful. Because vehicles that utilize our technology are based on a different technology platform than traditional internal combustion engines, individuals with sufficient training in zero-emission electric and hybrid vehicles may not be available to hire, and we may need to expend significant time and expense training the employees we do hire. If we are not able to attract, assimilate, train or retain additional highly qualified personnel in the future, or do so cost-effectively, our performance would be significantly and adversely affected.
Market Growth. We believe the market for all-electric and hybrid solutions for alternative fuel technology, specifically all-electric and hybrid vehicles will continue to grow as more purchases of new zero-emission vehicles and as more conversions of existing fleet vehicles to zero-emission vehicles are made. However, unless the costs to produce such vehicles decrease dramatically, purchases of our products will continue to depend in large part on financing subsidies from government agencies. We cannot be assured of the continued availability or the amounts of such assistance to our customers.
Revenue Growth from Additional Products. We seek to add to our product offerings additional zero-emission vehicles of all sizes manufactured by outside OEM partners, to be marketed, sold, warrantied and serviced through our developing distribution and service network, as well as add other ancillary products discussed elsewhere in this report.
Revenue Growth from Additional Geographic Markets. We believe that growth opportunities for our products exist internationally in addition to domestically, and through our wholly-owned subsidiary ADOMANI China, we will be pursuing international growth as well. Our future performance will depend in part upon the growth of these additional markets. Accordingly, our business and operating results will be significantly affected by our ability to timely enter and effectively address these emerging markets and the speed with which and extent to which demand for our products in these markets grows.
| 52 |
Components of Our Results of Operations
Sales
Sales are recognized from the sales of advanced zero-emission electric and hybrid drivetrain systems for fleet vehicles and from the sale of new, purpose-built zero-emission electric or hybrid vehicles. Sales are recognized when (i) persuasive evidence of an arrangement exists, (ii) delivery has occurred and title has passed, (iii) the price is fixed or determinable and (iv) collectability is reasonably assured.
Cost of Sales
Cost of sales includes those costs related to the development, manufacture, and distribution of our products. Specifically, we include in cost of sales each of the following: material costs (including commodity costs); freight costs; labor and other costs related to the development and manufacture of our products; and other associated costs.
Selling, General and Administrative Expenses
Selling, general and administrative expenses include all corporate and administrative functions that support our company. These expenses also include stock-based compensation expense; warranty expense, including product recall and customer satisfaction program costs; consulting costs; and other costs that cannot be included in cost of sales.
Consulting and Research and Development Expenses
These expenses are related to our consulting and research and development activity.
Other Income/Expenses, Net
Other income/expenses include non-operating income and expenses, including interest expense.
Provision for Income Taxes
We account for income taxes in accordance with FASB ASC 740 “Income Taxes,” which requires the recognition of deferred income tax assets and liabilities for the future tax consequences attributable to differences between the financial statements carrying amounts of existing assets and liabilities and their respective tax bases. Deferred tax assets and liabilities are measured using enacted tax rates expected to apply to taxable income in the years in which those temporary differences are expected to be recovered or settled. Under FASB ASC 740, the effect on deferred tax assets and liabilities of a change in tax rates is recognized in income in the period the enactment occurs. A valuation allowance is provided for certain deferred tax assets if it is more likely than not that we will not realize tax assets through future operations. Because we have incurred only losses to this point, no provision for income taxes has been made.
Results of Operations
Comparison of the Years Ended December 31, 2017 and 2016
| 53 |
ADOMANI, INC. AND SUBSIDIARIES
CONSOLIDATED STATEMENTS OF OPERATIONS
(in thousands, except per share data)
| Year Ended December 31, | ||||||||
| 2017 | 2016 | |||||||
| Sales | $ | 425 | $ | 68 | ||||
| Cost of sales | 479 | 50 | ||||||
| Gross profit | (54 | ) | 18 | |||||
| Operating expenses: | ||||||||
| General and administrative [1] | 18,705 | 9,398 | ||||||
| Consulting | 2,252 | 117 | ||||||
| Research and development | 587 | 37 | ||||||
| Total operating expenses, net | 21,544 | 9,552 | ||||||
| Loss from operations | (21,598 | ) | (9,534 | ) | ||||
| Other income (expense): | ||||||||
| Interest expense, net | (322 | ) | (1,148 | ) | ||||
| Other income (expense) | 20 | (3 | ) | |||||
| Total other income (expense) | (302 | ) | (1,151 | ) | ||||
| Loss before income taxes | (21,900 | ) | (10,685 | ) | ||||
| Income tax expense | (3 | ) | - | |||||
| Net loss | $ | (21,903 | ) | $ | (10,685 | ) | ||
| Net loss per share to common shareholders: | ||||||||
| Basic and diluted | $ | (0.33 | ) | $ | (0.16 | ) | ||
| Weighted shares used in the computation of net loss per share: | ||||||||
| Basic and diluted | 66,537,525 | 66,585,580 | ||||||
| [1] | Includes compensation-based stock expense as follows: |
| Year Ended December 31, | ||||||||
| 2017 | 2016 | |||||||
| General and administrative expenses | 15,039 | 7,565 | ||||||
| Total stock-based compensation expense | 15,039 | 7,565 | ||||||
Sales
Sales were $425,000 and $68,000 for the years ended December 31, 2017 and 2016, respectively. The increase in sales was due to the sale of a zero-emission electric Type C bus to Blue Bird Corporation in November 2017 for use at the NAPT Expo and other future demonstrations.
Cost of Goods Sold
Cost of goods sold was $478,772 and $50,000 for the years ended December 31, 2017 and 2016, respectively. Cost of goods sold for 2017 includes $390,000 relating to the $425,000 in revenues recorded, plus $88,772 recorded as a valuation allowance against existing inventory that is unrelated to the revenue.
Research and Development Expenses
Research and development expenses have historically comprised a significant portion of our operating expenses. Research and development expense was $586,899 and $37,273 for the years ended December 31, 2017 and 2016, respectively. The increase in 2017 is primarily due to $420,000 incurred in the second quarter of 2017 to build and install our drivetrain system on a chassis of a Type D school bus, on a promotional basis, for a potential customer. The project also enabled us to evaluate a third party firm that performed the work. The balance of the increase occurred because we were required to pay other research and development consultants under the terms of an employment agreement with our former Chief Technology Officer. That employment agreement was terminated in early March 2018.
| 54 |
General and Administrative Expenses
General and administrative expenses were $18.7 million and $9.4 million for the years ended December 31, 2017 and 2016, respectively. The increase is primarily due to an increase in stock-based compensation expense of $7.5 million due to the additional options granted in March 2017 (see “Options to Purchase Common Stock” below and Note 9 to the consolidated financial statements included in this Annual Report) and also to the remeasurement of non-employee stock options, as required by ASC 718 and ASC 505. We anticipate stock-based compensation expense to continue to increase as we expand our infrastructure in order to begin generating revenue.
Payroll and payroll-related expenses increased by $1.2 million due to increased staff hired during 2017; investor relations expenses increased by $224,493, taxes and licenses increased by $104,315 primarily due to an accrual for the Delaware franchise tax; advertising and marketing expense increased by $93,955; travel-related expenses increased by $69,156; insurance expense increased by $62,782; rent expense increased by $56,457; and other general and administrative expenses increased by $230,213, offset by a decrease in legal and professional fees of $200,267 as compared to the prior-year period. These increases are primarily due to our need to expand our sales and marketing infrastructure, as well as the incurrence of certain costs associated with our status as a public company.
Interest Expense
Interest expense consists of the following:
| · | accrued third party finance charge amortization; | |
| · | accrued benefit conversion features applicable to debt instruments; and | |
| · | accrued interest on existing debt. |
Interest expense was $501,857 and $1.1 million for the years ended December 31, 2017 and 2016 respectively. This decrease is due to the full amortization of the beneficial conversion features, finance charges, and warrants early in 2017, the repayment of a portion of the principal balance of outstanding 9% notes, as well as the debt converted to equity on January 30, 2017 (see Note 6 to the consolidated financial statements included in this Annual Report).
Cash Flows
| Year Ended December 31, | ||||||||
| 2017 | 2016 | |||||||
| Consolidated Statements of Cash Flow Data: | ||||||||
| Cash flows used in operating activities | $ | (5,578 | ) | $ | (2,908 | ) | ||
| Cash flows used in investing activities | (614 | ) | (871 | ) | ||||
| Cash flows provided by (used in) financing activities | 7,700 | 180 | ||||||
| Increase (decrease) in cash and cash equivalents | $ | 1,508 | $ | (3,599 | ) | |||
Operating Activities
Cash used in operating activities is primarily the result of our operating losses, reduced by the impact of the non-cash stock-based compensation and warrant amounts. These numbers are further impacted by adjustments for non-cash interest expense.
| 55 |
Net cash used by operating activities during the year ended December 31, 2017 was $5.6 million, as a result of a net loss of $21.9 million, stock-based compensation of $15.0 million, other non-cash charges of $1.6 million, and changes in operating assets and liabilities that used $367,124 in cash. Other current assets increased by $672,150 due primarily to increases in other receivables of $276,314, and prepaid expenses of $395,836, primarily relating to deposits for inventory; accrued liabilities increased by $359,265 due primarily to the accrual of employee bonuses of $105,594, accrued franchise taxes of $99,400, a current liability established relating to the new lease accounting standard of $70,492, and other accrued expenses of $83,779; non-current liabilities increased by $289,012 due to the addition of a non-current liability established in conjunction with the new lease accounting standard; other non-current assets increased by $266,904 due primarily to the $359,504 addition of a right-of-use asset established in conjunction with the new lease accounting standard , offset by a decrease in deposits of $92,600 primarily due to reclassifying payments to a third party manufacturer from deposits to prepaid expenses; and accounts payable decreased by $76,345.
Net cash used in operating activities during the year ended December 31, 2016 was $2.9 million, as a result of a net loss of $10.7 million, stock-based compensation of $7.6 million, other non-cash charges of $672,511, and changes in operating assets and liabilities that used $460,689 in cash. Inventory increased by $313,772; accrued expenses decreased by $238,580 due to the payment of accrued compensation of $344,914, net of an increase in accrued interest on debt of $32,695; and other accruals of $73,639; accounts payable increased by $199,441; other non-current assets increased by $100,043 due to payment of several deposits; deferred revenue decreased by $68,000; and other current assets decreased by $60,265.
We expect cash used by operating activities to fluctuate significantly in future periods as a result of a number of factors, some of which are outside of our control, including, among others: the success we achieve in generating revenue; the success we have in helping our customers obtain financing to subsidize their purchases of our products; our ability to efficiently develop our dealer and service network; the costs of batteries and other materials utilized to make our products; the extent to which we need to invest additional funds in research and development; and the amount of expense we incur to satisfy future warranty claims.
Investing Activities
Net cash used by investing activities during the year ended December 31, 2017 was $612,856. This was due to issuing a $500,000 note to a third party, and $112,856 for the acquisition of property and equipment relating to the lease of our new office facility. See Notes 4, 5, and 12 to the consolidated financial statements contained in this Annual Report.
Net cash used by investing activities during the year ended December 31, 2016 was $871,474. This was due to the acquisition of $411,474 of property and equipment; $450,000 net proceeds of a loan to a third party; and $10,000 invested in Silicon Turbine Solutions.
Financing Activities
Net cash provided by financing activities during the year ended December 31, 2017 was $7.7 million due to net proceeds of $12.6 million received from the closing of our initial public offering under Regulation A of the Securities Act and net notes payable proceeds of $500,000, reduced by $3.6 million repayment of notes payable principal, and related interest of $346,736. The net increase was further offset by payments for costs related to our offering under Regulation A of $1,668,339 and payments made for our follow-on offering of $75,500. See Notes 7 and 12 to the consolidated financial statements contained in this Annual Report.
Net cash provided by financing activities during the year ended December 31, 2016 was $180,236 due to net proceeds of $1.0 million from the issuance of debt, net proceeds of $187,900 from the sale of stock, payment for stock rescission of $54,000, and to a $7,500 repayment of convertible debt principal. Other non-current assets increased $988,324 due to the capitalization of costs from our offering of common stock.
| 56 |
Comparison of the Years Ended December 31, 2016 and 2015
ADOMANI, INC. AND SUBSIDIARIES
CONSOLIDATED STATEMENTS OF OPERATIONS
(in thousands, except per share data)
| Year Ended December 31, | ||||||||
| 2016 | 2015 | |||||||
| Sales | $ | 68 | $ | - | ||||
| Cost of sales | 50 | - | ||||||
| Gross profit | 18 | - | ||||||
| Operating expenses: | ||||||||
| General and administrative (1) | 9,398 | 4,633 | ||||||
| Consulting | 117 | 135 | ||||||
| Research and development | 37 | 549 | ||||||
| Total operating expenses, net | 9,552 | 5,317 | ||||||
| Loss from operations | (9,534 | ) | (5,317 | ) | ||||
| Other income (expense): | ||||||||
| Interest expense, net | (1,148 | ) | (702 | ) | ||||
| Other income (expense) | (3 | ) | (16 | ) | ||||
| Total other income (expense) | (1,151 | ) | (718 | ) | ||||
| Loss before income taxes | (10,685 | ) | (6,035 | ) | ||||
| Income tax expense | - | - | ||||||
| Net loss | $ | (10,685 | ) | $ | (6,035 | ) | ||
| Net loss per share to common shareholders: | ||||||||
| Basic and diluted | $ | (0.16 | ) | $ | (0.07 | ) | ||
| Weighted shares used in the computation of net loss per share: | ||||||||
| Basic and diluted | 66,585,580 | 82,611,477 | ||||||
| (1) | Includes compensation-based stock expense as follows: |
| Year Ended December 31, | ||||||||
| 2016 | 2015 | |||||||
| General and administrative expenses | 7,565 | 3,035 | ||||||
| Total stock-based compensation expense | 7,565 | 3,035 | ||||||
Sales
Sales were $68,000 and $0 for the years ended December 31, 2016 and 2015.
Research and Development Expenses
Research and development expenses have historically comprised a significant portion of our operating expenses. Research and development expense was $37,273 and $548,889 for the years ended December 31, 2016 and 2015, respectively. A substantial amount of research and development expenditures made during 2016 were capitalized related to building a specific demonstration vehicle, which was the reason for lower expense in 2016.
General and Administrative Expenses
General and administrative expenses were $9.4 million and $4.6 million for the years ended December 31, 2016 and 2015, respectively. This increase is primarily due to an increase in stock-based compensation charges of $4.5 million; legal, accounting and other professional fees of $556,205 and decreases in other accounts of $322,205 during the year ended December 31, 2016. We anticipate the stock-based compensation expenses may continue to increase as we expand our infrastructure in order to begin generating revenues and due to our new status as a public company.
| 57 |
Interest Expense
Interest expense was $1.1 million and $702,134 for the years ended December 31, 2016 and 2015, respectively. This increase is due to the recognition of a beneficial conversion expense related to existing debt instruments, the amortization of finance charges incurred on debt issued during 2015, and the amortization of the fair market value of a warrant issued during 2016 that related to 2015.
Cash Flows
| Year Ended December 31, | ||||||||
| 2016 | 2015 | |||||||
| Consolidated Statements of Cash Flow Data: | ||||||||
| Cash flows used in operating activities | $ | (2,908 | ) | $ | (2,103 | ) | ||
| Cash flows used in investing activities | (871 | ) | (113 | ) | ||||
| Cash flows provided by (used in) financing activities | 180 | 6,635 | ||||||
| Increase (decrease) in cash and cash equivalents | $ | (3,599 | ) | $ | 4,419 | |||
Operating Activities
Cash used in operating activities is primarily the result of our operating losses, reduced by the impact of the non-cash stock-based compensation amounts. These numbers were further impacted by adjustments for non-cash interest expense and, in 2015, an increase in accrued liabilities. The increase in accrued liabilities is largely due to payroll-related accruals that were paid in 2016.
Net cash used in operating activities during the year ended December 31, 2016 was $2.9 million, as a result of a net loss of $10.7 million, stock-based compensation of $7.6 million, other non-cash charges of $672,511, and changes in operating assets and liabilities that used $460,689 in cash. Inventory increased by $313,772; accrued expenses decreased by $238,580 due to the payment of accrued compensation of $344,914, net of an increase in accrued interest on debt of $32,695; and other accruals of $73,639; accounts payable increased by $199,441; other non-current assets increased by $100,043 due to payment of several deposits; deferred revenue decreased by $68,000; and other current assets decreased by $60,265.
Net cash used by operating activities during the year ended December 31, 2015 was $2.1 million, as a result of a net loss of $6.035 million, stock-based compensation of $3.0 million, other non-cash charges of $430,722, and changes in operating assets and liabilities that provided $466,808 in cash.
We expect cash used by operating activities to fluctuate significantly in future periods as a result of a number of factors, some of which are outside of our control, including, among others: the success we achieve in generating revenue; the success we have in helping our customers obtain financing to subsidize their purchases of our products; our ability to efficiently develop our dealer and service network; the costs of batteries and other materials utilized to make our products; the extent to which we need to invest additional funds in research and development; and the amount of expense we incur to satisfy future warranty claims.
| 58 |
Investing Activities
Net cash used by investing activities during the year ended December 31, 2016 was $871,474. This was due to the acquisition of $411,474 of property and equipment; $450,000 net proceeds of a loan to a third party; and $10,000 invested in Silicon Turbine Solutions.
Net cash used by investing activities during the year ended December 31, 2015 was $113,332. This was primarily due to a $110,000 investment in Silicon Turbine Solutions.
Financing Activities
Net cash provided by financing activities during the year ended December 31, 2016 was $180,236 due to net proceeds of $1.0 million from the issuance of debt, net proceeds of $187,900 from the sale of stock, payment for stock rescission of $54,000, and to a $7,500 repayment of convertible debt principal. Other non-current assets increased $988,324 due to the capitalization of costs from our offering of common stock.
Net cash provided by financing activities during the year ended December 31, 2015 was $6.6 million, primarily due to net proceeds of $4.7 million from the issuance of convertible debt, net proceeds of $2.0 million in sales of stock, and to a $70,000 repayment of convertible debt principal.
Quarterly Results of Operations
The following table set forth selected, unaudited, quarterly consolidated statements of operations for each of the eight quarters beginning with the three months ended March 31, 2016. The information for each of these quarters has been prepared on the same basis as the audited consolidated financial statements included elsewhere in this Annual Report on Form 10-K and, in the opinion of management, reflects normal recurring adjustments necessary for the fair treatment of our consolidated results of operations for these periods. This data should be read in conjunction with our consolidated financial statements and related notes included elsewhere in this Annual Report. These quarterly results are not necessarily indicative of our results of operations to be expected for any future period.
| 59 |
| Three Months Ended | ||||||||||||||||
| 3/31/2017 | 6/30/2017 | 9/30/2017 | 12/31/2017 | |||||||||||||
| (in thousands, except per share data) | ||||||||||||||||
| Sales | $ | - | $ | - | $ | - | $ | 425 | ||||||||
| Cost of sales | - | - | - | 479 | ||||||||||||
| Gross profit (loss) | - | - | - | (54 | ) | |||||||||||
| Operating expenses: | ||||||||||||||||
| General and administrative | 1,297 | 5,350 | 11,716 | 342 | ||||||||||||
| Consulting | 19 | 2,143 | 49 | 41 | ||||||||||||
| Research and development | 59 | 460 | 38 | 30 | ||||||||||||
| Total operating expenses, net | 1,375 | 7,953 | 11,803 | 413 | ||||||||||||
| Loss from operations | (1,375 | ) | (7,953 | ) | (11,803 | ) | (467 | ) | ||||||||
| Other income (expense): | ||||||||||||||||
| Interest expense, net | (215 | ) | (147 | ) | (47 | ) | 87 | |||||||||
| Other income (expense) | 26 | 22 | (116 | ) | 88 | |||||||||||
| Total other income (expense) | (189 | ) | (125 | ) | (163 | ) | 175 | |||||||||
| Loss before income taxes | (1,564 | ) | (8,078 | ) | (11,966 | ) | (292 | ) | ||||||||
| Income tax expense | (2 | ) | - | (1 | ) | - | ||||||||||
| Net loss | $ | (1,566 | ) | $ | (8,078 | ) | $ | (11,967 | ) | $ | (292 | ) | ||||
| Net loss per share to common shareholders: | ||||||||||||||||
| Basic and diluted | $ | (0.02 | ) | $ | (0.12 | ) | $ | (0.18 | ) | $ | (0.00 | ) | ||||
| Weighted shares used in the computation of net loss per share: | ||||||||||||||||
| Basic and diluted | 63,121,402 | 66,815,898 | 68,070,930 | 68,070,930 | ||||||||||||
| Three Months Ended | ||||||||||||||||
| 3/31/2016 | 6/30/2016 | 9/30/2016 | 12/31/2016 | |||||||||||||
| (in thousands, except per share data) | ||||||||||||||||
| Sales | $ | - | $ | 68 | $ | - | $ | - | ||||||||
| Cost of sales | - | 50 | - | - | ||||||||||||
| Gross profit (loss) | - | 18 | - | - | ||||||||||||
| Operating expenses: | ||||||||||||||||
| General and administrative | 1,092 | 953 | 5,872 | 1,481 | ||||||||||||
| Consulting | 114 | 124 | - | (121 | ) | |||||||||||
| Research and development | 63 | - | 112 | (138 | ) | |||||||||||
| Total operating expenses, net | 1,269 | 1,077 | 5,984 | 1,222 | ||||||||||||
| Loss from operations | (1,269 | ) | (1,059 | ) | (5,984 | ) | (1,222 | ) | ||||||||
| Other income (expense): | ||||||||||||||||
| Interest expense, net | (272 | ) | (285 | ) | (274 | ) | (317 | ) | ||||||||
| Other income (expense) | 1 | - | (11 | ) | 7 | |||||||||||
| Total other income (expense) | (271 | ) | (285 | ) | (285 | ) | (310 | ) | ||||||||
| Loss before income taxes | (1,540 | ) | (1,344 | ) | (6,269 | ) | (1,532 | ) | ||||||||
| Income tax expense | - | - | - | - | ||||||||||||
| Net loss | $ | (1,540 | ) | $ | (1,344 | ) | $ | (6,269 | ) | $ | (1,532 | ) | ||||
| Net loss per share to common shareholders: | ||||||||||||||||
| Basic and diluted | $ | (0.02 | ) | $ | (0.02 | ) | $ | (0.11 | ) | $ | (0.03 | ) | ||||
| Weighted shares used in the computation of net loss per share: | ||||||||||||||||
| Basic and diluted | 84,297,745 | 66,551,134 | 57,163,882 | 58,542,350 | ||||||||||||
| 60 |
Liquidity and Capital Resources
From our incorporation in 2012 until the completion of our initial public offering of common stock under Regulation A of the Securities Act in June 2017, we financed our operations and capital expenditures through issuing equity capital, convertible notes and notes payable. A significant portion of this funding has been provided by affiliated stockholders, although significant equity capital was also raised in late 2015, and the majority of the convertible notes outstanding were issued in 2015 to non-affiliated third parties, as discussed below and in Note 6 to the consolidated financial statements contained elsewhere in this Annual Report.
As of December 31, 2017, we had cash and cash equivalents of $2.4 million. On January 9, 2018, we completed a public offering of 3,666,667 units for gross proceeds of $11.0 million. Net proceeds received, after deducting commissions, expenses and fees of approximately $1.2 million, were approximately $9.8 million. We believe that our existing cash and cash equivalents will be sufficient to fund our operations at least through the end of April 2019. However, we may not successfully execute our business plan, and if we do not, we may need additional capital to continue our operations. While we have not generated any material revenues to date and do not expect to be able to satisfy our cash requirements solely through product sales in the near future, we received several purchase orders for zero-emission electric school buses in the second half of 2017 and we recorded revenue of $425,000 in the fourth quarter of 2017. The sale of additional equity securities in the future could result in additional dilution to our stockholders and those securities may have rights senior to those of our common stock. The incurrence of additional indebtedness in the future would result in increased debt service obligations and could result in operating and financial covenants that would restrict our operations. Such capital, if required, may not be available on terms that are favorable to us or at all. We are currently incurring operating deficits that are expected to continue for the foreseeable future, and as we begin to execute our marketing plan, we expect our operating deficit will continue to grow until we begin to generate a sufficient level of revenue from our sales and marketing efforts.
Debt
As of December 31, 2016, we had borrowed $645,000 from Acaccia Family Trust, formerly a related party, and other parties by issuing notes convertible into our common stock at prices ranging from $0.10 per share to $0.50 per share. On January 30, 2017, the notes plus accrued interest, a total of $725,584, converted into 6,868,578 shares of our common stock. As of December 31, 2016, we also had outstanding a total of $4,255,325 of secured promissory notes, net of $884,700 principal amount of these secured notes that were exchanged for 884,700 shares of common stock on September 1, 2016. In November 2016, we borrowed $500,000 from an unaffiliated stockholder for working capital needs and, in March 2017, borrowed an additional $500,000 from the same stockholder for additional working capital required due to delays in completing our offering under Regulation A. In December 2016, we borrowed $500,000 from a third party pursuant to a secured promissory note, and immediately made a $500,000 loan to another third party who operates in the zero-emissions drivetrain technology industry. All notes referenced in this paragraph were scheduled to mature in 2017. In connection with the initial closing of our offering under Regulation A, on May 12, 2017, we repaid the $1,500,000 outstanding under the three unsecured notes that we issued in November 2016, December 2016 and March 2017, respectively. See Note 6 to the consolidated financial statements contained elsewhere in this report.
Regulation A Offering
On June 9, 2017, we completed a public offering of our common stock under Regulation A of the Securities Act. We sold 2,852,275 shares of our common stock for gross proceeds of approximately $14.6 million, of which approximately $1.7 million was paid to the selling stockholders for 342,273 shares of common stock they sold in the offering. Net proceeds, after deducting commissions, expenses, and fees of approximately $2.5 million, amounted to approximately $10.0 million.
Follow-On Public Offering
On January 9, 2018, we completed a public offering of 3,666,667 units for gross proceeds of $11.0 million. For each unit sold in the offering, we issued one share of our common stock and a warrant to purchase 1.5 shares of our common stock at an exercise price of $4.50. Net proceeds, after deducting commissions, expenses, and fees of approximately $1.2 million, amounted to approximately $9.8 million.
| 61 |
2015 Note Financing and Warrants to Purchase Common Stock
During 2015, we issued two-year secured promissory notes to third party lenders in an aggregate principal amount of $5,147,525 (Note Financing). As of December 31, 2017, we had repaid $2,106,325 of principal outstanding under such notes, and related cumulative interest of $986,007. The secured promissory notes were due initially on various dates between January 31 and November 30, 2017. Prior to the maturity dates of the notes, we exercised our option to extend the maturity dates six months pursuant to the provisions of such notes. The notes bear interest at an annual rate of 9%, payable monthly in arrears. The note obligations are secured by a lien on all of our assets. On September 1, 2016, holders of $884,700 of principal amount of the notes exchanged their notes for 884,700 shares of our common stock, thereby reducing the principal amount outstanding under the notes to $3,195,325. The remaining outstanding balance of $2,149,000 at December 31, 2017 was repaid in early January 2018 from the proceeds of the follow-on offering discussed above.
In connection with the Note Financing, in 2015, we agreed to issue a warrant to a third party to purchase 1,250,000 shares of our common stock at $4.00 per share, exercisable through September 1, 2021. On September 1, 2016, we issued the warrant to such third party.
Credit Facilities
We do not have any credit facilities or other access to bank credit. If, however, we believe that making an acquisition is appropriate, or see that sales of product are more rapidly using working capital than anticipated, we may seek to obtain a credit facility to address these issues.
Capital Expenditures
We do not have any contractual obligations for ongoing capital expenditures at this time. We do, however, purchase equipment necessary to conduct our operations on an as needed basis.
Going Concern
As of December 31, 2017, we had working capital of $1.8 million and stockholders’ equity of approximately $2.3 million. During the year ended December 31, 2017, we incurred a net loss attributable to holders of our common stock of approximately $21.9 million. Of the $21.9 million loss incurred for the year ended December 31, 2017, approximately $15.0 million is attributable to non-cash stock-based compensation expense, and another $1.2 million is related to non-cash consulting expense discussed above. The foregoing non-cash expenses had no impact on our cash flows during the year ended December 31, 2017. Stock-based compensation expense represents the amortization of the fair market value of stock options granted over their respective vesting period. The fair market value for both items is determined using the Black-Scholes model. Because some of these stock options were granted to non-employees, Accounting Standards Codification (ASC) 505 also require that we remeasure the fair market value of each of these options for each interim vesting period based on the market value of our stock on the interim vesting date. Therefore, the expense associated with these options is sensitive to changes in our stock price.
We have not generated any material revenues and have incurred net losses since inception. Our recurring operating losses and our need for additional sources of capital to fund our ongoing operations raise substantial doubt about our ability to continue as a going concern. As a result, our independent registered public accounting firm included an explanatory paragraph in its report on our audited consolidated financial statements as of December 31, 2016 and 2015 and for the years then ended with respect to this uncertainty. However, on June 9, 2017, we completed our offering under Regulation A. We sold 2,852,275 shares of our common stock for gross proceeds of $14,261,375, of which $1,711,365 was paid to the selling stockholders for 342,273 shares they sold in the offering. Furthermore, on January 9, 2018, we received approximately $9.8 million net proceeds from the follow-on offering discussed above. Based on the significant capital then raised and in the follow-on offering, that substantial doubt has been resolved.
| 62 |
Contractual Obligations
At December 31, 2017, our operating lease obligations and other contractual financial obligations that will affect our future liquidity were as follows:
| Payments due by period | ||||||||||||||||||||
| Total | Less than one year | 1 - 3 years | 4 - 5 years | More than 5 years | ||||||||||||||||
| Operating lease obligations | 570,238 | 74,626 | 350,364 | 145,248 | - | |||||||||||||||
| Employment contracts | 1,241,846 | 481,846 | 760,000 | - | - | |||||||||||||||
| Total | 1,812,084 | 556,472 | 1,110,364 | 145,248 | - | |||||||||||||||
The contractual commitment amounts in the table above are associated with agreements that are enforceable and legally binding. Obligations under contracts that we can cancel without a significant penalty are not included in the table above.
Off-Balance Sheet Arrangements
We did not have during the periods presented, and we do not currently have, any off-balance sheet arrangements, as defined in the rules and regulations of the SEC.
Indemnification Agreements
As we begin producing revenue, we will provide customers with indemnification of varying scope against claims of intellectual property infringement by third parties arising from the use of our products. We do not estimate the costs related to these indemnification provisions to be significant and are unable to determine the maximum potential impact of these indemnification provisions on our future results of operations. In addition, we have directors and officers liability coverage to further mitigate our indemnification exposure. No demands have been made upon us to provide indemnification and there are no claims that we are aware of that could have a material effect on our consolidated balance sheet, consolidated statement of operations, or consolidated cash flows.
Critical Accounting Policies and Estimates
Our consolidated financial statements are prepared in accordance with accounting principles generally accepted in the United States (GAAP). The preparation of these consolidated financial statements requires us to make estimates and assumptions that affect the reported amounts of assets, liabilities, revenue, expenses and related disclosures. We evaluate our estimates and assumptions on an ongoing basis. Our estimates are based on historical experience and various other assumptions that we believe to be reasonable under the circumstances. Our actual results could differ from these estimates.
We believe that the assumptions and estimates associated with the preparation of the financial statement information presented in this report are not significant because we have not generated any appreciable revenue. Therefore, we have not had to make assumptions or estimates related to a reserve for bad debt expense. As to future warranty costs to be incurred, we recorded a warranty reserve against 2017 revenue and will continue to evaluate the provision for such expenses in the future. These two items will have significant potential impact on our consolidated financial statements in the future. We also have no significant current litigation on which we have to provide reserves or estimate accruals and our investment to date in property, plant and equipment has not been significant. We therefore have not had to rely on estimates related to impairment. We have not generated any taxable income to date, so have not had to make any decisions about future profitability that would impact recording income tax expense. Assuming we are able to generate future profits by executing our business plan, these areas, among others, will most likely be our critical accounting policies and estimates.
In May 2014, the FASB issued ASU No. 2014-09, Revenue from Contracts with Customers (Topic 606). This amendment supersedes Topic 605 by establishing core principles that an entity should follow when recognizing revenue to depict the transfer of promised goods or services to customers in an amount that reflects the consideration to which the entity expects to be entitled in exchange for those goods or services. ASU No. 2015-14 amended the guidance to be effective for annual reporting periods after December 15, 2017, including interim periods within that reporting period. We will adopt ASU 2014-09 in the first quarter of 2018. Because we are currently a party to only one contract, and the contract provides for a single performance obligation, we anticipate no impact on our consolidated financial statements.
| 63 |
We have early-adopted ASU No. 2016-02, Leases (Topic 842). The amendment requires companies to recognize leased assets and liabilities on the balance sheet and to disclose key information regarding leasing arrangements. This guidance is effective for annual periods, and interim periods within those annual periods, after December 15, 2018. Early application of this amendment is permitted for all entities. While we do not anticipate that, going forward, leases will be material to our balance sheet, we chose to early-adopt as of December 31, 2017 due to our entering into new leases during the year. These new leases are the only leases required to be included on our balance sheet under the new standard. Consequently, the adoption of the new lease standard did not have any impact to prior period information. Further, these leases are operating leases and, therefore, have no income statement impact resulting from the adoption of this standard.
Contingencies
Certain conditions may exist as of the date the financial statements are issued, which may result in a loss to us, but which will only be resolved when one or more future events occur or fail to occur. Our management, in consultation with its legal counsel as appropriate, assesses such contingent liabilities, and such assessment inherently involves an exercise of judgment. In assessing loss contingencies related to legal proceedings that are pending against us or unasserted claims that may result in such proceedings, we, in consultation with legal counsel, evaluates the perceived merits of any legal proceedings or unasserted claims, as well as the perceived merits of the amount of relief sought or expected to be sought therein. If the assessment of a contingency indicates it is probable that a material loss has been incurred and the amount of the liability can be estimated, then the estimated liability would be accrued in our financial statements. If the assessment indicates a potentially material loss contingency is not probable, but is reasonably possible, or is probable, but cannot be estimated, then the nature of the contingent liability, together with an estimate of the range of possible loss, if determinable and material, would be disclosed. Loss contingencies considered remote are generally not disclosed unless they involve guarantees, in which case the guarantees would be disclosed.
Stock-Based Compensation
We measure the cost of services received in exchange for an award of equity instruments based on the fair value of the award. For employees, the fair value of the award is measured on the grant date and for non-employees, the fair value of the award is generally re-measured on vesting dates and interim financial reporting dates until the service period is complete. The fair value amount is then recognized over the period during which services are required to be provided in exchange for the award, usually the vesting period. The fair value of our common stock was estimated by management based on observations of the cash sales prices of its common shares. Awards granted to directors are treated on the same basis as awards granted to employees.
Fair Value Measurement
The carrying values of our financial instruments, including cash, notes receivable and accounts payable approximate their fair value due to the short-term nature of these financial instruments. Financial Accounting Standards Board (“FASB”) Accounting Standards Codification (“ASC”) No. 820, “Fair Value Measurement” defines fair value as the exchange price that would be received for an asset or paid to transfer a liability (an exit price) in the principal or most advantageous market for the asset or liability in an orderly transaction between market participants on the measurement date. It also establishes a three-tier fair value hierarchy, which prioritizes the inputs used in measuring fair value as follows:
Level 1: Observable inputs such as quoted prices in active markets;
Level 2: Inputs, other than the quoted prices in active markets, that are observable either directly or indirectly; and
Level 3: Unobservable inputs in which there is little or no market data, which require the reporting entity to develop its own assumptions.
| 64 |
We do not have any assets or liabilities that are required to be measured and recorded at fair value on a recurring basis.
Jumpstart Our Business Startups Act of 2012 (JOBS Act)
We are an “emerging growth company,” as defined in the JOBS Act. The JOBS Act contains provisions that, among other things, reduce certain reporting requirements for emerging growth companies. We have irrevocably elected not to avail ourselves of this exemption from new or revised accounting standards, and, therefore, will be subject to the same new or revised accounting standards as other public companies that are not emerging growth companies. We have chosen to rely on the other exemptions and reduced reporting requirements provided by the JOBS Act. Subject to certain conditions set forth in the JOBS Act, as an emerging growth company we are not required to, among other things, (i) being permitted to provide only two years of audited financial statements, in addition to any required unaudited interim financial statements, with correspondingly reduced “Management’s Discussion and Analysis of Financial Condition and Results of Operations” disclosure, (ii) not being required to comply with the auditor attestation requirements in the assessment of our internal control over financial reporting, (iii) not being required to comply with any requirement that may be adopted by the Public Company Accounting Oversight Board regarding mandatory audit firm rotation or a supplement to the auditor’s report providing additional information about the audit and the financial statements, (iv) reduced disclosure obligations regarding executive compensation or (v) exemptions from the requirements of holding a nonbinding advisory vote on executive compensation and stockholder approval of any golden parachute payments not previously approved.
We will retain our emerging growth company status until the first to occur of: (i) the end of the fiscal year in which the fifth anniversary of the completion of our initial public offering occurs, (ii) the end of the fiscal year in which our annual revenues exceed $1.07 billion, (iii) the date on which we issue more than $1 billion in non-convertible debt during any three-year period or (iv) the date on which we qualify as a “large accelerated filer.”
Recent Accounting Pronouncements
In May 2014, the FASB issued ASU No. 2014-09, Revenue from Contracts with Customers (Topic 606). This amendment supersedes Topic 605 by establishing core principles that an entity should follow when recognizing revenue to depict the transfer of promised goods or services to customers in an amount that reflects the consideration to which the entity expects to be entitled in exchange for those goods or services. ASU No. 2015-14 amended the guidance to be effective for annual reporting periods after December 15, 2017, including interim periods within that reporting period. We will adopt ASU 2014-09 in the first quarter of 2018. Because we are currently a party to only one contract, and the contract provides for a single performance obligation, we anticipate no impact on our consolidated financial statements.
In May 2017, the FASB issued ASU No. 201 7-09, Compensation-Stock Compensation (Topic 718): “Scope of Modification Accounting. “The amendments provide guidance on determining which changes to the terms and conditions of share-based payment awards require an entity to apply modification accounting under Topic 718. The guidance is effective for annual periods, and interim periods within those annual periods, beginning after December 15, 2017. Early adoption is permitted, including any interim period, for reporting periods for which financial statements have not been issued.
We have implemented all other new accounting pronouncements that are in effect and that may impact our financial statements and we do not believe that there are any other new accounting pronouncements that have been issued that might have a material impact on our consolidated financial position or results of operations.
| Item 7A. | Quantitative and Qualitative Disclosures About Market Risk |
We are exposed to market risks in the ordinary course of our business. We do not currently face material market risks such as interest rate fluctuation risk and foreign currency exchange risk. Our cash and cash equivalents include cash in readily available checking and money market accounts. These investments are not dependent on interest rate fluctuations that may cause the principal amount of these investments to fluctuate, and we do not expect such fluctuation will have a material impact on our financial conditions. If we issue additional debt in the future, we will be subject to interest rate risk. The majority of our expenses are denominated in the U.S. dollar.
| 65 |
As we continue our commercialization efforts internationally, we may generate revenue and incur expenses denominated in currencies other than the U.S. dollar, a majority of which we expect to be denominated in Chinese Yuan. As a result, as operations of ADOMANI China expand in the future, our revenue may be significantly impacted by fluctuations in foreign currency exchange rates. We may face risks associated with the costs of raw materials, primarily batteries, as we go into production. To the extent these and other risks materialize, they could have a material effect on our operating results or financial condition. We currently anticipate that our international selling, marketing and administrative costs related to foreign sales will be largely denominated in the same foreign currency, which may mitigate our foreign currency exchange risk exposure.
| Item 8. | Financial Statements and Supplementary Data |
INDEX TO CONSOLIDATED FINANCIAL STATEMENTS
| 66 |
REPORT OF INDEPENDENT REGISTERED PUBLIC ACCOUNTING FIRM
To the Shareholders and Board of Directors of
ADOMANI, Inc.
Newport Beach, California
Opinion on the Financial Statements
We have audited the accompanying consolidated balance sheets of ADOMANI, Inc. and its subsidiaries (collectively, the “Company”) as of December 31, 2017 and 2016, and the related consolidated statements of operations, stockholders’ equity (deficit), and cash flows for each of the years in the three-year period ended December 31, 2017, and the related notes (collectively referred to as the “financial statements”). In our opinion, the financial statements present fairly, in all material respects, the financial position of the Company as of December 31, 2017 and 2016, and the results of their operations and their cash flows for each of the years in the three-year period ended December 31, 2017, in conformity with accounting principles generally accepted in the United States of America.
Basis for Opinion
These financial statements are the responsibility of the Company’s management. Our responsibility is to express an opinion on the Company’s financial statements based on our audits. We are a public accounting firm registered with the Public Company Accounting Oversight Board (United States) (“PCAOB”) and are required to be independent with respect to the Company in accordance with the U.S. federal securities laws and the applicable rules and regulations of the Securities and Exchange Commission and the PCAOB.
We conducted our audits in accordance with the standards of the PCAOB. Those standards require that we plan and perform the audit to obtain reasonable assurance about whether the financial statements are free of material misstatement, whether due to error or fraud. The Company is not required to have, nor were we engaged to perform, an audit of its internal control over financial reporting. As part of our audits we are required to obtain an understanding of internal control over financial reporting but not for the purpose of expressing an opinion on the effectiveness of the Company’s internal control over financial reporting. Accordingly, we express no such opinion.
Our audits included performing procedures to assess the risks of material misstatement of the financial statements, whether due to error or fraud, and performing procedures that respond to those risks. Such procedures included examining, on a test basis, evidence regarding the amounts and disclosures in the financial statements. Our audit also included evaluating the accounting principles used and significant estimates made by management, as well as evaluating the overall presentation of the financial statements. We believe that our audits provide a reasonable basis for our opinion.
/s/ MaloneBailey, LLP
www.malonebailey.com
We have served as the Company’s auditor since 2014.
Houston, Texas
March 12, 2018
| 67 |
ADOMANI, INC. AND SUBSIDIARIES
CONSOLIDATED BALANCE SHEETS
(in thousands, except share data)
| December 31, | December 31, | |||||||
| 2017 | 2016 | |||||||
| ASSETS | ||||||||
| Current assets: | ||||||||
| Cash and cash equivalents | $ | 2,446 | $ | 938 | ||||
| Notes receivable, net | 1,000 | 454 | ||||||
| Inventory, net | 225 | 314 | ||||||
| Other current assets | 778 | 1,039 | ||||||
| Total current assets | 4,449 | 2,745 | ||||||
| Property and equipment, net | 487 | 417 | ||||||
| Other investments | - | 120 | ||||||
| Other non-current assets | 386 | 124 | ||||||
| Total assets | $ | 5,322 | $ | 3,406 | ||||
| LIABILITIES AND STOCKHOLDERS' EQUITY (DEFICIT) | ||||||||
| Current liabilities: | ||||||||
| Accounts payable | $ | 30 | $ | 107 | ||||
| Accrued liabilities | 514 | 236 | ||||||
| Deferred revenue | - | - | ||||||
| Notes payable, net | 2,149 | 5,177 | ||||||
| Convertible debt, net | - | 593 | ||||||
| Total current liabilities | 2,693 | 6,113 | ||||||
| Long-term liabilities | ||||||||
| Other non-current liabilities | 289 | - | ||||||
| Notes payable, net | - | - | ||||||
| Convertible debt, net | - | - | ||||||
| Total liabilities | 2,982 | 6,113 | ||||||
| Commitments and contingencies | ||||||||
| Stockholders' equity (deficit): | ||||||||
| Preferred stock, 100,000,000 authorized $0.00001 par value none issued and outstanding, respectively | - | - | ||||||
| Common stock, 2,000,000,000 authorized $0.00001 par value, 68,070,930 and 58,542,350 issued and outstanding, respectively | 1 | 1 | ||||||
| Additional paid-in capital | 45,316 | 18,366 | ||||||
| Accumulated deficit | (42,977 | ) | (21,074 | ) | ||||
| Total stockholders' equity (deficit) | 2,340 | (2,707 | ) | |||||
| Total liabilities and stockholders' equity (deficit) | $ | 5,322 | $ | 3,406 | ||||
See accompanying notes to consolidated financial statements.
| 68 |
ADOMANI, INC. AND SUBSIDIARIES
CONSOLIDATED STATEMENTS OF OPERATIONS
(in thousands, except per share data)
| Year Ended December 31, | ||||||||||||
| 2017 | 2016 | 2015 | ||||||||||
| Sales | $ | 425 | $ | 68 | $ | - | ||||||
| Cost of sales | 479 | 50 | - | |||||||||
| Gross profit (loss) | (54 | ) | 18 | - | ||||||||
| Operating expenses: | ||||||||||||
| General and administrative | 18,705 | 9,398 | 4,633 | |||||||||
| Consulting | 2,252 | 117 | 135 | |||||||||
| Research and development | 587 | 37 | 549 | |||||||||
| Total operating expenses, net | 21,544 | 9,552 | 5,317 | |||||||||
| Loss from operations | (21,598 | ) | (9,534 | ) | (5,317 | ) | ||||||
| Other income (expense): | ||||||||||||
| Interest expense, net | (322 | ) | (1,148 | ) | (702 | ) | ||||||
| Other income (expense) | 20 | (3 | ) | (16 | ) | |||||||
| Total other income (expense) | (302 | ) | (1,151 | ) | (718 | ) | ||||||
| Loss before income taxes | (21,900 | ) | (10,685 | ) | (6,035 | ) | ||||||
| Income tax expense | (3 | ) | - | - | ||||||||
| Net loss | $ | (21,903 | ) | $ | (10,685 | ) | $ | (6,035 | ) | |||
| Net loss per share to common shareholders: | ||||||||||||
| Basic and diluted | $ | (0.33 | ) | $ | (0.16 | ) | $ | (0.07 | ) | |||
| Weighted shares used in the computation of net loss per share: | ||||||||||||
| Basic and diluted | 66,537,525 | 66,585,580 | 82,611,477 | |||||||||
See accompanying notes to consolidated financial statements.
| 69 |
ADOMANI, INC. AND SUBSIDIARIES
CONSOLIDATED STATEMENTS OF STOCKHOLDERS' EQUITY (DEFICIT)
(in thousands, except per share data)
| Additional | ||||||||||||||||||||
| Common Stock | Paid-In | Accumulated | Stockholders' | |||||||||||||||||
| Shares | Amount | Capital | Deficit | Equity (Deficit) | ||||||||||||||||
| Balance, December 31, 2014 | 81,594,250 | $ | 1 | $ | 4,155 | $ | (4,354 | ) | $ | (198 | ) | |||||||||
| Common stock issued | 2,659,000 | - | 1,982 | - | 1,982 | |||||||||||||||
| Beneficial conversion feature on convertible debt | - | - | 21 | - | 21 | |||||||||||||||
| Stock based compensation | - | - | 3,035 | - | 3,035 | |||||||||||||||
| Stock warrant | - | - | 349 | - | 349 | |||||||||||||||
| Net loss | - | - | - | (6,035 | ) | (6,035 | ) | |||||||||||||
| Balance, December 31, 2015 | 84,253,250 | $ | 1 | $ | 9,542 | $ | (10,389 | ) | $ | (846 | ) | |||||||||
| Common stock issued for cash | 206,400 | - | 188 | - | 188 | |||||||||||||||
| Stock issued for third-party services rendered | 98,000 | 98 | 98 | |||||||||||||||||
| Stock issued for prepaid services | 100,000 | 100 | 100 | |||||||||||||||||
| Founders shares rescinded | (27,000,000 | ) | - | (54 | ) | - | (54 | ) | ||||||||||||
| Conversion of debt to common shares | 884,700 | - | 885 | - | 885 | |||||||||||||||
| Beneficial conversion feature on convertible debt | - | - | 42 | - | 42 | |||||||||||||||
| Stock based compensation | - | - | 7,565 | - | 7,565 | |||||||||||||||
| Net loss | - | - | - | (10,685 | ) | (10,685 | ) | |||||||||||||
| Balance, December 31, 2016 | 58,542,350 | $ | 1 | $ | 18,366 | $ | (21,074 | ) | $ | (2,707 | ) | |||||||||
| Common stock issued due to debt conversion | 6,868,578 | - | 726 | - | 726 | |||||||||||||||
| Common stock issued for cash | 2,510,002 | - | 12,550 | - | 12,550 | |||||||||||||||
| Offering costs netted against proceeds from common stock issued for cash | - | - | (4,437 | ) | - | (4,437 | ) | |||||||||||||
| Common stock issued for prepaid services cancelled | (100,000 | ) | - | (100 | ) | - | (100 | ) | ||||||||||||
| Common stock issued as offering costs | 250,000 | - | 1,250 | 1,250 | ||||||||||||||||
| Warrants issued for services | - | - | 1,241 | 1,241 | ||||||||||||||||
| Warrants issued as offering costs | - | - | 681 | 681 | ||||||||||||||||
| Stock based compensation | - | - | 15,039 | - | 15,039 | |||||||||||||||
| Net loss | - | - | - | (21,903 | ) | (21,903 | ) | |||||||||||||
| Balance, December 31, 2017 | 68,070,930 | $ | 1 | $ | 45,316 | $ | (42,977 | ) | $ | 2,340 | ||||||||||
See accompanying notes to consolidated financial statements.
| 70 |
ADOMANI, INC. AND SUBSIDIARIES
CONSOLIDATED STATEMENTS OF CASH FLOWS
(in thousands)
| Year Ended December 31, | ||||||||||||
| 2017 | 2016 | 2015 | ||||||||||
| Cash flows from operating activities: | ||||||||||||
| Net loss | (21,903 | ) | (10,685 | ) | $ | (6,035 | ) | |||||
| Adjustments to reconcile net loss to net cash used in operating activities: | ||||||||||||
| Depreciation and amortization | 19 | 13 | 7 | |||||||||
| Accretion of discount on note receivable | (46 | ) | - | - | ||||||||
| Amortization of debt discount | 130 | 660 | 424 | |||||||||
| Provision for bad debt | 70 | - | ||||||||||
| Stock based compensation expense | 15,039 | 7,565 | 3,035 | |||||||||
| Warrant issued for services | 1,241 | - | - | |||||||||
| Loss on write-down of property and equipment | 25 | - | - | |||||||||
| Write-down of inventory | 89 | - | - | |||||||||
| Write-off of investment | 120 | - | - | |||||||||
| Write-off of patents | 5 | - | - | |||||||||
| Changes in assets and liabilities: | ||||||||||||
| Inventory | - | (314 | ) | - | ||||||||
| Other current assets | (672 | ) | 60 | (2 | ) | |||||||
| Other non-current assets | (267 | ) | (100 | ) | (4 | ) | ||||||
| Accounts payable | (76 | ) | 199 | - | ||||||||
| Accrued liabilities | 359 | (238 | ) | 404 | ||||||||
| Deferred revenue | - | (68 | ) | 68 | ||||||||
| Other non-current liabilities | 289 | - | - | |||||||||
| Net cash used in operating activities | (5,578 | ) | (2,908 | ) | (2,103 | ) | ||||||
| Cash flows from investing activities: | ||||||||||||
| Purchase of property and equipment, net | (114 | ) | (411 | ) | (3 | ) | ||||||
| Investment in note receivable | (500 | ) | (450 | ) | - | |||||||
| Other Investments | - | (10 | ) | (110 | ) | |||||||
| Net cash used in investing activities | (614 | ) | (871 | ) | (113 | ) | ||||||
| Cash flows from financing activities: | ||||||||||||
| Proceeds from issuance of common stock | 12,550 | 188 | 1,982 | |||||||||
| Payments for stock rescission | - | (54 | ) | - | ||||||||
| Proceeds from issuance of debt, net of issuance costs | 500 | 1,042 | 4,723 | |||||||||
| Principal repayments of debt | (3,606 | ) | (8 | ) | (70 | ) | ||||||
| Payments for deferred offering costs | (1,744 | ) | (988 | ) | - | |||||||
| Net cash provided by financing activities | 7,700 | 180 | 6,635 | |||||||||
| Net change in cash and cash equivalents | 1,508 | (3,599 | ) | 4,419 | ||||||||
| Cash and cash equivalents at the beginning of the year | 938 | 4,537 | 118 | |||||||||
| Cash and cash equivalents at the end of the year | $ | 2,446 | $ | 938 | $ | 4,537 | ||||||
| Non-cash transactions: | ||||||||||||
| Original issuance discount of notes payable | $ | - | $ | 50 | $ | - | ||||||
| Debt discount due to BCF | $ | - | $ | 42 | $ | - | ||||||
| Stock issued for third-party services rendered | $ | - | $ | 98 | $ | - | ||||||
| Stock issued for prepaid services | $ | - | $ | 100 | $ | - | ||||||
| Common stock issued for conversion of notes payable | $ | - | $ | 885 | $ | - | ||||||
| Common stock issued due to debt conversion | $ | 726 | $ | - | $ | - | ||||||
| Deferred offering costs reclassified to equity | $ | 838 | $ | - | $ | - | ||||||
| Common stock issued for prepaid services rescinded | $ | 100 | $ | - | $ | - | ||||||
| Common stock issued as offering costs | $ | 1,250 | $ | - | $ | - | ||||||
| Warrants issued as offering costs | $ | 681 | $ | - | $ | - | ||||||
| Supplemental cash flow disclosures: | ||||||||||||
| Cash paid for interest expense | $ | 347 | $ | 408 | $ | 234 | ||||||
| Cash paid for income taxes | $ | - | $ | - | $ | - | ||||||
See accompanying notes to consolidated financial statements.
| 71 |
ADOMANI, INC. AND SUBSIDIARIESNOTES TO CONSOLIDATED FINANCIAL STATEMENTS
| 1. | Organization and operations |
ADOMANI, Inc. (“we”, “us”, “our” or the “Company”) is a provider of zero-emission electric and hybrid vehicles and replacement drivetrains that is focused on reducing the total cost of vehicle ownership. ADOMANI’s drivetrain systems are designed to help fleet operators unlock the benefits of green technology and address the challenges of traditional fuel price cost instability and local, state and federal environmental regulatory compliance. ADOMANI designs advanced zero-emission electric and hybrid drivetrain systems for integration in new school buses and medium to heavy-duty commercial fleet vehicles.
| 2. | Summary of Significant Accounting Policies |
Basis of Presentation—The Company’s consolidated financial statements and related disclosures for the periods ended December 31, 2017, 2016 and 2015, have been prepared using the accounting principles generally accepted in the United States (“U.S. GAAP”).
The Company has incurred losses for the past several years while developing infrastructure and planning a public offering of equity securities. The Company incurred net losses of $21.9 million, $10.7 million, and $6 million during the years ended December 31, 2017, 2016, and 2015, respectively. The Company completed an offering of common stock under Regulation A on June 9, 2017, as discussed in Note 7 below. The Company’s independent registered public accounting firm expressed in its report on the Company’s financial statements for the years ended December 31, 2016 and 2015 that there was substantial doubt about the Company’s ability to continue as a going concern. Based on management’s plans and the significant capital raised during the year ended December 31, 2017, and on January 9, 2018 (see Note 12), that substantial doubt has been resolved.
Principles of Consolidation—The accompanying financial statements reflect the consolidation of the individual financial statements of ADOMANI, Inc., ADOMANI California, Inc., Adomani (Nantong) Automotive Technology Co. Ltd. (“ADOMANI China”), School Bus Sales of California, Inc, and Zero Emission Truck and Bus Sales of Arizona, Inc. All significant intercompany accounts and transactions have been eliminated.
Use of Estimates—The preparation of financial statements in conformity with accounting principles generally accepted in the United States of America requires management to make estimates and assumptions that affect the reported amounts of assets and liabilities and disclosure of contingent assets and liabilities at the date of the financial statements and the reported amounts of revenue and expenses during the reporting period. Actual results could differ from those estimates.
Fair Value of Financial Instruments—The carrying values of our financial instruments, including cash, notes receivable and accounts payable approximate their fair value due to the short-term nature of these financial instruments. Financial Accounting Standards Board (“FASB”) Accounting Standards Codification (“ASC”) No. 820, “Fair Value Measurement” defines fair value as the exchange price that would be received for an asset or paid to transfer a liability (an exit price) in the principal or most advantageous market for the asset or liability in an orderly transaction between market participants on the measurement date. It also establishes a three-tier fair value hierarchy, which prioritizes the inputs used in measuring fair value as follows:
Level 1: Observable inputs such as quoted prices in active markets;
Level 2: Inputs, other than the quoted prices in active markets, that are observable either directly or indirectly; and
Level 3: Unobservable inputs in which there is little or no market data, which require the reporting entity to develop its own assumptions.
The Company does not have any assets or liabilities that are required to be measured and recorded at fair value on a recurring basis.
| 72 |
Revenue Recognition—The Company recognizes revenue from the sales of advanced zero-emission electric drivetrain systems for fleet vehicles. Revenue is recognized when (i) persuasive evidence of an arrangement exists, (ii) delivery has occurred and title has passed, (iii) the price is fixed or determinable and (iv) collectability is reasonably assured. The revenue recorded for the year ended December 31, 2017 was received from one sale.
Cash and Cash Equivalents – The Company considers all highly liquid investments purchased with an original or remaining maturity of three months or less to be cash equivalents.
Accounts Receivable and Allowance for Doubtful Accounts—The Company establishes an allowance for bad debts through a review of several factors including historical collection experience, current aging status of the customer accounts, and financial condition of our customers. We do not generally require collateral for our accounts receivable. The Company had no trade accounts receivable, but had $70,000 in other receivables as of December 31, 2017. The Company provided an allowance of $70,000, $0, and $0 as of December 31, 2017, 2016, and 2015, respectively.
Inventory and Inventory Valuation Allowance—The Company records inventory at the lower of cost or market. A valuation allowance is recorded for any inventory determined to be carried at a cost below market. The Company provided an inventory allowance of $88,772, $0, and $0 as of December 31, 2017, 2016, and 2015, respectively.
Income Taxes—The Company uses the liability method, where deferred tax assets and liabilities are determined based on the expected future tax consequences of temporary differences between the carrying amounts of assets and liabilities for financial and income tax reporting purposes.
The Company records a valuation allowance to reduce the deferred income tax assets to the amount that is more likely than not to be realized. In making such determinations, management considers all available positive and negative evidence, including scheduled reversals of deferred tax liabilities, projected future taxable income, tax planning strategies and recent financial operations. As of December 31, 2017, 2016, and 2015, the Company recognized a full valuation allowance for all deferred tax assets.
Accounting for Uncertainty in Income Taxes—The Company evaluates its uncertain tax positions and will recognize a loss contingency when it is probable that a liability has been incurred as of the date of the financial statements and the amount of the loss can be reasonably estimated. The amount recognized is subject to estimate and management judgment with respect to the likely outcome of each uncertain tax position. The amount that is ultimately sustained for an individual uncertain tax position or for all uncertain tax positions in the aggregate could differ from the amount recognized. At December 31, 2017, 2016, and 2015, management did not identify any uncertain tax positions.
Net Loss Per Share—Basic net loss per share is calculated by dividing the Company’s net loss applicable to common shareholders by the weighted average number of common shares during the period. Diluted net loss per share is calculated by dividing the Company’s net loss applicable to common shareholders by the diluted weighted average number of shares outstanding during the year. The diluted weighted average number of shares outstanding is the basic weighted number of shares adjusted for any potentially dilutive debt or equity securities.
Concentration of Credit Risk—The Company has credit risks related to cash and cash equivalents on deposit with a federally insured bank, as at times it exceeds the $250,000 maximum amount insured by the Federal Deposit Insurance Corporation.
Stock-Based Compensation—The Company accounts for employee stock-based compensation in accordance with the guidance of Financial Accounting Standards Board (“FASB”) Accounting Standards Codification (“ASC”) Topic 718, Compensation—Stock Compensation, which requires all share-based payments to employees, including grants of employee stock options, to be recognized in the financial statements based on their fair values. The fair value of the equity instrument is charged directly to compensation expense and credited to additional paid-in capital over the period during which services are rendered.
The Company follows ASC Topic 505-50, formerly EITF 96-18, “Accounting for Equity Instruments that are Issued to Other than Employees for Acquiring, or in Conjunction with Selling Goods and Services,” for stock options and warrants issued to consultants and other non-employees. In accordance with ASC Topic 505-50, these stock options and warrants issued as compensation for services provided to the Company are accounted for based upon the fair value of the services provided or the estimated fair market value of the option or warrant, whichever can be more clearly determined. The fair value of the equity instrument is charged directly to compensation expense and additional paid-in capital over the period during which services are rendered.
| 73 |
Property and Equipment—Property and equipment are stated at cost, less accumulated depreciation. The Company provides for depreciation using the straight-line method over the estimated useful lives of the assets, which range from three to five years, except leasehold improvements, which are being depreciated over the life of the lease term. Property and equipment qualify for capitalization if the purchase price exceeds $2,000. Major repairs and replacements, which extend the useful lives of equipment, are capitalized and depreciated over the estimated useful lives of the property. All other maintenance and repairs are expensed as incurred.
Leases—The Company has early-adopted ASU No. 2016-02, Leases (Topic 842). The amendment requires companies to recognize leased assets and liabilities on the balance sheet and to disclose key information regarding leasing arrangements. This guidance is effective for annual periods, and interim periods within those annual periods, after December 15, 2018. Early application of this amendment is permitted for all entities. While we do not anticipate that, going forward, leases will be material to our balance sheet, we chose to early-adopt as of December 31, 2017 due to our entering into new leases during the year. These new leases are the only leases required to be included on our balance sheet under the new standard. Consequently, the adoption of the new lease standard did not have any impact to prior period information. Further, these leases are operating leases and, therefore, have no income statement impact resulting from the adoption of this standard.
Impairment of Long-Lived Assets—Long-lived assets, including property and equipment, are reviewed for impairment whenever events or changes in circumstances indicate that the carrying amount of an asset may not be recoverable. The Company evaluates these assets to determine potential impairment by comparing the carrying amount to the undiscounted estimated future cash flows of the related assets. If the estimated undiscounted cash flows are less than the carrying value of the assets, the assets are written down to their fair value. There was no impairment of long-lived assets, or property and equipment, as of December 31, 2017, 2016, and 2015, respectively.
Research and Development—Costs incurred in connection with the development of new products and manufacturing methods are charged to operating expenses as incurred. During 2017, 2016, and 2015, $586,899, $37,273, and $548,889, respectively, were expensed as research and development costs.
Recent Accounting Pronouncements—In May 2014, the FASB issued ASU 2014-09, Revenue from Contracts with Customers (Topic 606) which amended the existing accounting standards for revenue recognition. ASU 2014-09 establishes principles for recognizing revenue upon the transfer of promised goods or services to customers, in an amount that reflects the expected consideration received in exchange for those goods or services. In July 2015, the FASB deferred the effective date for annual reporting periods beginning after December 15, 2017 (including interim reporting periods within those periods). The amendments may be applied retrospectively to each prior period (full retrospective) or retrospectively with the cumulative effect recognized as of the date of initial application (modified retrospective). The Company will adopt ASU 2014-09 in the first quarter of 2018. Because the Company is currently a party to only one contract, and the contract provides for a single performance obligation, the Company anticipates no impact on its consolidated financial statements.
In May 2017, the FASB issued ASU No. 2017-09, Compensation-Stock Compensation (Topic 718): “Scope of Modification Accounting.” The amendments provide guidance on determining which changes to the terms and conditions of share-based payment awards require an entity to apply modification accounting under Topic 718. The guidance is effective for annual periods, and interim periods within those annual periods, beginning after December 15, 2017. Early adoption is permitted, including any interim period, for reporting periods for which financial statements have not been issued. The Company has adopted this change.
Reclassification
Certain amounts in the 2016 financial statements have been reclassified to conform to the 2017 financial presentation. These reclassifications have no impact on net loss.
| 74 |
| 3. | Property and equipment, net |
Components of property and equipment, net consist of the following as of December 31, 2017 and 2016:
| December 31, | December 31, | |||||||
| 2017 | 2016 | |||||||
| Furniture and fixtures | $ | 38,540 | $ | - | ||||
| Leasehold improvements | 11,638 | - | ||||||
| Computers | 53,704 | 4,657 | ||||||
| Vehicles | - | 16,378 | ||||||
| Test/Demo vehicles | 407,612 | 414,023 | ||||||
| Total property and equipment | 511,494 | 435,058 | ||||||
| Less accumulated depreciation | (24,427 | ) | (17,868 | ) | ||||
| Net property and equipment | $ | 487,067 | $ | 417,190 | ||||
Depreciation expense was $18,600, $12,804, and $7,102 for the years ended December 31, 2017, 2016, and 2015, respectively. During the year ended December 31, 2017, we recognized a loss on write-down of property and equipment of $25,679 related to our Test/Demo vehicles due to a break-in at our warehouse.
| 4. | Income Taxes |
The cumulative estimated net operating loss carry-forward is $14,594,776, $7,991,399, and $5,055,663 at December 31, 2017, 2016, and 2015, respectively, and will expire in the years 2037, 2036, and 2035, respectively. Due to the enactment of the Tax Reform Act of 2018, the corporate tax rate for those tax years beginning with 2018 has been reduced to 21%. Therefore, the cumulative tax effect at the expected rate of 21% comprising our net deferred tax amount is as follows:
| December 31, | ||||||||
| 2017 | 2016 | |||||||
| Net operating loss | 1,179,117 | 580,655 | ||||||
| Deferred tax asset attributable to: | ||||||||
| Net operating loss carryover | 3,064,903 | 1,678,194 | ||||||
| Valuation allowance | (3,064,903 | ) | (1,678,194 | ) | ||||
| Net deferred tax asset | - | - | ||||||
| Cumulative NOL | 14,594,776 | 7,991,399 | ||||||
| Cumulative NOL @ 21% | 3,064,903 | 1,678,194 | ||||||
Due to the change in ownership provisions of the Tax Reform Act of 1986, net operating loss carryover for Federal income tax reporting purposes are subject to annual limitations. The net operating loss carry-forward includes the years 2012 through 2017. Should a change in ownership occur, net operating loss carryover may be limited as to use in future years.
| 5. | Notes Receivable |
On June 29, 2017, the Company loaned $500,000 to an unaffiliated third party with engineering expertise in the electric bus technology industry, with whom the Company may seek an alliance at some future date, in order to provide it with working capital. The stated interest rate is 9% per annum, with interest payments due monthly beginning July 31, 2017. The note is secured by the assets of the borrower and matures on December 31, 2017. The note was not repaid when due on December 31, 2017, but has been extended to June 30, 2018 (See Note 12). The Company loaned an additional $500,000 to another unaffiliated third party in the zero-emissions technology industry in December 2016. This note is subject to monthly interest of $10,000 and was extended in January 2018 to April 30, 2018. (See Notes 6 and 12).
| 75 |
| 6. | Debt |
During 2016, 2015 and 2014, the Company issued convertible notes for total proceeds of $42,160, $20,275 and $207,465, respectively, to Acaccia Family Trust (“Acaccia”), formerly a related party. As of December 31, 2016, the outstanding balance of such convertible notes was $359,000. During 2014, the Company issued convertible notes for total proceeds of $286,000 to various third parties. As of December 31, 2016, and 2015, the aggregate face value of the convertible notes issued to third and related parties was $645,000 and $601,840, respectively. All notes had a three-year maturity and bore interest at rates of 3% or 5% per annum. The terms of such loans permitted conversion of all outstanding principal and accrued interest into shares of common stock, with loans totaling $45,000 convertible at a rate of $0.50 per share and loans totaling $600,000, including the convertible notes issued to Acaccia, convertible at $0.10 per share. During 2016, the Company’s CFO purchased $25,000 of the $645,000 convertible notes outstanding from Acaccia. Effective January 30, 2017, all holders of such convertible debt converted their debt, which totaled $725,584, consisting of the outstanding principal amount and accrued and unpaid interest as of the date of conversion, into 6,868,578 shares of common stock (“Common Stock”) in anticipation of our IPO (See Note 7). As of December 31, 2017, all such convertible notes have been converted and no balance remains outstanding thereunder. No gain or loss resulted from the conversion of this debt to equity.
As these notes had an effective conversion price that was less than the fair market value of the Common Stock, these notes gave rise to a beneficial conversion feature totaling $42,160 and $20,275 during 2016 and 2015, respectively, which was recognized as an increase to paid-in capital and a corresponding debt discount. The debt discount was being amortized to interest expense on an effective interest basis over the maturity of the notes. For the years ended December 31, 2017, 2016 and 2015, debt discount amortization associated with these notes was $51,935, $156,955 and $94,660, respectively, which was recognized as interest expense in the accompanying consolidated statements of operations. The unamortized discount of these convertible notes was $0, $51,935, and $163,015 at December 31, 2017, 2016, and 2015, respectively.
During 2015, the Company issued two-year secured promissory notes with an aggregate face value of $5,147,525 to third-party lenders for cash. The notes are secured by all the assets of the Company, matured between January and November 2017 and bear interest at 9%. The Company has notified all holders of the 9% secured notes payable that it was exercising its option to extend the maturity dates six months pursuant to the provisions of the notes. In connection with these notes, the Company incurred debt issuance costs of $514,753, which are being recognized as debt discount and amortized over the life of the notes. During the years ended December 31, 2017, 2016 and 2015, the debt discount amortization associated with these notes was $29,006, $328,609 and $157,138, respectively, which was recognized as interest expense in the accompanying consolidated statements of operations. As of December 31, 2017, the debt issuance costs associated with these notes have been fully amortized. As of December 31, 2017, the Company has repaid in cash $2,106,325 in principal relative to these notes. In September 2016, the Company authorized the exchange of $884,700 principal amount of these notes for 884,700 shares of Common Stock. There was no gain or loss that resulted from the conversion of the notes to equity.
On November 18, 2016, the Company issued a promissory note with a principal amount of $500,000 to a stockholder in order to insure adequate working capital through the close of its IPO. The loan evidenced by the note was for a period of one year, at an interest rate of 5% per annum, with the principal and any unpaid interest due and payable in cash at maturity. On March 17, 2017, due to unforeseen delays in the closing of the IPO, the Company issued a second promissory note with a principal amount of $500,000 to the same stockholder in order to address additional liquidity concerns. The second note also bore interest at a rate of 5% per annum, with the principal and any unpaid interest due and payable in cash at maturity. The loans were scheduled to mature on November 15, 2017, unless previously repaid in accordance with the terms thereof. On May 12, 2017, the Company repaid both notes, plus accrued and unpaid interest of $15,685, from the proceeds of the initial closing of the IPO.
In December 2016, the Company borrowed $500,000 from an unaffiliated third party. The loan was scheduled to mature on June 15, 2017. It contained no stipulated interest rate, but the Company was obligated to pay loan fees of $50,000 to the lender. The proceeds of the loan were immediately used to loan $500,000 to an unaffiliated company in the zero-emissions technology industry that specializes in drivetrain solutions for zero-emission and hybrid vehicles. The loan, carried as a note receivable on the balance sheet, contains the same provisions, including the loan fees payable to the Company, as the note payable discussed above in this paragraph, and also was scheduled to mature on June 15, 2017. The Company repaid the loan to the unaffiliated third party on May 12, 2017 from the proceeds of the initial closing of the IPO. The maturity date for the note receivable was extended to December 31, 2017, and the unaffiliated third party began paying interest of $10,000 per month to the Company. During the year ended December 31, 2017, the related amortization expense recognized on this loan amounted to $45,833. The note was not repaid when due on December 31, 2017, but has been extended to April 30, 2018. (See Note 12).
| 76 |
In January 2015, in connection with the 2015 9% secured notes payable financing discussed above, the Company agreed to issue a warrant exercisable for 1,250,000 shares of Common Stock of the Company at an exercise price of $4.00 per share. The warrant, actually issued in September 2016, was valued using the Black Scholes valuation model and the resulting fair market value of $349,042 was recorded in 2015 as debt discount and is being amortized over the term of the notes. Interest expense relating to the amortization of this discount was $3,347, $174,998, and $170,698 for the years ended December 31, 2017, 2016, and 2015, respectively. As of December 31, 2017, the fair market value of the warrant was fully amortized.
Details of notes payable at December 31, 2017 and 2016 are as follows:
| As of December 31, | As of December 31, | |||||||
| 2017 | 2016 | |||||||
| Convertible Debt | ||||||||
| Principal amount outstanding | $ | - | $ | 645,000 | ||||
| Cumulative discount for notes with beneficial conversion feature | - | (349,560 | ) | |||||
| Cumulative amortization of debt discount | - | 297,625 | ||||||
| Subtotal of convertible notes @ $0.10 or $.50/share | - | 593,065 | ||||||
| Notes Payable | ||||||||
| Principal amount outstanding | 2,149,000 | 5,255,325 | ||||||
| Cumulative discount for finance charges incurred | (514,753 | ) | (514,753 | ) | ||||
| Cumulative discount for warrant | (349,042 | ) | (349,042 | ) | ||||
| Cumulative discount for 9% notes | (50,000 | ) | (50,000 | ) | ||||
| Cumulative amortization of finance charges | 514,753 | 485,747 | ||||||
| Cumulative amortization of warrant expense | 349,042 | 345,695 | ||||||
| Cumulative amortization of 9% notes | 50,000 | 4,167 | ||||||
| Subtotal of notes payable | 2,149,000 | 5,177,139 | ||||||
| Total of debt | $ | 2,149,000 | $ | 5,770,204 | ||||
| 7. | Common Stock |
Effective January 30, 2017, all holders of the $645,000 original principal amount of convertible debt converted their debt, which totaled $725,584, consisting of the outstanding principal amount and accrued and unpaid interest as of the date of conversion, into 6,868,578 shares of Common Stock. (See Note 6).
In March 2017, Dennis Di Ricco, who formerly served as the trustee of Acaccia, along with his family members and trusts) relinquished voting and investment power over all securities of the Company they owned, which constituted approximately 22% of the outstanding Common Stock of the Company. Mr. Di Ricco also surrendered his options to purchase up to 7,000,000 shares of common stock for forfeiture and cancellation (see Note 10), and sold (in a private transaction to which the Company was not a party) all 2,500,000 shares of Common Stock held as of record by his IRA. In connection with the foregoing, the Company and Mr. Di Ricco also terminated their consulting relationship. See Note 11.
In March 2016, the Company entered into a consulting agreement with Redwood Group International Limited (“Redwood”). In exchange for its services, Redwood received $5,000 per month in retainer payments and was eligible to receive other fees and warrants, as set forth in the consulting agreement. The initial term of the consulting agreement was 12 months, ending on February 28, 2017, although the term would automatically extend for an additional 12 months unless terminated by either party. On September 29, 2016, the Company executed a letter agreement with Redwood, pursuant to which it issued to Redwood an additional 100,000 shares of Common Stock, subject to Redwood satisfying certain performance thresholds. If Redwood failed to meet such performance thresholds, the agreement provided the Company with an exclusive option to reacquire all or a portion of the shares of Common Stock at $0.00001 per share. On November 15, 2016, the Company and Redwood agreed to terminate the original consulting agreement and entered into a new consulting agreement that was set to expire upon thirty days’ written notice by either party following the successful completion of the Company’s IPO. The new consulting agreement was substantially similar to the prior agreement with respect to fees and warrants due to Redwood, and provided that the Company would pay Redwood a sum of $800,000 and issue Redwood a warrant to acquire 350,000 shares of Common Stock. In May 2017, the Company and Redwood mutually agreed to terminate this agreement. On June 8, 2017, the Company paid a fee of $800,000 to Redwood and issued Redwood a warrant to purchase 350,000 shares of Common Stock, in connection with which the Company cancelled the 100,000 shares of Common Stock it had previously issued pursuant to the September 2016 letter agreement. The warrant to purchase 350,000 shares of Common Stock was valued using the Black Scholes method resulting in a fair market value of $1.24 million, which was charged to consulting expense for the year ended December 31, 2017. The assumptions used in the valuation included the term of 5 years, the exercise price of $5.00 per share, volatility of 92% and a risk-free interest rate of 1.75%. The fair value of the warrant was recorded as consulting expense during the year ended December 31, 2017.
| 77 |
On June 9, 2017, the Company consummated the final closing of the IPO, as discussed in Note 2 above. The Company sold an aggregate of 2,852,275 shares of Common Stock, of which 342,273 shares were sold on behalf of certain stockholders of the Company who elected to participate in the IPO, for aggregate gross proceeds of $14,261,375. Net proceeds received after deducting commissions, expenses and fees of approximately $2.5 million and the $1,711,365 proceeds remitted to selling shareholders for the sale of their shares, amounted to approximately $10.0 million. As such, the Company issued and sold an aggregate of 2,510,002 shares of Common Stock in connection with the IPO, excluding the shares sold by the selling stockholders. In connection with the final closing of the IPO on June 9, 2017, the Company issued an additional 250,000 shares of Common Stock, valued at $1,250,000 under the terms of a consulting agreement. Under the terms of the underwriting agreement executed in connection with the IPO, the Company issued to Boustead Securities, LLC a warrant to purchase 199,659 shares of Common Stock. The warrant to purchase 199,659 shares of Common Stock was valued using the Black Scholes method resulting in a fair market value of $680,543. The assumptions used in the valuation included the term of 5 years, the exercise price of $6.00 per share, volatility of 92% and a risk-free interest rate of 1.75%. The fair value of the warrant was recorded as offering costs and netted against additional paid in capital during the year ended December 31, 2017.
During 2016, the Company issued 206,400 shares of its common stock to third party investors for net proceeds of $188,000 and issued 98,000 shares as payment for services valued at $98,000. 86,500 of these shares were issued to the Company’s CFO. The CFO also purchased 10,000 shares from Acaccia.
In 2012, one of our shareholders advanced the sum of $64,000 for the anticipated purchase of 32,000,000 shares of common stock by one of the Company’s Officers and Directors with the condition that the Officer/Director either pay the Company $64,000 for the shares in which case the $64,000 advanced by the shareholder would be returned to the shareholder by the Company; or the Officer/Director reimburse the shareholder for the $64,000 so advanced. The conditional action by the Officer/Director never occurred and the shareholder rescinded the $64,000 advanced and requested that the Company return the $64,000 so advanced by him. On May 4, 2016, the Board of Directors of the Company approved the rescission and the return of the $64,000 plus statutory interest to the shareholder and to cancel the proposed issuance of the 32,000,000 shares.
On July 8, 2016, the Board of Directors approved a modification to the May 2016 rescission agreement such that 5,000,000 shares were returned to the shareholder, who in turn repaid the Company the pro-rata amount of the payment he received in May. The shareholder subsequently sold the 5,000,000 shares to the CEO at his cost, which was substantially less than the market value. As a result, $4,990,000 was recorded as stock-based compensation in July 2016.
During 2015, the Company issued 2,659,000 shares of its common stock to third party investors for proceeds of $1,982,000. Included in that amount, as part of its compensation strategy, the Company issued 500,000 shares of its Common Stock to its CEO at below fair market value. See Note 9.
| 78 |
| 8. | Stock Warrants |
As of December 31, 2017, the Company has issued warrants to purchase 1,799,659 shares of Common Stock, consisting of a warrant to purchase 199,659 shares of Common Stock with a measurement price of $5.00 and an exercise price of $6.00, a warrant to purchase 350,000 shares of Common Stock with a measurement price of $5.00 and an exercise price of $5.00, and a warrant to purchase 1,250,000 shares of Common Stock with a measurement price of $1.00 and an exercise price of $4.00.
The Company’s stock warrant activity for the years ended December 31, 2017, 2016, and 2015 is summarized as follows:
| Weighted | ||||||||||||
| Weighted | Average | |||||||||||
| Average | Remaining | |||||||||||
| Number of Shares | Exercise Price | Contractual Life (years) | ||||||||||
| Outstanding at December 31, 2014 | - | $ | - | |||||||||
| Granted | 1,250,000 | 4.00 | ||||||||||
| Forfeited | - | - | ||||||||||
| Outstanding at December 31, 2015 | 1,250,000 | $ | 4.00 | |||||||||
| Granted | - | - | ||||||||||
| Forfeited | - | - | ||||||||||
| Outstanding at December 31, 2016 | 1,250,000 | $ | 4.00 | |||||||||
| Granted | 549,659 | 5.36 | ||||||||||
| Forfeited | - | |||||||||||
| Outstanding at December 31, 2017 | 1,799,659 | $ | 4.42 | 3.87 | ||||||||
| Exercisable at December 31, 2017 | 1,799,659 | $ | 4.42 | 3.87 | ||||||||
As of December 31, 2017, the outstanding warrants have an intrinsic value of approximately $500,000.
| 9. | Stock-Based Compensation |
In March 2017, Dennis Di Ricco surrendered his options to purchase up to 7,000,000 shares of Common Stock for forfeiture or cancellation.
In March 2017, the board of directors of the Company (the “Board”) consented to the grant of options to purchase an aggregate of 3,600,000 shares of Common Stock to 13 people (employees and current Board members). The options vest over a three-year period, and the exercise price was determined based on the average of the trading price of the Company’s Common Stock on the Nasdaq Capital Market for the first ten days following the close of its IPO, which was $10.49. The options were valued using the Black Scholes method, resulting in a fair market value of $37.6 million. The assumptions used in the valuation included an expected term of 4.75 years; volatility of 86% and a risk-free interest rate of 2.02%.
In 2016, as discussed above, the 5,000,000 shares purchased by the CEO from the shareholder required the Company to recognize $4,990,000 stock-based compensation.
During 2015, as part of its compensation strategy, the Company issued 500,000 shares of its Common Stock with a fair value of $500,000 to its CEO in exchange for cash of $1,000. As the shares were fully vested at the issuance date, the Company immediately recognized stock-based compensation of $499,000.
| 79 |
Stock option activity for the years ended December 31, 2017, 2016, and 2015 is as follows:
| Weighted | ||||||||||||
| Weighted | Average | |||||||||||
| Average | Remaining | |||||||||||
| Number of Shares | Exercise Price | Contractual Life (years) | ||||||||||
| Outstanding at December 31, 2014 | 33,500,000 | $ | 0.10 | |||||||||
| Granted | 275,000 | 0.10 | ||||||||||
| Forfeited | - | - | ||||||||||
| Outstanding at December 31, 2015 | 33,775,000 | $ | 0.10 | |||||||||
| Granted | - | - | ||||||||||
| Forfeited | - | - | ||||||||||
| Outstanding at December 31, 2016 | 33,775,000 | $ | 0.10 | |||||||||
| Granted | 3,600,000 | 10.49 | ||||||||||
| Forfeited | (7,000,000 | ) | ||||||||||
| Outstanding at December 31, 2017 | 30,375,000 | $ | 1.33 | 4.0 | ||||||||
| Exercisable at December 31, 2017 | 24,396,007 | $ | 0.51 | 3.6 | ||||||||
Stock-based compensation expense was $15 million, $7.6 million, and $3 million for the years ended December 31, 2017, 2016, and 2015, respectively, and is included in general and administrative expense in the accompanying consolidated statements of operations. For the year ended December 31, 2017, this expense includes an adjustment due to the remeasurement of the fair market value of non-employee stock options, in accordance with ASC 505. ASC 505 requires a remeasurement of the fair market value of non-employee stock options at each interim vesting period, based on the Company’s stock price on the interim vesting date, and the related stock-based compensation expense is adjusted accordingly at each balance sheet date. As of December 31, 2017, the Company expects to recognize $39.1 million of stock-based compensation for the non-vested outstanding options over a weighted-average period of 2.09 years.
As of December 31, 2017, the outstanding options have an intrinsic value of approximately $115.1 million.
| 10. |
Commitments |
Employment Agreements—Effective September 1, 2014, the Company executed an employment agreement with James Reynolds, its Chief Executive Officer. The term of the employment agreement is 5 years, and the agreement provides for an annual base salary of $240,000 and entitles Mr. Reynolds to receive a bonus of five percent of the Company’s net profits on an annual basis.
Effective September 1, 2014, the Company executed an employment agreement with Edward Monfort, its now former Chief Technology Officer. The term of the employment agreement was 5 years, and the agreement provided for an annual base salary of $240,000 and entitled Mr. Monfort to receive a bonus of five percent of the Company’s net profits. In June 2016, Mr. Monfort entered into a new employment agreement with a two-year term, which superseded the 2014 employment agreement, pursuant to which his salary was reduced to $120,000 per annum. Additionally, the Company pays up to $7,000 per month to ELO, LLC, an entity owned by Mr. Monfort, for invoiced expenses relating to research and development pursuant to a consulting relationship, as well as up to $3,000 per month for services to another consultant selected by Mr. Monfort. Mr. Monfort’s employment agreement was terminated by the Company, effective March 6, 2018.
Effective January 1, 2017, the Company entered into an employment agreement with Michael Menerey, its Chief Financial Officer. The term of the employment agreement is five years and the agreement provides for an annual base salary of $200,000.
| 80 |
Operating Leases—In 2015, the Company signed an office and warehouse lease agreement for a facility in Orange, California, to serve as its primary facility for research and development activity. The initial term of the lease expired on February 29, 2016, at which time the Company extended the lease for two additional years, until February 28, 2018. The total amount due annually under the lease was $44,856. This lease was terminated, effective August 15, 2017 and, because of the early termination, required the refundable deposit, in the amount of $3,524, to be forfeited.
The Company signed a one-year office lease for office space in Newport Beach, California, to serve as office space for its headquarters. The initial term of the lease expired on December 31, 2016, at which time the Company extended the lease on a month-to-month basis. The total amount due monthly was approximately $3,400. This lease was terminated, effective September 30, 2017, due to signing a lease for office space in Corona, California.
In 2016, the Company signed a lease for office space in Los Altos, California, to serve as office space for its Northern California operations. The lease expired February 28, 2017 and the Company executed a new one-year lease in February 2017. The total amount due under the lease is $5,200 and the lease period is from March 1, 2017 through February 28, 2018.
In 2017, the Company signed a lease for storage space in Phoenix, Arizona to serve as a location to store vehicles and other equipment utilized for marketing and trade-show purposes. The lease is on a month-to-month basis and can be terminated by either party with 30-days notice. The total due monthly is $500.
In 2017, the Company signed a lease for storage space in Stockton, California to serve as a location to store vehicles and other equipment utilized for marketing and trade-show purposes. The lease is on a month-to-month basis and can be terminated by either party with 30-days notice. The total due monthly is $1,000.
In 2017, the Company signed a lease for corporate office space in Corona, California, to serve as its corporate headquarters. The lease is for a period of 65 months, terminating February 28, 2023. The base rent for the term of the lease is $568,912. The lease contains a rent escalation provision that begins at $7,600 per month at commencement, and becomes $10,560 per month by its conclusion.
In 2017, the Company signed a lease for two copiers for its corporate offices. The lease is for a period of 24 months, terminating September 30, 2019. The total due monthly is $380.
Other Agreements—In 2015, the Company entered into a contract with THINKP3 to provide services with the goal of securing federal grant assistance for development of the Company’s zero-emission and hybrid transportation solutions for school bus, commercial, government and utility fleets. The initial term of this contract was December 1, 2015 through November 30, 2016. On November 21, 2016, the parties renewed the agreement through November 30, 2017. On November 7, 2017, the agreement was renewed through November 30, 2018. Fees for these services are $8,000 per month. The contract can be terminated by either party with 30-days advance notice.
In March 2015, the Company signed a licensing option agreement with Silicon Turbines Systems, Inc. for use of its patent in manufacturing. The option calls for a payment of $10,000 per month, beginning March 1, 2015, up to a full investment amount of $3,000,000. The agreement provided that the original option would terminate on August 31, 2015, but the parties agreed verbally to both extend the date of termination of the option and delay the Company’s obligation to make any additional monthly payments under the option agreement while both companies evaluate the relationship. As a result, no payments were made in 2017. For the year ended December 31, 2016, the Company made one $10,000 payment. In September 2017, the Company determined they no longer desired to continue this relationship. Therefore, effective September 30, 2017, the $120,000 investment was written off.
In 2016, the Company signed an advisor agreement with Dennis Di Ricco, formerly a related party and stockholder, pursuant to which Mr. Di Ricco would provide consulting services to the Company. In March 2017, the Company terminated this agreement (see Note 9).
| 81 |
The following table summarizes our future minimum payments under contractual commitments, excluding debt, as of December 31, 2017:
| Payments due by period | ||||||||||||||||||||
| Total | Less than one year | 1 - 3 years | 4 - 5 years | More than 5 years | ||||||||||||||||
| Operating lease obligations | 570,238 | 74,626 | 350,364 | 145,248 | - | |||||||||||||||
| Employment contracts | 1,241,846 | 481,846 | 760,000 | - | - | |||||||||||||||
| Total | 1,812,084 | 556,472 | 1,110,364 | 145,248 | - | |||||||||||||||
| 11. | Leases |
As of December 31, 2017, the Company is a party to five operating leases. Four of these leases are office or warehouse leases and the fourth is an equipment lease (See Note 10). As disclosed in Note 2, the Company early adopted ASC 842 to our existing leases. The Company has elected to apply the short-term lease exception to all leases of one year or less. As such, we applied the guidance in ASC 842 to our corporate office and equipment leases and have determined that these should be classified as operating leases. Consequently, as a result of the adoption of ASC 842, we recognized an operating liability of $377,129 with a corresponding Right-Of-Use (“ROU”) asset of the same amounts based on the present value of the minimum rental payments of such leases. As of December 31, 2017, the ROU asset has a balance of $359,504 which is included in other non-current assets in the consolidated balance sheets and current liabilities and non-current liabilities relating to the ROU asset were $70,492, and $289,012, respectively which are included in accrued liabilities and other non-current liabilities in the consolidated balance sheets, respectively. The discount rate used for leases accounted under ASC 842 is the Company’s estimated borrowing rate of 14%. The corporate office lease provides for one three-year option to renew with nine months advanced notice to the landlord. The option to renew the corporate office lease was not considered when assessing the value of the ROU asset because the Company was not reasonably certain that it will assert its option to renew the lease.
As of December 31, 2017, this exception applies to the Phoenix, AZ and Stockton, CA leases, which are month-to-month, and the Los Altos, CA lease, which is for a term of one year.
Quantitative information regarding the Company’s leases is as follows:
| Year Ended December 31, | ||||||||||||
| 2017 | 2016 | 2015 | ||||||||||
| Lease Cost | ||||||||||||
| Operating lease cost | $ | 27,397 | $ | 77,375 | $ | 62,250 | ||||||
| Short-term lease cost | 107,575 | - | - | |||||||||
| Total lease cost | $ | 134,972 | $ | 77,375 | $ | 62,250 | ||||||
| Other Information | ||||||||||||
| Cash paid for the amounts included in the measurement of lease liabilities for operating leases: | ||||||||||||
| Operating cash flows | 8,740 | - | - | |||||||||
| Weighted-average remaining lease term (in years): | ||||||||||||
| Operating leases | 5.05 | N/A | N/A | |||||||||
| Weighted-average discount rate: | ||||||||||||
| Operating leases | 14 | % | N/A | N/A | ||||||||
| 82 |
| 12. | Subsequent Events |
On January 9, 2018, the Company consummated the closing of a follow-on offering. The Company sold an aggregate of 3,666,667 units for aggregate gross proceeds of $11,000,001. Each unit consists of one share of Common Stock and a warrant to purchase 1.5 shares of Common Stock at an exercise price of $4.50. Net proceeds received after deducting commissions, expenses and fees of approximately $1.2 million amounted to approximately $9.8 million. Under the terms of the underwriting agreement executed in connection with the follow-on offering, the Company issued to Boustead Securities, LLC and to Roth Capital Partners, LLC warrants to purchase 256,667 shares of Common Stock. The warrants to purchase 256,667 shares of Common Stock were valued using the Black Scholes method resulting in a fair market value of $598,737. The assumptions used in the valuation included the term of five years, the exercise price of $3.75 per share, volatility of 92.20% and a risk-free interest rate of 2.13%. The fair value of the warrants will be recorded as offering costs and netted against additional paid in capital during the three months ended March 31, 2018.
On January 10, 2018, as a result of receiving the proceeds at the closing of our follow-on offering described above, all remaining outstanding principal on the 9% secured notes was repaid along with any accrued, but unpaid, interest (See Note 6).
By mutual consent, the Company agreed to extend the note to the unaffiliated third party in the zero-emissions technology industry until April 30, 2018 (see Notes 5 and 6). The extension was executed on January 12, 2018. In exchange for extending the maturity date, the borrower agreed to pay ADOMANI an extension fee of $25,000 due no later than the April 30, 2018 maturity date.
By mutual consent, the Company agreed to extend the note to the unaffiliated third party with engineering expertise in the electric bus technology industry until June 30, 2018 (see Note 5). The extension was executed in February 2018. In exchange for extending the maturity date, the borrower agreed to pay ADOMANI 11% interest for January 2018, which is the “default rate” under the existing note (“Applicable Rate plus 2%”), and an extension fee of $25,000 due no later than the June 30, 2018 maturity date.
In early March 2018, due to the termination of an executive officer, 15,000,000 options exercisable at $0.10 per share (14,150,602 vested), and 150,000 options exercisable at $10.49 per share (40,511 vested) were forfeited.
| 83 |
| Item 9. | Changes in and disagreements with Accountants on Accounting and Financial Disclosure |
None.
| Item 9A. | Controls and Procedures |
Evaluation of Disclosure Controls and Procedures
Our management, with the participation of our Chief Executive Officer and Chief Financial Officer, has evaluated the effectiveness of our disclosure controls and procedures (as such term is defined in Rules 13a-15(e) and 15d-15(e) under the Securities Exchange Act of 1934, as amended (Exchange Act)) as of the end of the period covered by this Annual Report. Based on this evaluation, our Chief Executive Officer and our Chief Financial Officer have concluded that our disclosure controls and procedures (a) were effective to ensure that information that we are required to disclose in reports that we file or submits under the Exchange Act is recorded, processed, summarized and reported within the time periods specified in SEC rules and forms and (b) include, without limitation, controls and procedures designed to ensure that information required to be disclosed by us in reports filed or submitted under the Exchange Act is accumulated and communicated to our management, including our Chief Executive Officer and Chief Financial Officer, as appropriate, to allow timely decisions regarding required disclosure.
Management’s Report on Internal Control over Financial Reporting
This Annual Report does not include a report of management’s assessment regarding internal control over financial reporting or an attestation report of our independent registered public accounting firm due to a transition period established by the rules of the SEC for newly public companies.
Changes in Internal Control over Financial Reporting
There were no changes in our internal control over financial reporting that occurred during the fourth quarter of 2017 that materially affected, or are reasonably likely to materially affect, our internal control over financial reporting.
| 84 |
| Item 9B. | Other Information |
None.
| 85 |
Part III
| Item 10. | DIRECTORS, EXECUTIVE OFFICERS AND CORPORATE GOVERNANCE |
The information required hereunder is incorporated herein by reference to either a definitive proxy statement or an amendment to this Annual Report on Form 10-K to be filed within 120 days of December 31, 2017.
| Item 11 | EXECUTIVE COMPENSATION |
The information required hereunder is incorporated herein by reference to either a definitive proxy statement or an amendment to this Annual Report on Form 10-K to be filed within 120 days of December 31, 2017.
| Item 12 | SECURITY OWNERSHIP OF CERTAIN BENEFICIAL OWNERS AND MANAGEMENT AND RELATED STOCKHOLDER MATTERS |
The information required hereunder is incorporated herein by reference to either a definitive proxy statement or an amendment to this Annual Report on Form 10-K to be filed within 120 days of December 31, 2017.
Securities Authorized for Issuance Under Equity Compensation Plans
The following table sets forth information with respect to securities authorized for issuance under our equity compensation plans as of December 31, 2017:
| Number of securities to be issued upon exercise of outstanding options, warrants, and rights | Weighted-average exercise price of outstanding options, warrants, and rights | Number of securities remaining available for issuance under equity compensation plans (excluding securities reflected in column (a)) | ||||||||||
| Plan Category | (a) | (b) | (c) (1) | |||||||||
| Equity compensation plans approved by security holders | 24,396,007 | $ | 1.33 | 15,000,000 | ||||||||
| Equity compensation plans not approved by security holders | 0 | $ | - | 0 | ||||||||
| Total | 24,396,007 | $ | 1.33 | 15,000,000 | ||||||||
| (1) | On June 9, 2017, our board of directors and stockholders approved and ratified our 2017 Equity Incentive Plan (2017 Plan) authorizing the grant to officers, consultants and directors of stock options, stock appreciation rights, restricted stock, restricted stock units, performance shares and units and other cash-based or stock-based awards. The 2017 Plan initially authorizes and reserves 15,000,000 shares of our common stock, subject to an automatic annual increase equal to the smaller of 3% of the number of shares of common stock issued and outstanding on the immediately preceding December 31, or (b) an amount determined by our board of directors. No options have been issued under the 2017 Plan to date. The 2017 Plan replaced our 2012 Stock Option Plan (2012 Plan). The participants under the 2012 Plan elected to cancel their options to purchase our securities. |
| Item 13 | CERTAIN RELATIONSHIPS AND RELATED TRANSACTIONS, AND DIRECTOR INDEPENDENCE |
The information required hereunder is incorporated herein by reference to either a definitive proxy statement or an amendment to this Annual Report on Form 10-K to be filed within 120 days of December 31, 2017.
| Item 14. | PRINCIPAL ACCOUNTING FEES AND SERVICES |
The information required hereunder is incorporated herein by reference to either a definitive proxy statement or an amendment to this Annual Report on Form 10-K to be filed within 120 days of December 31, 2017.
| 86 |
Part IV
| Item 15. | Exhibits, Financial Statement Schedules |
(a) The following documents are filed as part of this Annual Report:
(1) Financial Statements.
The financial statements filed as part of this Annual Report are listed in the “Index to Consolidated Financial Statements” under Part II, Item 8 of this Annual Report.
(2) Financial Statement Schedules.
Schedules are omitted because the required information is not present or is not present in amounts sufficient to require submission of the schedule or because the information required is given in the consolidated financial statements or the notes thereto.
(3) Exhibits.
The following exhibits are filed (or incorporated by reference herein) as part of this Annual Report:
| 87 |
Exhibit Index
| 88 |
| + | Indicates a management contract or compensatory plan. |
| # | The information in Exhibit 32.1 shall not be deemed “filed” for purposes of Section 18 of the Securities Exchange Act of 1934, as amended, or the Exchange Act, or otherwise subject to the liabilities of that section, nor shall it be deemed incorporated by reference in any filing under the Securities Act of 1933, as amended, or the Securities Act, or the Exchange Act (including this report), unless the Registrant specifically incorporates the foregoing information into those documents by reference. |
| * | In accordance with Rule 402 of Regulation S-T, this interactive data file is deemed not filed or part of this Annual Report on Form 10-K for purposes of Sections 11 or 12 of the Securities Act or Section 18 of the Exchange Act and otherwise is not subject to liability under these sections. |
| Item 16. | Form 10-K Summary |
None.
| 89 |
SIGNATURES
Pursuant to the requirements of Section 13 or 15(d) of the Securities Exchange Act of 1934, the registrant has duly caused this report to be signed on its behalf by the undersigned, thereunto duly authorized.
| ADOMANI, INC. | ||
| Date: March 12, 2018 | By: | /s/ James L. Reynolds |
| James L. Reynolds | ||
| Chief Executive Officer and President | ||
KNOW ALL PERSONS BY THESE PRESENTS, that each person whose signature appears below constitutes and appoints James L. Reynolds and Michael K. Menerey, jointly and severally, his attorneys-in-fact, each with the power of substitution, for him in any and all capacities, to sign any amendments to this report, and to file the same, with exhibits thereto and other documents in connection therewith, with the Securities and Exchange Commission, hereby ratifying and confirming all that each of said attorneys-in-fact, or his substitute or substitutes, may do or cause to be done by virtue hereof.
Pursuant to the requirements of the Securities Exchange Act of 1934, this report has been signed below by the following persons on behalf of the registrant in the capacities and on the dates indicated.
| Signature | Title | Date | ||
|
/s/ James L. Reynolds |
Chief Executive Officer, President, Chairman of the Board (Principal Executive Officer) | March 12, 2018 | ||
| James L. Reynolds | ||||
|
/s/ Michael K. Menerey |
Chief Financial Officer and Director (Principal Financial Officer and Principal Accounting Officer) | March 12, 2018 | ||
| Michael K. Menerey | ||||
| /s/ Gary W. Nettles | Director | March 12, 2018 | ||
| Gary W. Nettles | ||||
|
/s/ Janet Boydell |
Director |
March 12, 2018 | ||
| Janet Boydell | ||||
| /s/ John F. Perkowski | Director | March 12, 2018 | ||
| John F. Perkowski |