Attached files
| file | filename |
|---|---|
| EX-31.1 - EXHIBIT 31.1 - NEOPHOTONICS CORP | nptn123117exhibit311.htm |
| EX-32.1 - EXHIBIT 32.1 - NEOPHOTONICS CORP | nptn123117exhibit321.htm |
| EX-31.2 - EXHIBIT 31.2 - NEOPHOTONICS CORP | nptn123117exhibit312.htm |
| EX-23.1 - EXHIBIT 23.1 - NEOPHOTONICS CORP | nptn123117exhibit231.htm |
| EX-21.1 - EXHIBIT 21.1 - NEOPHOTONICS CORP | nptn123117exhibit211.htm |
| EX-10.74 - EXHIBIT 10.74 - NEOPHOTONICS CORP | exhibit1074.htm |
| EX-10.73 - EXHIBIT 10.73 - NEOPHOTONICS CORP | exhibit10731.htm |
| EX-10.72 - EXHIBIT 10.72 - NEOPHOTONICS CORP | exhibit1072.htm |
UNITED STATES
SECURITIES AND EXCHANGE COMMISSION
Washington, D.C. 20549
__________________________________________________________________
Form 10-K
_____________________________________________________
(Mark One)
☒ ANNUAL REPORT PURSUANT TO SECTION 13 OR 15(d) OF THE SECURITIES EXCHANGE ACT OF 1934
For the fiscal year ended December 31, 2017
OR
☐ TRANSITION REPORT PURSUANT TO SECTION 13 OR 15(d) OF THE SECURITIES EXCHANGE ACT OF 1934
For the transition period from to
001-35061
(Commission File No.)
__________________________________________________
NeoPhotonics Corporation
(Exact name of Registrant as specified in its charter)
_______________________________________________________________
Delaware | 94-3253730 | |
(State or other jurisdiction of incorporation or organization) | (I.R.S. Employer Identification No.) | |
2911 Zanker Road
San Jose, California 95134
(Address of principal executive offices, zip code)
Registrant’s telephone number, including area code:
+1 (408) 232-9200
Securities registered pursuant to Section 12(b) of the Act:
Title of Each Class | Name of Exchange on Which Registered | |
Common Stock, par value $0.0025 per share | New York Stock Exchange | |
Securities registered pursuant to Section 12(g) of the Act:
None
___________________________________________________________
Indicate by check mark if the Registrant is a well-known seasoned issuer, as defined in Rule 405 of the Securities Act of 1933. Yes ☐ No ☒
Indicate by check mark if the Registrant is not required to file reports pursuant to Section 13 or Section 15(d) of the Act. Yes ☐ No ☒
Indicate by check mark whether the Registrant (1) has filed all reports required to be filed by Section 13 or 15(d) of the Exchange Act of 1934 during the preceding 12 months (or for such shorter period that the Registrant was required to file such reports), and (2) has been subject to such filing requirements for the past 90 days. Yes ☒ No ☐
Indicate by check mark whether the Registrant has submitted electronically and posted on its corporate Website, if any, every Interactive Data File required to be submitted and posted pursuant to Rule 405 of Regulation S-T (§ 232.405 of this chapter) during the preceding 12 months (or for such shorter period that the Registrant was required to submit and post such files). Yes ☒ No ☐
Indicate by check mark if disclosure of delinquent filers pursuant to Item 405 of Regulation S-K is not contained herein, and will not be contained, to the best of Registrant’s knowledge, in definitive proxy or information statements incorporated by reference in Part III of this Form 10-K or any amendment to this Form 10-K. ☒
Indicate by check mark whether the registrant is a large accelerated filer, an accelerated filer, a non-accelerated filer, a smaller reporting company, or an emerging growth company. See the definitions of “large accelerated filer,” “accelerated filer,” “smaller reporting company,” and "emerging growth company" in Rule 12b-2 of the Exchange Act.
Large accelerated filer | ☐ | Accelerated filer | ☒ | |||
Non-accelerated filer | ☐ (Do not check if a smaller reporting Company) | Small reporting company | ☐ | |||
Emerging growth company | ☐ | |||||
If an emerging growth company, indicate by check mark if the registrant has elected not to use the extended transition period for complying with any new or revised financial accounting standards provided pursuant to Section 13(a) of the Exchange Act. ☐
Indicate by check mark whether the Registrant is a shell company (as defined in Rule 12b-2 of the Act). Yes ☐ No ☒
As of June 30, 2017, the approximate aggregate market value of voting stock held by non-affiliates of the Registrant, based upon the last sale price of the Registrant’s common stock on the last business day of the Registrant’s most recently completed second fiscal quarter, June 30, 2017 (based upon the closing sale price of the Registrant’s common stock on the New York Stock Exchange), was approximately $256,840,000. This calculation excludes 10,298,290 shares held by directors, executive officers and stockholders affiliated with our directors and executive officers.
As of February 28, 2018, the Registrant had 44,278,392 outstanding shares of Common Stock.
__________________________________________________
DOCUMENTS INCORPORATED BY REFERENCE
The Registrant has incorporated by reference into Part III of this Annual Report on Form 10-K portions of its Proxy Statement for its 2018 Annual Meeting of Stockholders to be filed pursuant to Regulation 14A. The Proxy Statement will be filed within 120 days of Registrant’s fiscal year ended December 31, 2017.
NEOPHOTONICS CORPORATION
ANNUAL REPORT ON FORM 10-K
For the Fiscal Year Ended December 31, 2017
Table of Contents
Page | ||
3
PART I
ITEM 1. BUSINESS
FORWARD-LOOKING STATEMENTS
You should read the following discussion in conjunction with our Consolidated Financial Statements and the related “Notes to Consolidated Financial Statements” and “Financial Statements and Supplementary Data” included in this Annual Report on Form 10-K. This discussion contains forward-looking statements including statements concerning our possible or assumed future results of operations, business strategies, competitive position, industry environment, potential growth opportunities and the effects of competition. Such statements are based upon our management’s beliefs and assumptions and on information currently available to us. Forward-looking statements include statements that are not historical facts and can be identified by terms such as “anticipates,” “believes,” “could,” “seeks,” “estimates,” “expects,” “intends,” “may,” “plans,” “potential,” “predicts,” “projects,” “should,” “will,” “would” or similar expressions. Forward-looking statements involve known and unknown risks, uncertainties and other factors that may cause our actual results, performance or achievements to be materially different from any future results, performance or achievements expressed or implied by the forward-looking statements. These risks, uncertainties and other factors in this Annual Report on Form 10-K are discussed in greater detail under the heading “Risk Factors.” Given these uncertainties, you should not place undue reliance on these forward-looking statements. Also, forward-looking statements represent our management’s beliefs and assumptions only as of the date of this Annual Report on Form 10-K. You should read this Annual Report on Form 10-K completely and with the understanding that our actual future results may be materially different from what we expect. Except as required by law, we assume no obligation to update these forward-looking statements, or to update the reasons actual results could differ materially from those anticipated in these forward-looking statements, even if new information becomes available in the future.
CONVENTIONS THAT APPLY IN THIS ANNUAL REPORT ON FORM 10-K
Unless otherwise indicated, references in this Annual Report on Form 10-K to:
• | “3G” refers to third-generation wireless architecture; |
• | “4G” refers to fourth-generation wireless architecture; |
• | “5G” refers to fifth-generation wireless architecture supporting IoT, or Internet of Things; |
• | “10G” refers to 10 Gbps; |
• | “100G products” collectively refers to all products sold by us designed for use at 100Gbps (“100G”), and in coherent transmission systems designed for use at 100Gbps or higher data rates. Some customers may use components designed for use at 100G at lower speeds. Our 100G products include both coherent transmission products and 100G network products that are not coherent; |
• | “III-V compound semiconductors” refers to compound semiconductor materials made from group III and group V elements of the periodic table, such as Indium Phosphide and Gallium Arsenide; |
• | “Access” refers to the portion of the telecommunications network that connects subscribers to their carriers network; |
• | “Advanced Hybrid Photonic Integration” refers to state-of-the-art integration of multi-platform materials and devices; |
• | “CDC” refers to Colorless, Directionless, and Contentionless; |
• | "CDM" refers to a Coherent Driver Modulator which integrates a coherent I/Q modulator and drivers in a micro-mod package; |
• | “China” refers to the People’s Republic of China; |
• | “Cloud” refers to a large and geographically dispersed network of computing platforms, servers and interconnecting communications that can be accessed by users from any location to perform tasks and access information; |
• | “Coherent” refers to optical transmission systems that encode information in the phase of an optical signal and decode such information through comparison with an independent laser at the receiver and digital signal processing; |
• | “Contentionless” refers to the ability to switch two or more channels of the same wavelength or color from different directions through the same switch, such as a Multi-Cast Switch (MCS); |
4
• | “CWDM” refers to Coarse Wavelength Division Multiplexing; |
• | “DCI” refers to Data Center Interconnect; |
• | “Design win” refers to a confirmation by a customer that a product or group of products may be used as part of a customer’s product and we have a purchase order for such products; |
• | “Dissaggregation” refers to the trend in optical communications to separate software and hardware platforms so that different parts of a system can be supplied by different vendors; |
• | “Drop Modules” refers to wavelength multiplexer modules; |
• | “ECL” refers to External Cavity Laser; |
• | “EML” refers to Electro-absorptively Modulated Laser; |
• | “Flex Coherent” to a class of 100G transceivers and line cards in which the modulation format, and hence the reach and data-rate, can be altered by software command such that the same optical hardware can be used for metro, long-haul or, in some cases, data center interconnect applications; |
• | “Gbps” refers to gigabits per second; |
• | “High Speed Products” refers to transmitter and receiver products as well as switching and other component products for 100G optical transmission applications over distances of 2 to 2,000 kilometers. Our high speed 100G and beyond products are based on our Advanced Hybrid Photonic Integration technology. These technologies support encoding 100 gigabits or more per second of information for transmitting over a single channel and decoding the information at the receiver; |
• | “ICR” refers to Integrated Coherent Receiver; |
• | “ITLA” refers to Integrable Tunable Laser Assembly; |
• | “IoT” refers to the Internet of Things; |
• | “Long Haul” refers to fiber optic communications between central offices in different cities, where distances range from a few hundred to two thousand kilometers; |
• | “Low Speed Transceiver Products” refers to our access and low speed transceiver product lines; |
• | “LTE” refers to Long-Term Evolution wireless architecture; |
• | “Metro” refers to fiber optic communications between central offices within and around cities, with distances up to a few hundred kilometers; |
• | “MCS” refers to Multi-Cast Switch; |
• | “MPEG-2” refers to the Moving Picture Experts Group standard for compressed coding of moving pictures and associated audio information; |
• | “Network Products and Solutions” collectively refers to all products sold by us for use in optical communications networks and a variety of other applications that are designed for use at data rates that are less than 100Gbps, including 40G, 10G and lower data rates. These products include certain passive products that do not explicitly have a data rate specification, but that are most commonly used in networks at these data rates. |
• | “NLW” refers to Narrow Line Width; |
• | “PAM” or “PAM4” refers to Pulse Amplitude Modulation or PAM with four amplitude levels; |
• | “PIC” refers to Photonic Integrated Circuit; |
• | “PLC” refers to Planar Lightwave Circuit; |
• | “PON” refers to a Passive Optical Network; |
5
• | “PSM” or “PSM4” refers to Parallel Single Mode or PSM with four parallel lanes or fibers; |
• | “QSFP” refers to 40G and 100G Quad Small Form-factor modules that are pluggable into standard industry interfaces for switches, routers and other telecommunications equipment; |
• | “ROADM” refers to Reconfigurable Optical Add Drop Multiplexer; |
• | "Tbps or T" refers to terabits per second. One terabit is one trillion bits. |
• | “U.S. GAAP” refers to generally accepted accounting principles in the United States; |
• | “WDM” refers to Wavelength-Division Multiplexing and is a technology that combines multiple channels onto a single fiber using different wavelengths, or colors, of light; |
• | “well-characterized” refers to the ability to predict the outcome of manufacturing processes based upon known statistics of various manufacturing inputs; and |
• | “WSS” refers to Wavelength Selective Switch. |
Unless the context indicates otherwise, we use the terms “NeoPhotonics,” “we,” “us,” “our” and “the Company” in this Annual Report on Form 10-K to refer to NeoPhotonics Corporation and, where appropriate, its subsidiaries.
BUSINESS
Overview
We develop, manufacture and sell optoelectronic products that transmit, receive and switch high speed digital optical signals for communications networks. Our products address the highest speed over distance applications and are designed for 100G and beyond data rates, such as at 200G, 400G, 600G and, in the near future, 1.2 Terabits per second, for telecom and hyper-scale data center or content provider networks.
Our High Speed Products for data rates of 100G and beyond comprised 83% of our revenues in 2017 and were 82% of our proforma 2016 revenue, excluding the revenue from our low speed transceiver products which were sold in January 2017. These Products use our Advanced Hybrid photonic Integration technology and are the core focus of our strategy. We believe that they are an important competitive differentiator.
Our High Speed Products include transceiver modules, optical components and high speed chip-level optical devices. Our 100G and beyond transceiver module products incorporate our vertically integrated, high performance components, including ultra-narrow linewidth tunable lasers (NLW-TLs), high speed electro-absorbtively modulated lasers (EMLs), high bandwidth coherent receivers (ICRs), high bandwidth micro-modulators (micro-MOD), high bandwidth trans-impedance amplifiers (TIAs) and high bandwidth laser and modulator drivers. We integrate several of these components into a Coherent Optical Subassembly (COSA) which when combined with our NLW Laser, provides all of the optical functions necessary for coherent communications in an ultra-compact package suitable for next generation pluggable modules. Furthermore, in addition to integrating these components into our own modules, we sell these components to other industry leaders who use them in their highest performance products. We believe that our strength in these and other high performance components places us in a strong competitive position as we add new variants to our module product line.
100G and beyond networks have adopted coherent transmission technology to increase speeds and lower costs. These high speed networks are one of the highest growth segments of the optical communications market, and support the rapid expansion of telecom backbone, hyper-scale data center and content provider networks, accommodating increased mobile traffic. Prior to 2016, revenue growth from our high speed products was mainly driven by the adoption of our 100G coherent products in the Long Haul market sector. We expect our future growth in the 100G and beyond segment to be driven primarily by the increased adoption of our high speed products in the much larger Metro market sector and in the high-speed data center interconnect market as well as the large hyper-scale data center market.
Coherent transmission uses not only amplitude but also phase and polarization properties of light to increase data rates ten-fold or more over conventional “on-off” transmission protocols. Coherent transmission does not require complete isolation of each channel by optical filters and therefore can flexibly and efficiently switch the signal on an individual wavelength without conflict or contention between wavelengths, a feature that is required for Software Defined Optical Networks, or SDON. Software Defined Optical Networks markedly increase the flexibility and efficiency of Metro networks and, combined with the ten-fold
6
increase in data-rates achievable with coherent transmission, mark a very large improvement in cost performance for metro scale networks. In addition, the necessary equipment to implement a metro scale network is significantly reduced, especially using flex-coherent transceivers and CDC Switches.
The benefits of coherent transmission have made it a preferred technology for advanced high speed telecommunications networks for distances of 80 kilometers to 2000 kilometers. We believe that our Advanced Hybrid Photonic Integration technology enables us to effectively address the challenges inherent in precision and high volume manufacturing of optical components for coherent transmission.
Our products also serve high performance, non-coherent segments of the data center and enterprise market which require the fastest speeds transmitted over relatively long distances within hyper-scale data centers. We are a leading provider of electro-absorptively modulated lasers ("EMLs"), receiver photodiodes, plus laser driver and receiver amplifier ICs. Our client and data center transceiver modules incorporate these EMLs and related components to deliver high power and high quality modulated signals for superior speed and distance performance. In addition, we design and manufacture laser light sources in our Indium Phosphide wafer fabs for Silicon Photonics-based short reach interconnects within the data center.
In December 2016, we entered into an asset purchase agreement to sell certain assets of our access and low speed transceiver product lines (the “Low Speed Transceiver Products”) to APAT Optoelectronics Components Co., Ltd. (“APAT OE”) of Shenzhen, China. In January 2017, we closed the sale of these assets which generated approximately 1%, 15% and 27% of our total revenue in 2017, 2016 and 2015, respectively. All of these product lines were part of our Network Products and Solutions group and include the low speed passive optical network, or PON, products for which the end-of-life plan was announced in mid-2016.
Our revenue over the last several years reflects the rapid adoption and deployment of high speed 100G above networks across the global telecom and data center network applications.
We sell our products to the world’s leading network equipment manufacturers, including Nokia Corporation, or Nokia (formerly Alcatel-Lucent S.A., or Alcatel-Lucent, which was acquired by Nokia in January 2016), Ciena Corporation, or Ciena, Cisco Systems, Inc. and Huawei Technologies Co., Ltd., or Huawei. These four companies accounted for approximately 65% and 76% of our total revenue in 2017 and 2016, respectively. Other leading customers are FiberHome Telecommunications Technologies Co., Ltd., or FiberHome, a major Chinese telecommunications system provider, and Acacia Communications, Inc., or Acacia, a fast growing vendor of optical interconnects.
Our leading customers serve the telecom market and also the hyper-scale data center market, represented by companies including Amazon, Facebook, Google and Microsoft. Large network equipment and optical module companies, together with emerging content providers and data center operators, are the focus of our strategy due to their important positions in high speed and related communications networks markets.
We believe our Advanced Hybrid Photonic Integration technology is well positioned to serve the highest speed next-generation 200G, 400G and 600G products and applications. Using this core technology we produce photonic integrated circuits, or PICs, that comprise both arrayed and individual photonic functional elements using optimized materials systems and processes from our in-house Silicon, Indium Phosphide and Gallium Arsenide wafer fabrication, plus Silicon Germanium chips produced in external foundries. These individual PICs from different materials are then combined using our hybrid integration technology to make complete products, such as our Integrated Coherent Receiver (“ICR”), our ultra-narrow linewidth tunable laser, our Multi-cast Switch (“MCS”) for 100G and beyond coherent transport and Metro applications, our 100G and above CFPx transceivers for data center and telecom client networks, and our 64 Giga-baud ("GBaud") ICR and Indium Phosphide Micro-Modulator with an integrated driver for 400G and above applications.
100G and beyond coherent technology has become widely used in the Long Haul market segment over the last several years, but has only recently begun to be deployed in the much larger Metro and the emerging data center interconnect, or DCI, sector of the market. While the cost per port deployed typically declines every year due to technological advances, 100G and beyond coherent port demand represents a high growth opportunity for suppliers of components, modules and systems for the 100G coherent Metro and DCI markets. In addition, Metro coherent ports include ports that have “flex coherent” features, which can be used not only in the Metro market but also in the Long Haul market and therefore have to support the highest performance applications at deployment.
Our products for the rapidly growing coherent Metro market include Integrated Coherent Receivers, ultra-narrow linewidth tunable lasers, micro-modulators and multi-cast switches. Our multi-cast switches similarly are used by hyper-scale content providers for software definition of their network configuration. Also, we produce coherent transceiver modules that
7
are used for the Metro market as well as the data center interconnect market, such as high speed coherent CFP-DCO transceivers.
We design and manufacture a range of semiconductor laser and control IC products that are used in client-side telecommunications transmission and in single mode interconnections in hyper-scale data center applications. These products include lasers that are specifically optimized for use with Silicon Photonics based interconnects and for longer distance and high data rate interconnects.
We further design and manufacture a broad range of products for optical communications networks and a variety of other applications, where the networks operate at speeds less than 100G. These products are key elements of direct detect long haul and metro DWDM networks as well as mobile backhaul and fronthaul networks that include application-specific passive optical functionalities in modules or subsystem configurations. These include athermal arrayed-waveguide grating (AWG)-based modules for multiplexing and demultiplexing in conventional ROADM nodes as well as variable optical attenuators and tap power monitors for network monitoring and control. In addition, many of these products provide high-bandwidth connections to base station antennas for mobile devices.
We have strengthened our technology leadership through several strategic acquisitions as noted below over the last six years.
• | In October 2011, we acquired Santur Corporation, or Santur, a producer of tunable lasers and modulators for coherent transmission and of 100G client side transceiver modules. Santur’s capabilities included array distributed feedback ("DFB") lasers, silicon photonics and photonic integration of lasers, modulators and photodiode elements. |
• | In March 2013, we acquired the optical component business unit of LAPIS Semiconductor Co., Ltd., located in Japan, now known as NeoPhotonics Semiconductor. This business is a leading producer of high performance communications lasers, photodiode devices and optical control electronic devices which enable our leading market positions and increasing vertical integration in our coherent products including ultra-narrow linewidth tunable lasers and coherent receivers. NeoPhotonics Semiconductor also produces high speed lasers and control semiconductors for high speed data center and client side applications, providing vertical integration for our high speed telecom client side and data center module products and stand-alone products to the industry. |
• | In January 2015, we acquired the ultra-narrow linewidth tunable laser business of EMCORE Corporation’s (EMCORE), expanding our position as a supplier of tunable laser for coherent communications. The EMCORE ultra narrow linewidth tunable laser products are used in the industry’s highest speed applications and are critical components that are used with our highest speed and highest bandwidth receiver products for the emerging data rates of 400G and 600G. |
We have research and development and wafer fabrication facilities in San Jose and Fremont, California and in Tokyo, Japan that coordinate with our research and development and manufacturing facilities in Dongguan, Shenzhen and Wuhan, China and Ottawa, Canada. We additionally do conduct research and development and manufacturing in Moscow, Russia. We use proprietary design tools and design-for-manufacturing techniques to align our design process with our precision nanoscale, vertically integrated manufacturing and testing.
We use proprietary design tools and design-for-manufacturing techniques to align our design process with our precision nanoscale, vertically integrated manufacturing and testing. We believe we are one of the highest volume manufacturers of photonic integrated circuits ("PIC") in the world and that we can further expand our manufacturing capacity to meet market needs.
Industry Background
The new era of connectedness is increasingly universal and demands that the capacity of the digital communications networks must increase exponentially. Smartphones and related portable devices have emerged as the preferred vehicle connecting the digital world, with more than one billion current smartphone users and a rapidly increasing volume of other portable devices. Not only are more people connected to the mobile web, but they are connecting at increasingly higher data rates and requiring higher bandwidths. Wireless network deployments have progressed from third generation (3G) to fourth generation (4G/LTE) and are moving toward fifth generation (5G), representing a 10X increase in bandwidth over five years, and providing end-users with ever-increasing download speeds and mobility, and enabling IoT machine-to-machine communication for the integration of autonomous vehicles and other disruptive applications.
Further the deployment of modern communications has rapidly expanded from being the domain of telecom service providers to include today’s deployments by enterprises, content providers and merchant data storage and service “mega” data
8
center enterprises. The rapid rise of internet traffic that is going through mega data centers operated primarily by leading content companies, such as Amazon, Apple, Facebook, Google and Microsoft (i.e. Microsoft Azure), has created a large and rapidly growing new market for optical modules and components in general, but more specifically for high speed optical modules and components.
The revolution in the power of low cost computing devices is associated with an observation made by Intel co-founder Gordon Moore in 1965 that the number of transistors per square inch on integrated circuits had doubled every two years since their invention and a prediction that this trend would continue. In the domain of optical communications, a similar revolution, progressing at a similar rate, is driven by the increased speed, smaller size and lower cost achieved by photonic integration.
A single optical fiber can carry nearly 100 individual wavelengths (colors), each of which can now support 100 gigabits per second of data traffic capacity. Each of these wavelengths requires a 100G or higher speed transmitter and receiver, which can be tuned to any of the 100 separate channels. Thus, using 100G coherent technology and industry standard compression (MPEG-2), a single fiber can carry approximately 500,000 individual high definition full motion movies simultaneously over one fiber.
Digital Optical Communications Market Structure
The digital optical communications market has two main sectors, telecom (which is sub divided into Long Haul, Metro and access applications) and Datacom (which includes data center). The telecom sector includes the global backbone of Long Haul and Metro communications. It also includes local access links to end users. The Datacom and data center sector includes connections in hyper-scale data centers as well as traditional “enterprise” networks. As data centers proliferate within metropolitan sized geographies, a very rapidly growing Data center Interconnect market has emerged which resembles the metro market in its bandwidth and distance needs and utilizes similar optical technologies and products.
While the Metro market is the largest volume, it most often follows the Long Haul telecom sector in technology deployment, notably of coherent 100G and beyond technologies. The Long Haul telecom sector is the first adopter of the highest speed and most advanced communication links, and typically migrates over time into the Metro sector as costs are reduced such that they are economical in the shorter but more numerous Metro network links, with its commensurate lower traffic densities prior to aggregation for Long Haul transport.
The Datacom market includes hyper-scale data centers and infrastructure for cloud based services as well as traditional enterprise networks. Companies such as Amazon, Apple, Facebook, Google and Microsoft are steadily increasing investments in very large data centers as they implement cloud-based “big data” services that can be crowd-sourced and crowd-distributed, and that utilize machine-to-machine and inter-data center transactions to power the mobile web. Connections between such very large data centers over a metro-sized area are an emerging high growth market for “big pipes” using dedicated 100G and beyond digital optical connections from data center to data center (inter-data center or DCI). Connections within data centers (intra-data center) and from data center to a telecommunications carrier are also moving to 100G and beyond speeds, although somewhat behind Metro, DCI and long haul.
The Datacom market is often the most cost sensitive sector of digital optical communications due to high volumes and to shorter lifetime requirements, and therefore it typically begins to adopt leading edge speeds after those speeds penetrate the Metro sector of the telecom market segment.
From this market structure, we believe that a technology leader must achieve a leadership position in the Long Haul telecom sector as the basis for commercializing the most advanced technology and then extending that technology to the Metro and DCI sectors and to additional applications within data centers and other Datacom applications.
Digital Optical Communications Network Equipment
The structure of the industry that supplies the network equipment for telecom digital optical communications networks has largely concentrated down to leading vendors which include: Nokia (formerly Alcatel-Lucent, which was acquired by Nokia in January 2016), Ciena, Cisco, Coriant, Fujitsu Limited, Fiberhome, Huawei, Infinera Corporation, NEC Corporation and ZTE Corporation.
Major suppliers of network equipment to the Datacom and data center market include Arista Networks, Nokia, Brocade Communications Systems, Cisco, Huawei and Juniper Networks. At the optical module and component level, Broadcom Limited, or Broadcom (resulting from the acquisition of Broadcom Corporation by Avago Technologies Ltd., or Avago), Finisar and Sumitomo Electric Device Innovations, Inc., or Sumitomo, are leading merchant suppliers and some larger network equipment companies like Huawei and Cisco have divisions or affiliates (such as HiSilicon in the case of Huawei) that are
9
captive suppliers. Furthermore, some of the larger hyper-scale content providers, such as Google, Microsoft and Facebook, are beginning to design and source their own optical network systems equipment from contract manufacturing partners. These moves drive “disaggregation” in the data center network separating software and hardware elements, as well as different hardware functions, so that multiple vendors can supply different interacting products.
Recent changes in switch architectures are rapidly moving new installations to higher speed 25G dataflows (such that four such signal paths provide 100G comprised of four 25G signals, or “4x25G”), resulting in a fast growing 100G module market for connections inside the data center and “big pipes” for data connections between data centers, or data center interconnects (DCI), at 100G and 200G, and moving to 400G and 600G, data rates.
The main photonic operational blocks or modules required for digital optical communications are transmitters, receivers and, where the network is branched, optical switches. Transmitters and receivers are often combined into single modules which are called transceivers and can be configured into line cards, daughter cards and transponders, or digital or analog modules. At the high end, such as Long Haul, a transmitter and receiver can be paired and combined with signal processing electronics to error correct and restore degradation which affects the signal after traveling long distances, in which case the unit is referred to as a transponder. For high speeds and high bandwidth each of these product types requires photonic integration at the most advanced and complete level to deliver the required performance and functionality while being manufacturable at scale and competitive in cost.
Switching products, which switch different colors, or signal channels, down different branches of the network, have thus far been Reconfigurable Optical Add/Drop Multiplexers (ROADMs) consisting of Wavelength Selective Switches (WSSs). For 100G coherent networks, a new type of optical switch, the Multi-Cast Switch (MCS), has been developed and introduced to eliminate contention in 100G coherent switching. The need to eliminate contention is being driven by the move to SDON, which is important to both telecom network requirements and content provider networks. A “contentionless” architecture uses both traditional “Wavelength Selective Switches” and the new MCS, which we supply. One or more MCSs are deployed initially with each ROADM node, and then additional multicast switches are deployed over time as traffic growth demands with as many as eight MCS devices for each node, allowing networks to efficiently expand as needed. This type of switch is CDC, and its function is optimized for 100G and beyond coherent networks.
Digital Optical Communications Technology Background
Advances in cost performance in photonic integration have followed a path that has been similar to electronic integrated circuits.
The main objectives for technology advances in electronic digital integrated circuits and in integrated optical digital devices are similar, and are based on the drive towards lower cost and higher performance with expanding scale. In integrated optics these main objectives also include higher speed, lower power, smaller or denser form factor, and lower cost.
In both electronics and optics these objectives require ever increasing integration and miniaturization. In optics, however, we believe advanced hybrid integration is required for the highest performance products. Hybrid integration for digital optical devices incorporates multiple types of materials substrates, rather than just one, as in silicon for an electronic integrated circuit.
Complete advanced photonics integration capability requires at least three materials substrate systems: Indium Phosphide for active devices such as lasers, photodiode detectors, modulators, and amplifiers; Silicon or planar doped silicon dioxide (silica) for wave guides, filters, interferometers and other passive devices; and Gallium Arsenide or Silicon Germanium for drivers and control functions at the speeds necessary for 100G. The integration of more than one material substrate is called hybrid integration, and Advanced Hybrid Photonic Integration enables products in the 100G and beyond domain.
Advantages and Challenges of Coherent Transmission
Coherent digital optical transmission technology has increased the native capacity of a fiber optic link tenfold, versus a transmission modulation of simple on/off such as in 10G WDM networks. Coherent transmission modulation encodes information via phase and polarization, and the permutations of these variables are many times greater than on/off.
To create a detectable error-free signal in the coherent modality requires that each color (wavelength) transmitted be much purer than would be required for lower speed protocols. The primary enabler of such ultra-narrow line width (NLW), that is, an ultra-pure and stable color, is a new generation of the most advanced lasers. These NLW lasers must be paired with a new generation of receivers that decode phase and polarization through comparison with another NLW laser in a PIC-interferometer. Ultra-narrow line width lasers are built on Indium Phosphide substrates while the receivers utilize a Silicon or Indium Phosphide interferometer and Indium Phosphide photo detectors.
10
These 100G and beyond coherent optical transmission devices require tighter tolerances of material thickness and other critical dimensions than do components operating at 10G. For 100G, a new generation of technologies, including faster Gallium Arsenide drivers, is required to suitably process transmission signals in both the laser transmitter and the detector and receiver. As transmission speeds move to 200G, 400G and even 600G through higher order modulation protocols and higher symbol rates, even higher performance optical components are required. We believe we have established and characterized the full range of driver, laser and detector technologies required for implementing 100G, 200G, 400G and 600G coherent systems, a capability that we believe is held by only a few companies.
Our Core Technology and Hybrid Photonic Integration Platform
We have core technology capabilities in optoelectronics that enable the high speed, high bandwidth, high performance optoelectronics products and we believe we have developed or acquired all necessary capabilities required for producing high performance Advanced Hybrid Photonic Integrated optoelectronic devices for the most stringent performance requirements and operating conditions. Our core technology leverages a unique multi-material platform that includes:
Indium Phosphide (InP): Indium Phosphide is used to produce efficient lasers, sensitive photo detectors and modulators in the wavelength window typically used for telecommunications, i.e. 1.55 micron wavelengths, as it is a direct bandgap III-V compound semiconductor material. InP is the most important material for the generation of laser signals and the detection and conversion of those signals back to electronic form.
Silicon (Silicon Photonics and Planar Lightwave Circuits): Silicon is a multi-attribute material that is efficient for electronics and versatile for integration while being very inefficient in generating or detecting light in the telecom wavelength window as it is an indirect bandgap semiconductor material. Consequently, waveguides of Silicon or doped silicon dioxide (silica) exhibit very low optical loss and are ideal for switching, filtering or interferometric applications and active elements including modulators and switches can be produced using Silicon waveguides.
Gallium Arsenide (GaAs): Gallium Arsenide can operate at very high speeds and is well suited to make analog integrated circuit drivers for high speed lasers and modulators due to its high electron mobility. GaAs is a direct bandgap III-V compound semiconductor material, but unlike InP, GaAs does not lase in the telecom wavelength window.
Silicon Germanium (SiGe): Silicon Germanium is an alloy of Silicon and Germanium that is used to manufacture mixed signal and analog integrated circuits and is well suited for high speed amplifiers used in 100G systems. SiGe devices are made using standard silicon processing techniques in commercial foundries.
ASIC Development: We have applied in-house capability for customized integrated circuit design and development for specific purpose applications in high speed optical digital control and management, including certain developments in signal processing. Such products are deployed in GaAs, SiGe and silicon materials platforms.
We have developed design, integration and manufacturing approaches and techniques to produce advanced, high speed integrated solutions leveraging each of these in-house materials technology and high speed digital optoelectronics platforms.
11
Hybrid Photonic Integration
Products | Indium Phosphide | Silicon/Silica | Gallium Arsenide/Silicon Germanium | |||
COHERENT PRODUCT FAMILIES | ||||||
Integrated Coherent Receiver | ü | ü | ü | |||
Ultra-Narrow Line Width Tunable Laser | ü | ü | ||||
100G / 200G Multi-rate CFP-DCO Digital Coherent Transceiver | ü | ü | ü | |||
Multi-Cast Switch for 100G Coherent ROADM Node | ü | ü | ||||
64 GBaud CDM-Coherent Driver Modulator | ü | ü | ü | |||
CLIENT SIDE / DATA CENTER PRODUCT FAMILIES | ||||||
28 GBaud and 56 GBaud EML Lasers/Photodiodes and Semiconductor Drivers and Trans Impedance Amplifiers | ü | ü | ||||
CFP2-LR4 100G 10 km Transceiver | ü | ü | ü | |||
Continuous Wave, CWDM and DWDM DFB lasers and laser arrays | ü | ü | ||||
Our Strategy
Key elements of our strategy include:
• | Continue innovating to develop industry-leading comprehensive technology for Advanced Hybrid Photonic Integration. We have strengthened and expanded our technology platforms for comprehensive advanced photonic integration, in part from acquisitions and from internally funded development. We expect to continue to combine our mixed platform approach to design and produce the highest performance optical signal processing solutions. |
• | Capture major customer share for the most advanced modules and components at the top suppliers of state and users of the art network equipment. We intend to deepen our relationships with our strategic customers by increasing design wins in their systems, including Ciena, Cisco, Huawei and Nokia, plus certain others, which are market leaders or emerging players in 100G and beyond coherent systems. |
• | Offer complete optoelectronic solutions for 100G to 600G and beyond for leading edge Telecom and Datacom market segments. We expect to continue to introduce Coherent Transmitter, Receiver and Transceiver Module products that are optimized for the highest speeds so that our product line will include each of the major types of the most advanced products. |
• | Achieve growth in integrated optical applications that leverage our core technology of advanced optoelectronic products. We intend to provide state of the art products and solutions to industry leading customers to advance our goal of achieving continuous improvement in operating performance, profitability and growth. |
• | Focus on high growth segments that leverage our leadership in Advanced Hybrid Photonic Integration and that contribute to our profitable growth. We plan to continue to develop our products and solutions to capture new opportunities, such as emerging 400G and 600G connections in both carrier networks and within and between large data centers. |
12
• | Extend our product line into additional segments of the network that will benefit from ultra-high speed performance. We intend to penetrate the emerging market for 100G and above connections both within and between mega-data centers. In this segment we are targeting major users and builders of data centers and data center equipment, such as Amazon, Apple, Facebook, Google and Microsoft, as they develop some of their own network equipment. We believe our technology and product line is well positioned to penetrate this market. |
• | Pursue acquisitions that extend our leadership position in advanced optoelectronic integration. We may opportunistically pursue acquisitions that we believe provide complementary technology and that can accelerate our growth and strengthen our market position. |
Our Technology
We have developed expertise in the design, large-scale fabrication, high-volume module manufacturing and commercial deployment of high speed digital optics and signal processing products that are based on our Advanced Hybrid Photonic Integration products and technologies. The process of designing and manufacturing advanced optoelectronic integrated devices in high volume with predictable, well-characterized performance and low manufacturing costs is complex and multi-faceted. We have developed the technologies using multiple materials platforms for photonic integration that are required to design and manufacture complex, high-performance optoelectronic components, modules and subsystems for fiber optic networks. The basic elements of our technology are as follows:
Mixed-material platform and optoelectronic integration technology. We utilize a set of proprietary integration platforms that provide optoelectronic functionality on silicon and other integrated compound semiconductor substrates including Indium Phosphide, Gallium Arsenide and Silicon Germanium and integrated combinations of these platforms.
We utilize micron and sub-micron scale structures of multiple silicon dioxide and Indium Phosphide waveguides to fabricate optoelectronic functional elements such as lasers, detectors, modulators, interferometers, integrated optical filters, switches and variable attenuators. We integrate these functional design elements into optoelectronic devices to achieve a desired functionality and specification that is incorporated into our products. Similarly, we use Gallium Arsenide and Silicon Germanium integration platforms for drivers, amplifiers and related high-speed electronic control functions for our integrated optoelectronic devices.
Advanced Hybrid Photonic Integration. Through precise fabrication and positioning of physical features, we can integrate numerous different optoelectronic devices, which are fabricated on separate wafers from different semiconductor and related materials, matching the material to the function to create improved performance by using the highest performance elements of each type. For example, our hybrid integration allows us to integrate active devices, such as photodiodes or lasers fabricated using Indium Phosphide, with high-performance passive devices, such as interferometers, switches, routers and filters, fabricated on silicon, and to mate electronic amplifiers made with Silicon Germanium or drivers made with Gallium Arsenide directly to optical elements made with Silicon or Indium Phosphide.
This ability to combine specific functional elements out of optimized materials not only allows for very compact and low power components, but also through the intimate coupling of different elements, makes possible completely new functions. An example of this multi-platform architecture is found in the coherent optical communications domain where we intimately couple a passive interferometer with separate quadrature components carrying information and with photo detectors to turn a high speed optical signal into data-rich electrical signals for processing.
Optoelectronic engineering and integration. As we create complex integrated optoelectronic devices, we design and build electronic control algorithms and devices, signal processing methodologies, hardware and software routines and protocols, and device level ASICs that function to control and manage the highest performance features and capabilities of these integrated optoelectronics devices and systems. For example, our digital and analog modules are carefully characterized and controlled to extend and deliver their full operating ranges and performance features enables by their Advanced Hybrid Photonic Integration platform.
Hardware and firmware integration. We also sell our products as modules and subsystems which contain electronic hardware and firmware controls that interface directly with our customers’ systems. We design the electronic hardware and develop the firmware for control of our optical products and subsystems, and so that our optical products meet customer specifications.
Devices, Components, Modules & Subsystems. We are vertically integrated from the design of photonic integrated devices through manufacturing in our own wafer fabs and assembly and test in our own factories. We design and manufacture modules and subsystems that combine our key products with other elements to offer customers a complete solution. We sell products at
13
each level of product utility and can achieve the highest performance and capture the greatest value. We utilize some contract manufacturers for assembly operations where it is cost effective.
Fabrication and manufacturing processes. We have developed expertise in the technology domains relevant to high-volume fabrication and manufacturing of our optoelectronic integrated circuit products using wafer-scale processes and including the complex interaction of electro-optic, thermal-optic and mechanical micro-thermal features. Our complex manufacturing steps are analogous to many processes used in the semiconductor industry. Each integrated element is tested and characterized using our proprietary test equipment before incorporation into our products. Moreover the ability to assemble complete optoelectronic devices, modules and systems with full control of performance and fabrication from the semiconductor and optical device level through to its optoelectronic controls to its pluggable module form factor enables delivery of the highest performance, highest scale and lowest cost solutions required by the industry.
Circuit design and design-for-manufacturing tools. We use a comprehensive set of proprietary as well as industry standard software design tools, to model relevant geometries, dimensions and thermal management for a broad range of photonic devices. With these tools, we develop products with minimal design iterations and manage precision manufacturing to a narrow range of high performance specifications.
Our Products
We develop and manufacture Transmitter Products, Receiver Products and Switch Products that are used in ultra-high speed digital optical and signal processing communications, high speed switching and provisioning. We combine our transmitter and receiver products into Transceiver modules. Our Switching Products, such as Multi-Cast Switches, are used primarily in ROADM nodes that dynamically and efficiently allocate bandwidth to adjust for fast changing traffic patterns and for provisioning software defined optical networks. Our products can be categorized into groups, including High Speed Products for 100G, 200G, 400G, 600G and beyond applications, including in coherent networks, and Network Products and Solutions, for lower speed networks and other passive telecom and instrumentation products.
High Speed Products: We produce transmitter and receiver products as well as switching products for 100G and beyond optical transmission applications over distances of 2 to 2,000 kilometers. In addition we combine 100G and beyond transmitter and receiver products into pluggable modules for both line side coherent and client side hyper-scale data center applications. We have also integrated transmitter and receiver functions into a single integrated component called a COSA (Coherent Optical Sub Assembly), which has an ultra-small form factor designed to fit into the next generation pluggable transceivers. All of our high speed 100G and beyond products are based on our Advanced Hybrid Photonic Integration technology. This technology supports encoding 100 gigabits or more per second of information for transmitting over a single channel and decoding the information at the receiver, as well as enabling smaller, more compact and more highly integrated designs for the individual elements and integrated COSAs.
For Long Haul and Metro transport, we design and manufacture optical components for coherent systems, which manipulate light to encode ten times or more the amount of information in the same wavelength channel than is possible with traditional methods. This manipulation can only be accomplished using advanced photonic integration to intimately couple functional elements together. Our Coherent Products include Ultra-Narrow Linewidth Tunable transmit and local oscillator lasers (NLW-TL), which generate the ultra-pure wavelength, or color, necessary for coherent transmission, coherent micro-modulators which encode the information on the intensity and phase of the optical beam and Integrated Coherent Receivers (ICRs), which decode the phase and polarization encoded coherent signal.
We have introduced new pluggable coherent modules which combine our NLW-ITLA with our ICR and, in some cases with our high performance coherent modulator such as in our CFP-DCO transceiver and transponder optical modules. The design for interoperability of each of the constituent elements of such a precise high speed device is a core capability that continues to fuel our ability to develop and deliver device and module products that achieve the highest performance available globally.
We also sell 100G products for the client side and data center applications, including 25 GBaud EMLs, laser drivers, modulator drivers and photodiode receivers for 100G and beyond client side applications. We further offer pluggable transceiver modules, such as CFP2-LR4, for high speed data center and telecom client applications.
Further, we are developing an ultra-high-speed 56 GBaud EML and driver IC sets to enable single wavelength PAM4 100G applications and subsequently four wavelength 400G intra-data center transmission.
14
For hyper-scale data center applications we have introduced a series of high power laser diode array products for short reach Silicon Photonics based 100G intra-data center interconnections which use parallel single-mode architectures, or PSM4, as well as coarse wavelength division multiplexing, or CWDM architectures.
We provide a proprietary switching solution for 100G coherent systems embodied in our Multi-Cast Switch (MCS) product line. Our 4x4, 4x16, 8x16 and 12x16 Multi-Cast Switch modules for CDC ROADMs efficiently allocate bandwidth and signal routing in 100G and higher data rate networks. The Multi-Cast Switch provides scalable contentionless operation to achieve the highest traffic management efficiency, optimizing traffic flows in coherent transmission systems. Our MCS uses our PLC photonic integration platform and consists of a complex array of switches, waveguides, taps, crossings and other functional elements manufactured on Silicon wafers using standard semiconductor processing equipment. Our PLC technology exhibits very low loss and enables the extension of the Multi-Cast Switch to be extended to higher port count NxM configurations.
Market Sectors Served By Representative High Speed Products
Products | Long Haul | Metro | Data center | |||
COHERENT PRODUCT FAMILIES | ||||||
Integrated Coherent Receiver | ü | ü | ü | |||
Ultra Narrow Line Width Tunable Laser | ü | ü | ü | |||
64Gbaud/COSA | ü | ü | ü | |||
100G / 200G Multi-rate CFP-DCO Analog Coherent Transceiver | ü | ü | ü | |||
Multi-Cast Switch for 100G Coherent ROADM Node | ü | ü | ü | |||
64 GBaud CDM-Coherent Driver Modulator | ü | ü | ü | |||
CLIENT SIDE / DATA CENTER PRODUCT FAMILIES | ||||||
28 GBaud/56 GBaud EML Lasers/Photodiodes and Semiconductor Drivers and Trans Impedance Amplifiers | ü | |||||
Continuous Wave, CWDM and DWDM DFB lasers and laser arrays | ü | |||||
CFP2-LR4 100G 10 km Transceiver | ü | |||||
Network Products and Solutions: We design and manufacture products for optical communications networks and a variety of other applications, where the networks operate at speeds less than 100G. We offer a wide range of application-specific passive optical functionalities in modules or sub-system configurations. These include arrayed waveguide grating based drop modules for multiplexing and demultiplexing in conventional ROADM nodes as well as variable optical attenuators and tap power monitors for network monitoring and control. We combine several of these functions together in subsystems such as our variable multiplexer, which combines up to 48 variable optical attenuators and an arrayed waveguide grating multiplexer in a single compact unit. In addition, many of these products provide high-bandwidth connections to base station antennas for mobile devices and to people and machines over fixed and wireless networks. As consumer connectivity speeds have increased through the transitions from 2G to 3G to 4G/LTE and moving to 5G, the bandwidths necessary to aggregate and connect wireless traffic into the backbone network, including Mobile BackHaul, have also increased. We offer laser drivers, modulator drivers, photodiode receivers and Trans impedance amplifiers for these applications.
15
Through 2016 we also offered complete transceiver modules for a variety of low speed Access and Mobile Backhaul applications, including GPON and GEPON transceiver products at up to 10G data rates, plus 10G and below telecom, bidirectional and specialty transceiver products. Upon the sale of the Low Speed Transceiver Products’ assets to APAT OE in January 2017, these products are no longer included in the Network Products and Solutions product group.
In addition to products for fiber optic communications, we also sell products for test and measurement, instrumentation, industrial and research applications.
Our Infrastructure, Intellectual Properties and Our Employees
We have product development and product sustaining engineering teams in Silicon Valley (San Jose and Fremont, California), Tokyo, Japan and Shenzhen and Wuhan, China. In our Silicon Valley and Tokyo facilities we conduct research, product development and product roadmap definitions, including for our PIC products. In our Shenzhen facilities, we conduct new product development, manufacturing and process engineering, quality control, continuous improvement and cost reduction relating to product manufacturing, assembly and test. In our Wuhan, China and Ottawa, Canada facilities we conduct new device, component and product development.
We seek to establish and maintain proprietary rights in our technology and products through the use of patents, copyrights and trade secret laws. We have filed applications for patents to protect certain of our intellectual property in the U.S. and in other countries, including Australia, Canada, Japan, Korea, Hong Kong, China, Russia, India, Taiwan and several European Union countries. As of December 31, 2017, we had approximately 600 issued patents, expiring between 2018 and 2036 covering various aspects of our technologies.
We have manufacturing operations in the U.S., Japan, China and Russia. Our wafer fabrication operations are located in our San Jose and Fremont, California facilities, as well as in our Japan facilities, and include chip design, clean room fabrication, integration and related facilities for PICs. Our manufacturing, assembly and test operations are located in our Shenzhen and Dongguan, China facilities, and in Silicon Valley, California. In addition, we have established manufacturing capability in Russia.
As of December 31, 2017, we had 1,783 employees and non-employee contractors, of which 257 were based in the U.S., 1,344 in China, 145 in Japan, 26 in Russia and Europe and 11 in Canada.
None of our U.S. employees are represented by a labor union. Chinese law allows that all employees be members of a union that is overseen by the Chinese government. The majority of the employees in our Japanese subsidiary are also members of a union. We have never experienced employment-related work stoppages and we consider our employee relations to be good.
Our Customers
In 2017, 2016 and 2015, our five largest customers accounted for 78%, 82% and 82% of our total revenue, respectively. In 2017, customers of 10% or more revenue were Huawei, together with its affiliate HiSilicon Technologies Co. Ltd. (collectively “Huawei”), and Ciena Corporation, which accounted for 40% and 16% of our total revenue, respectively. In 2016, customers of 10% or more revenue were Huawei and Ciena Corporation, which accounted for 50% and 15% of our total revenue, respectively. In 2015, Huawei and Ciena Corporation accounted for 44% and 21% of our total revenue, respectively.
Our Sales and Marketing
We operate a sales model that focuses on alignment with our customers through coordination of our sales, product application engineering and manufacturing teams. Our sales cycles typically require a significant amount of time and a substantial expenditure of resources before we can realize revenue from the sale of products. The length of our sales cycle, from initial request to design win, is typically 6 to 12 months for an existing product and 12 to 18 months or longer for a new product.
We use a global direct sales force based in North America, Europe, Russia and Asia, including China and Japan. These individuals work with our product application engineers, and product marketing and sales operations teams, in an integrated approach to address our customers’ current and future needs. We have very deep technical relationships. We believe that these collaborative engineering activities provide us insight into our customers’ broader and longer-term needs. We view our technical sales capability and our technical relationships with customers as a key part of our value delivery to our key strategic customers.
16
Our marketing team focuses on product strategy, product development, roadmap development, new product introduction processes, program management, product demand stimulation and assessment, and competitive analysis. Our marketing team also seeks to educate the market about our products by communicating the value proposition and product differentiation in direct customer interactions and presentations and at industry tradeshows and at technical conferences. It is important that these teams are engaged in both industry forums such as MSA (multi supplier agreement) Committees, etc. as well as direct customer and end-user engagements.
Our Research and Development
We have invested and expect to continue to invest significant time and capital into our research and development operations. Research and development expenses were $58.3 million, $57.4 million and $44.5 million in 2017, 2016 and 2015, respectively.
Our research and development activities continue to push the performance leadership boundaries in high speed digital optics, hybrid optical integration, optoelectronics control and in signal processing.
Our Suppliers
We use suppliers from the U.S., China, Japan and other locations. Although there are multiple sources for most of the component parts of our products, some components are sourced from single or, in some cases, limited sources, which can increase risks of materials availability for production. We typically do not have written agreements with the majority of these component manufacturers to guarantee the supply of the key components used in our products. We also use contract manufacturers in Japan, China and other Asia locations for the back-end manufacturing of certain of our products.
As the industry scales the entire supply chain is working to scale. As a result, we work closely with our key suppliers to understand their business as we grow together. This requires our continuing close management.
Our Backlog
Sales of our products generally are made pursuant to purchase orders, often with short lead times. These purchase orders are typically made without deposits and may be subject to revision or cancellation. The quantities actually purchased by our customers, as well as the shipment schedules, are frequently revised to reflect changes in our customers’ needs and in our supply of products.
Certain of our customers use vendor managed inventory (VMI) arrangements under which we manufacture at a customer’s request, then ship to its facility or a designated contract manufacturer for the customer, to be held until it is used by the customer. We maintain title to vendor managed inventory until the customer uses the inventory. At that time the customer takes title to the products, it reports the consumption to us and we recognize the revenue for the product sale. The increased use of VMI by our customers may increase the possibility of changes to our backlog since customers may consume VMI more quickly or more slowly than we had planned.
Our direct sales force works our customers in an integrated approach to understand current and future needs. Because we operate a sales model that focuses on alignment with our customers there is the possibility of changes in delivery or acceptance schedules, cancellations, modifications or price reductions with limited or no penalties and the use by customers of VMI is increasing, we do not believe that backlog is a firm or reliable indicator of our future revenue and do not rely on backlog to manage our business or evaluate our performance. Changes in the amount of our backlog do not necessarily reflect a corresponding change in the level of actual or potential sales.
Seasonality
Historically, our first quarter revenue is generally seasonally lower than the rest of the year primarily due to lower capacity utilization during the annual new year holidays in China and the impact of typical price negotiations conducted at the end of each calendar year and impacting shipments during this period. This historical pattern is important in recognizing the typical annual distribution of revenue from quarter to quarter through the year. That said, our first quarter revenue varies markedly year to year so should not be considered a reliable indicator of our future revenue or financial performance.
Financial Information by Geographic Region
17
For information regarding our revenue and property, plant and equipment by geographic region, see Note 17 to the Consolidated Financial Statements. For risks relating to our operations see “Item 1A. Risk Factors” and particularly the risks under the caption “Risks related to our operations in China” and the risk factors “Our future results of operations may be subject to volatility as a result of exposure to fluctuations in foreign exchange rates, primarily the Chinese Renminbi (RMB) and Japanese Yen (JPY) exchange rates”, “We face a variety of risks associated with international sales and operations, which if not adequately managed could adversely affect our business and financial results” and “We are subject to global governmental export and import controls that could subject us to liability, impair our ability to compete in international markets or restrict our sales to certain customers”.
Competition
The market for optical communications systems is highly competitive. While no single company competes with us across all of our product areas, our competitors range from large international companies offering a wide range of products to smaller companies specializing in narrow markets. We believe the principal competitive factors in this market are:
• | ability to provide leading edge technologies for high speed communications; |
• | ability to design and manufacture high quality, reliable products, including customized solutions; |
• | breadth of product solutions; |
• | price to performance characteristics; |
• | ability to quickly and consistently produce in high volume and high quality; |
• | ability to meet customers’ specific requirements; |
• | ability to meet customer lead time demands; |
• | financial stability; and |
• | depth of relationships with and proximity to key customers globally. |
We believe we compete favorably with respect to these factors. We believe our principal competitors include:
• | Furukawa Co., Ltd., Fujitsu Optical Components Limited, NTT Electronics Corporation, Oclaro, Inc., Sumitomo, Finisar, Lumentum Holdings Inc. (formerly JDS Uniphase Corporation) and others in Coherent products; |
• | Accelink Technologies Co., Ltd., Broadcom (formerly Avago), Finisar, InnoLight Technology Corporation, M/A-Com, Inc, Oclaro, Source Photonics, Inc., Sumitomo and others in Data center and Client side products; |
• | Lumentum and NTT Electronics Corporation in switching; and |
• | Lumentum, NTT Electronics Corporation, M/A-Com, Inc., Oclaro, Inc., Sumitomo and others in Network Products and Solutions. |
Our competitors may have substantially greater name recognition and technical, financial and marketing resources than we do. Many of our competitors have greater resources to develop products or pursue acquisitions, and more experience in developing or acquiring new products and technologies and in creating market awareness for these products and technologies than we do. In addition, a number of our competitors have the financial resources to offer competitive products at below market pricing levels that could prevent us from competing effectively and which could adversely affect our financial performance.
We also face competition from some of our customers, including Huawei and its affiliate, HiSilicon, who evaluate our capabilities against the merits of manufacturing products internally. These customers may have the ability to manufacture competitive products at a lower cost than we would charge as a result of their higher levels of integration. As a result, these customers may purchase less of our products and there would be additional pressure to lower our selling prices which, accordingly, would negatively impact our revenue and gross margin.
18
Environmental, Health and Safety Matters
Our research and development and manufacturing operations and our products are subject to a variety of environmental, health and safety laws and regulations in the jurisdictions in which we operate. These regulations govern, among other things, the discharge of pollutants to air, water, and soil; the remediation of soil and groundwater contamination; the use, handling and disposal of hazardous materials; employee health and safety; and the hazardous material content and recycling of our products. We use, store and dispose of hazardous materials in our manufacturing operations and as components in our products. We incur costs to comply with existing environmental, health and safety requirements, and any failure to comply, or the identification of contamination for which we are found liable, could cause us to incur additional costs, including cleanup costs, monetary fines, or civil or criminal penalties, or result in the curtailment of our operations. In addition, environmental, health and safety requirements have become more stringent over time, and changes to existing requirements could restrict our ability to expand our facilities, require us to acquire costly pollution control equipment, or cause us to incur other significant expenses or to modify our manufacturing processes or the contents of our products. Some jurisdictions in which we operate or sell our products have enacted requirements regarding the recycling of waste electronic equipment, and/or the packaging and hazardous material content of certain products. For example, jurisdictions including China and the European Union, among a growing number of jurisdictions, have placed restrictions on the use of lead, among other chemicals, in electronic products, which affects the composition and packaging of our products. The passage of such requirements in additional jurisdictions, or the tightening of standards or elimination of certain exemptions in jurisdictions where our products are already subject to such requirements, could cause us to incur significant expenditures to make our products compliant with new requirements, or could limit the markets into which we may sell our products.
Additionally, increasing efforts to control emissions of greenhouse gases, or GHG, may also impact us. For example, our semiconductor manufacturing operations in California use perfluorocarbons, which are classified as a high global warming potential greenhouse gas. Under California’s Global Warming Solutions Act, we designed and installed additional pollution control equipment at our San Jose, California, manufacturing plant to reduce our perfluorocarbon emissions beginning in 2012. Since the end of 2012, our San Jose and Fremont, California, manufacturing facilities have maintained compliance with the Global Warming Solutions Act through the monitoring and reviewing of our Greenhouse Gas Emissions including permits issued locally by the Bay Area Air Quality Management District, and we have submitted reports annually to verify such compliance. In the U.S., the Environmental Protection Agency has announced a finding relating to GHG emissions that may result in promulgation of federal GHG air quality standards that could also affect us.
Available Information
We were incorporated in the State of Delaware in October 1996 as NanoGram Corporation, and we changed our name to NeoPhotonics Corporation in 2002. Our principal offices are located at 2911 Zanker Road, San Jose, CA 95134, USA and our telephone number is +1 (408) 232-9200. Our website address is www.neophotonics.com. Information found on, or accessible through, our website is not a part of, and is not incorporated into, this Annual Report on Form 10-K.
We file electronically with the U.S. Securities and Exchange Commission, or SEC, our annual reports on Form 10-K, quarterly reports on Form 10-Q, current reports on Form 8-K, and amendments to those reports filed or furnished pursuant to Section 13(a) or 15(d) of the Securities Exchange Act of 1934, as amended. We make available on our website at www.neophotonics.com, free of charge, copies of these reports as soon as reasonably practicable after filing these reports with, or furnishing them to, the SEC.
19
ITEM 1A. RISK FACTORS
Risks Associated with Our Business
We are dependent on Huawei Technologies Co., Ltd. and its affiliate HiSilicon Technologies Co., Ltd., Ciena Corporation and our other key customers for a large portion of our revenue and the loss of, or a significant reduction in orders in any period from any of our major customers may reduce our revenue and adversely impact our results of operations.
We have generated most of our revenue from a limited number of customers. In the year ended December 31, 2017, Huawei Technologies Co. Ltd., together with its affiliate HiSilicon Technologies Co., Ltd. (collectively “Huawei”), and Ciena Corporation accounted for approximately 40% and 16% of our revenue, respectively, and our top five customers represented 78% of our revenue. In the year ended December 31, 2016, Huawei Technologies, together with its affiliate HiSilicon (or collectively, Huawei), and Ciena Corporation accounted for approximately 50% and 15% of our revenue, respectively, and our top five customers represented 82% of our revenue. In the year ended December 31, 2015, Huawei and Ciena Corporation accounted for approximately 44% and 21% of our revenue, respectively, and our top five customers represented 82% of our revenue. The loss of, or a significant reduction in orders from these major customers or any of our other key customers would materially and adversely affect our revenue and results of operations.
We are subject to risks and uncertainties related to our revenue growth outlook in China.
Fiber optics telecommunication growth in China is an important contributor to our success. We expect a major portion of our revenue to come from China infrastructure spending in wireline and wireless networks, notably from the three largest China telecom carriers, China Mobile Communications Corporation, China Telecommunications Corporation and China United Network Communications Group Co., Ltd. In part, this infrastructure spending originates from the publicly announced China Broadband 2020 and related initiatives. Tender awards from the China telecom carriers and spending under these initiatives was slower in 2017 than anticipated, and our leading customers in China had accumulated excess inventory during 2016, both of which adversely affected our financial condition and results of operations in 2017. If the anticipated Chinese spending and carrier tender awards do not materialize as anticipated, or if there are further unanticipated and/or prolonged delays in the Chinese initiative, our business, financial condition, results of operations and prospects would be further adversely affected.
We have had a history of losses which may recur in the future.
We have had a history of losses and we may incur additional losses in future periods. As of December 31, 2017, our accumulated deficit was $352.0 million. We also expect to continue to make significant expenditures related to the ongoing operation and development of our business. These include expenditures related to the sales, marketing and development of our products and to maintain our manufacturing facilities and research and development operations.
We may need to raise additional capital in order to pursue our business strategies or maintain our operations, and we may not be able to obtain capital when desired on favorable terms, if at all, or without dilution to our stockholders.
We believe that our existing cash and cash equivalents, and cash flows from our operating activities and funds available under our credit facilities will be sufficient to meet our anticipated cash needs for at least the next 12 months. However, we operate in an industry that makes our prospects difficult to evaluate. It is possible that we may not generate sufficient cash flow from operations or otherwise have the capital resources to meet our future capital needs. If this occurs, we may need additional financing to continue operations or execute on our current or future business strategies, including to:
• | invest in our research and development efforts, including by hiring additional technical and other personnel; |
• | maintain and expand our operating or manufacturing infrastructure; |
• | acquire complementary businesses, products, services or technologies; or |
• | otherwise pursue our strategic plans and respond to competitive pressures. |
We do not know with certainty what forms of financing, if any, will be available to us. If financing is not available on acceptable terms, if and when needed, our ability to fund our operations, enhance our research and development and sales and marketing functions, develop and enhance our products, respond to unanticipated events, including unanticipated opportunities, or otherwise respond to competitive pressures could be adversely impacted. In any such event, our business, financial position and results of operations could be materially harmed. Moreover, if we raise additional funds through the issuance of equity or convertible debt securities, the percentage ownership of our stockholders could be significantly diluted, and these newly issued securities may have rights, preferences or privileges senior to those of existing stockholders. If we fail to raise sufficient additional capital if needed, we may not be able to completely execute our business plan and may not be able to continue our operations without further reducing expenses.
20
If we incur additional indebtedness through arrangements such as credit agreements or term loans, such arrangements may impose restrictions and covenants that limit our ability to respond appropriately to market conditions, make capital investments or take advantage of business opportunities. In addition, any additional debt arrangements we may enter into would likely require us to make regular interest payments, which could adversely affect our results of operations.
Manufacturing problems could impact manufacturing yields or result in delays in product shipments to customers and could adversely affect our revenue, competitive position and reputation.
We may experience delays, disruptions or quality control problems in our manufacturing operations or supply chain constraints, which could adversely impact manufacturing volumes, yields or delay product shipments. As a result, we could incur additional costs that would adversely affect our gross margin, and product shipments to our customers could be delayed beyond the shipment schedules requested by our customers, which would negatively affect our revenue, competitive position and reputation.
Additionally, manufacturing yields depend on a number of factors, including the stability and manufacturability of the product design, manufacturing improvements gained over cumulative production volumes, the quality and consistency of component parts and the nature and extent of customization requirements by customers. Capacity constraints, raw materials shortages, logistics issues, labor shortages, volatility in utilization of manufacturing operations, supporting utility services and other manufacturing supplies, the introduction of new product lines, rapid increases in production demands and changes in customer requirements, manufacturing facilities or processes, or those of some third party contract manufacturers and suppliers of raw materials and components have historically caused, and may in the future cause, reduced manufacturing yields, negatively impacting the gross margin on, and our production capacity for, those products. Our ability to maintain sufficient manufacturing yields is particularly challenging with respect to PICs due to the complexity and required precision of a large number of unique manufacturing process steps. Manufacturing yields for PICs can also suffer if contaminated materials or materials that do not meet highly precise composition requirements are inadvertently utilized. Because a large portion of our PIC manufacturing costs are fixed, PIC manufacturing yields have a substantial effect on our gross margin. Lower than expected manufacturing yields could also delay product shipments and decrease our revenue.
Customer demand is difficult to accurately forecast and, as a result, we may be unable to optimally match production with customer demand.
We make planning and spending decisions based on our estimates of customer requirements. The short-term nature of commitments by many of our customers, and the possibility of unexpected changes in demand for their products, reduce our ability to accurately estimate future customer requirements. In 2016 and 2017, we incurred substantial capital expenditures to increase manufacturing capacity in response to strong customer demand in 2016 (particularly in China) and in expectation of continued strong demand in 2017. However, tender awards from the China telecom carriers and spending under the China Broadband 2020 and related initiatives was slower in 2017 than anticipated, and our leading customers in China have accumulated excess inventory during 2016, which resulted in decreased customer demand and underutilization of certain of our manufacturing operations. Because many of our costs and operating expenses are relatively fixed, reduction in customer demand due to market downturns or other reasons would have a material adverse effect on our operating results, as occurred in 2017.
On the other hand, on occasion, customers may require rapid increases in production, which can strain our resources, cause our manufacturing to be negatively impacted by materials shortages, necessitate higher or more restrictive procurement commitments, increase our manufacturing yield loss and scrapping of excess materials, result in delayed shipments and/or reduce our gross margins. We may not have sufficient capacity at any given time to meet the volume demands of our customers, and we may have difficulty expanding our manufacturing operations on a timely basis to meet increasing customer demand. Additionally, one or more of our suppliers may not have sufficient capacity at any given time to meet our volume demands. Any inability to meet customer demands for rapid increases in production in the future could have a material adverse effect on our business, financial condition, results of operations and prospects.
We are under continuous pressure to reduce the prices of our products, which has adversely affected, and may continue to adversely affect, our gross margins.
The communications networks industry has been characterized by declining product prices over time as technological advances increase price and performance and put pressure on existing products. We have reduced the prices of many of our products in the past, most often during annual end-of-year price negotiation. We expect pricing pressure for our products to continue, including from our major customers. To maintain or increase their market share, our competitors also reduce prices of their products each year. In addition, our customers may seek to internally develop and manufacture competing products at a lower cost than we would otherwise charge, which would add additional pressure on us to lower our selling prices. If we are
21
unable to offset any future reductions in our average selling prices by increasing our sales volume, reducing our costs or introducing new products, our gross margin would be adversely affected.
We depend upon outside contract manufacturers for a portion of the manufacturing process for some of our products. Our operations and revenue related to these products could be adversely affected if we encounter problems with any such contract manufacturer.
While the majority of our products are manufactured internally, we also rely upon contract manufacturers in Thailand, China, Japan and other Asia locations to provide back-end manufacturing and production of some of our products. Our reliance on contract manufacturers for some of our products makes us vulnerable to possible production capacity constraints, reduced control over their supply chains, delivery schedules, manufacturing yields, manufacturing quality/controls and costs. If one of our contract manufacturers is unable to meet all of our customer demand in a timely fashion, whether due to their direct operating control or due to their supply chain, this could have a material adverse effect on the revenue from our products.
If the Metro and data center interconnect market sectors do not grow as rapidly as we expect, or if demand for our products in these sectors is lower than we expect, our revenue growth may be adversely affected.
We expect that our future growth in the market for 100G and beyond coherent products to be driven in large part by the increased adoption of our products in the Metro market segment and in the high-performance data center interconnect market. Over the last several years, 100G and beyond coherent technology has seen increasing adoption in the Long Haul market segment and now is penetrating the much larger Metro sector of the market.
If we fail to achieve or sustain a leadership position in the Long Haul telecom sector and use our position in that market to penetrate the Metro and data center interconnect segments, if these segments fail to grow as expected, or if demand for our products in the Metro and data center interconnect market segments fails to materialize, our business, financial condition, results of operations and prospects would suffer.
We face intense competition which could negatively impact our results of operations and market share.
The communications networks industry is highly competitive. Our competitors range from large international companies offering a wide range of products to smaller companies specializing in niche products.
Some of our competitors have substantially greater name recognition, technical, financial, and marketing resources, and greater manufacturing capacity, as well as better-established relationships with customers, than we do. Some of our competitors have more resources to develop or acquire, and more experience in developing or acquiring, new products and technologies. Some of our competitors may be able to develop new products more quickly than us and may be able to develop products that are more reliable or which provide more functionality than ours. In addition, some of our competitors have the financial resources to offer competitive products at below-market pricing levels that could prevent us from competing effectively and result in a loss of sales or market share or cause us to lower prices for our products.
We also face competition from some of our customers who evaluate our capabilities against the merits of manufacturing products internally, including Huawei. Due to the fact that such customers are not seeking to make a comparable profit directly from the manufacture of these products, they may have the ability to provide competitive products at a lower total cost than we would charge such customers. As a result, these customers may purchase less of our products and there would be additional pressure to lower our selling prices which, accordingly, would negatively impact our revenue and gross margin.
The Chinese Government Ministry of Industry and Information Technology has announced a five-year optical component technology roadmap with the aim to reduce China’s dependency on non-domestic companies for high-end optical chips and sub-components, including some products manufactured and sold by us. This announcement continues an ongoing trend in China to build domestic industry in this area, and, while we believe local Chinese component suppliers do not currently have the capability to supply the highest performance optical chips and sub-components, those companies may over time develop such capability and negatively impact our revenue and financial performance if we do not continue to innovate and maintain our lead in the highest speed and performance optical components.
If we fail to retain our key personnel or if we fail to attract additional qualified personnel, we may not be able to achieve our anticipated growth and our business could suffer.
Our success and ability to implement our business strategy depends upon the continued contributions of our senior management team and others, including senior management in foreign subsidiaries and our technical and operations employees in all locations. Our future success depends, in part, on our ability to attract and retain key personnel, including our senior management and others. The loss of services of members of our senior management team or key personnel or the inability to
22
continue to attract and retain qualified personnel could have a material adverse effect on our business. Competition for highly skilled technical and operations people where we operate is extremely intense, and we continue to face challenges identifying, hiring and retaining qualified personnel in many areas of our business.
The majority of our customer contracts do not commit customers to specified buying levels, and many of our customers may decrease, cancel or delay their buying levels at any time with little or no advance notice to us.
Our products are typically sold pursuant to individual purchase orders or by use of a vendor-managed inventory, or VMI, model, which is a process by which we ship agreed quantities of products to a customer-designated location and those products remain our inventory and we retain the title and risk of loss for those products until the customer takes possession of the products. Our customers are typically not contractually committed to buy any quantity of products beyond firm purchase orders. Many of our customers may increase, decrease, cancel or delay purchase orders already in place. We have experienced and expect to continue to experience wide fluctuations in demand from customers using VMI, particularly Huawei and its affiliate HiSilicon Technologies Co., Ltd., even in instances where we have built and shipped products to the customer-designated locations as VMI.
If we fail to adequately manage our long-term growth and expansion, our business and financial results will suffer.
Until 2017, we experienced significant growth over several years through, among other things, internal manufacturing and related expansion programs, product development and acquisitions of other businesses and products. Our business expanded to numerous locations, including foreign locations, and as a result became more complex, more demanding of management’s attention and subject to new laws and regulations.
Our success and ability to further scale our business will depend, in part, on our ability to manage changes in a cost-effective and efficient manner. If we cannot manage any future growth, we may be unable to take advantage of market opportunities, execute our business strategies or respond to competitive pressures. Any failure to effectively manage growth, maintain our quality and/or or customer satisfaction could adversely affect our business and reputation.
Our success will depend on our ability to anticipate and quickly respond to evolving technologies and customer requirements.
Our ability to anticipate and respond to evolving technology, industry standards, customer requirements and product offerings, and to develop and introduce new and enhanced products and technologies, will be critical factors in our ability to succeed. In addition, the introduction of new products by other companies embodying new technologies, or the emergence of new industry standards, could render our existing products uncompetitive from a pricing standpoint, obsolete or otherwise unmarketable.
While we rely on many suppliers, there are a few which, if they stopped, decreased or delayed shipments to us, it could have an adverse effect on our business and financial results.
We depend on a limited number of suppliers for certain components and materials we have qualified to use in the manufacture of certain of our products. Some of these suppliers could disrupt our business if they stop, decrease or delay shipments or if the components they ship have quality, consistency, or business continuity issues. Some of these components and materials are available only from a sole source, or have been qualified only from a single source. We may also face component shortages if we experience increased demand for components beyond what our qualified suppliers can deliver. If we experience component shortages from certain key suppliers, we may be unable to meet customer demand or may have higher purchasing costs, or both. Although we engage in various actions to mitigate the impact of these shortages, any inability on our part to obtain sufficient quantities of critical components at reasonable costs could adversely affect our ability to meet demand for our products, which could cause our revenue, results of operations, or both to suffer.
Our customers generally restrict our ability to change the component parts in our modules without their approval and such changes may require repeating product qualification processes. The reliance on a sole supplier, single qualified vendor or limited number of suppliers could result in delivery and quality problems, reduced control over product pricing, reliability and performance and an inability to identify and qualify another supplier in a timely manner. Any supply deficiencies relating to the quality, quantities or timeliness of delivery of components that we use to manufacture our products could adversely affect our ability to fulfill our customer orders and our results of operations.
We must continually achieve new design wins and enhance existing products or our business and future revenue may be harmed.
The markets for our products are characterized by frequent new product introductions, changes in customer requirements and evolving industry standards, all with an underlying pressure to reduce cost and meet stringent reliability and
23
qualification requirements. Our future performance will depend on our successful development, introduction and market acceptance of new and enhanced products that address these challenges. The anticipated or actual introduction of new and enhanced products by us and by our competitors may cause our customers to defer or cancel orders for our existing products, and could result, and in the past, has resulted, in a write-down in the value of inventory. To the extent customers defer or cancel orders for our products for any reason or we fail to achieve new design wins, our competitive position would be adversely affected and our ability to grow revenue would be impaired.
Furthermore, fast time-to-market with new products can be critical to success in our markets. It is difficult to displace an existing supplier for a particular type of product once a network equipment vendor has chosen a supplier, even if a later-to-market product provides superior performance or cost efficiency. If we are unable to make our new or enhanced products commercially available on a timely basis, we may lose existing and potential customers and our financial results would suffer.
We may be exposed to costs or losses from product lines that we intend to exit or may undertake divestiture of portions of our business that require us to continue providing substantial post-divestiture transition services and support, which may cause us to incur unanticipated costs and liabilities and adversely affect our financial condition and results of operations.
We have a strategy to exit products that have been declining in revenue and have lower gross margins than our other higher speed products. For instance, in January 2017, we completed the sale of assets and transfer of certain liabilities of our access network and low speed transceiver product lines (the “Low Speed Transceiver Products”). We may incur additional costs in connection with the sale or end-of-life of these products, or other products and/or facilities in the future, and our revenues and net income could be negatively affected, particularly in the short term, in connection with the end-of-life or sales of such products and/or facilities. It is also possible that we could incur continued costs or liabilities after the end-of-life process is completed, which could have a material adverse effect on our financial condition or operating results.
We are subject to the cyclical nature of the markets in which we compete and any future downturn may reduce demand for our products and revenue.
The markets in which we compete are tied to the aggregate capital expenditures of telecommunications service providers as they build out and upgrade their network infrastructure. These markets may be cyclical and characterized by rapid technological change, price erosion, evolving standards and wide fluctuations in product supply and demand. In the past, including recently to varying degrees in China, the U.S. and Europe, these markets have experienced significant downturns, often connected with, or in anticipation of, the maturation of product cycles—for both manufacturers’ and their customers’ products—or in response to over or under purchasing of inventory by our customers relative to ultimate carrier demand, and with declining general economic conditions. These downturns have been characterized by diminished product demand, production overcapacity, high inventory levels and accelerated erosion of average selling prices.
Our historical results of operations have been subject to substantial fluctuations, and we may experience substantial period-to-period fluctuations in future results of operations.
If spending for communications networks does not continue to grow as expected, our business and financial results may suffer.
Our future success as a provider of components, modules and subsystems to leading network equipment vendors depends on continued capital spending on global communications networks. Network traffic has experienced rapid growth driven primarily by bandwidth-intensive content, including cloud services, mobile video and data services, wireless 4G/LTE and 5G services, social networking, video conferencing and other multimedia. This growth is intensified by the proliferation of fixed and wireless devices that are enabling consumers to access content at increasing data rates anytime and anywhere. Our future success depends on continued demand for high-bandwidth, high-speed communications networks and the ability of network equipment vendors and carrier data center operators to fulfill this demand. In 2017, this growth slowed, primarily due to soft demand and high inventory levels in China, which adversely affected our business and financial condition in 2017. While we believe the long term prospects for growth in data traffic remain strong, our business and financial results will suffer if growth does not occur as expected.
We face a variety of risks associated with international sales and operations, which if not adequately managed could adversely affect our business and financial results.
We derive, and expect to continue to derive, a significant portion of our revenue from international sales in various markets. In addition, a major portion of our operations are based in Shenzhen and Dongguan, China and we have additional operations in Japan, Russia and Canada. Our international revenue and operations are subject to a number of material risks, including, but not limited to:
• | difficulties in staffing, managing and supporting operations in more than one country; |
24
• | difficulties in enforcing agreements and collecting receivables through foreign legal systems; |
• | fewer legal protections for intellectual property in foreign jurisdictions; |
• | the need for compliance with local laws and regulations; |
• | foreign and U.S. taxation issues and international trade barriers; |
• | general economic and political conditions in the markets in which we operate; |
• | difficulties in obtaining any necessary governmental authorizations for the export of our products to certain foreign jurisdictions; |
• | imposition of export restrictions on sales to any of our major foreign customers; |
• | fluctuations in foreign economies and fluctuations in the value of foreign currencies and interest rates; |
• | trade and travel restrictions; |
• | outbreaks of contagious disease; |
• | domestic and international economic or political changes, hostilities and other disruptions; and |
• | difficulties and increased expenses in complying with a variety of U.S. and foreign laws, regulations and trade standards, including the Foreign Corrupt Practices Act and international labor standards. Negative developments in any of these areas in China, Japan, Russia or other countries could result in a reduction in demand for our products, the cancellation or delay of orders already placed, difficulties in producing and delivering our products, threats to our intellectual property, difficulty in collecting receivables, higher labor costs and a higher cost of doing business. |
In addition, although we maintain an anti-corruption compliance program throughout our company, violations of our compliance program may result in criminal or civil sanctions, including material monetary fines, penalties and other costs against us or our employees, and may have a material adverse effect on our business.
Failure to realize the anticipated benefits from our business in the Russian Federation may affect our future results of operations and financial condition.
In connection with our raising capital in an April 2012 private placement of common stock, we established a wholly-owned subsidiary and company operations in the Russian Federation and we committed to make substantial investments in our Russian operations over a period of several years. We could be required to pay up to $2.0 million to Joint Stock Company “RUSNANO”, or Rusnano, at the time if we do not meet certain investment conditions towards our Russian operations by 2019.
The establishment of successful operations in the Russian Federation requires substantial capital expenditure, and is in part dependent on the cooperation of Russian entities that could include the Russia government and other third parties. We are also subject to economic, political, legal, and social events and developments in Russia, including but not limited to actions such as restrictions placed on U.S. companies doing business in Russia. If there are delays in our efforts to establish and maintain operations in the Russian Federation, the anticipated benefits of our Russian expansion may not be realized or may take longer to realize than expected.
Our revenues and costs will fluctuate over time, making it difficult to predict our future results of operations.
Our revenue, gross margin and results of operations have varied significantly and are likely to continue to vary from quarter to quarter due to a number of factors, many of which are not within our control. For instance, changes in gross margin may result from various factors, such as changes in pricing, changes in our fixed costs, changes in the cost of labor, changes in the mix of our products sold, changes in the amount of product manufactured versus the amount of product sold over time, and charges for excess and obsolete inventory. In addition, our first quarter revenue is generally seasonally lower than the rest of the year primarily due to lower capacity utilization during the holidays in China and the impact of typical price negotiations during the fourth quarter. It is difficult for us to accurately forecast our future revenue and gross margin and plan expenses accordingly and, therefore, it is difficult for us to predict our future results of operations.
Increasing costs and other factors may adversely impact our gross margins.
We may not be able to maintain or improve our gross margins because of slow introductions of new products, pricing pressure from increased competition, failure to effectively reduce the cost of existing products, failure to improve our product mix, future macroeconomic or market volatility reducing sales volumes, changes in customer demand (including a change in product mix among different areas of our business) or other factors. Our gross margins can also be adversely affected for reasons including, but not limited to, fixed manufacturing costs that would not be expected to decrease in proportion to any decrease in revenues; unfavorable production yields or variances; increases in costs of input parts and materials; the timing of movements in our inventory balances; warranty costs and related returns; changes in foreign currency exchange rates; possible exposure to inventory valuation reserves; and other increases in our costs and expenses, including as a result of rising labor
25
costs in China. Such significant increases in costs without corresponding increases in revenue would materially and adversely affect our business, our results of operations and our financial condition and our gross margins.
If our customers do not qualify our products for use, then our results of operations may suffer.
Prior to placing volume purchase orders with us, most of our customers require us to obtain their approval—called qualification in our industry—of our new and existing products, and our customers often audit our manufacturing facilities and perform other vendor evaluations during this process. The qualification process involves product sampling and reliability testing and collaboration with our product management and engineering teams in the design and manufacturing stages. If we are unable to qualify our products with customers, then our revenue would be lower than expected and we may not be able to recover the costs associated with the qualification process which would have an adverse effect on our results of operations.
In addition, due to evolving technological changes in our markets, a customer may cancel or modify a design project before we have qualified our product or begun volume manufacturing of a qualified product. It is unlikely that we would be able to recover the expenses for cancelled or unutilized custom design projects.
Potential changes in our effective tax rate could negatively affect our future results.
We are subject to income taxes in the U.S., China, Japan and other foreign jurisdictions, and our domestic and international tax liabilities are subject to the allocation of expenses in differing jurisdictions. Our tax rate is affected by changes in the mix of earnings and losses in countries with differing statutory tax rates, certain non-deductible expenses and the valuation of deferred tax assets and liabilities, including our ability to utilize our net operating losses. Increases in our effective tax rate could negatively affect our results of operations.
We may be involved in intellectual property disputes, which could divert management’s attention, cause us to incur significant costs and prevent us from selling or using the challenged technology.
Participants in the markets in which we sell our products have experienced frequent litigation regarding patent and other intellectual property rights. Numerous patents in these industries are held by others, including our competitors. In addition, from time to time, we have been notified that we may be infringing certain patents or other intellectual property rights of others. Regardless of their merit, responding to such claims can be time consuming, divert management’s attention and resources and may cause us to incur significant expenses. In addition, there can be no assurance that third parties will not assert infringement claims against us, whether or not such claims are valid. While we believe that our products do not infringe in any material respect upon intellectual property rights of other parties and/or meritorious defense would exist with respect to any assertions to the contrary, we cannot be certain that our products would not be found infringing the intellectual property rights of others.
In January 2010, Finisar Corporation, or Finisar, filed a complaint in the U.S. District Court for the Northern District of California against us and three other co-defendants. In the complaint, Finisar alleged infringement of certain of its U.S. patents arising from the co-defendants’ respective manufacture, importation, use, sale of or offer to sell certain optical transceiver products in the U.S. In March 2010, we filed an answer to the complaint and counterclaims, asserting two claims of patent infringement and additional claims asserting that Finisar has violated state and federal competition laws and violated its obligations to license on reasonable and non-discriminatory terms. In May 2010, the Court dismissed without prejudice all co-defendants (including us) except Source Photonics, Inc., on grounds that such claims should have been asserted in four separate lawsuits, one against each co-defendant. This dismissal without prejudice does not prevent Finisar from bringing a new similar lawsuit against us. In May 2012, we and Finisar agreed to toll our respective claims until the refiling of certain of the previously asserted claims from this dispute. As a result, Finisar is permitted to bring a new lawsuit against us if it chooses to do so, and we may bring new claims against Finisar upon seven days written notice prior to filing such claims.
Although we believe that we would have meritorious defenses to the infringement allegations and intend to defend any new similar lawsuit vigorously, there can be no assurance that we will be successful in our defense. Even if we are successful, we may incur substantial legal fees and other costs in defending the lawsuit. Further, a new lawsuit, if brought by either party, would be likely to divert the efforts and attention of our management and technical personnel, which could harm our business.
We have pursued and may continue to pursue acquisitions. Acquisitions could be difficult to integrate, divert the attention of key personnel, disrupt our business, dilute stockholder value and impair our financial results.
As part of our business strategy, we have pursued and intend to continue to pursue acquisitions of complementary businesses, products, services or technologies that we believe could accelerate our ability to compete in our existing markets or allow us to enter new markets. Any of these transactions could be material to our financial condition and results of operations. For instance, in October 2011, we completed the acquisition of Santur Corporation, a designer and manufacturer of InP-based
26
PIC products, and in March 2013 we completed the acquisition of the optical semiconductor business unit of LAPIS Semiconductor Co., Ltd., now known as NeoPhotonics Semiconductor. We purchased the tunable laser product lines of EMCORE in January 2015 and the power monitoring products business of EigenLight Corporation, or Eigenlight, in November 2015.
Acquisitions involve numerous risks. The failure to successfully evaluate and execute acquisitions or otherwise adequately address such risks could result in excess costs and materially harm our business and financial results.
Acquisitions also frequently result in the recording of goodwill and other intangible assets which are subject to potential impairments which have occurred in the past and which, were they to occur in the future, could harm our financial results.
It could be discovered that our products contain defects that may cause us to incur significant costs, divert our attention, result in a loss of customers and result in product liability claims.
Our products are complex and undergo quality testing as well as formal qualification, both by our customers and by us. For various reasons, such as the occurrence of performance problems that are unforeseeable in testing or that are detected only when products age or are operated under peak stress conditions, our products may fail to perform as expected long after customer acceptance. Failures could result from faulty components or design, problems in manufacturing or other unforeseen reasons. As a result, we could incur significant costs to repair or replace defective products under warranty, particularly when such failures occur in installed systems. Any significant product failure could result in lost future sales of the affected product and other products, as well as customer relations problems and litigation, which could harm our business.
The communications networks industry has long product development cycles requiring us to incur product development costs without assurances of an acceptable investment return.
Large volumes of communications equipment and support structures are installed with considerable expenditures of funds and other resources, and long investment return period expectations. At the component supplier level, these cycles create considerable, typically multi-year, gaps between the commencement of new product development and volume purchases. Due to changing industry and customer requirements, we are constantly developing new products, including seeking to further integrate functions on PICs and developing and using new technologies in our products. These development activities necessitate significant investment of capital. Our new products often require a long time to develop because of their complexity and rigorous testing and qualification requirements. Accordingly, we and our competitors often incur significant research and development and sales and marketing costs for products that, initially, will be purchased by our customers long after much of the cost is incurred and, in some cases, may never be purchased due to changes in industry or customer requirements in the interim.
We are subject to global governmental export and import controls that could subject us to liability, impair our ability to compete in international markets, or restrict our sales to certain customers.
We are subject to export and import control laws, trade regulations and other trade requirements that limit which products we sell and where and to whom we sell our products, especially laser-dependent products. In some cases, it is possible that export licenses would be required from the U.S. or other government agencies outside the U.S. such as, but not limited to, Japan, China or Russia for some of our products in accordance with various statutes. In addition, various countries regulate the export or import of certain technologies and have enacted laws that could limit our ability to distribute our products. Failure to comply with these and similar laws on a timely basis, or at all, or any limitation on our ability to export or sell our products or to obtain any required licenses would adversely affect our business, financial condition and results of operations.
If we fail to protect our intellectual property and other proprietary rights, our business and results of operations could be materially harmed.
Our success depends to a significant degree on our ability to protect our intellectual property and other proprietary rights. We rely on a combination of patent, trademark, copyright, trade secret and unfair competition laws, as well as license agreements and other contractual provisions, to establish and protect our intellectual property and other proprietary rights. We have applied for patent registrations in the U.S. and in other foreign countries, some of which have been issued. We cannot guarantee that our pending applications will be approved by the applicable governmental authorities.
Policing unauthorized use of our technology is difficult and we cannot be certain that the steps we have taken will prevent the misappropriation, unauthorized use or other infringement of our intellectual property rights. Further, we may not be able to effectively protect our intellectual property rights from misappropriation or other infringement in foreign countries where we have not applied for patent protections, and where effective patent, trademark, trade secret and other intellectual
27
property laws may be unavailable, or may not protect our proprietary rights as fully as U.S. or Japan law. Particularly, our U.S. patents do not afford any intellectual property protection in China, Japan, Canada or other Asia locations, including Russia, where we have company operations.
In the future, we may need to take legal actions to prevent third parties from infringing upon or misappropriating our intellectual property or from otherwise gaining access to our technology. Protecting and enforcing our intellectual property rights and determining their validity and scope could result in significant litigation costs and require significant time and attention from our technical and management personnel. If we fail to protect our intellectual property and other proprietary rights, or if such intellectual property and proprietary rights are infringed or misappropriated, our business, results of operations or financial condition could be materially harmed.
If we fail to obtain the right to use the intellectual property rights of others which are necessary to operate our business, and to protect their intellectual property, our business and results of operations will be adversely affected.
From time to time we may choose to, or be required to, license technology or intellectual property from third parties in connection with the development of our products. Failure to obtain a necessary third-party license required for our product offerings or to develop new products and product enhancements could adversely affect our business.
Participation in standards setting organizations may subject us to intellectual property licensing requirements or limitations that could adversely affect our business and prospects.
In the course of our participation in the development of emerging standards for some of our present and future products, we may agree to grant to all other participants a license to our patents that are essential to the practice of those standards on reasonable and non-discriminatory, or RAND, terms. If we fail to limit to whom we license our patents, or fail to limit the terms of any such licenses, we may be required to license our patents or other intellectual property to others in the future, which could limit the effectiveness of our patents against competitors.
Any potential dispute involving our products, services or technology could also include our customers using our products, which could trigger our indemnification obligations to them and result in substantial expenses to us.
In any potential dispute involving allegations that our products, services or technology infringe the intellectual property rights of third parties, our customers could also become the target of litigation. Because we often indemnify our customers for intellectual property claims made against them for products incorporating our technology, any claims against our customers could trigger indemnification obligations in some of our supply agreements, which could result in substantial expenses such as increased legal expenses, product recalls, damages for past infringement or royalties for future use.
Natural disasters, terrorist attacks or other catastrophic events could harm our operations and our financial results.
Our worldwide operations could be subject to natural disasters and other business disruptions, which could harm our future revenue and financial condition and increase our costs and expenses. For example, our corporate headquarters and wafer fabrication facility in Silicon Valley, California and our Tokyo, Japan facility are located near major earthquake fault lines, and our manufacturing facilities are located in Shenzhen and Dongguan, China, areas that are susceptible to typhoons. We are not insured against many natural disasters, including earthquakes.
Similarly, our worldwide operations could be subject to secondary effects of natural disasters, terrorist attacks or other catastrophic events. Even if our facilities are not directly affected, any of these types of events could substantially disrupt the business of our suppliers or customers, which could have a material adverse effect on us.
Rapidly changing standards and regulations could make our products obsolete, which would cause our revenue and results of operations to suffer.
We design our products to conform to regulations established by governments and to standards set by industry standards bodies worldwide, such as The American National Standards Institute, the European Telecommunications Standards Institute, the International Telecommunications Union and the Institute of Electrical and Electronics Engineers. Various industry organizations are currently considering whether and to what extent to create standards for elements used in 100Gbps and beyond systems. Because certain of our products are designed to conform to current specific industry standards, if competing or new standards emerge that are preferred by our customers, we would have to make significant expenditures to develop new products and our revenue and results of operations would suffer.
Our future results of operations may be subject to volatility as a result of exposure to fluctuations in foreign exchange rates, primarily the Chinese Renminbi (RMB) and Japanese Yen (JPY) exchange rates.
28
We are exposed to foreign exchange risks. Foreign currency fluctuations may adversely affect our revenue and our costs and expenses, and hence our results of operations. A substantial portion of our business is conducted through our subsidiaries based in China, whose functional currency is the RMB and Japan, whose functional currency is the JPY, and a smaller amount in Russian Rubles (RUB). The value of the RMB against the U.S. dollar and other currencies and the value of the JPY and RUB against the U.S. dollar and other currencies fluctuate and are affected by, among other things, changes in political and economic conditions.
To the extent that transactions by our subsidiaries in China and Japan are denominated in currencies other than the RMB and JPY, we bear the risk that fluctuations in the exchange rates of the RMB and JPY in relation to other currencies could decrease our revenue or increase our costs and expenses, therefore having an adverse effect on our future results of operations.
While we generate a significant portion of our revenue in U.S dollars, a significant portion of our cost of goods sold are in RMB and JPY. Therefore appreciation in RMB and JPY against the U.S. dollar would negatively impact our cost of goods sold upon translation to U.S. dollars.
We have entered into hedging transactions to reduce the short-term impact of foreign currency fluctuations. However, the availability and effectiveness of these hedging transactions may be limited and we may not be able to successfully hedge our exposure. In addition, our currency exchange variations may be magnified by Chinese exchange control regulations that restrict our ability to convert RMB into foreign currency.
We identified a material weakness in our internal control over financial reporting as of the end of 2016 which has been remediated as of December 31, 2017.
As part of our annual evaluation of internal controls for fiscal 2016, our management identified several deficiencies in our internal control over financial reporting related to certain revenue cut-off procedures. These deficiencies aggregated to a material weakness in our controls over revenue cut-off procedures, which affected the timing of our revenue recognition. A material weakness is defined as a deficiency, or combination of deficiencies, in internal control over financial reporting, such that there is a reasonable possibility that a material misstatement of our annual or interim financial statements will not be prevented or detected on a timely basis. No actual material misstatements were identified for the year ended December 31, 2016.
In 2017, we completed implementation of a remediation plan designed to address this material weakness. Our management assessed the effectiveness of our internal control over financial reporting and concluded that this material weakness had been remediated by the end of 2017 and that our internal control over financial reporting was effective as of December 31, 2017. However, if material weaknesses in our internal controls are discovered or occur in the future, our consolidated financial statements may contain material misstatements and we could be required to restate our financial results. For more information see “Item 9A. Controls and Procedures”.
If we fail to maintain effective internal control over financial reporting in the future, the accuracy and timing of our financial reporting may be adversely affected.
Our management is responsible for establishing and maintaining adequate internal control over our financial reporting, as defined in Rule 13a-15(f) under the Securities Exchange Act of 1934, as amended, or the Exchange Act.
Preparing our consolidated financial statements involves a number of complex manual and automated processes, which are dependent upon individual data input or review and require significant management judgment. One or more of these elements may result in errors that may not be detected and could result in a material misstatement of our consolidated financial statements. If we fail to maintain the adequacy of our internal controls over financial reporting, our business and operating results may be harmed and we may fail to meet our financial reporting obligations. If material weaknesses in our internal control are discovered or occur, our consolidated financial statements may contain material misstatements and we could be required to restate our financial results.
Our internal control over financial reporting may not prevent or detect misstatements because of its inherent limitations, including the possibility of human error, the circumvention or overriding of controls, or fraud. Even effective internal controls can provide only reasonable assurance with respect to the preparation and fair presentation of financial statements. Any failure of our internal controls could adversely affect the results of the periodic management evaluations and annual independent registered public accounting firm attestation reports regarding the effectiveness of our internal control over financial reporting. If we cannot provide reliable financial reports or prevent fraud, our business and results of operations could be harmed, investors could lose confidence in our reported financial information, and the trading price of our stock may decline.
29
We may be subject to disruptions or failures in information technology systems and network infrastructures that could have a material adverse effect on our business and financial condition.
We rely on the efficient and uninterrupted operation of complex information technology systems and network infrastructures to operate our business. A disruption, infiltration or failure of our information technology systems as a result of software or hardware malfunctions, system implementations or upgrades, computer viruses, cyber-attacks, third-party security breaches, employee error, theft or misuse, malfeasance, power disruptions, natural disasters or accidents could cause breaches of data security, loss of intellectual property and critical data and the release and misappropriation of sensitive competitive information and partner, customer and employee personal data. Any of these events could harm our competitive position, result in a loss of customer confidence, cause us to incur significant costs to remedy any damages and ultimately materially adversely affect our business and financial condition.
Covenants in our borrowing arrangements may limit our flexibility in responding to business opportunities and competitive developments and increase our vulnerability to adverse economic or industry conditions.
We have lending arrangements with several financial institutions, which generally require us to maintain certain financial covenants and limit our ability to take certain actions such as incurring some kinds of additional debt, paying dividends, or engaging in certain transactions like mergers and acquisitions, investments and asset sales without the lenders’ consent. These restrictions may limit our flexibility in responding to business opportunities, competitive developments and adverse economic or industry conditions. In addition, a breach of any of these covenants, or a failure to pay interest or indebtedness when due under any of our credit facilities, could result in a variety of adverse consequences, including the acceleration of our indebtedness.
We may be unable to utilize our net operating loss carryforwards to reduce our income taxes, which could adversely affect our future financial results.
As of December 31, 2017, we had net operating loss, or NOL, carryforwards for U.S. federal and state tax purposes of $245.0 million and $52.0 million, respectively. As these net operating losses have not been utilized and may not be utilized prior to their expiration in the future. The utilization of the NOL and tax credit carryforwards are subject to a substantial limitation imposed by Section 382 of the Internal Revenue Code of 1986, as amended, or the Code, and similar state provisions. We recorded deferred tax assets, net of valuation allowance, for the NOL carryforwards currently available after considering the existing Section 382 limitation. If we incur an additional limitation under Section 382, then the NOL carryforwards, as disclosed, could be reduced by the impact of any future limitation that would result in existing NOL carryforwards and tax credit carryforwards expiring unutilized and increases in future tax liabilities.
Comprehensive tax reform bills could adversely affect our business and financial condition.
The U.S. government recently enacted comprehensive tax legislation (the Tax Cuts and Jobs Act of 2017, or Tax Reform Act) that includes significant changes to the taxation of business entities. These changes include, among others, (i) a permanent reduction to the corporate income tax rate from 35% to 21%, (ii) a partial limitation on the deductibility of business interest expense, (iii) a shift of the U.S. taxation of multinational corporations from a tax on worldwide income to a territorial system (along with certain rules designed to prevent erosion of the U.S. income tax base) and (iv) a one-time tax on accumulated offshore earnings held in cash and illiquid assets, with the latter taxed at a lower rate. On December 22, 2017, the Securities and Exchange Commission issued Staff Accounting Bulletin (SAB 118) which provides a measurement period of no more than a year from the Tax Act enactment date for companies to complete the accounting under Accounting Standards Codification 740 (ASC 740). Given our current taxable loss position, based on our preliminary analysis, we do not expect the new tax legislation to have a material cash tax impact on our business other than reducing the NOL carryforwards which is offset by a valuation allowance. However, due to the broad complexities of the Tax Reform Act, our ASC 740 accounting for the Tax Reform is still subject to change, which could adversely affect our business and financial condition.
We may utilize conflict minerals in our production or rely on suppliers who utilize conflict minerals in their production, and the use of such conflict minerals may negatively impact our results of operations.
Since 2013, we have been subject to reporting obligations for the use of conflict minerals originating in the Democratic Republic of the Congo and adjoining countries and subsequently have timely filed our conflict minerals reports with the SEC. If we fail to comply with these requirements, our operating results could be harmed.
In some instances, we rely on third-party sales representatives to assist in selling our products, and the failure of these representatives to perform as expected could reduce our future revenue.
30
Although we primarily sell our products through direct sales to systems vendors, we also sell our products to some of our customers through third-party sales representatives. Many of our third-party sales representatives also market and sell competing products from our competitors. Our third-party sales representatives may terminate their relationships with us at any time, or with short notice. Our future performance will also depend, in part, on our ability to attract additional third-party sales representatives that will be able to market and support our products effectively, especially in markets in which we have not previously distributed our products. If our third-party sales representatives fail to perform as expected or to operate their businesses effectively, our revenue and results of operations could be harmed.
We are subject to environmental, health and safety laws and regulations, which could subject us to liabilities, increase our costs, or restrict our business or operations in the future.
Our manufacturing operations and our products are subject to a variety of federal, state, local and international environmental, health and safety laws and regulations in each of the jurisdictions in which we operate or sell our products. Our failure to comply with present and future environmental, health or safety requirements, or the identification of contamination, could cause us to incur substantial costs, including cleanup costs, monetary fines, civil or criminal penalties, or curtailment of operations, which could have a material adverse effect on our business, financial condition and results of operations.
Additionally, increasing efforts to control emissions of greenhouse gases, or GHG, may also impact us. Additional climate change or GHG control requirements are under consideration at the federal level in the U.S. and in China. Additional restrictions, limits, taxes, or other controls on GHG emissions could increase our operating costs and, while it is not possible to estimate the specific impact any final GHG regulations will have on our operations, there can be no assurance that these measures will not have significant additional impact on us.
Risks Related to Our Operations in China
Our business operations conducted in China are critical to our success. A significant portion of our revenue was recognized from customers for whom we shipped products to a location in China. Additionally, a substantial portion of our net property, plant and equipment, approximately 29% as of December 31, 2017, was located in China. We expect to make further investments in China in the foreseeable future. Therefore, our business, financial condition, results of operations and prospects are to a significant degree subject to economic, political, legal, and social events and developments in China.
Adverse changes in economic and political policies in China, or Chinese laws or regulations could have a material adverse effect on business conditions and the overall economic growth of China, which could adversely affect our business.
The Chinese economy differs from the economies of most developed countries in many respects, including the level of government involvement, level of development, growth rate and control of foreign exchange and allocation of resources. The Chinese economy has been transitioning from a planned economy to a more market-oriented economy. Despite reforms, the government continues to exercise significant control over China’s economic growth by way of the allocation of resources, control over foreign currency-denominated obligations and monetary policy and provision of preferential treatment to particular industries or companies. Moreover, the laws, regulations and legal requirements in China, including the laws that apply to foreign-invested enterprises are relatively new and are subject to frequent changes. The interpretation and enforcement of such laws is uncertain. Any adverse changes to these laws, regulations and legal requirements, including tax laws, or their interpretation or enforcement, or the creation of new laws or regulations relating to our business, could have a material adverse effect on our business.
Furthermore, any slowdown or economic downturn, whether actual or perceived, in China could have a material adverse effect on our business, financial condition and results of operation.
A considerable portion of our business involves selling High Speed optical components in China and any move to local Chinese vendors for these products might adversely affect our results.
The Chinese Government Ministry of Industry and Information Technology has announced a five-year optical component technology roadmap with the aim to reduce China’s dependency on non-domestic companies for high-end optical chips and sub-components, including some products manufactured and sold by us. This announcement continues an ongoing trend in China to build domestic industry in this area, and, while we believe local Chinese component suppliers do not currently have the capability to supply the highest performance optical chips and sub-components, those companies may over time develop such capability and negatively impact our revenue and financial performance if we do not continue to innovate and maintain our lead in the highest speed and performance optical components.
31
Our subsidiaries in China may be subject to restrictions on dividend payments, on making other payments to us or any other affiliated company, and on borrowing or allocating tax losses among our subsidiaries.
Current Chinese regulations permit our subsidiaries in China to pay dividends only out of their accumulated profits, if any, determined in accordance with Chinese accounting standards and regulations, which are different than U.S. accounting standards and regulations. In addition, our subsidiaries in China are required to set aside at least 10% of their respective accumulated profits each year, if any, to fund their statutory common reserves until such reserves have reached at least 50% of their respective registered capital, as well as to allocate a discretional portion of their after-tax profits to their staff welfare and bonus fund. As of December 31, 2017, our Chinese subsidiaries’ common reserves had not reached this threshold and, accordingly, these entities are required to continue funding such reserves with accumulated net profits. Accordingly, we may not be able to move our capital easily, which could harm our business.
Restrictions on currency exchange may limit our ability to receive and use our revenue and cash effectively.
Because a portion of our revenue is denominated in RMB, any restrictions on currency exchange may limit our ability to use revenue generated in RMB to fund any business activities we may have outside China or to make dividend payments in U.S. dollars. Under relevant Chinese rules and regulations, the RMB is convertible under the “current account,” which includes dividends, trade and service-related foreign exchange transactions, but not under the “capital account,” which includes foreign direct investment and loans, without the prior approval of the State Administration of Foreign Exchange, or SAFE. We cannot be certain that Chinese regulatory authorities will not impose more stringent restrictions on the convertibility of the RMB, especially with respect to foreign exchange transactions. If such restrictions are imposed, our ability to adjust our capital structure or engage in foreign exchange transactions may be limited.
Uncertainties with respect to China’s legal system could adversely affect the legal protection available to us.
Our operations in China are governed by Chinese laws and regulations. Our subsidiaries in China are generally subject to laws and regulations applicable to foreign investments in China and, in particular, laws applicable to wholly foreign-owned enterprises. China’s legal system is a civil law system based on written statutes. Unlike common law systems, it is a legal system where decided legal cases have limited value as precedents. However, China has not developed a fully-integrated legal system, and recently-enacted laws and regulations may not sufficiently cover all aspects of economic activities in China. Uncertainties in the Chinese legal system may impede our ability to enforce the contracts we have entered into with our distributors, business partners, customers and suppliers. In addition, protections of intellectual property rights and confidentiality in China may not be as effective as in the U.S. or other countries or regions with more developed legal systems. All of these uncertainties could limit the legal protections available to us and could materially and adversely affect our business and operations.
If the Chinese government determines that we failed to obtain approvals of, or registrations with, the requisite Chinese regulatory authority with respect to our current and past import and export of technologies, or failed to obtain the necessary licenses to file patent applications outside China for inventions made in China, we could be subject to sanctions, which could adversely affect our business.
China imposes controls on technology import and export. The term “technology import and export” is broadly defined to include, without limitation, the transfer or license of patents, software and know-how, and the provision of services in relation to technology. Depending on the nature of the relevant technology, the import and export of technology to or from China requires either approval by or registration with, the relevant Chinese governmental authorities. Additionally, the Chinese government requires the patent application for any invention made at least in part in China to be filed first in China, then undergo a government secrecy review and obtain a license before such application is filed in other countries.
If the Chinese government determines that we failed to obtain follow required procedures and obtain the appropriate license before filing a patent application outside China for an invention made at least in part in China, our China patents on such products may be invalidated, which could have a material and adverse effect on our business and operations.
China regulation of loans and direct investment by offshore holding companies to China entities may delay or prevent us from using our cash proceeds to make loans or additional capital contributions to our China subsidiaries.
From time to time, we may make loans or additional capital contributions to our China subsidiaries. We cannot assure you that we will be able to obtain these government registrations or approvals on a timely basis, if at all, with respect to our future loans or capital contributions to our China subsidiaries. If we fail to receive such registrations or approvals, our ability to capitalize our China subsidiaries may be negatively affected, which could materially and adversely affect our liquidity and ability to fund and expand our business.
Dividends paid to us by our Chinese subsidiaries may be subject to Chinese withholding tax.
32
The EIT Law and the implementation regulations provide that a 10% withholding tax may apply to dividends payable to investors that are “non-resident enterprises,” to the extent such dividends are derived from sources within China and in the absence of any tax treaty that may reduce such withholding tax rate.
Our contractual arrangements with our subsidiaries in China may be subject to audit or challenge by the Chinese tax authorities, and a finding that our subsidiaries in China owe additional taxes could substantially reduce our net income and the value of our stockholders’ investment.
Under the applicable laws and regulations in China, arrangements and transactions among related parties may be subject to audit or challenge by the Chinese tax authorities. We would be subject to adverse tax consequences if the Chinese tax authorities were to determine that the contracts with or between our subsidiaries were not executed on an arm’s length basis, and as a result the Chinese tax authorities could require that our Chinese subsidiaries adjust their taxable income upward for Chinese tax purposes. Such an adjustment could adversely affect us by increasing our tax expenses.
We may have difficulty maintaining adequate management, legal and financial controls in China, which we are required to do in order to comply with Section 404 of the Sarbanes-Oxley Act and securities laws, and which could cause a material adverse impact on our consolidated financial statements, the trading price of our common stock and our business.
Chinese companies have historically not adopted a western style of management and financial reporting concepts and practices, which includes strong corporate governance, internal controls and computer, financial and other control systems. Most of our middle management staff in China are not educated in the western system, and we may have difficulty hiring new employees in China with experience and expertise relating to accounting principles generally accepted in the U.S. and U.S. public-company reporting requirements. These issues could make it more difficult for us to establish and maintain adequate internal control over our financial reporting, which could then result in errors that could cause a material misstatement of our consolidated financial statements.
We may be exposed to liabilities under the FCPA and Chinese anti-corruption laws, and any determination that we violated these laws could have a material adverse effect on our business.
We are subject to the Foreign Corrupt Practices Act of 1977, or FCPA, and other laws that prohibit improper payments or offers of payments to foreign governments and their officials and political parties by U.S. persons and issuers as defined by the statute, for the purpose of obtaining or retaining business. We have operations, agreements with third parties and we make significant sales in China. China also strictly prohibits bribery of government officials. Our activities in China create the risk of unauthorized payments or offers of payments by our employees, consultants, sales agents or distributors, even though they may not always be subject to our control. Although we have implemented policies and procedures to discourage these practices by our employees, our existing safeguards and any future improvements may prove to be less than effective, and our employees, consultants, sales agents or distributors may engage in conduct for which we might be held responsible. Violations of the FCPA or anti-corruption laws in other countries may result in severe criminal or civil sanctions, and we may be subject to other liabilities, which could negatively affect our business, operating results and financial condition.
Risks Related to Ownership of Our Common Stock
Our stock price may be volatile due to fluctuation of our financial results from quarter-to-quarter and other factors.
Our quarterly revenue and results of operations have varied in the past and may continue to vary significantly from quarter to quarter. This variability may lead to volatility in our stock price as research analysts and investors respond to these quarterly fluctuations. These fluctuations are due to numerous factors, including:
• | fluctuations in demand for our products; |
• | the timing, size and product mix of sales of our products; |
• | changes in our pricing and sales policies, particularly in the first quarter of the year, or changes in the pricing and sales policies of our competitors; |
• | our ability to design, manufacture and deliver products to our customers in a timely and cost-effective manner and that meet customer requirements; |
• | quality control or yield problems in our manufacturing operations; |
• | our ability to timely obtain adequate quantities of the components used in our products; |
33
• | length and variability of the sales cycles of our products; |
• | unanticipated increases in costs or expenses; and |
• | fluctuations in foreign currency exchange rates. |
The foregoing factors are difficult to forecast, and these, as well as other factors, could materially adversely affect our quarterly and annual results of operations in the future. In addition, a significant amount of our operating expenses is relatively fixed in nature due to our internal manufacturing, research and development, sales and general administrative efforts. Any failure to adjust spending quickly enough to compensate for a revenue shortfall could magnify the adverse impact of such revenue shortfall on our results of operations. Moreover, our results of operations may not meet our announced financial outlook or the expectations of research analysts or investors, in which case the price of our common stock could decrease significantly. There can be no assurance that we will be able to successfully address these risks.
The market price of our common stock could be subject to wide fluctuations in response to, among other things, the risk factors described in this section of this Annual Report on Form 10-K, and other factors beyond our control, such as fluctuations in the valuation of companies perceived by investors to be comparable to us.
The stock markets have experienced price and volume fluctuations that have affected and continue to affect the market prices of equity securities of many companies. These fluctuations often have been unrelated or disproportionate to the operating performance of those companies. These broad market and industry fluctuations, as well as general economic, political and market conditions, such as recessions, sovereign debt or liquidity issues, interest rate changes or international currency fluctuations, may negatively affect the market price of our common stock.
In the past, many companies that have experienced volatility in the market price of their stock have been subject to securities class action litigation. We may become the target of this type of litigation in the future. Securities litigation against us could result in substantial costs and divert our management’s attention from other business concerns, which could seriously harm our business.
The concentration of our capital stock ownership with our principal stockholders, executive officers and directors and their affiliates may limit other stockholders’ ability to influence corporate matters.
As of December 31, 2017, our executive officers and directors, and entities that are affiliated with them or that have a right to designate a director, beneficially own an aggregate of approximately 47% of our outstanding common stock. This significant concentration of share ownership may adversely affect the trading price for our common stock because investors often perceive disadvantages in owning stock in companies with controlling stockholders. Also, as a result, these stockholders, acting together, may be able to control our management and affairs and matters requiring stockholder approval, including the election of directors and approval of significant corporate transactions.
Our charter documents and Delaware law could prevent a takeover that stockholders consider favorable and could also reduce the market price of our stock.
Our amended and restated certificate of incorporation and our amended and restated bylaws contain provisions that could delay or prevent a change in control of our company. These provisions could also make it more difficult for stockholders to elect directors and take other corporate actions. These provisions include:
•providing for a classified board of directors with staggered, three-year terms;
•not providing for cumulative voting in the election of directors;
•authorizing our board of directors to issue, without stockholder approval, preferred stock rights senior to those of common stock;
•prohibiting stockholder action by written consent;
•limiting the persons who may call special meetings of stockholders; and
•requiring advance notification of stockholder nominations and proposals.
In addition, we have been governed by the provisions of Section 203 of the Delaware General Corporate Law since the completion of our initial public offering. These provisions may prohibit large stockholders, in particular those owning 15% or more of our outstanding common stock, from engaging in certain business combinations without approval of substantially all of our stockholders for a certain period of time.
These and other provisions in our amended and restated certificate of incorporation, our amended and restated bylaws and under Delaware law could discourage potential takeover attempts, reduce the price that investors might be willing to pay
34
for shares of our common stock in the future and result in the market price being lower than it would be without these provisions.
ITEM 1B. UNRESOLVED STAFF COMMENTS
Not applicable.
ITEM 2. PROPERTIES
Our properties consist primarily of owned and leased office and manufacturing facilities. Our corporate headquarters are located in San Jose, California and our manufacturing facilities are primarily located in Shenzhen and Dongguan, China and Tokyo, Japan. The following schedule presents the approximate square footage of our facilities as of December 31, 2017:
Location | Square Feet | Commitment and Use | |||
San Jose, California | 103,314 | Leased; 2 buildings used for corporate headquarters offices and wafer fabrication. | |||
Fremont, California | 73,186 | Leased; 2 buildings. One building used for wafer fabrication and research and development. Second building is currently not occupied and lease cost was accelerated during the restructuring in 2017. | |||
Shenzhen, China | 236,853 | Owned; 1 building and 1 floor of a building. The building is used for manufacturing, research and development, and sales and marketing. The owned floor of the building, representing 23,361 square feet, was leased to a tenant effective February 2014. | |||
Shenzhen, China | 21,533 | Leased; 2 buildings used for staff dormitory. | |||
Dongguan, China | 94,550 | Leased; 2 buildings used for manufacturing and for staff dormitory. | |||
Tokyo, Japan | 143,875 | Owned; 1 building used for manufacturing, research and development and marketing. | |||
________________________________________________________
In addition, we lease a number of smaller offices for warehouse, manufacturing, research and other functions.
ITEM 3. LEGAL PROCEEDINGS
From time to time, we are involved in litigation that we believe is of the type common to companies engaged in our line of business, including commercial disputes and employment issues. As of the date of this Annual Report on Form 10-K, other than as described below, we are not involved in any pending legal proceedings that we believe could have a material adverse effect on our financial condition, results of operations or cash flows. However, as described below, a certain dispute involves a claim by a third party that our activities infringe their intellectual property rights. This and other types of intellectual property rights claims generally involve the demand by a third party that we cease the manufacture, use or sale of the allegedly infringing products, processes or technologies and/or pay substantial damages or royalties for past, present and future use of the allegedly infringing intellectual property. Claims that our products or processes infringe or misappropriate any third-party intellectual property rights (including claims arising through our contractual indemnification of our customers) often involve highly complex, technical issues, the outcome of which is inherently uncertain. Moreover, from time to time, we may pursue litigation to assert our intellectual property rights. Regardless of the merit or resolution of any such litigation, complex intellectual property litigation is generally costly and diverts the efforts and attention of our management and technical personnel which could adversely affect our business.
For a discussion of our current legal proceedings, please refer to the information set forth under the “Litigation” section in Note 13, Commitments and contingencies, in Notes to Consolidated Financial Statements in Item 8 of Part II of this Annual Report on Form 10-K, which is incorporated herein by reference.
ITEM 4. MINE SAFETY DISCLOSURES
Not applicable.
35
PART II
ITEM 5. MARKET FOR REGISTRANT’S COMMON EQUITY, RELATED STOCKHOLDER MATTERS AND ISSUER PURCHASES OF EQUITY SECURITIES
As of February 28, 2018, there were approximately 70 holders of record of our common stock (not including beneficial holders of our common stock holder in street names). We have not paid cash dividends on our common stock since our inception, and we do not anticipate paying any in the foreseeable future. Any future determination as to the declaration and payment of dividends, if any, will be at the discretion of our board of directors and will depend on then existing conditions, including our financial condition, operating results, contractual restrictions, capital requirements, business prospects, consent from our existing credit facility lender in the U.S., and other factors our board of directors may deem relevant.
The following table sets forth, for the periods indicated, the high and low closing prices of our common stock as reported by the New York Stock Exchange.
Low | High | ||||||
Fiscal Year 2017: | |||||||
First Quarter | $ | 6.90 | $ | 12.44 | |||
Second Quarter | $ | 6.90 | $ | 9.78 | |||
Third Quarter | $ | 5.26 | $ | 8.73 | |||
Fourth Quarter | $ | 4.56 | $ | 7.68 | |||
Fiscal Year 2016: | |||||||
First Quarter | $ | 8.04 | $ | 14.04 | |||
Second Quarter | $ | 8.53 | $ | 14.49 | |||
Third Quarter | $ | 9.10 | $ | 18.22 | |||
Fourth Quarter | $ | 10.79 | $ | 16.86 | |||
The graph below shows the cumulative total stockholder return of an investment of $100 (and the reinvestment of any dividends thereafter) on February 2, 2011 (the first trading day of NeoPhotonics Corporation common stock) in (i) our common stock, (ii) the S&P 500 Index and (iii) the NASDAQ Telecommunications Index. Our stock price performance shown in the graph below is not indicative of future stock price performance. The following graph and related information shall not be deemed “soliciting material” or be deemed to be “filed” with the SEC, nor shall such information be incorporated by reference into any future filing, except to the extent that we specifically state that such graph and related information are incorporated by reference into such filing.
36
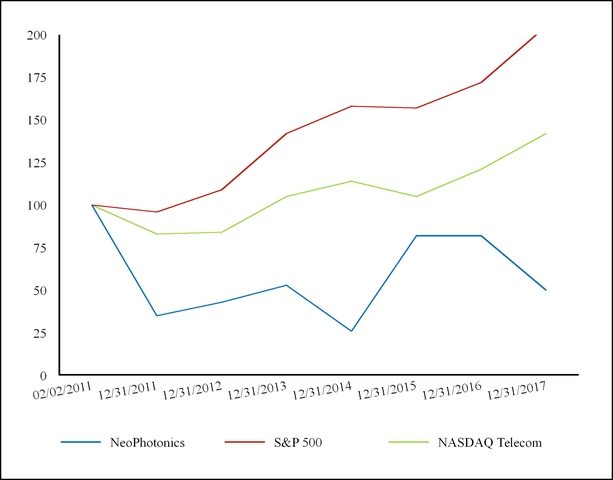
NeoPhotonics | S&P 500 | NASDAQ Telecom | |||||||||
2/2/2011 | $ | 100 | $ | 100 | $ | 100 | |||||
12/31/2011 | $ | 35 | $ | 96 | $ | 83 | |||||
12/31/2012 | $ | 43 | $ | 109 | $ | 84 | |||||
12/31/2013 | $ | 53 | $ | 142 | $ | 105 | |||||
12/31/2014 | $ | 26 | $ | 158 | $ | 114 | |||||
12/31/2015 | $ | 82 | $ | 157 | $ | 105 | |||||
12/31/2016 | $ | 82 | $ | 172 | $ | 121 | |||||
12/31/2017 | $ | 50 | $ | 205 | $ | 142 | |||||
For equity compensation plan information refer to Item 12 of this Annual Report on Form 10-K.
Use of Proceeds
In 2015, we completed our follow-on offering of 6,866,689 shares of our common stock in a registered public offering at $7.25 per share. We raised approximately $45.6 million, net of underwriting costs and other offering expenses of approximately $4.1 million. We held the proceeds received from our follow-on public offering as cash, cash equivalent and short-term investments and intend to continue to invest the funds in money market accounts and short-term marketable securities including money market funds, government agency securities, corporate debt securities and U.S. government securities. There has been no material change in the planned use of proceeds from our follow-on public offering as described in our final prospectus filed with the SEC on May 22, 2015 pursuant to Rule 424(b).
37
In both 2016 and 2015, we filed a resale registration statement, which registered 4,972,905 shares of our common stock, at a par value of $0.0025 per share, held by Rusnano. We do not receive any proceeds from any sales of our common stock held by Rusnano.
ITEM 6. SELECTED FINANCIAL DATA
The following selected consolidated financial data should be read together with our consolidated financial statements and the related notes and “Management’s Discussion and Analysis of Financial Condition and Results of Operations” appearing elsewhere in this Annual Report on Form 10-K. The selected consolidated financial data in this section is not intended to replace our consolidated financial statements and the related notes.
We derived the consolidated statements of operations data for the years ended December 31, 2017, 2016 and 2015 and the consolidated balance sheet data as of December 31, 2017 and 2016 from our consolidated financial statements appearing elsewhere in this Annual Report on Form 10-K. The consolidated statements of operations data for the years ended December 31, 2014 and 2013 and the consolidated balance sheet data as of December 31, 2015, 2014 and 2013 are derived from our consolidated financial statements, which are not included in this Annual Report on Form 10-K. Our historical results are not necessarily indicative of our future results.
Years ended December 31, | ||||||||||||||||||||
Consolidated Statement of Operations Data: | 2017 | 2016 (1) | 2015 (2) | 2014 (3) | 2013 (4) | |||||||||||||||
(in thousands, except per share data) | ||||||||||||||||||||
Revenue | $ | 292,894 | $ | 411,423 | $ | 339,439 | $ | 306,177 | $ | 282,242 | ||||||||||
Cost of goods sold | 231,415 | 294,290 | 240,358 | 235,059 | 217,069 | |||||||||||||||
Gross profit | 61,479 | 117,133 | 99,081 | 71,118 | 65,173 | |||||||||||||||
Operating expenses | 112,843 | 114,114 | 95,128 | 90,250 | 98,846 | |||||||||||||||
Income (loss) from operations | (51,364 | ) | 3,019 | 3,953 | (19,132 | ) | (33,673 | ) | ||||||||||||
Interest and other income, net | (1,060 | ) | 373 | 2,819 | 1,932 | 538 | ||||||||||||||
Provision for income taxes | (909 | ) | (3,597 | ) | (3,104 | ) | (2,519 | ) | (1,204 | ) | ||||||||||
Income (loss) from continuing operations | (53,333 | ) | (205 | ) | 3,668 | (19,719 | ) | (34,339 | ) | |||||||||||
Income from discontinued operations, net of tax | — | — | — | — | — | |||||||||||||||
Net income (loss) | $ | (53,333 | ) | $ | (205 | ) | $ | 3,668 | $ | (19,719 | ) | $ | (34,339 | ) | ||||||
Basic net income (loss) per share (5) | $ | (1.23 | ) | $ | — | $ | 0.10 | $ | (0.61 | ) | $ | (1.11 | ) | |||||||
Diluted net income (loss) per share (5) | $ | (1.23 | ) | $ | — | $ | 0.09 | $ | (0.61 | ) | $ | (1.11 | ) | |||||||
Years ended December 31, | ||||||||||||||||||||
Consolidated Balance Sheet Data: | 2017 | 2016 | 2015 | 2014 | 2013 | |||||||||||||||
(in thousands) | ||||||||||||||||||||
Cash and cash equivalents | $ | 78,906 | $ | 82,500 | $ | 76,088 | $ | 43,035 | $ | 57,101 | ||||||||||
Short-term investments | 12,311 | 19,015 | 23,294 | — | 17,916 | |||||||||||||||
Restricted cash and investments | 2,658 | 4,085 | 2,660 | 21,254 | 2,138 | |||||||||||||||
Working capital (6) | 110,769 | 124,468 | 151,211 | 102,130 | 124,298 | |||||||||||||||
Total assets | 402,953 | 390,887 | 341,878 | 286,284 | 302,227 | |||||||||||||||
Long-term debt (including current portion) | 46,561 | 10,962 | 11,519 | 23,336 | 34,475 | |||||||||||||||
Common stock and additional paid-in capital (7) | 546,064 | 532,484 | 511,852 | 456,271 | 447,546 | |||||||||||||||
Total equity | 194,451 | 225,405 | 211,656 | 159,456 | 176,811 | |||||||||||||||
____________________________________________
(1) | In 2016, our stock options and stock appreciation units with market condition were vested and we recognized approximately $5.7 million in related stock-based compensation expense in the period. |
(2) | We acquired the tunable laser product lines of EMCORE Corporation on January 2, 2015 and the optical power monitoring business of EigenLight Corporation on November 2, 2015 and the results of operations from these acquisitions are included from the date of acquisition. |
38
(3) | In 2014, we recognized total escrow settlement gain of $4.9 million, of which $3.9 million pertained to certain indemnification claims by us in connection with the acquisition of Santur in 2011 and $1.0 million pertained to our acquisition of NeoPhotonics Semiconductor in 2013. |
(4) | We acquired NeoPhotonics Semiconductor on March 29, 2013 and its results of operations are included from the date of acquisition. |
(5) | See Note 5 to the Consolidated Financial Statements for a description of our calculation of net income (loss) per share. |
(6) | Working capital is defined as total current assets less total current liabilities. |
(7) | In connection with our follow-on public offering completed in 2015, we issued 6,866,689 shares of common stock at $7.25 per share and raised approximately $45.6 million, net of underwriting discounts and offering costs. |
39
ITEM 7. MANAGEMENT’S DISCUSSION AND ANALYSIS OF FINANCIAL CONDITION AND RESULTS OF OPERATIONS
You should read the following discussion and analysis by our management of our financial condition and results of operations in conjunction with our consolidated financial statements and the accompanying notes.
The following discussion contains forward-looking statements that involve risks and uncertainties, such as statements of our plans, objectives, expectations and intentions. Our actual results could differ materially from those discussed in the forward-looking statements. Please also see the cautionary language at the beginning of Part I of this Annual Report on Form 10-K regarding forward-looking statements. Factors that could cause or contribute to such differences include, but are not limited to, those discussed in “Risk Factors” of this Annual Report on Form 10-K.
Business overview
We develop, manufacture and sell optoelectronic products that transmit, receive and switch high speed digital optical signals for communications networks. We sell our products to the world’s leading network equipment manufacturers, including Nokia (formerly Alcatel-Lucent, which was acquired by Nokia in January 2016), Ciena Corporation, Cisco Systems, Inc., and Huawei Technologies Co., Ltd. and its affiliate HiSilicon Technologies, Ltd. (collectively “Huawei”). These companies are among our largest customers and a focus of our strategy due to their leading market positions.
We have research and development and wafer fabrication facilities in San Jose and Fremont, California and in Tokyo, Japan that coordinate with our research and development and manufacturing facilities in Dongguan, Shenzhen and Wuhan, China and Ottawa, Canada. We use proprietary design tools and design-for-manufacturing techniques to align our design process with our precision nanoscale, vertically integrated manufacturing and testing. We believe we are one of the highest volume PIC manufacturers in the world and that we can further expand our manufacturing capacity to meet market needs.
Recognizing our focus on growth in our 100Gbps (“100G”) and beyond products, we align our product group reporting to “High Speed Products” which includes products designed for 100G and beyond applications and “Network Products and Solutions,” which comprises all products designed for applications below 100G. In 2017 and 2016, High Speed Products represented approximately 83% and 67% of total revenue, respectively. In 2016, High Speed products were 82% of our proforma revenue when the revenue from our low speed transceiver products, sold in January 2017, is excluded. Network Products and Solutions represented approximately 17% and 33% of total revenue, in 2017 and 2016 respectively, and represented 18% of our proforma revenue in 2016 when the sold low speed transceiver products are excluded.
In 2017, the market situation for 100G and above product deployments in China materially affected our results. Demand from our China-based customers was very strong in 2016 with our customers at that time providing optimistic forecasts for 2017 in anticipation of new tenders for provincial and metro 100G system deployments from the leading Chinese telecom carriers. However, tender awards from the China telecom carriers were slower than expected, in 2017, causing demand for our products by our customers to drop significantly starting in the first quarter of 2017. We believe one or more of our leading customers in China had accumulated significant inventory prior to the quarter ended March 31, 2017. We also believe they and other customers rapidly moved to adjust their inventory by reducing their purchases of our products, beginning in the first quarter of 2017 to align with the slow market demand and their own production levels.
We believe the market faced issues with the timing of provincial deployments and of inventory management at certain customers. The transition in China from national backbone deployments to provincial backbone and metro deployments reduces our and our customers’ visibility into the timing and volumes of tender awards, as the provincial offices of the China telecom carriers are somewhat independent of their national headquarters and each other. Our revenue growth in China was restricted by reduced demand and inventory overhang, both directly with our China based customers and through the impact on some of our non-China customers who also sell to customers in China.
In September 2017, China Mobile Communications Corporation awarded tenders for new provincial deployments to Huawei, ZTE Corporation and Fiberhome. This was followed in October 2017 by the issue of tenders by China United Network Communications Group Co., Ltd., or China Unicom, and we anticipate tenders will be issued in 2018 from China Telecommunications Corp, or China Telecom. While the timing is still uncertain, it is our expectation that these tender awards as well as new tender awards should create a more normalized demand environment in 2018.
These market developments in China have adversely affected our revenues, operating results and financial condition in 2017, as further addressed below.
40
In December 2016, we entered into an Asset Purchase Agreement (the “Asset Purchase Agreement”) with APAT Optoelectronics Components Co., Ltd. (the “Purchaser”) for the sale of certain assets of our access and low speed transceiver product lines (the “Low Speed Transceiver Products”) which was completed in January 2017. All of these products were part of our Network Products and Solutions group and include the low speed passive optical network, or PON, products for which the end-of-life plan was announced in mid-2016. In 2017, 2016 and 2015, the Low Speed Transceiver Products generated approximately 1%, 15% and 27% of our total revenue, respectively.
The asset sale consists of approximately $25.0 million in cash consideration plus approximately $1.4 million post-closing transition services under a transition services agreement ("TSA") with the Purchaser. We recognized a $2.2 million gain on the sale of these assets within operating loss in 2017. See Note 9 in Notes to Consolidated Financial Statements in Item 8 of Part II of this Report.
In 2017, our revenue decline of 29% compared to 2016 was driven primarily due to a reduction in demand from China market as described above and lower revenue that resulted from the sale of assets related to our Low Speed Transceiver Products' assets in January 2017. Excluding the Low Speed Transceiver Products, our revenue in 2017 declined 16% compared to 2016. Our gross margin was 21.0% in the year ended December 31, 2017 compared to 28.5% in the year ended December 31, 2016. The decrease in gross margin year over year was primarily attributable to under-utilization due to lower volumes in our manufacturing plants, inventory write-downs and reserves for non-cancelable purchase orders associated with excess inventory related to the demand reductions from China based customers, higher warranty reserves related to a quality rework requirement, lower yields at our wafer fabrication facility in Japan, restructuring costs and discontinued product inventory write-downs related to our decisions to end-of life certain products, partially offset by lower intangible amortization and stock-based compensation charges in 2017.
In 2018, we expect volume growth for our High Speed Products, although quarter-to-quarter results may show considerable variability due to customer demand fluctuations for current products as well as initial ramp-up variations on new product introductions. Similar to revenue, our gross margins may fluctuate materially depending on a variety of factors including average selling price changes, product mix, volume, manufacturing utilization and ongoing manufacturing process improvements.
Critical accounting policies and estimates
Our discussion and analysis of our financial condition and results of operations are based upon our consolidated financial statements, which have been prepared in accordance with accounting principles generally accepted in the U.S. (“U.S. GAAP”). These principles require us to make estimates and judgments that affect the reported amounts of assets, liabilities, revenue, expenses and cash flow, and related disclosure of contingent assets and liabilities. Our estimates include those related to revenue recognition, stock-based compensation expense, impairment analysis of goodwill and long-lived assets, valuation of inventory, purchased intangibles, warranty liabilities and accounting for income taxes. We base our estimates on historical experience and on various other assumptions that we believe to be reasonable under the circumstances. Actual results may differ from these estimates. To the extent that there are material differences between these estimates and our actual results, our future financial statements will be affected.
We believe that of our significant accounting policies, which are described in Note 2 of Notes to Consolidated Financial Statements, the following accounting policies involve a greater degree of judgment and complexity. Accordingly, we believe these are the most critical to fully understand and evaluate our financial condition and results of operations.
Revenue recognition
We recognize revenue from the sale of our products provided that persuasive evidence of an arrangement exists, delivery has occurred, the price is fixed or determinable and collectability is reasonably assured. We recognize revenue when the product is shipped and title has transferred to the buyer. We bear all costs and risks of loss or damage to the goods up to that point. On most orders, our terms of sale provide that title passes to the buyer upon shipment by us. In certain cases, our terms of sale may provide that title passes to the buyer upon delivery of the goods to the buyer. Revenue related to the sale of consignment inventory at customer vendor managed locations is not recognized until the product is pulled from inventory stock by customers. Payments made to third-party sales representatives are recorded to sales and marketing expense and not a reduction of revenue as the sales agent services they provide have an identifiable benefit and are made at similar rates of other sales agent service providers.
The amount of revenue recognized in a given period is affected by our judgement. Contracts and/or customer purchase orders are assessed to determine the existence of an arrangement. Shipping documents and customer acceptance, when applicable, are used to verify delivery. We assess whether the fee is fixed or determinable based on the payment terms associated with the transaction and whether the sales price is subject to refund or adjustment. We assess collectability based
41
primarily on the creditworthiness of the customer as determined by credit checks and the customer’s payment history. Our estimates are based on historical experience. If the actual amounts are significantly different from our estimates, our operating results could have a material impact.
Stock-based compensation expense
We grant stock options, stock appreciation units and restricted stock units to employees, directors and consultants. Stock purchase rights are granted to our employees. Stock-based awards are accounted for at fair value as of the measurement date using the Black-Scholes-Merton option-pricing model, the lattice-binominal option-pricing model or stock prices. For stock options and restricted stock units, the measurement date is the grant date and for employee stock purchase rights the measurement date is the first day of the offering period. Stock appreciation units are subject to re-measurement each reporting period.
We recognize the fair value over the period during which an employee is required to provide services in exchange for the award, known as the requisite service period (usually the vesting period) on a straight-line basis. Stock-based compensation expense includes the impact of estimated forfeitures. We estimate future forfeitures at the date of grant and revise the estimates, if necessary, in subsequent periods if actual forfeitures differ from those estimates.
Determining the appropriate fair value model and calculating the fair value of stock-based awards requires judgment, including estimating stock price volatility, forfeiture rates and expected life. If any of these assumptions, or the market price of our common shares, used in the option-pricing models change, our stock-based compensation expense could materially change our consolidated financial statements.
Business Combinations
We allocate the fair value of purchase consideration to the tangible and intangible assets acquired and liabilities assumed based on their estimated fair values. The excess of the fair value of purchase consideration over the fair values of these identifiable assets and liabilities is recorded as goodwill. When determining the fair values of assets acquired and liabilities assumed, management makes significant estimates and assumptions, especially with respect to intangible assets. Critical estimates in valuing certain intangible assets include but are not limited to future expected cash flows from customer relationships and acquired patents and developed technology; and discount rates.
Fair value estimates are based on the assumptions management believes a market participant would use in pricing the asset or liability. Such assumptions are believed to be reasonable but are inherently uncertain and unpredictable and, as a result, actual results may differ from estimates.
Amounts recorded in a business combination may change during the measurement period, which is a period not to exceed one year from the date of acquisition, as additional information about conditions existing at the acquisition date becomes available.
Goodwill and long-lived assets
Our methodology for allocating the purchase price relating to purchase acquisitions is determined through established valuation techniques. Goodwill represents a residual value as of the acquisition date, which generally results in measuring goodwill as an excess of the purchase consideration transferred plus the fair value of any noncontrolling interest in the acquired company over the fair value of net assets acquired, including any contingent consideration.
We perform annual goodwill impairment test in the fourth fiscal quarter by reporting unit. We could be subject to additional goodwill impairment tests in the event of changes in industry and market conditions, our business and reporting structure. During the fourth quarter of fiscal 2017, we performed the first step of the two-step goodwill impairment test and a sensitivity analysis for goodwill impairment and determined that the estimated fair value substantially exceeded the carrying value of the underlying goodwill and a hypothetical 10% decline in the fair value of the reporting unit would not result in an impairment of goodwill.
We assess the impairment of long-lived assets whenever events or changes in circumstances indicate that the carrying amount may not be recoverable. An impairment loss would be recognized when the sum of the future net cash flows expected to result from the use of the asset and its eventual disposition is less than its carrying amount. The estimated future cash flows are based upon, among other things, assumptions about expected future operating performance and may differ from actual cash flows. If our estimates regarding future cash flows derived from such assets were to change, we may record an impairment to the value of these assets.
Valuation of inventories
42
We record inventories at the lower of cost (using the first-in, first-out method) or net realizable value, after we give appropriate consideration to obsolescence and inventories in excess of anticipated future demand. In assessing the ultimate recoverability of inventories, we are required to make estimates regarding future customer demand, the timing of new product introductions, economic trends and market conditions. If the actual product demand is significantly lower than forecasted, we could be required to record additional inventory write-downs which would be charged to cost of goods sold. Obsolescence is determined from several factors, including competitiveness of product offerings, market conditions and product life cycles. Write-downs of excess and obsolete inventory are charged to cost of goods sold. At the point of the loss recognition, a new, lower cost basis for that inventory is established, and subsequent changes in facts and circumstances do not result in the restoration or increase in that newly established cost basis. If this lower-cost inventory is subsequently sold, it will result in lower costs and higher gross margin for those products. Any write-downs would have an adverse impact on our gross margin. In 2017, 2016 and 2015, inventory write-down charges were approximately $8.3 million, $3.0 million and $6.5 million, respectively. Our inventory write-down charges in 2015 included a $2.8 million charge resulting from the phasing-out of our earlier-generation tunable laser products.
Warranty liabilities
We provide warranties to cover defects in workmanship, materials and manufacturing of our products to meet stated functionality specifications. We test products against specified functionality requirements prior to delivery, but we nevertheless from time to time experience claims under our warranty guarantees. We accrue for estimated warranty costs under those guarantees based upon historical experience, and for specific items at the time their existence is known and the amounts are determinable. We charge a provision for estimated future costs related to warranty activities to cost of goods sold based upon historical product failure rates and historical costs incurred in correcting product failures. We recorded warranty expense of $1.3 million, $0.1 million and $0.1 million for each of the years ended December 31, 2017, 2016 and 2015, respectively. If we experience an increase in warranty claims compared with our historical experience, or if the cost of servicing warranty claims is greater than expected, our gross margin and profitability would be adversely affected.
Accounting for income taxes
We record income taxes using the asset and liability method, which requires the recognition of deferred tax assets and liabilities for the expected future tax consequences of events that have been recognized in our consolidated financial statements or tax returns. In estimating future tax consequences, generally we consider all expected future events, other than enactments or changes in tax law or rates. We provide valuation allowances when necessary to reduce deferred tax assets to the amount expected to be realized.
We operate in various tax jurisdictions and are subject to audit by various tax authorities. We provide for tax contingencies whenever it is deemed probable that a tax asset has been impaired or a tax liability has been incurred for events such as tax claims or changes in tax laws. Tax contingencies are based upon their technical merits, relevant tax law and the specific facts and circumstances as of each reporting period. Changes in facts and circumstances could result in material changes to the amounts recorded for such tax contingencies.
As part of the process of preparing our consolidated financial statements, we are required to estimate our taxes in each of the jurisdictions in which we operate. We estimate actual current tax exposure together with assessing temporary differences resulting from differing treatment of items, such as accruals and allowances not currently deductible for tax purposes. These differences result in deferred tax assets.
We make estimates and judgments about our future taxable income that are based on assumptions that are consistent with our plans and estimates. Should the actual amounts differ from our estimates, the amount of our valuation allowance could be materially impacted. Any adjustment to the deferred tax asset valuation allowance would be recorded in the consolidated statement of operations in the period that the adjustment is determined to be required.
Results of operations
Our business is focused on the highest speed digital optics and signal processing communications applications for telecom transport and Metro networks and for data center applications. In 2017, our High Speed Products for data rates of 100G and beyond comprised 83% of our revenues. In 2016, we entered into an Asset Purchase Agreement for the sale of assets of our Low Speed Transceiver Products within our Network Products and Solutions product group. In 2016 and 2015, the Low Speed Transceiver Products represent approximately 15% and 27% of total revenue, respectively. The asset sale was closed in January 2017.
43
In 2016, our stock-based stock options and stock appreciation units with market conditions vested when the average closing price of our common stock over 20 consecutive trading days exceeded $15.00 per share and we recorded approximately $5.7 million in related stock-based compensation expense within cost of goods sold and operating expenses.
We acquired the tunable laser product lines of EMCORE Corporation in January 2015 and the optical power monitoring business of EigenLight Corporation in November 2015 and the results of operations from these acquisitions are included from the date of acquisition.
The following table presents certain consolidated statements of operations data for the periods indicated as a percentage of total revenue:
Years Ended December 31, | ||||||||
2017 | 2016 | 2015 | ||||||
Revenue | 100 | % | 100 | % | 100 | % | ||
Gross profit | 21 | % | 28 | % | 29 | % | ||
Operating expenses | 39 | % | 27 | % | 28 | % | ||
Income (loss) from operations | (18 | )% | 1 | % | 1 | % | ||
Interest and other income, net | 0 | % | — | % | 1 | % | ||
Income (loss) before income taxes | (18 | )% | 1 | % | 2 | % | ||
Net income (loss) | (18 | )% | — | % | 1 | % | ||
Revenue
% Change | % Change | ||||||||||||||
(in thousands, except percentages) | 2017 | 2017 to 2016 | 2016 | 2016 to 2015 | 2015 | ||||||||||
Total revenue | $ | 292,894 | (29)% | $ | 411,423 | 21% | $ | 339,439 | |||||||
We sell substantially all of our products to original equipment manufacturers, or OEMs. We price our products based on market and competitive conditions and may periodically reduce the price of our products as market and competitive conditions change and as manufacturing costs are reduced. Our sales transactions to customers are denominated primarily in U.S. dollars, with some portions in Chinese Renminbi (“RMB”) and Japanese Yen (“JPY”). Revenue is driven by the volume of shipments and may be impacted by pricing pressures. We have generated most of our revenue from a limited number of customers.
Customers accounting for more than 10% of our total revenue and revenue from our top five customers for the years ended December 31, 2017, 2016 and 2015 were as follows:
Years Ended December 31, | ||||||||
2017 | 2016 | 2015 | ||||||
Percent of revenue from customers accounting for 10% or more of total revenue: | ||||||||
Huawei Technologies Co., Ltd (1) | 40 | % | 50 | % | 44 | % | ||
Ciena Corporation | 16 | % | 15 | % | 21 | % | ||
Percent of revenue from top five customers | 78 | % | 82 | % | 82 | % | ||
(1) | Huawei’s percentage of revenue included its affiliate, HiSilicon. Revenue from HiSilicon represented approximately 37%, 36% and 23% of total revenue, respectively, in 2017, 2016 and 2015. |
For the years ended December 31, 2017, 2016 and 2015, our percentage of sales from our China-based subsidiaries, the majority of which were denominated in RMB, were 1%, 4% and 5%, respectively.
Total revenue decreased by $118.5 million, or 29%, in 2017 compared to 2016. The decrease was approximately equally attributable to a reduction in demand from China telecom carrier tender awards with an inventory overhang at our Chinese customers as described further in the section entitled "Business overview" above and lower revenue that resulted from the sale of assets related to our Low Speed Transceiver Products in January 2017. Revenue generated by Low Speed Transceiver Products before the asset sale was $1.5 million in 2017, compared to $63.6 million in 2016. In 2017, High Speed Products
44
represented approximately 83% of total revenue, compared to 67% of total revenue in 2016 while Network Products and Solutions represented approximately 17% of total revenue in 2017, compared to approximately 33% of total revenue in 2016, which included Low Speed Transceiver Products. In 2017, revenue from China, United States, Japan and rest of the world was 55%, 14%, 3%, and 28% of total revenue, respectively, compared to 62%, 16%, 3%, and 19% of total revenue respectively, in 2016.
Total revenue increased by $72.0 million, or 21%, in 2016 compared to 2015. The increase was primarily attributable to an increase in revenue from our High Speed Products driven by product demand, partially in China. Our High Speed Products increased to 67% of revenue in 2016 from 58% in 2015 and our Network Products and Solutions revenue decreased from 42% in 2015 to 33% in 2016. The increase in High Speed Products revenue was partially offset by a decrease in Network Products and Solutions revenue largely due to our product phase-out efforts to improve our gross margin. In 2016, total revenue from China, the United States, Japan and rest of the world was $254.7 million, $67.8 million, $12.0 million and $76.9 million, respectively, compared to $182.5 million, $77.9 million, $12.7 million and $66.4 million, respectively, in 2015.
In 2018, we expect to resume growth in revenue from our High Speed Products. We also expect that a significant portion of our revenue will continue to be derived from a limited number of customers.
Cost of goods sold and gross margin
% Change | % Change | ||||||||||||||
(in thousands, except percentages) | 2017 | 2017 to 2016 | 2016 | 2016 to 2015 | 2015 | ||||||||||
Cost of goods sold | $ | 231,415 | (21)% | $ | 294,290 | 22% | $ | 240,358 | |||||||
Gross profit | $ | 61,479 | (48)% | 117,133 | 18% | 99,081 | |||||||||
2017 | 2016 | 2015 | ||||||
Gross profit as a % of revenue | 21.0 | % | 28.5 | % | 29.2 | % | ||
Our cost of goods sold consists primarily of the cost to produce wafers, modules and to manufacture and test our products. Additionally, our cost of goods sold includes stock-based compensation, write-downs of excess and obsolete inventory, royalty payments, amortization of certain purchased intangible assets, depreciation, acquisition-related fair value adjustments, restructuring cost, warranty, shipping and allocated facilities costs.
In 2017, gross profit decreased $55.7 million, or 48%, to $61.5 million in 2017, compared to $117.1 million in 2016. Our gross margin percent decreased by approximately eight percentage points to 21% in 2017 as compared to 2016. Approximately 6 percentage points of the decline in gross margin was driven by under-utilization attributable to lower volumes in our manufacturing plants, approximately 1.6 percentage points of the decline was due to inventory write-downs and reserves for non-cancelable purchase orders associated with excess inventory related to the demand reductions from China based customers and higher warranty reserves related to a quality rework requirement. These production volume declines were driven by: (a) lower end customer demand and therefore the need to decrease production and reduce inventory; and (b) lower output volumes at our wafer fabrication facility in Japan due to lower yields where we had end customer demand but could not support the demand with production output. Approximately 1 percentage point of the decline was driven by restructuring costs and discontinued product inventory write-downs related to our decisions to end-of life certain products. These gross margin reductions were offset by lower intangible amortization and stock-based compensation charges in 2017 which contributed 1.4 percentage points of improvement.
In 2016, gross profit increased $18.1 million, or 18%, to $117.1 million in 2016, compared to $99.1 million in 2015, primarily attributable to revenue growth, volume increase and cost reduction, partially offset by lower pricing, higher stock-based compensation expense and an unfavorable cost of goods sold impact as a result of the unrecoverable inventory associated with the bankruptcy reorganization by one of our distributors.
Our gross margin percent decreased by approximately one percentage point to 28.5% in 2016 from 29.2% in 2015, primarily attributable to a $1.8 million increase in stock-based compensation expense and $1.4 million of unfavorable cost of goods sold impact as a result of the unrecoverable inventory associated with the bankruptcy reorganization by one of our distributors and lower pricing, partially offset by production cost reduction and favorable product mix resulting from an increase in sales volume of our High Speed Products.
We expect that our gross profit and gross margin are likely to increase in 2018 due to a variety of factors, including favorable product mix, vertical integration, reduced amortization expense for purchased intangible assets and introduction of new products. Other factors that can affect our gross margin include production volume, inventory changes, changes in the
45
average selling prices of our products, changes in the cost and volumes of materials purchased from our suppliers, changes in labor costs, changes in overhead costs or requirements, revaluation of stock appreciation unit awards that are impacted by our stock price, write-downs of excess and obsolete inventories and warranty costs. In addition, we periodically negotiate pricing with certain customers which can cause our gross margins to fluctuate, particularly in the quarters subsequent to the periods in which the negotiations occurred.
Operating expenses
% Change | % Change | ||||||||||||||||
(in thousands, except percentages) | 2017 | 2017 to 2016 | 2016 | 2016 to 2015 | 2015 | ||||||||||||
Research and development | $ | 58,287 | 2 | % | $ | 57,376 | 29 | % | $ | 44,533 | |||||||
Sales and marketing | 17,760 | (4 | )% | 18,595 | 18 | % | 15,823 | ||||||||||
General and administrative | 34,453 | — | % | 34,409 | — | 31,635 | |||||||||||
Amortization of purchase intangible assets | 472 | (71 | )% | 1,609 | (10 | )% | 1,791 | ||||||||||
Acquisition and asset sale related costs | 130 | (94 | )% | 2,125 | 128 | % | 934 | ||||||||||
Gain on asset sale | (2,193 | ) | — | % | — | — | % | — | |||||||||
Asset impairment charge | — | — | % | — | (100 | )% | 368 | ||||||||||
Restructuring charges | 3,934 | — | % | — | (100 | )% | 44 | ||||||||||
Total operating expenses | $ | 112,843 | (1 | )% | $ | 114,114 | 20 | % | $ | 95,128 | |||||||
Research and development
We focus our research and development effort primarily on the high speed market. Research and development expense increased $0.9 million, or 2%, in 2017 compared to 2016. The increase was primarily due to a $2.7 million increase in salaries and related expenses, a $1.2 million increase in facilities-related cost and $0.8 million increase in depreciation expense. These increases were partially offset by a $2.3 million decrease in stock-based compensation expense compared to the 2016, which included higher stock-based compensation relating to a higher market price of our stock and the accelerated vesting of our market-based stock awards and a $1.3 million decrease in variable compensation.
Research and development expense increased $12.8 million, or 29%, in 2016 compared to 2015. The increase was primarily attributable to a $5.1 million increase in development expenses largely driven by prototype and material spending, a $3.0 million increase in salaries and benefits, a $2.7 million increase in stock-based compensation and a $1.7 million increase in consulting fees for new product development.
We believe that investments in research and development are important to help meet our strategic objectives. In 2018, we plan to continue to invest in research and development activities, including new products that we believe will further enhance our competitive position. Research and development expense consists of personnel costs, including stock-based compensation, for our research and development personnel, and product development costs, including engineering services, development software and hardware tools, depreciation of equipment and facility costs. We record all research and development expense as incurred. As a percentage of total revenue, our research and development expense may vary as our investment and revenue levels change over time.
Sales and marketing
Sales and marketing expense decreased by $0.8 million, or 4%, in 2017 compared to 2016, primarily due to a $2.4 million decrease in stock-based compensation expense compared to the 2016, which included higher stock-based compensation relating to a higher market price of our stock and the accelerated vesting of our market-based stock awards, and a $1.1 decrease in commissions and other variable compensation. These decreases were partially offset by a $0.6 million provision for bad debt expense in 2017, a $1.4 million increase in salaries and related expenses and a $0.3 million increase in product promotion costs.
Sales and marketing expense increased by $2.8 million, or 18%, in 2016 compared to 2015, primarily due to a $2.3 million increase in stock-based compensation expense, a $1.0 million increase in salaries and benefits and a $0.6 million increase in commission expense, partially offset by a $1.0 million decrease in bad debt provision largely due to collections.
We expect to continue to expand our high speed market focus and increase sales coverage of DCI market while controlling our sales and marketing expenses in 2018, even as our business continues to expand geographically. Sales and
46
marketing expense consists primarily of personnel costs, including stock-based compensation and sales commissions, costs related to sales and marketing programs and services and facility costs. As a percentage of total revenue, our sales and marketing expense may vary as our revenue changes over time.
General and administrative
General and administrative expense consists of personnel costs, including stock-based compensation, for our finance, human resources and information technology personnel and certain executive officers, as well as professional services costs related to accounting, tax, banking, legal and information technology services, depreciation and facility costs.
General and administrative expense was flat in 2017 as compared to 2016. Increases included a $1.8 million increase in audit and accounting related fees and a $1.5 million increase in professional and legal expenses. These increases were offset by a $2.1 million decrease in stock-based compensation expense compared to the 2016, which included higher stock-based compensation relating to a higher market price of our stock and the accelerated vesting of our market-based stock awards and $1.5 million decrease in variable compensation.
General and administrative expense increased by $2.8 million, or 9%, in 2016 compared to 2015. The increase was primarily due to a $2.5 million increase in stock-based compensation, a $0.7 million increase in salaries and benefits, and a $0.4 million increase in outside services driven by legal fees, partially offset by a $0.8 million decrease in variable compensation expenses.
We expect to continue to focus on controlling our general and administrative expense in 2018. As a percentage of total revenue, our general and administrative expense may vary as our revenue changes over time.
Amortization of purchased intangible assets
Our intangible assets are being amortized over their estimated useful lives. Amortization expense relating to technology and patents and leasehold interests are included within cost of goods sold, while customer relationships and non-compete agreements are recorded within operating expenses.
In 2017, amortization of purchased intangible assets was $1.3 million, comprising of $0.8 million in cost of goods sold and $0.5 million in operating expenses. Amortization of purchased intangible assets decreased by approximately $3.2 million in 2017 compared to 2016, primarily due to certain intangible assets being fully amortized in 2016.
In 2016, amortization of purchased intangible assets was $4.5 million, comprising of $2.9 million in cost of goods sold and $1.6 million in operating expenses. Amortization of purchased intangible assets decreased by approximately $0.7 million in 2016 compared to 2015, primarily due to certain intangible assets from our past acquisitions being fully amortized.
Acquisition and asset sale related costs
In 2017, we incurred $0.1 million in acquisition and asset sale related transaction costs related to legal, accounting and other professional services.
In 2016, we incurred $2.1 million in acquisition and asset sale related transaction costs related to legal, accounting and other professional services for our acquisition and asset sale activities.
In 2015, we incurred $0.9 million in acquisition-related transaction costs related to legal, accounting and other professional services for our acquisition activities, including our acquisitions of EMCORE’s tunable laser product lines and EigenLight’s optical power monitoring business.
Asset impairment charge
There were no asset impairment charges in 2017 and 2016. In 2015, we recognized asset impairment charges of $0.4 million of which $0.2 million was attributable to a write-down of held-for-sale assets acquired from EMCORE and $0.2 million was attributable to charges for equipment related to our product phase out effort.
Restructuring charges
In 2017, we initiated restructuring actions in order to focus on key growth initiatives and to achieve a lower break even revenue level through lower operating expenses and manufacturing costs. Actions included a reduction in force, facilities consolidation and certain asset-related adjustments. These actions are expected to reduce quarterly operating expenses and costs of goods sold by approximately $2.0 million and $0.6 million, respectively, when fully realized in the first quarter of 2018. We recorded $0.8 million and $3.9 million in restructuring charges within cost of goods sold and operating expenses in in 2017,
47
respectively. Additionally, we recorded a charge of $2.0 million to cost of goods sold in 2017 for discontinued product inventory write-downs related our decisions to end-of-life certain products.
There were no restructuring charges in 2016. We recorded $0.2 million in related restructuring charges in 2015, within cost of goods sold and operating expenses.
Interest and other income (expense), net
% Change | % Change | ||||||||||||||
(in thousands, except percentages) | 2017 | 2017 to 2016 | 2016 | 2016 to 2015 | 2015 | ||||||||||
Interest and other income (expense), net | $ | (1,060 | ) | (384)% | $ | 373 | (87)% | $ | 2,819 | ||||||
Interest and other income (expense), net consists of interest income, interest expense and other income, net. Interest income consists of income earned on our cash, cash equivalents and short-term investments. Interest expense consists of amounts incurred for interest on our outstanding debt. Other income, net includes foreign currency transaction gains and losses along with government subsidies. The functional currency of our subsidiaries in China and Japan is the RMB and the JPY, respectively.
Interest expense included in interest and other income (expense), increased in 2017 as compared to 2016. The increase in interest expense was due to increase in outstanding borrowings during 2017.
Interest and other income, net decreased $2.4 million, or 87%, in 2016 from $0.9 million in 2015. The decrease was primarily due to a $3.5 million decrease in other income, net driven by foreign exchange loss resulting from a weaker RMB and a stronger JPY against the U.S. dollars, partially offset by a $0.8 million decrease in interest expense and a $0.2 million increase in interest income.
Income taxes and effective tax rates
Years ended December 31, | |||||||||||
(in thousands, except percentages) | 2017 | 2016 | 2015 | ||||||||
Provision for income taxes | $ | (909 | ) | $ | (3,597 | ) | $ | (3,104 | ) | ||
Effective tax rate | (2 | )% | 106 | % | 46 | % | |||||
In 2017, our income tax provision was primarily related to the operating profit realized in our foreign subsidiaries in Japan and China. Historically, we have experienced net losses in the U.S. and in the short term, we expect this trend to continue.
The effective tax rate was (2)% in 2017 as compared to 106% in 2016 mainly due to lower earnings in foreign jurisdictions and increase in net loss generated in the U.S. in 2017.
In 2016, our income tax provision was primarily related to the operating profit realized in our foreign subsidiaries in Japan and China. Historically, we have experienced net losses in the U.S. and in the short term, we expect this trend to continue. In China, one of our subsidiaries changed from a preferential 15% tax rate available for high technology enterprises to 25% for 2016. The preferential rate applied to 2015 and 2014. We realized benefits from this 10% reduction in the tax rate of $0.9 million and $0.5 million for 2015 and 2014, respectively.
The effective tax rate in 2016 of 106% was 60 percentage points higher than the 2015 effective tax rate mainly due to the non-recurring vesting of the stock-based awards with a market condition in 2016 and, to a lesser extent, an increase in our tax rate in China.
In December 2017, the U.S. President signed into U.S. law the Tax Cuts and Jobs Act of 2017 ("Tax Reform"). The new legislation, among other provisions, will lower the corporate tax rate from 35% to 21%. In addition to applying the new lower corporate tax rate in 2018 and thereafter to any taxable income we may have, the legislation affects the way we can use and carry forward net operating losses previously accumulated and results in a revaluation of deferred tax assets recorded on our balance sheet. Given that the deferred tax assets are offset by a full valuation allowance, we believe these changes will have no net impact on our financial position and net loss. However, if and when we become profitable, we will receive a reduced benefit from such deferred tax assets. In addition, the Tax Reform includes a one-time mandatory repatriation transition tax on the net accumulated earnings and profits of a US taxpayer's foreign subsidiaries. We have performed an earnings and profits
48
analysis, and as a result of net operating loss carry forward available to fully offset the anticipated transition tax, we believe there will be no income tax effect in the current period.
Liquidity and capital resources
As of December 31, 2017, we had working capital of $110.8 million, including total cash, cash equivalents, short-term investments and restricted cash of $93.9 million. Approximately 31% of our total cash, cash equivalents, short-term investments and restricted cash were held by our foreign entities, including approximately $25.9 million in accounts held by our subsidiaries in China, of which $2.7 million was in restricted cash, and approximately $2.7 million in accounts held by our subsidiary in Japan. Cash, cash equivalents, investments and restricted cash held outside of the U.S. may be subject to taxes if repatriated and may not be immediately available for our working capital needs.
Approximately $8.8 million of our retained earnings within our total accumulated deficit as of December 31, 2017 was subject to restrictions due to the fact that our subsidiaries in China are required to set aside at least 10% of their respective accumulated profits each year end to fund statutory common reserves as well as allocate a discretionary portion of their after-tax profits to their staff welfare and bonus fund. This restricted amount is not distributable as cash dividends except in the event of liquidation.
In January 2017, we completed the sale of certain Low Speed Transceiver Products’ assets for approximately $25.0 million in consideration plus approximately $1.4 million for a post-closing transition services arrangement. The consideration was reduced by $3.4 million for inventory adjustment after closing to approximately $21.6 million, which was subject to other adjustments of up to $10.0 million for any potential claims. See Note 9 in Notes to Consolidated Financial Statements in Item 8 of Part II of this Report.
In September 2017 we entered into a revolving line of credit agreement with Wells Fargo Bank, National Association ("Wells Fargo") as the administrative agent for a lender group (the "Wells Fargo Credit Facility" or "Credit Facility"), and the $20.0 million amount outstanding under our Comerica Bank Credit Facility, which has since been terminated, was paid in full.
The Wells Fargo Credit Facility provides for borrowings equal to the lower of (a) a maximum revolver amount of $50.0 million, or (b) an amount equal to 80% - 85% of eligible accounts receivable plus 100% of qualified cash balances up to $15.0 million, less certain discretionary adjustments ("Borrowing Base"). The maximum revolver amount may be increased by up to $25.0 million, subject to certain conditions. At closing, $50.0 million was available, of which $30.0 million was drawn. We used $20.0 million of this amount to pay the principal and interest due under the Comerica Bank Credit Facility.
The Credit Facility matures on June 30, 2022 and borrowings bear interest at an interest rate option of either (a) the LIBOR rate, plus an applicable margin ranging from 1.50% to 1.75% per annum, or (b) the prime lending rate, plus an applicable margin ranging from 0.50% to 0.75% per annum. We are also required to pay a commitment fee equal to 0.25% of the unused portion of the Credit Facility.
The Credit Facility agreement requires prepayment of the borrowings to the extent the outstanding balance is greater than the lesser of (a) the most recently calculated Borrowing Base, or (b) the maximum revolver amount. The Borrowing Base calculation contains a customary provision that gives the lender the ability to reduce the Borrowing Base by reserves that are subjectively determinable, which is considered a subjective acceleration clause. We are required to maintain a combination of certain defined cash balances and unused borrowing capacity under the Credit Facility of at least $20.0 million, of which at least $5.0 million must be unused borrowing capacity. Borrowings under the Credit Facility are collateralized by substantially all of our assets. We were in compliance with the covenants of this Credit Facility as of December 31, 2017. As of December 31, 2017, the outstanding balance under the Credit Facility was $30.0 million and the weighted average rate under the LIBOR option was 3.29%. The remaining borrowing capacity was $20.0 million of which $5.0 million is required to be maintained as unused borrowing capacity.
We regularly issue short-term notes payable to our suppliers in China in exchange for accounts payable. These notes are supported by non-interest bearing bank acceptance drafts and are due three to six months after issuance. As a condition of the notes payable arrangements, we are required to keep a compensating balance at the issuing banks that is a percentage of the total notes payable balance until the amounts are settled. As of December 31, 2017, our subsidiary in China had three line of credit facilities with banking institutions. The total amount available for short-term borrowings under these line of credit facilities as of December 31, 2017 was $43.4 million. In July 2017, we borrowed $17.0 million under a line of credit facility with CITIC Bank which was repaid when due in January 2018. This line of credit facility expired in September 2017, but was renewed in December 2017 with a new expiration date of November 2018. In February 2018, we borrowed $17.0 million from CITIC Bank under the credit facility.
49
As of December 31, 2017 and December 31, 2016, the non-interest bearing bank acceptance drafts issued in connection with our notes payable to our suppliers in China under these line of credit facilities had an outstanding balance of $1.6 million and $6.4 million, respectively. Compensating balances relating to these credit facilities totaled $0.5 million and $2.1 million, respectively, as of December 31, 2017 and December 31, 2016. Compensating balances are classified as restricted cash on our consolidated balance sheets. See Note 3 and Note 11 of Notes to Consolidated Financial Statements in Item 8 of Part II of this Report.
As of December 31, 2017, we had three loan arrangements with the Bank of Tokyo-Mitsubishi UFJ, Ltd. (collectively the “Mitsubishi Bank Term Loans”). One of Mitsubishi Bank Term Loans requires interest only payments until the maturity date of February 23, 2018, with a lump sum payment of the aggregate principal amount on the maturity date while the other requires equal monthly payments of principal equal to 8,333,000 JPY until the maturity date of February 25, 2025, with a lump sum payment of the balance of 8,373,000 JPY on the maturity date. Interest on these loans accrues and is paid monthly based upon the annual rate of the monthly Tokyo Interbank Offer Rate (TIBOR) plus 1.40% and is secured by real estate collateral. The third term loan of 690 million JPY (approximately $6.2 million) (the “2017 Mitsubishi Bank Loan”) was entered into in March 2017 to acquire manufacturing equipment for our Japanese subsidiary and has an annual interest rate of the monthly TIBOR rate plus 1.00%. The 2017 Mitsubishi Bank Loan requires monthly interest and principal payments over 72 months commencing in April 2018. This loan is available from March 31, 2017 to March 30, 2018 and 690 million JPY (approximately $6.1 million) under this loan was fully drawn as of December 31, 2017. As of December 31, 2017, our total outstanding principal balance under the Mitsubishi Bank Term Loans was 1.9 billion JPY (approximately $16.9 million). See Note 11 of Notes to Consolidated Financial Statements in Item 8 of Part II of this Report. In January 2018, we repaid one of the Mitsubishi Bank Term Loans of 500 million JPY (approximately $4.4 million).
In January 2018, we entered into a term loan agreement with Bank of Tokyo-Mitsubishi UFJ, Ltd. (the "Mitsubishi Bank") and The Yamanashi Chou Bank, Ltd. for a term loan in the aggregate principal amount of 850 million JPY (approximately $7.8 million). The full amount of the term loan of 850 million JPY (approximately $7.8 million) was drawn in January 2018. Interest on this term loan is based upon the annual rate of the three months TIBOR rate plus 1.00%. This term loan requires quarterly interest payments, along with the principal payments, over 82 months commencing in April 2018.
From time to time we accept notes receivable in exchange for accounts receivable from certain of our customers in China. These notes receivable are non-interest bearing and are generally due within six months. Historically, we have collected on the notes receivable in full at the time of maturity.
In 2017, we generated operating losses of $51.4 million and negative cash flows from operations of $32.8 million. We had an accumulated deficit of $352.0 million as of December 31, 2017. Our operating results and cash flows during this period have been negatively affected by reduced demand in China stemming from delayed provincial deployments and a buildup of inventory at one or more of our leading customers, which is expected to continue into early 2018. In response, we implemented restructuring plans in May and September 2017 that included a reduction in force and consolidation of facilities, which are expected to reduce quarterly expenses by approximately $2.6 million when fully realized in the first quarter of 2018. We also reduced or delayed certain product development projects and capital expenditures, aggressively pursued collections of accounts and notes receivable and continued to closely manage production and inventory levels.
As of December 31, 2017, the remaining borrowing capacity under our revolving line of credit agreement with Wells Fargo, was $20.0 million of which $5.0 million is required to be maintained as unused borrowing capacity. As of December 31, 2017, we also have approximately $5.5 million available for short-term borrowings under two line of credit agreements in China that expire in July 2019 and approximately $37.9 million under third line of credit agreement with CITIC Bank in China that expires in November 2018. As of December 31, 2017, $17.0 million was due to CITIC Bank under an old line of credit, which was repaid in January 2018. Additionally, we had $6.0 million of current portion of long-term debt as of December 31, 2017, of which we paid $4.4 million in January 2018 and plan to pay out the remaining current portion of long-term debt out of our existing available cash. As noted above, in January 2018, we entered into a term loan agreement with Mitsubishi Bank and The Yamanashi Chou Bank, Ltd. for a term loan in the aggregate principal amount of 850 million JPY (approximately $7.8 million). In February 2018, we borrowed $17.0 million under third line of credit agreement with CITIC Bank in China that expires in November 2018.
We believe we will have sufficient resources to fund our currently planned operations and expenditures over the next twelve months without additional financing or other actions. In addition, we believe there are a number of ongoing and potential actions that may further strengthen our projected cash and projected financial position.
We operate in an industry that makes our prospects difficult to evaluate with certainty. Future declines in China market demand or other changes to our forecasts could adversely affect our results of operations, financial position and cash flows. As a result, we may need to raise additional debt or equity capital to fund our operations. Any additional debt arrangements may
50
likely require regular interest or principal payments which could adversely affect our operations. There can be no assurance that additional debt or equity capital will be available on acceptable terms, or at all. The accompanying consolidated financial statements do not include any adjustments that may result from the outcome of these uncertainties.
Rusnano Rights Agreement
Under our amended rights agreement, dated June 30, 2015, with Rusnano, one of our principal stockholders, we agreed to a $30.0 million investment commitment (the “Investment Commitment”) toward our Russian operations. The Investment Commitment can be partially satisfied by cash and/or non-cash investment inside or outside of Russia. Our $21.0 million investment milestone for 2016 was met as of December 31, 2016. If certain of the Investment Commitments are not achieved in the indicated time frames through 2019, we have the ability to exit our Russian operations by paying an exit fee of up to $2.0 million. See Note 13, Commitments and contingencies, in Notes to Consolidated Financial Statements in Item 8 of Part II of this Report for additional information.
Cash flow discussion
The table below sets forth selected cash flow data for the periods presented:
Years ended December 31, | |||||||||||
(in thousands) | 2017 | 2016 | 2015 | ||||||||
Net cash provided by (used in) operating activities | $ | (32,767 | ) | $ | 53,836 | $ | 26,138 | ||||
Net cash used in investing activities | (15,676 | ) | (49,470 | ) | (21,906 | ) | |||||
Net cash provided by financing activities | 43,102 | 3,516 | 29,623 | ||||||||
Effect of exchange rates on cash and cash equivalents | 1,747 | (1,470 | ) | (802 | ) | ||||||
Net increase (decrease) in cash and cash equivalents | $ | (3,594 | ) | $ | 6,412 | $ | 33,053 | ||||
Operating activities
In 2017, net cash used in operating activities was $32.8 million, compared to $53.8 million net cash provided by operating activities in 2016. The decrease was primarily attributable to a $48.3 million decrease in cash flows related to net loss and non-cash adjustments, $34.0 million decrease in cash flows related to decreased accounts payable, $21.0 million decrease in cash flows related to a buildup in inventories in the first half of 2017. The decreases were partially offset by a $10.7 million increase in cash flows from collection of accounts receivable primarily driven by lower revenue and strong collections and a $6.2 million increase in cash flows from accrued and other liabilities primarily relating to the TSA with APAT OE payable in the current year.
In 2016, net cash provided by operating activities was $53.8 million, a $27.7 million increase compared to 2015. The increase was primarily due to a $27.8 million increase in accounts payable due to timing of payments, a $13.6 million increase attributable to inventory shipments driven by product demand and a $1.8 million increase in net income net of non-cash adjustments, partially offset by a $9.5 million decrease related to higher prepaid and other assets primarily due to a reduction in prepaid taxes in 2015, a $6.0 million decrease related to lower accrued and other liabilities balance primarily due to variable compensation accrual for 2015 that did not recur in 2016.
In 2015, net cash provided by operating activities was $26.1 million, a $26.6 million increase compared to 2014. The increase was primarily due to a $23.4 million increase in net income, a $15.8 million increase driven by lower accounts receivable due to collections, a $5.7 million increase in accrued and other liabilities, a $4.2 million increase in prepaid and other assets, partially offset by a $19.9 million decrease related to inventory increases due to anticipated demand and a $5.7 million decrease in accounts payable due to timing of payments.
Investing activities
In 2017, net cash used in investing activities was $15.7 million, a $33.8 million decrease compared to $49.5 million used in 2016. The decrease in net cash used in investment activities was primarily attributable to a $21.6 million in proceeds from the sale of our Low Speed Transceiver Products’ assets in January 2017 and a $4.3 million decrease in property, plant and equipment purchases in 2017.
In 2016, net cash used in investing activities was $49.5 million, a $27.6 million increase compared to $21.9 million used in 2015. The increase in net cash used in investment activities was primarily attributable to a $45.6 million increase in purchased marketable securities, a $34.9 million increase in property, plant and equipment purchases to meet our product demand, a $10.8 million increase as a result of a large restricted cash decrease in 2015 and a $1.6 million increase due to
51
foreign currency hedge settlement payments, partially offset by a $45.7 million increase in proceeds from sales of marketable securities, a $19.1 million increase in proceeds from maturity of securities and a $0.4 million reduction in cash used in business acquisition compared to 2015.
In 2015, net cash used in investing activities was $21.9 million, an $8.0 million increase compared to $13.9 million used in 2014. The increase in net cash used in investment activities was primarily attributable to a $27.5 million increase in purchased marketable securities, a $5.8 million increase in property, plant and equipment purchases and a $5.4 million reduction in proceeds from maturity of securities, partially offset by a $21.0 million increase as a result of decreases in restricted cash balances and an $8.5 million increase in proceeds from sales of marketable securities.
Financing activities
In 2017, net cash provided by financing activities was $43.1 million, a $39.6 million increase compared to $3.5 million in 2016. The increase was primarily attributable to $30.0 million in new borrowing under our Wells Fargo Credit Facility ($10.0 million net of repayment of $20.0 million owed under the Comerica Bank Credit Facility), and $34.0 million from notes payable to banks in China.
In 2016, net cash provided by financing activities was $3.5 million, a $26.1 million decrease compared to $29.6 million in 2015. The decrease was primarily attributable to a $45.8 million decrease largely attributable to the $45.6 million net proceeds from our follow-on public offering in 2015, a $5.2 million decrease related to lower net proceeds from issuance of notes payable and a $2.1 million decrease in repayments of bank and acquisition-related loans, partially offset by a $14.9 million increase in proceeds from bank loans and a $7.5 million increase due to lower repayments of notes payable and a $3.9 million increase due to higher proceeds from exercise of stock options and issuance of stock under employee stock purchase plan primarily attributable higher average common stock price in 2016 compared to 2015.
In 2015, net cash provided by financing activities was $29.6 million, a $26.6 million increase compared to 2014. The increase was primarily attributable to a $62.2 million increase in net proceeds from bank and acquisition-related loans, a $45.6 million net proceeds from issuance of common stock in public offering, partially offset by a $75.6 million decrease in loans and acquisition-related loan payments, a $4.0 million decrease in proceeds from issuance of notes payable and a $3.4 million decrease in the repayments of notes payable.
Contractual obligations and commitments
The following summarizes our contractual obligations as of December 31, 2017:
Payments due by period | |||||||||||||||||||
(in thousands) | Total | Less than 1 Year | 1-3 Years | 3-5 Years | More than 5 Years | ||||||||||||||
Notes payable and short-term borrowing (1) | $ | 35,607 | $ | 35,607 | $ | — | $ | — | $ | — | |||||||||
Long-term debt (1) | 46,942 | 6,091 | 3,816 | 33,834 | 3,201 | ||||||||||||||
Retirement obligations (2) | 4,616 | 387 | 684 | 899 | 2,646 | ||||||||||||||
Operating leases (3) | 30,475 | 3,512 | 6,677 | 5,916 | 14,370 | ||||||||||||||
Purchase commitments (4) | 32,102 | 32,102 | — | — | — | ||||||||||||||
Rusnano payment derivative (5) | 389 | — | 389 | — | — | ||||||||||||||
Asset retirement obligations (6) | 3,252 | — | — | — | 3,252 | ||||||||||||||
Expected interest payments (7) | 6,097 | 1,909 | 2,351 | 1,769 | 68 | ||||||||||||||
Total | 159,480 | $ | 79,608 | $ | 13,917 | $ | 42,418 | $ | 23,537 | ||||||||||
Uncertainty in timing of future payments: | |||||||||||||||||||
Restricted retained earnings | 8,820 | ||||||||||||||||||
Deferred compensation plan | 547 | ||||||||||||||||||
Total commitments | $ | 168,847 | |||||||||||||||||
____________________________________________
(1) | See Note 11, Debt, in Notes to Consolidated Financial Statements in Item 8 of Part II of this Report for additional information regarding our debt. |
52
(2) | See Note 12, Pension Plans, in Notes to Consolidated Financial Statements in Item 8 of Part II of this Report for additional information regarding our retirement obligations. |
(3) | We have entered into various non-cancelable operating lease agreements for our offices in China, U.S. and Canada. |
(4) | This is an estimate of the amount outstanding under open purchase orders for the purchase of inventory and other goods at December 31, 2017. Certain of these open purchase orders may be cancellable without penalty. |
(5) | See Note 13, Commitments and contingencies, in Notes to Consolidated Financial Statements in Item 8 of Part II of this Report for additional information regarding our Rusnano Payment Derivative. |
(6) | We have an asset retirement obligation of $3.1 million associated with our facility lease in California which is included in other noncurrent liabilities in the consolidated balance sheet as of December 31, 2017. We also have a $0.1 million asset retirement obligation in Japan. |
(7) | We calculate the expected interest payments based on our long-term debt at prevailing interest rates as of December 31, 2017. |
Uncertain Tax Positions
As of December 31, 2017, the liability for uncertain tax positions was $0.2 million. We cannot conclude on the timing of cash payments associated with our uncertain tax positions.
Rusnano Rights Agreement
In connection with our April 2012 common stock private placement transaction, we entered into a rights agreement with Rusnano. Refer to the discussion in the “Liquidity and Capital Resources – Rusnano Rights Agreement” section.
Off-balance sheet arrangements
During the years ended December 31, 2017 and 2016, we did not have any significant off-balance sheet arrangements, as defined in Item 303(a)(4)(ii) of Regulation S-K.
Recent accounting pronouncements
See Note 2, Summary of Significant Accounting Policies, in Notes to the Consolidated Financial Statements in Item 8 of Part II of this Report, for a full description of recent accounting pronouncements, including the expected dates of adoption and estimated effects on financial condition and results of operations, which is incorporated herein by reference.
ITEM 7A. QUANTITATIVE AND QUALITATIVE DISCLOSURES ABOUT MARKET RISK
Interest rate fluctuation risk
The primary objective of our investment activities is to preserve principal while at the same time maximizing the income we receive from our investments without significantly increasing risk. To achieve this objective, we invest our excess cash in a variety of securities, including U.S. government agency securities, corporate notes and bonds and money market funds meeting certain criteria. These securities are classified as available-for-sale which are recorded on the balance sheet at fair value. We have determined that the gross unrealized gains or losses on the available-for-sale securities at December 31, 2017 are temporary in nature. We may sell these marketable securities investments in the future to fund future operating needs.
As of December 31, 2017, we had $34.0 million outstanding under our China credit facilities, $30.0 million outstanding under our U.S. credit facilities and $16.9 million outstanding under our term loans with the Mitsubishi Bank, which were subject to fluctuations in interest rates. For the year ended December 31, 2017, a hypothetical 10% increase in the interest rate could result in $0.3 million additional annual interest expense. The hypothetical assumptions made above will be different from what actually occurs in the future. Furthermore, the computations do not anticipate actions that may be taken by our management should the hypothetical market changes actually occur over time. As a result, actual impacts on our results of operations in the future will differ from those quantified above.
Foreign currency exchange risk
Foreign currency exchange rates are subject to fluctuation and may cause us to recognize transaction gains and losses in our statements of operations. A large portion of our business is conducted through our subsidiaries in China, whose functional currency is the RMB and Japan, whose functional currency is the JPY. To the extent that transactions by these subsidiaries are
53
in currencies other than their functional currencies, we bear the risk that fluctuations in the exchange rates of the RMB and JPY in relation to other currencies could increase our costs and expenses. During the year ended December 31, 2017, we recognized net foreign currency transaction losses of $0.5 million. We use the U.S. dollar as the reporting currency for our consolidated financial statements. Any significant revaluation of the RMB or JPY may materially and adversely affect our results of operations upon translation of these subsidiaries’ financial statements into U.S. dollars. While we generate a significant portion of our revenue in U.S. dollars, a significant portion of our cost of goods sold are in RMB. Therefore appreciation in RMB against the U.S. dollar would negatively impact our cost of goods sold upon translation to U.S. dollars. For example, for the year ended December 31, 2017, a 10% appreciation in RMB against the U.S. dollar would have resulted in an approximately $1.2 million increase in our cost of goods sold.
Effective July 1, 2016, we have entered into hedging transactions to reduce the short-term impact of foreign currency fluctuations. However, the availability and effectiveness of these hedging transactions may be limited and we may not be able to successfully hedge our exposure. In addition, our currency exchange variations may be magnified by any Chinese exchange control regulations that restrict our ability to convert RMB into foreign currency.
Inflation risk
Inflationary factors, such as increases in our cost of goods sold and operating expenses, may adversely affect our results of operations. Although we do not believe that inflation has had a material impact on our financial position or results of operations to date, an increase in the rate of inflation in the future, particularly in China, may have an adverse effect on our levels of gross profit and operating profit as a percentage of revenue if the sales prices for our products do not proportionately increase with these increased expenses.
54
ITEM 8. FINANCIAL STATEMENTS AND SUPPLEMENTARY DATA
INDEX TO CONSOLIDATED FINANCIAL STATEMENTS
Page | |
FINANCIAL STATEMENTS: | |
55
REPORT OF INDEPENDENT REGISTERED PUBLIC ACCOUNTING FIRM
To the Stockholders and the Board of Directors of NeoPhotonics Corporation
Opinion on the Financial Statements
We have audited the accompanying consolidated balance sheets of NeoPhotonics Corporation and subsidiaries (the "Company") as of December 31, 2017 and 2016, the related consolidated statements of operations, comprehensive loss, stockholders' equity, and cash flows, for each of the three years in the period ended December 31, 2017, and the related notes (collectively referred to as the "financial statements"). In our opinion, the financial statements present fairly, in all material respects, the financial position of the Company as of December 31, 2017 and 2016, and the results of its operations and its cash flows for each of the three years in the period ended December 31, 2017, in conformity with accounting principles generally accepted in the United States of America.
We have also audited, in accordance with the standards of the Public Company Accounting Oversight Board (United States) (PCAOB), the Company's internal control over financial reporting as of December 31, 2017, based on criteria established in Internal Control - Integrated Framework (2013) issued by the Committee of Sponsoring Organizations of the Treadway Commission and our report dated March 8, 2018, expressed an unqualified opinion on the Company's internal control over financial reporting.
Basis for opinion
These financial statements are the responsibility of the Company's management. Our responsibility is to express an opinion on the Company's financial statements based on our audits. We are a public accounting firm registered with the PCAOB and are required to be independent with respect to the Company in accordance with the U.S. federal securities laws and the applicable rules and regulations of the Securities and Exchange Commission and the PCAOB.
We conducted our audits in accordance with the standards of the PCAOB. Those standards require that we plan and perform the audit to obtain reasonable assurance about whether the financial statements are free of material misstatement, whether due to error or fraud. Our audits included performing procedures to assess the risks of material misstatement of the financial statements, whether due to error or fraud, and performing procedures that respond to those risks. Such procedures included examining, on a test basis, evidence regarding the amounts and disclosures in the financial statements. Our audits also included evaluating the accounting principles used and significant estimates made by management, as well as evaluating the overall presentation of the financial statements. We believe that our audits provide a reasonable basis for our opinion.
/s/ DELOITTE & TOUCHE LLP
San Jose, California
March 8, 2018
We have served as the Company's auditor since 2014.
56
NEOPHOTONICS CORPORATION
CONSOLIDATED BALANCE SHEETS
December 31, | |||||||
(In thousands, except par data) | 2017 | 2016 | |||||
ASSETS | |||||||
Current assets: | |||||||
Cash and cash equivalents | $ | 78,906 | $ | 82,500 | |||
Short-term investments | 12,311 | 19,015 | |||||
Restricted cash | 2,658 | 4,085 | |||||
Accounts receivable, net of allowance for doubtful accounts | 67,229 | 80,610 | |||||
Inventories | 67,301 | 48,237 | |||||
Assets held for sale | — | 13,953 | |||||
Prepaid expenses and other current assets | 36,235 | 22,396 | |||||
Total current assets | 264,640 | 270,796 | |||||
Property, plant and equipment, net | 127,565 | 106,867 | |||||
Purchased intangible assets, net | 4,294 | 5,562 | |||||
Goodwill | 1,115 | 1,115 | |||||
Other long-term assets | 5,339 | 6,547 | |||||
Total assets | $ | 402,953 | $ | 390,887 | |||
LIABILITIES AND STOCKHOLDERS’ EQUITY | |||||||
Current liabilities: | |||||||
Accounts payable | $ | 69,017 | $ | 84,766 | |||
Notes payable and short-term borrowing | 35,607 | 30,190 | |||||
Current portion of long-term debt | 6,005 | 747 | |||||
Accrued and other current liabilities | 43,242 | 30,625 | |||||
Total current liabilities | 153,871 | 146,328 | |||||
Long-term debt, net of current portion | 40,556 | 10,215 | |||||
Other noncurrent liabilities | 14,075 | 8,939 | |||||
Total liabilities | 208,502 | 165,482 | |||||
Commitments and contingencies (Note 13) | |||||||
Stockholders’ equity: | |||||||
Preferred stock, $0.0025 par value, 10,000 shares authorized, no shares issued or outstanding | — | — | |||||
Common stock, $0.0025 par value, 100,000 shares authorized | |||||||
At December 31, 2017, 44,219 shares issued and outstanding; at December 31, 2016, 42,526 shares issued and outstanding | 111 | 106 | |||||
Additional paid-in capital | 545,953 | 532,378 | |||||
Accumulated other comprehensive income (loss) | 398 | (8,401 | ) | ||||
Accumulated deficit | (352,011 | ) | (298,678 | ) | |||
Total stockholders’ equity | 194,451 | 225,405 | |||||
Total liabilities and stockholders’ equity | $ | 402,953 | $ | 390,887 | |||
See Accompanying Notes to Consolidated Financial Statements.
57
NEOPHOTONICS CORPORATION
CONSOLIDATED STATEMENTS OF OPERATIONS
Years Ended December 31, | |||||||||||
(In thousands, except per share data) | 2017 | 2016 | 2015 | ||||||||
Revenue | $ | 292,894 | $ | 411,423 | $ | 339,439 | |||||
Cost of goods sold | 231,415 | 294,290 | 240,358 | ||||||||
Gross profit | 61,479 | 117,133 | 99,081 | ||||||||
Operating expenses: | |||||||||||
Research and development | 58,287 | 57,376 | 44,533 | ||||||||
Sales and marketing | 17,760 | 18,595 | 15,823 | ||||||||
General and administrative | 34,453 | 34,409 | 31,635 | ||||||||
Amortization of purchased intangible assets | 472 | 1,609 | 1,791 | ||||||||
Acquisition and asset sale related costs | 130 | 2,125 | 934 | ||||||||
Restructuring charges | 3,934 | — | 44 | ||||||||
Gain on asset sale | (2,193 | ) | — | — | |||||||
Asset impairment charges | — | — | 368 | ||||||||
Total operating expenses | 112,843 | 114,114 | 95,128 | ||||||||
Income (loss) from operations | (51,364 | ) | 3,019 | 3,953 | |||||||
Interest income | 198 | 303 | 121 | ||||||||
Interest expense | (1,362 | ) | (402 | ) | (1,243 | ) | |||||
Other income, net | 104 | 472 | 3,941 | ||||||||
Total interest and other income (expense), net | (1,060 | ) | 373 | 2,819 | |||||||
Income (loss) before income taxes | (52,424 | ) | 3,392 | 6,772 | |||||||
Provision for income taxes | (909 | ) | (3,597 | ) | (3,104 | ) | |||||
Net income (loss) | $ | (53,333 | ) | $ | (205 | ) | $ | 3,668 | |||
Basic net income (loss) per share | $ | (1.23 | ) | (0.00) | $ | 0.10 | |||||
Diluted net income (loss) per share | $ | (1.23 | ) | (0.00) | $ | 0.09 | |||||
Weighted average shares used to compute basic net income (loss) per share | 43,431 | 41,798 | 37,421 | ||||||||
Weighted average shares used to compute diluted net income (loss) per share | 43,431 | 41,798 | 38,686 | ||||||||
See Accompanying Notes to Consolidated Financial Statements.
58
NEOPHOTONICS CORPORATION
CONSOLIDATED STATEMENTS OF COMPREHENSIVE LOSS
Years ended December 31, | |||||||||||
(in thousands) | 2017 | 2016 | 2015 | ||||||||
Net income (loss) | $ | (53,333 | ) | $ | (205 | ) | $ | 3,668 | |||
Other comprehensive income (loss): | |||||||||||
Foreign currency translation adjustments, net of zero tax | 8,803 | (6,640 | ) | (6,987 | ) | ||||||
Unrealized gains (losses) on available-for-sale securities, net of zero tax | 17 | 10 | (35 | ) | |||||||
Defined benefit pension plans: | |||||||||||
Loss arising during the period | (32 | ) | (72 | ) | (40 | ) | |||||
Curtailments, settlements and other | — | — | — | ||||||||
Tax | 11 | 24 | 13 | ||||||||
Total other comprehensive income (loss) | 8,799 | (6,678 | ) | (7,049 | ) | ||||||
Comprehensive loss | $ | (44,534 | ) | $ | (6,883 | ) | $ | (3,381 | ) | ||
See Accompanying Notes to Consolidated Financial Statements.
59
NEOPHOTONICS CORPORATION
CONSOLIDATED STATEMENTS OF STOCKHOLDERS’ EQUITY
Common stock | Additional paid-in capital | Accumulated other comprehensive income (loss) | Accumulated deficit | Total stockholders’ equity | ||||||||||||||||||
(In thousands) | Shares | Amount | ||||||||||||||||||||
Balances at December 31, 2014 | 32,752 | $ | 82 | $ | 456,189 | $ | 5,326 | $ | (302,141 | ) | $ | 159,456 | ||||||||||
Comprehensive loss | — | — | — | (7,049 | ) | 3,668 | (3,381 | ) | ||||||||||||||
Issuance of common stock from public stock offering, net of discount and offering costs | 6,867 | 17 | 45,621 | — | — | 45,638 | ||||||||||||||||
Issuance of common stock upon exercise of stock options | 304 | 1 | 1,177 | — | — | 1,178 | ||||||||||||||||
Issuance of common stock under employee stock purchase plan | 600 | 1 | 1,538 | — | — | 1,539 | ||||||||||||||||
Issuance of common stock for vested restricted stock units | 558 | 1 | (1 | ) | — | — | — | |||||||||||||||
Tax withholding related to vesting of restricted stock units | (95 | ) | — | (727 | ) | — | — | (727 | ) | |||||||||||||
Stock-based compensation costs | — | — | 7,953 | — | — | 7,953 | ||||||||||||||||
Balances at December 31, 2015 | 40,986 | 102 | 511,750 | (1,723 | ) | (298,473 | ) | 211,656 | ||||||||||||||
Comprehensive loss | — | — | — | (6,678 | ) | (205 | ) | (6,883 | ) | |||||||||||||
Issuance of common stock from public stock offering, net of discount and offering costs | — | — | — | |||||||||||||||||||
Issuance of common stock upon exercise of stock options | 1,013 | 3 | 3,668 | — | — | 3,671 | ||||||||||||||||
Issuance of common stock under employee stock purchase plan | 351 | 1 | 2,778 | — | — | 2,779 | ||||||||||||||||
Issuance of common stock for vested restricted stock units | 226 | — | — | — | — | — | ||||||||||||||||
Tax withholding related to vesting of restricted stock units | (50 | ) | — | (615 | ) | — | — | (615 | ) | |||||||||||||
Stock-based compensation costs | — | — | 14,797 | — | — | 14,797 | ||||||||||||||||
Balances at December 31, 2016 | 42,526 | 106 | 532,378 | (8,401 | ) | (298,678 | ) | 225,405 | ||||||||||||||
Comprehensive loss | — | — | — | 8,799 | (53,333 | ) | (44,534 | ) | ||||||||||||||
Issuance of common stock upon exercise of stock options | 665 | 2 | 2,481 | — | — | 2,483 | ||||||||||||||||
Issuance of common stock under employee stock purchase plan | 349 | 1 | 2,392 | — | — | 2,393 | ||||||||||||||||
Issuance of common stock for vested restricted stock units | 806 | 2 | (2 | ) | — | — | — | |||||||||||||||
Tax withholding related to vesting of restricted stock units | (127 | ) | — | (998 | ) | — | — | (998 | ) | |||||||||||||
Stock-based compensation costs | — | — | 9,702 | — | — | 9,702 | ||||||||||||||||
Balances at December 31, 2017 | 44,219 | $ | 111 | $ | 545,953 | $ | 398 | $ | (352,011 | ) | $ | 194,451 | ||||||||||
See Accompanying Notes to Consolidated Financial Statements.
60
NEOPHOTONICS CORPORATION
CONSOLIDATED STATEMENTS OF CASH FLOWS
Years ended December 31, | |||||||||||
(In thousands) | 2017 | 2016 | 2015 | ||||||||
Cash flows from operating activities | |||||||||||
Net income (loss) | $ | (53,333 | ) | $ | (205 | ) | $ | 3,668 | |||
Adjustments to reconcile net income (loss) to net cash provided by (used in) operating activities: | |||||||||||
Depreciation and amortization | 28,350 | 22,400 | 22,875 | ||||||||
Stock-based compensation expense | 8,206 | 17,076 | 7,763 | ||||||||
Deferred taxes | 792 | (668 | ) | (641 | ) | ||||||
Amortization of investment, debt and other | 247 | 159 | 296 | ||||||||
Loss (gain) on disposal of property and equipment | (1,746 | ) | 185 | 394 | |||||||
Loss (gain) on foreign currency hedges | (2,104 | ) | 1,640 | — | |||||||
Allowance for doubtful accounts | 577 | (382 | ) | 640 | |||||||
Write-down of inventories | 8,349 | 2,983 | 6,486 | ||||||||
Foreign currency remeasurement and other, net | 2,583 | (2,661 | ) | (2,992 | ) | ||||||
Asset impairment charges | 324 | — | 368 | ||||||||
Adjustment to fair value of Rusnano payment derivative | — | — | (141 | ) | |||||||
Change in assets and liabilities, net of effects of acquisitions: | |||||||||||
Accounts receivable | 13,166 | 2,496 | 2,529 | ||||||||
Inventories | (22,347 | ) | (1,332 | ) | (14,899 | ) | |||||
Prepaid expenses and other assets | (11,409 | ) | (11,184 | ) | (1,691 | ) | |||||
Accounts payable | (10,874 | ) | 23,111 | (4,692 | ) | ||||||
Accrued and other liabilities | 6,452 | 218 | 6,175 | ||||||||
Net cash (used in) provided by operating activities | (32,767 | ) | 53,836 | 26,138 | |||||||
Cash flows from investing activities | |||||||||||
Purchase of property, plant and equipment | (47,409 | ) | (51,693 | ) | (16,837 | ) | |||||
Proceeds from sale of property, plant and equipment and other assets | 21,809 | 179 | 245 | ||||||||
Purchase of marketable securities | (52,062 | ) | (82,728 | ) | (37,130 | ) | |||||
Proceeds from sale of marketable securities | 52,272 | 63,841 | 18,103 | ||||||||
Proceeds from maturity of marketable securities | 6,458 | 23,148 | 4,000 | ||||||||
Change in restricted cash | 1,638 | (618 | ) | 10,135 | |||||||
Settlement of foreign currency hedges | 1,618 | (1,599 | ) | — | |||||||
Acquisition of businesses, net | — | — | (422 | ) | |||||||
Net cash used in investing activities | (15,676 | ) | (49,470 | ) | (21,906 | ) | |||||
Cash flows from financing activities | |||||||||||
Proceeds from exercise of stock options and issuance of stock under ESPP | 4,893 | 6,587 | 2,717 | ||||||||
Tax withholding on restricted stock units | (998 | ) | (615 | ) | (727 | ) | |||||
Proceeds from (payments for) public stock offering, net of offering costs | (117 | ) | (164 | ) | 45,648 | ||||||
Proceeds from bank loans | 112,834 | 95,200 | 80,256 | ||||||||
Repayment of bank and acquisition-related loans | (68,492 | ) | (96,119 | ) | (94,032 | ) | |||||
Proceeds from issuance of notes payable | 6,621 | 16,032 | 21,259 | ||||||||
Repayment of notes payable | (11,639 | ) | (18,007 | ) | (25,498 | ) | |||||
Proceeds from government grants | — | 602 | — | ||||||||
Net cash provided by financing activities | 43,102 | 3,516 | 29,623 | ||||||||
Effect of exchange rates on cash and cash equivalents | 1,747 | (1,470 | ) | (802 | ) | ||||||
Net increase (decrease) in cash and cash equivalents | (3,594 | ) | 6,412 | 33,053 | |||||||
Cash and cash equivalents at the beginning of the period | 82,500 | 76,088 | 43,035 | ||||||||
Cash and cash equivalents at the end of the period | $ | 78,906 | $ | 82,500 | $ | 76,088 | |||||
Supplemental disclosure of cash flow information: | |||||||||||
Cash paid for interest | $ | 732 | $ | 263 | $ | 878 | |||||
Cash paid for income taxes | 5,388 | 2,215 | 264 | ||||||||
Supplemental disclosure of noncash investing and financing activities: | |||||||||||
Restricted cash receipt and payable related to asset purchase agreement | — | 1,039 | — | ||||||||
Unpaid deferred offering costs | — | 117 | — | ||||||||
Decrease (increase) in unpaid property, plant and equipment | 6,072 | (13,629 | ) | (396 | ) | ||||||
Modification of bank loan with Comerica | — | — | 15,786 | ||||||||
Issuance of note to seller of acquired business | — | — | 15,482 | ||||||||
Transfer of restricted investments to short-term investments | — | — | 8,296 | ||||||||
Asset retirement obligation | 2,146 | — | — | ||||||||
See Accompanying Notes to Consolidated Financial Statements.
61
NEOPHOTONICS CORPORATION
NOTES TO CONSOLIDATED FINANCIAL STATEMENTS
1. The Company and basis of presentation
Business and organization
NeoPhotonics Corporation and its subsidiaries (NeoPhotonics or the Company) develops, manufactures and sells optoelectronic products that transmit, receive and switch high speed digital optical signals for communications networks. The Company sells its products worldwide, primarily to leading network equipment manufacturers.
Certain Significant Risks and Uncertainties
The Company operates in a dynamic industry and, accordingly, can be affected by a variety of factors. For example, any of the following areas could have a negative effect on the Company in terms of its future financial position, results of operations or cash flows: the general state of the U.S., China and world economies; the highly cyclical nature of the industries the Company serves; the loss of any of a small number of its larger customers; ability to obtain additional financing; inability to meet certain debt covenants; failure to successfully integrate completed acquisitions; fundamental changes in the technology underlying the Company’s products; the hiring, training and retention of key employees; successful and timely completion of product design efforts; and new product design introductions by competitors.
Consolidation
The consolidated financial statements include the accounts of the Company and its wholly owned subsidiaries. Intercompany accounts and transactions have been eliminated in consolidation.
Going Concern
Accounting Standards Update (“ASU”) No. 2014-15, Disclosure of Uncertainties about an Entity’s Ability to Continue as a Going Concern, requires an entity to disclose information about its potential inability to continue as a going concern when conditions and events indicate that it is probable that the entity may be unable to meet its obligations as they become due within one year. Management has assessed the Company’s ability to continue as a going concern within one year of the filing date of this Annual Report on Form 10-K with the Securities and Exchange Commission ("SEC") in March 2018. The accompanying consolidated financial statements have been prepared assuming that the Company will continue as a going concern, which contemplates the realization of assets and satisfaction of liabilities in the normal course of business.
As of December 31, 2017, the Company’s working capital was $110.8 million, including available cash, cash equivalents, short-term investments and restricted cash of approximately $93.9 million. In 2017, the Company had operating losses of $51.4 million and negative cash flows from operations of $32.8 million. It had an accumulated deficit of approximately $352.0 million as of December 31, 2017.
The Company's operating results and cash flows for 2017 have been negatively affected by reduced demand in China stemming from delayed provincial deployments and a buildup of inventory at one or more of our leading customers, which is expected to continue into early 2018. In response, the Company implemented restructuring plans in May and September 2017 that included a reduction in force and consolidation of facilities, which are expected to reduce expenses. The Company has also reduced or delayed certain product development projects and capital expenditures, aggressively pursued collections of accounts and notes receivable and continued to closely manage production and inventory levels.
In September 2017, the Company entered into a revolving line of credit agreement with Wells Fargo Bank, National Association ("Wells Fargo") which provides for borrowings under an accounts receivable based formula up to a maximum of $50.0 million. As of December 31, 2017, $30.0 million was outstanding under this line. The remaining borrowing capacity as of December 31, 2017 was $20.0 million, of which $5.0 million is required to be maintained as unused borrowing capacity. Borrowings under the Wells Fargo line are not due until June 30, 2022 as long as the borrowing base is not less than the outstanding amount (see Note 11). The Company also has approximately $5.5 million available for short-term borrowings under two line of credit agreements with Pudong Bank in China that expire in July 2019 and approximately $37.9 million under third line of credit agreement with CITIC Bank in China which was renewed in December 2017 and expires in November 2018. In February 2018, the Company borrowed $17.0 million under this third line of credit agreement with CITIC Bank in China.
The Company believes it will have sufficient resources to fund its currently planned operations and expenditures over the next twelve months without additional financing or other actions. In addition, the Company believes there are a number of ongoing and potential actions that may further strengthen its projected cash and projected financial position.
62
The Company operates in an industry that makes its prospects difficult to evaluate with certainty. Future declines in China market demand or other changes to the Company’s forecasts could adversely affect the Company’s results of operations, financial position and cash flows. As a result, the Company may need to raise additional debt or equity capital to fund its operations. Any additional debt arrangements may likely require regular interest and principal payments which could adversely affect the Company’s operations. There can be no assurance that additional debt or equity capital will be available on acceptable terms, or at all.
2. Summary of significant accounting policies
Use of estimates
The preparation of financial statements in accordance with U.S. generally accepted accounting principles (“U.S. GAAP”) requires management to make estimates and assumptions that affect the reported amounts of assets and liabilities and disclosure of contingent assets and liabilities at the date of the financial statements and the reported revenue and expenses during the reporting period. Significant estimates made by management include: the useful lives of property, plant and equipment and intangible assets as well as future cash flows to be generated by those assets; fair values of identifiable assets acquired and liabilities assumed in business combinations; allowances for doubtful accounts; valuation allowances for deferred tax assets; write off of excess and obsolete inventories; the valuation of the Rusnano payment derivative and the valuations and recognition of stock-based compensation, among others. Actual results could differ from these estimates.
Concentration of credit risk and significant customers
Financial instruments that potentially subject the Company to concentrations of credit risk are primarily cash and cash equivalents and trade accounts receivable. The Company’s investment policy requires cash and cash equivalents to be placed with high-credit quality institutions and limits on the amount of credit risk from any one issuer. The Company performs ongoing credit evaluations of its customers’ financial condition whenever deemed necessary and generally does not require collateral. The Company maintains an allowance for doubtful accounts based upon the expected collectability of all accounts receivable, which takes into consideration an analysis of historical bad debts, specific customer creditworthiness and current economic trends.
For the year ended December 31, 2017, two customers accounted for 40% and 16% of the Company’s total revenue. For the year ended December 31, 2016, two customers accounted for 50% and 15% of the Company’s total revenue. For the year ended December 31, 2015, two customers accounted for 44% and 21% of the Company’s total revenue. The percentage of revenue from top five customers was 78%, 82% and 82% for the years ended December 31, 2017, 2016 and 2015, respectively.
As of December 31, 2017, three customers accounted for approximately 36%, 14% and 10%, respectively, of the Company’s total accounts receivable. As of December 31, 2016, three customers accounted for 42%, 12% and 12% of the Company’s total accounts receivable.
Restricted cash
As a condition of the notes payable lending arrangements and the line of credit facilities, the Company is required to keep a compensating balance at the issuing banks. In addition, the Company also maintained restricted cash in connection with the asset purchase agreement executed in December 2016, see Note 9. These balances have been excluded from the Company’s cash and cash equivalents balance and are classified as restricted cash in the Company’s consolidated balance sheets. As of December 31, 2017 and 2016, the amount of restricted cash was $2.7 million and $4.1 million, respectively.
Cash, cash equivalents and investments
Highly liquid investments with a maturity of 90 days or less at the date of purchase are considered cash equivalents, with the exception of money market funds and commercial paper which are classified as short-term investments. Marketable securities are reported at fair value and are classified as available-for-sale investments in our current assets because they represent investments of cash available for current operations and for strategic reasons. As a result, the Company recorded all its marketable securities in short-term investments regardless of the contractual maturity date of the securities.
The Company regularly reviews its investment portfolio to identify and evaluate investments that have indications of possible impairment. Factors considered in determining whether a loss is other-than-temporary include: the length of time and extent to which the fair market value has been lower than the cost basis, the financial condition and near-term prospects of the investee, credit quality, likelihood of recovery, and the Company’s ability to hold the investment for a period of time sufficient to allow for any anticipated recovery in fair market value.
63
Table of Contents
NEOPHOTONICS CORPORATION
NOTES TO CONSOLIDATED FINANCIAL STATEMENTS (continued)
Unrealized gains and losses, net of tax, are included in accumulated other comprehensive loss as a separate component of stockholders’ equity on the consolidated balance sheets. The amortization of premiums and discounts on the investments, and realized gains and losses on available-for-sale securities are included in other income, net in the consolidated statements of operations. The Company uses the specific-identification method to determine cost in calculating realized gains and losses upon the sale of its marketable securities.
Fair Value Measurements
Fair value is defined as the price at which an asset could be exchanged in a current transaction between knowledgeable, willing parties. A liability’s fair value is defined as the amount that would be paid to transfer the liability to a new obligor, not the amount that would be paid to settle the liability with the creditor. Where available, fair value is based on observable market prices or parameters or derived from such prices or parameters. Where observable prices or inputs are not available, valuation models are applied. These valuation techniques involve some level of management estimation and judgment, the degree of which is dependent on the price transparency for the instruments or market and the instruments’ complexity. Valuation techniques used to measure fair value must maximize the use of observable inputs and minimize the use of unobservable inputs. The authoritative accounting guidance describes a fair value hierarchy based on three levels of inputs that may be used to measure fair value, of which the first two are considered observable and the last is considered unobservable. These levels of inputs are as follows:
Level 1—Observable inputs such as unadjusted, quoted prices in active markets for identical assets or liabilities at the measurement date.
Level 2—Inputs (other than quoted prices included in Level 1) are either directly or indirectly observable for the asset or liability. These include quoted prices for similar assets or liabilities in active markets and quoted prices for identical or similar assets or liabilities in markets that are not active.
Level 3—Unobservable inputs that reflect management’s best estimate of what market participants would use in pricing the asset or liability at the measurement date. Consideration is given to the risk inherent in the valuation technique and the risk inherent in the inputs to the model.
For marketable securities measured at fair value using Level 2 inputs, we review trading activity and pricing for these investments as of the measurement date. When sufficient quoted pricing for identical securities is not available, we use market pricing and other observable market inputs for similar securities obtained from various third party data providers. These inputs either represent quoted prices for similar assets in active markets or have been derived from observable market data.
Accounts receivable
Accounts receivable include trade receivables and notes receivable from customers. The notes are generally due within six months. The Company receives notes receivable in exchange for accounts receivable from certain customers in China that are secured by the customer’s affiliated financial institution.
An allowance for doubtful accounts is calculated based on the aging of the Company’s trade receivables, historical experience, and management judgment. The Company writes off trade receivables against the allowance when management determines a balance is uncollectible and is no longer actively pursuing collection of the receivable.
Inventories
Inventories consist of on-hand raw materials, work-in-progress inventories and finished goods. Raw materials and work-in-progress inventories are stored mainly on the Company’s premises. Finished goods are stored on the Company’s premises as well as on consignment at certain customer sites.
Inventories are stated at the lower of standard cost, which approximates actual cost determined on the weighted average basis, or net realizable value. Inventories are recorded using the first-in, first-out method. The Company routinely evaluates quantities and values of inventories in light of current market conditions and market trends, and records a write-down for quantities in excess of demand and product obsolescence. The evaluation may take into consideration historic usage, expected demand, anticipated sales price, new product development schedules, the effect new products might have on the sale of existing products, product obsolescence, customer concentrations, product merchantability and other factors. Market conditions are subject to change and actual consumption of inventory could differ from forecasted demand. The Company also regularly reviews the cost of inventories against their estimated market value and records a lower of cost or market write-down for
64
Table of Contents
NEOPHOTONICS CORPORATION
NOTES TO CONSOLIDATED FINANCIAL STATEMENTS (continued)
inventories that have a cost in excess of estimated market value, resulting in a new cost basis for the related inventories which is not reversed.
Business Combinations
We allocate the fair value of purchase consideration to the tangible and intangible assets acquired and liabilities assumed based on their estimated fair values as of the close of acquisition. The excess of the fair value of purchase consideration over the fair values of these identifiable assets and liabilities is recorded as goodwill. When determining the fair values of assets acquired and liabilities assumed, management makes significant estimates and assumptions through established and generally accepted valuation techniques.
Fair value estimates are based on the assumptions management believes a market participant would use in pricing the asset or liability. Critical estimates in valuing certain intangible assets include, but are not limited to, future expected cash flows from customer relationships and acquired patents and developed technology; and discount rates. Management’s estimates of fair value are based upon assumptions believed to be reasonable, but which are inherently uncertain and unpredictable and, as a result, actual results may differ from estimates.
Amounts recorded in a business combination may change during the measurement period, which is a period not to exceed one year from the date of acquisition, as additional information about conditions existing at the acquisition date becomes available.
Goodwill
Goodwill is reviewed for impairment annually in the fourth fiscal quarter or more frequently if events or changes in circumstances indicate that the carrying value of goodwill may not be recoverable. The Company will assess the qualitative factors to determine whether it is more likely than not that the fair value of its reporting unit is less than its carrying amount as a basis for determining whether it is necessary to perform the two-step goodwill impairment. If the Company determines that it is more likely than not that its fair value is less than its carrying amount, then the two-step goodwill impairment test is performed. The first step, identifying a potential impairment, compares the fair value of the reporting unit with its carrying amount. If the carrying amount exceeds its fair value, the second step would need to be performed; otherwise, no further steps are required. The second step, measuring the impairment loss, compares the implied fair value of the goodwill with the carrying amount of the goodwill. Any excess of the goodwill carrying amount over the implied fair value is recognized as an impairment loss, and the carrying value of goodwill is written down to fair value. The Company had no goodwill impairment in 2017 or 2016.
Long-lived assets
Property, plant and equipment are stated at cost, net of accumulated depreciation and amortization. Repairs and maintenance costs are expensed as incurred. Depreciation and amortization are computed using the straight-line method over the following estimated useful lives:
Buildings | 20-30 years |
Machinery and equipment | 2-7 years |
Furniture, fixtures and office equipment | 3-5 years |
Software | 5-7 years |
Leasehold improvements | life of the asset or lease term, if shorter |
Intangible assets acquired in a business combination are recorded at fair value. Identifiable finite-lived intangible assets are amortized over the period of estimated benefit using the straight-line method, reflecting the pattern of economic benefits associated with these assets. The estimated useful lives of the Company’s finite-lived intangible assets generally range from two to seven years. The acquired land use rights in China have an estimated useful life of 45 years.
Assets held for sale are measured at the lower of carrying value or the fair value less cost to sell. The carrying value of intangible assets and other long-lived assets is reviewed on a regular basis for the existence of facts or circumstances, both internally and externally, that may suggest impairment. Some factors which the Company considers to be triggering events for impairment review include a significant decrease in the market value of an asset, a significant change in the extent or manner in which an asset is used, a significant adverse change in the business climate that could affect the value of an asset, an accumulation of costs for an asset in excess of the amount originally expected, a current period operating loss or cash flow decline combined with a history of operating loss or cash flow uses or a projection that demonstrates continuing losses and a
65
Table of Contents
NEOPHOTONICS CORPORATION
NOTES TO CONSOLIDATED FINANCIAL STATEMENTS (continued)
current expectation that, it is more likely than not, a long-lived asset will be disposed of at a loss before the end of its estimated useful life.
If one or more of such facts or circumstances exist, the Company will evaluate the carrying value of long-lived assets to determine if impairment exists by comparing it to estimated undiscounted future cash flows over the remaining useful life of the assets. If the carrying value of the assets is greater than the estimated future cash flow, the assets are written down to the estimated fair value. The Company’s cash flow estimates contain management’s best estimates, using appropriate and customary assumptions and projections at the time. Any write-down would be treated as a permanent reduction in the carrying amount of the asset and an operating loss would be recognized.
The Company recorded asset impairment charges of $0.4 million in restructuring charges in 2017 (see Note 10). There were no asset impairment charges in 2016. The Company recorded asset impairment charges of $0.4 million in 2015 related to certain held-for-sale property, plant and equipment.
Revenue recognition
Revenue is derived from the sale of the Company’s products. The Company recognizes revenue provided that persuasive evidence of an arrangement exists, delivery has occurred, the price is fixed or determinable and collectability is reasonably assured. Contracts and/or customer purchase orders are used to determine the existence of an arrangement. Delivery is considered to have occurred when title and risk of loss have transferred to the customer. The price is equal to the amount invoiced to the customer and is not subject to adjustment and customers do not have the right of return. The Company evaluates the creditworthiness of its customers to determine that appropriate credit limits are established prior to the acceptance of an order.
Revenue is recognized when the product is delivered and title have transferred to the buyer. The Company generally bears all costs and risks of loss or damage to the goods up to that point. Revenue related to the sale of consignment inventory at customer vendor managed locations is not recognized until the product is pulled from inventory stock by customers. In instances where acceptance of the product or solutions is specified by the customer, revenue is deferred until such required acceptance criteria have been met. Shipping and handling costs are included in the cost of goods sold. The Company presents revenue net of sales taxes and any similar assessments.
Product warranties
The Company generally provides warranties to cover defects in workmanship, materials and manufacturing for a period of one to three years to meet the stated functionality as agreed to in each sales arrangement. Products are tested against specified functionality requirements prior to delivery, but the Company nevertheless from time to time experiences claims under its warranty guarantees. The Company accrues for estimated warranty costs under those guarantees based upon historical experience, and for specific items, at the time their existence is known and the amounts are determinable.
Research and development
Research and development expense consists of personnel costs, including stock-based compensation expense, for the Company’s research and development personnel and product development costs, including engineering services, development software and hardware tools, depreciation of capital equipment and facility costs. Research and development costs are expensed as incurred.
Advertising costs
Advertising costs are expensed as incurred and, to date, have not been significant.
Stock-based compensation
The Company grants stock-based awards to employees, consultants and directors. The stock-based awards, including stock options, restricted stock units, employee stock purchase rights, stock appreciation units and market-based awards, are accounted for at estimated fair values. Vesting of stock-based awards is generally subject to the grantee’s continuing service to the Company.
The Company generally determines the fair value of stock options and stock appreciation rights utilizing the Black-Scholes-Merton option-pricing model, or a lattice-binomial option-pricing model for stock-based awards with a market condition. The fair value of employee grants is measured on the date of grant and then recognized over the period during which an employee is required to provide services in exchange for the award, known as the requisite service period (usually the
66
Table of Contents
NEOPHOTONICS CORPORATION
NOTES TO CONSOLIDATED FINANCIAL STATEMENTS (continued)
vesting period) on a straight-line basis. The fair value of non-employee grants is measured on the date of grant and then marked to market until vest dates and then recognized over the requisite service period.
The Company records expense and an equal adjustment to the liability for stock appreciation units equal to the fair value of the vested portion of the awards as of each period end. Each reporting period thereafter, compensation expense will be recorded based on the remaining service period and the then fair value of the award until vesting of the award is completed. After vesting is completed, the Company will continue to re-measure the fair value of the liability each reporting period until the award is exercised or expires, with changes in the fair value of the liability recorded in the consolidated statements of operations.
Restricted stock units are valued at the closing sales price as quoted on the New York Stock Exchange on the date of grant, and are converted into shares of common stock upon vesting on a one-for-one basis. The compensation expense related to the restricted stock units is determined using the fair value of common stock on the date of grant, and the expense is recognized on a straight-line basis over the vesting period.
Employee stock purchase rights are accounted for at fair value, utilizing the Black-Scholes-Merton option-pricing model.
Stock-based compensation expense for modified stock-based awards are recognized using the pool approach, under which the remaining compensation cost from the original awards plus the incremental costs, if any, of the related modified awards is recognized in its entirety over the remaining portion of the requisition service period of the corresponding modified awards.
Stock-based compensation expense recognized at fair value includes the impact of estimated forfeitures. The Company estimates future forfeitures at the date of grant and revises the estimates, if necessary, in subsequent periods if actual forfeitures differ from those estimates.
Income taxes
Income taxes are accounted for under the asset and liability method. Deferred tax assets and liabilities are recognized for the future tax consequences attributable to differences between the carrying amounts of existing assets and liabilities in the financial statements and their respective tax bases, and operating loss and tax credit carryforwards. Deferred tax assets and liabilities are measured using enacted tax rates expected to apply to taxable income in the years in which those temporary differences are expected to be recovered or settled. The effect on deferred tax assets and liabilities from a change in tax rates is recognized in the consolidated statement of operations in the period that includes the enactment date.
The Company operates in various tax jurisdictions and is subject to audit by various tax authorities. In preparing the Company’s consolidated financial statements, the Company is required to estimate its taxes in each of the jurisdictions in which it operates. The Company estimates actual current tax exposure as well as assesses temporary differences resulting from different treatment of items, such as accruals and allowances not currently deductible for tax purposes. These differences result in deferred tax assets which represent future tax benefits to be received when certain expenses previously recognized in the financial statements become deductible expenses under applicable income tax laws, or loss credit carryforwards are utilized.
In assessing the realizability of deferred tax assets, management considers whether it is more likely than not that some portion or all of a deferred tax asset will be realized. The ultimate realization of deferred tax assets is dependent upon the generation of future taxable income during the periods in which those temporary differences become deductible. A valuation allowance is recorded for loss carryforwards and other deferred tax assets where it is more likely than not that such deferred tax assets will not be realized. The Company classifies its net deferred tax assets as other long-term assets and deferred tax liabilities as noncurrent liabilities on its consolidated balance sheet.
Foreign currency
Generally the functional currency of the Company’s international subsidiaries is the local currency. The Company translates the financial statements of these subsidiaries to U.S. dollars using month-end rates of exchange for assets and liabilities, and average rates of exchange for revenue, costs, and expenses. Translation gains and losses are recorded in accumulated other comprehensive income (loss) as a component of stockholders’ equity. Effective July 1, 2016, the Company has established a hedging program using monthly forward exchange contracts as economic hedges to protect against volatility of foreign exchange rate exposure of its net intercompany activities based on a cost-benefit analysis that considers that magnitude of the exposure, the volatility of the exchange rate and the cost of the hedging instruments. The forward contracts are not designated for hedge accounting and are marked to market at fair value and reported as either other current assets or accounts payable. Any changes in the fair value are recorded as foreign exchange gain (loss) and help mitigate the changes in the value of the underlying net intercompany balances. The Company recognized a $2.1 million gain and $1.6 million loss in
67
Table of Contents
NEOPHOTONICS CORPORATION
NOTES TO CONSOLIDATED FINANCIAL STATEMENTS (continued)
2017 and 2016, respectively, relating to its foreign currency contracts within other income, net. Net foreign exchange gain (loss) was ($0.5) million, $(0.1) million, and $3.4 million in 2017, 2016, and 2015, respectively. These gains and losses were recorded as other income (expense), net in the Company’s consolidated statements of operations. The Company presents the cash flows relating to these foreign exchange contracts as investing activities in its consolidated statements of cash flows.
Net income (loss) per share
Basic net income (loss) per share is calculated by dividing net income (loss) by the weighted average number of common shares outstanding for the period. Diluted net income (loss) per share is calculated by dividing net income (loss) by the weighted average number of common shares and potential dilutive common share equivalents outstanding during the period if the effect is dilutive.
Accounting standards update recently adopted
Effective January 1, 2017, the Company adopted ASU 2016-9, Compensation – Stock Compensation (Topic 718): Improvements to Employee Share-Based Payment Accounting (“ASU 2016-9”). ASU 2016-9 simplifies certain aspects of the accounting for shared-based payment transactions, including income taxes, classification of awards and classification in the statement of cash flows. It eliminates the requirement to delay the recognition of excess tax benefits until current taxes payable are reduced. Upon adoption, the Company’s previously unrecognized excess tax benefits of $8.6 million had no impact on its accumulated deficit balance as the related U.S. deferred tax assets were fully offset by a valuation allowance. The Company elected to apply the change in presentation in the statements of cash flows prospectively and elected to continue to account for estimated forfeitures over the vesting period of the share-based awards.
Effective January 1, 2017, the Company also adopted ASU 2015-11, Inventory (Topic 330): Simplifying the Measurement of Inventory (“ASU 2015-11”). ASU 2015-11 requires entities to measure most inventories “at the lower of cost and net realizable value” but does not apply to inventories that are measured by using either the last-in, first-out method or the retail inventory method. The impact on the Company’s consolidated financial statements upon the adoption of this standard was immaterial.
Recent accounting standards update not yet effective
In May 2017, the Financial Accounting Standards Board (“FASB”) issued Accounting Standards Update (“ASU”) No. 2017-9, Compensation—Stock Compensation (718)—Scope of Modification Accounting (ASU 2017-9”). This guidance redefines which changes to the terms and conditions of a share-based payment award require an entity to apply modification accounting for a share-based payment. ASU 2017-9 is effective for interim and annual periods after December 15, 2017 and early adoption is permitted in any interim period. The Company has not yet determined whether it will elect early adoption and has determined that the adoption of this standard will not have a significant impact on its consolidated financial statements and related disclosures.
In March 2017, the FASB issued ASU No. 2017-7, Compensation-Retirement Benefits (Topic 715)-Improving the Presentation of Net Periodic Pension Cost and Net Periodic Postretirement Benefit Cost (“ASU 2017-7”). This guidance revises the presentation of employer-sponsored defined benefit pension and other postretirement plans for the net periodic benefit cost in the statement of operations and requires that the service cost component of net periodic benefit be presented in the same income statement line items as other employee compensation costs for services rendered during the period. The other components of the net benefit costs are required to be presented in the statement of operations separately from the service cost component and outside the subtotal of income from operations. This guidance allows only the service cost component of net periodic benefit costs to be eligible for capitalization. ASU 2017-7 is effective for interim and annual periods after December 15, 2018 and early adoption is permitted as of the beginning of an annual reporting period. The adoption of this standard is not expected to have a material impact on the Company’s consolidated financial statements and related disclosures.
In January 2017, the FASB issued ASU 2017-4, Intangibles-Goodwill and Other (Topic 350): Simplifying the Test for Goodwill Impairment (“ASU 2017-4”). This standard amends the goodwill impairment test to compare the fair value of a reporting unit with its carrying amount and recognize an impairment charge for the amount by which the carrying amount exceeds the reporting unit’s fair value, up to the total amount of goodwill allocated to that reporting unit. ASU 2017-4 is effective prospectively for interim and annual periods beginning after December 15, 2019. Early adoption is permitted for interim and annual goodwill impairment tests performed on testing dates after January 1, 2017. The Company has not determined whether it will elect early adoption and is currently evaluating the impact of the adoption of this standard on its consolidated financial statements and related disclosures.
68
Table of Contents
NEOPHOTONICS CORPORATION
NOTES TO CONSOLIDATED FINANCIAL STATEMENTS (continued)
In January 2017, the FASB issued ASU 2017-1, Business Combinations (Topic 805): Clarifying the Definition of a Business (“ASU 2017-1”). This standard provides a framework in determining when a set of assets and activities is a business. ASU 2017-1 is effective for interim and annual periods beginning after December 15, 2017 on a prospective basis. The adoption of this standard is not expected to have a material impact on the Company’s consolidated financial statements and related disclosures.
In November 2016, the Financial Accounting Standards Board (“FASB”) issued Accounting Standards Update ("ASU") 2016-18, Statement of Cash Flows (Topic 230): Restricted Cash (“ASC 2016-18”). This standard provides guidance on the classification and presentation of restricted cash in the statement of cash flows and must be applied retrospectively. ASU 2016-18 is effective for fiscal years beginning after December 15, 2017. Early adoption is permitted. The adoption of this standard is not expected to have a material impact on the Company’s consolidated financial statements and related disclosures
In October 2016, the FASB issued ASU 2016-16, Income Taxes (Topic 740): Intra-Entity Transfers of Assets Other Than Inventory (“ASU 2016-16”). This standard provides guidance on the tax accounting for the transferring and receiving entities upon transfer of an asset. ASU 2016-16 is effective for the Company’s interim and annual periods beginning after December 15, 2017 and should be applied on a modified retrospective basis. Early adoption is permitted. The adoption of this standard is not expected to have a material impact on the Company’s consolidated financial statements and related disclosures.
In August 2016, the FASB issued ASU 2016-15, Statement of Cash Flows (Topic 230): Classification of Certain Cash Receipts and Cash Payments (“ASU 2016-15”). This standard provides guidance on the classification of certain cash receipts and payments in the statement of cash flows. It is effective, retrospectively, for the Company’s annual and interim reporting periods beginning after December 15, 2017 or prospectively from the earliest date practicable if retrospective application is impracticable. Early adoption is permitted. The adoption of this standard is not expected to have a material impact on the Company’s consolidated financial statements and related disclosures.
In June 2016, the FASB issued ASU 2016-13, Financial Instruments – Credit Losses (Topic 326): Measurement of Credit Losses on Financial Instruments (“ASU 2016-13”). ASU 2016-13 amends existing guidance on the impairment of financial assets and adds an impairment model that is based on expected losses rather than incurred losses and requires an entity to recognize as an allowance its estimate of expected credit losses for its financial assets. An entity will apply this guidance through a cumulative-effect adjustment to retained earnings upon adoption (a modified-retrospective approach) while a prospective transition approach is required for debt securities for which an other-than-temporary impairment had been recognized before the effective date. It is effective for the Company’s annual and interim reporting periods beginning after December 15, 2019. Early adoption is permitted. The Company is in the process of evaluating the impact of the adoption on its consolidated financial statements and related disclosure.
In February 2016, the FASB issued ASU 2016-2, Leases (Topic 842) (“ASU 2016-2”). ASU 2016-2 introduces a lessee model that requires recognition of assets and liabilities arising from qualified leases on the consolidated balance sheets and consolidated statements of operations and to disclose qualitative and quantitative information about lease transactions. It is effective for interim and annual periods beginning after December 15, 2018. Early adoption is permitted. A modified retrospective transition is required with certain optional practical expedients allowed. The Company is in the process of evaluating the impact of the adoption on its consolidated financial statements and related disclosure.
In January 2016, the FASB issued ASU 2016-1, Financial Instruments - Overall (Subtopic 825-10): Recognition and Measurement of Financial Assets and Financial Liabilities (“ASU 2016-1”). ASU 2016-1 revises an entity’s accounting related to (1) the classification and measurement of investments in equity securities and (2) the presentation of certain fair value changes for financial liabilities measured at fair value. It also amends certain disclosure requirements associated with the fair value of financial instruments and is effective for the Company’s annual and interim reporting periods beginning after December 15, 2017. Early adoption is permitted. The adoption of this standard is not expected to have a material impact on the Company’s consolidated financial statements and related disclosures.
In May 2014, the FASB issued ASU No. 2014-9, Revenue from Contracts with Customers (“ASU 2014-9”). The standard, along with the amendments issued in 2016 and 2015, provides companies with a single model for use in accounting for revenue arising from contracts with customers and supersedes current revenue recognition guidance, including industry-specific revenue guidance. The core principle of the model is to recognize revenue when control of the goods or services transfers to the customer, as opposed to recognizing revenue when the risks and rewards transfer to the customer under the existing revenue guidance. ASU 2014-9 is required to be adopted, using either of two methods: (i) retrospective to each prior reporting period presented with the option to elect certain practical expedients as defined within ASU 2014-9; or (ii) retrospective with the cumulative effect of initially applying ASU 2014-9 recognized at the date of initial application and providing certain additional disclosures. This standard, as amended, is effective for annual and interim periods beginning after December 15, 2017 and
69
Table of Contents
NEOPHOTONICS CORPORATION
NOTES TO CONSOLIDATED FINANCIAL STATEMENTS (continued)
permits entities to early adopt for annual and interim reporting periods beginning after December 15, 2016. The Company will adopt this standard in the first quarter of 2018, using the full retrospective transition method. We have substantially completed our analysis and the adoption of this guidance will not have a material impact on our consolidated financial statements and our internal controls over financial reporting.
3. Cash, cash equivalents, short-term investments and restricted cash
The following table summarizes the Company’s cash, cash equivalents, short-term investments, and restricted cash at December 31, 2017 and 2016 (in thousands):
December 31, 2017 | December 31, 2016 | ||||||
Cash and cash equivalents: | |||||||
Cash | $ | 78,906 | 58,691 | ||||
Cash equivalents | — | 23,809 | |||||
Cash and cash equivalents | $ | 78,906 | $ | 82,500 | |||
Short-term investments | $ | 12,311 | $ | 19,015 | |||
Restricted cash | $ | 2,658 | $ | 4,085 | |||
The following table summarizes the Company’s unrealized gains and losses related to the cash equivalents and short-term investments in marketable securities designated as available-for-sale (in thousands):
As of December 31, 2017 | As of December 31, 2016 | ||||||||||||||||||||||||||||||
Amortized Cost | Gross Unrealized Gains | Gross Unrealized Loss | Fair Value | Amortized Cost | Gross Unrealized Gains | Gross Unrealized Loss | Fair Value | ||||||||||||||||||||||||
Marketable securities: | |||||||||||||||||||||||||||||||
Money market accounts | $ | — | $ | — | $ | — | $ | — | $ | 23,809 | $ | — | $ | — | $ | 23,809 | |||||||||||||||
Money market funds | 11,561 | — | — | 11,561 | 199 | — | — | 199 | |||||||||||||||||||||||
Corporate debt securities | — | — | — | — | 9,438 | 4 | (3 | ) | 9,439 | ||||||||||||||||||||||
Government agency securities | — | — | — | — | 3,767 | — | (10 | ) | 3,757 | ||||||||||||||||||||||
U.S. government securities | 751 | — | (1 | ) | 750 | 5,008 | — | (10 | ) | 4,998 | |||||||||||||||||||||
Sovereign government bonds | — | — | — | — | 622 | — | — | 622 | |||||||||||||||||||||||
Total | $ | 12,312 | $ | — | $ | (1 | ) | $ | 12,311 | $ | 42,843 | $ | 4 | $ | (23 | ) | $ | 42,824 | |||||||||||||
Reported as: | |||||||||||||||||||||||||||||||
Cash equivalents | $ | — | $ | — | $ | — | $ | — | $ | 23,809 | $ | — | $ | — | $ | 23,809 | |||||||||||||||
Short-term investments | 12,312 | — | (1 | ) | 12,311 | 19,034 | 4 | (23 | ) | 19,015 | |||||||||||||||||||||
Total | $ | 12,312 | $ | — | $ | (1 | ) | $ | 12,311 | $ | 42,843 | $ | 4 | $ | (23 | ) | $ | 42,824 | |||||||||||||
As of December 31, 2017 and 2016, maturities of marketable securities were as follows (in thousands):
December 31, 2017 | December 31, 2016 | ||||||
Less than 1 year | $ | 12,311 | $ | 36,054 | |||
Due in 1 to 2 years | — | 6,468 | |||||
Due in 3 to 5 years | — | 302 | |||||
Total | $ | 12,311 | $ | 42,824 | |||
Realized gains and losses on the sale of marketable securities during the years ended December 31, 2017, 2016 and 2015 were immaterial. The Company did not recognize any impairment losses on its marketable securities during the years ended
70
Table of Contents
NEOPHOTONICS CORPORATION
NOTES TO CONSOLIDATED FINANCIAL STATEMENTS (continued)
December 31, 2017, 2016 or 2015. As of December 31, 2017, the Company did not have any investments in marketable securities that were in an unrealized loss position for a period in excess of 12 months.
4. Fair value measurements
Assets and Liabilities Measured at Fair Value on a Recurring Basis
The following table presents the Company’s assets that are measured at fair value on a recurring basis (in thousands):
December 31, 2017 | December 31, 2016 | ||||||||||||||||||||||||||||||
Level 1 | Level 2 | Level 3 | Total | Level 1 | Level 2 | Level 3 | Total | ||||||||||||||||||||||||
Cash equivalents and short-term investments: | |||||||||||||||||||||||||||||||
Money market funds | $ | 11,561 | $ | — | $ | — | $ | 11,561 | $ | 199 | $ | — | $ | — | $ | 199 | |||||||||||||||
U.S. government securities | 750 | — | — | 750 | 4,998 | — | — | 4,998 | |||||||||||||||||||||||
Money market accounts | — | — | — | — | — | 23,809 | — | 23,809 | |||||||||||||||||||||||
Corporate debt securities | — | — | — | — | — | 9,439 | — | 9,439 | |||||||||||||||||||||||
Government agency securities | — | — | — | — | — | 3,757 | — | 3,757 | |||||||||||||||||||||||
Sovereign government bonds | — | — | — | — | — | 622 | — | 622 | |||||||||||||||||||||||
Total | $ | 12,311 | $ | — | $ | — | $ | 12,311 | $ | 5,197 | $ | 37,627 | $ | — | $ | 42,824 | |||||||||||||||
Mutual funds held in Rabbi Trust, recorded in other long-term assets | $ | 523 | $ | — | $ | — | $ | 523 | $ | 622 | $ | — | $ | — | $ | 622 | |||||||||||||||
The Company offers a Non-Qualified Deferred Compensation Plan (“NQDC Plan”) to a select group of its highly compensated employees to provide participants the opportunity to defer payment of certain compensation as defined in the NQDC Plan. A Rabbi Trust has been established to fund the NQDC Plan obligation, which was fully funded as of December 31, 2017 and 2016. The assets held by the Rabbi Trust are in the form of exchange traded mutual funds and are included in the Company’s other long-term assets on its consolidated balance sheets as of December 31, 2017 and 2016. Level 1 assets are determined by using quoted prices in active markets for identical assets. The fair values of Level 2 assets are priced based on quoted market prices for similar instruments or non-binding market prices that are corroborated by observable market data using inputs such as benchmark yields, broker quotes and other similar data.
The following table presents the Company’s liabilities that are measured at fair value on a recurring basis (in thousands):
As of December 31, 2017 | As of December 31, 2016 | ||||||||||||||||||||||||||||||
Level 1 | Level 2 | Level 3 | Total | Level 1 | Level 2 | Level 3 | Total | ||||||||||||||||||||||||
Rusnano payment derivative | $ | — | $ | — | $ | 389 | $ | 389 | $ | — | $ | — | $ | 389 | $ | 389 | |||||||||||||||
Foreign currency forward contracts | — | (43 | ) | — | (43 | ) | — | 41 | — | 41 | |||||||||||||||||||||
$ | — | $ | (43 | ) | $ | 389 | $ | 346 | $ | — | $ | 41 | $ | 389 | $ | 430 | |||||||||||||||
The fair value of the Rusnano payment derivative is based on the Company’s estimate (see Note 13). The fair values of the foreign currency forward contracts are based on quoted market rates and market observable data for similar instruments. There were no transfers between levels of the fair value hierarchy during the periods presented.
Assets and Liabilities Measured at Fair Value on a Nonrecurring Basis
In 2017 and 2016, there were no assets or liabilities measured at fair value on a nonrecurring basis. In 2015, the Company wrote off $0.2 million of property, plant and equipment and $0.2 million of held-for-sale assets recognized and recognized asset impairment charges of $0.4 million within operating expenses (Level 3). These assets were measured at fair value due to events or circumstances the Company identified as having significant impact on their fair value during the respective periods. To arrive at the valuation of these assets, the Company considered the discounted cash flows and categorized the fair value measurement as Level 3 as significant unobservable inputs were used in the valuation.
Assets and Liabilities Not Measured at Fair Value
71
Table of Contents
NEOPHOTONICS CORPORATION
NOTES TO CONSOLIDATED FINANCIAL STATEMENTS (continued)
The carrying values of cash, restricted cash, accounts receivable, accounts payable, notes payable and short-term borrowing approximate their fair values due to the short-term nature and liquidity of these financial instruments.
The fair value of the Company’s long-term debt have been calculated using an estimate of the interest rate the Company would have had to pay on the issuance of liabilities with a similar maturity and discounting the cash flows at that rate which it considers to be a level 2 fair value measurement and was not materially different than the carrying value as of December 31, 2017 and 2016 as the interest rates approximated rates currently available to the Company. The fair values do not necessarily give an indication of the amount that the Company would currently have to pay to extinguish any of this debt.
5. Net income (loss) per share
The following table sets forth the computation of the basic and diluted net income (loss) per share attributable to NeoPhotonics Corporation common stockholders for the periods indicated (in thousands, except per share amounts):
Years Ended December 31, | |||||||||||
2017 | 2016 | 2015 | |||||||||
Numerator: | |||||||||||
Net income (loss) | $ | (53,333 | ) | $ | (205 | ) | $ | 3,668 | |||
Denominator: | |||||||||||
Weighted average shares used to compute per share amount: | |||||||||||
Basic | 43,431 | 41,798 | 37,421 | ||||||||
Dilutive effect of equity awards | — | — | 1,265 | ||||||||
Diluted | 43,431 | 41,798 | 38,686 | ||||||||
Basic net income (loss) per share | $ | (1.23 | ) | (0.00) | $ | 0.10 | |||||
Diluted net income (loss) per share | $ | (1.23 | ) | (0.00) | $ | 0.09 | |||||
The Company has excluded the impact of the following outstanding employee stock options, restricted stock units, common stock warrants and shares expected to be issued under its employee stock purchase plan from the computation of diluted net income (loss) per share, as their effect would have been antidilutive (in thousands):
December 31, | ||||||||
2017 | 2016 | 2015 | ||||||
Employee stock options | 3,934 | 4,301 | 2,176 | |||||
Restricted stock units | 2,405 | 2,089 | 954 | |||||
Employee stock purchase plan | 421 | 306 | 318 | |||||
6,760 | 6,696 | 3,448 | ||||||
6. Business Combinations
EMCORE Corporation
On January 2, 2015, the Company closed an acquisition of certain assets and assumed certain liabilities of the tunable laser product lines of EMCORE Corporation (“EMCORE”) for an original purchase price of $17.5 million, pursuant to the terms of the Asset Purchase Agreement between the parties dated October 22, 2014. Consideration for the transaction consisted of $1.5 million in cash and a promissory note (the “EMCORE Note”) of approximately $16.0 million, which was subsequently adjusted to $15.5 million in connection with a True-Up Confirmation Agreement (the “True-Up Agreement”) executed by and between the Company and EMCORE on April 16, 2015. The final adjusted purchase price for the acquisition was approximately $17.0 million.
The Company accounted for this acquisition as a business combination. With the acquisition of the EMCORE ultra narrow linewidth tunable laser products, the Company aims to strengthen its portfolio of High Speed Products.
In connection with the acquisition, the Company incurred approximately $0.9 million in total acquisition-related costs related to legal, accounting and other professional services. The acquisition costs were expensed as incurred and included in operating expenses in the Company’s consolidated statement of operations.
72
Table of Contents
NEOPHOTONICS CORPORATION
NOTES TO CONSOLIDATED FINANCIAL STATEMENTS (continued)
The fair values assigned to intangible assets acquired were based on valuations using estimates and assumptions provided by management, with the assistance of an independent third party appraisal firm. The excess purchase price over those fair values was recorded as goodwill. The Company used best estimates and assumptions as part of the purchase price allocation process to value assets acquired and liabilities assumed at the acquisition date and during the Company’s process of obtaining further information, further refined estimates and assumptions, including the acquired property, plant and equipment, prepaid and other current assets, which primarily consisted of held-for-sale assets and accounts payable. As a result, during the measurement period completed in 2015, the Company recorded adjustments related to the acquired net accounts receivable, the acquired net inventories, the assumed sales tax accrual and the acquired prepaid expenses and other current assets by immaterial amounts, and decreased goodwill by a corresponding net amount. Goodwill recorded consisted of a valuable assembled workforce and market synergy. The amounts assigned to goodwill are deductible for income tax purposes.
The following table summarizes the allocation of the assets acquired and liabilities assumed as of the acquisition date and subsequent adjustments (in thousands):
Total purchase consideration: | |||
Cash paid | $ | 1,500 | |
Notes payable | 15,482 | ||
Total | $ | 16,982 | |
Fair value of assets acquired: | |||
Accounts receivable | $ | 9,274 | |
Inventories | 1,693 | ||
Prepaid expenses and other current assets | 670 | ||
Property, plant and equipment | 6,917 | ||
Intangible assets acquired: | |||
Developed technology | 4,100 | ||
Customer relationships | 700 | ||
Total | $ | 23,354 | |
Less: fair value of liabilities assumed: | |||
Accounts payable | $ | (7,427 | ) |
Accrued liabilities | (60 | ) | |
Total | $ | (7,487 | ) |
Goodwill | $ | 1,115 | |
Purchased intangibles with finite lives will be amortized on a straight-line basis over their respective estimated useful lives. The following table presents details of the purchase price allocated to the acquired intangible assets at the acquisition date:
Useful Life | Purchased intangible assets | ||||
(In years) | (In thousands) | ||||
Developed technology | 7 | $ | 4,100 | ||
Customer relationships | 2 | 700 | |||
Total purchased intangible assets | $ | 4,800 | |||
73
Table of Contents
NEOPHOTONICS CORPORATION
NOTES TO CONSOLIDATED FINANCIAL STATEMENTS (continued)
The following unaudited supplemental pro forma information presents the combined results of operations of NeoPhotonics Corporation for the periods presented as though the companies had been combined as of the beginning of 2014. In the year ended December 31, 2017, 2016 and 2015, revenue related to products acquired from EMCORE was approximately $96.0 million, $80.8 million and $55.8 million, respectively. The pro forma financial information reflects adjustments related to transaction costs of $0.3 million and $0.6 million in the years ended December 31, 2015 and 2014, respectively, as well as immaterial employee expense in the year ended December 31, 2015. Incremental intangible amortization, inventory and depreciation adjustments were also added to the 2014 period. There were no sales between the business acquired from EMCORE and the Company in the periods presented. The unaudited pro forma results do not assume any operating efficiencies as a result of the consolidation of operations (in thousands, except per share data):
Years Ended December 31, | |||||||
2015 | 2014 | ||||||
Revenue | $ | 339,439 | $ | 353,003 | |||
Net income (loss) | $ | 4,088 | $ | (23,221 | ) | ||
Basic net income (loss) per share | $ | 0.11 | $ | (0.72 | ) | ||
Diluted net income (loss) per share | $ | 0.11 | $ | (0.72 | ) | ||
EigenLight Corporation
In November 2015 the Company closed an acquisition of the business and products of EigenLight Corporation for cash consideration of $0.4 million in an asset transaction. The Company accounted for this as a business combination and the majority of the purchase price was allocated to inventory and property, plant and equipment.
7. Purchased intangible assets
Purchased intangible assets consist of the following (in thousands):
December 31, 2017 | December 31, 2016 | ||||||||||||||||||||||
Gross Assets | Accumulated Amortization | Net Assets | Gross Assets | Accumulated Amortization | Net Assets | ||||||||||||||||||
Technology and patents | $ | 37,684 | $ | (34,923 | ) | $ | 2,761 | $ | 36,918 | $ | (33,316 | ) | $ | 3,602 | |||||||||
Customer relationships | 15,425 | (14,835 | ) | 590 | 15,039 | (13,990 | ) | 1,049 | |||||||||||||||
Leasehold interest | 1,309 | (366 | ) | 943 | 1,226 | (315 | ) | 911 | |||||||||||||||
$ | 54,418 | $ | (50,124 | ) | $ | 4,294 | $ | 53,183 | $ | (47,621 | ) | $ | 5,562 | ||||||||||
Amortization expense relating to technology and patents and the leasehold interest intangible assets is included within cost of goods sold, and customer relationships and the non-compete agreements within operating expenses. The following table presents details of the amortization expense of the Company’s purchased intangible assets as reported in the consolidated statements of operations (in thousands):
Years ended December 31, | |||||||||||
2017 | 2016 | 2015 | |||||||||
Cost of goods sold | $ | 869 | $ | 2,871 | $ | 3,349 | |||||
Operating expenses | 472 | 1,609 | 1,791 | ||||||||
Total | $ | 1,341 | $ | 4,480 | $ | 5,140 | |||||
The estimated future amortization expense of purchased intangible assets as of December 31, 2017, is as follows (in thousands):
74
Table of Contents
NEOPHOTONICS CORPORATION
NOTES TO CONSOLIDATED FINANCIAL STATEMENTS (continued)
2018 | $ | 1,208 | |
2019 | 807 | ||
2020 | 689 | ||
2021 | 689 | ||
2022 | 103 | ||
Thereafter | 798 | ||
$ | 4,294 | ||
8. Balance sheet components
Restricted Cash
Restricted cash was as follows (in thousands):
December 31, | |||||||
2017 | 2016 | ||||||
Restricted in connection with notes payable and short-term borrowing (see Note 11) | $ | 2,658 | $ | 2,098 | |||
Restricted in connection with asset purchase agreement (see Note 9) | — | 1,987 | |||||
Total restricted cash | $ | 2,658 | $ | 4,085 | |||
Reported as: | |||||||
Restricted cash | $ | 2,658 | $ | 4,085 | |||
Accounts receivable, net
Accounts receivable, net were as follows (in thousands):
December 31, | |||||||
2017 | 2016 | ||||||
Accounts receivable | $ | 65,499 | $ | 78,143 | |||
Trade notes receivable | 2,356 | 2,892 | |||||
Allowance for doubtful accounts | (626 | ) | (425 | ) | |||
$ | 67,229 | $ | 80,610 | ||||
The table below summarizes the movement in the Company’s allowance for doubtful accounts (in thousands):
Balance at December 31, 2014 | $ | (241 | ) |
Provision for bad debt | (640 | ) | |
Write-offs, net of recoveries | 38 | ||
Balance at December 31, 2015 | (843 | ) | |
Reversal of provision for bad debt | 382 | ||
Write-offs, net of recoveries | 36 | ||
Balance at December 31, 2016 | (425 | ) | |
Provision for bad debt | (577 | ) | |
Write-offs, net of recoveries | 376 | ||
Balance at December 31, 2017 | $ | (626 | ) |
Inventories
Inventories were as follows (in thousands):
75
Table of Contents
NEOPHOTONICS CORPORATION
NOTES TO CONSOLIDATED FINANCIAL STATEMENTS (continued)
December 31, | |||||||
2017 | 2016 | ||||||
Raw materials | $ | 33,400 | $ | 23,348 | |||
Work in process | 13,246 | 10,996 | |||||
Finished goods(1) | 20,655 | 13,893 | |||||
$ | 67,301 | $ | 48,237 | ||||
(1) Included in finished goods was $7.1 million and $8.3 million of inventory at customer vendor managed inventory locations at December 31, 2017 and 2016, respectively.
Prepaid expenses and other current assets
Prepaid expenses and other current assets were as follows (in thousands):
December 31, | |||||||
2017 | 2016 | ||||||
Prepaid taxes and taxes receivable | $ | 15,162 | $ | 16,102 | |||
Transition services agreement receivable (see Note 9) | 12,817 | — | |||||
Deposits and other prepaid expenses | 4,138 | 3,571 | |||||
Other receivable | 4,118 | 2,723 | |||||
$ | 36,235 | $ | 22,396 | ||||
Property, plant and equipment, net
Property, plant and equipment, net were as follows (in thousands):
December 31, | |||||||
2017 | 2016 | ||||||
Land | $ | 3,083 | $ | 2,847 | |||
Buildings | 24,102 | 22,107 | |||||
Machinery and equipment | 189,527 | 160,314 | |||||
Furniture, fixtures, software and office equipment | 9,948 | 8,413 | |||||
Leasehold improvements | 26,007 | 14,541 | |||||
252,667 | 208,222 | ||||||
Less: Accumulated depreciation | (125,102 | ) | (101,355 | ) | |||
$ | 127,565 | $ | 106,867 | ||||
Depreciation expense was $27.0 million, $17.9 million and $17.7 million for the years ended December 31, 2017, 2016 and 2015, respectively. In 2017, the Company wrote off certain leasehold improvements in its facilities in California and recorded a restructuring charge of $0.1 million in connection with the Company’s restructuring actions. Purchases of property, plant and equipment unpaid as of December 31, 2017, 2016 and 2015 was $10.0 million, $16.1 million and $2.5 million, respectively.
76
Table of Contents
NEOPHOTONICS CORPORATION
NOTES TO CONSOLIDATED FINANCIAL STATEMENTS (continued)
Accrued and other current liabilities
Accrued and other current liabilities were as follows (in thousands):
December 31, | |||||||
2017 | 2016 | ||||||
Employee-related | $ | 12,990 | $ | 18,654 | |||
Transition services agreement payables (see Note 9) | 11,222 | — | |||||
Asset sale related contingent liabilities (see Note 9) | 7,135 | — | |||||
Income and other taxes payable | 542 | 3,956 | |||||
Deferred revenue, current | 939 | 956 | |||||
Accrued warranty | 1,334 | 678 | |||||
Rusnano payment derivative | — | 389 | |||||
Other accrued expenses | 9,080 | 5,992 | |||||
$ | 43,242 | $ | 30,625 | ||||
Accrued warranty
The table below summarizes the movement in the warranty accrual, which is included in accrued and other current liabilities (in thousands):
Years ended December 31, | |||||||||||
2017 | 2016 | 2015 | |||||||||
Beginning balance | $ | 678 | $ | 1,175 | $ | 1,751 | |||||
Warranty accruals | 1,263 | 102 | 79 | ||||||||
Settlements | (607 | ) | (599 | ) | (655 | ) | |||||
Ending balance | $ | 1,334 | $ | 678 | $ | 1,175 | |||||
Other noncurrent liabilities
Other noncurrent liabilities were as follows (in thousands):
December 31, | |||||||
2017 | 2016 | ||||||
Pension and other employee-related | $ | 4,675 | $ | 5,045 | |||
Deferred rent | 2,908 | 1,509 | |||||
Deferred revenue | 617 | 136 | |||||
Government grant | 1,095 | 1,048 | |||||
Rusnano payment derivative | 389 | — | |||||
Deferred income tax liabilities | 106 | 46 | |||||
Asset retirement obligations and other | 4,285 | 1,155 | |||||
$ | 14,075 | $ | 8,939 | ||||
9. Asset sale
In January 2017, the Company completed the sale of its Low Speed Transceiver Products’ assets to APAT OE pursuant to an asset purchase agreement dated December 14, 2016 for consideration of approximately $25.0 million (in RMB equivalent) plus approximately $1.4 million (in RMB equivalent) post-closing transaction service fees to be received under a transition services agreement with APAT OE in which the Company will provide short-term manufacturing and other specific services pursuant to such agreement. The related supply chain purchase commitments and value-added tax obligations have been assumed by APAT OE. The receivable and payable balances related to the transition service arrangement were $12.8 million and $11.2 million, respectively, as of December 31, 2017.
77
Table of Contents
NEOPHOTONICS CORPORATION
NOTES TO CONSOLIDATED FINANCIAL STATEMENTS (continued)
As of December 31, 2016, the balance in assets held for sale was $13.9 million, consisting of $13.1 million in inventories and $0.8 million in property, plant and equipment. As a result of post-closing adjustments, total consideration was reduced by approximately $3.4 million for inventory. In addition, an immaterial amount of property, plant and equipment was reclassified from assets held for sale. Upon closing, assets sold to APAT OE were approximately $12.8 million, including approximately $12.1 million in inventories and $0.7 million in property, plant and equipment. The adjusted consideration received of approximately $21.6 million is subject to further reduction of up to $10.0 million for any indemnification claims. As of December 31, 2017, the Company has a reserve of $7.1 million within accrued and other current liabilities for warranty claims. The indemnification warranties expired on June 30, 2017. The Company recognized a $2.2 million gain on the sale of these assets within operating loss in 2017.
All of the Low Speed Transceiver Products were part of the Company’s Network Products and Solution product group and included the low speed optical network (PON) products for which the end-of-life plan was announced in mid-2016.
10. Restructuring
In 2017, the Company initiated restructuring actions in order to focus on key growth initiatives and a lower break even revenue level through lower operating expenses and manufacturing costs. Actions included a reduction in force, facilities consolidation and certain asset-related adjustments. The Company recorded $0.8 million and $3.9 million in restructuring charges within cost of goods sold and operating expenses in 2017, respectively. Additionally, the Company recorded a charge of $2.0 million to cost of goods sold in 2017 for discontinued product inventory write-downs related the Company's decisions to end-of-life certain products. There were no restructuring charges in 2016. There were no restructuring liabilities as of December 31, 2016.
Employee Severance | Facilities Consolidation | Asset-Related | Total | ||||||||||||
Restructuring obligations December 31, 2016 | $ | — | $ | — | $ | — | $ | — | |||||||
Charges | 2,308 | 2,003 | 434 | 4,745 | |||||||||||
Cash payments | (2,308 | ) | (310 | ) | (177 | ) | (2,795 | ) | |||||||
Non-cash settlements and other | — | (113 | ) | (214 | ) | (327 | ) | ||||||||
Restructuring obligations December 31, 2017 | $ | — | $ | 1,580 | $ | 43 | $ | 1,623 | |||||||
78
Table of Contents
NEOPHOTONICS CORPORATION
NOTES TO CONSOLIDATED FINANCIAL STATEMENTS (continued)
11. Debt
The table below summarizes the carrying amount and weighted average interest rate of the Company’s debt (in thousands, except percentages):
December 31, 2017 | December 31, 2016 | ||||||||||||
Carrying Amount | Interest Rate | Carrying Amount | Interest Rate | ||||||||||
Note payable to Pudong Bank | $ | 17,000 | 4.10 | % | $ | — | — | ||||||
Note payable to CITIC Bank | $ | 17,000 | 4.00 | % | $ | — | — | ||||||
Notes payable to suppliers | $ | 1,607 | $ | 6,390 | — | ||||||||
Short-term borrowing under Comerica Bank Credit Facility | — | 23,800 | 3.37 | % | |||||||||
Total notes payable and short-term borrowing | $ | 35,607 | $ | 30,190 | |||||||||
Long-term debt, current and non-current: | |||||||||||||
Borrowing under Wells Fargo Credit Facility | $ | 30,018 | 3.29 | % | $ | — | |||||||
Mitsubishi Bank loans | $ | 16,924 | 1.05% -1.45% | $ | 11,253 | 1.43 | % | ||||||
Unaccreted discount and issuance costs within current portion of long-term debt | (86 | ) | (108 | ) | |||||||||
Unaccreted discount and issuance costs within long-term debt, net of current portion | (295 | ) | (183 | ) | |||||||||
Total long-term debt, net of unaccreted discount and issuance costs | $ | 46,561 | $ | 10,962 | |||||||||
Reported as: | |||||||||||||
Current portion of long-term debt | $ | 6,005 | $ | 747 | |||||||||
Long-term debt, net of current portion | 40,556 | 10,215 | |||||||||||
Total long-term debt, net of unaccreted discount and issuance costs | $ | 46,561 | $ | 10,962 | |||||||||
Notes payable
The Company regularly issues notes payable to its suppliers in China. These notes are supported by non-interest bearing bank acceptance drafts issued under the Company’s existing line of credit facilities and are due three to six months after issuance. As a condition of the notes payable arrangements, the Company is required to keep a compensating balance at the issuing banks that is a percentage of the total notes payable balance until the amounts are settled. As of December 31, 2017, the Company’s subsidiary in China had three, line of credit facilities with banking institutions:
• | Under the first line of credit facility with Pudong Bank, the Company can borrow up to RMB 120.0 million ($18.4 million) for short-term loans at varying interest rates, or up to approximately RMB 171.4 million ($26.3 million) for bank acceptance drafts (with a 30% compensating balance requirement). This line of credit facility expires in July 2019. In November 2017, the Company borrowed $17.0 million under this line which bears interest at 4.1% and will mature in May 2018. |
• | Under the second line of credit facility with Pudong Bank, which expires in July 2019, the Company can borrow up to RMB 30.0 million ($4.6 million) for short-term loans at varying interest rates, or up to approximately RMB 42.9 million ($6.6 million) for bank acceptance drafts (with a 30% compensating balance requirement). |
• | In December 2017, the Company's subsidiary in China entered into a third line of credit facility with CITIC Bank in China, which expires in November 2018. The purpose of the credit facility is to provide short-term borrowings, bank acceptance drafts and letters of credits. Under this credit facility, the Company can borrow up to approximately RMB 250 million ($38.4 million) at varying interest rates. |
The Company had another line of credit facility with CITIC Bank in China which expired during September 2017. In July 2017, the Company borrowed $17.0 million under this line which bore interest at LIBOR plus 2.55%. The amount of $17.0 million under this line was repaid to CITIC Bank in January 2018.
79
Table of Contents
NEOPHOTONICS CORPORATION
NOTES TO CONSOLIDATED FINANCIAL STATEMENTS (continued)
Under these line of credit facilities, the non-interest bearing bank acceptance drafts issued in connection with the Company's notes payable to its suppliers in China, had an outstanding balance of $1.6 million and $6.4 million as of December 31, 2017 and December 31, 2016, respectively. In addition to the outstanding notes payable, three letters of credit totaling $1.6 million were issued to its suppliers in 2016 for equipment purchases delivered by December 2016. These letters of credit required a 30% compensating balance. As of December 31, 2016, the outstanding balance of these letters of credit was immaterial and was fully repaid as of December 31, 2017. The total amount available for short-term borrowings under these line of credit facilities as of December 31, 2017 was $43.4 million.
As of December 31, 2017 and December 31, 2016, compensating balances relating to bank acceptance drafts and letters of credit issued to suppliers and the Company's subsidiaries totaled $0.5 million and $2.1 million, respectively. Compensating balances are classified as restricted cash on the Company’s consolidated balance sheets.
Credit Facilities
The Company had a credit agreement, as amended with the Comerica Bank as lead bank in the U.S. (the “Comerica Bank Credit Facility”) with a borrowing capacity to $30.0 million. In January 2017, the Company amended the Comerica Bank Credit Facility to extend the maturity to April 30, 2017 and to remove the financial covenant related to EBDITA. In April 2017, the Company amended the Comerica Bank Credit Facility to extend the maturity date to July 31, 2017 and to add a financial covenant that required maintenance of a modified EBITDA. In June 2017, the Company amended the Comerica Bank Credit Facility to extend the maturity to August 31, 2017, to allow NeoPhotonics China to borrow up to $17.0 million, to limit the indebtedness under the facility to $20.0 million and to modify the EBITDA requirement. In August 2017, the Credit Facility was further amended to extend the maturity to September 30, 2017. As of December 31, 2016, the Company was in compliance with the covenants of the credit facility except for exceeding the capital expenditure limit as of December 31, 2016 for which a waiver was obtained subsequent to the year end.
Borrowings under the Comerica Bank Credit Facility bore interest at an interest rate option of a base rate as defined in the agreement plus 1.75% or LIBOR plus 2.75%. The base rate was the greater of (a) the effective prime rate, (b) the Federal Funds effective rate plus one percent, and (c) the daily adjusting LIBOR rate plus one percent. The outstanding balance was $23.8 million as of December 31, 2016 and the rate on the LIBOR option was 3.37%.
In September 2017, the Company entered into a revolving line of credit agreement with Wells Fargo as the administrative agent for a lender group (the "Wells Fargo Credit Facility" or "Credit Facility"), and the amount outstanding under the Comerica Bank Credit Facility was paid in full.
The Wells Fargo Credit Facility provides for borrowings equal to the lower of (a) a maximum revolver amount of $50.0 million, or (b) an amount equal to 80% - 85% of eligible accounts receivable plus 100% of qualified cash balances up to $15.0 million, less certain discretionary adjustments ("Borrowing Base"). The maximum revolver amount may be increased by up to $25.0 million, subject to certain conditions. At closing, $50.0 million was available, of which $30.0 million was drawn. The Company used $20.0 million of this amount to pay the principal and interest due under the Comerica Bank Credit Facility, which has since been terminated.
The Credit Facility matures on June 30, 2022 and borrowings bear interest at an interest rate option of either (a) the LIBOR rate, plus an applicable margin ranging from 1.50% to 1.75% per annum, or (b) the prime lending rate, plus an applicable margin ranging from 0.50% to 0.75% per annum. The Company is also required to pay a commitment fee equal to 0.25% of the unused portion of the Credit Facility.
The Credit Facility agreement ("Agreement") requires prepayment of the borrowings to the extent the outstanding balance is greater than the lesser of (a) the most recently calculated Borrowing Base, or (b) the maximum revolver amount. The Company is required to maintain a combination of certain defined cash balances and unused borrowing capacity under the Credit Facility of at least $20.0 million, of which at least $5.0 million shall include unused borrowing capacity. The Agreement also restricts the Company's ability to dispose of assets, permit change in control, merge or consolidate, make acquisitions, incur indebtedness, grant liens, make investments and make certain restricted payments. Borrowings under the Credit Facility are collateralized by substantially all of the Company's assets. The Company was in compliance with the covenants of this Credit Facility as of December 31, 2017. As of December 31, 2017, the outstanding balance under the Credit Facility was $30.0 million and the weighted average rate under the LIBOR option was 3.29% The remaining borrowing capacity as of December 31, 2017 was $20.0 million, of which $5.0 million is required to be maintained as unused borrowing capacity.
Acquisition-related
80
Table of Contents
NEOPHOTONICS CORPORATION
NOTES TO CONSOLIDATED FINANCIAL STATEMENTS (continued)
In 2015, the Company repaid in full the $15.5 million note issued for the acquisition of the tunable laser products of EMCORE in January 2015 as well as the remaining balance of the 1,050 million Japanese Yen (the “JPY”) loan issued for the acquisition of NeoPhotonics Semiconductor in March 2013.
Mitsubishi Bank Loans
On February 25, 2015, the Company entered into certain loan agreements and related agreements with the Bank of Tokyo-Mitsubishi UFJ, Ltd. (the "Mitsubishi Bank") that provided for (i) a term loan in the aggregate principal amount of 500 million Japanese Yen (the “JPY”) ($4.4 million) (the “Term Loan A”) and (ii) a term loan in the aggregate principal amount of one billion JPY ($8.9 million) (the “Term Loan B” and together with the Term Loan A, the “2015 Mitsubishi Bank Loans”). The Mitsubishi Bank Loans are secured by a mortgage on certain real property and buildings owned by our Japanese subsidiary. Interest on the 2015 Mitsubishi Bank Loans accrues and is paid monthly based upon the annual rate of the monthly Tokyo Interbank Offer Rate (TIBOR) plus 1.40%. The Term Loan A requires interest only payments until the maturity date of February 23, 2018, with a lump sum payment of the aggregate principal amount on the maturity date. The Term Loan B requires equal monthly payments of principal equal to 8,333,000 JPY until the maturity date of February 25, 2025, with a lump sum payment of the balance of 8,373,000 JPY on the maturity date. Interest on the Term Loan B is accrued based upon monthly TIBOR plus 1.40% and is secured by real estate collateral. In conjunction with the execution of the Bank Loans, the Company paid a loan structuring fee, including consumption tax, of 40,500,000 JPY ($0.4 million). The Term Loan A of 500 million JPY (approximately $4.4 million) was repaid to the Mitsubishi Bank in January 2018.
The 2015 Mitsubishi Bank Loans contain customary representations and warranties and customary affirmative and negative covenants applicable to the Company’s Japanese subsidiary, including, among other things, restrictions on cessation in business, management, mergers or acquisitions. The 2015 Mitsubishi Bank Loans contain financial covenants relating to minimum net assets, maximum ordinary loss and a dividends covenant. Outstanding principal balance under the 2015 Mitsubishi Bank Loans and unamortized debt issuance costs were approximately 1.2 billion JPY (approximately $4.4 million for Term Loan A and $6.4 million for Term Loan B) and 43.0 million JPY (approximately $0.4 million), respectively, as of December 31, 2017. The Company was in compliance with the related covenants as of December 31, 2017 and December 31, 2016.
In March 2017, the Company entered into a loan agreement and related agreements with the Mitsubishi Bank for a term loan of 690 million JPY (approximately $6.1 million) (the “2017 Mitsubishi Bank Loan”) to acquire manufacturing equipment for its Japanese subsidiary. This loan is secured by the manufacturing equipment acquired from the loan proceeds. Interest on the 2017 Mitsubishi Bank Loan is based on the annual rate of the monthly TIBOR rate plus 1.00%. The 2017 Mitsubishi Bank Loan matures on March 29, 2024 and requires monthly interest and principal payments over 72 months commencing in April 2018. The loan contains customary covenants relating to minimum net assets, maximum ordinary loss and a dividends covenant. The loan is available from March 31, 2017 to March 30, 2018 and 690 million JPY (approximately $6.1 million) under this loan was drawn as of December 31, 2017.
At December 31, 2017, maturities of long-term debt were as follows (in thousands):
2018 | $ | 6,091 | |
2019 | 1,908 | ||
2020 | 1,908 | ||
2021 | 1,908 | ||
2022 | 31,926 | ||
Thereafter | 3,201 | ||
$ | 46,942 | ||
12. Pension Plans
Japan defined benefit pension plans
In connection with its acquisition of NeoPhotonics Semiconductor in 2013, the Company assumed responsibility for two defined benefit plans that provide retirement benefits to its NeoPhotonics Semiconductor employees in Japan: the Retirement Allowance Plan (“RAP”) and the Defined Benefit Corporate Pension Plan (“DBCPP”). The RAP is an unfunded plan administered by the Company. Effective February 28, 2014, the DBCPP was converted to a defined contribution plan (“DCP”). In May 2014, LAPIS transferred approximately $2.0 million into the newly formed DCP which was the allowable
81
Table of Contents
NEOPHOTONICS CORPORATION
NOTES TO CONSOLIDATED FINANCIAL STATEMENTS (continued)
amount that can be transferred according to the Japanese regulations. LAPIS also paid the Company approximately $0.3 million in connection with the conversion of the plan. Additionally, the Company transferred the net unfunded projected benefit obligation amount from the DBCPP to the RAP and froze the RAP benefit at the February 28, 2014 amount. Under the RAP, lump sum benefits are provided upon retirement or upon certain instances of termination. In 2014, the Company reclassified $0.2 million and $0.1 million from accumulated other comprehensive income to cost of goods sold and operating expenses, respectively.
The funded status of these plans for the years ended December 31, 2017, 2016 and 2015 was as follows (in thousands):
2017 | 2016 | 2015 | |||||||||
RAP | RAP | RAP | |||||||||
Change in projected benefit obligation: | |||||||||||
Projected benefit obligation, beginning of period | $ | 4,802 | $ | 5,086 | $ | 5,054 | |||||
Service cost | — | — | — | ||||||||
Interest cost | 5 | 11 | 10 | ||||||||
Benefits paid | (411 | ) | (551 | ) | — | ||||||
Actuarial (gain)/loss | 32 | 72 | 40 | ||||||||
Curtailment/Settlement | — | — | — | ||||||||
Transfer from DBCPP to RAP | — | — | — | ||||||||
Currency translation adjustment | 188 | 184 | (18 | ) | |||||||
Projected benefit obligation, end of period | $ | 4,616 | $ | 4,802 | $ | 5,086 | |||||
Change in plan assets: | |||||||||||
Plan assets at fair value, beginning of period | $ | — | $ | — | $ | — | |||||
Employer contributions | — | — | — | ||||||||
Benefits paid | — | — | — | ||||||||
Transfer to DCP | — | — | — | ||||||||
Currency translation adjustment | — | — | — | ||||||||
Plan assets at calculated amount, end of period | $ | — | $ | — | $ | — | |||||
Amounts recognized in consolidated balance sheets: | |||||||||||
Accrued and other current liabilities | $ | 488 | $ | 393 | $ | 497 | |||||
Other noncurrent liabilities | $ | 4,128 | $ | 4,409 | $ | 4,589 | |||||
Amount recognized in accumulated other comprehensive loss: | |||||||||||
Defined benefit pension plans adjustment | $ | 271 | $ | 230 | $ | 153 | |||||
Accumulated benefit obligation, end of period | $ | 4,616 | $ | 4,802 | $ | 5,086 | |||||
Net periodic pension cost associated with these plans for the years ended December 31, 2017, 2016 and 2015 included the following components (in thousands):
2017 | 2016 | 2015 | |||||||||
RAP | RAP | RAP | |||||||||
Service cost | $ | — | $ | — | $ | — | |||||
Interest cost | 5 | 11 | 10 | ||||||||
Other | — | — | — | ||||||||
Curtailment/settlement (gain) loss | — | — | — | ||||||||
Net periodic pension (gain) costs | $ | 5 | $ | 11 | $ | 10 | |||||
The projected and accumulated benefit obligations for the RAP were calculated as of December 31, 2017 and 2016 using a discount rate assumption of 0.1% and 0.1%, respectively.
82
Table of Contents
NEOPHOTONICS CORPORATION
NOTES TO CONSOLIDATED FINANCIAL STATEMENTS (continued)
Estimated future benefit payments under the RAP are as follows (in thousands):
2018 | $ | 387 | |
2019 | 183 | ||
2020 | 501 | ||
2021 | 611 | ||
2022 | 288 | ||
2023 - 2026 | 1,342 | ||
Thereafter | 1,304 | ||
$ | 4,616 | ||
401(k) Plan
The Company maintains a savings and retirement plan qualified under Section 401(k) of the Internal Revenue Code of 1986, as amended (the "IRC"). The Company currently matches a portion of all eligible employee contributions which vest immediately. The Company’s matching contributions to the plan totaled $0.5 million, $0.4 million and $0.3 million, respectively, for the years ended December 31, 2017, 2016, and 2015.
13. Commitments and contingencies
Leases
The Company leases various facilities under non-cancelable operating leases expiring through 2027.
On June 13, 2017, the Company entered into an office lease for approximately 39,000 square feet for the Company’s current headquarters in San Jose (the “Lease”) with a commencement date of June 1, 2017. The Company’s existing office lease for the facility was terminated and replaced by the new Lease. Upon commencement, the Lease had an initial term of one hundred and twenty-three (123) months, ending September 30, 2027, (the “Initial Term”) with a monthly rental rate of $41,388, escalating annually to a maximum monthly rental rate of approximately $72,525 in the last year of the Initial Term. Upon termination of the Lease, the Company anticipates a restoration cost of approximately $0.7 million.
In September 2016, the Company entered into an office lease for approximately 64,000 square feet of office and laboratory space located adjacent to the Company’s current headquarters in San Jose (the “Lease”). The term of the Lease commenced on January 1, 2017. Upon commencement, the Lease has an initial term of one hundred and twenty-nine (129) months, ending on September 30, 2027 (the “Initial Term”), with a monthly rental rate of $144,000, escalating annually to a maximum monthly rental rate of approximately $194,000 in the last year of the Initial Term. The Landlord has agreed to provide the office and laboratory space to the Company free of charge for the first nine months of the Initial Term through September 30, 2017. Upon termination of the Lease, the Company anticipates a restoration cost of approximately $3.1 million.
As of December 31, 2017, the future minimum commitments under the Company’s non-cancelable operating leases are as follows (in thousands):
Years ending December 31, | |||
2018 | $ | 3,512 | |
2019 | 3,608 | ||
2020 | 3,069 | ||
2021 | 2,977 | ||
2022 | 2,939 | ||
Thereafter | 14,370 | ||
$ | 30,475 | ||
The total minimum lease commitment amount above does not include minimum sublease rent income of $1.7 million receivable in the future under non-cancelable sublease agreements.
83
Table of Contents
NEOPHOTONICS CORPORATION
NOTES TO CONSOLIDATED FINANCIAL STATEMENTS (continued)
The Company recognizes rent expense on a straight-line basis over the lease period. Rent expense under the Company’s operating leases was $4.6 million, $2.4 million and $2.2 million, respectively, in the years ended December 31, 2017, 2016, and 2015.
Litigation
From time to time, the Company is subject to various claims and legal proceedings, either asserted or unasserted, that arise in the ordinary course of business. The Company accrues for legal contingencies if the Company can estimate the potential liability and if the Company believes it is probable that the case will be ruled against it. If a legal claim for which the Company did not accrue is resolved against it, the Company would record the expense in the period in which the ruling was made. The Company believes that the likelihood of an ultimate amount of liability, if any, for any pending claims of any type (alone or combined) that will materially affect the Company’s financial position, results of operations or cash flows is remote. The ultimate outcome of any litigation is uncertain, however, and unfavorable outcomes could have a material negative impact on the Company’s financial condition and operating results. Regardless of outcome, litigation can have an adverse impact on the Company because of defense costs, negative publicity, diversion of management resources and other factors.
On January 5, 2010, Finisar Corporation, or Finisar, filed a complaint in the U.S. District Court for the Northern District of California against Source Photonics, Inc., MRV Communications, Inc., Oplink Communications, Inc. and the Company, or collectively, the co-defendants. In the complaint Finisar alleged infringement of certain of its U.S. patents. In 2010 the Company filed an answer to the complaint and counterclaims, asserting two claims of patent infringement and additional claims. The court dismissed without prejudice all co-defendants (including the Company) except Source Photonics, Inc., on grounds that such claims should have been asserted in four separate lawsuits, one against each defendant. This dismissal does not prevent Finisar from bringing a new similar lawsuit against the Company. In 2011 the Company and Finisar agreed to suspend their respective claims and in 2012 they further agreed to toll their respective claims. While there has been no action on this matter since 2012, the Company is currently unable to predict the outcome of this dispute and therefore cannot determine the likelihood of loss nor estimate a range of possible loss.
In January 2013, the Company was served with a lawsuit, filed in Belgium by a distributor called Laser 2000 Beneluo SA (“Laser 2000”) claiming unpaid commissions. The distributor agreement was formally terminated as of January 3, 2012. The Company paid $492,000 to Laser 2000 as partial settlement of claims and to avoid penalties from the Court and submitted a legal brief to court on September 16, 2013. Laser 2000 filed a response on December 16, 2013 and the Company filed the final rebuttal brief on January 30, 2014. In March 2015, the Belgian Court issued a ruling awarding Laser 2000 approximately one million euros in damages (approximately $1,100,000 at current exchange rates). The Company did not believe it would ultimately be liable for the full amount of damage and accrued $0.3 million in March 2015 for estimated probable net litigation expense relating to this matter. The Company appealed this verdict and, in April 2017 settled this case and paid approximately $250,000.
On December 27, 2016 the Company was served with a lawsuit filed by Lestina International Ltd. (“Lestina”), in Santa Clara County, CA. The lawsuit is regarding a dispute of approximately $3 million related to purchase orders for the Company’s Low Speed Transceiver Products that was soon thereafter sold by the Company to APAT OE in January 2017. The purchase orders in question were included in the asset sale and were assumed liabilities by the purchaser of the business. The Company is unable to predict with certainty the outcome of this matter, but is seeking to resolve the matter either through a court dismissal of the action or a resolution with the plaintiff and/or the purchaser of the Low Speed Transceiver Products’ assets. Discovery is currently in process. Because the purchase orders in question were an assumed liability of the Low Speed Transceiver Products’ assets that were transferred to the purchaser, the Company does not expect that the ultimate costs to resolve these matters will have a material adverse effect on its consolidated financial position, results of operations or cash flows.
APAT Arbitration
On June 16, 2017, APAT Optoelectronics Components Co., Ltd. filed an arbitration claim against NeoPhotonics (China) Co., Ltd. (the Company’s China subsidiary), claiming that approximately $1.5 million of the inventory that was sold to APAT OE by NeoChina in an Asset Purchase Agreement executed between the parties on December 14, 2016 was aged inventory and of no value. The arbitration was heard in the Shenzhen Court of International Arbitration on August 2, 2017. On October 25, 2017, NeoPhotonics (China) Co., Ltd. was informed that it was successful in the defense of the dispute and was also successful in its counterclaim against APAT Optoelectronics Components Co., Ltd. NeoPhotonics (China) Co. Ltd. was awarded approximately RMB700,000 (approximately USD $100,000) in compensatory damages and attorney fees as well as having the approximately $1.5 million claim against it rejected in its entirety.
Indemnifications
84
Table of Contents
NEOPHOTONICS CORPORATION
NOTES TO CONSOLIDATED FINANCIAL STATEMENTS (continued)
In the normal course of business, the Company enters into agreements that contain a variety of representations and warranties and provide for general indemnification. The Company’s exposure under these agreements is unknown because it involves claims that may be made against the Company in the future, but have not yet been made. To date, the Company has not paid any claims or been required to defend any action related to its indemnification obligations. However, the Company may record charges in the future as a result of these indemnification obligations.
In November 2016 Oyster Communications, Inc. filed nine patent lawsuits against several defendants in the U.S. District Court for the Eastern District of Texas, including one against Cisco Systems, Inc. One defendant has successfully transferred their case to the U.S. District Court for the Northern District of California. Additional defendant requested venue changes are still pending. The Company was not named as a defendant in any of the lawsuits. In July 2017, however, Cisco notified the Company that it would be seeking indemnification from the Company for claims against Cisco arising from the lawsuits. The Company is investigating the matter but is currently unable to predict the outcome of this matter and therefore cannot determine the likelihood of loss nor estimate a range of possible loss.
Purchase obligations
The Company has open purchase orders with its suppliers for the purchase of inventory and other items in the ordinary course of its business. As of December 31, 2017, the Company’s estimate of outstanding amounts under these purchase orders was approximately $32.1 million, primarily expected to be purchased within the next 12 months. Certain of these open purchase orders may be cancellable without penalty.
Penalty Payment Derivative
In connection with a private placement transaction with Joint Stock Company "Rusano" in 2012, (formerly Open Joint Stock Company “RUSNANO"), or Rusnano, in 2012, the Company agreed to certain performance obligations including establishing a wholly-owned subsidiary in Russia and making a $30.0 million investment commitment (the ‘Investment Commitment’) towards the Company’s Russian operations, which could be partially satisfied by cash and/or non-cash investment inside or outside of Russia and/or by way of non-cash asset transfers.
The Rights Agreement as amended in 2015 (the "Amended Rights Agreement") limits the maximum amount of penalties and/or exit fee (the "Rusano Payment") to be paid by the Company to $5.0 million in the aggregate and allows such payment to be reduced when certain milestones are met over time. The Amended Rights Agreement also provides for an updated investment plan for the Company’s Russian subsidiaries that includes non-cash transfer of licensing rights to intellectual property, non-cash transfers of existing equipment and commitments to complete the remaining investment milestones through 2019. The Company fulfilled its investment commitment required by 2016 and had contributed over $21.0 million in cash and assets to its subsidiaries in Russia as of December 31, 2016. Therefore, no amounts of the Rusnano Payment were due as of December 31, 2016 or December 31, 2017.
As of December 31, 2017, the remaining Investment Commitment was approximately $8.0 million to be invested at any time on or before December 31, 2019. At any point between December 31, 2017 and December 31, 2019, the Company may elect to pay a $2.0 million exit fee to terminate any remaining obligations associated with the Investment Commitment.
In August 2016, the Company entered into a letter of agreement with Rusnano to agree to transfer a 10G SFP+ transceiver product line and incur expected costs of approximately $0.1 million, by July 30, 2017, which will not be counted toward the Company’s overall Investment Commitment. Since the asset sale of the Company’s Low Speed Transceiver Products was completed in January 2017, the Company may undertake such expense by spending such amount in another manner to be discussed and agreed between the parties.
Rusnano has non-transferable veto rights over the Company’s Russian subsidiaries’ annual budget during the investment period and must approve non-cash asset transfers to be made in satisfaction of the Investment Commitment. The Company accounted for the Rusnano Payment as an embedded derivative instrument. The fair value of the Penalty Payment derivative has been estimated at the date of the original common stock sale (April 27, 2012) and at each subsequent balance sheet date using a probability-weighted discounted future cash flow approach using unobservable inputs, which are classified as Level 3 within the fair value hierarchy. The primary inputs for this approach include the probability of achieving the Investment Commitment and a discount rate that approximates the Company’s incremental borrowing rate. After the initial measurement, changes in the fair value of this derivative are recorded in other income (expense), net. The estimated fair value of this derivative was $0.4 million as of each of December 31, 2017 and December 31, 2016. As of December 31, 2017, the derivative was reported within other noncurrent liabilities and as of December 31, 2016 the derivative was reported within accrued and other current liabilities on the Company’s consolidated balance sheets. See Note 8.
85
Table of Contents
NEOPHOTONICS CORPORATION
NOTES TO CONSOLIDATED FINANCIAL STATEMENTS (continued)
14. Stockholders’ Equity
Common stock
As of December 31, 2017, the Company had reserved 7,297,302 shares of common stock for issuance under its stock plans and 278,673 shares of common stock for issuance under its employee stock purchase plan.
Resale Registration Statement
In December 2014, the Company entered into a Commitment to File a Registration Statement and Related Waiver of Registration Rights, whereby Rusnano waived certain registration rights in connection with a potential offering by the Company of shares of the Company’s common stock, and the Company committed to file with the U.S. Securities and Exchange Commission a resale registration statement on Form S-1 covering the resale of all shares of the Company’s common stock held by Rusnano. In each of 2015 and 2016, the Company filed such resale registration statement, which registered 4,972,905 shares of the Company’s common stock, at a par value of $0.0025 per share, held by Rusnano. The Company does not receive any proceeds from any sales of the Company’s common stock held by Rusnano (See Note 13).
Follow-On Public Offering
In 2015, the Company completed a follow-on public offering, in which the Company sold 6,866,689 shares of its common stock, including 895,655 shares of common stock sold upon the exercise in full of the overallotment option by the underwriters, at a public offering price of $7.25 per share. The Company raised approximately $45.6 million, net of underwriting discounts of $3.0 million and other offering expenses of approximately $1.2 million.
Accumulated Other Comprehensive Income (Loss)
The following table shows the components of accumulated other comprehensive income (loss), net of taxes, as of December 31, 2017 and 2016 (in thousands):
December 31, 2017 | December 31, 2016 | ||||||
Foreign currency translation adjustments | $ | 567 | $ | (8,235 | ) | ||
Unrealized gains on available-for-sale securities | (1 | ) | (19 | ) | |||
Defined benefit pension plan adjustment | (168 | ) | (147 | ) | |||
$ | 398 | $ | (8,401 | ) | |||
No material amounts related to available-for-sale securities or the defined benefit pension plan were reclassified out of accumulated other comprehensive income (loss) during the years ended December 31, 2017, 2016 or 2015.
Accumulated Deficit
Approximately $8.8 million and $8.7 million of the Company’s retained earnings within its accumulated deficit at December 31, 2017 and 2016, respectively, was subject to restriction due to a requirement that its subsidiaries in China set aside at least 10% of their respective accumulated profits each year to fund statutory common reserves as well as allocate a discretional portion of their after-tax profits to their staff welfare and bonus fund.
15. Stock-based compensation
Equity incentive programs
2004 Stock Option Plan
In March 2004, the Company adopted the 2004 Stock Option Plan (the “2004 Plan”) for the benefit of its eligible employees, consultants and independent directors. In February 2011, in connection with the closing of the Company’s initial public offering and execution of the associated underwriting agreement, shares authorized for issuance under the 2004 Plan were cancelled (except for those shares reserved for issuance upon exercise of outstanding stock options). As of December 31, 2017, options to purchase 481,725 shares were outstanding under the 2004 Plan and no shares were available for future grant.
2007 Stock Appreciation Grants Plan
86
Table of Contents
NEOPHOTONICS CORPORATION
NOTES TO CONSOLIDATED FINANCIAL STATEMENTS (continued)
In October 2007, the Company adopted its 2007 Stock Appreciation Grants Plan (the “2007 Plan”). The 2007 Plan provides for the grant of units (“stock appreciation units”) entitling the holder upon exercise to receive cash in an amount equal to the amount by which the Company’s common stock has appreciated in value. Each stock appreciation unit entitles a participant to a cash payment in the amount of the excess of the fair market value of a share of common stock on the exercise date over the fair market value of a share of common stock on the award date.
The total appreciation available to a participant from the exercise of an award is equal to the number of stock appreciation units being exercised, multiplied by the amount of appreciation per stock appreciation unit. The stock appreciation units granted under the 2007 Plan were primarily granted to employees or consultants of the Company’s subsidiaries in China.
As of December 31, 2017, 49,824 stock appreciation units were outstanding, of which 49,824 stock appreciation units were vested. The Company does not intend to grant additional stock appreciation units under the 2007 Plan.
2010 Equity Incentive Plan
In April 2010, the Company adopted its 2010 Equity Incentive Plan (the “2010 Plan”). The 2010 Plan will terminate on April 13, 2020, unless sooner terminated by the board of directors.
The 2010 Plan provides for the grant of incentive stock options, non-statutory stock options, stock appreciation rights, restricted stock awards, restricted stock unit awards, market-based stock awards, and other forms of equity compensation, or collectively, stock awards, all of which may be granted to employees, including officers, and to non-employee directors and consultants. Additionally, the 2010 Plan provides for the grant of market-based cash awards. Incentive stock options may be granted only to employees. All other awards may be granted to employees, including officers, and to non-employee directors and consultants.
Under the terms of the 2010 Plan, awards may be granted at prices not less than 100% of the fair value of the Company’s common stock, as determined by the Company’s board of directors, on the date of grant for an incentive stock option and not less than 85% of the fair value of the Company’s common stock on the date of grant for a non-qualified stock option. Options vest over a period of time as determined by the board of directors, generally over a three to four year period, and expire ten years from date of grant.
Initially, the aggregate number of shares of the Company’s common stock that may be issued pursuant to stock awards under the 2010 Plan was 865,420 shares. The number of shares of the Company’s common stock reserved for issuance under the 2010 Plan automatically increase on January 1st each year, starting on January 1, 2012 and continuing through January 1, 2020, by 3.5% of the total number of shares of the Company’s common stock outstanding on December 31 of the preceding calendar year, or such lesser number of shares of common stock as determined by the Company’s board of directors. The maximum number of shares that may be issued pursuant to the exercise of incentive stock options under the 2010 Plan is 8,000,000 shares. As of December 31, 2017, stock options to purchase and restricted stock units to convert to a total of 5,301,808 shares of common stock were outstanding under the 2010 Plan and 909,805 shares were reserved for future issuance.
2010 Employee Stock Purchase Plan
In February 2011, the Company adopted its 2010 Employee Stock Purchase Plan (the “2010 ESPP”). The 2010 ESPP was implemented through a series of offerings of purchase rights to eligible U.S. employees. The offering period is for 12 months beginning November 16th of each year, with two purchase dates on May 15th and November 15th. Due to the delay in filing its 2013 Annual Report on Form 10-K, in May 2014 the Compensation Committee of the Company’s Board of Directors (the “Committee”) rescheduled the May 15 purchase date under the then offering period to June 17, 2014. Additionally, the Committee waived the existing purchase limits for the June 17, 2014 purchase only and created a modification of the purchase price formula for such offering period. In connection with this modification, the Company recorded an immaterial charge as stock based compensation expense in its 2014 consolidated statements of operations.
The 2010 ESPP initially authorized the issuance of 342,568 shares of the Company’s common stock pursuant to purchase rights granted to employees or to employees of designated affiliates. The number of shares of common stock reserved for issuance automatically increase on January 1st of each year, starting January 1, 2012 and continuing through January 1, 2020, in an amount equal to the lesser of (1) 3.5% of the total number of shares of common stock outstanding on December 31st of the preceding calendar year, (2) 600,000 shares of common stock or (3) such lesser number of shares of common stock as determined by the Company’s board of directors. As of December 31, 2017, the Company had 278,673 shares reserved for future issuance.
2011 Inducement Award Plan
87
Table of Contents
NEOPHOTONICS CORPORATION
NOTES TO CONSOLIDATED FINANCIAL STATEMENTS (continued)
In September 2011, the Company adopted its 2011 Inducement Award Plan (the “2011 Plan”). The 2011 Plan provides for awarding options, stock appreciation rights, restricted stock grants, restricted stock units and other awards to new employees of the Company and its affiliates, including as a result of future business acquisitions. All options under this plan will be designated as non-statutory stock options.
The number of shares initially reserved for issuance under the 2011 Plan was 750,000 shares. The exercise price of awards shall be not less than 100% of the fair market value of the Company’s common stock on the date of grant. Each stock appreciation right grant will be denominated in shares of common stock equivalents. Options and stock appreciation rights have a maximum term of ten years measured from the date of grant, subject to earlier termination following the individual’s cessation of service with the Company. In 2015, an additional 100,000 shares were authorized for issuance by the Company’s board of directors. As of December 31, 2017, stock options to purchase and restricted stock units to convert to a total of 554,633 shares of common stock were outstanding under the 2011 Plan and 49,331 shares were reserved for future issuance.
Determining Fair Value
The Company estimated the fair value of certain stock-based awards using a Black-Scholes-Merton valuation model with the following assumptions:
Years ended December 31, | |||||
Stock options | 2017 | 2016 | 2015 | ||
Weighted-average expected term (years) | 5.99 | 5.75 | 5.33 | ||
Weighted-average volatility | 65% | 65% | 60% | ||
Risk-free interest rate | 2.02%-2.08% | 1.01%-1.76% | 1.37%-1.85% | ||
Expected dividends | — % | — % | — % | ||
Stock appreciation units | |||||
Weighted-average expected term (years) | 2.30 | 2.77 | 3.54 | ||
Weighted-average volatility | 69% | 61% | 62% | ||
Risk-free interest rate | 0.51%-1.62% | 0.45%-1.47% | 0.25%-1.57% | ||
Expected dividends | — % | — % | — % | ||
ESPP | |||||
Weighted-average expected term (years) | 0.72 | 0.73 | 0.69 | ||
Weighted-average volatility | 61% | 54% | 58% | ||
Risk-free interest rate | 0.91%-1.31% | 0.39%-0.45% | 0.03%-0.14% | ||
Expected dividends | — % | — % | — % | ||
Expected term. The expected term for stock options was estimated using the Company’s historical exercise behavior and expected future exercise behavior. Vested stock appreciation units first became exercisable upon the expiration of the lock-up period associated with the initial public offering. Therefore, the Company estimated the term of the award based on an average of the weighted-average exercise period and the remaining contractual term. The expected term for the ESPP represents the period of time from the beginning of the offering period to the purchase date.
Volatility. Due to the limited history of the trading of the Company’s common stock since the initial public offering in February 2011, the expected volatility used by the Company is based on a combination of its own volatility and the volatility of similar entities. In evaluating similarity, factors such as industry, stage of life cycle, size, and financial leverage are taken into consideration. The term over which volatility was measured was commensurate with the expected term.
Risk-free interest rate. The risk-free rate that the Company uses in the Black-Scholes-Merton option valuation model is based on U.S. Treasury zero-coupon issues with remaining terms similar to the expected term on the options.
Expected dividends. The Company has never declared or paid any cash dividends and does not plan to pay cash dividends in the foreseeable future, and, therefore, used an expected dividend yield of zero in the valuation model.
Stock-Based Compensation Expense
88
Table of Contents
NEOPHOTONICS CORPORATION
NOTES TO CONSOLIDATED FINANCIAL STATEMENTS (continued)
The following table summarizes the stock-based compensation expense recognized for the years ended December 31, 2017, 2016 and 2015. Unamortized stock-based compensation costs capitalized as part of inventory were immaterial in each of the periods presented (in thousands):
Years ended December 31, | |||||||||||
2017 | 2016 | 2015 | |||||||||
Cost of goods sold | $ | 1,098 | $ | 3,130 | $ | 1,335 | |||||
Research and development | 2,491 | 4,760 | 2,049 | ||||||||
Sales and marketing | 1,697 | 4,105 | 1,794 | ||||||||
General and administrative | 2,920 | 5,081 | 2,585 | ||||||||
$ | 8,206 | $ | 17,076 | $ | 7,763 | ||||||
2014 Stock Option and Stock Appreciation Rights Repricing Offer
On December 18, 2014, the Company completed an offer to certain of its current employees (or engaged as a consultant to the Company) to receive the opportunity to reduce the exercise price of certain outstanding eligible options or eligible stock appreciation rights to the closing trading price of the Company’s common stock on December 18, 2014, in exchange for such holders’ agreement to accept a new vesting schedule (the “Repricing Offer”). The eligible stock options and stock appreciation rights covered an aggregate of 2,373,692 shares of the Company’s common stock. On December 18, 2014, options to purchase 1,948,631 shares of the Company’s common stock and stock appreciation rights to purchase 87,354 shares of the Company’s common stock were repriced in the Repricing Offer. The repriced eligible options and eligible stock appreciation rights had a grant date compensation cost, net of forecasted forfeitures, of approximately $2.6 million, which included incremental compensation cost of approximately $0.9 million.
The new exercise price per share for each repriced eligible option or eligible stock appreciation right is $3.50. Each of the repriced eligible options or eligible stock appreciation rights was subject to a new vesting schedule as follows: 50% of the shares subject to such repriced eligible option or eligible stock appreciation right vested and became exercisable on January 1, 2016, and the remaining 50% vested and became exercisable in 12 equal monthly installments on each monthly anniversary thereafter, in each case subject to continued service with the Company on each applicable vesting date; provided, however, that alternative vesting applied to certain eligible options or eligible stock appreciation rights if the expiration date of such eligible options or eligible stock appreciation rights was after January 30, 2016, but on or before January 1, 2017, then 50% of the shares subject to the repriced awards vested and became exercisable on January 1, 2016 and the remaining shares were subject to ratable monthly vesting over the remaining term ending 60 days prior to the expiration date of the repriced awards; if the expiration date of such eligible options or eligible stock appreciation rights was prior to January 30, 2016, then 100% of the shares subject to the repriced awards vested and became exercisable on the 60th day prior to the expiration date.
Stock Option and Restricted Stock Unit Activity
The following table summarizes the Company’s stock option and restricted stock unit, or RSU, activity during the year ended December 31, 2017:
Stock Options | Restricted Stock Units | |||||||||||||||
Shares Available for Grant | Number of Shares | Weighted Average Exercise Price | Number of Units | Weighted Average Grant Date Fair Value | ||||||||||||
Balance at December 31, 2016 | 768,046 | 4,301,340 | $ | 5.18 | 2,089,473 | $ | 10.15 | |||||||||
Authorized for issuance | 1,488,411 | |||||||||||||||
Granted | (1,889,536 | ) | 502,746 | 7.37 | 1,386,790 | 7.86 | ||||||||||
Exercised/Converted | (665,393 | ) | 3.73 | (805,463 | ) | 9.48 | ||||||||||
Cancelled/Forfeited | 592,215 | (205,164 | ) | 8.11 | (266,163 | ) | 10.42 | |||||||||
Balance at December 31, 2017 | 959,136 | 3,933,529 | $ | 5.55 | 2,404,637 | $ | 9.02 | |||||||||
The following table summarizes information about stock options outstanding as of December 31, 2017:
89
Table of Contents
NEOPHOTONICS CORPORATION
NOTES TO CONSOLIDATED FINANCIAL STATEMENTS (continued)
Options Outstanding | ||||||||||||
Number of Shares | Weighted Average Exercise Price | Weighted Average Remaining Contractual Term (Years) | Aggregate Intrinsic Value (in Thousands) | |||||||||
Vested and expected to vest | 3,830,959 | $ | 5.48 | 5.83 | $ | 6,919,879 | ||||||
Exercisable | 3,084,096 | $ | 4.78 | 5.08 | $ | 6,706,040 | ||||||
The fair value of options vested during the years ended December 31, 2017, 2016 and 2015 was $1.5 million, $3.9 million and $1.3 million, respectively. The intrinsic value of options vested and expected to vest and exercisable as of December 31, 2017 is calculated based on the difference between the exercise price and the fair value of the Company’s common stock as of December 31, 2017. The intrinsic value of options exercised during the years ended December 31, 2017, 2016 and 2015, was $3.0 million, $9.7 million and $1.6 million, respectively.
The weighted-average fair value of options granted was $4.43, $7.05 and $3.87 per share for the years ended December 31, 2017, 2016 and 2015, respectively. At December 31, 2017, there was $3.2 million of unrecognized stock-based compensation expense for stock options, net of estimated forfeitures, which will be recognized over the remaining weighted-average period of 2.2 years.
Included in the outstanding stock options at December 31, 2017 are 1.0 million shares of market-based stock options granted to key personnel. The fair value of its market-based option grants was $4.72 for 2015 and $1.65 for 2014 using a Monte Carlo simulation model with the assumptions discussed above. These options vested in September 2016 as a result of the satisfaction of the market condition requiring the average closing price of the Company’s common stock over a period of 20 consecutive trading days to be equal to or greater than $15.00 per share and the recipients remaining in continuous service with the Company through such period. The Company recorded approximately $4.8 million in related stock-based compensation expense for these options in 2016.
The following table summarizes information about RSUs outstanding as of December 31, 2017:
Restricted Stock Units Outstanding | ||||||||||||
Number of Shares | Weighted Average Exercise Price | Weighted Average Remaining Contractual Term (Years) | Aggregate Intrinsic Value (in Thousands) | |||||||||
Vested and expected to vest | 2,098,888 | $ | — | 1.26 | $ | 13,810,684 | ||||||
The fair value of RSUs vested during the years ended December 31, 2017, 2016 and 2015 was $7.6 million, $1.6 million and $3.3 million, respectively. The intrinsic value of RSUs vested and expected to vest as of December 31, 2017 is calculated based on the fair value of the Company’s common stock as of December 31, 2017. The intrinsic value of RSUs converted during the years ended December 31, 2017, 2016 and 2015, was $6.4 million, $2.8 million and $4.3 million, respectively.
The weighted-average fair value of RSUs granted was $7.86, $12.33 and $7.46 per share for the years ended December 31, 2017, 2016 and 2015, respectively. At December 31, 2017, the Company had $15.3 million of unrecognized stock-based compensation expense for RSUs, net of estimated forfeitures, which will be recognized over the remaining weighted-average period of 2.1 years.
The majority of the Company’s RSUs that were converted during the years ended December 31, 2017, 2016 and 2015 were net share settled. Upon each settlement date, RSUs were withheld to cover the minimum withholding tax and the remaining amounts were delivered to the recipient as shares of the Company’s common stock. In 2017, 2016 and 2015, the Company withheld 126,999, 49,838 and 95,227 shares, respectively, and remitted cash of $1.0 million, $0.6 million and $0.7 million, respectively, to the appropriate tax authorities.
Stock Appreciation Unit Activity
The following table summarizes the Company’s stock appreciation unit activity during the year ended December 31, 2017:
90
Table of Contents
NEOPHOTONICS CORPORATION
NOTES TO CONSOLIDATED FINANCIAL STATEMENTS (continued)
Stock Appreciation Units | Weighted-Average Exercise Price | |||||
Stock appreciation units outstanding as of December 31, 2016 | 286,768 | $ | 4.87 | |||
Stock appreciation units exercised | (42,618 | ) | $ | 4.50 | ||
Stock appreciation units cancelled | (4,326 | ) | $ | 4.24 | ||
Stock appreciation units outstanding as of December 31, 2017 | 239,824 | $ | 4.95 | |||
The fair value of stock appreciation units vested was immaterial in 2017, $3.7 million in 2016 and immaterial in 2015. The intrinsic value of stock appreciation units is calculated based on the difference between the exercise price and the fair value of the Company’s common stock as of December 31, 2017. Cash paid for stock appreciation units exercised was $0.2 million in 2017, $0.5 million in 2016, and $0.1 million in 2015.
As of December 31, 2017 and 2016 the liability for settlement of stock appreciation units was approximately $0.8 million and $2.0 million, respectively, and was included in accrued and other current liabilities on the consolidated balance sheet, based on the fair value of the stock appreciation units, that will be recognized through settlement.
Included in the outstanding stock appreciation units at December 31, 2017 were 0.2 million shares of market-based stock appreciation units granted to key personnel which were granted during 2013. These market-based units vested in September 2016 upon the satisfaction of the market condition requiring the average closing price of the Company’s common stock over a period of 20 consecutive trading days to be equal to or greater than $15.00 per share and the recipients remaining in continuous service with the Company through such period. In 2017, the Company recorded approximately $0.3 million gain as compared to expense of approximately $0.9 million in 2016, in related stock-based compensation for these stock appreciation units.
Employee Stock Purchase Plan
The Company issued 349,175 shares under the 2010 ESPP during the year ended December 31, 2017. As of December 31, 2017, there was $0.8 million of unrecognized stock-based compensation expense for stock purchase rights that will be recognized over the remaining offering period, through November 2018.
16. Income taxes
The provision for income taxes is based upon the income (loss) before income taxes as follows (in thousands):
Years Ended December 31, | |||||||||||
2017 | 2016 | 2015 | |||||||||
U.S. operations | $ | (52,725 | ) | $ | (10,217 | ) | $ | (7,212 | ) | ||
Non-U.S. operations | 301 | 13,609 | 13,984 | ||||||||
$ | (52,424 | ) | $ | 3,392 | $ | 6,772 | |||||
91
Table of Contents
NEOPHOTONICS CORPORATION
NOTES TO CONSOLIDATED FINANCIAL STATEMENTS (continued)
The components of the provision for income taxes consisted of the following (in thousands):
Years Ended December 31, | |||||||||||
2017 | 2016 | 2015 | |||||||||
Current | |||||||||||
Federal | $ | (144 | ) | $ | (127 | ) | $ | (48 | ) | ||
State | 3 | (13 | ) | (8 | ) | ||||||
Foreign | 363 | (3,925 | ) | (3,725 | ) | ||||||
222 | (4,065 | ) | (3,781 | ) | |||||||
Deferred | |||||||||||
Federal | 4 | (24 | ) | (22 | ) | ||||||
State | — | — | — | ||||||||
Foreign | (1,135 | ) | 492 | 699 | |||||||
Total provision | $ | (909 | ) | $ | (3,597 | ) | $ | (3,104 | ) | ||
The provision for income taxes differs from the amount obtained by applying the U.S. federal statutory tax rate as follows (in thousands, except percentages):
Years Ended December 31, | |||||||||||
2017 | 2016 | 2015 | |||||||||
Federal statutory rate | 35 | % | 35 | % | 35 | % | |||||
Tax at federal statutory rate | $ | 18,354 | $ | (1,185 | ) | $ | (2,378 | ) | |||
State taxes, net of federal benefit | 2 | (8 | ) | (8 | ) | ||||||
Mandatory repatriation/Section 956 | (5,718 | ) | (19 | ) | (66 | ) | |||||
Nondeductible expenses | (67 | ) | (727 | ) | (135 | ) | |||||
Stock-based compensation | (314 | ) | (877 | ) | (465 | ) | |||||
Change in valuation allowance | 16,273 | (1,455 | ) | (958 | ) | ||||||
Research and development | 851 | 1,175 | 1,017 | ||||||||
Foreign rate differences | (2,819 | ) | (1,215 | ) | (844 | ) | |||||
Foreign tax credit | 144 | 127 | 30 | ||||||||
Change in prior year deferred balances | (28,262 | ) | 920 | 417 | |||||||
Other | 647 | (333 | ) | 286 | |||||||
Total provision for income taxes from continuing operations | $ | (909 | ) | $ | (3,597 | ) | $ | (3,104 | ) | ||
Change in prior year deferred balances of $28.3 million include approximately $30.0 million related to remeasurement of U.S. federal deferred tax assets from corporate tax rate of 35% to 21%, based on the newly enacted tax laws in December 2017. See below for more discussion related to newly enacted tax laws in December 2017.
92
Table of Contents
NEOPHOTONICS CORPORATION
NOTES TO CONSOLIDATED FINANCIAL STATEMENTS (continued)
Deferred income tax assets and liabilities comprise the following (in thousands):
December 31, | |||||||
2017 | 2016 | ||||||
Deferred Tax Assets: | |||||||
Net operating loss carryforwards | $ | 44,912 | $ | 55,274 | |||
Federal and state credits | 26,170 | 23,372 | |||||
Reserves, accruals and other | 9,698 | 14,423 | |||||
Fixed assets and intangibles | 1,259 | 1,817 | |||||
Total deferred tax assets | 82,039 | 94,886 | |||||
Valuation allowance | (76,101 | ) | (90,060 | ) | |||
Total deferred tax assets, net of valuation allowance | 5,938 | 4,826 | |||||
Less deferred tax liabilities: | |||||||
Acquired intangibles | (2,054 | ) | (2,295 | ) | |||
Property, plant and equipment | (3,338 | ) | (949 | ) | |||
Net deferred tax assets | $ | 546 | $ | 1,582 | |||
Reported as: | |||||||
Long term deferred tax assets, included within other long-term assets | $ | 652 | $ | 1,628 | |||
Long term deferred income tax liabilities, included within noncurrent liabilities | (106 | ) | (46 | ) | |||
Net deferred tax assets | $ | 546 | $ | 1,582 | |||
The net valuation allowance decreased by $14.0 million in 2017 and increased by $1.1 million in 2016. The changes are primarily due to changes in the U.S. deferred tax assets. U.S. deferred tax assets and the corresponding valuation allowance have been re-measured based on the newly enacted tax rate in December 2017. The change in valuation allowance balance in 2017 has reflected such accounting impact. See more discussion below for change in U.S. tax laws. The Company did not record a full valuation allowance against its net deferred tax assets in most foreign jurisdictions as it believes these deferred tax assets were realizable on a more likely than not basis as of December 31, 2017. Based upon the weight of available evidence, which includes the Company’s historical operating performance and the reported cumulative net losses to date, the Company continues to maintain a full valuation allowance against its net U.S. deferred tax assets with the exception of indefinite deferred tax liabilities.
The Company adopted ASU 2016-9 effective January 1, 2017. Upon adoption, the Company's previously unrecognized excess tax benefits of $8.6 million had no impact on its accumulated deficit balance as the related U.S. deferred tax assets were fully offset by a valuation allowance.
As of December 31, 2017, the Company had federal and state net operating loss, or NOL, carryforwards of $244.7 million and $51.7 million, respectively. Federal NOL carryforwards start to expire in 2022 and a portion of the California NOL carryforwards will begin to expire in 2028. As of December 31, 2017, the Company also had federal and state research credit carryovers of $8.3 million and $15.8 million, respectively. The federal credits will begin to expire in 2018 and the state credits can be carried forward indefinitely. The Company also had $10.4 million of foreign tax credit carryforwards which will start to expire in 2022 if not utilized. Utilization of NOL carryforwards and carried over tax credits may be subject to substantial annual limitation due to federal and state ownership limitations. The annual limitation may result in the expiration of NOL and tax credit carryforwards before utilization. The deferred tax assets listed above do not include NOL carryforwards that are expected to expire unutilized as a result of existing ownership changes.
On December 22, 2017, the U.S. President signed into U.S. law the Tax Cuts and Jobs Act of 2017 ("Tax Reform"). The new legislation, among other provisions, will lower the corporate tax rate from 35% to 21%. In addition to applying the new lower corporate tax rate in 2018 and thereafter to any taxable income we may have, the legislation affects the way we can use and carry forward net operating losses previously accumulated and results in a revaluation of deferred tax assets recorded on our balance sheet. Given that the deferred tax assets are offset by a full valuation allowance, these changes will have no net impact on the Company's financial position and net loss. However, if and when we become profitable, we will receive a reduced benefit from such deferred tax assets. In addition, the Tax Reform includes a one-time mandatory repatriation transition tax on the net accumulated earnings and profits of a US taxpayer's foreign subsidiaries. We have performed an earnings and profits analysis, and as a result of net operating loss carry forward available to fully offset the anticipated transition tax, there will be no income tax effect in the current period. Therefore, the preliminary accounting for this matter is
93
Table of Contents
NEOPHOTONICS CORPORATION
NOTES TO CONSOLIDATED FINANCIAL STATEMENTS (continued)
generally complete. Although foreign earnings have been included in US taxable income under the mandatory repatriation transition tax regime as discussed here, the Company has not changed its assertion to permanently reinvest the foreign earnings.
The SEC staff issued Staff Accounting Bulletin 118 (“SAB 118”), which provides guidance on accounting for the tax effects of the Tax Reform. SAB 118 provides a measurement period that should not extend beyond one year from the Tax Reform enactment date for companies to complete the accounting under ASC 740, Income Taxes. In accordance with SAB 118, a company must reflect the income tax effects of those aspects of the Tax Reform for which the accounting under ASC 740 is complete. To the extent that a company’s accounting for certain income tax effects of the Tax Reform is incomplete but it is able to determine a reasonable estimate, it must record a provisional estimate in the financial statements. If a company cannot determine a provisional estimate to be included in the financial statements, it should continue to apply ASC 740 on the basis of the provisions of the tax laws that were in effect immediately before the enactment of the Tax Reform. We expect to complete our analysis within the measurement period in accordance with SAB 118.
One of the Company’s China subsidiaries qualified for a preferential 15% tax rate that is available under the China Enterprise Income Tax Law, or the EIT law, for new and high technology enterprises and was granted a 15% tax rate for tax years 2015 and 2014. In June 2016, China’s State Administration of Taxation issued a notice to adjust the requirements for high technology enterprise status and as a result, the Company’s China subsidiary did not meet the requirements for the tax year 2016 and computed its tax provision for 2016 based on a 25% regular corporate tax rate and remeasured its deferred tax assets accordingly. The Company realized benefits from the reduced tax rate of $0.9 million and $0.5 million in the years ended December 31, 2015 and 2014, respectively. The tax provision for 2017 was based on the 25% regular corporate tax rate.
At December 31, 2017, the Company’s gross unrecognized tax benefits were approximately $25.5 million, of which $0.2 million would impact the effective tax rate if recognized. Substantial portion of these unrecognized tax benefits could be subject to a valuation allowance if and when recognized in a future period, which could impact the timing of any related effective tax rate benefit. The Company does not believe that the amount of unrecognized tax benefits will change significantly in the next twelve months. There were no interest or penalties related to unrecognized tax benefits. The Company’s policy is to classify interest and penalties associated with unrecognized tax benefits as income tax expense.
A reconciliation of the beginning and ending amount of unrecognized tax benefits is as follows (in thousands):
Balance at December 31, 2014 | $ | 18,372 | |
Gross increases for tax positions of current year | 2,314 | ||
Balance at December 31, 2015 | 20,686 | ||
Gross increases for tax positions of current year | 2,920 | ||
Balance at December 31, 2016 | 23,606 | ||
Gross increases for tax positions of current year | 1,933 | ||
Balance at December 31, 2017 | $ | 25,539 | |
The Company’s material tax jurisdictions are the United States federal, California, Japan and China. As a result of NOL carryforwards, substantially all of the Company’s tax years remain open to U.S. federal and state tax examination. Tax years for 2011 and forward remain open for Chinese tax examination.
17. Segment and geographic information
The Company’s Chief Executive Officer, who is considered to be the chief operating decision maker, manages the Company’s operations as a whole and reviews financial information presented on a consolidated basis for purposes of evaluating financial performance and allocating resources. In 2017, 2016 and 2015, the Company operated in one reportable segment.
Through 2017, the Company has aligned its products to High Speed Products and Network Products and Solutions. The following presents revenue by product group (in thousands):
94
Table of Contents
NEOPHOTONICS CORPORATION
NOTES TO CONSOLIDATED FINANCIAL STATEMENTS (continued)
Years Ended December 31, | |||||||||||
2017 | 2016 | 2015 | |||||||||
Revenue: | |||||||||||
High Speed Products | $ | 241,780 | $ | 277,258 | $ | 195,831 | |||||
Network Products and Solutions | 51,114 | 134,165 | 143,608 | ||||||||
Total revenue | $ | 292,894 | $ | 411,423 | $ | 339,439 | |||||
The following tables set forth the Company’s revenue and asset information by geographic region. Revenue is classified based on the ship to location of the customer. Such classification recognizes that for many customers, including those in North America or in Europe, designated shipping points are often in China or elsewhere in Asia (in thousands):
Years Ended December 31, | |||||||||||
2017 | 2016 | 2015 | |||||||||
Revenue: | |||||||||||
China | $ | 161,637 | $ | 254,685 | $ | 182,504 | |||||
United States | 41,538 | 67,807 | 77,867 | ||||||||
Japan | 8,586 | 12,037 | 12,713 | ||||||||
Rest of world | 81,133 | 76,894 | 66,355 | ||||||||
Total revenue | $ | 292,894 | $ | 411,423 | $ | 339,439 | |||||
As of December 31, | |||||||
2017 | 2016 | ||||||
Property, plant and equipment, net: | |||||||
China | $ | 37,212 | $ | 38,589 | |||
United States | 42,243 | 31,101 | |||||
Japan | 43,826 | 31,784 | |||||
Rest of world | 4,284 | 5,393 | |||||
Total | $ | 127,565 | $ | 106,867 | |||
18. Selected Quarterly Financial Data (unaudited)
The following tables set forth a summary of the Company’s quarterly financial information for each of the four quarters for the years ended December 31, 2017 and 2016:
Year ended December 31, 2017 | First Quarter | Second Quarter | Third Quarter | Fourth Quarter | ||||||||||||
(In thousands, except per share data) | ||||||||||||||||
Revenues | $ | 71,688 | $ | 73,214 | $ | 71,121 | $ | 76,871 | ||||||||
Gross profit | 18,503 | 16,777 | 10,513 | 15,686 | ||||||||||||
Net income (loss) | (11,522 | ) | (9,341 | ) | (18,187 | ) | (14,283 | ) | ||||||||
Basic net income (loss) per share | $ | (0.27 | ) | $ | (0.22 | ) | $ | (0.42 | ) | $ | (0.32 | ) | ||||
Diluted net income (loss) per share | $ | (0.27 | ) | $ | (0.22 | ) | $ | (0.42 | ) | $ | (0.32 | ) | ||||
Weighted averages shares used to compute basic net income (loss) per share | 42,615 | 43,219 | 43,790 | 44,079 | ||||||||||||
Weighted averages shares used to compute diluted net income (loss) per share | 42,615 | 43,219 | 43,790 | 44,079 | ||||||||||||
95
Year ended December 31, 2016 | First Quarter | Second Quarter | Third Quarter | Fourth Quarter | ||||||||||||
(In thousands, except per share data) | ||||||||||||||||
Revenues | $ | 99,145 | $ | 99,129 | $ | 103,312 | $ | 109,837 | ||||||||
Gross profit | 31,122 | 27,529 | 27,449 | 31,033 | ||||||||||||
Net income (loss) | 2,310 | 2,676 | (7,187 | ) | 1,996 | |||||||||||
Basic net income (loss) per share | $ | 0.06 | $ | 0.06 | $ | (0.17 | ) | $ | 0.05 | |||||||
Diluted net income (loss) per share | 0.05 | 0.06 | (0.17 | ) | 0.04 | |||||||||||
Weighted averages shares used to compute basic net income (loss) per share | 41,121 | 41,603 | 42,038 | 42,421 | ||||||||||||
Weighted averages shares used to compute diluted net income (loss) per share | 43,648 | 44,320 | 42,038 | 45,767 | ||||||||||||
19. Subsequent Events
Subsequent events included the following:
New term loan and repayment of Term Loan A in Japan
In January 2018, the Company entered into a term loan agreement with Mitsubishi Bank and The Yamanashi Chou Bank, Ltd. for a term loan in the aggregate principal amount of 850 million JPY (approximately $7.8 million) (the “Term Loan C”). The purpose of the Term Loan C is to obtain machinery for the core parts of the manufacturing line and payments for related expenses by the Company's subsidiary in Japan. The Term Loan C will be secured by the assets owned by the Company's subsidiary in Japan. The Term Loan C is available from January 29, 2018 to January 29, 2025. The full amount of the Term Loan C was drawn on January 29, 2018. Interest on the Term Loan C is based upon the annual rate of the three months TIBOR rate plus 1.00%. The Term Loan C requires quarterly interest payments, along with the principal payments, over 82 months commencing in April 2018.
In January 2018, the Company repaid Term Loan A of 500 million JPY to Mitsubishi Bank.
Repayment of note payable to financial institution
In January 2018, the Company repaid $17.0 million to CITIC Bank, which was borrowed under a line of credit facility with CITIC Bank which expired in September 2017.
Note payable to financial institution
In February 2018, the Company borrowed $17.0 million from CITIC Bank, under the credit facility with CITIC Bank, which expires in November 2018.
96
ITEM 9. CHANGES IN AND DISAGREEMENTS WITH ACCOUNTANTS ON ACCOUNTING AND FINANCIAL DISCLOSURE
Not applicable.
ITEM 9A. CONTROLS AND PROCEDURES
Evaluation of Disclosure Controls and Procedures
Our management, with the participation of our Chief Executive Officer and Chief Financial Officer, evaluated the effectiveness of the design and operation of our disclosure controls and procedures as of December 31, 2017. The term “disclosure controls and procedures,” as defined in Rules 13a-15(e) and 15d-15(e) under the Securities Exchange Act of 1934, as amended (Exchange Act), means controls and other procedures of a company that are designed to ensure that information required to be disclosed by a company in the reports that it files or submits under the Exchange Act is recorded, processed, summarized and reported, within the time periods specified in the SEC’s rules and forms. Disclosure controls and procedures include, without limitation, controls and procedures designed to ensure that information required to be disclosed by a company in the reports that it files or submits under the Exchange Act is accumulated and communicated to the company’s management, including its principal executive and principal financial officers, as appropriate to allow timely decisions regarding required disclosure.
Based upon that evaluation as of the end of the period covered in this Annual Report on Form 10-K, our Chief Executive Officer and Chief Financial Officer have concluded that our disclosure controls and procedures were effective as of December 31, 2017 at a reasonable assurance level.
Management’s Report on Internal Control Over Financial Reporting
Our management is responsible for establishing and maintaining adequate internal control over financial reporting, as defined in Rules 13a-15(f) and 15d-15(f) as defined in the Exchange Act. Internal control over financial reporting consists of policies and procedures that: (1) pertain to the maintenance of records that, in reasonable detail, accurately and fairly reflect the transactions and dispositions of our company assets; (2) are designed and operated to provide reasonable assurance regarding the reliability of our financial reporting and our process for the preparation of financial statements for external purposes in accordance with generally accepted accounting principles and that receipts and expenditures are being made only in accordance with authorizations of our management and directors; and (3) provide reasonable assurance regarding prevention or timely detection of unauthorized acquisition, use or disposition of our assets that could have a material effect on the financial statements. Because of its inherent limitations, internal control over financial reporting may not prevent or detect misstatements. Also, projections of any evaluation of effectiveness to future periods are subject to the risk that controls may become inadequate because of changes in conditions, or that the degree of compliance with the policies or procedures may deteriorate.
Our management assessed the effectiveness of our internal control over financial reporting using the criteria set forth by the Committee of Sponsoring Organizations of the Treadway Commission in Internal Control — Integrated Framework (2013). Based on the results of our assessment, using the criteria in Internal Control – Integrated Framework (2013), our management has concluded that we maintained effective internal control over financial reporting as of December 31, 2017.
The effectiveness of our internal control over financial reporting as of December 31, 2017 has been audited by Deloitte & Touche LLP, an independent registered public accounting firm, as stated in their report, which appears below.
Changes in Internal Control Over Financial Reporting
During the quarter ended December 31, 2017, we made changes in our internal control over financial reporting that materially affected or are reasonably likely to materially affect our internal control over financial reporting. We have completed our remediation efforts for the material weakness in our internal control over financial reporting identified during 2016. Specifically, our management, Audit Committee and Board of Directors took the following steps as part of our ongoing remediation efforts to address this issue:
(a) | Strengthened our cut-off controls by redesigning the controls with consideration of differing inherent risk, improved documentation standards and training; and |
(b) | Restricted and enhanced system access rights to ensure adequate controls within the sales, operations and logistics organizations. |
97
Other than the changes described above there have not been any changes in our internal control over financial reporting (as defined in Rule 13a-15(f) under the Exchange Act) as of December 31, 2017 that materially affected, or are reasonably likely to materially affect, our internal control over financial reporting.
Inherent Limitation on the Effectiveness of Internal Controls
The effectiveness of any system of internal control over financial reporting is subject to inherent limitations, including the exercise of judgment in designing, implementing, operating, and evaluating the controls and procedures, and the inability to eliminate misconduct completely. Accordingly, any system of internal control over financial reporting can only provide reasonable, not absolute, assurance. In addition, projections of any evaluation of effectiveness to future periods are subject to the risk that controls may become inadequate because of changes in conditions, or that the degree of compliance with the policies or procedures may deteriorate. We intend to continue to monitor and upgrade our internal controls as necessary or appropriate for our business, but cannot assure that such improvements will be sufficient to provide us with effective internal control over financial reporting.
98
REPORT OF INDEPENDENT REGISTERED PUBLIC ACCOUNTING FIRM
To the Stockholders and the Board of Directors of NeoPhotonics Corporation
Opinion on Internal Control over Financial Reporting
We have audited the internal control over financial reporting of NeoPhotonics Corporation and subsidiaries (the “Company”) as of December 31, 2017, based on criteria established in Internal Control - Integrated Framework (2013) issued by the Committee of Sponsoring Organizations of the Treadway Commission (COSO). In our opinion, the Company maintained, in all material respects, effective internal control over financial reporting as of December 31, 2017, based on criteria established in Internal Control - Integrated Framework (2013) issued by COSO.
We have also audited, in accordance with the standards of the Public Company Accounting Oversight Board (United States) (PCAOB), the consolidated financial statements as of and for the year ended December 31, 2017, of the Company and our report dated March 8, 2018, expressed an unqualified opinion on those financial statements.
Basis for Opinion
The Company’s management is responsible for maintaining effective internal control over financial reporting and for its assessment of the effectiveness of internal control over financial reporting, included in the accompanying Management’s Report on Internal Control Over Financial Reporting. Our responsibility is to express an opinion on the Company’s internal control over financial reporting based on our audit. We are a public accounting firm registered with the PCAOB and are required to be independent with respect to the Company in accordance with the U.S. federal securities laws and the applicable rules and regulations of the Securities and Exchange Commission and the PCAOB.
We conducted our audit in accordance with the standards of the PCAOB. Those standards require that we plan and perform the audit to obtain reasonable assurance about whether effective internal control over financial reporting was maintained in all material respects. Our audit included obtaining an understanding of internal control over financial reporting, assessing the risk that a material weakness exists, testing and evaluating the design and operating effectiveness of internal control based on the assessed risk, and performing such other procedures as we considered necessary in the circumstances. We believe that our audit provides a reasonable basis for our opinion.
Definition and Limitations of Internal Control over Financial Reporting
A company’s internal control over financial reporting is a process designed to provide reasonable assurance regarding the reliability of financial reporting and the preparation of financial statements for external purposes in accordance with generally accepted accounting principles. A company’s internal control over financial reporting includes those policies and procedures that (1) pertain to the maintenance of records that, in reasonable detail, accurately and fairly reflect the transactions and dispositions of the assets of the company; (2) provide reasonable assurance that transactions are recorded as necessary to permit preparation of financial statements in accordance with generally accepted accounting principles, and that receipts and expenditures of the company are being made only in accordance with authorizations of management and directors of the company; and (3) provide reasonable assurance regarding prevention or timely detection of unauthorized acquisition, use, or disposition of the company’s assets that could have a material effect on the financial statements.
Because of its inherent limitations, internal control over financial reporting may not prevent or detect misstatements. Also, projections of any evaluation of effectiveness to future periods are subject to the risk that controls may become inadequate because of changes in conditions, or that the degree of compliance with the policies or procedures may deteriorate.
/s/ DELOITTE & TOUCHE LLP
San Jose, California
March 8, 2018
99
ITEM 9B. OTHER INFORMATION
Not applicable.
100
Part III
ITEM 10. DIRECTORS, EXECUTIVE OFFICERS AND CORPORATE GOVERNANCE
The information required regarding our directors is incorporated herein by reference from the information contained in the section entitled “Proposal 1—Election of Directors” in our definitive Proxy Statement for the 2018 Annual Meeting of Stockholders (our “Proxy Statement”), a copy of which will be filed with the SEC on or before April 30, 2018.
The information required regarding our executive officers is incorporated herein by reference from the information contained in the section entitled “Management” in our Proxy Statement.
The information required regarding Section 16(a) beneficial ownership reporting compliance is incorporated by reference from the information contained in the section entitled “Section 16(a) Beneficial Ownership Reporting Compliance” in our Proxy Statement.
The information required with respect to procedures by which security holders may recommend nominees to our board of directors, the composition of our Audit Committee, and whether the Company has an “audit committee financial expert”, is incorporated by reference from the information contained in the section entitled “Proposal 1—Election of Directors” in our Proxy Statement.
Adoption of Code of Ethics
We have adopted a Code of Business Conduct and Ethics (the “Code”) applicable to all of our board of director members, employees and executive officers, including our Chief Executive Officer (Principal Executive Officer), and Chief Financial Officer (Principal Financial Officer and Principal Accounting Officer). We have made the Code available on our website at http://www.neophotonics.com.
We intend to satisfy the public disclosure requirements regarding (1) any amendments to the Code, or (2) any waivers under the Code given to our Principal Executive Officer, Principal Financial Officer and Principal Accounting Officer by posting such information on our website at http://www.neophotonics.com. There were no amendments to the Code or waivers granted thereunder relating to the Principal Executive Officer, Principal Financial Officer or Principal Accounting Officer during 2017.
ITEM 11. EXECUTIVE COMPENSATION
The information required regarding the compensation of our directors and executive officers is incorporated herein by reference from the information contained in the sections entitled “Executive Compensation,” “Director Compensation,” “Compensation Committee Report” and “Compensation Committee Interlocks and Insider Participation” in our Proxy Statement.
ITEM 12. SECURITY OWNERSHIP OF CERTAIN BENEFICIAL OWNERS AND MANAGEMENT
The information required regarding security ownership of our 5% or greater stockholders and of our directors and management is incorporated herein by reference from the information contained in the section entitled “Security Ownership of Certain Beneficial Owners and Management” in our Proxy Statement.
The information required regarding securities authorized for issuance our equity compensation plans is incorporated herein by reference from the information contained in the section entitled “Equity Compensation Plan Information” in our Proxy Statement.
ITEM 13. CERTAIN RELATIONSHIPS AND RELATED TRANSACTIONS AND DIRECTOR INDEPENDENCE
The information required regarding related transactions is incorporated herein by reference from the information contained in the section entitled “Certain Relationships and Related Transactions” and, with respect to director independence, the section entitled “Proposal 1—Election of Directors” in our Proxy Statement.
ITEM 14. PRINCIPAL ACCOUNTING FEES AND SERVICES
The information required is incorporated herein by reference from the information contained in the sections entitled “Principal Accountant Fees and Services” and “Pre-Approval Policies and Procedures” in the section entitled “Proposal 2—Ratification of Appointment of Independent Registered Public Accounting Firm” in our Proxy Statement.
101
PART IV
ITEM 15. EXHIBITS AND FINANCIAL STATEMENT SCHEDULES
We have filed the following documents as part of this Form 10-K:
1. Consolidated Financial Statements:
Page No. | |
2. Financial Statement Schedules
All schedules have been omitted because they are not required, not applicable, not present in amounts sufficient to require submission of the schedule, or the required information is otherwise included.
3. Exhibits
102
Exhibit no. | Description of exhibit | Form | SEC File No. | Exhibit | Filing Date | Filed Herewith | |||||
2.1 | Form 8-K | 001-35061 | 2.1 | October 18, 2011 | |||||||
2.2 | Form 10-K | 001-35061 | 2.2 | March 15, 2013 | |||||||
2.3 | Form 8-K | 001-35061 | 10.1 | October 27, 2014 | |||||||
2.4 | Form 8-K | 001-35061 | 99.1 | January 8, 2015 | |||||||
2.5 | Form 8-K | 001-35061 | 10.1 | April 21, 2015 | |||||||
2.6* | Form 8-K | 001-35061 | 2.1 | January 23, 2017 | |||||||
2.7* | Form 8-K | 001-35061 | 2.2 | January 23, 2017 | |||||||
2.8* | Form 8-K | 001-35061 | 2.3 | January 23, 2017 | |||||||
3.1 | Form 8-K | 001-35061 | 3.1 | February 10, 2011 | |||||||
3.2 | Form S-1 | 333-166096 | 3.4 | November 22, 2010 | |||||||
4.1 | Form S-1/A | 333-166096 | 4.1 | May 17, 2010 | |||||||
4.2 | Form S-1 | 333-166096 | 4.2 | April 15, 2010 | |||||||
4.3 | Form S-1 | 333-201180 | 4.4 | December 19, 2014 | |||||||
10.1 | Form S-1 | 333-166096 | 10.1 | April 15, 2010 | |||||||
10.2+ | Form S-1 | 333-166096 | 10.2 | April 15, 2010 | |||||||
10.3+ | Form S-1 | 333-166096 | 10.3 | April 15, 2010 | |||||||
10.4+ | Form S-8 | 333-189577 | 99.1 | June 25, 2013 | |||||||
10.5+ | Form 10-K | 001-35061 | 10.5 | March 16, 2017 | |||||||
103
Exhibit no. | Description of exhibit | Form | SEC File No. | Exhibit | Filing Date | Filed Herewith | |||||
10.6+ | Form S-1 | 333-166096 | 10.5 | April 15, 2010 | |||||||
10.7 | Form S-1 | 333-166096 | 10.6 | July 23, 2010 | |||||||
10.8 | Form 10-Q | 001-35061 | 10.3 | August 8, 2013 | |||||||
10.9* | Form S-1 | 333-166096 | 10.9 | April 15, 2010 | |||||||
10.10 | Form 10-Q | 001-35061 | 10.3 | November 10, 2011 | |||||||
10.11 | Form 10-Q | 001-35061 | 10.4 | November 10, 2011 | |||||||
10.12+ | Form S-1 | 333-166096 | 10.17 | April 15, 2010 | |||||||
10.13+ | Form 10-K | 001-35061 | 10.18 | June 4, 2014 | |||||||
10.14+ | Form S-1 | 333-166096 | 10.19 | April 15, 2010 | |||||||
10.15*+ | Form S-1 | 333-166096 | 10.20 | April 15, 2010 | |||||||
10.20+ | Form S-8 | 333-177306 | 99.1 | October 13, 2011 | |||||||
10.21 | Form 10-K | 001-35061 | 10.35 | March 30, 2012 | |||||||
10.22+ | Form 10-Q | 001-35061 | 10.1 | May 10, 2012 | |||||||
104
Exhibit no. | Description of exhibit | Form | SEC File No. | Exhibit | Filing Date | Filed Herewith | |||||
10.23 | Form 10-K | 001-35061 | 10.36 | March 30, 2012 | |||||||
10.24+ | Form 10-Q | 001-35061 | 10.3 | May 10, 2012 | |||||||
10.25 | Form 8-K | 001-35061 | 10.1 | May 1, 2012 | |||||||
10.26 | Form 8-K | 001-35061 | 10.2 | May 1, 2012 | |||||||
10.27 | Form 8-K | 001-35061 | 10.1 | March 27, 2013 | |||||||
10.28 | Form 8-K | 001-35061 | 10.1 | January 17, 2014 | |||||||
10.29 | Form 8-K | 001-35061 | 10.1 | February 18, 2014 | |||||||
10.30 | Form 8-K | 001-35061 | 10.1 | March 10, 2014 | |||||||
10.31 | Form 8-K | 001-35061 | 10.1 | May 20, 2014 | |||||||
10.32+ | Form 10-Q | 001-35061 | 10.4 | June 24, 2014 | |||||||
10.33+ | Form 10-Q | 001-35061 | 10.1 | November 10, 2014 | |||||||
10.34** | Form 10-K | 001-35061 | 10.42 | March 16, 2015 | |||||||
10.35** | Form 10-K | 001-35061 | 10.43 | March 16, 2015 | |||||||
10.36 | Form 10-K | 001-35061 | 10.44 | March 16, 2015 | |||||||
10.37 | Form 8-K | 001-35061 | 10.1 | July 15, 2015 | |||||||
10.38* | Form 10-Q | 001-35061 | 10.2 | November 6, 2015 | |||||||
10.39 | Form 8-K | 001-35061 | 10.1 | January 28, 2015 | |||||||
105
Exhibit no. | Description of exhibit | Form | SEC File No. | Exhibit | Filing Date | Filed Herewith | |||||
10.40 | Form 8-K | 001-35061 | 10.1 | April 1, 2015 | |||||||
10.42* | Form 10-K | 001-35061 | 10.42 | March 15, 2016 | |||||||
10.43* | Form 10-K | 001-35061 | 10.43 | March 15, 2016 | |||||||
10.44 | Form 10-K | 001-35061 | 10.44 | March 15, 2016 | |||||||
10.45+ | Form 10-Q | 001-35061 | 10.1 | May 10, 2016 | |||||||
10.46+ | Form 10-Q | 001-35061 | 10.2 | August 9, 2016 | |||||||
10.47+ | Form 10-Q | 001-35061 | 10.3 | August 9, 2016 | |||||||
10.48+ | Form 10-Q | 001-35061 | 10.4 | August 9, 2016 | |||||||
10.49+ | Form 10-Q | 001-35061 | 10.5 | August 9, 2016 | |||||||
10.50+ | Form 10-Q | 001-35061 | 10.6 | August 9, 2016 | |||||||
10.51 | Form 10-Q | 001-35061 | 10.7 | November 8, 2016 | |||||||
10.52* | Form 10-Q | 001-35061 | 10.8 | November 8, 2016 | |||||||
10.53 | Form 10-Q | 001-35061 | 10.9 | November 8, 2016 | |||||||
10.54 | Form 10-Q | 001-35061 | 10.10 | November 8, 2016 | |||||||
10.55* | Form 10-Q | 001-35061 | 10.11 | November 8, 2016 | |||||||
10.56 | Form 10-Q | 001-35061 | 10.12 | November 8, 2016 | |||||||
106
Exhibit no. | Description of exhibit | Form | SEC File No. | Exhibit | Filing Date | Filed Herewith | |||||
10.57* | Form 10-Q | 001-35061 | 10.13 | November 8, 2016 | |||||||
10.58* | Form 10-Q | 001-35061 | 10.14 | November 8, 2016 | |||||||
10.59 | Form 10-K | 001-35061 | 10.59 | March 16, 2017 | |||||||
10.60** | Form 10-Q | 001-35061 | 10.2 | May 9, 2017 | |||||||
10.61 | Form 8-K | 001-35061 | 10.1 | June 19, 2017 | |||||||
10.62 | Form 10-Q | 001-35061 | 10.1 | August 9, 2017 | |||||||
10.63 | Form 8-K | 001-35061 | 10.1 | July 5, 2017 | |||||||
10.64 | Form 10-Q | 001-35061 | 10.4 | August 9, 2017 | |||||||
10.65+ | Form 10-Q | 001-35061 | 10.5 | August 9, 2017 | |||||||
10.66+ | Form 10-Q | 001-35061 | 10.6 | August 9, 2017 | |||||||
10.67+ | Form 10-Q | 001-35061 | 10.1 | November 8, 2017 | |||||||
10.68+ | Retention Agreement dated August 14, 2017 by and between NeoPhotonics Corporation and Elizabeth Eby. | Form 10-Q | 001-35061 | 10.2 | November 8, 2017 | ||||||
10.69 | Form 8-K | 001-35061 | 10.1 | September 7, 2017 | |||||||
10.70 | Form 8-K | 001-35061 | 10.1 | September 11, 2017 | |||||||
10.71* | Form 8-K | 001-35061 | 10.1 | December 18, 2017 | |||||||
10.72+ | X | ||||||||||
10.73** | X | ||||||||||
10.74+ | X | ||||||||||
21.1 | X | ||||||||||
23.1 | X | ||||||||||
24.1 | X | ||||||||||
31.1 | X | ||||||||||
31.2 | X | ||||||||||
32.1 | X | ||||||||||
107
Exhibit no. | Description of exhibit | Form | SEC File No. | Exhibit | Filing Date | Filed Herewith | |||||
101.INS | XBRL Instance Document. | ||||||||||
101.SCH | XBRL Taxonomy Extension Schema Document. | ||||||||||
101.CAL | XBRL Taxonomy Extension Calculation Linkbase Document. | ||||||||||
101.DEF | XBRL Taxonomy Extension Definition Linkbase Document. | ||||||||||
101.LAB | XBRL Taxonomy Extension Label Linkbase Document. | ||||||||||
101.PRE | XBRL Taxonomy Extension Presentation Linkbase Document. | ||||||||||
*Translation to English of an original Chinese document.
**Translation to English of an original Japanese document.
+Management compensatory plan or arrangement.
ITEM 16. FORM 10-K SUMMARY
None.
108
SIGNATURES
Pursuant to the requirements of Section 13 or 15(d) of the Securities Exchange Act of 1934, the Registrant has duly caused this Annual Report on Form 10-K to be signed on its behalf by the undersigned, thereunto duly authorized.
NeoPhotonics Corporation | ||
By: | /S/ TIMOTHY S. JENKS | |
Timothy S. Jenks | ||
President, Chief Executive Officer and | ||
Chairman of the Board of Directors | ||
March 8, 2018
POWER OF ATTORNEY
KNOW ALL PERSONS BY THESE PRESENTS, that each person whose signature appears below constitutes and appoints Timothy S. Jenks and Elizabeth Eby, and each of them, jointly and severally, his/her attorneys-in-fact, each with the power of substitution, for him/her in any and all capacities, to sign any and all amendments to this Annual Report on Form 10-K and to file the same, with exhibits thereto and other documents in connection therewith, with the Securities and Exchange Commission, hereby ratifying and confirming all that each of said attorneys-in-fact, or his/her substitute or substitutes, may do or cause to be done by virtue hereof.
Pursuant to the requirements of the Securities Exchange Act of 1934, this report has been signed by the following persons on March 8, 2018 on behalf of the Registrant and in the capacities and on the dates indicated:
Signature | Title | Date | ||
/s/ TIMOTHY S. JENKS | President, Chief Executive Officer and | March 8, 2018 | ||
Timothy S. Jenks | Chairman of the Board of Directors | |||
(Principal Executive Officer) | ||||
/s/ ELIZABETH EBY | Senior Vice President, Finance and Chief | March 8, 2018 | ||
Elizabeth Eby | Financial Officer (Principal Financial and | |||
Accounting Officer) | ||||
/s/ CHARLES J. ABBE | Director | March 8, 2018 | ||
Charles J. Abbe | ||||
/s/ DMITRY AKHANOV | Director | March 8, 2018 | ||
Dmitry Akhanov | ||||
/s/ BANDEL L. CARANO | Director | March 8, 2018 | ||
Bandel L. Carano | ||||
/s/ RAJIV RAMASWAMI | Director | March 8, 2018 | ||
Rajiv Ramaswami | ||||
/s/ MICHAEL J. SOPHIE | Director | March 8, 2018 | ||
Michael J. Sophie | ||||
/s/ IHAB S. TARAZI | Director | March 8, 2018 | ||
Ihab S. Tarazi | ||||
109