Attached files
| file | filename |
|---|---|
| EX-32 - EX-32 - HACKETT GROUP, INC. | hckt-ex32_25.htm |
| EX-31.2 - EX-31.2 - HACKETT GROUP, INC. | hckt-ex312_23.htm |
| EX-31.1 - EX-31.1 - HACKETT GROUP, INC. | hckt-ex311_24.htm |
| EX-23.1 - EX-23.1 - HACKETT GROUP, INC. | hckt-ex231_21.htm |
| EX-21.1 - EX-21.1 - HACKETT GROUP, INC. | hckt-ex211_20.htm |
UNITED STATES
SECURITIES AND EXCHANGE COMMISSION
WASHINGTON, D.C. 20549
FORM 10-K
|
☒ |
ANNUAL REPORT PURSUANT TO SECTION 13 OR 15(d) OF THE SECURITIES EXCHANGE ACT OF 1934 |
FOR T HE FISCAL YEAR ENDED December 29, 2017
OR
|
☐ |
TRANSITION REPORT PURSUANT TO SECTION 13 OR 15(d) OF THE SECURITIES EXCHANGE ACT OF 1934 |
FOR THE TRANSITION PERIOD FROM TO
COMMISSION FILE NUMBER 333-48123
The Hackett Group, Inc.
(Exact name of registrant as specified in its charter)
|
FLORIDA |
|
65-0750100 |
|
(State or other jurisdiction of |
|
(I.R.S. Employer |
|
|
|
|
|
1001 Brickell Bay Drive, Suite 3000 Miami, Florida |
|
33131 |
|
(Address of principal executive offices) |
|
(Zip Code) |
(305) 375-8005
(Registrant’s telephone number, including area code)
Securities registered pursuant to Section 12(b) of the Act:
|
(Title of each class) |
|
(Name of each exchange on which registered) |
|
Common Stock, par value $.001 per share |
|
NASDAQ Stock Market |
Securities registered pursuant to Section 12(g) of the Act:
None
Indicate by check mark if the registrant is a well-known seasoned issuer, as defined in Rule 405 of the Securities Act. Yes ☐ No ☒
Indicate by check mark if the registrant is not required to file reports pursuant to Section 13 or Section 15(d) of the Exchange Act. Yes ☐ No ☒
Indicate by check mark whether the registrant: (1) has filed all reports required to be filed by Section 13 or 15(d) of the Securities Exchange Act of 1934 during the preceding 12 months (or for such shorter period that the registrant was required to file such reports), and (2) has been subject to such filing requirements for the past 90 days. Yes ☒ No ☐
Indicate by check mark whether the registrant has submitted electronically and posted on its corporate Website, if any, every Interactive Data File required to be submitted and posted pursuant to Rule 405 of Regulation S-T (§ 232.405 of this chapter) during the preceding 12 months (or for such shorter period that the registrant was required to submit and post such files). Yes ☒ No ☐
Indicate by check mark if disclosure of delinquent filers pursuant to Item 405 of Regulation S-K (§229.405) is not contained herein, and will not be contained, to the best of registrant’s knowledge, in definitive proxy or information statements incorporated by reference in Part III of this Form 10-K or any amendment to this Form 10-K. ☐
Indicate by check mark whether the registrant is a large accelerated filer, an accelerated filer, or a non-accelerated filer, or a smaller reporting company, or an emerging growth company. See the definitions of “large accelerated filer,” “accelerated filer” and “smaller reporting company”, and “emerging growth company” in Rule 12b-2 of the Exchange Act.
|
Large Accelerated Filer |
☐ |
Accelerated Filer |
☒ |
|
Non-accelerated Filer |
☐ (Do not check if a smaller reporting company) |
Smaller reporting company |
☐ |
|
Emerging growth company |
☐ |
|
|
If an emerging growth company, indicate by check mark if the registrant has elected not to use the extended transition period for complying with any new or revised financial accounting standards provided pursuant to Section 13(a) of the Exchange Act. ☐
Indicate by check mark whether the registrant is a shell company (as defined in Rule 12b-2 of the Exchange Act). Yes ☐ No ☒
The aggregate market value of the common stock held by non-affiliates of the registrant was $357,550,986 on June 30, 2017 based on the last reported sale price of the registrant’s common stock on the NASDAQ Global Market.
The number of shares of the registrant’s common stock outstanding on March 6, 2018 was 29,227,112.
DOCUMENTS INCORPORATED BY REFERENCE
Part III of this Annual Report on Form 10-K incorporates by reference certain portions of the registrant’s proxy statement for its 2018 Annual Meeting of Shareholders to be filed with the Commission not later than 120 days after the end of the fiscal year covered by this report.
TABLE OF CONTENTS
|
|
|
Page |
|
FORM 10-K PART I |
||
|
ITEM 1. |
4 |
|
|
ITEM 1A. |
11 |
|
|
ITEM 1B. |
15 |
|
|
ITEM 2. |
15 |
|
|
ITEM 3. |
15 |
|
|
ITEM 4. |
15 |
|
|
PART II |
||
|
ITEM 5. |
16 |
|
|
ITEM 6. |
19 |
|
|
ITEM 7. |
Management’s Discussion and Analysis of Financial Condition and Results of Operations |
20 |
|
ITEM 7A. |
26 |
|
|
ITEM 8. |
27 |
|
|
ITEM 9. |
Changes in and Disagreements with Accountants on Accounting and Financial Disclosure |
56 |
|
ITEM 9A. |
56 |
|
|
ITEM 9B. |
59 |
|
|
PART III |
||
|
ITEM 10. |
59 |
|
|
ITEM 11. |
59 |
|
|
ITEM 12. |
Security Ownership of Certain Beneficial Owners and Management and Related Stockholder Matters |
59 |
|
ITEM 13. |
Certain Relationships and Related Transactions, and Director Independence |
59 |
|
ITEM 14. |
59 |
|
|
PART IV |
||
|
ITEM 15. |
60 |
|
|
ITEM 16. |
60 |
|
|
61 |
||
|
63 |
||
2
CAUTIONARY NOTE REGARDING FORWARD-LOOKING STATEMENTS
This report and the information incorporated by reference in it include “forward-looking statements” within the meaning of Section 27A of the Securities Act of 1933 and Section 21E of the Securities Exchange Act of 1934. We intend the forward-looking statements to be covered by the safe harbor provisions for forward-looking statements in these sections. All statements regarding our expected financial position and operating results, our business strategy, our financing plans and forecasted demographic and economic trends relating to our industry are forward-looking statements. These statements can sometimes be identified by our use of forward-looking words such as “may,” “will,” “anticipate,” “estimate,” “expect,” or “intend” and similar expressions. These statements involve known and unknown risks, uncertainties and other factors that may cause our actual results, performance or achievements to be materially different from the results, performance or achievements expressed or implied by the forward-looking statements. We cannot promise you that our expectations in such forward-looking statements will turn out to be correct. Factors that could impact such forward-looking statements include, among others, our ability to attract additional business, the timing of projects and the potential for contract cancellation by our customers, changes in expectations regarding the business and information technology industries, our ability to attract and retain skilled employees, possible changes in collections of accounts receivable due to the bankruptcy or financial difficulties of our customers, risks of competition, price and margin trends, and changes in general economic conditions, foreign exchange rates and interest rates. An additional description of our risk factors is described in Part I – Item 1A. “Risk Factors”. We undertake no obligation to update or revise publicly any forward-looking statements, whether as a result of new information, future events or otherwise, except as required by law.
3
GENERAL
In this Annual Report on Form 10-K, unless the context otherwise requires, “Hackett,” the “Company,” “we,” “us,” and “our” refer to The Hackett Group, Inc. and its subsidiaries and predecessors. We were originally incorporated on April 23, 1997.
The Hackett Group is an intellectual property-based strategic consultancy and leading enterprise benchmarking and best practices implementation firm serving global companies. Services include benchmarking, executive advisory, business transformation, enterprise performance management, working capital management, implementing, training and advisory to global business services. The Hackett Group also provides dedicated expertise in business strategy, operations, finance, human capital management, strategic sourcing, procurement, and information technology, including its award-winning Oracle and SAP practices.
The Hackett Group has completed more than 15,200 benchmarking and performance studies with major organizations, including 97% of the Dow Jones Industrials, 89% of the Fortune 100, 87% of the DAX 30 and 59% of the FTSE 100. These studies drive its Best Practice Intelligence Center™ which includes the firm's benchmarking metrics, best practices repository, and best practice configuration and process flow accelerators, which enable The Hackett Group’s clients and partners to achieve world-class performance.
The rapid development and move to cloud applications and infrastructure along with improving analytics, mobile functionality and enhanced user experience is dramatically influencing the way businesses compete and deliver their services. This is redefining entire industries at an accelerated pace, forcing organizations to fundamentally change and adopt these new capabilities in order to remain competitive. Traditional sequential and linear-based business models are changing to fully networked and dynamic automated workflows and events with enhanced analytics. This era is very attractive to our sector since we believe clients will increasingly require organizational and technology implementation insight on what technology can deliver and what changes in business models are required to justify significant investments.
As we entered 2017, our goal was to fully reposition all of our offerings to the emerging opportunities which started by digitizing all of our benchmarking and best practices intellectual property (“IP”). We wanted to deliver our proprietary insight in new ways and to do so efficiently and whenever possible, virtually. This also required us to change the way we go to market and engage clients. The following are some of the key actions and achievements of the year:
|
|
• |
Expanded Cloud Capabilities - We expanded our Oracle Cloud applications addressable market from Enterprise Performance Management (“EPM”) to include ERP and the entire Oracle Cloud applications suite through the acquisition of Jibe Consulting. This move quadrupled our Oracle Cloud addressable market and positioned us as a strategic Oracle Cloud applications consultancy. |
|
|
• |
Expanded RPA Advisory Capabilities – We expanded our ability to help clients assess and implement the rapidly emerging Robotics Process Automation (“RPA”) and related smart automation technologies through the acquisition of Aecus, Ltd. and an aggressive organic development effort. |
|
|
• |
Launched Quantum Leap – We launched our next generation benchmarking and continuous improvement software as a service solution. This market leading benchmark solution will allow us to improve the client experience by delivering twice the insight and to reducing the client effort by half, thus redefining our benchmarking leadership and we expect to further distance us from the competition. |
|
|
• |
Launched the Hackett Digital Transformation Platform (“DTP”) - This required us to further digitize our IP and the way we shared and delivered our IP with our clients across our benchmarking, advisory, transformation and Cloud ERP and EPM application solutions. The Hackett DTP improves efficiency by accelerating the speed to value by helping an organization achieve their performance targets through a combination of benchmark metrics, best practices and configuration and process flow accelerators in a fully automated platform. |
|
|
• |
Expanded our IP as a Service Revenue - We used our DTP to expand our offerings to ADP. We believe the new platform should allow us to attract new alliances partners that can leverage our unique benchmarking and best practices IP to help them differentiate and sell their software or services solutions. |
|
|
• |
Launched the Hackett Institute and acquired the joint venture interest of our CGBS Program - We moved our training content to a state-of-the-art learning management system, which we believe is better aligned with our client demands. We also launched our Enterprise Analytics training and certification programs. Given the unique nature of our best practice content and the favorable market reaction to our CGBS offering we believe that continuing education is a significant growth opportunity for our organization. |
We continue to expect one of the key drivers for our growth to come from the growing leverage of our so called “wedge” offering, or Benchmarking and Best Practices Advisory, including our IP as a Service products. This has only been further accentuated by the launch of our new software as a service benchmarking solution, Quantum Leap as well as the launch of our Digital Transformation Platform.
4
OUR PROPRIETARY BEST PRACTICE IMPLEMENTATION INTELLECTUAL CAPITAL
Hackett uses its proprietary Best Practice Implementation (“BPI”) intellectual capital to help clients improve their performance. Our benchmark offerings allow clients to empirically quantify their performance improvement opportunity at an actionable level. It also provides us visibility into how leading global companies deploy technology or organizational strategies to optimize their performance. This insight results in a proprietary Best Practices Repository as well as best practice software configuration and organizational strategies which are only available from the unique vantage point provided from our Benchmarking solutions. Utilizing the benchmarking metrics and repository of best practices, combined with the global strategy and implementation insight of our transformation and technology associates, Hackett has also created a series of organizational and technology accelerators that allow clients to effect proven sustainable performance improvement.
During 2017 we launched the first version of the Hackett Digital Transformation Platform. This required us to further digitize much of our BPI intellectual capital and the way we shared it with our clients across our benchmarking, advisory, transformation and Cloud ERP and EPM application solutions. Our ability to fully digitize our IP and align proven technology and organizational solutions to help clients drive transformational change allows us to highly differentiate our offerings. It also allows us to engage and support clients more efficiently, increasingly remotely and where appropriate continuously.
Our BPI approach leverages our inventory of Hackett-Certified™ practices, observed through benchmark and other BPI engagements, to correlate best practices with superior performance levels. We utilize Capability Maturity Models to better understand our client’s capabilities and organizational maturity, so that we can determine the level of performance that they can realistically pursue. In addition, we utilize Hackett’s intellectual capital in the form of best practice process flows and software configuration guides to integrate Hackett’s empirically proven best practices directly into business processes and workflows that are enabled by enterprise software applications. The repository of best practice process flows and software configuration guides now reside in the Best Practice Intelligence Center portal as well as in our new releases of our Digital Transformation Platform. This allows us to utilize our IP to be used on client engagements to ensure that best practices are identified and implemented, whenever possible. This coordinated approach addresses people, process, information and technology all within the framework of our Best Practices.
Because Hackett solutions are based on Hackett-Certified™ best practices, we believe that clients gain significant advantages. Clients can have confidence that their solutions are based on strategies from the world’s leading companies. More importantly, Hackett solutions deliver enhanced efficiency, improved effectiveness and reduced implementation risk.
The BPI approach, which is now enhanced with the launch of our Digital Transformation Platform (“DTP”), often begins with a clear understanding of current performance, which is normally gained through benchmarking key processes and comparing the results to world-class levels and industry standards captured in the Hackett database. We then help clients prioritize and select the appropriate best practices to implement through a coordinated performance improvement strategy. Without a coordinated strategy that addresses the seven key business components which include organization and governance, process design, process sourcing, service placement, information, enabling technology and skills and talent, we believe companies risk losing a significant portion of business case benefits of their investments. We have designed detailed best practice process flows based on Hackett’s deep knowledge of world-class business performance which enable clients to streamline and automate key processes, and generate performance improvements quickly and efficiently at both the functional and enterprise level.
Similarly, we integrate Hackett-Certified™ best practices directly into technology solutions. We believe it is imperative that companies simplify and automate processes to meet best practice standards before new technology implementations and upgrades are completed. The automation of inefficient processes only serves to continue to drive up costs, cycle times and error rates. We have completed detailed fit-gap analyses in most functional areas of major business application packages including Oracle and SAP to determine their ability to support best practices. Application-specific tools, implementation guides and process flows allow us to optimize the configuration of best of breed software. BPI establishes the foundation for improved performance.
We believe the combination of optimized processes, best practice-based business applications and enhanced business intelligence environments allow our clients to achieve and sustain significant business performance improvement. The specific client circumstances normally dictate how they engage us. Our goal is to be responsive to client needs, and to establish a continuous and trusted relationship. We have developed a series of offerings that allow us to efficiently help the client without regard to where they are in their performance improvement lifecycle.
COMPETITION
The strategic business advisory and technology consulting marketplace continues to be extremely competitive. The marketplace will remain competitive as companies continue to look for ways to improve their organizational effectiveness. Our competitors include international accounting firms; international, national and regional strategic consulting and systems implementation firms; and the IT services divisions of application software firms. Mergers and consolidations throughout our industry have resulted in higher levels of competition. We believe that the principal competitive factors in the industries in which we compete include skills and capabilities of
5
people, innovative services and product offerings, perceived ability to add value, reputation and client references, price, scope of services, service delivery approaches, technical and industry expertise, quality of services and solutions, ability to deliver results on a timely basis, availability of appropriate resources, and global reach and scale. We acknowledge that many of our competitors are larger however we believe very few, if any, of our competitors have proprietary intellectual capital similar to the benchmarking based performance metrics and BPI insight that emanates from our Transformational Benchmark and Best Practices Advisory offerings.
In spite of our size relative to our competitor group, we believe our competitive position is distinct. With Hackett’s best practice intellectual capital and its direct link to our BPI/DTP approach, we believe we can empirically and objectively assist our clients. Our ability to apply best practices to client operations via proven techniques is at the core of our competitive standing.
Similarly, we believe that Hackett is the definitive source for best practice performance metrics and strategies. Hackett has conducted more than 15,200 benchmark and performance studies over 24 years at over 5,300 clients, generating proprietary data sets spanning multiple performance metrics and correlating best practices with superior performance. The combination of Hackett benchmark data, along with deep expertise and knowledge in evaluating, designing and implementing business transformation strategies leveraging our proprietary Best Practices Repository, delivers a powerful and distinct value proposition to our clients.
Our culture of client collaboration leverages the power of our cross-functional and service line teams to increase revenue and strengthen relationships. We believe that this culture, along with terrific talent and with our intellectual capital-centric approach, gives us a distinct competitive advantage.
STRATEGY
We remain focused on executing the following strategies:
|
|
• |
Expand our brand or market permission to our other offerings. We believe that our long-term growth prospects depend on our ability to extend our unique market permission to help clients and strategic partners measure their performance improvement opportunity, using our proprietary benchmark database into our other offerings. We have started to extend our permission through the strategic relationship that results from our Best Practices Advisory Programs. However, our most significant growth opportunity is in our ability to extend our brand and market permission into our enterprise transformation and other best practice implementation offerings which create a significant opportunity to grow revenue per client. |
|
|
• |
Continue to position and grow Hackett as an IP-centric strategic advisory organization. We believe that the Hackett brand is widely recognized for benchmarking metrics and best practice strategies. By building a series of highly complementary on-site and off-site offerings that allow our client’s access to our IP which is based on our best practice process and technology implementation insight, we are able to build trusted strategic relationships with our clients. Depending upon where our clients are in their assessment or implementation of performance improvement initiatives, we offer them a combination of offerings that support their efforts. |
We believe that clients that leverage our IP are more likely to allow us to serve them more broadly. IP-based services enhance our opportunities to serve clients remotely, continuously and more profitably. Our goal is to use our unique intellectual capital to establish a strategic relationship with our clients directly or through strategic alliances and channels and to further use that entry point to introduce our business transformation and technology capabilities.
In 2017, we launched Quantum Leap and our first version of the Hackett Digital Transformation Platform to expand and hopefully attract new alliance partners that can leverage our unique benchmarking and best practices IP to help them differentiate and sell their software or services solutions. This allowed us to expand our offerings to existing partners and develop new offerings in 2017 which should allow us to attract new alliance partners. At the end of the fourth quarter of 2017 our Executive and Best Practice Advisory Members had over 300 clients. This excludes hundreds of additional clients that we now serve through our IP as a Service alliances and training solutions.
Consistent with prior years, well over 70% of our Hackett sales were also Advisory or Benchmarking clients, which continues to support the leverage of this entry or IP-wedge offering.
If our clients need off-site access to our IP and advisors to help them either assess or execute on their own, they can avail themselves of our Best Practices Advisory Programs or our new IP as a Service offerings. The key is for the client to know that we can support them strategically by leveraging our unique IP and insight so that we are able to build a strategic relationship which is appropriate for them. We also believe that clients that value our IP will turn to us for other services when the need arises, allowing us over time to ascribe a larger amount of our total revenue to our existing client base, which will improve the predictability of our results. We continue to explore ways to leverage our IP through new external strategic partners and their channels.
6
In the fourth quarter of 2015, we launched a program with ADP that added a dedicated Hackett Best Practices advisory program to ADP’s Vantage HCM ® solution. Our success with this program allowed us to further expand our program to additional ADP software and services solutions during 2017. Given our success with ADP and our investment in DTP, we are now in a stronger position to attract new alliance partners and to support and accelerate their sales initiatives as well as and their client’s continuous improvement efforts. We believe this capability is uniquely Hackett’s given our strong brand permission and benchmarking and best practice capability and technology.
In late 2015, we also launched the Association of Certified GBS Professionals Program with the Chartered Institute of Management Accountants (“CIMA”). This relationship allowed us to build an entirely new professional development business that provided globally recognized certifications for shared services and global business service professionals. As a result of the favorable market reaction to the way our IP was used as the core training content for this program, in 2017, we launched The Hackett Institute and acquired CIMA interest in this program. This allow us to develop our own certification brand and standard. Additionally, we moved our CGBS program to a new state of the art learning management system that will allow us to better meet our large global client’s requirements. We believe that training and certification is a great way to leverage our IP in a high gross margin revenue growth area for our business.
In 2017 we announced our new Enterprise Analytics training and certification course and the introduction of The Hackett Institute. We believe that our clients analytical skills will significantly grow over the next decade as companies realize the value of data and related insight and realize the need to extend these skills in a meaningful way throughout the enterprise. Given the unique nature of our Best Practice content and the recognized value we have experienced with our CGBS offering we now believe that continuing education provides a significant growth opportunity for our organization.
|
|
• |
Continue to expand our BPI/DTP Content and Technology. BPI/DTP incorporates intellectual capital from Hackett into our implementation tools and techniques. For clients, the end results are tangible cost and performance gains and improved returns on their organizational and technology investments. Many clients attribute their decision to employ us based on our BPI IP and accelerators. Our objective is to help clients make smarter business process and software configuration decisions as a result of our BPI methods and knowledge. We are continuously updating our BPI content and tools through benchmarking, enterprise transformation and research activities. Additional BPI updates are also driven by new software releases that drive innovation in business process automation. In 2017, we invested in the automation and further integration of our various metrics, best practices and best practice acceleration tools into DTP. This effort will continue in 2018. |
|
|
• |
Recruit and develop talent. As we continue to grow and realize the potential of our business model, it has become increasingly evident that the primary limit to our growth will be our ability to attract, retain, develop and motivate associates. We continue to invest in associate development programs that are specifically targeted to improve our go-to-market and delivery execution. |
|
|
• |
Leverage our offshore capabilities. Leveraging an offshore resource capability to support the delivery of our offerings has been a key strategy for our organization. Our facilities in Hyderabad, India and Montevideo, Uruguay allow us to increase operational efficiencies and build targeted key capabilities that can appropriately support the delivery of our offerings and internal functional teams. |
|
|
• |
Seek out strategic acquisitions. We will continue to pursue strategic acquisitions that strengthen our ability to compete and expand our IP. We believe that our unique Hackett access and our BPI approach, coupled with our strong balance sheet and infrastructure, can be utilized to support a larger organization. We plan to pursue acquisitions that are accretive or have strong growth prospects, and most importantly, have strong synergy with our best practice intellectual capital focus. |
OUR OFFERINGS
We offer a comprehensive range of services, including executive advisory programs, benchmarking, business transformation and technology consulting services. With strategic and functional knowledge in finance, human resources, information technology, procurement, supply chain management, corporate services, customer service, and sales and marketing, our expertise extends across the enterprise. We have completed successful engagements in a variety of industries, including automotive, consumer goods, financial services, technology, life sciences, manufacturing, media and entertainment, retail, telecommunications, transportation and utilities.
The Hackett Group
|
• |
Executive and Best Practices Advisory Programs |
7
Our Advisory programs provide on-demand access to world-class performance metrics, peer-learning opportunities and best practice implementation advice. The scope of Hackett’s advisory programs is defined by business function (Executive Advisory) and by end-to-end process coverage (Process Advisory) and by Software Program (ADP Vantage). Our advisory programs include a mix of the following deliverables:
|
|
• |
Best Practice Intelligence Center: Online, searchable repository of best practices, performance metrics, conference presentations and associated research available to Executive and Best Practices Advisory Program Members and their support teams. |
|
|
• |
Best Practice Accelerators: Dedicated web based access to best practices, customized software configuration tools, best practice process flows used to support the sale, configuration and organizational implementation and post implementation support efforts of partner software. |
|
|
• |
Advisor Inquiry: Hackett’s inquiry services are used by clients for quick access to fact-based advice on proven approaches and methods to increase the efficiency and effectiveness of selling, general and administrative processes. |
|
|
• |
Best Practice Research: Empirically-based research and insight derived from Hackett benchmark, performance and transformation studies. Our research provides detailed insights into the most significant proven approaches in use at world-class organizations that yield superior business results. |
|
|
• |
Peer Interaction: Regular member-led webcasts, annual Best Practice Conferences, annual Member Forums, membership performance surveys and client-submitted content, provide ongoing peer learning and networking opportunities. |
|
|
• |
Introduction of New IP- centric Offerings: We are continuing to seek new opportunities through strategic alliances and channels to use our IP to help others sell and deliver their products, such as those offered through our CGBS and ADP programs. We continue to look for other potential programs through which to introduce new IP-centric offerings. |
|
• |
Benchmarking Services |
Our benchmarking group dates back to 1991, and has measured and evaluated the efficiency and effectiveness of enterprise functions for over 5,300 organizations globally. This includes 97% of the Dow Jones Industrials, 89% of the Fortune 100, 87% of the DAX 30 and 59% of the FTSE 100. Ongoing studies are conducted in a wide range of areas, including selling, general and administrative, finance, human resources, information technology, procurement, enterprise performance management, shared service centers and working capital management. Hackett has identified over 2,000 best practices for over 115 processes in these key functional areas and uses proprietary performance measurement tools and data collection processes that enable companies to complete the performance measurement cycle and identify and quantify improvement opportunities in as little as four weeks. Benchmarks are used by our clients to objectively establish priorities, generate organizational consensus, align compensation to establish performance goals, and develop the required business case for business and technology investments.
|
• |
Strategy and Business Transformation |
Our Business Transformation practices help clients develop a coordinated strategy for achieving performance improvements across the enterprise. Our experienced teams utilize Hackett performance measurement data to link performance gains to industry best practices. Our strategic capabilities include operational assessments, process and organization design, change management and the effective application of technology. We combine best practices knowledge with business expertise and broad technology capabilities, which we believe enables our programs to optimize return on client investments in people, process, technology and information. Through REL, a leader in generating cash flow improvement from working capital, we offer services which are designed to help companies improve cash flow from operations through improved working capital management, reduced costs and increased service quality.
8
Our EEA practice focuses on helping clients maximize the value of their investments in Enterprise Software and business analytics. In 2017, we acquired Oracle ERP and Cloud implementation capabilities. This allowed us to quadruple the size of our Oracle addressable market and strongly positioned us to be a strategic provide of Oracle’s rapidly growing cloud software and services market. The software market is rapidly moving to cloud-based software, which led us to aggressively transition our Oracle group from being primarily focused on the implementation of Oracle EPM on-premise software to the entire Oracle Cloud Enterprise Suite. We believe the actions we took to expand our Oracle Cloud capabilities from EPM on-premise to the entire Oracle Cloud ERP Suite have strongly positioned us to take advantage of this secular cloud migration growth opportunity. Another significant investment we made during the year was to digitize all of our IP and to build our proprietary Hackett DTP. By specifically building one of our first versions around the Oracle Cloud application functionality, we believe we can quickly demonstrate how to optimize the configuration of Oracle Cloud applications to drive to its fully intended transformative outcome. We believe these moves align our EEA practices with the Oracle go-to-market strategy and will also allow us to use our unique best-practice implementation IP to demonstrate the value of Oracle Cloud apps for the Oracle sales channel. These improvements cover many aspects of service delivery, including process improvement, technology deployment, organizational alignment, information and data definition and skills and competency alignment. Solutions typically reside in three primary areas: Core Financial Close and Consolidation, Integrated Business Planning, and Reporting / Advanced Analytics. Solution innovations have taken the practice into areas such as Big Data, cloud technology data management and governance, and Industry-specific analytic templates. This practice works closely with Oracle technology offerings and was the #1 Oracle Cloud EPM partner in 2017.
|
• |
SAP Solutions |
Our SAP Solutions professionals help clients choose and deploy the purchase of on-premise and cloud software applications that best meet their needs and objectives. Our expertise is focused on SAP ERP (with primary focus on Life Sciences and Consumer Goods). The group offers comprehensive services from planning, architecture, and vendor evaluation and selection through implementation, customization, testing and integration. Comprehensive fit-gap analyses of all major packages against Hackett Best Practices are utilized by our SAP Solutions teams. BPI tools and templates help integrate best practices into business and analytical applications. The group also offers post-implementation support, change management, exception management, process transparency, system documentation and end-user training, all of which are designed to enhance return on investment. We also provide off-shore application development and Application Maintenance and Support (“AMS”) services. These services include post-implementation support for select business application and infrastructure platforms. Our SAP Solutions group also includes a division responsible for the sale of the SAP suite of applications.
9
We focus on developing long-term client relationships with Global 2000 firms and other sophisticated buyers of business and IT consulting services. During 2017, 2016 and 2015, our ten most significant clients accounted for 21%, 24% and 24% of revenue, respectively. In addition, during 2017, 2016 and 2015 our largest client generated 4% of total revenue. We have achieved a high level of satisfaction across our client base. The responses to our client satisfaction surveys have generally been positive. We receive surveys from a significant number of our engagements which are utilized in a rigorous process to improve our delivery execution, sales processes, methodologies and training.
BUSINESS DEVELOPMENT AND MARKETING
Our extensive client base and relationships with Global 2000 firms remain our most significant sources of new business. Our revenue generation strategy is formulated to ensure that we are addressing multiple facets of business development. The categories below define our business development resources. Our primary goal is to continue to increase awareness of our brand which we have created around Hackett’s empirical knowledge capital and BPI in the extended enterprise that we now serve. We have a regional sales and market development effort in both North America and Europe, so we can better coordinate the sales and marketing messages from our various offerings. Our compensation programs for our associates reflect an emphasis on optimizing our total revenue relationship with our clients. In our technology practice groups, we have continued to utilize Hackett intellectual capital that resides in our BPI tools as a way to differentiate the relationships we have with the software providers and with our clients.
BUSINESS DEVELOPMENT RESOURCES
Although virtually all of our advisors and consultants have the ability to and are expected to contribute to new revenue opportunities, our primary internal business development resources are comprised of the following:
|
|
• |
The Leadership Team, Principals and Senior Directors are comprised of our senior leaders who have a combination of executive, regional, practice and anchor account responsibilities. In addition to their management responsibilities, this group of associates is responsible for growing the business by fostering executive-level relationships within accounts and leveraging their existing contacts in the marketplace. |
|
|
• |
The Sales Organization is comprised of associates who are 100% dedicated to generating sales. They are deployed geographically in key markets, are primarily focused on developing new relationships and are aligned to our core practice areas within their target accounts. They also handle opportunities in their geographic territories as they arise. |
|
|
• |
The Business Development Associates are comprised of trained groups of telemarketing specialists who are conversant with their respective solution areas. Lead generation is coordinated with our marketing and sales groups to ensure that our inbound and outbound efforts are synchronized with targeted marketing and sales programs. |
|
|
• |
The Delivery Organization is comprised of our billable associates who work at client locations. We encourage associates to pursue additional business development opportunities through their normal course of delivering existing projects thereby helping us expand our business within existing accounts. |
In addition to our business development resources, we have a corporate marketing and communications organization responsible for overseeing our marketing programs, public relations and employee communications activities.
We have organized our market focus into the following categories:
|
|
• |
Strategic Accounts are comprised of large prospects and existing relationships which we believe will have a significant revenue relationship within the next 18 months. Strategic account criteria include the size of the company, industry affiliation, propensity to buy external consulting services and contacts within the account. The sales representative working closely with regional leadership is primarily responsible for identifying business opportunities in the account, acting as the single point of coordination for the client, and performing the general duties of account manager. |
|
|
• |
Regional Accounts are accounts within a specified geographic location. These accounts mostly include large prospects, dormant clients, existing medium-sized clients and mid-tier market accounts and are handled primarily on an opportunistic basis, except for active clients where delivery teams are focused on driving additional revenue. |
|
|
• |
Strategic Alliance Accounts are accounts that allow us to partner with organizations of greater scale or different skill sets or with software developers enabling all parties to jointly market their products and services to prospective clients. |
10
We fully believe that our culture fosters intellectual creativity, collaboration and innovation. We believe in building relationships with both our associates and clients. We believe the best solutions come from teams of diverse individuals addressing problems collectively and from multiple dimensions, including the business, technological and human dimensions. We believe that the most effective working environment is one where everyone is encouraged to contribute and is rewarded for that contribution. Our core values are the strongest expression of our working style and represent what we stand for. These core values are:
|
|
• |
Continuous development of our associates, our unique content business model and our knowledge base; |
|
|
• |
Diversity of backgrounds, skills and experiences; |
|
|
• |
Knowledge capture, contribution and utilization; and |
|
|
• |
Collaboration with one another, our partners and our clients. |
Our human resources staff includes seasoned professionals in North America, Europe and South America who support our practices by, among other things, administering our benefit programs and facilitating the hiring process. Our human resources staff also includes dedicated individuals who recruit consultants with both business and technology expertise. Our recruiting team supports our hiring process by focusing on the highest demand solution areas of our business to ensure an adequate pipeline of new associates. We also have an employee referral program, which rewards existing employees who source new hires.
As of December 29, 2017, we had 1,123 associates, excluding subcontractors, 79% of whom were billable professionals. We do not have any associates that are subject to collective bargaining arrangements; however, in France, our associates enjoy the benefit of certain government regulations based on industry classification. We have entered into nondisclosure and non-solicitation agreements with virtually all of our personnel. We also engage consultants as independent contractors pursuant to written agreements that contain non-disclosure and non-solicitation provisions.
COMMUNITY INVOLVEMENT
One important way we put our values into action is through our commitment to the communities where we work. The mission of our Community Councils, which operate in each of the cities where we have offices, is to strive to make the markets, communities and clients we serve better than how we found them. We do so by building a strong sense of community, with collaboration and personal interaction from all of our associates, through both volunteer and service programs and social gatherings.
INTELLECTUAL PROPERTY
We have obtained trademark registrations for The Hackett Group and Book of Numbers, and own registrations for certain of our other trademarks in the United States and abroad. We believe that the protection of these marks is an important part to our strategy of expanding the brand recognition we have built around our empirical knowledge capital.
AVAILABLE INFORMATION
We make our public filings with the Securities and Exchange Commission (“SEC”), including our Annual Report on Form 10-K, Quarterly Reports on Form 10-Q, Current Reports on Form 8-K, and all exhibits and amendments to these reports, available free of charge at our website www.thehackettgroup.com as soon as reasonably practicable after we electronically file such material with, or furnish it to, the SEC. Any material that we file with the SEC may be read and copied at the SEC’s Public Reference Room at 100 F Street, N.E., Washington, D.C. 20549 or at www.sec.gov. Information on the operation of the Public Reference Room may be obtained by calling the SEC at 1-800-SEC-0330.
Also available on our website, free of charge, are copies of our Code of Conduct and Ethics, and the charters for the Audit Committee, Compensation Committee and Nominating and Governance Committee of our Board of Directors. We intend to disclose any amendment to, or waiver from, a provision of our Code of Conduct and Ethics applicable to our senior financial officers, including our Chief Executive Officer, Chief Operating Officer, Chief Financial Officer and Corporate Controller on our website within four business days following the date of the amendment or waiver.
Our business is subject to risks. The following important factors could cause actual results to differ materially from those contained in forward-looking statements made in this Annual Report on Form 10-K or printed elsewhere by management from time to time.
11
Our results of operations could be negatively affected by global and regional economic conditions.
Global and regional economic conditions may affect our clients’ businesses and the markets they serve. A substantial or prolonged economic downturn, weak or uncertain economic conditions or similar factors could adversely affect our clients’ financial condition which may reduce our clients’ demand for our services, force price reductions, cause project cancellations, or delay consulting services for which they have engaged us. In addition, if we are unable to successfully anticipate the changing economic conditions, we may be unable to effectively plan for and respond to those changes, and our business could be negatively affected.
Our quarterly operating results may vary.
Our financial results may fluctuate from quarter to quarter in any given year and should not be used to predict future performance. In future quarters, our operating results may not meet analysts’ and investors’ expectations. If that happens, the price of our common stock may fall. Many factors can cause fluctuations in our financial results, including:
|
|
• |
number, size, timing and scope of client engagements; |
|
|
• |
customer concentration; |
|
|
• |
long and unpredictable sales cycles; |
|
|
• |
contract terms of client engagements; |
|
|
• |
degrees of completion of client engagements; |
|
|
• |
client engagement delays or cancellations; |
|
|
• |
competition for and utilization of employees; |
|
|
• |
how well we estimate the resources and effort we need to complete client engagements; |
|
|
• |
the integration of acquired businesses; |
|
|
• |
pricing changes in the industry; |
|
|
• |
economic conditions specific to business and information technology consulting; and |
|
|
• |
global economic conditions. |
A high percentage of our operating expenses, particularly personnel and rent, are fixed in advance of any particular quarter. As a result, if we experience unanticipated changes in client engagements or in consultant utilization rates, we could experience large variations in quarterly operating results and losses in any particular quarter. Due to these factors, we believe our quarter-to-quarter operating results should not be used to predict future performance.
If we are unable to maintain our reputation and expand our brand name recognition, we may have difficulty attracting new business and retaining current clients and employees.
We believe that establishing and maintaining a good reputation and name recognition are critical for attracting and retaining clients and employees in our industry. We also believe that the importance of reputation and name recognition will continue to increase due to the number of providers of business consulting and IT services. If our reputation is damaged or if potential clients are not familiar with us or with the solutions we provide, we may be unable to attract new, or retain existing, clients and employees. Promotion and enhancement of our name will depend largely on our success in continuing to provide effective solutions. If clients do not perceive our solutions to be effective or of high quality, our brand name and reputation will suffer. In addition, if solutions we provide have defects, critical business functions of our clients may fail, and we could suffer adverse publicity as well as economic liability.
We depend heavily on a limited number of clients.
We have derived, and believe that we will continue to derive, a significant portion of our revenue from a limited number of clients for which we perform large projects. In 2017, our ten largest clients accounted for 21% of our aggregate revenue. In addition, revenue from a large client may constitute a significant portion of our total revenue in any particular quarter. Our customer contracts generally can be cancelled for convenience by the customer upon 30 days’ notice. The loss of any of our large clients for any reason, including as a result of the acquisition of that client by another entity, our failure to meet that client’s expectations, the client’s decision to reduce spending on technology-related projects, or failure to collect amounts owed to us from our client could have a material adverse effect on our business, financial condition and results of operations.
We have risks associated with potential acquisitions or investments.
Since our inception, we have expanded through acquisitions. In the future, we plan to pursue additional acquisitions as opportunities arise. We may not be able to successfully integrate businesses which we may acquire in the future without substantial
12
expense, delays or other operational or financial problems. We may not be able to identify, acquire or profitably manage additional businesses. Also, acquisitions may involve a number of risks, including:
|
|
• |
diversion of management’s attention; |
|
|
• |
failure to retain key personnel; |
|
|
• |
failure to retain existing clients; |
|
|
• |
unanticipated events or circumstances; |
|
|
• |
unknown claims or liabilities; |
|
|
• |
amortization of certain acquired intangible assets; and |
|
|
• |
operating in new or unfamiliar geographies. |
Client dissatisfaction or performance problems at a single acquired business could have a material adverse impact on our reputation as a whole. Further, we cannot assure you that our future acquired businesses will generate anticipated revenue or earnings.
Difficulties in integrating businesses we acquire in the future may demand time and attention from our senior management.
Integrating businesses that we acquire in the future may involve unanticipated delays, costs and/or other operational and financial problems. In integrating acquired businesses, we may not achieve expected economies of scale or profitability, or realize sufficient revenue to justify our investment. If we encounter unexpected problems as we try to integrate an acquired firm into our business, our management may be required to expend time and attention to address the problems, which would divert their time and attention from other aspects of our business.
Our markets are highly competitive.
We may not be able to compete effectively with current or future competitors. The business consulting and IT services markets are highly competitive. We expect competition to further intensify as these markets continue to evolve. Some of our competitors have longer operating histories, larger client bases, longer relationships with their clients, greater brand or name recognition and significantly greater financial, technical and marketing resources than we do. As a result, our competitors may be in a stronger position to respond more quickly to new or emerging technologies and changes in client requirements and to devote greater resources than we can to the development, promotion and sale of their services. Competitors could lower their prices, potentially forcing us to lower our prices and suffer reduced operating margins. We face competition from international accounting firms; international, national and regional strategic consulting and systems implementation firms; and the IT services divisions of application software firms.
In addition, there are relatively low barriers to entry into the business consulting and IT services market. We do not own any patented technology that would stop competitors from entering this market and providing services similar to ours. As a result, the emergence of new competitors may pose a threat to our business. Existing or future competitors may develop and offer services that are superior to, or have greater market acceptance, than ours, which could significantly decrease our revenue and the value of your investment.
We may not be able to hire, train, motivate, retain and manage professional staff.
To succeed, we must hire, train, motivate, retain and manage highly skilled employees. Competition for skilled employees who can perform the services we offer is intense. We might not be able to hire enough skilled employees or train, motivate, retain and manage the employees we hire. This could hinder our ability to complete existing client engagements and bid for new ones. Hiring, training, motivating, retaining and managing employees with the skills we need is time-consuming and expensive.
We could lose money on our contracts.
As part of our strategy, from time to time, we enter into capped or fixed-price contracts, in addition to contracts based on payment for time and materials. Because of the complexity of many of our client engagements, accurately estimating the cost, scope and duration of a particular engagement can be a difficult task. We maintain an Office of Risk Management (“ORM”) that evaluates and attempts to mitigate delivery risk associated with complex projects. In connection with their review, ORM analyzes the critical estimates associated with these projects. If we fail to make these estimates accurately, we could be forced to devote additional resources to these engagements for which we will not receive additional compensation. To the extent that an expenditure of additional resources is required on an engagement, this could reduce the profitability of, or result in a loss on, the engagement. We may be unsuccessful in negotiating with clients regarding changes to the cost, scope or duration of specific engagements. To the extent we do not sufficiently communicate to our clients, or our clients fail to adequately appreciate the nature and extent of any of these types of changes to an engagement, our reputation may be harmed and we may suffer losses on an engagement.
13
Lack of detailed written contracts could impair our ability to recognize revenue for services performed, collect fees, protect our IP and protect ourselves from liability to others.
We protect ourselves by entering into detailed written contracts with our clients covering the terms and contingencies of the client engagement. In some cases, however, consistent with what we believe to be industry practice, work is performed for clients on the basis of a limited statement of work or verbal agreement before a detailed written contract can be finalized. Revenue is not recognized on a project prior to receiving a signed contract. To the extent that we fail to have detailed written contracts in place, our ability to collect fees, protect our IP and protect ourselves from liability to others may be impaired.
Our corporate governance provisions may deter a financially attractive takeover attempt.
Provisions of our charter and by-laws may discourage, delay or prevent a merger or acquisition which shareholders may consider favorable, including transactions in which shareholders would receive a premium for their shares. These provisions include the following:
|
|
• |
shareholders must comply with advance notice requirements before raising a matter at a meeting of shareholders or nominating a director for election; |
|
|
• |
our Board of Directors is staggered into three classes and the members may be removed only for cause upon the affirmative vote of holders of at least two-thirds of the shares entitled to vote; |
|
|
• |
we would not be required to hold a special meeting to consider a takeover proposal unless holders of more than a majority of the shares entitled to vote on the matter were to submit a written demand or demands for us to do so; and |
|
|
• |
our Board of Directors may, without obtaining shareholder approval, classify and issue up to 1,250,000 shares of preferred stock with powers, preferences, designations and rights that may make it more difficult for a third party to acquire us. |
We may lose large clients or may not be able to secure targeted follow-on work or client retention rates.
Our client engagements are generally short-term arrangements, and most clients can reduce or cancel their contracts for our services with a 30 days’ notice and without penalty. As a result, if we lose a major client or large client engagement, our revenue will be adversely affected. We perform varying amounts of work for specific clients from year to year. A major client in one year may not use our services in another year. In addition, we may derive revenue from a major client that constitutes a large portion of total revenue for particular quarters. If we lose any major clients or any of our clients cancel programs or significantly reduce the scope of a large engagement, our business, financial condition, and results of operations could be materially and adversely affected. Also, if we fail to collect a large accounts receivable, we could be subjected to significant financial exposure. Consequently, you should not predict or anticipate our future revenue based upon the number of clients we currently have or the number and size of our existing client engagements.
We also derive a portion of our revenue from annual memberships for our Executive Advisory Programs. Our growth prospects therefore depend on our ability to achieve and sustain renewal rates on programs and to successfully launch new programs. Failure to achieve expected renewal rate levels or to successfully launch new programs and services could have an adverse effect on our operating results.
If we are unable to protect our IP rights or infringe on the IP rights of third parties, our business may be harmed.
We rely upon a combination of nondisclosure and other contractual arrangements and trade secrets, copyright and trademark laws to protect our proprietary rights and the proprietary rights of third parties from whom we license IP. Although we enter into confidentiality agreements with our employees and limit distribution of proprietary information, there can be no assurance that the steps we have taken in this regard will be adequate to deter misappropriation of our IP, or that we will be able to detect unauthorized use and take appropriate steps to enforce our IP rights.
Although we believe that our services do not infringe on the IP rights of others and that we have all rights necessary to utilize the IP employed in our business, we are subject to the risk of claims alleging infringement of third-party IP rights. Any claims could require us to spend significant sums in litigation, pay damages, develop non-infringing IP or acquire licenses to the IP that is the subject of asserted infringement.
The market price of our common stock may fluctuate widely.
The market price of our common stock could fluctuate substantially due to:
|
|
• |
future announcements concerning us or our competitors; |
|
|
• |
quarterly fluctuations in operating results; |
|
|
• |
announcements of acquisitions or technological innovations; |
14
|
|
• |
current market volatility. |
In addition, the stock prices of many business and technology services companies fluctuate widely for reasons which may be unrelated to operating results. Fluctuation in the market price of our common stock may impact our ability to finance our operations and retain personnel.
We earn revenue, incur costs and maintain cash balances in multiple currencies, and currency fluctuations could adversely affect our financial results.
We have international operations, where we earn revenue and incur costs in various foreign currencies, primarily the British Pound, the Euro and the Australian Dollar. Doing business in these foreign currencies exposes us to foreign currency risks in numerous areas, including revenue, purchases, payroll and investments. Certain foreign currency exposures are naturally offset within an international business unit, because revenue and costs are denominated in the same foreign currency, and certain cash balances are held in U.S. Dollar denominated accounts. However, due to the increasing size and importance of our international operations, fluctuations in foreign currency exchange rates could materially impact our results.
Our cash position includes amounts denominated in foreign currencies. We manage our worldwide cash requirements considering available funds from our subsidiaries and the cost effectiveness with which these funds can be accessed. The repatriation of cash balances from certain of our subsidiaries outside the U.S. could have adverse tax consequences and be limited by foreign currency exchange controls. However, those balances are generally available in the local jurisdiction without legal restrictions to fund ordinary business operations. Any fluctuations in foreign currency exchange rates could materially impact the availability and amount of these funds available for transfer.
ITEM 1B. UNRESOLVED STAFF COMMENTS
None.
Our principal executive office is currently located at 1001 Brickell Bay Drive, Floor 30, Miami, Florida 33131. The lease on this premise covers 10,896 square feet and expires June 30, 2020. We also have offices in Atlanta, Chicago, New York, Philadelphia, Portland, Seattle, San Francisco, Frankfurt, London, Paris, Montevideo, Hyderabad and Sydney. As of December 29, 2017, we had operating leases that expire on various dates through July 2024. We believe that we will be able to obtain suitable new or replacement space as needed. We do not own real estate and do not intend to invest in real estate or real estate-related assets.
We are involved in legal proceedings, claims, and litigation arising in the ordinary course of business not specifically discussed herein. In the opinion of management, the final disposition of such matters will not have a material adverse effect on our consolidated financial position, cash flows or results of operations.
ITEM 4. MINE SAFETY DISCLOSURES
Not applicable.
15
ITEM 5. MARKET FOR REGISTRANT’S COMMON EQUITY, RELATED STOCKHOLDER MATTERS AND ISSUER PURCHASES OF EQUITY SECURITIES
Our common stock is traded under the NASDAQ Stock Market symbol, "HCKT". The following table sets forth for the fiscal periods indicated, the high and low sales prices of the common stock, as reported on the NASDAQ Stock Market:
|
2017 |
|
High |
|
|
Low |
|
||
|
Fourth Quarter |
|
$ |
16.52 |
|
|
$ |
14.55 |
|
|
Third Quarter |
|
$ |
16.90 |
|
|
$ |
13.24 |
|
|
Second Quarter |
|
$ |
20.36 |
|
|
$ |
14.00 |
|
|
First Quarter |
|
$ |
20.69 |
|
|
$ |
15.75 |
|
|
|
|
|
|
|
|
|
|
|
|
2016 |
|
High |
|
|
Low |
|
||
|
Fourth Quarter |
|
$ |
18.35 |
|
|
$ |
14.64 |
|
|
Third Quarter |
|
$ |
17.26 |
|
|
$ |
13.06 |
|
|
Second Quarter |
|
$ |
15.74 |
|
|
$ |
13.11 |
|
|
First Quarter |
|
$ |
15.84 |
|
|
$ |
12.44 |
|
The closing sale price for the common stock on March 6, 2018, was $18.00.
As of March 6, 2018, there were 256 holders of record of our common stock and 29,227,112 shares of common stock outstanding.
Securities Authorized for Issuance under Equity Compensation Plans
The information required by this section is set forth under Item 12 of this Annual Report on Form 10-K and is herein incorporated by reference.
16
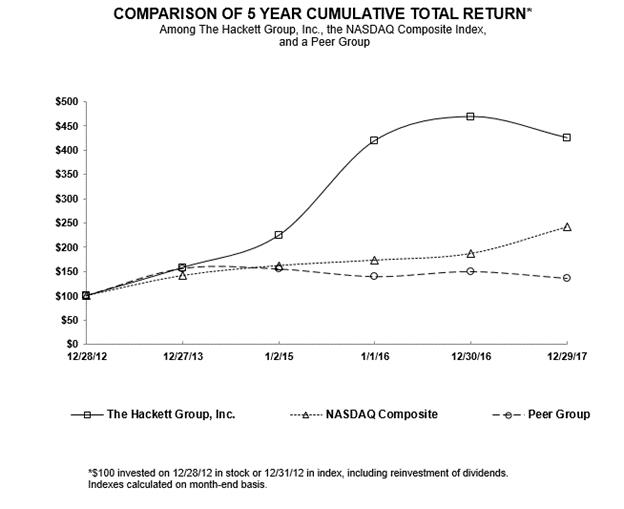
The following graph compares our cumulative total shareholder return since December 28, 2012 with the NASDAQ Composite Index and a peer group index composed of other companies with similar business models identified below. The graph assumes that the value of the investment in our common stock and each index (including reinvestment of dividends) was $100 on December 28, 2012.
|
|
|
|
12/28/12 |
|
|
|
12/27/13 |
|
|
|
1/2/15 |
|
|
|
1/1/16 |
|
|
|
12/30/16 |
|
|
|
12/29/17 |
|
||||||
|
The Hackett Group, Inc. |
|
$ |
|
100.00 |
|
|
$ |
|
157.89 |
|
|
$ |
|
224.26 |
|
|
$ |
|
419.86 |
|
|
$ |
|
469.33 |
|
|
$ |
|
425.60 |
|
|
NASDAQ Composite Index |
|
$ |
|
100.00 |
|
|
$ |
|
141.63 |
|
|
$ |
|
162.09 |
|
|
$ |
|
173.33 |
|
|
$ |
|
187.19 |
|
|
$ |
|
242.29 |
|
|
Peer Group |
|
$ |
|
100.00 |
|
|
$ |
|
156.62 |
|
|
$ |
|
155.45 |
|
|
$ |
|
139.43 |
|
|
$ |
|
150.01 |
|
|
$ |
|
135.72 |
|
The Peer Group includes Edgewater Technology, Inc., FTI Consulting, Inc., Huron Consulting Group, Inc., Information Services Group, Inc., and The Corporate Executive Board Company.
Company Dividend Policy
In December 2012, we announced an annual dividend program of $0.10 per share. We have gradually been increasing the dividend for our shareholders on an annual basis. In 2016, we increased the annual dividend to $0.26 per share to be paid on a semi-annual basis or $4.0 million to shareholders of record on both June 30, 2016 and December 22, 2016. In 2017, we increased the annual dividend to $0.30 per share to be paid on a semi-annual basis or $4.6 million and $4.7 million to shareholders of record on both June 30, 2017 and December 22, 2017, respectively. Subsequent to year end 2017, we increased the annual dividend from $0.30 per share to $0.34 per share to be paid on a semi-annual basis. Our credit agreement contains restrictions on our ability to declare dividends and repurchase shares. The declaration of dividends shall at all times be subject to the final determination of our Board of Directors that a dividend is prudent at that time in consideration of the needs of the business and other factors including the ability to pay dividends under our credit agreement.
17
Purchases of Equity Securities
We have an ongoing authorization from our Board of Directors to repurchase shares of our common stock. The repurchase plan was first announced on July 30, 2002. All repurchases under this program are discretionary and are made in the open market or through privately negotiated transactions, subject to market conditions and trading restrictions. There is no expiration date on the current authorization. The following table summarizes our share repurchases during the year ended December 29, 2017 under this authorization:
|
|
|
|
|
|
|
|
|
|
|
Total Number |
|
|
Maximum Dollar |
|
||
|
|
|
|
|
|
|
|
|
|
|
of Shares Purchased |
|
|
Value of Shares That |
|
||
|
|
|
Total Number |
|
|
Average |
|
|
as Part of Publicly |
|
|
May Yet Be Purchased |
|
||||
|
|
|
of Shares |
|
|
Price Paid |
|
|
Announced |
|
|
Under the |
|
||||
|
Period |
|
Purchased |
|
|
per Share |
|
|
Program |
|
|
Program |
|
||||
|
Balance as of December 30, 2016 |
|
|
|
|
|
|
|
|
|
|
|
|
|
$ |
4,433,361 |
|
|
December 31, 2016 to March 31, 2017 |
|
|
58,928 |
|
|
$ |
20.13 |
|
|
|
58,928 |
|
|
$ |
3,247,186 |
|
|
April 1, 2017 to June 30, 2017 |
|
|
507,351 |
|
|
$ |
15.01 |
|
|
|
507,351 |
|
|
$ |
630,006 |
|
|
July 1, 2017 to September 29, 2017 |
|
|
181,516 |
|
|
$ |
13.73 |
|
|
|
181,516 |
|
|
$ |
3,137,560 |
|
|
September 30, 2017 to December 29, 2017 |
|
|
— |
|
|
$ |
— |
|
|
|
— |
|
|
$ |
3,137,560 |
|
|
|
|
|
747,795 |
|
|
$ |
15.11 |
|
|
|
747,795 |
|
|
|
|
|
During the year ended December 29, 2017, the Company’s Board of Directors approved an additional $10.0 million authorization, bringing the cumulative authorization as of December 29, 2017, to $137.2 million with cumulative purchases under the plan of $134.1 million, leaving $3.1 million available for future purchases.
Shares purchased under the repurchase plan do not include shares withheld to satisfy withholding tax obligations. These withheld shares are never issued and in lieu of issuing the shares, taxes were paid on our employee’s behalf. In 2017, 268 thousand shares were withheld and not issued for a cost of $4.4 million.
18
ITEM 6. SELECTED FINANCIAL DATA
The following consolidated financial data sets forth our selected financial information as of and for each of the years in the five-year period ended December 29, 2017, and has been derived from our audited consolidated financial statements. The selected consolidated financial data should be read together with our consolidated financial statements, related notes thereto and with “Management’s Discussion and Analysis of Financial Condition and Results of Operations.”
|
|
|
Year Ended |
|
||||||||||||||||||||||
|
|
|
December 29, |
|
|
December 30, |
|
|
January 1, |
|
|
January 2, |
|
|
December 27, |
|
||||||||||
|
|
|
2017 |
|
|
2016 |
|
|
2016 |
|
|
2015 |
|
|
2013 |
|
||||||||||
|
Consolidated Statement of Operations Data: |
|
|
(in thousands, except per share data) |
|
|||||||||||||||||||||
|
Revenue: |
|
|
|
|
|
|
|
|
|
|
|
|
|
|
|
|
|
|
|
|
|
|
|
|
|
|
Revenue before reimbursements |
|
$ |
|
263,252 |
|
|
$ |
|
259,907 |
|
|
$ |
|
234,581 |
|
|
$ |
|
213,519 |
|
|
$ |
|
200,391 |
|
|
Reimbursements |
|
|
|
22,610 |
|
|
|
|
28,654 |
|
|
|
|
26,359 |
|
|
|
|
23,218 |
|
|
|
|
23,439 |
|
|
Total revenue (1) |
|
|
|
285,862 |
|
|
|
|
288,561 |
|
|
|
|
260,940 |
|
|
|
|
236,737 |
|
|
|
|
223,830 |
|
|
Costs and expenses: |
|
|
|
|
|
|
|
|
|
|
|
|
|
|
|
|
|
|
|
|
|
|
|
|
|
|
Cost of service: |
|
|
|
|
|
|
|
|
|
|
|
|
|
|
|
|
|
|
|
|
|
|
|
|
|
|
Personnel costs before reimbursable expenses (2) |
|
|
|
166,312 |
|
|
|
|
163,273 |
|
|
|
|
147,024 |
|
|
|
|
138,958 |
|
|
|
|
130,456 |
|
|
Reimbursable expenses |
|
|
|
22,610 |
|
|
|
|
28,654 |
|
|
|
|
26,359 |
|
|
|
|
23,218 |
|
|
|
|
23,439 |
|
|
Total cost of service |
|
|
|
188,922 |
|
|
|
|
191,927 |
|
|
|
|
173,383 |
|
|
|
|
162,176 |
|
|
|
|
153,895 |
|
|
Selling, general and administrative costs |
|
|
|
64,825 |
|
|
|
|
62,081 |
|
|
|
|
65,632 |
|
|
|
|
61,386 |
|
|
|
|
54,208 |
|
|
Bargain purchase gain from acquisition (3) |
|
|
|
— |
|
|
|
|
— |
|
|
|
|
— |
|
|
|
|
(3,015 |
) |
|
|
|
— |
|
|
Restructuring costs (benefit) |
|
|
|
1,293 |
|
|
|
|
— |
|
|
|
|
— |
|
|
|
|
3,604 |
|
|
|
|
— |
|
|
Total costs and operating expenses |
|
|
|
255,040 |
|
|
|
|
254,008 |
|
|
|
|
239,015 |
|
|
|
|
224,151 |
|
|
|
|
208,103 |
|
|
Operating income |
|
|
|
30,822 |
|
|
|
|
34,553 |
|
|
|
|
21,925 |
|
|
|
|
12,586 |
|
|
|
|
15,727 |
|
|
Other expense: |
|
|
|
|
|
|
|
|
|
|
|
|
|
|
|
|
|
|
|
|
|
|
|
|
|
|
Interest expense, net |
|
|
|
(584 |
) |
|
|
|
(387 |
) |
|
|
|
(409 |
) |
|
|
|
(620 |
) |
|
|
|
(465 |
) |
|
Income from continuing operations before income taxes |
|
|
|
30,238 |
|
|
|
|
34,166 |
|
|
|
|
21,516 |
|
|
|
|
11,966 |
|
|
|
|
15,262 |
|
|
Income tax expense (4) |
|
|
|
2,884 |
|
|
|
|
12,625 |
|
|
|
|
7,707 |
|
|
|
|
2,255 |
|
|
|
|
6,398 |
|
|
Income from continuing operations |
|
|
|
27,354 |
|
|
|
|
21,541 |
|
|
|
|
13,809 |
|
|
|
|
9,711 |
|
|
|
|
8,864 |
|
|
Loss from discontinued operations |
|
|
|
— |
|
|
|
|
— |
|
|
|
|
— |
|
|
|
|
— |
|
|
|
|
(135 |
) |
|
Net income |
|
$ |
|
27,354 |
|
|
$ |
|
21,541 |
|
|
$ |
|
13,809 |
|
|
$ |
|
9,711 |
|
|
$ |
|
8,729 |
|
|
|
|
|
|
|
|
|
|
|
|
|
|
|
|
|
|
|
|
|
|
|
|
|
|
|
|
|
Basic net income per common share: |
|
|
|
|
|
|
|
|
|
|
|
|
|
|
|
|
|
|
|
|
|
|
|
|
|
|
Income per common share from continuing operations |
|
$ |
|
0.95 |
|
|
$ |
|
0.74 |
|
|
$ |
|
0.47 |
|
|
$ |
|
0.34 |
|
|
$ |
|
0.29 |
|
|
Loss per common share from discontinued operations |
|
|
|
— |
|
|
|
|
— |
|
|
|
|
— |
|
|
|
|
— |
|
|
|
|
— |
|
|
Net income per common share |
|
$ |
|
0.95 |
|
|
$ |
|
0.74 |
|
|
$ |
|
0.47 |
|
|
$ |
|
0.34 |
|
|
$ |
|
0.29 |
|
|
|
|
|
|
|
|
|
|
|
|
|
|
|
|
|
|
|
|
|
|
|
|
|
|
|
|
|
Diluted net income per common share: |
|
|
|
|
|
|
|
|
|
|
|
|
|
|
|
|
|
|
|
|
|
|
|
|
|
|
Income per common share from continuing operations |
|
$ |
|
0.85 |
|
|
$ |
|
0.66 |
|
|
$ |
|
0.43 |
|
|
$ |
|
0.33 |
|
|
$ |
|
0.28 |
|
|
Loss per common share from discontinued operations |
|
|
|
— |
|
|
|
|
— |
|
|
|
|
— |
|
|
|
|
— |
|
|
|
|
(0.01 |
) |
|
Net income per common share |
|
$ |
|
0.85 |
|
|
$ |
|
0.66 |
|
|
$ |
|
0.43 |
|
|
$ |
|
0.33 |
|
|
$ |
|
0.27 |
|
|
|
|
|
|
|
|
|
|
|
|
|
|
|
|
|
|
|
|
|
|
|
|
|
|
|
|
|
Weighted average common shares outstanding: |
|
|
|
|
|
|
|
|
|
|
|
|
|
|
|
|
|
|
|
|
|
|
|
|
|
|
Basic |
|
|
|
28,852 |
|
|
|
|
29,082 |
|
|
|
|
29,620 |
|
|
|
|
28,718 |
|
|
|
|
30,283 |
|
|
Diluted |
|
|
|
32,196 |
|
|
|
|
32,815 |
|
|
|
|
31,968 |
|
|
|
|
29,881 |
|
|
|
|
32,116 |
|
|
|
|
|
|
|
|
|
|
|
|
|
|
|
|
|
|
|
|
|
|
|
|
|
|
|
|
|
Consolidated Balance Sheet Data: |
|
|
|
|
|
|
|
|
|
|
|
|
|
|
|
|
|
|
|
|
|
|
|
|
|
|
Cash |
|
$ |
|
17,512 |
|
|
$ |
|
19,710 |
|
|
$ |
|
23,503 |
|
|
$ |
|
14,608 |
|
|
$ |
|
18,199 |
|
|
Restricted cash |
|
$ |
|
— |
|
|
$ |
|
— |
|
|
$ |
|
— |
|
|
$ |
|
— |
|
|
$ |
|
354 |
|
|
Working capital |
|
$ |
|
23,837 |
|
|
$ |
|
12,999 |
|
|
$ |
|
17,375 |
|
|
$ |
|
15,418 |
|
|
$ |
|
20,767 |
|
|
Total assets |
|
$ |
|
185,231 |
|
|
$ |
|
159,299 |
|
|
$ |
|
160,379 |
|
|
$ |
|
149,598 |
|
|
$ |
|
145,188 |
|
|
Long-term debt |
|
$ |
|
19,000 |
|
|
$ |
|
7,000 |
|
|
$ |
|
— |
|
|
$ |
|
18,263 |
|
|
$ |
|
19,029 |
|
|
Shareholders’ equity |
|
$ |
|
107,275 |
|
|
$ |
|
86,269 |
|
|
$ |
|
102,144 |
|
|
$ |
|
89,788 |
|
|
$ |
|
93,176 |
|
|
Dividends paid/declared per share |
|
$ |
|
0.30 |
|
|
$ |
|
0.26 |
|
|
$ |
|
0.20 |
|
|
$ |
|
0.12 |
|
|
$ |
|
0.10 |
|
|
(1) |
In April 2017 and May 2017, we acquired Aecus Limited, a U.K. – based European Outsourcing Advisory and Robotics Process Automation (“RPA”) consulting firm company and we acquired Jibe Consulting, U.S.- based Oracle E-Business Suite (“EBS”) and Oracle Cloud Business Application implementation firm. As a result of the acquisitions, our 2017 results of operations included $16.2 million in total revenue. In January 2014, we acquired Technolab, an EPM AMS business. As a result of the acquisition, our 2014 results of operations included $10.3 million in total revenue from Technolab. |
|
(2) |
Fiscal years 2014 through 2017 include acquisition-related compensation expense of $4.1 million in 2017, $1.2 million in 2016, $927 thousand in 2015 and $4.3 million in 2014 from the acquisitions of Jibe Consulting and Aecus Limited in 2017 and Technolab in 2014. |
|
(3) |
Fiscal year 2014 includes a bargain purchase gain from the acquisition of Technolab, an EPM AMS business. |
|
(4) |
Fiscal year 2017 includes the tax benefit for the revaluation of the deferred tax liabilities as a result of the recently enacted tax legislation and accounting on the vesting of share-based awards. |
19
ITEM 7. MANAGEMENT’S DISCUSSION AND ANALYSIS OF FINANCIAL CONDITION AND RESULTS OF OPERATIONS
Overview
Hackett, originally incorporated on April 23, 1997, is a leading strategic advisory and technology consulting firm that enables companies to achieve world-class business performance. By leveraging the comprehensive Hackett database, the world’s leading repository of enterprise business process performance metrics and best practice intellectual capital, our business and technology solutions help clients improve performance and maximize returns on technology investments.
Hackett is a strategic advisory firm and a world leader in best practice research, benchmarking, business transformation and working capital management services which empirically defines and enables world-class enterprise performance. Hackett empirically defines world-class performance in sales, general and administrative and certain supply chain activities with analysis gained through more than 15,200 benchmark and performance studies over 24 years at over 5,300 of the world’s leading companies.
Hackett’s combined capabilities include executive advisory programs, benchmarking, business transformation working capital management and technology solutions, with corresponding offshore support. In addition, we are identifying new opportunities for our benchmarking and best practice intellectual property by leveraging new channels through strategic alliances to introduce new recurring revenue, high margin offerings that could redefine our organizational model that we have started to refer to as “IP as a service” business.
In the following discussion, “Hackett” represents our total company. “The Hackett Group” encompasses our Benchmarking, Business Transformation, Executive Advisory, Robotics Process Automation, Enterprise Performance Management (“EPM”) and EPM Application Maintenance and Support (“AMS”) groups. “SAP Solutions” encompasses our SAP ERP Technology and SAP Maintenance groups.
Critical Accounting Policies
In the ordinary course of business, we make a number of estimates and assumptions relating to the reporting of results of operations and financial position in conformity with generally accepted accounting principles in the United States (“GAAP”). Actual results could differ significantly from those estimates under different assumptions and conditions. We believe the following discussion addresses our most critical accounting policies. These policies require management to exercise judgment on issues that are often difficult, subjective and complex due to the necessity of estimating the effect of matters that are inherently uncertain.
Revenue Recognition
Our revenue is principally derived from fees for services generated on a project-by-project basis. Revenue for services rendered is recognized on a time and materials basis or on a fixed-fee or capped-fee basis.
Revenue for time and materials contracts is recognized based on the number of hours worked by our consultants at an agreed upon rate per hour and is recognized in the period in which services are performed.
Revenue related to fixed-fee or capped-fee contracts is recognized on the proportional performance method of accounting based on the ratio of labor hours incurred to estimated total labor hours. This percentage is multiplied by the contracted dollar amount of the project to determine the amount of revenue to be recognized in an accounting period. The contracted dollar amount used in this calculation excludes the amount the client pays us for reimbursable expenses. There are situations where the number of hours to complete projects may exceed our original estimate, as a result of an increase in project scope, unforeseen events that arise, or the inability of the client or the delivery team to fulfill their responsibilities. On an on-going basis, our project delivery, Office of Risk Management and finance personnel review hours incurred and estimated total labor hours to complete projects. Any revisions in these estimates are reflected in the period in which they become known. If our estimates indicate that a contract loss will occur, a loss provision will be recorded in the period in which the loss first becomes probable and reasonably estimable. Contract losses are determined to be the amount by which the estimated direct costs of the contract exceed the estimated total revenue that will be generated by the contract. These costs are included in total cost of service.
Revenue from advisory services is recognized ratably over the life of the client agreements.
Additionally, we earn revenue from the resale of software licenses and maintenance contracts. Revenue for the resale of software and software licenses is recognized upon contract execution and customer receipt of software. Revenue from maintenance contracts is recognized ratably over the life of the agreements.
Revenue for contracts with multiple elements is allocated based on the respective selling price of the individual elements.
Unbilled revenue represents revenue for services performed that have not been invoiced. If we do not accurately estimate the scope of the work to be performed, or we do not manage our projects properly within the planned periods of time, or we do not meet
20
our clients’ expectations under the contracts, then future consulting margins may be negatively affected or losses on existing contracts may need to be recognized. Any such reductions in margins or contract losses could be material to our results of operations.
Sales tax collected from customers and remitted to the applicable taxing authorities is accounted for on a net basis, with no impact on revenue.
Revenue before reimbursements excludes reimbursable expenses charged to clients. Reimbursements, which include travel and out-of-pocket expenses, are included in revenue, and an equivalent amount of reimbursable expenses is included in cost of service.
The agreements entered into in connection with a project, whether time and materials, or fixed-fee or capped-fee based, typically allow our clients to terminate early due to breach or for convenience with 30 days’ notice. In the event of termination, the client is contractually required to pay for all time, materials and expenses incurred by us through the effective date of the termination. In addition, from time to time we enter into agreements with our clients that limit our right to enter into business relationships with specific competitors of that client for a specific time period. These provisions typically prohibit us from performing a defined range of services which we might otherwise be willing to perform for potential clients. These provisions are generally limited to six to twelve months and usually apply only to specific employees or the specific project team.
Allowances for Doubtful Accounts
We maintain allowances for doubtful accounts for estimated losses resulting from our clients not making required payments. Periodically, we review accounts receivable to assess our estimates of collectability. Management critically reviews accounts receivable and analyzes historical bad debts, past-due accounts, client credit-worthiness and current economic trends when evaluating the adequacy of the allowance for doubtful accounts. If the financial condition of our clients were to deteriorate, resulting in their inability to make payments, additional allowances may be required.
Long-Lived Assets (excluding Goodwill and Other Intangible Assets)
Long-lived assets are reviewed for impairment whenever events or circumstances indicate that the carrying amount of an asset may not be fully recoverable. If an evaluation is required, the estimated future undiscounted cash flows associated with the asset are compared to the asset’s carrying amount to determine if there has been an impairment. The amount of an impairment is calculated as the difference between the fair value of the asset and its carrying value. Estimates of future undiscounted cash flows are based on management’s view of growth rates for the related business, anticipated future economic conditions and estimates of residual values.
Business Combinations
For transactions that are considered business combinations, we utilize fair values in determining the carrying values of the purchased assets and assumed liabilities, which are recorded at fair value at acquisition date, and identifiable intangible assets are recorded at fair value. Costs directly related to the business combinations are recorded as expenses as they are incurred. Fair values are subject to refinement for up to one year after the closing date of an acquisition as information relative to closing date fair values become available. A bargain purchase gain on an acquisition occurs when the net of the estimated fair value of the assets acquired and liabilities assumed exceeds the consideration paid.
Goodwill and Other Intangible Assets
Goodwill and intangible assets deemed to have indefinite lives are not amortized, but rather are tested for impairment on an annual basis, or more frequently if events or changes in circumstances indicate potential impairment. Finite-lived intangible assets are amortized over their useful lives and are subject to impairment evaluations. The excess cost of the acquisition over the fair value of the net assets acquired is recorded as goodwill.
Goodwill is tested at least annually for impairment at the reporting unit level. The reporting units are The Hackett Group (including Benchmarking, Business Transformation, Business Transformation EPM, Strategy and Operations, Executive Advisory Programs and Robotics Process Automation) and Hackett Technology Solutions (including SAP ERP and AMS, Oracle EPM and EPM AMS). In assessing the recoverability of goodwill and intangible assets, we make estimates based on assumptions regarding various factors to determine if impairment tests are met. These estimates contain management’s judgment, using appropriate and customary assumptions available at the time. We performed our annual step one impairment test of our goodwill in the fourth quarter of fiscal 2017 and determined that goodwill was not impaired.
Other intangible assets are tested for potential impairment whenever events or changes in circumstances suggest that the carrying value of an asset may not be fully recoverable. If an evaluation is required, the estimated future undiscounted cash flows associated with the asset are compared to the asset’s carrying amount to determine if there has been an impairment. The amount of an impairment is calculated as the difference between the fair value of the asset and its carrying value. Estimates of future undiscounted cash flows are based on management’s view of growth rates for the related business, anticipated future economic conditions and estimates of residual values. Other intangible assets arise from business combinations and consist of customer relationships, customer
21
backlog, non-compete agreements and trademarks that are amortized on a straight-line or accelerated basis over periods of up to ten years.
Stock Based Compensation
We recognize compensation expense for awards of equity and liability instruments to employees based on the grant-date fair value of those awards, over the requisite service period, with limited exceptions.
Deferred tax assets and liabilities are determined based on differences between the financial reporting carrying values and tax bases of assets and liabilities, and are measured by using enacted tax rates expected to apply to taxable income in the years in which those differences are expected to reverse. Deferred income taxes also reflect the impact of certain state operating loss and tax credit carryforwards. A valuation allowance is provided if we believe it is more likely than not that all or some portion of the deferred tax asset will not be realized. An increase or decrease in the valuation allowance, if any, that results from a change in circumstances, and which causes a change in our judgment about the realizability of the related deferred tax asset, is included in the current tax provision.
We adopted a more-likely-than-not threshold for financial statement recognition and measurement of a tax position taken or expected to be taken in a tax return. This interpretation also provides guidance on de-recognition of income tax assets and liabilities, classification of current and deferred income tax assets and liabilities, accounting for interest and penalties associated with tax positions, accounting for income taxes in interim periods and income tax disclosures. We report penalties and tax-related interest expense as a component of income tax expense.
Our fiscal year generally consists of a 52-week period and periodically consists of a 53-week period as each fiscal year ends on the Friday closest to December 31. Fiscal years 2017, 2016, and 2015 ended on December 29, 2017, December 30, 2016, and January 1, 2016, respectively. References to a year included in this document refer to a fiscal year rather than a calendar year.
The following table sets forth, for the periods indicated, our results of operations and the percentage relationship to revenue before reimbursements of such results (in thousands, except per share amounts).
|
|
Twelve Months Ended |
|
|||||||||||||||||||||
|
|
December 29, |
|
|
|
|
December 30, |
|
|
|
|
January 1, |
|
|
|
|||||||||
|
|
2017 |
|
|
|
|
2016 |
|
|
|
|
2016 |
|
|
|
|||||||||
|
Revenue: |
|
|
|
|
|
|
|
|
|
|
|
|
|
|
|
|
|
|
|
|
|
|
|
|
Revenue before reimbursements |
$ |
263,252 |
|
|
100% |
|
|
$ |
259,907 |
|
|
100% |
|
|
$ |
234,581 |
|
|
100% |
|
|||
|
Reimbursements |
|
22,610 |
|
|
|
|
|
|
|
28,654 |
|
|
|
|
|
|
|
26,359 |
|
|
|
|
|
|
Total revenue |
|
285,862 |
|
|
|
|
|
|
|
288,561 |
|
|
|
|
|
|
|
260,940 |
|
|
|
|
|
|
|
|
|
|
|
|
|
|
|
|
|
|
|
|
|
|
|
|
|
|
|
|
|
|
|
Costs and expenses: |
|
|
|
|
|
|
|
|
|
|
|
|
|
|
|
|
|
|
|
|
|
|
|
|
Cost of service: |
|
|
|
|
|
|
|
|
|
|
|
|
|
|
|
|
|
|
|
|
|
|
|
|
Personnel costs |
|
157,745 |
|
|
60% |
|
|
|
157,515 |
|
|
61% |
|
|
|
141,665 |
|
|
60% |
|
|||
|
Non-cash stock compensation expense |
|
4,470 |
|
|
|
|
|
|
|
4,544 |
|
|
|
|
|
|
|
4,432 |
|
|
|
|
|
|
Acquisition-related compensation expense |
|
1,582 |
|
|
|
|
|
|
|
- |
|
|
|
|
|
|
|
- |
|
|
|
|
|
|
Acquisition-related non-cash stock compensation expense |
|
2,515 |
|
|
|
|
|
|
|
1,214 |
|
|
|
|
|
|
|
927 |
|
|
|
|
|
|
Reimbursable expenses |
|
22,610 |
|
|
|
|
|
|
|
28,654 |
|
|
|
|
|
|
|
26,359 |
|
|
|
|
|
|
Total cost of service |
|
188,922 |
|
|
|
|
|
|
|
191,927 |
|
|
|
|
|
|
|
173,383 |
|
|
|
|
|
|
|
|
|
|
|
|
|
|
|
|
|
|
|
|
|
|
|
|
|
|
|
|
|
|
|
Selling, general and administrative costs |
|
59,027 |
|
|
22% |
|
|
|
57,974 |
|
|
22% |
|
|
|
58,423 |
|
|
25% |
|
|||
|
Non-cash stock compensation expense |
|
3,330 |
|
|
|
|
|
|
|
3,007 |
|
|
|
|
|
|
|
2,344 |
|
|
|
|
|
|
SARs-related non-cash compensation expense |
|
- |
|
|
|
|
|
|
|
- |
|
|
|
|
|
|
|
2,658 |
|
|
|
|
|
|
Acquisition-related costs |
|
378 |
|
|
|
|
|
|
|
- |
|
|
|
|
|
|
|
- |
|
|
|
|
|
|
Amortization of intangible assets |
|
2,090 |
|
|
|
|
|
|
|
1,100 |
|
|
|
|
|
|
|
2,207 |
|
|
|
|
|
|
Total selling, general, and administrative expenses |
|
64,825 |
|
|
25% |
|
|
|
62,081 |
|
|
24% |
|
|
|
65,632 |
|
|
28% |
|
|||
|
|
|
|
|
|
|
|
|
|
|
|
|
|
|
|
|
|
|
|
|
|
|
|
|
|
Restructuring costs |
|
1,293 |
|
|
|
|
|
|
|
- |
|
|
|
|
|
|
|
- |
|
|
|
|
|
|
Total costs and operating expenses |
|
255,040 |
|
|
|
|
|
|
|
254,008 |
|
|
|
|
|
|
|
239,015 |
|
|
|
|
|
|
Income from operations |
|
30,822 |
|
|
12% |
|
|
|
34,553 |
|
|
13% |
|
|
|
21,925 |
|
|
9% |
|
|||
|
Other expense: |
|
|
|
|
|
|
|
|
|
|
|
|
|
|
|
|
|
|
|
|
|
|
|
|
Interest expense |
|
(584 |
) |
|
|
|
|
|
|
(387 |
) |
|
|
|
|
|
|
(409 |
) |
|
|
|
|
|
Income from operations before income taxes |
|
30,238 |
|
|
11% |
|
|
|
34,166 |
|
|
13% |
|
|
|
21,516 |
|
|
9% |
|
|||
|
Income tax expense |
|
2,884 |
|
|
1% |
|
|
|
12,625 |
|
|
5% |
|
|
|
7,707 |
|
|
3% |
|
|||
|
Net income |
$ |
27,354 |
|
|
10% |
|
|
$ |
21,541 |
|
|
8% |
|
|
$ |
13,809 |
|
|
6% |
|
|||
|
|
|
|
|
|
|
|
|
|
|
|
|
|
|
|
|
|
|
|
|
|
|
|
|
|
Diluted net income per common share |
$ |
0.85 |
|
|
|
|
|
|
$ |
0.66 |
|
|
|
|
|
|
$ |
0.43 |
|
|
|
|
|
22
Overview. For the fiscal year 2017, revenue before reimbursements increased 1.3% to $263.3 million and earnings per share increased 29%, as compared to the same period in the prior year. Fiscal year 2017 earnings per share was favorably impacted by tax benefit for the revaluation of the deferred tax liabilities as a result of the recently enacted tax legislation and the change in accounting for the vesting of share-based awards.
Revenue. We are a global company with operations primarily in the United States and Western Europe. Our revenue is denominated in multiple currencies, primarily the U.S. Dollar, British Pound, Euro and Australian Dollar, and as a result is affected by currency exchange rate fluctuations. The impact of the currency fluctuation did not have a significant impact on comparisons between 2017 and 2016. Revenue is analyzed based on geographic location of engagement team personnel.
Our total Company revenue before reimbursements increased 1.3%, to $263.3 million in 2017, as compared to $259.9 million in 2016. Our domestic revenue decreased 4%, but was offset by our international growth of 36%. Gross revenue decreased in 2017 to $285.9 million from $288.6 million as a result of our decrease in revenue related to reimbursable expenses. Reimbursable expenses are project and travel-related expenses passed through to a client with no margin associated with them. Reimbursable expenses as a percentage of net revenue were 8.6% during 2017 and 11.0% in 2016. The decrease in reimbursable expenses is primarily driven by lower expense ratios resulting from the recent acquisitions and the increase in “IP as a service” revenue, both which historically drive much lower levels of reimbursable expenses. In 2017 and 2016, no customer accounted for more than 5% of our total revenue.
Hackett domestic revenue before reimbursements was down 6% in 2017, as revenue was adversely impacted primarily as a result of the transition from on- premise to cloud application migration. The decrease of the domestic Hackett revenue was offset by strong Hackett international growth of 36%, primarily in Europe, during 2017, as compared to the same period in the prior year. Our international revenue accounted for 19% of our total revenue in 2017, as compared to 14% in 2016.
SAP Solutions revenue before reimbursements increased 5%, to $39.9 million, during 2017, as compared to $38.1 million in the in 2016.
Cost of Service. Cost of service primarily consists of salaries, benefits and incentive compensation for consultants and subcontractor fees; acquisition-related cash and stock compensation costs; non-cash stock compensation expense; and reimbursable expenses associated with projects.
Personnel costs remained relatively consistent with an increase to $157.7 million in 2017 from $157.5 million in 2016. Personnel costs before reimbursable expenses, as a percentage of revenue before reimbursements also remained relatively consistent at 60% in 2017, as compared to 61% in 2016.
Non-cash stock compensation expense was $4.5 million in both 2017 and 2016.
Acquisition related compensation costs of $1.6 million for 2017 relate to the accrual for the cash portion of the Aecus contingent consideration to be paid to the selling shareholders and key personnel, and the cash portion of the Jibe contingent consideration that is to be paid to key personnel, all of which are subject to service vesting and as a result is recorded as compensation expense. See Note 15, “Acquisitions” to our consolidated financial statements included in this Annual Report on Form 10-K.
Acquisition related non-cash stock compensation expense in 2017 primarily related to our EPM AMS acquisition of Technolab in fiscal 2014 and the Jibe and Aecus acquisitions in 2017. See Note 15, “Acquisitions” to our consolidated financial statements included in this Annual Report on Form 10-K.
Selling, General and Administrative (“SG&A”). SG&A costs, excluding non-cash compensation expense, acquisition related costs and the amortization of intangible assets increased 2% to $59.0 million in 2017, from $58.0 million in 2016. SG&A costs as a percentage of revenue before reimbursements were 22% in both 2017 and 2016.
Non-cash compensation expense included in total SG&A increased to $3.3 million in 2017, as compared to $3.0 million in 2016. The increase primarily related to the performance-based equity compensation which was driven by Company performance in 2016. See Note 10, “Stock Based Compensation” to our consolidated financial statements included in this Annual Report on Form 10-K for further information.
Amortization expense was $2.1 million in 2017, as compared to $1.1 million in 2016. The amortization expense in 2017 relates to the amortization of the intangible assets acquired in our 2014 EPM AMS acquisition of Technolab, our acquisitions of Jibe and Aecus in the second quarter of 2017 and the buyout of our partner’s joint venture interest in the CGBS Training and Certification Programs. The intangible assets relate to the customer relationship, trademarks, customer backlog and non-compete agreements. The Technolab intangible assets will continue to amortize through 2018, the Jibe and Aecus intangible assets will continue to amortize until 2022 and the CGBS Training and Certification intangible asset will amortize until 2027.
23
Restructuring Costs. In 2017, we recorded restructuring costs primarily related to the transition of resources driven by our migration from on premise software to cloud-based implementations as well as the Jibe acquisition, and the rationalization of global resources as a result of the emergence of RPA related engagements from our Aecus acquisition.
Interest expense. In 2017, we recorded interest expense of $584 thousand, as compared to $387 thousand in 2016. The increase in interest expense in 2017, as compared to 2016 primarily relates to the higher average outstanding debt balance during 2017.
Income Taxes. During 2017, we recorded $2.9 million of income tax expense related to certain federal, foreign and state taxes which reflected an effective tax rate of 9.5%. During the first quarter of 2017, we recorded no income tax expense as a result of the adoption of a new pronouncement relating to the accounting on the vesting of share-based awards. During the fourth quarter of fiscal 2017 we recorded a tax benefit related to the revaluation of our deferred tax liabilities as a result of the adoption of the 2017 Tax Act on December 22, 2017. Excluding the effect of the new pronouncement and the new tax reform legislation, the effective tax rate would have been 35.5% for certain federal, foreign and state taxes for 2017. In 2016, we recorded income tax expense of $12.6 million which reflected an effective tax rate of 37.0% in both periods for certain federal, foreign and state taxes.
Comparison of 2016 to 2015
Overview. Our continued strong U.S. demand drove our results as our momentum was realized across virtually all of our U.S. practices. For the fiscal year 2016, revenue increased 10.6% to $288.6 million and earnings per share increased 53%, as compared to the same period in the prior year. Fiscal year 2015 earnings per share was unfavorably impacted by non-recurring, non-cash compensation expense relating to performance-based Stock Appreciation Rights issued in 2012.
Revenue. We are a global company with operations primarily in the United States and Western Europe. Our revenue is denominated in multiple currencies, primarily the U.S. Dollar, British Pound, Euro and Australian Dollar, and as a result is affected by currency exchange rate fluctuations. The impact of the currency fluctuation did not have a significant impact on comparisons between 2016 and 2015. Revenue is analyzed based on geographic location of engagement team personnel.
Our total Company revenue increased 10.6%, to $288.6 million in 2016, as compared to $260.9 million in 2015. Our strong 2016 results were driven by over 13% revenue growth from our North American service offerings. By consolidating several of our Hackett practices, we have seen improvement in collaboration and cross-selling which has allowed us to serve clients more broadly. As an example, revenue from our top twenty U.S. clients this year grew just over 20% from the prior year. Our domestic growth was partially offset by weak European revenue which has decreased 2.9% year over year. Our international revenue accounted for 14% of our total revenue in 2016, as compared to 16% in 2015.
Reimbursements as a percentage of total revenue were 10% during both 2016 and 2015. In 2016 and 2015, no customer accounted for more than 5% of our total revenue.
Total Cost of Service. Cost of service consists of personnel costs, which are comprised of salaries, benefits incentive compensation for consultants and subcontractor fees; non-cash stock compensation expense; and reimbursable expenses associated with projects.
Personnel costs increased 11% to $157.5 million in 2016 from $141.7 million in 2015. The increase in the absolute dollar amount was primarily a result of increased employee headcount and higher subcontractor costs to support increasing revenue. Personnel costs before reimbursable expenses, as a percentage of revenue before reimbursements remained relatively constant at 61% in 2016, as compared to 60% in 2015.
Non-cash compensation expense included in total cost of service was comparable at $4.5 million in 2016, as compared to $4.4 million in 2015. Acquisition-related stock compensation expense included in total cost of service was $1.2 million in 2016, as compared to $0.9 million in 2015. The increase in the acquisition-related stock compensation expense was primarily related to the finalization of the earn-out equity granted related to the acquisition of Technolab International Corporation (“Technolab”).
Total Selling, General and Administrative (“SG&A”). SG&A costs, excluding non-cash compensation expense, SARs-related non-cash compensation expense and the amortization of intangible assets decreased 1% to $58.0 million in 2016, from $58.4 million in 2015. SG&A costs as a percentage of revenue before reimbursements were 22% in 2016 and 25% in 2015 due to the improved leverage from increased revenue.
Non-cash compensation expense included in total SG&A increased to $3.0 million in 2016, as compared to $2.3 million in 2015. The increase primarily related to the performance-based equity compensation which was driven by Company performance. SARs-related non-cash compensation expense included in total SG&A decreased $2.7 million in 2016, as compared to 2015, due to the non-recurring, non-cash stock compensation expense related to the performance-based SARs awards tied to the achievement of the pro-forma EBITDA performance target. This expense represented 100% of the non-cash compensation expense for these equity awards. See Note 9, “Stock Based Compensation” to our consolidated financial statements included in this Annual Report on Form 10-K for further information.
24
Amortization expense was $1.1 million and $2.2 million in 2016 and 2015, respectively. The amortization expense in 2016 and 2015 was primarily due to the amortization of the intangible assets acquired in our 2014 EPM AMS acquisition of Technolab. The decrease in the amortization expense primarily related to the full amortization at the end of 2015 of the customer backlog and tradename. The intangibles related to the customer relationship and non-compete agreement will continue to amortize through 2018.
Income Tax Expense. In 2016, we recorded income tax expense of $12.6 million, which reflected an effective tax rate of 37.0% for certain federal, foreign and state taxes. In 2015, we recorded income tax expense of $7.7 million, which reflected an effective tax rate of 35.8% for certain federal, foreign and state taxes.
Liquidity and Capital Resources
As of December 29, 2017 and December 30, 2016, we had $17.5 million and $19.7 million, respectively, of cash and cash equivalents, respectively. We currently believe that available funds (including the cash on hand and funds available for borrowing under the revolving line), and cash flows generated by operations will be sufficient to fund our working capital and capital expenditure requirements for at least the next twelve months. We may decide to raise additional funds to support expansion, to develop new or enhance products and services, to respond to competitive pressures or to acquire complementary businesses or technologies. There is no assurance, however, that additional financing will be available when needed or desired.
The following table summarizes our cash flow activity (in thousands):
|
|
|
Year Ended |
|
|||||
|
|
|
December 29, |
|
|
December 30, |
|
||
|
|
|
2017 |
|
|
2016 |
|
||
|
Cash flows provided by operating activities |
|
$ |
26,512 |
|
|
$ |
32,889 |
|
|
Cash flows used in investing activities |
|
$ |
(17,524 |
) |
|
$ |
(3,179 |
) |
|
Cash flows used in financing activities |
|
$ |
(11,181 |
) |
|
$ |
(33,499 |
) |
Cash Flows from Operating Activities
Net cash provided by operating activities was $26.5 million in 2017, as compared $32.9 million in 2016. In 2017, the net cash provided by operating activities was primarily due to net income adjusted for non-cash items, partially offset by increased accounts receivable and unbilled revenue and decreased accrued expenses and other liabilities due to the payout of 2016 incentive compensation. In 2016, the net cash provided by operating activities was primarily due to net income adjusted for non-cash items, partially offset by increased accounts receivable and unbilled revenue.
Cash Flows from Investing Activities
Net cash used in investing activities was $17.5 million in 2017, as compared to $3.2 million in 2016. In 2017, the cash utilized in investing included cash paid for the Jibe and Aecus acquisitions, and for the buyout of our interest in the CGBS Training and Certification Program for a total cash outflow of $11.3 million. In addition, cash was utilized for capital expenditures of $6.5 million for the development of the Hackett Academy and our benchmark technology, as well as further investments in internal corporate systems. In 2016, the cash utilized in investing included capital expenditures of $3.2 million on the continued development of our benchmark technology and the purchase of computer equipment as a result of the increase in headcount.
Cash Flows from Financing Activities
Net cash used in financing activities was $11.2 million in 2017 and $33.5 million in 2016. The usage of cash in 2017 was primarily related to the cost of the repurchase of $11.3 million of Company common stock under the Company’s share repurchase program, $4.4 million was utilized to satisfy employee net vesting-related tax requirements and $8.7 million was utilized to fund shareholder dividends. These cash uses were offset by the net borrowings under our credit facility of $12.0 million. The usage of cash in 2016 was primarily related to the cost of the repurchase of $30.1 million of Company common stock under the Company’s share repurchase program, $4.0 million was utilized to satisfy employee net vesting-related tax requirements and $7.2 million was utilized to fund shareholder dividends. These uses of cash were partially offset by the net borrowings under our credit facility of $7.0 million.
25
There were no material capital commitments as of December 29, 2017. The following table summarizes our future principal payments under our Credit Agreement and future lease commitments under our non-cancelable operating leases as of December 29, 2017 (in thousands):
|
Contractual Obligations |
|
Total |
|
|
Less Than 1 Year |
|
|
1-3 Years |
|
|
4-5 Years |
|
|
More Than 5 Years |
|
||||||||||
|
Short-term debt obligations (1) |
|
$ |
|
— |
|
|
$ |
|
— |
|
|
$ |
|
— |
|
|
$ |
|
— |
|
|
$ |
|
— |
|
|
Long-term debt obligations (1) |
|
|
|
19,000 |
|
|
|
|
— |
|
|
|
|
— |
|
|
|
|
19,000 |
|
|
|
|
— |
|
|
Operating lease obligations |
|
|
|
7,216 |
|
|
|
|
2,161 |
|
|
|
|
3,184 |
|
|
|
|
1,742 |
|
|
|
|
129 |
|
|
Total |
|
$ |
|
26,216 |
|
|
$ |
|
2,161 |
|
|
$ |
|
3,184 |
|
|
$ |
|
20,742 |
|
|
$ |
|
129 |
|
|
|
(1) |
Excludes the fee on the amount of any unused commitment that we may be obligated to pay under our Credit Agreement, as such amounts vary and cannot be estimated. See Note 8 to our consolidated financial statements included in this Annual Report on Form 10-K. |
Off-Balance Sheet Arrangements
We did not have any off-balance sheet arrangements as of December 29, 2017.
Recently Issued Accounting Standards
For discussion of recently issued accounting standards, see Note 1 to our consolidated financial statements included in this Annual Report on Form 10-K.
ITEM 7A . QUANTITATIVE AND QUALITATIVE DISCLOSURES ABOUT MARKET RISK
As of December 29, 2017, our exposure to market risk related primarily to changes in interest rates and foreign currency exchange rate risks.
Interest Rate Risk
Our exposure to market risk for changes in interest rates relates primarily to the Credit Facility, which is subject to variable interest rates. The interest rates per annum applicable to loans under the Credit Facility will be, at our option, equal to either a base rate or a LIBOR rate for one-, two-, three- or nine-month interest periods chosen by us in each case, plus an applicable margin percentage. A 100 basis point increase in our interest rate under our Credit Facility would not have had a material impact on our 2017 results of operations.
Exchange Rate Sensitivity
We face exposure to adverse movements in foreign currency exchange rates, as a portion of our revenue, expenses, assets and liabilities are denominated in currencies other than the U.S. Dollar, primarily the British Pound, the Euro and the Australian Dollar. The Company recognized losses related to foreign currency exchange of $0.7 million and $0.2 million in 2017 and 2015, respectively, and income of $0.6 million in 2016. These exposures may change over time as business practices evolve. Currently, we do not hold any derivative contracts that hedge our foreign currency risk, but we may adopt such strategies in the future.
For a discussion of the risks we face as a result of foreign currency fluctuations, see “Item 1A. Risk Factors” in Part I of this report.
26
ITEM 8. FINANCIAL STATEMENTS AND SUPPLEMENTARY DATA
THE HACKETT GROUP, INC.
INDEX TO FINANCIAL STATEMENTS AND SCHEDULE
|
|
|
Page |
|
|
28 |
|
|
Consolidated Balance Sheets as of December 29, 2017 and December 30, 2016 |
|
29 |
|
|
30 |
|
|
|
31 |
|
|
|
32 |
|
|
|
33 |
|
|
|
34 |
|
|
Schedule II – Valuation and Qualifying Accounts and Reserves |
|
55 |
27
REPORT OF INDEPENDENT REGISTERED PUBLIC ACCOUNTING FIRM
To the Shareholders and the Board of Directors of The Hackett Group, Inc.
Opinion on The Financial Statements
We have audited the accompanying consolidated balance sheets of The Hackett Group, Inc. (the Company) as of December 29, 2017 and December 30, 2016, the related consolidated statements of operations, comprehensive income, shareholders’ equity and cash flows for each of the three years in the period ended December 29, 2017, and the related notes to the consolidated financial statements and schedules (collectively, the financial statements). In our opinion, the financial statements present fairly, in all material respects, the financial position of The Hackett Group, Inc. as of December 29, 2017 and December 30, 2016, and the results of its operations and its cash flows for each of the three years in the period ended December 29, 2017, in conformity with accounting principles generally accepted in the United States of America.
We have also audited, in accordance with the standards of the Public Company Accounting Oversight Board (United States) (PCAOB), the Company’s internal control over financial reporting as of December 29, 2017, based on criteria established in Internal Control — Integrated Framework issued by the Committee of Sponsoring Organizations of the Treadway Commission in 2013, and our report dated March 8, 2018 expressed an unqualified opinion on the effectiveness of The Hackett Group, Inc.’s internal control over financial reporting.
Basis for Opinion
These financial statements are the responsibility of the Company’s management. Our responsibility is to express an opinion on the Company’s financial statements based on our audits. We are a public accounting firm registered with the PCAOB and are required to be independent with respect to the Company in accordance with U.S. federal securities laws and the applicable rules and regulations of the Securities and Exchange Commission and the PCAOB.
We conducted our audits in accordance with the standards of the PCAOB. Those standards require that we plan and perform the audits to obtain reasonable assurance about whether the financial statements are free of material misstatement, whether due to error or fraud. Our audits include performing procedures Our audits included performing procedures to assess the risks of material misstatement of the financial statements, whether due to error or fraud, and performing procedures that respond to those risks. Such procedures included examining, on a test basis, evidence regarding the amounts and disclosures in the financial statements. Our audits also included evaluating the accounting principles used and significant estimates made by management, as well as evaluating the overall presentation of the financial statements. We believe that our audits provide a reasonable basis for our opinion.
We have served as the Company’s auditor since 2015.
/s/ RSM US LLP
Fort Lauderdale, Florida
March 9, 2018
28
(in thousands, except share data)
|
|
|
December 29, |
|
|
December 30, |
|
||
|
|
|
2017 |
|
|
2016 |
|
||
|
ASSETS |
|
|
|
|
|
|
|
|
|
Current assets: |
|
|
|
|
|
|
|
|
|
Cash |
|
$ |
17,512 |
|
|
$ |
19,710 |
|
|
Accounts receivable and unbilled revenue, net of allowance of $2,601 and $2,574 at December 29, 2017 and December 30, 2016, respectively |
|
|
55,262 |
|
|
|
47,399 |
|
|
Prepaid expenses and other current assets |
|
|
2,511 |
|
|
|
1,704 |
|
|
Total current assets |
|
|
75,285 |
|
|
|
68,813 |
|
|
Property and equipment, net |
|
|
18,851 |
|
|
|
14,774 |
|
|
Other assets |
|
|
6,021 |
|
|
|
3,336 |
|
|
Goodwill |
|
|
85,074 |
|
|
|
72,376 |
|
|
Total assets |
|
$ |
185,231 |
|
|
$ |
159,299 |
|
|
LIABILITIES AND SHAREHOLDERS’ EQUITY |
|
|
|
|
|
|
|
|
|
Current liabilities: |
|
|
|
|
|
|
|
|
|
Accounts payable |
|
$ |
8,434 |
|
|
$ |
9,089 |
|
|
Accrued expenses and other liabilities |
|
|
43,014 |
|
|
|
46,725 |
|
|
Total current liabilities |
|
|
51,448 |
|
|
|
55,814 |
|
|
Non-current accrued expenses and other liabilities |
|
|
1,268 |
|
|
|
— |
|
|
Non-current deferred tax liability, net |
|
|
6,240 |
|
|
|
10,216 |
|
|
Long-term debt |
|
|
19,000 |
|
|
|
7,000 |
|
|
Total liabilities |
|
|
77,956 |
|
|
|
73,030 |
|
|
Commitments and contingencies |
|
|
|
|
|
|
|
|
|
Shareholders’ equity: |
|
|
|
|
|
|
|
|
|
Preferred stock, $.001 par value, 1,250,000 shares authorized, none issued and outstanding |
|
|
— |
|
|
|
— |
|
|
Common stock, $.001 par value, 125,000,000 shares authorized; 55,744,893 and 54,785,193 shares issued at December 29, 2017 and December 30, 2016, respectively |
|
|
56 |
|
|
|
55 |
|
|
Additional paid-in capital |
|
|
288,297 |
|
|
|
277,100 |
|
|
Treasury stock, at cost, 26,945,776 and 26,197,981 shares at December 29, 2017 and December 30, 2016, respectively |
|
|
(134,054 |
) |
|
|
(122,756 |
) |
|
Accumulated deficit |
|
|
(38,515 |
) |
|
|
(56,581 |
) |
|
Accumulated other comprehensive loss |
|
|
(8,509 |
) |
|
|
(11,549 |
) |
|
Total shareholders’ equity |
|
|
107,275 |
|
|
|
86,269 |
|
|
Total liabilities and shareholders’ equity |
|
$ |
185,231 |
|
|
$ |
159,299 |
|
The accompanying notes are an integral part of the consolidated financial statements.
29
CONSOLIDATED STATEMENTS OF OPERATIONS
(in thousands, except per share data)
|
|
|
Year Ended |
|
|||||||||
|
|
|
December 29, |
|
|
December 30, |
|
|
January 1, |
|
|||
|
|
|
2017 |
|
|
2016 |
|
|
2016 |
|
|||
|
Revenue: |
|
|
|
|
|
|
|
|
|
|
|
|
|
Revenue before reimbursements |
|
$ |
263,252 |
|
|
$ |
259,907 |
|
|
$ |
234,581 |
|
|
Reimbursements |
|
|
22,610 |
|
|
|
28,654 |
|
|
|
26,359 |
|
|
Total revenue |
|
|
285,862 |
|
|
|
288,561 |
|
|
|
260,940 |
|
|
Costs and expenses: |
|
|
|
|
|
|
|
|
|
|
|
|
|
Cost of service: |
|
|
|
|
|
|
|
|
|
|
|
|
|
Personnel costs before reimbursable expenses (includes $6,985, $5,758 and $5,359 of stock compensation expense in 2017, 2016 and 2015, respectively) |
|
|
166,312 |
|
|
|
163,273 |
|
|
|
147,024 |
|
|
Reimbursable expenses |
|
|
22,610 |
|
|
|
28,654 |
|
|
|
26,359 |
|
|
Total cost of service |
|
|
188,922 |
|
|
|
191,927 |
|
|
|
173,383 |
|
|
Selling, general and administrative costs (includes $3,330, $3,007 and $5,002 of stock compensation expense in 2017, 2016, and 2015, respectively) |
|
|
64,825 |
|
|
|
62,081 |
|
|
|
65,632 |
|
|
Restructuring cost |
|
|
1,293 |
|
|
|
— |
|
|
|
— |
|
|
Total costs and operating expenses |
|
|
255,040 |
|
|
|
254,008 |
|
|
|
239,015 |
|
|
Operating income |
|
|
30,822 |
|
|
|
34,553 |
|
|
|
21,925 |
|
|
Other expense: |
|
|
|
|
|
|
|
|
|
|
|
|
|
Interest expense |
|
|
(584 |
) |
|
|
(387 |
) |
|
|
(409 |
) |
|
Income from operations before income taxes |
|
|
30,238 |
|
|
|
34,166 |
|
|
|
21,516 |
|
|
Income tax expense |
|
|
2,884 |
|
|
|
12,625 |
|
|
|
7,707 |
|
|
Net income |
|
$ |
27,354 |
|
|
$ |
21,541 |
|
|
$ |
13,809 |
|
|
Basic net income per common share: |
|
|
|
|
|
|
|
|
|
|
|
|
|
Income per common share from operations |
|
$ |
0.95 |
|
|
$ |
0.74 |
|
|
$ |
0.47 |
|
|
Weighted average common shares outstanding |
|
|
28,852 |
|
|
|
29,082 |
|
|
|
29,620 |
|
|
Diluted net income per common share: |
|
|
|
|
|
|
|
|
|
|
|
|
|
Income per common share from operations |
|
$ |
0.85 |
|
|
$ |
0.66 |
|
|
$ |
0.43 |
|
|
Weighted average common and common equivalent shares outstanding |
|
|
32,196 |
|
|
|
32,815 |
|
|
|
31,968 |
|
The accompanying notes are an integral part of the consolidated financial statements.
30
CONSOLIDATED STATEMENTS OF COMPREHENSIVE INCOME
(in thousands)
|
|
|
Year Ended |
|
|||||||||
|
|
|
December 29, |
|
|
December 30, |
|
|
January 1, |
|
|||
|
|
|
2017 |
|
|
2016 |
|
|
2016 |
|
|||
|
Net income |
|
$ |
27,354 |
|
|
$ |
21,541 |
|
|
$ |
13,809 |
|
|
Foreign currency translation adjustment |
|
|
3,040 |
|
|
|
(3,577 |
) |
|
|
(1,807 |
) |
|
Total comprehensive income |
|
$ |
30,394 |
|
|
$ |
17,964 |
|
|
$ |
12,002 |
|
The accompanying notes are an integral part of the consolidated financial statements.
31
CONSOLIDATED STATEMENTS OF SHAREHOLDERS’ EQUITY
(in thousands)
|
|
|
|
|
|
|
|
|
|
|
|
|
|
|
|
|
|
|
|
|
|
|
|
|
|
|
Accumulated |
|
|
|
|
|
|
|
|
|
|
|
|
|
|
|
|
|
Additional |
|
|
|
|
|
|
|
|
|
|
|
|
|
|
Other |
|
|
Total |
|
|||
|
|
|
Common Stock |
|
|
Paid in |
|
|
Treasury Stock |
|
|
Accumulated |
|
|
Comprehensive |
|
|
Shareholders’ |
|
||||||||||||||
|
|
|
Shares |
|
|
Amount |
|
|
Capital |
|
|
Shares |
|
|
Amount |
|
|
Deficit |
|
|
Loss |
|
|
Equity |
|
||||||||
|
Balance at January 2, 2015 |
|
|
53,203 |
|
|
$ |
53 |
|
|
$ |
264,912 |
|
|
|
(23,989 |
) |
|
$ |
(91,335 |
) |
|
$ |
(77,677 |
) |
|
$ |
(6,165 |
) |
|
$ |
89,788 |
|
|
Issuance of common stock |
|
|
644 |
|
|
|
1 |
|
|
|
(1,543 |
) |
|
|
— |
|
|
|
— |
|
|
|
— |
|
|
|
— |
|
|
|
(1,542 |
) |
|
Treasury stock purchased |
|
|
— |
|
|
|
— |
|
|
|
— |
|
|
|
(149 |
) |
|
|
(1,356 |
) |
|
|
— |
|
|
|
— |
|
|
|
(1,356 |
) |
|
Amortization of restricted stock units |
|
|
|
|
|
|
|
|
|
|
|
|
|
|
|
|
|
|
|
|
|
|
|
|
|
|
|
|
|
|
|
|
|
and common stock subject to |
|
|
|
|
|
|
|
|
|
|
|
|
|
|
|
|
|
|
|
|
|
|
|
|
|
|
|
|
|
|
|
|
|
vesting requirements |
|
|
— |
|
|
|
— |
|
|
|
9,518 |
|
|
|
— |
|
|
|
— |
|
|
|
— |
|
|
|
— |
|
|
|
9,518 |
|
|
Dividends declared |
|
|
— |
|
|
|
— |
|
|
|
— |
|
|
|
— |
|
|
|
— |
|
|
|
(6,266 |
) |
|
|
— |
|
|
|
(6,266 |
) |
|
Net income |
|
|
— |
|
|
|
— |
|
|
|
— |
|
|
|
— |
|
|
|
— |
|
|
|
13,809 |
|
|
|
— |
|
|
|
13,809 |
|
|
Foreign currency translation |
|
|
— |
|
|
|
— |
|
|
|
— |
|
|
|
— |
|
|
|
— |
|
|
|
— |
|
|
|
(1,807 |
) |
|
|
(1,807 |
) |
|
Balance at January 1, 2016 |
|
|
53,847 |
|
|
$ |
54 |
|
|
$ |
272,887 |
|
|
|
(24,138 |
) |
|
$ |
(92,691 |
) |
|
$ |
(70,134 |
) |
|
$ |
(7,972 |
) |
|
$ |
102,144 |
|
|
Issuance of common stock |
|
|
938 |
|
|
|
1 |
|
|
|
(3,032 |
) |
|
|
— |
|
|
|
— |
|
|
|
— |
|
|
|
— |
|
|
|
(3,031 |
) |
|
Treasury stock purchased |
|
|
— |
|
|
|
— |
|
|
|
— |
|
|
|
(2,059 |
) |
|
|
(30,065 |
) |
|
|
— |
|
|
|
— |
|
|
|
(30,065 |
) |
|
Amortization of restricted stock units |
|
|
|
|
|
|
|
|
|
|
|
|
|
|
|
|
|
|
|
|
|
|
|
|
|
|
|
|
|
|
|
|
|
and common stock subject to |
|
|
|
|
|
|
|
|
|
|
|
|
|
|
|
|
|
|
|
|
|
|
|
|
|
|
|
|
|
|
|
|
|
vesting requirements |
|
|
— |
|
|
|
— |
|
|
|
7,245 |
|
|
|
— |
|
|
|
— |
|
|
|
— |
|
|
|
— |
|
|
|
7,245 |
|
|
Dividends declared |
|
|
— |
|
|
|
— |
|
|
|
— |
|
|
|
— |
|
|
|
— |
|
|
|
(7,988 |
) |
|
|
— |
|
|
|
(7,988 |
) |
|
Net income |
|
|
— |
|
|
|
— |
|
|
|
— |
|
|
|
— |
|
|
|
— |
|
|
|
21,541 |
|
|
|
— |
|
|
|
21,541 |
|
|
Foreign currency translation |
|
|
— |
|
|
|
— |
|
|
|
— |
|
|
|
— |
|
|
|
— |
|
|
|
— |
|
|
|
(3,577 |
) |
|
|
(3,577 |
) |
|
Balance at December 30, 2016 |
|
|
54,785 |
|
|
$ |
55 |
|
|
$ |
277,100 |
|
|
|
(26,197 |
) |
|
$ |
(122,756 |
) |
|
$ |
(56,581 |
) |
|
$ |
(11,549 |
) |
|
$ |
86,269 |
|
|
Issuance of common stock |
|
|
960 |
|
|
|
1 |
|
|
|
(3,211 |
) |
|
|
— |
|
|
|
— |
|
|
|
— |
|
|
|
— |
|
|
|
(3,210 |
) |
|
Treasury stock purchased |
|
|
— |
|
|
|
— |
|
|
|
— |
|
|
|
(748 |
) |
|
|
(11,298 |
) |
|
|
— |
|
|
|
— |
|
|
|
(11,298 |
) |
|
Amortization of restricted stock units |
|
|
|
|
|
|
|
|
|
|
|
|
|
|
|
|
|
|
|
|
|
|
|
|
|
|
|
|
|
|
|
|
|
and common stock subject to |
|
|
|
|
|
|
|
|
|
|
|
|
|
|
|
|
|
|
|
|
|
|
|
|
|
|
|
|
|
|
|
|
|
vesting requirements |
|
|
— |
|
|
|
— |
|
|
|
14,408 |
|
|
|
— |
|
|
|
— |
|
|
|
— |
|
|
|
— |
|
|
|
14,408 |
|
|
Dividends declared |
|
|
— |
|
|
|
— |
|
|
|
— |
|
|
|
— |
|
|
|
— |
|
|
|
(9,288 |
) |
|
|
— |
|
|
|
(9,288 |
) |
|
Net income |
|
|
— |
|
|
|
— |
|
|
|
— |
|
|
|
— |
|
|
|
— |
|
|
|
27,354 |
|
|
|
— |
|
|
|
27,354 |
|
|
Foreign currency translation |
|
|
— |
|
|
|
— |
|
|
|
— |
|
|
|
— |
|
|
|
— |
|
|
|
— |
|
|
|
3,040 |
|
|
|
3,040 |
|
|
Balance at December 29, 2017 |
|
|
55,745 |
|
|
$ |
56 |
|
|
$ |
288,297 |
|
|
|
(26,945 |
) |
|
$ |
(134,054 |
) |
|
$ |
(38,515 |
) |
|
$ |
(8,509 |
) |
|
$ |
107,275 |
|
The accompanying notes are an integral part of the consolidated financial statements.
32
CONSOLIDATED STATEMENTS OF CASH FLOWS
(in thousands)
|
|
|
Year Ended |
|
|||||||||
|
|
|
December 29, |
|
|
December 30, |
|
|
January 1, |
|
|||
|
|
|
2017 |
|
|
2016 |
|
|
2016 |
|
|||
|
Cash flows from operating activities: |
|
|
|
|
|
|
|
|
|
|
|
|
|
Net income |
|
$ |
27,354 |
|
|
$ |
21,541 |
|
|
$ |
13,809 |
|
|
Adjustments to reconcile net income to net |
|
|
|
|
|
|
|
|
|
|
|
|
|
cash provided by operating activities: |
|
|
|
|
|
|
|
|
|
|
|
|
|
Depreciation expense |
|
|
2,442 |
|
|
|
2,485 |
|
|
|
2,582 |
|
|
Amortization expense |
|
|
2,090 |
|
|
|
1,100 |
|
|
|
2,207 |
|
|
Amortization of debt issuance costs |
|
|
90 |
|
|
|
106 |
|
|
|
98 |
|
|
Provision for doubtful accounts |
|
|
117 |
|
|
|
38 |
|
|
|
89 |
|
|
(Gain) loss on foreign currency transactions |
|
|
695 |
|
|
|
(594 |
) |
|
|
170 |
|
|
Non-cash stock compensation expense |
|
|
10,316 |
|
|
|
8,765 |
|
|
|
10,361 |
|
|
Acquisition consideration reflected as compensation expense |
|
|
— |
|
|
|
— |
|
|
|
(3,440 |
) |
|
Deferred income tax expense (benefit) |
|
|
(1,781 |
) |
|
|
2,339 |
|
|
|
4,978 |
|
|
Changes in assets and liabilities, net of acquisition: |
|
|
|
|
|
|
|
|
|
|
|
|
|
Increase in accounts receivable and unbilled revenue |
|
|
(5,278 |
) |
|
|
(4,709 |
) |
|
|
(4,761 |
) |
|
(Increase) decrease in prepaid expenses and other assets |
|
|
(887 |
) |
|
|
135 |
|
|
|
312 |
|
|
Increase (decrease) in accounts payable |
|
|
(1,064 |
) |
|
|
790 |
|
|
|
390 |
|
|
Increase (decrease) in accrued expenses and other liabilities |
|
|
(7,585 |
) |
|
|
893 |
|
|
|
9,382 |
|
|
Net cash provided by operating activities |
|
|
26,509 |
|
|
|
32,889 |
|
|
|
36,177 |
|
|
Cash flows from investing activities: |
|
|
|
|
|
|
|
|
|
|
|
|
|
Purchases of property and equipment |
|
|
(6,517 |
) |
|
|
(3,179 |
) |
|
|
(3,002 |
) |
|
Cash consideration paid for acquisitions |
|
|
(11,268 |
) |
|
|
— |
|
|
|
— |
|
|
Cash acquired in acquisition |
|
|
261 |
|
|
|
— |
|
|
|
— |
|
|
Net cash used in investing activities |
|
|
(17,524 |
) |
|
|
(3,179 |
) |
|
|
(3,002 |
) |
|
Cash flows from financing activities: |
|
|
|
|
|
|
|
|
|
|
|
|
|
Proceeds from borrowings |
|
|
26,000 |
|
|
|
30,000 |
|
|
|
2,500 |
|
|
Payment of debt borrowings |
|
|
(14,000 |
) |
|
|
(23,000 |
) |
|
|
(20,763 |
) |
|
Debt issuance costs |
|
|
— |
|
|
|
(237 |
) |
|
|
(14 |
) |
|
Dividends paid |
|
|
(8,670 |
) |
|
|
(7,163 |
) |
|
|
(3,067 |
) |
|
Proceeds from issuance of common stock |
|
|
1,208 |
|
|
|
984 |
|
|
|
945 |
|
|
Repurchases of common stock |
|
|
(15,716 |
) |
|
|
(34,083 |
) |
|
|
(3,838 |
) |
|
Net cash used in financing activities |
|
|
(11,178 |
) |
|
|
(33,499 |
) |
|
|
(24,237 |
) |
|
Effect of exchange rate on cash |
|
|
(5 |
) |
|
|
(4 |
) |
|
|
(43 |
) |
|
Net increase (decrease) in cash |
|
|
(2,198 |
) |
|
|
(3,793 |
) |
|
|
8,895 |
|
|
Cash at beginning of year |
|
|
19,710 |
|
|
|
23,503 |
|
|
|
14,608 |
|
|
Cash at end of year |
|
$ |
17,512 |
|
|
$ |
19,710 |
|
|
$ |
23,503 |
|
|
Supplemental disclosure of cash flow information: |
|
|
|
|
|
|
|
|
|
|
|
|
|
Cash paid for income taxes |
|
$ |
3,698 |
|
|
$ |
8,757 |
|
|
$ |
268 |
|
|
Cash paid for interest |
|
$ |
510 |
|
|
$ |
282 |
|
|
$ |
335 |
|
|
|
|
|
|
|
|
|
|
|
|
|
|
|
|
Supplemental disclosure of non-cash investing and financing activities: |
|
|
|
|
|
|
|
|
|
|
|
|
|
Shares issued to sellers and key personnel of Jibe Consulting |
|
$ |
3,613 |
|
|
$ |
- |
|
|
$ |
- |
|
The accompanying notes are an integral part of the consolidated financial statements.
33
THE HACKETT GROUP, INC.
NOTES TO CONSOLIDATED FINANCIAL STATEMENTS
1. Basis of Presentation and General Information
Nature of Business
The Hackett Group is an intellectual property-based strategic consultancy and leading enterprise benchmarking and best practices implementation firm to global companies. Services include business transformation, enterprise performance management, working capital management, and global business services. The Hackett Group also provides dedicated expertise in business strategy, operations, finance, human capital management, strategic sourcing, procurement, and information technology, including its award-winning Oracle EPM and SAP practices.
Basis of Presentation and Consolidation
The accompanying consolidated financial statements include the Company’s accounts and those of its wholly-owned subsidiaries which the Company is required to consolidate. The Company consolidates the assets, liabilities, and results of operations of its entities.
Fiscal Year
The Company’s fiscal year generally consists of a 52-week period and periodically consists of a 53-week period as each fiscal year ends on the Friday closest to December 31. Fiscal years 2017, 2016, and 2015 ended on December 29, 2017, December 30, 2016, and January 1, 2016, respectively. References to a year included in the consolidated financial statements refer to a fiscal year rather than a calendar year.
Cash and Restricted Cash
The Company considers all short-term investments with maturities of three months or less to be cash equivalents to the extent that it places its temporary cash investments with high credit quality financial institutions. At times, such investments may be in excess of the F.D.I.C. insurance limits.
As of December 29, 2017 and December 30, 2016, the Company did not have any restricted cash balances or cash equivalents.
Allowance for Doubtful Accounts
The Company maintains allowances for doubtful accounts for estimated losses resulting from its clients not making required payments. Management makes estimates of the collectability of accounts receivable and critically reviews accounts receivable and analyzes historical bad debts, past-due accounts, client credit-worthiness and current economic trends when evaluating the adequacy of the allowance for doubtful accounts. If the financial condition of the Company’s clients were to deteriorate, resulting in their inability to make payments, additional allowances may be required.
Dividends
In December 2012, the Company’s Board of Directors approved the initiation of an annual cash dividend program in the amount of $0.10 per share. The Company’s Board of Directors has been gradually increasing the dividend over the years. In fiscal 2016, the Company’s Board of Directors approved an increase in the annual dividend to $0.26 per share, to be paid semi-annually. In 2016, the Company paid dividends of $0.23 per share. In 2017, the Company’s Board of Directors approved an increase in the annual dividend to $0.30 per share. Subsequent to year end 2017, the Company’s Board of Directors approved the increase in the annual dividend from $0.30 per share to $0.34 per share to be paid on a semi-annual basis. The dividend policy is reviewed periodically by the Board of Directors. The amount and timing of all dividend payments is subject to the discretion of the Board of Directors and will depend upon business conditions, contractual obligations, legal restrictions, results of operations, financial conditions and other factors.
Property and Equipment, Net
Property and equipment are recorded at cost. Depreciation is calculated to amortize the depreciable assets over their useful lives using the straight-line method and commences when the asset is placed in service. The range of estimated useful lives is three to ten years. Leasehold improvements are amortized on a straight-line basis over the term of the lease or the estimated useful life of the improvement, whichever is shorter. Expenditures for repairs and maintenance are charged to expense as incurred. Expenditures for betterments and major improvements are capitalized. The carrying amount of assets sold or retired and related accumulated depreciation are removed from the balance sheet in the year of disposal and any resulting gains or losses are included in the consolidated statements of operations.
34
THE HACKETT GROUP, INC.
NOTES TO CONSOLIDATED FINANCIAL STATEMENTS
1. Basis of Presentation and General Information (continued)
The Company capitalizes the costs of internal-use software, which generally includes hardware, software, and payroll-related costs for employees who are directly associated with, and who devote time, to the development of internal-use computer software.
Long-Lived Assets (excluding Goodwill and Other Intangible Assets)
Long-lived assets are reviewed for impairment whenever events or circumstances indicate that the carrying amount of an asset may not be fully recoverable. If an evaluation is required, the estimated future undiscounted cash flows associated with the asset are compared to the asset’s carrying amount to determine if there has been an impairment. The amount of an impairment is calculated as the difference between the fair value of the asset and its carrying value. Estimates of future undiscounted cash flows are based on management’s view of growth rates for the related business, anticipated future economic conditions and estimates of residual values.
Business Combinations
For transactions that are considered business combinations, the Company utilizes fair values in determining the carrying values of the purchased assets and assumed liabilities, which are recorded at fair value at acquisition date, and identifiable intangible assets are recorded at fair value. Costs directly related to the business combinations are recorded as expenses as they are incurred. Fair values are subject to refinement for up to one year after the closing date of an acquisition as information relative to closing date fair values become available.
Goodwill and Other Intangible Assets
Goodwill and intangible assets deemed to have indefinite lives are not amortized, but rather are tested for impairment on an annual basis, or more frequently if events or changes in circumstances indicate potential impairment. Finite-lived intangible assets are amortized over their useful lives. The excess cost of the acquisition over the fair value of the net assets acquired is recorded as goodwill.
Goodwill is tested at least annually for impairment at the reporting unit level utilizing the market approach. The reporting units consist of The Hackett Group (including Benchmarking, Business Transformation, Business Transformation Enterprise Performance Management (“EPM”), Strategy and Operations, Executive Advisory Programs and Robotics Process Automation) and Hackett Technology Solutions (including SAP ERP and SAP Application Maintenance and Support (“AMS”), Oracle EPM and EPM AMS). In assessing the recoverability of goodwill and intangible assets, the Company utilizes the market approach and makes estimates based on assumptions regarding various factors to determine if impairment tests are met. The market approach utilizes valuation multiples based on operating data from publicly traded companies within the same industry. Multiples derived from guideline companies provide an indication of how much a knowledgeable investor in the marketplace would be willing to pay for a company. These multiples are then applied to the Company’s reporting units to arrive at an indication of value. This approach contains management’s judgment, using appropriate and customary assumptions available at the time.
The Company performed its annual step one impairment test of goodwill in the fourth quarter of fiscal years 2017 and 2016 and determined that goodwill was not impaired. The carrying amount and activity of goodwill attributable to The Hackett Group and Hackett Technology Solutions was as follows (in thousands):
|
|
|
|
|
|
|
Hackett |
|
|
|
|
|
|
|
|
|
The Hackett |
|
|
Technology |
|
|
|
|
|
||
|
|
|
Group |
|
|
Solutions |
|
|
Total |
|
|||
|
Balance at January 1, 2016 |
|
|
43,450 |
|
|
|
31,134 |
|
|
|
74,584 |
|
|
Foreign currency translation adjustment |
|
|
(2,208 |
) |
|
|
— |
|
|
|
(2,208 |
) |
|
Balance at December 30, 2016 |
|
|
41,242 |
|
|
|
31,134 |
|
|
|
72,376 |
|
|
Additions (see Note 15) |
|
|
1,858 |
|
|
|
9,538 |
|
|
|
11,396 |
|
|
Foreign currency translation adjustment |
|
|
1,302 |
|
|
|
— |
|
|
|
1,302 |
|
|
Balance at December 29, 2017 |
|
$ |
44,402 |
|
|
$ |
40,672 |
|
|
$ |
85,074 |
|
35
THE HACKETT GROUP, INC.
NOTES TO CONSOLIDATED FINANCIAL STATEMENTS
1. Basis of Presentation and General Information (continued)
Other intangible assets are tested for potential impairment whenever events or changes in circumstances suggest that the carrying value of an asset may not be fully recoverable. If an evaluation is required, the estimated future undiscounted cash flows associated with the asset are compared to the asset’s carrying amount to determine if there has been an impairment. The amount of an impairment is calculated as the difference between the fair value of the asset and its carrying value. Estimates of future undiscounted cash flows are based on management’s view of growth rates for the related business, anticipated future economic conditions and estimates of residual values. Other intangible assets arise from business combinations and consist of customer relationships, customer backlog and trademarks that are amortized on a straight-line or accelerated basis over periods of up to ten years.
Other intangible assets, included in other assets in the accompanying consolidated balance sheets, consist of the following (in thousands):
|
|
|
|
|
December 29, |
|
|
December 30, |
|
||
|
|
|
|
|
2017 |
|
|
2016 |
|
||
|
Gross carrying amount |
|
|
|
$ |
27,147 |
|
|
$ |
22,448 |
|
|
Accumulated amortization |
|
|
|
|
(21,869 |
) |
|
|
(19,779 |
) |
|
Foreign currency translation adjustment |
|
|
|
|
245 |
|
|
|
33 |
|
|
|
|
|
|
$ |
5,523 |
|
|
$ |
2,702 |
|
All of the Company’s intangible assets are expected to be fully amortized by the end of 2027. For the years ended December 29, 2017, December 30, 2016 and January 1, 2016, the Company recorded $2.1 million, $1.1 million and $2.2 million of amortization expense, respectively. The estimated future amortization expense of intangible assets as of December 29, 2017 is as follows: $2.4 million in 2018, $0.7 million in 2019, $0.6 million in 2020, $0.6 million in 2021, $0.3 million in 2022 and $0.7 million thereafter. See Note 15 for further discussion.
Revenue Recognition
Revenue is principally derived from fees for services generated on a project-by-project basis. Revenue for services rendered is recognized on a time and materials basis or on a fixed-fee or capped-fee basis.
Revenue for time and materials contracts is recognized based on the number of hours worked by our consultants at an agreed upon rate per hour and is recognized in the period in which services are performed.
Revenue related to fixed-fee or capped-fee contracts is recognized on the proportional performance method of accounting based on the ratio of labor hours incurred to estimated total labor hours. This percentage is multiplied by the contracted dollar amount of the project to determine the amount of revenue to recognize in an accounting period. The contracted dollar amount used in this calculation excludes the amount the client pays for reimbursable expenses. There are situations where the number of hours to complete projects may exceed the original estimate. These increases can be as a result of an increase in project scope, unforeseen events that arise, or the inability of the client or the delivery team to fulfill their responsibilities. On an on-going basis, project delivery, Office of Risk Management and finance personnel review hours incurred and estimated total labor hours to complete projects. Any revisions in these estimates are reflected in the period in which they become known. If the Company estimates indicate that a contract loss will occur, a loss provision will be recorded in the period in which the loss first becomes probable and reasonably estimable. Contract losses are determined to be the amount by which the estimated direct costs of the contract exceed the estimated total revenue that will be generated by the contract and are included in total cost of service.
Revenue from advisory services is recognized ratably over the life of the agreements.
Additionally, the Company earns revenue from the resale of software licenses and maintenance contracts. Revenue for the resale software and software licenses is recognized upon contract execution and customer receipt of software. Revenue from maintenance contracts is recognized ratably over the life of the agreements.
Revenue for contracts with multiple elements is allocated based on the respective selling price of the individual elements.
Unbilled revenue represents revenue for services performed that have not been invoiced. If the Company does not accurately estimate the scope of the work to be performed, or does not manage its projects properly within the planned periods of time, or does not meet clients’ expectations under the contracts, then future consulting margins may be negatively affected or losses on existing contracts may need to be recognized. Any such reductions in margins or contract losses could be material to the Company’s results of operations.
36
THE HACKETT GROUP, INC.
NOTES TO CONSOLIDATED FINANCIAL STATEMENTS
1. Basis of Presentation and General Information (continued)
Sales tax collected from customers and remitted to the applicable taxing authorities is accounted for on a net basis, with no impact on revenue.
Revenue before reimbursements excludes reimbursable expenses charged to clients. Reimbursements, which include travel and out-of-pocket expenses, are included in revenue, and an equivalent amount of reimbursable expenses is included in cost of service.
The agreements entered into in connection with a project, whether time and materials based or fixed-fee or capped-fee based, typically allow clients to terminate early due to breach or for convenience with 30 days’ notice. In the event of termination, the client is contractually required to pay for all time, materials and expenses incurred by the Company through the effective date of the
termination. In addition, from time to time the Company enters into agreements with its clients that limit its right to enter into business relationships with specific competitors of that client for a specific time period. These provisions typically prohibit the Company from performing a defined range of services which it might otherwise be willing to perform for potential clients. These provisions are generally limited to six to twelve months and usually apply only to specific employees or the specific project team.
Stock Based Compensation
The Company recognizes compensation expense for awards of equity instruments to employees based on the grant-date fair value of those awards, with limited exceptions, over the requisite service period.
Restructuring Reserves
Restructuring reserves reflect judgments and estimates of the Company’s ultimate costs of severance, closure and consolidation of facilities and settlement of contractual obligations under its operating leases, including sublease rental rates, absorption period to sublease space and other related costs. The Company reassesses the reserve requirements to complete each individual plan under the restructuring programs at the end of each reporting period. If these estimates change in the future or actual results differ from the Company’s estimates, additional charges may be required.
Income Taxes
Deferred tax assets and liabilities are determined based on differences between the financial reporting carrying values and tax bases of assets and liabilities, and are measured by using enacted tax rates expected to apply to taxable income in the years in which those differences are expected to reverse. Deferred income taxes also reflect the impact of certain state operating loss and tax credit carryforwards. A valuation allowance is provided if the Company believes it is more likely than not that all or some portion of the deferred tax asset will not be realized. An increase or decrease in the valuation allowance, if any, that results from a change in circumstances, and which causes a change in the Company’s judgment about the realizability of the related deferred tax asset, is included in the tax provision.
The Company utilized a more-likely-than-not threshold for financial statement recognition and measurement of a tax position taken or expected to be taken in a tax return. This interpretation also provides guidance on de-recognition of income tax assets and liabilities, classification of current and deferred income tax assets and liabilities, accounting for interest and penalties associated with tax positions, accounting for income taxes in interim periods and income tax disclosures. The Company reports penalties and tax-related interest expense as a component of income tax expense.
Net Income per Common Share
Basic net income per common share is computed by dividing net income by the weighted average number of common shares outstanding during the period. With regard to common stock subject to vesting requirements and restricted stock units issued to employees, the calculation includes only the vested portion of such stock.
The potential issuance of common shares upon the exercise, conversion or vesting of unvested restricted stock units, common stock subject to vesting, stock options and stock appreciation right units ("SARs"), as calculated under the treasury stock method, may be dilutive. Diluted net income per share is computed by dividing the net income by the weighted average number of common shares outstanding, and will increase by the assumed conversion of other potentially dilutive securities during the period.
37
THE HACKETT GROUP, INC.
NOTES TO CONSOLIDATED FINANCIAL STATEMENTS
1. Basis of Presentation and General Information (continued)
The following table reconciles basic and diluted weighted average shares:
|
|
|
Year Ended |
|
||||||||||||
|
|
|
December 29, |
|
|
December 30, |
|
|
January 1, |
|
||||||
|
|
|
2017 |
|
|
2016 |
|
|
2016 |
|
||||||
|
Basic weighted average common shares outstanding |
|
|
28,852,251 |
|
|
|
29,082,253 |
|
|
|
29,620,361 |
|
|||
|
Effect of dilutive securities: |
|
|
|
|
|
|
|
|
|
|
|
|
|||
|
Unvested restricted stock units and common stock subject to vesting requirements issued to employees |
|
|
1,002,380 |
|
|
|
1,413,893 |
|
|
|
1,617,820 |
|
|||
|
Common stock issuable upon the exercise of stock options and SARs |
|
|
2,341,501 |
|
|
|
2,319,245 |
|
|
|
729,447 |
|
|||
|
Dilutive weighted average common shares outstanding |
|
|
32,196,132 |
|
|
|
32,815,391 |
|
|
|
31,967,628 |
|
|||
There were 0.8 million, 0.8 million and 0.5 million shares of underlying awards granted excluded from the above reconciliation for the years ended 2017, 2016, and 2015, respectively, as their inclusion would have had an anti-dilutive effect on diluted net income per share.
Fair Value of Financial Instruments
The Company’s financial instruments consist of cash and cash equivalents, accounts receivable and unbilled revenue, accounts payable, accrued expenses and other liabilities and debt. As of December 29, 2017 and December 30, 2016, the carrying amount of each financial instrument, with the exception of debt, approximated the instrument’s fair value due to the short-term nature and maturity of these instruments.
The Company uses significant other observable market data or assumptions (Level 2 inputs as defined in accounting guidance) that it believes market participants would use in pricing debt. The fair value of the debt approximated its carrying amount using Level 2 inputs, due to the short-term variable interest rates based on market rates utilizing the market approach.
Concentration of Credit Risk
The Company provides services primarily to Global 2000 companies and other sophisticated buyers of business consulting and information technology services. The Company performs ongoing credit evaluations of its major customers and maintains reserves for potential credit losses. In 2017, 2016, and 2015, no customer accounted for more than 5% of total revenue.
Management’s Estimates
The preparation of financial statements in conformity with U.S. GAAP requires management to make estimates and assumptions that affect the reported amounts of assets and liabilities and disclosure of contingent assets and liabilities as of the date of the financial statements and the reported amounts of revenue and expenses during the reporting period. Actual results could differ from those estimates.
Other Comprehensive Income
The Company reports its comprehensive income in accordance with FASB ASC Topic 220, Comprehensive Income, which establishes standards for reporting and presenting comprehensive income and its components in a full set of financial statements. Other comprehensive income consists of net income and cumulative currency translation adjustments.
38
THE HACKETT GROUP, INC.
NOTES TO CONSOLIDATED FINANCIAL STATEMENTS
1. Basis of Presentation and General Information (continued)
Segment Reporting
The Company engages in business activities in one operating segment, which provides business and technology consulting services.
Recent Accounting Pronouncements
In May 2014, the Financial Accounting Standards Board (“FASB”) issued guidance on revenue recognition, which provides for a single, principles-based model for revenue recognition and replaces the existing revenue recognition guidance. The guidance is effective for annual and interim periods beginning on or after December 15, 2017 and will replace most existing revenue recognition guidance under U.S. GAAP when it becomes effective. It permits the use of either a full retrospective or modified retrospective transition method.
The Company has completed its assessment of the impact of adopting the requirements of Accounting Standards Update (“ASU”) No. 2014-09, Revenue from Contracts with Customers (“Topic 606”) on its existing revenue recognition policies, including completing our contract reviews and our evaluation of the incremental costs of obtaining a contract, and has adopted the standard effective December 30, 2017, using the modified retrospective method of adoption. The guidance requires significantly expanded disclosures around the nature, amount, timing and uncertainty of revenue and cash flows arising from contracts with customers which we will include in our March 30, 2018 interim filing. The Company has concluded that the adoption of ASC 606 did not have a material impact on its consolidated financial statements.
In February 2016, the FASB issued guidance on leases which supersedes the current lease guidance. The core principle requires lessees to recognize the assets and liabilities that arise from nearly all leases on the balance sheet. Accounting applied by lessors will remain largely consistent with previous guidance. The amendments are effective for fiscal years beginning after December 15, 2018, including interim periods within those fiscal years. Early adoption is permitted. The Company is assessing the impact of this standard on its consolidated financial statements and related disclosures.
In March 2016, the FASB issued guidance simplifying the accounting for share-based payment transactions including the income tax consequences, classification of awards as either equity or liabilities and classification on the statements of cash flows. Under the new standard, all excess tax benefits and tax deficiencies should be recognized as income tax expense or benefit on the statements of income. An excess income tax benefit arises when the tax deduction of a share-based award for income tax purposes exceeds the compensation cost recognized for financial reporting purposes and, a tax deficiency arises when the compensation cost exceeds the tax deduction. Under current GAAP, excess tax benefits are recognized as additional paid-in capital while tax deficiencies are recognized either as an offset to accumulated excess tax benefits, if any, or on the statements of income.
Management adopted the guidance effective December 31, 2016. As a result of the adoption of this guidance, management made an accounting policy election to recognize the effect of forfeitures in compensation cost when they occur, which had an immaterial impact on results of operations and financial position and no impact on cash flows at adoption. In the first quarter of 2017, the Company recorded no income tax expense as a result of the adoption of the new guidance relating to the accounting on the vesting of share-based awards. Excluding the effect of the new guidance, the effective tax rate would have been 34% for certain federal, foreign and state taxes during the twelve months ended December 29, 2017.
In August 2016, the FASB issued guidance on the classification of certain cash receipts and cash payments. The guidance provides specific clarification on eight cash flow classification issues, including contingent consideration payments made after a business combination. The guidance is effective for interim and annual periods beginning after December 15, 2017. Early adoption is permitted and the guidance requires a retrospective transition. We do not expect the guidance to have a material impact on our consolidated financial statements.
In January 2017, the FASB issued guidance which simplifies the accounting for goodwill impairment. The guidance removes step two of the goodwill impairment test, which requires a hypothetical purchase price allocation. A goodwill impairment will now be the amount by which a reporting unit’s carrying value exceeds its fair value, not to exceed the carrying amount of goodwill. Entities will continue to have the option to perform a qualitative assessment to determine if a quantitative impairment test is necessary. The standard should be applied prospectively and will become effective for the Company for their annual goodwill impairment test in fiscal years beginning after December 15, 2021. Early adoption is permitted for annual goodwill impairment tests performed on testing dates after January 1, 2017. The Company early adopted this standard in January 2017, and there was no material impact to its consolidated financial statements and related disclosures upon adoption of this guidance.
39
THE HACKETT GROUP, INC.
NOTES TO CONSOLIDATED FINANCIAL STATEMENTS
1. Basis of Presentation and General Information (continued)
In January 2017, the FASB issued guidance which clarifies the definition of a business with the objective of adding guidance to assist entities with evaluating whether transactions should be accounted for as acquisitions or disposals of assets or businesses which distinction determines whether goodwill is recorded or not. This amended guidance was effective for us on December 30, 2017, and the Company does not expect it to have a material impact on its consolidated operating results or financial condition.
In May 2017, the FASB issued guidance about which changes to the terms or conditions of a share-based payment award require an entity to apply modification accounting in Topic 718. The guidance will become effective for the Company in fiscal years beginning after December 15, 2017, with early adoption permitted. The standard should be applied prospectively to an award modified on or after the adoption date. The Company does not expect it to have a material impact on its consolidated operating results or financial condition.
Reclassifications
Certain prior period amounts in the consolidated financial statements, and notes thereto, have been reclassified to conform to current period presentation.
2. Fair Value Measurement
The Company records its assets and liabilities in accordance with FASB ASC Topic 820, Fair Value Measurements and Disclosures (“ASC 820”). ASC 820 defines fair value as the exchange price that would be received for an asset or paid to transfer a liability (exit price) in the principal or most advantageous market for the asset or liability in an orderly transaction between market participants on the measurement date. ASC 820 also establishes a fair value hierarchy which requires an entity to maximize the use of observable inputs and minimize the use of unobservable inputs when measuring fair value. ASC 820 describes the following three levels of inputs that may be used to measure fair value:
Level 1: Quoted market prices in active markets for identical assets or liabilities
Level 2: Observable market-based inputs or unobservable inputs that are corroborated by market data
Level 3: Unobservable inputs that are not corroborated by market data
3. Accounts Receivable and Unbilled Revenue, Net
Accounts receivable and unbilled revenue, net, consists of the following (in thousands):
|
|
|
December 29, |
|
|
December 30, |
|
||
|
|
|
2017 |
|
|
2016 |
|
||
|
Accounts receivable |
|
$ |
44,972 |
|
|
$ |
39,335 |
|
|
Unbilled revenue |
|
|
12,891 |
|
|
|
10,638 |
|
|
Allowance for doubtful accounts |
|
|
(2,601 |
) |
|
|
(2,574 |
) |
|
|
|
$ |
55,262 |
|
|
$ |
47,399 |
|
Accounts receivable as of December 29, 2017 and December 30, 2016, is net of uncollected advanced billings. Unbilled revenue as of December 29, 2017 and December 30, 2016 includes recognized recoverable costs and accrued profits on contracts for which billings had not been presented to clients.
40
THE HACKETT GROUP, INC.
NOTES TO CONSOLIDATED FINANCIAL STATEMENTS
4. Property and Equipment, net
|
|
|
December 29, |
|
|
December 30, |
|
||
|
|
|
2017 |
|
|
2016 |
|
||
|
Equipment |
|
$ |
7,194 |
|
|
$ |
6,580 |
|
|
Software |
|
|
33,135 |
|
|
|
26,983 |
|
|
Leasehold improvements |
|
|
410 |
|
|
|
373 |
|
|
Furniture and fixtures |
|
|
517 |
|
|
|
493 |
|
|
|
|
|
41,256 |
|
|
|
34,429 |
|
|
Less accumulated depreciation |
|
|
(22,405 |
) |
|
|
(19,655 |
) |
|
|
|
$ |
18,851 |
|
|
$ |
14,774 |
|
Depreciation expense for the years ended December 29, 2017, December 30, 2016, and January 1, 2016, was $2.4 million, $2.5 million, and $2.6 million, respectively, and is included in selling, general and administrative costs in the accompanying consolidated statements of operations. The increase in accumulated depreciation in 2017, as compared to 2016, relates to depreciation expense and the impact of foreign currency translation adjustments.
5. Accrued Expenses and Other Liabilities
Accrued expenses and other liabilities consist of the following (in thousands):
|
|
|
December 29, |
|
|
December 30, |
|
||
|
|
|
2017 |
|
|
2016 |
|
||
|
Accrued compensation and benefits |
|
$ |
5,289 |
|
|
$ |
4,412 |
|
|
Accrued bonuses |
|
|
4,119 |
|
|
|
13,038 |
|
|
Accrued dividend payable |
|
|
4,656 |
|
|
|
4,023 |
|
|
Acquisition earnout accruals |
|
|
6,207 |
|
|
|
— |
|
|
Deferred revenue |
|
|
9,271 |
|
|
|
10,975 |
|
|
Accrued sales, use, franchise and VAT tax |
|
|
3,670 |
|
|
|
3,791 |
|
|
Non-cash stock compensation accrual |
|
|
1,890 |
|
|
|
4,225 |
|
|
Income tax payable |
|
|
5,649 |
|
|
|
4,437 |
|
|
Other accrued expenses |
|
|
2,263 |
|
|
|
1,824 |
|
|
Total accrued expenses and other liabilities |
|
$ |
43,014 |
|
|
$ |
46,725 |
|
6. Restructuring Costs
During 2017, the Company recorded restructuring costs of $1.3 million, which was primarily related to the transition of resources driven by our migration from on-premise software to cloud-based implementations, as well as the Jibe acquisition, and the rationalization of global resources as a result of the emergence of RPA (“Robotic Process Automation”) related engagements from the Aecus acquisition. As of December 29, 2017, the Company did not have any remaining commitments related to restructuring.
The following table sets forth the activity in the restructuring expense accruals (in thousands):
|
|
|
Severance and Other |
|
|
|
|
|
Employee Costs |
|
|
|
|
|
|
|
|
|
Accrual balance at December 30, 2016 |
$ |
|
— |
|
|
Accrual |
|
|
1,293 |
|
|
Expenditures |
|
|
1,293 |
|
|
Accrual balance at December 29, 2017 |
$ |
|
— |
|
41
THE HACKETT GROUP, INC.
NOTES TO CONSOLIDATED FINANCIAL STATEMENTS
The Company has operating lease agreements for its premises that expire on various dates through July 2024. Rent expense for the years ended December 29, 2017, December 30, 2016, and January 1, 2016 was $2.4 million, $2.3 million and $2.2 million, respectively.
Future minimum lease commitments under non-cancelable operating leases as of December 29, 2017, are as follows (in thousands):
|
|
|
|
|
Rental |
|
|
|
|
|
|
|
Payments |
|
|
|
2018 |
|
|
|
$ |
2,161 |
|
|
2019 |
|
|
|
|
1,873 |
|
|
2020 |
|
|
|
|
1,311 |
|
|
2021 |
|
|
|
|
945 |
|
|
2022 |
|
|
|
|
797 |
|
|
Thereafter |
|
|
|
|
129 |
|
|
Total |
|
|
|
$ |
7,216 |
|
8. Credit Facility
The Company entered into a credit agreement with Bank of America, N.A. ("Bank of America"), pursuant to which Bank of America agreed to lend the Company up to $20.0 million pursuant to a revolving line of credit (the “Revolver”) and up to $47.0 million pursuant to a term loan (“the Term Loan”, and together with the Revolver, the “Credit Facility”). As of the end of January 1, 2016, the Company had fully utilized and paid off its Term Loan. As of the end of 2017 and 2016, the Company had a $19.0 million and a $7.0 million outstanding balance on the Revolver, respectively.
On May 9, 2016, the Company amended and restated the credit agreement with Bank of America to:
|
|
• |
Provide for up to an additional $25.0 million of borrowing under the Revolver for a total borrowing capacity of $45.0 million; and to |
|
|
• |
Extend the maturity date on the Revolver to May 9, 2021, five years from the date of this amendment of the Credit Agreement. |
The obligations of Hackett under the Credit Facility are guaranteed by active existing and future material U.S. subsidiaries of Hackett (the “U.S. Subsidiaries”), and are secured by substantially all of the existing and future property and assets of Hackett and the U.S. Subsidiaries, a 100% pledge of the capital stock of the U.S. Subsidiaries, and a 66% pledge of the capital stock of Hackett’s direct foreign subsidiaries (subject to certain exceptions).
The interest rates per annum applicable to loans under the Credit Facility will be, at the Company’s option, equal to either a base rate or a LIBOR base rate, plus an applicable margin percentage. The applicable margin percentage is based on the consolidated leverage ratio, as defined in the Credit Agreement. As of December 29, 2017, the applicable margin percentage was 1.50% per annum based on the consolidated leverage ratio, in the case of LIBOR rate advances, and 0.75% per annum, in the case of base rate advances. The interest rate as of December 29, 2017 was 2.96%.
The Company is subject to certain covenants, including total consolidated leverage, fixed cost coverage, adjusted fixed cost coverage and liquidity requirements, each as set forth in the Credit Agreement, subject to certain exceptions. As of December 29, 2017, the Company was in compliance with all covenants.
In connection with the Credit Facility, the Company incurred $0.2 million of debt issuance costs. These costs are amortized over the remaining life of the Credit Facility and are included in Other Assets in the accompanying consolidated balance sheet.
42
THE HACKETT GROUP, INC.
NOTES TO CONSOLIDATED FINANCIAL STATEMENTS
8. Credit Facility (continued)
As of December 30, 2016, the Company had a debt balance of $7.0 million. During 2017, the Company borrowed $26.0 million on the Revolver and through the year ended December 29, 2017, the Company has paid down $14.0 million, leaving $19.0 million outstanding under the Revolver, excluding the debt issuance costs of $0.3 million as of December 29, 2017.
|
|
|
|
|
Principal |
|
|
|
|
|
|
|
Amortization |
|
|
|
|
|
|
|
Payments |
|
|
|
2017 |
|
|
|
$ |
— |
|
|
2018 |
|
|
|
|
— |
|
|
2019 |
|
|
|
|
— |
|
|
2020 |
|
|
|
|
— |
|
|
2021 |
|
|
|
|
19,000 |
|
|
Thereafter |
|
|
|
|
— |
|
|
Total |
|
|
|
$ |
19,000 |
|
The Company files federal income tax returns, as well as multiple state, local and foreign jurisdiction tax returns. A number of years may elapse before an uncertain tax position is audited and finally resolved. While it is often difficult to predict the final outcome or the timing of resolution on any particular uncertain tax position, the Company believes that its reserves for income taxes reflect the most probable outcome. The Company adjusts these reserves, as well as the related interest, in light of changing facts and circumstances. The resolution of a matter would be recognized as an adjustment to the provision for income taxes and the effective tax rate in the period of resolution. The Company is no longer subject to examinations of its federal income tax returns by the Internal Revenue Service for years through 2013 and all significant state, local and foreign matters have been concluded for years through 2013. In the first quarter of 2017, the IRS commenced an examination of the Company’s U.S. income tax return for fiscal year 2014, which is still in progress.
The components of income before income taxes are as follows (in thousands):
|
|
|
Year Ended |
|
|||||||||
|
|
|
December 29, |
|
|
December 30, |
|
|
January 1, |
|
|||
|
|
|
2017 |
|
|
2016 |
|
|
2016 |
|
|||
|
Domestic |
|
$ |
22,038 |
|
|
$ |
28,611 |
|
|
$ |
16,249 |
|
|
Foreign |
|
|
8,200 |
|
|
|
5,555 |
|
|
|
5,267 |
|
|
Income before income taxes |
|
$ |
30,238 |
|
|
$ |
34,166 |
|
|
$ |
21,516 |
|
43
THE HACKETT GROUP, INC.
NOTES TO CONSOLIDATED FINANCIAL STATEMENTS
The components of income tax expense (benefit) are as follows (in thousands):
|
|
|
Year Ended |
|
|||||||||
|
|
|
December 29, |
|
|
December 30, |
|
|
January 1, |
|
|||
|
|
|
2017 |
|
|
2016 |
|
|
2016 |
|
|||
|
Current tax expense |
|
|
|
|
|
|
|
|
|
|
|
|
|
Federal |
|
$ |
3,231 |
|
|
$ |
8,969 |
|
|
$ |
2,042 |
|
|
State |
|
|
445 |
|
|
|
1,065 |
|
|
|
463 |
|
|
Foreign |
|
|
989 |
|
|
|
252 |
|
|
|
224 |
|
|
|
|
|
4,665 |
|
|
|
10,286 |
|
|
|
2,729 |
|
|
Deferred tax expense (benefit) |
|
|
|
|
|
|
|
|
|
|
|
|
|
Federal |
|
|
(2,915 |
) |
|
|
789 |
|
|
|
3,566 |
|
|
State |
|
|
209 |
|
|
|
667 |
|
|
|
529 |
|
|
Foreign |
|
|
925 |
|
|
|
883 |
|
|
|
883 |
|
|
|
|
|
(1,781 |
) |
|
|
2,339 |
|
|
|
4,978 |
|
|
Income tax expense |
|
$ |
2,884 |
|
|
$ |
12,625 |
|
|
$ |
7,707 |
|
A reconciliation of the federal statutory tax rate with the effective tax rate is as follows:
|
|
|
Year Ended |
|||||||||||||
|
|
|
December 29, |
|
December 30, |
|
January 1, |
|||||||||
|
|
|
2017 |
|
2016 |
|
2016 |
|||||||||
|
U.S statutory income tax expense rate |
|
|
35.0 |
|
% |
|
|
35.0 |
|
% |
|
|
35.0 |
|
% |
|
State income taxes, net of federal income tax expense |
|
|
1.4 |
|
|
|
|
3.3 |
|
|
|
|
3.0 |
|
|
|
Valuation reduction |
|
|
(0.2 |
) |
|
|
|
(0.7 |
) |
|
|
|
(0.8 |
) |
|
|
Tax reform impact on deferred taxes |
|
|
(13.4 |
) |
|
|
|
— |
|
|
|
|
— |
|
|
|
Meals and entertainment |
|
|
0.9 |
|
|
|
|
0.8 |
|
|
|
|
1.2 |
|
|
|
Foreign rate differential |
|
|
(3.7 |
) |
|
|
|
(1.8 |
) |
|
|
|
(3.1 |
) |
|
|
Shared based compensation |
|
|
(11.4 |
) |
|
|
|
— |
|
|
|
|
— |
|
|
|
Foreign exchange loss |
|
|
0.3 |
|
|
|
|
0.1 |
|
|
|
|
(0.2 |
) |
|
|
Other, net |
|
|
0.6 |
|
|
|
|
0.2 |
|
|
|
|
0.7 |
|
|
|
Effective tax rate |
|
|
9.5 |
|
% |
|
|
36.9 |
|
% |
|
|
35.8 |
|
% |
The components of the net deferred income tax asset (liability) are as follows (in thousands):
|
|
|
Year Ended |
|
|||||
|
|
|
December 29, |
|
|
December 30, |
|
||
|
|
|
2017 |
|
|
2016 |
|
||
|
Deferred income tax assets: |
|
|
|
|
|
|
|
|
|
Allowance for doubtful accounts |
|
$ |
582 |
|
|
$ |
978 |
|
|
Net operating loss and tax credits carryforward |
|
|
2,311 |
|
|
|
2,182 |
|
|
Accrued expenses and other liabilities |
|
|
4,257 |
|
|
|
4,089 |
|
|
|
|
|
7,150 |
|
|
|
7,249 |
|
|
Valuation allowance |
|
|
(984 |
) |
|
|
(1,042 |
) |
|
|
|
|
6,166 |
|
|
|
6,207 |
|
|
Deferred income tax liabilities: |
|
|
|
|
|
|
|
|
|
Depreciation |
|
|
(4,787 |
) |
|
|
(5,484 |
) |
|
Tax over book amortization on goodwill and intangibles |
|
|
(7,437 |
) |
|
|
(10,789 |
) |
|
Other items |
|
|
(182 |
) |
|
|
(150 |
) |
|
|
|
|
(12,406 |
) |
|
|
(16,423 |
) |
|
Net deferred income tax liability |
|
$ |
(6,240 |
) |
|
$ |
(10,216 |
) |
44
THE HACKETT GROUP, INC.
NOTES TO CONSOLIDATED FINANCIAL STATEMENTS
The 2017 Tax Cuts and Jobs Act (the “2017 Tax Act”) was signed into law on December 22, 2017. The 2017 Tax Act made a significant number of changes to existing U.S. Internal Revenue Code, including a permanent reduction of the U.S. corporate income tax rate from 35% to 21% for tax years beginning after December 31, 2017, and it also provides for a one-time transition tax on certain unremitted foreign earnings (the “Transition Tax”). As a result, the Company recorded a provisional income tax benefit of $4.0 million related to the re-measurement of deferred tax assets and liabilities resulting from the reduction of the federal corporate tax rate. The Company has performed a preliminary analysis of its post-1986 earnings and profits of its foreign subsidiaries and has estimated an overall accumulated net deficit, therefore no amounts have been recorded relative to the Transition Tax. In accordance with Staff Accounting Bulletin (“SAB”) No. 118, the Company will finalize the deferred tax and Transition Tax calculations during the allowed measurement period in 2018.
The SEC staff issued Staff Accounting Bulletin ("SAB") No. 118 in December. The SAB provides guidance on accounting for the tax effects of the 2017 Tax Act where uncertainty exists, it provides a measurement period that should not extend beyond one year from the 2017 Tax Act enactment date for companies to complete the related accounting under U.S. GAAP. In accordance with this guidance, the company has recorded provisional amounts for those specific income tax effects of the 2017 Tax Act for which a reasonable estimate could be determined.
As of December 29, 2017, the Company had $1.9 million of U.S. state net operating loss carryforwards. Additionally, at December 29, 2017, the Company had $3.7 million of foreign net operating loss carryforwards, of which $0.5 million related to operations in France and $0.8 million related to operations in Australia. A significant amount of the foreign net operating losses may be carried forward indefinitely.
The liability method of accounting for deferred income taxes requires a valuation allowance against deferred tax assets if, based on the weight of available evidence, it is more likely than not that some or all of the deferred tax assets will not be realized. In determining the need for valuation allowances the Company considers evidence such as history of losses and general economic conditions. At December 29, 2017 and December 30, 2016, the Company had a valuation allowance of $1.0 million for both periods, to reduce deferred income tax assets primarily related to foreign and state net operating loss and tax credit carryforwards.
The undistributed earnings in foreign subsidiaries at December 31, 2017 was approximately $4.9 million. The company has historically reinvested its foreign earnings abroad indefinitely, and as a result no U.S. federal or state deferred income taxes have been provided on these earnings.
The 2017 Tax Act implements a territorial system, whereby certain foreign subsidiary earnings can be repatriated to the U.S with no federal tax. As a result, the company is still evaluating the impact of the 2017 Tax Act on its assertion to indefinitely reinvest the earnings from certain of its foreign jurisdictions and therefore continues to assert that such earnings will be indefinitely reinvested.
Penalties and tax-related interest expense are reported as a component of income tax expense. For the years ended December 29, 2017 and December 30, 2016, the total amount of accrued income tax-related interest and penalties was $256 thousand and $ 228 thousand, respectively.
The Company prescribes a more-likely-than-not threshold for financial statement recognition and measurement of a tax position taken or expected to be taken in a tax return. This interpretation also provides guidance on de-recognition of income tax assets and liabilities, classification of current and deferred income tax assets and liabilities, accounting for interest and penalties associated with tax positions, accounting for income taxes in interim periods and income tax disclosures.
The following table sets forth the detail and activity of the ASC 740-10 liability during the years ended December 29, 2017 and December 30, 2016 (in thousands):
|
|
|
Year Ended |
|
|||||
|
|
|
December 29, |
|
|
December 30, |
|
||
|
|
|
2017 |
|
|
2016 |
|
||
|
Beginning balance |
|
$ |
738 |
|
|
$ |
712 |
|
|
Additions based on tax positions |
|
|
28 |
|
|
|
26 |
|
|
Reduction for prior year tax deductions |
|
|
— |
|
|
|
— |
|
|
Ending balance |
|
$ |
766 |
|
|
$ |
738 |
|
45
THE HACKETT GROUP, INC.
NOTES TO CONSOLIDATED FINANCIAL STATEMENTS
As of December 29, 2017 and December 30, 2016, the ASC 740-10, “Accounting for Uncertainty in Income Taxes”, liability of $0.8 million and $0.7 million, respectively, was classified as a current liability and included in accrued expenses and other liabilities in the accompanying consolidated balance sheets.
The Company does not believe there will be any material changes in its unrecognized tax positions over the next twelve months. The reversal of ASC 740-10 tax liabilities as of December 29, 2017 and December 30, 2016 would have a favorable impact on the effective tax rate in future period.
Stock Plans
Total share based compensation included in net income for the years ended December 29, 2017, December 30, 2016, and January 1, 2016 is as follows:
|
|
|
Year Ended |
|
|||||||||
|
|
|
December 29, |
|
|
December 30, |
|
|
January 1, |
|
|||
|
|
|
2017 |
|
|
2016 |
|
|
2016 |
|
|||
|
Restricted stock units |
|
$ |
7,801 |
|
|
$ |
7,550 |
|
|
$ |
6,776 |
|
|
Stock options and stock appreciation rights |
|
|
— |
|
|
|
— |
|
|
|
2,658 |
|
|
Common stock subject to vesting requirements |
|
|
2,515 |
|
|
|
1,215 |
|
|
|
927 |
|
|
|
|
$ |
10,316 |
|
|
$ |
8,765 |
|
|
$ |
10,361 |
|
The number of shares available for future issuance under the Company's stock plans as of December 29, 2017 were 2,229,558. The Company issues new shares as they are required to be delivered under the plan.
Stock Options and SARs
The Company has granted stock options to employees and directors of the Company at exercise prices equal to the market value of the stock at the date of grant. The options generally vest ratably over four years, based on continued employment, with a maximum term of ten years. Stock option activity under the Company’s stock option plans for the year ended December 29, 2017 is summarized as follows:
|
|
|
Option Shares |
|
|
Weighted Average Exercise Price |
|
|
Weighted Average Remaining Contractual Term |
|
|
Aggregate Intrinsic Value |
|
||||
|
Outstanding as of December 30, 2016 |
|
|
230,167 |
|
|
$ |
4.00 |
|
|
|
|
|
|
|
|
|
|
Exercised |
|
|
(50,000 |
) |
|
|
4.00 |
|
|
|
|
|
|
|
|
|
|
Forfeited or expired |
|
|
— |
|
|
|
— |
|
|
|
|
|
|
|
|
|
|
Outstanding as of December 29, 2017 |
|
|
180,167 |
|
|
$ |
4.00 |
|
|
|
4.22 |
|
|
$ |
2,109,818 |
|
|
Exercisable at December 29, 2017 |
|
|
180,167 |
|
|
$ |
4.00 |
|
|
|
4.22 |
|
|
$ |
2,109,818 |
|
A summary of the Company’s stock option activity for the years ended December 30, 2016 and January 1, 2016 was as follows:
|
|
|
December 30, 2016 |
|
|
January 1, 2016 |
|
||||||||||
|
|
|
Option Shares |
|
|
Weighted Average Exercise Price |
|
|
Option Shares |
|
|
Weighted Average Exercise Price |
|
||||
|
Outstanding at beginning of year |
|
|
230,167 |
|
|
$ |
4.00 |
|
|
|
297,667 |
|
|
|
4.00 |
|
|
Exercised |
|
|
— |
|
|
|
— |
|
|
|
(67,500 |
) |
|
|
3.99 |
|
|
Forfeited or expired |
|
|
— |
|
|
|
— |
|
|
|
— |
|
|
|
— |
|
|
Outstanding at end of year |
|
|
230,167 |
|
|
$ |
4.00 |
|
|
|
230,167 |
|
|
$ |
4.00 |
|
|
Exercisable at end of year |
|
|
230,167 |
|
|
$ |
4.00 |
|
|
|
90,167 |
|
|
$ |
4.00 |
|
46
THE HACKETT GROUP, INC.
NOTES TO CONSOLIDATED FINANCIAL STATEMENTS
10. Stock Based Compensation (continued)
The fair value of the SARs and stock options is estimated using the Black-Scholes option pricing valuation model. The determination of fair value is affected by the Company's stock price, expected stock price volatility, expected term of the award and the risk-free rate of interest.
Other information pertaining to stock option activity during the years ended December 29, 2017, December 30, 2016, and January 1, 2016 was as follows (in thousands):
|
|
|
Year Ended |
|
|||||||||
|
|
|
December 29, 2017 |
|
|
December 30, 2016 |
|
|
January 1, 2016 |
|
|||
|
Total intrinsic value of stock options exercised |
|
$ |
803 |
|
|
$ |
— |
|
|
$ |
660 |
|
On February 8, 2012, the Compensation Committee approved the fiscal year 2012 through 2015 equity compensation target for the Chief Executive Officer and Chief Operating Officer. Under this target, a single performance-based option grant was made to the Company’s Chief Executive Officer and the Chief Operating Officer of 1,912,500 options and 1,004,063 options, respectively, totaling 2,916,563 options, each with an exercise price of $4.00 and a fair value of $1.31. One -half of the options vest upon the achievement of at least 50% growth of pro forma earnings per share and the remaining half vest upon the achievement of at least 50% pro forma EBITDA growth. Pro forma EBITDA is defined as pro forma earnings (which specifically excludes non-cash stock compensation expense, intangible asset amortization expense, acquisition-related charges and gains, restructuring charges and assumes a normalized long-term cash rate of 30%) before interest, taxes and depreciation. Each metric can be achieved at any time during the six -year term of the award based on a trailing twelve-month period measured quarterly. The grants will expire if neither target is achieved during the six-year term. The base year for the performance calculation is fiscal 2011 for both pro forma earnings per share and pro forma EBITDA performance targets.
In March of 2013, the performance-based stock option grants were surrendered by the Company’s Chief Executive Officer and Chief Operating Officer and replaced with SARs, totaling 2,916,563, equal in number to the number of options granted to each of them in 2012. The terms and conditions and the specific performance targets that must be achieved in order for the SAR s to vest are the same as those of the surrendered options, with the exception that the SARs will be settled in cash, stock or any combination thereof, at the Company’s discretion.
The SARs related to the pro forma EPS target were earned and vested in the first quarter of 2015 with the Audit Committee’s approval of the Company’s 2014 financial statements and the SARs related to the pro forma EBITDA target were earned and vested in the first quarter of 2016 with the Audit Committee’s approval of the Company’s 2015 financial statements. As of December 29, 2017, no SARs had been exercised.
SAR activity for the year ended December 29, 2017 was as follows:
|
|
|
Number of SARs |
|
|
Weighted Average Exercise Price |
|
|
Weighted Average Fair Value |
|
|||
|
Outstanding as of December 30, 2016 |
|
|
2,916,563 |
|
|
$ |
4.00 |
|
|
|
1.31 |
|
|
Expired |
|
|
— |
|
|
|
— |
|
|
|
— |
|
|
Outstanding as of December 29, 2017 |
|
|
2,916,563 |
|
|
$ |
4.00 |
|
|
$ |
1.31 |
|
|
Exercisable at December 29, 2017 |
|
|
2,916,563 |
|
|
$ |
4.00 |
|
|
$ |
1.31 |
|
The following assumptions were used to determine the fair value of the SARs granted to employees:
|
Expected volatility |
|
|
43 |
% |
|
Risk-free rate |
|
0.35% -1.00% |
|
|
|
Expected term (in years) |
|
2-6 |
|
|
47
THE HACKETT GROUP, INC.
NOTES TO CONSOLIDATED FINANCIAL STATEMENTS
10. Stock Based Compensation (continued)
As of December 29, 2017, 100% of total outstanding options and SARs were performance-based. The Company did not record any compensation expense in 2017 related to the options and SARs, but did record $2.7 million of compensation expense in 2015 related to these options and SARs. As of January 1, 2016, all stock compensation expense related to the outstanding options and SARs had been expensed.
Restricted Stock Units
Under the stock plans, participants may be granted restricted stock units, each of which represents a conditional right to receive a common share in the future. The restricted stock units granted under this plan generally vest over one of the following vesting schedules: (1) a four -year period, with 50% vesting on the second anniversary and 25% of the shares vesting on the third and fourth anniversaries of the grant date, (2) a four -year period, with 25% vesting on the first, second, third and fourth anniversary, or (3) a three -year period with 33% vesting on the first, second and third anniversary. Upon vesting, the restricted stock units will convert into an equivalent number of shares of common stock. The amount of expense relating to the restricted stock units is based on the closing market price of the Company’s common stock on the date of grant and is amortized on a straight-line basis over the applicable requisite service period. Restricted stock unit activity for the year ended December 29, 2017, was as follows:
|
|
|
Number of Restricted Stock Units |
|
|
Weighted Average Grant-Date Fair Value |
|
||
|
Nonvested balance as of December 30, 2016 |
|
|
1,779,480 |
|
|
$ |
9.02 |
|
|
Granted |
|
|
674,592 |
|
|
|
16.60 |
|
|
Vested |
|
|
(862,731 |
) |
|
|
7.77 |
|
|
Forfeited |
|
|
(71,703 |
) |
|
|
13.24 |
|
|
Nonvested balance as of December 29, 2017 |
|
|
1,519,638 |
|
|
$ |
12.96 |
|
The Company recorded restricted stock units based compensation expense of $7.8 million, $7.6 million and $6.8 million in 2017, 2016, and 2015, respectively, which is included in stock compensation expense, based on the vesting provisions of the restricted stock units and the fair market value of the stock on the grant date. As of December 29, 2017, there was $9.1 million of total restricted stock unit compensation expense related to the nonvested awards not yet recognized, which is expected to be recognized over a weighted average period of 1.9 years. The Company accounts for certain restricted stock units under liability accounting as a result of the fixed monetary amount and a variable number of shares that will be issued. See Note 5 for further details.
Common Stock Subject to Vesting Requirements
Shares of common stock subject to vesting requirements were issued to employees of acquired companies. These shares vest over a period of up to four years. Compensation was based on the market value of the Company’s common stock at the time of grant and is recognized on a straight-line basis. The activity for common stock subject to vesting requirement s for the year ended December 29, 2017 was as follows:
|
|
|
Number of Shares of Common Stock Subject to Vesting Requirements |
|
|
Weighted Average Grant-Date Fair Value |
|
||
|
Nonvested balance as of December 30, 2016 |
|
|
505,060 |
|
|
$ |
9.00 |
|
|
Granted |
|
|
182,279 |
|
|
|
19.82 |
|
|
Vested |
|
|
(248,587 |
) |
|
|
9.11 |
|
|
Forfeited |
|
|
(7,728 |
) |
|
|
8.99 |
|
|
Nonvested balance as of December 29, 2017 |
|
|
431,024 |
|
|
$ |
13.52 |
|
Common stock subject to vesting requirements of $3.6 million and $4.6 million was issued in 2017 and 2015, respectively, in relation to the equity portion of the Jibe acquisition closing consideration and the Technolab earn-out consideration, respectively. These shares are subject to a four year vesting period.
The Company recorded compensation expense of $2.5 million, $1.2 million and $0.9 million, during the years ended December 29, 2017, December 30, 2016, and January 1, 2016, respectively, related to common stock subject to vesting requirements.
48
THE HACKETT GROUP, INC.
NOTES TO CONSOLIDATED FINANCIAL STATEMENTS
10. Stock Based Compensation (continued)
As of December 29, 2017, there was $ 4.2 million of total stock based compensation expense related to common stock granted subject to vesting requirements not yet recognized, which is expected to be recognized over a weighted average period of 2.7 years.
11. Shareholders’ Equity
Employee Stock Purchase Plan
Effective July 1, 1998, the Company adopted an Employee Stock Purchase Plan to provide substantially all employees who have completed three months of service as of the beginning of an offering period an opportunity to purchase shares of its common stock through payroll deductions. Purchases on any one grant are limited to 10% of eligible compensation. Shares of the Company’s common stock may be purchased by employees at six -month intervals at 95% of the fair market value on the last trading day of each six-month period. The aggregate fair market value, determined as of the first trading date of the offering period, of shares purchased by an employee may not exceed $25,000 annually. In 2017, subject to shareholder approval, the Company’s Board of Directors agreed to extend the Employee Stock Purchase Plan to July 1, 2023 from July 1, 2018 and added an additional 250,000 shares of common stock which increased the total available shares of common stock to 279,606. As of 2017, a total of 211,845 shares of common stock were available for purchase under the plan. For plan years 2017, 2016 and 2015 67,761 shares, 67,111 shares and 48,356 shares, respectively, were issued for total proceeds of $1.0 million, $1.0 million, and $0.7 million, respectively.
Treasury Stock
On July 30, 2002, the Company announced that its Board of Directors approved the repurchase of up to $5.0 million of the Company’s common stock. Since the inception of the repurchase plan, the Board of Directors approved the repurchase of an additional $132.2 million of the Company’s common stock, thereby increasing the total program size to $137.2 million as of December 29, 2017. As of December 29, 2017, the Company had effected cumulative purchases under the plan of $134.1 million, leaving $3.1 million available for future purchases. There is no expiration of the authorization. Under the repurchase plan, the Company may buy back shares of its outstanding stock from time to time either on the open market or through privately negotiated transactions, subject to market conditions and trading restrictions, excluding the above mentioned tender offers. During 2017 and 2016, the Company repurchased 748 thousand and 2.1 million shares of its common stock, respectively, at an average price per share of $15.11 and $14.60, respectively, for a total cost of $11.3 million and $30.1 million, respectively. As of December 29, 2017 and December 30, 2016, the Company had repurchased 26.9 million and 26.2 million shares of its common stock, respectively, at an average price of $4.97 and $4.69 per share, respectively. Subsequent to year end, the Company repurchased 53 thousand shares of the Company’s stock from members of its Board of Directors and Executive team for a total cost of $1.0 million, or $18.33 per share. The proceeds from the sale of these shares will be used in part to cover estimated tax liabilities associated with previously vested restricted stock units. This leaves $2.2 million available under the repurchase plan for future purchases.
The Company holds repurchased shares of its common stock as treasury stock and accounts for treasury stock under the cost method.
On May 6, 2016, the Company’s Board of Directors approved the repurchase of 697 thousand shares of its common stock from the Company’s CEO, 732 thousand shares of its common stock from the Company’s COO, and 73 thousand shares of its common stock from the Company’s CFO for a total of approximately 1.5 million shares at a purchase price of $14.77 per share. The transaction was approved by the Audit Committee of the Board of Directors which is comprised solely of independent directors and was effected as part of the Company’s share repurchase program. Following the transaction, Mr. Fernandez, Mr. Dungan and Mr. Ramirez remained the beneficial owners of 11.8%, 4.9% and 0.9% shares, respectively, of the outstanding common stock. One of the primary reasons for this transaction was to lower the Company’s weighted average shares outstanding which had increased by 11% from the first quarter of 2015 as a result of the vesting of the SARs and appreciation in share price. The repurchase reduced weighted average shares outstanding by approximately 4% and is $0.03 to $0.04 accretive on an annualized basis. Based on the most recent SEC filings, including shares of Company common stock beneficially owned and shares that could be acquired upon the exercise of the SARs, Mr. Fernandez continues to be the largest beneficial shareholder of the Company.
Shares purchased under the repurchase plan do not include shares withheld to satisfy withholding tax obligations. These withheld shares are never issued and in lieu of issuing the shares, taxes were paid on the employee’s behalf. In 2017 and 2016, 268 thousand shares were withheld and not issued for a cost of $4.4 million and 294 thousand shares were withheld and not issued for a cost of $4.0 million, respectively, which are included under issuance of common stock in the accompanying consolidated statements of shareholders’ equity. Subsequent to December 29, 2017, 177 thousand shares have been withheld for a total cost of $ 3.1 million.
49
THE HACKETT GROUP, INC.
NOTES TO CONSOLIDATED FINANCIAL STATEMENTS
11. Shareholders’ Equity (continued)
Dividends
In December 2012, the Company announced an annual dividend program of $0.10 per share. In December 2012 and 2013, the Company paid annual dividends of $0.10 per share, or $3.1 million to shareholders of record as of close of business on December 20, 2012 and on December 10, 2013, respectively. In 2014, the Company increased the dividend to $0.12 per share, or $3.5 million, to shareholders of record as of close of business on December 10, 2014. In 2015, the Company increased the annual dividend to $0.20 per share to be paid on a semi-annual basis which resulted in aggregate dividends of $3.1 million and $3.2 million paid to shareholders of record on June 29, 2015 and December 28, 2015, respectively. In 2016, the Company increased the annual dividend to $0.26 per share to be paid on a semi-annual basis which resulted in aggregate dividends of $4.0 million and $4.0 million paid to shareholders of record on June 30, 2016 and December 22, 2016, respectively. In 2017, the Company increased the annual dividend to $0.30 per share to be paid on a semi-annual basis which resulted in aggregate dividends of $4.6 million and $4.7 million paid to shareholders of record on June 30, 2017 and December 22, 2017, respectively. These dividends were paid from U.S. domestic sources and are accounted for as an increase to retained deficit. The dividend declared in December 2017 was paid in January 2018. Subsequent to December 29, 2017, the Company increased its annual dividend to $0.34 per share to be paid on a semi-annual basis.
12. Benefit Plan
The Company maintains a 401(k) plan covering all eligible employees. Subject to certain dollar limits, eligible employees may contribute up to 15% of their pre-tax annual compensation to the plan. The Company may make discretionary contributions on an annual basis. During fiscal years 2017, 2016, and 2015, the Company made matching contributions of 25% of employee contributions up to 4% of their gross salaries. The Company’s matching contributions were $0.5 million, $0.6 million and $0.3 million for the fiscal years ended December 29, 2017, December 30, 2016 and January 1, 2016.
13. Transactions with Related Parties
During the year ended 2017, the Company repurchased 59 thousand shares of the Company’s stock from members of its Board of Directors for a total cost of $1.2 million or $20.13 per share. During the year ended December 30, 2016, the Company bought back 25 thousand shares of its common stock from members of its Board of Directors for $0.4 million or $15.68 per share. Subsequent to year end, the Company repurchased 53 thousand shares of the Company’s stock from members of its Board of Directors and Executive team for a total cost of $1.0 million, or $18.33 per share. The proceeds from the sale of these shares will be used primarily to cover estimated tax liabilities associated with previously vested restricted stock units.
On May 6, 2016, the Company’s Board of Directors approved the repurchase of 697 thousand shares of its common stock from the Company’s CEO, 732 thousand shares of its common stock from the Company’s COO, and 73 thousand shares of its common stock from the Company’s CFO for a total of approximately 1.5 million shares at a purchase price of $14.77 per share. The transaction was approved by the Audit Committee of the Board of Directors which is comprised solely of independent directors and was affected as part of the Company’s share repurchase program. See Note 10 for further details.
There were no related party transactions in 2015.
The Company is involved in legal proceedings, claims, and litigation arising in the ordinary course of business not specifically discussed herein. In the opinion of management, the final disposition of such matters will not have a material adverse effect on the Company’s consolidated financial position, cash flows or results of operations.
15. Acquisitions
Jibe Consulting
Effective May 1, 2017, the Company acquired certain assets and liabilities of Jibe Consulting, Inc. (“Jibe”), a U.S.- based Oracle E-Business Suite (“EBS”) and Oracle Cloud Business Application implementation firm. The acquisition of Jibe enhances the Company’s Cloud Application capabilities and strongly complements its market leading EPM transformation and technology implementation group.
50
THE HACKETT GROUP, INC.
NOTES TO CONSOLIDATED FINANCIAL STATEMENTS
The sellers’ purchase consideration was $5.4 million in cash, not subject to vesting, and $3.6 million in shares of the Company’s common stock, subject to vesting. The equity that was issued has a four-year vesting term and will be recorded as compensation expense over the respective vesting period. In addition, the sellers have the opportunity to earn an additional $6.6 million in cash and $4.4 million in Company common stock based on the achievement of performance targets over the 18 months period following closing for a total of $11.0 million in contingent consideration; a portion of which will be allocated to key employees in both cash and Company stock. The cash related to the contingent consideration which is to be paid to the sellers is not subject to service vesting and has been accounted for as part of the purchase consideration. The cash related to the contingent consideration, which is to be paid to the key employees, is subject to service vesting and is being accounted for as compensation expense. This contingent liability has been recorded in the consolidated balance sheet as current accrued expenses and other liabilities. The equity related to the contingent consideration will be subject to service vesting and will be recorded as compensation expense over the respective vesting period. As of December 29, 2017, the Company had recorded $1.5 million of acquisition-related compensation expense and non-cash stock compensation related to the equity portion of the closing consideration and the equity portion of the contingent consideration. The initial cash consideration was funded from borrowings under the Company’s Revolver.
The purchase price was allocated to tangible and intangible assets acquired and liabilities assumed based on their estimated fair values. The fair value of identifiable intangible assets acquired was based on estimates and assumptions made by management at the time of the acquisition. As additional information, as of the acquisition date, becomes available and as management completes its evaluation, the purchase price allocation may be revised during the remainder of the measurement period (which will not exceed 12 months from the acquisition date). Any such revisions or changes may be material as the fair values of the tangible and intangible assets acquired and liabilities assumed are finalized. The following table presents the preliminary purchase price allocation of the assets acquired and liabilities assumed, based on the fair values (in thousands):
|
|
|
Purchase Price |
|
|
|
|
|
Allocation |
|
|
|
Total consideration |
|
$ |
11,293 |
|
|
Accounts receivable |
|
|
1,932 |
|
|
Other current assets |
|
|
59 |
|
|
Total current assets acquired |
|
|
1,991 |
|
|
Intangible assets |
|
|
931 |
|
|
Goodwill |
|
|
9,538 |
|
|
Total assets acquired |
|
|
12,460 |
|
|
Accrued expenses and other liabilities |
|
|
1,167 |
|
|
Total liabilities acquired |
|
|
1,167 |
|
|
Purchase consideration on acquisition |
|
$ |
11,293 |
|
The recognized goodwill is primarily attributable to the benefits the Company expects to derive from enhanced market opportunities. The acquired intangible assets with definite lives are amortized over periods ranging from 2 to 5 years. The following table presents the intangible assets acquired from Jibe:
|
|
|
|
|
|
|
|
|
|
|
Category |
|
Amount (in thousands) |
|
|
Useful Life (in years) |
|
||
|
Customer Base |
|
$ |
140 |
|
|
|
5 |
|
|
Customer Backlog |
|
|
325 |
|
|
|
2 |
|
|
Non-Compete |
|
|
466 |
|
|
|
5 |
|
|
|
|
$ |
931 |
|
|
|
|
|
51
THE HACKETT GROUP, INC.
NOTES TO CONSOLIDATED FINANCIAL STATEMENTS
The acquisition was not material to the Company's results of operations, financial position, or cash flows and therefore, the pro forma impact of these acquisitions is not presented. Since the acquisition date through December 29, 2017, Jibe contributed $12.3 million of revenue before reimbursable expenses and contribution before depreciation, amortization, interest, corporate overhead allocation and taxes of $1.2 million. The acquisition related costs incurred 2017 totaled $0.2 million and were all classified in selling, general and administrative costs in the Company’s consolidated statements of operations. All goodwill is expected to be deductible for tax purposes.
Aecus Limited
Effective April 6, 2017, the Company acquired 100% of the equity of the U.K.-based operations of Aecus Limited (“Aecus”), a European Outsourcing Advisory and Robotics Process Automation (“RPA”) consulting firm. This acquisition strongly complements the global strategy and business transformation offerings of the Hackett Group.
The sellers’ purchase consideration was £3.2 million in cash. In addition, the sellers have the opportunity to earn an additional £2.4 million in contingent consideration in cash based on the achievement of performance targets achieved over the next 12 months and key personnel have the opportunity to earn £0.3 million in cash and £0.3 million in the Company’s common stock. The contingent consideration for the selling shareholders and key personnel is subject to performance and service periods and will be accounted for as compensation expense and in non-current accrued expenses and other liabilities. As of December 29, 2017, the Company had recorded a total of $1.3 million of acquisition-related compensation expense and acquisition non-cash stock compensation expense for the cash and equity portion of the contingent consideration. The closing purchase consideration was funded with the Company’s available funds.
The purchase price was allocated to tangible and intangible assets acquired and liabilities assumed based on their estimated fair values. The fair value of identifiable intangible assets acquired was based on estimates and assumptions made by management at the time of the acquisition. As additional information, as of the acquisition date, becomes available and as management completes its evaluation, the purchase price allocation may be revised during the remainder of the measurement period (which will not exceed 12 months from the acquisition date). Any such revisions or changes may be material as the fair values of the tangible and intangible assets acquired and liabilities assumed are finalized.
The following table presents the purchase price allocation of the assets acquired and liabilities assumed, based on the fair values (in thousands):
|
|
|
Purchase Price |
|
|
|
|
|
Allocation |
|
|
|
Total consideration |
|
£ |
3,173 |
|
|
Cash |
|
|
209 |
|
|
Accounts receivable |
|
|
898 |
|
|
Other current assets |
|
|
46 |
|
|
Total current assets acquired |
|
|
1,153 |
|
|
Intangible assets |
|
|
1,515 |
|
|
Goodwill |
|
|
1,306 |
|
|
Total assets acquired |
|
|
3,974 |
|
|
Accrued expenses and other liabilities |
|
|
801 |
|
|
Total liabilities acquired |
|
|
801 |
|
|
Purchase consideration on acquisition |
|
£ |
3,173 |
|
52
THE HACKETT GROUP, INC.
NOTES TO CONSOLIDATED FINANCIAL STATEMENTS
The recognized goodwill is primarily attributable to the benefits the Company expects to derive from enhanced market opportunities. The acquired intangible assets with definite lives are amortized over periods ranging from 2 to 5 years. The following table presents the preliminary intangible assets acquired from Aecus:
|
|
|
|
|
|
|
|
|
|
|
Category |
|
Amount (in thousands) |
|
|
Useful Life (in years) |
|
||
|
Customer Base |
|
£ |
455 |
|
|
|
5 |
|
|
Customer Backlog |
|
|
52 |
|
|
|
2 |
|
|
Non-Compete |
|
|
1,008 |
|
|
|
5 |
|
|
|
|
£ |
1,515 |
|
|
|
|
|
The acquisition was not material to the Company's results of operations, financial position, or cash flows and therefore, the pro forma impact of these acquisitions is not presented. From acquisition date through the month ended December 29, 2017, Aecus has contributed $3.9 million of revenue before reimbursable expenses and contribution before depreciation, amortization, interest, corporate overhead allocation and taxes of $0.5 million. The acquisition related costs incurred during 2017 totaled $0.1 million and were all classified in selling, general and administrative costs in the Company’s consolidated statements of operations. The goodwill and intangibles resulting from this transaction are not expected to be deductible under UK tax regulations.
Additional Transaction:
Chartered Institute of Management Accountants
In October 2017, Hackett-REL, Ltd., a subsidiary of the Company located in the United Kingdom, acquired The Chartered Institute of Management Accountants' share of the Certified GBS Professionals program. This acquisition allows those studying under the program and their employers to benefit further from the Company’s sector specific expertise and focus on the growing global business services market. Purchase consideration was $2.0 million in cash and was funded with the Company’s available funds. Also in connection with this transaction, the Alliance and Program Development Agreement between the Company, Hackett-REL, Ltd and The Chartered Institute of Management Accountants was terminated.
The purchase price was allocated to tangible and intangible assets acquired based on their estimated fair values. The intangible asset will amortize over a ten-year period.
16. Geographic and Service Group Information
Revenue, which is primarily based on the country of the Company’s contracting entity is attributed to geographic areas as follows (in thousands):
|
|
|
Year Ended |
|
|||||||||
|
|
|
December 29, |
|
|
December 30, |
|
|
January 1, |
|
|||
|
|
|
2017 |
|
|
2016 |
|
|
2016 |
|
|||
|
Revenue: |
|
|
|
|
|
|
|
|
|
|
|
|
|
North America |
|
$ |
230,904 |
|
|
$ |
246,249 |
|
|
$ |
218,719 |
|
|
International (primarily European countries) |
|
|
54,958 |
|
|
|
42,312 |
|
|
|
42,221 |
|
|
Total revenue |
|
$ |
285,862 |
|
|
$ |
288,561 |
|
|
$ |
260,940 |
|
Long-lived assets are attributed to geographic areas as follows (in thousands):
|
|
|
December 29, |
|
|
December 30, |
|
||
|
|
|
2017 |
|
|
2016 |
|
||
|
Long-lived assets: |
|
|
|
|
|
|
|
|
|
North America |
|
$ |
90,605 |
|
|
$ |
78,200 |
|
|
International (primarily European countries) |
|
|
19,341 |
|
|
|
12,286 |
|
|
Total long-lived assets |
|
$ |
109,946 |
|
|
$ |
90,486 |
|
53
THE HACKETT GROUP, INC.
NOTES TO CONSOLIDATED FINANCIAL STATEMENTS
16. Geographic and Service Group Information (continued)
As of December 29, 2017, December 30, 2016, and January 1, 2016, foreign assets included $ 15.1 million, $ 11.9 million and $14.1 million, respectively, of goodwill related to the REL, Archstone and Aecus acquisitions, in fiscal 2005, 2009 and 2017, respectively.
In the following table, The Hackett Group service group encompasses Benchmarking, Business Transformation and Executive Advisory groups, and includes EPM Technologies. The SAP/ ERP Solutions group encompasses SAP ERP (in thousands):
|
|
|
Year Ended |
|
|||||||||
|
|
|
December 29, |
|
|
December 30, |
|
|
January 1, |
|
|||
|
|
|
2017 |
|
|
2016 |
|
|
2016 |
|
|||
|
The Hackett Group |
|
$ |
242,269 |
|
|
$ |
246,210 |
|
|
$ |
221,341 |
|
|
SAP/ERP Solutions |
|
|
43,593 |
|
|
|
42,351 |
|
|
|
39,599 |
|
|
Total revenue |
|
$ |
285,862 |
|
|
$ |
288,561 |
|
|
$ |
260,940 |
|
17. Quarterly Financial Information (unaudited)
The following table presents unaudited supplemental quarterly financial information for the years ended December 29, 2017 and December 30, 2016 (in thousands, except per share data):
|
|
|
Quarter Ended |
|
|||||||||||||
|
|
|
March 31, 2017 |
|
|
June 30, 2017 |
|
|
September 29, 2017 |
|
|
December 29, 2017 |
|
||||
|
Total revenue |
|
$ |
65,069 |
|
|
$ |
67,726 |
|
|
$ |
65,947 |
|
|
$ |
64,510 |
|
|
Operating income |
|
$ |
7,964 |
|
|
$ |
6,464 |
|
|
$ |
7,874 |
|
|
$ |
8,520 |
|
|
Income from continuing operations |
|
$ |
7,874 |
|
|
$ |
6,337 |
|
|
$ |
7,690 |
|
|
$ |
8,337 |
|
|
Net income (1) |
|
$ |
7,874 |
|
|
$ |
4,750 |
|
|
$ |
5,289 |
|
|
$ |
9,441 |
|
|
Basic net income per common share (2) |
|
$ |
0.27 |
|
|
$ |
0.16 |
|
|
$ |
0.18 |
|
|
$ |
0.33 |
|
|
Diluted net income per common share (2) |
|
$ |
0.24 |
|
|
$ |
0.15 |
|
|
$ |
0.17 |
|
|
$ |
0.29 |
|
|
|
|
Quarter Ended |
|
|||||||||||||
|
|
|
April 1, 2016 |
|
|
July 1, 2016 |
|
|
September 30, 2016 |
|
|
December 30, 2016 |
|
||||
|
Total revenue |
|
$ |
61,973 |
|
|
$ |
68,178 |
|
|
$ |
66,810 |
|
|
$ |
62,946 |
|
|
Operating income |
|
$ |
7,240 |
|
|
$ |
8,638 |
|
|
$ |
9,007 |
|
|
$ |
9,668 |
|
|
Income from continuing operations |
|
$ |
7,199 |
|
|
$ |
8,528 |
|
|
$ |
8,870 |
|
|
$ |
9,569 |
|
|
Net income |
|
$ |
4,382 |
|
|
$ |
5,446 |
|
|
$ |
5,488 |
|
|
$ |
6,225 |
|
|
Basic net income per common share (2) |
|
$ |
0.15 |
|
|
$ |
0.19 |
|
|
$ |
0.19 |
|
|
$ |
0.22 |
|
|
Diluted net income per common share (2) |
|
$ |
0.13 |
|
|
$ |
0.17 |
|
|
$ |
0.17 |
|
|
$ |
0.19 |
|
|
(1) |
The first quarter of 2017 included a tax benefit for the change in accounting on the vesting of share-based awards. The fourth quarter of 2017 included a tax benefit for the revaluation of the deferred tax liabilities as a result of the recent enacted tax legislation. |
|
(2) |
Quarterly basic and diluted net income per common share were computed independently for each quarter and do not necessarily total to the year to date basic and diluted net income per common share. |
54
THE HACKETT GROUP, INC.
NOTES TO CONSOLIDATED FINANCIAL STATEMENTS
SCHEDULE II – VALUATION AND QUALIFYING ACCOUNTS AND RESERVES
YEARS ENDED December 29, 2017, December 30, 2016, and January 1, 2016
(in thousands)
|
|
|
Balance at |
|
|
Charge to |
|
|
|
|
|
|
|
|
|
|
|
||||
|
|
|
Beginning |
|
|
Revenue/ |
|
|
|
|
|
|
|
Balance at |
|
||||||
|
Allowance for Doubtful Accounts |
|
of Year |
|
|
Expense |
|
|
Write-offs |
|
|
End of Year |
|
||||||||
|
Year Ended December 29, 2017 |
|
$ |
|
2,574 |
|
|
|
|
158 |
|
|
|
|
185 |
|
|
$ |
|
2,601 |
|
|
Year Ended December 30, 2016 |
|
$ |
|
1,881 |
|
|
|
|
744 |
|
|
|
|
(51 |
) |
|
$ |
|
2,574 |
|
|
Year Ended January 1, 2016 |
|
$ |
|
1,330 |
|
|
|
|
694 |
|
|
|
|
(143 |
) |
|
$ |
|
1,881 |
|
55
ITEM 9. CHANGES IN AND DISAGREMENTS WITH ACCOUNTANTS ON ACCOUNTING AND FINANCIAL DISCLOSURE.
None.
ITEM 9A. CONTROLS AND PROCEDURES
The Company maintains disclosure controls and procedures (“DCP”) that are designed to ensure that information required to be disclosed by us in reports that we file or submit under the Securities Exchange Act of 1934, as amended (“the Exchange Act”), is recorded, processed, summarized, and reported within the time periods specified in the SEC rules and forms, and that such information is accumulated and communicated to the Company’s management, including its Chief Executive Officer (principal executive officer) and Chief Financial Officer (principal financial officer), as appropriate, to allow for timely decisions regarding required disclosure.
The Company, under the supervision and with the participation of the Company’s management, including the Chief Executive Officer and Chief Financial Officer, evaluated the effectiveness of the design and operation of the Company’s DCP as of the end of the period covered by this report. Based on this evaluation, the Chief Executive Officer and the Chief Financial Officer concluded that our disclosure controls and procedures were effective as of the end of the period covered by the Annual Report on Form 10-K.
Changes in internal control over financial reporting
There were no changes in our internal control over financial reporting identified in connection with the evaluation required by paragraph (d) of Exchange Act Rules 13a-15 or 15d-15 that occurred during the three months ended December 29, 2017 that have materially affected, or are reasonably likely to materially affect, our internal control over financial reporting.
56
Management’s Report on Internal Control Over Financial Reporting
Our management is responsible for establishing and maintaining adequate internal control over financial reporting, as such term is defined in Exchange Act Rule 13a-15(f). Under the supervision and with the participation of our management, including our Principal Executive Officer and Principal Financial Officer, we conducted an evaluation of the effectiveness of our internal control over financial reporting based on the framework in “Internal Control – Integrated Framework (2013)” issued by the Committee of Sponsoring Organizations of the Treadway Commission (COSO) as of and for the year ended December 29, 2017.
Based on our evaluation, utilizing the criteria set forth in “Internal Control – Integrated Framework issued by COSO in 2013,” our management concluded that our internal control over financial reporting was effective as of the end of the period covered by this Annual Report on Form 10-K.
The Company’s independent registered certified public accounting firm has audited our internal control over financial reporting as of December 29, 2017, and has expressed an unqualified opinion thereon.
57
Report of Independent Registered Public Accounting Firm
To the Shareholders and the Board of Directors of The Hackett Group, Inc.
Opinion on the Internal Control Over Financial Reporting
We have audited The Hackett Group, Inc.'s (the Company) internal control over financial reporting as of December 29, 2017, based on criteria established in Internal Control — Integrated Framework issued by the Committee of Sponsoring Organizations of the Treadway Commission in 2013. In our opinion, the Company maintained, in all material respects, effective internal control over financial reporting as of December 29, 2017, based on criteria established in Internal Control — Integrated Framework issued by the Committee of Sponsoring Organizations of the Treadway Commission in 2013.
We have also audited, in accordance with the standards of the Public Company Accounting Oversight Board (United States) (PCAOB), the consolidated balance sheets of The Hackett Group, Inc. as of December 29, 2017 and December 30, 2016, the related consolidated statements of operations, comprehensive income, shareholders' equity and cash flows for each of the three years in the period ended December 29, 2017, and the related notes and schedules, and our report dated March 9, 2018 expressed an unqualified opinion.
Basis for Opinion
The Company’s management is responsible for maintaining effective internal control over financial reporting and for its assessment of the effectiveness of internal control over financial reporting in the accompanying Management’s Report on Internal Control Over Financial Reporting. Our responsibility is to express an opinion on the Company’s internal control over financial reporting based on our audit. We are a public accounting firm registered with the PCAOB and are required to be independent with respect to the Company in accordance with U.S. federal securities laws and the applicable rules and regulations of the Securities and Exchange Commission and the PCAOB.
We conducted our audit in accordance with the standards of the PCAOB. Those standards require that we plan and perform the audit to obtain reasonable assurance about whether effective internal control over financial reporting was maintained in all material respects. Our audit included obtaining an understanding of internal control over financial reporting, assessing the risk that a material weakness exists, and testing and evaluating the design and operating effectiveness of internal control based on the assessed risk. Our audit also included performing such other procedures as we considered necessary in the circumstances. We believe that our audit provides a reasonable basis for our opinion.
Definition and Limitations of Internal Control Over Financial Reporting
A company's internal control over financial reporting is a process designed to provide reasonable assurance regarding the reliability of financial reporting and the preparation of financial statements for external purposes in accordance with generally accepted accounting principles. A company's internal control over financial reporting includes those policies and procedures that (1) pertain to the maintenance of records that, in reasonable detail, accurately and fairly reflect the transactions and dispositions of the assets of the company; (2) provide reasonable assurance that transactions are recorded as necessary to permit preparation of financial statements in accordance with generally accepted accounting principles, and that receipts and expenditures of the company are being made only in accordance with authorizations of management and directors of the company; and (3) provide reasonable assurance regarding prevention or timely detection of unauthorized acquisition, use or disposition of the company's assets that could have a material effect on the financial statements.
Because of its inherent limitations, internal control over financial reporting may not prevent or detect misstatements. Also, projections of any evaluation of effectiveness to future periods are subject to the risk that controls may become inadequate because of changes in conditions, or that the degree of compliance with the policies or procedures may deteriorate.
/s/ RSM US LLP
Fort Lauderdale, Florida
March 9, 2018
58
None.
ITEM 10. DIRECTORS, EXECUTIVE OFFICERS AND CORPORATE GOVERNANCE
Information responsive to this Item is incorporated herein by reference to the Company’s definitive proxy statement for the 2018 Annual Meeting of Shareholders.
ITEM 11. EXECUTIVE COMPENSATION
Information responsive to this Item is incorporated herein by reference to the Company’s definitive proxy statement for the 2018 Annual Meeting of Shareholders.
ITEM 12. SECURITY OWNERSHIP OF CERTAIN BENEFICIAL OWNERS AND MANAGEMENT AND RELATED STOCKHOLDER MATTERS
Information responsive to this Item is incorporated herein by reference to the Company’s definitive proxy statement for the 2018 Annual Meeting of Shareholders.
ITEM 13. CERTAIN RELATIONSHIPS AND RELATED TRANSACTIONS, AND DIRECTOR INDEPENDENCE
Information responsive to this Item is incorporated herein by reference to the Company’s definitive proxy statement for the 2018 Annual Meeting of Shareholders.
ITEM 14. PRINCIPAL ACCOUNTING FEES AND SERVICES
Information appearing under the caption “Fees Paid to Independent Accountants” in the proxy statement for the 2018 Annual Meeting of Shareholders is hereby incorporated by reference.
59
ITEM 15. EXHIBITS AND FINANCIAL STATEMENT SCHEDULES
(a) The following documents are filed as a part of this Form:
1. Financial Statements
The consolidated financial statements filed as part of this report are listed and indexed on page 27. Schedules other than those listed in the index have been omitted because they are not applicable or the required information has been included elsewhere in this report.
2. Financial Statement Schedules
Schedule II — Valuation and Qualifying Accounts and Reserves is included in this report. Schedules other than those listed in the index have been omitted because they are not applicable or the information required to be set forth therein is contained, or incorporated by reference, in the consolidated financial statements of The Hackett Group, Inc. or notes thereto.
3. Exhibits: See Index to Exhibits on page 61.
The Exhibits listed in the accompanying Index to Exhibits are filed or incorporated by reference as part of this report.
None.
60
|
|
Exhibit Description |
|
3.1 |
|
|
3.2 |
|
|
3.3 |
|
|
3.4 |
|
|
3.5 |
|
|
10.1 |
|
|
10.2 |
|
|
10.3 |
|
|
10.4 |
Form of Employment Agreement entered into between the Registrant and each of Messrs. Fernandez, Frank and Knotts (incorporated herein by reference to the Registrant’s Registration Statement on Form S-1 (File No. 333-48123)). (P) |
|
10.5 |
|
|
10.6 |
|
|
10.7 |
|
|
10.8 |
|
|
10.9 |
|
|
10.10 |
|
|
10.11 |
|
|
10.12 |
|
|
10.13 |
|
|
10.14 |
|
|
10.15 |
|
|
10.16 |
|
|
10.17 |
|
|
21.1* |
61
|
|
Exhibit Description |
|
31.1* |
Certification by CEO pursuant to Section 302 of the Sarbanes-Oxley Act of 2002. |
|
31.2* |
Certification by CFO pursuant to Section 302 of the Sarbanes-Oxley Act of 2002. |
|
32* |
|
|
101.INS** |
XBRL Instance Document |
|
101.SCH** |
XBRL Taxonomy Extension Schema |
|
101.CAL** |
XBRL Taxonomy Extension Calculation Linkbase |
|
101.DEF** |
XBRL Taxonomy Extension Definition Linkbase |
|
101.LAB** |
XBRL Taxonomy Extension Label Linkbase |
|
101.PRE** |
XBRL Taxonomy Extension Presentation Linkbase |
|
* |
Filed herewith |
|
** |
Pursuant to Rule 406T of Regulation S-T, these interactive data files are deemed not filed or part of a registration statement or prospectus for purposes of Sections 11 or 12 of the Securities Act of 1933 or Section 18 of the Securities Exchange Act of 1934 and otherwise are not subject to liability. |
|
(P) |
Paper exhibits. |
62
Pursuant to the requirements of Section 13 or 15(d) of the Securities Exchange Act of 1934, the Registrant has duly caused this report to be signed on its behalf by the undersigned, thereunto duly authorized, in the City of Miami, State of Florida, on March 9, 2018.
|
THE HACKETT GROUP, INC. |
||
|
|
|
|
|
By: |
|
/s/ Ted A. Fernandez |
|
|
|
Ted A. Fernandez |
|
|
|
Chief Executive Officer and Chairman of the Board |
Pursuant to the requirements of the Securities Act of 1934, this Form 10-K has been signed by the following persons on behalf of the Registrant in the capacities and on the date indicated.
|
Signatures |
|
Title |
|
Date |
|
|
|
|
|
|
|
/s/ Ted A. Fernandez |
|
Chief Executive Officer and Chairman |
|
March 9, 2018 |
|
Ted A. Fernandez |
|
|
||
|
|
|
|
|
|
|
/s/ Robert A. Ramirez |
|
Executive Vice President, Finance and Chief Financial Officer |
|
March 9, 2018 |
|
Robert A. Ramirez |
|
|
||
|
|
|
|
|
|
|
/s/ David N. Dungan |
|
Chief Operating Officer and Director |
|
March 9, 2018 |
|
David N. Dungan |
|
|
||
|
|
|
|
|
|
|
/s/ Richard Hamlin |
|
Director |
|
March 9, 2018 |
|
Richard Hamlin |
|
|
||
|
|
|
|
|
|
|
/s/ John R. Harris |
|
Director |
|
March 9, 2018 |
|
John R. Harris |
|
|
||
|
|
|
|
|
|
|
/s/ Robert A. Rivero |
|
Director |
|
March 9, 2018 |
|
Robert A. Rivero |
|
|
||
|
|
|
|
|
|
|
/s/ Alan T. G. Wix |
|
Director |
|
March 9, 2018 |
|
Alan T. G. Wix |
|
|
63