Attached files
| file | filename |
|---|---|
| EX-32 - EXHIBIT 32 - FNCB Bancorp, Inc. | ex_106676.htm |
| EX-31.2 - EXHIBIT 31.2 - FNCB Bancorp, Inc. | ex_106675.htm |
| EX-31.1 - EXHIBIT 31.1 - FNCB Bancorp, Inc. | ex_106674.htm |
| EX-23 - EXHIBIT 23 - FNCB Bancorp, Inc. | ex_106673.htm |
5
UNITED STATES
SECURITIES AND EXCHANGE COMMISSION
WASHINGTON, D.C. 20549
FORM 10-K
|
☒ |
ANNUAL REPORT PURSUANT TO SECTION 13 OR 15(d) OF THE SECURITIES EXCHANGE ACT OF 1934 |
For the fiscal year ended December 31, 2017
OR
|
☐ |
TRANSITION REPORT PURSUANT TO SECTION 13 OR 15(d) OF THE SECURITIES EXCHANGE ACT OF 1934 |
For the transition period from to
Commission File No. 000-53869
FNCB BANCORP, INC.
(Exact Name of Registrant as Specified in Its Charter)
|
Pennsylvania |
23-2900790 |
|
(State or Other Jurisdiction |
(I.R.S. Employer |
|
102 E. Drinker St., Dunmore, PA |
18512 |
|
(Address of Principal Executive Offices) |
(Zip Code) |
Registrant’s telephone number, including area code (570) 346-7667
Securities registered pursuant to Section 12(b) of the Act: NONE
Securities registered pursuant to Section 12(g) of the Act:
Common Stock, $1.25 par value
(Title of Class)
Indicate by check mark if the registrant is a well-known seasoned issuer, as defined in Rule 405 of the Securities Act. Yes ☐ No ☒
Indicate by check mark if the registrant is not required to file reports pursuant to Section 13 or section 15(d) of the Act. Yes ☐ No ☒
Indicate by check mark whether the registrant: (1) has filed all reports required to be filed by Section 13 or 15(d) of the Securities Exchange Act of 1934 during the preceding 12 months (or for such shorter period that the registrant was required to file such reports), and (2) has been subject to such filing requirements for the past 90 days.
Yes ☒ No ☐
Indicate by check mark whether the registrant has submitted electronically and posted on its corporate Web site, if any, every Interactive Data File required to be submitted and posted pursuant to Rule 405 of Regulation S-T (232.405 of this chapter) during the preceding 12 months (or for such shorter period that the registrant was required to submit and post such files). Yes ☒ No ☐
Indicate by check mark if disclosure of delinquent filers pursuant to Item 405 of Regulation S-K is not contained herein, and will not be contained, to the best of registrant’s knowledge, in definitive proxy or information statements incorporated by reference in Part III of this Form 10-K or any amendment to this Form 10-K. ☒
Indicate by check mark whether the registrant is a large accelerated filer, an accelerated filer, a non-accelerated filer, a smaller reporting company, or emerging growth company. See the definitions of “large accelerated filer,” “accelerated filer,” “smaller reporting company,” and “emerging growth company” in Rule 12b-2 of the Exchange Act. (Check one)
|
Large Accelerated Filer ☐ |
Accelerated Filer ☒ |
|
Non-Accelerated Filer ☐ |
Smaller reporting company ☐ |
|
(Do not check if a smaller reporting company) |
Emerging growth company ☐ |
If an emerging growth company, indicate by check mark if the registrant has elected not to use the extended transition period for complying with any new or revised financial accounting standards provided pursuant to Section 13(a) of the Exchange Act. ☐
Indicate by check mark whether the registrant is a shell company (as defined in Rule 12b-2 of the Exchange Act). Yes ☐ No ☒
The aggregate market value of the voting and non-voting common stock of the registrant, held by non-affiliates was $111,754,846 at June 30, 2017.
APPLICABLE ONLY TO CORPORATE REGISTRANTS
State the number of shares outstanding of each of the registrant’s classes of common stock, as of the latest practicable date: 16,766,600 shares of common stock as of March 9, 2018.
DOCUMENTS INCORPORATED BY REFERENCE
Certain information required by Items 10, 11, 12, 13 and 14 is incorporated by reference into Part III hereof from portions of the Proxy Statement for the registrant’s 2018 Annual Meeting of Shareholders.
Contents
|
PART I |
|
2 |
|
Item 1. |
Business |
2 |
|
Item 1A. |
Risk Factors |
11 |
|
Item 1B. |
Unresolved Staff Comments. |
18 |
|
Item 2. |
Properties. |
18 |
|
Item 3. |
Legal Proceedings. |
19 |
|
Item 4. |
Mine Safety Disclosures. |
20 |
|
PART II |
|
20 |
|
Item 5. |
Market for Registrant’s Common Equity, Related Shareholder Matters and Issuer Purchases of Equity Securities. |
20 |
|
Item 6. |
Selected Financial Data |
23 |
|
Item 7. |
Management’s Discussion and Analysis of Financial Condition and Results of Operations |
23 |
|
Item 7A. |
Quantitative and Qualitative Disclosures About Market Risk. |
52 |
|
Item 8. |
Financial Statements and Supplementary Data. |
54 |
|
Item 9. |
Changes in and Disagreements with Accountants on Accounting and Financial Disclosure |
109 |
|
Item 9A. |
Controls and Procedures |
109 |
|
Item 9B. |
Other Information |
110 |
|
PART III |
|
111 |
|
Item 10. |
Directors, Executive Officers and Corporate Governance. |
111 |
|
Item 11. |
Executive Compensation. |
111 |
|
Item 12. |
Security Ownership of Certain Beneficial Owners and Management and Related Stockholder Matters. |
111 |
|
Item 13. |
Certain Relationships and Related Transactions, and Director Independence. |
111 |
|
Item 14. |
Principal Accounting Fees and Services. |
111 |
|
PART IV |
|
112 |
|
Item 15. |
Exhibits and Financial Statement Schedules |
112 |
| Item 16. | Form 10-K Summary | 113 |
Cautionary Note Regarding Forward-Looking Statements.
This Annual Report on Form 10-K may contain forward-looking statements within the meaning of Section 27A of the Securities Act, as amended, and Section 21E of the Securities Exchange Act of 1934, as amended, which are subject to risks and uncertainties. These statements are based on assumptions and may describe future plans, strategies, financial conditions, results of operations and expectations of FNCB Bancorp, Inc. and its direct and indirect subsidiaries (“FNCB”). These forward-looking statements are generally identified by use of the words “may”, “should”, “will”, “could”, “believe,” “expect,” “intend,” “anticipate,” “estimate,” “project”, “plan”, “future” or similar expressions. All statements in this report, other than statements of historical facts, are forward-looking statements.
These forward-looking statements are not guarantees of future performance and are subject to risks and uncertainties, some of which are beyond FNCB Bancorp’s control and ability to predict, that could cause actual results to differ materially from those expressed in the forward-looking statements. Important factors that could cause actual results of FNCB Bancorp, Inc. to differ materially from those in the forward-looking statements include, but are not limited to:
|
• |
the effect of changes in market interest rates and the relative balances of interest-earning assets to interest-bearing liabilities on net interest margin and net interest income; |
|
• |
increases in non-performing assets, which may require FNCB to increase the allowance for loan and lease losses, charge off loans and incur elevated collection and carrying costs related to such non-performing assets; |
|
• |
the impact of adverse economic conditions, particularly in FNCB’s market area, on the performance of its loan portfolio and the demand for its products and services; |
|
• |
the effects of changes in interest rates on demand for FNCB’s products and services; |
|
• |
the effects of changes in interest rates or disruptions in liquidity markets on FNCB Bancorp Inc.’s sources of funding; |
|
• |
the impact of legislative and regulatory changes and the increasing amount of time and resources spent on compliance; |
|
• |
monetary and fiscal policies of the U.S. government, including policies of the U.S. Department of Treasury and the Federal Reserve System; |
|
• |
credit risk associated with lending activities and changes in the quality and composition of FNCB’s loan and investment portfolios; |
|
• |
demand for loans, deposits and other products; |
|
• |
the effect of competition on deposit and loan rates and growth and on the net interest margin; |
|
• |
changes in the values of real estate and other collateral securing the loan portfolio, particularly in FNCB Bancorp, Inc.’s market area; |
|
• |
the failure to identify and to address cyber-security risks; |
|
• |
the ability of FNCB Bancorp, Inc. to keep pace with technological changes; |
|
• |
the ability to attract and retain talented personnel; |
|
• |
capital and liquidity strategies, including FNCB Bancorp, Inc.’s ability to comply with applicable capital and liquidity requirements, and its ability to generate capital internally or raise capital on favorable terms; |
|
• |
FNCB Bancorp, Inc.’s reliance on its subsidiary, FNCB Bank, for substantially all of its revenues and its ability to pay dividends or other distributions; |
|
• |
the effects of changes in relevant accounting principles and guidelines on FNCB Bancorp, Inc.’s financial condition; and |
|
• |
the impact from the failure of third party service providers to perform their contractual obligations. |
These risks and uncertainties should be considered in evaluating forward-looking statements and undue reliance should not be placed on such statements. FNCB Bancorp, Inc. undertakes no obligation, other than as required by law, to update or revise any forward-looking statements, whether as a result of new information, future events or otherwise.
PART I
|
Item 1. |
Business |
Overview
The Company
FNCB Bancorp, Inc., formerly First National Community Bancorp, Inc., incorporated in 1997, is a Pennsylvania business corporation and a registered bank holding company headquartered in Dunmore, Pennsylvania. FNCB Bancorp, Inc. became an active bank holding company on July 1, 1998 when it acquired 100% ownership of the former First National Community Bank. In this report, the terms “FNCB,” “we,” “us,” and “our” refer to FNCB Bancorp, Inc. and its subsidiaries, unless the context requires otherwise. In certain circumstances, however, FNCB Bancorp, Inc. uses the term “FNCB” to refer to itself.
Effective June 30, 2016, following receipt of required regulatory approvals from the Pennsylvania Department of Banking and Securities, First National Community Bank completed a charter conversion from a national bank to a Pennsylvania state bank. Following the change in charter, First National Community Bank changed its legal name to FNCB Bank (the “Bank”). Subsequently, on October 4, 2016, the holding company filed an amendment to its articles of incorporation to change its name from First National Community Bancorp, Inc. to FNCB Bancorp, Inc. The name change became effective October 17, 2016.
FNCB’s primary activity consists of owning and operating the Bank, which provides substantially all of FNCB’s earnings as a result of its banking services.
FNCB had net income of $0.1 million, $6.3 million, and $35.8 million in 2017, 2016 and 2015, respectively. Total assets were $1.2 billion at December 31, 2017, $1.2 billion at December 31, 2016, and $1.1 billion at December 31, 2015.
The Bank
Established as a national banking association in 1910, as of December 31, 2017 the Bank operated 18 full-service branch offices within its primary market area, Northeastern Pennsylvania, and a Limited Purpose Banking Office (“LPO”) based in Allentown, Lehigh County, Pennsylvania.
Products and Services
Retail Banking
The Bank provides a wide variety of traditional banking products and services to individuals and businesses, including online, mobile and telephone banking, debit cards, check imaging and electronic statements. Deposit products include various checking, savings and certificate of deposit products, as well as a line of preferred products for higher-balance customers. The Bank is a member of the Promontory Interfinancial Network and participates in their Certificate of Deposit Account Registry (“CDARs”) and Insured Cash Sweep (“ICS”) programs, which provides customers with ability to secure Federal Deposit Insurance Corporation (“FDIC”) insurance on balances in excess of the standard limitations.
The Bank also offers customers the convenience of 24-hour banking, seven days a week, through FNCB Online Banking (“FNCB Online”) and FNCB Business Online Banking via a secure website, https://www.fncb.com. FNCB’s online product suite includes bill payment, internal and external funds transfer and POP Money (person to person transfers), and Purchase Rewards. Through FNCB Online, customers can directly access their accounts, open new accounts and apply for a mortgage or obtain a pre-qualification approval through the Bank’s mortgage center. Customers can also access FNCB Online through the Bank’s mobile application. Telephone banking (“Account Link”), a service that provides customers with the ability to access account information and perform related account transfers through the use of a touch tone telephone, is also available. In addition, customers can access money from their deposit accounts by using their debit card to make purchases or withdraw cash from any automated teller machines (“ATMs”) including ATMs located in each of the Bank’s branch offices as well as additional locations. FNCB’s mobile deposit, available to personal banking customers with access to FNCB Online and an eligible deposit account, allows customers to deposit checks, electronically from start to finish, from anywhere at any time.
FNCB Business Online Banking is a menu driven product that provides the Bank’s business customers direct access to their account information and the ability to perform internal and external account transfers, wire transfers and payments through ACH transactions, and process direct deposit payroll transactions for employees, 24 hours a day, 7 days a week, from their place of business.
The Bank also offers business customers remote deposit capture and merchant services, as well as business debit cards. Remote deposit capture provides business customers the ability to process daily check deposits to their accounts through an online image capture environment. The Bank offers business customers merchant payment processing solutions, including state-of-the-art credit card terminals, integrated payment systems and a dedicated account manager. Business customers can also access money from their deposit account by using their “business” debit card, providing a faster, more convenient way to make purchases, track business expenses and manage finances.
The Bank offers several overdraft protection products including Bounce Protection, Instant Money and transfer from another FNCB checking or savings account, which provide customers with an added level of protection against unanticipated overdrafts due to cash flow emergencies and account reconciliation errors.
Lending Activities
FNCB offers a variety of loans, including residential real estate loans, construction, land acquisition and development loans, commercial real estate loans, commercial and industrial loans, loans to state and political subdivisions, and consumer loans, generally to individuals and businesses in its primary market area. These lending activities are described in further detail below.
Residential Mortgage Loans and Home Equity Term Loans
FNCB offers a variety of fixed-rate one- to four-family residential loans and home equity term loans. FNCB’s suite of residential mortgage products include First Time Homebuyer mortgages, FHA and Home Possible® mortgages with low down payments to meet the home financing needs of customers. Home equity term loans have fixed interest rates with terms up to 15 years. FNCB also offers a proprietary “WOW” mortgage, a first-lien, fixed-rate mortgage product with maturity terms ranging from 7.5 to 14.5 years. At December 31, 2017, one- to four-family residential mortgage loans totaled $158.0 million, or 20.6%, of the total loan portfolio. Except for the WOW mortgage, one- to four-family mortgage loans are originated generally for sale in the secondary market. However, FNCB may hold in portfolio one- to four-family residential mortgage loans as deemed necessary according to current asset/liability management strategies. During the year ended December 31, 2017, the Bank sold $12.4 million of one- to four-family mortgages. FNCB retains servicing rights on these mortgages.
Construction, Land Acquisition and Development Loans
FNCB offers interim construction financing secured by residential property for the purpose of constructing one- to four-family homes. FNCB also offers interim construction financing for the purpose of constructing residential developments and various commercial properties including shopping centers, office complexes and single purpose owner-occupied structures and for land acquisition. At December 31, 2017, construction, land acquisition and development loans amounted to $21.0 million and represented 2.7% of the total loan portfolio.
Commercial Real Estate Loans
Commercial real estate loans represent the largest portion of FNCB’s total loan portfolio and loans in this portfolio generally have larger loan balances. These loans are secured by a broad range of real estate, including but not limited to, office complexes, shopping centers, hotels, warehouses, gas stations, convenience markets, residential care facilities, nursing care facilities, restaurants, multifamily housing, farms and land subdivisions. At December 31, 2017, FNCB’s commercial real estate loans totaled $261.8 million, or 34.1%, of the total loan portfolio.
Commercial and Industrial Loans
FNCB generally offers commercial loans to sole proprietors and businesses located in its primary market area. The commercial loan portfolio includes, but is not limited to, lines of credit, dealer floor plan lines, equipment loans, vehicle loans and term loans. These loans are primarily secured by vehicles, machinery and equipment, inventory, accounts receivable, marketable securities and deposit accounts. At December 31, 2017, FNCB’s commercial and industrial loans totaled $150.1 million, or 19.5%, of the total loan portfolio.
Consumer Loans
Consumer loans include both secured and unsecured installment loans, direct new and used automobile financing, home equity and personal lines of credit and overdraft protection loans. The Bank is also in the business of underwriting indirect auto loans which are originated through various auto dealers in its market area. Home equity lines of credit have adjustable interest rates based on the National prime interest rate and are offered up to a maximum combined loan-to-value ratio of 90%, based on the property’s appraised value. At December 31, 2017, FNCB’s consumer loans totaled $134.7 million, or 17.5%, of the total loan portfolio.
State and Political Subdivision Loans
FNCB originates state and political subdivision loans, including general obligation and tax anticipation notes, primarily to municipalities in the Bank’s market area. At December 31, 2017, FNCB’s state and political subdivision loans totaled $42.5 million, or 5.5%, of the total loan portfolio.
For more information regarding FNCB’s loan portfolio and lending policies, please refer to Note 2, “Summary of Significant Accounting Policies” to the consolidated financial statements included in Item 8 of this Annual Report on Form 10-K.
Wealth Management
FNCB offers customers wealth management services through a third-party provider. Customers are able to access alternative deposit products such as mutual funds, annuities, stocks, and bonds directly for purchase from an outside provider.
Deposit Activities
In general, deposits, borrowings and loan repayments are the major sources of funding for lending and other investment purposes. FNCB relies primarily on marketing, product innovation, technology and service to attract, grow and retain its deposits. Deposit account terms vary according to the minimum balance required, the time periods the funds must remain on deposit and the interest rate, among other factors. In determining the terms of deposit accounts, management considers the interest rates offered by its competitors, the interest rates available on FHLB advances and other wholesale funding, its liquidity needs and customer preferences. Management regularly reviews FNCB’s deposit mix and deposit pricing as part of its asset/liability management, taking into consideration rates offered by competitors in its market area and balance sheet interest-rate sensitivity.
Competition
The banking and financial services industries are highly competitive. FNCB faces direct competition in originating loans and in attracting deposits from a significant number of financial institutions operating in its market area, many with a statewide or regional presence, and in some cases, a national presence, as well as other financial and non-financial institutions outside of its market area through online loan and deposit product offerings. The competition comes principally from other banks, savings institutions, credit unions, mortgage banking companies, internet-based financial technology (“FinTech”) companies and, with respect to deposits, institutions offering investment alternatives, including money market funds and online deposit accounts. The increased competition has resulted from changes in the legal and regulatory guidelines, as well as from economic conditions. The cost of regulatory compliance remains high for community banks as compared to their larger competitors that are able to achieve economies of scale.
As a result of consolidation in the banking industry, some of the Bank’s competitors and their respective affiliates are larger and may enjoy advantages such as greater financial resources, a wider geographic presence, a wider array of services, or more favorable pricing alternatives and lower origination and operating costs. FNCB considers its major competitors to be local commercial banks as well as other commercial banks with branches in its market area. Competitors may offer deposits at higher rates and loans with lower fixed rates, more attractive terms and less stringent credit structures than FNCB has been able to offer. The growth and profitability of FNCB depends on its continued ability to successfully compete. Management believes interest rates on deposits, especially money market and time deposits, and interest rates and fees charged on loans within FNCB’s market area to be very competitive.
Supervision and Regulation
FNCB participates in a highly regulated industry and is subject to a variety of statutes, regulations and policies, as well as ongoing regulatory supervision and review. Federal statutes that apply to FNCB and the Bank include the Gramm Leach Bliley Act (“GLB Act”), the Bank Holding Company Act (“BHCA”), the Dodd-Frank Wall Street Reform and Consumer Protection Act (the “Dodd-Frank Act”), the Federal Reserve Act and the Federal Deposit Insurance Act. In general, these statutes, regulations promulgated in accordance with these statutes, and interpretations establish the eligible business activities of FNCB and the Bank, certain acquisition and merger restrictions, limitations on intercompany transactions, such as loans and dividends, and capital adequacy requirements, among other things. These laws, regulations and policies are subject to frequent change and FNCB takes measures to comply with applicable requirements.
FNCB
FNCB is a bank holding company within the meaning of the BHCA and is registered with, and subject to regulation and examination by, the Reserve Bank and the Board of Governors of the Federal Reserve System (“FRB”). FNCB is required to file annual and quarterly reports with the FRB and to provide the FRB with such additional information that they may require. BHCA and other federal laws subject bank holding companies to restrictions on the types of activities in which they may engage, and to a range of supervisory requirements and activities, including regulatory enforcement actions for violations of laws and regulations and unsafe and unsound banking practices.
The BHCA requires approval of the FRB for, among other things, the acquisition of direct or indirect ownership or control of more than five percent (5%) of the voting securities or substantially all the assets of any bank or bank holding company, or before the merger or consolidation with another bank holding company.
With certain limited exceptions, a bank holding company is prohibited from acquiring control of any voting shares of any company which is not a bank or bank holding company and from engaging directly or indirectly in any activity other than banking or managing or controlling banks or furnishing services to or performing services for its authorized subsidiaries. A bank holding company may, however, engage in, or acquire an interest in a company that engages in, activities that the FRB has determined by order or regulation to be so closely related to banking or managing or controlling banks as to be properly incident thereto. In making such a determination, the FRB is required to consider whether the performance of such activities can reasonably be expected to produce benefits to the public, such as convenience, increased competition or gains in efficiency, which outweigh possible adverse effects, such as undue concentration of resources, decreased or unfair competition, conflicts of interest or unsound banking practices. The FRB is also empowered to differentiate between activities commenced de novo and activities commenced by the acquisition, in whole or in part, of a going concern. Some of the activities that the FRB has determined by regulation to be closely related to banking include making or servicing loans, performing certain data processing services, acting as a fiduciary or investment or financial advisor, and making investments in corporations or projects designed primarily to promote community welfare.
Subsidiary banks of a bank holding company are subject to certain restrictions imposed by the Federal Reserve Act on any extensions of credit to the bank holding company or any of its subsidiaries, or investments in the stock or other securities thereof, and on the taking of such stock or securities as collateral for loans to any borrower. Further, a holding company and any subsidiary bank are prohibited from engaging in certain tie-in arrangements in connection with the extension of credit. A subsidiary bank may not extend credit, lease or sell property, or furnish any services, or fix or vary the consideration for any of the foregoing on the condition that: (i) the customer obtain or provide some additional credit, property or services from or to such bank other than a loan, discount, deposit or trust service; (ii) the customer obtain or provide some additional credit, property or service from or to the bank holding company or any other subsidiary of the bank holding company; or (iii) the customer not obtain some other credit, property or service from competitors, except for reasonable requirements to assure the soundness of credit extended.
The GLB Act allows a bank holding company or other company to certify status as a financial holding company, which allows such company to engage in activities that are financial in nature, that are incidental to such activities, or are complementary to such activities without further approval. FNCB is not a financial holding company. The GLB Act enumerates certain activities that are deemed financial in nature, such as underwriting insurance or acting as an insurance principal, agent or broker, underwriting, dealing in or making markets in securities, and engaging in merchant banking under certain restrictions. The GLB Act also authorizes the FRB to determine by regulation what other activities are financial in nature, or incidental or complementary thereto.
FNCB also is subject to the jurisdiction of the Securities and Exchange Commission (“SEC”) and is subject to the disclosure and regulatory requirements under the Securities Act of 1933, as amended, and the Securities Exchange Act of 1934, as amended.
On December 29, 2017, FNCB filed an application with The Nasdaq Stock Market LLC (“Nasdaq”) requesting listing on the Nasdaq Capital Market®. FNCB subsequently received approval from Nasdaq on February 26, 2018 to list its common shares for trading on The Nasdaq Capital Market®. FNCB’s shares of common stock began trading on the Nasdaq effective with the market opening on Monday, March 5, 2018. As such, FNCB is now subject to certain financial, liquidity and corporate governance requirements imposed by Nasdaq. Non-compliance of these requirements could subject FNCB to potential denial of listing, or additional conditions, as necessary, to protect investors and the public interest. Prior to March 5, 2018, FNCB’s shares of common stock traded on the OTCQX marketplace under the symbol “FNCB”.
The Bank
Effective June 30, 2016, upon its conversion to a state charter, the Bank is regulated by the Pennsylvania Department of Banking and Securities (“PADOBS”). The Bank’s deposit accounts are insured up to the maximum legal limit by the Deposit Insurance Fund of the FDIC and accordingly, the Bank is also regulated by the FDIC. The regulations of the PADOBS and the FDIC govern most aspects of the Bank’s business, including required reserves against deposits, loans, investments, mergers and acquisitions, borrowings, dividends and location and number of branch offices. The laws and regulations governing the Bank generally have been promulgated to protect depositors and the Deposit Insurance Fund, and not for protecting shareholders.
Branching and Interstate Banking. The federal banking agencies are authorized to approve interstate bank merger transactions without regard to whether such transactions are prohibited by the law of any state, unless the home state of one of the banks has opted out of the interstate bank merger provisions of the Riegle-Neal Interstate Banking and Branching Efficiency Act of 1994 (the “Riegle-Neal Act”) by adopting a law after the date of enactment of the Riegle-Neal Act and before June 1, 1997 that applies equally to all out-of-state banks and expressly prohibits merger transactions involving out-of-state banks. Interstate bank mergers are also subject to the nationwide and statewide insured deposit concentration limitations described in the Riegle-Neal Act.
The Dodd-Frank Act permits national and state banks to establish de novo branches in other states to the same extent as a bank chartered by that state would be so permitted. Previously, banks could only establish branches in other states if the host state expressly permitted out-of-state banks to establish branches in that state. Pennsylvania law had previously permitted banks chartered in Pennsylvania to establish branches in other states without limitation, thereby permitting national banks in Pennsylvania to establish branches anywhere in the state, but only permitted out of state banks to branch in Pennsylvania if the home state of the out-of-state bank permits Pennsylvania banks to establish de novo branches. The branching provisions of the Dodd-Frank Act could result in more banks from other states establishing de novo branches in the Bank’s market area.
USA Patriot Act and the Bank Secrecy Act (“BSA”). Under the BSA, a financial institution is required to have systems in place to detect certain transactions, based on the size and nature of the transaction. Financial institutions are generally required to report cash transactions involving more than $10,000 to the United States Treasury. In addition, financial institutions are required to file suspicious activity reports for transactions that involve more than $5,000 and that the financial institution knows, suspects or has reason to suspect, involves illegal funds, is designed to evade the requirements of the BSA or has no lawful purpose. Under the Uniting and Strengthening America by Providing Appropriate Tools Required to Intercept and Obstruct Terrorism Act, commonly referred to as the “USA Patriot Act” or the “Patriot Act,” financial institutions are subject to prohibitions against specified financial transactions and account relationships, as well as enhanced due diligence standards intended to detect, and prevent, the use of the United States financial system for money laundering and terrorist financing activities. The Patriot Act requires financial institutions, including banks, to establish anti-money laundering programs, including employee training and independent audit requirements, meet minimum specified standards, follow minimum standards for customer identification and maintenance of customer identification records, and regularly compare customer lists against lists of suspected terrorists, terrorist organizations and money launderers.
Capital Adequacy Requirements. Federal banking agencies have adopted risk based capital adequacy and leverage capital adequacy requirements pursuant to which they assess the adequacy of capital in examining and supervising banks and bank holding companies and in analyzing bank regulatory applications. Risk-based capital requirements determine the adequacy of capital based on the risk inherent in various classes of assets and off-balance sheet items.
Effective January 1, 2015, FNCB and the Bank are subject to the Basel III regulatory capital reforms and changes required by the Dodd-Frank Act (“Basel III”). Basel III calls for the following capital requirements:
|
● |
A minimum ratio of common equity tier I (“CET I”) capital to risk-weighted assets of 4.5%. |
|
|
● |
A minimum ratio of tier I capital to risk-weighted assets of 6%. |
|
● |
A minimum ratio of total capital to risk-weighted assets of 8%. |
|
|
● |
A minimum leverage ratio of 4%. |
Basel III also establishes a “countercyclical capital buffer,” that is designed to absorb losses during periods of economic stress. Generally, the capital conservation buffer of 2.50% of risk-weighted assets, when fully phased in, will be imposed when federal banking regulators determine that excess aggregate credit growth becomes associated with a buildup of systemic risk. For all banking institutions, the phase-in period for the capital conservation buffer requirement began on January 1, 2016 at 0.625% and will increase by that amount each year until it reaches 2.50% on January 1, 2019.
Banking institutions with a ratio of CET I to risk-weighted assets above the minimum but below the conservation buffer (or below the combined capital conservation buffer and countercyclical capital buffer, when the latter is applied) may face constraints on their ability to pay dividends, to effect equity repurchases and pay discretionary bonuses to executive officers, which constraints vary based on the amount of the shortfall.
Basel III also included, as part of the definition of CET I capital, a requirement that banking institutions include the amount of Accumulated Other Comprehensive Income (“AOCI”), which primarily consists of unrealized gains and losses, net of tax, on available-for-sale securities, that are not other than temporarily impaired (“OTTI”) in calculating regulatory capital, unless the institution makes a one-time opt-out election from this provision in connection with the filing of its first regulatory reports after applicability of the Basel III Rule to that institution. The Basel III Rule also imposes a 4.00% minimum Tier I leverage ratio. Upon implementation of Basel III on January 1, 2015, FNCB and the Bank elected to exclude AOCI in calculating regulatory capital with the filing of their respective first regulatory reports after applicability of Basel III.
Basel III provides for new deductions from and adjustments to CET I. These include, for example, the requirement that mortgage servicing rights, deferred tax assets dependent upon future taxable income and significant investments in non-consolidated financial entities be deducted from CET I to the extent that any one such category exceeds 10.00% of CET I or all such categories in the aggregate exceed 15.00% of CET I.
Basel III imposed changes to methodologies for determining risk weighted assets, including revisions to recognition of credit risk mitigation, such as a greater recognition of financial collateral and a wider range of eligible guarantors, the risk weighting of equity exposures and past due loans, and higher (greater than 100%) risk weighting for certain commercial real estate exposures that have higher credit risk profiles, including higher loan to value and equity components.
On November 21, 2017, the federal banking regulatory agencies jointly issued a final rule to extend the 2017 transition provisions under Basel III for certain capital deductions and risk weights as well as certain minority interest requirements for banking organizations not subject to the advanced approaches capital rules, including: mortgage servicing assets; deferred tax assets arising from temporary differences that could not be realized through net operating loss carrybacks; significant investments in the capital of unconsolidated financial institutions; and non-significant investments in the capital of unconsolidated financial institutions; and significant investments in the capital of unconsolidated financial institutions that are not in the form of common stock. FNCB and the Bank are not subject to the advanced approaches capital rule.
As discussed below, Basel III also integrates the new capital requirements into the prompt corrective action provisions under Section 38 of the Federal Deposit Insurance Act (“FDIA”).
Prompt Corrective Action. Under Section 38 of the FDIA, each federal banking agency is required to implement a system of prompt corrective action for institutions which it regulates. The federal banking agencies have promulgated substantially similar regulations to implement the system of prompt corrective action established by Section 38 of the FDIA.
The following are the capital requirements under the Basel III Rules integrated into the prompt corrective action category definitions. As of December 31, 2017, the following capital requirements were applicable to the Bank for purposes of Section 38 of the FDIA.
|
Total |
Tier I |
|||||||||
|
Risk-Based |
Risk-Based |
CET I |
Leverage |
Tangible Equity |
||||||
|
Capital Category |
|
Capital Ratio |
|
Capital Ratio |
|
Capital Ratio |
|
Ratio |
|
to Assets |
|
Well capitalized |
|
>/= 10.0% |
|
>/= 8.0% |
|
>/= 6.5% |
|
>/= 5.0% |
|
N/A |
|
Adequately capitalized with converation buffer |
>/= 9.25% |
>/= 7.25% |
>/= 5.75% |
>/= 4.0% |
N/A |
|||||
|
Adequately capitalized |
|
>/= 8.0% |
|
>/= 6.0% |
|
>/= 4.5% |
|
>/= 4.0% |
|
N/A |
|
Undercapitalized |
< 8.0% |
< 6.0% |
< 4.5% |
< 4.0% |
N/A |
|||||
|
Significantly undercapitalized |
|
< 6.0% |
|
< 4.0% |
|
< 3.0% |
|
< 3.0% |
|
N/A |
|
Critically undercapitalized |
N/A |
N/A |
N/A |
N/A |
Less than 2.0% |
Additionally, FNCB’s outstanding subordinated notes are subject to phase out and will cease to qualify as capital for regulatory purposes. Overall, management believes that implementation of Basel III did not have a material adverse effect on FNCB’s or the Bank’s capital ratios, earnings, shareholder’s equity, or its ability to pay discretionary bonuses to executive officers. At December 31, 2017, the Bank was “well capitalized” under the aforementioned requirements with a common equity Tier I capital and Tier I capital to risk-weighted assets ratios of 11.36%, a total capital to risk-weighted assets ratio of 12.49% and a Leverage ratio of 8.24%. Similarly, at December 31, 2017, FNCB met its capital requirements with a common equity Tier I capital to risk-weighted assets of 9.74%, a Tier I capital to risk-weighted assets ratio of 10.66%, a total capital to risk-weighted assets ratio of 12.08%, and a Leverage ratio of 7.74%.
Regulatory Enforcement Authority. Federal banking law grants substantial enforcement powers to federal banking regulators. This enforcement authority includes, among other things, the ability to assess civil money penalties, to issue cease-and-desist or removal orders and to initiate injunctive actions against banking organizations and institution-affiliated parties. In general, these enforcement actions may be initiated for violations of laws and regulations and unsafe or unsound practices. Other actions or inactions may provide the basis for enforcement action, including misleading or untimely reports filed with regulatory authorities.
The Bank and its “institution-affiliated parties,” including its management, employees, agents, independent contractors, consultants such as attorneys and accountants and others who participate in the conduct of the financial institution’s affairs, are subject to potential civil and criminal penalties for violations of law, regulations or written orders of a governmental agency. In addition, regulators are provided with greater flexibility to commence enforcement actions against institutions and institution-affiliated parties. Possible enforcement actions include the termination of deposit insurance and cease-and-desist orders. Such orders may, among other things, require affirmative action to correct any harm resulting from a violation or practice, including restitution, reimbursement, indemnifications or guarantees against loss. A financial institution may also be ordered to restrict its growth, dispose of certain assets, rescind agreements or contracts, or take other actions as determined by the ordering agency to be appropriate.
Under provisions of the federal securities laws, a determination by a court or regulatory agency that certain violations have occurred at a company or its affiliates can result in fines, restitution, a limitation of permitted activities, disqualification to continue to conduct certain activities and an inability to rely on certain favorable exemptions. Certain types of infractions and violations can also affect a public company in its timing and ability to expeditiously issue new securities into the capital markets.
The regulatory structure also gives the regulatory authorities extensive discretion in connection with their supervisory and enforcement activities and examination policies, including policies with respect to the classification of assets and the establishment of adequate loan loss allowances for regulatory purposes.
The Dodd-Frank Act. The Dodd-Frank Act made significant changes to the bank regulatory structure and affects the lending, deposit, investment, trading and operating activities of financial institutions and their holding companies. The Dodd-Frank Act has required a number of federal agencies to adopt a broad range of new rules and regulations, and to prepare various studies and reports for Congress. The federal agencies have been given significant discretion in drafting these rules and regulations. To date, the following provisions of the Dodd-Frank Act are considered to be of greatest significance to FNCB:
|
● |
expands the authority of the FRB to examine bank holding companies and their subsidiaries, including insured depository institutions; |
|
● |
requires a bank holding company to be well capitalized and well managed to receive approval of an interstate bank acquisition; |
|
● |
changes standards for federal preemption of state laws related to national banks and their subsidiaries; |
|
● |
provides mortgage reform provisions regarding a customer’s ability to pay and making more loans subject to provisions for higher-cost loans and new disclosures; |
|
● |
creates the Consumer Financial Protection Bureau (the “CFPB”) that has rulemaking authority for a wide range of consumer protection laws that apply to all banks and has broad powers to supervise and enforce consumer protection laws; |
|
● |
creates the Financial Stability Oversight Council with authority to identify institutions and practices that might pose a systemic risk; |
|
● |
introduces additional corporate governance and executive compensation requirements on companies’ subject to the Securities and Exchange Act of 1934, as amended; |
|
● |
permits FDIC-insured banks to pay interest on business demand deposits; |
|
● |
requires that holding companies and other companies that directly or indirectly control an insured depository institution serve as a source of financial strength; |
|
● |
makes permanent the $250 thousand limit for federal deposit insurance at all insured depository institutions; and |
|
● |
permits national and state banks to establish interstate branches to the same extent as the branch host state allows establishment of in-state branches. |
President Donald J. Trump has indicated that one of the goals of his administration is to reduce federal government regulation, including, among other things, reconsidering certain regulations promulgated under the Dodd-Frank Act. On February 3, 2017, President Donald J. Trump issued an executive order that directs the Secretary of the Treasury Department to consult with the heads of the member agencies of the Financial Stability Oversight Council and report to President Trump on the extent to which the laws and regulations governing the U.S. financial system are in accord with certain enumerated “core principles” (the “Executive Order”). The “core principles” set forth in the Executive Order relate to U.S. financial system regulation, and include fostering economic growth and vibrant financial markets through more rigorous regulatory impact analysis, and making “regulation more efficient, effective and appropriately tailored.” More recently, the U.S. House of Representatives and Senate have both considered legislation that would roll-back or eliminate portions of the Dodd-Frank Act, and a bipartisan bill, “The Economic Growth, Regulatory Relief and Consumer Protection Act,” has been introduced in the Senate which includes a roll back of certain key provisions of the Dodd-Frank Act. At this time, it is not possible to predict whether any legislation will be enacted that amends the Dodd-Frank Act or, if enacted, what provisions the legislation would include or the impact of any such legislation on FNCB and the Bank.
Consumer Financial Protection Bureau. The Dodd-Frank Act created the CFPB, which is granted broad rulemaking, supervisory and enforcement powers under various federal consumer financial protection laws, including the Equal Credit Opportunity Act, Truth in Lending Act (“TILA”), Real Estate Settlement Procedures Act (“RESPA”), Fair Credit Reporting Act, Fair Debt Collection Act, Consumer Financial Privacy provisions of the Gramm-Leach-Bliley Act, and certain other statutes. The CFPB has examination and primary enforcement authority with respect to depository institutions with $10 billion or more in assets. Smaller institutions are subject to rules promulgated by the CFPB, but continue to be examined and supervised by federal banking regulators for consumer compliance purposes. The CFPB has authority to prevent unfair, deceptive or abusive practices in connection with the offering of consumer financial products. The Dodd-Frank Act authorizes the CFPB to establish certain minimum standards for the origination of residential mortgages including a determination of the borrower’s ability to repay. In addition, the Dodd-Frank Act allows borrowers to raise certain defenses to foreclosure if they receive any loan other than a “qualified mortgage” as defined by the CFPB. The Dodd-Frank Act permits states to adopt consumer protection laws and standards that are more stringent than those adopted at the federal level and, in certain circumstances, permits state attorneys general to enforce compliance with both the state and federal laws and regulations.
Ability to Repay and Qualified Mortgage Rule
Pursuant to the Dodd Frank Act, the CFPB issued a final rule on January 10, 2013, which became effective January 10, 2014, amending Regulation Z as implemented by the Truth in Lending Act, requiring mortgage lenders to make a reasonable and good faith determination based on verified and documented information that a consumer applying for a mortgage loan has a reasonable ability to repay the loan according to its terms. Mortgage lenders are required to determine consumers’ ability to repay in one of two ways. The first alternative requires the mortgage lender to consider the following eight underwriting factors when making the credit decision:
|
• |
current or reasonably expected income or assets; |
|
• |
current employment status; |
|
• |
the monthly payment on the covered transaction; |
|
• |
the monthly payment on any simultaneous loan; |
|
• |
the monthly payment for mortgage-related obligations; |
|
• |
current debt obligations, alimony, and child support; |
|
• |
the monthly debt-to-income ratio or residual income; and |
|
• |
credit history. |
Alternatively, the mortgage lender can originate “qualified mortgages,” which are entitled to a presumption that the creditor making the loan satisfied the ability-to-repay requirements. In general, a “qualified mortgage” is a mortgage loan without negative amortization, interest-only payments, balloon payments, or terms exceeding 30 years. In addition, to be a qualified mortgage, the points and fees paid by a consumer cannot exceed 3% of the total loan amount. Loans which meet these criteria will be considered qualified mortgages, and as a result generally protect lenders from fines or litigation in the event of foreclosure. Qualified mortgages that are “higher-priced” (e.g. subprime loans) garner a rebuttable presumption of compliance with the ability-to-repay rules, while qualified mortgages that are not “higher-priced” (e.g. prime loans) are given a safe harbor of compliance. The final rule, as issued, did not have a material impact on our lending activities or our results of operations or financial condition.
TILA/RESPA Integrated Disclosures (“TRID”). On October 3, 2015, the CFPB implemented a final rule combining the mortgage disclosures consumers previously received under TILA and RESPA. For more than 30 years, the TILA and RESPA mortgage disclosures had been administered separately by, respectively, the Federal Reserve Board and the U.S. Department of Housing and Urban Development. The final rule requires lenders to provide applicants with the new Loan Estimate and Closing Disclosure and generally applies to most closed-end consumer mortgage loans for which the creditor or mortgage broker receives an application on or after October 3, 2015.
The CFPB’s rulemaking, examination and enforcement authority has and will continue to significantly affect financial institutions offering consumer financial products and services, including FNCB and the Bank. These regulatory activities may limit the types of financial services and products the Bank may offer, which in turn may reduce FNCB’s revenues.
FDIC Insurance Premiums. The FDIC maintains a risk-based assessment system for determining deposit insurance premiums. Four risk categories (I-IV), each subject to different premium rates, are established based upon an institution’s status as well capitalized, adequately capitalized or undercapitalized, and the institution’s supervisory rating.
The Dodd-Frank Act permanently increased the maximum deposit insurance amount for banks, savings institutions and credit unions to $250,000 per depositor. The Dodd-Frank Act also broadened the base for FDIC insurance assessments. Assessments are now based on a financial institution’s average consolidated total assets less tangible equity capital. The Dodd-Frank Act requires the FDIC to increase the reserve ratio of the Deposit Insurance Fund from 1.15% to 1.35% of insured deposits by 2020 and eliminates the requirement that the FDIC pay dividends to insured depository institutions when the reserve ratio exceeds certain thresholds. The Dodd-Frank Act eliminated the statutory prohibition against the payment of interest on business checking accounts.
An insured institution is required to pay deposit insurance premiums on its assessment base in accordance with its risk category. There are three adjustments that can be made to an institution’s initial base assessment rate: (1) a potential decrease for long-term unsecured debt, including senior and subordinated debt and, for small institutions, a portion of Tier I capital; (2) a potential increase for secured liabilities above a threshold amount; and (3) for non-Risk Category I institutions, a potential increase for brokered deposits above a threshold amount. The FDIC may also impose special assessments from time to time.
At December 31, 2017, the Bank was considered risk category I, the lowest risk category, for deposit insurance assessments and paid an annual assessment rate ranging from 0.0005 basis points to 0.0006 basis points on the assessment base of average consolidated total assets less the average tangible equity during the assessment period.
Dividend Restrictions
FNCB Bancorp, Inc. is a legal entity separate and distinct from the Bank. FNCB Bancorp, Inc.’s revenues (on a parent company only basis) and its ability to pay dividends to its shareholders are almost entirely dependent upon the receipt of dividends from the Bank. The right of FNCB Bancorp, Inc., and consequently the rights of its creditors and shareholders to participate in any distribution of the assets or earnings of any subsidiary through the payment of such dividends or otherwise is necessarily subject to the prior claims of creditors of the subsidiary (including depositors) except to the extent that claims of FNCB Bancorp, Inc., in its capacity as a creditor, may be recognized. Additionally, the ability of the Bank to pay dividends to FNCB Bancorp, Inc. is subject to Pennsylvania state law and various regulatory restrictions.
The declaration of cash dividends on FNCB’s common stock is at the discretion of its board of directors, and any decision to declare a dividend is based on a number of factors, including, but not limited to, earnings, prospects, financial condition, regulatory capital levels, applicable covenants under any credit agreements, notes and other contractual restrictions, Pennsylvania law, federal bank regulatory law, and other factors deemed relevant.
Employees
As of December 31, 2017, FNCB, including the Bank employed 242 persons, including 25 part-time employees.
Available Information
FNCB files reports, proxy and information statements and other information electronically with the SEC. You may read and copy any materials that FNCB files with the SEC at the SEC’s Public Reference Room at 100 F Street, NE, Washington, DC 20549. Information may be obtained on the operation of the Public Reference Room by calling the SEC at 1-800-SEC-0330. The SEC maintains an Internet site that contains reports, proxy and information statements, and other information regarding issuers that file electronically with the SEC. The SEC’s website site address is https://www.sec.gov. FNCB makes its Annual Report on Form 10-K, Quarterly Reports on Form 10-Q and Current Reports on Form 8-K and amendments thereto available through its website at https://www.fncb.com. The information contained on our website is not included as a part of, or incorporated by reference in, this Annual Report on Form 10-K. These reports may also be obtained free of charge as soon as practicable after filing or furnishing them to the SEC upon request by sending an email to corporatesecretary@fncb.com. Information may also be obtained via written request to FNCB Bancorp, Inc. Attention: Chief Financial Officer, 102 East Drinker Street, Dunmore, PA 18512.
|
Item 1A. |
Risk Factors |
FNCB, like other financial companies, is subject to a number of risks that may adversely affect our financial condition or results of operations, many of which are outside of our direct control. Among these risks are:
|
• |
Credit risk, which is the risk of loss due to borrowers or other counterparties not being able to meet their financial obligations under agreed upon terms; |
|
• |
Market risk, which occurs when fluctuations in interest rates impact earnings and capital. Financial impacts are realized through changes in the interest rates of balance sheet assets and liabilities (net interest margin) or directly through valuation changes of capitalized MSR and/or trading assets (noninterest income); |
|
• |
Liquidity risk, which is the risk to current or anticipated earnings or capital arising from an inability to meet obligations when they come due. Liquidity risk includes the inability to access funding sources or manage fluctuations in funding levels. Liquidity risk also results from the failure to recognize or address changes in market conditions that affect our ability to liquidate assets quickly and with minimal loss in value; |
|
• |
Operational and Legal risk, which is the risk of loss arising from inadequate or failed internal processes or systems, human errors or misconduct, or adverse external events. Operational losses result from internal fraud; external fraud, inadequate or inappropriate employment practices and workplace safety, failure to meet professional obligations involving customers, products, and business practices, damage to physical assets, business disruption and systems failures, and failures in execution, delivery, and process management. Legal risk includes, but is not limited to, exposure to orders, fines, penalties, or punitive damages resulting from litigation, as well as regulatory actions; |
|
• |
Compliance risk, which exposes us to money penalties, enforcement actions or other sanctions as a result of non-conformance with laws, rules, and regulations that apply to the financial services industry; |
|
• |
Strategic risk, which is defined as risk to current or anticipated earnings, capital, or enterprise value arising from adverse business decisions, improper implementation of business decisions or lack of responsiveness to industry / market changes; and |
|
• |
Reputation risk, which is the risk that negative publicity regarding an institution's business practices, whether true or not, will cause a decline in the customer base, costly litigation, or revenue reductions. |
The risk factors discussed below, which could materially affect FNCB’s business, operating results or financial condition, should be considered in addition to the other information presented in this Annual Report on Form 10-K. However, the risk factors described below are not meant to be all inclusive. Additional risks and uncertainties not currently known or that FNCB currently deems to be insignificant may also materially adversely affect its business, operating results or financial condition.
Credit Risk
Weakness in the economic environment, in general, and within FNCB’s market area could pose significant challenges for FNCB and could adversely affect its financial condition and results of operations.
FNCB’s success depends primarily on the general economic conditions in the Commonwealth of Pennsylvania and the specific local markets in which it operates. Unlike larger national or other regional banks that are more geographically diversified, FNCB provides banking and financial services to customers primarily in the Lackawanna, Luzerne, Lehigh and Wayne County markets. The local economic conditions in these areas have a significant impact on the demand for FNCB’s products and services as well as the ability of customers to repay loans, the value of the collateral securing loans, and the stability of deposit funding sources. A significant decline in general economic conditions, caused by inflation, recession, acts of terrorism, severe weather or natural disasters, outbreak of hostilities or other international or domestic occurrences, unemployment, changes in securities markets or other factors could impact these local economic conditions and, in turn, have a material adverse effect on FNCB’s financial condition and results of operations. Specifically, weakness in economic conditions could result in one or more of the following:
|
• |
A decrease in the demand for FNCB’s loans and other products and services; |
|
• |
A decrease in customer savings generally and in the demand for FNCB’s savings and other deposit products; and |
|
• |
An increase in the number of customers and counterparties who become delinquent, file for protection under bankruptcy laws, or default on their loans or other obligations. |
An increase in the number of delinquencies, bankruptcies, or defaults could result in a higher level of non-performing assets, net charge-offs, and provision for loan and lease losses. The markets we serve are dependent on retail and service-related businesses and, thus, are particularly vulnerable to adverse changes in economic conditions affecting these sectors.
As of December 31, 2017, approximately 36.8% of FNCB’s loan portfolio consisted of commercial real estate loans and construction, land acquisition and development loans. These types of loans are generally viewed as having a higher risk of default than residential real estate loans or consumer loans. These types of loans are also typically larger than residential real estate loans and consumer loans. Because FNCB’s loan portfolio contains a significant number of commercial real estate loans with relatively large balances, the deterioration of one or a few of these loans could cause a significant increase in non-performing loans. All non-performing loans totaled $2.6 million, or 0.3% of total gross loans, as of December 31, 2017, and $2.2 million, or 0.3% of total gross loans, as of December 31, 2016. Although non-performing loans as a percentage of gross loans remained steady from the prior year, an increase in non-performing loans in the future could result in an increase in the provision for loan and lease losses and an increase in loan charge-offs, both of which could have a material adverse effect on FNCB’s financial condition and results of operations. The lending activities in which the Bank engages carry the risk that the borrowers will be unable to perform on their obligations. As such, general economic conditions, nationally and in FNCB’s primary market area, will have a significant impact on its results of operations. To the extent that economic conditions deteriorate, business and individual borrowers may be less able to meet their obligations to the Bank in full, in a timely manner, resulting in decreased earnings or losses to the Bank. To the extent that loans are secured by real estate, adverse conditions in the real estate market may reduce the ability of the borrowers to generate the necessary cash flow for repayment of the loan, and reduce the ability to collect the full amount of the loan upon a default. To the extent that the Bank makes fixed-rate loans, general increases in interest rates will tend to reduce its spread as the interest rates FNCB must pay for deposits would increase while interest income is flat. Economic conditions and interest rates may also adversely affect the value of property pledged as security for loans.
FNCB’s concentrations of loans, including those to insiders and related parties, may create a greater risk of loan defaults and losses.
A substantial portion of FNCB’s loans are secured by real estate in the Northeastern Pennsylvania market, and substantially all of its loans are to borrowers in that area. FNCB also has a significant amount of commercial real estate, commercial and industrial, construction, land acquisition and development loans and land-related loans for residential and commercial developments. At December 31, 2017, $462.2 million, or 60.2%, of gross loans were secured by real estate, primarily commercial real estate. Management has taken steps to mitigate commercial real estate concentration risk by diversification among the types and characteristics of real estate collateral properties, sound underwriting practices, and ongoing portfolio monitoring and market analysis. Of total gross loans, $21.0 million, or 2.7%, were construction, land acquisition and development loans. Construction, land acquisition and development loans have the highest risk of uncollectability. An additional $150.1 million, or 19.5%, of portfolio loans were commercial and industrial loans not secured by real estate. Historically, commercial and industrial loans generally have had a higher risk of default than other categories of loans, such as single family residential mortgage loans. The repayment of these loans often depends on the successful operation of a business and are more likely to be adversely affected by adverse economic conditions. While management believes that the loan portfolio is well diversified in terms of borrowers and industries, these concentrations expose FNCB to the risk that adverse developments in the real estate market, or in the general economic conditions in its general market area, could increase the levels of non-performing loans and charge-offs, and reduce loan demand. In that event, FNCB would likely experience lower earnings or losses. Additionally, if, for any reason, economic conditions in its market area deteriorate, or there is significant volatility or weakness in the economy or any significant sector of the area’s economy, FNCB’s ability to develop business relationships may be diminished, the quality and collectability of its loans may be adversely affected, the value of collateral may decline and loan demand may be reduced.
Commercial real estate, commercial and industrial and construction, land acquisition and development loans tend to have larger balances than single family mortgage loans and other consumer loans. Because FNCB’s loan portfolio contains a significant number of commercial and industrial loans, commercial real estate loans and construction, land acquisition and development loans with relatively large balances, the deterioration of one or a few of these loans may cause a significant increase in non-performing assets. An increase in non-performing loans could result in a loss of earnings from these loans, an increase in the provision for loan and lease losses, or an increase in loan charge-offs, which could have an adverse impact on FNCB’s results of operations and financial condition.
Guidance adopted by federal banking regulators provides that banks having concentrations in construction, land development or commercial real estate loans are expected to have and maintain higher levels of risk management and, potentially, higher levels of capital, which may adversely affect shareholder returns, or require FNCB to obtain additional capital sooner than it otherwise would. Excluded from the scope of this guidance are loans secured by non-farm nonresidential properties where the primary source of repayment is the cash flow from the ongoing operations and activities conducted by the party, or affiliate of the party, who owns the property.
Outstanding loans and line of credit balances to directors, officers and their related parties totaled $55.6 million as of December 31, 2017. At December 31, 2017, there were no loans to directors, officers and their related parties that were categorized as criticized loans within the Bank’s risk rating system, meaning they are not considered to present a higher risk of collection than other loans. For more information regarding loans to officers and directors and/or their related parties, please refer to Note 11, “Related Party Transactions” to the consolidated financial statements included in Item 8 and Item 13, “Certain Relationships and Related Transactions, and Director Independence” to this Annual Report on Form 10-K.
FNCB’s financial condition and results of operations would be adversely affected if the ALLL is not sufficient to absorb actual losses or if increases to the ALLL were required.
The lending activities in which the Bank engages carry the risk that the borrowers will be unable to perform on their obligations, and that the collateral securing the payment of their obligations may be insufficient to assure repayment. FNCB may experience significant credit losses, which could have a material adverse effect on its operating results. Management makes various assumptions and judgments about the collectability of FNCB’s loan portfolio, including the creditworthiness of its borrowers and the value of the real estate and other assets serving as collateral for the repayment of many of its loans, which it uses as a basis to estimate and establish its reserves for losses. In determining the amount of the ALLL, management reviews loans, loss and delinquency experience, and evaluates current economic conditions. If these assumptions prove to be incorrect, the ALLL may not cover inherent losses in FNCB’s loan portfolio at the date of its financial statements. Material additions to FNCB’s allowance or extensive charge-offs would materially decrease its net income. At December 31, 2017, the ALLL totaled $9.0 million, representing 1.17% of total loans.
Although management believes FNCB’s underwriting standards are adequate to manage normal lending risks, it is difficult to assess the future performance of its loan portfolio due to the ongoing economic environment and the state of the real estate market. The assessment of future performance of the loan portfolio is inherently uncertain. FNCB can give no assurance that non-performing loans will not increase or that non-performing or delinquent loans will not adversely affect its future performance.
In addition, federal and state regulators periodically review the ALLL and may require increases to the ALLL or further loan charge-offs. Any increase in ALLL or loan charge-offs as required by these regulatory agencies could have a material adverse effect on FNCB’s results of operations and financial condition.
If management concludes that the decline in value of any of FNCB’s investment securities is other-than-temporary, FNCB is required to write down the security to reflect credit-related impairments through a charge to earnings.
Management reviews FNCB’s investment securities portfolio at each quarter-end reporting period to determine whether the fair value is below the current carrying value. When the fair value of any of FNCB’s debt investment securities has declined below its carrying value, management is required to assess whether the decline represents an OTTI. If management concludes that the decline is other-than-temporary, it is required to write down the value of that security to reflect the credit-related impairments through a charge to earnings. Changes in the expected cash flows of securities in FNCB’s portfolio and/or prolonged price declines in future periods may result in OTTI, which would require a charge to earnings. Due to the complexity of the calculations and assumptions used in determining whether an asset is impaired, any impairment disclosed may not accurately reflect the actual impairment in the future. In addition, to the extent that the value of any of FNCB’s investment securities is sensitive to fluctuations in interest rates, any increase in interest rates may result in a decline in the value of such investment securities.
FNCB held approximately $2.8 million in capital stock of the Federal Home Loan Bank of Pittsburgh (“FHLB”) as of December 31, 2017. FNCB must own such capital stock to qualify for membership in the Federal Home Loan Bank system which enables it to borrow funds under the FHLB advance program. If the FHLB were to cease operations, FNCB’s business, financial condition, liquidity, capital and results of operations may be materially and adversely affected.
Market Risk
Changes in interest rates could reduce income, cash flows and asset values.
FNCB’s earnings and cash flows are largely dependent upon its net interest income. Net interest income is the difference between interest income earned on interest-earning assets such as loans and securities and interest expense paid on interest-bearing liabilities such as deposits and borrowed funds. Interest rates are highly sensitive to many factors that are beyond FNCB’s control, including general economic conditions and policies of various governmental and regulatory agencies and, in particular, the FRB. Changes in monetary policy, including changes in interest rates, could influence not only the interest FNCB receives on loans and securities and the amount of interest it pays on deposits and borrowings, but such changes could also affect (i) FNCB’s ability to originate loans and obtain deposits, (ii) the fair value of FNCB’s financial assets and liabilities, and (iii) the average duration of FNCB’s mortgage-backed securities portfolio.
If the interest rates paid on deposits and other borrowings increase at a faster rate than the interest rates received on loans and investments, FNCB’s net interest income, and therefore earnings, could be adversely affected. Earnings could also be adversely affected if the interest rates received on loans and investments fall more quickly than the interest rates paid on deposits and other borrowings. Any substantial, unexpected, prolonged change in market interest rates could have a material adverse effect on FNCB’s financial condition and results of operations.
FNCB may not be able to successfully compete with others for business.
FNCB competes for loans, deposits and investment dollars with numerous regional and national banks and other community banking institutions, online divisions of banks located in other markets as well as other kinds of financial institutions and enterprises, such as securities firms, insurance companies, savings associations, credit unions, mortgage brokers, private lenders and Fintech companies. There is also competition for banking business from competitors outside of its market area. As noted above, FNCB and the Bank are subject to extensive regulations and supervision, including, in many cases, regulations that limit the type and scope of activities. Many competitors have substantially greater resources and may offer certain services that FNCB and the Bank does not provide, and operate under less stringent regulatory environments. The differences in available resources and applicable regulations may make it harder for FNCB to compete profitably, reduce the rates that it can earn on loans and investments, increase the rates it must offer on deposits and other funds, and adversely affect its overall financial condition and earnings. For additional discussion of FNCB’s competitive environment, refer to the section entitled “Business – Competition” included in Item 1 of this Annual Report on Form 10-K.
Liquidity Risk
Changes in either FNCB’s financial condition or in the general banking industry could result in a loss of depositor confidence.
Liquidity is the ability to meet cash flow needs on a timely basis at a reasonable cost. The Bank uses its liquidity to extend credit and to repay liabilities as they become due or as demanded by customers. The Board of Directors establishes liquidity policies, including contingency funding plans, and limits and management establishes operating guidelines for liquidity. FNCB’s primary source of liquidity is customer deposits. The continued availability of this funding source depends on customer willingness to maintain deposit balances with banks in general and FNCB in particular. The availability of deposits can also be impacted by regulatory changes (e.g. changes in FDIC insurance, the liquidity coverage ratio, etc.), changes in the financial condition of FNCB, or the banking industry in general, and other events which can impact the perceived safety and soundness or economic benefits of bank deposits. While FNCB makes significant efforts to consider and plan for hypothetical disruptions in our deposit funding through the use of liquidity stress testing, market related, geopolitical, or other events could impact the liquidity derived from deposits.
FNCB is a bank holding company and depends on dividends from its subsidiary, FNCB Bank, to operate.
FNCB is an entity separate and distinct from the Bank. The Bank conducts most of our operations and FNCB depends upon dividends from the Bank to service FNCB's debt, pay FNCB’s expenses and to pay dividends to FNCB's shareholders. The availability of dividends from the Bank is limited by various statutes and regulations. It is possible, depending upon the financial condition including liquidity and capital adequacy of the Bank and other factors, that the Bank’s regulators could limit the payment of dividends or other payments to FNCB by the Bank. In the event that the Bank was unable to pay dividends, FNCB in turn would likely have to reduce or stop paying dividends to its shareholders. Failure to pay dividends to FNCB shareholders could have a material adverse effect on the market price of our Common Stock. For additional information regarding dividend restrictions, refer to the section entitled “Regulatory Matters” included in Item 1 of this Annual Report on Form 10-K.
If we lose access to wholesale funding sources, we may not be able to meet the cash flow requirements of our depositors, creditors, and borrowers, or have the operating cash needed to fund corporate expansion and other corporate activities.
Wholesale funding sources include brokered deposits, reciprocal and one-way CDARS and ICS deposits federal funds lines of credit, securities sold under repurchase agreements, non-core deposits, and long-term debt. The Bank is also a member of the Federal Home Loan Bank of Pittsburgh, which provides members access to funding through advances collateralized with certain qualifying assets within the Bank’s loan portfolio. In addition, FNCB’s available-for-sale securities provide an additional source of liquidity. Disruptions in availability of wholesale funding can directly impact the liquidity of FNCB and the Bank. The inability to access capital markets funding sources as needed could adversely impact FNCB’s financial condition, results of operations, cash flows, and level of regulatory-qualifying capital.
Operational and Legal Risk
Interruptions or security breaches of FNCB’s information systems could negatively affect its financial performance or reputation.
In conducting its business, FNCB relies heavily on its information systems. FNCB collects and stores sensitive data, including proprietary business information and personally identifiable information of its customers and employees, in its data centers and on its networks. The secure processing, maintenance and transmission of this information is critical to FNCB’s operations and business strategy. Maintaining and protecting those systems is difficult and expensive, as is dealing with any failure, interruption or breach of those systems. Despite security measures, FNCB’s information technology and infrastructure may be vulnerable to security breaches, cyber-attacks by hackers or breaches due to employee error, malfeasance or other disruptions. Any damage, failure or breach could cause an interruption in operations. Computer break-ins, phishing and other disruptions could also jeopardize the security of information stored in and transmitted through FNCB’s computer systems and network infrastructure. The occurrence of any failures, interruptions or breaches could damage FNCB’s reputation, disrupt operations and the services provided to customers, cause a loss of confidence in the products and the services provided, cause FNCB to incur additional expenses, result in a loss of customer business and data, result in legal claims or proceedings, result in liability under laws that protect the privacy of personal information, result in regulatory penalties, or expose FNCB to other liability, any of which could have a material adverse effect on its business, financial condition and results of operations and competitive position.
If FNCB’s information technology is unable to keep pace with growth or industry developments or if technological developments result in higher costs or less advantageous pricing, financial performance may suffer.
Effective and competitive delivery of FNCB’s products and services increasingly depends on information technology resources and processes, both those provided internally as well as those provided through third party vendors. In addition to better serving customers, the effective use of technology can improve efficiency and help reduce costs. FNCB’s future success will depend, in part, upon its ability to address the needs of its customers by using technology to provide products and services to enhance customer convenience, as well as to create efficiencies in its operations. There is increasing pressure to provide products and services at lower prices. This can reduce net interest income and non-interest income from fee-based products and services. In addition, the widespread adoption of new technologies could require FNCB to make substantial capital expenditures to modify or adapt existing products and services or develop new products and services. FNCB may not be successful in introducing new products and services in response to industry trends or developments in technology, or those new products may not achieve market acceptance. Many of FNCB’s competitors have greater resources to invest in technological improvements. Additionally, as technology in the financial services industry changes and evolves, keeping pace becomes increasingly complex and expensive. There can be no assurance that FNCB will be able to effectively implement new technology-driven products and services, which could reduce its ability to compete effectively. As a result, FNCB could lose business, be forced to price products and services on less advantageous terms to retain or attract customers, or be subject to cost increases.
FNCB relies on management and other key personnel and the loss of any of them may adversely affect its operations.
FNCB believes each member of the executive management team is important to its success and the unexpected loss of any of these persons could impair day-to-day operations as well as its strategic direction.
FNCB’s success depends, in large part, on its ability to attract and retain key people. Competition for the best people in most activities engaged in by FNCB can be intense and it may not be able to hire people or retain them. The unexpected loss of services of one or more of FNCB’s key personnel could have a material adverse impact on its business due to the loss of their skills, knowledge of its market, years of industry experience and to the difficulty of promptly finding qualified replacement personnel.
FNCB may be a defendant from time to time in a variety of litigation and other actions, which could have a material adverse effect on its financial condition, results of operations and cash flows.
FNCB has been and may continue to be involved from time to time in a variety of litigation matters arising out of its business. An increased number of lawsuits, including purported class action lawsuits and other consumer driven litigation, have been filed and will likely continue to be filed against financial institutions, which may involve substantial compensatory and/or punitive damages. Management believes the risk of litigation generally increases during downturns in the national and local economies. FNCB’s insurance may not cover all claims that may be asserted against it, and any claims asserted against it, regardless of merit or eventual outcome, may harm its reputation and may cause it to incur significant expense. Should the ultimate judgments or settlements in any litigation exceed insurance coverage, they could have a material adverse effect on its financial condition, results of operations and cash flows. In addition, FNCB may not be able to obtain appropriate types or levels of insurance in the future, nor may it be able to obtain adequate replacement policies with acceptable terms, if at all. For additional discussion of FNCB’s current legal matters, refer to Item 3, “Legal Proceedings” of this Annual Report on Form 10-K.
FNCB’s disclosure controls and procedures and internal controls over financial reporting may not achieve their intended objectives.
FNCB maintains disclosure controls and procedures designed to ensure the timely filing of reports as specified in the rules and forms of the Securities and Exchange Commission. FNCB also maintains a system of internal control over financial reporting. These controls may not achieve their intended objectives. Control processes that involve human diligence and compliance, such as its disclosure controls and procedures and internal controls over financial reporting, are subject to lapses in judgment and breakdowns resulting from human failures. Controls can also be circumvented by collusion or improper management override. Because of such limitations, there are risks that material misstatements due to error or fraud may not be prevented or detected and that information may not be reported on a timely basis. If FNCB’s controls are not effective, it could have a material adverse effect on its financial condition, results of operations, and market for its common stock, and could subject it to additional regulatory scrutiny.
The price of FNCB’s common stock may fluctuate significantly, which may make it difficult for investors to resell common stock at a time or price they find attractive.
FNCB’s common stock per share price may fluctuate significantly as a result of a variety of factors, many of which are beyond its control. These factors include, in addition to those described above:
|
● |
actual or anticipated quarterly fluctuations in operating results and financial condition; |
|
● |
changes in financial estimates or publication of research reports and recommendations by financial analysts or actions taken by rating agencies with respect to FNCB or other financial institutions; |
|
● |
speculation in the press or investment community generally or relating to FNCB’s reputation or the financial services industry; |
|
● |
strategic actions by FNCB or its competitors, such as acquisitions, restructurings, dispositions or financings; |
|
● |
fluctuations in the stock price and operating results of FNCB’s competitors; |
|
● |
future sales of FNCB’s equity or equity-related securities; |
|
● |
proposed or adopted regulatory changes or developments; |
|
● |
anticipated or pending investigations, proceedings, audits or litigation that involve or affect FNCB; |
|
● |
domestic and international economic factors unrelated to FNCB’s performance; and |
|
● |
general market conditions and, in particular, developments related to market conditions for the financial services industry. |
During 2017, the per share closing bid price of FNCB’s common stock on the OTCQX Marketplace (“OTCQX”) ranged from a low of $6.05 on January 5, 2017, to a high of $8.13 on May 24, 2017.
In addition, in recent years, the stock market in general has experienced extreme price and volume fluctuations. This volatility has had a significant effect on the market price of securities issued by many companies, including for reasons unrelated to their operating performance. These broad market fluctuations may adversely affect FNCB’s share price, notwithstanding its operating results. Management expects that the market price of its common stock will continue to fluctuate and there can be no assurances about the levels of the market prices for its common stock.
An active public market for FNCB’s common stock does not currently exist. As a result, shareholders may not be able to quickly and easily sell their shares of common stock.
Until March 5, 2018, FNCB’s shares of common stock were quoted on the OTCQX. An average of 5,669 shares of FNCB’s common stock traded on the OTCQX during 2017 on a daily basis. On March 5, 2018, FNCB’s shares of common stock began trading on The Nasdaq Capital Market®. An active, liquid market for FNCB’s shares of common stock has not previously existed, and there can be no assurance that an active and liquid market will develop, or if one does develop, if it can be maintained. The absence of an active trading market may make it difficult for FNCB shareholders to sell FNCB’s shares of common stock at the prevailing price when desired or at all, particularly in large quantities. For a further discussion, see Item 5, “Market for Registrant’s Common Equity, Related Shareholder Matters, and Issuer Purchases of Equity Securities” to this Annual Report on Form 10-K.
New or changed legislation or regulation and regulatory initiatives could adversely affect FNCB through increased regulation and increased costs of doing business.
Changes in federal and state legislation and regulation may affect FNCB’s operations. New and modified regulations, such as the Dodd-Frank Act and Basel III, may have unforeseen or unintended consequences on the banking industry. The Dodd-Frank Act has implemented significant changes to the U.S. financial system, including the creation of new regulatory agencies (such as the Financial Stability Oversight Council to oversee systemic risk and the CFPB to develop and enforce rules for consumer financial products), changes in retail banking regulations, and changes to deposit insurance assessments. For example, the Dodd-Frank Act has implemented new requirements with respect to “qualified mortgages” and new mortgage servicing standards have, and may continue to, increase costs associated with this business. For a more detailed description, see the section entitled “Business – The Bank – Consumer Financial Protection Bureau” included in Item 1 to this Annual Report on Form 10-K.
Additionally, final rules to implement Basel III adopted in July 2013 revise risk-based and leverage capital requirements and limit capital distributions and certain discretionary bonuses if a banking organization does not hold the required “capital conservation buffer.” The rule became effective for FNCB on January 1, 2015, with some additional transition periods. This additional regulation could increase compliance costs and otherwise adversely affect operations. For a more detailed description of the final rules, see the description in Item 1 of this Annual Report on Form 10-K under the heading “Capital Adequacy Requirements”. The potential also exists for additional federal or state laws or regulations, or changes in policy or interpretations, affecting many of FNCB’s operations, including capital levels, lending and funding practices, insurance assessments, and liquidity standards. The effect of any such changes and their interpretation and application by regulatory authorities cannot be predicted, may increase FNCB’s cost of doing business and otherwise affect FNCB’s operations, may significantly affect the markets in which it does business, and could have a materially adverse effect on FNCB.
FNCB is also subject to the guidelines under the GLB Act. The GLB Act guidelines require, among other things, that each financial institution develop, implement and maintain a written, comprehensive information security program containing safeguards that are appropriate to the financial institution’s size and complexity, the nature and scope of the financial institution’s activities and the sensitivity of any customer information at issue. In recent years there also has been increasing enforcement activity in the areas of privacy, information security and data protection in the United States, including at the federal level. Compliance with these laws, rules and regulations regarding the privacy, security and protection of customer and employee data could result in higher compliance and technology costs. In addition, non-compliance could result in potentially significant fines, penalties and damage to FNCB’s reputation and brand.
Changes in accounting standards could impact reported earnings.
From time to time there are changes in the financial accounting and reporting standards that govern the preparation of financial statements. These changes can materially impact how FNCB records and reports its financial condition and results of operations. In some instances, FNCB could be required to apply a new or revised standard retroactively, resulting in the restatement of prior period financial statements.
Compliance Risk
FNCB is subject to extensive government regulation, supervision and possible regulatory enforcement actions, which may subject it to higher costs and lower shareholder returns.
The banking industry is subject to extensive regulation and supervision that govern almost all aspects of its operations. The extensive regulatory framework is primarily intended to protect the federal deposit insurance fund and depositors, not shareholders. Compliance with applicable laws and regulations can be difficult and costly and, in some instances, may put banks at a competitive disadvantage compared to less regulated competitors such as finance companies, mortgage banking companies, leasing companies and internet-based Fintech companies. FNCB’s regulatory authorities have extensive discretion in their supervisory and enforcement activities, including with respect to the imposition of restrictions on the operation of a bank or a bank holding company, the imposition of significant fines, the ability to delay or deny merger or other regulatory applications, the classification of assets by a bank, and the adequacy of a bank’s allowance for loan losses, among other matters. If they deem FNCB to be operating in a manner inconsistent with safe and sound banking practices, these regulatory authorities can require the entry into informal and formal supervisory agreements, including board resolutions, memoranda of understanding, settlement agreements and consent or cease and desist orders, pursuant to which FNCB would be required to implement identified corrective actions to address cited concerns and/or to refrain from taking certain actions in the form of injunctive relief. In recent years, the banking industry has faced increased regulation and scrutiny; for instance, areas such as BSA compliance (including BSA and related anti-money laundering regulations) and real estate-secured consumer lending (such as Truth-in-Lending regulations, changes in Real Estate Settlement Procedures Act regulations, implementation of licensing and registration requirements for mortgage originators and more recently, heightened regulatory attention to mortgage and foreclosure-related activities and exposures) are being confronted with escalating regulatory expectations and scrutiny. Non-compliance with laws and regulations such as these, even in cases of inadvertent non-compliance, could result in litigation, significant fines and/or sanctions. Any failure to comply with, or any change in, any applicable regulation and supervisory requirement, or change in regulation or enforcement by such authorities, whether in the form of policies, regulations, legislation, rules, orders, enforcement actions, or decisions, could have a material impact on FNCB, the Bank and other affiliates, and its operations. Federal economic and monetary policy may also affect FNCB’s ability to attract deposits and other funding sources, make loans and investments, and achieve satisfactory interest spreads. Any failure to comply with such regulation or supervision could result in sanctions by regulatory agencies, civil money penalties and/or reputation damage, which could have a material adverse effect on FNCB’s business, financial condition and results of operations. In addition, compliance with any such action could distract management’s attention from FNCB’s operations, cause it to incur significant expenses, restrict it from engaging in potentially profitable activities and limit its ability to raise capital.
Strategic Risk
FNCB may need to raise additional capital in the future, but that capital may not be available when it is needed and on terms favorable to current shareholders.
Laws, regulations and banking regulators require FNCB and the Bank to maintain adequate levels of capital to support their operations. In addition, capital levels are determined by FNCB’s management and Board of Directors based on capital levels that they believe are necessary to support business operations. Management regularly evaluates its present and future capital requirements and needs and analyzes capital raising alternatives and options. Although FNCB succeeded in meeting its current regulatory capital requirements, it may need to raise additional capital in the future to support growth, possible loan losses or potential OTTI during future periods, to meet future regulatory capital requirements or for other reasons.
The Board of Directors may determine from time to time that FNCB needs to raise additional capital by issuing additional shares of common stock or other securities. FNCB is not restricted from issuing additional shares of common stock, including securities that are convertible into or exchangeable for, or that represent the right to receive, common stock. Because FNCB’s decision to issue securities in any future offering will depend on market conditions and other factors beyond its control, FNCB cannot predict or estimate the amount, timing or nature of any future offerings, or the prices at which such offerings may be affected. Such offerings will likely be dilutive to common shareholders from ownership, earnings and book value perspectives. New investors also may have rights, preferences and privileges that are senior to, and that adversely affect, its then current common shareholders. Additionally, if FNCB raises additional capital by making additional offerings of debt or preferred equity securities, upon liquidation, holders of its debt securities and shares of preferred shares, and lenders with respect to other borrowings, will receive distributions of available assets prior to the holders of common stock. Additional equity offerings may dilute the holdings of existing shareholders or reduce the market price of FNCB’s common stock, or both. Holders of FNCB’s common stock are not entitled to preemptive rights or other protections against dilution.
FNCB cannot provide any assurance that additional capital will be available on acceptable terms or at all. Any occurrence that may limit access to the capital markets may adversely affect FNCB’s capital costs and its ability to raise capital and, in turn, its liquidity. Moreover, if FNCB needs to raise capital, it may have to do so when many other financial institutions are also seeking to raise capital and would have to compete with those institutions for investors. An inability to raise additional capital on acceptable terms when needed could have a material adverse effect on FNCB’s business, financial condition and results of operations.
Reputation Risk
Damage to FNCB’s reputation could significantly harm its businesses, competitive position and prospects for growth.
FNCB’s ability to attract and retain investors, customers, clients, and employees could be adversely affected by damage to our reputation resulting from various sources, including employee misconduct, litigation, or regulatory outcomes; failure to deliver minimum standards of service and quality; compliance failures; unethical behavior; unintended breach of confidential information; and the activities of our clients, customers, and/or counterparties. Actions by the financial services industry in general, or by certain entities or individuals within it, also could have a significantly adverse impact on our reputation.
FNCB’s actual or perceived failure to identify and address various issues, including failure to properly address operational risks, could also give rise to reputational risk that could negatively impact business prospects. These issues include legal and regulatory requirements; consumer protection, fair lending, and privacy issues; properly maintaining customer and associated personal information; record keeping; protecting against money laundering; sales and trading practices; and ethical issues.
|
Item 1B. |
Unresolved Staff Comments. |
None.
|
Item 2. |
Properties. |
FNCB currently conducts business from its headquarters, which also houses the Bank’s main office, located at 102 East Drinker Street, Dunmore, Pennsylvania, 18512. At December 31, 2017, FNCB also operated seventeen additional branches located throughout Lackawanna, Luzerne and Wayne counties, an LPO located in Allentown, Lehigh County, Pennsylvania and a lending center and two administrative offices located in Dunmore, Lackawanna County, Pennsylvania. Fourteen of the offices are leased and the balance are owned by the Bank. Except for potential remodeling of certain facilities to provide for the efficient use of work space and/or to maintain an appropriate appearance, each property is considered reasonably suitable and adequate for current and immediate future purposes.
As part of its responsibilities, management regularly evaluates FNCB’s delivery system and facilities including analyzing each office’s operating efficiency, location, foot traffic, structure and design. As a result of these evaluations, on May 1, 2017, FNCB announced that the Bank will implement a comprehensive branch network improvement program that will focus on strengthening, better positioning and expanding its market coverage by developing new state-of-the-art customer facilities, as well as relocating and consolidating select locations. In accordance with the branch network improvement program, on June 30, 2017, FNCB consolidated its branch office located at 1127 Texas Palmyra Highway, Honesdale, Wayne County, Pennsylvania with its branch located at 1001 Main Street, Honesdale, Pennsylvania.
As part of this network improvement program, FNCB announced its intention to relocate three branches located in Luzerne County, Pennsylvania to a new location. The three branches that will be relocated are: 1) a branch located at 734 San Souci Parkway, Hanover Township, Pennsylvania; 2) a branch located at 27 North River Street, Plains, Pennsylvania; and 3) a branch located at 3 Old Boston Road, Pittston, Pennsylvania. These three branches will be relocated into a brand-new facility to be built in the Richland 315 development located at 1150 Route 315, Wilkes-Barre (Plains Township), Luzerne County, Pennsylvania. FNCB currently leases the three branches, as well as the aforementioned Honesdale branch, that was consolidated, and will lease the future Luzerne County facility. FNCB does not expect to incur any significant disposal costs on either the Wayne County or Luzerne County branch consolidations. The construction of the new facility began in the fourth quarter of 2017 and is expected to be completed in the second quarter of 2018, at which time the Luzerne County branch consolidation will occur. The three existing branches will continue to operate as full-service branches until that time.
On December 21, 2016, the Bank purchased a building located immediately adjacent to its main office at 106-108 East Drinker Street, Dunmore, Pennsylvania, 18512 for the purpose of housing its commercial and retail lending units. The lending center opened on March 7, 2017.
On January 20, 2017, FNCB opened a LPO in Allentown, Lehigh County, Pennsylvania and began offering its retail and commercial lending products in this new market area. This LPO is located in an office leased by the Bank at 3500 Winchester Road, Suites 101 and 102, Allentown, Pennsylvania, 18104.
On September 27, 2017, the Board of Directors of FNCB approved the purchase of the Bank’s corporate center located at 200 South Blakely Street, Dunmore, Pennsylvania, for $2.15 million. FNCB had been leasing this property since 1994. The purchase, which was finalized on January 12, 2018, was funded by cash generated from operations and is anticipated to reduce occupancy expenses by approximately $100,000 annually.
|
Item 3. |
Legal Proceedings. |
On May 24, 2012, a putative shareholder filed a complaint in the Court of Common Pleas for Lackawanna County (“Shareholder Derivative Suit”) against certain present and former directors and officers of FNCB (the “Individual Defendants”) alleging, inter alia, breach of fiduciary duty, abuse of control, corporate waste, and unjust enrichment. FNCB was named as a nominal defendant. On February 4, 2014, the Court issued a Final Order and Judgment for the matter granting approval of a Stipulation of Settlement (the “Settlement”) and dismissing all claims against FNCB and the Individual Defendants. As part of the Settlement, without admitting any fault, wrongdoing or liability, the Individual Defendants agreed to settle the derivative litigation for $5.0 million. The $5.0 million Settlement payment was made to FNCB on March 28, 2014. The Individual Defendants reserved their rights to indemnification under FNCB’s Articles of Incorporation and Bylaws, resolutions adopted by the Board, the Pennsylvania Business Corporation Law and any and all rights they have against FNCB’s and the Bank’s insurance carriers. In addition, in conjunction with the Settlement, FNCB accrued $2.5 million related to fees and costs of the plaintiff’s attorneys, which was included in non-interest expense in the consolidated statements of income for the year ended December 31, 2013. On April 1, 2014, FNCB paid the $2.5 million related to fees and costs of the plaintiff’s attorneys and partial indemnification of the Individual Defendants in the amount of $2.5 million. On July 1, 2017, FNCB continued to make partial indemnification to the Individual Defendants by commencing monthly principal payments, on behalf of the Individual Defendants, of $25,000 plus accrued interest due to First Northern Bank and Trust Co. As of December 31, 2017, $2.5 million plus accrued interest remains accrued in other liabilities related to the potential indemnification of the Individual Defendants.
On September 5, 2012, Fidelity and Deposit Company of Maryland (“F&D”) filed an action against FNCB and the Bank, as well as several current and former officers and directors of FNCB, in the United States District Court for the Middle District of Pennsylvania. F&D has asserted a claim for the rescission of a directors’ and officers’ insurance policy and a bond that it had issued to FNCB. On November 9, 2012, FNCB and the Bank answered the claim and asserted counterclaims for the losses and expenses already incurred by FNCB and the Bank. FNCB and the other defendants are defending the claims and have opposed F&D’s requested relief by way of counterclaims, breaches of contract and bad faith claims against F&D for its failure to fulfill its obligations to FNCB and the Bank under the insurance policy. Discovery is complete and the parties have exchanged expert reports. Dispositive motions have been submitted by the parties and the Court heard oral arguments on the motions on August 9, 2017. FNCB is awaiting the Court’s rulings on the dispositive motions. At this time, FNCB cannot reasonably determine the outcome of potential range of loss, if any, in connection with this matter.
On February 16, 2017, FNCB and the Bank entered into a Class Action Settlement Agreement and Release (the “Settlement Agreement”) in the matters filed in the Court of Common Pleas of Lackawanna County to Steven Antonik, Individually, and as Administrator of the Estate of Linda Kluska, William R. Howells and Louise A. Howells, Summer Benjamin, and Joshua Silfee, on behalf of themselves and all other similarly situated vs. First National Community Bancorp, Inc. and First National Community Bank, Civil Action No. 2013-CV-4438 and Charles Saxe, III, Individually and on behalf of all others similarly situated vs. First National Community Bank No. 2013-CV-5071 (collectively, the “Actions”). By entering into this Settlement Agreement, the parties to the Actions have resolved the claims made in the complaints to their mutual satisfaction. FNCB has not admitted to the validity of any claims or allegations and denies any liability in the claims made and the Plaintiffs have not admitted that any claims or allegations lack merit or foundation. Under the terms of the Settlement Agreement, the parties have agreed to the following: 1) FNCB is to pay the Plaintiffs’ class members the aggregate sum of Seven Hundred Fifty Thousand Dollars ($750,000) (an amount which FNCB recorded as a liability and corresponding expense in its 2015 operating results); 2) Plaintiffs shall release all claims against FNCB related to the Actions; 3) FNCB shall move to vacate or satisfy any judgments against any class members arising from the vehicle loans that are the subject of the Actions; and 4) FNCB shall waive the deficiency balance of each class member and remove the trade lines on each class members’ credit report associated with the subject vehicle loans that are at issue in the Actions for Experian, Equifax, and Transunion. The Settlement Agreement provides for an Incentive Award for the representative Plaintiffs and an award to Plaintiffs’ counsel of attorney’s fees and reimbursement of expenses in connection with their roles in these Actions, subject to Court approval. The Settlement Agreement was preliminarily approved by Court Order on February 16, 2017. On March 2, 2017, FNCB paid the Settlement Administrator Seven Hundred Fifty Thousand ($750,000) pursuant to the terms and conditions of the Settlement Agreement. The Settlement Agreement received final Court approval on May 31, 2017. Additionally, in association with the subject vehicle loans, FNCB has completed the removal of trade lines on each class members' credit report and has substantially completed satisfying judgments, where applicable, in favor of class members. As previously mentioned above and in connection with the primary terms of the tentative settlement agreement entered by Order of Court on December 17, 2015, FNCB recorded a liability and corresponding expense in the amount of Seven Hundred Fifty Thousand ($750,000), which was included in FNCB’s 2015 operating results.
FNCB has been subject to tax audits, and is also a party to routine litigation involving various aspects of its business, such as employment practice claims, workers compensation claims, claims to enforce liens, condemnation proceedings on properties in which FNCB holds security interests, claims involving the making and servicing of real property loans and other issues incident to its business, none of which has or is expected to have a material adverse impact on the consolidated financial condition, results of operations or liquidity of FNCB.
|
Item 4. |
Mine Safety Disclosures. |
Not Applicable.
PART II
|
Item 5. |
Market for Registrant’s Common Equity, Related Shareholder Matters and Issuer Purchases of Equity Securities. |
Market Prices of Stock and Dividends Paid
During the years ended December 31, 2017 and 2016, FNCB’s common shares were quoted on the OTCQX under the symbol “FNCB.” Quarterly market highs and lows and dividends paid for each of the past two years are presented below. These prices represent actual transactions.
|
Market Price |
Dividends Paid |
|||||||||||
|
High |
Low |
Per Share |
||||||||||
|
Quarter |
2017 |
2017 |
||||||||||
|
First |
$ | 7.50 | $ | 6.05 | $ | 0.03 | ||||||
|
Second |
8.13 | 6.35 | 0.03 | |||||||||
|
Third |
8.00 | 7.41 | 0.03 | |||||||||
|
Fourth |
7.99 | 6.54 | 0.04 | |||||||||
|
Quarter |
2016 |
2016 |
||||||||||
|
First |
$ | 6.90 | $ | 5.11 | $ | 0.02 | ||||||
|
Second |
6.12 | 5.50 | 0.02 | |||||||||
|
Third |
6.00 | 4.75 | 0.02 | |||||||||
|
Fourth |
6.30 | 5.00 | 0.03 | |||||||||
On December 29, 2017, FNCB filed a listing application with The Nasdaq Stock Market LLC (“Nasdaq”). FNCB subsequently received approval from Nasdaq on February 26, 2018 to list its common shares for trading on The Nasdaq Capital Market®. FNCB’s shares of common stock began trading on Nasdaq effective with the market opening on Monday, March 5, 2018.
Holders
As of February 28, 2018, there were approximately 1,811 holders of record of FNCB’s common shares. Because many of FNCB’s shares are held by brokers and other institutions on behalf of shareholders, FNCB is unable to estimate the total number of shareholders represented by these record holders.
Dividends
FNCB had been under a Written Agreement with the Federal Reserve Bank of Philadelphia from November 24, 2010 until it was fully and completely released from the enforcement action on September 2, 2015. The Bank had been under a Consent Order with the Office of the Comptroller of the Currency from September 1, 2010 until it was fully and completely released from the enforcement action on March 25, 2015. While under the Written Agreement, FNCB was precluded from paying dividends, and accordingly, did not pay dividends to shareholders during the tenure of the Written Agreement. FNCB resumed quarterly dividend payments effective with a quarterly dividend paid on March 15, 2016. In addition to the resumption of dividend payments, on April 27, 2016, FNCB’s Board of Directors approved the reinstatement of the Dividend Reinvestments and Stock Purchase Plan effective June 1, 2016.
On January 31, 2018, the Board of Directors declared a dividend of $0.04 per share for the first quarter of 2018. The dividend is payable on March 15, 2018 to shareholders of record as of March 1, 2018.
It is the present intent of the Board of Directors to continue paying quarterly dividends going forward. However, FNCB’s ability to declare and pay future dividends is dependent upon earnings, financial position, appropriate restrictions under applicable laws, legal and regulatory restrictions and other factors relevant at the time FNCB’s Board of Directors considers any declaration of any dividends. For a further discussion of FNCB’s and the Bank’s dividend restrictions, refer to Note 14, “Regulatory Matters/Subsequent Events” in the notes to consolidated financial statements in this Annual Report on Form 10-K.
Equity Compensation Plans
For more information regarding FNCB’s equity compensation plans, see Part III, Item 12, “Security Ownership of Certain Beneficial Owners and Management and Related Stockholder Matters” in this Annual Report on Form 10-K.
Performance Graph
The following graph compares the cumulative total shareholder return (i.e. price change, reinvestment of cash dividends and stock dividends received) on FNCB’s common stock against the cumulative total return of the NASDAQ Stock Market (U.S. Companies) Index, the SNL Bank Index for banks with $1 billion to $5 billion in assets, the KBW NASDAQ Regional Banking Index, and the SNL Bank NASDAQ Index. For the year ended December 31, 2017, FNCB elected to include the SNL Bank Index for banks with $1 billion to $5 billion in assets to replace the previously referenced SNL Bank Index for banks with $500 million to $1 billion in assets, as FNCB has remained over $1 billion in total assets for each of the preceding three years. The SNL Bank Index for banks with $500 million to $1 billion continues to be represented on the graph below for comparison purposes for 2017. The stock performance graph assumes that $100 was invested on December 31, 2012. The graph further assumes the reinvestment of dividends into additional shares of the same class of equity securities at the frequency with which dividends are paid on such securities during the relevant fiscal year. The yearly points marked on the horizontal axis correspond to December 31 of that year. FNCB calculates each of the referenced indices in the same manner. All are market-capitalization-weighted indices, so companies judged by the market to be more important (i.e. more valuable) count for more in all indices.
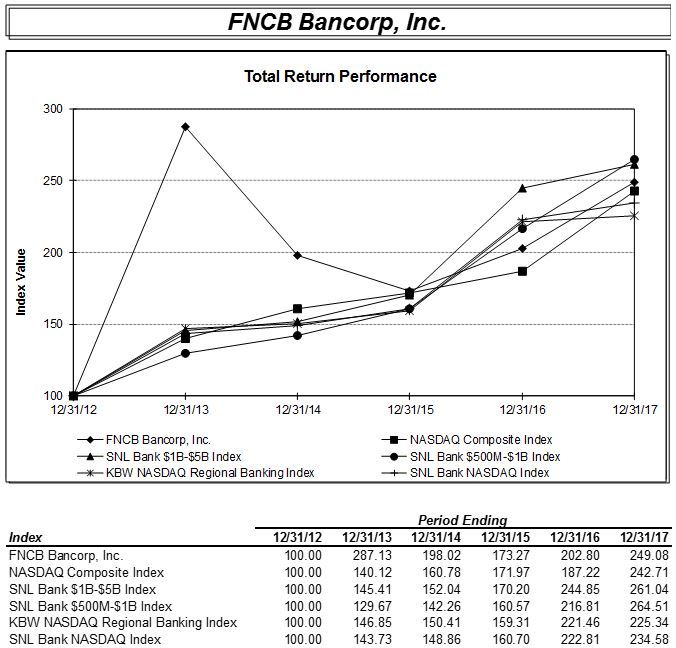
Recent Sales of Unregistered Securities
None.
Purchase of Equity Securities by the Issuer and Affiliated Purchasers
None.
|
Item 6. |
Selected Financial Data |
The selected consolidated financial and other data and management’s discussion and analysis of financial condition and results of operations set forth below and in Item 7 hereof is derived in part from, and should be read in conjunction with, FNCB’s consolidated financial statements and notes thereto contained elsewhere herein. Certain reclassifications have been made to prior years’ consolidated financial statements to conform to the current year’s presentation. Those reclassifications did not impact net income.
|
For the Years Ended December 31, |
||||||||||||||||||||
|
(dollars in thousands, except per share data) |
2017 |
2016 |
2015 |
2014 |
2013 |
|||||||||||||||
|
Balance Sheet Data: |
||||||||||||||||||||
|
Total assets |
$ | 1,162,305 | $ | 1,195,599 | $ | 1,090,618 | $ | 970,029 | $ | 1,003,808 | ||||||||||
|
Securities, available-for-sale |
290,387 | 276,015 | 257,042 | 219,989 | 204,867 | |||||||||||||||
|
Securities, held-to-maturity |
- | - | - | - | 2,308 | |||||||||||||||
|
Net loans |
761,609 | 722,860 | 721,926 | 657,747 | 628,880 | |||||||||||||||
|
Total deposits |
1,002,448 | 1,015,139 | 821,546 | 795,336 | 884,698 | |||||||||||||||
|
Borrowed funds |
60,278 | 78,847 | 160,112 | 96,504 | 62,433 | |||||||||||||||
|
Shareholders' equity |
89,191 | 90,371 | 86,178 | 51,398 | 33,578 | |||||||||||||||
|
Income Statement Data: |
||||||||||||||||||||
|
Interest income |
$ | 37,848 | $ | 34,748 | $ | 32,201 | $ | 32,673 | $ | 32,953 | ||||||||||
|
Interest expense |
4,800 | 4,197 | 4,801 | 6,147 | 7,176 | |||||||||||||||
|
Net interest income before provision (credit) for loan and lease losses |
33,048 | 30,551 | 27,400 | 26,526 | 25,777 | |||||||||||||||
|
Provision (credit) for loan and lease losses |
769 | 1,153 | (1,345 | ) | (5,869 | ) | (6,270 | ) | ||||||||||||
|
Non-interest income |
7,225 | 6,203 | 7,800 | 14,920 | 9,283 | |||||||||||||||
|
Non-interest expense |
28,069 | 27,545 | 28,464 | 33,569 | 34,948 | |||||||||||||||
|
Income before income taxes |
11,435 | 8,056 | 8,081 | 13,746 | 6,382 | |||||||||||||||
|
Income tax expense (benefit) |
11,288 | 1,747 | (27,759 | ) | 326 | - | ||||||||||||||
|
Net income |
147 | 6,309 | 35,840 | 13,420 | 6,382 | |||||||||||||||
|
Earnings per share, basic and diluted |
0.01 | 0.38 | 2.17 | 0.81 | 0.39 | |||||||||||||||
|
Capital and Related Ratios: |
||||||||||||||||||||
|
Cash dividends declared per share |
$ | 0.13 | $ | 0.09 | $ | - | $ | - | $ | - | ||||||||||
|
Book value per share |
5.32 | 5.43 | 5.22 | 3.12 | 2.04 | |||||||||||||||
|
Tier I leverage ratio |
7.74 | % | 7.53 | % | 7.27 | % | 6.05 | % | 4.71 | % | ||||||||||
|
Total risk-based capital to risk-adjusted assets |
12.08 | % | 12.06 | % | 11.79 | % | 13.67 | % | 11.58 | % | ||||||||||
|
Average equity to average total assets (1) |
8.36 | % | 8.42 | % | 5.64 | % | 4.66 | % | 3.60 | % | ||||||||||
|
Tangible equity to tangible assets |
7.67 | % | 7.56 | % | 7.89 | % | 5.27 | % | 3.30 | % | ||||||||||
|
Selected Performance Ratios: |
||||||||||||||||||||
|
Return on average assets (1) |
0.01 | % | 0.57 | % | 3.57 | % | 1.38 | % | 0.67 | % | ||||||||||
|
Return on average equity (1) |
0.15 | % | 6.82 | % | 63.24 | % | 29.50 | % | 18.65 | % | ||||||||||
|
Net interest margin (2) |
3.23 | % | 3.13 | % | 2.99 | % | 3.08 | % | 3.21 | % | ||||||||||
|
Noninterest income/operating income (2) |
15.79 | % | 14.88 | % | 18.73 | % | 30.30 | % | 20.79 | % | ||||||||||
|
Asset Quality Ratios: |
||||||||||||||||||||
|
Allowance for loan and lease losses/total loans |
1.17 | % | 1.15 | % | 1.20 | % | 1.72 | % | 2.18 | % | ||||||||||
|
Nonperforming loans/total loans |
0.34 | % | 0.31 | % | 0.52 | % | 0.82 | % | 0.99 | % | ||||||||||
|
Allowance for loan and lease losses/nonperforming loans |
350.43 | % | 376.86 | % | 232.05 | % | 208.62 | % | 219.87 | % | ||||||||||
|
Net charge-offs/average loans |
0.02 | % | 0.21 | % | 0.20 | % | (0.51 | %) | (0.28 | %) | ||||||||||
|
Loan loss provision/net charge-offs |
499.35 | % | 75.66 | % | *** | *** | *** | |||||||||||||
*** Ratio is not meaningful for 2015, 2014 and 2013.
(1) Average balances were calculated using average daily balances. Average balances for loans include non-accrual loans.
(2) Tax-equivalent adjustments were calculated using the prevailing statutory rate of 34.0 percent.
|
Item 7. |
Management’s Discussion and Analysis of Financial Condition and Results of Operations |
Management’s discussion and analysis (“MD&A”) represents an overview of the financial condition and results of operations of FNCB and should be read in conjunction with our consolidated financial statements and notes thereto included in Item 8 and Risk Factors detailed in Item 1A of Part I to this Annual Report on Form 10-K.
FNCB is in the business of providing customary retail and commercial banking services to individuals, businesses and local governments and municipalities through its wholly-owned subsidiary, FNCB Bank’s 18 full-service branch offices within its primary market area, Northeastern Pennsylvania, and a LPO based in Allentown, Lehigh County, Pennsylvania.
FORWARD-LOOKING STATEMENTS
FNCB may from time to time make written or oral “forward-looking statements,” including statements contained in our filings with the SEC, in reports to shareholders, and in our other communications, which are made in good faith by us pursuant to the “safe harbor” provisions of the Private Securities Litigation Reform Act of 1995.
These forward-looking statements include statements with respect to FNCB’s beliefs, plans, objectives, goals, expectations, anticipations, estimates and intentions, that are subject to significant risks and uncertainties, and are subject to change based on various factors (some of which are beyond our control). The words “may,” “could,” “should,” “would,” “believe,” “anticipate,” “estimate,” “expect,” “intend,” “plan” and similar expressions are intended to identify forward-looking statements. The following factors, among others, could cause FNCB’s financial performance to differ materially from the plans, objectives, expectations, estimates and intentions expressed in such forward-looking statements: the strength of the United States economy in general and the strength of the local economies in our markets; the effects of, and changes in trade, monetary, corporate tax and fiscal policies and laws, including interest rate policies of the Board of Governors of the Federal Reserve System; inflation, interest rate, market and monetary fluctuations; the timely development of and acceptance of new products and services; the ability of FNCB to compete with other institutions for business; the composition and concentrations of FNCB’s lending risk and the adequacy of our reserves to manage those risks; the valuation of FNCB’s investment securities; the ability of FNCB to pay dividends or repurchase common shares; the ability of FNCB to retain key personnel; the impact of any pending or threatened litigation against FNCB; the marketability of shares of FNCB stock and fluctuations in the value of FNCB’s share price; the effectiveness of FNCB’s system of internal controls; the ability of FNCB to attract additional capital investment; the impact of changes in financial services’ laws and regulations (including laws concerning capital adequacy, taxes, banking, securities and insurance); the impact of technological changes and security risks upon our information technology systems; changes in consumer spending and saving habits; the nature, extent, and timing of governmental actions and reforms, and the success of FNCB at managing the risks involved in the foregoing and other risks and uncertainties, including those detailed in FNCB’s filings with the SEC.
FNCB cautions that the foregoing list of important factors is not all inclusive. Readers are also cautioned not to place undue reliance on any forward-looking statements, which reflect management’s analysis only as of the date of this report, even if subsequently made available by FNCB on its website or otherwise. FNCB does not undertake to update any forward-looking statement, whether written or oral, that may be made from time to time by or on behalf of FNCB to reflect events or circumstances occurring after the date of this report.
CRITICAL ACCOUNTING POLICIES
In preparing the consolidated financial statements, management has made estimates, judgments and assumptions that affect the reported amounts of assets and liabilities as of the date of the consolidated statements of condition and results of operations for the periods indicated. Actual results could differ significantly from those estimates.
FNCB’s accounting policies are fundamental to understanding management’s discussion and analysis of its financial condition and results of operations. Management has identified the policies on the determination of the allowance for loan and lease losses (“ALLL”), securities’ valuation and impairment evaluation, the valuation of other real estate owned (“OREO”) and income taxes to be critical, as management is required to make subjective and/or complex judgments about matters that are inherently uncertain and could be subject to revision as new information becomes available.
The judgments used by management in applying the critical accounting policies discussed below may be affected by changes and/or deterioration in the economic environment, which may impact future financial results. Specifically, subsequent evaluations of the loan portfolio, in light of the factors then prevailing, may result in significant changes in the ALLL in future periods, and the inability to collect on outstanding loans could result in increased loan losses. In addition, the valuation of certain securities in FNCB’s investment portfolio could be negatively impacted by illiquidity or dislocation in marketplaces resulting in significantly depressed market prices thus leading to impairment losses.
Allowance for Loan and Lease Losses
Management evaluates the credit quality of FNCB’s loan portfolio on an ongoing basis, and performs a formal review of the adequacy of the ALLL on a quarterly basis. The ALLL is established through a provision for loan losses charged to earnings and is maintained at a level management considers adequate to absorb estimated probable losses inherent in the loan portfolio as of the evaluation date. Loans, or portions of loans, determined by management to be uncollectible are charged off against the ALLL, while recoveries of amounts previously charged off are credited to the ALLL.
Determining the amount of the ALLL is considered a critical accounting estimate because it requires significant judgment and the use of estimates related to the amount and timing of expected future cash flows on impaired loans, estimated losses on pools of homogeneous loans based on historical loss experience, qualitative factors, and consideration of current economic trends and conditions, all of which may be susceptible to significant change. Banking regulators, as an integral part of their examination of FNCB, also review the ALLL, and may require, based on their judgments about information available to them at the time of their examination, that certain loan balances be charged off or require that adjustments be made to the ALLL. Additionally, the ALLL is determined, in part, by the composition and size of the loan portfolio.
The ALLL consists of two components, a specific component and a general component. The specific component relates to loans that are classified as impaired. For such loans, an allowance is established when the discounted cash flows, collateral value or observable market price of the impaired loan is lower than the carrying value of that loan. The general component covers all other loans and is based on historical loss experience adjusted by qualitative factors. The general reserve component of the ALLL is based on pools of unimpaired loans segregated by loan segment and risk rating categories of “Pass”, “Special Mention” or “Substandard and Accruing.” Historical loss factors and various qualitative factors are applied based on the risk profile in each risk rating category to determine the appropriate reserve related to those loans. Substandard loans on nonaccrual status above the $100 thousand loan relationship threshold and all loans considered troubled debt restructurings (“TDRs”) are classified as impaired.
See Note 2, “Summary of Significant Accounting Policies” and Note 5, “Loans” of the notes to consolidated financial statements included in Item 8, “Financial Statements and Supplementary Data” to this Annual Report on Form 10-K for additional information about the ALLL.
Securities Valuation and Evaluation for Impairment
Management utilizes various inputs to determine the fair value of its investment portfolio. To the extent they exist, unadjusted quoted market prices in active markets (Level 1) or quoted prices for similar assets or models using inputs that are observable, either directly or indirectly (Level 2) are utilized to determine the fair value of each investment in the portfolio. In the absence of observable inputs or if markets are illiquid, valuation techniques are used to determine fair value of any investments that require inputs that are both unobservable and significant to the fair value measurement (Level 3). For Level 3 inputs, valuation techniques are based on various assumptions, including, but not limited to, cash flows, discount rates, adjustments for nonperformance and liquidity, and liquidation values. A significant degree of judgment is involved in valuing investments using Level 3 inputs. The use of different assumptions could have a positive or negative effect on FNCB’s financial condition or results of operations. See Note 4, “Securities” and Note 15, “Fair Value Measurements” of the notes to consolidated financial statements included in Item 8, “Financial Statements and Supplementary Data” to this Annual Report on Form 10-K for additional information about FNCB’s securities valuation techniques.
On a quarterly basis, management evaluates individual investment securities in an unrealized loss position for other than temporary impairment (“OTTI”). The analysis of OTTI requires the use of various assumptions, including but not limited to, the length of time an investment’s fair value is less than book value, the severity of the investment’s decline, any credit deterioration of the issuer, whether management intends to sell the security, and whether it is more-likely-than-not that FNCB will be required to sell the security prior to recovery of its amortized cost basis. Debt investment securities deemed to have OTTI are written down by the impairment related to the estimated credit loss, and the non-credit related impairment loss is recognized in other comprehensive income. FNCB did not recognize any OTTI charges on investment securities for years ended December 31, 2017, 2016 and 2015 within the consolidated statements of income.
See Note 2, “Summary of Significant Accounting Policies” and Note 4, “Securities” of the notes to consolidated financial statements included in Item 8, “Financial Statements and Supplementary Data” to this Annual Report on Form 10-K for additional information about valuation of securities.
Other Real Estate Owned
OREO consists of property acquired by foreclosure, abandonment or conveyance of deed in-lieu of foreclosure of a loan, and bank premises that are no longer used for operation or for future expansion. OREO is held for sale and is initially recorded at fair value less costs to sell at the date of acquisition or transfer, which establishes a new cost basis. Upon acquisition of the property through foreclosure or deed-in-lieu of foreclosure, any adjustment to fair value less estimated selling costs is recorded to the ALLL. The determination is made on an individual asset basis. Bank premises no longer used for operations or future expansion are transferred to OREO at fair value less estimated selling costs with any related write-down included in non-interest expense. Subsequent to acquisition, valuations are periodically performed and the assets are carried at the lower of cost or fair value less cost to sell. Fair value is determined through external appraisals, current letters of intent, broker price opinions or executed agreements of sale, unless management determines that conditions exist that warrant an adjustment to the value. Costs relating to the development and improvement of the OREO properties may be capitalized; holding period costs and any subsequent changes to the valuation allowance are charged to expense as incurred.
Income Taxes
The objectives of accounting for income taxes are to recognize the amount of taxes payable or refundable for the current year and deferred tax liabilities and assets for the future tax consequences of events that have been recognized in an entity’s financial statements or tax returns. Judgment is required in assessing the future tax consequences of events that have been recognized in FNCB’s consolidated financial statements or tax returns. Fluctuations in the actual outcome of these future tax consequences could impact our consolidated financial condition or results of operations.
FNCB records an income tax provision or benefit based on the amount of tax, including alternative minimum tax, currently payable or receivable and the change in deferred tax assets and liabilities. Deferred income taxes reflect the net tax effects of temporary differences between the carrying amounts of assets and liabilities for financial and tax reporting purposes. Management conducts quarterly assessments of all available positive and negative evidence to determine the amount of deferred tax assets that will more likely than not be realized. FNCB establishes a valuation allowance for deferred tax assets and records a charge to income if management determines, based on available evidence at the time the determination is made, that it is more likely than not that some portion or all of the deferred tax assets will not be realized. In evaluating the need for a valuation allowance, management considers past operating results, estimates of future taxable income based on approved business plans, future capital requirements and ongoing tax planning strategies. This evaluation process involves significant management judgment about assumptions that are subject to change from period to period depending on the related circumstances. The recognition of deferred tax assets requires management to make significant assumptions and judgments about future earnings, the periods in which items will impact taxable income, future corporate tax rates, and the application of inherently complex tax laws. The use of different estimates can result in changes in the amounts of deferred tax items recognized, which may result in equity and earnings volatility because such changes are reported in current period earnings. On December 31, 2010, management established a valuation allowance equal to 100 percent of FNCB’s net deferred tax asset, excluding deferred tax assets and liabilities related to unrealized holding gains and losses on available-for-sale securities, and maintained such an allowance through December 31, 2014. As part of its evaluation conducted as of December 31, 2015, management reviewed all the positive and negative evidence available at that time and concluded that significant positive evidence outweighed any negative evidence and the valuation allowance previously established for FNCB’s deferred tax assets should be reversed, except for the amount established for charitable contribution carryovers. Management’s subsequent evaluation as of December 31, 2016 concluded that the previously established valuation allowance for charitable contributions should be reversed, and as such, FNCB did not have any valuation allowances for deferred tax assets as of December 31, 2016. Similarly, management’s evaluation as of December 31, 2017 concluded that no valuation allowance was necessary for net deferred tax assets as of December 31, 2017.
On December 22, 2017, President Trump signed into law “H.R.1.,” formally known as the Tax Cuts and Jobs Act (the “Tax Act”), which among other things, reduces the federal maximum corporate income tax rate from 35.0% to 21.0% effective January 1, 2018. In accordance with generally accepted accounting principles (“GAAP”), the enactment of this new tax legislation required FNCB to revalue its deferred tax assets at the new corporate statutory rate of 21.0% as of December 31, 2017. The revaluation of FNCB’s deferred tax assets, net of deferred tax liabilities, resulted in a reduction in the value of its net deferred tax assets of $8.0 million in the fourth quarter of 2017, with a corresponding increase in the income tax provision. This revaluation adjustment had an impact of ($0.48) per diluted share, and tangible book value of ($0.48) per share based on weighted-average diluted shares for the year ended December 31, 2017 and shares outstanding at December 31, 2017, respectively. There was no significant impact to FNCB’s regulatory capital ratios or liquidity resulting from the revaluation.
In connection with determining the income tax provision or benefit, management considers maintaining liabilities for uncertain tax positions and tax strategies that it believes contain an element of uncertainty. Periodically, management evaluates each of FNCB’s tax positions and strategies to determine whether a liability for uncertain tax benefits is required. As of December 31, 2017 and 2016, management determined that FNCB did not have any uncertain tax positions or tax strategies and that no liability was required to be recorded.
See Note 2, “Summary of Significant Accounting Policies” and Note 10, “Income Taxes” of the notes to consolidated financial statements included in Item 8, “Financial Statements and Supplementary Data” to this Annual Report on Form 10-K for additional information about the accounting for income taxes.
New Authoritative Accounting Guidance and Accounting Guidance to be Adopted in Future Periods
For information regarding new authoritative accounting guidance adopted by FNCB during the year ended December 31, 2017 and accounting guidance that FNCB will adopt in future periods, see Note 2, “Summary of Significant Accounting Policies” of the notes to consolidated financial statements included in Item 8, “Financial Statements and Supplementary Data” to this Annual Report on Form 10-K.
EXECUTIVE OVERVIEW
The following overview should be read in conjunction with this MD&A in its entirety.
Results of Operations
The enactment of the Tax Act significantly impacted FNCB’s results of operations for the year ended December 31, 2017. As required by GAAP, upon enactment FNCB revalued its net deferred tax assets at 21.0%, the new corporate statutory tax rate which became effective January 1, 2018. The revaluation resulted in additional, non-recurring, non-cash income tax expense of $8.0 million in the fourth quarter of 2017, which caused a decrease in basic and diluted earnings-per-share of ($0.48) in 2017, and tangible book value of ($0.48) per share based on weighted-average basic and diluted shares outstanding for the year ended December 31, 2017 and actual shares outstanding at December 31, 2017, respectively.
FNCB reported earnings in 2017 of $0.1 million, or $0.01 per diluted common share, a decrease of $6.2 million, or 97.7%, compared to $6.3 million, or $0.38 per diluted common share, in 2016. The decrease in 2017 net income compared to 2016 was primarily attributable to the increase in income tax expense, offset in part by strong improvement in net interest income and non-interest income, coupled with a reduction in the provision for loan and lease losses. Net interest income improved $2.5 million, or 8.2%, to $33.0 million in 2017 from $30.5 million in 2016. The improvement resulted primarily from solid growth in interest earning assets, higher yields on taxable loans and investments and reduced borrowing costs. Non-interest income increased $1.0 million, or 16.5%, to $7.2 million in 2017 from $6.2 million in 2016. An increase in net gains on the sale of securities of $0.6 million, coupled with increases in other income and net gains on the sales of loans guaranteed by the Small Business Administration (“SBA”), other real estate owned and other repossessed assets, were the primary factors driving the increase in non-interest income comparing 2017 and 2016. The provision for loan and lease losses, driven by a reduction in net charge-offs, decreased $0.4 million, or 33.3%, to $0.8 million in 2017 from $1.2 million in 2016. These positive factors were offset by a $0.5 million, or 1.9%, increase in non-interest expenses to $28.0 million in 2017 from $27.5 in 2016.
Return on average assets and return on average shareholders’ equity equaled 0.01% and 0.15%, respectively, in 2017, compared to 0.57% and 6.82%, respectively, in 2016. For the three months ended December 31, 2017, return on average assets and return on average shareholders’ equity were (2.09%) and (24.98%), respectively, compared to 0.55% and 6.43%, respectively, for the same three months of 2016. FNCB paid dividends to holders of common stock of $0.13 per share and $0.09 per share for the years ended December 31, 2017 and 2016, respectively.
Balance Sheet Profile
Total assets decreased $33.3 million, or 2.8%, to $1.162 billion at December 31, 2017 from $1.196 billion at December 31, 2016. The decrease in total assets was led by a reduction in cash and cash equivalents, as cash was used to fund growth in interest-earning assets and pay down borrowings, coupled with a reduction in interest-bearing deposits. Loans, net of net deferred loan costs and unearned income, grew $39.3 million, or 5.4%, to $770.6 million at December 31, 2017 from $731.3 million at December 31, 2016. In addition, securities available for sale increased $14.4 million, or 5.2%, to $290.4 million at December 31, 2017 from $276.0 million at the end of 2016. Total deposits decreased $12.7 million, or 1.3%, to $1.002 billion at December 31, 2017 from $1.015 billion at December 31, 2016. The decrease in total deposits reflected cyclical deposit trends of public funds, coupled with the anticipated exit of short-term funds in the first quarter of 2017 that were received at the end of 2016 related to the sale of a municipal utility. Borrowed funds declined $18.6 million, including $13.6 million in advances from the Federal Home Loan Bank of Pittsburgh and $5.0 million in subordinated debentures.
Total shareholders’ equity declined $1.2 million, or 1.3%, to $89.2 million at December 31, 2017 from $90.4 million at the end of 2016, which resulted primarily from dividends declared and paid of $2.2 million and an increase in accumulated other comprehensive loss of $0.2 million. Partially offsetting these reductions in 2017 were common shares issued through the dividend reinvestment and optional cash purchase plans of $0.4 million, stock-based compensation of $0.3 million, and net income of $0.1 million.
At December 31, 2017, FNCB’s total risk-based capital ratio and the Tier 1 leverage ratio were 12.08% and 7.74%, respectively. The respective ratios for the Bank at December 31, 2017 were 12.49% and 8.24%. The ratios for both FNCB and the Bank exceeded the 10.00% and 5.00% required to be well capitalized under the prompt corrective action provisions of the Basel III capital framework for U.S. banking organizations.
Management’s Focus in 2017
In 2017, management focused on developing strategies aimed at increasing net interest income through commercial and retail loan growth initiatives, improving retail delivery systems, strengthening corporate governance and enhancing the marketability and liquidity of FNCB’s common stock.
In line with its commercial and retail loan growth initiatives, on January 20, 2017, FNCB opened a LPO in Allentown, Lehigh County, Pennsylvania, and began offering its retail and commercial lending products in this new market area. Additionally, in order to facilitate loan growth initiatives, on March 7, 2017, FNCB opened a lending center immediately adjacent to its main office in Dunmore, Lackawanna County, Pennsylvania, which houses part of its commercial and retail lending units.
As part of its responsibilities, management regularly evaluates FNCB’s delivery system and facilities including analyzing each office’s operating efficiency, location, foot traffic, structure and design. As a result of these evaluations, on May 1, 2017, FNCB announced that the Bank will implement a comprehensive branch network improvement program that will focus on strengthening, better positioning and expanding its market coverage by developing new state-of-the-art customer facilities, as well as relocating and consolidating select locations. In accordance with the branch network improvement program, on June 30, 2017, FNCB consolidated its branch office located at 1127 Texas Palmyra Highway, Honesdale, Wayne County, Pennsylvania with its branch located at 1001 Main Street, Honesdale, Pennsylvania.
As part of this network improvement program, FNCB also announced its intention to relocate three branches located in Luzerne County, Pennsylvania to a new location. The three branches that will be relocated are: 1) a branch located at 734 San Souci Parkway, Hanover Township, Pennsylvania; 2) a branch located at 27 North River Street, Plains, Pennsylvania; and 3) a branch located at 3 Old Boston Road, Pittston, Pennsylvania. These three branches will be relocated into a brand-new facility to be built in the Richland 315 development located at 1150 Route 315, Wilkes-Barre (Plains Township), Luzerne County, Pennsylvania. FNCB currently leases the three branches, as well as the aforementioned Honesdale branch, that was consolidated, and will lease the future Luzerne County facility. FNCB did not incur any significant disposal costs on the Wayne County consolidation and does not expect to incur any significant disposal costs on Luzerne County branch consolidation. The construction of the new Luzerne County facility began in the fourth quarter of 2017 and is expected to be completed in the second quarter of 2018, at which time the Luzerne County branch consolidation will occur. The three existing branches will continue to operate as full-service branches until that time.
Following continued analysis of FNCB’s locations and facilities, on September 27, 2017, the Board of Directors approved the purchase of the Bank’s corporate center located at 200 South Blakely Street, Dunmore, Pennsylvania, for $2.15 million. FNCB has been leasing this property since 1994. The purchase of the corporate center, which was funded by cash generated by operations, was finalized on January 15, 2018. The purchase of this building is anticipated to reduce occupancy expenses in excess of $100,000 annually going forward.
The network improvement program also calls for the continued evaluation of FNCB’s delivery systems. In the second quarter of 2017, FNCB commenced a project to upgrade its entire automated teller machine network. In addition, in 2018 management plans to evaluate the development of new state-of-the-art facilities on properties already owned by FNCB located in Dunmore, Lackawanna County, Pennsylvania and in Taylor Borough, Lackawanna County, Pennsylvania. Also in 2018, management plans to implement a bank-wide customer relationship management (“CRM”) system to improve customer service, enhance market share and create cross-sales opportunities between retail and commercial business units.
With respect to strengthening FNCB’s corporate governance structure, on September 27, 2017, the board of directors of FNCB and the Bank elected three new independent members to the boards of both entities. The addition of the new members extends both boards to 12 directors. On the same date, the board of directors also approved the formation of a community advisory board to consist of members from Northeastern Pennsylvania and the Lehigh Valley who will advise, support and serve as liaisons for the Bank in developing and furthering relationships with businesses and the community in our market area. The initial advisory board members were appointed on January 31, 2018.
In addition to expanding the board and approving the formation of an advisory board, on September 27, 2017, the Board of Directors approved revisions to its Corporate Governance Guidelines to set a retirement age for FNCB’s and the Bank’s directors and executive officers. According to the approved revisions, no person can be nominated to serve as a Director after he or she has passed his or her 80th birthday. In the event that a director turns the age of 80 during his or her term as a Director, he or she may serve the remaining time of his or her term until his or her successor is duly elected and qualified or until the earlier of his or her death, resignation or removal. In addition, FNCB’s and the Bank’s executive officers are now subject to a mandatory retirement age of 75. Such retirement age may be waived for the President and Chief Executive Officer for strategic planning purposes in the sole discretion of the Board of Directors of FNCB and the Bank
Aligned with enhancing the marketability and liquidity of FNCB’s stock on December 29, 2017, FNCB filed a listing application with The Nasdaq Stock Market LLC (“Nasdaq”). FNCB subsequently received approval from Nasdaq on February 26, 2018 to list its common shares for trading on The Nasdaq Capital Market®. FNCB’s shares of common stock began trading on Nasdaq effective with the market opening on Monday, March 5, 2018.
SUMMARY OF FINANCIAL PERFORMANCE
Net Interest Income
2017 compared to 2016
Net interest income is the difference between (i) interest income, interest and fees on interest-earning assets, and (ii) interest expense, interest paid on deposits and borrowed funds. Net interest income represents the largest component of FNCB’s operating income and, as such, is the primary determinant of profitability. Net interest income is impacted by variations in the volume, rate and composition of earning assets and interest-bearing liabilities, changes in general market rates and the level of non-performing assets. Interest income is shown on a fully tax-equivalent basis and is calculated by adjusting tax-free interest using FNCB’s historic federal marginal tax rate of 34.0% to equate the income to that of taxable interest.
Since the first 25-basis point increase in the federal funds target rate on December 16, 2015, the Federal Open Market Committee (“FOMC”) increased the target rate a total of 100 basis points in four 25-basis point actions on December 14, 2016, March 15, 2017, June 14, 2017 and December 13, 2017. These actions resulted in corresponding increases in the national prime rate. At December 31, 2017, the national prime rate was 4.50%, 75 basis points higher than 3.75% at December 31, 2016. FNCB experienced an increase in loan yields throughout 2017 as compared to 2016, as variable- and adjustable-rate loans repriced upward. The increase in market interest rates has also led to notable increases in funding costs.
Tax-equivalent net interest income improved in 2017, increasing $2.5 million to $33.8 million compared to $31.3 million in 2016. The 7.9% increase in tax-equivalent net interest income primarily reflected a $3.1 million increase in tax-equivalent interest income, partially offset by a $0.6 million increase in interest expense. Tax-equivalent interest income in 2017 was positively impacted by increases in the yields earned across all interest-earning asset categories, coupled with significant growth in average earning assets. The increase in interest expense largely reflected an increase in the rates paid on interest-bearing demand deposits, partially mitigated by a reduction in the interest expense paid on borrowings attributable to lower average balances of borrowed funds.
FNCB’s tax-equivalent interest margin improved 10 basis points to 3.23% in 2017 from 3.13% in 2016. Tax-equivalent net interest margin, a key measurement used in the banking industry to measure income from earning assets relative to the cost to fund those assets, is calculated by dividing tax-equivalent net interest income by average interest-earning assets. Rate spread, the difference between the average yield on interest-earning assets shown on a fully tax-equivalent basis and the average cost of interest-bearing liabilities, was 3.13% for the year ended December 31, 2017, an increase of 8 basis points compared to 3.05% for the year ended December 31, 2016.
Tax-equivalent interest income increased $3.1 million, or 8.6%, to $38.6 million in 2017 from $35.5 million in 2016. The growth in tax-equivalent interest income reflected a 13-basis point improvement in the tax-equivalent yield on average earning assets to 3.68% in 2017 from 3.55% in 2016. Comparing 2017 and 2016, the tax-equivalent yield earned on the loan portfolio increased 19 basis points, the tax-equivalent yield earned on the investment portfolio increased 16 basis points, and the tax-equivalent yield earned on interest-bearing deposits in other banks increased 54 basis points, contributing $1.4 million, $0.5 million, and $0.1 million, respectively, to the improvement in tax-equivalent interest income. Accompanying the improvement in the tax-equivalent yields was strong growth in interest-earning assets, which increased $45.7 million, or 4.6%. Average loans increased $9.7 million, or 1.3%, to $732.3 million in 2017 from $725.6 million, resulting in an increase to tax-equivalent interest income of $0.3 million. In addition, average investments increased $25.2 million, or 9.5%, to $290.0 million in 2017 from $264.8 million in 2016, resulting in an increase to tax-equivalent interest income of $0.7 million, and average interest-bearing deposits in other banks increased $10.8 million, or 152.1%, to $17.9 million in 2017 from $7.1 million in 2016, resulting in an increase to tax-equivalent interest income of $0.1 million.
Increases in interest rates also drove an increase in interest expense of $0.6 million, or 14.4%, to $4.8 million in 2017 from $4.2 million in 2016. Rates paid on interest-bearing deposits increased 7 basis points to 0.44% in 2017 from 0.37% in 2016. The increase in deposit rates was concentrated in interest-bearing demand deposits which increased 14 basis points to 0.36% in 2017 as compared to 0.22% in 2016, resulting in an increase to interest expense of $0.7 million. The rate paid on savings deposits increased to a lesser extent, increasing by only 3 basis points to 0.13% in 2017 from 0.10% in 2016, while the rate paid on time deposits remained steady at 0.80% for both 2017 and 2016. Similarly, the rate paid on borrowed funds increased 34 basis points to 1.76% in 2017 from 1.42% in 2016, contributing $0.3 million to the overall increase in interest expense.
Average interest-bearing liabilities increased $30.8 million, or 3.6%, to $875.1 million in 2017 from $844.3 million in 2016. Despite the increase, changes in the volumes of interest-bearing liabilities resulted in a $0.4 million decrease in interest expense, as a reduction in higher-costing average borrowed funds more than offset an increase in lower-costing average interest-bearing deposits. Specifically, a $30.4 million, or 29.5%, decrease in average borrowed funds to $72.8 million in 2017 from $103.2 million in 2016 resulted in a reduction to interest expense of $0.5 million. The decline in interest expense paid on borrowed funds was partially offset by an $88 thousand increase in interest expense resulting from a $61.2 million, or 8.3%, increase in average interest-bearing deposits to $802.3 million in 2017 from $741.1 million in 2016. An increase in municipal deposits was the primary factor contributing to an increase of $67.1 million, or 15.4%, in average interest-bearing demand deposits to $502.2 million in 2017 from $435.1 million in 2016, which led to an increase in interest expense of $168 thousand. In addition, average savings deposits increased $4.8 million, or 4.9%, to $102.0 million in 2017 from $97.2 million in 2016, which caused a corresponding increase in interest expense of $5 thousand. Partially offsetting these increases was a reduction in the average balance of time deposits of $10.6 million, or 5.1%, to $198.1 million in 2017 from $208.8 million in 2016, which resulted in an $85 thousand reduction in interest expense.
2016 compared to 2015
Tax-equivalent net interest income in 2016 improved $3.2 million to $31.3 million compared to $28.1 million in 2015. The 11.2% increase in tax-equivalent net interest income primarily reflected a $2.5 million increase in tax-equivalent interest income, coupled with a $0.6 million reduction in interest expense. Tax-equivalent interest income was positively impacted by an increase in average earning assets, coupled with a slight increase in the yield earned on loans and investment securities. The decrease in interest expense largely reflected a reduction in funding costs due to the realization of a full year of the modification of the interest rate of the subordinated debentures from 9.0% to 4.5% during 2015. In addition, FNCB’s cost of funds was also favorably impacted by a reduction in the rate paid on other time deposits, as higher-costing certificates of deposit matured and were reinvested at lower rates. FNCB’s tax-equivalent interest margin improved 14 basis points to 3.13% in 2016 from 2.99% in 2015. Similarly, FNCB’s rate spread increased 16 basis points to 3.05% for the year ended December 31, 2016 from 2.89% for the year ended December 31, 2015.
Tax-equivalent interest income increased $2.5 million, or 7.7%, to $35.5 million in 2016 from $32.9 million in 2015. The growth in tax-equivalent interest income comparing 2016 and 2015 reflected strong growth in interest-earning assets, as average loans increased $33.2 million, or 4.8%, resulting in an increase to tax-equivalent interest income of $1.3 million, and average investments increased $36.3 million or 15.9%, resulting in an increase to tax-equivalent interest income of $0.9 million. Accompanying the growth in average earning assets was a 5-basis point improvement in the tax-equivalent yield on average earning assets to 3.55% in 2016 from 3.50% in 2015. Specifically, the tax-equivalent yield earned on the loan portfolio increased 2 basis points, while the tax-equivalent yield earned on the investment portfolio increased 8 basis points, contributing $0.1 million and $0.2 million, respectively, to the improvement in tax-equivalent interest income. The tax-equivalent yield earned on interest-bearing deposits in other banks improved 22 basis points, reflecting the 25-basis point increase in the federal funds target rate on December 16, 2015. However, the increase was more than offset by a decrease in the average balance of interest-bearing deposits in other banks of $11.0 million, or 60.8%.
Interest expense decreased $0.6 million, or 12.6%, to $4.2 million in 2016 from $4.8 million in 2015. The decrease in interest expense was driven almost entirely by an 11-basis point decrease in the cost of funds to 0.50% in 2016 compared to 0.61% in 2015, which resulted in a $0.6 million corresponding decrease in interest expense due to changes in rates. Specifically, the modification of the interest rate on the Notes from 9.0% to 4.5% effective July 1, 2015 had the greatest impact on interest expense, as it was the leading factor driving a 59-basis point decrease in the cost of borrowed funds to 1.42% in 2016 from 2.01% in 2015. The decrease in borrowing costs resulted in a $0.6 million reduction in interest expense. Partially offsetting the decrease in borrowing costs was a slight increase in FNCB’s cost of interest-bearing demand deposits and savings deposits of 3 basis points each, which were more than offset by a 5-basis point decrease in the cost of time deposits. Changes in the average deposit rates resulted in a $66 thousand increase in interest expense.
Average interest-bearing liabilities increased $61.8 million, or 7.9%, to $844.3 million in 2016 from $782.5 million in 2015. Despite the increase, changes in the volumes of interest-bearing liabilities resulted in a $66 thousand decrease in interest expense, as a reduction in higher-costing average borrowed funds more than offset an increase in lower-costing average interest-bearing deposits. Specifically, a $4.7 million, or 4.4%, decrease in average borrowed funds, resulted in a reduction to interest expense of $99 thousand. The decline in interest expense paid on borrowed funds was partially offset by a $33 thousand increase in interest expenses resulting from a $66.5 million increase in average interest-bearing deposits. An increase in municipal deposits was the primary factor contributing to an increase of $76.7 million, or 21.4%, in average interest-bearing demand deposits, which led to an increase in interest expense of $158 thousand. Partially offsetting this increase was a decrease in the average balance of time deposits of $15.6 million, or 7.0%, which resulted in a $129 thousand reduction in interest expense.
Non-accrual loans
The interest income that would have been earned on non-accrual and restructured loans outstanding at December 31, 2017, 2016 and 2015 in accordance with their original terms approximated $157 thousand, $221 thousand, and $406 thousand, respectively. Interest income on impaired loans of $392 thousand, $202 thousand, and $258 thousand was recognized based on payments received in 2017, 2016 and 2015, respectively.
The following table presents the components of net interest income for each of the three years ended December 31, 2017, 2016 and 2015:
Summary of Net Interest Income
|
Year ended December 31, |
Year ended December 31, |
Year ended December 31, |
||||||||||||||||||||||||||||||||||
|
2017 |
2016 |
2015 |
||||||||||||||||||||||||||||||||||
|
Average |
Yield/ |
Average |
Yield/ |
Average |
Yield/ |
|||||||||||||||||||||||||||||||
|
(dollars in thousands) |
Balance |
Interest |
Cost |
Balance |
Interest |
Cost |
Balance |
Interest |
Cost |
|||||||||||||||||||||||||||
|
ASSETS |
||||||||||||||||||||||||||||||||||||
|
Earning assets (2)(3) |
||||||||||||||||||||||||||||||||||||
|
Loans-taxable (4) |
$ | 697,377 | $ | 28,519 | 4.09 | % | $ | 682,289 | $ | 26,623 | 3.90 | % | $ | 653,303 | $ | 25,256 | 3.87 | % | ||||||||||||||||||
|
Loans-tax free (4) |
40,903 | 1,973 | 4.82 | % | 46,305 | 2,076 | 4.48 | % | 42,135 | 1,988 | 4.72 | % | ||||||||||||||||||||||||
|
Total loans (1)(2) |
738,280 | 30,492 | 4.13 | % | 728,594 | 28,699 | 3.94 | % | 695,438 | 27,244 | 3.92 | % | ||||||||||||||||||||||||
|
Securities-taxable |
288,823 | 7,798 | 2.70 | % | 263,624 | 6,676 | 2.53 | % | 226,122 | 5,478 | 2.42 | % | ||||||||||||||||||||||||
|
Securities-tax free |
1,212 | 74 | 6.11 | % | 1,192 | 70 | 5.87 | % | 2,419 | 165 | 6.82 | % | ||||||||||||||||||||||||
|
Total securities (1)(5) |
290,035 | 7,872 | 2.71 | % | 264,816 | 6,746 | 2.55 | % | 228,541 | 5,643 | 2.47 | % | ||||||||||||||||||||||||
|
Interest-bearing deposits in other banks |
17,874 | 180 | 1.01 | % | 7,089 | 33 | 0.47 | % | 18,076 | 46 | 0.25 | % | ||||||||||||||||||||||||
|
Total earning assets |
1,046,189 | 38,544 | 3.68 | % | 1,000,499 | 35,478 | 3.55 | % | 942,055 | 32,933 | 3.50 | % | ||||||||||||||||||||||||
|
Non-earning assets |
99,993 | 107,061 | 73,587 | |||||||||||||||||||||||||||||||||
|
Allowance for loan and lease losses |
(8,626 | ) | (8,684 | ) | (10,729 | ) | ||||||||||||||||||||||||||||||
|
Total assets |
$ | 1,137,556 | $ | 1,098,876 | $ | 1,004,913 | ||||||||||||||||||||||||||||||
|
LIABILITIES AND SHAREHOLDERS' EQUITY |
||||||||||||||||||||||||||||||||||||
|
Interest-bearing liabilities |
||||||||||||||||||||||||||||||||||||
|
Interest-bearing demand deposits |
$ | 502,170 | 1,800 | 0.36 | % | $ | 435,092 | 973 | 0.22 | % | $ | 358,442 | 672 | 0.19 | % | |||||||||||||||||||||
|
Savings deposits |
101,952 | 136 | 0.13 | % | 97,188 | 94 | 0.10 | % | 91,603 | 60 | 0.07 | % | ||||||||||||||||||||||||
|
Time deposits |
198,143 | 1,585 | 0.80 | % | 208,783 | 1,663 | 0.80 | % | 224,538 | 1,899 | 0.85 | % | ||||||||||||||||||||||||
|
Total interest-bearing deposits |
802,265 | 3,521 | 0.44 | % | 741,063 | 2,730 | 0.37 | % | 674,583 | 2,631 | 0.39 | % | ||||||||||||||||||||||||
|
Borrowed funds and other interest-bearing liabilities |
72,795 | 1,279 | 1.76 | % | 103,239 | 1,467 | 1.42 | % | 107,965 | 2,170 | 2.01 | % | ||||||||||||||||||||||||
|
Total interest-bearing liabilities |
875,060 | 4,800 | 0.55 | % | 844,302 | 4,197 | 0.50 | % | 782,548 | 4,801 | 0.61 | % | ||||||||||||||||||||||||
|
Demand deposits |
156,670 | 148,746 | 139,945 | |||||||||||||||||||||||||||||||||
|
Other liabilities |
10,770 | 13,263 | 25,744 | |||||||||||||||||||||||||||||||||
|
Shareholders' equity |
95,056 | 92,565 | 56,676 | |||||||||||||||||||||||||||||||||
|
Total liabilities and shareholders' equity |
$ | 1,137,556 | $ | 1,098,876 | $ | 1,004,913 | ||||||||||||||||||||||||||||||
|
Net interest income/interest rate apread (6) |
33,744 | 3.13 | % | 31,281 | 3.05 | % | 28,132 | 2.89 | % | |||||||||||||||||||||||||||
|
Tax equivalent adjustment |
(696 | ) | (730 | ) | (732 | ) | ||||||||||||||||||||||||||||||
|
Net interest income as reported |
$ | 33,048 | $ | 30,551 | $ | 27,400 | ||||||||||||||||||||||||||||||
|
Net interest margin (7) |
3.23 | % | 3.13 | % | 2.99 | % | ||||||||||||||||||||||||||||||
|
(1) |
Interest income is presented on a tax-equivalent basis using a 34% rate. |
|
|
(2) |
Loans are stated net of unearned income. |
|
|
(3) |
Non-accrual loans are included in loans within earning assets. |
|
|
(4) |
Loan fees included in interest income are not significant. |
|
|
(5) |
The yields for securities that are classified as available for sale are based on the average historical amortized cost. |
|
|
(6) |
Interest rate spread represents the difference between the average yield on interest earning assets and the cost of average interest bearing liabilities and is presented on a tax equivalent basis. |
|
|
(7) |
Net interest income as a percentage of total average interest earning assets. |
The most significant impact on net income between periods is derived from the interaction of changes in the volume and rates earned or paid on interest-earning assets and interest-bearing liabilities. The volume of earning assets, specifically loans and investments, compared to the volume of interest-bearing liabilities represented by deposits and borrowings, combined with the spread, produces the changes in net interest income between periods. Components of interest income and interest expense are presented on a tax-equivalent basis using FNCB’s historic statutory federal income tax rate of 34%.
The following table summarizes the effect that changes in volumes of earning assets and interest-bearing liabilities and the interest rates earned and paid on these assets and liabilities have on net interest income. The net change or mix component attributable to the combined impact of rate and volume changes has been allocated proportionately to the change due to volume and the change due to rate.
Rate Volume Analysis
|
For the Year Ended December 31, |
For the Year Ended December 31, |
|||||||||||||||||||||||
|
2017 vs. 2016 |
2016 vs. 2015 |
|||||||||||||||||||||||
|
Increase (Decrease) Due to Change in |
Increase (Decrease) Due to Change in |
|||||||||||||||||||||||
|
(in thousands) |
Volume |
Rate |
Total |
Volume |
Rate |
Total |
||||||||||||||||||
|
Interest income: |
||||||||||||||||||||||||
|
Loans - taxable |
$ | 598 | $ | 1,298 | $ | 1,896 | $ | 1,129 | $ | 238 | $ | 1,367 | ||||||||||||
|
Loans - tax free |
(253 | ) | 150 | (103 | ) | 190 | (102 | ) | 88 | |||||||||||||||
|
Total loans |
345 | 1,448 | 1,793 | 1,319 | 136 | 1,455 | ||||||||||||||||||
|
Securities - taxable |
663 | 459 | 1,122 | 941 | 257 | 1,198 | ||||||||||||||||||
|
Securities - tax free |
1 | 3 | 4 | (74 | ) | (21 | ) | (95 | ) | |||||||||||||||
|
Total securities |
664 | 462 | 1,126 | 867 | 236 | 1,103 | ||||||||||||||||||
|
Interest-bearing deposits in other banks |
83 | 64 | 147 | (38 | ) | 25 | (13 | ) | ||||||||||||||||
|
Total interest income |
1,092 | 1,974 | 3,066 | 2,148 | 397 | 2,545 | ||||||||||||||||||
|
Interest expense: |
||||||||||||||||||||||||
|
Interest-bearing demand deposits |
168 | 659 | 827 | 158 | 143 | 301 | ||||||||||||||||||
|
Savings deposits |
5 | 37 | 42 | 4 | 30 | 34 | ||||||||||||||||||
|
Time deposits |
(85 | ) | 7 | (78 | ) | (129 | ) | (107 | ) | (236 | ) | |||||||||||||
|
Total interest-bearing deposits |
88 | 703 | 791 | 33 | 66 | 99 | ||||||||||||||||||
|
Borrowed funds and other interest-bearing liabilities |
(489 | ) | 301 | (188 | ) | (99 | ) | (604 | ) | (703 | ) | |||||||||||||
|
Total interest expense |
(401 | ) | 1,004 | 603 | (66 | ) | (538 | ) | (604 | ) | ||||||||||||||
|
Net Interest Income |
$ | 1,493 | $ | 970 | $ | 2,463 | $ | 2,214 | $ | 935 | $ | 3,149 | ||||||||||||
Provision for Loan and Lease Losses
Management closely monitors the loan portfolio and the adequacy of the ALLL by considering the underlying financial performance of the borrower, collateral values and associated credit risks. Future material adjustments may be necessary to the provision for loan and lease losses and the ALLL if economic conditions or loan performance differ substantially from the assumptions management considered in its evaluation of the ALLL. The provision for loan and lease losses is an expense charged against net interest income to provide for probable losses attributable to uncollectible loans and is based on management’s analysis of the adequacy of the ALLL. A credit to loan and lease losses reflects the reversal of amounts previously charged to the ALLL.
2017 compared to 2016
FNCB recorded a provision for loan and lease losses of $0.8 million for the year ended December 31, 2017, a decrease of $0.4 million compared to $1.2 million for the year ended December 31, 2016. The decrease in the provision for loan and lease losses was due largely to a $1.3 million reduction in net charge-offs to $0.2 million in 2017, compared to $1.5 million in 2016. Net charge-offs within the commercial and industrial and commercial real estate segments decreased significantly, declining $0.5 million and $0.3 million, respectively, comparing 2017 and 2016. Partially offsetting the decrease in the provision for loan and lease losses due to the reduction in net loans charged-off was an increase in the provision for loan and lease losses in 2017 to reflect the $39.3 million growth in total loans as compared to 2016.
2016 compared to 2015
For the year ended December 31, 2016, FNCB recorded a provision for loan and lease losses of $1.2 million compared to a credit for loan and lease losses of $1.3 million for the year ended December 31, 2015. The provision for loan and lease losses in 2016 was due largely to net charge-offs of $1.5 million during 2016. Net charge-offs within the commercial real estate, commercial and industrial and consumer segments were the most elevated, totaling $0.4 million, $0.6 million, and $0.4 million, respectively. The credit for loan and lease losses in 2015 was due largely to improvement in FNCB’s historical loss and certain qualitative factors and levels of classified loans. The balance of loans classified as “Substandard” decreased $8.9 million, or 34.7%, to $16.8 million at December 31, 2015 from $25.7 million at the end of 2014.
Non-Interest Income
The following table presents the components of non-interest income for the years ended December 31, 2017, 2016 and 2015:
Components of Non-Interest Income
|
Year Ended December 31, |
||||||||||||
|
(in thousands) |
2017 |
2016 |
2015 |
|||||||||
|
Deposit service charges |
$ | 2,903 | $ | 2,892 | $ | 2,960 | ||||||
|
Net gain on the sale of securities |
1,597 | 960 | 2,296 | |||||||||
|
Net gain on the sale of mortgage loans held for sale |
304 | 340 | 292 | |||||||||
|
Net gain on the sale of SBA guaranteed loans |
79 | 51 | - | |||||||||
|
Net gain on the sale of other repossessed assets |
47 | - | - | |||||||||
|
Net gain on the sale of other real estate owned |
79 | 49 | 162 | |||||||||
|
Loan-related fees |
384 | 439 | 442 | |||||||||
|
Income from bank-owned life insurance |
527 | 552 | 564 | |||||||||
|
Other |
1,305 | 920 | 1,084 | |||||||||
|
Total non-interest income |
$ | 7,225 | $ | 6,203 | $ | 7,800 | ||||||
2017 compared to 2016
For the year ended December 31, 2017, non-interest income increased $1.0 million, or 16.5%, to $7.2 million compared to $6.2 million for the same period of 2016. The increase was due largely to an increase in net gains on the sale of securities of $0.6 million, or 66.4%, coupled with an increase in other income of $0.4 million, or 41.9%. Net gains on the sale of other real estate owned were $79 thousand in 2017, an increase of $30 thousand, or 61.2%, compared to $49 thousand in 2016. Also affecting non-interest income was an increase in net gains on the sale of guaranteed principal balances of loans guaranteed by the SBA of $28 thousand, or 54.9%, to $79 thousand in 2017 from $51 thousand in 2016. FNCB also recorded a net gain on the sale of other repossessed assets of $47 thousand during 2017.
Partially offsetting these increases in non-interest income were decreases of $55 thousand, or 12.5%, in loan-related fees, concentrated in reduced letter of credit fees, coupled with decreases of $36 thousand in net gains on the sale of mortgage loans and $25 thousand, or 4.5%, in income from bank-owned life insurance policies. Service charges on deposit accounts remained steady, increasing by $11 thousand, or 0.4%, in 2017 as compared to 2016.
2015 compared to 2014
Non-interest income decreased $1.6 million, or 20.5%, to $6.2 million in 2016 compared to $7.8 million in 2015. Non-interest income levels in 2016 were largely impacted by a reduction in net gains on the sale of securities of $1.3 million, or 58.2%, from $2.3 million during 2015 to $1.0 million during 2016. In addition, FNCB received non-recurring income from legal settlements of $0.2 million in 2015.
Also affecting non-interest income were reductions in deposit services charges and net gains on the sale of OREO, which were partially mitigated by increases in gains from loan sales. Deposit service charges also declined slightly by $68 thousand, or 2.3%. The sale of OREO properties generated net gains of $49 thousand in 2016, a decrease of $113 thousand, or 69.8%, from $162 thousand in 2015. Partially offsetting these decreases was an increase in net gains on the sale of mortgage loans held for sale of $48 thousand, or 16.4%, from $292 thousand in 2015 to $340 thousand in 2016. Also during 2016, FNCB realized a net gain of $51 thousand on the sale of the guaranteed principal balance of three loans that were guaranteed by the SBA. Loan-related fees, income from bank-owned life insurance policies, and other income remained steady comparing 2016 and 2015.
Non-Interest Expense
The following table presents the major components of non-interest expense for the years ended December 31, 2017, 2016 and 2015:
Components of Non-Interest Expense
|
Year Ended December 31, |
||||||||||||
|
(in thousands) |
2017 |
2016 |
2015 |
|||||||||
|
Salaries and employee benefits |
$ | 14,161 | $ | 14,320 | $ | 13,810 | ||||||
|
Occupancy expense |
2,105 | 1,777 | 2,284 | |||||||||
|
Equipment expense |
1,815 | 1,732 | 1,657 | |||||||||
|
Advertising expense |
623 | 554 | 483 | |||||||||
|
Data processing expense |
2,023 | 1,997 | 1,976 | |||||||||
|
Regulatory assessments |
686 | 729 | 950 | |||||||||
|
Bank shares tax |
800 | 836 | 705 | |||||||||
|
Expense of other real estate |
488 | 409 | 400 | |||||||||
|
Legal expense |
128 | 362 | 437 | |||||||||
|
Professional fees |
956 | 961 | 1,014 | |||||||||
|
Insurance expense |
519 | 516 | 659 | |||||||||
|
Legal settlements |
- | - | 777 | |||||||||
|
Other losses |
503 | 277 | 281 | |||||||||
|
Other operating expenses |
3,262 | 3,075 | 3,031 | |||||||||
|
Total non-interest expense |
$ | 28,069 | $ | 27,545 | $ | 28,464 | ||||||
2017 compared to 2016
Non-interest expense totaled $28.0 million in 2017, an increase of $0.5 million, or 1.9%, from $27.5 million in 2016. The increase resulted primarily from increases in occupancy expense, other losses, other operating expenses, equipment expense, expenses of other real estate owned, and advertising expenses. Partially mitigating these increases were decreases in legal expense, salaries and employee benefits, regulatory expenses, and bank shares tax.
Long-term facilities planning contributed to an increase in occupancy expense of $0.3 million, or 18.5%, to $2.1 million in 2017 as compared to $1.8 million in 2016. Specifically, FNCB accelerated depreciation of certain leasehold improvements resulting from future facilities planning which contributed $0.2 million to the increase in occupancy expense over 2016, coupled with increases in rent expense and snow removal costs.
Other operating expenses increased $0.2 million, or 6.1%, to $3.3 million in 2017 from $3.1 million in 2016. The increase was attributable to increases in loan-related expenses related to a “No Closing Costs Loan Sale” for its real estate secured retail lending products launched during 2017, coupled with an increase in telecommunication expenses related to ongoing network improvement projects and an increase in the required provision for off-balance sheet commitments. FNCB also experienced an increase in other losses during 2017, due largely to losses resulting from external fraud activities and software abandonment costs. Also contributing to the increase in non-interest expenses for 2017 were increases in equipment expense of $83 thousand, expenses of other real estate owned of $79 thousand, and advertising expenses of $69 thousand.
Legal expenses continued to decline throughout 2017 as outstanding litigation was resolved. Legal expenses declined $0.2 million, or 64.6%, from $0.3 million in 2016 to $0.1 million in 2017.
FNCB experienced a decrease in salaries and employee benefit costs of $0.1 million, or 1.1%, to $14.2 million in 2017 as compared to $14.3 million in 2016. The decline was concentrated in salaries expense, resulting from a reduction in the number of full-time equivalent employees to 230 at December 31, 2017 from 236 at December 31, 2016, coupled with a reduction in severance-related costs. These decreases were partially offset by increases in health insurance premiums.
During 2016, FNCB converted from a national charter to a state charter, which contributed to the $43 thousand, or 5.9%, reduction in regulatory expenses for 2017 as compared to 2016. FNCB also experienced a reduction in bank shares tax expense of $36 thousand, or 4.3%, comparing 2017 and 2016.
2016 compared to 2015
Non-interest expense totaled $27.5 million in 2016, a decrease of $0.9 million, or 3.2%, from $28.5 million in 2015. The decrease resulted primarily from reductions in legal settlements, occupancy expense, regulatory assessments, insurance expenses, legal expenses, and professional fees. Partially offsetting these decreases were increases in salaries and employee benefits, bank shares tax, equipment expense and advertising expenses.
Long-term facilities planning and the relocation of one of the Bank’s corporate offices contributed to occupancy expense reductions of $0.5 million, or 22.2%, to $1.8 million in 2016 as compared to $2.3 million in 2015. Specifically, FNCB experienced decreases in rent expense, maintenance expenses, snow removal costs, and utilities expenses.
Included in regulatory assessments expense are FDIC insurance assessments and semi-annual assessments imposed by the Bank’s primary regulator. FNCB experienced a $0.2 million, or 23.3%, reduction in regulatory assessment expense comparing 2016 and 2015. The decrease largely reflected the Bank’s conversion from a national charter to a state charter and continued improvement in the Bank’s risk profile. The change in charter resulted in a reduction in semi-annual regulatory assessments of $150 thousand, or 53.4%, to $131 thousand in 2016 from $281 thousand in 2015. In addition, during the second quarter of 2015, FNCB was notified by the FDIC that the Bank’s risk category for FDIC assessments had improved to a risk category I, the lowest risk category from risk category II based upon the results of its most recent regulatory examination. The change in risk categories became effective on February 1, 2015, and as a result the Bank’s initial base assessment rate for deposit insurance decreased from 0.14 basis points to a range of 0.05 – 0.09 basis points. FNCB was able to realize a full-year of lower assessment rates in 2016, which resulted in a $71 thousand, or 10.6%, reduction in FDIC assessments comparing 2016 and 2015. Moreover, FNCB’s improved risk profile contributed to a $0.1 million, or 21.7%, reduction in insurance expenses.
Legal and professional fee expenses continued to decline throughout 2016 as outstanding litigation was resolved and reliance on outside consulting firms declined. Legal expenses declined $75 thousand, or 17.2%, as compared to 2015, while professional fees decreased $53 thousand, or 5.2%.
FNCB experienced an increase in salaries and employee benefit costs of $0.5 million, or 3.7%, to $14.3 million in 2016 as compared to $13.8 million in 2015. Despite a reduction in the number of full-time equivalent employees to 236 at December 31, 2016 from 250 at December 31, 2015, total salary expense increased $245 thousand, or 2.1%, due to annual merit increases and severance-related costs. Payroll taxes and employee benefits increased $265 thousand, or 11.1%, which largely reflected higher health insurance premiums and an increase in the state unemployment compensation rate.
On October 1, 2015, the Bank executed a Supplemental Executive Retirement Plan (“SERP”) for a select group of management or highly compensated employees within the meaning of Sections 201(2), 301(a)(3) and 401(a)(1) of The Employee Retirement Income Security Act of 1974. The general provisions of the SERP provide for annual year-end contributions, performance contingent contributions and discretionary contributions. The SERP contributions are unfunded for federal tax purposes and constitute an unsecured promise by the Bank to pay benefits in the future. Participants in the SERP shall have the status of general unsecured creditors of the Bank. Annual accrued unfunded contributions included in salaries and employee benefits expense totaled $147 thousand in 2016 and $130 thousand in 2015.
Provision for Income Taxes
FNCB recorded income tax expense of $11.3 million in 2017, an increase of $9.5 million as compared to $1.7 million in 2016. The increase in income tax expense was due largely to a non-recurring revaluation of deferred tax assets, net of deferred tax liabilities, resulting in a decrease in net deferred tax assets and a corresponding increase in income tax expense of $8.0 million during 2017, coupled with higher pre-tax income. The revaluation of FNCB’s deferred tax assets resulted from the reduction in the statutory corporate tax rate from a maximum federal corporate income tax rate of 35% to 21%, under the Tax Act signed into law on December 22, 2017. FNCB recorded a benefit for income taxes during 2015 of $27.8 million, resulting primarily from the reversal of a previously established valuation allowance for deferred tax assets.
Management evaluates the carrying amount of its deferred tax assets on a quarterly basis, or more frequently, if necessary, in accordance with guidance set forth in ASC Topic 740 “Income Taxes,” and applies the criteria in the guidance to determine whether it is more likely than not that some portion, or all, of the deferred tax asset will not be realized within its life cycle, based on the weight of available evidence. If management determines based on available evidence, both positive and negative, that it is more likely than not that some portion or all of the deferred tax asset will not be realized in future periods, a valuation allowance is calculated and recorded. These determinations are inherently subjective and depend upon management’s estimates and judgments used in their evaluation of both positive and negative evidence.
In evaluating available evidence, management considers, among other factors, historical financial performance, expectation of future earnings, the ability to carry back losses to recoup taxes previously paid, length of statutory carry forward periods, experience with operating loss and tax credit carry forwards not expiring unused, tax planning strategies and timing of reversals of temporary differences. In assessing the need for a valuation allowance, management carefully weighs both positive and negative evidence currently available.
Management performed an evaluation of FNCB’s deferred tax assets at December 31, 2015 and determined that based on its consistent methodology the negative evidence that had been present at December 31, 2014 no longer existed, and accordingly reversed the previously established valuation allowance for deferred tax assets. Similarly, based on management’s evaluation of available positive and negative evidence at December 31, 2017 and 2016, a valuation allowance for deferred tax assets was not required.
The decrease in the federal corporate income tax rate to 21.0% under the Tax Act became effective on January 1, 2018. Management anticipates a reduction in income tax expense going forward due to the reduction in corporate tax rate.
FINANCIAL CONDITION
Total assets were $1.162 billion at December 31, 2017, a decrease of $33.3 million, or 2.8%, from $1.196 billion, at December 31, 2016. The decrease in total assets was led by a reduction in cash and cash equivalents, as cash was used to fund growth in interest-earning assets and pay down borrowings, coupled with a reduction in interest-bearing deposits. Loans, net of net deferred loan costs and unearned income grew $39.4 million, or 5.4%, to $770.6 million at December 31, 2017 from $731.3 million at December 31, 2016. Securities available for sale increased $14.4 million, or 5.2%, to $290.4 million at December 31, 2017 from $276.0 million at the end of 2016. Total deposits decreased $12.7 million, or 1.3%, and borrowed funds declined $18.6 million, or 23.6%.
Total shareholders’ equity declined $1.2 million, or 1.3%, to $89.2 million at December 31, 2017 from $90.4 million at the end of 2016. Dividends declared during 2017 of $2.2 million and an increase in the accumulated other comprehensive loss of $0.2 million were the primary factors causing the reduction in capital, partially offset by common shares issued through the dividend reinvestment and optional cash purchase plans of $0.4 million, stock-based compensation of $0.3 million and net income of $0.1 million. Dividends declared and paid by FNCB on its common stock totaled $0.13 per share during 2017. On January 31, 2018, the Board of Directors of FNCB declared a $0.04 per share dividend for the first quarter of 2018, payable on March 15, 2018 to shareholders of record on March 1, 2018.
Securities
FNCB’s investment securities portfolio provides a source of liquidity needed to meet expected loan demand and interest income to increase profitability. Additionally, the investment securities portfolio is used to meet pledging requirements to secure public deposits and for other purposes. Management classifies investment securities as either held-to-maturity or available-for-sale at the time of purchase based on its intent. Held-to-maturity securities are carried at amortized cost, while available-for-sale securities are carried at fair value, with unrealized holding gains and losses reported as a component of shareholders’ equity in accumulated other comprehensive income (loss), net of tax. At December 31, 2017 and 2016, all securities were classified as available-for-sale. Decisions to purchase or sell investment securities are based upon management’s current assessment of long- and short-term economic and financial conditions, including the interest rate environment and asset/liability management, liquidity and tax-planning strategies. Securities with limited marketability and/or restrictions, such as FHLB of Pittsburgh stock, are carried at cost.
At December 31, 2017, FNCB’s investment portfolio was comprised principally of fixed-rate securities issued by U.S. government or U.S. government-sponsored agencies, which include mortgage-backed securities and residential and commercial CMOs, fixed-rate taxable obligations of state and political subdivisions, and corporate debt securities. Except for U.S. government and government-sponsored agencies, there were no securities of any individual issuer that exceeded 10.0% of shareholders’ equity as of December 31, 2017.
Because of the predominantly fixed-rate nature of the portfolio, FNCB’s debt securities are inherently subject to interest rate risk, defined as the risk that an investment’s value will change due to a change in interest rates, in the spread between two rates and in the shape of the yield curve. A security’s value is usually affected inversely by changes in rates. U.S. Treasury rates fell to near-historical lows mid-2016 following the United Kingdom’s referendum to exit the European Union. During 2017, short-term U.S. Treasury rates rose steadily due to a more expansionary fiscal and monetary policy. However, spreads between short- and long-term rates narrowed causing the yield curve to flatten. The 2-year Treasury rate, which was 1.19% at December 31, 2016, rose 18 basis points to 1.38% at June 30, 2017 and then climbed 51 basis points to 1.89% at December 31, 2017. Conversely, the 10-year Treasury rate, which was 2.45% at December 31, 2016, fell 14 basis points to 2.31% at June 30, 2017 before rebounding 9 basis points to close 2017 5basis points lower than at close of 2016. The spread between the 2-year and 10-year U.S. Treasury rate compressed 75 basis points from 126 basis points at December 31, 2016 to 51 basis points at December 31, 2017. FNCB reported a net unrealized holding loss on its investment portfolio of $1.7 million, net of income taxes of $464 thousand, at December 31, 2017, compared to an unrealized holding loss of $1.6 million, net of income taxes of $0.8 million, at December 31, 2016. Any additional increases in interest rates could result in further depreciation in the fair value of FNCB’s securities portfolio and capital position.
The following table presents the carrying value of available-for-sale securities, which are carried at fair value at December 31, 2017, 2016 and 2015:
Composition of the Investment Portfolio
|
December 31, |
||||||||||||
|
(in thousands) |
2017 |
2016 |
2015 |
|||||||||
|
Available-for-sale |
||||||||||||
|
Obligations of U.S. government agencies |
$ | - | $ | 12,188 | $ | 44,043 | ||||||
|
Obligations of state and political subdivisions |
145,999 | 117,873 | 75,407 | |||||||||
|
U.S. government/government-sponsored agencies: |
||||||||||||
|
Collateralized mortgage obligations - residential |
35,657 | 18,084 | 22,269 | |||||||||
|
Collateralized mortgage obligations - commercial |
75,418 | 99,350 | 89,423 | |||||||||
|
Mortgage-backed securities |
22,311 | 20,576 | 18,098 | |||||||||
|
Corporate debt securities |
4,058 | 3,792 | 3,692 | |||||||||
|
Asset-backed securities |
3,086 | - | - | |||||||||
|
Negotiable certificates of deposit |
2,930 | 3,216 | 3,162 | |||||||||
|
Equity securities |
928 | 936 | 948 | |||||||||
|
Total available-for-sale securities |
$ | 290,387 | $ | 276,015 | $ | 257,042 | ||||||
Management monitors the investment portfolio regularly and adjusts the investment strategy to reflect changes in liquidity needs, asset/liability strategy and tax-planning requirements. FNCB currently has $40.5 million in net operating loss (“NOL”) carryovers, which it uses to offset any taxable income. Because of this tax position, there is no benefit from holding tax-exempt obligations of state and political subdivisions. Accordingly, management’s actions during recent periods with regard to managing the investment portfolio have reflected current tax-planning initiatives focused on generating sustained taxable income to be able to reduce NOL carryovers.
FNCB’s investment strategy involved selling lower-yielding securities of U.S. government and government-sponsored agencies and reinvesting the proceeds from the sales, as well as normal monthly cash flows from the portfolio, into higher-yielding taxable obligations of state and political subdivisions and multi-family mortgage-backed securities and CMOs of U.S. government/government-sponsored agencies. During 2017, management sold 38 available-for-sale securities with an aggregate amortized cost of $130.6 million and a weighted-average yield of 2.40%. Gross proceeds received totaled $132.2 million, with net gains of $1.6 million realized upon the sales and included in non-interest income.
Securities purchased during the year ended December 31, 2017 totaled $154.7 million, including $100.8 million in CMOs of U.S. government-sponsored agencies, $39.7 million in obligations of state and political subdivisions, $8.2 million in mortgage-backed securities of U.S. government-sponsored agencies, $4.0 million in asset-backed securities and $2.0 million in corporate debt securities. Securities purchased during 2017 had a weighted-average yield of 2.76%.
The following table presents the maturities of available-for-sale securities, based on carrying value at December 31, 2017, and the weighted average yields of such securities calculated on the basis of the amortized cost and effective yields weighted for the scheduled maturity of each security. The yields on tax-exempt obligations of states and political subdivisions are presented on a tax-equivalent basis using FNCB’s historic effective tax rate of 34.0%. Because residential and commercial collateralized mortgage obligations, mortgage-backed securities and asset-backed securities are not due at a single maturity date, they are not included in the maturity categories in the following summary.
Maturity Distribution of the Investment Portfolio
|
December 31, 2017 |
||||||||||||||||||||||||||||
|
(dollars in thousands) |
Within One Year |
> 1 – 5 Years |
6 - 10 Years |
Over 10 Years |
Collateralized Mortgage Obligations, Mortgage-Backed and Asset-Backed Securities |
No Fixed Maturity |
Total |
|||||||||||||||||||||
|
Available-for-sale securities |
||||||||||||||||||||||||||||
|
Obligations of U.S. government agencies |
$ | - | $ | - | $ | - | $ | - | $ | - | $ | - | $ | - | ||||||||||||||
|
Yield |
||||||||||||||||||||||||||||
|
Obligations of state and political subdivisions |
- | 36,515 | 109,484 | - | - | - | 145,999 | |||||||||||||||||||||
|
Yield |
2.49 | % | 2.84 | % | 2.75 | % | ||||||||||||||||||||||
|
U.S. government/government-sponsored agencies: |
||||||||||||||||||||||||||||
|
Collateralized mortgage obligations - residential |
- | - | - | - | 35,657 | - | 35,657 | |||||||||||||||||||||
|
Yield |
2.77 | % | 2.77 | % | ||||||||||||||||||||||||
|
Collateralized mortgage obligations - commercial |
- | - | - | - | 75,418 | - | 75,418 | |||||||||||||||||||||
|
Yield |
2.50 | % | 2.50 | % | ||||||||||||||||||||||||
|
Mortgage-backed securities |
- | - | - | - | 22,311 | - | 22,311 | |||||||||||||||||||||
|
Yield |
2.88 | % | 2.88 | % | ||||||||||||||||||||||||
|
Corporate debt securities |
- | - | 4,058 | - | - | - | 4,058 | |||||||||||||||||||||
|
Yield |
6.63 | % | 6.63 | % | ||||||||||||||||||||||||
|
Asset-backed securities |
- | - | - | - | 3,086 | - | 3,086 | |||||||||||||||||||||
|
Yield |
2.46 | % | 2.46 | % | ||||||||||||||||||||||||
|
Negotiable certificates of deposit |
496 | 2,434 | - | - | - | - | 2,930 | |||||||||||||||||||||
|
Yield |
1.85 | % | 2.14 | % | 2.09 | % | ||||||||||||||||||||||
|
Equity securities |
- | - | - | - | - | 928 | 928 | |||||||||||||||||||||
|
Yield |
3.45 | % | 3.45 | % | ||||||||||||||||||||||||
|
Total available-for-sale securities |
$ | 496 | $ | 38,949 | $ | 113,542 | $ | - | $ | 136,472 | $ | 928 | $ | 290,387 | ||||||||||||||
|
Weighted average yield |
1.85 | % | 2.47 | % | 2.97 | % | 0.00 | % | 2.63 | % | 3.45 | % | 2.75 | % | ||||||||||||||
OTTI Evaluation
There was no OTTI recognized during the years ended December 31, 2017, 2016 and 2015. For additional information regarding management’s evaluation of securities for OTTI, see Note 4, “Securities” of the notes to consolidated financial statements included in Item 8, “Financial Statement and Supplementary Data” of this Annual Report on Form 10-K.
Investment in the Federal Home Loan Bank (“FHLB”) of Pittsburgh stock has limited marketability and is carried at cost. FNCB’s investment in FHLB of Pittsburgh stock totaled $2.8 million and $3.3 million at December 31, 2017 and 2016, respectively. Management noted no indicators of impairment for the FHLB of Pittsburgh stock at December 31, 2017. During the year ended December 31, 2016, the Bank canceled its membership with the Federal Reserve Bank of Philadelphia (“FRB”), and as a result, the entire balance of FRB stock totaling $1.3 million was redeemed.
During the year ended December 31, 2017, FNCB purchased $1.7 million, representing a 4.9% interest, in the common stock of a privately-held bank holding company. The common stock was purchased as part of a private placement pursuant to an exemption from the registration requirements of the Securities Act of 1933 for offerings not involving any public offering. The common stock is not currently traded on any established market, and is not expected to be traded in the near future on any securities exchange or established over-the-counter market. FNCB has elected to account for this transaction as an investment in an equity security without a readily determinable fair value. An equity security without a readily determinable fair value shall be written down to its fair value if a qualitative assessment indicates that the investment is impaired and the fair value of the investment is less than its carrying value. The $1.7 million investment is included in other assets in the consolidated statements of financial condition at December 31, 2017. Management engaged an independent third party to provide a valuation of this investment as of December 31, 2017. The valuation indicated that the investment was not impaired and accordingly, no adjustment for impairment was required at December 31, 2017.
Loans
FNCB experienced strong demand for its lending products throughout 2017, resulting in an increase in total loans of $39.3 million, or 5.4%, to $768.1 million at December 31, 2017 from $728.8 million at December 31, 2016. The most prominent growth was exhibited in the residential and commercial real estate lending categories, which together contributed $31.7 million to the growth in total loans. During 2017, FNCB launched a “No Closing Cost Loan Sale” for its real estate secured lending products, which waived closing costs for qualified loan customers. In addition, the introduction of the Loan Production Office in Allentown, Lehigh County, coupled with adding experienced commercial lenders to the lending team, contributed to the strong growth in commercial real estate loans. FNCB also experienced growth in the consumer lending segment, resulting from the purchase of a pool of refinanced student loans and continued growth in its indirect lending portfolio.
Historically, commercial lending activities have represented a significant portion of FNCB’s loan portfolio. Commercial lending includes commercial and industrial loans, commercial real estate loans and construction, land acquisition and development loans, and represented 56.4% and 56.6% of total loans at December 31, 2017 and December 31, 2016, respectively.
From a collateral standpoint, a majority of FNCB’s loan portfolio consists of loans secured by real estate. Real estate secured loans, which include commercial real estate, construction, land acquisition and development, residential real estate loans and home equity lines of credit (“HELOCs”), increased by $32.1 million, or 7.5%, to $462.2 million at December 31, 2017 from $430.1 million at December 31, 2016. The increase was attributable to both the residential and commercial real estate segments, as detailed above. Real estate secured loans represented 60.2% of total gross loans at December 31, 2017 and 59.0% at December 31, 2016.
Commercial and industrial loans decreased $0.7 million, or 0.4%, during the year to $150.1 million at December 31, 2017 from $150.8 million at December 31, 2016. Commercial and industrial loans consist primarily of equipment loans, working capital financing, revolving lines of credit and loans secured by cash and marketable securities. Loans secured by commercial real estate increased $18.0 million, or 7.4%, to $261.8 million at December 31, 2017 from $243.8 million at December 31, 2016. Commercial real estate loans include long-term commercial mortgage financing and are primarily secured by first or second lien mortgages. Additionally, construction, land acquisition and development loans increased $2.6 million, or 14.3%, during the year to $21.0 million at December 31, 2017, from $18.4 million at December 31, 2016.
Residential real estate loans totaled $158.0 million at December 31, 2017, an increase of $13.7 million, or 9.5%, from $144.3 million at December 31, 2016. The No Closing Costs Loan Sale, mentioned above, contributed to the increase, specifically concentrated in home equity term loans, which grew $8.1 million, or 40.1%, to $28.4 million at December 31, 2017 as compared to $20.3 million at December 31, 2016. The components of residential real estate loans include fixed-rate and variable-rate mortgage loans. HELOCs are not included in this category but are included in consumer loans. FNCB primarily underwrites fixed-rate purchase and refinance of residential mortgage loans for sale in the secondary market to reduce interest rate risk and provide funding for additional loans. Additionally, FNCB offers a “WOW” mortgage product, which is a non-saleable mortgage with maturity terms of 7.5 to 14.5 years, and offers customers an attractive fixed interest rate, low closing costs and a guaranteed 30-day close. “WOW’ mortgages increased $2.2 million, or 5.1%, to $44.7 million at December 31, 2017 from $42.5 million at December 31, 2016.
Consumer loans totaled $134.7 million at December 31, 2017, an increase of $6.9 million, or 5.3%, from $127.8 million at December 31, 2016. Indirect auto loans increased $4.9 million, or 4.8%, to $106.8 million at December 31, 2017 from $101.9 million at December 31, 2016. In addition, as previously mentioned FNCB purchased a pool of refinanced student loans of $5.0 million during 2017. This pool had an outstanding balance at December 31, 2017 of $3.8 million. FNCB does not provide servicing for the purchased pool of refinanced student loans. Loans to state and municipal governments decreased $1.2 million, or 2.7%, to $42.5 million at December 31, 2017 from $43.7 million at December 31, 2016.
The following table presents loans receivable, net by major category at December 31, for each of the last five years:
|
Loan Portfolio Detail |
||||||||||||||||||||
|
December 31, |
||||||||||||||||||||
|
(in thousands) |
2017 |
2016 |
2015 |
2014 |
2013 |
|||||||||||||||
|
Residential real estate |
$ | 158,020 | $ | 144,260 | $ | 130,696 | $ | 122,832 | $ | 114,925 | ||||||||||
|
Commercial real estate |
261,783 | 243,830 | 245,198 | 233,473 | 218,524 | |||||||||||||||
|
Construction, land acquisition and development |
20,981 | 18,357 | 30,843 | 18,835 | 24,382 | |||||||||||||||
|
Commercial and industrial |
150,103 | 150,758 | 146,826 | 131,057 | 126,021 | |||||||||||||||
|
Consumer |
134,653 | 127,844 | 128,533 | 122,092 | 118,645 | |||||||||||||||
|
State and political subdivisions |
42,529 | 43,709 | 46,056 | 40,205 | 39,875 | |||||||||||||||
|
Total loans, gross |
768,069 | 728,758 | 728,152 | 668,494 | 642,372 | |||||||||||||||
|
Unearned income |
(80 | ) | (48 | ) | (98 | ) | (98 | ) | (143 | ) | ||||||||||
|
Net deferred loan costs |
2,654 | 2,569 | 2,662 | 871 | 668 | |||||||||||||||
|
Allowance for loan and lease losses |
(9,034 | ) | (8,419 | ) | (8,790 | ) | (11,520 | ) | (14,017 | ) | ||||||||||
|
Loans, net |
$ | 761,609 | $ | 722,860 | $ | 721,926 | $ | 657,747 | $ | 628,880 | ||||||||||
The following table presents the maturity distribution and interest rate information of the loan portfolio by major category as of December 31, 2017:
Maturity Distribution of the Loan Portfolio
|
December 31, 2017 |
||||||||||||||||
|
(in thousands) |
Within One Year |
One to Five Years |
Over Five Years |
Total |
||||||||||||
|
Residential real estate |
$ | 1,068 | $ | 6,977 | $ | 149,975 | $ | 158,020 | ||||||||
|
Commercial real estate |
32,305 | 30,664 | 198,814 | 261,783 | ||||||||||||
|
Construction, land acquisition and development |
9,868 | 989 | 10,124 | 20,981 | ||||||||||||
|
Commercial and industrial |
83,970 | 46,232 | 19,901 | 150,103 | ||||||||||||
|
Consumer |
5,854 | 71,009 | 57,790 | 134,653 | ||||||||||||
|
State and political subdivisions |
239 | 13,218 | 29,072 | 42,529 | ||||||||||||
|
Total loans, gross |
$ | 133,304 | $ | 169,089 | $ | 465,676 | $ | 768,069 | ||||||||
|
Loans with predetermined interest rates |
$ | 20,397 | $ | 144,531 | $ | 193,137 | $ | 358,065 | ||||||||
|
Loans with floating rates |
112,907 | 24,558 | 272,539 | 410,004 | ||||||||||||
|
Total loans, gross |
$ | 133,304 | $ | 169,089 | $ | 465,676 | $ | 768,069 | ||||||||
Under industry regulations, a concentration is considered to exist when there are amounts loaned to a multiple number of borrowers engaged in similar activities which would cause them to be similarly impacted by economic or other conditions. Typically, industry guidelines require disclosure of concentrations of loans exceeding 10.0% of total loans outstanding. FNCB had no such concentrations at December 31, 2017, 2016 and 2015. In addition to industry guidelines, FNCB’s internal policy considers a concentration to exist in its loan portfolio if an aggregate loan balance outstanding to borrowers within a specific industry exceeds 25.0% of capital. However, management regularly reviews loans by all industry categories to determine if a potential concentration exists.
The following table presents loans by industry, the percentage to gross loans and indicates concentrations greater than 25.0% of capital at December 31, 2017, 2016 and 2015:
|
Loan Concentrations |
December 31, |
|||||||||||||||||||||||
|
2017 |
2016 |
2015 |
||||||||||||||||||||||
|
(dollars in thousands) |
Amount |
% of Gross Loans |
Amount |
% of Gross Loans |
Amount |
% of Gross Loans |
||||||||||||||||||
|
Retail space/shopping centers |
$ | 44,184 | 5.75 | % | $ | 38,573 | 5.27 | % | $ | 35,292 | 4.83 | % | ||||||||||||
|
1-4 family residential investment properties |
33,275 | 4.33 | % | 24,413 | 3.34 | % | 18,957 | 2.59 | % | |||||||||||||||
|
Automobile dealers |
22,792 | 2.97 | % | 31,989 | 4.37 | % | 34,594 | 4.73 | % | |||||||||||||||
Asset Quality
Loans that management has the intent and ability to hold for the foreseeable future or until maturity or payoff are stated at the amount of unpaid principal, net of unearned interest, deferred loan fees and costs, and reduced by the ALLL. The ALLL is established through a provision for loan and lease losses charged to earnings.
FNCB has established and consistently applies loan policies and procedures designed to foster sound underwriting and credit monitoring practices. Credit risk is managed through the efforts of loan officers, the loan review function, and the Credit Risk Management and the ALLL committees, as well as oversight from the Board of Directors. Management continually evaluates its credit risk management practices to ensure it is reacting to problems in the loan portfolio in a timely manner, although, as is the case with any financial institution, a certain degree of credit risk is dependent in part on local and general economic conditions that are beyond management’s control.
Under FNCB’s risk rating system, loans that are rated pass, special mention, substandard, doubtful, or loss are reviewed regularly as part of the risk management practices. The Credit Risk Management Committee, which consists of key members of management, finance, legal, retail lending and credit administration, meets monthly or more often as necessary to review individual problem credits and workout strategies and provides monthly reports to the Board of Directors.
A loan is considered impaired when it is probable that FNCB will be unable to collect all amounts due (including principal and interest) according to the contractual terms of the note and loan agreement. For purposes of the analysis, all TDRs, loan relationships with an aggregate outstanding balance greater than $100 thousand rated substandard and non-accrual, and loans that are identified as doubtful or loss are considered impaired. Impaired loans are analyzed individually to determine the amount of impairment. For collateral-dependent loans, impairment is measured based on the fair value of the collateral supporting the loans. A loan is determined to be collateral dependent when repayment of the loan is expected to be provided through the liquidation of the collateral held. For impaired loans that are secured by real estate, external appraisals are obtained annually, or more frequently as warranted, to ascertain a fair value so that the impairment analysis can be updated. Should a current appraisal not be available at the time of impairment analysis, other sources of valuation may be used, including current letters of intent, broker price opinions or executed agreements of sale. For non-collateral-dependent loans, impairment is measured based on the present value of expected future cash flows, net of any deferred fees and costs, discounted at the loan’s original effective interest rate.
Loans to borrowers that are experiencing financial difficulty that are modified and result in the granting of concessions to the borrowers are classified as TDRs and are considered to be impaired. Such concessions generally involve an extension of a loan’s stated maturity date, a reduction of the stated interest rate, payment modifications, capitalization of property taxes with respect to mortgage loans or a combination of these modifications. Non-accrual TDRs are returned to accrual status if principal and interest payments, under the modified terms, are brought current, are performing under the modified terms for six consecutive months, and management believes that collection of the remaining interest and principal is probable.
Non-performing loans are monitored on an ongoing basis as part of FNCB’s loan review process. Additionally, work-out for non-performing loans and OREO are actively monitored through the Credit Risk Management Committee. A potential loss on a non-performing asset is generally determined by comparing the outstanding loan balance to the fair market value of the pledged collateral, less cost to sell.
Loans are placed on non-accrual when a loan is specifically determined to be impaired or when management believes that the collection of interest or principal is doubtful. This generally occurs when a default of interest or principal has existed for 90 days or more, unless the loan is well secured and in the process of collection, or when management becomes aware of facts or circumstances that the loan would default before 90 days. FNCB determines delinquency status based on the number of days since the date of the borrower’s last required contractual loan payment. When the interest accrual is discontinued, all unpaid interest income is reversed and charged back against current earnings. Any subsequent cash payments received are applied, first to the outstanding loan amounts, then to the recovery of any charged-off loan amounts, with any excess treated as a recovery of lost interest. A non-accrual loan is returned to accrual status when the loan is current as to principal and interest payments, is performing according to contractual terms for six consecutive months and future payments are reasonably assured.
Management actively manages impaired loans in an effort mitigate loss to FNCB by working with customers to develop strategies to resolve borrower difficulties, through sale or liquidation of collateral, foreclosure, and other appropriate means. In addition, management monitors employment and economic conditions within FNCB’s market area, as weakening of conditions could result in real estate devaluations and an increase in loan delinquencies, which could negatively impact asset quality and cause an increase in the provision for loan and lease losses. While lagging the state and national unemployment rate, employment conditions in FNCB’s market area improved in 2017 in comparison to year-end 2016. The unemployment rate for the Scranton/Wilkes-Barre/Hazleton Pennsylvania metropolitan area declined to 5.6% for December 2017 from 6.0% for December 2016. The unemployment rate for our market area was above the rate for the Commonwealth of Pennsylvania of 4.7% and the rate for the United States of 4.1% for December 2017.
Under the fair value of collateral method, the impaired amount of the loan is deemed to be the difference between the loan amount and the fair value of the collateral, less the estimated costs to sell. For real estate secured loans, management generally estimates selling costs using a factor of 10%, which is based on typical cost factors, such as a 6% broker commission, 1% transfer taxes, and 3% various other miscellaneous costs associated with the sales process. If the valuation indicates that the fair value has deteriorated below the carrying value of the loan, the difference between the fair value and the principal balance is charged off. For impaired loans for which the value of the collateral less costs to sell exceeds the loan value, the impairment is determined to be zero.
The following table presents information about non-performing assets and accruing TDRs as of December 31 for each of the last five years:
Non-performing Assets and Accruing TDRs
|
December 31, |
||||||||||||||||||||
|
(dollars in thousands) |
2017 |
2016 |
2015 |
2014 |
2013 |
|||||||||||||||
|
Non-accrual loans, including non-accrual TDRs |
$ | 2,578 | $ | 2,234 | $ | 3,788 | $ | 5,522 | $ | 6,356 | ||||||||||
|
Loans past due 90 days or more and still accruing |
- | - | - | - | 19 | |||||||||||||||
|
Total non-performing loans |
2,578 | 2,234 | 3,788 | 5,522 | 6,375 | |||||||||||||||
|
Other real estate owned |
1,023 | 2,048 | 3,154 | 2,255 | 4,246 | |||||||||||||||
|
Other non-performing assets |
1,900 | 2,160 | - | - | - | |||||||||||||||
|
Total non-performing assets |
$ | 5,501 | $ | 6,442 | $ | 6,942 | $ | 7,777 | $ | 10,621 | ||||||||||
|
Accruing TDRs |
$ | 9,299 | $ | 4,176 | $ | 4,982 | $ | 5,282 | $ | 3,995 | ||||||||||
|
Non-performing loans as a percentage of total loans, gross |
0.34 | % | 0.31 | % | 0.52 | % | 0.82 | % | 0.99 | % | ||||||||||
Total non-performing assets decreased $0.9 million, or 14.6%, to $5.5 million at December 31, 2017 from $6.4 million at December 31, 2016. The reduction in non-performing assets was primarily due to a decrease in other real estate owned of $1.0 million, or 50.0%. Non-accrual loans increased by $0.3 million, primarily attributable to one large commercial relationship, which was also modified as a TDR during the year ended December 31, 2017. FNCB’s ratio of non-performing loans to total gross loans increased to 0.34% at December 31, 2017 from 0.31% at December 31, 2016. FNCB’s ratio of non-performing assets as a percentage of shareholders’ equity improved to 6.2% at December 31, 2017 from 7.1% at December 31, 2016. Management continues to monitor non-accrual loans, delinquency trends and economic conditions within FNCB’s market area on an on-going basis to proactively address any collection-related issues and mitigate any potential loss.
Other non-performing assets at December 31, 2017 and 2016 include a classified account receivable secured by an evergreen letter of credit in the amount of $1.9 million, received in 2011 as part of a settlement agreement for a large construction, land acquisition and development loan for a residential development project in the Pocono region of Monroe County. The project was stalled due to a decline in real estate values in this area following the financial crisis of 2008. The agreement provides for payment to FNCB as real estate building lots are sold. In 2016 management classified this receivable as substandard due to length of holding time and continues to monitor this project closely. To date, no lots have been sold; however, economic development in this market area has recently improved and construction activity related to this project by the developer has increased. Also included in other non-performing assets at December 31, 2016 was foreclosed equipment of $260 thousand, which was sold during the year ended December 31, 2017, resulting in a net gain of $47 thousand included in non-interest income within the consolidated statements of income.
TDRs at December 31, 2017 and 2016 were $10.2 million and $4.3 million, respectively. Accruing and non-accruing TDRs were $9.3 million and $0.9 million, respectively at December 31, 2017 and $4.2 million and $0.1 million, respectively at December 31, 2016. There were nine loan relationships modified as TDRs during the year ended December 31, 2017, which incorporated a total of sixteen individual loans. There were three loan relationships, comprised of eight commercial real estate loans totaling $5.3 million, and two loan relationships, comprised of four commercial and industrial loans totaling $1.8 million, that were modified under varying forms of forbearance agreements during the year ended December 31, 2017. Additional TDRs included two consumer loans totaling $85 thousand that had their terms extended and delinquent taxes capitalized, as well as two residential real estate loans totaling $190 thousand that had their terms extended. The commercial real estate modifications included a principal forbearance agreement for one loan in the amount of $4.0 million and reductions in required monthly principal payments resulting in balloon payments due at maturity for seven loans to two borrowers aggregating $1.2 million. The four commercial and industrial loan modifications involved the delay of required principal and interest payments for predefined time periods.
The average balance of impaired loans was $10.9 million and $6.9 million for the years ended December 31, 2017 and 2016, respectively. FNCB recognized interest on impaired loans of $392 thousand in 2017 and $202 thousand in 2016.
The following table presents the changes in non-performing loans for the years ended December 31, 2017 and 2016. Loan foreclosures represent recorded investment at time of foreclosure not including the effect of any guarantees:
Changes in Non-performing Loans
|
Year ended December 31, |
||||||||
|
(in thousands) |
2017 |
2016 |
||||||
|
Balance, January 1 |
$ | 2,234 | $ | 3,788 | ||||
|
Loans newly placed on non-accrual |
3,586 | 3,853 | ||||||
|
Change in loans past due 90 days or more and still accruing |
- | - | ||||||
|
Loan foreclosures |
(80 | ) | (1,177 | ) | ||||
|
Loans returned to performing status |
(180 | ) | (147 | ) | ||||
|
Loans charged-off |
(1,399 | ) | (2,556 | ) | ||||
|
Loan payments received |
(1,583 | ) | (1,527 | ) | ||||
|
Balance, December 31 |
$ | 2,578 | $ | 2,234 | ||||
The additional interest income that would have been earned on non-accrual and restructured loans had the loans been performing in accordance with their original terms approximated $0.2 million for both years ended December 31, 2017 and 2016.
The following table presents accruing loan delinquencies and non-accrual loans as a percentage of gross loans at December 31, 2017, 2016 and 2015:
Loan Delinquencies and Non-accrual Loans
|
December 31, |
||||||||||||
|
2017 |
2016 |
2015 |
||||||||||
|
Accruing: |
||||||||||||
|
30-59 days |
0.27 | % | 0.37 | % | 0.18 | % | ||||||
|
60-89 days |
0.11 | % | 0.13 | % | 0.14 | % | ||||||
|
90+ days |
0.00 | % | 0.00 | % | 0.00 | % | ||||||
|
Non-accrual |
0.34 | % | 0.31 | % | 0.52 | % | ||||||
|
Total delinquencies |
0.72 | % | 0.81 | % | 0.84 | % | ||||||
Total delinquencies as a percent of gross loans improved to 0.72% at December 31, 2017 from 0.81% at December 31, 2016. The improvement was due primarily to decreases of $0.6 million in loans 30-59 days delinquent and $0.1 million in loans 60-89 days delinquent, partially offset by an increase of $0.3 million in non-accrual loans.
Allowance for Loan and Lease Losses
The ALLL represents management’s estimate of probable loan losses inherent in the loan portfolio. The ALLL is analyzed in accordance with GAAP and is maintained at a level that is based on management’s evaluation of the adequacy of the ALLL in relation to the risks inherent in the loan portfolio.
As part of its evaluation, management considers qualitative and environmental factors, including, but not limited to:
|
• |
changes in national, local, and business economic conditions and developments, including the condition of various market segments; |
|
• |
changes in the nature and volume of the loan portfolio; |
|
• |
changes in lending policies and procedures, including underwriting standards, collection, charge-off and recovery practices and results; |
|
• |
changes in the experience, ability and depth of lending management and staff; |
|
• |
changes in the quality of the loan review system and the degree of oversight by the Board of Directors; |
|
• |
changes in the trend of the volume and severity of past due and classified loans, including trends in the volume of non-accrual loans, TDRs and other loan modifications; |
|
• |
the existence and effect of any concentrations of credit and changes in the level of such concentrations; |
|
• |
the effect of external factors such as competition and legal and regulatory requirements on the level of estimated credit losses in the current loan portfolio; and |
|
• |
analysis of customers’ credit quality, including knowledge of their operating environment and financial condition. |
Evaluations are intrinsically subjective, as the results are estimated based on management knowledge and experience and are subject to interpretation and modification as information becomes available or as future events occur. Management monitors the loan portfolio on an ongoing basis with emphasis on weakness in both the real estate market and the economy in general and its effect on repayment. Adjustments to the ALLL are made based on management’s assessment of the factors noted above.
In its evaluation of the ALLL, management considers a variety of qualitative factors including changes in the volume and severity of delinquencies. Management also considers the economic conditions in FNCB’s market area and continues to notice some weakness. As previously mentioned, the unemployment rate for the Scranton-Wilkes-Barre-Hazleton metropolitan area, FNCB’s predominant market area, improved to 5.6% for December 2017 from 6.0% for December 2016. However, unemployment in FNCB’s market continues to rank among the highest as compared to Pennsylvania’s 21 metropolitan areas. Moreover, the improvement in employment conditions for FNCB’s market area lagged behind the improvement in conditions experienced for the entire Commonwealth of Pennsylvania, in which the unemployment rate declined to 4.7% for December 2017 from 5.6% for December 2016. FNCB tries to mitigate the effects of changes in economic conditions by emphasizing strict underwriting standards.
For purposes of management’s analysis of the ALLL, all loan relationships with an aggregate balance greater than $100 thousand that are rated substandard and non-accrual, identified as doubtful or loss, and all TDRs are considered impaired and are analyzed individually to determine the amount of impairment. Circumstances such as construction delays, declining real estate values, and the inability of the borrowers to make scheduled payments have resulted in these loan relationships being classified as impaired. FNCB utilizes the fair value of collateral method for collateral-dependent loans and TDRs for which repayment depends on the sale of collateral. For non-collateral-dependent loans and TDRs, FNCB measures impairment based on the present value of expected future cash flows discounted at the loan’s original effective interest rate. With regard to collateral-dependent loans, appraisals are received at least annually to ensure that impairment measurements reflect current market conditions. Should a current appraisal not be available at the time of impairment analysis, other valuation sources including current letters of intent, broker price opinions or executed agreements of sale may be used. Only downward adjustments are made based on these supporting values. Included in all impairment calculations is a cost to sell adjustment of approximately 10%, which is based on typical cost factors, including a 6% broker commission, 1% transfer taxes and 3% various other miscellaneous costs associated with the sales process. Sales costs are periodically reviewed and revised based on actual experience. The ALLL analysis is adjusted for subsequent events that may arise after the end of the reporting period but before the financial reports are filed.
The ALLL equaled $9.0 million at December 31, 2017, an increase of $0.6 million from $8.4 million at December 31, 2016. The increase resulted from a provision for loan and lease losses of $769 thousand for the year ended December 31, 2017, partially offset by net charge-offs of $154 thousand for the same period.
The ALLL consists of both specific and general components. The component of the ALLL that is related to impaired loans that are individually evaluated for impairment, the guidance for which is provided by ASC 310 “Impairment of a Loan” (“ASC 310”), was $0.8 million, or 8.6%, of the total ALLL at December 31, 2017, compared to $0.3 million, or 3.6%, of the total ALLL at December 31, 2016. The increase in reserves for loans individually evaluated for impairment resulted primarily from a reserve established for a large commercial and industrial loan relationship that was transferred to non-accrual and modified as a TDR during 2017. A general reserve of $8.2 million was established for loans analyzed collectively under ASC 450 “Contingencies” (“ASC 450”), which represented 91.4% of the total ALLL of $9.0 million. The ratio of the ALLL to total loans at December 31, 2017 and December 31, 2016 was 1.17% and 1.15%, respectively, based on total loans, gross of $768.1 million and $728.8 million, respectively.
The following table presents an allocation of the ALLL by major loan category and percent of loans in each category to total loans at December 31, for each of the last five years:
Allocation of the ALLL
|
December 31, |
||||||||||||||||||||||||||||||||||||||||
|
2017 |
2016 |
2015 |
2014 |
2013 |
||||||||||||||||||||||||||||||||||||
|
(dollars in thousands) |
Allowance |
Percentage of Loans in Each Category to Total Loans |
Allowance |
Percentage of Loans in Each Category to Total Loans |
Allowance |
Percentage of Loans in Each Category to Total Loans |
Allowance |
Percentage of Loans in Each Category to Total Loans |
Allowance |
Percentage of Loans in Each Category to Total Loans |
||||||||||||||||||||||||||||||
|
Residential real estate |
$ | 1,236 | 20.58 | % | $ | 1,171 | 19.72 | % | $ | 1,333 | 17.87 | % | $ | 1,772 | 18.35 | % | $ | 2,287 | 17.86 | % | ||||||||||||||||||||
|
Commercial real estate |
3,499 | 34.08 | % | 3,297 | 33.32 | % | 3,346 | 33.54 | % | 4,663 | 34.87 | % | 6,017 | 33.97 | % | |||||||||||||||||||||||||
|
Construction, land acquisition and development |
209 | 2.73 | % | 268 | 2.51 | % | 853 | 4.22 | % | 665 | 2.81 | % | 924 | 3.79 | % | |||||||||||||||||||||||||
|
Commercial and industrial |
2,340 | 19.54 | % | 1,736 | 21.01 | % | 1,205 | 20.49 | % | 2,104 | 19.72 | % | 2,321 | 19.74 | % | |||||||||||||||||||||||||
|
Consumer |
1,395 | 17.53 | % | 1,457 | 17.47 | % | 1,494 | 17.58 | % | 1,673 | 18.24 | % | 1,789 | 18.44 | % | |||||||||||||||||||||||||
|
State and political subdivisions |
355 | 5.54 | % | 490 | 5.97 | % | 485 | 6.30 | % | 598 | 6.01 | % | 679 | 6.20 | % | |||||||||||||||||||||||||
|
Unallocated |
- | 0.00 | % | - | 0.00 | % | 74 | 0.00 | % | 45 | 0.00 | % | - | 0.00 | % | |||||||||||||||||||||||||
|
Total |
$ | 9,034 | 100.00 | % | $ | 8,419 | 100.00 | % | $ | 8,790 | 100.00 | % | $ | 11,520 | 100.00 | % | $ | 14,017 | 100.00 | % | ||||||||||||||||||||
The following table presents an analysis of the ALLL by loan category for each of the last five years:
Reconciliation of the ALLL
|
For the Year Ended December 31, |
||||||||||||||||||||
|
(in thousands) |
2017 |
2016 |
2015 |
2014 |
2013 |
|||||||||||||||
|
Balance, January 1, |
$ | 8,419 | $ | 8,790 | $ | 11,520 | $ | 14,017 | $ | 18,536 | ||||||||||
|
Charge-offs: |
||||||||||||||||||||
|
Residential real estate |
192 | 153 | 139 | 204 | 664 | |||||||||||||||
|
Commercial real estate |
159 | 398 | 912 | - | 65 | |||||||||||||||
|
Construction, land acquisition and development |
- | - | 688 | 45 | 179 | |||||||||||||||
|
Commercial and industrial |
495 | 1,107 | 180 | 217 | 341 | |||||||||||||||
|
Consumer |
603 | 960 | 716 | 922 | 655 | |||||||||||||||
|
State and political subdivision |
- | - | - | - | - | |||||||||||||||
|
Total charge-offs |
1,449 | 2,618 | 2,635 | 1,388 | 1,904 | |||||||||||||||
|
Recoveries of charged-off loans: |
||||||||||||||||||||
|
Residential real estate |
29 | 4 | 58 | 90 | 343 | |||||||||||||||
|
Commercial real estate |
45 | 6 | 307 | 362 | 879 | |||||||||||||||
|
Construction, land acquisition and development |
480 | 9 | - | 3,538 | 130 | |||||||||||||||
|
Commercial and industrial |
360 | 507 | 400 | 262 | 1,853 | |||||||||||||||
|
Consumer |
381 | 568 | 485 | 508 | 450 | |||||||||||||||
|
State and political subdivision |
- | - | - | - | - | |||||||||||||||
|
Total recoveries |
1,295 | 1,094 | 1,250 | 4,760 | 3,655 | |||||||||||||||
|
Net charge-offs (recoveries) |
154 | 1,524 | 1,385 | (3,372 | ) | (1,751 | ) | |||||||||||||
|
Provision (credit) for loan and lease losses |
769 | 1,153 | (1,345 | ) | (5,869 | ) | (6,270 | ) | ||||||||||||
|
Balance, December 31 |
$ | 9,034 | $ | 8,419 | $ | 8,790 | $ | 11,520 | $ | 14,017 | ||||||||||
|
Ratios: |
||||||||||||||||||||
|
Net charge-offs (recoveries) as a percentage of average loans |
0.02 | % | 0.21 | % | 0.20 | % | (0.51 | )% | (0.28 | )% | ||||||||||
|
Allowance for loan and lease losses as a percent of gross loans outstanding at period end |
1.17 | % | 1.15 | % | 1.20 | % | 1.72 | % | 2.18 | % | ||||||||||
Other Real Estate Owned
At December 31, 2017, there were five properties with an aggregate carrying value of $1.0 million in OREO, compared to nine properties with an aggregate balance of $2.0 million at December 31, 2016. During the year ended December 31, 2017, FNCB foreclosed upon two residential real estate properties with a carrying value of $125 thousand. During the year ended December 31, 2016, FNCB foreclosed on two properties with an aggregate carrying value of $950 thousand.
Included in OREO were three properties previously held in bank premises and equipment that were transferred to OREO due to a change in their intended use. The properties include two commercial lots previously held for future expansion and a former branch office located in Stroudsburg, Pennsylvania. The aggregate carrying value of these properties was $0.9 million and represented 91.1% of OREO at December 31, 2017. Subsequently, on March 1, 2018, the former Stroudsburg, Pennsylvania branch office with a carrying value of $428 thousand was sold for $465 thousand.
During the year ended December 31, 2017, there were three sales and one partial sale of properties with an aggregate carrying value of $0.8 million. Net gains realized on the sale of these properties was $79 thousand, which is included in non-interest income. There were three sales and one partial sale of properties with an aggregate carrying value of $1.9 million during the twelve months ended December 31, 2016, with net gains realized on the sales of $49 thousand, which is included in non-interest income for the year ended December 31, 2016.
FNCB actively markets OREO properties for sale through a variety of channels including internal marketing and the use of outside brokers/realtors. The carrying value of OREO is generally calculated at an amount not greater than 90% of the most recent fair market appraised value unless specific conditions warrant an exception. A 10% factor is generally used to estimate costs to sell, which is based on typical cost factors, such as 6% broker commission, 1% transfer taxes, and 3% various other miscellaneous costs associated with the sales process. This fair value is updated on an annual basis or more frequently if new valuation information is available. Deterioration in the real estate market could result in additional losses on these properties. FNCB incurred valuation adjustments of $322 thousand for the year ended December 31, 2017, of which $307 thousand is included in expense of other real estate owned in the consolidated statements of income. A $15 thousand valuation adjustment recorded during 2017 was related to an investor loan, and accordingly reduced the liability owed to the investor. Valuation adjustments totaled $169 thousand for the year ended December 31, 2016.
The following table presents the activity in OREO for each of the three years ended December 31, 2017, 2016 and 2015:
Activity in OREO
|
For the Years Ended December 31, |
||||||||||||
|
(in thousands) |
2017 |
2016 |
2015 |
|||||||||
|
Balance, Janauary 1 |
$ | 2,048 | $ | 3,154 | $ | 2,255 | ||||||
|
Real estate foreclosures |
125 | 950 | 1,717 | |||||||||
|
Valuation adjustments |
(322 | ) | (169 | ) | (208 | ) | ||||||
|
Carrying value of OREO sold |
(828 | ) | (1,887 | ) | (610 | ) | ||||||
|
Balance, December 31 |
$ | 1,023 | $ | 2,048 | $ | 3,154 | ||||||
The following table presents a distribution of OREO at December 31 for the past five years:
Distribution of OREO
|
December 31, |
||||||||||||||||||||
|
(in thousands) |
2017 |
2016 |
2015 |
2014 |
2013 |
|||||||||||||||
|
Land / lots |
$ | 516 | $ | 641 | $ | 785 | $ | 1,287 | $ | 3,549 | ||||||||||
|
Commercial real estate |
427 | 1,380 | 2,342 | 941 | 647 | |||||||||||||||
|
Residential real estate |
80 | 27 | 27 | 27 | 50 | |||||||||||||||
|
Total other real estate owned |
$ | 1,023 | $ | 2,048 | $ | 3,154 | $ | 2,255 | $ | 4,246 | ||||||||||
The expenses related to maintaining OREO, including the subsequent write-downs of the properties related to declines in value since foreclosure, net of any income received, amounted to $0.5 million, $0.4 million, and $0.4 million for the years ended December 31, 2017, 2016, and 2015, respectively.
Deposits
Total deposits decreased $12.7 million, or 1.3%, to $1.002 billion at December 31, 2017 from $1.015 billion at the end of 2016. Non-interest-bearing demand deposits increased $2.6 million, or 1.5%, while interest-bearing deposits decreased $15.3 million, or 1.8%. The increase in non-interest-bearing demand deposits primarily reflected growth in business checking deposits, while the decrease in interest-bearing deposits was primarily due to a reduction in municipal deposit accounts of $66.0 million, to $237.9 million at December 31, 2017 from $303.9 million at December 31, 2016. The decrease in municipal deposits reflected the anticipated exit of short-term funds related to the sale of a municipal utility in December 2016, partially mitigated by the attainment of new relationships through the government banking department. Partially offsetting this decrease were increases in money market accounts of $45.2 million to $174.8 million at December 31, 2017 from $129.7 million at December 31, 2016 and time deposits of $5.3 million to $192.3 million at December 31, 2017 from $187.1 million at December 31, 2016. The 34.8% increase in money market accounts resulted primarily from an inflow of funds from one large commercial depositor, coupled with the addition of funds from a large commercial depositor that participates in FNCB’s ICS program through the Promontory Interfinancial Network.
Non-interest-bearing demand deposits averaged $7.9 million, or 5.3%, higher at $156.7 million in 2017 as compared to $148.7 million in 2016. Interest-bearing deposits averaged $802.3 million in 2017, an increase of $61.2 million, or 8.3%, compared to $741.1 million in 2016. The increase was concentrated in interest-bearing demand deposits, which increased $67.1 million, or 15.4%, to $502.2 million in 2017 from $435.1 million in 2016 due primarily to growth in municipal deposit accounts. In addition, average savings deposits increased $4.8 million, or 4.9% comparing 2017 and 2016. Partially offsetting these increases was a decrease of $10.6 million, or 5.1%, in average total time deposits. FNCB’s deposit funding costs increased 7 basis points to 0.44% in 2017 from 0.37% in 2016, which was driven primarily by a 14-basis point increase in the average rate paid for interest-bearing demand deposits. Rates on savings deposits increased by 3 basis points, while rates on time deposits remained steady at 0.80% at both December 31, 2017 and 2016.
Management recognizes the importance of deposit growth as its primary funding source for loan products and is currently evaluating new products and strategies focused on growing commercial and consumer demand deposit balances and municipal deposit relationships in 2018.
The average balance of, and the rate paid on, the major classifications of deposits for the past three years are summarized in the following table:
Deposit Distribution
|
For the Year Ended December 31, |
||||||||||||||||||||||||
|
2017 |
2016 |
2015 |
||||||||||||||||||||||
|
Average |
Average |
Average |
||||||||||||||||||||||
|
(dollars in thousands) |
Balance |
Rate |
Balance |
Rate |
Balance |
Rate |
||||||||||||||||||
|
Interest-bearing deposits: |
||||||||||||||||||||||||
|
Demand |
$ | 502,170 | 0.36 | % | $ | 435,092 | 0.22 | % | $ | 358,442 | 0.19 | % | ||||||||||||
|
Savings |
101,952 | 0.13 | % | 97,188 | 0.10 | % | 91,603 | 0.07 | % | |||||||||||||||
|
Time |
198,143 | 0.80 | % | 208,783 | 0.80 | % | 224,538 | 0.85 | % | |||||||||||||||
|
Total interest-bearing deposits |
802,265 | 0.44 | % | 741,063 | 0.37 | % | 674,583 | 0.39 | % | |||||||||||||||
|
Non-interest-bearing deposits |
156,670 | 148,746 | 139,945 | |||||||||||||||||||||
|
Total deposits |
$ | 958,935 | $ | 889,809 | $ | 814,528 | ||||||||||||||||||
The following table presents the maturity distribution of time deposits of $100,000 or more at December 31, 2017 and 2016:
Maturity Distribution of Time Deposits $100,000 or More
|
December 31, |
||||||||
|
(in thousands) |
2017 |
2016 |
||||||
|
3 months or less |
$ | 30,664 | $ | 27,461 | ||||
|
Over 3 through 6 months |
13,006 | 7,511 | ||||||
|
Over 6 through 12 months |
33,979 | 18,805 | ||||||
|
Over 12 months |
19,693 | 25,938 | ||||||
|
Total |
$ | 97,342 | $ | 79,715 | ||||
Borrowings
Short-term borrowings generally represent overnight borrowing transactions through the FHLB of Pittsburgh, which provide for short-term funding requirements of FNCB and mature within one business day of the transaction. Short-term borrowings may also include federal funds purchased and borrowings through the Federal Reserve Discount Window, which are considered to be a contingency source of funding. Other than testing its availability for contingency funding planning purposes, FNCB did not purchase any federal funds or borrow from the Federal Reserve Discount Window during the years ended December 31, 2017, 2016 and 2015. FNCB did not have any overnight advances outstanding with the FHLB of Pittsburgh at December 31, 2017 or 2016.
Long-term debt is comprised of FHLB of Pittsburgh term advances, subordinated debentures and junior subordinated debentures and totaled $60.3 million at December 31, 2017, a decrease of $18.5 million, or 23.6%, from $78.8 million at December 31, 2016. On July 27, 2017, the Board of Directors of FNCB approved the acceleration of a $5.0 million partial repayment of principal on the Notes. The $5.0 million principal repayment, which was due and payable on September 1, 2018, was paid to Noteholders on September 1, 2017. The Notes have a fixed interest rate of 4.50%. The principal balance outstanding for these Notes was $5.0 million at December 31, 2017 and $10.0 million at December 31, 2016.
Advances through the FHLB of Pittsburgh decreased $13.5 million to $45.0 million at December 31, 2017 from $58.5 million at December 31, 2016. FHLB of Pittsburgh advances are collateralized under a blanket pledge agreement, and FNCB is also required to purchase FHLB of Pittsburgh stock based upon the amount of advances outstanding. As a result of the decrease in term advances, the FHLB of Pittsburgh stock required to be held by FNCB was $2.8 million at December 31, 2017, a decrease of $0.5 million from $3.3 million at December 31, 2016. At December 31, 2017, FNCB’s maximum borrowing capacity with the FHLB of Pittsburgh was $314.3 million, of which had $269.5 million was available for borrowing purposes.
FNCB also had $10.3 million of junior subordinated debentures outstanding at December 31, 2017 and 2016. The interest rate on these debentures resets quarterly at a spread of 1.67% above the current 3-month LIBOR rate. The average interest rate paid on the junior subordinated debentures in 2017 was 2.90%, compared to 2.39% in 2016.
Average borrowed funds decreased $30.4 million, or 29.5%, to $72.8 million in 2017 from $103.2 million in 2016. The average rate paid for long-term debt increased 34 basis points to 1.76% in 2017 from 1.42% in 2016. The increase in rate on the long-term debt was due to increases in the rates paid on FHLB borrowings and junior subordinated debentures, which directly correlated with the increases in market interest rates throughout 2017. The maximum amount of total borrowings outstanding at any month end during the years ended December 31, 2017 and 2016 were $97.2 million and $145.1 million, respectively.
For further discussion of FNCB’s borrowings, see Note 8, “Borrowed Funds” in the Notes to the consolidated financial statements included in Item 8 of this Annual Report on Form 10-K.
Liquidity
The term liquidity refers to the ability to generate sufficient amounts of cash to meet cash flow needs. Liquidity is required to fulfill the borrowing needs of FNCB’s credit customers and the withdrawal and maturity requirements of its deposit customers, as well as to meet other financial commitments. FNCB’s liquidity position is impacted by several factors, which include, among others, loan origination volumes, loan and investment maturity structure and cash flows, deposit demand and certificate of deposit maturity structure and retention. FNCB has liquidity and contingent funding policies in place that are designed with controls in place to provide advanced detection of potentially significant funding shortfalls, establish methods for assessing and monitoring risk levels, and institute prompt responses that may alleviate a potential liquidity crisis. Management monitors FNCB’s liquidity position and fluctuations daily, forecasts future liquidity needs, performs stress tests on its liquidity levels and develops strategies to ensure adequate liquidity at all times.
The statements of cash flows present the change in cash and cash equivalents from operating, investing and financing activities. Cash and due from banks and interest-bearing deposits in other banks are FNCB’s most liquid assets. At December 31, 2017, cash and cash equivalents totaled $37.7 million, a decrease of $74.7 million from $112.4 million at December 31, 2016, as net cash outflows from investing and financing activities exceeded net cash inflows from operating activities.
Cash outlays for investing activities used $53.5 million of cash and cash equivalents during the year ended December 31, 2017, which was due largely to net increases in loans to customers of $41.5 million. Additionally, purchases of available-for-sale securities, net of proceeds received from sales, maturities, calls and principal reduction in 2017 used $13.6 million of cash and cash equivalents. Also in 2017, purchases of bank premises and equipment utilized $1.1 million cash and cash equivalents. Partially offsetting these outflows were cash inflows in 2017 from the sale of SBA guaranteed loans of $1.0 million and proceeds from the sale of OREO and other repossessed assets of $1.2 million.
Financing activities used $33.0 million in net cash, which resulted primarily from a $12.7 million net decrease in deposits, net repayments of FHLB of Pittsburgh advances of $13.6 million, a $5.0 million principal reduction on the Notes and cash dividends paid of $2.2 million. Partially offsetting these outflows was net cash provided by operating activities in 2017 of $11.8 million. Operating activities include net income, adjusted for the effects of non-cash transactions including, among others, depreciation and amortization and the provision for loan and lease losses, is the primary source for the remaining funds from operations. Specifically, in 2017 FNCB recorded net income of $0.1 million and non-cash adjustments to income of $11.6 million, which included an $11.0 million decrease in net deferred tax assets, due largely to the non-recurring revaluation adjustment following enactment of the Tax Act.
Management believes that FNCB’s liquidity position is sufficient to meet its cash flow needs as of December 31, 2017. FNCB generally utilizes core deposits as its primary source of liquidity. Core deposits include non-interest-bearing and interest-bearing demand deposits, savings deposits and other time deposits, net of brokered deposits and deposits generated through the Promontory Interfinancial Network, which include time deposits issued under CDARs program and money market and NOW accounts issued through the ICS program. Participating in the Promontory Interfinancial Network programs allows FNCB to service and attract potential high-balance deposits customers who want the security of full-FDIC insurance but want to maintain a local deposit relationship. Core deposits averaged $876.1 million for the year ended December 31, 2017, an increase of $160.3 million, or 22.4%, compared to $715.8 million for the year ended December 31, 2016. The increase in core deposits primarily reflected growth in interest-bearing demand, net of deposits issued through the ICS program, of $67.1 million, other time deposits, net of brokered deposits and CDARs certificates, of $25.7 million, non-interest-bearing demand deposits of $7.9 million and savings deposits of $4.8 million. During the year ended December 31, 2017, FNCB’s balance to be considered a jumbo deposit was increased from $100 thousand to $250 thousand, which was the primary factor in the increase in other time deposits. In addition to core deposits, FNCB currently utilizes brokered certificates of deposit, certificates of deposits generated through a national listing service, funding through the Promontory Financial Network and advances through the FHLB of Pittsburgh as alternative sources of liquidity. At December 31, 2017, FNCB had available borrowing capacity with the FHLB of Pittsburgh of $269.3 million.
Capital
A strong capital base is essential to the continued growth and profitability of FNCB and is therefore a management priority. Management’s principal capital planning goals are to provide an adequate return to shareholders while retaining a sufficient base from which to provide for future growth, while at the same time complying with all regulatory standards. As more fully described in Note 14, “Regulatory Matters” to the notes to the consolidated financial statements included in Item 8 of this Annual Report on Form 10-K, regulatory authorities have prescribed specified minimum capital ratios as guidelines for determining capital adequacy to help assure the safety and soundness of financial institutions.
The following schedules present information regarding FNCB’s and the Bank’s risk-based capital at December 31, 2017 and 2016, and selected other capital ratios:
| Company | Bank |
Minimum Required For Capital Adequacy Purposes |
Minimum Required For Capital Adequacy Purposes with Conservation Buffer |
To Be Well Capitalized Under Prompt Corrective Action Regulations* |
||||||||||||||||||||||||
|
(dollars in thousands) |
Amount |
Ratio |
Amount |
Ratio |
Ratio |
Ratio |
Ratio |
|||||||||||||||||||||
|
December 31, 2017 |
||||||||||||||||||||||||||||
|
Total capital (to risk-weighted assets) |
$ | 101,135 | 12.08 | % | $ | 104,272 | 12.49 | % | 8.00 | % | 9.25 | % | 10.00 | % | ||||||||||||||
|
Tier I capital (to risk-weighted assets) |
89,220 | 10.66 | % | 94,856 | 11.36 | % | 6.00 | % | 7.25 | % | 8.00 | % | ||||||||||||||||
|
Tier I common equity (to risk-weighted assets) |
81,493 | 9.74 | % | 94,856 | 11.36 | % | 4.50 | % | 5.75 | % | 6.50 | % | ||||||||||||||||
|
Tier I capital (to average assets) |
89,220 | 7.74 | % | 94,856 | 8.24 | % | 4.00 | % | 4.00 | % | 5.00 | % | ||||||||||||||||
|
Total risk-weighted assets |
837,032 | 834,959 | ||||||||||||||||||||||||||
|
Total average assets |
1,152,776 | 1,151,539 | ||||||||||||||||||||||||||
|
Company |
Bank |
Minimum Required For Capital Adequacy Purposes |
Minimum Required For Capital Adequacy Purposes with Conservation Buffer |
To Be Well Capitalized Under Prompt Corrective Action Regulations* |
||||||||||||||||||||||||
|
(dollars in thousands) |
Amount |
Ratio |
Amount |
Ratio |
Ratio |
Ratio |
Ratio |
|||||||||||||||||||||
|
December 31, 2016 |
||||||||||||||||||||||||||||
|
Total capital (to risk-weighted assets) |
$ | 96,827 | 12.06 | % | $ | 102,786 | 12.81 | % | 8.00 | % | 8.625 | % | 10.00 | % | ||||||||||||||
|
Tier I capital (to risk-weighted assets) |
82,159 | 10.23 | % | 94,118 | 11.73 | % | 6.00 | % | 6.625 | % | 8.00 | % | ||||||||||||||||
|
Tier I common equity (to risk-weighted assets) |
80,049 | 9.97 | % | 94,118 | 11.73 | % | 4.50 | % | 5.125 | % | 6.50 | % | ||||||||||||||||
|
Tier I capital (to average assets) |
82,159 | 7.53 | % | 94,118 | 8.63 | % | 4.00 | % | 4.000 | % | 5.00 | % | ||||||||||||||||
|
Total risk-weighted assets |
803,026 | 802,610 | ||||||||||||||||||||||||||
|
Total average assets |
1,090,665 | 1,090,550 | ||||||||||||||||||||||||||
|
* Applies to the Bank only. |
FNCB’s total regulatory capital increased $4.3 million to $101.1 million at December 31, 2017 from $96.8 million at December 31, 2016. FNCB’s and the Bank’s risk-based capital ratios exceeded the minimum regulatory capital ratios required for adequately capitalized institutions. Based on the most recent notification from its primary regulators, the Bank was categorized as well capitalized at December 31, 2017 and 2016. There are no conditions or events since this notification the management believes have changed this category.
As of December 31, 2017, FNCB had 33,242,037 shares of common stock available for future sale or share dividends. The number of shareholders of record at December 31, 2017 was 1,804. Quarterly market highs and lows, dividends paid and known market makers are highlighted in Part I, Item 5, “Market for Registrant’s Common Equity, Related Shareholder Matters and Issuer Purchases of Equity Securities” of this Annual Report on Form 10-K. For further discussion of FNCB’s capital requirements and dividend limitations, refer to Note 14, “Regulatory Matters,” of the notes to consolidated financial statements included in Item 8, “Financial Statements and Supplementary Data” of this Annual Report on Form 10-K.
Additionally, FNCB has available 20,000,000 authorized shares of preferred stock. There were no preferred shares issued and outstanding at December 31, 2017 and 2016.
FNCB had a Dividend Reinvestment and Optional Cash Purchase Plan (“DRP”), which permitted participants to automatically reinvest cash dividends on all of their shares and to make voluntary cash contributions under the terms of the plan at a discounted price. On April 27, 2016, the Board of Directors approved the reinstatement of the DRP effective June 1, 2016. Previously, the operation of the DRP had been suspended since 2011. Common shares issued under the DRP in 2017 and 2016 totaled 65,240 and 78,752, respectively. There were no shares of common stock issued under the DRP in 2015.
During the years ended December 31, 2017 and 2016, FNCB declared and paid dividends of $0.13 per share and $0.09 per share, respectively. Subsequent to December 31, 2017, on January 31, 2018, FNCB declared a dividend of $0.04 per share of common stock. The dividend is payable on March 15, 2018 to shareholders of record on March 1, 2018.
Off-Balance Sheet Arrangements
In the normal course of operations, FNCB engages in a variety of financial transactions that, in accordance with GAAP, are not recorded in our consolidated financial statements or are recorded in amounts that differ from the notional amounts. These transactions involve, to varying degrees, elements of credit, interest rate and liquidity risk. Such transactions may be used for general corporate purposes or for customer needs. Corporate purpose transactions would be used to help manage credit, interest rate and liquidity risk or to optimize capital. Customer transactions are used to manage customers' requests for funding.
For the year ended December 31, 2017, FNCB did not engage in any off-balance sheet transactions that would have or would be reasonably likely to have a material effect on its consolidated financial condition. For a further discussion of FNCB’s off-balance sheet arrangements, refer to Note 12, “Commitments, Contingencies, and Concentrations” to the notes to the consolidated financial statements included in Item 8, “Financial Statements and Supplementary Data,” of this Annual Report on Form 10-K.
The following table presents off-balance financial instruments whose contractual amounts represent credit risk at December 31, 2017 and 2016. All of the off-balance sheet financial instruments outstanding at December 31, 2017 expire within one year of their respective contract dates.
Off-Balance Sheet Commitments
|
December 31, |
||||||||
|
(in thousands) |
2017 |
2016 |
||||||
|
Commitments to extend credit |
$ | 190,672 | $ | 150,111 | ||||
|
Standby letters of credit |
15,994 | 21,220 | ||||||
In order to provide for probable losses inherent in these instruments, FNCB recorded reserves for unfunded commitments of $381 thousand and $249 thousand at December 31, 2017 and 2016, respectively, which were included in other liabilities in the consolidated statements of financial condition.
FNCB’s Finance unit proactively monitors the level of unused commitments against the available sources of liquidity from its investment portfolio, from deposit gathering activities as well as available unused borrowing capacity from the FHLB and the Federal Reserve. The Finance unit reports the results of its liquidity monitoring regularly to FNCB’s Asset/Liability Management Committee, the Rate and Liquidity Committee, the Executive Management Committee and the Board of Directors.
Contractual Obligations
The following table details FNCB’s contractual obligations as of December 31, 2017. Payments due by period in the following table are based on final maturity dates without consideration of early redemption.
Maturities of Contractual Obligations
|
Contractual Payments Due by Period |
||||||||||||||||||||
|
(in thousands) |
Total |
Less Than 1 Year |
1-3 Years |
3-5 Years |
More Than 5 Years |
|||||||||||||||
|
Federal Home Loan Bank advances- term |
$ | 44,968 | $ | 25,432 | $ | 19,536 | $ | - | $ | - | ||||||||||
|
Subordinated debentures |
5,000 | - | 5,000 | - | - | |||||||||||||||
|
Junior subordinated debt |
10,310 | - | - | - | 10,310 | |||||||||||||||
|
Operating lease obligations |
1,199 | 374 | 392 | 256 | 177 | |||||||||||||||
|
Total contractual cash obligations |
$ | 61,477 | $ | 25,806 | $ | 24,928 | $ | 256 | $ | 10,487 | ||||||||||
Item 7A. Quantitative and Qualitative Disclosures About Market Risk.
Interest Rate Risk
Interest Rate Sensitivity
Market risk is the risk to earnings and/or financial position resulting from adverse changes in market rates or prices, such as interest rates, foreign exchange rates or equity prices. FNCB’s exposure to market risk is primarily interest rate risk associated with our lending, investing and deposit gathering activities, all of which are other than trading. Changes in interest rates affect earnings by changing net interest income and the level of other interest-sensitive income and operating expenses. In addition, variations in interest rates affect the underlying economic value of our assets, liabilities and off-balance sheet items.
Asset and Liability Management
FNCB manages these objectives through its Asset and Liability Management Committee (“ALCO”) and its Rate and Liquidity and Investment Committees, which consist of certain members of management and certain members of the finance unit. Members of the committees meet regularly to develop balance sheet strategies affecting the future level of net interest income, liquidity and capital. The major objectives of ALCO are to:
|
● |
manage exposure to changes in the interest rate environment by limiting the changes in net interest margin to an acceptable level within a reasonable range of interest rates; |
|
● |
ensure adequate liquidity and funding; |
|
● |
maintain a strong capital base; and |
|
● |
maximize net interest income opportunities. |
ALCO monitors FNCB’s exposure to changes in net interest income over both a one-year planning horizon and a longer-term strategic horizon. ALCO uses net interest income simulations and economic value of equity (“EVE”) simulations as the primary tools in measuring and managing FNCB’s position and considers balance sheet forecasts, our liquidity position, the economic environment, anticipated direction of interest rates and FNCB’s earnings sensitivity to changes in these rates in its modeling. In addition, ALCO has established policy tolerance limits for acceptable negative changes in net interest income. Furthermore, as part of its ongoing monitoring, ALCO has been enhanced to require quarterly back testing of modeling results, which involves after-the-fact comparisons of projections with FNCB’s actual performance to measure the validity of assumptions used in the modeling techniques.
Earnings at Risk and Economic Value at Risk Simulations:
Earnings at Risk
Earnings-at-risk simulation measures the change in net interest income and net income under various interest rate scenarios. Specifically, given the current market rates, ALCO looks at “earnings at risk” to determine anticipated changes in net interest income from a base case scenario with scenarios of + 200, +400 and -100 basis points for simulation purposes. The simulation takes into consideration that not all assets and liabilities re-price equally and simultaneously with market rates (i.e., savings rate).
Economic Value at Risk
While earnings-at-risk simulation measures the short-term risk in the balance sheet, economic value (or portfolio equity) at risk measures the long-term risk by finding the net present value of the future cash flows from FNCB’s existing assets and liabilities. ALCO examines this ratio regularly, and given the current rate environment, has utilized rate shocks of +200, +400 and -100 basis points for simulation purposes. Management recognizes that, in some instances, this ratio may contradict the “earnings at risk” ratio.
While ALCO regularly performs a wide variety of simulations under various strategic balance sheet and treasury yield curve scenarios, the following results reflect FNCB’s sensitivity over the subsequent twelve months based on the following assumptions:
|
● |
asset and liability levels using December 31, 2017 as a starting point; |
|
● |
cash flows are based on contractual maturity and amortization schedules with applicable prepayments derived from internal historical data and external sources; and |
|
● |
cash flows are reinvested into similar instruments to keep interest-earning asset and interest-bearing liability levels constant. |
The following table illustrates the simulated impact of parallel and instantaneous interest rate shocks of +400 basis points, +200 basis points and -100 basis points on net interest income and the change in economic value over a one-year time horizon from the December 31, 2017 levels:
|
Rates +200 |
Rates +400 |
Rates -100 |
||||||||||||||||||||||
|
Simulation |
Policy |
Simulation |
Policy |
Simulation |
Policy |
|||||||||||||||||||
|
Results |
Limit |
Results |
Limit |
Results |
Limit |
|||||||||||||||||||
|
Earnings at risk: |
||||||||||||||||||||||||
|
Percent change in net interest income |
(2.9 | )% | (10.0 | )% | (6.4 | )% | (20.0 | )% | (2.8 | )% | (5.0 | )% | ||||||||||||
|
Economic value at risk: |
||||||||||||||||||||||||
|
Percent change in economic value of equity |
(5.0 | )% | (20.0 | )% | (10.4 | )% | (35.0 | )% | (6.1 | )% | (10.0 | )% | ||||||||||||
FNCB was liability rate sensitive at December 31, 2017, as a greater volume of interest-bearing liabilities than interest-earning assets will mature or reprice within a one-year time frame, due to a significant amount of non-maturity, interest-bearing deposit balances at the end of the period. Accordingly, model results at December 31, 2017 indicate that FNCB’s net interest income and economic value of equity are expected to decrease 2.9% and 5.0%, respectively, under a 200-basis point interest rate shock. In comparison, model results at December 31, 2016 indicated net interest income was expected to decrease 2.0% and 4.3% given +200 and +400 basis point rate shocks. Model results at December 31, 2017 continue to indicate that FNCB is short-term liability sensitive and long-term asset sensitive.
This analysis does not represent a forecast for FNCB and should not be relied upon as being indicative of expected operating results. These simulations are based on numerous assumptions: the nature and timing of interest rate levels, prepayments on loans and securities, deposit decay rates, pricing decisions on loans and deposits, reinvestment/replacements of asset and liability cash flows, and other factors. While assumptions reflect current economic and local market conditions, FNCB cannot make any assurances as to the predictive nature of these assumptions, including changes in interest rates, customer preferences, competition and liquidity needs, or what actions ALCO might take in responding to these changes.
As previously mentioned, as part of its ongoing monitoring, ALCO requires back testing of modeling results, which involves after-the-fact comparisons of projections with FNCB’s actual performance to measure the validity of assumptions used in the modeling techniques. As part of its quarterly review, management compared tax-equivalent net interest income recorded for the three months ended December 31, 2017 with tax-equivalent net interest income that was projected for the same three-month period. The variance between actual and projected tax-equivalent net interest income for the three-month period ended December 31, 2017 was $180 thousand or 2.0%. Although the variance was deemed immaterial, ALCO performs a rate/volume analysis between actual and projected results to continue to improve the accuracy of its simulation models.
Item 8. Financial Statements and Supplementary Data.
Report of Independent Registered Public Accounting Firm
Shareholders and Board of Directors of
FNCB Bancorp, Inc. and Subsidiaries
We have audited the accompanying consolidated statements of financial condition of FNCB Bancorp, Inc. and Subsidiaries (the "Company") as of December 31, 2017 and 2016, and the related consolidated statements of income, comprehensive income, changes in shareholders’ equity, and cash flows, for each of the three years in the period ended December 31, 2017, and the related notes (collectively referred to as the "consolidated financial statements"). We also have audited the Company’s internal control over financial reporting as of December 31, 2017, based on criteria established in Internal Control – Integrated Framework: (2013) issued by the Committee of Sponsoring Organizations of the Treadway Commission (“COSO”).
In our opinion, the consolidated financial statements present fairly, in all material respects, the financial position of the Company as of December 31, 2017 and 2016, and the results of its operations and its cash flows for each of the three years in the period ended December 31, 2017, in conformity with accounting principles generally accepted in the United States of America. Also in our opinion, the Company maintained, in all material respects, effective internal control over financial reporting as of December 31, 2017, based on criteria established in Internal Control – Integrated Framework: (2013) issued by COSO.
Basis for Opinion
The Company’s management is responsible for these consolidated financial statements, for maintaining effective internal control over financial reporting, and for its assessment of the effectiveness of internal control over financial reporting, included in the accompanying Management’s Report on Internal Control over Financial Reporting. Our responsibility is to express an opinion on the Company's consolidated financial statements and an opinion on the Company’s internal control over financial reporting based on our audits. We are a public accounting firm registered with the Public Company Accounting Oversight Board (United States) ("PCAOB") and are required to be independent with respect to the Company in accordance with the U.S. federal securities laws and the applicable rules and regulations of the Securities and Exchange Commission and the PCAOB.
We conducted our audits in accordance with the standards of the PCAOB. Those standards require that we plan and perform the audit to obtain reasonable assurance about whether the consolidated financial statements are free of material misstatement, whether due to error or fraud and whether effective internal control over financial reporting was maintained in all material respects.
Our audits of the financial statements included performing procedures to assess the risks of material misstatement of the consolidated financial statements, whether due to error or fraud, and performing procedures that respond to those risks. Such procedures included examining, on a test basis, evidence regarding the amounts and disclosures in the consolidated financial statements. Our audits also included evaluating the accounting principles used and significant estimates made by management, as well as evaluating the overall presentation of the consolidated financial statements. Our audit of internal control over financial reporting included obtaining an understanding of internal control over financial reporting, assessing the risk that a material weakness exists, and testing and evaluating the design and operating effectiveness of internal control based on the assessed risk. Our audits also included performing such other procedures as we considered necessary in the circumstances. We believe that our audits provide a reasonable basis for our opinion.
Definition and Limitations of Internal Control Over Financial Reporting
A company's internal control over financial reporting is a process designed to provide reasonable assurance regarding the reliability of financial reporting and the preparation of financial statements for external purposes in accordance with generally accepted accounting principles. A company's internal control over financial reporting includes those policies and procedures that (1) pertain to the maintenance of records that, in reasonable detail, accurately and fairly reflect the transactions and dispositions of the assets of the company; (2) provide reasonable assurance that transactions are recorded as necessary to permit preparation of financial statements in accordance with generally accepted accounting principles, and that receipts and expenditures of the company are being made only in accordance with authorizations of management and directors of the company; and (3) provide reasonable assurance regarding prevention or timely detection of unauthorized acquisition, use, or disposition of the company's assets that could have a material effect on the financial statements.
Because of its inherent limitations, internal control over financial reporting may not prevent or detect misstatements. Also, projections of any evaluation of effectiveness to future periods are subject to the risk that controls may become inadequate because of changes in conditions, or that the degree of compliance with the policies or procedures may deteriorate.
/s/Baker Tilly Virchow Krause, LLP
Wilkes-Barre, Pennsylvania
We have served as the Company’s auditor since 2014.
March 9, 2018
|
FNCB BANCORP, INC. AND SUBSIDIARIES |
|||||
|
CONSOLIDATED STATEMENTS OF FINANCIAL CONDITION |
|
December 31, |
December 31, |
|||||||
|
(in thousands, except share data) |
2017 |
2016 |
||||||
|
Assets |
||||||||
|
Cash and cash equivalents: |
||||||||
|
Cash and due from banks |
$ | 22,755 | $ | 20,562 | ||||
|
Interest-bearing deposits in other banks |
14,991 | 91,883 | ||||||
|
Total cash and cash equivalents |
37,746 | 112,445 | ||||||
|
Securities available for sale, at fair value |
290,387 | 276,015 | ||||||
|
Stock in Federal Home Loan Bank of Pittsburgh, at cost |
2,753 | 3,311 | ||||||
|
Loans held for sale |
1,095 | 596 | ||||||
|
Loans, net of allowance for loan and lease losses of $9,034 and $8,419 |
761,609 | 722,860 | ||||||
|
Bank premises and equipment, net |
10,388 | 10,784 | ||||||
|
Accrued interest receivable |
3,234 | 2,757 | ||||||
|
Bank-owned life insurance |
30,460 | 29,933 | ||||||
|
Other real estate owned |
1,023 | 2,048 | ||||||
|
Net deferred tax assets |
15,785 | 26,875 | ||||||
|
Other assets |
7,825 | 7,975 | ||||||
|
Total assets |
$ | 1,162,305 | $ | 1,195,599 | ||||
|
Liabilities |
||||||||
|
Deposits: |
||||||||
|
Demand (non-interest-bearing) |
$ | 176,325 | $ | 173,702 | ||||
|
Interest-bearing |
826,123 | 841,437 | ||||||
|
Total deposits |
1,002,448 | 1,015,139 | ||||||
|
Borrowed funds: |
||||||||
|
Federal Home Loan Bank of Pittsburgh advances |
44,968 | 58,537 | ||||||
|
Subordinated debentures |
5,000 | 10,000 | ||||||
|
Junior subordinated debentures |
10,310 | 10,310 | ||||||
|
Total borrowed funds |
60,278 | 78,847 | ||||||
|
Accrued interest payable |
241 | 242 | ||||||
|
Other liabilities |
10,147 | 11,000 | ||||||
|
Total liabilities |
1,073,114 | 1,105,228 | ||||||
|
Shareholders' equity |
||||||||
|
Preferred shares ($1.25 par) |
||||||||
|
Authorized: 20,000,000 shares at December 31, 2017 and December 31, 2016 |
||||||||
|
Issued and outstanding: 0 shares at December 31, 2017 and December 31, 2016 |
- | - | ||||||
|
Common shares ($1.25 par) |
||||||||
|
Authorized: 50,000,000 shares at December 31, 2017 and December 31, 2016 |
||||||||
|
Issued and outstanding: 16,757,963 shares at December 31, 2017 and 16,645,845 shares at December 31, 2016 |
20,947 | 20,807 | ||||||
|
Additional paid-in capital |
63,210 | 62,593 | ||||||
|
Retained earnings |
6,779 | 8,531 | ||||||
|
Accumulated other comprehensive loss |
(1,745 | ) | (1,560 | ) | ||||
|
Total shareholders' equity |
89,191 | 90,371 | ||||||
|
Total liabilities and shareholders’ equity |
$ | 1,162,305 | $ | 1,195,599 | ||||
|
The accompanying notes to consolidated financial statements are an integral part of these statements. |
|
FNCB BANCORP, INC. AND SUBSIDIARIES |
|
CONSOLIDATED STATEMENTS OF INCOME |
|
For the Year Ended December 31, |
||||||||||||
|
(in thousands, except share data) |
2017 |
2016 |
2015 |
|||||||||
|
Interest income |
||||||||||||
|
Interest and fees on loans |
$ | 29,821 | $ | 27,993 | $ | 26,568 | ||||||
|
Interest and dividends on securities: |
||||||||||||
|
U.S. government agencies |
3,426 | 3,557 | 4,036 | |||||||||
|
State and political subdivisions, tax-free |
49 | 46 | 109 | |||||||||
|
State and political subdivisions, taxable |
3,809 | 2,574 | 905 | |||||||||
|
Other securities |
563 | 545 | 537 | |||||||||
|
Total interest and dividends on securities |
7,847 | 6,722 | 5,587 | |||||||||
|
Interest on interest-bearing deposits in other banks |
180 | 33 | 46 | |||||||||
|
Total interest income |
37,848 | 34,748 | 32,201 | |||||||||
|
Interest expense |
||||||||||||
|
Interest on deposits |
3,521 | 2,730 | 2,631 | |||||||||
|
Interest on borrowed funds: |
||||||||||||
|
Interest on Federal Home Loan Bank of Pittsburgh advances |
599 | 595 | 514 | |||||||||
|
Interest on subordinated debentures |
380 | 625 | 1,450 | |||||||||
|
Interest on junior subordinated debentures |
300 | 247 | 206 | |||||||||
|
Total interest on borrowed funds |
1,279 | 1,467 | 2,170 | |||||||||
|
Total interest expense |
4,800 | 4,197 | 4,801 | |||||||||
|
Net interest income before provision (credit) for loan and lease losses |
33,048 | 30,551 | 27,400 | |||||||||
|
Provision (credit) for loan and lease losses |
769 | 1,153 | (1,345 | ) | ||||||||
|
Net interest income after provision (credit) for loan and lease losses |
32,279 | 29,398 | 28,745 | |||||||||
|
Non-interest income |
||||||||||||
|
Deposit service charges |
2,903 | 2,892 | 2,960 | |||||||||
|
Net gain on the sale of available-for-sale securities |
1,597 | 960 | 2,296 | |||||||||
|
Net gain on the sale of mortgage loans held for sale |
304 | 340 | 292 | |||||||||
|
Net gain on the sale of SBA guaranteed loans |
79 | 51 | - | |||||||||
|
Net gain on the sale of other repossessed assets |
47 | - | - | |||||||||
|
Net gain on the sale of other real estate owned |
79 | 49 | 162 | |||||||||
|
Loan-related fees |
384 | 439 | 442 | |||||||||
|
Income from bank-owned life insurance |
527 | 552 | 564 | |||||||||
|
Other |
1,305 | 920 | 1,084 | |||||||||
|
Total non-interest income |
7,225 | 6,203 | 7,800 | |||||||||
|
Non-interest expense |
||||||||||||
|
Salaries and employee benefits |
14,161 | 14,320 | 13,810 | |||||||||
|
Occupancy expense |
2,105 | 1,777 | 2,284 | |||||||||
|
Equipment expense |
1,815 | 1,732 | 1,657 | |||||||||
|
Advertising expense |
623 | 554 | 483 | |||||||||
|
Data processing expense |
2,023 | 1,997 | 1,976 | |||||||||
|
Regulatory assessments |
686 | 729 | 950 | |||||||||
|
Bank shares tax |
800 | 836 | 705 | |||||||||
|
Expense of other real estate owned |
488 | 409 | 400 | |||||||||
|
Legal expense |
128 | 362 | 437 | |||||||||
|
Professional fees |
956 | 961 | 1,014 | |||||||||
|
Insurance expense |
519 | 516 | 659 | |||||||||
|
Legal settlements |
- | - | 777 | |||||||||
|
Other losses |
503 | 277 | 281 | |||||||||
|
Other operating expenses |
3,262 | 3,075 | 3,031 | |||||||||
|
Total non-interest expense |
28,069 | 27,545 | 28,464 | |||||||||
|
Income before income tax expense (benefit) |
11,435 | 8,056 | 8,081 | |||||||||
|
Income tax expense (benefit) |
11,288 | 1,747 | (27,759 | ) | ||||||||
|
Net income |
$ | 147 | $ | 6,309 | $ | 35,840 | ||||||
|
Earnings per share |
||||||||||||
|
Basic |
$ | 0.01 | $ | 0.38 | $ | 2.17 | ||||||
|
Diluted |
$ | 0.01 | $ | 0.38 | $ | 2.17 | ||||||
|
Cash dividends declared per common share |
$ | 0.13 | $ | 0.09 | $ | - | ||||||
|
WEIGHTED AVERAGE NUMBER OF SHARES OUTSTANDING: |
||||||||||||
|
Basic |
16,722,966 | 16,571,262 | 16,499,622 | |||||||||
|
Diluted |
16,740,288 | 16,572,695 | 16,499,622 | |||||||||
|
The accompanying notes to consolidated financial statements are an integral part of these statements. |
|
FNCB BANCORP, INC. AND SUBSIDIARIES |
|||||||
|
CONSOLIDATED STATEMENTS OF COMPREHENSIVE INCOME |
|
For the Year Ended December 31, |
||||||||||||
|
(in thousands) |
2017 |
2016 |
2015 |
|||||||||
|
Net income |
$ | 147 | $ | 6,309 | $ | 35,840 | ||||||
|
Other comprehensive income (loss): |
||||||||||||
|
Unrealized gains (losses) on securities available for sale |
1,752 | (1,312 | ) | 479 | ||||||||
|
Taxes |
(596 | ) | 447 | (163 | ) | |||||||
|
Net of tax amount |
1,156 | (865 | ) | 316 | ||||||||
|
Reclassification adjustment for gains included in net income |
(1,597 | ) | (960 | ) | (2,296 | ) | ||||||
|
Taxes |
543 | 326 | 781 | |||||||||
|
Net of tax amount |
(1,054 | ) | (634 | ) | (1,515 | ) | ||||||
|
Total other comprehensive income (loss) |
102 | (1,499 | ) | (1,199 | ) | |||||||
|
Comprehensive income |
$ | 249 | $ | 4,810 | $ | 34,641 | ||||||
|
The accompanying notes to consolidated financial statements are an integral part of these statements. |
|
FNCB BANCORP, INC. AND SUBSIDIARIES |
|
CONSOLIDATED STATEMENTS OF CHANGES IN SHAREHOLDERS' EQUITY |
|
For the Years Ended December 31, 2017, 2016 and 2015 |
|
Accumulated |
Accumulated |
|||||||||||||||||||||||
|
Number |
Additional |
(Deficit) / |
Other |
Total |
||||||||||||||||||||
|
of Common |
Common |
Paid-in |
Retained |
Comprehensive |
Shareholders' |
|||||||||||||||||||
|
(in thousands, except share data) |
Shares |
Stock |
Capital |
Earnings |
Income (Loss) |
Equity |
||||||||||||||||||
|
Balances, December 31, 2014 |
16,484,419 | $ | 20,605 | $ | 61,781 | $ | (32,126 | ) | $ | 1,138 | $ | 51,398 | ||||||||||||
|
Net income for the year |
- | - | - | 35,840 | - | 35,840 | ||||||||||||||||||
|
Stock-based compensation |
13,300 | 17 | 52 | - | - | 69 | ||||||||||||||||||
|
Common shares issued under long-term incentive compensation plan |
16,526 | 21 | (21 | ) | - | - | - | |||||||||||||||||
|
Restricted stock awards |
- | - | 247 | - | - | 247 | ||||||||||||||||||
|
Other comprehensive loss, net of tax of $618 |
- | - | - | - | (1,199 | ) | (1,199 | ) | ||||||||||||||||
|
Balances, December 31, 2015 |
16,514,245 | $ | 20,643 | $ | 62,059 | $ | 3,714 | $ | (61 | ) | $ | 86,355 | ||||||||||||
|
Net income for the year |
- | - | - | 6,309 | - | 6,309 | ||||||||||||||||||
|
Cash dividends declared, $0.09 per share |
- | - | - | (1,492 | ) | - | (1,492 | ) | ||||||||||||||||
|
Common shares issued under long-term incentive compensation plan |
52,848 | 66 | (66 | ) | - | - | - | |||||||||||||||||
|
Restricted stock awards |
- | - | 265 | - | - | 265 | ||||||||||||||||||
|
Common shares issued through dividend reinvestment / optional cash purchase plan |
78,752 | 98 | 335 | - | - | 433 | ||||||||||||||||||
|
Other comprehensive loss, net of tax of $773 |
- | - | - | - | (1,499 | ) | (1,499 | ) | ||||||||||||||||
|
Balances, December 31, 2016 |
16,645,845 | $ | 20,807 | $ | 62,593 | $ | 8,531 | $ | (1,560 | ) | $ | 90,371 | ||||||||||||
|
Net income for the year |
- | - | - | 147 | - | 147 | ||||||||||||||||||
|
Cash dividends declared, $0.13 per share |
- | - | - | (2,176 | ) | - | (2,176 | ) | ||||||||||||||||
|
Common shares issued under long-term incentive compensation plan |
46,878 | 58 | (58 | ) | - | - | - | |||||||||||||||||
|
Restricted stock awards |
- | - | 301 | - | - | 301 | ||||||||||||||||||
|
Common shares issued through dividend reinvestment / optional cash purchase plan |
65,240 | 82 | 374 | (10 | ) | - | 446 | |||||||||||||||||
|
Reclassification of impact of income tax rate change on unrealized losses on securities available for sale |
- | - | - | 287 | (287 | ) | - | |||||||||||||||||
|
Other comprehensive income, net of tax of $53 |
- | - | - | - | 102 | 102 | ||||||||||||||||||
|
Balances, December 31, 2017 |
16,757,963 | $ | 20,947 | $ | 63,210 | $ | 6,779 | $ | (1,745 | ) | $ | 89,191 | ||||||||||||
|
The accompanying notes to consolidated financial statements are an integral part of these statements. |
|
FNCB BANCORP, INC AND SUBSIDIARIES |
|
For the Year Ended December 31, |
||||||||||||
|
(in thousands) |
2017 |
2016 |
2015 |
|||||||||
|
Cash flows from operating activities: |
||||||||||||
|
Net income |
$ | 147 | $ | 6,309 | $ | 35,840 | ||||||
|
Adjustments to reconcile net income to net cash provided by operating activities: |
||||||||||||
|
Investment securities amortization, net |
931 | 1,165 | 1,423 | |||||||||
|
Equity in trust |
(9 | ) | (7 | ) | (6 | ) | ||||||
|
Depreciation and amortization |
2,516 | 2,604 | 1,703 | |||||||||
|
Valuation adjustment for loan servicing rights |
(6 | ) | 5 | - | ||||||||
|
Provision (credit) for loan and lease losses |
769 | 1,153 | (1,345 | ) | ||||||||
|
Valuation adjustment for off-balance sheet commitments |
133 | (51 | ) | (117 | ) | |||||||
|
Stock-based compensation expense |
301 | 265 | 316 | |||||||||
|
Net gain on the sale of available-for-sale securities |
(1,597 | ) | (960 | ) | (2,296 | ) | ||||||
|
Net gain on the sale of mortgage loans held for sale |
(304 | ) | (340 | ) | (292 | ) | ||||||
|
Net gain on the sale of other repossessed assets |
(47 | ) | - | - | ||||||||
|
Loss on the disposition of bank premises and equipment |
64 | - | - | |||||||||
|
Net gain on the sale of SBA guaranteed loans |
(79 | ) | (51 | ) | - | |||||||
|
Net gain on the sale of other real estate owned |
(79 | ) | (49 | ) | (162 | ) | ||||||
|
Valuation adjustment of other real estate owned |
307 | 169 | 208 | |||||||||
|
Income from bank-owned life insurance |
(527 | ) | (552 | ) | (564 | ) | ||||||
|
Proceeds from the sale of mortgage loans held for sale |
12,737 | 9,817 | 8,210 | |||||||||
|
Funds used to originate mortgage loans held for sale |
(12,932 | ) | (9,390 | ) | (7,998 | ) | ||||||
|
Decrease (increase) in net deferred tax assets |
11,037 | 1,613 | (27,684 | ) | ||||||||
|
Increase in accrued interest receivable |
(477 | ) | (282 | ) | (400 | ) | ||||||
|
(Increase) decrease in prepaid expenses and other assets |
(138 | ) | 496 | 917 | ||||||||
|
(Decrease) increase in accrued interest payable |
(1 | ) | (10,923 | ) | 903 | |||||||
|
Decrease in accrued expenses and other liabilities |
(979 | ) | (558 | ) | (4,195 | ) | ||||||
|
Total adjustments |
11,620 | (5,876 | ) | (31,379 | ) | |||||||
|
Net cash provided by operating activities |
11,767 | 433 | 4,461 | |||||||||
|
Cash flows from investing activities: |
||||||||||||
|
Maturities, calls and principal payments of securities available for sale |
8,895 | 6,264 | 8,615 | |||||||||
|
Proceeds from the sale of securities available for sale |
132,240 | 32,588 | 88,658 | |||||||||
|
Purchases of securities available for sale |
(154,686 | ) | (60,302 | ) | (133,269 | ) | ||||||
|
Redemption (purchase) of the stock in Federal Home Loan Bank of Pittsburgh |
558 | 3,033 | (3,541 | ) | ||||||||
|
Redemption of Federal Reserve Bank stock |
- | 1,351 | - | |||||||||
|
Net increase in loans to customers |
(41,519 | ) | (5,656 | ) | (68,665 | ) | ||||||
|
Proceeds from the sale of SBA guaranteed loans |
979 | 1,315 | - | |||||||||
|
Proceeds from the sale of other repossessed assets |
280 | - | - | |||||||||
|
Proceeds from the sale of other real estate owned |
870 | 1,928 | 758 | |||||||||
|
Purchases of bank premises and equipment |
(1,093 | ) | (861 | ) | (1,419 | ) | ||||||
|
Net cash used in investing activities |
(53,476 | ) | (20,340 | ) | (108,863 | ) | ||||||
|
Cash flows from financing activities: |
||||||||||||
|
Net (decrease) increase in deposits |
(12,691 | ) | 193,593 | 26,210 | ||||||||
|
Net (repayment of) proceeds from Federal Home Loan Bank of Pittsburgh advances - overnight |
- | (60,500 | ) | 60,500 | ||||||||
|
Proceeds from Federal Home Loan Bank of Pittsburgh advances - term |
59,804 | 46,915 | 151,300 | |||||||||
|
Repayment of Federal Home Loan Bank of Pittsburgh advances - term |
(73,373 | ) | (63,680 | ) | (137,192 | ) | ||||||
|
Principal reduction on subordinated debentures |
(5,000 | ) | (4,000 | ) | (11,000 | ) | ||||||
|
Proceeds from issuance of common shares |
456 | 433 | - | |||||||||
|
Discount on optional cash purchase plan |
(10 | ) | - | - | ||||||||
|
Cash dividends paid |
(2,176 | ) | (1,492 | ) | - | |||||||
|
Net cash (used in) provided by financing activities |
(32,990 | ) | 111,269 | 89,818 | ||||||||
|
Net (decrease) increase in cash and cash equivalents |
(74,699 | ) | 91,362 | (14,584 | ) | |||||||
|
Cash and cash equivalents at beginning of year |
112,445 | 21,083 | 35,667 | |||||||||
|
Cash and cash equivalents at end of year |
$ | 37,746 | $ | 112,445 | $ | 21,083 | ||||||
|
Supplemental cash flow information |
||||||||||||
|
Cash paid during the period for: |
||||||||||||
|
Interest |
$ | 4,801 | $ | 15,120 | $ | 3,898 | ||||||
|
Income taxes |
210 | 10 | 22 | |||||||||
|
Other transactions: |
||||||||||||
|
Principal balance of loans transferred to other real estate owned |
80 | 1,210 | 3,697 | |||||||||
|
Government guarantee receivable on loans transferred to other real estate owned or other assets |
- | - | (1,980 | ) | ||||||||
|
Change in deferred gain on sale of other real estate owned |
(7 | ) | (8 | ) | 14 | |||||||
The accompanying notes to consolidated financial statements are an integral part of these statements.
Notes to Consolidated Financial Statements
Note 1. ORGANIZATION
FNCB Bancorp, Inc. is a registered bank holding company under the Bank Holding Company Act of 1956 incorporated under the laws of the Commonwealth of Pennsylvania in 1997. It is the parent company of FNCB Bank (the “Bank”) and the Bank’s wholly owned subsidiaries FNCB Realty Company, Inc., FNCB Realty Company I, LLC, and FNCB Realty Company II, LLC. Unless the context otherwise requires, the term “FNCB” is used to refer to FNCB Bancorp, Inc., and its subsidiaries. In certain circumstances, however, the term “FNCB” refers to FNCB Bancorp, Inc., itself.
The Bank provides customary banking services to individuals and businesses through its 18 banking locations located in northeastern Pennsylvania and its Limited Purpose Banking Office (“LPO”) in Allentown, Lehigh County, Pennsylvania.
FNCB Realty Company, Inc., FNCB Realty Company I, LLC, and FNCB Realty Company II, LLC were formed to hold real estate and/or operate businesses acquired in exchange for debt settlement or foreclosure.
On June 30, 2016, First National Community Bancorp, Inc., the parent company of First National Community Bank, announced that following receipt of required regulatory approvals from the Pennsylvania Department of Banking and Securities, First National Community Bank had completed a charter conversion from a national bank to a Pennsylvania state bank and, as a result of the conversion, First National Community Bank changed its legal name to FNCB Bank. Both the charter conversion and legal name change became effective June 30, 2016. On October 4, 2016, First National Community Bancorp, Inc., the parent company of FNCB Bank, filed an amendment to its articles of incorporation to change its name, effective October 17, 2016, to “FNCB Bancorp, Inc.” The Board of Directors also amended its bylaws, effective October 17, 2016, to reflect the new name.
In December 2006, First National Community Statutory Trust I (“Issuing Trust”), which is wholly owned by FNCB, was formed under Delaware law to provide FNCB with an additional funding source through the issuance of pooled trust preferred securities. FNCB has adopted Accounting Standards Codification (“ASC”) 810-10, Consolidation, for the Issuing Trust. Accordingly, the Issuing Trust has not been consolidated with the accounts of FNCB, because FNCB is not the primary beneficiary of the trust.
Note 2. SUMMARY OF SIGNIFICANT ACCOUNTING POLICIES
Basis of Presentation
The consolidated financial statements of FNCB are comprised of the accounts of FNCB Bancorp, Inc., the Bank, and the Bank’s wholly-owned subsidiaries. All inter-company transactions and balances have been eliminated in consolidation. The accounting and reporting policies of FNCB conform to accounting principles generally accepted in the United States of America (“GAAP”), Regulation S-X and general practices within the banking industry. Prior period amounts have been reclassified when necessary to conform to the current year’s presentation. Such reclassifications did not have a material impact on the operating results or financial position of FNCB.
The preparation of financial statements in accordance with GAAP requires management to make estimates and assumptions that affect the reported amounts of assets and liabilities and disclosure of contingent assets and liabilities at the date of the consolidated financial statements and the reported amounts of revenues and expenses during the reporting period. Actual results could differ significantly from those estimates. Material estimates that are particularly susceptible to change in the near term are the allowance for loan and lease losses (“ALLL”), securities’ valuation and impairment evaluation, the valuation of other real estate owned (“OREO”), and income taxes.
Cash Equivalents
For purposes of reporting cash flows, cash equivalents include cash on hand and amounts due from banks.
Securities
FNCB classifies investment securities as either held-to-maturity or available-for-sale at the time of purchase. Investment securities that are classified as held-to-maturity are carried at amortized cost when management has the positive intent and ability to hold them to maturity. Investment securities that are classified as available-for-sale are carried at fair value with unrealized holding gains and losses recognized as a component of shareholders’ equity in accumulated other comprehensive loss, net of tax. Premiums and discounts are amortized or accreted over the life of the related security as an adjustment to yield using the interest method. Realized gains and losses on sales of investment securities are based on amortized cost using the specific identification method on the trade date.
On a quarterly basis, management evaluates each of its investment securities classified as held-to-maturity or available-for-sale in an unrealized loss position for other than temporary impairment (“OTTI”). An individual security is considered impaired when its current fair value is less than its amortized cost basis. As part of its evaluation, management considers the following factors, among other things, in determining whether the security’s impairment is other than temporary:
|
● |
the length of time and extent of the impairment; |
|
● |
the causes of the decline in fair value, such as credit deterioration, interest rate fluctuations, or market volatility; |
|
● |
adverse industry or geographic conditions; |
|
● |
historical implied volatility; |
|
● |
payment structure of the security and whether FNCB expects to receive all contractual cash flows; |
|
● |
failure of the issuer to make contractual interest or principal payments in the past; |
|
● |
changes in the security’s rating; and |
|
● |
recoveries or additional declines in the security’s fair value subsequent to the balance sheet date. |
Based on current authoritative guidance, when a held-to-maturity or available-for-sale debt security is assessed for OTTI, management must first consider (a) whether management intends to sell the security and (b) whether it is more likely than not that FNCB will be required to sell the security prior to recovery of its amortized cost basis. If one of these circumstances applies to a security, an OTTI loss is recognized in the statement of income equal to the full amount of the decline in fair value below amortized cost. If neither of these circumstances applies to a security, but FNCB does not expect to recover the entire amortized cost basis, an OTTI loss has occurred that must be separated into two categories: (a) the amount related to credit loss and (b) the amount related to other factors (such as market risk). In assessing the level of OTTI attributable to credit loss, management compares the present value of cash flows expected to be collected with the amortized cost basis of the security. The portion of the total OTTI related to credit loss is identified as the amount of principal cash flows not expected to be received over the remaining term of the security as estimated based on cash flow projections discounted at the applicable original yield of the security, and is recognized in earnings, while the amount related to other factors is recognized in other comprehensive income. The total OTTI loss is presented in the statement of income less the portion recognized in other comprehensive income. When a debt security becomes other-than-temporarily impaired, its amortized cost basis is reduced to reflect the portion of the total impairment related to credit loss.
For equity securities, FNCB evaluates whether or not the unrealized loss is expected to be recovered based on evidence to support a realizable value equal to or greater than the amortized cost basis. If it is probable that the amortized cost basis will not be recovered, taking into consideration the estimated recovery period and ability of FNCB to hold the security until recovery, the entire difference between the security’s cost basis and its fair value is recognized in earnings at the balance sheet date.
Investment in FHLB of Pittsburgh stock has limited marketability, is carried at cost and is evaluated for impairment based on FNCB’s determination of the ultimate recoverability of the par value of the stock. FNCB’s investment in FHLB of Pittsburgh stock totaled $2.8 million and $3.3 million at December 31, 2017 and 2016, respectively. Management noted no indicators of impairment for the FHLB of Pittsburgh stock at December 31, 2017.
Loans and Loan Origination Fees and Costs
Loans receivable, other than loans held for sale, are stated at the principal outstanding, net of unamortized loan fees and costs, unearned income, partial charge-offs and the allowance for loan and lease losses. Interest income on all loans is recognized using the effective interest method. Loan origination and commitment fees, as well as certain direct loan origination costs, are deferred and the net amount is amortized as an adjustment of the related loan’s yield. FNCB generally amortizes these amounts over the life of the related loan. Amortization of deferred loan fees or costs is discontinued when a loan is placed on non-accrual status.
Loans are placed on non-accrual when a loan is specifically determined to be impaired or when management believes that the collection of interest or principal is doubtful. This generally occurs when a default of interest or principal has existed for 90 days or more, unless the loan is well secured and in the process of collection, or when management becomes aware of facts or circumstances that the loan would default before 90 days. FNCB determines delinquency status based on the number of days since the date of the borrower’s last required contractual loan payment. When the interest accrual is discontinued, all unpaid interest income is reversed and charged back against current earnings. Any subsequent cash payments received are applied, first to the outstanding loan amounts, then to the recovery of any charged-off loan amounts, with any excess treated as a recovery of lost interest. A non-accrual loan is returned to accrual status when the loan is current as to principal and interest payments, is performing according to contractual terms for six consecutive months and future payments are reasonably assured.
In accordance with federal regulations, prior to making, extending, renewing or advancing additional funds in excess of $250 thousand on a loan secured by real estate, FNCB requires an appraisal of the property by an independent, state-certified or state-licensed appraiser (depending upon collateral type and loan amount) that is approved by the Board of Directors. Appraisals are reviewed internally or by an independent third party engaged by FNCB. Generally, management obtains a new appraisal when a loan is deemed impaired. These appraisals may be more limited in scope than those obtained at the initial underwriting of the loan.
Troubled Debt Restructurings
FNCB considers a loan to be a troubled debt restructuring (“TDR”) when it grants a concession to the borrower for legal or economic reasons related to the borrower’s financial difficulties that it would not otherwise consider. Such concessions granted generally involve a reduction of the stated interest rate, an extension of a loan’s stated maturity date, payment modifications, capitalization of real estate taxes, or a combination of these modifications. Non-accrual TDRs are returned to accrual status if principal and interest payments, under the modified terms, are brought current, are performing under the modified terms for six consecutive months, and management believes that collection of the remaining interest and principal is probable.
Loan Impairment
A loan is considered impaired when it is probable that FNCB will be unable to collect all amounts due (including principal and interest) according to the contractual terms of the note and loan agreement. For purposes of the impairment analysis, all TDRs, loan relationships with an aggregate outstanding balance greater than $100 thousand rated substandard and non-accrual, and loans that are identified as doubtful or loss, are considered impaired. Impaired loans are analyzed individually to determine the amount of impairment. For collateral-dependent loans, impairment is measured based on the fair value of the collateral supporting the loans. A loan is considered to be collateral dependent when repayment of the loan is expected to be provided through the liquidation of the collateral held. For impaired loans that are secured by real estate, external appraisals are obtained annually, or more frequently as warranted, to ascertain a fair value so that the impairment analysis can be updated. Should a current appraisal not be available at the time of impairment analysis, other sources of valuation may be used including current letters of intent, broker price opinions or executed agreements of sale. For non-collateral dependent impaired loans, impairment is measured based on the present value of expected future cash flows, net of any unamortized deferred fees and costs, and discounted at the loan’s original effective interest rate.
Generally, all loans with balances of $100 thousand or less are considered within homogeneous pools and are not individually evaluated for impairment. However, individual loans with balances of $100 thousand or less are individually evaluated for impairment if that loan is part of a larger impaired loan relationship or the loan is a TDR.
Impaired loans, or portions thereof, are charged-off upon determination that all or a portion of the loan balance is uncollectible and exceeds the fair value of the collateral. A loan is considered uncollectible when the borrower is delinquent with respect to principal or interest repayment and it is unlikely that the borrower will have the ability to pay the debt in a timely manner, collateral value is insufficient to cover the outstanding indebtedness and the guarantors (if applicable) do not provide adequate support for the loan.
Allowance for Loan and Lease Losses
Management evaluates the credit quality of FNCB’s loan portfolio on an ongoing basis, and performs a formal review of the adequacy of the ALLL on a quarterly basis. The ALLL is established through a provision for loan losses charged to earnings and is maintained at a level management considers adequate to absorb estimated probable losses inherent in the loan portfolio as of the evaluation date. Loans, or portions of loans, determined by management to be uncollectible are charged off against the ALLL, while recoveries of amounts previously charged off are credited to the ALLL.
Determining the amount of the ALLL is considered a critical accounting estimate because it requires significant judgment and the use of estimates related to the amount and timing of expected future cash flows on impaired loans, estimated losses on pools of homogeneous loans based on historical loss experience, qualitative factors, and consideration of current economic trends and conditions, all of which may be susceptible to significant change. Banking regulators, as an integral part of their examination of FNCB, also review the ALLL, and may require, based on their judgments about information available to them at the time of their examination, that certain loan balances be charged off or require that adjustments be made to the ALLL. Additionally, the ALLL is determined, in part, by the composition and size of the loan portfolio.
The ALLL consists of two components, a specific component and a general component. The specific component relates to loans that are classified as impaired. For such loans, an allowance is established when the discounted cash flows, collateral value or observable market price of the impaired loan is lower than the carrying value of that loan. The general component covers all other loans and is based on historical loss experience adjusted for qualitative factors. The general reserve component of the ALLL is based on pools of unimpaired loans segregated by loan segment and risk rating categories of “Pass”, “Special Mention” or “Substandard and Accruing.” Historical loss factors and various qualitative factors are applied based on the risk profile in each risk rating category to determine the appropriate reserve related to those loans. Substandard loans on nonaccrual status above the $100 thousand loan relationship threshold and all loans considered TDRs are classified as impaired. Based on its evaluation, management may establish an unallocated component for a respective loan segment (as discussed below) when the actual historical loss experience for that loan segment results in an overall negative historical loss factor.
When establishing the ALLL, management categorizes loans into the following loan segments that are based generally on the nature of the collateral and basis of repayment. The risk characteristics of FNCB’s loan segments are as follows:
Construction, Land Acquisition and Development Loans - These loans consist of loans secured by real estate, with the purpose of constructing one- to four-family homes, residential developments and various commercial properties including shopping centers, office complexes and single-purpose, owner-occupied structures. Additionally, loans in this category include loans for land acquisition, secured by raw land. FNCB’s construction program offers either short-term, interest-only loans that require the borrower to pay only interest during the construction phase with a balloon payment of the principal outstanding at the end of the construction period or only interest during construction with a conversion to amortizing principal and interest when the construction is complete. Loans for undeveloped real estate are subject to a loan-to-value ratio not to exceed 65%. Construction loans are treated similarly to the developed real estate loans and are subject to a maximum loan to value ratio of 85% based upon an “as-completed” appraised value. Construction loans generally yield a higher interest rate than other mortgage loans but also carry more risk.
Commercial Real Estate Loans - These loans represent the largest portion of FNCB’s total loan portfolio and loans in this portfolio generally carry larger loan balances. The commercial real estate mortgage loan portfolio consists of owner-occupied and non-owner-occupied properties that are secured by a broad range of real estate, including but not limited to, office complexes, shopping centers, hotels, warehouses, gas stations, convenience markets, residential care facilities, nursing care facilities, restaurants and multifamily housing. FNCB offers commercial real estate loans at various rates and terms that do not exceed 25 years. These types of loans are subject to specific loan-to-value guidelines prior to the time of closing. The policy limits for developed real estate loans are subject to a maximum loan-to-value ratio of 85%. Commercial mortgage loans must also meet specific criteria that include the capacity, capital, credit worthiness and cash flow of the borrower and the project being financed. Potential borrower(s) and guarantor(s) are required to provide FNCB with historical and current financial data. As part of the underwriting process for commercial real estate loans, management performs a review of the cash flow analysis of the borrower(s), guarantor(s) and the project in addition to considering the borrower’s expertise, credit history, net worth and the value of the underlying property.
Commercial and Industrial Loans - FNCB offers commercial loans at various rates and terms to businesses located in its primary market area. The commercial loan portfolio includes revolving lines of credit, automobile floor plans, equipment loans, vehicle loans, improvement loans and term loans. These loans generally carry a higher risk than commercial real estate loans by the nature of the underlying collateral, which can be machinery and equipment, inventory, accounts receivable, vehicles or marketable securities. Generally, a collateral lien is placed on the collateral supporting the loan. In order to reduce the risk associated with these loans, management may attempt to secure real estate as collateral and obtain personal guarantees of the borrower as deemed necessary.
State and Political Subdivision Loans - FNCB originates general obligation notes and tax anticipation loans to state and political subdivisions, which are primarily municipalities in FNCB’s market area.
Residential Real Estate Loans - FNCB offers fixed- and variable-rate one- to four-family residential loans. Residential first lien mortgages are generally subject to an 80% loan to value ratio based on the appraised value of the property. FNCB will generally require the mortgagee to purchase Private Mortgage Insurance if the amount of the loan exceeds the 80% loan to value ratio. Residential mortgage loans are generally smaller in size and are considered homogeneous as they exhibit similar characteristics. FNCB may sell loans and retain servicing when warranted by market conditions.
Consumer Loans – FNCB offers both secured and unsecured installment loans, personal lines of credit and overdraft protection loans. FNCB is in the business of underwriting indirect auto loans which are originated through various auto dealers in northeastern Pennsylvania and dealer floor plan loans. FNCB offers home equity loans and home equity lines of credit (“HELOCs”) with a maximum combined loan-to-value ratio of 90% based on the appraised value of the property. Home equity loans have fixed rates of interest and carry terms up to 15 years. HELOCs have adjustable interest rates and are based upon the national prime interest rate. Consumer loans are generally smaller in size and exhibit homogeneous characteristics.
Off-Balance-Sheet Credit-Related Financial Instruments
FNCB is a party to financial instruments with off-balance sheet risk in the normal course of business to meet the financing need of its customers. These financial instruments include commitments to extend credit, unused portions of lines of credit, including revolving HELOCs, and letters of credit. FNCB’s exposure to credit loss in the event of nonperformance by the other party to the financial instrument is represented by the contractual notional amount of these instruments. FNCB uses the same credit policies in making these commitments as it does for on-balance sheet instruments. In order to provide for probable losses inherent in these instruments, FNCB records a reserve for unfunded commitments, included in other liabilities on the consolidated statements of financial condition, with the offsetting expense recorded in other operating expenses in the consolidated statements of income.
Mortgage Banking Activities and Loan Servicing
Mortgage loans originated and intended for sale are carried at the lower of aggregate cost or fair value determined on an individual loan basis. Net unrealized losses are recorded as a valuation allowance and charged to earnings. Gains and losses on sales of mortgage loans are based on the difference between the selling price and the carrying value of the related loan sold and include the value assigned to the rights to service the loan.
FNCB may also elect to sell the guaranteed principal balance of loans that are guaranteed by the Small Business Administration (“SBA”) and retain the servicing on those loans. For the years ended December 31, 2017 and 2016, FNCB sold the guaranteed principal balance of loans totaling $900 thousand and $1.3 million, respectively. There were no sales of SBA guaranteed loans during the year ended December 31, 2015.
Servicing rights are recorded at fair value upon sale of the loan and reported in other assets on the consolidated statements of financial condition. Servicing rights are amortized in proportion to and over the period during which estimated servicing income will be received.
Fair value is based on market prices for comparable servicing contracts, when available, or alternately, is based on a valuation model that calculates the present value of estimated future net servicing income. The valuation model incorporates assumptions that market participants would use in estimating future net servicing income, such as the cost to service, the discount rate, the custodial earnings rate, an inflation rate, ancillary income, prepayment speeds and default rates and losses.
Servicing rights are evaluated for impairment at each reporting date based upon the fair value of the rights as compared to amortized cost. Impairment is determined by stratifying rights into tranches based on predominant risk characteristics, such as interest rate, loan type and investor type. Impairment is recognized through a valuation allowance for an individual tranche, to the extent that fair value is less than the capitalized amount for the tranche. If management later determines that all or a portion of the impairment no longer exists for a particular tranche, a reduction of the allowance may be recorded as an increase to income.
Other Real Estate Owned
OREO consists of property acquired by foreclosure, abandonment or conveyance of deed in-lieu of foreclosure of a loan, and bank premises that are no longer used for operation or for future expansion. OREO is held for sale and is initially recorded at fair value less costs to sell at the date of acquisition or transfer, which establishes a new cost basis. Upon acquisition of the property through foreclosure or deed in-lieu of foreclosure, any adjustment to fair value less estimated selling costs is recorded to the ALLL. The determination is made on an individual asset basis. Bank premises no longer used for operations or future expansion are transferred to OREO at fair value less estimated selling costs with any related write-down included in non-interest expense. Subsequent to acquisition, valuations are periodically performed and the assets are carried at the lower of cost or fair value less cost to sell. Fair value is determined through external appraisals, current letters of intent, broker price opinions or executed agreements of sale, unless management determines that conditions exist that warrant an adjustment to the value. Costs relating to the development and improvement of OREO properties may be capitalized; holding period costs and any subsequent changes to the valuation allowance are charged to expense as incurred.
Bank Premises and Equipment
Land is stated at cost. Bank premises, equipment and leasehold improvements are stated at cost less accumulated depreciation. Costs for routine maintenance and repairs are expensed as incurred, while significant expenditures for improvements are capitalized. Depreciation expense is computed generally using the straight-line method over the following ranges of estimated useful lives, or in the case of leasehold improvements, to the expected terms of the leases, if shorter:
|
Buildings and improvements (years) |
10 |
to |
40 |
|
Furniture, fixtures and equipment (years) |
3 |
to |
15 |
|
Leasehold improvements (years) |
2 |
to |
39 |
Long-lived Assets
Intangible assets and bank premises and equipment are reviewed by management at least annually for potential impairment and whenever events or circumstances indicate that carrying amounts may not be recoverable.
Income Taxes
FNCB recognizes income taxes under the asset and liability method. Under this method, deferred tax assets and liabilities are recognized for the future tax consequences attributable to differences between the financial statement carrying amounts of existing assets and liabilities and their respective tax bases. Deferred tax assets and liabilities are measured using enacted tax rates expected to apply to taxable income in the years in which those temporary differences are expected to be recovered or settled. The effect on deferred tax assets and liabilities of a change in tax rates is recognized in income in the period that includes the enactment date. Deferred tax assets are reduced by a valuation allowance when, in the opinion of management, it is more-likely-than-not that all or some portion of the deferred tax assets will not be realized.
FNCB files a consolidated Federal income tax return. Under tax sharing agreements, each subsidiary provides for and settles income taxes with FNCB as if it would have filed on a separate return basis. Interest and penalties, if any, as a result of a taxing authority examination are recognized within non-interest expense. FNCB is not currently subject to an audit by any of its tax authorities and with limited exception is no longer subject to federal and state income tax examinations by taxing authorities for years before 2014.
When tax returns are filed, it is highly certain that some positions taken would be sustained upon examination by the taxing authorities, while others are subject to uncertainty about the merits of the position taken or the amount of the position that would be ultimately sustained. The benefit of a tax position is recognized in the financial statements in the period during which, based on all available evidence, management believes it is more-likely-than-not that the position will be sustained upon examination, including the resolution of appeals or litigation processes, if any. Tax positions taken are not offset or aggregated with other positions. Tax positions that meet the more-likely-than-not recognition threshold are measured as the largest amount of tax benefit that is more than 50% likely of being realized upon settlement with the applicable taxing authority. The portion of the benefits associated with tax positions taken that exceeds the amount measured as described above is reflected as a liability for unrecognized tax benefits along with any associated interest and penalties that would be payable to the taxing authorities upon examination. Management determined that FNCB had no liabilities for uncertain tax positions at December 31, 2017 and 2016.
Earnings per Share
Earnings per share is calculated on the basis of the weighted-average number of common shares outstanding during the year. Basic earnings per share excludes dilution and is computed by dividing net income available to common shareholders by the weighted-average common shares outstanding during the period. Diluted earnings per share reflect additional shares that would have been outstanding if dilutive potential common shares had been issued. Potential common shares that may be issued by FNCB relate to outstanding stock options and shares of unvested restricted stock, for which the dilutive effect is calculated using the treasury stock method.
Stock-Based Compensation
FNCB is required to measure and record compensation expense for stock-based payments based on the instrument’s fair value on the date of the grant. The fair value of each option grant is estimated on the date of grant using the Black-Scholes option-pricing model. The fair value of shares of restricted stock awarded under the Long Term Incentive Compensation Plan (“LTIP”) is determined using an average of the high and low prices for FNCB’s common stock for the 10 days preceding the grant date. The fair value of shares of stock granted under Employee Stock Grant Plans is determined using the closing price of FNCB’s common stock on the grant date. Stock-based compensation expense for stock options and restricted stock is recognized ratably over the vesting period, adjusted for forfeitures during the period in which they occur. Stock-based compensation expense for shares of stock awarded under the Employee Stock Grant Plans is recognized on the grant date.
Bank-Owned Life Insurance
Bank-owned life insurance (“BOLI”) represents the cash surrender value of life insurance policies on certain current and former directors and officers of FNCB. FNCB purchased the insurance as a tax-deferred investment and future source of funding for liabilities, including the payment of employee benefits such as health care. BOLI is carried in the consolidated statements of financial condition at its cash surrender value. Increases in the cash value of the policies, as well as proceeds received, are recorded in non-interest income. Under some of these policies, the beneficiaries receive a portion of the death benefit. The net present value of the future death benefits scheduled to be paid to the beneficiaries was $108 thousand and $105 thousand at December 31, 2017 and 2016, respectively, and is reflected in other liabilities on the consolidated statements of financial condition.
Fair Value Measurement
FNCB uses fair value measurements to record fair value adjustments to certain financial assets and liabilities and to determine fair value disclosures. Available-for-sale securities are recorded at fair value on a recurring basis. Additionally, from time to time, FNCB may be required to recognize adjustments to other assets at fair value on a nonrecurring basis, such as impaired loans, other securities, and OREO.
Fair value is the price that would be received to sell an asset or paid to transfer a liability in the principal or most advantageous market in an orderly transaction between market participants at the measurement date. An orderly transaction is a transaction that assumes exposure to the market for a period prior to the measurement date to allow for marketing activities that are usual and customary for transactions involving such assets or liabilities; it is not a forced transaction.
Accounting standards define fair value, establish a framework for measuring fair value, establish a three-level hierarchy for disclosure of fair value measurement and provide disclosure requirements about fair value measurements. The valuation hierarchy is based upon the transparency of inputs to the valuation of an asset or liability as of the measurement date.
The three levels of the fair value hierarchy are:
|
● |
Level 1 valuation is based upon unadjusted quoted market prices for identical instruments traded in active markets. |
|
● |
Level 2 valuation is based upon quoted market prices for similar instruments traded in active markets, quoted market prices for identical or similar instruments traded in markets that are not active and model-based valuation techniques for which all significant assumptions are observable in the market or can be corroborated by market data; and |
|
● |
Level 3 valuation is derived from other valuation methodologies including discounted cash flow models and similar techniques that use significant assumptions not observable in the market. These unobservable assumptions reflect estimates of assumptions that market participants would use in determining fair value. |
Comprehensive Income
Accounting principles generally require that recognized revenue, expenses, gains and losses be included in net income. Although certain changes in assets and liabilities, such as unrealized gains and losses on available-for-sale securities, are reported as a separate component of the shareholders’ equity section of the statement of financial condition, such items, along with net income, are components of comprehensive income.
New Authoritative Accounting Guidance
ASU 2016-09, Compensation – Stock Compensation (Topic 718): “Improvements to Employee Share-Based Payment Accounting” simplifies several aspects of the accounting for share-based payment transactions, including the income tax consequences, classification of awards as either equity or liabilities, forfeitures, and classification on the statement of cash flows. ASU 2016-09 was effective for annual periods, and interim periods within those annual periods, beginning after December 15, 2016 for public entities. The adoption of this guidance on January 1, 2017 did not have a material effect on the operating results or financial position of FNCB.
ASU 2018-02, Income Statement – Reporting Comprehensive Income (Topic 220): “Reclassification of Certain Tax Effects from Accumulated Other Comprehensive Income” permits a reclassification from accumulated other comprehensive income to retained earnings for stranded tax effects resulting from the reduction in the corporate income tax rate to 21.0% with the newly enacted Tax Cuts and Jobs Act. This guidance is effective for fiscal years beginning after December 15, 2018; however, FNCB chose to early adopt the new standard for the year ended December 31, 2017, as allowed under the new standard. The amount of the reclassification for FNCB was $287 thousand, which is included in the consolidated statements of changes in shareholders’ equity.
Accounting Guidance to be Adopted in Future Periods
ASU 2014-09, Revenue from Contracts with Customers (Topic 606): Section A, “Summary and Amendments That Create Revenue from Contracts with Customers (Topic 606) and Other Assets and Deferred Costs-Contract with Customers (Subtopic 340-40);” Section B, “Conforming Amendments to Other Topics and Subtopics in the Codification and Status Tables;” and Section C, “Background Information and Basis for Conclusions,” provides a robust framework for addressing revenue recognition issues, and upon its effective date, replaces almost all existing revenue recognition guidance, including industry specific guidance, in current GAAP. On August 12, 2015, the FASB issued ASU 2015-14, Revenue from Contracts with Customers (Topic 606): “Deferral of the Effective Date,” which defers the adoption of ASU 2014-09 until the interim and annual reporting periods beginning after December 15, 2017. The core principle of ASU 2014-09 is that an entity should recognize revenue to depict the transfer of promised goods or services to customers in an amount that reflect the consideration to which the entity expects to be entitled in exchange for those goods or services. The new guidance provides steps to follow to achieve the core principle. ASU 2014-09 will also result in enhanced interim and annual disclosures, both qualitative and quantitative, about revenue in order to help financial statement users understand the nature, amount, timing and uncertainty of revenue and related cash flows. FNCB adopted this guidance on January 1, 2018. The guidance allows an entity to apply the new standard either retrospectively or through a cumulative effect adjustment as of January 1, 2018. Management conducted an in-depth assessment of FNCB’s revenue streams using the five-step, contract-based approach to determine whether or not the revenue stream falls within the scope of this new guidance. FNCB’s largest revenue stream, net interest income, is explicitly excluded from the scope of ASU 2014-09. Deposit-related service charges, interchange income and gains and losses from the sales of foreclosed real estate are revenue streams that fall within the scope of ASU 2014-09. Management reviewed FNCB’s current policies and practices for these revenue streams to identify any differences with the new guidance and concluded that no change in accounting treatment is required. FNCB has elected to implement the new guidance using the modified retrospective application, with the cumulative effect recorded as an adjustment to opening retained earnings upon adoption on January 1, 2018. Due to immateriality, FNCB will have no cumulative effect adjustment to record. Management is still finalizing any required changes to the related disclosures.
ASU 2016-01, Financial Instruments – Overall (Subtopic 825-10): “Recognition and Measurement of Financial Assets and Financial Liabilities” requires all equity investments to be measured at fair value with changes in the fair value recognized through net income (other than those accounted for under equity method of accounting or those that result in consolidation of the investee). The amendments in this ASU also require an entity to present separately in other comprehensive income the portion of the total change in the fair value of a liability resulting from a change in the instrument-specific credit risk when the entity has elected to measure the liability at fair value in accordance with the fair value option for financial instruments. In addition, this ASU eliminates the requirement to disclose the fair value of financial instruments measured at amortized cost for entities that are not public business entities and the requirement to disclose the method(s) and significant assumptions used to estimate the fair value that is required to be disclosed for financial instruments measured at amortized cost on the balance sheet for public business entities. ASU 2016-01 is effective for fiscal years beginning after December 15, 2017 for public entities. The adoption of this guidance on January 1, 2018 did not have a material effect on the operating results or financial position of FNCB.
ASU 2016-02, Leases (Topic 842): “Leases” will require organizations that lease assets to recognize on the balance sheet the assets and liabilities for the rights and obligations created by those leases with lease terms of more than 12 months. Consistent with current GAAP, the recognition, measurement and presentation of expenses and cash flows arising from a lease by the lessee will primarily depend on its classification as a finance or operating lease. However, unlike current GAAP, which requires only capital leases to be recognized on the balance sheet, the new ASU will require both types of leases to be recognized on the balance sheet. ASU 2016-02 will also require disclosures to help investors and other financial statement users better understand the amount, timing and uncertainty of cash flows arising from leases. The new disclosures will include both qualitative and quantitative requirements that provide additional information about the amounts recorded in the financial statements. ASU 2016-02 is effective with fiscal years, and interim periods within those fiscal years, beginning after December 15, 2018 for public entities. FNCB currently leases fourteen of its offices. FNCB will adopt this new guidance on January 1, 2019, and is currently evaluating the effect this guidance may have on its operating results and financial position.
ASU 2016-13, Financial Instruments – Credit Losses (Topic 326): “Measurement of Credit Losses on Financial Instruments,” replaces the current loss impairment methodology under GAAP with a methodology that reflects expected credit losses and requires consideration of a broader range of reasonable and supportable information to form credit loss estimates in an effort to provide financial statement users with more decision-useful information about the expected credit losses on financial instruments and other commitments to extend credit. Specifically, the amendments in this ASU will require a financial asset (or a group of financial assets) measured at amortized cost basis to be presented at the net amount expected to be collected. The amendments in this update affect entities holding financial assets and net investment in leases that are not accounted for at fair value through net income, including such financial assets as loans, debt securities, trade receivables, net investments in leases, off-balance-sheet credit exposures, reinsurance receivables, and any other financial assets not excluded from the scope that have the contractual right to receive cash. On June 17, 2016, the four federal financial institution regulatory agencies (the Board of Governors of the Federal Reserve System, the Federal Deposit Insurance Corporation, the National Credit Union Administration and the Office of the Comptroller of the Currency), issued a joint statement to provide information about ASU 2016-13 and the initial supervisory views regarding the implementation of the new standard. The joint statement applies to all banks, savings associations, credit unions and financial institution holding companies, regardless of asset size. The statement details the key elements of, and the steps necessary for, the successful transition to the new accounting standard. In addition, the statement notifies financial institutions that because the appropriate allowance levels are institution-specific amounts, the agencies will not establish benchmark targets or ranges for the change in institutions’ allowance levels upon adoption of the ASU, or for allowance levels going forward. Due to the importance of ASU 2016-13, the agencies encourage financial institutions to begin planning and preparing for the transition and state that senior management, under the oversight of the board of directors, should work closely with staff in their accounting, lending, credit risk management, internal audit, and information technology functions during the transition period leading up to, and well after, adoption. ASU 2016-13 is effective for public business entities that are U.S. Securities and Exchange Commission (“SEC”) filers for fiscal years beginning after December 15, 2019, including interim periods within those fiscal years. All entities may adopt the amendments in this ASU earlier as of the fiscal years beginning after December 15, 2018, including interim periods within those fiscal years. Accordingly, FNCB will adopt this guidance on January 1, 2020. FNCB has created a Current Expected Credit Loss (“CECL”) task group comprised of members of its finance, credit administration, lending, internal audit, loan operations and information systems units. The CECL task group has become familiar with the provisions of ASU 2016-13 and is in the process of planning and preparing for the transition to the new guidance, which includes, but is not limited to: (1) developing an appropriate course of action for FNCB taking into consideration the nature, scope, and risk of its lending and investing activities; (2) identifying segments and sub-segments within the loan portfolio that have similar risk characteristics; (3) reviewing the existing allowance and credit risk management practices to identify processes that may be leveraged when applying the new guidance; (4) identifying data needs and implementing changes that are necessary to its core operating system and interfaces to be able to capture data requirements; and (5) evaluating the effect this guidance may have on FNCB’s operating results and/or financial position, including assessing any potential impact on its capital.
ASU 2016-15, Statement of Cash Flows (Topic 230): “Classification of Certain Cash Receipts and Cash Payments,” provides guidance on eight specific cash flow issues in order to reduce current and potential future diversity in reporting. The specific cash flow items addressed include debt prepayment or debt extinguishment costs, settlement of zero-coupon debt instruments with coupon interest rates that are insignificant in relation to the effective interest rate of the borrowing, contingent consideration payments made after a business combination, proceeds from the settlement of insurance claims, proceeds from the settlement of corporate-owned life insurance policies, including bank-owned life insurance policies, distributions received from equity method investees, beneficial interest in securitization transactions, and separately identifiable cash flows and application of the predominance principle. ASU 2016-15 is effective for public business entities for fiscal years beginning after December 15, 2017, and interim periods within those fiscal years. ASU 2016-15 is effective for all entities that are required to present a statement of cash flows under Topic 320, and early adoption is permitted. The adoption of this guidance on January 1, 2018 did not have a material effect on the operating results or financial position of FNCB.
ASU 2017-08, Receivables – Nonrefundable Fees and Other Costs (Topic 310): “Premium Amortization on Purchased Callable Debt Securities” requires that the amortization period for certain callable debt securities be shortened to the earliest call date. The amortization of callable securities held at a discount is not affected. ASU 2017-08 is effective for fiscal years, and interim periods within those fiscal years, beginning after December 15, 2018 for public entities. The adoption of this guidance on January 1, 2019 is not expected to have a material effect on the operating results or financial position of FNCB.
ASU 2017-09, Compensation – Stock Compensation (Topic 718): “Scope of Modification Accounting” clarifies when it is appropriate to apply modification accounting guidance when there is a change to the terms or conditions of a share-based payment award. Specifically, the standard provides that an entity should account for the effects of a modification unless the fair value of the modified award is the same as the original award immediately before modification, if the vesting conditions of the modified award are the same as the vesting conditions of the original award immediately before modification, and the classification of the modified award is the same as the classification of the original award immediately before modification. ASU 2017-09 is effective for annual periods, and interim periods within those annual periods, beginning after December 15, 2017. The adoption of this guidance on January 1, 2018 is not expected to have a material effect on the operating results or financial position of FNCB.
Note 3. RESTRICTED CASH BALANCES
FNCB is required to maintain certain average reserve balances as established by the Federal Reserve Bank. The amount of those reserve balances for the reserve computation periods which included December 31, 2017 and 2016 were $1.8 million and $1.5 million, respectively. FNCB satisfied the required reserve balances through the restriction of vault cash and deposits maintained at the Federal Reserve Bank.
In addition, FNCB maintains compensating balances at correspondent banks, most of which are not required, but are used to offset specific charges for services. At December 31, 2017 and 2016, the amount of these balances was $114 thousand and $133 thousand, respectively.
Note 4. SECURITIES
During the third quarter of 2017, management identified two subordinated notes issued by other financial institutions in the amount of $1.0 million each and $1.0 million in mandatory-redeemable preferred stock of a subsidiary of another financial institution that were included in loans receivable at December 31, 2016 and 2015. Management determined that these financial instruments are in fact securities and upon identification reclassified the recorded investment in these instruments of $3.0 million from loans receivable to available-for-sale securities. Management also conducted an assessment of materiality of the reclassification to determine if FNCB’s previously-issued consolidated financial statements should be amended. Based on its qualitative and quantitative assessment of materiality, management determined that the reclassification did not have a material impact to FNCB’s financial position or results of operations as of and for the years ended December 31, 2016 and 2015, including the interim periods within those years. In addition, the reclassification did not have a material impact to FNCB’s financial position or results of operations as of and for the interim periods ended March 31, 2017 and June 30, 2017. Accordingly, management concluded that FNCB’s previously-issued consolidated financial statements and notes to the consolidated financial statements could still be relied upon. However, management has elected to correct the error in these current-period consolidated financial statements and notes to the consolidated financial statements by adjusting the prior-period information for comparability. Management engaged an independent third party to conduct a valuation of and provide fair values for these available-for-sale securities as of September 30, 2017, December 31, 2016, December 31, 2015 and for each quarterly period-end of 2017 and 2016. Based on the valuations, management adjusted these available-for-sale securities to fair value at December 31, 2016 and 2015 and each of the quarter-end periods of 2017 and 2016. Specifically, these reclassifications and valuations resulted in the following adjustments to balances included in previously-issued consolidated statements of financial position at December 31, 2016 and 2015 of: 1) increases to securities available for sale of $3.3 million, or 1.22%, and $3.3 million, or 1.29%; 2) decreases to loans, net of the allowance for loan and lease losses of $3.0 million, or 0.41%, for both period ends; 3) increases to total capital, specifically accumulated other comprehensive income, net of income taxes, of $224 thousand, or 0.25%, and $178 thousand, or 0.21%; and 4) decreases to net deferred tax assets of $115 thousand, or 0.43%, and $91 thousand, or 0.32%, respectively. Adjustments to these balances at each of the quarter-end periods of 2017 and 2016 were comparable to those made at December 31, 2016 and 2015, which management has deemed to be immaterial. These reclassifications and valuations had no effect on the consolidated statements of income, the consolidated statements of cash flows, or on earnings per share for the annual and interim periods of 2016 and interim periods of 2017.
The following tables present the amortized cost, gross unrealized gains and losses, and the fair value of the FNCB’s securities at December 31, 2017 and 2016:
|
December 31, 2017 |
||||||||||||||||
|
Gross |
Gross |
|||||||||||||||
|
Unrealized |
Unrealized |
|||||||||||||||
|
Amortized |
Holding |
Holding |
Fair |
|||||||||||||
|
(in thousands) |
Cost |
Gains |
Losses |
Value |
||||||||||||
|
Available-for-sale: |
||||||||||||||||
|
Obligations of U.S. government agencies |
$ | - | $ | - | $ | - | $ | - | ||||||||
|
Obligations of state and political subdivisions |
146,812 | 567 | 1,380 | 145,999 | ||||||||||||
|
U.S. government/government-sponsored agencies: |
||||||||||||||||
|
Collateralized mortgage obligations - residential |
36,100 | 73 | 516 | 35,657 | ||||||||||||
|
Collateralized mortgage obligations - commercial |
76,396 | - | 978 | 75,418 | ||||||||||||
|
Mortgage-backed securities |
22,254 | 174 | 117 | 22,311 | ||||||||||||
|
Corporate debt securities |
4,000 | 58 | - | 4,058 | ||||||||||||
|
Asset-backed securities |
3,100 | 3 | 17 | 3,086 | ||||||||||||
|
Negotiable certificates of deposit |
2,924 | 6 | - | 2,930 | ||||||||||||
|
Equity securities |
1,010 | - | 82 | 928 | ||||||||||||
|
Total available-for-sale securities |
$ | 292,596 | $ | 881 | $ | 3,090 | $ | 290,387 | ||||||||
|
December 31, 2016 |
||||||||||||||||
|
Gross |
Gross |
|||||||||||||||
|
Unrealized |
Unrealized |
|||||||||||||||
|
Amortized |
Holding |
Holding |
Fair |
|||||||||||||
|
(in thousands) |
Cost |
Gains |
Losses |
Value |
||||||||||||
|
Available-for-sale: |
||||||||||||||||
|
Obligations of U.S. government agencies |
$ | 12,152 | $ | 36 | $ | - | $ | 12,188 | ||||||||
|
Obligations of state and political subdivisions |
119,919 | 257 | 2,303 | 117,873 | ||||||||||||
|
U.S. government/government-sponsored agencies: |
||||||||||||||||
|
Collateralized mortgage obligations - residential |
17,969 | 155 | 40 | 18,084 | ||||||||||||
|
Collateralized mortgage obligations - commercial |
100,064 | 154 | 868 | 99,350 | ||||||||||||
|
Mortgage-backed securities |
20,593 | 159 | 176 | 20,576 | ||||||||||||
|
Corporate debt securities |
3,500 | 339 | 47 | 3,792 | ||||||||||||
|
Asset-backed securities |
- | - | - | - | ||||||||||||
|
Negotiable certificates of deposit |
3,172 | 44 | - | 3,216 | ||||||||||||
|
Equity securities |
1,010 | - | 74 | 936 | ||||||||||||
|
Total available-for-sale securities |
$ | 278,379 | $ | 1,144 | $ | 3,508 | $ | 276,015 | ||||||||
Except for securities of U.S. government and government-sponsored agencies, there were no securities of any individual issuer that exceeded 10.0% of shareholders’ equity at December 31, 2017 or 2016.
The following table presents the maturity information of FNCB’s available-for-sale debt securities at December 31, 2017. Expected maturities will differ from contractual maturity because issuers may have the right to call or prepay obligations with or without call or prepayment penalties. Because collateralized mortgage obligations, mortgage-backed securities and asset-backed securities are not due at a single maturity date, they are not included in the maturity categories in the following maturity summary.
|
December 31, 2017 |
||||||||
|
Available-for-Sale |
||||||||
|
Amortized |
Fair |
|||||||
|
(in thousands) |
Cost |
Value |
||||||
|
Amounts maturing in: |
||||||||
|
One year or less |
$ | 496 | $ | 496 | ||||
|
One year through five years |
38,998 | 38,949 | ||||||
|
After five years through ten years |
114,242 | 113,542 | ||||||
|
After ten years |
- | - | ||||||
|
Asset-backed securities |
3,100 | 3,086 | ||||||
|
Collateralized mortgage obligations |
112,496 | 111,075 | ||||||
|
Mortgage-backed securities |
22,254 | 22,311 | ||||||
|
Total |
$ | 291,586 | $ | 289,459 | ||||
The following table presents the gross proceeds received and gross realized gains and losses on sales and redemptions of available-for-sale securities for each of the three years ended December 31, 2017, 2016 and 2015.
|
Year Ended December 31, |
||||||||||||
|
(in thousands) |
2017 |
2016 |
2015 |
|||||||||
|
Available-for-sale: |
||||||||||||
| Gross proceeds received on sales | $ | 132,240 | $ | 32,588 | $ | 88,658 | ||||||
| Gross proceeds received on redemptions | 1,500 | - | - | |||||||||
| Gross realized gains | 1,673 | 960 | 2,325 | |||||||||
| Gross realized losses | (76 | ) | - | (29 | ) | |||||||
The following tables present the number of, fair value and gross unrealized losses of available-for-sale securities with unrealized losses at December 31, 2017 and 2016, aggregated by investment category and length of time the securities have been in an unrealized loss position.
|
December 31, 2017 |
||||||||||||||||||||||||||||||||||||
|
Less than 12 Months |
12 Months or Greater |
Total |
||||||||||||||||||||||||||||||||||
|
Number |
Gross |
Number |
Gross |
Number |
Gross |
|||||||||||||||||||||||||||||||
|
of |
Fair |
Unrealized |
of |
Fair |
Unrealized |
of |
Fair |
Unrealized |
||||||||||||||||||||||||||||
|
(dollars in thousands) |
Securities |
Value |
Losses |
Securities |
Value |
Losses |
Securities |
Value |
Losses |
|||||||||||||||||||||||||||
|
Obligations of U.S. government agencies |
- | $ | - | $ | - | - | $ | - | $ | - | - | $ | - | $ | - | |||||||||||||||||||||
|
Obligations of state and policitical subdivisions |
56 | 65,056 | 497 | 26 | 24,595 | 883 | 82 | 89,651 | 1,380 | |||||||||||||||||||||||||||
|
U.S. government/government-sponsored agencies: |
||||||||||||||||||||||||||||||||||||
|
Collateralized mortgage obligations - residential |
10 | 24,686 | 516 | 1 | 53 | - | 11 | 24,739 | 516 | |||||||||||||||||||||||||||
|
Collateralized mortgage obligations - commercial |
22 | 64,344 | 672 | 2 | 10,076 | 306 | 24 | 74,420 | 978 | |||||||||||||||||||||||||||
|
Mortgage-backed securities |
4 | 8,454 | 56 | 2 | 2,058 | 61 | 6 | 10,512 | 117 | |||||||||||||||||||||||||||
|
Corporate debt securities |
- | - | - | - | - | - | - | - | - | |||||||||||||||||||||||||||
|
Asset-backed securities |
1 | 2,443 | 17 | - | - | - | 1 | 2,443 | 17 | |||||||||||||||||||||||||||
|
Negotiable certificates of deposit |
1 | 247 | - | - | - | - | 1 | 247 | - | |||||||||||||||||||||||||||
|
Equity securities |
- | - | - | 1 | 918 | 82 | 1 | 918 | 82 | |||||||||||||||||||||||||||
|
Total |
94 | $ | 165,230 | $ | 1,758 | 32 | $ | 37,700 | $ | 1,332 | 126 | $ | 202,930 | $ | 3,090 | |||||||||||||||||||||
|
December 31, 2016 |
||||||||||||||||||||||||||||||||||||
|
Less than 12 Months |
12 Months or Greater |
Total |
||||||||||||||||||||||||||||||||||
|
Number |
Gross |
Number |
Gross |
Number |
Gross |
|||||||||||||||||||||||||||||||
|
of |
Fair |
Unrealized |
of |
Fair |
Unrealized |
of |
Fair |
Unrealized |
||||||||||||||||||||||||||||
|
(dollars in thousands) |
Securities |
Value |
Losses |
Securities |
Value |
Losses |
Securities |
Value |
Losses |
|||||||||||||||||||||||||||
|
Obligations of U.S. government agencies |
- | $ | - | $ | - | - | $ | - | $ | - | - | $ | - | $ | - | |||||||||||||||||||||
|
Obligations of state and policitical subdivisions |
82 | 88,479 | 2,303 | - | - | - | 82 | 88,479 | 2,303 | |||||||||||||||||||||||||||
|
U.S. government/government-sponsored agencies: |
||||||||||||||||||||||||||||||||||||
|
Collateralized mortgage obligations - residential |
2 | 4,514 | 40 | 1 | 175 | - | 3 | 4,689 | 40 | |||||||||||||||||||||||||||
|
Collateralized mortgage obligations - commercial |
17 | 70,146 | 868 | - | - | - | 17 | 70,146 | 868 | |||||||||||||||||||||||||||
|
Mortgage-backed securities |
5 | 6,495 | 176 | - | - | - | 5 | 6,495 | 176 | |||||||||||||||||||||||||||
|
Corporate debt securities |
- | - | - | 1 | 453 | 47 | 1 | 453 | 47 | |||||||||||||||||||||||||||
|
Asset-backed securities |
- | - | - | - | - | - | - | - | - | |||||||||||||||||||||||||||
|
Negotiable certificates of deposit |
- | - | - | - | - | - | - | - | - | |||||||||||||||||||||||||||
|
Equity securities |
- | - | - | 1 | 926 | 74 | 1 | 926 | 74 | |||||||||||||||||||||||||||
|
Total |
106 | $ | 169,634 | $ | 3,387 | 3 | $ | 1,554 | $ | 121 | 109 | $ | 171,188 | $ | 3,508 | |||||||||||||||||||||
Management evaluates individual securities in an unrealized loss position quarterly for OTTI. As part of its evaluation, management considers, among other things, the length of time a security’s fair value is less than its amortized cost, the severity of decline, any credit deterioration of the issuer, whether or not management intends to sell the security, and whether it is more likely than not that FNCB will be required to sell the security prior to recovery of its amortized cost.
There were 126 securities in an unrealized loss position at December 31, 2017, including 41 securities issued by a U.S. government or government-sponsored agency, 82 obligations of state and political subdivisions, one asset-backed security, one negotiable certificate of deposit and one equity security. Management performed a review of all securities in an unrealized loss position as of December 31, 2017 and determined that movements in the fair values of the securities were consistent with the change in market interest rates. In addition, as part of its review, management noted that there was no material change in the credit quality of any of the issuers or any other event or circumstance that may cause a significant adverse effect on the fair value of these securities. Moreover, to date, FNCB has received all scheduled principal and interest payments and expects to fully collect all future contractual principal and interest payments on all securities in an unrealized loss position at December 31, 2017. FNCB does not intend to sell the securities nor is it more likely than not that it will be required to sell the securities, prior to recovery of their amortized cost. Based on the results of its review and considering the attributes of these debt and equity securities, management concluded that the individual unrealized losses were temporary and OTTI did not exist at December 31, 2017.
Investment in the Federal Home Loan Bank (“FHLB”) of Pittsburgh stock has limited marketability and is carried at cost. FNCB’s investment in FHLB of Pittsburgh stock totaled $2.8 million and $3.3 million at December 31, 2017 and 2016, respectively. Management noted no indicators of impairment for the FHLB of Pittsburgh stock at December 31, 2017 and 2016. During the year ended December 31, 2016, the Bank canceled its membership with the Federal Reserve Bank of Philadelphia (“FRB”), and as a result, the entire balance of FRB stock totaling $1.3 million was redeemed.
During the year ended December 31, 2017, FNCB purchased a 4.9% interest in the common stock of a privately-held bank holding company for $1.7 million. The common stock was purchased as part of a private placement pursuant to an exemption from the registration requirements of the Securities Act of 1933 for offerings not involving any public offering. The common stock is not currently traded on any established market, and is not expected to be traded in the near future on any securities exchange or established over-the-counter market. FNCB has elected to account for this transaction as an investment in an equity security without a readily determinable fair value. An equity security without a readily determinable fair value shall be written down to its fair value if a qualitative assessment indicates that the investment is impaired and the fair value of the investment is less than its carrying value. The $1.7 million investment is included in other assets in the consolidated statements of financial condition at December 31, 2017. Management engaged an independent third party to provide a valuation of this investment as of December 31, 2017. The valuation indicated that the investment was not impaired and accordingly, no adjustment for impairment was required at December 31, 2017.
Note 5. LOANS
The following table summarizes loans receivable, net, by category at December 31, 2017 and 2016:
|
December 31, |
||||||||
|
(in thousands) |
2017 |
2016 |
||||||
|
Residential real estate |
$ | 158,020 | $ | 144,260 | ||||
|
Commercial real estate |
261,783 | 243,830 | ||||||
|
Construction, land acquisition and development |
20,981 | 18,357 | ||||||
|
Commercial and industrial |
150,103 | 150,758 | ||||||
|
Consumer |
134,653 | 127,844 | ||||||
|
State and political subdivisions |
42,529 | 43,709 | ||||||
|
Total loans, gross |
768,069 | 728,758 | ||||||
|
Unearned income |
(80 | ) | (48 | ) | ||||
|
Net deferred loan costs |
2,654 | 2,569 | ||||||
|
Allowance for loan and lease losses |
(9,034 | ) | (8,419 | ) | ||||
|
Loans, net |
$ | 761,609 | $ | 722,860 | ||||
FNCB has granted loans, letters of credit and lines of credit to certain of its executive officers and directors as well as to certain of their related parties. For more information about related party transactions, refer to Note 11, “Related Party Transactions” to these consolidated financial statements.
For information about credit concentrations within FNCB’s loan portfolio, refer to Note 12, “Commitments, Contingencies and Concentrations” to these consolidated financial statements.
FNCB originates one- to four-family mortgage loans for sale in the secondary market. During the years ended December 31, 2017, 2016 and 2015, one- to four-family mortgages sold on the secondary market were $12.4 million, $9.5 million and $7.9 million, respectively. Net gains on the sale of residential mortgage loans for the years ended December 31, 2017, 2016 and 2015 were $304 thousand, $340 thousand and $292 thousand, respectively. FNCB retains servicing rights on these mortgages. At December 31, 2017 and December 31, 2016, there were $1.1 million and $596 thousand in one- to four-family residential mortgage loans held for sale, respectively.
During the years ended December 31, 2017 and 2016, FNCB sold the guaranteed principal balance of loans that were guaranteed by the Small Business Administration (“SBA”) totaling $900 thousand and $1.3 million, respectively. Net gains realized upon the sales and included in non-interest income totaled $79 thousand in 2017 and $51 thousand in 2016. FNCB retained the servicing rights on these loans. There were no sales of guaranteed loans during the year ended December 31, 2015. The unpaid principal balance of loans serviced for others, including residential mortgages and SBA guaranteed loans were $103.0 million and $103.5 million at December 31, 2017 and 2016, respectively.
FNCB does not have any lending programs commonly referred to as subprime lending. Subprime lending generally targets borrowers with weakened credit histories typically characterized by payment delinquencies, previous charge-offs, judgments, and bankruptcies, or borrowers with questionable repayment capacity as evidenced by low credit scores or high debt-burden ratios.
FNCB provides for loan losses based on the consistent application of its documented ALLL methodology. Loan losses are charged to the ALLL and recoveries are credited to it. Additions to the ALLL are provided by charges against income based on various factors which, in management’s judgment, deserve current recognition of estimated probable losses. Loan losses are charged-off in the period the loans, or portions thereof, are deemed uncollectible. Generally, FNCB will record a loan charge-off (including a partial charge-off) to reduce a loan to the estimated recoverable amount based on its methodology detailed below. Management regularly reviews the loan portfolio and makes adjustments for loan losses in order to maintain the ALLL in accordance with GAAP. The ALLL consists primarily of the following two components:
|
(1) |
Specific allowances are established for impaired loans, which FNCB defines as all loan relationships with an aggregate outstanding balance greater than $100 thousand rated substandard and on non-accrual, loans rated doubtful or loss, and all TDRs. The amount of impairment provided for as an allowance is represented by the deficiency, if any, between the carrying value of the loan and either (a) the present value of expected future cash flows discounted at the loan’s effective interest rate, (b) the loan’s observable market price, or (c) the fair value of the underlying collateral, less estimated costs to sell, for collateral dependent loans. Impaired loans that have no impairment losses are not considered for general valuation allowances described below. If management determines that collection of the impairment amount is remote, a charge-off will be recorded for the impairment amount. |
|
(2) |
General allowances are established for loan losses on a portfolio basis for loans that do not meet the definition of impaired. FNCB divides its portfolio into loan segments for loans exhibiting similar characteristics. Loans rated special mention or substandard and accruing, which are embedded in these loan segments, are then separated from these loan segments, as these loans are subject to an analysis that emphasizes the credit risk associated with these loans. An estimated loss rate is then applied to each loan segment, which are based on FNCB’s own historical loss experience for each respective loan segment. In addition, management evaluates and applies to each loan segment certain qualitative or environmental factors that are likely to cause estimated credit losses associated with FNCB’s existing portfolio to differ from historical experience, which are discussed below. For loans that have an internal credit rating of special mention or substandard, the qualitative and environmental factors are further adjusted for the increased risk. |
As part of its evaluation, management considers qualitative and environmental factors, including, but not limited to:
|
● |
changes in national, local, and business economic conditions and developments, including the condition of various market segments; |
|
● |
changes in the nature and volume of the loan portfolio; |
|
● |
changes in lending policies and procedures, including underwriting standards, collection, charge-off and recovery practices and results; |
|
● |
changes in the experience, ability and depth of lending management and staff; |
|
● |
changes in the quality of the loan review system and the degree of oversight by the Board of Directors; |
|
● |
changes in the trend of the volume and severity of past due and classified loans, including trends in the volume of non-accrual loans, TDRs and other loan modifications; |
|
● |
the existence and effect of any concentrations of credit and changes in the level of such concentrations; |
|
● |
the effect of external factors such as competition and legal and regulatory requirements on the level of estimated credit losses in the current loan portfolio; and |
|
● |
analysis of customers’ credit quality, including knowledge of their operating environment and financial condition. |
Management evaluates the credit quality of the loan portfolio on an ongoing basis, and performs a formal review of the adequacy of the ALLL on a quarterly basis. This evaluation is inherently subjective, as it requires material estimates that may be susceptible to significant revisions based upon changes in economic and real estate market conditions. Actual loan losses may be significantly more than the ALLL that is established, which could have a material negative effect on FNCB’s operating results or financial condition. While management uses the best information available to make its evaluations, future adjustments to the ALLL may be necessary if conditions differ substantially from the information used in making the evaluations. Banking regulators, as an integral part of their examination of FNCB, also review the ALLL, and may require, based on their judgments about information available to them at the time of their examination, that certain loan balances be charged off or require that adjustments be made to the ALLL.
The following tables present, by loan category, the activity in the ALLL and the allocation of the ALLL and related loan balance disaggregated based on impairment methodology at December 31, 2017, 2016 and 2015.
|
Allowance for Loan and Lease Losses by Loan Category |
||||||||||||||||||||||||||||||||
|
December 31, 2017 |
||||||||||||||||||||||||||||||||
|
Real Estate |
||||||||||||||||||||||||||||||||
|
(in thousands) |
Residential Real Estate |
Commercial Real Estate |
Construction, Land Acquisition and Development |
Commercial and Industrial |
Consumer |
State and Political Subdivisions |
Unallocated |
Total |
||||||||||||||||||||||||
|
Allowance for loan losses: |
||||||||||||||||||||||||||||||||
|
Beginning balance, January 1, 2017 |
$ | 1,171 | $ | 3,297 | $ | 268 | $ | 1,736 | $ | 1,457 | $ | 490 | $ | - | $ | 8,419 | ||||||||||||||||
|
Charge-offs |
(192 | ) | (159 | ) | - | (495 | ) | (603 | ) | - | - | (1,449 | ) | |||||||||||||||||||
|
Recoveries |
29 | 45 | 480 | 360 | 381 | - | - | 1,295 | ||||||||||||||||||||||||
|
Provisions (credits) |
228 | 316 | (539 | ) | 739 | 160 | (135 | ) | - | 769 | ||||||||||||||||||||||
|
Ending balance, December 31, 2017 |
$ | 1,236 | $ | 3,499 | $ | 209 | $ | 2,340 | $ | 1,395 | $ | 355 | $ | - | $ | 9,034 | ||||||||||||||||
|
Ending balance, December 31, 2017: |
||||||||||||||||||||||||||||||||
|
Specific reserve |
$ | 33 | $ | 138 | $ | - | $ | 600 | $ | 2 | $ | - | $ | - | $ | 773 | ||||||||||||||||
|
Ending balance, December 31, 2017: |
||||||||||||||||||||||||||||||||
|
General reserve |
$ | 1,203 | $ | 3,361 | $ | 209 | $ | 1,740 | $ | 1,393 | $ | 355 | $ | - | $ | 8,261 | ||||||||||||||||
|
Loans receivable: |
||||||||||||||||||||||||||||||||
|
Ending balance, December 31, 2017 |
$ | 158,020 | $ | 261,783 | $ | 20,981 | $ | 150,103 | $ | 134,653 | $ | 42,529 | $ | - | $ | 768,069 | ||||||||||||||||
|
Ending balance, December 31, 2017: |
||||||||||||||||||||||||||||||||
|
Individually evaluated for impairment |
$ | 1,902 | $ | 8,164 | $ | 85 | $ | 795 | $ | 395 | $ | - | $ | - | $ | 11,341 | ||||||||||||||||
|
Ending balance, December 31, 2017: |
||||||||||||||||||||||||||||||||
|
Collectively evaluated for impairment |
$ | 156,118 | $ | 253,619 | $ | 20,896 | $ | 149,308 | $ | 134,258 | $ | 42,529 | $ | - | $ | 756,728 | ||||||||||||||||
|
Allowance for Loan and Lease Losses by Loan Category |
||||||||||||||||||||||||||||||||
|
December 31, 2016 |
||||||||||||||||||||||||||||||||
|
Real Estate |
||||||||||||||||||||||||||||||||
|
(in thousands) |
Residential Real Estate |
Commercial Real Estate |
Construction, Land Acquisition and Development |
Commercial and Industrial |
Consumer |
State and Political Subdivisions |
Unallocated |
Total |
||||||||||||||||||||||||
|
Allowance for loan losses: |
||||||||||||||||||||||||||||||||
|
Beginning balance, January 1, 2016 |
$ | 1,333 | $ | 3,346 | $ | 853 | $ | 1,205 | $ | 1,494 | $ | 485 | $ | 74 | $ | 8,790 | ||||||||||||||||
|
Charge-offs |
(153 | ) | (398 | ) | - | (1,107 | ) | (960 | ) | - | - | (2,618 | ) | |||||||||||||||||||
|
Recoveries |
4 | 6 | 9 | 507 | 568 | - | - | 1,094 | ||||||||||||||||||||||||
|
Provisions (credits) |
(13 | ) | 343 | (594 | ) | 1,131 | 355 | 5 | (74 | ) | 1,153 | |||||||||||||||||||||
|
Ending balance, December 31, 2016 |
$ | 1,171 | $ | 3,297 | $ | 268 | $ | 1,736 | $ | 1,457 | $ | 490 | $ | - | $ | 8,419 | ||||||||||||||||
|
Ending balance, December 31, 2016: |
||||||||||||||||||||||||||||||||
|
Specific reserve |
$ | 29 | $ | 254 | $ | - | $ | 18 | $ | 1 | $ | - | $ | - | $ | 302 | ||||||||||||||||
|
Ending balance, December 31, 2016: |
||||||||||||||||||||||||||||||||
|
General reserve |
$ | 1,142 | $ | 3,043 | $ | 268 | $ | 1,718 | $ | 1,456 | $ | 490 | $ | - | $ | 8,117 | ||||||||||||||||
|
Loans receivable: |
||||||||||||||||||||||||||||||||
|
Ending balance, December 31, 2016 |
$ | 144,260 | $ | 243,830 | $ | 18,357 | $ | 150,758 | $ | 127,844 | $ | 43,709 | $ | - | $ | 728,758 | ||||||||||||||||
|
Ending balance, December 31, 2016: |
||||||||||||||||||||||||||||||||
|
Individually evaluated for impairment |
$ | 1,929 | $ | 2,937 | $ | 350 | $ | 91 | $ | 297 | $ | - | $ | - | $ | 5,604 | ||||||||||||||||
|
Ending balance, December 31, 2016: |
||||||||||||||||||||||||||||||||
|
Collectively evaluated for impairment |
$ | 142,331 | $ | 240,893 | $ | 18,007 | $ | 150,667 | $ | 127,547 | $ | 43,709 | $ | - | $ | 723,154 | ||||||||||||||||
|
Allowance for Loan and Lease Losses by Loan Category |
||||||||||||||||||||||||||||||||
|
December 31, 2015 |
||||||||||||||||||||||||||||||||
|
Real Estate |
||||||||||||||||||||||||||||||||
|
(in thousands) |
Residential Real Estate |
Commercial Real Estate |
Construction, Land Acquisition and Development |
Commercial and Industrial |
Consumer |
State and Political Subdivisions |
Unallocated |
Total |
||||||||||||||||||||||||
|
Allowance for loan losses: |
||||||||||||||||||||||||||||||||
|
Beginning balance, January 1, 2015 |
$ | 1,772 | $ | 4,663 | $ | 665 | $ | 2,104 | $ | 1,673 | $ | 598 | $ | 45 | $ | 11,520 | ||||||||||||||||
|
Charge-offs |
(139 | ) | (912 | ) | (688 | ) | (180 | ) | (716 | ) | - | - | (2,635 | ) | ||||||||||||||||||
|
Recoveries |
58 | 307 | - | 400 | 485 | - | - | 1,250 | ||||||||||||||||||||||||
|
Provisions (credits) |
(358 | ) | (712 | ) | 876 | (1,119 | ) | 52 | (113 | ) | 29 | (1,345 | ) | |||||||||||||||||||
|
Ending balance, December 31, 2015 |
$ | 1,333 | $ | 3,346 | $ | 853 | $ | 1,205 | $ | 1,494 | $ | 485 | $ | 74 | $ | 8,790 | ||||||||||||||||
|
Ending balance, December 31, 2015: |
||||||||||||||||||||||||||||||||
|
Specific reserve |
$ | 92 | $ | 287 | $ | 1 | $ | - | $ | 1 | $ | - | $ | - | $ | 381 | ||||||||||||||||
|
Ending balance, December 31, 2015: |
||||||||||||||||||||||||||||||||
|
General reserve |
$ | 1,241 | $ | 3,059 | $ | 852 | $ | 1,205 | $ | 1,493 | $ | 485 | $ | 74 | $ | 8,409 | ||||||||||||||||
|
Loans receivable: |
||||||||||||||||||||||||||||||||
|
Ending balance, December 31, 2015 |
$ | 130,696 | $ | 245,198 | $ | 30,843 | $ | 146,826 | $ | 128,533 | $ | 46,056 | $ | - | $ | 728,152 | ||||||||||||||||
|
Ending balance, December 31, 2015: |
||||||||||||||||||||||||||||||||
|
Individually evaluated for impairment |
$ | 2,930 | $ | 3,831 | $ | 646 | $ | 203 | $ | 351 | $ | - | $ | - | $ | 7,961 | ||||||||||||||||
|
Ending balance, December 31, 2015: |
||||||||||||||||||||||||||||||||
|
Collectively evaluated for impairment |
$ | 127,766 | $ | 241,367 | $ | 30,197 | $ | 146,623 | $ | 128,182 | $ | 46,056 | $ | - | $ | 720,191 | ||||||||||||||||
Credit Quality Indicators – Commercial Loans
Management continuously monitors and evaluates the credit quality of FNCB’s commercial loans by regularly reviewing certain credit quality indicators. Management utilizes credit risk ratings as the key credit quality indicator for evaluating the credit quality of FNCB’s loan receivables.
FNCB’s commercial loan classification and credit grading processes are part of the lending, underwriting, and credit administration functions to ensure an ongoing assessment of credit quality. FNCB maintains a formal, written loan classification and credit grading system that includes a discussion of the factors used to assign appropriate classifications of credit grades to loans. The risk grade groupings provide a mechanism to identify risk within the loan portfolio and provide management and the Board with periodic reports by risk category. The process also identifies groups of loans that warrant the special attention of management. Accurate and timely loan classification and credit grading is a critical component of loan portfolio management. Loan officers are required to review their loan portfolio risk ratings regularly for accuracy. In addition, the credit risk ratings play an important role in the loan review function, as well as the establishment and evaluation of the provision for loan and lease losses and the ALLL.
The loan review function uses the same risk rating system in the loan review process. Quarterly, FNCB engages an independent third party to assess the quality of the loan portfolio and evaluate the accuracy of ratings with the loan officer’s and management’s assessment.
FNCB’s loan rating system assigns a degree of risk to commercial loans based on relevant information about the ability of borrowers to service their debt such as: current financial information, historical payment experience, credit documentation, public information and current economic trends, among other factors. Management analyzes these non-homogeneous loans individually by grading the loans as to credit risk and probability of collection for each type of loan. Commercial and industrial loans include commercial indirect auto loans which are not individually risk rated, and construction, land acquisition and development loans include residential construction loans which are also not individually risk rated. These loans are monitored on a pool basis due to their homogeneous nature as described in “Credit Quality Indicators – Other Loans” below. FNCB risk rates certain residential real estate loans and consumer loans that are part of a larger commercial relationship using a credit grading system as described in “Credit Quality Indicators – Commercial Loans.” The grading system contains the following basic risk categories:
1. Minimal Risk
2. Above Average Credit Quality
3. Average Risk
4. Acceptable Risk
5. Pass - Watch
6. Special Mention
7. Substandard - Accruing
8. Substandard - Non-Accrual
9. Doubtful
10. Loss
This analysis is performed on a quarterly basis using the following definitions for risk ratings:
Pass – Assets rated 1 through 5 are considered pass ratings. These assets show no current or potential problems and are considered fully collectible. All such loans are evaluated collectively for ALLL calculation purposes. However, accruing loans restructured under a troubled debt restructuring (“TDRs”) that have been performing for an extended period, do not represent a higher risk of loss, and have been upgraded to a pass rating are evaluated individually for impairment.
Special Mention – Assets classified as special mention do not currently expose FNCB to a sufficient degree of risk to warrant an adverse classification but do possess credit deficiencies or potential weaknesses deserving close attention. Special mention assets have a potential weakness or pose an unwarranted financial risk which, if not corrected, could weaken the asset and increase risk in the future.
Substandard – Assets classified as substandard have well defined weaknesses based on objective evidence, and are characterized by the distinct possibility that FNCB will sustain some loss if the deficiencies are not corrected.
Doubtful – Assets classified as doubtful have all the weaknesses inherent in those classified as substandard with the added characteristic that such weaknesses make collection or liquidation in full highly questionable and improbable based on current circumstances.
Loss – Assets classified as loss are those considered uncollectible and of such little value that their continuance as assets is not warranted.
Credit Quality Indicators – Other Loans
Certain residential real estate loans, consumer loans, and commercial indirect auto loans are monitored on a pool basis due to their homogeneous nature. Loans that are delinquent 90 days or more are placed on non-accrual status unless collection of the loan is in process and reasonably assured. FNCB utilizes accruing versus non-accrual status as the credit quality indicator for these loan pools.
The following tables present the recorded investment in loans receivable by loan category and credit quality indicator at December 31, 2017 and 2016:
| Credit Quality Indicators | ||||||||||||||||||||||||||||||||||||||||
|
December 31, 2017 |
||||||||||||||||||||||||||||||||||||||||
|
Commercial Loans |
Other Loans |
|||||||||||||||||||||||||||||||||||||||
|
Special |
Subtotal |
Accruing |
Non-accrual |
Subtotal |
Total |
|||||||||||||||||||||||||||||||||||
|
Pass |
Mention |
Substandard |
Doubtful |
Loss |
Commercial |
Loans |
Loans |
Other |
Loans |
|||||||||||||||||||||||||||||||
|
Residential real estate |
$ | 27,186 | $ | 421 | $ | 62 | $ | - | $ | - | $ | 27,669 | $ | 129,887 | $ | 464 | $ | 130,351 | $ | 158,020 | ||||||||||||||||||||
|
Commercial real estate |
245,779 | 2,461 | 13,543 | - | - | 261,783 | - | - | - | 261,783 | ||||||||||||||||||||||||||||||
|
Construction, land acquisition and development |
18,280 | 330 | 6 | - | - | 18,616 | 2,365 | - | 2,365 | 20,981 | ||||||||||||||||||||||||||||||
|
Commercial and industrial |
142,019 | 479 | 1,597 | - | - | 144,095 | 6,008 | - | 6,008 | 150,103 | ||||||||||||||||||||||||||||||
|
Consumer |
1,731 | - | 34 | - | - | 1,765 | 132,584 | 304 | 132,888 | 134,653 | ||||||||||||||||||||||||||||||
|
State and political subdivisions |
42,040 | - | 396 | - | - | 42,436 | 93 | - | 93 | 42,529 | ||||||||||||||||||||||||||||||
|
Total |
$ | 477,035 | $ | 3,691 | $ | 15,638 | $ | - | $ | - | $ | 496,364 | $ | 270,937 | $ | 768 | $ | 271,705 | $ | 768,069 | ||||||||||||||||||||
|
Credit Quality Indicators |
||||||||||||||||||||||||||||||||||||||||
|
December 31, 2016 |
||||||||||||||||||||||||||||||||||||||||
|
Commercial Loans |
Other Loans |
|||||||||||||||||||||||||||||||||||||||
|
Special |
Subtotal |
Accruing |
Non-accrual |
Subtotal |
Total |
|||||||||||||||||||||||||||||||||||
|
Pass |
Mention |
Substandard |
Doubtful |
Loss |
Commercial |
Loans |
Loans |
Other |
Loans |
|||||||||||||||||||||||||||||||
|
Residential real estate |
$ | 25,506 | $ | 394 | $ | 466 | $ | - | $ | - | $ | 26,366 | $ | 117,286 | $ | 608 | $ | 117,894 | $ | 144,260 | ||||||||||||||||||||
|
Commercial real estate |
233,523 | 4,911 | 5,396 | - | - | 243,830 | - | - | - | 243,830 | ||||||||||||||||||||||||||||||
|
Construction, land acquisition and development |
14,101 | 346 | 448 | - | - | 14,895 | 3,462 | - | 3,462 | 18,357 | ||||||||||||||||||||||||||||||
|
Commercial and industrial |
142,794 | 2,794 | 1,128 | - | - | 146,716 | 4,042 | - | 4,042 | 150,758 | ||||||||||||||||||||||||||||||
|
Consumer |
2,699 | - | 37 | - | - | 2,736 | 124,935 | 173 | 125,108 | 127,844 | ||||||||||||||||||||||||||||||
|
State and political subdivisions |
40,424 | 2,964 | 321 | - | - | 43,709 | - | - | - | 43,709 | ||||||||||||||||||||||||||||||
|
Total |
$ | 459,047 | $ | 11,409 | $ | 7,796 | $ | - | $ | - | $ | 478,252 | $ | 249,725 | $ | 781 | $ | 250,506 | $ | 728,758 | ||||||||||||||||||||
Included in loans receivable are loans for which the accrual of interest income has been discontinued due to deterioration in the financial condition of the borrowers. The recorded investment in these non-accrual loans was $2.6 million and $2.2 million at December 31, 2017 and 2016, respectively. Generally, loans are placed on non-accrual status when they become 90 days or more delinquent, and remain on non-accrual status until they are brought current, have six months of performance under the loan terms, and factors indicating reasonable doubt about the timely collection of payments no longer exists. Therefore, loans may be current in accordance with their loan terms, or may be less than 90 days delinquent and still be on a non-accrual status. There were no loans past due 90 days or more and still accruing at December 31, 2017 and 2016.
The following tables present the delinquency status of past due and non-accrual loans at December 31, 2017 and 2016:
|
December 31, 2017 |
||||||||||||||||||||
|
Delinquency Status |
||||||||||||||||||||
|
0-29 Days |
30-59 Days |
60-89 Days |
>/= 90 Days |
|||||||||||||||||
|
(in thousands) |
Past Due |
Past Due |
Past Due |
Past Due |
Total |
|||||||||||||||
|
Performing (accruing) loans: |
||||||||||||||||||||
|
Real estate: |
||||||||||||||||||||
|
Residential real estate |
$ | 156,701 | $ | 793 | $ | - | $ | - | $ | 157,494 | ||||||||||
|
Commercial real estate |
260,276 | 70 | 473 | - | 260,819 | |||||||||||||||
|
Construction, land acquisition and development |
20,954 | 27 | - | - | 20,981 | |||||||||||||||
|
Total real estate |
437,931 | 890 | 473 | - | 439,294 | |||||||||||||||
|
Commercial and industrial |
149,046 | 185 | 88 | - | 149,319 | |||||||||||||||
|
Consumer |
133,034 | 1,028 | 287 | - | 134,349 | |||||||||||||||
|
State and political subdivisions |
42,529 | - | - | - | 42,529 | |||||||||||||||
|
Total performing (accruing) loans |
762,540 | 2,103 | 848 | - | 765,491 | |||||||||||||||
|
Non-accrual loans: |
||||||||||||||||||||
|
Real estate: |
||||||||||||||||||||
|
Residential real estate |
342 | 63 | - | 120 | 525 | |||||||||||||||
|
Commercial real estate |
- | - | - | 964 | 964 | |||||||||||||||
|
Construction, land acquisition and development |
- | - | - | - | - | |||||||||||||||
|
Total real estate |
342 | 63 | - | 1,084 | 1,489 | |||||||||||||||
|
Commercial and industrial |
750 | - | - | 35 | 785 | |||||||||||||||
|
Consumer |
25 | 92 | 53 | 134 | 304 | |||||||||||||||
|
State and political subdivisions |
- | - | - | - | - | |||||||||||||||
|
Total non-accrual loans |
1,117 | 155 | 53 | 1,253 | 2,578 | |||||||||||||||
|
Total loans receivable |
$ | 763,657 | $ | 2,258 | $ | 901 | $ | 1,253 | $ | 768,069 | ||||||||||
|
December 31, 2016 |
||||||||||||||||||||
|
Delinquency Status |
||||||||||||||||||||
|
0-29 Days |
30-59 Days |
60-89 Days |
>/= 90 Days |
|||||||||||||||||
|
(in thousands) |
Past Due |
Past Due |
Past Due |
Past Due |
Total |
|||||||||||||||
|
Performing (accruing) loans: |
||||||||||||||||||||
|
Real estate: |
||||||||||||||||||||
|
Residential real estate |
$ | 143,142 | $ | 229 | $ | 107 | $ | - | $ | 143,478 | ||||||||||
|
Commercial real estate |
241,477 | 830 | 553 | - | 242,860 | |||||||||||||||
|
Construction, land acquisition and development |
17,766 | 346 | - | - | 18,112 | |||||||||||||||
|
Total real estate |
402,385 | 1,405 | 660 | - | 404,450 | |||||||||||||||
|
Commercial and industrial |
150,378 | 307 | 9 | - | 150,694 | |||||||||||||||
|
Consumer |
126,341 | 1,030 | 300 | - | 127,671 | |||||||||||||||
|
State and political subdivisions |
43,709 | - | - | - | 43,709 | |||||||||||||||
|
Total peforming (accruing) loans |
722,813 | 2,742 | 969 | - | 726,524 | |||||||||||||||
|
Non-accrual loans: |
||||||||||||||||||||
|
Real estate: |
||||||||||||||||||||
|
Residential real estate |
176 | 202 | 17 | 387 | 782 | |||||||||||||||
|
Commercial real estate |
201 | 23 | - | 746 | 970 | |||||||||||||||
|
Construction, land acquisition and development |
- | 245 | - | - | 245 | |||||||||||||||
|
Total real estate |
377 | 470 | 17 | 1,133 | 1,997 | |||||||||||||||
|
Commercial and industrial |
- | - | - | 64 | 64 | |||||||||||||||
|
Consumer |
56 | 25 | 2 | 90 | 173 | |||||||||||||||
|
State and political subdivisions |
- | - | - | - | - | |||||||||||||||
|
Total non-accrual loans |
433 | 495 | 19 | 1,287 | 2,234 | |||||||||||||||
|
Total loans receivable |
$ | 723,246 | $ | 3,237 | $ | 988 | $ | 1,287 | $ | 728,758 | ||||||||||
The aggregate recorded investment in impaired loans was $11.3 million at December 31, 2017 and $5.6 million at December 31, 2016, an increase of $5.7 million. The increase in impaired loans was primarily due to nine loan relationships that were modified as TDRs during the year ended December 31, 2017. The following tables present a distribution of the recorded investment, unpaid principal balance and the related allowance for FNCB’s impaired loans, which have been analyzed for impairment under ASC 310, at December 31, 2017 and 2016. Non-accrual loans, other than TDRs, with balances less than the $100 thousand loan relationship threshold are not evaluated individually for impairment and accordingly, are not included in the following tables. However, these loans are evaluated collectively for impairment as homogenous pools in the general allowance under ASC Topic 450. Total non-accrual loans, other than TDRs, with balances less than the $100 thousand loan relationship threshold that were evaluated under ASC Topic 450 amounted to $0.5 million at December 31, 2017 and $0.8 million at December 31, 2016.
|
December 31, 2017 |
||||||||||||
|
(in thousands) |
Recorded Investment |
Unpaid Principal Balance |
Related Allowance |
|||||||||
|
With no allowance recorded: |
||||||||||||
|
Real estate: |
||||||||||||
|
Residential real estate |
$ | 190 | $ | 216 | $ | - | ||||||
|
Commercial real estate |
5,174 | 5,295 | - | |||||||||
|
Construction, land acquisition and development |
85 | 85 | - | |||||||||
|
Total real estate |
5,449 | 5,596 | - | |||||||||
|
Commercial and industrial |
21 | 53 | - | |||||||||
|
Consumer |
30 | 30 | - | |||||||||
|
State and political subdivisions |
- | - | - | |||||||||
|
Total impaired loans with no related allowance recorded |
5,500 | 5,679 | - | |||||||||
|
With a related allowance recorded: |
||||||||||||
|
Real estate: |
||||||||||||
|
Residential real estate |
1,712 | 1,751 | 33 | |||||||||
|
Commercial real estate |
2,990 | 2,990 | 138 | |||||||||
|
Construction, land acquisition and development |
- | - | - | |||||||||
|
Total real estate |
4,702 | 4,741 | 171 | |||||||||
|
Commercial and industrial |
774 | 774 | 600 | |||||||||
|
Consumer |
365 | 365 | 2 | |||||||||
|
State and political subdivisions |
- | - | - | |||||||||
|
Total impaired loans with a related allowance recorded |
5,841 | 5,880 | 773 | |||||||||
|
Total of impaired loans |
||||||||||||
|
Real estate: |
||||||||||||
|
Residential real estate |
1,902 | 1,967 | 33 | |||||||||
|
Commercial real estate |
8,164 | 8,285 | 138 | |||||||||
|
Construction, land acquisition and development |
85 | 85 | - | |||||||||
|
Total real estate |
10,151 | 10,337 | 171 | |||||||||
|
Commercial and industrial |
795 | 827 | 600 | |||||||||
|
Consumer |
395 | 395 | 2 | |||||||||
|
State and political subdivisions |
- | - | - | |||||||||
|
Total impaired loans |
$ | 11,341 | $ | 11,559 | $ | 773 | ||||||
|
December 31, 2016 |
||||||||||||
|
(in thousands) |
Recorded Investment |
Unpaid Principal Balance |
Related Allowance |
|||||||||
|
With no allowance recorded: |
||||||||||||
|
Real estate: |
||||||||||||
|
Residential real estate |
$ | 386 | $ | 477 | $ | - | ||||||
|
Commercial real estate |
1,066 | 1,143 | - | |||||||||
|
Construction, land acquisition and development |
350 | 766 | - | |||||||||
|
Total real estate |
1,802 | 2,386 | - | |||||||||
|
Commercial and industrial |
73 | 105 | - | |||||||||
|
Consumer |
- | - | - | |||||||||
|
State and political subdivisions |
- | - | - | |||||||||
|
Total impaired loans with no related allowance recorded |
1,875 | 2,491 | - | |||||||||
|
With a related allowance recorded: |
||||||||||||
|
Real estate: |
||||||||||||
|
Residential real estate |
1,543 | 1,543 | 29 | |||||||||
|
Commercial real estate |
1,871 | 1,871 | 254 | |||||||||
|
Construction, land acquisition and development |
- | - | - | |||||||||
|
Total real estate |
3,414 | 3,414 | 283 | |||||||||
|
Commercial and industrial |
18 | 18 | 18 | |||||||||
|
Consumer |
297 | 297 | 1 | |||||||||
|
State and political subdivisions |
- | - | - | |||||||||
|
Total impaired loans with a related allowance recorded |
3,729 | 3,729 | 302 | |||||||||
|
Total of impaired loans |
||||||||||||
|
Real estate: |
||||||||||||
|
Residential real estate |
1,929 | 2,020 | 29 | |||||||||
|
Commercial real estate |
2,937 | 3,014 | 254 | |||||||||
|
Construction, land acquisition and development |
350 | 766 | - | |||||||||
|
Total real estate |
5,216 | 5,800 | 283 | |||||||||
|
Commercial and industrial |
91 | 123 | 18 | |||||||||
|
Consumer |
297 | 297 | 1 | |||||||||
|
State and political subdivisions |
- | - | - | |||||||||
|
Total impaired loans |
$ | 5,604 | $ | 6,220 | $ | 302 | ||||||
The following table presents the average balance and the interest income recognized on impaired loans for the years ended December 31, 2017, 2016 and 2015:
|
Year Ended December 31, |
||||||||||||||||||||||||
|
2017 |
2016 |
2015 |
||||||||||||||||||||||
|
(in thousands) |
Average Balance |
Interest Income (1) |
Average Balance |
Interest Income (1) |
Average Balance |
Interest Income (1) |
||||||||||||||||||
|
Real estate: |
||||||||||||||||||||||||
|
Residential real estate |
$ | 2,017 | $ | 84 | $ | 2,428 | $ | 91 | $ | 3,157 | $ | 121 | ||||||||||||
|
Commercial real estate |
7,391 | 276 | 3,489 | 92 | 6,830 | 106 | ||||||||||||||||||
|
Construction, land acquisition and development |
104 | 4 | 428 | 7 | 570 | 18 | ||||||||||||||||||
|
Total real estate |
9,512 | 364 | 6,345 | 190 | 10,557 | 245 | ||||||||||||||||||
|
Commercial and industrial |
1,028 | 15 | 283 | 2 | 174 | 2 | ||||||||||||||||||
|
Consumer |
363 | 13 | 300 | 10 | 356 | 11 | ||||||||||||||||||
|
State and political subdivisions |
- | - | - | - | - | - | ||||||||||||||||||
|
Total impaired loans |
$ | 10,903 | $ | 392 | $ | 6,928 | $ | 202 | $ | 11,087 | $ | 258 | ||||||||||||
|
(1) Interest income represents income recognized on performing TDRs. |
||||||||||||||||||||||||
The additional interest income that would have been earned on non-accrual and restructured loans had these loans performed in accordance with their original terms approximated $0.2 million for the year ended December 31, 2017, $0.2 million for the year ended December 31, 2016, and $0.4 million for the year ended December 31, 2015.
Troubled Debt Restructured Loans
TDRs at December 31, 2017 and 2016 were $10.2 million and $4.3 million, respectively. Accruing and non-accruing TDRs were $9.3 million and $0.9 million, respectively at December 31, 2017 and $4.2 million and $0.1 million, respectively at December 31, 2016. Approximately $750 thousand and $261 thousand in specific reserves have been established for TDRs as of December 31, 2017 and 2016, respectively. FNCB was not committed to lend additional funds to any loan classified as a TDR at December 31, 2017 and 2016.
The modification of the terms of such loans may include one or a combination of the following, among others: a reduction of the stated interest rate of the loan, an extension of the maturity date, capitalization of real estate taxes, a payment modification under a forbearance agreement, or a permanent reduction of the recorded investment in the loan.
The following table presents the pre- and post-modification recorded investment in loans modified as TDRs and type of modifications made during the years ended December 31, 2017, 2016 and 2015:
|
Year Ended December 31, 2017 |
||||||||||||||||||||||||||||
|
Pre-Modification Outstanding Recorded Investment by Type of Modification |
||||||||||||||||||||||||||||
|
(dollars in thousands) |
Number of Contracts |
Extension of Term |
Extension of Term and Capitalization of Taxes |
Extension of Term and Forbearance |
Forbearance |
Total |
Post-Modification Outstanding Recorded Investment |
|||||||||||||||||||||
|
Loan category: |
||||||||||||||||||||||||||||
|
Residential real estate |
2 | $ | 190 | $ | - | $ | - | $ | - | $ | 190 | $ | 190 | |||||||||||||||
|
Commercial real estate |
8 | - | - | - | 5,250 | 5,250 | 5,250 | |||||||||||||||||||||
|
Construction, land acquisition and development |
- | - | - | - | - | - | - | |||||||||||||||||||||
|
Commercial and industrial |
4 | - | - | 25 | 1,820 | 1,845 | 1,575 | |||||||||||||||||||||
|
Consumer |
2 | - | 85 | - | - | 85 | 104 | |||||||||||||||||||||
|
State and political subdivisions |
- | - | - | - | - | - | - | |||||||||||||||||||||
|
Total modifications |
16 | $ | 190 | $ | 85 | $ | 25 | $ | 7,070 | $ | 7,370 | $ | 7,119 | |||||||||||||||
|
Year Ended December 31, 2016 |
||||||||||||||||||||||||||||
|
Pre-Modification Outstanding Recorded Investment by Type of Modification |
||||||||||||||||||||||||||||
|
(in thousands) |
Number of Contracts |
Extension of Term |
Extension of Term and Capitalization of Taxes |
Extension of Term and Forbearance |
Forbearance |
Total |
Post-Modification Outstanding Recorded Investment |
|||||||||||||||||||||
|
Loan category: |
||||||||||||||||||||||||||||
|
Residential real estate |
2 | $ | 159 | $ | 95 | $ | - | $ | - | $ | 254 | $ | 258 | |||||||||||||||
|
Commercial real estate |
- | - | - | - | - | - | - | |||||||||||||||||||||
|
Construction, land acquisition and development |
- | - | - | - | - | - | - | |||||||||||||||||||||
|
Commercial and industrial |
2 | 52 | - | - | - | 52 | 52 | |||||||||||||||||||||
|
Consumer |
- | - | - | - | - | - | - | |||||||||||||||||||||
|
State and political subdivisions |
- | - | - | - | - | - | - | |||||||||||||||||||||
|
Total modifications |
4 | $ | 211 | $ | 95 | $ | - | $ | - | $ | 306 | $ | 310 | |||||||||||||||
|
Year Ended December 31, 2015 |
||||||||||||||||||||||||||||
|
Pre-Modification Outstanding Recorded Investment by Type of Modification |
||||||||||||||||||||||||||||
|
(in thousands) |
Number of Contracts |
Extension of Term |
Extension of Term and Capitalization of Taxes |
Extension of Term and Forbearance |
Forbearance |
Total |
Post-Modification Outstanding Recorded Investment |
|||||||||||||||||||||
|
Loan category: |
||||||||||||||||||||||||||||
|
Residential real estate |
5 | $ | 710 | $ | 100 | $ | - | $ | - | $ | 810 | $ | 827 | |||||||||||||||
|
Commercial real estate |
1 | - | - | - | 1,654 | 1,654 | 742 | |||||||||||||||||||||
|
Construction, land acquisition and development |
1 | 96 | - | - | - | 96 | 96 | |||||||||||||||||||||
|
Commercial and industrial |
1 | - | - | - | 79 | 79 | 79 | |||||||||||||||||||||
|
Consumer |
- | - | - | - | - | - | - | |||||||||||||||||||||
|
State and political subdivisions |
- | - | - | - | - | - | - | |||||||||||||||||||||
|
Total modifications |
8 | $ | 806 | $ | 100 | $ | - | $ | 1,733 | $ | 2,639 | $ | 1,744 | |||||||||||||||
There were nine loan relationships modified as TDRs during the year ended December 31, 2017, which incorporated a total of sixteen individual loans. There were three loan relationships, comprised of eight commercial real estate loans totaling $5.3 million, and two loan relationships, comprised of four commercial and industrial loans totaling $1.8 million, that were modified under varying forms of forbearance agreements during the year ended December 31, 2017. Additional TDRs included two consumer loans totaling $85 thousand that had their terms extended and delinquent taxes capitalized, as well as two residential real estate loans totaling of $190 thousand that had their terms extended. The commercial real estate modifications included a principal forbearance agreement for one loan in the amount of $4.0 million and reductions in required monthly principal payments resulting in balloon payments due at maturity for seven loans to two borrowers aggregating $1.2 million. The four commercial and industrial loan modifications involved the delay of required principal and interest payments for predefined time periods. In addition, a charge-off in the amount of $0.3 million was recorded as part of the modification of three commercial and industrial loans aggregating $1.8 million to one borrower. During the third quarter of 2017, two of the four commercial and industrial loans totaling $0.8 million were paid off. All remaining loans modified during the year ended December 31, 2017 are performing in accordance with their respective modified terms.
The following table presents the number and recorded investment of TDRs that were modified within the previous 12 months which have defaulted (defined as past due 90 days or more) during the years ended December 31, 2017 and 2016. There were no TDRs modified within the previous 12 months that defaulted during the year ended December 31, 2015.
|
For the Year Ended December 31, 2017 |
For the Year Ended December 31, 2016 |
|||||||||||||||
|
(in thousands) |
Number of Contracts |
Recorded Investment |
Number of Contracts |
Recorded Investment |
||||||||||||
|
Type of modification: |
||||||||||||||||
|
Residential real estate |
- | $ | - | 3 | $ | 107 | ||||||||||
|
Commercial real estate |
- | - | 1 | 680 | ||||||||||||
|
Construction, land acquisition and development |
1 | 10 | - | - | ||||||||||||
|
Commercial and industrial |
- | - | - | - | ||||||||||||
|
Consumer |
- | - | - | - | ||||||||||||
|
State and political subdivisions |
- | - | - | - | ||||||||||||
|
Total modifications |
1 | $ | 10 | 4 | $ | 787 | ||||||||||
For impairment determination purposes, the three residential real estate TDRs that defaulted during the year ended December 31, 2016 were considered collateral-dependent loans. One of the three TDRs suffered a decline in collateral value, which resulted in a charge against the ALLL of $37 thousand during the year ended December 31, 2016. The one commercial real estate loan with a recorded investment of $680 thousand that defaulted during the year ended December 31, 2016, was foreclosed upon and transferred to OREO during the third quarter of 2016.
Residential Real Estate Loan Foreclosures
There were three consumer mortgage loans secured by residential real estate properties in the process of foreclosure with an aggregate recorded investment of $14 thousand at December 31, 2017. There were two residential real estate properties with an aggregate carrying value of $125 thousand foreclosed upon during the year ended December 31, 2017. Of the two loans foreclosed upon during 2017, one was an investor-owned residential real estate property, which was subsequently sold during the fourth quarter of 2017. There were two residential real estate properties with an aggregate carrying value of $92 thousand included in OREO at December 31, 2017.
There were five consumer mortgage loans secured by residential real estate properties in the process of foreclosure with an aggregate recorded investment of $92 thousand at December 31, 2016. There was one residential real estate property with a carrying value of $237 thousand that was foreclosed upon during the year ended December 31, 2016. There were two residential real estate properties with an aggregate carrying value of $41 thousand included in OREO at December 31, 2016.
Note 6. BANK PREMISES AND EQUIPMENT/SUBSEQUENT EVENT
The following table summarizes bank premises and equipment at December 31, 2017 and 2016:
|
December 31, |
||||||||
|
(in thousands) |
2017 |
2016 |
||||||
|
Land |
$ | 2,757 | $ | 2,757 | ||||
|
Buildings and improvements |
7,968 | 7,676 | ||||||
|
Furniture, fixtures and equipment |
10,231 | 12,299 | ||||||
|
Leasehold improvements |
5,225 | 5,184 | ||||||
|
Total |
26,181 | 27,916 | ||||||
|
Accumulated depreciation |
(15,793 | ) | (17,132 | ) | ||||
|
Net |
$ | 10,388 | $ | 10,784 | ||||
Depreciation and amortization expense of premises and equipment amounted to $1.4 million, $1.3 million, and $1.2 million for the years ended December 31, 2017, 2016 and 2015, respectively.
On May 1, 2017, FNCB announced that the Bank will implement a comprehensive branch network improvement program that will focus on strengthening, better positioning and expanding its market coverage by developing new state-of-the-art customer facilities, as well as relocating and consolidating select locations. In accordance with the branch network improvement program, on June 30, 2017, FNCB consolidated its branch office located at 1127 Texas Palmyra Highway, Honesdale, Wayne County, Pennsylvania with its branch located at 1001 Main Street, Honesdale, Pennsylvania. FNCB did not incur any significant disposal costs on the Wayne County consolidation.
As part of this network improvement program, FNCB also announced on May 1, 2017, its intention to relocate three branches located in Luzerne County, Pennsylvania to a new location. The three branches that will be relocated are: 1) a branch located at 734 San Souci Parkway, Hanover Township, Pennsylvania; 2) a branch located at 27 North River Street, Plains, Pennsylvania; and 3) a branch located at 3 Old Boston Road, Pittston, Pennsylvania. These three branches will be relocated into a brand-new facility to be built in the Richland 315 development located at 1150 Route 315, Wilkes-Barre (Plains Township), Luzerne County, Pennsylvania. FNCB currently leases the three branches, as well as the aforementioned Honesdale branch, that was consolidated, and will lease the future Luzerne County facility. FNCB does not expect to incur any significant disposal costs on the Luzerne County branch consolidations. The construction of the Luzerne County facility began in the fourth quarter of 2017 and is expected to be completed in the second quarter of 2018, at which time the Luzerne County branch consolidation will occur. The three existing branches will continue to operate as full-service branches until that time.
On October 11, 2017, the Bank signed an agreement to purchase its corporate center located at 200 South Blakely Street, Dunmore, Lackawanna County, Pennsylvania for $2.15 million. FNCB had been leasing this property since 1994. The purchase of the corporate center was finalized on January 12, 2018.
Note 7. DEPOSITS
The following table summarizes deposits by major category at December 31, 2017 and 2016:
|
December 31, |
||||||||
|
(in thousands) |
2017 |
2016 |
||||||
|
Demand (non-interest bearing) |
$ | 176,325 | $ | 173,702 | ||||
|
Interest-bearing: |
||||||||
|
Interest-bearing demand |
532,351 | 551,114 | ||||||
|
Savings |
101,433 | 103,241 | ||||||
|
Time ($250,000 and over) |
43,807 | 35,917 | ||||||
|
Other time |
148,532 | 151,165 | ||||||
|
Total interest-bearing |
826,123 | 841,437 | ||||||
|
Total deposits |
$ | 1,002,448 | $ | 1,015,139 | ||||
The aggregate amount of deposits reclassified as loans was $57 thousand at December 31, 2017 and $80 thousand at December 31, 2016. Management evaluates transaction accounts that are overdrawn for collectability as part of its evaluation for credit losses. During 2017 and 2016, no deposits were received on terms other than those available in the normal course of business.
The following table summarizes scheduled maturities of time deposits, including certificates of deposit and individual retirement accounts, at December 31, 2017:
| $250,000 |
Other |
|||||||||||
|
(in thousands) |
and Over |
Time Deposits |
Total |
|||||||||
|
2018 |
$ | 33,537 | $ | 110,133 | $ | 143,670 | ||||||
|
2019 |
8,051 | 19,412 | 27,463 | |||||||||
|
2020 |
1,310 | 8,535 | 9,845 | |||||||||
|
2021 |
400 | 5,877 | 6,277 | |||||||||
|
2022 |
509 | 4,575 | 5,084 | |||||||||
|
2023 and thereafter |
- | - | - | |||||||||
|
Total |
$ | 43,807 | $ | 148,532 | $ | 192,339 | ||||||
Investment securities with a carrying value of $282.3 million and $271.3 million at December 31, 2017 and 2016, respectively, were pledged to collateralize certain municipal deposits. In addition, FNCB had outstanding letters of credit with the FHLB to secure municipal deposits of $5.0 million and $75.0 million at December 31, 2017 and 2016, respectively.
Note 8. BORROWED FUNDS
Short-term borrowings available to FNCB include overnight FHLB of Pittsburgh advances, federal funds purchased and the Federal Reserve Discount Window, which generally represent overnight or less than 30-day borrowings. FNCB’s maximum borrowing capacity under federal funds lines of credit and the Federal Reserve Discount Window was $20.0 million and $12.5 million, respectively at December 31, 2017. Federal funds lines of credit are unsecured, while any borrowings through the Federal Reserve Discount Window are fully collateralized by certain pledged loans in the amount of $22.6 million at December 31, 2017.
FNCB has an agreement with the FHLB of Pittsburgh which allows for borrowings, either overnight or term, up to its maximum borrowing capacity, which is based on a percentage of qualifying loans pledged under a blanket pledge agreement. Loans of $448.2 million and $427.8 million, at December 31, 2017 and 2016, respectively, were pledged to collateralize borrowings under this agreement. FNCB’s maximum borrowing capacity was $314.3 million at December 31, 2017, of which $45.0 million in fixed-rate advances having original maturities between nine months and five years, as well as a $5.0 million letter of credit to secure municipal deposits, were outstanding. In addition to pledging loans, FNCB is required to purchase FHLB of Pittsburgh stock based upon the amount of advances and letters of credit outstanding.
|
As of and for the Year Ended December 31, 2017 |
||||||||||||||||||||
|
Weighted |
Weighted |
|||||||||||||||||||
|
Maximum |
Average |
Average |
||||||||||||||||||
|
Ending |
Average |
Month-End |
Rate for |
Rate at |
||||||||||||||||
|
(dollars in thousands) |
Balance |
Balance |
Balance |
the Year |
Period End |
|||||||||||||||
|
FHLB of Pittsburgh advances - overnight |
$ | - | $ | 3,679 | $ | 22,260 | 1.22 | % | - | |||||||||||
|
FHLB of Pittsburgh advances - term |
44,968 | 50,477 | 59,805 | 1.10 | % | 1.44 | % | |||||||||||||
|
Federal funds |
- | - | - | - | - | |||||||||||||||
|
Federal reserve discount window advances |
- | - | - | - | - | |||||||||||||||
|
Subordinated debentures |
5,000 | 8,329 | 10,000 | 4.50 | % | 4.50 | % | |||||||||||||
|
Junior subordinated debentures |
10,310 | 10,310 | 10,310 | 2.90 | % | 2.99 | % | |||||||||||||
|
As of and for the Year Ended December 31, 2016 |
||||||||||||||||||||
|
Weighted |
Weighted |
|||||||||||||||||||
|
Maximum |
Average |
Average |
||||||||||||||||||
|
Ending |
Average |
Month-End |
Rate for |
Rate at |
||||||||||||||||
|
(dollars in thousands) |
Balance |
Balance |
Balance |
the Year |
Period End |
|||||||||||||||
|
FHLB of Pittsburgh advances - overnight |
$ | - | $ | 21,443 | $ | 74,280 | 0.56 | % | - | |||||||||||
|
FHLB of Pittsburgh advances - term |
58,537 | 57,824 | 70,994 | 0.74 | % | 0.87 | % | |||||||||||||
|
Federal funds |
- | - | - | - | - | |||||||||||||||
|
Federal reserve discount window advances |
- | - | - | - | - | |||||||||||||||
|
Subordinated debentures |
10,000 | 13,661 | 14,000 | 4.50 | % | 4.50 | % | |||||||||||||
|
Junior subordinated debentures |
10,310 | 10,310 | 10,310 | 2.39 | % | 2.52 | % | |||||||||||||
On December 14, 2006, the Issuing Trust issued $10.0 million of trust preferred securities (the “Trust Securities”) at a variable interest rate of 7.02%, with a scheduled maturity of December 15, 2036. FNCB owns 100.0% of the ownership interest in the Issuing Trust. The proceeds from the issue were invested in $10.3 million, 7.02% Junior Subordinated Debentures (the “Debentures”) issued by FNCB. The interest rate on the Trust Securities and the Debentures resets quarterly at a spread of 1.67% above the current 3-month LIBOR rate. The average interest rate paid on the Debentures was 2.90% in 2017, 2.39% in 2016, and 1.99% in 2015. The Debentures are unsecured and rank subordinate and junior in right to all indebtedness, liabilities and obligations of FNCB. The Debentures represent the sole assets of the Trust. Interest on the Trust Securities is deferrable until a period of twenty consecutive quarters has elapsed. FNCB had the option to prepay the Trust Securities beginning December 15, 2011. FNCB has, under the terms of the Debentures and the related Indenture, as well as the other operative corporate documents, agreed to irrevocably and unconditionally guarantee the Trust’s obligations under the Debentures. FNCB has reflected this investment on a deconsolidated basis. As a result, the Debentures totaling $10.3 million, have been reflected in borrowed funds in the consolidated statements of financial condition at December 31, 2017 and 2016 under the caption “Junior Subordinated Debentures”. FNCB records interest expense on the Debentures in its consolidated statements of income. FNCB also records its common stock investment issued by First National Community Statutory Trust I in other assets in its consolidated statements of financial condition at December 31, 2017 and 2016. At December 31, 2017 and 2016, accrued and unpaid interest associated with the Debentures amounted to $16 thousand and $13 thousand, respectively.
On September 1, 2009, FNCB offered only to accredited investors up to $25.0 million principal amount of unsecured subordinated debentures due September 1, 2019 (the “Notes”). Prior to July 1, 2015, the Notes had a fixed interest rate of 9% per annum. Payments of interest are payable to registered holders of the Notes (the “Noteholders”) quarterly on the first of every third month, subject to the right of FNCB to defer such payment. On June 30, 2015, pursuant to approval from all of the Noteholders and the Reserve Bank, FNCB amended the original terms of the Notes to reduce the interest rate payable from 9.00% to 4.50% effective July 1, 2015 and to accelerate a partial repayment of principal amount under the Notes. Pursuant to the approved amendment, on June 30, 2015, FNCB repaid 44% of the original principal amount, or $11.0 million, of the Notes outstanding to the holders on June 30, 2015, with the remaining $14.0 million in principal to be repaid as follows: (a) 16% of the original principal amount, or $4.0 million, payable on September 1, 2017; (b) 20% of the original principal amounts, or $5.0 million, payable on September 1, 2018; and (c) the final 20% of the original principal amount, or $5.0 million, payable on September 1, 2019, the maturity date of the Notes. On October 28, 2016, the Board of Directors of FNCB approved the acceleration of a $4.0 million partial repayment of principal on the Notes. The $4.0 million principal repayment, which was due and payable on September 1, 2017, was paid to Noteholders on December 1, 2016. On July 27, 2017, the Board of Directors of FNCB approved the acceleration of a $5.0 million partial repayment of principal on the Notes. The $5.0 million principal repayment, which was due and payable on September 1, 2018, was paid to Noteholders on September 1, 2017. The principal balance outstanding for these Notes was $5.0 million at December 31, 2017 and $10.0 million at December 31, 2016. The accrued and unpaid interest associated with the Notes amounted to $19 thousand and $39 thousand at December 31, 2017 and 2016, respectively.
The following table presents maturities of borrowed funds and the weighted-average rate by contractual maturity date at December 31, 2017:
|
December 31, 2017 |
||||||||
|
(in thousands) |
Amount |
Weighted Average Interest Rate |
||||||
|
2018 |
$ | 25,432 | 1.21 | % | ||||
|
2019 |
24,536 | 2.30 | % | |||||
|
2020 |
- | - | ||||||
|
2021 |
- | - | ||||||
|
2022 |
- | - | ||||||
|
Thereafter |
10,310 | 2.91 | % | |||||
|
Total |
$ | 60,278 | 1.95 | % | ||||
Note 9. BENEFIT PLANS
The Bank has a defined contribution profit sharing plan (“Profit Sharing Plan”) which includes the provision under section 401(k) of the Internal Revenue Code (“401(k)”) and covers all eligible employees. The Bank’s contribution to the plan is determined at management’s discretion at the end of each year and funded. The 401(k) feature of the plan permits employees to make voluntary salary deferrals, either pre-tax or Roth, up to the dollar limit prescribed by law. FNCB may make discretionary matching contributions equal to a uniform percentage of employee salary deferrals. Discretionary matching contributions are determined each year by management and approved by the Board of Directors. There were no discretionary annual contributions made to the profit sharing plan in 2017, 2016 and 2015. Discretionary matching contributions under the 401(k) feature of the plan totaled $187 thousand, $168 thousand, and $149 thousand in 2017, 2016 and 2015, respectively.
The Bank has an unfunded non-qualified deferred compensation plan covering all eligible Bank officers and directors as defined by the plan. This plan permits eligible participants to elect to defer a portion of their compensation. Elective deferred compensation and accrued earnings, included in other liabilities in the accompanying consolidated statements of financial condition, aggregated $3.1 million at both December 31, 2017 and 2016.
On October 1, 2015, the Bank executed a Supplemental Executive Retirement Plan (“SERP”) for a select group of management or highly compensated employees within the meaning of Sections 201(2), 301(a)(3) and 401(a)(1) of The Employee Retirement Income Security Act of 1974. The general provisions of the SERP provide for annual year-end contributions, performance contingent contributions and discretionary contributions. The SERP contributions are unfunded for Federal tax purposes and constitute an unsecured promise by the Bank to pay benefits in the future and are included in other liabilities in the accompanying consolidated statements of financial condition. Participants in the SERP shall have the status of general unsecured creditors of the Bank. SERP contributions totaled $172 thousand, $147 thousand, and $130 thousand in 2017, 2016, and 2015, respectively. The total liability associated with the SERP was $449 thousand at December 31, 2017 and $277 thousand at December 31, 2016.
Note 10. INCOME TAXES
On December 22, 2017, President Trump signed into law H.R.1., formally known as the “Tax Cuts and Jobs Act,” which among other things, reduces the maximum federal corporate income tax rate from 35.0% to 21.0% effective January 1, 2018. In accordance with GAAP, the enactment of this new tax legislation required FNCB to revalue its deferred tax assets at the new corporate statutory rate of 21.0% as of December 31, 2017. The revaluation of FNCB’s deferred tax assets, net of deferred tax liabilities, resulted in a reduction in its net deferred tax assets of $8.0 million in the fourth quarter of 2017 with a corresponding increase in the income tax expense.
The following table summarizes the current and deferred amounts of the provision for income tax expense (benefit) and the change in valuation allowance for each of the three years ended December 31, 2017, 2016 and 2015:
|
For the Year Ended December 31, |
||||||||||||
|
(in thousands) |
2017 |
2016 |
2015 |
|||||||||
|
Current |
$ | 251 | $ | 134 | $ | (75 | ) | |||||
|
Deferred |
3,030 | 1,968 | 2,297 | |||||||||
|
Revaluation adjustment |
8,007 | - | - | |||||||||
|
Change in valuation allowance |
- | (355 | ) | (29,981 | ) | |||||||
|
Income tax expense (benefit) |
$ | 11,288 | $ | 1,747 | $ | (27,759 | ) | |||||
The following table presents a reconciliation between the effective income tax expense (benefit) and the income tax expense that would have been provided at FNCB’s historic federal statutory tax rate of 34.0% for each of the years ended December 31, 2017, 2016 and 2015:
|
For the Year Ended December 31, |
||||||||||||
|
(in thousands) |
2017 |
2016 |
2015 |
|||||||||
|
Provision at statutory tax rates |
$ | 3,888 | $ | 2,739 | $ | 2,748 | ||||||
|
Add (deduct): |
||||||||||||
|
Tax effects of non-taxable income |
(459 | ) | (481 | ) | (483 | ) | ||||||
|
Non-deductible interest expense |
10 | 9 | 11 | |||||||||
|
Bank-owned life insurance |
(179 | ) | (187 | ) | (192 | ) | ||||||
|
Change in valuation allowance |
- | (355 | ) | (29,981 | ) | |||||||
|
Revaluation adjustment |
8,007 | - | - | |||||||||
|
Other items, net |
21 | 22 | 138 | |||||||||
|
Income tax expense (benefit) |
$ | 11,288 | $ | 1,747 | $ | (27,759 | ) | |||||
The following table summarizes the components of the net deferred tax asset included in other assets at December 31, 2017 and 2016:
|
December 31, |
||||||||
|
(in thousands) |
2017 |
2016 |
||||||
|
Allowance for loan and lease losses |
$ | 1,986 | $ | 2,961 | ||||
|
Deferred compensation |
761 | 1,242 | ||||||
|
Unrealized holding losses on securities available-for-sale |
464 | 804 | ||||||
|
Other real estate owned valuation |
195 | 233 | ||||||
|
Deferred intangible assets |
457 | 997 | ||||||
|
Employee benefits |
158 | 272 | ||||||
|
AMT tax credits |
2,850 | 2,600 | ||||||
|
Charitable contribution carryover |
74 | 235 | ||||||
|
Accrued rent expense |
75 | 157 | ||||||
|
Accrued vacation |
26 | 55 | ||||||
|
Accrued legal settlement costs |
544 | 941 | ||||||
|
Deferred income |
35 | 81 | ||||||
|
Depreciation |
97 | - | ||||||
|
Prepaid expenses |
9 | - | ||||||
|
Net operating loss carryover |
8,515 | 17,123 | ||||||
|
Gross deferred tax assets |
16,246 | 27,701 | ||||||
|
Deferred loan origination costs |
(251 | ) | (551 | ) | ||||
|
Accrued interest |
(210 | ) | (193 | ) | ||||
|
Prepaid expenses |
- | (74 | ) | |||||
|
Depreciation |
- | (8 | ) | |||||
|
Gross deferred tax liabilities |
(461 | ) | (826 | ) | ||||
|
Net deferred tax assets |
$ | 15,785 | $ | 26,875 | ||||
As of December 31, 2017, FNCB had $40.5 million of net operating loss carryovers resulting in deferred tax assets of $8.5 million. As of December 31, 2017, FNCB also had $353 thousand of charitable contribution carryovers resulting in gross deferred tax assets of $74 thousand. These charitable contribution carryovers will begin to expire after December 31, 2018 if not utilized. In addition, FNCB had alternative minimum tax (“AMT”) credit carryovers of $2.9 million as of December 31, 2017 that have an indefinite life.
Management evaluates the carrying amount of its deferred tax assets on a quarterly basis, or more frequently if necessary, in accordance with guidance set forth in ASC Topic 740 “Income Taxes,” and applies the criteria in the guidance to determine whether it is more likely than not that some portion, or all, of the deferred tax asset will not be realized within its life cycle, based on the weight of available evidence. In evaluating available evidence, management considers, among other factors, historical financial performance, expectation of future earnings, the ability to carry back losses to recoup taxes previously paid, length of statutory carry forward periods, experience with operating loss and tax credit carry forwards not expiring unused, tax planning strategies and timing of reversals of temporary differences. In assessing the need for a valuation allowance, management carefully weighs both positive and negative evidence currently available. The weight given to the potential effect of positive and negative evidence must be commensurate with the extent to which it can be objectively verified. If management determines based on available evidence, both positive and negative, that it is more likely than not that some portion or all of the deferred tax asset will not be realized in future periods, a valuation allowance is calculated and recorded. These determinations are inherently subjective and depend upon management’s estimates and judgments used in their evaluation of both positive and negative evidence.
Prior to December 31, 2015, FNCB had established a full valuation allowance for its deferred tax assets. At December 31, 2015, management performed an evaluation of FNCB’s deferred tax assets and determined that based on its consistent methodology the negative evidence that was previously present to support the full valuation allowance no longer existed. FNCB’s core earnings had normalized and it was now in a cumulative three-year income position, which management deemed to be positive evidence. In addition, management believed that FNCB’s projected future earnings were sufficient to be able to utilize its available NOL carryforwards prior to their expiration.
This analysis supported the reversal of the valuation allowance established for deferred tax assets at December 31, 2015 except for the valuation allowance established for charitable contribution carryforwards. At December 31, 2015, FNCB had $1.0 million in contribution carryforwards available. Unlike the expiration period for net operating loss carryforwards (generally 20 years) and AMT credit carryovers (indefinite), the expiration of an excess charitable contribution carryover occurs after the 5th succeeding tax year for which a charitable contribution is made. Management did not believe that enough positive evidence existed at that time to support the utilization of charitable contribution carryforwards in entirety before expiration at December 31, 2015. Accordingly, management believed a valuation allowance in the amount of $355 thousand was appropriate strictly in the case of the excess charitable contribution carryover deferred tax asset at December 31, 2015.
Management performed an evaluation of FNCB’s deferred tax assets at December 31, 2017 and 2016 taking into consideration all available positive and negative evidence at that time. Based on this evaluation, management believes that FNCB’s future taxable income will be sufficient to utilize deferred tax assets. FNCB’s projected future core earnings will continue to support the recognition of the deferred tax assets based on future growth projections. Accordingly, a valuation allowance for deferred tax assets, including deferred tax assets related to excess charitable contribution carryovers, was not required at December 31, 2017 and 2016.
Note 11. RELATED PARTY TRANSACTIONS
In conducting its business, FNCB has engaged in, and intends to continue to engage in, banking and financial transactions with directors, executive officers and their related parties.
FNCB has granted loans, letters of credit and lines of credit to directors, executive officers and their related parties. The following table summarizes the changes in the total amounts of such outstanding loans, advances under lines of credit, net of any participations sold, as well as repayments during the years ended December 31, 2017 and 2016:
|
For the Year Ended December 31, |
||||||||
|
(in thousands) |
2017 |
2016 |
||||||
|
Balance January 1, |
$ | 42,007 | $ | 52,652 | ||||
|
Additions, new loans and advances |
76,324 | 24,917 | ||||||
|
Repayments |
(62,755 | ) | (35,513 | ) | ||||
|
Other (1) |
- | (49 | ) | |||||
|
Balance December 31, |
$ | 55,576 | $ | 42,007 | ||||
____________________________________________
|
(1) Other represents loans to related parties that ceased being related parties during the year |
At December 31, 2017, there were no loans made to directors, executive officers and their related parties that were not performing in accordance with the terms of the loan agreements. As of December 31, 2016, there was one loan relationship aggregating $381 thousand to a business partially owned by a director that was classified as “Special Mention”. Management had classified the loan relationship as special mention strictly because FNCB has not received current financial information from a non-related party to the loan agreements. During the first quarter of 2017, the required updated financial information had been received, and the loan relationship was no longer criticized.
On September 27, 2017, the Board of Directors of FNCB elected three new directors to the Board of Directors. The addition of the three directors and their related parties contributed $25.9 million of the $76.3 million in additions, new loans and advances during the year ended December 31, 2017.
Deposits from directors, executive officers and their related parties held by the Bank at December 31, 2017 and 2016 amounted to $139.2 million and $119.3 million, respectively. Interest paid on the deposits amounted to $298 thousand, $196 thousand, and $276 thousand for the years ended December 31, 2017, 2016 and 2015, respectively.
In the course of its operations, FNCB acquires goods and services from, and transacts business with, various companies of related parties, which include, but are not limited to, employee health insurance, fidelity bond and errors and omissions insurance, legal services, and repair of repossessed automobiles for resale. FNCB recorded payments to related parties for goods and services of $2.6 million, $2.6 million, and $2.1 million in 2017, 2016, and 2015, respectively.
The Notes held by directors and/or their related parties totaled $3.1 million at December 31, 2017 and $6.2 million at December 31, 2016. On December 1, 2016, FNCB accelerated a $4.0 million principal repayment, which was due and payable on September 1, 2017, of which $2.5 million was paid to directors and/or their related interests. On September 1, 2017, FNCB accelerated a $5.0 million principal repayment, which was due and payable on September 1, 2018, of which $3.1 million was paid to directors and/or their related interests.
The following table summarizes the activity related to FNCB’s subordinated debt for the years ended December 31, 2017 and 2016:
|
For the Year Ended |
For the Year Ended |
|||||||||||||||||||||||
|
December 31, 2017 |
December 31, 2016 |
|||||||||||||||||||||||
|
(in thousands) |
Related Party Subordinated Noteholders |
Other Subordinated Noteholders |
Total Subordinated Notes Outstanding |
Related Party Subordinated Noteholders |
Other Subordinated Noteholders |
Total Subordinated Notes Outstanding |
||||||||||||||||||
|
Balance, beginning of period |
$ | 6,171 | $ | 3,829 | $ | 10,000 | $ | 8,640 | $ | 5,360 | $ | 14,000 | ||||||||||||
|
Assignments |
- | - | - | - | - | - | ||||||||||||||||||
|
Principal reductions |
(3,085 | ) | (1,915 | ) | (5,000 | ) | (2,469 | ) | (1,531 | ) | (4,000 | ) | ||||||||||||
|
Balance, end of period |
$ | 3,086 | $ | 1,914 | $ | 5,000 | $ | 6,171 | $ | 3,829 | $ | 10,000 | ||||||||||||
On March 1, 2016, FNCB paid $10.8 million in deferred and accrued interest on the Notes for a deferral period from September 1, 2010 through May 31, 2015, of which $3.9 million was paid to FNCB’s directors and/or their related parties. Regular quarterly interest payments on the Notes paid by FNCB to its directors and/or their related parties totaled $246 thousand in 2017 and $395 thousand in 2016. Interest expense recorded on the Notes for directors and/or their related parties amounted to $235 thousand and $386 thousand for the years ended December 31, 2017 and 2016, respectively. Interest accrued and unpaid on the Notes to directors and/or their related parties totaled $12 thousand at December 31, 2017 and $24 thousand at December 31, 2016.
Note 12. COMMITMENTS, CONTINGENCIES AND CONCENTRATIONS
Leases
At December 31, 2017, FNCB was obligated under certain non-cancelable leases with initial or remaining terms of one year or more. Minimum future obligations under non-cancelable leases in effect at December 31, 2017 are as follows:
|
Minimum Future Lease Payments |
||||||||||||
|
December 31, 2017 |
||||||||||||
|
(in thousands) |
Facilities |
Equipment |
Total |
|||||||||
|
2018 |
$ | 323 | $ | 51 | $ | 374 | ||||||
|
2019 |
194 | 32 | 226 | |||||||||
|
2020 |
161 | 5 | 166 | |||||||||
|
2021 |
139 | - | 139 | |||||||||
|
2022 |
117 | - | 117 | |||||||||
|
2023 and thereafter |
177 | - | 177 | |||||||||
|
Total |
$ | 1,111 | $ | 88 | $ | 1,199 | ||||||
Total rental expense under leases amounted to $542 thousand, $456 thousand and $795 thousand in 2017, 2016 and 2015, respectively.
Financial Instruments with off-balance sheet commitments
FNCB is a party to financial instruments with off-balance sheet risk in the normal course of business to meet the financing needs of its customers. These financial instruments include commitments to extend credit and standby letters of credit that involve varying degrees of credit, interest rate or liquidity risk in excess of the amount recognized in the balance sheet. FNCB’s exposure to credit loss from nonperformance by the other party to the financial instruments for commitments to extend credit and standby letters of credit is represented by the contractual amount of those instruments.
Financial instruments whose contract amounts represent credit risk at December 31, 2017 and 2016 are as follows:
|
December 31, |
||||||||
|
(in thousands) |
2017 |
2016 |
||||||
|
Commitments to extend credit |
$ | 190,672 | $ | 150,111 | ||||
|
Standby letters of credit |
15,994 | 21,220 | ||||||
In order to provide for probable losses inherent in these instruments, FNCB recorded reserves for unfunded commitments of $381 thousand and $249 thousand at December 31, 2017 and 2016, respectively, which were included in other liabilities on the consolidated balance sheets.
Commitments to extend credit are agreements to lend to customers in accordance with contractual provisions. These commitments usually are for specific periods or contain termination clauses and may require the payment of a fee. The total amounts of unused commitments do not necessarily represent future cash requirements, in that commitments often expire without being drawn upon.
Letters of credit and financial guarantees are agreements whereby FNCB guarantees the performance of a customer to a third party. Collateral may be required to support letters of credit in accordance with management’s evaluation of the creditworthiness of each customer. The credit exposure assumed in issuing letters of credit is essentially equal to that in other lending activities.
Federal Home Loan Bank — Mortgage Partnership Finance (“MPF”) Program
Under a secondary market loan servicing program with the FHLB, FNCB, in exchange for a monthly fee, provides a credit enhancement guarantee to the FHLB for foreclosure losses in excess of a defined First Loss Account (“FLA”) balance, up to specified amounts. At December 31, 2017, FNCB serviced payments on $10.8 million of first lien residential loan principal under these terms for the FHLB. At December 31, 2017, the maximum credit enhancement obligation for such guarantees by FNCB would be approximately $485 thousand if total foreclosure losses on the entire pool of loans exceed the FLA of approximately $64 thousand. During 2017, there was one loan that had been sold to the FHLB that FNCB was required to foreclose upon under the MPF program. Under the agreement, FNCB recognized a $55 thousand loss on the foreclosure and subsequent sale of the property, which is included in other losses in the consolidated statements of income for the year ended December 31, 2017. There was no reserve established for this guarantee at December 31, 2017 and 2016.
Concentrations of Credit Risk
Cash Concentrations: The Bank maintains cash balances at several correspondent banks. There were no due from bank accounts in excess of the $250 thousand limit covered by the Federal Deposit Insurance Corporation (“FDIC”) at December 31, 2017 or December 31, 2016.
Loan Concentrations: FNCB attempts to limit its exposure to concentrations of credit risk by diversifying its loan portfolio and closely monitoring any concentrations of credit risk. The commercial real estate and construction, land acquisition and development portfolios comprise $282.8 million, or 36.8% of gross loans at December 31, 2017. Geographic concentrations exist because FNCB provides its services in its primary market area of Northeastern Pennsylvania and conducts limited activities outside of that area. FNCB had loans and loan commitments secured by real estate outside of its primary market area of $15.5 million, or 2.0%, of gross loans at December 31, 2017.
FNCB considers an industry concentration within the loan portfolio to exist if the aggregate loan balance outstanding for that industry exceeds 25.0% of capital. The following table summarizes the concentrations within FNCB’s loan portfolio by industry at December 31, 2017 and 2016:
|
December 31, 2017 |
December 31, 2016 |
|||||||||||||||
|
% of |
% of |
|||||||||||||||
|
(in thousands) |
Amount |
Gross Loans |
Amount |
Gross Loans |
||||||||||||
|
Retail space/shopping centers |
$ | 44,184 | 5.75 | % | $ | 38,573 | 5.27 | % | ||||||||
|
1-4 family residential investment properties |
33,275 | 4.33 | % | 24,413 | 3.34 | % | ||||||||||
|
Automobile dealers |
22,792 | 2.97 | % | 31,989 | 4.37 | % | ||||||||||
Litigation
On May 24, 2012, a putative shareholder filed a complaint in the Court of Common Pleas for Lackawanna County (“Shareholder Derivative Suit”) against certain present and former directors and officers of FNCB (the “Individual Defendants”) alleging, inter alia, breach of fiduciary duty, abuse of control, corporate waste, and unjust enrichment. FNCB was named as a nominal defendant. On February 4, 2014, the Court issued a Final Order and Judgment for the matter granting approval of a Stipulation of Settlement (the “Settlement”) and dismissing all claims against FNCB and the Individual Defendants. As part of the Settlement, without admitting any fault, wrongdoing or liability, the Individual Defendants agreed to settle the derivative litigation for $5.0 million. The $5.0 million Settlement payment was made to FNCB on March 28, 2014. The Individual Defendants reserved their rights to indemnification under FNCB’s Articles of Incorporation and Bylaws, resolutions adopted by the Board, the Pennsylvania Business Corporation Law and any and all rights they have against FNCB’s and the Bank’s insurance carriers. In addition, in conjunction with the Settlement, FNCB accrued $2.5 million related to fees and costs of the plaintiff’s attorneys, which was included in non-interest expense in the consolidated statements of income for the year ended December 31, 2013. On April 1, 2014, FNCB paid the $2.5 million related to fees and costs of the plaintiff’s attorneys and partial indemnification of the Individual Defendants in the amount of $2.5 million. On July 1, 2017, FNCB continued to make partial indemnification to the Individual Defendants by commencing monthly principal payments, on behalf of the Individual Defendants, of $25,000 plus accrued interest due to First Northern Bank and Trust Co. As of December 31, 2017, $2.5 million plus accrued interest remains accrued in other liabilities related to the potential indemnification of the Individual Defendants.
On September 5, 2012, Fidelity and Deposit Company of Maryland (“F&D”) filed an action against FNCB and the Bank, as well as several current and former officers and directors of FNCB, in the United States District Court for the Middle District of Pennsylvania. F&D has asserted a claim for the rescission of a directors’ and officers’ insurance policy and a bond that it had issued to FNCB. On November 9, 2012, FNCB and the Bank answered the claim and asserted counterclaims for the losses and expenses already incurred by FNCB and the Bank. FNCB and the other defendants are defending the claims and have opposed F&D’s requested relief by way of counterclaims, breaches of contract and bad faith claims against F&D for its failure to fulfill its obligations to FNCB and the Bank under the insurance policy. Discovery is complete and the parties have exchanged expert reports. Dispositive motions have been submitted by the parties and the Court heard oral arguments on the motions on August 9, 2017. FNCB is awaiting the Court’s rulings on the dispositive motions. At this time, FNCB cannot reasonably determine the outcome of potential range of loss, if any, in connection with this matter.
On February 16, 2017, FNCB and the Bank entered into a Class Action Settlement Agreement and Release (the “Settlement Agreement”) in the matters filed in the Court of Common Pleas of Lackawanna County to Steven Antonik, Individually, and as Administrator of the Estate of Linda Kluska, William R. Howells and Louise A. Howells, Summer Benjamin, and Joshua Silfee, on behalf of themselves and all other similarly situated vs. First National Community Bancorp, Inc. and First National Community Bank, Civil Action No. 2013-CV-4438 and Charles Saxe, III, Individually and on behalf of all others similarly situated vs. First National Community Bank No. 2013-CV-5071 (collectively, the “Actions”). By entering into this Settlement Agreement, the parties to the Actions have resolved the claims made in the complaints to their mutual satisfaction. FNCB has not admitted to the validity of any claims or allegations and denies any liability in the claims made and the Plaintiffs have not admitted that any claims or allegations lack merit or foundation. Under the terms of the Settlement Agreement, the parties have agreed to the following: 1) FNCB is to pay the Plaintiffs’ class members the aggregate sum of Seven Hundred Fifty Thousand Dollars ($750,000) (an amount which FNCB recorded as a liability and corresponding expense in its 2015 operating results); 2) Plaintiffs shall release all claims against FNCB related to the Actions; 3) FNCB shall move to vacate or satisfy any judgments against any class members arising from the vehicle loans that are the subject of the Actions; and 4) FNCB shall waive the deficiency balance of each class member and remove the trade lines on each class members’ credit report associated with the subject vehicle loans that are at issue in the Actions for Experian, Equifax, and Transunion. The Settlement Agreement provides for an Incentive Award for the representative Plaintiffs and an award to Plaintiffs’ counsel of attorney’s fees and reimbursement of expenses in connection with their roles in these Actions, subject to Court approval. The Settlement Agreement was preliminarily approved by Court Order on February 16, 2017. On March 2, 2017, FNCB paid the Settlement Administrator $750,000 pursuant to the terms and conditions of the Settlement Agreement. The Settlement Agreement received final Court approval on May 31, 2017. Additionally, in association with the subject vehicle loans, FNCB has completed the removal of trade lines on each class members' credit report and has substantially completed satisfying judgments, where applicable, in favor of class members. As previously mentioned above and in connection with the primary terms of the tentative settlement agreement entered by Order of Court on December 17, 2015, FNCB recorded a liability and corresponding expense in the amount of Seven Hundred Fifty Thousand ($750,000), which was included in FNCB’s 2015 operating results.
FNCB has been subject to tax audits, and is also a party to routine litigation involving various aspects of its business, such as employment practice claims, workers compensation claims, claims to enforce liens, condemnation proceedings on properties in which FNCB holds security interests, claims involving the making and servicing of real property loans and other issues incident to its business, none of which has or is expected to have a material adverse impact on the consolidated financial condition, results of operations or liquidity of FNCB.
Note 13. STOCK COMPENSATION PLANS/SUBSEQUENT EVENT
FNCB had an Employee Stock Incentive Plan (the “Stock Incentive Plan”), where options were granted to key officers and other employees of FNCB. The aggregate number of shares authorized to be issued upon exercise of the options under the Stock Incentive Plan could not exceed 1,100,000 shares. Options and rights granted under the Stock Incentive Plan became exercisable six months after the date the options were awarded and expire ten years after the award date. Upon exercise, the shares are issued from FNCB’s authorized but unissued stock. The Stock Incentive Plan expired on August 30, 2010. Accordingly, no further grants have been, or will be, made under the Stock Incentive Plan. No compensation expense related to options under the Stock Incentive Plan was required to be recorded in each of the years ended December 31, 2017, 2016, and 2015.
The following table summarizes the status of FNCB’s Stock Incentive Plan:
|
For the Years Ended December 31, |
||||||||||||||||||||||||
|
2017 |
2016 |
2015 |
||||||||||||||||||||||
|
Weighted |
Weighted |
Weighted |
||||||||||||||||||||||
|
Average |
Average |
Average |
||||||||||||||||||||||
|
Exercise |
Exercise |
Exercise |
||||||||||||||||||||||
|
Shares |
Price |
Shares |
Price |
Shares |
Price |
|||||||||||||||||||
|
Stock options outstanding at the beginning of the year |
37,700 | $ | 13.15 | 50,746 | $ | 15.20 | 64,479 | $ | 15.87 | |||||||||||||||
|
Granted |
- | - | - | - | - | - | ||||||||||||||||||
|
Exercised |
- | - | - | - | - | - | ||||||||||||||||||
|
Forfeited |
(18,500 | ) | 15.58 | (13,046 | ) | 21.14 | (13,733 | ) | 18.33 | |||||||||||||||
|
Stock options outstanding at the end of the year |
19,200 | $ | 10.81 | 37,700 | $ | 13.15 | 50,746 | $ | 15.20 | |||||||||||||||
|
Options exercisable at year end |
19,200 | $ | 10.81 | 37,700 | $ | 13.15 | 50,746 | $ | 15.20 | |||||||||||||||
|
Weighted average fair value of options granted during the year |
$ | - | $ | - | $ | - | ||||||||||||||||||
|
Stock-based compensation expense |
$ | - | $ | - | $ | - | ||||||||||||||||||
At December 31, 2017, 2016 and 2015, the exercisable options had no total intrinsic value and there was no unrecognized compensation expense.
The following table presents information pertaining to options outstanding at December 31, 2017:
|
Options Outstanding |
Options Excercisable |
|||||||||||||||||||||
|
Weighted |
||||||||||||||||||||||
|
Average |
Weighted |
Weighted |
||||||||||||||||||||
|
Remaining |
Average |
Average |
||||||||||||||||||||
|
Number |
Contractual |
Exercise |
Number |
Exercise |
||||||||||||||||||
| Range of Exercise Price |
Outstanding |
Life |
Price |
Exercisable |
Price |
|||||||||||||||||
| $10.81 | 19,200 | 1.01 | $ | 10.81 | 19,200 | $ | 10.81 | |||||||||||||||
On November 25, 2015, the Board of Directors adopted a 2015 Employee Stock Grant Plan (the “2015 Stock Grant Plan”) under which shares of common stock not to exceed 13,550 were authorized to be granted to employees. On November 25, 2015, FNCB granted 50 shares of its common stock to each active full and part time employee. There were 13,300 shares granted under the 2015 Stock Grant Plan at a fair value of $5.15 per share. The total cost of this grant, which was included in salary expense in the consolidated statements of income, amounted to $68 thousand for the year ended December 31, 2015. No additional shares were granted under this plan. There were no such plans adopted in 2017 or 2016.
FNCB has a Long Term Incentive Compensation Plan (“LTIP”) for executives and certain key employees. The LTIP authorizes up to 1,200,000 shares of common stock for issuance and provides the Board of Directors with the authority to offer several different types of long-term incentives, including stock options, stock appreciation rights, restricted stock, restricted stock units, performance units and performance shares. The Board of Directors granted awards to executives and certain key employees under the terms of the LTIP, which were comprised solely of shares of restricted stock, of 54,549 shares, 67,600 shares and 84,900 shares for the years ended December 31, 2017, 2016 and 2015, respectively. At December 31, 2017, there were 977,619 shares of common stock available for award under the LTIP. For the years ended December 31, 2017, 2016, and 2015, stock-based compensation expense, which is included in salaries and benefits expense in the consolidated statements of income, totaled $301 thousand, $265 thousand and $247 thousand, respectively. Total unrecognized compensation expense related to unvested restricted stock awards at December 31, 2017, 2016, and 2015 was $472 thousand, $396 thousand and $453 thousand, respectively. Unrecognized compensation expense related to unvested shares of restricted stock is expected to be recognized over a weighted-average period of 3.4 years. On March 1, 2018, an additional 56,829 shares of restricted stock were awarded under the LTIP.
The following table summarizes the activity related to FNCB’s unvested restricted stock awards during the year ended December 31, 2017.
|
For the Years Ended December 31, |
||||||||||||||||||||||||
|
2017 |
2016 |
2015 |
||||||||||||||||||||||
|
Weighted- |
Weighted- |
Weighted- |
||||||||||||||||||||||
|
Average |
Average |
Average |
||||||||||||||||||||||
|
Restricted |
Grant Date |
Restricted |
Grant Date |
Restricted |
Grant Date |
|||||||||||||||||||
|
Shares |
Fair Value |
Shares |
Fair Value |
Shares |
Fair Value |
|||||||||||||||||||
|
Unvested unrestricted stock awards at January 1, |
103,874 | $ | 5.74 | 112,958 | $ | 5.99 | 45,750 | $ | 6.70 | |||||||||||||||
|
Awards granted |
54,549 | 6.83 | 67,600 | 5.53 | 84,900 | 5.75 | ||||||||||||||||||
|
Forfeitures |
(5,416 | ) | 5.73 | (23,836 | ) | 5.69 | (1,166 | ) | 6.70 | |||||||||||||||
|
Vestings |
(46,878 | ) | 5.90 | (52,848 | ) | 6.02 | (16,526 | ) | 6.70 | |||||||||||||||
|
Unvested unrestricted stock awards at December 31, |
106,129 | $ | 6.23 | 103,874 | $ | 5.74 | 112,958 | $ | 5.99 | |||||||||||||||
Note 14. REGULATORY MATTERS/SUBSEQUENT EVENT
FNCB’s ability to pay dividends to its shareholders is largely dependent on the Bank’s ability to pay dividends to FNCB. Bank regulations limit the amount of dividends that may be paid without prior approval of the Bank’s regulatory agency. Cash dividends declared and paid by FNCB during 2017 and 2016 were $0.13 per share and $0.09 per share, respectively. On April 27, 2016, the Board of Directors approved the reinstatement of the Dividend Reinvestment and Stock Purchase Plan (“DRP”) which became effective on June 1, 2016. Effective July 1, 2017, shares acquired under the DRP were purchased in open market transactions. Previously, FNCB issued shares under the DRP from authorized but unissued common shares. Shares of common stock issued under the DRP totaled 65,240 and 78,752 for the years ended December 31, 2017 and 2016, respectively. Subsequent to December 31, 2017, on January 31, 2018, FNCB declared a $0.04 per share dividend payable on March 15, 2018 to shareholders of record on March 1, 2018.
FNCB is subject to various regulatory capital requirements administered by the federal banking agencies. Failure to meet minimum capital requirements can initiate certain mandatory and possibly additional discretionary actions by regulators that, if undertaken, could have a direct material adverse effect on FNCB’s financial statements. Under capital adequacy guidelines and the regulatory framework for prompt corrective action, specific capital guidelines that involve quantitative measures of assets, liabilities, and certain off-balance sheet items as calculated under regulatory accounting practices must be met. Capital amounts and classification are also subject to qualitative judgments by the regulators about components, risk weightings, and other factors.
In July 2013, the Federal Reserve, the OCC and the FDIC approved the final Basel III capital framework for U.S. banking organizations (the “Regulatory Capital Rules”) implementing regulatory capital reforms and changes required by the Dodd-Frank Act.
The Regulatory Capital Rules were effective on January 1, 2014; however, the mandatory compliance date for FNCB and the Bank as “standardized approach” banking organizations began on January 1, 2015 and is subject to transitional provisions extending to January 1, 2019. The Regulatory Capital Rules include new risk-based capital and leverage ratios and refine the definition of what constitutes “capital” for purposes of calculating those ratios. The new minimum capital level requirements applicable to FNCB and the Bank under the Regulatory Capital Rules are:
|
● |
a total capital ratio of 8.00% (unchanged from previous rules); |
|
● |
a Tier I risk-based capital ratio of 6.00% (increased from 4.00%); |
|
● |
a new common equity Tier I risk-based capital ratio of 4.50%; and |
|
● |
a Tier I capital to average assets (“Tier I leverage ratio”) of 4.00% for all institutions. |
Under the Regulatory Capital Rules, in order to avoid limitations on capital distributions (including dividend payments and certain discretionary bonus payments to executive officers), a banking organization must hold a capital conservation buffer comprised of common equity Tier I capital above its minimum risk-based capital requirements in an amount greater than 2.5% of total risk-weighted assets. The capital conservation buffer requirement began on January 1, 2016 at the 0.625% of risk-weighted assets and will increase by that amount each year until fully phased in on January 1, 2019 at 2.50%.
The Regulatory Capital Rules also included revisions and clarifications consistent with Basel III regarding the various components of Tier I capital, including common equity, unrealized gains and losses, as well as certain instruments that will no longer qualify as Tier I capital, some of which will be phased out over time. Implementation of the deductions and other adjustments to common equity Tier I capital began on January 1, 2015, and will be phased-in over a four-year period (beginning at 40% on January 1, 2015, 60% on January 1, 2016 and an additional 20% per year thereafter). On November 21, 2017, the Federal Reserve, the OCC and the FDIC approved a revision to the Regulatory Capital Rules to suspend the phase-in of certain deductions and other adjustments to common equity Tier I capital. The updated final rule applies to non-advanced approaches banking organizations and is effective on January 1, 2018. FNCB and the Bank were in full compliance with the additional capital conservation buffer requirement at December 31, 2017.
The Regulatory Capital Rules also revised the prompt corrective action framework, which is designed to place restrictions on insured depository institutions, including the Bank, if their capital levels begin to show signs of weakness. These revisions took effect January 1, 2015. Under the prompt corrective action requirements, which complement the capital conservation buffer, insured depository institutions are required to meet the following increased capital level requirements in order to qualify as “well capitalized”:
|
● |
a total risk-based capital ratio of 10.00% (unchanged from current rules); |
|
● |
a Tier I risk-based capital ratio of 8.00% (increased from 6.00%); |
|
● |
a new common equity Tier I risk-based capital ratio of 6.50%; and |
|
● |
a Tier I leverage ratio of 5.00%. |
Furthermore, effective January 1, 2015, the Regulatory Capital Rules set forth certain changes for the calculation of risk-weighted assets, which were required to be utilized beginning January 1, 2015. The provisions applicable to banking organizations under the “standardized approach” include changes with respect to risk weights for commercial real estate loans, past due exposures and conversion factors for commitments with an original maturity of one year or less.
Current quantitative measures established by regulation to ensure capital adequacy require FNCB to maintain minimum amounts and ratios (set forth in the table below) of total capital, Tier I capital, and Tier I common equity (as defined in the regulations) to risk-weighted assets (as defined), and of Tier I capital (as defined) to average assets (as defined). The following tables present summary information regarding FNCB’s and the Bank’s risk-based capital and related ratios at December 31, 2017 and 2016:
| Company | Bank |
Minimum Required For Capital Adequacy Purposes |
Minimum Required For Capital Adequacy Purposes with Conservation Buffer |
To Be Well Capitalized Under Prompt Corrective Action Regulations* |
||||||||||||||||||||||||
|
(dollars in thousands) |
Amount |
Ratio |
Amount |
Ratio |
Ratio |
Ratio |
Ratio |
|||||||||||||||||||||
|
December 31, 2017 |
||||||||||||||||||||||||||||
|
Total capital (to risk-weighted assets) |
$ | 101,135 | 12.08 | % | $ | 104,272 | 12.49 | % | 8.00 | % | 9.25 | % | 10.00 | % | ||||||||||||||
|
Tier I capital (to risk-weighted assets) |
89,220 | 10.66 | % | 94,856 | 11.36 | % | 6.00 | % | 7.25 | % | 8.00 | % | ||||||||||||||||
|
Tier I common equity (to risk-weighted assets) |
81,493 | 9.74 | % | 94,856 | 11.36 | % | 4.50 | % | 5.75 | % | 6.50 | % | ||||||||||||||||
|
Tier I capital (to average assets) |
89,220 | 7.74 | % | 94,856 | 8.24 | % | 4.00 | % | 4.00 | % | 5.00 | % | ||||||||||||||||
|
Total risk-weighted assets |
837,032 | 834,959 | ||||||||||||||||||||||||||
|
Total average assets |
1,152,776 | 1,151,539 | ||||||||||||||||||||||||||
|
Company |
Bank |
Minimum Required For Capital Adequacy Purposes |
Minimum Required For Capital Adequacy Purposes with Conservation Buffer |
To Be Well Capitalized Under Prompt Corrective Action Regulations* |
||||||||||||||||||||||||
|
(dollars in thousands) |
Amount |
Ratio |
Amount |
Ratio |
Ratio |
Ratio |
Ratio |
|||||||||||||||||||||
|
December 31, 2016 |
||||||||||||||||||||||||||||
|
Total capital (to risk-weighted assets) |
$ | 96,827 | 12.06 | % | $ | 102,786 | 12.81 | % | 8.00 | % | 8.625 | % | 10.00 | % | ||||||||||||||
|
Tier I capital (to risk-weighted assets) |
82,159 | 10.23 | % | 94,118 | 11.73 | % | 6.00 | % | 6.625 | % | 8.00 | % | ||||||||||||||||
|
Tier I common equity (to risk-weighted assets) |
80,049 | 9.97 | % | 94,118 | 11.73 | % | 4.50 | % | 5.125 | % | 6.50 | % | ||||||||||||||||
|
Tier I capital (to average assets) |
82,159 | 7.53 | % | 94,118 | 8.63 | % | 4.00 | % | 4.000 | % | 5.00 | % | ||||||||||||||||
|
Total risk-weighted assets |
803,026 | 802,610 | ||||||||||||||||||||||||||
|
Total average assets |
1,090,665 | 1,090,550 | ||||||||||||||||||||||||||
|
* Applies to the Bank only. |
Note 15. FAIR VALUE MEASUREMENTS
In determining fair value, FNCB uses various valuation approaches, including market, income and cost approaches. Accounting standards establish a hierarchy for inputs used in measuring fair value that maximizes the use of observable inputs and minimizes the use of unobservable inputs by requiring that observable inputs be used when available. Observable inputs are inputs that market participants would use in pricing the asset or liability, which are developed based on market data obtained from sources independent of FNCB. Unobservable inputs reflect FNCB’s knowledge about the assumptions the market participants would use in pricing an asset or liability, which are developed based on the best information available in the circumstances.
The fair value hierarchy gives the highest priority to unadjusted quoted market prices in active markets for identical assets or liabilities (Level 1 measurement) and the lowest priority to unobservable inputs (Level 3 measurement). A financial asset or liability’s level within the fair value hierarchy is based on the lowest level of input that is significant to the fair value measurement. The fair value hierarchy is broken down into three levels based on the reliability of inputs as follows:
|
● |
Level 1 valuation is based upon unadjusted quoted market prices for identical instruments traded in active markets. |
|
● |
Level 2 valuation is based upon quoted market prices for similar instruments traded in active markets, quoted market prices for identical or similar instruments traded in markets that are not active and model-based valuation techniques for which all significant assumptions are observable in the market or can be corroborated by market data; and |
|
● |
Level 3 valuation is derived from other valuation methodologies including discounted cash flow models and similar techniques that use significant assumptions not observable in the market. These unobservable assumptions reflect estimates of assumptions that market participants would use in determining fair value. |
A description of the valuation methodologies used for assets recorded at fair value, and for estimating fair value of financial instruments not recorded at fair value, is set forth below.
Cash, Short-term Investments, Accrued Interest Receivable and Accrued Interest Payable
For these short-term instruments, the carrying amount is a reasonable estimate of fair value.
Securities
The estimated fair values of available-for-sale equity securities are determined by obtaining quoted prices on nationally recognized exchanges (Level 1 inputs). The estimated fair values for FNCB’s investments in obligations of U.S. government agencies, obligations of state and political subdivisions, government-sponsored agency CMOs and mortgage-backed securities, corporate debt securities, asset-backed securities and negotiable certificates of deposit are obtained by FNCB from a nationally-recognized pricing service. This pricing service develops estimated fair values by analyzing like securities and applying available market information through processes such as benchmark curves, benchmarking of like securities, sector groupings and matrix pricing (Level 2 inputs), to prepare valuations. Matrix pricing is a mathematical technique widely used in the industry to value debt securities without relying exclusively on quoted prices for the specific securities, but rather by relying on the securities’ relationship to other benchmark quoted securities. The fair value measurements consider observable data that may include, among other things, dealer quotes, market spreads, cash flows, the U.S. Treasury yield curve, live trading levels, trade execution data, market consensus prepayment speeds, credit information and the bond’s terms and conditions, and are based on market data obtained from sources independent from FNCB. The Level 2 investments in FNCB’s portfolio are priced using those inputs that, based on the analysis prepared by the pricing service, reflect the assumptions that market participants would use to price the assets. Management has determined that the Level 2 designation is appropriate for these securities because, as with most fixed-income securities, those in FNCB’s portfolio are not exchange-traded, and such non-exchange-traded fixed income securities are typically priced by correlation to observed market data. FNCB has reviewed the pricing service’s methodology to confirm its understanding that such methodology results in a valuation based on quoted market prices for similar instruments traded in active markets, quoted markets for identical or similar instruments traded in markets that are not active and model-based valuation techniques for which the significant assumptions can be corroborated by market data as appropriate to a Level 2 designation.
For those securities for which the inputs used by an independent pricing service were derived from unobservable market information, FNCB evaluated the appropriateness and quality of each price. Management reviewed the volume and level of activity for all classes of securities and attempted to identify transactions which may not be orderly or reflective of a significant level of activity and volume. For securities meeting these criteria, the quoted prices received from either market participants or an independent pricing service may be adjusted, as necessary, to estimate fair value (fair values based on Level 3 inputs). If applicable, the adjustment to fair value was derived based on present value cash flow model projections obtained from third party providers using assumptions similar to those incorporated by market participants.
At December 31, 2017, FNCB owned three corporate debt securities with an aggregate amortized cost and fair value of $4.0 million and $4.1 million, respectively. The market for these securities at December 31, 2017 was not active and markets for similar securities also were not active. FNCB obtained valuations for these securities from a third-party service provider that prepared the valuations using a discounted cash flow approach. Management takes measures to validate the service provider’s analysis and is actively involved in the valuation process, including reviewing and verifying the assumptions used in the valuation calculations. Results of a discounted cash flow test are significantly affected by variables such as the estimate of the probability of default, estimates of future cash flows, discount rates, prepayment rates and the creditworthiness of the underlying issuers. FNCB considers these inputs to be unobservable Level 3 inputs because they are based on estimates about the assumptions market participants would use in pricing this type of asset and developed based on the best information available in the circumstances rather than on observable inputs. As it relates to fair value measurements, once each issuer is categorized and the forecasted default rates have been applied, the expected cash flows are modeled using the variables described above. Discount rates ranging from 5.58% to 6.33% were applied to the expected cash flows to estimate fair value. Management will continue to monitor the market for these securities to assess the market activity and the availability of observable inputs and will continue to apply these controls and procedures to the valuations received from its third-party service provider for the period it continues to use an outside valuation service.
Loans
Except for collateral-dependent impaired loans, fair values of loans are estimated by discounting the projected future cash flows using market discount rates that reflect the credit, liquidity, and interest rate risk inherent in the loan. Projected future cash flows are calculated based upon contractual maturity or call dates, projected repayments and prepayments of principal. The estimated fair value of collateral dependent impaired loans is based on the appraised loan value or other reasonable offers less estimated costs to sell. FNCB does not record loans at fair value on a recurring basis. However from time to time, a loan is considered impaired and an allowance for credit losses is established. The specific reserves for collateral dependent impaired loans are based on the fair value of the collateral less estimated costs to sell. The fair value of the collateral is generally based on appraisals. In some cases, adjustments are made to the appraised values due to various factors including age of the appraisal, age of comparables included in the appraisal, and known changes in the market and in the collateral. When significant adjustments are based on unobservable inputs, the resulting fair value measurement is categorized as a Level 3 measurement.
Loans Held For Sale
Fair values of mortgage loans held for sale are based on commitments on hand from investors or prevailing market prices.
Mortgage Servicing Rights
The fair value of mortgage servicing rights, which are included in other assets in the consolidated statements of financial condition, are estimated using a discounted cash flow model that applies current estimated prepayments derived from the mortgage-backed securities market and utilizes a current market discount rate for observable credit spreads. FNCB does not record mortgage servicing rights at fair value on a recurring basis.
Restricted Stock
Ownership in equity securities of the FHLB of Pittsburgh is restricted and there is no established market for their resale. The carrying amount is a reasonable estimate of fair value.
Equity Investment without a Readily Determinable Fair Value
During the year ended December 31, 2017, FNCB purchased a 4.9% interest in the common stock of a privately-held bank holding company for $1.7 million. The common stock was purchased as part of a private placement pursuant to an exemption from the registration requirements of the Securities Act of 1933 for offerings not involving any public offering. The common stock is not currently traded on any established market, and is not expected to be traded in the near future on any securities exchange or established over-the-counter market. FNCB has elected to account for this transaction as an investment in an equity security without a readily determinable fair value. An equity security without a readily determinable fair value shall be written down to its fair value if a qualitative assessment indicates that the investment is impaired and the fair value of the investment is less than its carrying value. The $1.7 million investment is included in other assets in the consolidated statements of financial condition at December 31, 2017. Management engaged an independent third party to provide a valuation of this investment as of December 31, 2017. The valuation indicated that the investment is not impaired, and accordingly, no adjustment for impairment is required at December 31, 2017.
Deposits
The fair value of demand deposits, savings deposits, and certain money market deposits is the amount payable on demand at the reporting date. The fair value of fixed-maturity certificates of deposit is estimated based on discounted cash flows using FHLB advance rates currently offered for similar remaining maturities.
Borrowed Funds
FNCB uses discounted cash flows using rates currently available for debt with similar terms and remaining maturities to estimate fair value.
Commitments to Extend Credit and Standby Letters of Credit
The fair value of commitments to extend credit and standby letters of credit are estimated using the fees currently charged to enter into similar agreements, taking into account the remaining terms of the agreements and the present creditworthiness of the counterparties. For fixed-rate loan commitments, fair value also considers the difference between current levels of interest rates and the committed rates. The fair value of off-balance sheet commitments is insignificant and therefore not included in the table for non-recurring assets and liabilities.
Assets Measured at Fair Value on a Recurring Basis
The following tables present the financial assets that are measured at fair value on a recurring basis at December 31, 2017 and 2016, and the fair value hierarchy of the respective valuation techniques utilized to determine the fair value:
|
Fair Value Measurements at December 31, 2017 |
||||||||||||||||
|
Quoted Prices |
Significant |
Significant |
||||||||||||||
|
in Active Markets |
Observable |
Unobservable |
||||||||||||||
|
for Identical Assets |
Inputs |
Inputs |
||||||||||||||
|
(in thousands) |
Fair Value |
(Level 1) |
(Level 2) |
(Level 3) |
||||||||||||
|
Available-for-sale securities: |
||||||||||||||||
|
Obligations of U.S. government agencies |
$ | - | $ | - | $ | - | $ | - | ||||||||
|
Obligations of state and political subdivisions |
145,999 | - | 145,999 | - | ||||||||||||
|
U.S. government/government-sponsored agencies: |
||||||||||||||||
|
Collateralized mortgage obligations - residential |
35,657 | - | 35,657 | - | ||||||||||||
|
Collateralized mortgage obligations - commercial |
75,418 | - | 75,418 | - | ||||||||||||
|
Mortgage-backed securities |
22,311 | - | 22,311 | - | ||||||||||||
|
Corporate debt securities |
4,058 | - | - | 4,058 | ||||||||||||
|
Asset-backed securities |
3,086 | - | 3,086 | - | ||||||||||||
|
Negotiable certificates of deposit |
2,930 | - | 2,930 | - | ||||||||||||
|
Equity securities |
928 | 928 | - | - | ||||||||||||
|
Total available-for-sale securities |
$ | 290,387 | $ | 928 | $ | 285,401 | $ | 4,058 | ||||||||
|
Fair Value Measurements at December 31, 2016 |
||||||||||||||||
|
Quoted Prices |
Significant |
Significant |
||||||||||||||
|
in Active Markets |
Observable |
Unobservable |
||||||||||||||
|
for Identical Assets |
Inputs |
Inputs |
||||||||||||||
|
(in thousands) |
Fair Value |
(Level 1) |
(Level 2) |
(Level 3) |
||||||||||||
|
Available-for-sale securities: |
||||||||||||||||
|
Obligations of U.S. government agencies |
$ | 12,188 | $ | - | $ | 12,188 | $ | - | ||||||||
|
Obligations of state and political subdivisions |
117,873 | - | 117,873 | - | ||||||||||||
|
U.S. government/government-sponsored agencies: |
||||||||||||||||
|
Collateralized mortgage obligations - residential |
18,084 | - | 18,084 | - | ||||||||||||
|
Collateralized mortgage obligations - commercial |
99,350 | - | 99,350 | - | ||||||||||||
|
Mortgage-backed securities |
20,576 | - | 20,576 | - | ||||||||||||
|
Corporate debt securities |
3,792 | - | 453 | 3,339 | ||||||||||||
|
Asset-backed securities |
- | - | - | - | ||||||||||||
|
Negotiable certificates of deposit |
3,216 | - | 3,216 | - | ||||||||||||
|
Equity securities |
936 | 936 | - | - | ||||||||||||
|
Total available-for-sale securities |
$ | 276,015 | $ | 936 | $ | 271,740 | $ | 3,339 | ||||||||
There were no transfers between levels within the fair value hierarchy during the years ended December 31, 2017 and 2016.
The following table presents a reconciliation and statement of operations classification of gains and losses for all assets measured at fair value on a recurring basis using significant unobservable inputs (Level 3), which consisted entirely of corporate debt securities, for the years ended December 31, 2017 and 2016.
|
Fair Value Measurements |
||||||||
|
Using Significant Unobservable Inputs (Level 3) |
||||||||
|
Corporate Debt Securities |
||||||||
|
(in thousands) |
2017 |
2016 |
||||||
|
Balance at January 1, |
$ | 3,339 | $ | 3,269 | ||||
|
Additions |
2,000 | - | ||||||
|
Payments received |
- | - | ||||||
|
Sales |
(1,268 | ) | - | |||||
|
Total gains or losses (realized/unrealized): |
||||||||
|
Included in earnings |
268 | - | ||||||
|
Included in other comprehensive income |
(281 | ) | 70 | |||||
|
Balance at December 31, |
$ | 4,058 | $ | 3,339 | ||||
Assets Measured at Fair Value on a Non-Recurring Basis
The following tables present assets and liabilities measured at fair value on a non-recurring basis at December 31, 2017 and 2016, and additional quantitative information about the valuation techniques and inputs utilized by FNCB to determine fair value. All such assets and liabilities were measured using Level 3 inputs.
|
December 31, 2017 |
|||||||||||||||||||||
|
Fair Value Measurement |
Quantitative Information |
||||||||||||||||||||
|
Recorded |
Valuation |
Fair |
Valuation |
Unobservable |
Value/ |
||||||||||||||||
|
(in thousands) |
Investment |
Allowance |
Value |
Technique |
Inputs |
Range |
|||||||||||||||
|
Impaired loans - collateral dependent |
$ | 1,262 | $ | 636 | $ | 626 |
Appraisal of collateral |
Selling costs |
10.0% | ||||||||||||
|
Impaired loans - other |
4,578 | 137 | 4,441 |
Discounted cash flows |
Discount rate |
3.7% | - | 7.5% | |||||||||||||
|
Other real estate owned |
1,023 | - | 1,023 |
Appraisal of collateral |
Selling costs |
10.0% | |||||||||||||||
|
December 31, 2016 |
|||||||||||||||||||||
|
Fair Value Measurement |
Quantitative Information |
||||||||||||||||||||
|
Recorded |
Valuation |
Fair |
Valuation |
Unobservable |
Value/ |
||||||||||||||||
|
(in thousands) |
Investment |
Allowance |
Value |
Technique |
Inputs |
Range |
|||||||||||||||
|
Impaired loans - collateral dependent |
$ | 482 | $ | 68 | $ | 414 |
Appraisal of collateral |
Selling costs |
10.0% | ||||||||||||
|
Impaired loans - other |
3,247 | 234 | 3,013 |
Discounted cash flows |
Discount rate |
3.0% | - | 7.5% | |||||||||||||
|
Other real estate owned |
1,949 | - | 1,949 |
Appraisal of collateral |
Selling costs |
10.0% | |||||||||||||||
The fair value of collateral-dependent impaired loans is determined through independent appraisals or other reasonable offers, which generally include various Level 3 inputs which are not identifiable. Management reduces the appraised value by the estimated costs to sell the property and may make adjustments to the appraised values as necessary to consider any declines in real estate values since the time of the appraisal. For impaired loans that are not collateral-dependent, fair value is determined using the discounted cash flow method. When the measure of the impaired loan is less than the recorded investment in the loan, the impairment is recorded through a valuation allowance or is charged off. The amount shown is the balance of impaired loans, net of any charge-offs and the related allowance for loan losses.
OREO properties are recorded at fair value less the estimated cost to sell at the date of FNCB’s acquisition of the property. Subsequent to acquisition of the property, the balance may be written down further. It is FNCB’s policy to obtain certified external appraisals of real estate collateral underlying impaired loans and OREO, and estimate fair value using those appraisals. Other valuation sources may be used, including broker price opinions, letters of intent and executed sale agreements.
The following table summarizes the estimated fair values of FNCB’s financial instruments at December 31, 2017 and 2016. FNCB discloses fair value information about financial instruments, whether or not recognized in the statements of financial condition, for which it is practicable to estimate that value. The following estimated fair value amounts have been determined using available market information and appropriate valuation methodologies. However, management judgment is required to interpret data and develop fair value estimates. Accordingly, the estimates below are not necessarily indicative of the amounts FNCB could realize in a current market exchange. The use of different market assumptions and/or estimation methodologies may have a material effect on the estimated fair value amounts.
|
Fair Value |
December 31, 2017 |
December 31, 2016 |
||||||||||||||||
|
(in thousands) |
Measurement |
Carrying Value |
Fair Value |
Carrying Value |
Fair Value |
|||||||||||||
|
Financial assets |
||||||||||||||||||
|
Cash and short term investments |
Level 1 |
$ | 37,746 | $ | 37,746 | $ | 112,445 | $ | 112,445 | |||||||||
|
Securities available for sale |
See previous table |
290,387 | 290,387 | 276,015 | 276,015 | |||||||||||||
|
FHLB of Pittsburgh stock |
Level 2 |
2,753 | 2,753 | 3,311 | 3,311 | |||||||||||||
|
Loans held for sale |
Level 2 |
1,095 | 1,095 | 596 | 596 | |||||||||||||
|
Loans, net |
Level 3 |
761,609 | 752,222 | 722,860 | 712,263 | |||||||||||||
|
Accrued interest receivable |
Level 2 |
3,234 | 3,234 | 2,757 | 2,757 | |||||||||||||
|
Equity securities without readily determinable fair values |
Level 3 |
1,658 | 1,658 | - | - | |||||||||||||
|
Mortgage servicing rights |
Level 3 |
265 | 774 | 215 | 744 | |||||||||||||
|
Financial liabilities |
||||||||||||||||||
|
Deposits |
Level 2 |
1,002,448 | 962,586 | 1,015,139 | 968,904 | |||||||||||||
|
Borrowed funds |
Level 2 |
60,278 | 60,214 | 78,847 | 78,923 | |||||||||||||
|
Accrued interest payable |
Level 2 |
241 | 241 | 242 | 242 | |||||||||||||
Note 16. EARNINGS PER SHARE
For FNCB, the numerator of both the basic and diluted earnings per share of common stock is net income available to common shareholders. The weighted average number of common shares outstanding used in the denominator for basic earnings per common share is increased to determine the denominator used for diluted earnings per common share by the effect of potentially dilutive common share equivalents utilizing the treasury stock method. Common share equivalents are outstanding stock options to purchase FNCB’s shares of common stock and unvested restricted stock.
The following table presents the calculation of both basic and diluted earnings per share of common stock for the years ended December 31, 2017, 2016 and 2015:
|
For the Year Ended December 31, |
||||||||||||
|
(in thousands, except share data) |
2017 |
2016 |
2015 |
|||||||||
|
Net income |
$ | 147 | $ | 6,309 | $ | 35,840 | ||||||
|
Basic weighted-average number of common stock outstanding |
16,722,966 | 16,571,262 | 16,499,622 | |||||||||
|
Plus: common share equivalents |
17,322 | 1,433 | - | |||||||||
|
Diluted weighted-average number of common stock outstanding |
16,740,288 | 16,572,695 | 16,499,622 | |||||||||
|
Income per share of common stock: |
||||||||||||
|
Basic |
$ | 0.01 | $ | 0.38 | $ | 2.17 | ||||||
|
Diluted |
$ | 0.01 | $ | 0.38 | $ | 2.17 | ||||||
For each of the years ended December 31, 2017, 2016 and 2015, common stock equivalents reflected in the table above were related entirely to the incremental shares of unvested restricted stock. Stock options of 19,200 shares, 37,700 shares, and 50,746 shares, respectively for the years ended December 31, 2017, 2016 and 2015 were excluded from common stock equivalents. The exercise prices of stock options exceeded the average market price of FNCB’s common stock during the periods presented; therefore, inclusion of these common stock equivalents would be anti-dilutive to the diluted earnings per share of common stock calculation.
Note 17. OTHER COMPREHENSIVE INCOME (LOSS)
The following tables summarize the reclassifications out of accumulated other comprehensive (loss) income for the years ended December 31, 2017, 2016 and 2015.
|
For the year Ended December 31, 2017 |
||||||
|
Amount Reclassified |
||||||
|
from Accumulated |
Affected Line Item |
|||||
|
Other Comprehensive |
in the Consolidated |
|||||
|
(in thousands) |
Income (Loss) |
Statements of Income |
||||
|
Available-for-sale securities: |
||||||
|
Net gains on sale of securities reclassified into net income |
$ | (1,597 | ) |
Net gain on sale of securities |
||
|
Taxes |
543 |
Income tax expense (benefit) |
||||
|
Net of tax amount |
$ | (1,054 | ) | |||
|
For the year Ended December 31, 2016 |
||||||
|
Amount Reclassified |
||||||
|
from Accumulated |
Affected Line Item |
|||||
|
Other Comprehensive |
in the Consolidated |
|||||
|
(in thousands) |
Income (Loss) |
Statements of Income |
||||
|
Available-for-sale securities: |
||||||
|
Net gains on sale of securities reclassified into net income |
$ | (960 | ) |
Net gain on sale of securities |
||
|
Taxes |
326 |
Income tax expense (benefit) |
||||
|
Net of tax amount |
$ | (634 | ) | |||
|
For the year Ended December 31, 2015 |
||||||
|
Amount Reclassified |
||||||
|
from Accumulated |
Affected Line Item |
|||||
|
Other Comprehensive |
in the Consolidated |
|||||
|
(in thousands) |
Income (Loss) |
Statements of Income |
||||
|
Available-for-sale securities: |
||||||
|
Net gains on sale of securities reclassified into net income |
$ | (2,296 | ) |
Net gain on sale of securities |
||
|
Taxes |
781 |
Income tax expense (benefit) |
||||
|
Net of tax amount |
$ | (1,515 | ) | |||
The following table summarizes the changes in accumulated other comprehensive (loss) income, net of tax for the years ended December 31, 2017, 2016 and 2015:
|
For the Year Ended December 31, |
||||||||||||
|
(in thousands) |
2017 |
2016 |
2015 |
|||||||||
|
Balance, January 1, |
$ | (1,560 | ) | $ | (61 | ) | $ | 1,138 | ||||
|
Other comprehensive (loss) income before reclassifications |
1,156 | (865 | ) | 316 | ||||||||
|
Amounts reclassified from accumulated other comprehensive (loss) income |
(1,054 | ) | (634 | ) | (1,515 | ) | ||||||
|
Net other comprehensive (loss) income during the period |
102 | (1,499 | ) | (1,199 | ) | |||||||
|
Reclassification of stranded tax effects upon adoption of ASU 2018-2 |
(287 | ) | - | - | ||||||||
|
Balance, December 31, |
$ | (1,745 | ) | $ | (1,560 | ) | $ | (61 | ) | |||
Note 18. CONDENSED FINANCIAL INFORMATION — PARENT COMPANY ONLY
The following tables present condensed parent company only financial information:
Condensed Statements of Financial Condition
|
December 31, |
||||||||
|
(in thousands) |
2017 |
2016 |
||||||
|
Assets: |
||||||||
|
Cash |
$ | 61 | $ | 567 | ||||
|
Investment in statutory trust |
393 | 384 | ||||||
|
Investment in subsidiary (equity method) |
104,827 | 112,330 | ||||||
|
Other assets |
1,867 | 236 | ||||||
|
Total assets |
$ | 107,148 | $ | 113,517 | ||||
|
Liabilities and Shareholders’ Equity: |
||||||||
|
Subordinated debentures |
$ | 5,000 | $ | 10,000 | ||||
|
Junior subordinated debentures |
10,310 | 10,310 | ||||||
|
Accrued interest payable |
35 | 52 | ||||||
|
Other liabilities |
2,612 | 2,784 | ||||||
|
Total liabilities |
17,957 | 23,146 | ||||||
|
Shareholders’ equity |
89,191 | 90,371 | ||||||
|
Total liabilities and shareholders’ equity |
$ | 107,148 | $ | 113,517 | ||||
Condensed Statements of Income
|
For the Year Ended December 31, |
||||||||||||
|
(in thousands) |
2017 |
2016 |
2015 |
|||||||||
|
Income: |
||||||||||||
|
Dividends from subsidiaries |
$ | 8,698 | $ | 16,000 | $ | 12,500 | ||||||
|
Income from trust |
9 | 7 | 6 | |||||||||
|
Total income |
8,707 | 16,007 | 12,506 | |||||||||
|
Expense: |
||||||||||||
|
Interest on subordinated notes |
380 | 625 | 1,450 | |||||||||
|
Interest on junior subordinated debt |
300 | 247 | 206 | |||||||||
|
Other operating expenses |
162 | 182 | 168 | |||||||||
|
Other losses |
113 | 115 | 114 | |||||||||
|
Total expenses |
955 | 1,169 | 1,938 | |||||||||
|
Income before income taxes |
7,752 | 14,838 | 10,568 | |||||||||
|
Provision for income taxes |
- | - | - | |||||||||
|
Income before equity in undistributed net income of subsidiary |
7,752 | 14,838 | 10,568 | |||||||||
|
Equity in undistributed net income of subsidiary |
(7,605 | ) | (8,529 | ) | 25,272 | |||||||
|
Net income |
$ | 147 | $ | 6,309 | $ | 35,840 | ||||||
Condensed Statements of Cash Flows
|
For the Year Ended December 31, |
||||||||||||
|
(in thousands) |
2017 |
2016 |
2015 |
|||||||||
|
Cash flows from operating activities: |
||||||||||||
|
Net income |
$ | 147 | $ | 6,309 | $ | 35,840 | ||||||
|
Adjustments to reconcile net income to net cash provided by operating activities: |
||||||||||||
|
Equity in undistributed loss (income) of subsidiary |
7,605 | 8,529 | (25,272 | ) | ||||||||
|
Equity in trust |
(9 | ) | (7 | ) | (6 | ) | ||||||
|
(Decrease) increase in accrued interest payable |
(17 | ) | (10,850 | ) | 999 | |||||||
|
Decrease (increase) in other assets |
328 | 639 | (18 | ) | ||||||||
|
(Decrease) increase in other liabilities |
(172 | ) | 59 | (58 | ) | |||||||
|
Net cash provided by operating activities |
7,882 | 4,679 | 11,485 | |||||||||
|
Cash flows from investing activities: |
||||||||||||
|
Purchase of privately-held bank holding company stock |
(1,658 | ) | - | - | ||||||||
|
Net cash used by investing activities |
(1,658 | ) | - | - | ||||||||
|
Cash flows from financing activities: |
||||||||||||
|
Principal reduction on subordinated debentures |
(5,000 | ) | (4,000 | ) | (11,000 | ) | ||||||
|
Proceeds from issuance of common shares |
446 | 433 | - | |||||||||
|
Cash dividends paid |
(2,176 | ) | (1,492 | ) | - | |||||||
|
Net cash used in financing activities |
(6,730 | ) | (5,059 | ) | (11,000 | ) | ||||||
|
(Decrease) increase in cash |
(506 | ) | (380 | ) | 485 | |||||||
|
Cash at beginning of year |
567 | 947 | 462 | |||||||||
|
Cash at end of year |
$ | 61 | $ | 567 | $ | 947 | ||||||
Note 19. SELECTED QUARTERLY FINANCIAL DATA (UNAUDITED)
|
2017 |
||||||||||||||||
|
Quarter Ended |
||||||||||||||||
|
(in thousands, except share data) |
March 31, |
June 30, |
September 30, |
December 31, |
||||||||||||
|
Interest income |
$ | 8,939 | $ | 9,183 | $ | 9,605 | $ | 10,121 | ||||||||
|
Interest expense |
1,056 | 1,143 | 1,280 | 1,321 | ||||||||||||
|
Net interest income |
7,883 | 8,040 | 8,325 | 8,800 | ||||||||||||
|
(Credit) provision for loan and lease losses |
(478 | ) | 421 | 543 | 283 | |||||||||||
|
Net interest income after (credit) provision for loan and lease losses |
8,361 | 7,619 | 7,782 | 8,517 | ||||||||||||
|
Non-interest income |
1,570 | 2,023 | 1,714 | 1,918 | ||||||||||||
|
Non-interest expense |
6,928 | 6,940 | 6,397 | 7,804 | ||||||||||||
|
Income before income taxes |
3,003 | 2,702 | 3,099 | 2,631 | ||||||||||||
|
Income tax expense |
806 | 910 | 827 | 8,745 | ||||||||||||
|
Net income (loss) |
$ | 2,197 | $ | 1,792 | $ | 2,272 | $ | (6,114 | ) | |||||||
|
Income (loss) per share: |
||||||||||||||||
|
Basic |
$ | 0.13 | $ | 0.11 | $ | 0.14 | $ | (0.36 | ) | |||||||
|
Diluted |
$ | 0.13 | $ | 0.11 | $ | 0.14 | $ | (0.36 | ) | |||||||
|
2016 |
||||||||||||||||
|
Quarter Ended |
||||||||||||||||
|
(in thousands, except share data) |
March 31, |
June 30, |
September 30, |
December 31, |
||||||||||||
|
Interest income |
$ | 8,544 | $ | 8,663 | $ | 8,765 | $ | 8,776 | ||||||||
|
Interest expense |
1,006 | 1,050 | 1,085 | 1,056 | ||||||||||||
|
Net interest income |
7,538 | 7,613 | 7,680 | 7,720 | ||||||||||||
|
Provision (credit) for loan and lease losses |
696 | 396 | (234 | ) | 295 | |||||||||||
|
Net interest income after provision (credit) for loan and lease losses |
6,842 | 7,217 | 7,914 | 7,425 | ||||||||||||
|
Non-interest income |
1,331 | 2,094 | 1,380 | 1,398 | ||||||||||||
|
Non-interest expense |
6,804 | 7,025 | 6,553 | 7,163 | ||||||||||||
|
Income before income taxes |
1,369 | 2,286 | 2,741 | 1,660 | ||||||||||||
|
Income tax expense |
226 | 661 | 724 | 136 | ||||||||||||
|
Net income |
$ | 1,143 | $ | 1,625 | $ | 2,017 | $ | 1,524 | ||||||||
|
Earnings per share: |
||||||||||||||||
|
Basic |
$ | 0.07 | $ | 0.10 | $ | 0.12 | $ | 0.09 | ||||||||
|
Diluted |
$ | 0.07 | $ | 0.10 | $ | 0.12 | $ | 0.09 | ||||||||
Item 9. Changes in and Disagreements with Accountants on Accounting and Financial Disclosure
None.
Item 9A. Controls and Procedures
FNCB’s management has evaluated the effectiveness of the design and operation of FNCB’s disclosure controls and procedures, as such term is defined under Rule 13a-15(e) promulgated under the Securities Exchange Act of 1934, as amended, as of December 31, 2017.
Based on that evaluation, FNCB’s Chief Executive Officer and Chief Financial Officer concluded FNCB’s disclosure controls and procedures were effective as of December 31, 2017.
There were no changes made to FNCB’s internal control over financial reporting that occurred during the most recent fiscal quarter that have materially affected, or are reasonably likely to materially affect, FNCB’s internal control over financial reporting.
Management’s Report on Internal Control Over Financial Reporting
Management is responsible for establishing and maintaining adequate internal control over financial reporting for FNCB Bancorp, Inc. (the “Company”). Internal control over financial reporting is a process designed to provide reasonable assurance regarding the reliability of financial reporting and the preparation of financial statements for external purposes in accordance with generally accepted accounting principles in the United States and is not intended to provide absolute assurance that a misstatement of the Company’s financial statements would be prevented or detected.
Internal control over financial reporting includes those policies and procedures that pertain to the maintenance of records that in reasonable detail accurately and fairly reflect the transactions and dispositions of the assets of the Company; provide reasonable assurance that transactions are recorded as necessary to permit preparation of financial statements in accordance with generally accepted accounting principles, and that receipts and expenditures of the Company are only being made in accordance with authorizations of management and directors of the Company; and provide reasonable assurance regarding prevention or timely detection of unauthorized acquisition, use, or disposition of the Company’s assets that could have a material effect on the financial statements.
Any control system, no matter how well conceived and operated, can provide only reasonable, not absolute, assurance that the objectives of the control system are met. The design of a control system inherently has limitations and the benefits of controls must be weighed against their costs. Additionally, controls can be circumvented by the individual acts of some persons, by collusion of two or more people, or by management override of the controls. Therefore, no assessment of a cost-effective system of internal controls can provide absolute assurance that all control issues and instances of fraud, if any, will be detected.
As of December 31, 2017, management of the Company conducted an assessment of the effectiveness of the Company’s internal control over financial reporting based on criteria established in Internal Control – Integrated Framework (2013) issued by the Committee of Sponsoring Organizations of the Treadway Commission. Management’s assessment included extensive documenting, evaluating and testing the design and operating effectiveness of our internal control over financial reporting.
Based on this evaluation under the criteria in the Framework, management concluded that the Company’s system of internal control over financial reporting was effective as of December 31, 2017.
Baker Tilly Virchow Krause, LLP, the Company’s independent registered public accounting firm that audited the Company’s consolidated financial statements, has issued an audit report on the Company’s internal control over financial reporting as of December 31, 2017. That report is included in Item 8, “Financial Statements and Supplementary Data,” of this Annual Report on Form 10-K.
| /s/ Gerard A. Champi | /s/ James M. Bone, Jr., CPA |
|
Gerard A. Champi President and Chief Executive Officer |
James M. Bone, Jr., CPA Executive Vice President and Chief Financial Officer |
|
Item 9B. |
Other Information |
None
PART III
|
Item 10. |
Directors, Executive Officers and Corporate Governance. |
The information concerning the Directors and Executive Officers of FNCB required by this Item 10 is incorporated herein by reference to the sections entitled “Information as to Nominees, Directors and Executive Officers” in FNCB’s Definitive Proxy Statement for its 2018 Annual Meeting of Shareholders, which will be filed with the Securities and Exchange Commission on or about April 17, 2018 (the “Proxy Statement”). Disclosure of compliance with Section 16(a) of the Securities Exchange Act of 1934, as amended, by FNCB’s Directors and Executive Officers is incorporated by reference to the section entitled “Section 16(a) Beneficial Ownership Reporting Compliance” in the Proxy Statement. In addition, information concerning Audit Committee and Audit Committee Financial Expert is included in the Proxy Statement under the caption “Audit Committee Report” and is incorporated herein by reference.
FNCB has adopted a Code of Business Conduct and Ethics (the “Code”) that applies to FNCB’s directors and employees, including the President and Principal Executive Officer (“PEO”), Principal Financial Officer (“PFO”) and Principal Accounting Officer (“PAO”). The Code includes guidelines relating to compliance with laws, the ethical handling of actual or potential conflicts of interest, the use of corporate opportunities, protection and use of FNCB’s confidential information, accepting gifts and business courtesies, accurate financial and regulatory reporting, and procedures for promoting compliance with, and reporting violations of, the Code. The Code is available on FNCB’s website at www.fncb.com/investorrelations/ under the heading “Governance Documents.” FNCB intends to post any amendments to the Code on its website and also to disclose any waivers (to the extent applicable to FNCB’s President, PEO, PFO or PAO) on a Form 8-K within the prescribed time period.
|
Item 11. |
Executive Compensation. |
The information required by this Item 11 is incorporated herein by reference to the section entitled “Executive Compensation” in FNCB’s Proxy Statement.
|
Item 12. |
Security Ownership of Certain Beneficial Owners and Management and Related Stockholder Matters. |
The information required by this Item 12 is incorporated herein by reference to the section entitled “Principal Beneficial Owners of FNCB’s Common Stock” in FNCB’s Proxy Statement.
|
Item 13. |
Certain Relationships and Related Transactions, and Director Independence. |
The information required by this Item 13 related to certain relationships and related transactions is incorporated herein by reference to the section entitled “Certain Relationships and Related Transactions” in FNCB’s Proxy Statement. The information required under this Item 13 related to Director Independence is incorporated herein by reference to the section entitled “Corporate Governance” in FNCB’s Proxy Statement.
|
Item 14. |
Principal Accounting Fees and Services. |
The information required by this Item 14 is incorporated herein by reference to the section entitled “Fees Paid to Independent Registered Public Accounting Firm” in FNCB’s Proxy Statement.
PART IV
|
Item 15. |
Exhibits and Financial Statement Schedules |
|
1. |
Financial Statements |
The following financial statements are included by reference in Part II, Item 8 hereof:
|
Report of Independent Registered Public Accounting Firm |
|
|
Consolidated Statements of Financial Condition |
|
|
Consolidated Statements of Income |
|
|
Consolidated Statements of Comprehensive Income |
|
|
Consolidated Statements of Changes in Shareholders’ Equity |
|
|
Consolidated Statements of Cash Flows |
|
|
Notes to Consolidated Financial Statements |
|
2. |
Financial Statement Schedules |
Financial Statement Schedules are omitted because the required information is either not applicable, not required or is shown in the respective financial statements or in the notes thereto.
|
3. |
The following exhibits are filed herewith or incorporated by reference. |
|
EXHIBIT 3.1 |
|
|
EXHIBIT 3.2 |
|
|
EXHIBIT 4.1 |
|
|
EXHIBIT 4.2 |
|
|
EXHIBIT 10.1 |
|
|
EXHIBIT 10.2 |
|
|
EXHIBIT 10.3 |
|
|
EXHIBIT 10.4+ |
|
|
EXHIBIT 10.5+ |
|
|
EXHIBIT 10.6 |
|
EXHIBIT 10.7+ |
|
|
EXHIBIT 10.8+ |
|
|
EXHIBIT 10.9+ |
|
|
EXHIBIT 10.10+ |
|
|
EXHIBIT 10.11+ |
|
|
EXHIBIT 10.12+ |
|
|
EXHIBIT 10.13+ |
|
|
EXHIBIT 10.14+ |
|
|
EXHIBIT 10.15+ |
|
|
EXHIBIT 10.16+ |
|
|
EXHIBIT 10.17+ |
|
|
EXHIBIT 10.18+ |
|
|
EXHIBIT 21 |
|
|
EXHIBIT 23* |
|
|
EXHIBIT 31.1* |
|
|
EXHIBIT 31.2* |
|
|
EXHIBIT 32** |
Section 1350 Certification — Chief Executive Officer and Chief Financial Officer |
|
EXHIBIT 101 |
The following financial information from FNCB Bancorp, Inc.’s Annual Report on Form 10-K for the year ended December 31, 2017 formatted in an XBRL Interactive Data File: (1) Consolidated Statements of Financial Condition; (2) Consolidated Statements of Income (3) Consolidated Statements of Comprehensive Income; (4) Consolidated Statements of Shareholders’ Equity; (5) Consolidated Statements of Cash Flows; and (6) Notes to Consolidated Financial Statements, with detailed tagging of notes and financial statement schedules. |
_____________________________
* Filed herewith
** Furnished herewith
+ Management contract, compensatory plan or arrangement
Item 16. Form 10-K Summary
None.
Pursuant to the requirements of Section 13 or 15(d) of the Securities Exchange Act of 1934, the registrant has duly caused this report to be signed on its behalf by the undersigned, thereunto duly authorized:
Registrant: FNCB BANCORP, INC.
|
/s/ Gerard A. Champi |
March 9, 2018 |
||
|
Gerard A. Champi |
Date |
||
|
/s/ James M. Bone, Jr. |
March 9, 2018 |
||
|
James M. Bone, Jr., CPA |
Date |
||
|
/s/ Stephanie A. Westington |
March 9, 2018 |
||
|
Stephanie A. Westington, CPA Principal Accounting Officer |
Date |
||
Pursuant to the requirements of the Securities Act of 1934, this report has been signed below by the following persons on behalf of the registrant and in the capacities and on the dates indicated:
Directors:
|
/s/ William G. Bracey |
March 9, 2018 |
/s/ Gerard A. Champi |
March 9, 2018 |
|||
|
William G, Bracey |
Date |
Gerard A. Champi |
Date |
|||
|
/s/ Joseph Coccia |
March 9, 2018 |
/s/ Dominick L. DeNaples |
March 9, 2018 |
|||
|
Joseph Coccia |
Date |
Dominick L. DeNaples |
Date |
|||
|
/s/ Joseph L. DeNaples |
March 9, 2018 |
/s/ Louis A. DeNaples |
March 9, 2018 |
|||
|
Joseph L. DeNaples |
Date |
Louis A. DeNaples |
Date |
|||
|
/s/ Louis A. DeNaples, Jr. |
March 9, 2018 |
/s/ Vithalbhai D. Dhaduk |
March 9, 2018 |
|||
|
Louis A. DeNaples, Jr. |
Date |
Vithalbhai D. Dhaduk |
Date |
|||
|
|
||||||
|
/s/ Keith W. Eckel |
March 9, 2018 |
/s/ Kathleen McCarthy Lambert |
March 9, 2018 |
|||
|
Keith W. Eckel |
Date |
Kathleen McCarthy Lambert |
Date |
|||
|
/s/ Thomas J. Melone |
March 9, 2018 |
/s/ John P. Moses |
March 9, 2018 |
|||
|
Thomas J. Melone |
Date |
John P. Moses |
Date |
115