Attached files
| file | filename |
|---|---|
| EX-99.3 - PRESS RELEASE - TPI COMPOSITES, INC | exh_993.htm |
| EX-99.1 - PRESS RELEASE - TPI COMPOSITES, INC | exh_991.htm |
| 8-K - FORM 8-K - TPI COMPOSITES, INC | f8k_030818.htm |
EXHIBIT 99.2

Q4 2017 Earnings Call

Q4 2017 Earnings Call Legal Disclaimer This presentation contains forward - looking statements within the meaning of the federal securities laws. All statements other than statements of historical facts contai ned in this presentation, including statements regarding our future results of operations and financial position, business strategy and p lan s and objectives of management for future operations, are forward - looking statements. In many cases, you can identify forward - looking statements by terms such as “may,” “should,” “expects,” “plans,” “anticipates,” “could,” “intends,” “target,” “projects,” “contemplates,” “believes,” “estimates,” “predicts,” “potential” or “continue” or the negati ve of these terms or other similar words. Forward - looking statements contained in this presentation include, but are not limited to, statements about (i) growth of the wind energy mar ket and our addressable market; (ii) the potential impact of GE’s acquisition of LM Wind Power upon our business; (iii) the potential impact of the increasing prevalence of auction - based tenders in the wind energy market and increased competition from solar energy on our gross margins and overall financial performance; (iv) our ability to successfully expand our transportation business and execute upon our strategy of entering new markets outside of wind energy; (v) our future financial performance, including our net sales, cost of goods sold, gross profit or gross margin, operating expenses, ability to generate positive cash flow, and ability to achieve or maintain profitability; (vi) the sufficiency of our cash and cash equivalents to meet our liquidity needs; ( vii) our ability to attract and retain customers for our products, and to optimize product pricing; ( viii ) competition from other wind blade manufacturers; (ix) the discovery of defects in our products; (x) our ability to successfully expand in our existing markets and into new international markets; (xi) worldwide economic conditions and their impact on customer demand; ( xii) our ability to effectively manage our growth strategy and future expenses; ( xiii ) our ability to maintain, protect and enhance our intellectual property; ( xiv) our ability to comply with existing, modified or new laws and regulations applying to our business; ( xv) the attraction and retention of qualified employees and key personnel; and ( xvi) changes in domestic or international government or regulatory policy, including without limitation, changes in tax policy. These forward - looking statements are only predictions. These statements relate to future events or our future financial performance and involve kno wn and unknown risks, uncertainties and other important factors that may cause our actual results, levels of activity, performance or achievements to materially differ from any future results, levels of activity, performance or achievements expressed or implied by these forward - looking statements. Because forward - looking statements are inherently subject to risks and uncertainties, some of which cannot be predicted or quantified, you should not rely on these forward - looking statements as guarantees of future events. Further information on the factors, risks and uncertainties that could affect our financial results and the forward - looking statements in this presentation are included in our filings with the Securities and Exchange Commission and will be included in subsequent periodic and current reports we make with the Securities and Exchange Com mission from time to time, including in our Annual Report on Form 10 - K for the year ended December 31, 2017. The forward - looking statements in this presentation represent our views as of the date of this presentation. We anticipate that subsequent events an d developments will cause our views to change. However, while we may elect to update these forward - looking statements at some point in the future, we undertake no obligation to update any forward - looking statement to reflect events or developments after the date on which the statement is made or to reflect the occurrence of una nti cipated events except to the extent required by applicable law. You should, therefore, not rely on these forward - looking statements as representing our views as of any date after the date of this presentation. Our forward - looking statements do not reflect the potential impact of any future acquisitions, mergers, dispositions, joint ventures, or investme nts we may make. This presentation includes unaudited non - GAAP financial measures including total billings, EBITDA, adjusted EBITDA, net cash (debt) and free cash flow. We define total billings as the total amounts we have invoiced our customers for products and services for which we are entitled to payment under the ter ms of our long - term supply agreements or other contractual agreements. We define EBITDA as net income (loss) attributable to the Company plus interest expense (including lo sse s on the extinguishment of debt and net of interest income), income taxes and depreciation and amortization. We define Adjusted EBITDA as EBITDA plus any share - based compensation expense, plus or minus any gains or losses from foreign currency remeasurement. We define net cash (debt) as the total principal amount of debt outstanding less unrestricted cash and cash equivalents. We define free cash flow as net cash flow generated from operating activities less capital expenditures. We present non - GAAP measures when we believe that the additional information is useful and meaningful to investors. Non - GAAP financial measures do not have any standardized meaning and are therefore unlikely to be comparable to similar measures presented by other companies. The presentation of non - GAAP financial measures is not intended to be a substitute for, and should not be considered in isolation from, the financial measures reported in accordance with GAAP. See the appendix for the reconciliations of certain non - GAAP financial measures to the comparable GAAP measures. This presentation also contains estimates and other information concerning our industry that are based on industry publicatio ns, surveys and forecasts. This information involves a number of assumptions and limitations, and we have not independently verified the accuracy or completeness of the information . 2 March 8, 2018

Q4 2017 Earnings Call Agenda • Q4 and Full Year 2017 Highlights • Industry Update • Q4 and Full Year 2017 Financial Highlights • Impact of ASC 606 • Impact of Tax Reform • Guidance for 2018 • Q&A • Appendix – Non - GAAP Information 3 March 8, 2018

Q4 and Full Year 2017 Highlights

Q4 2017 Earnings Call Q4 and Full Year 2017 Highlights 5 March 8, 2018 Q4 and Full Year 2017 Highlights and Recent Company News • Operating results and year - over - year increases compared to 201 6 • Net sales were up 33.2 % to $247.1 million for the quarter and 23.2% to $930.3 million for the year • Total billings were up 22.8 % to $ 242.7 million for the quarter and 23.2% to $941.6 million for the year • Net income for the quarter i mprove d to $ 5.9 million from a loss of $ 2.3 million and to $43.7 million in 2017 from $13.8 million in 2016 • Adjusted EBITDA for the quarter increased by 75.0% to $ 25.1 million and by 53.5% to $101.5 million for the year • Adjusted EBITDA margin for the quarter was up 250 bps to 10.2 % and up 210 bps to 10.9% for the year • Entered into an agreement with Navistar to design and develop a Class 8 truck comprised of a composite tractor and frame rails • Signed a five - year supply agreement with Proterra to become the supplier of composite bus bodies for their Catalyst® zero - emission electric transit buses GAAP Net Sales ($ in millions) $755 $930 $186 $247 $0 $200 $400 $600 $800 $1,000 FY 2016 FY 2017 Q4 '16 Q4 '17 Sets invoiced 2,154 2,736 541 669 Est. MW 4,920 6 , 602 1,234 1,726 Dedicated lines (1) 44 48 44 48 Lines installed (2) 3 3 41 33 41 (1) Number of wind blade manufacturing lines dedicated to our customers under long - term supply agreement s. Includes 7 lines under supply agreements that ended on December 31, 2017. (2) Number of wind blade manufacturing lines installed that are either in operation, startup or transition 23.2% 33.2%

Q4 2017 Earnings Call Existing Contracts Provide for ~ $4.6 Billion in Revenue through 2023 (1 ) 6 March 8, 2018 Long - term Supply Agreements (1) 2017 2018 2019 2020 2021 2022 2023 U.S. Turkey Mexico China Long - term supply agreements provide for estimated minimum aggregate volume commitments from our customers of approximately $ 3.1 billion and encourage our customers to purchase additional volume up to, in the aggregate, an estimated total contract value of approximately $4.6 billion through the end of 2023 (1) Note: Our contracts with some of our customers are subject to termination or reduction on short notice, generally with substa nti al penalties, and contain liquidated damages provisions, which may require us to make unanticipated payments to our customers or our customers to make payments to us. (1) As of March 8 , 2018. The chart depicts the term of the longest contract in each location . .

Industry Update

Q4 2017 Earnings Call Onshore Global Market Growth 8 March 8, 2018 Annual I nstalled G lobal W ind C apacity (GW): 2016 – 2026E 42.5 45.8 7.6 17.4 2016 2026E Developing wind markets Mature wind markets Source: MAKE Q 4 2017 Global Wind Power Market Outlook Update Note: Developing wind markets defined as fewer than 6 GW of 2016 installed capacity Annual installed wind capacity growth is propelled by an increase in developing wind markets, including Turkey and Mexico where TPI Composites is well positioned to succeed 50.1 CAGR 0. 8 % CAGR 8. 6 % Mature wind market share Developing market s market share 15.2% 84.8% 2 7 . 9 % 7 2 . 1 % 6 3 . 3

Q4 2017 Earnings Call U.S. Onshore Market Growth: 2011 – 2020E 9 March 8, 2018 The U.S. wind market is expected to experience consistent near - term growth in light of the PTC phase out Source: MAKE Q4 2017 Global Wind Power Market Outlook Update (GW) U.S. Onshore Wind Market Growth - Capacity (2011 – 2015) 6.2 12.5 1.1 4.8 8.6 0 3 6 9 12 15 2011 2012 2013 2014 2015 8.9 7.0 8.9 10.8 12.4 2016 2017E 2018E 2019E 2020E U.S. Onshore Wind Market Growth – Capacity (2016 – 2020E) Average annual installation: 10.7 GW (2018 – 2020) Total U.S. wind installations: 32.1 GW (2018 – 2020) Average annual installation: 6.6 GW Total U.S. wind installations: 33.2 GW

Q4 2017 Earnings Call Market Demand Drivers • Overall competitiveness of wind energy • Corporate and industrial demand • Utilities being driven by consumer demand and sheer economics • Offshore economics • Repowering - globally • Vehicle electrification • Decarbonization of electric sector 10 March 8, 2018

Q4 and Full Year 2017 Financial Highlights

Q4 2017 Earnings Call Q4 and Full Year 2017 Financial Highlights (unaudited ) 12 March 8, 2018 (1) See pages 25 – 28 for reconciliations of non - GAAP financial data (2) Based on n et income (loss) attributable to common stock holders ($ in millions, except per share data and KPIs) Q4 ’17 Q4 ’16 ∆ Full Year ’17 Full Year ’16 ∆ Select Financial Data Net Sales $ 247.1 $ 185.6 33.2% $ 930.3 $ 754.9 23.2% Total Billings (1) $ 242.7 $ 197.6 22.8% $ 941.6 $ 764.4 23.2% Net Income (Loss) $ 5.9 $ (2.3) NM $ 43.7 $ 13.8 215.6% Diluted Earnings (Loss) per Share (2) $ 0.17 $ (0.07) $ 0.24 $ 1.25 $ 0.48 $ 0.77 Adjusted EBITDA (1) $ 25.1 $ 14.3 75.0% $ 101.5 $ 66.2 53.5% Adjusted EBITDA Margin 10.2% 7.7% 250 bps 10.9% 8.8% 210 bps Net Cash (Debt) (1) $ 24.6 $ (6.4) $ 30.9 $ 24.6 $ (6.4) $ 30.9 Free Cash Flow (1) $ 21.6 $ 14.3 $ 7.3 $ 37.8 $ 23.3 $ 14.5 Capital Expenditures $ 9.5 $ 11.6 $ (2.1) $ 44.8 $ 30.5 $ 14.3 Key Performance Indicators (KPIs) Sets Invoiced 669 541 128 2,736 2,154 582 Estimated Megawatts 1,726 1,234 492 6,602 4,920 1,682 Dedicated Wind Blade Manufacturing Lines 48 44 4 lines 48 44 4 lines Wind Blade Manufacturing Lines Installed 41 33 8 lines 41 33 8 lines Wind Blade Manufacturing Lines in Startup 9 3 6 lines 9 3 6 lines Wind Blade Manufacturing Lines in Transition — 3 3 lines — 3 3 lines
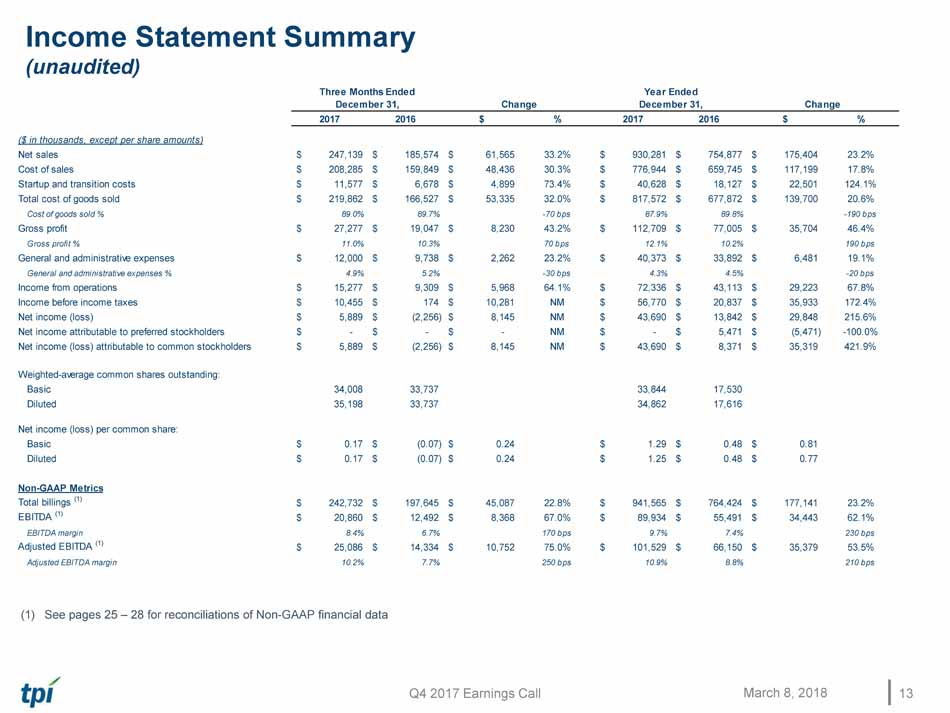
Q4 2017 Earnings Call Income Statement Summary (unaudited) 13 March 8, 2018 (1) See pages 25 – 28 for reconciliations of Non - GAAP financial data 2017 2016 $ % 2017 2016 $ % ($ in thousands, except per share amounts) Net sales 247,139$ 185,574$ 61,565$ 33.2% 930,281$ 754,877$ 175,404$ 23.2% Cost of sales 208,285$ 159,849$ 48,436$ 30.3% 776,944$ 659,745$ 117,199$ 17.8% Startup and transition costs 11,577$ 6,678$ 4,899$ 73.4% 40,628$ 18,127$ 22,501$ 124.1% Total cost of goods sold 219,862$ 166,527$ 53,335$ 32.0% 817,572$ 677,872$ 139,700$ 20.6% Cost of goods sold % 89.0% 89.7% -70 bps 87.9% 89.8% -190 bps Gross profit 27,277$ 19,047$ 8,230$ 43.2% 112,709$ 77,005$ 35,704$ 46.4% Gross profit % 11.0% 10.3% 70 bps 12.1% 10.2% 190 bps General and administrative expenses 12,000$ 9,738$ 2,262$ 23.2% 40,373$ 33,892$ 6,481$ 19.1% General and administrative expenses % 4.9% 5.2% -30 bps 4.3% 4.5% -20 bps Income from operations 15,277$ 9,309$ 5,968$ 64.1% 72,336$ 43,113$ 29,223$ 67.8% Income before income taxes 10,455$ 174$ 10,281$ NM 56,770$ 20,837$ 35,933$ 172.4% Net income (loss) 5,889$ (2,256)$ 8,145$ NM 43,690$ 13,842$ 29,848$ 215.6% Net income attributable to preferred stockholders -$ -$ -$ NM -$ 5,471$ (5,471)$ -100.0% Net income (loss) attributable to common stockholders 5,889$ (2,256)$ 8,145$ NM 43,690$ 8,371$ 35,319$ 421.9% Weighted-average common shares outstanding: Basic 34,008 33,737 33,844 17,530 Diluted 35,198 33,737 34,862 17,616 Net income (loss) per common share: Basic 0.17$ (0.07)$ 0.24$ 1.29$ 0.48$ 0.81$ Diluted 0.17$ (0.07)$ 0.24$ 1.25$ 0.48$ 0.77$ Non-GAAP Metrics Total billings (1) 242,732$ 197,645$ 45,087$ 22.8% 941,565$ 764,424$ 177,141$ 23.2% EBITDA (1) 20,860$ 12,492$ 8,368$ 67.0% 89,934$ 55,491$ 34,443$ 62.1% EBITDA margin 8.4% 6.7% 170 bps 9.7% 7.4% 230 bps Adjusted EBITDA (1) 25,086$ 14,334$ 10,752$ 75.0% 101,529$ 66,150$ 35,379$ 53.5% Adjusted EBITDA margin 10.2% 7.7% 250 bps 10.9% 8.8% 210 bps Three Months Ended December 31, Change Year Ended December 31, Change

Q4 2017 Earnings Call Key Balance Sheet and Cash Flow Data ( unaudited) 14 March 8, 2018 (1) See page 27 for the reconciliation s of net cash ( debt ) and free cash flow ($ in thousands) 2017 2016 Balance Sheet Data: Cash and cash equivalents 148,113$ 119,066$ Restricted cash 3,849$ 2,259$ Accounts receivable 121,576$ 67,842$ Inventories 67,064$ 53,095$ Inventories held for customer orders 64,858$ 52,308$ Deferred revenue 81,048$ 69,568$ Total debt-current and noncurrent, net 121,385$ 123,155$ Net cash (debt) (1) 24,557$ (6,379)$ ($ in thousands) 2017 2016 2017 2016 Cash Flow Data: Net cash provided by operating activities 31,140$ 25,865$ 82,663$ 53,841$ Capital expenditures 9,516$ 11,590$ 44,828$ 30,507$ Free cash flow (1) 21,624$ 14,275$ 37,835$ 23,334$ December 31, Year Ended December 31, Three Months Ended December 31,

Impact of ASC 606

Q4 2017 Earnings Call Estimated Impact of ASC 606 16 March 8, 2018 (in thousands except per share amounts) 2018 Guidance Under ASC 606 Year Ended December 31, 2017 Year Ended December 31, 2016 Low End of Range High End of Range As Reported Estimated Restatement under ASC 606 As Reported Estimated Restatement under ASC 606 Net Sales $1,000,000 $1,050,000 $930,281 $955,000 $754,877 $770,000 EPS – Fully Diluted $0.38 $0.42 $1.25 $1.12 $0.48 $1.05 Adjusted EBITDA $75,000 $80,000 $101,529 $99,000 $66,150 $77,000

Impact of Tax Reform

Q4 2017 Earnings Call Impact of Tax Reform 18 March 8, 2018 • We expect to have no cash taxes in the U.S. in 2018 or 2019 due to the utilization of foreign tax credits and NOLs which includes the estimated impact of taxes on approximately $74.3M of net foreign earnings and profits (repatriation tax) • We expect no direct future impact from the BEAT provisions • We expect a nominal benefit of the immediate expensing of capital expenditures given the relatively small amount in the U.S. • After 2019 we expect tax reform to have an overall positive impact to TPI as a result of lower tax rates in the U.S. once our NOLs are fully utilized

Q4 2017 Earnings Call Effective Tax Rate • A djusting our guidance for 2018 from 25% to a range of 40% to 42% – Under our operating and tax structure, the majority of our operating results in China and Mexico are taxed in the U.S. – We are structured this way to take advantage of the NOLs we’ve generated in the U.S. and as a more efficient way to manage our global cash. – However, we are unable to currently recognize the benefit of NOLs generated in the U.S. due to the valuation allowance recorded against this asset in the U.S. as required under U.S. GAAP. – We will generate U.S. tax losses in 2018 as a result of the startups for Vestas in Matamoros, Senvion in China and Proterra in Iowa. – The inability to recognize the benefit of the U.S. tax losses in 2018 will result in our reported effective tax rate for 2018 being higher than originally anticipated. 19 March 8, 2018

Guidance for 2018

Q4 2017 Earnings Call Key Guidance Metrics 21 March 8, 2018 2018 Guidance Previous 2018 Guidance Updated 2018 Guidance ASC 606 Total Billings (1) $1.0B – $1.05B $1.0B – $1.05B $1.0B – $1.05B Net Sales DNP DNP $1.0B – $1.05B Adjusted EBITDA $70M - $75M $70M - $75M $75M – $80M Earnings per Share - FD DNP DNP $0.38 - $0.42 Sets 2,500 – 2,550 2,500 – 2,550 Average Selling Price per Blade $125K – $130K $125K - – $130K Non - Blade Billings $75M – $80M $75M – $80M G&A Costs as a % of Billings (incl. SBC) 4% – 5% 4% – 5% Estimated MW 6,950 – 7,100 6,950 – 7,100 Dedicated Lines - EOY 51 – 55 51 – 55 Share - Based Compensation $10M – $11M $10M - – $11M Depreciation & Amortization $30M – $35M $30M – $35M Net Interest Expense $11.5M – $12.5M $11.5M – $12.5M Capital Expenditures $70M – $75M $85M – $90M Effective Tax Rate 25% 40% – 42% Note: All reference to lines is to wind blade manufacturing lines (1) We have not reconciled our total expected billings for 2018 to expected net sales under GAAP because we have not yet finalize d c alculations necessary to provide the reconciliation, including expected changes in deferred revenue, and as such the reconciliation is not possible without unreas ona ble efforts.

Q4 2017 Earnings Call Startup and Transition Guidance Metrics 22 March 8, 2018 Note: References to “lines” above relate to wind blade manufacturing lines

Q&A

Appendix – Non - GAAP Information This presentation includes unaudited non - GAAP financial measures including total billings, EBITDA, adjusted EBITDA, net cash (debt) and free cash flow. We define total billings as the total amounts we have invoiced our customers for products and services for wh ich we are entitled to payment under the terms of our long - term supply agreements or other contractual agreements. We define EBITDA as net income (loss) attributable to the Company plus interest expense (including losses on the extinguishment of debt and net of in ter est income), income taxes, and depreciation and amortization. We define adjusted EBITDA as EBITDA plus any share - based compensation expense, plus or minus any gains or losses from foreign currency remeasurement. We define net cash (debt) as the total principal amount of debt outstanding less unrestricted cash and cash equivalents. We define free cash flow as net cash flow g ene rated from operating activities less capital expenditures. We present non - GAAP measures when we believe that the additional information is useful and meaningful to investors. Non - GAAP financial measures do not have any standardized meaning and are therefore unlikely to be comparable to similar measures presented by other companies. The presentation of non - GAAP financial measures is not intended to be a substitute for, and should not be considered in isolation from, the financial measures reported in accordance with GA AP. See below for a reconciliation of certain non - GAAP financial measures to the comparable GAAP measures.

Q4 2017 Earnings Call Non - GAAP Reconciliations ( unaudited) Net sales is reconciled to total billings as follows: Net income is reconciled to EBITDA and adjusted EBITDA as follows: Note: Footnote references on the following page 25 March 8, 2018 ($ in thousands) 2017 2016 2017 2016 Net sales 247,139$ 185,574$ 930,281$ 754,877$ Change in deferred revenue: Blade-related deferred revenue at beginning of period (1) (87,294) (61,949) (69,568) (65,520) Blade-related deferred revenue at end of period (1) 81,048 69,568 81,048 69,568 Foreign exchange impact (2) 1,839 4,452 (196) 5,499 Change in deferred revenue (4,407) 12,071 11,284 9,547 Total billings 242,732$ 197,645$ 941,565$ 764,424$ Three Months Ended December 31, Year Ended December 31, ($ in thousands) 2017 2016 2017 2016 Net income (loss) 5,889$ (2,256)$ 43,690$ 13,842$ Adjustments: Depreciation and amortization 7,256 3,194 20,878 12,897 Interest expense (net of interest income) 3,149 4,637 12,286 17,270 Loss on extinguishment of debt - 4,487 - 4,487 Income tax provision 4,566 2,430 13,080 6,995 EBITDA 20,860 12,492 89,934 55,491 Share-based compensation expense 2,330 1,785 7,124 9,902 Realized loss on foreign currency remeasurement 1,896 57 4,471 757 Adjusted EBITDA 25,086$ 14,334$ 101,529$ 66,150$ Three Months Ended December 31, Year Ended December 31,

Q4 2017 Earnings Call Non - GAAP Reconciliations (continued ) (unaudited) (1) Total billings is reconciled using the blade - related deferred revenue amounts at the beginning and the end of the period as follows: (2 ) Represents the effect of the difference in the exchange rate used by our various foreign subsidiaries on the invoice date versus the exchange rate used at the period - end balance sheet date. 26 March 8, 2018 ($ in thousands) 2017 2016 2017 2016 Blade-related deferred revenue at beginning of period 87,294$ 61,949$ 69,568$ 65,520$ Non-blade related deferred revenue at beginning of period - - - - Total current and noncurrent deferred revenue at beginning of period 87,294$ 61,949$ 69,568$ 65,520$ Blade-related deferred revenue at end of period 81,048$ 69,568$ 81,048$ 69,568$ Non-blade related deferred revenue at end of period - - - - Total current and noncurrent deferred revenue at end of period 81,048$ 69,568$ 81,048$ 69,568$ Three Months Ended December 31, Year Ended December 31,

Q4 2017 Earnings Call Non - GAAP Reconciliations (continued) ( unaudited) Net cash (debt) is reconciled as follows: Free cash flow is reconciled as follows: 27 March 8, 2018 ($ in thousands) 2017 2016 2017 2016 Net cash provided by operating activities 31,140$ 25,865$ 82,663$ 53,841$ Less capital expenditures (9,516) (11,590) (44,828) (30,507) Free cash flow 21,624$ 14,275$ 37,835$ 23,334$ Year Ended December 31, Three Months Ended December 31, ($ in thousands) 2017 2016 Total debt, net of debt issuance costs 121,385$ 123,155$ Add debt issuance costs 2,171 2,290 Less cash and cash equivalents (148,113) (119,066) Net cash (debt) 24,557$ (6,379)$ December 31,

Q4 2017 Earnings Call Non - GAAP Reconciliations (continued ) (unaudited) A reconciliation of the low end and high end of projected net income under ASC 606 to projected EBITDA and projected adjusted EBITDA is as follows: 28 March 8, 2018 ($ in thousands) Low End High End Projected net income 12,000$ 15,000$ Adjustments: Projected depreciation and amortization 32,500 32,500 Projected interest expense (net of interest income) 12,000 12,000 Projected income tax provision 8,000 10,000 Projected EBITDA 64,500 69,500 Projected share-based compensation expense 10,500 10,500 Projected realized loss on foreign currency remeasurement - - Projected Adjusted EBITDA 75,000$ 80,000$ (1) All figures presented are projected estimates for the full year ending December 31, 2018. 2018 Adjusted EBITDA Guidance Range (1)
