Attached files
| file | filename |
|---|---|
| EX-23.1 - EXHIBIT 23.1 - Ribbon Communications Inc. | rbbn-ex23120171231.htm |
| EX-32.2 - EXHIBIT 32.2 - Ribbon Communications Inc. | rbbn-ex32220171231.htm |
| EX-32.1 - EXHIBIT 32.1 - Ribbon Communications Inc. | rbbn-ex32120171231.htm |
| EX-31.2 - EXHIBIT 31.2 - Ribbon Communications Inc. | rbbn-ex31220171231.htm |
| EX-31.1 - EXHIBIT 31.1 - Ribbon Communications Inc. | rbbn-ex31120171231.htm |
| EX-21.1 - EXHIBIT 21.1 - Ribbon Communications Inc. | rbbn-ex21120171231.htm |
| EX-10.31 - EXHIBIT 10.31 - Ribbon Communications Inc. | rbbn-ex103120171231.htm |
| EX-10.30 - EXHIBIT 10.30 - Ribbon Communications Inc. | rbbn-ex103020171231.htm |
| EX-10.29 - EXHIBIT 10.29 - Ribbon Communications Inc. | rbbn-ex102920171231.htm |
| EX-10.28 - EXHIBIT 10.28 - Ribbon Communications Inc. | rbbn-ex102820171231.htm |
| EX-10.7 - EXHIBIT 10.7 - Ribbon Communications Inc. | rbbn-ex10720171231.htm |
| EX-10.5 - EXHIBIT 10.5 - Ribbon Communications Inc. | rbbn-ex10520171231.htm |
| EX-3.3 - EXHIBIT 3.3 - Ribbon Communications Inc. | rbbn-ex3320171231.htm |
UNITED STATES
SECURITIES AND EXCHANGE COMMISSION
WASHINGTON, D.C. 20549
FORM 10-K
x | ANNUAL REPORT PURSUANT TO SECTION 13 OR 15(d) OF THE SECURITIES EXCHANGE ACT OF 1934 | |
For the fiscal year ended December 31, 2017 | ||
o | TRANSITION REPORT PURSUANT TO SECTION 13 OR 15(d) OF THE SECURITIES EXCHANGE ACT OF 1934 | |
Commission File Number 001-38267
RIBBON COMMUNICATIONS INC.
(Exact name of Registrant as specified in its charter)
DELAWARE | 82-1669692 | |
(State or other jurisdiction of incorporation or organization) | (I.R.S. Employer Identification No.) | |
4 Technology Park Drive, Westford, Massachusetts 01886
(Address of principal executive offices, including zip code)
(978) 614-8100
(Registrant's telephone number, including area code)
Securities registered pursuant to Section 12(b) of the Act:
Title of each class | Name of each exchange on which registered | |
Common Stock, par value $0.0001 | The Nasdaq Global Select Market | |
Securities registered pursuant to Section 12(g) of the Act: None
Indicate by check mark if the registrant is a well-known seasoned issuer, as defined in Rule 405 of the Securities Act. Yes o No x
Indicate by check mark if the registrant is not required to file reports pursuant to Section 13 or Section 15(d) of the Act. Yes o No x
Indicate by check mark whether the registrant (1) has filed all reports required to be filed by Section 13 or 15(d) of the Securities Exchange Act of 1934 during the preceding 12 months (or for such shorter period that the Registrant was required to file such reports), and (2) has been subject to such filing requirements for the past 90 days. Yes x No o
Indicate by check mark whether the registrant has submitted electronically and posted on its corporate Web site, if any, every Interactive Data File required to be submitted and posted pursuant to Rule 405 of Regulation S-T (§232.405 of this chapter) during the preceding 12 months (or for such shorter period that the registrant was required to submit and post such files). Yes x No o
Indicate by check mark if disclosure of delinquent filers pursuant to Item 405 of Regulation S-K (§229.405 of this chapter) is not contained herein, and will not be contained, to the best of the registrant's knowledge, in definitive proxy or information statements incorporated by reference in Part III of this Form 10-K or any amendment to this Form 10-K. x
Indicate by check mark whether the registrant is a large accelerated filer, an accelerated filer, a non-accelerated filer, smaller reporting company or an emerging growth company. See definitions of "large accelerated filer," "accelerated filer," "smaller reporting company" and "emerging growth company" in Rule 12b-2 of the Exchange Act. (Check one):
Large accelerated filer o | Accelerated filer x | Non-accelerated filer o (Do not check if a smaller reporting company) | Smaller reporting company o | Emerging growth company o |
If an emerging growth company, indicate by check mark if the registrant has elected not to use the extended transition period for complying with any new or revised financial accounting standards provided pursuant to Section 13(a) of the Exchange Act. o
Indicate by check mark whether the registrant is a shell company (as defined in Rule 12b-2 of the Exchange Act). Yes o No x
As of June 30, 2017, the last business day of the Registrant's most recently completed second fiscal quarter, the Registrant's common stock was not publicly traded. Therefore, the Registrant cannot calculate the aggregate market value of its voting and non-voting common equity held by non-affiliates as of such date.
The aggregate market value of the common stock held by non-affiliates of Sonus Networks, Inc., the Registrant's predecessor, was approximately $357,710,000 based on the closing price for its common stock on The Nasdaq Global Select Market on June 30, 2017. As of February 27, 2018, the Registrant had 101,928,560 shares of common stock, $0.0001 par value, outstanding.
DOCUMENTS INCORPORATED BY REFERENCE
Portions of the definitive Proxy Statement to be delivered to stockholders in connection with the Registrant's 2018 Annual Meeting of Stockholders are incorporated by reference into Part III of this report.
RIBBON COMMUNICATIONS INC.
FORM 10-K
YEAR ENDED DECEMBER 31, 2017
TABLE OF CONTENTS
Item | Page | |
Cautionary Note Regarding Forward-Looking Statements
This Annual Report on Form 10-K contains "forward-looking statements" within the meaning of the U.S. Private Securities Litigation Reform Act of 1995, which are subject to a number of risks and uncertainties. All statements other than statements of historical facts contained in this Annual Report on Form 10-K, including statements regarding our future results of operations and financial position, anticipated restructuring and integration-related expenses, business strategy, plans and objectives of management for future operations and plans for future product development and manufacturing are forward-looking statements. Without limiting the foregoing, the words "anticipates", "believes", "could", "estimates", "expects", "intends", "may", "plans", "seeks" and other similar language, whether in the negative or affirmative, are intended to identify forward-looking statements, although not all forward looking statements contain these identifying words. Forward-looking statements are based on our current expectations and assumptions regarding our business, the economy and other future conditions. Because forward-looking statements relate to the future, they are subject to inherent uncertainties, risks and changes in circumstances that are difficult to predict. These statements involve known and unknown risks, uncertainties and other important factors that may cause our actual results, performance or achievements to be materially different from any future results, performance or achievements expressed or implied by the forward-looking statements. We therefore caution you against relying on any of these forward-looking statements. Important factors that could cause actual results to differ materially from those in these forward-looking statements are discussed in Item 1A., "Risk Factors" of Part I and Items 7 and 7A., "Management's Discussion and Analysis of Financial Condition and Results of Operations" and "Quantitative and Qualitative Disclosures About Market Risk," respectively, of Part II of this Annual Report on Form 10-K. Also, any forward-looking statement made by us in this Annual Report on Form 10-K speaks only as of the date on which this Annual Report on Form 10-K was first filed. Factors or events that could cause our actual results to differ may emerge from time to time, and it is not possible for us to predict all of them. We undertake no obligation to publicly update any forward-looking statement, whether as a result of new information, future developments or otherwise, except as may be required by law.
Presentation of Information
Effective October 27, 2017, we completed the merger (the "Merger") of Sonus Networks, Inc. ("Sonus"), GENBAND Holdings Company, GENBAND, Inc. and GENBAND II, Inc. (collectively, "GENBAND").
Unless the context otherwise requires, references in this Annual Report on Form 10-K to "Ribbon," "Ribbon Communications," "Company," "we," "us" and "our" and "the Company" refer to (i) Sonus Networks, Inc. and its subsidiaries prior to the Merger and (ii) Ribbon Communications Inc. and its subsidiaries upon completion of the Merger, as applicable.
3
GLOSSARY OF CERTAIN INDUSTRY TERMS
The industry terms defined below are used throughout this Annual Report on Form 10-K (this “10-K”).
API (application programming interface): A set of subroutine definitions, protocols, and tools for building application software. In general terms, it is a set of clearly defined methods of communication between various software components.
CPaaS (Communications Platform as a Service): A cloud-based delivery model that allows organizations to add real-time communication capabilities such as voice, video and messaging to business applications by deploying application program interfaces.
CPU (central processing unit): The electronic circuitry within a computer that carries out the instructions of a computer program by performing the basic arithmetic, logical, control and input/output operations specified by the instructions.
DSC (diameter signaling controller): A device that helps communications service providers overcome Diameter signaling performance, scalability and interoperability challenges in LTE and IMS networks. Diameter is a next-generation industry-standard protocol used to exchange authentication, authorization and accounting information in LTE and IMS networks.
DSP (digital signal processing): The use of digital processing, such as by computers or more specialized digital signal processors, to perform a wide variety of signal processing operations. The signals processed in this manner are a sequence of numbers that represent samples of a continuous variable in a domain such as time, space, or frequency.
ESP: Estimated selling price.
GPU (graphical processing unit): A specialized electronic circuit designed to rapidly manipulate and alter memory to accelerate the creation of images in a frame buffer intended for output to a display device.
HUC (hosted unified communications): A user-centric UC that supports traditional SIP-based endpoints as well as collaboration and video UC from PCs, Macs, and mobile devices.
IMS (IP multimedia [sub]system): An architectural framework for delivering IP multimedia services.
IP (Internet Protocol): A set of rules governing the format of data sent over the Internet or other network.
IP-PBX: SIP-based PBX.
ISP: Internet service provider.
LTE (long term evolution): A standard for high-speed wireless communication for mobile devices and data terminals for smooth and efficient transition toward more advanced leading-edge technologies to increase the capacity and speed of wireless data networks. Often used to refer to wireless broadband or mobile network technologies.
MSO (multi-system operator): An operator of multiple cable or direct-broadcast satellite television systems.
NFV (network function virtualization): A network architecture concept that uses the technologies of IT virtualization to virtualize entire classes of network node functions into building blocks that may connect, or chain together, to create communication services.
OTT (Over-the-Top): A media distribution practice that allows a streaming content provider to sell audio, video, and other media services directly to the consumer over the internet via streaming media as a standalone product, bypassing telecommunications, cable or broadcast television service providers that traditionally act as a controller or distributor of such content.
PBX (private branch exchange): A telephone system within an enterprise that switches calls between enterprise users on local lines while allowing all users to share a certain number of external phone lines.
PLMN (public land mobile network): A network that is established and operated by an administration or by a recognized operating agency for the specific purpose of providing land mobile telecommunications services to the public.
4
PSTN (public switched telephone network): The aggregate of the world's circuit-switched telephone networks that are operated by national, regional, or local telephony operators, providing infrastructure and services for public telecommunication.
RTC (real-time communications): A term used to refer to live telecommunications that occur without transmission delays. RTC is nearly instant with minimal latency. RTC data and messages are not stored between transmission and reception. RTC is generally a peer-to-peer, rather than broadcasting or multicasting, transmission.
SBC (session border controller): A device regularly deployed in VoIP networks to exert control over the signaling and the media streams involved in setting up, conducting, and tearing down telephone calls or other interactive media communications.
SDK: Software development kit.
SDN (software-defined networking): An umbrella term encompassing several kinds of network technology aimed at making the network as agile and flexible as the virtualized server and storage infrastructure of the modern data center.
SIP (session initiation protocol): A communications protocol for signaling and controlling multimedia communication sessions in applications of Internet telephony for voice and video calls, in private IP telephone systems, as well as in instant messaging over IP networks.
SMB: Small-medium business.
SMS (short message service): A text messaging service component of most telephone, World Wide Web, and mobile device systems, using standardized communication protocols to enable mobile devices to exchange short text messages.
SOHO: Small office and home office.
STaaS (SIP Trunking as a Service): A VoIP technology and streaming media service based on SIP by which Internet telephony service providers deliver telephone services and UC to customers equipped with IP-PBX and UC facilities.
TDM (time-division multiplexing): A method of putting multiple data streams in a single signal by separating the signal into many segments, each having a very short duration. Each individual data stream is reassembled at the receiving end based on the timing.
TPE: Third-party evidence of selling price.
UC (unified communications): A business term describing the integration of enterprise communication services such as instant messaging (chat), presence information, voice (including IP telephony), mobility features (including extension mobility and single number reach), audio, web & video conferencing, fixed-mobile convergence, desktop sharing, data sharing (including web connected electronic interactive whiteboards), call control and speech recognition with non-real-time communication services such as unified messaging (integrated voicemail, e-mail, SMS and fax).
VAR (value added reseller): A company that adds features or services to an existing product, then resells it (usually to end-users) as an integrated product or complete turn-key solution.
VMC (virtualized mobile core): A software platform enabling standard-based Wi-Fi Calling, LTE calling and VoLTE services for mobile network operators and mobile virtual network operators.
VNF (virtual network function): Responsible for handling specific network functions that run in one or more virtual machines on top of the hardware networking infrastructure, which can include routers, switches, servers, cloud computing systems and more.
VoIP (Voice over Internet Protocol): A methodology and group of technologies for the delivery of voice communications and multimedia sessions over IP networks, such as the Internet.
VoLTE (Voice over LTE): A standard for high-speed wireless communication for mobile phones and data terminals over a 4G LTE access network, rather than 2G or 3G connections.
5
VoWifi (Voice over Wifi): A complementary technology to VoLTE that utilizes IMS technology to provide the routing telephone calls and faxes over an existing data network rather than over the traditional PSTN.
VSOE (vendor-specific objective evidence of selling price): A method of revenue recognition allowed by U.S. GAAP that enables companies to recognize revenue on specific items on a multi-item sale based on evidence specific to a company that the product has been delivered.
6
PART I
Item 1. Business
Overview
We are a leading provider of network solutions to telecommunications, wireless and cable service providers and enterprises across industry verticals. With over 1,000 customers around the globe, including some of the largest telecommunications service providers and enterprises in the world, we enable service providers and enterprises to modernize their communications networks and provide secure RTC solutions to their customers and employees. By securing and enabling reliable and scalable IP networks, we help service providers and enterprises adopt the next generation of software-based virtualized and cloud communications technologies to drive new, incremental revenue while protecting their existing revenue streams. Our solutions provide a secure way for our customers to connect and leverage multivendor, multiprotocol communications systems and applications across their networks and the cloud, around the world and in a rapidly changing ecosystem of IP-enabled devices such as smartphones and tablets. In addition, our solutions secure the evolution to cloud-based delivery of UC solutions - both for service providers transforming to a cloud-based network and for enterprises using cloud-based UC. We go to market through both direct sales and indirect channels globally, leveraging the assistance of resellers, and we provide ongoing support to our customers through a global services team with experience in design, deployment and maintenance of some of the world's largest IP networks.
We recently completed our Merger with GENBAND in October 2017. As a result of the Merger, we believe we are better positioned to enable network transformations to IP and to cloud-based networks for service providers and enterprise customers worldwide, with a broader and deeper sales footprint, increased ability to invest in growth, more efficient and effective research and development, and a comprehensive RTC product offering.
Industry Background
Traditional TDM-based voice and data solutions are being supplanted by alternative IP-based networks. Given this shift, today’s telecommunications service providers and enterprises are faced with two separate but related challenges: how to upgrade their aging and costly communications infrastructure, and how to implement new and innovative software, IP and cloud-based communications capabilities. Service providers in particular must address these challenges while at the same time responding to competition in the form of new web-scale communication providers such as Microsoft, Google and Amazon.
To address these challenges, service providers and enterprises are modernizing their communications networks, network functions and communications applications from legacy environments to new environments using IP, NFV and the cloud to take advantage of the many benefits that these technologies offer with an end goal of providing better and more productive communications experiences to their customers and employees.
Telecommunications Service Providers: Network Modernization
One of the most significant capital costs for telecommunications service providers has been and continues to be their infrastructure. In order to leverage past capital investments and deliver existing and new services, service providers must consolidate their infrastructure from the costly, legacy infrastructures such as the PSTN and the PLMN into the more efficient and flexible IP- and software-based network models, which are capable of driving revenue growth. Migrating from the PSTN to IP reduces real estate, power and operating costs. IP networks allow the consolidation of voice, video and data within a single IP-based networking infrastructure over broadband and wireless access and enables new communications services, such as SIP Trunking and HUCs. Similarly, modernizing mobile networks to the IMS-based 4G LTE and VoLTE networks enables mobile service providers to offer better and more efficient mobile communications experiences to end users. As consumers and businesses continue to demand more engaging and productive communications experiences, we believe network modernization is and will continue to be essential to service providers’ ability to compete effectively in the market for telecommunications services.
Modernization of Networks to IP
Communication trends have been shifting for the past several years. What was once an industry built on voice communications from central office switches and PBXs on the enterprise premise is now being replaced by the use of social networks, OTT service providers, mobile applications, and hosted service providers. Consumers are increasingly turning to OTT applications
7
(like WhatsApp, Apple’s Facetime, Messaging or Amazon’s Alexa). This shift has created an enhanced experience for consumers and has heightened expectations for future products and services.
Businesses, large and small, are re-architecting business processes and undergoing a digital transformation, building their own virtualized solutions in the cloud or moving their IT applications entirely to public cloud applications, and adding RTC and collaboration to their customer service solutions. These new solutions improve customer service and create an e-commerce experience that blends online applications with the in-store environment, creating a seamless experience for customers. Network modernization to IP-based systems enables service providers to add modern communications service offers that blend traditional voice messaging capabilities with contemporary features such as video messaging, visual voicemail, mobile messaging and email integration, and an accelerated time-to-market for differentiated messaging services.
Secure Real-time Communications
For most telecommunications service providers, the move to IP-based RTC presumes a strategic, phased migration. This evolution exposes service providers to new security threats, as the “walled” protection offered by their voice network infrastructures no longer exists with SIP and data-based networks. With SIP-based systems, RTC applications such as voice, video and messaging become data applications, and without appropriate security measures in place, these networks are left open to security breaches and hacks. Additionally, the move to SIP has seen an increase in fraud in service provider networks in the form of robo-dialing and toll fraud schemes.
Given these threats, there is a need for sophisticated security solutions to protect networks during the network transformation process. Service providers have relied on SBCs, which are deployed within networks that are designed to provide robust security, as well as simplify interoperability, routing and other functions as a protection measure. By their nature, SBCs are application-aware and therefore can use data and sophisticated analytics to detect and thwart security breaches. We believe securing networks against threats is most effective when secure software solutions are deployed within networks and integrated into existing RTC investments.
Network Function Virtualization
In addition to shifting from legacy to secure IP networks, service providers are increasingly moving toward NFV in order to be able to offer new services quickly to their customers, reduce costs and compete with Web-Scale companies. NFV offers a new way to design, deploy and manage networking services by decoupling network functions from proprietary hardware appliances so they can run in software. This transformation enables better use of network infrastructure, creates agility, delivers rapid and elastic scaling, and enables faster time to market. VNFs can be deployed on generic computing platforms, hosted in private and public clouds, located in data centers, or within other network elements, and on end user premises.
Cloud and “as a Service” Models
As communications applications are deployed in the cloud, service providers gain the ability to offer a new class of business models commonly referred to “as a Service” solutions. These solutions include:
CPaaS: CPaaS is a cloud-based platform that enables developers to add RTC features such as voice, data, video, and messaging in their own applications without needing to build backend infrastructure and interfaces. CPaaS provides software developers the flexibility to “drag and drop” these features into their native applications or within web sites, through simple APIs and SDKs. With CPaaS, enterprises can quickly build applications that tie RTC and their social channels to their business workflows. This technology has not only moved real time communications off carrier networks, but also has greatly simplified the development and deployment of RTC capabilities.
UCaaS: Deploying UC within the “cloud” helps businesses provide flexibility and scalability for core business tasks. UCaaS features include enterprise messaging, presence technology, online meetings, team collaboration, telephony and video conferencing in lieu of traditional voice solutions, such as PBXs or carrier based Centrex. With CPaaS, enterprises can quickly build applications that tie RTC and their social channels to their business workflows.
STaaS: SIP trunking enables service providers to bundle voice and data over a single converged IP pipe and brings connectivity to the enterprise, creating a more economical offering than can be achieved with separate voice and data connections. STaaS delivers IP telephone to customers equipped with IP-PBX and UC facilities. With STaaS, customers have the flexibility to turn up or down and manage their own SIP trunks without the need for additional hardware on-premises or in the network.
8
Enterprises: Network Modernization and Digital Transformation
Today’s businesses, both enterprises and SMBs, are undergoing not only a network modernization but also a digital business transformation. The focus is shifting from person-to-person communications to contextual collaboration and omni-channel customer experiences. Within this context, businesses need a secure, scalable and innovative alternative to proprietary PBX and UC products. As part of their digital transformation, businesses have adopted the cloud, open interfaces, mobile, Big Data, and analytics. Seeing the advantages and cost savings from the cloud, businesses are migrating their communications solutions to this same environment, thereby enabling connections between business processes, communications, and collaboration.
Network Modernization
Enterprises undergoing network modernization are focused on moving from TDM-based PBXs to SIP trunking and new UC and collaboration systems while ensuring interoperability during the transformation process. In addition, enterprises in certain industries will often be subject to specific requirements or standards before a network transformation is completed. For example, governments may require JITC certification for secure deployments, and healthcare providers may need to achieve HIPAA certification.
When modernizing a network, the ability to interwork modern applications such as Microsoft’s Skype for Business, with legacy analog endpoints on premises, becomes essential. SBCs play an integral role in providing interworking and survivability options. As discussed above, SBCs play a crucial role in securing the network modernization process, which is a top priority for any business.
Digital Transformation
Successful enterprises today are focused on innovating their core product offerings and building a strategic advantage to reach and empower their customers. As technologies evolve and new mobile applications and connected devices proliferate, enterprises must adapt and innovate their communications solutions to create a “connected” experience anywhere, anytime, on any device. As part of this process, businesses are increasingly deploying “as a Service” offerings from the cloud (from either a service provider or a web-scale provider). UCaaS and CPaaS create a single communications platform that changes the way enterprises interact with customers and meet their expectations. CPaaS enables enterprises to quickly build applications that tie real time communications and their social channels to their business processes while UCaaS delivers the underlying UC infrastructure to ensure end users have the features and functionality required to enable reliable and scalable end-to-end communications.
Our Solutions, Products and Services
Ribbon Solutions
Ribbon provides secure RTC software, hardware and cloud-native solutions for service providers and enterprises. Ribbon's communications solutions are widely deployed at over 1,000 customers globally, provide high scale, reliability and performance, and are deployable from the public, private and hybrid cloud, in-network or on the enterprise premise. As of December 31, 2017, our solutions for service providers and enterprises included the following:
9
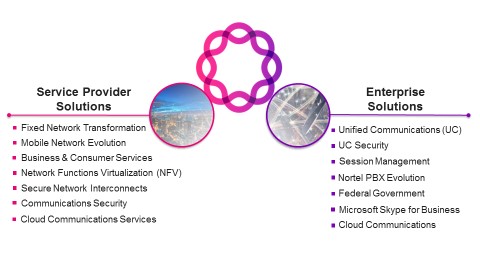
Ribbon service provider solutions help fixed and mobile operators, cable providers or MSOs, ISPs and interconnect service providers modernize their networks, quickly capitalize on growing market segments and introduce differentiating products, applications and services for their business and consumer customers. Ribbon's service provider network modernization solutions include fixed network transformation, mobile network evolution (mobility), secure network interconnects, network functions virtualization, cloud communications as a Service and communications security solutions, enabling secure and innovative business and consumer communications services offerings. Ribbon solutions help service providers connect people to each other wherever they happen to be, addressing the growing demands of today’s consumers and businesses for secure RTC.
Ribbon's enterprise solutions allow enterprises to securely connect to SIP trunks and modernize their communications networks. Modernization solutions range from legacy Nortel PBX evolution, securing UC and contact centers, migrating to Microsoft Skype for Business and Teams, providing session management, security and cloud communications solutions to enable highly productive communications experiences for employees and customers using the web, mobile and fixed endpoints. Ribbon provides communications solutions for the federal government vertical and has Joint Interoperability Test Command (JTIC) certified solutions. Ribbon also provides RTC solutions to other industry verticals, including higher education, finance and healthcare. Ribbon has significant experience and expertise in securing SIP communications with a portfolio of SBCs, and has deployed thousands of SBCs across different industry verticals. Our Microsoft Skype for Business and Teams solutions secure those communications environments and assist in the migration of enterprise customers to those environments.
Ribbon Products
Ribbon products enable service providers to take new services to market quickly and with scale and carrier class reliability, allowing them to compete effectively in the marketplace, and enable enterprises to make their employee and customer engagement experiences richer and more productive.
Ribbon’s product lines enabling network transformation, mobile network evolution and interconnect solutions include Ribbon's call session controllers, media gateways, signaling products, policy and routing products and a market leading portfolio of SBCs, all of which are mechanisms through which operators and enterprises deploy our secure RTC solutions. Ribbon’s UC solutions are enabled by the Ribbon Application Server, Client and Intelligent Messaging products, and are a platform for business and residential multimedia communications across fixed, mobile, cable, and enterprise markets. Our product portfolio enables the securing of SIP-based UC sessions in the enterprise and the migration of legacy PBX-based enterprise communications networks (such as the Nortel PBX installed base) across different market verticals. Our product portfolio includes element management and network management products to enable customers to configure, monitor and manage the products they purchase from us.
The product portfolio also includes native mobile client products that allow service providers to enable Wi-Fi and LTE Calling services for their subscribers, without the considerable cost of investing in, implementing and maintaining, a full VoLTE IMS network.
The Company's Cloud Communications “as a Service” portfolio, which includes CPaaS, UCaaS and STaaS offers, is based on Kandy, which is a cloud-based RTC platform that enables service providers, independent software vendors, systems integrators and enterprises to rapidly create and deploy high value embedded communications services for their customers. Utilizing Ribbon's communications technology and offered as a part of a white-label solution, providers connect their networks to Kandy CPaaS via SIP Trunks and APIs. The Kandy Platform provides APIs and SDKs for developers to build embedded communications applications. Kandy helps service providers grow revenues with quick to deploy, pre-packaged applications called Kandy Wrappers. Kandy Wrappers are fully functional software applications that can be delivered standalone or inserted into a business website or into a business application to endow it with embedded RTC capabilities. Kandy also delivers a suite of UCaaS solutions such as Cloud PBX, Cloud Contact Center and Cloud Collaboration.
Ribbon Services
Our global services organization is responsible for all aspects of implementation and support of our solutions and products. Key portfolio components include solution and business consulting, system integration, deployment, and managed care services. Our technical support group provides constant support to keep customers' networks operating at peak performance. Support services include managing software updates, hardware maintenance, hardware spare services and managed spares programs, and emergency assistance during disaster recovery.
10
With a local presence in over twenty countries on five continents, Ribbon Global Services provides both a local presence and global scale with complete coverage to help drive our customers’ success.
The Ribbon Global Services team provides our customers with:
A full-service portfolio including deployment and integration, testing and verification, migration, operational support, monitoring and managed services;
End to end project management and accountability via highly experienced Program Managers and following a consistent, disciplined methodology;
Knowledgeable and experienced technical resources with scarce skills and expertise on IP Communications Solutions and Network Modernization;
Consistent execution in the design, deployment and support of the world's largest and most advanced networks; and
Award winning, around-the-clock technical support services with dedicated technical support centers around the globe, including the United States, Mexico, United Kingdom, Spain, Germany, Australia, Japan, Malaysia, Taiwan, China (Hong Kong) and India.
Our Strategy
Ribbon is a leader in enabling network modernization and we plan to continue to invest in our platform approach to increase our global reach and scale. Ribbon is intently focused on realizing the cost synergies and product rationalizations that it aimed to achieve through the Merger. Key elements of Ribbon’s strategy include:
Continue to Enable our Service Provider and Enterprise Customers to Transform their Networks and Business Models. Changing consumption patterns of end customers and consumers of secure real-time communications, combined with competitive pressures, are forcing service providers and enterprises to significantly expand their RTC environments to provide better, more agile end customer experiences containing operational and capital expenditure costs. This in turn is requiring them to transform their networks and business models for secure RTC. The Ribbon portfolio enables this transformation.
Focus on our Customer Needs. Our customers are key to the success of our business and our business model is focused on aligning with our customers through direct engagement, service and support as well as through our channel partners. This model allows us to target our sales and research and development efforts based on the needs of our customers and we believe it is critical to our success.
Build on Growing our Customer Footprint and Global Reach. Ribbon has over 1,000 customers globally, in all of the major regions of the world, including some of the largest telecommunications service providers and enterprises in the world. This footprint allows us to sell additional products and services from the Ribbon portfolio to that deployed base of existing customers and provides us the ability to sell new products and services to that customer base. We also continue to look for opportunities to expand our portfolio footprint and global reach to further diversify our customer base.
Selectively Invest in our Core Products and Solutions. In order to service our customers that have deployed our products and solutions and support their key priorities and growth, we must strategically invest in research and development. We are committed to balancing our research and development investments between existing products and solutions and new growth-oriented product initiatives. In addition, we are focused on investing in products and solutions that we will be profitable for our Company. We intend to sunset certain less significant product offerings that are not aligned with our strategic direction and are not meaningful contributors to profitability. We believe this will allow us to more effectively and efficiently deploy capital to growth areas. Through targeted research and development investments in core products and solutions that will align with our strategy for growth, we are committed to helping our customers migrate their networks to software, and virtualized and cloud environments.
11
Disciplined Expansion into New Markets and Applications for Growth. We believe that a disciplined approach to targeting new markets and applications is critical to growing our business. As such, we have taken actions to expand our portfolio and offers to our customers. Two key growth initiatives include a focus on cloud communications and RTC security. We have also begun to work with our customers on the deployment of our Kandy platform to offer new and innovative RTC services. Similarly, given our significant experience with securing IP network borders with our SBC portfolio, and the increasing importance of security in today’s networks and communications, we are working on expanding our role in securing RTC with new portfolio offerings.
Selectively Pursue Strategic Relationships, Alliances and Acquisitions. Ribbon continues to pursue strategic relationships, alliances and acquisitions that align our business with our customers’ strategic goals and objectives as well as our own strategic goals for further extending our footprint, reach, scale and growth in the business.
Competitive Differentiation
In addition to our scale and global presence, there are several factors that set us apart and allow us to compete effectively with comparable peers in terms of scope, size and scale.
Installed Base. Ribbon has a large deployed based of Nortel softswitches and media gateways in global service provider and enterprise networks supporting over 30 million legacy switched access lines. These softswitches are highly integrated into our customer’s back office environments and require specialized tools and intellectual property from Ribbon to consolidate and migrate those environments to newer IP based services with optimal capital expenditure investments. Similarly, our large deployed based of SBCs at service providers and enterprises offers Ribbon a unique platform for upgrading and cross-selling products into that installed base.
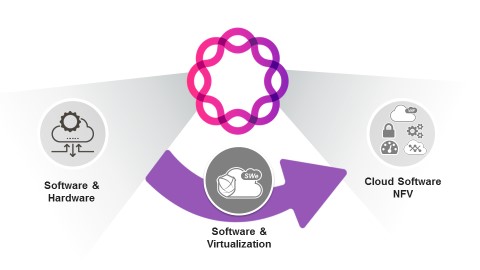
Strong Technology in Virtualization. Ribbon has extensive network virtualization software products and technology as part of our overall portfolio and have begun deploying these products to help our customers in the modernization of their networks to software-based virtualization and the cloud. A significant portion of our overall portfolio has software and virtualized offerings that can co-exist with our hardware appliance based options.
Security Experience and Technology. Our SBC technology, deployments and expertise are market leading. Ribbon has been securing service provider and enterprise networks and RTC sessions for over nine years, giving us a strong platform from which to launch additional security offers into the market. We believe our SBC products are unmatched in the market on reliability, performance and functionality at scale.
Media Processing, Transcoding and Signaling Technology Expertise. We have extensive experience in deploying mobile VoLTE and VoWifi solutions. Our voice media transcoding technology that is supported by CPU, GPU or DSP options is industry leading. Our mobile network evolution solutions are deployed in large-scale 4G VoLTE networks supporting over 200 million subscribers in total.
12
Intellectual Property
Intellectual property is fundamental to our business and our success, and we depend upon our ability to develop, maintain and protect our technology. Therefore, we seek to safeguard our investments in technology and rely on a combination of United States and foreign patent, trademark, trade secret and copyright law and contractual restrictions to protect the proprietary aspects of our technology and to defend us against claims from others. Our general policy has been to seek to patent those patentable inventions that we expect to incorporate in our products or that we expect will be valuable otherwise. We have a program to file applications for and obtain patents, copyrights and trademarks in the United States and in specific foreign countries where we believe filing for such protection is appropriate.
As of December 31, 2017, we held patents and had pending patent applications both in the United States and abroad as follows: in the name of Sonus Networks, Inc., 234 United States patents with expiration dates ranging from July 2018 through January 2036, 35 patent applications pending in the Unites States, 47 foreign patents with expiration dates ranging from May 2020 through October 2027, and four patent applications pending abroad; and in the name of GENBAND US LLC, 129 United States patents with expiration dates ranging from February 2017 through March 2025, 70 patent applications pending in the Unites States, 122 foreign patents with expiration dates ranging from June 2019 through October 2027, and 56 patent applications pending abroad.
Furthermore, as of December 31, 2017, we had 48 registered trademarks in the United States, as follows: 25 in the name of GENBAND US LLC, including GENBAND, GENBAND with design, G9, G9 with design, KANDY and BUSINESSCALL; 16 in the name of Sonus Networks, Inc., including SONUS, the SONUS logo, NETASSURE and NETSCORE; three in the name of Network Equipment Technologies, Inc., including PROMINA; and four in the name of Quintum Technologies, LLC, including TENOR. We also had 34 pending trademark applications in the United States as of December 31, 2017, as follows: 33 in the name of Sonus Networks, Inc., including Ribbon and the Ribbon Logo; and one in the name of GENBAND US LLC.
In addition to the protections described above, we seek to safeguard our intellectual property by:
Employing measures to safeguard against the unauthorized use or disclosure of the source and object code for our software, documentation and other written materials, and seeking protection of such materials under copyright and trade secret laws;
Licensing our software pursuant to signed license agreements, which impose restrictions on others' ability to use our software; and
Seeking to limit disclosure of our intellectual property by requiring employees and consultants with access to our proprietary information to execute confidentiality agreements.
We have incorporated third-party licensed technology into certain of our current products. From time to time, we may be required to license additional technology from third parties to develop new products or to enhance existing products. Based on experience and standard industry practice, we believe that licenses to use third-party technology generally can be obtained on commercially reasonable terms. Nonetheless, there can be no assurance that necessary third-party licenses will be available or continue to be available to us on commercially reasonable terms. As a result, the inability to maintain, license or re-license any third-party licenses required in our current products, or to obtain any new third-party licenses to develop new products and enhance existing products could require us to obtain substitute technology of lower quality or performance standards or at greater cost. This could delay or prevent us from making these products or enhancements, any of which could seriously harm our business, financial condition and operating results.
Please see generally the risks that are more fully discussed in Item 1A. “Risk Factors” for risks related to our intellectual property.
Our Customers
We have over 1,000 customers globally. Our customers are located around the world in over 50 countries and include many of the leading global telecommunications service providers and enterprises. Service providers use our products to provide secure RTC for the service providers (in the case of interconnects), enterprises and consumers they serve. Enterprises use our products to provide RTC for their employees (including remote workers) as well as provide secure communications networks for their customer-facing components, such as contact centers.
13
Our global service provider customers include fixed-line, mobile, cable, internet and interconnect service providers. Our Enterprise customers include businesses of all sizes, ranging from SOHO, SMB and large enterprises across various industry verticals with a concentration in the federal government, healthcare and education sectors. We sell to customers via a direct sales team as well as through indirect channels that include VARs, system integrators and service providers. Independent software vendors also partner with Ribbon to source our communications solutions and market them through their sales channels.
In the year ended December 31, 2017, 17% of our revenues were derived from sales to one customer, Verizon Networks, a service provider that provides interconnect, fixed line and mobile communications services. Verizon is transforming its TDM network from a hardware centric network to a SIP and NFV based network, and Ribbon is playing a key role in this transformation. Our top five customers represented approximately 41% of our revenue in the year ended December 31, 2017.
Competitive Conditions
Competition in the telecommunications market is intense. The market is shifting from a market dominated by a few large incumbent telecommunications equipment companies, such as Ericsson LM Telephone Company, Huawei Technologies Co. Ltd., and Nokia Corporation (which recently merged with Alcatel-Lucent S.A.), to a market that is characterized by network virtualization, migration to the cloud, and open interfaces. We believe this shift creates opportunities for us, as well as our direct competitors in telecommunications and networking, which include:
Within the network transformation space: mid-size vendors of networking and telecommunications equipment and specialty vendors, including AudioCodes Ltd., Dialogic Inc., Mavenir Systems, Inc., Metaswitch Networks Corporation, Oracle Communications and ADTRAN, Inc.; and
Within the enterprise and cloud solutions space: Microsoft, 8x8, Inc., Avaya Inc., Bandwidth Inc., Cisco Inc., (with Tropo Inc./Broadsoft, Inc.), F5 Networks, Inc., Mitel Networks Corporation (with ShoreTel, Inc.), Plivo Inc., RingCentral, Inc., Tokbox Inc., Twilio Inc. and Vonage Holdings Corp. (with Nexmo, Inc.).
Other smaller private and public companies are also focusing on similar market opportunities. Mergers among any of the above companies or other competitors, as well as additional competitors with significant financial resources entering our markets, could further intensify competition. Mergers between service providers may also increase competition, as these reduce the number of customers and channels for products and solutions.
To compete effectively, we must deliver innovative products that provide extremely high reliability and quality; deploy and scale easily and efficiently; interoperate with existing network infrastructures and multivendor solutions; provide effective network management; are accompanied by comprehensive customer support and professional services; provide a cost-effective and space-efficient solution for enterprises and service providers; meet price competition from low cost equipment providers; and offer solutions that are timely for the market and support where the industry is heading.
Although we believe we compete favorably because our solutions are widely deployed, highly scalable and cost-effective for our customers, some of our competitors have broader product portfolios than we have and are able to devote greater resources to the development, promotion, sale and support of their products. In addition, some of our competitors have more extensive customer bases and broader customer relationships than we have, including relationships with our potential customers and established relationships with distribution partners.
Sales and Marketing
We sell our products, solutions and services to our customers with a direct internal sales force and also indirectly via channels and partnerships globally, leveraging the assistance of VARs such as Verizon Communications Inc. and distributors such as Westcon Group Inc, BlackBox and Arrow S3. Our channel partner programs are designed to serve particular markets and provide our customers with opportunities to purchase our products in combination with related services and products. For example, Ribbon is a Microsoft Gold Communications Partner and helps enterprises optimize Skype for Business (and Teams) deployments by securing those communications.
As a primary supplier of network infrastructure solutions to Tier 1 service providers (a service provider that can reach every other network on the Internet without purchasing IP transit), we require a strong worldwide presence. We have an established sales presence throughout North America, Europe, Asia/Pacific, the Middle East, Africa and Central/South America. We also have a dedicated direct sales team focused on the Federal Government sector in the United States.
14
Our marketing team is focused on promoting company brand awareness, increasing our solutions, product, technology and services differentiation and awareness via webinars, company web sites, advertising and digital outreach, as well as generating qualified sales leads. We promote thought leadership on technology and our solutions within the industry by participating in and speaking at industry events and conferences and via social network campaigns and blogs. Our marketing team also provides briefings to industry analysts on a regular basis and at major industry events, communicates with the media in connection with noteworthy public announcements and supports our investor relations department on quarterly conference calls and regular investor updates.
Manufacturing
Our contract manufacturers provide comprehensive manufacturing services, including assembly and testing of our hardware products and procurement of component materials on our behalf. We believe that outsourcing the manufacturing of our hardware products enables us to preserve working capital, allows for greater flexibility in meeting changes in demand and enables us to be more responsive in delivering diverse product offerings to our customers. As of December 31, 2017, we outsourced the manufacturing of our hardware products to four manufacturers, two of which we primarily rely upon. We and our contract manufacturers purchase several key components of our hardware products, including commercial digital signal processors, from single or limited sources. We purchase these components on a purchase order basis.
Please see generally the risks that are more fully discussed in Item 1A. “Risk Factors” for risks related to our manufacturing operations and use of contract manufacturers.
Research and Development
We believe that strong product development capabilities are essential to our strategy of enhancing our core technology, developing additional security and network modernization features and maintaining comprehensive product and service offerings. Our research and development process leverages innovative technology in response to market data and customer feedback. As part of this process, we regularly review research and development investments in our products and balance them against market demand.
We have assembled a team of highly skilled engineers with significant transcoding, UC application and networking industry experience. Our engineers have deep experience in and with leading wireline and wireless telecommunications equipment suppliers, computer data networking and multimedia companies. Our engineering effort is focused on UC, NFV and security product development. We also continue to invest in Kandy.
As of December 31, 2017, we maintained research and development offices in Massachusetts, California, Illinois, Texas, New York, New Jersey and North Carolina, United States; Kanata, Montreal and Ontario, Canada; Bangalore, India and Swindon, United Kingdom.
We have made, and intend to continue to make, a substantial investment in research and development. Our research and development expenses were $101.5 million for the year ended December 2017, $72.8 million for the year ended December 31, 2016, and $77.9 million for the year ended December 31, 2015. The increase in research and development expenses from 2016 to 2017 is primarily due to the inclusion of GENBAND’s research and development expenses from October 27, 2017 to December 31, 2017 in our consolidated results of operations for 2017.
Seasonality
We have experienced quarterly fluctuations in customer activity due to seasonal considerations. We typically experience increases in order volume in the fourth quarter due to greater spending on operating and capital expenditures by our service provider customers. We typically experience reductions in order volume toward the beginning of the calendar year, when our service provider customers are finalizing their annual budgets, which may result in lower revenues in the first quarter. These seasonal effects may vary and do not always correlate to our operating results. Accordingly, they should not be considered a reliable indicator of our future operating results.
Backlog
We sell products and services pursuant to purchase orders issued under master agreements that provide standard terms and conditions that govern the general commercial terms and conditions of the sale. These agreements typically do not obligate customers to purchase any minimum or guaranteed quantities, nor do they generally require upfront cash deposits. At any given time, we have orders for products that have not yet been shipped and for services (including our customer support obligations)
15
that have not yet been performed. We also have orders relating to products that have been delivered and services that have been performed but have not yet been accepted by the customer under the applicable purchase terms. We include both of these situations in our calculation of backlog. A backlogged order may not result in revenue in the quarter in which it was booked, and the actual revenue recognized in a quarter may not equal the total amount of related backlog. In addition, although we believe that the backlog orders are firm, purchase orders may be canceled by the customer prior to shipment without significant penalty. Therefore, we do not believe that our backlog, as of any particular date, is necessarily indicative of actual revenue for any future period. In addition, we expect to derive a greater percentage of our revenue in the future from the enterprise market and through sales channels where speed of fulfillment is essential to winning business. Consequently, we expect to derive a lower percentage of our business from large service provider orders that are delivered over multiple quarters and years and we expect our backlog to decrease as a result. Our backlog was approximately $400 million at December 31, 2017 and approximately $123 million at December 31, 2016.
Our Employees
At December 31, 2017, we had a total of 2,457 employees, comprised of 1,605 employees located in the Americas, 310 employees located in the Middle East, Africa and Europe and 542 employees located in the Asia Pacific region. Certain of our employees are represented by collective bargaining agreements, primarily in Europe. We believe our relations with our employees are good.
Geographic and Segment Information
We operate in a single segment. Operating segments are identified as components of an enterprise about which separate discrete financial information is available for evaluation by the chief operating decision maker in making decisions regarding resource allocation and assessing performance. To date, our chief operating decision maker has made such decisions and assessed performance at the company level, as one segment. Our chief operating decision maker is our President and Chief Executive Officer.
Our classification of revenue by geographic area is determined by the ship-to location of our customers. The following table summarizes revenue by geographic area as a percentage of total revenue:
Year ended December 31, | ||||||||
2017 | 2016 | 2015 | ||||||
United States | 66 | % | 69 | % | 71 | % | ||
Europe, Middle East and Africa | 14 | 13 | 13 | |||||
Japan | 7 | 10 | 10 | |||||
Other Asia Pacific | 7 | 5 | 4 | |||||
Other | 6 | 3 | 2 | |||||
100 | % | 100 | % | 100 | % | |||
Information regarding the geographic components of our property and equipment is provided in Note 8 of the Notes to Consolidated Financial Statements included in this Annual Report on Form 10-K.
Our Company History
We were organized as a Delaware corporation on May 19, 2017, initially under the name Solstice Sapphire Investments, Inc., for the purpose of effecting the merger of Sonus and GENBAND. The Merger occurred on October 27, 2017. Upon completion of the Merger, Sonus and GENBAND became wholly-owned subsidiaries of Solstice Sapphire Investments, Inc., which concurrently changed its name to Sonus Networks, Inc. On November 28, 2017, Sonus Networks, Inc. changed its name to Ribbon Communications Inc. Ribbon succeeded to and continues to operate, directly or indirectly, the then existing businesses of Sonus and GENBAND.
Additional Information
This Annual Report on Form 10-K, as well as all other reports filed with or furnished to the United States Securities and Exchange Commission (the “SEC”), are available free of charge through our Internet site (http://www.ribboncommunications.com) as soon as reasonably practicable after we electronically file such material with, or furnish it to, the SEC.
16
Item 1A. Risk Factors
Our business faces significant risks and uncertainties. Certain important factors may have a material adverse effect on our business prospects, financial condition and results of operations, and they should be carefully considered. Accordingly, in evaluating our business, we encourage you to consider the following discussion of risk factors in its entirety in addition to other information contained in or incorporated by reference into this Annual Report on Form 10-K and our other public filings with the Securities and Exchange Commission (“SEC”). Other events that we do not currently anticipate or that we currently deem immaterial may also affect our business, prospects, financial condition and results of operations.
Risks Related to the Sonus-GENBAND Merger
The anticipated benefits and cost savings of our recent merger may not be realized, which could have a material adverse effect on our results of operations and financial condition.
Effective October 27, 2017, we completed the merger (the “Merger”) of Sonus Networks, Inc. (“Sonus”), GENBAND Holdings Company, GENBAND, Inc., and GENBAND II, Inc. (collectively, “GENBAND”).
The success of the Merger, including anticipated benefits and cost savings, will depend, in part, on our ability to successfully combine and integrate the businesses of Sonus and GENBAND, including processes, policies, procedures, operations, technologies and systems. It is possible that the integration process could result in the loss of key employees, higher than expected costs, diversion of management attention, the disruption of our ongoing businesses or inconsistencies in standards, controls, procedures and policies that adversely affect the combined company’s ability to maintain relationships with customers, vendors and employees or to achieve the anticipated benefits and cost savings of the Merger. If we experience difficulties with the integration process, or are unable to successfully combine the businesses of Sonus and GENBAND in an efficient and effective manner, the anticipated benefits and cost savings of the Merger may not be realized fully or at all, or may take longer to realize than anticipated. As part of the integration process, we may also attempt to divest certain assets of the combined company, which may not be possible on favorable terms, or at all, or if successful, may change the profile of the combined company. An inability to realize the full extent of the anticipated benefits of the Merger, as well as any delays encountered in the integration process, could have an adverse effect upon our revenues, level of expenses and operating results, which may adversely affect the value of our common stock.
In addition, Sonus and GENBAND incurred, and we expect to continue to incur, significant costs in connection with consummating the Merger and integrating the operations of the two companies. These include non-recurring transaction fees, including legal, regulatory and other costs associated with closing the transaction, as well as expenses relating to formulating and implementing integration plans, including facilities and systems consolidation costs and employment-related costs. We may incur additional and unforeseen expenses during the integration process. Payment of these costs and expenses may adversely affect our liquidity, and the actual cost savings of the Merger could be less than expected and may take longer to achieve than anticipated, or may not be realized at all.
Third parties may terminate or alter existing contracts or relationships with us.
Third parties, including customers, suppliers, vendors, landlords, licensors and other business partners, with whom either, or both, Sonus and GENBAND had relationships, may terminate or otherwise reduce the scope of their relationship with us because of the Merger. Any such disruptions could cause us to suffer a loss of potential future revenues and/or lose rights that are material to our business.
We entered into a stockholders’ agreement with certain GENBAND stockholders in connection with the consummation of the Merger, which provided them with certain rights that may differ from the rights of our other stockholders.
On October 27, 2017, in connection with the consummation of the Merger, we entered into a principal stockholders’ agreement (the “Stockholders Agreement”) with Heritage PE (OEP) II, L.P. and Heritage PE (OEP) III, L.P. (the “OEP Stockholders”), principal stockholders of GENBAND prior to the Merger. The Stockholders Agreement sets forth certain arrangements and contains various provisions relating to board representation, standstill restrictions and transfer restrictions as further described therein, including the right of the OEP Stockholders to designate up to five directors for nomination to our nine-member board of directors, subject to the OEP Stockholders maintaining certain levels of beneficial ownership of our common stock. Therefore, the OEP Stockholders will be able to exert significant influence over matters requiring board approval, and our stockholders other than the OEP Stockholders will have limited or no ability to influence the outcome of certain key
17
transactions. The interests of the parties to the Stockholders Agreement may differ from those of other holders of our common stock.
Risks Related to our Business and Industry
Our quarterly revenue and operating results are unpredictable and may fluctuate significantly from quarter to quarter, which could adversely affect our business, results of operations and the trading price of our common stock.
Our revenues and operating results may vary significantly from quarter to quarter due to a number of factors, many of which are outside of our control and any of which may cause our stock price to fluctuate. The primary factors that may affect our revenues and operating results include, but are not limited to, the following:
• | consolidation within the telecommunications industry, including acquisitions of or by our customers; |
• | general economic conditions in our markets, both domestic and international, as well as the level of discretionary IT spending; |
• | competitive conditions in our markets, including the effects of new entrants, consolidation, technological innovation and substantial price discounting; |
• | fluctuation in demand for our products and services, and the timing and size of customer orders; |
• | fluctuations in foreign exchange rates; |
• | cancellation or deferral of existing customer orders or the renegotiation of existing contractual commitments; |
• | mix of product configurations sold; |
• | length and variability of the sales cycle for our products; |
• | application of complex revenue recognition accounting rules to our customer arrangements; |
• | timing of revenue recognition; |
• | changes in our pricing policies, the pricing policies of our competitors and the prices of the components of our products; |
• | market acceptance of new products, product enhancements and services that we offer; |
• | the quality and level of our execution of our business strategy and operating plan, and the effectiveness of our sales and marketing programs; |
• | new product announcements, introductions and enhancements by us or our competitors, which could result in deferrals of customer orders; |
• | our ability to develop, introduce, ship and successfully deliver new products and product enhancements that meet customer requirements in a timely manner; |
• | our reliance on contract manufacturers for the production and shipment of our hardware products; |
• | our or our contract manufacturers' ability to obtain sufficient supplies of sole or limited source components or materials; |
• | our ability to attain and maintain production volumes and quality levels for our products; |
• | variability and unpredictability in the rate of growth in the markets in which we compete; |
• | costs related to mergers, acquisitions and divestitures; and |
• | corporate restructurings. |
Equipment purchases by communications service providers and enterprises continue to be unpredictable. As with other telecommunications product suppliers, we typically recognize a portion of our revenue in a given quarter from sales booked and shipped in the last weeks of that quarter. As a result, delays in customer orders may result in delays in shipments and recognition of revenue beyond the end of a given quarter. Additionally, we rely on the revenues provided by certain large customers. It can be difficult for us to predict the timing of receipt of major customer orders, and we are unable to control their timing decisions. In the past, we have experienced significant variability in the spending patterns and purchasing practices of our large customers on a quarterly and annual basis, and we expect that this variability will continue. Consequently, our quarterly operating results are difficult to predict even in the short term and a delay in an anticipated sale past the end of a particular quarter may negatively impact our results of operations for that quarter, or in some cases, that year. Therefore, we believe that quarter-to-quarter comparisons of our operating results are not a good indication of our future performance. If our revenue or operating results fall below the expectations of investors or securities analysts or below any guidance we may provide to the market, the price of our common stock could decline substantially. Such a stock price decline could also occur even if we meet our publicly stated revenue and/or earnings guidance.
A significant portion of our operating expenses is fixed in the short term. If revenues for a particular quarter are below expectations, we may not be able to reduce costs and expenses proportionally for that quarter. Any such revenue shortfall would, therefore, have a significant effect on our operating results for that quarter.
18
We have incurred net losses and may incur additional net losses.
We incurred net losses in fiscal years 2017, 2016 and 2015. We may incur additional net losses in future quarters and years. Our revenues may not grow, and we may never generate sufficient revenues to sustain profitability. Any failure by us to achieve, sustain or increase profitability on a consistent basis could cause the value of our common stock to decline.
If we fail to compete successfully against telecommunications equipment and networking companies, our ability to increase our revenues and achieve profitability will be impaired.
Competition in the telecommunications market is intense. The market is shifting from a market dominated by a few large incumbent telecommunications equipment companies, such as Ericsson LM Telephone Company, Huawei Technologies Co. Ltd., and Nokia Corporation (which recently merged with Alcatel-Lucent S.A.), to a market that is characterized by network virtualization, migration to the cloud, and open interfaces. We believe this shift creates opportunities for us, as well as our direct competitors in telecommunications and networking, including:
• | Within the network transformation space, mid-size vendors of networking and telecommunications equipment and specialty vendors, including AudioCodes Ltd., Dialogic Inc., Mavenir Systems, Inc., Metaswitch Networks Corporation, Oracle Corporation (Session Border Controller) and ADTRAN, Inc.; and |
• | Within the enterprise and cloud solutions space, 8x8, Inc., Avaya Inc., Bandwidth Inc., Cisco Inc., (with Tropo Inc./Broadsoft, Inc.), F5 Networks, Inc., Mitel Networks Corporation, Plivo Inc., RingCentral, Inc., Tokbox Inc., Twilio Inc. and Vonage Holdings Corp. (Nexmo, Inc.). |
Mergers among any of these or other competitors could strengthen their ability to compete against us, and additional competitors with significant financial resources entering our markets could further intensify competition.
Many of our current and potential competitors have significantly greater selling and marketing, technical, manufacturing, financial and other resources than we have. Further, some of our competitors sell significant amounts of other products to our current and prospective customers and have the ability to offer lower prices to win business. Our competitors' broad product portfolios, coupled with already existing relationships, may cause our customers to buy our competitors' products or harm our ability to attract new customers.
To compete effectively, we must deliver innovative products that:
• | provide extremely high reliability and quality; |
• | deploy and scale easily and efficiently; |
• | interoperate with existing network infrastructures and multivendor solutions; |
• | provide effective network management; |
• | are accompanied by comprehensive customer support and professional services; |
• | provide a cost-effective and space-efficient solution for enterprises and service providers; |
• | meet price competition from low cost equipment providers; and |
• | offer solutions that are timely for the market and support where the industry is heading. |
If we are unable to compete successfully against our current and future competitors, we could experience price reductions, order cancellations and loss of customers and revenues, and our operating results could be adversely affected.
We will not be successful if we do not grow our customer base or if we are unable to generate recurring business from our existing customers.
We rely on certain key customers, and our future success will depend on our ability to generate recurring business from our existing customers and to attract additional customers beyond our current customer base. One customer, Verizon, contributed 17% of our revenue in 2017, and one customer, AT&T, contributed 12% of our revenue in 2016 and 13% of our revenue in 2015. In addition, for the year ended December 31, 2017, our top five customers contributed approximately 41% of our revenue. Factors that may affect our ability to grow our customer base include but are not limited to the following:
• | economic conditions that discourage potential new customers from making the capital investments required to adopt new technologies; |
• | deterioration in the general financial condition of service providers and enterprises, or their ability to raise capital or access lending sources; |
• | new product introductions by our competitors; and |
19
• | the development of our channel partner program. |
Due to the nature of certain of our product offerings, the per-order revenue from orders placed by the majority of our new customers is generally lower than the per-order revenue generated from our historical customer orders. If we are unable to expand our customer base, we will be forced to rely on generating recurring revenue from existing customers, which may not be successful. We expect that, for the foreseeable future, the majority of our revenue will continue to depend on sales of our products to a limited number of existing customers or sales to customers with lower per-order revenue than those generated from our historical sales. Factors that may affect our ability to generate recurring revenues from our existing customers include but are not limited to the following:
• | customer willingness to implement our products; |
• | pricing pressures due to the commoditization of our products; |
• | the timing of industry transitions to new network technologies; |
• | acquisitions of or by our customers; |
• | delays or difficulties that we may incur in completing the development and introduction of our planned products or product enhancements; |
• | failure of our products to perform as expected; and |
• | difficulties we may incur in meeting customers' delivery requirements or with software development, hardware design, manufacturing or marketing of our products and/or services. |
The loss of any significant customer, or any substantial reduction in purchase orders or deferral of purchasing decisions from these customers, could materially adversely affect our results of operations and financial condition.
Consolidation in the telecommunications industry could harm our business.
The telecommunications industry, including many of our customers, has experienced consolidation, including, in the carrier space:
• | the pending acquisition of Hawaiian Telecom, Inc. by Cincinnati Bell Inc. (announced in July 2017); |
• | the acquisition of Level 3 Communications Inc. by CenturyLink Inc. in November 2017; |
• | the acquisition of XO Communications, LLC by Verizon Communications Inc. in February 2017; and |
• | the acquisition of Time Warner Cable Inc. and Bright House Networks, LLC by Charter Communications, Inc. in May 2016. |
Further, consolidation has occurred in the vendor space, including:
• | the pending acquisition of Spoken Communications Inc. by Avaya Holdings Corp. (announced in January 2018); |
• | the acquisition of Broadsoft, Inc. by Cisco Systems, Inc. in February 2018; |
• | the acquisition of ShoreTel Inc. by Mitel Networks Corporation in September 2017; |
• | the combination of Mitel Mobility, Inc., Xura, Inc. and Ranzure Networks, Inc, and re-branding as Mavenir Systems, Inc., by Siris Capital Group LLC, a private equity investment firm, in December 2016; |
• | the acquisition of Alcatel-Lucent S.A. by Nokia Corporation in November 2016; |
• | the acquisition of Polycom, Inc. by Siris Capital Group LLC, in September 2016; |
• | the acquisition of Nexmo, Inc. by Vonage Holdings Corp. in June 2016; |
• | the acquisition of Tropo Inc. by Cisco Systems, Inc. in May 2015; |
• | the acquisition of Aruba Networks, Inc. by HP Inc. in May 2015; |
• | the acquisition of Riverbed Technology, Inc. by Thoma Bravo, LLC, a private equity investment firm, in April 2015; |
• | the acquisition of Dialogic Inc. by Novacap TMT IV, L.P. in 2014; and |
• | the acquisitions of Acme Packet, Inc. and Tekelec, Inc. by Oracle Corporation in 2013. |
We expect this trend to continue. Consolidation among our customers may cause delays or reductions in capital expenditure plans by such customers and/or increased competitive pricing pressures as the number of available customers declines and the relative bargaining power of customers increases in relation to suppliers. Any of these factors could materially adversely affect our business.
Restructuring activities could adversely affect our ability to execute our business strategy.
We recorded net restructuring expense of $14.3 million in the aggregate in 2017, 2016 and 2015, comprised of $15.2 million for severance and related costs, less $0.9 million of net reversals related to certain facilities. We expect to record approximately $12 million of additional restructuring expense in 2018.
20
Our current restructuring and any future restructuring, should it become necessary for us to continue to restructure our business due to worldwide market conditions or other factors that reduce the demand for our products and services, could adversely affect our ability to execute our business strategy in a number of ways, including through:
• | loss of key employees; |
• | diversion of management's attention from normal daily operations of the business; |
• | diminished ability to respond to customer requirements related to both products and services; |
• | decrease in cash and profits related to severance payments and facility termination costs; |
• | disruption of our engineering and manufacturing processes, which could adversely affect our ability to introduce new products and to deliver products both on a timely basis and in accordance with the highest quality standards; and/or |
• | reduced ability to execute effectively internal administrative processes, including the implementation of key information technology programs. |
There can be no assurance that any restructuring actions we have taken in the past, or may take in the future, will improve our financial condition or results of operations.
We are exposed to the credit risk of some of our customers and to credit exposures in fragile financial markets, which could result in material losses.
Due to our reliance on significant customers, we are dependent on the continued financial strength of our customers. If one or more of our significant customers experience financial difficulties, it could result in uncollectable accounts receivable and our loss of significant customers and anticipated revenue.
Most of our sales are on an open credit basis, with typical payment terms of 30 to 90 days. We evaluate and monitor individual customer payment capability in granting such open credit arrangements, seeking to limit such open credit to amounts we believe our customers can pay and maintain reserves that we believe are adequate to cover exposure to doubtful accounts. However, there can be no assurance that our open credit customers will pay the amounts they owe to us or that the reserves we maintain will be adequate to cover such credit exposure. Our sales derived through our distributors, in particular, represent sources of increased credit risk as distributors tend to have more limited financial resources than other resellers and end-user customers.
Our customers' failure to pay and/or our failure to maintain sufficient reserves could have a material adverse effect on our results of operations and financial condition. Additionally, in the event that turmoil in the credit markets makes it more difficult for some customers to obtain financing, those customers' ability to pay could be adversely impacted, which in turn could have a material adverse impact on our business, results of operations and financial condition.
Disruptions to, or our failure to effectively develop relationships with and manage, distributors, resellers, system integrators and other channel partners, and the processes and procedures that support them, could adversely affect our ability to generate revenues from the sale of our products and services.
We continue to enhance our sales strategy, which we expect will include more partner sales engagements to resell our products and services through authorized distributors, value-added resellers (“VARs”), system integrators and other channel partners. Our future success is dependent upon establishing and maintaining successful relationships with a variety of distributors, VARs, system integrators and other channel partners. We may also need to pursue strategic partnerships with vendors that have broader technology or product offerings in order to compete with end-to-end solution providers. In addition, many of the enterprise markets we are pursuing require a broad network of resale partners in order to achieve effective distribution.
Many of our distribution and channel partners sell competitive products and services, and the loss of, or reduction in sales by, these partners could materially reduce our revenues. Our sales through channel partners typically involve the use of our products as components of a larger solution being implemented by systems integrators. In these instances, the purchase and sale of our products are dependent on the channel partners, who typically control the timing, prioritization and implementation of projects. Project delays, changes in priority or solution re-design decisions by the systems integrator can adversely affect our product sales. If we fail to maintain relationships with our distribution, VAR and systems integration partners, fail to develop new relationships with other partners in new markets, fail to manage, train or provide incentives to our existing partners effectively, or if these partners are not successful in their sales efforts, sales of our products and services may decrease and our operating results could suffer. Moreover, if we do not have adequate personnel, experience and resources to manage the relationships with our partners and to fulfill our responsibilities under such arrangements, any such shortcomings could have a material adverse impact on our business and results of operations.
21
In addition, we recognize some of our revenue based on a drop-ship model using information provided by our partners. If those partners provide us with inaccurate or untimely information, the amount or timing of our revenues could be adversely affected. We may also be impacted by financial failure of our partners, which could result in our inability to collect accounts receivable in full, and thereby materially adversely affect our results of operations and financial condition.
If our strategic plan, including our research and development of innovative new products and the improvement of existing products, is not aligned with our customers’ investments in the evolution of their networks, or if our products and services do not meet customers’ demands, customers may not buy our products or use our services.
Success in our industry requires large investments in technology and creates exposure to rapid technological and market changes. We spend a significant amount of time, money and resources both developing new technology, products and solutions and acquiring new businesses or business assets. Our strategic plan includes a significant shift in our investments from mature technologies that previously generated significant revenue for us toward certain next-generation technologies, as well as working with channel partners to sell our products. Our choices of specific technologies to pursue, and those to de-emphasize, may prove to be inconsistent with our customers' investment spending. Moreover, if we invest in the development of technologies, products and solutions that do not function as expected, are not adopted by the industry, are not ready in time, are not accepted by our customers as quickly as anticipated or at all, mature more quickly than we anticipated or are not successful in the marketplace, our sales and earnings may suffer and, as a result, our stock price could decline.
In order for us to be successful, our technologies, products and solutions must be accepted by relevant standardization bodies and by the industry as a whole. To achieve market acceptance for our products, we must effectively anticipate, and adapt in a timely manner to, customer requirements and offer products and services that meet changing customer demands. Prospective customers may require product features and capabilities that our current products do not have. The introduction of new or enhanced products also requires that we carefully manage the transition from older products in order to minimize disruption in customer ordering patterns and ensure that adequate supplies of new products can be delivered to meet anticipated customer demand. If we fail to develop products and offer services that satisfy customer requirements or if we fail to effectively manage the transition from older products, our ability to create or increase demand for our products and services could be seriously harmed, we may lose current and prospective customers and our results of operations and financial condition could be materially adversely affected.
If our products do not interoperate with our customers' existing networks, we may not retain current customers or attract new customers.
Many of our customers will require that our products be designed to interface with their existing networks, each of which may have different specifications. Issues caused by an unanticipated lack of interoperability may result in significant warranty, support and repair costs, divert the attention of our engineering personnel from our hardware and software development efforts and cause significant customer relations problems. If our products do not interoperate with those of our customers' networks, installations could be delayed or orders for our products could be canceled, which would seriously harm our gross margins and result in loss of revenues or customers.
We believe the telecommunications industry is in the early stages of a major architectural shift to the virtualization of networks. If the architectural shift does not occur, if it does not occur at the pace we predict, or if the products and services we have developed are not attractive to our customers after such shift takes place, our revenues could decline.
We believe the telecommunications industry is in the early stages of transitioning to the virtualization of networks, and we are developing products and services that we believe will be attractive to our customers and potential customers who make that shift. While we anticipate that the industry shift to a software-centric cloud-based architecture is likely to happen, fundamental changes like this often take time to accelerate. In addition, our customers may adapt to such changes at varying rates. As our customers take time to determine their future network architectures, we may encounter delayed timing of orders, deferred purchasing decisions and reduced expenditures by our customers. These longer decision cycles and reduced expenditures may negatively impact our revenues or make it difficult for us to accurately predict our revenues, either of which could materially adversely affect our results of operations and cause our stock price to decline.
Virtualization of our product portfolio could slow our revenue growth.
Virtualization of our product portfolio could slow our revenue growth as we move away from hardware products and increasingly focus on software-based products. Historically, we have produced highly complex products that incorporate hardware with embedded software components. As we virtualize our product portfolio, we expect our margins to improve due
22
to decreased costs tied to production and sales of our hardware products, including costs related to our reliance on third-party contract manufacturers, interruptions or delays in the supply of hardware components from such third-party sources, and existing hardware support services. While we expect our margins to improve as a result of such reductions in cost, our revenues may decline as a result of the decreases in sales of hardware products, many of which have generated higher revenue on a per-unit basis than certain of our software products.
If the market for our voice infrastructure products continues to significantly decline and if our Security and Application products sales to not accelerate as quickly as we anticipate, our operating results could suffer.
In 2017, the macro-environment for our media gateway trunking and softswitch business continued to face significant declining revenues. Our customers are consolidating, which is both delaying and curtailing their capital spending. Even though we continue to transform our company from a media gateway trunking business to a Security and Applications Business (comprised of Session Border Controllers, Kandy and Unified Communications servers), a portion of our current revenue remains dependent upon the commercial success of our voice infrastructure products, which we believe will also remain true for the foreseeable future. If the market for these products declines more than anticipated and if our Security and Application products sales to not accelerate as quickly as we anticipate, our operating results could suffer.
The market for some of our products depends on the availability and demand for other vendors' products.
Some of our products, particularly those addressing the Unified Communications market, are designed to function with other vendors' products. In these cases, demand for our products is dependent upon the availability, demand for, and sales of the other vendors' products, as well as the degree to which our products successfully interoperate with the other vendors' products and add value to the solution being provided to the customer. If the other vendors change the design of their products, delay the issuance of new releases, fail to adequately market their products, or are otherwise unsuccessful in building a market for their products, the demand for our products will be adversely affected, which could adversely affect our business, results of operations and financial condition.
Failure by our strategic partners or by us in integrating products provided by our strategic partners could harm our business.
Our solutions include the integration of products supplied by strategic partners, who offer complementary products and services. We rely on these strategic partners in the timely and successful deployment of our solutions to our customers. If the products provided by these partners have defects or do not operate as expected, if the services provided by these partners are not completed in a timely manner, if our partners have organizational or supply issues, or if we do not effectively integrate and support products supplied by these strategic partners, then we may have difficulty with the deployment of our solutions that may result in:
• | loss of, or delay in, revenues; |
• | increased service, support and warranty costs and a diversion of development resources; and |
• | network performance penalties. |
In addition to cooperating with our strategic partners on specific customer projects, we also may compete in some areas with these same partners. If these strategic partners fail to perform or choose not to cooperate with us on certain projects, in addition to the effects described above, we could experience:
• | loss of customers and market share; and |
• | failure to attract new customers or achieve market acceptance for our products. |
Our large customers have substantial negotiating leverage, and they may require that we agree to terms and conditions that may have an adverse effect on our business.
Large communications service providers have substantial purchasing power and leverage in negotiating contractual arrangements with us. These customers may, among other things, require us to develop additional features, require penalties for failure to deliver such features, require us to partner with a certain reseller before purchasing our products and/or seek discounted product and/or service pricing. As we sell more products to this class of customer, we may be required to agree to terms and conditions that are less favorable to us, which may affect the timing of revenue recognition, amount of deferred revenues or product and service margins and may adversely affect our financial position and cash flows in certain reporting periods.
23
We depend upon contract manufacturers. If our contract manufacturers fail to perform, or if we change or consolidate manufacturers, we may fail to meet the demands of our customers and damage our customer relationships, which could materially adversely affect our business.
While we currently work with four contract manufacturers, we primarily rely upon two large global manufacturers to assemble our products according to our specifications and to fulfill orders on a timely basis. Reliance on a third-party manufacturer involves a number of risks, including a lack of control over the manufacturing process, inventory management and the potential absence or unavailability of adequate capacity. As we do not have the internal manufacturing capabilities to meet our customers' demands, any difficulties or failures to perform by our contract manufacturers could cause delays in customer product shipments, which could negatively affect our relationships with customers and result in delayed revenues.
In addition, any future changes to or consolidations of our current contract manufacturers could lead to material shortages or delays in the supply of our products. Qualifying a new contract manufacturer to commence commercial scale production or consolidating to a reduced number of contract manufacturers are expensive and time-consuming activities and could result in a significant delay in the supply of our products, which could negatively affect our relationships with customers and result in delayed revenues.
We and our contract manufacturers rely on single or limited sources for supply of some components of our products and if we fail to adequately predict our manufacturing requirements or if our supply of any of these components is disrupted, we will be unable to ship our products in a timely manner, or at all.
We and our contract manufacturers currently purchase several key components of our products, including commercial digital signal processors, from single or limited sources. Depending upon the component, there may or may not be alternative sources of substitutes. We purchase these components on a purchase order basis. If we overestimate our component and finished goods requirements, we could have excess inventory, which would increase our costs. If we underestimate our requirements, we may not have an adequate supply, which could interrupt manufacturing of our products and result in delays in shipments and revenues. Additionally, if any of our contract manufacturers underestimates our requirements, it may not have an adequate supply, which could interrupt manufacturing of our products and result in delays in shipments and revenues. If any of our sole or limited source suppliers experiences capacity constraints, work stoppages or other reductions or disruptions in output, it may not be able to meet, or may choose not to meet, our delivery schedules. Moreover, we have agreed to compensate our contract manufacturers in the event of termination or cancellation of orders, discontinuance of product or excess material.
We currently do not have long-term supply contracts with our component suppliers and they are not required to supply us with components for any specified periods, in any specified quantities or at any set price, except as may be specified in a particular purchase order. In the event of a disruption or delay in supply or our inability to obtain components, we may not be able to develop an alternate source in a timely manner or at favorable prices, or at all. While we regularly monitor our inventory of supplies, a failure to find acceptable alternative sources could hurt our ability to deliver high-quality products to our customers and negatively affect our operating margins.
Reliance on our suppliers exposes us to potential supplier production difficulties, quality variations and unforeseen price increases. Our customers rely upon our ability to meet committed delivery dates, and any disruption in the supply of key components would seriously adversely affect our ability to meet these dates and could result in loss of customers, harm to our ability to attract new customers, or legal action by our customers. Defense-expedite rated orders from the U.S. federal government, which by law receive priority, can also interrupt scheduled shipments to our other customers. Additionally, any unforeseen increases in the prices of components could reduce our profitability or force us to increase our prices, which could result in a loss of customers or harm our ability to attract new customers and could have a material adverse effect on our results of operations.
Our customer contracts also generally allow customers to reschedule delivery dates or cancel orders within certain time frames before shipment without penalty and outside those times frames with a penalty. Because of these and other factors, there are risks of excess or inadequate inventory that could negatively affect our expenses and results of operations.
If we are unable to obtain necessary licenses or on-going maintenance and support of third-party technology at acceptable prices, on acceptable terms, or at all, it could harm our operating results or business.
We have incorporated third-party licensed technology, including open source software, into our current products. From time to time, we may be required to license additional technology from third parties to develop new products or product enhancements. Third-party licenses and on-going maintenance and support may not be available or continue to be available to us on commercially reasonable terms or may be available to us but only at significantly escalated pricing. Additionally, we may not
24
be able to replace the functionality provided by third-party software currently offered with our products if that software becomes obsolete, defective or incompatible with future versions of our products or is not adequately maintained or updated. If we are unable to maintain or re-license any third-party licenses required in our current products or obtain any new third-party licenses to develop new products and product enhancements, or in the case of any defects in these third-party software products, we could be required to obtain substitute technology of lower quality or performance standards or at greater cost, and we may be delayed or prevented from making these products or enhancements, any of which could seriously harm our sales and the competitiveness of our products unless and until we can secure an alternative source. Such alternate sources may not provide us with the same functionality as that currently provided to us.
The hardware products that we purchase from our third-party vendors have life cycles, and some of those products have reached the end of their life cycles. If we are unable to correctly estimate future requirements for these products, it could harm our operating results or business.
Some of the hardware products that we purchase from our third-party vendors have reached the end of their life cycles. It may be difficult for us to maintain appropriate levels of the discontinued hardware to adequately ensure that we do not have a shortage or surplus of inventory of these products. If we do not correctly forecast the demand for such hardware, we could have excess inventory and may need to write off the costs related to such purchases. The write-off of surplus inventory could materially adversely affect our operating results. However, if we underestimate our forecast and our customers place orders to purchase more products than are available, we may not have sufficient inventory to support their needs. If we are unable to provide our customers with enough of these products, it could make it difficult to retain certain customers, which could have a material and adverse effect on our business.
Because our larger scale products are sophisticated and designed to be deployed in complex networks around the world, they may have errors or defects that we find only after full deployment. These defects, and any failure to establish a support infrastructure and maintain required support levels, could seriously harm our business.
Our larger scale products are sophisticated and are designed to be deployed in large and complex networks around the world. Because of the nature of our products, they can only be fully tested when substantially deployed in these networks. Some of our customers may discover errors or defects in the software or hardware, or the products may not operate as expected only after full deployment. As we continue to expand our distribution channel through distributors and resellers, we will need to rely on and support their service and support organizations. If we are unable to fix errors or other performance problems that may be identified after full deployment of our products, we could experience:
• | loss of, or delay in, revenues or increased expense; |
• | loss of customers and market share; |
• | failure to attract new customers or achieve market acceptance for our products; |
• | increased service, support and warranty costs and a diversion of development resources; and/or |
• | costly and time-consuming legal actions by our customers. |
Our customers expect us to establish a support infrastructure and maintain demanding support standards to ensure that their networks maintain high levels of availability and performance. To continue to support our customers with these larger scale products, our support organization will need to provide service and support at a high level throughout the world. If we are unable to provide the expected level of support and service to our customers, we could experience:
• | loss of customers and market share; |
• | failure to attract new customers in new markets and geographies; |
• | increased service, support and warranty costs and a diversion of development resources; and/or |
• | network performance penalties. |
Any errors or defects in our products, and any failure to establish a support infrastructure and maintain required support levels, could materially adversely affect our business and results of operations.
Disruptions to, or our failure to effectively develop, manage and maintain our government customer relationships could adversely affect our ability to generate revenue from the sales of our products to these customers. Further, such government sales are subject to potential delays and cutbacks, may require specific testing efforts, or impose significant compliance obligations.
A portion of our total revenue from product sales comes from contracts with U.S. federal government agencies, none of which currently contemplates long-term purchase commitments. Disruptions to, or our failure to effectively develop, manage and
25
maintain our government customer relationships, could adversely affect our ability to generate revenue from the sales to such customers. Governments routinely investigate and audit government contractors’ administrative processes, and any unfavorable audit could result in the government refusing to continue buying our products and services, a reduction of revenue or fines or civil or criminal liability if the audit uncovers improper or illegal activities, which could materially adversely impact our operating results.
Furthermore, a majority of our government sales involve products that have or will soon reach the end of their life cycles, and such government sales for these older products have declined substantially in recent periods. Sales of our newer products to governmental agencies for broad deployment may not develop quickly, if at all, or be sufficient to offset future declines in sales of these legacy products. Additionally, spending by government customers fluctuates based on budget allocations and the timely passage of the annual federal budget.
Among the factors that could impact federal government spending and which would reduce our federal government contracting and subcontracting business are a significant decline in, or reapportioning of, spending by the federal government, changes as a result of the current presidential administration, changes, delays or cancellations of federal government programs or requirements, the adoption of new laws or regulations that affect companies that provide services to the federal government, federal government shutdowns or other delays in the government appropriations process, changes in the political climate, including with regard to the funding for products we provide, delays in the payment of our invoices by government payment offices, and general economic conditions. The loss or significant curtailment of any government contracts or subcontracts, whether due to our performance or due to interruptions or changes in governmental funding for such contracts or subcontracts, could have a material adverse effect on our business, results of operations and financial condition.
Further, sales to government customers may require specific testing efforts or impose significant compliance or certification obligations. For example, the Department of Defense ("DOD") has issued specific requirements for IP networking products for features and interoperability. In order for a vendor's product to be used to connect to the DOD network, that product must pass a series of significant tests and be certified by the Joint Interoperability Test Command (“JITC”). Certain of our products are already certified by JITC. However, if we are unable to obtain JITC certification as needed, our DOD sales, and hence our revenue and results of operations, may suffer.
If we fail to realize the anticipated benefits from any recent acquisitions by Sonus and GENBAND on a timely basis, or at all, our business and financial condition may be adversely affected.
We may fail to realize the anticipated benefits from any recent acquisitions by either Sonus or GENBAND on a timely basis, or at all, for a variety of reasons, including but not limited to the following:
• | problems or delays in assimilating or transitioning to us the acquired assets, operations, systems, processes, controls, technologies, products or personnel; |
• | loss of acquired customer accounts; |
• | unanticipated costs associated with the acquisitions; |
• | failure to identify in the due diligence process or assess the magnitude of certain liabilities we assumed in the acquisitions, which could result in unexpected litigation or regulatory exposure, unfavorable accounting treatment, unexpected increases in taxes due, significant issues with product quality or development or other adverse effects on our business or results of operations; |
• | multiple or overlapping product lines as a result of the acquisitions that are offered, priced and supported differently, which could cause customer confusion and delays; |
• | higher than anticipated costs in continuing support and development of acquired products and services; |
• | diversion of management’s attention from our core business and the challenges of managing larger and more widespread operations from the acquisitions; |
• | adverse effects on existing business relationships of any of the acquired businesses with their respective suppliers, licensors, contract manufacturers, customers, distributors, resellers and industry experts; |
• | significant impairment, exit and/or restructuring charges if the products or technologies acquired in the acquisitions do not meet our sales expectations or are unsuccessful; |
• | insufficient revenue to offset increased expenses associated with the acquisitions; |
• | risks associated with entering markets in which we have no or limited prior experience; |
• | potential loss of the employees we acquired in the acquisitions or our own employees; and/or |
• | failure to properly integrate internal controls and financial systems of the combined companies. |
26
If we are unable to successfully manage these issues, the anticipated benefits and efficiencies of our recent acquisitions may not be realized fully or at all, or may take longer to realize than expected, and our ability to compete and our results of operations may be adversely affected.
Any future investments, mergers or acquisitions we make or enter into, as applicable, could be difficult to integrate, disrupt our business, dilute shareholder value and seriously harm our financial condition.
We are not currently a party to any material pending merger or acquisition agreements. However, we may merge with or acquire additional businesses, products or technologies in the future. No assurance can be given that any future merger or acquisition will be successful or will not materially adversely affect our business, operating results or financial condition. We continue to review opportunities to merge with or acquire other businesses or technologies that would add to our existing product line, complement and enhance our current products, expand the breadth of our product and service offerings, enhance our technical capabilities or otherwise offer growth opportunities. If we enter into a merger or make acquisitions in the future, we could, among other things:
• | issue stock that would dilute existing stockholders' percentage ownership; |
• | incur debt or assume liabilities; |
• | reduce significantly our cash and investments; |
• | incur significant impairment charges related to the write-off of goodwill and intangible assets; |
• | incur significant amortization expenses related to intangible assets; and/or |
• | incur large and immediate write-offs for in-process research and development and stock-based compensation. |
Mergers and acquisitions are inherently risky and subject to many factors outside of our control. Therefore, we cannot be certain that we would be successful in overcoming problems in connection with our past or future acquisitions. Our inability to do so could significantly harm our business, revenues, and results of operations.
Failure to hire and retain key personnel, or the loss of any of our executive officers, could negatively impact our ability to meet our business objectives and impair our future growth.
Our business depends upon highly skilled technical, managerial, engineering, sales, marketing and customer support personnel. Competition for these personnel is intense, especially during times of economic recovery or growth. Any failure to hire, assimilate in a timely manner and retain key qualified personnel, particularly engineering and sales personnel, could impair our growth and make it difficult to meet key objectives, such as timely and effective product introductions. The challenge of retaining key employees could be increasingly difficult due to the Merger and ongoing integration process. In addition, our ability to attract and retain key employees could be adversely impacted if we do not have a sufficient number of shares available under the Amended and Restated Stock Incentive Plan to issue to our employees, or if our stockholders do not approve requested share increases or a new equity incentive plan. We may not be able to locate suitable employees for any key employee who leaves or offer employment to potential replacements on reasonable terms.
Our future success also depends upon the continued services of our executive officers who have critical industry experience and relationships that we rely on to implement our business plan. With the exception of certain key employees based in the European Union, none of our officers or key employees is bound by an employment agreement for any specific term. The loss of the services of any of our executive officers or key employees could delay the development and introduction of, and negatively impact our ability to sell, our products and achieve our business objectives.
The terms of our credit agreement could adversely affect our operating flexibility and pose risks of default or springing maturity, which would negatively impact our liquidity and operations.
Our credit facility with Silicon Valley Bank includes $100 million of commitments, the full amount of which is available for revolving loans, a $15 million sublimit that is available for letters of credit and a $15 million sublimit that is available for swingline loans. The senior secured credit facility is scheduled to mature in December 2021, subject to a springing maturity if, on or before July 14, 2020, the existing promissory note issued to certain shareholders is not converted or extended to March 2022 or later. The credit agreement includes procedures for additional financial institutions to become lenders, or for any existing lender to increase its commitment under the facility, subject to an available increase of $50 million for all incremental commitments under the credit agreement, without amendment. Provisions in the credit agreement impose limitations on our ability to, among other things, incur additional indebtedness, create liens, make acquisitions or engage in mergers, enter into transactions with affiliates, dispose of assets, make certain investments and amend or repay certain junior debt.
27
In addition, we are required to meet certain financial covenants customary for financings of this type. Our failure to comply with these covenants may result in the declaration of an event of default, which could cause us to be unable to borrow under the credit agreement or result in the acceleration of the maturity of indebtedness outstanding under the credit agreement at such time. If the maturity of our indebtedness is accelerated, we may not have sufficient funds available for repayment or we may not have the ability to borrow or obtain sufficient funds to replace the accelerated indebtedness on terms acceptable to us, or at all.
We had $20 million of borrowings outstanding under the credit facility as of December 31, 2017. In addition, we had $2.9 million of letters of credit outstanding under the credit facility as of December 31, 2017. If we are prevented from borrowing or if we are unable to extend, renew or replace the credit facility by the maturity date of December 2021, or an early springing maturity date, on favorable terms, or at all, this could have a material adverse effect on our liquidity and cause our business, operations and financial condition to suffer. If the credit facility is subjected to the early springing maturity, we may not have sufficient funds available for repayment or we may not have the ability to borrow or obtain sufficient funds to replace the indebtedness on terms acceptable to us, or at all.
Litigation and government investigations could result in significant legal expenses and settlement payments, fines or damage awards.
From time to time, we are subject to litigation regarding intellectual property rights or other claims. In the past, we have also been named as a defendant in securities class action and stockholder derivative lawsuits. We are generally obliged, to the extent permitted by law, to indemnify our current and former directors and officers who are named as defendants in these lawsuits. Defending against litigation may require significant attention and resources of management. Regardless of the outcome, such litigation could result in significant legal expenses. For instance, GENBAND was involved in four patent infringement lawsuits involving Metaswitch Networks Ltd., Metaswitch Networks Corp. and Metaswitch Inc. (collectively, “Metaswitch”), three of which are ongoing. At this time, it is not possible to predict the outcome of the ongoing lawsuits, including whether or not any proceedings will continue, and when or how these matters will be resolved or whether we will ultimately receive, and in what sum, amounts previously awarded as a result of these proceedings. Regardless of whether we are ultimately successful in these lawsuits, we will likely elect to continue to incur substantial legal fees in connection with these matters.
We have also been subject to employment claims in connection with employee terminations, and may be subject to additional claims in the future. In addition, companies in our industry whose employees accept positions with us may claim that we have engaged in unfair hiring practices. These claims may result in material litigation. We could incur substantial costs defending ourselves or our employees against these claims, regardless of their merits. Further, defending ourselves from these types of claims could divert our management's attention from our operations. The quantity and cost of employment claims may rise as a result of our increasing international expansion and the Merger.
In addition, we are from time to time subject to investigations by the government. For example, we are also fully cooperating with an SEC inquiry regarding the development and issuance of Sonus' first quarter 2015 revenue and earnings guidance. Following recent communications with the SEC's Division of Enforcement (the "Staff"), we have reached an agreement in principle to resolve this matter and, in connection therewith, we are negotiating the terms of an order in which we will neither make admissions nor denials, and in which we will agree to pay a $1.9 million civil penalty and agree not to violate the securities laws in the future. There is no assurance that we will not be subject to similar investigations by the Staff or other government agencies in the future.
If the defenses we claim in our material litigation matters are ultimately unsuccessful, or if we are unable to achieve a favorable settlement with an adverse party or a government agency, we could be liable for large settlement payments, damage awards or fines that could have a material adverse effect on our business and results of operations.
A breach of the security of our information systems or those of our third-party providers could adversely affect our operating results.
We rely upon the security of our information systems and, in certain circumstances, those of our third-party providers, such as vendors, consultants and contract manufacturers, to protect our sensitive or proprietary information and information of or about our customers. Despite our security procedures, such as the encryption of data, and those of our third-party providers, our information systems and those of our third-party providers are vulnerable to threats such as computer hacking, cyber-terrorism or other unauthorized attempts by third parties to access, modify, corrupt or delete our or our customers' sensitive or proprietary information. Such cyberattacks and other cyber incidents are occurring more frequently, are constantly evolving, are becoming more sophisticated and can take many forms. Information technology system failures, including a breach of our or our third-
28
party providers' data security measures through a cyberattack, other cyber incident or otherwise, or the theft or loss of laptops, other mobile devices or electronic records used to back up our systems or our third-party providers' systems, could result in a disclosure of customer, employee, or our information or otherwise disrupt our ability to function in the normal course of business by potentially causing, among other things, delays in the fulfillment or cancellation of customer orders or disruptions in the manufacture or shipment of products or delivery of services, any of which could have a material adverse effect on our operating results. Additionally, the information systems of our customers could be compromised, which could lead to unauthorized tampering with our products and may result in, among other things, the disruption of our customers' business, errors or defects occurring in the software due to such unauthorized tampering, and our products not operating as expected after such unauthorized tampering. These types of security breaches could also create exposure to lawsuits, regulatory investigations, increased legal liability and/or reputational damage. In addition, the costs to remediate any cyberattack could be significant. Such consequences could be exacerbated if we or our third-party providers are unable to adequately recover critical systems in a timely manner following a systems failure. Our insurance coverage may be insufficient to cover all losses related to cyberattacks.
Worldwide efforts to contain capital spending and global economic conditions and uncertainties in the geopolitical environment have been and may continue to be materially adverse to our business.
One factor that significantly affects our operating results is the impact of economic conditions on the willingness of our current and potential customers to make capital investments. Given the general uncertainty regarding global economic conditions and uncertainties in the geopolitical environment, we believe that customers have tried to maintain or improve profitability through cost control and constrained capital spending, which places additional pressure on IT departments to demonstrate acceptable return on investment. Some of our customers have canceled or delayed, and current and prospective customers may continue to cancel and delay, spending on the development or roll-out of capital and technology projects with us due to economic uncertainty and, consequently, our results of operations have been, and may continue to be, adversely affected. In addition, current uncertain worldwide economic and political environments make it increasingly difficult for us, our customers and our suppliers to accurately forecast future product demand, which could result in an inability to satisfy demand for our products and a loss of market share. Our revenues are likely to decline in such circumstances, which may result in erosion of our profit margins and significant losses.
Moreover, economic conditions worldwide may contribute to slowdowns in the communications and networking industries, as well as to specific segments and markets in which we operate, particularly the wireline sector, resulting in, among other things:
• | reduced demand for our products and services as a result of our customers choosing to refrain from building capital intensive networks; |
• | increased price competition for our products, not only from our competitors, but also as a consequence of customers disposing of unutilized products; |
• | risk of excess and obsolete inventories; |
• | excess facilities and manufacturing capacity; and/or |
• | higher overhead costs as a percentage of revenue and higher interest expense. |
Continuing turmoil in the geopolitical environment in many parts of the world, as well as changes implemented by the current U.S. presidential administration, may continue to put pressure on global economic conditions which, in turn, could materially adversely affect our operating results.
Man-made problems, such as terrorism, and natural disasters may disrupt our operations and harm our operating results.
The continued threat of terrorism and heightened security and military action in response to this threat, or any future acts of terrorism, may cause disruptions to the economies of the United States and other countries. Events such as work stoppages or widespread blackouts could have similar negative impacts. Such disruptions or uncertainties could result in delays or cancellations of customer orders or the manufacture or shipment of our products and have a material adverse effect on our business and results of operations.
Natural catastrophic events, such as earthquakes, fire, floods, or tornadoes, may also affect our or our customers' operations. For example, one of our offices is located in the Silicon Valley area of Northern California, a region known for seismic activity. These facilities are located near the San Francisco Bay where the water table is quite close to the surface and where tenants in nearby facilities have experienced water intrusion problems. A significant natural disaster, such as an earthquake or flood, could have a material adverse effect on our business in this location.
29
If we fail to maintain appropriate internal controls in the future, we may not be able to report our financial results accurately, which may adversely affect our stock price and our business.
Section 404 of the Sarbanes-Oxley Act of 2002 and the related regulations require our management to report on, and our independent registered public accounting firm to attest to, the effectiveness of our internal control over financial reporting. We have committed and will be required to continue to commit significant financial and managerial resources in order to comply with these requirements.
Further, we are required to integrate GENBAND and other acquired businesses into our system of disclosure controls and procedures and internal control over financial reporting. As may be the case with other companies we acquire, prior to the Merger, GENBAND was not required to implement or maintain the disclosure controls and procedures or internal control over financial reporting that are required of public companies, and we cannot provide assurance as to how long the integration process may take.
Internal control over financial reporting has inherent limitations, including human error, the possibility that controls could be circumvented or become inadequate because of changed conditions, and fraud. If we are unable to maintain effective internal controls, we may not have adequate, accurate or timely financial information, and we may be unable to meet our reporting obligations as a publicly traded company or comply with the requirements of the SEC or the Sarbanes-Oxley Act of 2002. This could result in a restatement of our financial statements, the imposition of sanctions, or investigation by regulatory authorities, and could cause investors to lose confidence in our reported financial information. Any such consequence or other negative effect of our inability to meet our reporting requirements or comply with legal and regulatory requirements, as well as any disclosure of an accounting, reporting or control issue, could adversely affect the trading price of our common stock and our business.
Changes to existing accounting pronouncements or taxation rules or practices may cause adverse fluctuations in our reported results of operations or affect how we conduct our business.
A change in accounting pronouncements or taxation rules or practices can have a significant effect on our reported results and may affect our reporting of transactions completed before the change is effective. New accounting pronouncements, taxation rules and varying interpretations of accounting pronouncements or taxation rules have occurred in the past and may occur in the future. The change to existing rules, future changes, if any, or the need for us to modify a current tax position may adversely affect our reported financial results or the way we conduct our business. For example, we were required to adopt the new revenue recognition standard in 2018.
In addition, recent U.S. tax legislation signed by President Trump in December 2017 made many changes to the Internal Revenue Code that impact U.S. corporations, including reducing the U.S. corporate income tax rate, limiting certain interest deductions, permitting immediate expensing of certain capital expenditures, adopting elements of a territorial tax system and imposing a one-time transition tax on all undistributed earnings and profits of certain U.S.-owned foreign corporations. Many of these changes are effective immediately, without any transition periods or grandfathering for existing transactions. The legislation is unclear in many respects and could be subject to potential amendments and technical corrections, as well as interpretations and implementing regulations, any of which could lessen or increase certain adverse impacts of the legislation. In addition, it is unclear how these U.S. federal income tax changes will affect state and local taxation, which often uses federal taxable income as a starting point for computing state and local tax liabilities. We will be finalizing the impact on the Company of the tax legislation throughout 2018.
If our goodwill or intangible assets become impaired, we may be required to record a significant charge to earnings.
Under generally accepted accounting principles, we review our intangible assets for impairment when events or changes in circumstances indicate the carrying value may not be recoverable. Our intangible assets increased by approximately $237 million in 2017 as a result of the Merger, $12 million in 2016 as a result of our acquisition of Taqua, LLC (“Taqua”) and $11 million in 2015 as a result of our acquisition of certain assets related to Treq Labs, Inc.’s business of designing, developing marketing, selling, servicing and maintaining software defined networking (“SDN”) technology, SDN controller software and SDN management software (the “SDN Business”). Goodwill, which increased by approximately $286 million in 2017 as a result of the Merger, $9 million in 2016 as a result of our acquisition of Taqua and $1 million in 2015 as a result of our acquisition of the SDN Business, is tested for impairment at least annually. Factors that may be considered a change in circumstances indicating that the carrying value of our goodwill or intangible assets may not be recoverable include significant underperformance relative to plan or long-term projections, strategic changes in business strategy, significant negative industry or economic trends, significant change in circumstances relative to a large customer, significant decline in our stock price for a
30
sustained period and decline in our market capitalization to below net book value. Any material impairment of goodwill or intangible assets could adversely affect our results of operations.
Risks Relating to our Intellectual Property
Our business could be jeopardized if we are unable to protect our intellectual property. Additionally, in some jurisdictions, our rights may not be as strong as we currently enjoy in the United States.
We rely on a combination of security countermeasures within our deployed products, as well as patent, copyright, trademark and trade secret laws and contractual restrictions on disclosure to protect our intellectual property rights. Despite our efforts to protect our proprietary rights, unauthorized parties may attempt to copy or otherwise misappropriate our products or technology. Monitoring unauthorized use of our products is difficult and we cannot be certain that the steps we have taken will prevent unauthorized use of our technology, particularly in foreign countries where the laws may not protect our proprietary rights as fully as in the United States. The legal systems of many foreign countries do not protect or honor intellectual property rights to the same extent as the legal system of the United States. It may be very difficult, time-consuming and costly for us to attempt to enforce our intellectual property rights, especially in these foreign jurisdictions. If competitors are able to use our technology, our ability to compete effectively could be harmed, which could have a material adverse effect on our business.
Claims that our current or future products infringe or misappropriate the proprietary rights of others could adversely affect our ability to sell those products and cause us to incur additional costs.
Substantial litigation over intellectual property rights exists in the telecommunications industry. For instance, GENBAND was involved in four patent infringement lawsuits involving Metaswitch, three of which are ongoing, in which both GENBAND and Metaswitch asserted claims of patent infringement against each other. At this time, it is not possible to predict the outcome of the ongoing lawsuits, including whether or not any proceedings will continue, and when or how these matters will be resolved or whether we will ultimately receive, and in what sum, amounts previously awarded to us as a result of these proceedings.
We expect that we could be increasingly subject to third-party infringement claims as our revenue increases, the number of competitors grows and/or the functionality of products and technology in different industry segments overlaps. Third parties may currently have, or may eventually be issued, patents on which our current or future products or technologies may allegedly infringe. For example, we and our customers have received inquiries from intellectual property owners and may become subject to claims that we or our customers allegedly infringe the intellectual property rights of third parties. If a third party asserts that our products infringe upon their proprietary rights, we may be forced either to defend ourselves, our customers or contract manufacturers in litigation or to license their patents or other intellectual property for substantial royalty payments. These claims and any resulting licensing arrangement or lawsuit could subject us to significant royalty payments or liability for damages and invalidation of our proprietary rights. Any potential intellectual property litigation also could force us to do one or more of the following:
• | delay shipments of, or stop selling, incorporating or using our products that use the challenged intellectual property; |
• | obtain from the owner of the infringed intellectual property right a license to sell or use the relevant technology, which license may not be available at acceptable prices, on acceptable terms, or at all; or |
• | redesign those products that use any allegedly infringing technology, if feasible. |
Patent litigation, regardless of its outcome, will likely result in the expenditure of significant financial resources and the diversion of management’s time and resources. In addition, patent litigation may cause negative publicity and adversely impact our ability to gain prospective customers. If a third party's claim of infringement against us in a particular patent litigation is successful, and we could not develop non-infringing technology or license the infringed or similar technology on a timely and cost-effective basis, our revenue may decrease substantially, and we could be exposed to significant liability. A court could enter orders that temporarily, preliminarily or permanently enjoin us or our customers from making, using, selling, offering to sell or importing our current or future products, or could enter an order mandating that we undertake certain remedial activities. In addition, costs relating to indemnification provisions in our product agreements may be significant.
Risks Relating to our International Operations
We may face risks associated with our international expansion that could impair our ability to grow our international revenues. If we fail to manage the operational and financial risks associated with our international operations, it could have a material adverse effect on our business and results of operations.
31
We have expanded, and expect to continue to expand, our operations in international and emerging markets. International operations are a significant part of our business, and such operations will continue to require significant management attention and financial resources to successfully develop direct and indirect international sales and support channels. In addition, our international operations are subject to other inherent risks, including:
• | reliance on channel partners; |
• | greater difficulty collecting accounts receivable and longer collection cycles; |
• | difficulties and costs of staffing and managing international operations; |
• | impacts of differing technical standards outside the United States; |
• | compliance with international trade, customs and export control regulations; |
• | reduced protection for intellectual property rights in some countries; |
• | foreign government regulations limiting or prohibiting potential sales or increasing the cost of doing business in such markets, including adverse tax policies, tariffs, customs regulations, trade protection measures, export quotas and qualifications to transact business; |
• | differing regulatory requirements, including tax laws, data privacy laws and labor regulations; |
• | challenging pricing environments in highly competitive new markets; |
• | foreign currency exchange controls, restrictions on repatriation of cash and changes in currency exchange rates; |
• | management communication and integration problems related to entering new markets with different languages, cultures and political systems; |
• | potential exposure to liability or damage of reputation resulting from a higher incidence of corruption or unethical business practices in some countries; |
• | greater risk of a failure of employees to comply with both U.S. and foreign laws, including antitrust regulations, the U.S. Foreign Corrupt Practices Act (“FCPA”) and any trade regulations ensuring fair trade practices; |
• | higher or more variable network service provider fees outside of the United States; |
• | any need to adapt and localize our products for specific countries; |
• | our ability to effectively price our products in competitive international markets; |
• | potentially adverse tax consequences; and |
• | political, social and economic instability, including as a result of the fragility of global financial markets, health pandemics or epidemics and/or acts of war or terrorism. |
Our international revenue, both as a percentage of total revenue and absolute dollars, may vary from one period to the next, and accordingly, current data may not be indicative of future periods. If we are unable to support our business operations in international and emerging markets, or their further expansion, while balancing the higher operational and financial risks associated with these markets, our business and results of operations could be harmed.
In addition, we may not be able to develop international market demand for our products, which could impair our ability to grow our revenues. In many international markets, long-standing relationships between potential customers and their local suppliers and protective regulations, including local content requirements and approvals, create barriers to entry. We have limited experience marketing, distributing and supporting our products in certain international locations and, to do so, we expect that we will need to develop versions of our products that comply with local standards. Moreover, difficulties in foreign financial markets and economies and of foreign financial institutions, particularly in emerging markets, could adversely affect demand from customers in the affected countries.
We are exposed to fluctuations in currency exchange rates that could negatively impact our financial results and cash flows.
Because a portion of our business is conducted outside the United States, we face exposure to adverse movements in foreign currency exchange rates. These exposures may change over time as business practices evolve, and they could have a material adverse impact on our financial results and cash flows. An increase in the value of the U.S. dollar could increase the real cost to our customers of our products in those markets outside the United States where we often sell in dollars, and a weakened U.S. dollar could increase the cost of local operating expenses and procurement of raw materials from sources outside the United States. Therefore, changes in the value of the U.S. dollar against other currencies will affect our revenues, income from operations, net income and the value of balance sheet items originally denominated in other currencies. There is no guarantee that our financial results will not be adversely affected by currency exchange rate fluctuations.
Our business and operations in the United Kingdom are exposed to potential disruptions and uncertainty relating to Brexit.
In March 2017, Prime Minister Theresa May of the United Kingdom formally began the process of withdrawing the United Kingdom from the European Union, following the June 2016 referendum in which the majority of voters in the United Kingdom supported such withdrawal (known as Brexit). Brexit could cause disruptions to and create uncertainty surrounding
32
our business and operations in the United Kingdom, including affecting relationships with existing and future customers, suppliers and employees. The effects of Brexit will depend on any agreements the U.K. makes to retain access to E.U. markets either during a transitional period or more permanently. The measures could potentially disrupt the markets we serve and the tax jurisdictions in which we operate and adversely change tax benefits or liabilities in these or other jurisdictions. In addition, Brexit could lead to legal uncertainty and potentially divergent national laws and regulations as the U.K. determines which E.U. laws to replace or replicate. These developments in turn may inhibit our sales, mobility of our personnel, and our access to capital.
Our use and reliance upon research and development resources in India may expose us to unanticipated costs and/or liabilities.
We have an office in Bangalore, India. The employees at this facility consist principally of research and development personnel. There is no assurance that our reliance upon development resources in India will enable us to achieve meaningful cost reductions or greater resource efficiency. Further, our development efforts and other operations in India involve significant risks, including:
• | difficulty hiring and retaining appropriate engineering and management resources due to intense competition for such resources and resulting wage inflation; |
• | knowledge transfer related to our technology and resulting exposure to misappropriation of intellectual property or information that is proprietary to us, our customers and other third parties; |
• | heightened exposure to changes in economic, security and political conditions in India; and |
• | fluctuations in currency exchange rates and tax compliance in India. |
Difficulties resulting from the factors noted above and other risks related to our operations in India could increase our expenses, impair our development efforts, harm our competitive position and damage our reputation.
Risks Relating to Legislation and Government Regulation
Failure to comply with the Foreign Corrupt Practices Act or the U.K. Bribery Act could subject us to significant civil or criminal penalties.
We earn a significant portion of our total revenues from international sales generated through our foreign direct and indirect operations. As a result, we are subject to the FCPA, and the U.K. Bribery Act of 2010 (the "UKBA"), which prohibit bribery in the conduct of business. The FCPA generally prohibits U.S. companies and their intermediaries from making corrupt payments to foreign officials for the purpose of obtaining or keeping business or otherwise obtaining favorable treatment, and requires companies to maintain adequate record-keeping and internal accounting practices to accurately reflect the transactions of the company. The FCPA applies to companies, individual directors, officers, employees and agents. The UKBA is much broader and prohibits all bribery, in both the public and private sectors. Although the UKBA does not contain a separate financial records provision, such a requirement is captured under other U.K. legislation. Under the FCPA and the UKBA, U.S. companies, their subsidiaries, employees, senior officers and/or directors may be held liable for actions taken by strategic or local partners or representatives. In addition, the U.S. government or the U.K. government, as applicable, may seek to hold us liable for successor liability violations committed by companies we have acquired or may in the future acquire. If we or our intermediaries fail to comply with the requirements of the FCPA and the UKBA, governmental authorities in the United States and the United Kingdom, as applicable, could seek to impose civil and/or criminal penalties, which could have a material adverse effect on our reputation, results of operations and the trading price of our common stock.
We are subject to governmental export and import controls that could subject us to liability, require a license from the U.S. government or impair our ability to compete in international markets.
Certain of our products incorporating encryption technology are subject to export controls and may be exported only with the required level of export license or through an export license exception. Under these laws and regulations, we are responsible for obtaining all necessary licenses or other approvals, if required, for exports of hardware, software and technology, as well as the provision of service. If we were to fail to comply with export licensing, customs regulations, economic sanctions and other laws, we could be subject to substantial civil and criminal penalties, including fines for the Company and incarceration for responsible employees and managers, and the possible loss of export or import privileges. Similarly, various countries regulate the import of certain encryption technology and have enacted laws that could limit our ability to distribute our products or our customers' ability to implement our products in those countries.
33
In addition, if our distributors fail to obtain appropriate import, export or re-export licenses or permits, we may also be adversely affected through reputational harm and penalties. Obtaining export licenses can be difficult and time-consuming, and in some cases a license may not be available on a timely basis or at all.
Furthermore, export control laws and economic sanctions prohibit the shipment of certain products to embargoed or sanctioned countries, governments and persons. We cannot assure that a violation of these regulations will not occur, whether knowingly or inadvertently. Any such shipment could have negative consequences including government investigations, penalties, fines, civil and criminal sanctions, and reputational harm.
Additionally, any change in our products or in export or import regulations, economic sanctions or related legislation, shift in approach to the enforcement or scope of existing regulations or change in the countries, persons or technologies targeted by such regulations, could result in delays in the introduction of our products in international markets, decreased use of our products by, or in our decreased ability to export or sell our products to, existing or potential customers with international operations. Any decreased use of our products or limitation on our ability to export or sell our products would likely have a material adverse effect on our business and results of operations.
Regulation of the telecommunications industry, or changes in governmental regulation, interpretation or legislative reform could harm our operating results and future prospects.
The telecommunications industry is highly regulated and our business and financial condition could be adversely affected by changes in the regulations relating to the telecommunications industry. Currently, there are few laws or regulations that apply directly to access to or delivery of voice services on IP networks. We could be adversely affected by regulation of IP networks and commerce in any country where we operate, including the United States. Such regulations could include matters such as voice over the Internet or using Internet protocol, encryption technology, and access charges for service providers. The adoption of such regulations could decrease demand for our products, and at the same time increase the cost of selling our products, which could have a material adverse effect on our business and results of operations.
Other laws and regulations, including in the areas of advertising, consumer affairs, data protection, finance, marketing, privacy, publishing and taxation requirements, are subject to change and differing interpretations. Changes in the political climate or in existing laws or regulations, or their interpretations, or the enactment of new laws or the issuance of new regulations or changes in enforcement priorities or activity could adversely affect our business by, among other things, increasing our administrative, compliance and other costs; forcing us to undergo a corporate restructuring; limiting our ability to engage in inter-company transactions with its affiliates and subsidiaries; increasing our tax obligations, including unfavorable outcomes from audits performed by various tax authorities; affecting our ability to continue to serve our customers and to attract new customers; affecting cash management practices and repatriation efforts; forcing us to alter or restructure our relationships with vendors and contractors; increasing compliance efforts or costs; limiting our use of or access to personal information; restricting our ability to market our products; and/or requiring us to implement additional or different programs and systems.
Compliance with regulations is costly and time-consuming, and we may encounter difficulties, delays or significant expenses in connection with compliance, and we may be exposed to significant penalties, liabilities, reputational harm and loss of business in the event that we fail to comply. While it is not possible to predict when or whether fundamental policy or interpretive changes would occur, these or other changes could fundamentally change the dynamics of our industry or the costs associated with our operations. Changes in public policy or enforcement priorities could materially affect our profitability, our ability to retain or grow business, or in the event of extreme circumstances, our financial condition.
Risks Related to our Common Stock
Our stock price has been and may continue to be volatile.
The market for technology stocks has been, and will likely continue to be, volatile. The following factors, among others, could cause the market price of our common stock to fluctuate significantly:
• | addition or loss of any major customer; |
• | continued significant declines in customer spending in the media gateway trunking business; |
• | decreased spending by customers in the SBC and/or DSC security businesses; |
• | consolidation among our customers and/or our competitors in the telecommunications industry; |
• | changes in the financial condition or anticipated capital expenditures of any existing or potential major customer; |
• | economic conditions for the telecommunications, networking and related industries; |
• | quarterly variations in our bookings, revenues and operating results; |
34
• | failure to meet our earnings guidance or securities analysts’ estimates; |
• | changes in financial estimates by securities analysts; |
• | speculation in the press or investment community, and shorting of our stock by investors; |
• | announcements by us or our competitors of significant contracts, new products or acquisitions, distribution partnerships, joint ventures, mergers or capital commitments; |
• | activism by any single large stockholder or combination of stockholders; |
• | sales of common stock or other securities by us or by our stockholders in the future; |
• | securities and other litigation; |
• | developments with respect to intellectual property rights, including any related litigation; |
• | repurchases under our stock buyback program; |
• | departure of key personnel or other major changes in our board of directors or management; |
• | changes in governmental regulations; |
• | our ability to develop and market new and enhanced products on a timely basis; |
• | announcement of a stock split, reverse stock split, stock dividend or similar event; and/or |
• | emergence or adoption of new technologies or industry standards. |
Furthermore, brokerage firms often do not permit stocks trading below $5.00 per share to be sold short, but often permit short-selling of shares which are traded at higher prices. As a result, to the extent our per-share trading price is consistently above $5.00, investors may short our stock. This may increase the volatility of our stock price.
Delaware law and our charter documents contain provisions that could discourage or prevent a potential takeover, even if such a transaction would be beneficial to our stockholders.
Some provisions in our amended and restated certificate of incorporation, our amended and restated by-laws, as well as provisions of Delaware law, may discourage, delay or prevent a merger or acquisition that may be deemed undesirable by our Board of Directors but that a stockholder may consider favorable. These include provisions:
• | authorizing the Board of Directors to issue shares of preferred stock; |
• | limiting the persons who may call special meetings of stockholders; |
• | prohibiting stockholder actions by written consent; |
• | permitting the Board of Directors to increase the size of the Board and to fill vacancies; |
• | providing indemnification to our directors and officers; |
• | controlling the procedures for conduct and scheduling of Board and stockholder meetings; |
• | requiring a super-majority vote of our stockholders to amend our amended and restated by-laws and certain provisions of our amended and restated certificate of incorporation; and |
• | establishing advance notice requirements for nominations for election to the Board of Directors or for proposing matters that can be acted on by stockholders at stockholder meetings. |
These provisions, alone or together, could delay hostile takeovers or changes in control of us or our management.
As a Delaware corporation, we are also subject to provisions of Delaware law, including Section 203 of the Delaware General Corporation law, which prevents some stockholders holding more than 15% of our outstanding common stock from engaging in certain business combinations without approval of the holders of substantially all of our outstanding common stock.
Any provision of our amended and restated certificate of incorporation, our amended and restated by-laws or Delaware law that has the effect of delaying or deterring a change in control could limit the opportunity for our stockholders to receive a premium for their shares of our common stock, and could also affect the price that some investors are willing to pay for our common stock. Although we believe that our amended and restated certificate of incorporation, our amended and restated bylaws and provisions of Delaware law provide an opportunity for the Board of Directors to assure that our stockholders realize full value for their investment, they could have the effect of delaying or preventing a change of control that some stockholders may consider beneficial.
Item 1B. Unresolved Staff Comments
None.
35
Item 2. Properties
As of December 31, 2017, we maintained the following facilities:
Location | Principal use | Square footage (approximate) | Lease expiration | |||
Plano, Texas | Engineering/development, customer support, general and administrative and sales | 100,300 | February 2022 | |||
Westford, Massachusetts | Corporate activities, engineering/development, sales and customer support | 97,500 | August 2028 | |||
Paladium (Ottawa), Canada | Engineering/development, customer support and general and administrative | 76,500 | December 2019 | |||
Research Triangle Park, North Carolina | Engineering/development, customer support, general and administrative and sales | 71,300 | April 2027 | |||
Bangalore, India | Engineering/development | 60,100 | October 2019 | |||
Durham, North Carolina | Warehouse | 50,300 | August 2020 | |||
Richardson, Texas | Customer testing | 26,500 | January 2020 | |||
Billerica, Massachusetts | Engineering/development, customer support and sales | 23,400 | September 2018 | |||
Maidenhead, United Kingdom | Engineering/development, customer support and sales | 20,400 | July 2020 | |||
Fremont, California | Engineering/development and general and administrative | 16,000 | June 2020 | |||
Kanata (Ottawa), Canada | Engineering/development and general and administrative | 16,000 | October 2018 | |||
Richardson, Texas (a) | Engineering/development, general and administrative and sales | 15,600 | September 2021 | |||
Freehold, New Jersey | Engineering/development | 13,300 | January 2024 | |||
Mexico City, Mexico | Customer support | 11,900 | October 2019 | |||
Prague, Czech Republic | Customer support | 11,500 | May 2019 | |||
Tel Aviv, Israel | Sales and customer support | 7,800 | July 2019 | |||
Swindon, United Kingdom | Engineering/development and customer support | 5,800 | December 2018 | |||
Galway, Ireland | General and administrative | 5,600 | January 2023 | |||
San Jose, California (b) | Engineering/development | 5,500 | November 2018 | |||
Rochester, New York (c) | Engineering/development and customer support | 5,400 | October 2019 | |||
New York, New York | General and administrative and sales | 5,100 | August 2020 | |||
Tokyo, Japan | Sales and customer support | 5,000 | May 2020 | |||
Schaumburg, Illinois | Engineering/development | 4,700 | October 2019 | |||
Madrid, Spain | Sales and customer support | 4,100 | September 2019 | |||
Montreal (Quebec), Canada | Engineering/development | 4,100 | November 2018 | |||
Immenstaad, Germany | Customer support | 4,000 | June 2018 | |||
Sydney, Australia | Sales and customer support | 3,400 | October 2018 | |||
Gaithersburg, Maryland | Engineering/development and customer support | 2,600 | January 2019 | |||
Hyannis, Massachusetts | Engineering/development | 2,200 | December 2019 | |||
Hong Kong, China | Sales and customer support | 2,100 | October 2019 | |||
Dubai, United Arab Emirates | Sales and customer support | 1,200 | May 2018 | |||
Melbourne, Australia | Sales and customer support | 1,000 | May 2018 | |||
__________
(a) A portion of this facility was not in use at December 31, 2017 and is currently being subleased as part of a restructuring initiative.
36
(b) Facility was not in use at December 31, 2017 as part of a restructuring initiative and is currently being actively marketed for sublease.
(c) Facility was not in use at December 31, 2017 as part of a restructuring initiative and is currently being subleased.
We also lease small (under 1,000 square feet) short-term office space in various countries around the world for sales, marketing and services staff. We believe our existing facilities are adequate for our current needs and that suitable additional space will be available as needed.
Item 3. Legal Proceedings
We are fully cooperating with an SEC inquiry regarding the development and issuance of Sonus’ first quarter 2015 revenue and earnings guidance. Following recent communications with the SEC's Division of Enforcement (the "Staff"), we have reached an agreement in principle to resolve this matter. We are negotiating the terms of an order with the Staff in which we will neither make admissions nor denials, and in which we will agree to pay a $1.9 million civil penalty and agree not to violate the securities laws in the future. We recorded $1.9 million in the year ended December 31, 2017, including $0.3 million in the three months ended December 31, 2017, for potential fines in connection with this investigation.
In addition, through GENBAND, we are involved in three ongoing patent infringement lawsuits with Metaswitch Networks Ltd., Metaswitch Networks Corp. and Metaswitch Inc. (collectively, “Metaswitch”). First, on January 21, 2014, GENBAND and our indirectly-owned subsidiary, GENBAND US LLC, filed a complaint alleging that Metaswitch infringed certain patents owned by GENBAND. Following unsuccessful mediation, a trial took place and on January 15, 2016 the jury awarded approximately $8,168,000 in past royalty damages to GENBAND, which neither GENBAND nor we have recorded. On September 29, 2016, the court confirmed the jury verdict following motions from both parties. GENBAND is seeking additional royalty and other damages and has appealed a ruling of the court denying a permanent injunction against continued infringement by Metaswitch. GENBAND appealed the denial of its request for a permanent injunction and presented oral argument on this issue before the U.S. Court of Appeals for the Federal Circuit on June 8, 2017. On July 10, 2017, the U.S. Court of Appeals for the Federal Circuit vacated the lower court’s denial of a permanent injunction and remanded the case for further consideration of GENBAND’s request for a permanent injunction. On December 18, 2017, the lower court held a hearing on all remaining issues regarding the appeal. All briefing for reconsideration has been completed and the court’s decision is pending.
A second lawsuit was filed on July 7, 2014 by Metaswitch against GENBAND in which both parties asserted claims of patent infringement against each other. The trial for the second lawsuit concluded on March 17, 2016 with no damages awarded to either party. The court entered a final judgment on April 14, 2016 awarding GENBAND its costs as the prevailing party. On August 28, 2017, the court denied all parties’ motions for judgment as a matter of law and for a new trial. On October 26, 2017, the court granted GENBAND’s motion for bill of costs and awarded GENBAND approximately $315,000 against Metaswitch, which was subsequently recorded by the Company in early 2018, when received.
Next, on June 2, 2016, the federal district court signed an order lifting a stay and severing and consolidating various non-patent claims and counterclaims that were previously stayed in the first two lawsuits into a third lawsuit. On March 28, 2017, the court dismissed all parties’ claims in this third lawsuit without prejudice, concluding that it lacked subject-matter jurisdiction over GENBAND’s claims, declining to exercise jurisdiction over Metaswitch’s federal Lanham Act counterclaim, and dismissing Metaswitch’s remaining counterclaims concluding that it lacked subject-matter jurisdiction over those claims. Immediately following the dismissal of this federal court action on March 28, 2017, GENBAND filed a petition against Metaswitch in Texas state court asserting the claims that GENBAND had previously asserted in the federal court action. Metaswitch filed its answer on April 21, 2017 and asserted counterclaims against GENBAND. On August 16, 2017, Metaswitch then amended its counterclaims against GENBAND. A hearing on discovery motions was held on January 4, 2018. The Texas state court has issued a scheduling order setting trial for this case in November 2018. At this time, it is not possible to predict the outcome of the litigation, but we do not expect the results of this suit to have a material adverse effect on our business or results of operations.
We are often a party to disputes and legal proceedings that we consider routine and incidental to our business. Management does not expect the results of any of these actions to have a material effect on our business or results of operations.
37
Item 4. Mine Safety Disclosures
Not applicable.
38
PART II
Item 5. Market for Registrant's Common Equity, Related Stockholder Matters and Issuer Purchases of Equity Securities
Market Information
Our common stock began publicly trading on The Nasdaq Global Select Market on October 30, 2017 under the symbol "SONS," following the Merger. Effective November 29, 2017, our common stock was quoted on The Nasdaq Global Select Market under the symbol "RBBN."
The following table sets forth, for the time periods indicated, the high and low sale prices of our common stock as reported on The Nasdaq Global Select Market:
High | Low | ||||||
Fiscal 2017 | |||||||
Fourth quarter (October 30 to December 31) | $ | 9.05 | $ | 6.89 | |||
Holders
At March 2, 2018, there were approximately 172 holders of record of our common stock.
Dividend Policy
We have never declared or paid cash dividends and have no present intention to pay cash dividends in the foreseeable future.
Recent Sales of Unregistered Securities
None.
39
Purchases of Equity Securities by the Issuer and Affiliated Purchasers
The following table summarizes repurchases of our common stock during the fourth quarter of 2017:
Period | Total Number of Shares Purchased (1) | Average Price Paid per Share | Total Number of Shares Purchased as Part of Publicly Announced Plans or Programs | Approximate Dollar Value of Shares that May Yet be Purchased Under the Plans or Programs | |||||||||
October 30, 2017 to October 31, 2017 | — | $ | — | — | $ | — | |||||||
November 1, 2017 to November 30, 2017 | 3,070 | $ | 6.95 | — | $ | — | |||||||
December 1, 2017 to December 31, 2017 | 14,201 | $ | 7.41 | — | $ | — | |||||||
Total | 17,271 | $ | 7.33 | — | $ | — | |||||||
(1) Upon vesting of restricted stock awards, our employees are permitted to return to us a portion of the newly vested shares to satisfy the tax withholding obligations that arise in connection with such vesting. During the fourth quarter of 2017, 17,271 shares of restricted stock were returned to us by employees to satisfy tax withholding obligations arising in connection with vesting of restricted stock, which shares are included in this column.
40
Performance Graph
The following performance graph compares the cumulative total return to stockholders for our common stock for the period from October 30, 2017 (the date Ribbon's common stock began trading on Nasdaq) through December 31, 2017 with the cumulative total return over the same period on the Nasdaq Composite Index and the Nasdaq Telecommunications Index. The comparison assumes an investment of $100 on October 30, 2017 in our common stock and in each of the indices and, in each case, assumes reinvestment of all dividends, if any. The performance shown is not necessarily indicative of future performance.
This graph is not deemed to be "filed" with the SEC or subject to the liabilities of Section 18 of the Securities Exchange Act of 1934, as amended (the "Exchange Act"), and should not be deemed to be incorporated by reference into any of our prior or subsequent filings under the Securities Act of 1933, as amended, or the Exchange Act.
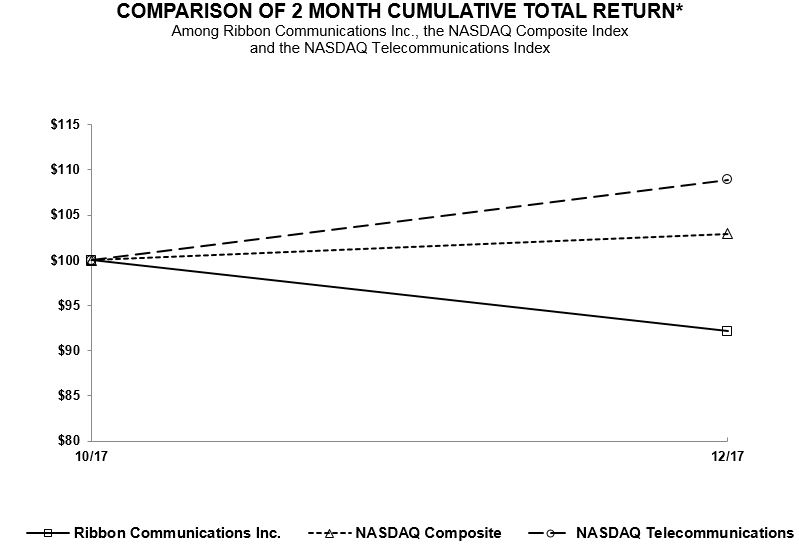
* $100 invested on October 30, 2017 in stock or October 31, 2017 in index, including reinvestment of dividends.
Fiscal year ending December 31.
10/17 | 12/17 | ||||||
Ribbon Communications Inc. | $ | 100.00 | $ | 92.13 | |||
Nasdaq Composite | $ | 100.00 | $ | 102.94 | |||
Nasdaq Telecommunications | $ | 100.00 | $ | 108.92 | |||
Item 6. Selected Financial Data
On October 27, 2017, the Merger Date, Sonus and GENBAND completed the Merger. The following table presents selected consolidated financial data of Sonus, prior to the Merger Date, and selected consolidated financial data of Ribbon, on and after the Merger Date. The selected consolidated financial data set forth below as of December 31, 2017 and 2016 and for each of the years ended December 31, 2017, 2016 and 2015 have been derived from the audited consolidated financial statements included elsewhere herein. The selected consolidated financial data set forth below as of December 31, 2015, 2014 and 2013 and for each of the years ended December 31, 2014 and 2013 have been derived from audited consolidated financial statements not included elsewhere herein. The following selected consolidated financial data should be read in conjunction with "Management's Discussion and Analysis of Financial Condition and Results of Operations" and our consolidated financial statements and notes thereto included elsewhere in this Annual Report on Form 10-K.
41
Year ended December 31, | |||||||||||||||||||
Consolidated Statement of Operations Data | |||||||||||||||||||
(In thousands, except per share amounts) | 2017 (1) | 2016 (2) | 2015 (3) | 2014 (4) | 2013 | ||||||||||||||
Revenue: | |||||||||||||||||||
Product | $ | 181,119 | $ | 146,381 | $ | 141,913 | $ | 182,455 | $ | 167,272 | |||||||||
Service | 148,823 | 106,210 | 107,121 | 113,871 | 109,461 | ||||||||||||||
Total revenue | 329,942 | 252,591 | 249,034 | 296,326 | 276,733 | ||||||||||||||
Cost of revenue: | |||||||||||||||||||
Product | 70,250 | 47,367 | 50,460 | 60,284 | 59,235 | ||||||||||||||
Service | 58,196 | 37,613 | 36,917 | 42,637 | 45,038 | ||||||||||||||
Total cost of revenue | 128,446 | 84,980 | 87,377 | 102,921 | 104,273 | ||||||||||||||
Gross profit | 201,496 | 167,611 | 161,657 | 193,405 | 172,460 | ||||||||||||||
Operating expenses: | |||||||||||||||||||
Research and development | 101,481 | 72,841 | 77,908 | 79,396 | 69,559 | ||||||||||||||
Sales and marketing | 83,403 | 68,539 | 72,841 | 80,141 | 78,365 | ||||||||||||||
General and administrative | 47,642 | 35,948 | 39,846 | 43,937 | 40,107 | ||||||||||||||
Acquisition- and integration-related expense | 14,763 | 1,152 | 131 | 1,558 | 93 | ||||||||||||||
Restructuring expense | 9,436 | 2,740 | 2,148 | 5,625 | 5,411 | ||||||||||||||
Total operating expenses | 256,725 | 181,220 | 192,874 | 210,657 | 193,535 | ||||||||||||||
Loss from operations | (55,229 | ) | (13,609 | ) | (31,217 | ) | (17,252 | ) | (21,075 | ) | |||||||||
Interest and other income, net | 1,537 | 2,193 | 1,329 | 2,611 | 408 | ||||||||||||||
Loss from continuing operations before income taxes | (53,692 | ) | (11,416 | ) | (29,888 | ) | (14,641 | ) | (20,667 | ) | |||||||||
Income tax benefit (provision) | 18,440 | (2,516 | ) | (2,007 | ) | (2,214 | ) | (1,452 | ) | ||||||||||
Net loss | $ | (35,252 | ) | $ | (13,932 | ) | $ | (31,895 | ) | $ | (16,855 | ) | $ | (22,119 | ) | ||||
Loss per share | |||||||||||||||||||
Basic | $ | (0.60 | ) | $ | (0.28 | ) | $ | (0.64 | ) | $ | (0.34 | ) | $ | (0.40 | ) | ||||
Diluted | $ | (0.60 | ) | $ | (0.28 | ) | $ | (0.64 | ) | $ | (0.34 | ) | $ | (0.40 | ) | ||||
Shares used to compute loss per share | |||||||||||||||||||
Basic | 58,822 | 49,385 | 49,560 | 50,245 | 55,686 | ||||||||||||||
Diluted | 58,822 | 49,385 | 49,560 | 50,245 | 55,686 | ||||||||||||||
______________________________
(1) Includes $69.1 million of revenue and $12.5 million of net loss attributable to GENBAND for the period subsequent to the Merger on October 27, 2017.
(2) Includes $1.9 million of revenue and $4.7 million of net loss attributable to Taqua, LLC for the period subsequent to its acquisition by the Company on September 26, 2016.
(3) Includes the results of operations of the SDN Business of Treq Labs, Inc. for the period subsequent to its acquisition by the Company on January 2, 2015. The Company has not disclosed the revenue and earnings of the SDN Business for the periods since January 2, 2015, as these amounts are not significant to the Company's consolidated financial statements.
(4) Includes $14.8 million of revenue attributable to Performance Technologies Incorporated for the period subsequent to its acquisition by the Company on February 19, 2014. The impact on earnings is not significant.
42
December 31, | |||||||||||||||||||
Consolidated Balance Sheet Data | |||||||||||||||||||
(In thousands) | 2017 | 2016 | 2015 | 2014 | 2013 | ||||||||||||||
Cash and cash equivalents | $ | 57,073 | $ | 31,923 | $ | 50,111 | $ | 41,157 | $ | 72,423 | |||||||||
Marketable securities | $ | 17,224 | $ | 61,836 | $ | 58,533 | $ | 64,443 | $ | 138,882 | |||||||||
Investments | $ | 9,031 | $ | 32,371 | $ | 33,605 | $ | 42,407 | $ | 34,364 | |||||||||
Total assets | $ | 910,883 | $ | 308,059 | $ | 312,891 | $ | 332,635 | $ | 417,484 | |||||||||
Revolving credit facility | $ | 20,000 | $ | — | $ | — | $ | — | $ | — | |||||||||
Long-term debt, related party | $ | 22,500 | $ | — | $ | — | $ | — | $ | — | |||||||||
Other long-term obligations | $ | 30,160 | $ | 11,868 | $ | 12,416 | $ | 14,878 | $ | 15,821 | |||||||||
43
Item 7. Management's Discussion and Analysis of Financial Condition and Results of Operations
Overview
We are a leading provider of network communications solutions to telecommunications, wireless and cable service providers and enterprises across industry verticals. With over 1,000 customers around the globe, including some of the largest telecommunications service providers and enterprises in the world, we enable service providers and enterprises to modernize their communications networks and provide secure RTC solutions to their customers and employees. By securing and enabling reliable and scalable IP networks, we help service providers and enterprises adopt the next generation of software-based virtualized and cloud communications technologies to drive new, incremental revenue while protecting their existing revenue streams. Our solutions provide a secure way for our customers to connect and leverage multivendor, multiprotocol communications systems and applications across their networks and the cloud, around the world and in a rapidly changing ecosystem of IP-enabled devices such as smartphones and tablets. In addition, our solutions secure the evolution to cloud-based delivery of UC solutions - both for service providers transforming to a cloud-based network and for enterprises using cloud-based UC. We go to market through both direct sales and indirect channels globally, leveraging the assistance of resellers, and we provide ongoing support to our customers through a global services team with experience in design, deployment and maintenance of some of the world's largest IP networks.
We recently completed our Merger with GENBAND in October 2017. As a result of the Merger, we believe we are better positioned to enable network transformations to IP and to cloud-based networks for service providers and enterprise customers worldwide, with a broader and deeper sales footprint, increased ability to invest in growth, more efficient and effective research and development, and a comprehensive RTC product offering.
Business Acquisitions
On October 27, 2017 (the "Merger Date"), Sonus Networks, Inc. ("Sonus") consummated an acquisition as specified in an Agreement and Plan of Merger (the “Merger Agreement”) with Solstice Sapphire Investments, Inc. ("NewCo") and certain of its wholly-owned subsidiaries, GENBAND Holdings Company, GENBAND Inc. and GENBAND II, INC. (collectively, "GENBAND") such that, following a series of mergers (collectively, the "Merger"), Sonus and GENBAND each became a wholly-owned subsidiary of NewCo.
Pursuant to the Merger Agreement, NewCo issued 50.9 million shares to the GENBAND equity holders, with the number of shares issued in the aggregate to the GENBAND equity holders equal to the number of shares of Sonus common stock outstanding immediately prior to the closing date of the Merger, such that former stockholders of Sonus would own approximately 50%, and former shareholders of GENBAND and the two related holding companies would own approximately 50%, of the shares of NewCo common stock issued and outstanding immediately following the consummation of the Merger.
The Merger has been accounted for as a business combination and the financial results of GENBAND have been included in our consolidated financial statements beginning on the Merger Date. On November 28, 2017, the Company changed its name to "Ribbon Communications Inc."
On September 26, 2016 (the "Taqua Acquisition Date"), we acquired Taqua, LLC ("Taqua"), a leading supplier of IP communications systems, applications and services to mobile and fixed operators. Taqua enables the transformation of software-based service provider networks to deliver next-generation voice, video and messaging services, including VoIP, VoWiFi and VoLTE. The financial results of Taqua are included in our consolidated financial statements beginning on the Taqua Acquisition Date.
On January 2, 2015 (the "Treq Asset Acquisition Date"), we acquired from Treq Labs, Inc. ("Treq") certain assets related to its business of designing, developing, marketing, selling, servicing and maintaining SDN technology, SDN controller software and SDN management software (the "SDN Business"). The SDN Business provides solutions that optimize networks for voice, video and UC for both enterprise and service provider customers. The financial results of the SDN Business are included in our consolidated financial statements beginning on the Treq Asset Acquisition Date.
44
Financial Overview
Financial Results
We reported losses from operations of approximately $55 million for 2017, $14 million for 2016 and $31 million for 2015. We reported net losses of approximately $35 million for 2017, $14 million for 2016 and $32 million for 2015.
Our revenue was approximately $330 million in 2017, $253 million in 2016 and $249 million in 2015. Our gross profit was approximately $201 million in 2017, $168 million in 2016 and $162 million in 2015. Our gross profit as a percentage of revenue ("total gross margin") was approximately 61% in 2017, 66% in 2016 and 65% in 2015.
Our operating expenses were approximately $257 million in 2017, compared to approximately $181 million in 2016 and approximately $193 million in 2015.
Our 2017 operating expenses included approximately $15 million of acquisition- and integration-related expenses, nearly all related to the Merger, and approximately $9 million of restructuring expense. Our 2017 restructuring expense was primarily related to severance and related costs.
Our 2016 operating expenses included approximately $1 million of acquisition- and integration-related costs for professional and services fees related to our acquisition of Taqua and approximately $3 million of restructuring expense, primarily comprised of approximately $2 million related to our 2016 Restructuring Initiative and approximately $1 million related to our Taqua Restructuring Initiative.
Our 2015 operating expenses included approximately $2 million of restructuring expense, comprised of approximately $4 million of expense related to our 2015 Restructuring Initiative, net of approximately $2 million of reversals of restructuring expense previously recorded in connection with our 2012 Restructuring Initiative.
We recorded stock-based compensation expense of approximately $26 million in 2017, $20 million in 2016 and $22 million in 2015. The expense recorded in 2017 includes approximately $9 million of incremental expense related to the acceleration of stock options and certain full value stock awards in connection with the Merger.
See "Results of Operations" in this Management's Discussion and Analysis of Financial Condition and Results of Operations ("MD&A") for additional discussion of our results of operations for the years ended December 31, 2017, 2016 and 2015.
Restructuring and Cost Reduction Initiatives
In connection with the Merger, we implemented a restructuring plan in the fourth quarter of 2017 to eliminate certain redundant positions and facilities within the combined companies (the "Merger Restructuring Initiative"). Accordingly, we recorded $8.5 million of restructuring expense in 2017 related to the Merger Restructuring Initiative. We believe that the payments related to the amount accrued at December 31, 2017 will be completed in 2018. We anticipate that we will record additional future expense in connection with this initiative for headcount and redundant facilities aggregating approximately $12 million. We believe that the payments related to this expected additional future expense will be completed by early 2019.
We assumed GENBAND's restructuring liability aggregating approximately $4 million at the Merger Date (the "GENBAND Restructuring Initiative"), primarily related to headcount reductions. We do not expect to record additional expense in connection with this initiative except for adjustments for changes in estimated costs. We expect that the payments related to this assumed liability will be completed in 2018.
In connection with the acquisition of Taqua, we implemented a restructuring plan in the third quarter of 2016 to eliminate certain redundant positions within the combined companies. On October 24, 2016, the Audit Committee of our Board of Directors (the "Audit Committee") approved a broader Taqua restructuring plan related to headcount and redundant facilities (collectively, the "Taqua Restructuring Initiative"). In connection with this initiative, we have recorded approximately $2 million of restructuring expense for severance and related costs and estimated costs related to the elimination of redundant facilities, including adjustments recorded for changes in cost estimates for the planned restructuring activities. The actions under the Taqua Restructuring Initiative have been implemented and accordingly, we do not expect to record additional expense in connection with this initiative. The amounts accrued for severance and related costs were fully paid by the end of the third quarter of 2017. We expect that the amounts accrued for facilities costs will be paid by the end of 2018.
45
On July 25, 2016, we announced a program (the "2016 Restructuring Initiative") to further accelerate our investment in new technologies as the communications industry migrates to a cloud-based architecture and pursues new strategic initiatives, such as new products and an expanded go-to-market footprint in selected geographies and discrete vertical markets. We have recorded an aggregate of approximately $2 million of restructuring expense in connection with this initiative, primarily for severance and related costs. The amounts accrued for severance and related costs were fully paid by the end of the third quarter of 2017. We expect that the amounts accrued for facilities will be paid by the end of October 2019.
To better align our cost structure to our then-current revenue expectations, in April 2015, we announced a cost reduction review. On April 16, 2015, we initiated a restructuring plan to reduce our workforce by approximately 150 positions, or approximately 13% of our worldwide workforce (the "2015 Restructuring Initiative"). We recorded nominal restructuring expense in 2016 and approximately $4 million in 2015 in connection with the 2015 Restructuring Initiative. We made the final payments in connection with this initiative in 2017 and do not expect to either incur additional expense or make additional payments in the future related to the 2015 Restructuring Initiative.
Critical Accounting Policies and Estimates
Management's discussion and analysis of the financial condition and results of operations is based upon our consolidated financial statements, which have been prepared in accordance with accounting principles generally accepted in the United States of America. The preparation of these financial statements requires us to make estimates and judgments that affect the reported amounts of assets, liabilities, revenues and expenses, and related disclosure of contingent assets and liabilities. We base our estimates and judgments on historical experience, knowledge of current conditions and beliefs of what could occur in the future given available information. We consider the following accounting policies to be both those most important to the portrayal of our financial condition and those that require the most subjective judgment. If actual results differ significantly from management's estimates and projections, there could be a material effect on our consolidated financial statements. The significant accounting policies that we believe are the most critical include revenue recognition, the valuation of inventory, loss contingencies and reserves, stock-based compensation, business combinations, goodwill and intangible assets, and accounting for income taxes.
Revenue Recognition. We recognize revenue from sales when persuasive evidence of an arrangement exists, delivery has occurred, the sale price is fixed or determinable, and collectability of the related receivable is probable. When we have future obligations, including a requirement to deliver additional elements that are essential to the functionality of the delivered elements or when customer acceptance is required, we defer revenue recognition and related costs until those obligations are satisfied. Likewise, when fees for products or services are not fixed and determinable, we defer the recording of receivables, deferred revenue and revenue until such time as the fees become due or are collected. We limit the amount of revenue recognition for delivered elements to the amount that is not contingent on the future delivery of products or services, future performance obligations, or subject to customer-specific return, exchange or refund provisions.
Revenue from maintenance and support services is generally recognized ratably over the service period. Maintenance revenue is deferred until the associated product is accepted by the customer and all other revenue recognition criteria have been met. Maintenance and support services include telephone support, return and repair support and unspecified rights to product upgrades and enhancements. Revenue from other professional services is typically recognized as the services are delivered if all other revenue recognition criteria have been met.
Our products typically have both software and non-software components that function together to deliver the products' essential functionality. Many of our sales involve multiple-element arrangements that include both software and hardware-related products, maintenance and various professional services. We recognize revenue in accordance with the provisions of Accounting Standards Codification ("ASC") 605-25, Revenue Recognition - Multiple-Element Arrangements ("ASC 605-25") for transactions that include both hardware and software components. We recognize revenue from stand-alone software sales under the software revenue recognition guidance in ASC 985-605, Software - Revenue Recognition ("ASC 985-605").
For multiple-element arrangements that include both software-only products and non-software products, we allocate the total arrangement consideration to the software-only deliverables as a group and to the individual non-software deliverables based on their relative selling prices. If an undelivered element (such as maintenance and support services) relates to both the software-only and non-software deliverables, we bifurcate the consideration allocated to the undelivered element (such as maintenance and support services) into a non-software component and the software-only component using the relative selling price method. The consideration allocated to the non-software and software-only deliverables is recognized in accordance with the applicable guidance as discussed within this critical accounting policy.
46
For transactions that include multiple elements, arrangement consideration is allocated to each element based on the relative selling prices of all of the elements in the arrangement using the fair value hierarchy as required by ASC 605-25.
Consistent with the methodology under the previous accounting guidance, we establish VSOE based upon the price charged when the same element is sold separately or established by management having the relevant pricing authority. We have VSOE for certain of our maintenance and support services and certain professional services. When VSOE exists, it is used to determine the selling price of a deliverable. We have not been able to establish VSOE on some of our products and for certain of our services because we have not sold such products or services on a stand-alone basis, not priced such products or services within a narrow range, or had limited sales history.
When VSOE is not established, we attempt to establish the selling price of each element based on TPE. Our solution typically differs from that of our peers as there are no similar or interchangeable competitor products or services. Our various product, service and maintenance offerings contain a significant level of unique features and functionality and therefore, comparable pricing of competitors' products and services with similar functionality cannot be obtained. Accordingly, we are not able to determine TPE for our products or services.
When we are unable to establish selling price using VSOE or TPE, we use ESP in our allocation of arrangement consideration for the relevant deliverables. The objective of ESP is to determine the price at which we would transact a sale if a product or service was sold on a stand-alone basis. We determine ESP for our products and certain services by considering multiple factors including, but not limited to, overall market conditions, such as geographic or regional-specific market factors, profit objectives and pricing practices for such deliverables. The determination of ESP is a formal process within the Company that includes review and approval by our management.
We sell the majority of our products directly to our end customers. For products sold to resellers and distributors, we recognize revenue on a sell-through basis.
Effective January 1, 2018, we adopted Accounting Standards Update ("ASU") 2014-09, Revenue from Contracts with Customers ("ASU 2014-09"), along with additional ASUs which, among other things, clarified the implementation of the new revenue guidance and delayed the adoption by one year, to January 1, 2018 (collectively, the "New Revenue Standard"). We will utilize the modified retrospective approach. The New Revenue Standard replaces most of the existing revenue recognition standards and includes expanded disclosure requirements. For a further discussion of the New Revenue Standard, see "Recent Accounting Pronouncements" in this MD&A.
Valuation of Inventory. We review inventory for both potential obsolescence and potential loss of value periodically. In this review, we make assumptions about the future demand for and market value of the inventory and, based on these assumptions, estimate the amount of any excess, obsolete or slow-moving inventory.
We write down our inventories if they are considered to be obsolete or at levels in excess of forecasted demand. In these cases, inventory is written down to estimated realizable value based on historical usage and expected demand. Inherent in our estimates of market value in determining inventory valuation are estimates related to economic trends, future demand for our products and technical obsolescence of our products. If future demand or market conditions are less favorable than our projections, additional inventory write-downs could be required and would be reflected in the cost of revenue in the period the revision is made. To date, we have not been required to revise any of our assumptions or estimates used in determining our inventory valuations.
We write down our evaluation equipment at the time of shipment to our customers, as it is not probable that the inventory value will be realizable.
Loss Contingencies and Reserves. We are subject to ongoing business risks arising in the ordinary course of business that affect the estimation process of the carrying value of assets, the recording of liabilities and the possibility of various loss contingencies. An estimated loss contingency is accrued when it is probable that a liability has been incurred or an asset has been impaired and the amount of loss can be reasonably estimated. We regularly evaluate current information available to determine whether such amounts should be adjusted and record changes in estimates in the period they become known. We are subject to various legal claims. We reserve for legal contingencies and legal fees when the amounts are probable and reasonably estimable.
Stock-Based Compensation. Our stock-based compensation cost is measured at the grant date based on the fair value of the award and is recognized as expense over the requisite service period, which is generally the vesting period.
47
We use the Black-Scholes valuation model for estimating the fair value on the date of grant of employee stock options. Determining the fair value of stock option awards at the grant date requires judgment regarding certain valuation assumptions, including the volatility of our stock price, expected term of the option, risk-free interest rate and expected dividends. Changes in such assumptions and estimates could result in different fair values and could therefore impact our earnings. Such changes, however, would not impact our cash flows. The fair value of restricted stock awards, restricted stock units and performance-based awards is based upon our stock price on the grant date.
In 2015, we began to grant performance-based stock units that include a market condition to certain of our executives. We use a Monte Carlo simulation approach to model future stock price movements based upon the risk-free rate of return, the volatility of each entity, and the pair-wise covariance between each entity. These results are then used to calculate the grant date fair values of the performance-based stock units.
The amount of stock-based compensation expense recorded in any period for unvested awards requires estimates of the amount of stock-based awards that are expected to be forfeited prior to vesting, as well as assumptions regarding the probability that performance-based stock awards will be earned.
Business Combinations. We allocate the purchase price of acquired companies to identifiable assets acquired and liabilities assumed at their acquisition date fair values. Goodwill as of the acquisition date is measured as the excess of consideration transferred over the net of the acquisition date fair values of the assets acquired and the liabilities assumed and represents the expected future economic benefits arising from other assets acquired in the business combination that are not individually identified and separately recognized. Significant management judgments and assumptions are required in determining the fair value of assets acquired and liabilities assumed, particularly acquired intangible assets which are principally based upon estimates of the future performance and cash flows expected from the acquired business and applied discount rates. While we use our best estimates and assumptions as part of the purchase price allocation process to accurately value assets acquired and liabilities assumed at a business combination date, our estimates and assumptions are inherently uncertain and subject to refinement. If different assumptions are used, it could materially impact the purchase price allocation and our financial position and results of operations. Any adjustments to assets acquired or liabilities assumed subsequent to the purchase price allocation period are included in operating results in the period in which the adjustments are determined. Intangible assets typically are comprised of developed technology, trademarks and trade names, customer contracts/relationships, order backlog, internal use software and covenants not to compete.
Goodwill and Intangible Assets. Goodwill is not amortized, but instead is tested for impairment at least annually or if indicators of potential impairment exist. Intangible assets with estimated lives and other long-lived assets are reviewed for impairment when events or changes in circumstances indicate that the carrying amount of an asset may not be recoverable. Recoverability of intangible assets with estimated lives and other long-lived assets is measured by comparing the carrying amount of the asset to future net undiscounted pretax cash flows expected to be generated by the asset. If these comparisons indicate that an asset is not recoverable, we will recognize an impairment loss for the amount by which the carrying value of the asset exceeds the related estimated fair value.
Estimated fair value is based on either discounted future pretax operating cash flows or appraised values. Considerable judgment is required to estimate discounted future operating cash flows. Judgment is also required in determining whether an event has occurred that may impair the value of goodwill or identifiable intangible or other long-lived assets. Factors that could indicate an impairment may exist include significant underperformance relative to plan or long-term projections, strategic changes in business strategy, significant negative industry or economic trends, a significant change in circumstances relative to a large customer, a significant decline in our stock price for a sustained period and a decline in our market capitalization to below net book value. We must make assumptions about future cash flows, future operating plans, discount rates and other factors in the models and valuation reports. To the extent these future projections and estimates change, the estimated amounts of impairment could differ from current estimates.
Our annual testing for impairment of goodwill is completed as of November 30. We operate as a single operating segment with one reporting unit and consequently evaluate goodwill for impairment based on an evaluation of the fair value of our company as a whole. We performed our step one assessments for 2017, 2016 and 2015 and determined that our market capitalization was significantly in excess of our carrying value. Subsequent to December 31, 2017, our market capitalization declined to a value less than our book value. Should our market capitalization remain at less than our book value, this may indicate a triggering event and we may be required to undertake an interim goodwill impairment test.
Accounting for Income Taxes. Our provision for income taxes is comprised of a current and a deferred portion. The current income tax provision is calculated as the estimated taxes payable or refundable on tax returns for 2017. We provide for deferred income taxes resulting from temporary differences between financial and taxable income. Such differences arise
48
primarily from tax net operating loss ("NOL") and credit carryforwards, depreciation, deferred revenue, stock-based compensation expense, accruals and reserves.
We assess the recoverability of any tax assets recorded on the balance sheet and provide any necessary valuation allowances as required. In evaluating our ability to recover our deferred tax assets, we consider all available positive and negative evidence including our past operating results, the existence of cumulative income in the most recent years, changes in the business in which we operate and our forecast of future taxable income. In determining future taxable income, we are responsible for assumptions utilized, including the amount of state, federal and international pre-tax operating income, the reversal of temporary differences and the implementation of feasible and prudent tax planning strategies. These assumptions require significant judgment about the forecasts of future taxable income and are consistent with the plans and estimates we are using to manage our underlying businesses. Such assessment is completed on a jurisdiction by jurisdiction basis.
At December 31, 2017, we had valuation allowances of approximately $73 million to offset net domestic deferred tax assets of approximately $74 million. In addition, we had valuation allowances to offset Canada Scientific Research and Experimental Development ("SRED") credits carryovers of approximately $10 million and Ireland net deferred tax assets of $6 million. In the event we determine it is more likely than not that we will be able to use a deferred tax asset in the future in excess of its net carrying value, the valuation allowance would be reduced, thereby increasing net earnings and increasing equity in the period such determination is made. We have recorded net deferred tax assets in some of our international subsidiaries. These amounts could change in future periods based upon our operating results and changes in tax law.
We provide for income taxes during interim periods based on the estimated effective tax rate for the full year. We record a cumulative adjustment to the tax provision in an interim period in which a change in the estimated annual effective tax rate is determined.
We have provided for income taxes on the undistributed earnings of our non-U.S. subsidiaries as of December 31, 2017, with the exception of the Company's Irish subsidiary, as we do not plan to permanently reinvest these amounts outside the United States. The repatriation of the undistributed earnings would result in withholding taxes imposed on the repatriation. Consequently, we have recorded a tax liability of $3.2 million, consisting primarily of withholding and distribution taxes, relating to undistributed earnings from these subsidiaries as of December 31, 2017. Had the earnings of the Irish subsidiary been determined to not be permanently reinvested outside the U.S., no additional deferred tax liability would be required due to no withholding taxes or income tax expense being imposed on such repatriation.
We assess all material positions taken in any income tax return, including all significant uncertain positions, in all tax years that are still subject to assessment or challenge by relevant taxing authorities. Assessing an uncertain tax position begins with the initial determination of the position's sustainability and is measured at the largest amount of benefit that has a greater than 50% likelihood of being realized upon ultimate settlement. As of each balance sheet date, unresolved uncertain tax positions must be reassessed, and we will determine whether (i) the factors underlying the sustainability assertion have changed and (ii) the amount of recognized tax benefit is still appropriate. The recognition and measurement of tax benefits require significant judgment. Judgments concerning the recognition and measurement of a tax benefit might change as new information becomes available.
On December 22, 2017, the U.S. government enacted comprehensive tax legislation commonly referred to as the Tax Cuts and Jobs Act (the "Tax Act"). The Tax Act makes broad and complex changes to the U.S. tax code, including, but not limited to: reducing the U.S. federal corporate tax rate from 35% to 21%; requiring companies to pay a one-time transition tax on certain unrepatriated earnings of foreign subsidiaries; generally eliminating U.S. federal income taxes on dividends from foreign subsidiaries; requiring a current inclusion in U.S. federal taxable income of certain earnings (Global Intangible Low-taxed Income) of controlled foreign corporation; eliminating the corporate alternative minimum tax ("AMT") and changing how existing AMT credits can be realized; creating the base erosion anti-abuse tax; creating a new limitation on deductible interest expense; changing rules related to uses and limitations of net operating loss carryforwards created in tax years beginning after December 31, 2017; providing a tax deduction for foreign-derived intangible income; and changing rules related to deductibility of compensation for certain officers.
The impact of certain effects of the Tax Act has been recognized in the period in which the new legislation was enacted per guidance in Staff Accounting Bulletin 118, which allows for a measurement period to complete the accounting for certain elements of the tax reform. We have not yet completed a full evaluation of the impact of the Tax Act on our financial statements, however, we have provided a reasonable estimate for the impact related to remeasured deferred tax assets based on the new federal income tax rate of 21%. We have also provided for the provisional impact related to the Tax Act's change to the federal NOL and AMT carryovers. The total estimated impact of $5 million is reflected in income from continuing operations, and increased the tax benefit for the year ended December 31, 2017. We will continue to make and refine our calculations as
49
additional analysis is completed. We cannot predict with certainty how the Tax Act will affect the Company's financial position or results of operations.
Results of Operations
Years Ended December 31, 2017 and 2016
Revenue. Revenue for the years ended December 31, 2017 and 2016 was as follows (in millions, except percentages):
Year ended December 31, | Increase from prior year | |||||||||||||
2017 | 2016 | $ | % | |||||||||||
Product | $ | 181.1 | $ | 146.4 | $ | 34.7 | 23.7 | % | ||||||
Service | 148.8 | 106.2 | 42.6 | 40.1 | % | |||||||||
Total revenue | $ | 329.9 | $ | 252.6 | $ | 77.3 | 30.6 | % | ||||||
Product revenue is comprised of sales of our network transformation, security and applications solutions. The increase in product revenue in 2017 compared to 2016 was primarily the result of the inclusion GENBAND's product revenue approximating $38 million for the period since the Merger Date, approximately $20 million of higher sales of our security and application products and the inclusion of approximately $4 million of 2017 product revenue from Taqua. These increases were partially offset by net decreases in sales of certain other products, primarily our legacy gateway products.
In 2017, approximately 24% of our product revenue was from indirect sales through our channel partner program, compared to approximately 26% in 2016.
In 2017, approximately 20% of our product revenue was attributable to sales to enterprise customers, compared to approximately 19% in 2016. These sales were made through both our direct sales team and indirect sales channel partners.
The timing of the completion of customer projects, revenue recognition criteria satisfaction and customer payments may cause our product revenue to fluctuate from one period to the next.
Service revenue is primarily comprised of hardware and software maintenance and support (“maintenance revenue”) and network design, installation and other professional services (“professional services revenue”).
Service revenue for the years ended December 31, 2017 and 2016 was comprised of the following (in millions, except percentages):
Year ended December 31, | Increase from prior year | |||||||||||||
2017 | 2016 | $ | % | |||||||||||
Maintenance | $ | 114.7 | $ | 87.0 | $ | 27.7 | 31.9 | % | ||||||
Professional services | 34.1 | 19.2 | 14.9 | 77.4 | % | |||||||||
Total service revenue | $ | 148.8 | $ | 106.2 | $ | 42.6 | 40.1 | % | ||||||
Our maintenance revenue increased in 2017 compared to 2016 primarily due to the inclusion of approximately $21 million of revenue attributable to GENBAND in 2017 for the period since the Merger Date and the inclusion of approximately $5 million of revenue attributable to Taqua.
The increase in our professional services revenue in 2017 compared to 2016 was primarily due to the inclusion of approximately $10 million of revenue attributable to GENBAND in 2017 for the period since the Merger Date, coupled with an increase in the volume of network transformation solutions projects completed in 2017 compared to 2016.
The timing of the completion of customer projects, revenue recognition criteria satisfaction, customer payments and maintenance contract renewals may cause our services revenue to fluctuate from one period to the next.
50
The following customers contributed 10% or more of our revenue in the years ended December 31, 2017 and 2016:
Year ended December 31, | |||
2017 | 2016 | ||
Verizon Communications Inc. | 17% | * | |
AT&T Inc. | * | 12% | |
Revenue earned from customers domiciled outside the United States was approximately 34% of revenue in 2017 and approximately 31% of revenue in 2016. Due to the timing of project completions, we expect that the domestic and international components as a percentage of our revenue may fluctuate from quarter to quarter and year to year.
Our deferred product revenue was approximately $22 million at December 31, 2017 and approximately $7 million at December 31, 2016. Our deferred service revenue was approximately $93 million at December 31, 2017 and approximately $44 million at December 31, 2016. Our deferred revenue balance may fluctuate as a result of the timing of revenue recognition, customer payments, maintenance contract renewals, contractual billing rights and maintenance revenue deferrals included in multiple element arrangements.
We expect that our product revenue in 2018 will increase significantly compared to 2017 levels, primarily due to our acquisition of GENBAND.
We expect that our service revenue in 2018 will increase compared to 2017 levels due to the inclusion of GENBAND services revenue and the continued organic growth of our installed customer base. However, we expect to continue to encounter ongoing industry pricing pressure, third-party competition and legacy network product decommissioning.
Overall, we expect that total revenue in 2018 will be significantly higher than our 2017 total revenue due to the inclusion of GENBAND for a full year in 2018. However, we expect that our total revenue will decrease in the first quarter of 2018 and in the 2018 fiscal year compared to the combined revenues of Sonus and GENBAND in the comparable 2017 periods
In connection with the purchase price allocation to record our acquisition of GENBAND, we were required to record at fair value the assumed deferred revenue, resulting in a reduction of approximately $50 million to the assumed deferred revenue and future recognizable revenue. We expect that we will recognize approximately $22 million less revenue in 2018 than GENBAND would have recognized in the same period had we not acquired it. We expect that these purchase accounting-related reductions to future revenue will continue through 2020, primarily related to future service revenue.
Cost of Revenue/Gross Margin. Our cost of revenue consists primarily of amounts paid to third-party manufacturers for purchased materials and services, royalties and manufacturing and services personnel and related costs. Our cost of revenue and gross margins for the years ended December 31, 2017 and 2016 were as follows (in millions, except percentages):
Year ended December 31, | Increase from prior year | |||||||||||||
2017 | 2016 | $ | % | |||||||||||
Cost of revenue | ||||||||||||||
Product | $ | 70.2 | $ | 47.4 | $ | 22.8 | 48.3 | % | ||||||
Service | 58.2 | 37.6 | 20.6 | 54.7 | % | |||||||||
Total cost of revenue | $ | 128.4 | $ | 85.0 | $ | 43.4 | 51.1 | % | ||||||
Gross margin | ||||||||||||||
Product | 61.2 | % | 67.6 | % | ||||||||||
Service | 60.9 | % | 64.6 | % | ||||||||||
Total gross margin | 61.1 | % | 66.4 | % | ||||||||||
The decrease in product gross margin in 2017 compared to 2016 was primarily due to the inclusion of GENBAND since the Merger Date, which decreased our product gross margin by approximately seven percentage points, and impairment expense of approximately $6 million related to the write-off of one of our previously acquired developed technology intangible assets, which decreased our product gross margin by approximately four percentage points. These decreases were partially offset by the impact of our product and customer mix, particularly sales of certain of our security and applications products, which increased our product gross margin by approximately five percentage points in 2017.
The decrease in service gross margin in 2017 compared to 2016 was primarily due to the inclusion of GENBAND
51
expenses since the Merger Date, which decreased our service gross margin by approximately four percentage points. Although service revenue increased by approximately $43 million in 2017 compared to 2016, the increase in service costs of approximately $21 million contributed to the decline in gross margin. Our service cost of revenue is relatively fixed in advance of any particular quarter and therefore, changes in service revenue will typically have a significant impact on service gross margins.
We believe that our total gross margin will decrease in 2018 due primarily to the inclusion of amortization expense for acquired intangible assets arising from the GENBAND acquisition.
Research and Development Expenses. Research and development expenses consist primarily of salaries and related personnel expenses and prototype costs for the design, development, testing and enhancement of our products. Research and development expenses for the years ended December 31, 2017 and 2016 were as follows (in millions, except percentages):
Year ended December 31, | Increase from prior year | ||||||||||||
2017 | 2016 | $ | % | ||||||||||
$ | 101.5 | $ | 72.8 | $ | 28.7 | 39.3 | % | ||||||
The increase in research and development expenses in 2017 compared to 2016 was attributable to approximately $19 million of higher employee-related expenses, approximately $7 million of higher product development expense (i.e., third-party development, prototype and test equipment costs), approximately $2 million of higher infrastructure-related expense and approximately $1 million of net increases in other research and development costs. The increase in employee-related expenses was attributable to approximately $14 million of higher salary and related expenses, approximately $2 million of higher stock-based compensation expense and approximately $3 million of higher combined expense in connection with our company-wide bonus program and employee travel, training and related expenses. Our 2017 research and development expenses included approximately $17 million of expense attributable to GENBAND, primarily comprised of approximately $9 million of employee-related expenses, approximately $5 million of product development costs, approximately $1 million of depreciation expense and approximately $1 million of infrastructure expense.
Some aspects of our research and development efforts require significant short-term expenditures, the timing of which may cause significant variability in our expenses. We believe that rapid technological innovation is critical to our long-term success, and we are tailoring our investments to meet the requirements of our customers and market. We believe that our research and development expenses in 2018 will increase from 2017 levels due to the full year impact in 2018 of GENBAND research and development costs and our increased investment in our security strategy, partially offset by cost reductions resulting from our restructuring initiatives.
Sales and Marketing Expenses. Sales and marketing expenses consist primarily of salaries and related personnel costs, commissions, travel and entertainment expenses, promotions, customer trial and evaluations inventory and other marketing and sales support expenses. Sales and marketing expenses for the years ended December 31, 2017 and 2016 were as follows (in millions, except percentages):
Year ended December 31, | Increase from prior year | ||||||||||||
2017 | 2016 | $ | % | ||||||||||
$ | 83.4 | $ | 68.5 | $ | 14.9 | 21.7 | % | ||||||
The increase in sales and marketing expenses in 2017 compared to 2016 was primarily attributable to the inclusion of GENBAND's expenses, aggregating approximately $14 million, for the 2017 period since the Merger Date, primarily comprised of approximately $10 million of employee-related expenses, $3 million of amortization of acquired intangible assets and $2 million of infrastructure-related expense.
We believe that our sales and marketing expenses will increase in 2018 from 2017 levels due to the full year impact of the inclusion of GENBAND in 2018, partially offset by reductions resulting from our recent restructuring initiatives.
52
General and Administrative Expenses. General and administrative expenses consist primarily of salaries and related personnel costs for executive and administrative personnel, recruiting expenses and audit, legal and other professional fees. General and administrative expenses for the years ended December 31, 2017 and 2016 were as follows (in millions, except percentages):
Year ended December 31, | Increase from prior year | ||||||||||||
2017 | 2016 | $ | % | ||||||||||
$ | 47.6 | $ | 35.9 | $ | 11.7 | 32.5 | % | ||||||
Our 2017 general and administrative expenses included approximately $5 million of expense attributable to GENBAND in the period since the Merger Date. The increase in general and administrative expenses in 2017 compared to 2016 was attributable to approximately $10 million of higher employee-related expenses, approximately $3 million of higher professional fees (i.e., legal, audit and outside services) and approximately $2 million of expense accrued for potential fines in connection with the ongoing U.S. Securities and Exchange Commission ("SEC") investigation. These increases were partially offset by approximately $3 million of lower infrastructure costs.
We believe that our general and administrative expenses will modestly increase in 2018 compared to 2017, primarily due to the full year impact of GENBAND general and administrative expenses in 2018, partially offset by reductions in connection with our recent restructuring initiatives.
Acquisition- and Integration-Related Expenses. Acquisition- and integration-related expenses include those expenses related to acquisitions that we would otherwise not have been incurred. Acquisition-related expenses include professional and services fees, such as legal, audit, consulting, paying agent and other fees, and expenses related to cash payments to certain former executives of the acquired businesses in connection with their employment agreements. Integration-related expenses represent incremental costs related to combining the two companies, such as third-party consulting and other third-party services needed to merge the two separate companies' systems and processes. We recorded approximately $15 million of acquisition- and integration-related expenses in the year ended December 31, 2017, comprised of approximately $13 million of acquisition-related expense and approximately $2 million of integration expense. The acquisition-related expense was comprised of approximately $12 million for professional services fees and $1 million related to cash payments to certain former GENBAND executives. We recorded approximately $1 million of acquisition-related expenses in 2016 in connection with the acquisition of Taqua. We estimate that we will incur additional integration-related expenses in 2018 approximating $10 million.
Restructuring Expense. We have been committed to streamlining operations and reducing operating costs by closing and consolidating certain facilities and reducing our worldwide workforce. Please see the additional discussion of our restructuring initiatives in the "Restructuring and Cost Reduction Initiatives" section of the Overview of this Management's Discussion and Analysis of Financial Condition and Results of Operations.
We recorded net restructuring expense of approximately $9 million in 2017, comprised of approximately $9 million in connection with our Merger Restructuring Initiative, less than $1 million in connection with our Taqua Restructuring Initiative and less than $1 million in connection with our 2016 Restructuring Initiative. The net restructuring expense recorded included reversals for changes in estimated costs totaling less than $1 million in the aggregate in connection with the GENBAND Restructuring Initiative, the Taqua Restructuring Initiative and the 2016 Restructuring Initiative. We recorded restructuring expense aggregating approximately $3 million in 2016, primarily for severance and related costs, comprised of approximately $2 million under our 2016 Restructuring Initiative and approximately $1 million related to our Taqua Restructuring Initiative.
Although we have eliminated positions as part of our restructuring initiatives, we continue to hire in certain areas that we believe are important to our future growth. Restructuring expense is reported separately in the consolidated statements of operations.
53
Interest Income, net. Interest income and interest expense for the years ended December 31, 2017 and 2016 were as follows (in millions, except percentages):
Year ended December 31, | Increase (decrease) from prior year | |||||||||||||
2017 | 2016 | $ | % | |||||||||||
Interest income | $ | 1.0 | $ | 0.9 | $ | 0.1 | 7.9 | % | ||||||
Interest expense | (0.7 | ) | (0.1 | ) | 0.6 | 591.8 | % | |||||||
Interest income, net | $ | 0.3 | $ | 0.8 | $ | (0.5 | ) | (65.8 | )% | |||||
Interest income consisted of interest earned on our cash equivalents, marketable securities and investments. Interest expense in 2017 was primarily comprised of interest on the outstanding revolving credit facility balance assumed in connection with the acquisition of GENBAND, amortization of debt issuance costs in connection with our revolving credit facilities and interest on capital lease obligations. Interest expense in 2016 was comprised of expense related to the amortization of debt issuance costs in connection with our revolving credit facility and expense related to interest on capital lease obligations.
Other Income, Net. Other income, net, in 2017 of approximately $1 million was primarily comprised of the gain on the sale of an intangible asset and foreign currency transaction gains. Other income, net, in 2016 of approximately $1 million was primarily comprised of gains from the sale of intangible assets.
Income Taxes. We recorded a benefit for income taxes of approximately $18 million in 2017 and a provision for income taxes of approximately $3 million in 2016. The benefit recorded in 2017 was primarily the result of the release of an approximately $16 million domestic valuation allowance as a result of net deferred tax liabilities acquired as part of the GENBAND acquisition. The expense recorded in 2016 was primarily related to foreign operations. During 2017 and 2016, we performed an analysis to determine if, based on all available evidence, we considered it more likely than not that some portion or all of the recorded deferred tax assets will not be realized in a future period. As a result of our evaluations, we concluded that there was insufficient positive evidence to overcome the more objective negative evidence related to our cumulative losses and other factors. Accordingly, we maintained a valuation against our domestic deferred tax asset. A similar analysis and conclusion was made with regard to the valuation allowance on the deferred tax assets of our Irish subsidiary. In analyzing the deferred tax assets related to our Canada subsidiaries, we concluded that it was more likely than not that the Canadian federal SRED credits would not be realized in a future period.
Years Ended December 31, 2016 and 2015
Revenue. Revenue for the years ended December 31, 2016 and 2015 was as follows (in millions, except percentages):
Year ended December 31, | Increase (decrease) from prior year | |||||||||||||
2016 | 2015 | $ | % | |||||||||||
Product | $ | 146.4 | $ | 141.9 | $ | 4.5 | 3.1 | % | ||||||
Service | 106.2 | 107.1 | (0.9 | ) | (0.8 | )% | ||||||||
Total revenue | $ | 252.6 | $ | 249.0 | $ | 3.6 | 1.4 | % | ||||||
The increase in product revenue in 2016 compared to 2015 was primarily the result of an increase in sales of our SBC products, which contributed approximately $5 million of higher product revenue in 2016 compared to 2015, and the inclusion of approximately $1 million of product revenue from Taqua in our 2016 results. These increases were partially offset by net decreases in sales of certain of our other products.
In 2016, approximately 26% of our product revenue recognized was from indirect sales through our channel partner program, compared to approximately 24% in 2015.
In both 2016 and 2015, our product revenue from sales to enterprise customers was approximately 19% of our total product revenue. These sales were made through both our direct sales team and indirect sales channel partners.
54
Service revenue for the years ended December 31, 2016 and 2015 was comprised of the following (in millions, except percentages):
Year ended December 31, | Increase (decrease) from prior year | |||||||||||||
2016 | 2015 | $ | % | |||||||||||
Maintenance | $ | 87.0 | $ | 89.3 | $ | (2.3 | ) | (2.6 | )% | |||||
Professional services | 19.2 | 17.8 | 1.4 | 7.9 | % | |||||||||
Total service revenue | $ | 106.2 | $ | 107.1 | $ | (0.9 | ) | (0.8 | )% | |||||
Our maintenance revenue decreased in 2016 compared to 2015, primarily due to customer mix, including merger activity among certain of our customers, and the timing of product shipments in 2016. This decrease was partially offset by the growth of our installed customer base, the timing of maintenance renewals and the acquisition of Taqua.
The increase in our professional services revenue in 2016 compared to 2015 was primarily due to an increase in volume of projects completed in 2016 compared to 2015. The timing of the completion of projects for revenue recognition, customer payments and maintenance contracts may cause our services revenue to fluctuate from one period to the next.
The following customer contributed 10% or more of our revenue in each of the years ended December 31, 2016 and 2015:
Year ended December 31, | |||||
2016 | 2015 | ||||
AT&T Inc. | 12 | % | 13 | % | |
Revenue earned from customers domiciled outside the United States was approximately 31% of total revenue in 2016 and approximately 29% of revenue in 2015.
Our deferred product revenue was approximately $7 million at December 31, 2016 and approximately $12 million at December 31, 2015. Our deferred service revenue was approximately $44 million at December 31, 2016 and approximately $34 million at December 31, 2015.
Cost of Revenue/Gross Margin. Cost of revenue and gross margins for the years ended December 31, 2016 and 2015 were as follows (in millions, except percentages):
Year ended December 31, | Increase (decrease) from prior year | |||||||||||||
2016 | 2015 | $ | % | |||||||||||
Cost of revenue | ||||||||||||||
Product | $ | 47.4 | $ | 50.5 | $ | (3.1 | ) | (6.1 | )% | |||||
Service | 37.6 | 36.9 | 0.7 | 1.9 | % | |||||||||
Total cost of revenue | $ | 85.0 | $ | 87.4 | $ | (2.4 | ) | (2.7 | )% | |||||
Gross margin | ||||||||||||||
Product | 67.6 | % | 64.4 | % | ||||||||||
Service | 64.6 | % | 65.5 | % | ||||||||||
Total gross margin | 66.4 | % | 64.9 | % | ||||||||||
The increase in product gross margin in 2016 compared to 2015 was primarily due to higher product revenue against certain fixed manufacturing costs, coupled with approximately $5 million of lower variable costs in connection with our inventory valuation, which increased our product gross margin in the aggregate by approximately three percentage points.
The decrease in service gross margin in 2016 compared to 2015 was primarily attributable to slightly higher fixed service costs, including the inclusion of Taqua expenses, and third-party costs, both against slightly lower revenue, each of which decreased our service gross margin by less than one percentage point.
Research and Development Expenses. Research and development expenses for the years ended December 31, 2016 and 2015 were as follows (in millions, except percentages):
55
Year ended December 31, | Decrease from prior year | ||||||||||||
2016 | 2015 | $ | % | ||||||||||
$ | 72.8 | $ | 77.9 | $ | (5.1 | ) | (6.5 | )% | |||||
The decrease in research and development expenses in 2016 compared to 2015 was primarily attributable to approximately $3 million of lower depreciation expense, approximately $1 million of lower expense for product development (i.e., third-party development, prototype and test equipment costs) and approximately $1 million of lower facilities-related expenses.
Sales and Marketing Expenses. Sales and marketing expenses for the years ended December 31, 2016 and 2015 were as follows (in millions, except percentages):
Year ended December 31, | Decrease from prior year | ||||||||||||
2016 | 2015 | $ | % | ||||||||||
$ | 68.5 | $ | 72.8 | $ | (4.3 | ) | (5.9 | )% | |||||
The decrease in sales and marketing expenses in 2016 compared to 2015 was attributable to approximately $5 million of lower employee-related expenses, approximately $1 million of lower consulting fees and less than $1 million of lower costs for facilities-related expenses and amortization of acquired intangible assets. These decreases were partially offset by approximately $2 million of net increases in other sales and marketing expenses. The decrease in employee-related expenses was attributable to approximately $2 million of lower salary and commissions and related expenses, approximately $2 million of lower employee travel, training and related expenses and approximately $1 million of lower stock-based compensation expense.
General and Administrative Expenses. General and administrative expenses for the years ended December 31, 2016 and 2015 were as follows (in millions, except percentages):
Year ended December 31, | Decrease from prior year | ||||||||||||
2016 | 2015 | $ | % | ||||||||||
$ | 35.9 | $ | 39.8 | $ | (3.9 | ) | (9.8 | )% | |||||
The decrease in general and administrative expenses in 2016 compared to 2015 was primarily attributable to approximately $3 million of lower employee-related expenses and approximately $1 million of lower combined costs from depreciation expense and professional fees. The decrease in employee-related expenses was primarily attributable to approximately $2 million of lower stock-based compensation expense and approximately $1 million of lower salary and related expenses.
Acquisition- and Integration-Related Expenses. We recorded approximately $1 million of acquisition-related expenses in 2016 in connection with the acquisition of Taqua and less than $1 million of acquisition-related expenses in 2015 in connection with the acquisition of the SDN Business.
Restructuring Expense. We recorded restructuring expense aggregating approximately $3 million in 2016, primarily comprised of approximately $2 million for severance and related costs under our 2016 Restructuring Initiative and approximately $1 million related to our Taqua Restructuring Initiative. The majority of the expense recorded in connection with our Taqua Restructuring Initiative was for severance and related costs, with a minor cost for the elimination of excess facilities.
We recorded approximately $2 million of restructuring expense in 2015, which was primarily comprised of approximately $4 million of expense for severance and related costs in connection with our 2015 Restructuring Initiative, partially offset by approximately $2 million of reversals of expense arising from settlements with landlords to vacate facilities for amounts that were lower than had previously been accrued.
56
Interest Income, net. Interest income and interest expense for the years ended December 31, 2016 and 2015 were as follows (in millions, except percentages):
Year ended December 31, | Increase (decrease) from prior year | |||||||||||||
2016 | 2015 | $ | % | |||||||||||
Interest income | $ | 0.9 | $ | 0.4 | $ | 0.5 | 113.3 | % | ||||||
Interest expense | (0.1 | ) | (0.2 | ) | (0.1 | ) | (51.3 | )% | ||||||
Interest income, net | $ | 0.8 | $ | 0.2 | $ | 0.6 | 271.5 | % | ||||||
Interest income consisted of interest earned on our cash equivalents, marketable securities and investments. Interest expense was related to interest on capital lease obligations and expense related to the amortization of debt issuance costs in connection with our revolving credit facility.
Other Income, Net. In 2016, we sold intangible assets and recognized gains aggregating approximately $1 million. We recorded $1 million of income in 2015 related to the sale of an intangible asset.
Income Taxes. We recorded provisions for income taxes of approximately $3 million in 2016 and $2 million in 2015, primarily related to foreign operations. The increase in 2016 was primarily the result of settling a foreign tax audit, which accounted for $0.6 million of incremental income tax expense in 2016 compared to 2015. The income tax benefits from the deferred tax assets recorded in connection with our 2016 domestic losses have been offset by an increase in the valuation allowance. During 2016 and 2015, we performed an analysis to determine if, based on all available evidence, we considered it more likely than not that some portion or all of the recorded deferred tax assets will not be realized in a future period. As a result of our evaluations, we concluded that there was insufficient positive evidence to overcome the more objective negative evidence related to our cumulative losses and other factors. Accordingly, we maintained a valuation against our domestic deferred tax asset.
Off-Balance Sheet Arrangements
We have no off-balance sheet arrangements that have or are reasonably likely to have a current or future material effect on our financial position, changes in financial position, revenues or expenses, results of operations, liquidity, capital expenditures or capital resources.
Liquidity and Capital Resources
Our consolidated statements of cash flows are summarized as follows (in millions):
Year ended December 31, | |||||||||||
2017 | 2016 | Change | |||||||||
Net loss | $ | (35.2 | ) | $ | (13.9 | ) | $ | (21.3 | ) | ||
Adjustments to reconcile net loss to cash flows used in operating activities | 35.0 | 35.0 | — | ||||||||
Changes in operating assets and liabilities | 8.3 | (1.9 | ) | 10.2 | |||||||
Net cash provided by operating activities | $ | 8.1 | $ | 19.2 | $ | (11.1 | ) | ||||
Net cash provided by (used in) investing activities | $ | 21.0 | $ | (27.3 | ) | $ | 48.3 | ||||
Net cash used in financing activities | $ | (4.5 | ) | $ | (9.9 | ) | $ | 5.4 | |||
Our cash, cash equivalents and short- and long-term investments totaled approximately $83 million at December 31, 2017 and $126 million at December 31, 2016. We had cash held by our non-U.S. subsidiaries aggregating approximately $14 million at December 31, 2017 and $5 million at December 31, 2016. If we elect to repatriate all of the funds held by our non-U.S. subsidiaries as of December 31, 2017, we do not believe that the amounts of potential withholding taxes that would arise from the repatriation would have a material effect on our liquidity.
On the Merger Date and in connection with the Merger, we assumed GENBAND's Senior Secured Credit Agreement with Silicon Valley Bank (the "Prior Credit Agreement"), which had outstanding borrowings and letters of credit totaling approximately $18 million and $3 million, respectively, and an average interest rate of 4.67%. GENBAND had entered into the Prior Credit Agreement with Silicon Valley Bank ("SVB") effective July 1, 2016. The Prior Credit Agreement had a maturity date of July 1, 2019 and provided for revolving loans, including letters of credit and swingline loans, not to exceed $50 million
57
in total, with potential further increases of up to $75 million available for a total revolving line of credit of up to $125 million.
On December 21, 2017, we entered into a Senior Secured Credit Agreement (the “Credit Facility”) with Silicon Valley Bank, which refinanced the Prior Credit Agreement. The Credit Facility includes $100 million of commitments, the full amount of which is available for revolving loans, a $15 million sublimit that is available for letters of credit and a $15 million sublimit that is available for swingline loans. The Credit Facility is scheduled to mature in December 2021, subject to a springing maturity if, on or before July 14, 2020, the existing promissory note issued to certain shareholders is not converted or extended to March 2022 or later. The Credit Facility includes procedures for additional financial institutions to become lenders, or for any existing lender to increase its commitment under the facility, subject to an available increase of $50 million for all incremental commitments under the Credit Facility without amendment.
The indebtedness and other obligations under the Credit Facility are unconditionally guaranteed on a senior secured basis by us and GENBAND US LLC, our wholly-owned domestic subsidiary (collectively, the “Guarantors”) and each of our other material U.S. domestic subsidiaries. The Credit Agreement is secured by first-priority liens on substantially all of our assets.
The Credit Facility requires periodic interest payments until maturity. We may prepay all revolving loans under the Credit Facility at any time without premium or penalty (other than customary LIBOR breakage costs), subject to certain notice requirements.
Revolving loans under the Credit Facility bear interest at our option at either the Eurodollar (LIBOR) rate plus a margin ranging from 2.50% to 3.00% per year or the base rate (the highest of the Federal Funds rate plus 0.50%, or the prime rate announced from time to time in The Wall Street Journal) plus a margin ranging from 1.50% to 2.00% per year (such margins being referred to as the “Applicable Margin”). The Applicable Margin varies depending on our consolidated leverage ratio (as defined in the Credit Facility). The base rate and the LIBOR rate are each subject to a zero percent floor.
We are charged a commitment fee ranging from 0.25% to 0.40% per year on the daily amount of the unused portions of the commitments under the Credit Facility. Additionally, with respect to all letters of credit outstanding under the Credit Facility, we are charged a fronting fee of 0.125% per year and an outstanding letter of credit fee equal to the Applicable Margin for base rate loans ranging from 1.50% to 2.00% times the amount of the outstanding letters of credit.
The Credit Facility includes financial covenants regarding its minimum consolidated quick ratio, minimum consolidated interest coverage ratio and maximum consolidated leverage ratio, all of which are defined in the Credit Facility and tested on a quarterly basis. In addition, the Credit Facility contains various covenants that, among other restrictions, limit our and our subsidiaries’ ability to enter into certain types of transactions, including, but not limited to: incurring or assuming indebtedness, making acquisitions or engaging in mergers, making investments, repurchasing equity and paying dividends, selling or otherwise transferring assets, changing the nature of our business and amending or making prepayments on certain junior debt. We were in compliance with all covenants of the Credit Facility at December 31, 2017.
The Credit Facility contains events of default that are customary for a secured credit facility. If an event of default relating to bankruptcy or other insolvency events with respect to a borrower occurs, all obligations under the Credit Facility will immediately become due and payable. If any other event of default exists under the Credit Facility, the lenders may accelerate the maturity of the obligations outstanding under the Credit Facility and exercise other rights and remedies, including charging a default rate of interest equal to 2.00% per year above the rate that would otherwise be applicable. In addition, if any event of default exists under the Credit Facility, the lenders may commence foreclosure or other actions against the collateral.
If any default exists under the Credit Facility, or if the Borrower is unable to make any of the representations and warranties as stated in the Credit Facility at the applicable time, the Borrower will be unable to borrow funds or have letters of credit issued under the Credit Facility, which, depending on the circumstances prevailing at that time, could have a material adverse effect on the Borrower’s liquidity and working capital.
On December 21, 2017, concurrently with the completion of the Credit Facility, we repaid in full all outstanding amounts under the Prior Credit Agreement and terminated the agreement. We did not incur any early termination penalties in connection with the termination of the Prior Credit Agreement.
At December 31, 2017, we had an outstanding debt balance of $20 million at an interest rate of 4.51% and approximately $3 million of outstanding letters of credit at an interest rate of 2.00% under the Credit Facility.
In connection with the Merger, on October 27, 2017, we issued a promissory note for approximately $23 million to certain of GENBAND's equity holders (the "Promissory Note"). The Promissory Note does not amortize and the principal thereon is
58
payable in full on the third anniversary of its execution. Interest on the promissory note is payable quarterly in arrears and accrues at a rate of 7.5% per year for the first six months after issuance, and thereafter at a rate of 10% per year. The failure to make any payment under the Promissory Note when due and, with respect to payment of any interest, the continuation of such failure for a period of thirty days thereafter, constitutes an event of default under the Promissory Note. If an event of default occurs under the Promissory Note, the payees may declare the entire balance of the Promissory Note due and payable (including principal and accrued and unpaid interest) within five business days of the payees' notification to the Company of such acceleration.
Sonus maintained a credit agreement by and among Sonus, as Borrower, Bank of America, N.A. ("Bank of America"), as Administrative Agent, Swing Line Lender and L/C Issuer, and the other lenders from time to time party thereto entered into on June 27, 2014 (as amended, the "Sonus Credit Agreement"). The Sonus Credit Agreement expired by its terms on June 30, 2017 and was not renewed. Sonus did not have any amounts outstanding under the Sonus Credit Agreement at December 31, 2016.
On July 29, 2013, Sonus announced that our Board of Directors had authorized a stock buyback program to repurchase up to $100 million of its common stock from time to time on the open market or in privately negotiated transactions. The stock buyback program was funded using Sonus' working capital. During the year ended December 31, 2016, Sonus repurchased and retired 1.3 million shares for approximately $10 million, including transaction fees. Sonus did not repurchase any shares in the year ended December 31, 2017. We did not assume the stock buyback program in connection with the Merger.
Our operating activities provided approximately $8 million of cash in 2017 and $19 million of cash in 2016.
Cash provided by operating activities in 2017 was primarily the result of higher deferred revenue and accounts payable, coupled with decreases in inventory and other operating assets. These were partially offset by higher accounts receivable and lower accrued expenses and other long-term liabilities, plus the impact of our net loss, adjusted for non-cash items. Deferred revenue balances may fluctuate as a result of the timing of invoicing and revenue recognition. The increase in accounts payable relates to the timing of purchases of both services and tangible goods and their related payment arrangements. The increase in accounts receivable primarily relates to higher revenue in 2017 compared to 2016, partially offset by our continued focus on our collections efforts. Our net loss, adjusted for non-cash items such as depreciation, amortization, stock-based compensation, impairment of intangible assets and deferred income taxes, was virtually break-even.
Cash provided by operating activities in 2016 was primarily the result of decreases in inventory and other operating assets and higher deferred revenue, partially offset by lower accrued expenses and accounts payable, higher accounts receivable and our net loss. The decrease in accrued expenses primarily relates to lower accruals in connection with our Company-wide cash bonus program, for which we changed the timing of bonus payments in 2016 such that a portion of the bonus was paid in August 2016 based on our results against certain internal goals for the first half of the year. Bonuses for the remainder of 2016 were paid in early 2017 based on our results for the second half of 2016. The increase in accounts receivable primarily relates to higher revenue in 2016 compared to 2015, partially offset by the results of our continued focus on our collections efforts. Deferred revenue balances may fluctuate as a result of timing of invoicing and revenue recognition. Our net loss, adjusted for non-cash items such as depreciation, amortization, stock-based compensation and deferred income taxes, provided approximately $21 million of cash.
Our investing activities provided approximately $21 million of cash in 2017 and used approximately $27 million of cash in 2016. In 2017, net sales of our investments in marketable securities provided approximately $67 million of cash, of which we used approximately $43 million to pay the cash consideration for GENBAND. We used approximately $4 million to purchase property and equipment. In 2016, we used approximately $21 million of cash, net of cash acquired, for business acquisitions, approximately $5 million of cash used for the purchase of property and equipment and approximately $3 million for net investments in marketable securities. The amount used for business acquisitions was comprised of $20 million, net of cash acquired, for the acquisition of Taqua and slightly under $1 million paid as the final consideration installment for the SDN Business.
Our financing activities used approximately $4 million of cash in 2017 and approximately $10 million of cash in 2016. The 2017 amount was primarily comprised of approximately $8 million used to pay withholding obligations related to the net share settlement of restricted and performance-based stock grants upon vesting and $1 million to pay debt issuance costs related to our Credit Agreement, partially offset by approximately $2 million of net borrowings against our Credit Agreement, $1 million of proceeds from the sale of our common stock in connection with our Amended and Restated 2000 Employee Stock Purchase Plan, as amended ("ESPP") and approximately $1 million of proceeds from the exercise of stock options. The 2016 amount was primarily comprised of approximately $10 million used for the repurchase of common stock under our stock buyback program.
59
Contractual Obligations
Our contractual obligations (both principal and interest) at December 31, 2017 consisted of the following (in millions):
Payments due by period | |||||||||||||||||||
Total | Less than 1 year | 1-3 years | 3-5 years | More than 5 years | |||||||||||||||
Capital lease obligations | $ | 0.9 | $ | 0.4 | $ | 0.5 | $ | — | $ | — | |||||||||
Operating lease obligations * | 57.6 | 14.7 | 17.7 | 9.3 | 15.9 | ||||||||||||||
Purchase obligations | 49.4 | 47.9 | 1.5 | — | — | ||||||||||||||
Restructuring severance obligations | 9.5 | 9.5 | — | — | — | ||||||||||||||
Debt obligations - principal ** | 42.5 | — | 22.5 | 20.0 | — | ||||||||||||||
Employee postretirement defined benefit plans | 1.1 | 0.1 | 0.1 | 0.1 | 0.8 | ||||||||||||||
Uncertain tax positions *** | 5.1 | 5.1 | — | — | — | ||||||||||||||
$ | 166.1 | $ | 77.7 | $ | 42.3 | $ | 29.4 | $ | 16.7 | ||||||||||
__________________________________
* | Includes restructuring payments aggregating approximately $1 million, approximately 50% of which is due in less than one year and the remainder is due in one to three years. Excludes current estimated sublease income aggregating approximately $1 million over the remaining lease terms of the restructured facilities. |
** | Debt obligations - principal represents both our Promissory Note payable of $22.5 million and the outstanding balance on our Credit Facility of $20 million at December 31, 2017. We periodically make payments and borrow on the revolving credit facility, and accordingly, we have included it in current liabilities in our consolidated balance sheet. However, we have reported the outstanding balance payment due in the table above in the "3-5 years" column based solely on the expiration date of the Credit Facility. |
*** | This liability is not subject to fixed payment terms and the amount and timing of payments, if any, that we will make related to this liability are not known. See Note 18 to our consolidated financial statements appearing in this Annual Report on Form 10-K for additional information. |
Based on our current expectations, we believe our current cash, cash equivalents, marketable debt securities, long-term investments and available borrowings under the Credit Agreement will be sufficient to meet our anticipated cash needs for working capital and capital expenditures for at least twelve months. The rate at which we will consume cash will be dependent on the cash needs of future operations, including changes in working capital, which will, in turn, be directly affected by the levels of demand for our products, the timing and rate of expansion of our business, the resources we devote to developing our products and any litigation settlements. We anticipate devoting substantial capital resources to continue our research and development efforts, to maintain our sales, support and marketing, to complete merger-related integration activities and for other general corporate activities. However, it is difficult to predict future liquidity requirements with certainty. See Note 22 to our consolidated financial statements for a description of our other contingencies.
Recent Accounting Pronouncements
In May 2014, the FASB issued ASU 2014-09, Revenue from Contracts with Customers (“ASU 2014-09”), its new standard on revenue from contracts with customers, along with additional ASUs which, among other things, clarified the implementation of the new revenue guidance and delayed the adoption by one year, to January 1, 2018 (collectively, the "New Revenue Standard" or "ASC 606"). The New Revenue Standard outlines a single comprehensive model for entities to use in accounting for revenue arising from contracts with customers and supersedes most current revenue recognition guidance, including industry-specific guidance. The core principle of the revenue model is that an entity recognizes revenue to depict the transfer of promised goods or services to customers in an amount that reflects the consideration to which the entity expects to be entitled in exchange for those goods or services. In applying the revenue model to contracts within its scope, an entity identifies the contract(s) with a customer, identifies the performance obligations in the contract, determines the transaction price, allocates the transaction price to the performance obligations in the contract and recognizes revenue when (or as) the entity satisfies a performance obligation. Certain of the New Revenue Standard's provisions also apply to transfers of nonfinancial assets, including in-substance nonfinancial assets that are not an output of an entity’s ordinary activities (i.e., property, plant and equipment; real estate; or intangible assets). Existing accounting guidance applicable to these transfers has been amended or superseded. Effective January 1, 2018, we adopted the New Revenue Standard using the modified retrospective option, and have substantially completed the implementation of ASC 606 and have identified the necessary
60
changes to our policies, processes, systems and controls. However, due to the recent acquisition of GENBAND, we have not yet completed all of our internal control procedures. Under the modified retrospective method, we are applying the New Revenue Standard to all contracts not yet completed as of January 1, 2018, recognizing in beginning Accumulated deficit an adjustment for the cumulative effect of the change and providing additional disclosures comparing results to those as if we were still following the previous accounting standards. Currently, we do not have VSOE for certain elements in software bundled arrangements, which results in revenue being recognized ratably over the longest performance period. The majority of our transition adjustment will be related to these arrangements. We currently expect that the adjustment to decrease Accumulated deficit as a result of this change will not exceed $15 million. Additionally, we expect to capitalize certain commission costs resulting directly from securing contracts which are currently expensed. We expect this to result in the capitalization of approximately $1 million of previously expensed commissions.
In May 2017, the Financial Accounting Standards Board ("FASB") issued Accounting Standards Update ("ASU") 2017-09, Compensation - Stock Compensation (Topic 718): Scope of Modification Accounting ("ASU 2017-09"), which amends the scope of modification accounting for share-based payment arrangements such that an entity would not apply modification accounting if the fair value, vesting conditions and classification of the awards are the same immediately before and after the modification. ASU 2017-09 is effective for us beginning January 1, 2018 for both interim and annual reporting periods. We do not expect the adoption of ASU 2017-09 will have a material impact on our consolidated financial statements.
In March 2017, the FASB issued ASU 2017-07, Compensation - Retirement Benefits (Topic 715): Improving the Presentation of Net Periodic Pension Cost and Net Periodic Post Retirement Benefit Cost ("ASU 2017-07"). ASU 2017-07 amends the requirements in ASC 715 to require entities to disaggregate the current-service-cost component from the other components of net benefit cost (the "other components") and include it with other current compensation costs for related employees, present the other components elsewhere in the income statement and outside of income from operations if such a subtotal is presented and disclose the income statement lines that contain the other components if they are not presented on appropriately described separate lines. ASU 2017-07 is effective for us beginning January 1, 2018 for both interim and annual reporting periods. We do not expect the adoption of ASU 2017-07 will have a material impact on our consolidated financial statements.
In January 2017, the FASB issued ASU 2017-04, Intangibles - Goodwill and Other (Topic 350): Simplifying the Test for Goodwill Impairment ("ASU 2017-04"), which removes the requirement to compare the implied fair value of goodwill with its carrying amount as part of step 2 of the goodwill impairment test by instead comparing the fair value of a reporting unit with its carrying amount and recognizing an impairment charge for the amount by which the carrying amount exceeds the reporting unit's fair value. ASU 2017-04 also clarifies the treatment of foreign currency translation adjustments to reporting units and the income tax effects on goodwill impairment loss measurement. ASU 2017-04 is effective prospectively for us beginning January 15, 2020, with early adoption permitted for interim or annual goodwill impairment tests performed on testing dates after January 1, 2017. We elected to early-adopt ASU 2017-04; such early adoption did not have a material impact on our consolidated financial results.
In October 2016, the FASB issued ASU 2016-16, Income Taxes (Topic 740): Intra-Entity Transfers of Assets Other Than Inventory ("ASU 2016-16"), which removes the prohibition in ASC 740, Income Taxes, against the immediate recognition of the current and deferred income tax effects of intra-entity transfers of assets other than inventory. ASU 2016-16 is effective for us beginning January 1, 2019 for both interim and annual reporting periods. We do not believe that the adoption of this standard will have a material impact on our consolidated financial statements.
In August 2016, the FASB issued ASU 2016-15, Statement of Cash Flows (Topic 230): Classification of Certain Cash Receipts and Cash Payments ("ASU 2016-15"), which adds or clarifies guidance on eight cash flow issues, including debt prepayment or debt extinguishment costs, settlement of zero-coupon debt instruments or certain other debt instruments, contingent consideration payments made after a business combination, proceeds from the settlement of insurance claims, proceeds from the settlement of corporate-owned life insurance policies, distributions received from equity method investees, beneficial interests in securitization transactions and separately identifiable cash flows and application of the predominance principle. ASU 2016-15 is effective for us beginning January 1, 2018 for both interim and annual reporting periods. Entities must apply the guidance retrospectively to all periods presented but may apply it prospectively from the earliest date practicable if retrospective application would be impracticable. We do not expect the adoption of ASU 2016-15 will have a material impact on our consolidated financial statements.
In June 2016, the FASB issued ASU 2016-13, Financial Instruments - Credit Losses (Topic 326): Measurement of Credit Losses on Financial Instruments ("ASU 2016-13"), which adds an impairment model that is based on expected losses rather than incurred losses. Under ASU 2016-13, an entity recognizes as an allowance its estimate of expected credit losses, which the FASB believes will result in more timely recognition of such losses. ASU 2016-13 is effective for us beginning January 1,
61
2020 for both interim and annual reporting periods, with early adoption permitted. We do not expect the adoption of ASU 2016-13 will have a material impact on our consolidated financial statements.
In March 2016, the FASB issued ASU 2016-09, Compensation - Stock Compensation (Topic 718): Improvements to Employee Share-Based Payment Accounting ("ASU 2016-09"), which simplifies several aspects of the accounting for employee share-based payment transactions, including the accounting for income taxes, forfeitures and statutory tax withholding requirements, as well as classification in the statement of cash flows. ASU 2016-09 became effective for us beginning January 1, 2017 for both interim and annual reporting periods. Under ASU 2016-09, we will now recognize unrealized excess tax benefits. Due to the full valuation allowance on our federal and state income taxes, the adoption of ASU 2016-09 did not have a material impact on our accounting for income taxes. Without the valuation allowance, we would have recognized an increased deferred tax asset approximating $5 million. We have elected to continue to apply forfeiture rates to the expense attribution related to stock options, restricted stock awards and restricted stock units, as we believe that such continued application results in more accurate expense attribution over the life of these equity grants.
In February 2016, the FASB issued ASU 2016-02, Leases (Topic 842) Section A - Leases: Amendments to the FASB Accounting Standards Codification ("ASU 2016-02"), its new standard on accounting for leases. ASU 2016-02 introduces a lessee model that brings most leases onto the balance sheet. ASU 2016-02 eliminates the current GAAP requirement for an entity to use bright-line tests in determining lease classification. ASU 2016-02 is effective for us for both interim and annual periods beginning January 1, 2019. Upon adoption of ASU 2016-02, we will recognize lease obligations for the right to use these assets in connection with our existing lease agreements. We are currently assessing the potential impact of the adoption of ASU 2016-02 on our consolidated financial statements and accordingly, such amounts to be recognized in the balance sheet have yet to be determined.
In July 2015, the FASB issued ASU 2015-11, Simplifying the Measurement of Inventory ("ASU 2015-11"), which simplifies the measurement of inventory by requiring entities to measure most inventory at the lower of cost and net realizable value, replacing the previous requirement to measure most inventory at the lower of cost or market. ASU 2015-11 does not apply to inventories that are measured by using either the last-in, first-out method or the retail inventory method. ASU 2015-11 became effective for us for both interim and annual reporting periods beginning January 1, 2017. The adoption of ASU 2015-11 did not have a material impact on our consolidated financial statements.
Item 7A. Quantitative and Qualitative Disclosures About Market Risk
We are exposed to a variety of market risks, including changes in interest rates affecting the return on our investments and foreign currency fluctuations.
At December 31, 2017, our cash, cash equivalents, marketable securities and long-term investments totaled $83 million. We maintain an investment portfolio of various holdings, types and maturities which may include money market funds, commercial paper, corporate notes, certificates of deposit and government debt securities. A sharp rise in market interest rates could have a material adverse impact on the fair value of our investment portfolio. Conversely, declines in market interest rates could have a material impact on the interest earnings of our investment portfolio. We do not currently hedge these interest rate exposures. We place our investments with high quality issuers and have policies limiting, among other things, the amount of credit exposure to any one issuer. We seek to limit default risk by purchasing only investment grade securities. We manage potential losses in fair value by investing in relatively short-term investments, thereby allowing us to hold our investments to maturity. A hypothetical movement of plus or minus 50 basis points in market interest rates could affect the value of our investment portfolio by approximately $0.1 million for the year ended December 31, 2017. However, we have the ability to hold our investments until maturity, and therefore do not expect our operating results or cash flows to be affected to any significant degree by the effect of a sudden change in market interest rates on our investment portfolio.
Based on a hypothetical 10% adverse movement in all foreign currency exchange rates, our revenue for the year ended December 31, 2017 would have been adversely affected by approximately $2 million and our net loss for the year ended December 31, 2017 would have been adversely affected by approximately $6 million, although the actual effects may differ materially from this hypothetical analysis.
62
Item 8. Financial Statements and Supplementary Data
63
REPORT OF INDEPENDENT REGISTERED PUBLIC ACCOUNTING FIRM
To the Board of Directors and Stockholders of Ribbon Communications Inc.
Opinion on the Financial Statements
We have audited the accompanying consolidated balance sheets of Ribbon Communications Inc. and subsidiaries (the "Company") as of December 31, 2017 and 2016, the related consolidated statements of operations, comprehensive loss, stockholders' equity, and cash flows for each of the three years in the period ended December 31, 2017, and the related notes (collectively referred to as the "financial statements"). In our opinion, the financial statements present fairly, in all material respects, the financial position of the Company as of December 31, 2017 and 2016, and the results of its operations and its cash flows for each of the three years in the period ended December 31, 2017, in conformity with accounting principles generally accepted in the United States of America.
We have also audited, in accordance with the standards the Public Company Accounting Oversight Board (United States) (PCAOB), the Company's internal control over financial reporting as of December 31, 2017, based on criteria established in Internal Control - Integrated Framework (2013) issued by the Committee of Sponsoring Organizations of the Treadway Commission and our report dated March 8, 2018, expressed an unqualified opinion on the Company's internal control over financial reporting.
Basis for Opinion
These financial statements are the responsibility of the Company's management. Our responsibility is to express an opinion on the Company's financial statements based on our audits. We are a public accounting firm registered with the PCAOB and are required to be independent with respect to the Company in accordance with the U.S. federal securities laws and the applicable rules and regulations of the Securities and Exchange Commission and the PCAOB.
We conducted our audits in accordance with the standards of the PCAOB. Those standards require that we plan and perform the audit to obtain reasonable assurance about whether the financial statements are free of material misstatement, whether due to error or fraud. Our audits included performing procedures to assess the risks of material misstatement of the financial statements, whether due to error or fraud, and performing procedures that respond to those risks. Such procedures included examining, on a test basis, evidence regarding the amounts and disclosures in the financial statements. Our audits also included evaluating the accounting principles used and significant estimates made by management, as well as evaluating the overall presentation of the financial statements. We believe that our audits provide a reasonable basis for our opinion.
/s/ Deloitte & Touche LLP
Boston, Massachusetts
March 8, 2018
We have served as the Company's auditor since 2005.
64
RIBBON COMMUNICATIONS INC.
Consolidated Balance Sheets
(in thousands, except share and per share data)
December 31, 2017 | December 31, 2016 | ||||||
Assets | |||||||
Current assets: | |||||||
Cash and cash equivalents | $ | 57,073 | $ | 31,923 | |||
Marketable securities | 17,224 | 61,836 | |||||
Accounts receivable, net | 165,156 | 53,862 | |||||
Inventory | 21,303 | 18,283 | |||||
Other current assets | 21,463 | 12,010 | |||||
Total current assets | 282,219 | 177,914 | |||||
Property and equipment, net | 24,780 | 11,741 | |||||
Intangible assets, net | 244,414 | 30,197 | |||||
Goodwill | 335,716 | 49,393 | |||||
Investments | 9,031 | 32,371 | |||||
Deferred income taxes | 8,434 | 1,542 | |||||
Other assets | 6,289 | 4,901 | |||||
$ | 910,883 | $ | 308,059 | ||||
Liabilities and Stockholders' Equity | |||||||
Current liabilities: | |||||||
Revolving credit facility | $ | 20,000 | $ | — | |||
Accounts payable | 45,851 | 6,525 | |||||
Accrued expenses and other | 76,380 | 27,040 | |||||
Deferred revenue | 100,571 | 43,504 | |||||
Total current liabilities | 242,802 | 77,069 | |||||
Long-term debt, related party | 22,500 | — | |||||
Deferred revenue, net of current | 14,184 | 7,188 | |||||
Deferred income taxes | 2,787 | 3,047 | |||||
Other long-term liabilities | 13,189 | 1,633 | |||||
Total liabilities | 295,462 | 88,937 | |||||
Commitments and contingencies (Note 22) | |||||||
Stockholders' equity: | |||||||
Preferred stock, $0.01 par value; 10,000,000 shares authorized at December 31, 2017; 5,000,000 shares authorized at December 31, 2016; none issued and outstanding | — | — | |||||
Common stock, 240,000,000 shares authorized, $0.0001 par value, 101,752,856 shares issued and outstanding at December 31, 2017; 120,000,000 shares authorized, $0.001 par value, 49,041,881 shares issued and outstanding at December 31, 2016 | 10 | 49 | |||||
Additional paid-in capital | 1,684,768 | 1,250,744 | |||||
Accumulated deficit | (1,072,426 | ) | (1,037,174 | ) | |||
Accumulated other comprehensive income | 3,069 | 5,503 | |||||
Total stockholders' equity | 615,421 | 219,122 | |||||
$ | 910,883 | $ | 308,059 | ||||
See notes to the consolidated financial statements.
65
RIBBON COMMUNICATIONS INC.
Consolidated Statements of Operations
(in thousands, except per share data)
Year ended December 31, | |||||||||||
2017 | 2016 | 2015 | |||||||||
Revenue: | |||||||||||
Product | $ | 181,119 | $ | 146,381 | $ | 141,913 | |||||
Service | 148,823 | 106,210 | 107,121 | ||||||||
Total revenue | 329,942 | 252,591 | 249,034 | ||||||||
Cost of revenue: | |||||||||||
Product | 70,250 | 47,367 | 50,460 | ||||||||
Service | 58,196 | 37,613 | 36,917 | ||||||||
Total cost of revenue | 128,446 | 84,980 | 87,377 | ||||||||
Gross profit | 201,496 | 167,611 | 161,657 | ||||||||
Operating expenses: | |||||||||||
Research and development | 101,481 | 72,841 | 77,908 | ||||||||
Sales and marketing | 83,403 | 68,539 | 72,841 | ||||||||
General and administrative | 47,642 | 35,948 | 39,846 | ||||||||
Acquisition- and integration-related | 14,763 | 1,152 | 131 | ||||||||
Restructuring | 9,436 | 2,740 | 2,148 | ||||||||
Total operating expenses | 256,725 | 181,220 | 192,874 | ||||||||
Loss from operations | (55,229 | ) | (13,609 | ) | (31,217 | ) | |||||
Interest income, net | 263 | 769 | 207 | ||||||||
Other income, net | 1,274 | 1,424 | 1,122 | ||||||||
Loss before income taxes | (53,692 | ) | (11,416 | ) | (29,888 | ) | |||||
Income tax benefit (provision) | 18,440 | (2,516 | ) | (2,007 | ) | ||||||
Net loss | $ | (35,252 | ) | $ | (13,932 | ) | $ | (31,895 | ) | ||
Loss per share: | |||||||||||
Basic | $ | (0.60 | ) | $ | (0.28 | ) | $ | (0.64 | ) | ||
Diluted | $ | (0.60 | ) | $ | (0.28 | ) | $ | (0.64 | ) | ||
Shares used to compute loss per share: | |||||||||||
Basic | 58,822 | 49,385 | 49,560 | ||||||||
Diluted | 58,822 | 49,385 | 49,560 | ||||||||
See notes to the consolidated financial statements.
66
RIBBON COMMUNICATIONS INC.
Consolidated Statements of Comprehensive Loss
(in thousands)
Year ended December 31, | |||||||||||
2017 | 2016 | 2015 | |||||||||
Net loss | $ | (35,252 | ) | $ | (13,932 | ) | $ | (31,895 | ) | ||
Other comprehensive income (loss), net of tax: | |||||||||||
Foreign currency translation adjustments | (1,940 | ) | 54 | 9 | |||||||
Unrealized gain (loss) on available-for-sale marketable securities, net of reclassification adjustments for realized amounts | 146 | 51 | (15 | ) | |||||||
Employee retirement benefits | (578 | ) | — | — | |||||||
Other comprehensive income (loss), net of tax | (2,372 | ) | 105 | (6 | ) | ||||||
Comprehensive loss, net of tax | $ | (37,624 | ) | $ | (13,827 | ) | $ | (31,901 | ) | ||
See notes to the consolidated financial statements.
67
RIBBON COMMUNICATIONS INC.
Consolidated Statements of Stockholders' Equity
(in thousands, except share data)
Common stock | ||||||||||||||||||||||
Shares | Amount | Additional paid-in capital | Accumulated deficit | Accumulated other comprehensive income (loss) | Total stockholders' equity | |||||||||||||||||
Balances, January 1, 2015 | 49,357,033 | $ | 49 | $ | 1,226,226 | $ | (991,347 | ) | $ | 5,422 | $ | 240,350 | ||||||||||
Issuance of common stock in connection with employee stock purchase plan | 233,659 | 2,378 | 2,378 | |||||||||||||||||||
Exercise of stock options | 155,478 | 1,757 | 1,757 | |||||||||||||||||||
Vesting of restricted stock awards | 491,739 | 1 | 1 | |||||||||||||||||||
Vesting of performance-based stock awards and units | 45,901 | — | ||||||||||||||||||||
Shares of restricted stock returned to the Company under net share settlements to satisfy tax withholding obligations | (167,634 | ) | (2,344 | ) | (2,344 | ) | ||||||||||||||||
Repurchase of common stock | (642,387 | ) | (1 | ) | (7,916 | ) | (7,917 | ) | ||||||||||||||
Stock-based compensation expense | 21,699 | 21,699 | ||||||||||||||||||||
Reclassification of equity to liability for equity awards converted to cash bonuses | (997 | ) | (997 | ) | ||||||||||||||||||
Other comprehensive loss | (6 | ) | (6 | ) | ||||||||||||||||||
Net loss | (31,895 | ) | (31,895 | ) | ||||||||||||||||||
Balances, December 31, 2015 | 49,473,789 | 49 | 1,240,803 | (1,023,242 | ) | 5,416 | 223,026 | |||||||||||||||
Issuance of common stock in connection with employee stock purchase plan | 225,031 | 1,360 | 1,360 | |||||||||||||||||||
Exercise of stock options | 23,070 | 153 | 153 | |||||||||||||||||||
Vesting of restricted stock awards and units | 792,773 | 1 | (1 | ) | — | |||||||||||||||||
Vesting of performance-based stock awards and units | 18,438 | — | ||||||||||||||||||||
Shares of restricted stock returned to the Company under net share settlements to satisfy tax withholding obligations | (231,620 | ) | (1,810 | ) | (1,810 | ) | ||||||||||||||||
Repurchase of common stock | (1,259,600 | ) | (1 | ) | (9,529 | ) | (9,530 | ) | ||||||||||||||
Stock-based compensation expense | 19,768 | 19,768 | ||||||||||||||||||||
Other comprehensive income | 87 | 87 | ||||||||||||||||||||
Net loss | (13,932 | ) | (13,932 | ) | ||||||||||||||||||
Balances, December 31, 2016 | 49,041,881 | 49 | 1,250,744 | (1,037,174 | ) | 5,503 | 219,122 | |||||||||||||||
Issuance of common stock in connection with employee stock purchase plan | 249,621 | 1,252 | 1,252 | |||||||||||||||||||
Exercise of stock options | 105,688 | 617 | 617 | |||||||||||||||||||
Vesting of restricted stock awards and units | 2,160,553 | — | ||||||||||||||||||||
Vesting of performance-based stock units | 145,357 | — | ||||||||||||||||||||
Shares of restricted stock returned to the Company under net share settlements to satisfy tax withholding obligations | (807,952 | ) | (7,523 | ) | (7,523 | ) | ||||||||||||||||
Shares issued as consideration in connection with acquisition of GENBAND | 50,857,708 | 5 | 413,977 | 413,982 | ||||||||||||||||||
Stock-based compensation expense | 25,657 | 25,657 | ||||||||||||||||||||
Reclassification between Common stock and Additional paid-in capital to record change in par value of common stock | (44 | ) | 44 | — | ||||||||||||||||||
Other comprehensive loss | (2,434 | ) | (2,434 | ) | ||||||||||||||||||
Net loss | (35,252 | ) | (35,252 | ) | ||||||||||||||||||
Balances, December 31, 2017 | 101,752,856 | $ | 10 | $ | 1,684,768 | $ | (1,072,426 | ) | $ | 3,069 | $ | 615,421 | ||||||||||
See notes to the consolidated financial statements.
68
RIBBON COMMUNICATIONS INC.
Consolidated Statements of Cash Flows
(in thousands)
Year ended December 31, | |||||||||||
2017 | 2016 | 2015 | |||||||||
Cash flows from operating activities: | |||||||||||
Net loss | $ | (35,252 | ) | $ | (13,932 | ) | $ | (31,895 | ) | ||
Adjustments to reconcile net loss to cash flows provided by operating activities: | |||||||||||
Depreciation and amortization of property and equipment | 8,486 | 7,970 | 11,961 | ||||||||
Amortization of intangible assets | 17,112 | 7,500 | 7,107 | ||||||||
Stock-based compensation | 25,657 | 19,768 | 21,699 | ||||||||
Impairment of intangible assets | 5,471 | — | — | ||||||||
Deferred income taxes | (20,361 | ) | 1,088 | 752 | |||||||
Other | (1,340 | ) | (1,265 | ) | (784 | ) | |||||
Changes in operating assets and liabilities: | |||||||||||
Accounts receivable | (30,759 | ) | (851 | ) | 11,369 | ||||||
Inventory | 5,786 | 4,858 | (1,001 | ) | |||||||
Other operating assets | 269 | 506 | 4,915 | ||||||||
Accounts payable | 13,415 | (821 | ) | (1,257 | ) | ||||||
Accrued expenses and other long-term liabilities | (4,263 | ) | (7,778 | ) | (4,134 | ) | |||||
Deferred revenue | 23,859 | 2,149 | 1,137 | ||||||||
Net cash provided by operating activities | 8,080 | 19,192 | 19,869 | ||||||||
Cash flows from investing activities: | |||||||||||
Purchases of property and equipment | (3,999 | ) | (4,626 | ) | (7,792 | ) | |||||
Business acquisitions, net of cash acquired | (42,951 | ) | (20,669 | ) | (10,897 | ) | |||||
Purchases of marketable securities | (28,731 | ) | (78,528 | ) | (54,772 | ) | |||||
Sale/maturities of marketable securities | 96,112 | 75,178 | 67,980 | ||||||||
Proceeds from the sale of intangible assets | 576 | 1,298 | 896 | ||||||||
Net cash provided by (used in) investing activities | 21,007 | (27,347 | ) | (4,585 | ) | ||||||
Cash flows from financing activities: | |||||||||||
Borrowings under revolving line of credit | 15,500 | — | — | ||||||||
Principal payments on revolving line of credit | (13,500 | ) | — | — | |||||||
Principal payments of capital lease obligations | (99 | ) | (43 | ) | (76 | ) | |||||
Payment of debt issuance costs | (731 | ) | — | — | |||||||
Proceeds from the sale of common stock in connection with employee stock purchase plan | 1,252 | 1,360 | 2,378 | ||||||||
Proceeds from the exercise of stock options | 617 | 153 | 1,757 | ||||||||
Payment of tax withholding obligations related to net share settlements of restricted stock awards | (7,523 | ) | (1,810 | ) | (2,344 | ) | |||||
Repurchase of common stock | — | (9,530 | ) | (7,917 | ) | ||||||
Net cash used in financing activities | (4,484 | ) | (9,870 | ) | (6,202 | ) | |||||
Effect of exchange rate changes on cash and cash equivalents | 547 | (163 | ) | (128 | ) | ||||||
Net increase (decrease) in cash and cash equivalents | 25,150 | (18,188 | ) | 8,954 | |||||||
Cash and cash equivalents, beginning of year | 31,923 | 50,111 | 41,157 | ||||||||
Cash and cash equivalents, end of year | $ | 57,073 | $ | 31,923 | $ | 50,111 | |||||
Supplemental disclosure of cash flow information: | |||||||||||
Interest paid | $ | 317 | $ | 41 | $ | 64 | |||||
Income taxes paid | $ | 2,290 | $ | 1,249 | $ | 1,430 | |||||
Income tax refunds received | $ | 274 | $ | 511 | $ | 357 | |||||
Supplemental disclosure of non-cash investing activities: | |||||||||||
Capital expenditures incurred, but not yet paid | $ | 1,043 | $ | 277 | $ | 375 | |||||
Property and equipment acquired under capital lease | $ | — | $ | 36 | $ | 137 | |||||
Business acquisition purchase consideration - common stock issued | $ | 413,982 | $ | — | $ | — | |||||
Business acquisition purchase consideration - note issued to selling equity holders | $ | 22,500 | $ | — | $ | — | |||||
Supplemental disclosure of non-cash financing activities: | |||||||||||
Total fair value of restricted stock awards, restricted stock units, performance-based stock awards and performance-based stock units on date vested | $ | 20,515 | $ | 10,376 | $ | 9,138 | |||||
See notes to the consolidated financial statements.
69
RIBBON COMMUNICATIONS INC.
Notes to Consolidated Financial Statements
(1) NATURE OF THE BUSINESS
Ribbon is a leading provider of network communications solutions to telecommunications, wireless and cable service providers and enterprises of all sizes across industry verticals. With over 1,000 customers around the globe, including some of the largest telecommunications service providers and enterprises in the world, Ribbon enables service providers and enterprises to modernize their communications networks and provide secure RTC solutions to their customers and employees. By securing and enabling reliable and scalable IP networks, Ribbon helps service providers and enterprises adopt the next generation of software-based virtualized and cloud communications technologies to drive new, incremental revenue while protecting their existing revenue streams. Ribbon's solutions provide a secure way for its customers to connect and leverage multivendor, multiprotocol communications systems and applications across their networks and the cloud, around the world and in a rapidly changing ecosystem of IP-enabled devices such as smartphones and tablets. In addition, Ribbon's solutions secure the evolution to cloud-based delivery of UC solutions - both for service providers transforming to a cloud-based network and for enterprises using cloud-based UC. Ribbon goes to market through both direct sales and indirect channels globally, leveraging the assistance of resellers, and provides ongoing support to its customers through a global services team with experience in design, deployment and maintenance of some of the world's largest IP networks.
The Merger with GENBAND (see Note 2) was completed in October 2017. As a result of the Merger, Ribbon believes it is better positioned to enable network transformations to IP and to cloud-based networks for service providers and enterprise customers worldwide, with a broader and deeper sales footprint, increased ability to invest in growth, more efficient and effective research and development, and a comprehensive RTC product offering.
(2) BASIS OF PRESENTATION AND SUMMARY OF SIGNIFICANT ACCOUNTING POLICIES
Basis of Presentation
The consolidated financial statements have been prepared in United States dollars, in accordance with accounting principles generally accepted in the United States ("GAAP").
On October 27, 2017 (the "Merger Date"), Sonus Networks, Inc. ("Sonus") consummated an acquisition as specified in an Agreement and Plan of Merger (the “Merger Agreement”) with Solstice Sapphire Investments, Inc. ("NewCo") and certain of its wholly-owned subsidiaries, GENBAND Holdings Company, GENBAND Inc. and GENBAND II, Inc. (collectively, "GENBAND") pursuant to which, following a series of merger transactions (collectively, the "Merger"), Sonus and GENBAND each became a wholly-owned subsidiary of NewCo, with Sonus deemed the acquirer in the transaction for accounting purposes. Subsequently, on November 28, 2017, the Company changed its name to "Ribbon Communications Inc."
The consolidated financial statements of the Company represent the consolidated financial statements of Sonus, prior to the Merger Date, and the consolidated financial statements of Ribbon, on and after the Merger Date. The financial results of GENBAND are included in Ribbon's consolidated financial statements beginning on the Merger Date.
Significant Accounting Policies
Principles of Consolidation
The accompanying consolidated financial statements include the accounts of Ribbon and its wholly-owned subsidiaries. All intercompany transactions and balances have been eliminated in consolidation.
Use of Estimates and Judgments
The preparation of financial statements in conformity with GAAP requires management to make estimates and assumptions that affect the reported amounts of assets and liabilities and disclosure of contingent assets and liabilities at the date of the financial statements and the reported amounts of revenues and expenses during the reporting periods. Significant estimates and judgments relied upon in preparing these consolidated financial statements include accounting for business combinations, revenue recognition for multiple element arrangements, inventory valuations, assumptions used to determine the fair value of stock-based compensation, intangible assets and goodwill valuations, legal contingencies and recoverability of
70
Ribbon's net deferred tax assets and the related valuation allowances. Ribbon regularly assesses these estimates and records changes in estimates in the period in which they become known. Ribbon bases its estimates on historical experience and various other assumptions that it believes to be reasonable under the circumstances. Actual results could differ from those estimates.
Reclassifications
Certain reclassifications, not affecting previously reported net loss, have been made to the previously issued financial statements to conform to the current period presentation.
Business Combinations
The Company recognizes identifiable assets acquired and liabilities assumed at their acquisition date fair values. Goodwill as of the acquisition date is measured as the excess of consideration transferred over the net of the acquisition date fair values of the assets acquired and the liabilities assumed and represents the expected future economic benefits arising from other assets acquired in the business combination that are not individually identified and separately recognized. While the Company uses its best estimates and assumptions as part of the purchase price allocation process to accurately value assets acquired and liabilities assumed at the acquisition date, its estimates are inherently uncertain and subject to refinement. As a result, during the measurement period, which may be up to one year from the acquisition date, the Company records adjustments to the assets acquired and liabilities assumed with the corresponding offset to goodwill to the extent that it identifies adjustments to the preliminary purchase price allocation. Upon the conclusion of the measurement period or final determination of the values of assets acquired and liabilities assumed, whichever comes first, any subsequent adjustments are recorded to the consolidated statements of operations.
Revenue Recognition
The Company recognizes revenue from sales when persuasive evidence of an arrangement exists, delivery has occurred, the sale price is fixed or determinable, and collectability of the related receivable is reasonably assured. In instances where customer acceptance is required, revenue is deferred until the acceptance has been achieved. When fees for products or services are not fixed and determinable, the Company defers the recording of receivables, deferred revenue and revenue until such time as the fees become due or are collected.
Revenue from maintenance and support services is recognized ratably over the service period. Maintenance revenue is deferred until the associated product is accepted by the customer and all other revenue recognition criteria have been met. Maintenance and support services include telephone support, return and repair support and unspecified rights to product upgrades and enhancements. Revenue from other professional services is typically recognized as the services are delivered if all other revenue recognition criteria have been met.
The Company's products typically have both software and non-software components that function together to deliver the products' essential functionality. In addition, hardware sold generally cannot be used apart from the software. Therefore, the Company considers its principal products to be both software and hardware-related. Many of the Company's sales involve multiple element arrangements that include product, maintenance and various professional services. The Company recognizes revenue in accordance with the provisions of Accounting Standards Codification ("ASC") 605-25, Revenue Recognition - Multiple-Element Arrangements ("ASC 605-25") for transactions that include both hardware and software components. The Company recognizes revenue from stand-alone software sales under the software revenue recognition guidance in ASC 985-605, Software - Revenue Recognition ("ASC 985-605"). The Company limits the amount of revenue recognized for delivered elements to the amount that is not contingent on the future delivery of products or services, future performance obligations, or subject to customer-specific return or refund privileges.
For multiple-element arrangements that include both software-only products and non-software products, the Company allocates the total arrangement consideration to the software-only deliverables as a group and to the individual non-software deliverables based on their relative selling prices. If an undelivered element (such as maintenance and support services) relates to both the software-only and non-software deliverables, the Company bifurcates the consideration allocated to the undelivered element (such as maintenance and support services) into a non-software component and the software-only component using the
71
relative selling price method. The consideration allocated to the non-software and software-only deliverables is recognized in accordance with the guidance as discussed in this note.
Under ASC 985-605, revenue for any undelivered elements that are considered not essential to the functionality of the product and for which VSOE has been established is deferred and recognized upon delivery utilizing the residual method. If the Company has undelivered product for which VSOE has not been established, it defers all revenue on the entire arrangement until VSOE is established or until such elements are delivered, provided that all other revenue recognition criteria are met. If the Company has undelivered services for which VSOE has not been established, the entire arrangement is recognized as revenue over the longest remaining service period from the point in time that all services have commenced and all products have been delivered, provided that all other revenue recognition criteria are met.
For transactions that include multiple elements, arrangement consideration is allocated to each element based on the relative selling prices of all of the elements in the arrangement using the fair value hierarchy as required by ASC 605-25.
The Company establishes VSOE based upon the price charged when the same element is sold separately or established by management having the relevant pricing authority. The Company has VSOE for certain of its maintenance and support services and certain professional services. When VSOE exists, it is used to determine the selling price of a deliverable. The Company has not been able to establish VSOE of its products, for certain of its services and for certain maintenance offerings because the Company has not sold such products or services on a stand-alone basis, has not priced its products or services within a narrow range, or has limited sales history.
When VSOE is not established, the Company attempts to establish the selling price of each element based on TPE. The Company's solution typically differs from that of its peers as there are no similar or interchangeable competitor products or services. The Company's various product, service and maintenance offerings contain a significant level of unique features and functionality and therefore, comparable pricing of competitors' products and services with similar functionality cannot be obtained. Accordingly, the Company is not able to determine TPE for its products or services.
When the Company is unable to establish selling price using VSOE or TPE, the Company uses ESP in its allocation of arrangement consideration for the relevant deliverables. The objective of ESP is to determine the price at which the Company would transact a sale if a product or service was sold on a stand-alone basis. The Company determines ESP for its products and certain services by considering multiple factors including, but not limited to, overall market conditions, including geographic or regional-specific market factors, profit objectives and historical pricing practices for such deliverables. The determination of ESP is a formal process within the Company that includes review and approval by the Company's management.
Deferred revenue typically includes customer deposits and amounts associated with partial product shipments and maintenance or service contracts. Deferred revenue expected to be recognized as revenue more than one year subsequent to the balance sheet date is reported as a component of long-term liabilities in the consolidated balance sheets. The Company defers recognition of incremental direct costs, such as cost of goods, third-party installations and commissions, until recognition of the related revenue. Such costs are classified as current assets if the deferred revenue is initially classified as current and noncurrent assets if the related deferred revenue is initially classified as long-term.
The Company excludes any taxes assessed by a governmental authority that are directly imposed on a revenue-producing transaction (i.e., sales, use and value added) from its revenue and costs. Reimbursement received for out-of-pocket expenses and shipping costs is recorded as revenue.
The Company sells the majority of its products directly to its end customers. For products sold to resellers and distributors, the Company recognizes revenue on a sell-through basis.
Financial Instruments
The carrying amounts of Ribbon's financial instruments, which include cash equivalents, investments, accounts receivable and accounts payable, approximate their fair values.
All investments in marketable securities are classified as available-for-sale and are reported at fair value, with unrealized gains and losses excluded from earnings and reported, net of tax, in Accumulated other comprehensive loss, which is a
72
component of stockholders' equity. Unrealized losses that are determined to be other-than-temporary, based on current and expected market conditions, are recognized in earnings. Declines in fair value determined to be credit-related are charged to earnings. The cost of marketable securities sold is determined by the specific identification method.
Financial instruments with remaining maturities or that are due within one year from the balance sheet date are classified as current. Financial instruments with remaining maturities or that are payable more than one year from the balance sheet date are classified as noncurrent.
Cash and Cash Equivalents
Cash equivalents are stated at fair value. Cash equivalents are liquid securities that have remaining maturities of three months or less at the date of purchase.
Restricted Cash
The Company classifies as restricted cash all cash pledged as collateral to secure long-term obligations and all cash whose use is otherwise limited by contractual provisions. Restricted cash is recorded within other current assets on the consolidated balance sheet.
Foreign Currency Translation
For foreign subsidiaries where the functional currency is the local currency, assets and liabilities are translated into U.S. dollars at the current exchange rate on the balance sheet date. Revenue and expenses are translated at average rates of exchange prevailing during each period. Translation adjustments for these subsidiaries are included in Accumulated other comprehensive loss.
For foreign subsidiaries where the functional currency is the U.S. dollar, monetary assets and liabilities are translated into U.S. dollars at the current exchange rate on the balance sheet date. Nonmonetary assets and liabilities are remeasured into U.S. dollars at historical exchange rates. Revenue and expense items are translated at average rates of exchange prevailing during each period.
Realized and unrealized foreign currency gains and losses arising from transactions denominated in currencies other than the subsidiary's functional currency are reflected in earnings with the exception of intercompany transactions considered to be of a long-term investment nature.
Effective on the Merger Date, the Company began to record its foreign currency transaction gains (losses) as a component of Other income (expense), net. The Company did not reclassify amounts previously recorded within General and administrative expenses as the amounts were not material to the consolidated results of the Company. The Company recognized net transaction gains of $0.7 million for the year ended December 31, 2017 and net transaction losses of $0.3 million for the year ended December 31, 2016 and $0.4 million for the year ended December 31, 2015.
Inventory
Inventory is recorded at the lower of cost or market value using the first-in, first-out convention. The Company reduces the carrying value of inventory for those items that are potentially excess, obsolete or slow-moving based on changes in customer demand, technology developments or other economic factors.
Ribbon writes down evaluation equipment at the time of shipment to its customers, as it is probable that the inventory value will not be realized.
Deferred product costs represent deferred cost of revenue for product shipments to customers prior to satisfaction of Ribbon's revenue recognition criteria. The Company classifies inventory that is not expected to be consumed within one year from the balance sheet date as noncurrent and includes such inventory as a component of Other assets.
73
Property and Equipment
Property and equipment are stated at cost, net of accumulated depreciation. Expenditures for maintenance and repairs are charged to expense as incurred. Depreciation is computed using the straight-line method over the estimated useful lives of the related assets, which range from two to five years. Leasehold improvements are amortized over the lesser of the lease term or five years. When an asset is sold or retired, the cost and related accumulated depreciation or amortization are eliminated, and the resulting gain or loss, if any, is recognized in income (loss) from operations in the consolidated statement of operations. The Company reviews property and equipment for impairment in the same manner as intangible assets discussed below.
Software development costs associated with internal use software are incurred in three stages of development: the preliminary project stage, the application development stage and the post-implementation stage. Costs incurred during the preliminary project and post-implementation stages are expensed as incurred. Certain qualifying costs incurred during the application development stage are capitalized as property and equipment. Internal use software is amortized on a straight-line basis over its estimated useful life of three years, beginning when the software is ready for its intended use.
Intangible Assets and Goodwill
Intangible assets are comprised of certain intangible assets arising from the Merger, as well as previous acquisitions. These intangible assets include a combination of in-process research and development, developed technology, customer relationships, trade names, and internal use software. Intangible assets are reviewed for impairment when events or changes in circumstances indicate that their carrying amounts may not be recoverable based upon the estimated undiscounted cash flows. Recoverability of intangible assets with estimated lives and other long-lived assets is measured by a comparison of the carrying amount of an asset or asset group to future net undiscounted cash flows expected to be generated by the asset or asset group. If these comparisons indicate that an asset is not recoverable, the Company will recognize an impairment loss for the amount by which the carrying value of the asset or asset group exceeds the related estimated fair value. Estimated fair value is based on either discounted future operating cash flows or appraised values, depending on the nature of the asset. The Company amortizes its intangible assets over their respective useful lives, with the exception of in-process research and development, which has an indefinite life until the product is generally available, at which time such asset is typically reclassified to developed technology, and the Company begins to amortize this asset. See Note 9 for additional information regarding the Company's intangible assets.
Goodwill is recorded when the consideration for an acquisition exceeds the fair value of net tangible and identifiable intangible assets acquired. Goodwill is not amortized, but instead is tested for impairment at least annually, or more frequently if indicators of potential impairment exist, by comparing the fair value of the Company's reporting unit to its carrying value.
The Company's annual testing for impairment of goodwill is completed as of November 30. The Company operates as a single operating segment with one reporting unit and consequently evaluates goodwill for impairment based on an evaluation of the fair value of the Company as a whole. The Company performed its step one assessments for each of the years ended December 31, 2017, 2016 and 2015 and determined each year that its market capitalization was significantly in excess of its carrying value and accordingly, there was no impairment of goodwill.
Other Assets
Other assets are primarily comprised of the long-term portion of deferred cost of goods sold, prepaid expenses and deposits.
Stock-Based Compensation
The Company's stock-based compensation cost is measured at the grant date based on the fair value of the award and is recognized as expense over the requisite service period, which generally represents the vesting period, and includes an estimate of the awards that will be forfeited.
The Company uses the Black-Scholes valuation model for estimating the fair value on the date of grant of stock options. The fair value of stock option awards is affected by the Company's stock price as well as valuation assumptions, including the volatility of Ribbon's stock price, expected term of the option, risk-free interest rate and expected dividends.
74
In 2015, the Company began to grant performance-based stock units ("PSUs") that include a market condition to certain of its executives. The Company uses a Monte Carlo simulation approach to model future stock price movements based upon the risk-free rate of return, the volatility of each entity and the pair-wise covariance between each entity. These results are then used to calculate the grant date fair values of the PSUs.
Research and Development Costs
Research and development costs are expensed as incurred.
Concentrations of Credit Risk
The financial instruments that potentially subject Ribbon to concentrations of credit risk are cash, cash equivalents, investments and accounts receivable. The Company's cash equivalents and investments were managed by one financial institution at both December 31, 2017 and 2016. Historically, the Company has not experienced significant losses due to such bank depository concentration.
Certain components and software licenses from third parties used in Ribbon's products are procured from single sources of supply. The failure of a supplier, including a subcontractor, to deliver on schedule could delay or interrupt Ribbon's delivery of products and thereby materially adversely affect Ribbon's revenues and operating results.
Advertising Costs
Advertising costs are expensed as incurred and included as a component of Sales and marketing expense in the Company's consolidated statements of operations. Advertising expenses were $0.3 million for the year ended December 31, 2017, $0.1 million for the year ended December 31, 2016 and $0.9 million for the year ended December 31, 2015.
Operating Segments
The Company operates in a single segment, as the chief operating decision maker makes decisions and assesses performance at the company level. Operating segments are identified as components of an enterprise about which separate discrete financial information is utilized for evaluation by the chief operating decision maker in making decisions regarding resource allocation and assessing performance. To date, the chief operating decision maker has made such decisions and assessed performance at the company level, as one segment. The Company's chief operating decision maker is its President and Chief Executive Officer.
Loss Contingencies and Reserves
Ribbon is subject to ongoing business risks arising in the ordinary course of business, including legal claims, that affect the estimation process of the carrying value of assets, the recording of liabilities and the possibility of various loss contingencies. An estimated loss contingency is accrued when it is probable that a liability has been incurred or an asset has been impaired and the amount of loss can be reasonably estimated. Ribbon regularly evaluates current information available to determine whether such amounts should be adjusted and records changes in estimates in the period they become known.
An allowance for doubtful accounts is estimated based on the Company's assessment of the collectability of specific customer accounts.
Ribbon accrues for royalties for technology that it licenses from vendors based on established royalty rates and usage. In certain cases, Ribbon has been contacted by third parties who claim that Ribbon's products infringe on certain intellectual property of a third party. Ribbon evaluates these claims and accrues amounts when it is probable that the obligation has been incurred and the amounts are reasonably estimable.
Accounting for Income Taxes
Deferred tax assets and liabilities are recognized for the expected future consequences of events that have been reflected
75
in the consolidated financial statements. Deferred tax assets and liabilities are determined based on the differences between the financial reporting and tax basis of assets and liabilities and operating loss carryforwards, using tax rates expected to be in effect for the years in which the differences are expected to reverse. The Company records valuation allowances to reduce deferred income tax assets to the amount that is more likely than not to be realized.
The Company has provided for income taxes on the undistributed earnings of its non-U.S. subsidiaries as of December 31, 2017, with the exception of the Company's Irish subsidiary, as the Company does not plan to permanently reinvest these amounts outside the United States. The repatriation of the undistributed earnings would result in withholding taxes imposed on the repatriation. Consequently, the Company has recorded a tax liability of $3.2 million, primarily consisting of withholding and distribution taxes, relating to undistributed earnings from these subsidiaries as of December 31, 2017. Had the earnings of the Irish subsidiary been determined to not be permanently reinvested outside the U.S., no additional deferred tax liability would be required due to no withholding taxes or income tax expense being imposed on such repatriation.
The Company determines whether it is more likely than not that a tax position will be sustained upon examination. If it is not more likely than not that a position will be sustained, no amount of the benefit attributable to the position is recognized. The tax benefit to be recognized of any tax position that meets the more likely than not recognition threshold is calculated as the largest amount that is more than 50% likely of being realized upon resolution of the contingency. The Company accounts for interest and penalties related to uncertain tax positions as part of its provision for income taxes.
Defined Benefit Plans
In connection with the Merger, the Company assumed defined benefit plans for some of GENBAND's employees at various international locations. The Company recognizes retirement benefit assets or liabilities in the consolidated balance sheets reflecting the funded status of pension and other retirement benefit plans. Retirement benefit assets and liabilities are adjusted for the difference between the benefit obligations and the plan assets at fair value (measured at year-end), with the offset recorded directly to stockholders' equity through accumulated other comprehensive income (loss), net of tax. The amount recorded in stockholders' equity represents the after-tax unamortized actuarial gains or losses, unamortized transition obligations and unamortized prior service costs. The amounts included in the Company's consolidated financial statements as of and for the year ended December 31, 2017 represent the activity for the period from the Merger Date to December 31, 2017.
Recent Accounting Pronouncements
In May 2014, the FASB issued ASU 2014-09, Revenue from Contracts with Customers (“ASU 2014-09”), its new standard on revenue from contracts with customers, along with additional ASUs which, among other things, clarified the implementation of the new revenue guidance and delayed the adoption by one year, to January 1, 2018 (collectively, the "New Revenue Standard" or "ASC 606"). The New Revenue Standard outlines a single comprehensive model for entities to use in accounting for revenue arising from contracts with customers and supersedes most current revenue recognition guidance, including industry-specific guidance. The core principle of the revenue model is that an entity recognizes revenue to depict the transfer of promised goods or services to customers in an amount that reflects the consideration to which the entity expects to be entitled in exchange for those goods or services. In applying the revenue model to contracts within its scope, an entity identifies the contract(s) with a customer, identifies the performance obligations in the contract, determines the transaction price, allocates the transaction price to the performance obligations in the contract and recognizes revenue when (or as) the entity satisfies a performance obligation. Certain of the New Revenue Standard's provisions also apply to transfers of nonfinancial assets, including in-substance nonfinancial assets that are not an output of an entity’s ordinary activities (i.e., property, plant and equipment; real estate; or intangible assets). Existing accounting guidance applicable to these transfers has been amended or superseded. Effective January 1, 2018, the Company adopted the New Revenue Standard using the modified retrospective option and has identified the necessary changes to its policies, processes, systems and controls. However, due to the recent acquisition of GENBAND, the Company has not yet completed all of its internal control procedures. Under the modified retrospective method, the Company is applying the New Revenue Standard to all contracts not yet completed as of January 1, 2018, recognizing in beginning Accumulated deficit an adjustment for the cumulative effect of the change and providing additional disclosures comparing results to those as if the Company was still following the previous accounting standards. Currently, the Company does not have VSOE for certain elements in software bundled arrangements, which results in revenue being recognized ratably over the longest performance period. The majority of the Company's transition adjustment will be related to these arrangements. The Company currently expects that the adjustment to decrease Accumulated deficit as a result of this change will not exceed $15 million. Additionally, the Company expects to capitalize certain commission costs
76
resulting directly from securing contracts which are currently expensed. The Company expects this to result in the capitalization of approximately $1 million of previously expensed commissions expense.
In May 2017, the Financial Accounting Standards Board ("FASB") issued Accounting Standards Update ("ASU") 2017-09, Compensation - Stock Compensation (Topic 718): Scope of Modification Accounting ("ASU 2017-09"), which amends the scope of modification accounting for share-based payment arrangements such that an entity would not apply modification accounting if the fair value, vesting conditions and classification of the awards are the same immediately before and after the modification. ASU 2017-09 is effective for the Company beginning January 1, 2018 for both interim and annual reporting periods. The Company does not expect the adoption of ASU 2017-09 will have a material impact on its consolidated financial statements.
In March 2017, the FASB issued ASU 2017-07, Compensation - Retirement Benefits (Topic 715): Improving the Presentation of Net Periodic Pension Cost and Net Periodic Post Retirement Benefit Cost ("ASU 2017-07"). ASU 2017-07 amends the requirements in ASC 715 to require entities to disaggregate the current-service-cost component from the other components of net benefit cost (the "other components") and include it with other current compensation costs for related employees, present the other components elsewhere in the income statement and outside of income from operations if such a subtotal is presented and disclose the income statement lines that contain the other components if they are not presented on appropriately described separate lines. ASU 2017-07 is effective for the Company beginning January 1, 2018 for both interim and annual reporting periods. The Company does not expect the adoption of ASU 2017-07 will have a material impact on our consolidated financial statements.
In January 2017, the FASB issued ASU 2017-04, Intangibles - Goodwill and Other (Topic 350): Simplifying the Test for Goodwill Impairment ("ASU 2017-04"), which removes the requirement to compare the implied fair value of goodwill with its carrying amount as part of step 2 of the goodwill impairment test by instead comparing the fair value of a reporting unit with its carrying amount and recognizing an impairment charge for the amount by which the carrying amount exceeds the reporting unit's fair value. ASU 2017-04 also clarifies the treatment of foreign currency translation adjustments to reporting units and the income tax effects on goodwill impairment loss measurement. ASU 2017-04 is effective prospectively for the Company beginning January 15, 2020, with early adoption permitted for interim or annual goodwill impairment tests performed on testing dates after January 1, 2017. The Company elected to early-adopt ASU 2017-04; such early adoption did not have a material impact on its consolidated financial results.
In October 2016, the FASB issued ASU 2016-16, Income Taxes (Topic 740): Intra-Entity Transfers of Assets Other Than Inventory ("ASU 2016-16"), which removes the prohibition in ASC 740, Income Taxes, against the immediate recognition of the current and deferred income tax effects of intra-entity transfers of assets other than inventory. ASU 2016-16 is effective for us beginning January 1, 2019 for both interim and annual reporting periods. The Company does not believe that the adoption of this standard will have a material impact on our consolidated financial statements.
In August 2016, the FASB issued ASU 2016-15, Statement of Cash Flows (Topic 230): Classification of Certain Cash Receipts and Cash Payments ("ASU 2016-15"), which adds or clarifies guidance on eight cash flow issues, including debt prepayment or debt extinguishment costs, settlement of zero-coupon debt instruments or certain other debt instruments, contingent consideration payments made after a business combination, proceeds from the settlement of insurance claims, proceeds from the settlement of corporate-owned life insurance policies, distributions received from equity method investees, beneficial interests in securitization transactions and separately identifiable cash flows and application of the predominance principle. ASU 2016-15 is effective for the Company beginning January 1, 2018 for both interim and annual reporting periods. Entities must apply the guidance retrospectively to all periods presented but may apply it prospectively from the earliest date practicable if retrospective application would be impracticable. The Company does not expect the adoption of ASU 2016-15 will have a material impact on its consolidated financial statements.
In June 2016, the FASB issued ASU 2016-13, Financial Instruments - Credit Losses (Topic 326): Measurement of Credit Losses on Financial Instruments ("ASU 2016-13"), which adds an impairment model that is based on expected losses rather than incurred losses. Under ASU 2016-13, an entity recognizes as an allowance its estimate of expected credit losses, which the FASB believes will result in more timely recognition of such losses. ASU 2016-13 is effective for the Company beginning January 1, 2020 for both interim and annual reporting periods, with early adoption permitted. The Company does not expect the adoption of ASU 2016-13 will have a material impact on its consolidated financial statements.
77
In March 2016, the FASB issued ASU 2016-09, Compensation - Stock Compensation (Topic 718): Improvements to Employee Share-Based Payment Accounting ("ASU 2016-09"), which simplifies several aspects of the accounting for employee share-based payment transactions, including the accounting for income taxes, forfeitures and statutory tax withholding requirements, as well as classification in the statement of cash flows. ASU 2016-09 became effective for the Company beginning January 1, 2017 for both interim and annual reporting periods. Under ASU 2016-09, the Company will now recognize unrealized excess tax benefits. Due to the full valuation allowance on the Company's federal and state income taxes, the adoption of ASU 2016-09 did not have a material impact on its accounting for income taxes. Without the valuation allowance, the Company would have recognized an increased deferred tax asset approximating $5 million. The Company has elected to continue to apply forfeiture rates to the expense attribution related to stock options, restricted stock awards and restricted stock units, as the Company believes that such continued application results in more accurate expense attribution over the life of these equity grants.
In February 2016, the FASB issued ASU 2016-02, Leases (Topic 842) Section A - Leases: Amendments to the FASB Accounting Standards Codification ("ASU 2016-02"), its new standard on accounting for leases. ASU 2016-02 introduces a lessee model that brings most leases onto the balance sheet. ASU 2016-02 eliminates the current GAAP requirement for an entity to use bright-line tests in determining lease classification. ASU 2016-02 is effective for the Company for both interim and annual periods beginning January 1, 2019. Upon adoption of ASU 2016-02, the Company will recognize lease obligations for the right to use these assets in connection with its existing lease agreements. The Company is currently assessing the potential impact of the adoption of ASU 2016-02 on its consolidated financial statements and accordingly, such amounts to be recognized on the balance sheet have yet to be determined.
In July 2015, the FASB issued ASU 2015-11, Simplifying the Measurement of Inventory ("ASU 2015-11"), which simplifies the measurement of inventory by requiring entities to measure most inventory at the lower of cost and net realizable value, replacing the previous requirement to measure most inventory at the lower of cost or market. ASU 2015-11 does not apply to inventories that are measured by using either the last-in, first-out method or the retail inventory method. ASU 2015-11 became effective for the Company for both interim and annual reporting periods beginning January 1, 2017. The adoption of ASU 2015-11 did not have a material impact on its consolidated financial statements.
(3) BUSINESS ACQUISITIONS
GENBAND Merger
On October 27, 2017, Sonus consummated an acquisition as specified in the Merger Agreement with NewCo and GENBAND such that, following the Merger, Sonus and GENBAND each became a wholly-owned subsidiary of NewCo, with Sonus deemed the acquirer in the transaction for accounting purposes. On November 28, 2017, the Company changed its name to "Ribbon Communications Inc."
Prior to the Merger, GENBAND was a Cayman Islands exempted company limited by shares that was formed on April 7, 2010. Through its wholly owned operating subsidiaries, GENBAND created rapid communications and applications for service providers, enterprises, independent software vendors, system integrators and developers globally. A majority of GENBAND's shares were held by JPMorgan Chase & Co. and managed by One Equity Partners ("OEP"). GENBAND shares were not listed on an exchange or quoted on any automated services, and there was no established trading market for GENBAND shares.
The Company believes that Sonus' and GENBAND's complementary products, solutions and strategies position the combined company to deliver comprehensive solutions to service providers and enterprises migrating to a virtualized all-IP environment in an expanded customer and global footprint.
Pursuant to the Merger Agreement, NewCo issued 50.9 million shares of Sonus common stock to the GENBAND equity holders, with the number of shares issued in the aggregate to the GENBAND equity holders equal to the number of shares of Sonus common stock outstanding immediately prior to the closing date of the Merger, such that former stockholders of Sonus would own approximately 50%, and former shareholders of GENBAND would own approximately 50%, of the shares of NewCo common stock issued and outstanding immediately following the consummation of the Merger.
78
In addition, NewCo repaid GENBAND’s long-term debt, including both principal and unpaid interest, to a related party of GENBAND totaling $48 million and repaid GENBAND’s management fees due to an affiliate of OEP totaling $10.3 million. NewCo also issued a promissory note for $22.5 million to certain GENBAND equity holders.
NewCo assumed the liability under GENBAND's revolving credit facility with Silicon Valley Bank (the "GENBAND facility"), which had outstanding borrowings and letters of credit totaling $17.9 million and $2.9 million, respectively, at October 27, 2017. At October 27, 2017, the outstanding borrowings had an average interest rate of 4.67%.
The Merger has been accounted for as a business combination and the financial results of GENBAND have been included in the Company's consolidated financial statements for the period subsequent to its acquisition.
As of December 31, 2017, the valuation of acquired assets, identifiable intangible assets and certain assumed liabilities is preliminary. The Company is still in the process of investigating the facts and circumstances existing as of the Merger Date in order to finalize its valuation. The Company expects to finalize the valuation of the assets acquired and liabilities assumed in the third quarter of 2018.
A summary of the preliminary allocation of the purchase consideration for GENBAND is as follows (in thousands):
Fair value of consideration transferred: | |||
Cash consideration: | |||
Repayment of GENBAND long-term debt and accrued interest, related party | $ | 47,973 | |
Payment of GENBAND management fees due to majority shareholder | 10,302 | ||
Less cash acquired | (15,324 | ) | |
Net cash consideration | 42,951 | ||
Fair value of Sonus stock issued | 413,982 | ||
Promissory note issued to GENBAND equity holders | 22,500 | ||
Fair value of total consideration | $ | 479,433 | |
Fair value of assets acquired and liabilities assumed: | |||
Current assets, net of cash acquired | $ | 99,126 | |
Property and equipment | 16,770 | ||
Intangible assets: | |||
In-process research and development | 5,600 | ||
Developed technology | 129,000 | ||
Customer relationships | 101,300 | ||
Trade names | 900 | ||
Goodwill | 285,825 | ||
Other noncurrent assets | 6,732 | ||
Revolving credit facility | (17,930 | ) | |
Deferred revenue | (32,390 | ) | |
Other current liabilities | (80,023 | ) | |
Deferred revenue, net of current | (6,804 | ) | |
Other long-term liabilities | (28,673 | ) | |
$ | 479,433 | ||
The valuation of the acquired intangible assets is inherently subjective and relies on significant unobservable inputs. The Company used an income approach to value the acquired developed technology, customer relationships and trade name intangible assets. The valuation for each of these intangible assets was based on estimated projections of expected cash flows to be generated by the assets, discounted to the present value at discount rates commensurate with perceived risk. The valuation assumptions take into consideration the Company's estimates of customer attrition, technology obsolescence and revenue growth projections. The Company will reclassify its in-process research and development intangible assets to developed technology intangible assets in the periods that the related products became generally available and begin to record amortization expense for such developed technology intangible assets at that time. The Company is amortizing the identifiable intangible
79
assets in relation to the expected cash flows from the individual intangible assets over their respective useful lives, which have a weighted average life of 8.3 years (see Note 9). Goodwill resulting from the transaction is primarily due to expected synergies between the combined companies and is not deductible for tax purposes.
Pro Forma Results
The following unaudited pro forma information presents the condensed combined results of operations of Sonus and GENBAND for the years ended December 31, 2017 and 2016 as if the Merger had been completed on January 1, 2016, with adjustments to give effect to pro forma events that are directly attributable to the Merger. These pro forma adjustments include a reduction of historical GENBAND revenue for the fair value adjustment related to acquired deferred revenue, an increase in amortization expense for the acquired identifiable intangible assets, a decrease in historical GENBAND interest expense reflecting the extinguishment of certain of GENBAND's debt as a result of the Merger, net of the interest expense recorded in connection with the promissory note issued to certain GENBAND equity holders as part of the purchase consideration and the elimination of revenue and costs related to sales transactions between Sonus and GENBAND. Pro forma adjustments also include the elimination of acquisition- and integration-related costs directly attributable to the acquisition and incremental stock-based compensation expense directly attributable to the acquisition from the year ended December 31, 2017 and inclusion of such costs in the year ended December 31, 2016.
The unaudited pro forma results do not reflect any operating efficiencies or potential cost savings that may result from the consolidation of the operations of Sonus and GENBAND. Accordingly, these unaudited pro forma results are presented for illustrative purposes and are not intended to represent or be indicative of the actual results of operations of the combined company that would have been achieved had the Merger occurred at the beginning of the periods presented, nor are they intended to represent or be indicative of future results of operations (in thousands, except per share amounts):
Year ended December 31, | |||||||
2017 | 2016 | ||||||
(unaudited) | |||||||
Revenue | $ | 615,286 | $ | 631,914 | |||
Net loss | $ | (69,741 | ) | $ | (147,394 | ) | |
Loss per share | $ | (0.69 | ) | $ | (1.46 | ) | |
Taqua, LLC
The Company acquired Taqua, a privately-held company, on September 26, 2016 (the "Taqua Acquisition Date"). Taqua enables the transformation of software-based service provider networks to deliver next-generation voice, video and messaging services, including VoIP, VoWiFi and VoLTE. In consideration for the acquisition of Taqua, Sonus paid $19.9 million in cash to the sellers on the Taqua Acquisition Date, net of cash acquired. The Company also entered into an Earn-Out Agreement, dated as of September 26, 2016, with Taqua Holdings, LLC and Jeffrey L. Brawner, the seller representative in the transaction, under which there is the potential for additional cash payments of up to $65 million in the aggregate to the sellers if certain annual revenue thresholds are exceeded as measured annually through 2020. The Company had initially recorded $10 million of contingent consideration as of the Taqua Acquisition Date, with the estimate based on historical sales and probability weighted cash flows related to forecasted sales. Because there are unobservable inputs to the valuation methodology that are significant to the measurement of its fair value, namely, forecasted sales, the Company had categorized the earn-out at Level 3 within the fair value hierarchy. During the fourth quarter of 2016, the Company reassessed the historical and updated forecasted sales and accordingly, reversed the previous estimated contingent consideration such that as of December 31, 2016, no incremental contingent consideration was recorded. The Company regularly reassesses the historical and updated forecasted sales and will adjust the amount recorded for estimated contingent consideration as required. As of December 31, 2017, no incremental contingent consideration was recorded.
The transaction has been accounted for as a business combination and the financial results of Taqua have been included in the Company's consolidated financial statements for the period subsequent to its acquisition.
The Company finalized its valuation of the identifiable intangible assets in the second quarter of 2017. During the first
80
quarter of 2017 and the fourth quarter of 2016, the Company recorded changes to the initial preliminary purchase price allocation. The primary adjustments in the first quarter of 2017 were a $0.4 million increase to current liabilities and a $0.1 million increase to noncurrent liabilities. During the fourth quarter of 2016, the Company recorded changes to the initial preliminary purchase price allocation. The primary adjustments recorded in the fourth quarter of 2016 were the aforementioned reversal of the $10 million of previously recorded contingent consideration, a reduction of $12.1 million to the developed technology intangible asset and an increase of $5.5 million to the customer relationship intangible asset. These adjustments, as well as other immaterial adjustments to other balance sheet accounts, resulted in a net reduction to goodwill of $2.2 million. Based on this final purchase price allocation, the Company recorded $9.6 million of goodwill, which is primarily due to expected synergies between the combined companies and expanded market opportunities resulting from the expanded product offering portfolio. The goodwill is deductible for tax purposes.
A summary of the final allocation of the purchase consideration for Taqua is as follows (in thousands):
Fair value of consideration transferred: | |||
Cash, net of cash acquired | $ | 19,919 | |
Fair value of assets acquired and liabilities assumed: | |||
Current assets | $ | 3,347 | |
Property and equipment | 1,478 | ||
Intangible assets: | |||
Developed technology | 2,100 | ||
Customer relationships | 9,510 | ||
Goodwill | 9,581 | ||
Other noncurrent assets | 23 | ||
Current liabilities | (5,435 | ) | |
Long-term liabilities | (685 | ) | |
$ | 19,919 | ||
The valuation of the acquired intangible assets is inherently subjective and relies on significant unobservable inputs. The Company used an income approach to value the acquired developed technology and customer relationship intangible assets. The valuation for each of these intangible assets was based on estimated projections of expected cash flows to be generated by the assets, discounted to the present value at discount rates commensurate with perceived risk. The valuation assumptions take into consideration the Company's estimates of technology attrition and revenue growth projections. The Company is amortizing the identifiable intangible assets in relation to the expected cash flows from the individual intangible assets over their respective useful lives (see Note 9).
The Company's revenue for the year ended December 31, 2016 included $1.9 million of revenue attributable to Taqua since the Taqua Acquisition Date. The inclusion of Taqua's operations for the period from the Taqua Acquisition Date to December 31, 2016 in the Company's financial results for the year ended December 31, 2016 increased the Company's loss by $4.7 million. The Company has not provided pro forma financial information, as the historical amounts were not significant to the Company's consolidated financial statements.
SDN Business of Treq Labs, Inc.
On January 2, 2015 (the "Treq Asset Acquisition Date"), the Company acquired from Treq Labs, Inc. ("Treq"), certain assets related to Treq's business of designing, developing, marketing, selling, servicing and maintaining SDN technology, SDN controller software and SDN management software (the "SDN Business"). The SDN Business provides solutions that optimize networks for voice, video and UC for both enterprise and service provider customers. In consideration for the acquisition of the SDN Business, Sonus paid $10.1 million in cash on the Treq Asset Acquisition Date, and an additional consideration payment of $750,000 on each of July 2, 2015 and January 4, 2016. The Company also entered into an Earn-Out Agreement, dated as of January 2, 2015, with Treq and Karl F. May, the seller representative in the transaction (the "Earn-Out Agreement"), under which the Company agreed to issue up to an aggregate of 1.3 million shares of common stock over a three-year period subsequent to the Treq Asset Acquisition Date if aggregate revenue thresholds of at least $60 million are achieved by the SDN
81
Business during that period, and up to an aggregate of an additional 2.2 million shares of common stock (3.5 million shares in total) if aggregate revenue thresholds of at least $150 million are achieved by the SDN Business during that period. If the initial revenue thresholds are not met, no shares will be issued. Based on historical and forecasted sales, no incremental contingent consideration was recorded either initially as of the Treq Asset Acquisition Date or through December 31, 2017. Any shares issued pursuant to the Earn-Out Agreement will be issued in reliance on the exemption from registration available under Section 4(a)(2) of the Securities Act of 1933, as amended (the "Securities Act"), and will be subsequently registered for resale under the Securities Act by the Company.
The transaction has been accounted for as a business combination. The Company finalized its valuation of the identifiable intangible assets in the second quarter of fiscal 2015. Based on the purchase price allocation, the Company recorded $1.0 million of goodwill, primarily due to expected synergies between the combined companies and expanded market opportunities. The goodwill is deductible for tax purposes.
A summary of the final allocation of the purchase consideration for the SDN Business is as follows (in thousands):
Fair value of consideration transferred: | |||
Cash, net of cash acquired | $ | 11,647 | |
Fair value of assets acquired: | |||
Intangible assets: | |||
In-process research and development | $ | 9,100 | |
Developed technology | 1,500 | ||
Goodwill | 1,047 | ||
$ | 11,647 | ||
The valuation of the acquired intangible assets is inherently subjective and relies on significant unobservable inputs. The Company used an income approach to value the acquired in-process research and development and developed technology intangible assets. The valuation for each of these intangible assets was based on estimated projections of expected cash flows to be generated by the assets, discounted to the present value at discount rates commensurate with perceived risk. The valuation assumptions take into consideration the Company's estimates of technology attrition and revenue growth projections. In the three months ended September 25, 2015, the Company reclassified $7.5 million of its in-process research and development intangible assets to its developed technology intangible assets. During the three months ended March 31, 2016, the Company reclassified the remaining $1.6 million of in-process research and development intangible assets to its developed technology intangible assets. These amounts were reclassified from in-process research and development intangible assets to developed technology intangible assets in the periods that the related products became generally available and began to record amortization expense for such developed technology intangible assets. The Company is amortizing the identifiable intangible assets in relation to the expected cash flows from the individual intangible assets over their respective useful lives (see Note 9).
The Company has not disclosed the amount of revenue or earnings of the SDN Business since the SDN Business Acquisition Date or pro forma financial information, as these amounts are not significant to the Company's consolidated financial statements.
Acquisition- and Integration-Related Expenses
Acquisition- and integration-related expenses include those expenses related to acquisitions that would otherwise not have been incurred by the Company. The acquisition-related expenses include professional and services fees, such as legal, audit, consulting, paying agent and other fees, and expenses related to cash payments to certain former executives of the acquired businesses in connection with their employment agreements. The integration-related expenses represent incremental costs related to combining the two companies, such as third-party consulting and other third-party services related to merging the two separate companies' systems and processes. The amount recorded in the year ended December 31, 2017 primarily relates to the Merger, with a nominal amount related to the acquisition of Taqua. The amount recorded in the year ended December 31, 2016 relates to professional fees in connection with the acquisition of Taqua. The amount recorded in the year ended December 31, 2015 relates to professional fees in connection with the acquisition of the SDN Business.
82
The components of acquisition-related costs incurred in the years ended December 31, 2017, 2016 and 2015 are as follows (in thousands):
Year ended December 31, | |||||||||||
2017 | 2016 | 2015 | |||||||||
Professional and services fees (acquisition-related) | $ | 11,916 | $ | 1,152 | $ | 131 | |||||
Management bonuses (acquisition-related) | 931 | — | — | ||||||||
Integration-related expenses | 1,916 | — | — | ||||||||
$ | 14,763 | $ | 1,152 | $ | 131 | ||||||
(4) EARNINGS (LOSS) PER SHARE
Basic earnings (loss) per share is computed by dividing net income (loss) by the weighted average number of shares outstanding during the period. For periods in which the Company reports net income, diluted net income per share is determined by using the weighted average number of common and dilutive common equivalent shares outstanding during the period unless the effect is antidilutive.
The calculations of shares used to compute basic and diluted loss per share are as follows (in thousands):
Year ended December 31, | ||||||||
2017 | 2016 | 2015 | ||||||
Weighted average shares outstanding—basic | 58,822 | 49,385 | 49,560 | |||||
Potential dilutive common shares | — | — | — | |||||
Weighted average shares outstanding—diluted | 58,822 | 49,385 | 49,560 | |||||
Options to purchase the Company's common stock, unvested shares of restricted stock and unvested shares underlying performance-based stock grants aggregating 2.5 million shares for the year ended December 31, 2017 have not been included in the computation of diluted loss per share because their effect would have been antidilutive. Options to purchase the Company's common stock, unvested shares of restricted stock, unvested shares underlying performance-based stock grants and shares in connection with future purchases under the Company's Amended and Restated 2000 Employee Stock Purchase Plan, as amended (the "ESPP"), aggregating 8.0 million shares for the year ended December 31, 2016 and 8.2 million shares for the year ended December 31, 2015 have not been included in the computation of diluted loss per share because their effect would have been antidilutive.
(5) CASH EQUIVALENTS AND INVESTMENTS
The Company invests in debt and equity instruments, primarily U.S. government-backed, municipal and corporate obligations, which management believes to be high quality (investment grade) credit instruments.
During the year ended December 31, 2017, the Company sold $51.6 million of its available-for-sale securities, primarily to provide the cash consideration and other acquisition-related payments in connection with the Merger. During the year ended December 31, 2016, the Company sold $4.9 million of its available-for-sale securities. The Company recognized nominal gross gains and losses from the sales of these securities. The Company did not sell any of its available-for-sale securities during the year ended December 31, 2015.
Investments with continuous unrealized losses for one year or greater at December 31, 2017 were nominal; however, since the Company does not intend to sell these securities and does not believe it will be required to sell any securities before they recover in value, it does not believe these declines are other-than-temporary.
On a quarterly basis, the Company reviews its investments to determine if there have been any events that could create a credit impairment. Based on its reviews, the Company does not believe that any impairment existed with its current holdings at December 31, 2017.
83
The amortized cost, gross unrealized gains and losses and fair value of the Company's cash equivalents and investments at December 31, 2017 and 2016 were comprised of the following (in thousands):
December 31, 2017 | |||||||||||||||
Amortized cost | Unrealized gains | Unrealized losses | Fair value | ||||||||||||
Cash equivalents | $ | 1,254 | $ | — | $ | — | $ | 1,254 | |||||||
Short-term investments | |||||||||||||||
U.S. government agency notes | $ | 4,091 | $ | — | $ | (19 | ) | $ | 4,072 | ||||||
Corporate debt securities | 8,048 | — | (31 | ) | 8,017 | ||||||||||
Certificates of deposit | 5,135 | — | — | 5,135 | |||||||||||
$ | 17,274 | $ | — | $ | (50 | ) | $ | 17,224 | |||||||
Investments | |||||||||||||||
U.S. government agency notes | $ | 3,992 | $ | — | $ | (28 | ) | $ | 3,964 | ||||||
Corporate debt securities | 3,908 | — | (24 | ) | 3,884 | ||||||||||
Certificates of deposit | 1,183 | — | — | 1,183 | |||||||||||
$ | 9,083 | $ | — | $ | (52 | ) | $ | 9,031 | |||||||
December 31, 2016 | |||||||||||||||
Amortized cost | Unrealized gains | Unrealized losses | Fair value | ||||||||||||
Cash equivalents | $ | 6,619 | $ | — | $ | — | $ | 6,619 | |||||||
Short-term investments | |||||||||||||||
Municipal obligations | $ | 3,264 | $ | — | $ | (3 | ) | $ | 3,261 | ||||||
U.S. government agency notes | 16,477 | 3 | (3 | ) | 16,477 | ||||||||||
Corporate debt securities | 41,893 | 4 | (45 | ) | 41,852 | ||||||||||
Certificates of deposit | 246 | — | — | 246 | |||||||||||
$ | 61,880 | $ | 7 | $ | (51 | ) | $ | 61,836 | |||||||
Investments | |||||||||||||||
U.S. government agency notes | $ | 19,473 | $ | 3 | $ | (39 | ) | $ | 19,437 | ||||||
Corporate debt securities | 10,520 | — | (44 | ) | 10,476 | ||||||||||
Certificates of deposit | 2,458 | — | — | 2,458 | |||||||||||
$ | 32,451 | $ | 3 | $ | (83 | ) | $ | 32,371 | |||||||
The Company's available-for-sale debt securities that are classified as Investments in the consolidated balance sheet mature after one year but within two years or less from the balance sheet date.
Fair Value Hierarchy
Fair value is the price that would be received to sell an asset or paid to transfer a liability in an orderly transaction between market participants. As such, fair value is a market-based measurement that should be determined based on assumptions that market participants would use in pricing an asset or a liability. The three-tier fair value hierarchy is based on the level of independent, objective evidence surrounding the inputs used to measure fair value. A financial instrument's categorization within the fair value hierarchy is based upon the lowest level of input that is significant to the fair value measurement. The fair value hierarchy is as follows:
Level 1. Level 1 applies to assets or liabilities for which there are quoted prices in active markets for identical assets or liabilities.
84
Level 2. Level 2 applies to assets or liabilities for which there are inputs that are directly or indirectly observable in the marketplace, such as quoted prices for similar assets or liabilities in active markets or quoted prices for identical assets or liabilities in markets with insufficient volume or infrequent transactions (less active markets).
Level 3. Level 3 applies to assets or liabilities for which there are unobservable inputs to the valuation methodology that are significant to the measurement of the fair value of the assets or liabilities.
The following table shows the fair value of the Company's financial assets at December 31, 2017 and 2016. These financial assets are comprised of the Company's available-for-sale debt securities and reported under the captions Cash and cash equivalents, Short-term investments and Investments in the consolidated balance sheets (in thousands):
Fair value measurements at December 31, 2017 using: | |||||||||||||||
Total carrying value at December 31, 2017 | Quoted prices in active markets (Level 1) | Significant other observable inputs (Level 2) | Significant unobservable inputs (Level 3) | ||||||||||||
Cash equivalents | $ | 1,254 | $ | 1,254 | $ | — | $ | — | |||||||
Short-term investments | |||||||||||||||
U.S. government agency notes | $ | 4,072 | $ | — | $ | 4,072 | $ | — | |||||||
Corporate debt securities | 8,017 | — | 8,017 | — | |||||||||||
Certificates of deposit | 5,135 | — | 5,135 | — | |||||||||||
$ | 17,224 | $ | — | $ | 17,224 | $ | — | ||||||||
Investments | |||||||||||||||
U.S. government agency notes | $ | 3,964 | $ | — | $ | 3,964 | $ | — | |||||||
Corporate debt securities | 3,884 | — | 3,884 | — | |||||||||||
Certificates of deposit | 1,183 | — | 1,183 | — | |||||||||||
$ | 9,031 | $ | — | $ | 9,031 | $ | — | ||||||||
Fair value measurements at December 31, 2016 using: | |||||||||||||||
Total carrying value at December 31, 2016 | Quoted prices in active markets (Level 1) | Significant other observable inputs (Level 2) | Significant unobservable inputs (Level 3) | ||||||||||||
Cash equivalents | $ | 6,619 | $ | 6,619 | $ | — | $ | — | |||||||
Short-term investments | |||||||||||||||
Municipal obligations | $ | 3,261 | $ | — | $ | 3,261 | $ | — | |||||||
U.S. government agency notes | 16,477 | — | 16,477 | — | |||||||||||
Corporate debt securities | 41,852 | — | 41,852 | — | |||||||||||
Certificates of deposit | 246 | — | 246 | — | |||||||||||
$ | 61,836 | $ | — | $ | 61,836 | $ | — | ||||||||
Investments | |||||||||||||||
U.S. government agency notes | $ | 19,437 | $ | — | $ | 19,437 | $ | — | |||||||
Corporate debt securities | 10,476 | — | 10,476 | — | |||||||||||
Certificates of deposit | 2,458 | — | 2,458 | — | |||||||||||
$ | 32,371 | $ | — | $ | 32,371 | $ | — | ||||||||
The Company's marketable securities and investments have been valued with the assistance of valuations provided by third-party pricing services, as derived from such services' pricing models. Inputs to the models may include, but are not limited to, reported trades, executable bid and asked prices, broker/dealer quotations, prices or yields of securities with similar
85
characteristics, benchmark curves or information pertaining to the issuer, as well as industry and economic events. The pricing services may use a matrix approach, which considers information regarding securities with similar characteristics to determine the valuation for a security. The Company is ultimately responsible for the consolidated financial statements and underlying estimates. Accordingly, the Company assesses the reasonableness of the valuations provided by the third-party pricing services by reviewing actual trade data, broker/dealer quotes and other similar data, which are obtained from quoted market prices or other sources.
(6) ACCOUNTS RECEIVABLE, NET
Accounts receivable, net, consisted of the following (in thousands):
December 31, | |||||||
2017 | 2016 | ||||||
Accounts receivable | $ | 165,229 | $ | 53,872 | |||
Allowance for doubtful accounts | (73 | ) | (10 | ) | |||
Accounts receivable, net | $ | 165,156 | $ | 53,862 | |||
The Company's allowance for doubtful accounts activity was as follows (in thousands):
Year ended December 31, | Balance at beginning of year | Charges to expense | Charges (credits) to other accounts (deferred revenue) | Write-offs | Balance at end of year | ||||||||||||||
2017 | $ | 10 | $ | 154 | $ | (56 | ) | $ | (35 | ) | $ | 73 | |||||||
2016 | $ | 10 | $ | 10 | $ | — | $ | (10 | ) | $ | 10 | ||||||||
2015 | $ | 58 | $ | 17 | $ | — | $ | (65 | ) | $ | 10 | ||||||||
(7) INVENTORY
Inventory consisted of the following (in thousands):
December 31, | |||||||
2017 | 2016 | ||||||
On-hand final assemblies and finished goods inventories | $ | 18,374 | $ | 15,346 | |||
Deferred cost of goods sold | 4,569 | 4,237 | |||||
22,943 | 19,583 | ||||||
Less current portion | (21,303 | ) | (18,283 | ) | |||
Noncurrent portion (included in Other assets) | $ | 1,640 | $ | 1,300 | |||
86
(8) PROPERTY AND EQUIPMENT
Property and equipment consisted of the following (in thousands):
December 31, | |||||||||
Useful Life | 2017 | 2016 | |||||||
Equipment | 2-5 years | $ | 67,415 | $ | 63,622 | ||||
Software | 2-5 years | 21,977 | 19,378 | ||||||
Furniture and fixtures | 3-5 years | 1,892 | 698 | ||||||
Leasehold improvements | Shorter of the life of the lease or estimated useful life (1-5 years) | 18,428 | 11,757 | ||||||
109,712 | 95,455 | ||||||||
Less accumulated depreciation and amortization | (84,932 | ) | (83,714 | ) | |||||
Property and equipment, net | $ | 24,780 | $ | 11,741 | |||||
The Company recorded depreciation and amortization expense related to property and equipment of $8.5 million for the year ended December 31, 2017, $8.0 million for the year ended December 31, 2016 and $12.0 million for the year ended December 31, 2015. During each of the years ended December 31, 2017 and 2016, the Company disposed of certain property and equipment that was fully depreciated at the time of disposal, which resulted in reductions in both Cost and Accumulated depreciation.
Property and equipment under capital leases included in the amounts above were as follows (in thousands):
December 31, | |||||||
2017 | 2016 | ||||||
Cost | $ | 664 | $ | 173 | |||
Less accumulated depreciation | (180 | ) | (68 | ) | |||
Property and equipment under capital leases, net | $ | 484 | $ | 105 | |||
The net book values of the Company's property and equipment by geographic area were as follows (in thousands):
December 31, | |||||||
2017 | 2016 | ||||||
United States | $ | 17,576 | $ | 7,939 | |||
Canada | 1,740 | 246 | |||||
Asia/Pacific | 3,853 | 2,963 | |||||
Europe | 1,400 | 593 | |||||
Other | 211 | — | |||||
$ | 24,780 | $ | 11,741 | ||||
87
(9) INTANGIBLE ASSETS AND GOODWILL
The Company's intangible assets at December 31, 2017 and 2016 consisted of the following (in thousands):
December 31, 2017 | Weighted average amortization period (years) | Cost | Accumulated amortization | Net carrying value | |||||||||
In-process research and development | * | $ | 5,600 | $ | — | $ | 5,600 | ||||||
Developed technology | 6.90 | 153,380 | 24,211 | 129,169 | |||||||||
Customer relationships | 9.32 | 120,840 | 12,015 | 108,825 | |||||||||
Trade names | 3.00 | 900 | 80 | 820 | |||||||||
Internal use software | 3.00 | 730 | 730 | — | |||||||||
7.77 | $ | 281,450 | $ | 37,036 | $ | 244,414 | |||||||
December 31, 2016 | Weighted average amortization period (years) | Cost | Accumulated amortization | Net carrying value | |||||||||
Developed technology | 6.54 | $ | 34,980 | $ | 16,453 | $ | 18,527 | ||||||
Customer relationships | 5.78 | 19,540 | 7,870 | 11,670 | |||||||||
Internal use software | 3.00 | 730 | 730 | — | |||||||||
6.23 | $ | 55,250 | $ | 25,053 | $ | 30,197 | |||||||
* An in-process research and development intangible asset has an indefinite life until the product is generally available, at which time such asset is typically reclassified to developed technology.
Amortization expense for intangible assets for the years ended December 31, 2017, 2016 and 2015 was as follows (in thousands):
Year ended December 31, | Statement of operations classification | ||||||||||||
2017 | 2016 | 2015 | |||||||||||
Developed technology | $ | 18,358 | $ | 6,038 | $ | 5,222 | Cost of revenue - product | ||||||
Customer relationships | 4,145 | 1,462 | 1,723 | Sales and marketing | |||||||||
Trade names | 80 | — | — | Sales and marketing | |||||||||
Internal use software | — | — | 162 | Cost of revenue - product | |||||||||
$ | 22,583 | $ | 7,500 | $ | 7,107 | ||||||||
In connection with the preparation of its financial statements for the fourth quarter of 2017, the Company reviewed its intangible assets and other long-lived assets for impairment indicators. The Company determined that a triggering event had occurred relative to one of its developed technology intangible assets that had been previously acquired. During 2017, the Company discontinued its ongoing development of this technology and determined that there were no alternative uses of the technology within either its existing or future product lines. As a result, the Company recorded an impairment charge of $5.5 million to write down the carrying value of the asset to zero. This expense is included as a component of Cost of revenue - product in the Company's consolidated statements of operations for the year ended December 31, 2017.
88
Estimated future amortization expense for the Company's intangible assets at December 31, 2017 was as follows (in thousands):
Years ending December 31, | |||
2018 | $ | 46,013 | |
2019 | 39,109 | ||
2020 | 38,590 | ||
2021 | 32,472 | ||
2022 | 26,534 | ||
Thereafter | 61,696 | ||
$ | 244,414 | ||
Goodwill is recorded when the consideration for an acquisition exceeds the fair value of net tangible and identifiable intangible assets acquired. The changes in the carrying value of the Company's goodwill in the years ended December 31, 2017 and 2016 were as follows (in thousands):
Year ended December 31, | |||||||
2017 | 2016 | ||||||
Balance at January 1 | |||||||
Goodwill | $ | 52,499 | $ | 43,416 | |||
Accumulated impairment losses | (3,106 | ) | (3,106 | ) | |||
49,393 | 40,310 | ||||||
Acquisition of GENBAND | 285,825 | — | |||||
Acquisition of Taqua and subsequent purchase accounting adjustments | 498 | 9,083 | |||||
Balance at December 31 | $ | 335,716 | $ | 49,393 | |||
The components of the Company's goodwill balances at December 31, 2017 and 2016 were as follows:
December 31, | |||||||
2017 | 2016 | ||||||
Goodwill | $ | 338,822 | $ | 52,499 | |||
Accumulated impairment losses | (3,106 | ) | (3,106 | ) | |||
$ | 335,716 | $ | 49,393 | ||||
(10) ACCRUED EXPENSES
Accrued expenses consisted of the following (in thousands):
December 31, | |||||||
2017 | 2016 | ||||||
Employee compensation and related costs | $ | 37,782 | $ | 15,879 | |||
Professional fees | 13,743 | 1,243 | |||||
Other | 24,855 | 9,918 | |||||
$ | 76,380 | $ | 27,040 | ||||
(11) RESTRUCTURING ACCRUALS
The Company recorded restructuring expense aggregating $9.4 million in the year ended December 31, 2017, $2.7 million in the year ended December 31, 2016 and $2.1 million in the year ended December 31, 2015.
89
Merger Restructuring Initiative
In connection with the Merger, the Company's management approved a restructuring plan in the fourth quarter of 2017 to eliminate certain redundant positions and facilities within the combined companies (the "Merger Restructuring Initiative"). In connection with this initiative, the Company recorded $8.5 million of restructuring expense in 2017 for severance and related costs for approximately 120 employees. The Company expects to record additional restructuring expense in 2018 in connection with this initiative for redundant facilities and severance for approximately 40 additional employees as it continues to combine the two businesses and benefit from operational synergies. The Company expects the amount accrued at December 31, 2017 will be paid in 2018. The Company anticipates it will record additional future expense in connection with this initiative for headcount and redundant facilities aggregating approximately $12 million. The Company believes that the payments related to this expected additional future expense will be completed by early 2019.
A summary of the Merger Restructuring Initiative accrual activity for the year ended December 31, 2017 is as follows (in thousands):
Year ended December 31, 2017 | Balance at January 1, 2017 | Initiatives charged to expense | Adjustments for changes in estimate | Cash payments | Balance at December 31, 2017 | ||||||||||||||
Severance | $ | — | $ | 8,508 | $ | — | $ | (913 | ) | $ | 7,595 | ||||||||
The Company assumed GENBAND's previously recorded restructuring liability, totaling $4.1 million, on the Merger Date (the "GENBAND Restructuring Initiative"). Of this amount, $3.7 million related to severance and related costs and $0.4 million related to facilities. The Company does not expect to record additional expense in connection with this initiative with the exception of adjustments for changes in estimated costs. The Company expects that the payments related to this assumed liability will be completed in 2018. A summary of the GENBAND Restructuring Initiative accrual activity for the year ended December 31, 2017 is as follows (in thousands):
Year ended December 31, 2017 | Balance at January 1, 2017 | Liability assumed in connection with Merger | Initiatives charged to expense | Adjustments for changes in estimate | Cash payments | Balance at December 31, 2017 | |||||||||||||||||
Severance | $ | — | $ | 3,663 | $ | — | $ | (158 | ) | $ | (1,589 | ) | $ | 1,916 | |||||||||
Facilities | — | 431 | — | (123 | ) | (103 | ) | 205 | |||||||||||||||
$ | — | $ | 4,094 | $ | — | $ | (281 | ) | $ | (1,692 | ) | $ | 2,121 | ||||||||||
2016 Restructuring Initiative
In July 2016, the Company announced a program (the "2016 Restructuring Initiative") to further accelerate its investment in new technologies, as the communications industry migrates to a cloud-based architecture and as the Company pursues new strategic initiatives, such as new products and an expanded go-to-market footprint in selected geographies and discrete vertical markets. The Company recorded $2.0 million of restructuring expense in the aggregate in connection with this initiative, comprised of $1.9 million for severance and related costs and $0.1 million to abandon its facility in Rochester, New York (the "Rochester Facility"). The actions under the 2016 Restructuring Initiative have been implemented and accordingly, the Company does not expect to record additional expense in connection with this initiative. The amounts accrued for severance and related costs had been fully paid by the end of the third quarter of 2017. The Company expects that the amounts accrued for facilities will be paid by the end of October 2019, when the lease on the Rochester Facility expires.
In connection with the 2016 Restructuring Initiative, the Company recorded $0.5 million of restructuring expense in the year ended December 31, 2017, including adjustments for changes in estimated costs, comprised of $0.4 million for severance and related costs and $0.1 million related to the Company's Rochester Facility. The Company recorded $1.5 million of expense in the year ended December 31, 2016 related to headcount reductions. Summaries of the 2016 Restructuring Initiative accrual activity for the years ended December 31, 2017 and 2016 are as follows (in thousands):
90
Year ended December 31, 2017 | Balance at January 1, 2017 | Initiatives charged to expense | Adjustments for changes in estimate | Cash payments | Balance at December 31, 2017 | ||||||||||||||
Severance | $ | 497 | $ | 405 | $ | (26 | ) | $ | (876 | ) | $ | — | |||||||
Facilities | — | 126 | — | (31 | ) | 95 | |||||||||||||
$ | 497 | $ | 531 | $ | (26 | ) | $ | (907 | ) | $ | 95 | ||||||||
Year ended December 31, 2016 | Balance at January 1, 2016 | Initiatives charged to expense | Adjustments for changes in estimate | Cash payments | Balance at December 31, 2016 | ||||||||||||||
Severance | $ | — | $ | 1,484 | $ | — | $ | (987 | ) | $ | 497 | ||||||||
Taqua Restructuring Initiative
In connection with the acquisition of Taqua, the Company's management approved a restructuring plan in the third quarter of 2016 to eliminate certain redundant positions within the combined companies. On October 24, 2016, the Audit Committee of the Board of Directors of the Company approved a broader Taqua restructuring plan related to headcount and redundant facilities (both restructuring plans, the "Taqua Restructuring Initiative"). The Company recorded $1.8 million of restructuring expense in the aggregate in connection with this initiative, comprised of $1.2 million for severance and related costs and $0.6 million related to the elimination of redundant facilities, including adjustments recorded for changes in cost estimates for the planned restructuring activities. The actions under the Taqua Restructuring Initiative have been implemented and accordingly, the Company does not expect to record additional expense in connection with this initiative. The amounts accrued for severance and related costs had been fully paid by the end of the third quarter of 2017. The Company expects that the amounts accrued for facilities will be paid by the end of 2018.
In connection with the Taqua Restructuring Initiative, the Company recorded $0.7 million of restructuring expense, including adjustments for changes in estimated costs, in the year ended December 31, 2017, comprised of $0.2 million for severance and related costs and $0.5 million related to redundant facilities. The Company recorded $1.2 million of restructuring expense for this initiative in the year ended December 31, 2016, comprised of $1.0 million for severance and related costs and $0.2 million related to redundant facilities. Summaries of the Taqua Restructuring Initiative accrual activity for the years ended December 31, 2017 and 2016 are as follows (in thousands):
Year ended December 31, 2017 | Balance at January 1, 2017 | Initiatives charged to expense | Adjustments for changes in estimate | Cash payments | Balance at December 31, 2017 | ||||||||||||||
Severance | $ | 384 | $ | 245 | $ | (49 | ) | $ | (580 | ) | $ | — | |||||||
Facilities | 218 | 508 | — | (361 | ) | 365 | |||||||||||||
$ | 602 | $ | 753 | $ | (49 | ) | $ | (941 | ) | $ | 365 | ||||||||
Year ended December 31, 2016 | Balance at January 1, 2016 | Initiatives charged to expense | Adjustments for changes in estimate | Cash payments | Balance at December 31, 2016 | ||||||||||||||
Severance | $ | — | $ | 971 | $ | — | $ | (587 | ) | $ | 384 | ||||||||
Facilities | — | 218 | — | — | 218 | ||||||||||||||
$ | — | $ | 1,189 | $ | — | $ | (587 | ) | $ | 602 | |||||||||
2015 Restructuring Initiative
To better align the Company's cost structure to its then-current revenue expectations, in April 2015, the Company announced a cost reduction review. As part of this review, on April 16, 2015, the Company initiated a restructuring plan to reduce its workforce by approximately 150 positions, or 12.5% of its worldwide workforce (the "2015 Restructuring Initiative"). In connection with the 2015 Restructuring Initiative, the Company recorded $3.8 million of restructuring expense for severance and related costs in the year ended December 31, 2015. The Company recorded $67,000 in the year ended
91
December 31, 2016 to adjust the amount expected to ultimately be paid for severance. Summaries of the 2015 Restructuring Initiative accrual for the years ended December 31, 2017 and 2016 are as follows (in thousands):
Year ended December 31, 2017 | Balance at January 1, 2017 | Initiatives charged to expense | Adjustments for changes in estimate | Cash payments | Balance at December 31, 2017 | ||||||||||||||
Severance | $ | 168 | $ | — | $ | — | $ | (168 | ) | $ | — | ||||||||
Year ended December 31, 2016 | Balance at January 1, 2016 | Initiatives charged to expense | Adjustments for changes in estimate | Cash payments | Balance at December 31, 2016 | ||||||||||||||
Severance | $ | 749 | $ | — | $ | 67 | $ | (648 | ) | $ | 168 | ||||||||
Balance Sheet Classification
The current portions of accrued restructuring are included as a component of Accrued expenses in the consolidated balance sheets. The long-term portions of accrued restructuring are included as a component of Other long-term liabilities in the consolidated balance sheets. The long-term portions of accrued restructuring were $0.2 million at December 31, 2017 and $0.1 million at December 31, 2016. These amounts represent future lease payments on restructured facilities.
(12) DEBT
Assumed Senior Secured Credit Agreement
On the Merger Date and in connection with the Merger, the Company assumed GENBAND's Senior Secured Credit Agreement with Silicon Valley Bank (the "Prior Credit Agreement"), which had outstanding borrowings and letters of credit totaling $17.9 million and $2.9 million, respectively, and an average interest rate of 4.67%. GENBAND had entered the Prior Credit Agreement with Silicon Valley Bank ("SVB") effective July 1, 2016, with two of its operating subsidiaries as borrowers and GENBAND as the guarantor. The Prior Credit Agreement had a maturity date of July 1, 2019 and provided for revolving loans, including letters of credit and swingline loans, not to exceed $50 million in total, with potential further increases of $75 million available for a total revolving line of credit of up to $125 million.
Senior Secured Credit Facility
On December 21, 2017, the Company entered into a Senior Secured Credit Facilities Credit Agreement (the “Credit Facility”), by and among the Company, as a guarantor, Sonus Networks, Inc., as the borrower (“Borrower”), Silicon Valley Bank, as administrative agent (in such capacity, the “Administrative Agent”), issuing lender, swingline lender and lead arranger and the lenders party thereto (each referred to individually as a “Lender”, and collectively, the “Lenders”), which refinanced the Prior Credit Agreement. The Credit Facility includes $100 million of commitments from the lenders to the Borrower, the full amount of which is available for revolving loans, a $15 million sublimit that is available for letters of credit and a $15 million sublimit that is available for swingline loans. The Credit Facility is scheduled to mature in December 2021, subject to a springing maturity if, on or before July 14, 2020, the existing promissory note issued to certain shareholders is not converted or extended to March 2022 or later. The Credit Facility includes procedures for additional financial institutions to become lenders, or for any existing lender to increase its commitment under the facility, subject to an available increase of $50 million for all incremental commitments under the Credit Facility.
The indebtedness and other obligations under the Credit Facility are unconditionally guaranteed on a senior secured basis by the Company and GENBAND US LLC, a wholly-owned domestic subsidiary of the Company (collectively, the “Guarantors”) and each other material US domestic subsidiary of the Company. The Credit Facility is secured by first-priority liens on substantially all of the assets of the Borrower and the Guarantors, including the Company.
The Credit Facility requires periodic interest payments until maturity. The Borrower may prepay all revolving loans under the Credit Facility at any time without premium or penalty (other than customary LIBOR breakage costs), subject to certain notice requirements.
92
Revolving loans under the Credit Facility bear interest at the Borrower’s option at either the Eurodollar (LIBOR) rate plus a margin ranging from 2.50% to 3.00% per year or the base rate (the highest of the Federal Funds rate plus 0.50%, or the prime rate announced from time to time in The Wall Street Journal) plus a margin ranging from 1.50% to 2.00% per year (such margins being referred to as the “Applicable Margin”). The Applicable Margin varies depending on the Company’s consolidated leverage ratio (as defined in the Credit Facility). The base rate and the LIBOR rate are each subject to a zero percent floor.
The Borrower is charged a commitment fee ranging from 0.25% to 0.40% per year on the daily amount of the unused portions of the commitments under the Credit Facility. Additionally, with respect to all letters of credit outstanding under the Credit Facility, the Borrower is charged a fronting fee of 0.125% per year and an outstanding letter of credit fee equal to the Applicable Margin for base rate loans ranging from 1.50% to 2.00% times the amount of the outstanding letters of credit.
The Credit Facility includes financial covenants regarding its minimum consolidated quick ratio, minimum consolidated interest coverage ratio and maximum consolidated leverage ratio, all of which are defined in the Credit Facility and tested on a quarterly basis. In addition, the Credit Facility contains various covenants that, among other restrictions, limit the Company’s and its subsidiaries’ ability to enter into certain types of transactions, including, but not limited to: incurring or assuming indebtedness, making acquisitions or engaging in mergers, making investments, repurchasing equity and paying dividends, selling or otherwise transferring assets, changing the nature of its business and amending or making prepayments on certain junior debt. The Company was in compliance with all covenants of the Credit Facility as of December 31, 2017.
The Credit Facility contains events of default that are customary for a secured credit facility. If an event of default relating to bankruptcy or other insolvency events with respect to a borrower occurs, all obligations under the Credit Facility will immediately become due and payable. If any other event of default exists under the Credit Facility, the lenders may accelerate the maturity of the obligations outstanding under the Credit Facility and exercise other rights and remedies, including charging a default rate of interest equal to 2.00% per year above the rate that would otherwise be applicable. In addition, if any event of default exists under the Credit Facility, the lenders may commence foreclosure or other actions against the collateral.
If any default exists under the Credit Facility, or if the Borrower is unable to make any of the representations and warranties as stated in the Credit Facility at the applicable time, the Borrower will be unable to borrow funds or have letters of credit issued under the Credit Facility, which, depending on the circumstances prevailing at that time, could have a material adverse effect on the Borrower’s liquidity and working capital.
At December 31, 2017, the Company had an outstanding debt balance of $20.0 million at an interest rate of 4.51% and $2.9 million of outstanding letters of credit at an interest rate of 2.00% under the Credit Facility.
Promissory Note
In connection with the Merger, on October 27, 2017, the Company issued a promissory note for $22.5 million to certain of GENBAND's equity holders (the "Promissory Note"). The Promissory Note does not amortize and the principal thereon is payable in full on the third anniversary of its execution. Interest on the Promissory Note is payable quarterly in arrears and accrues at a rate of 7.5% per year for the first six months after issuance, and thereafter at a rate of 10% per year. The failure to make any payment under the Promissory Note when due and, with respect to payment of any interest, the continuation of such failure for a period of thirty days thereafter, constitutes an event of default under the Promissory Note. If an event of default occurs under the Promissory Note, the payees may declare the entire balance of the Promissory Note due and payable (including principal and accrued and unpaid interest) within five business days of the payees' notification to the Company of such acceleration.
Credit Agreement
Sonus maintained a credit agreement by and among Sonus, as Borrower, Bank of America, N.A. ("Bank of America"), as Administrative Agent, Swing Line Lender and L/C Issuer, and the other lenders from time to time party thereto, entered into on June 27, 2014 (as amended, the "Sonus Credit Agreement"). The Sonus Credit Agreement expired by its terms on June 30, 2017 and was not renewed. Sonus did not have any amounts outstanding under the Sonus Credit Agreement at December 31, 2016.
93
(13) LONG-TERM LIABILITIES
Long-term liabilities consisted of the following (in thousands):
December 31, | |||||||
2017 | 2016 | ||||||
Capital lease obligations | $ | 837 | $ | 124 | |||
Deferred rent | 1,359 | 1,812 | |||||
Restructuring | 10,176 | 1,267 | |||||
Pension obligations | 7,524 | — | |||||
Taxes payable | 2,079 | — | |||||
Other | 2,544 | 790 | |||||
24,519 | 3,993 | ||||||
Current portion | (11,330 | ) | (2,360 | ) | |||
Long-term liabilities, net of current portion | $ | 13,189 | $ | 1,633 | |||
The current portions of long-term liabilities are included as components of Accrued expenses in the Company's consolidated balance sheets.
(14) COMMON STOCK REPURCHASES
On July 29, 2013, Sonus announced that its Board of Directors had authorized a stock buyback program to repurchase up to $100 million of its common stock from time to time on the open market or in privately negotiated transactions. The timing and amount of any shares repurchased was determined by Sonus' management based on its evaluation of market conditions and other factors. The buyback program did not have a fixed expiration date but could be suspended or discontinued at any time. The buyback program was funded using Sonus' working capital. Ribbon did not assume the stock buyback program in connection with the Merger.
During the year ended December 31, 2017, Sonus did not repurchase any shares under the stock buyback program. During the year ended December 31, 2016, Sonus spent $9.5 million, including transaction fees, to repurchase and retire 1.3 million shares of its common stock under the buyback program.
(15) STOCK-BASED COMPENSATION PLANS
Amended and Restated Stock Incentive Plan
The Company's Amended and Restated Stock Incentive Plan (the "Plan"), provides for the award of options to purchase the Company's common stock ("stock options"), stock appreciation rights ("SARs"), restricted stock awards ("RSAs"), restricted stock units ("RSUs"), performance-based stock awards ("PSAs"), performance-based stock units ("PSUs") and other stock-based awards to employees, officers, directors (including those directors who are not employees or officers of the Company), consultants and advisors of the Company and its subsidiaries.
At its 2017 Annual Meeting of Stockholders held on June 9, 2017 (the "2017 Annual Meeting"), the Company's stockholders approved amendments to the Plan including, among other things, to increase the number of shares of the Company's common stock authorized for issuance under the Plan by 900,000 shares; provide that any dividends or dividend equivalents on applicable unvested equity grants will be paid to a participant only if and when such shares become free from the restrictions on transferability and forfeitability; explicitly require a participant who accepts an award under the Plan to be bound by any clawback policy that the Company has in effect or may adopt in the future; and eliminate the fungible ratio applied to awards of shares of restricted stock, restricted stock units , performance awards or other stock units (collectively, full value awards") granted on or after June 9, 2017, but maintained the fungible ratios applied to prior grants of full value awards such
94
that full value awards that were granted under any prior ratio that applied at the time such awards were granted will continue to return to the Plan upon forfeiture of such awards at the previous applicable ratio.
In connection with the Merger, the Company assumed the Plan with all of its then-current terms and conditions.
At December 31, 2017, there were 5.4 million shares available for future issuance under the Plan.
2012 Stock Incentive Plan
In connection with the acquisition of PT, the Company assumed PT's 2012 Amended Performance Technologies, Incorporated Omnibus Incentive Plan, and subsequently renamed it the 2012 Stock Incentive Plan (the "2012 Plan"). In December 2014, all of the unissued shares under the 2012 Plan were transferred to the Plan. Any outstanding awards under the 2012 Plan that in the future expire, terminate, are canceled, surrendered or forfeited, or are repurchased by the Company will be returned to the Plan. Accordingly, at December 31, 2017, there were no shares available for future issuance under the 2012 Plan.
2008 Stock Incentive Plan
In connection with the acquisition of NET, the Company assumed NET's 2008 Equity Incentive Plan and subsequently renamed it the 2008 Stock Incentive Plan (the "2008 Plan"). In December 2014, all of the unissued shares under the 2008 Plan were transferred to the Plan. Any outstanding awards under the 2008 Plan that in the future expire, terminate, are canceled, surrendered or forfeited, or are repurchased by the Company will be returned to the Plan. Accordingly, at December 31, 2017, there were no shares available for future issuance under the 2008 Plan.
Treatment of Equity Awards in Connection with the Merger
In connection with the Merger, the Company accelerated the vesting of all outstanding stock options and certain outstanding full value awards. In addition, the vesting schedules of certain remaining unvested full value awards were adjusted. Such vesting and adjustments are described as follows:
Stock options - each stock option outstanding as of five business days prior to the Merger Date became vested in full as of that date (to the extent not previously vested), and the holders of such stock options were permitted to exercise their stock options from October 20, 2017 through October 24, 2017, after which date all remaining stock options, with certain exceptions, were canceled. The Company accelerated the vesting of 0.3 million stock options and subsequently canceled 4.5 million vested unexercised stock options in connection with this transaction. This activity is included in the stock options table below. Any stock options granted under the 2008 Plan and 2012 Plan were not canceled, as these plans do not permit such cancellations. These stock options will continue to be outstanding until they are either exercised or expire.
RSAs and RSUs - as prescribed by the Company's Plan, any unvested RSAs and RSUs that were scheduled to vest within one year from the Merger Date became vested in full as of the Merger Date. The vesting schedules of the remaining unvested RSAs and RSUs were then accelerated by one year. Certain executives had specific terms and conditions related to their RSAs detailed in their employment agreements or amendments thereto (the "employment terms"). The accelerated vesting of and future vesting schedule adjustments to the RSAs held by these individuals were completed in accordance with their individual employment terms. In accordance with the terms of their RSA grants, unvested RSAs held by the then-current members of the Board of Directors were accelerated on a pro rata basis based on the amount of time the unvested RSAs were outstanding compared to the originally scheduled vesting date. Unvested PSUs granted to the Company's former President and Chief Executive Officer, who separated from the Company effective December 13, 2017 (the "former CEO"), were converted to RSAs in accordance with his employment terms; certain of those converted grants were accelerated, and the remaining RSAs would continue to vest according to their terms, but with the elimination of any required satisfaction of the performance metrics associated with the awards when they were originally granted as PSUs. Accordingly, the release of the former CEO's RSAs that were converted from PSUs is included in the RSA table below. In total, the Company accelerated the vesting of and released 1.1 million RSAs and approximately 36,000 RSUs in connection with the Merger. The activity related to these RSAs and RSUs is included in the applicable tables below.
PSUs - any unvested PSUs were accelerated in accordance with the employment agreement of each individual PSU
95
holder. The remaining unvested units will continue to vest according to their terms, with the exception of the PSU grants held by the former CEO, as discussed above. The Company accelerated the vesting of and released approximately 98,000 PSUs in connection with this transaction. The activity related to these PSUs is included in the PSU table below.
Executive Equity Arrangements
In 2015, the Company began to grant PSUs to certain of its executives. The terms of each PSU grant are such that up to one-third of the shares subject to the respective PSU grant will vest, if at all, on each of the respective first, second and third anniversaries of the date of grant, depending on the Company's total shareholder return ("TSR") compared to the TSR of the companies included in the Nasdaq Telecommunications Index for the same fiscal year, measured by the Compensation Committee after each of the fiscal years as defined by each grant (each, a "Performance Period"). The shares determined to be earned will vest on the anniversary of the grant date following each Performance Period. Shares subject to the PSUs that fail to be earned will be forfeited.
All of the PSUs include a market condition that required the use of a Monte Carlo simulation approach to model future stock price movements based upon the risk-free rate of return, the date of return, the volatility of each entity and the pair-wise covariance between each entity. These results were then used to calculate the grant date fair values of the respective PSUs. Because all of the PSUs granted have market conditions, the Company is required to record expense for the PSUs through their respective final vesting dates regardless of the number of shares that are ultimately earned.
On March 31, 2017, the Company granted an aggregate of 165,000 PSUs with both market and service conditions to five of its executives.
On April 1, 2016, the Company granted an aggregate of 131,250 PSUs with both market and service conditions to six of its executives (the "2016 PSUs"). In February 2017, the Compensation Committee determined that the performance metrics for the 2016 PSUs for the 2016 Performance Period had been achieved at the 90.4% level, and accordingly, 24,106 shares in the aggregate were released to the four executives holding such outstanding grants on March 16, 2017. The unearned shares relating to the 2016 Performance Period, aggregating 2,560 shares, were forfeited on March 16, 2017. These amounts are included in the PSU table below.
On March 16, 2015, the Company granted an aggregate of 131,250 PSUs with both market and service conditions to eight of its executives (the "2015 PSUs"). In February 2017, the Compensation Committee determined that the performance metrics for the 2015 PSUs for the 2016 Performance Period had been achieved at the 76.0% level, and accordingly, 23,750 shares in the aggregate were released to the four remaining executives holding such outstanding grants on April 1, 2017. The unearned shares relating to the 2016 Performance Period, aggregating 7,500 shares, were forfeited on April 1, 2017.
In connection with the Merger, as previously described above, PSUs held by the former CEO were converted to RSAs and certain other PSUs were accelerated and released in accordance with the individual employment terms of each PSU grantee. The vesting schedules of the remaining unvested PSUs were adjusted to continue to vest on their terms.
In connection with the Company's annual incentive program, 22 executives of the Company were given the choice to receive all or half of their fiscal year 2015 bonuses (the "2015 Bonus"), if any were earned, in the form of shares of the Company's common stock (the "2015 Bonus Shares"). Each executive could also elect not to participate in this program and to earn his or her 2015 Bonus, if any, in the form of cash. In September 2015, the Compensation Committee considered the impact on employee retention and incentive compensation caused by the drop in the price of the Company's common stock since January 2, 2015, and indicated its intent to pay all such executives their 2015 Bonus, if any was earned, in cash. As a result, at September 25, 2015, the Company reclassified the stock-based compensation expense recorded through that date in connection with the 2015 Bonus Shares aggregating $1.0 million from Additional paid-in capital to Accrued expenses and recorded incremental bonus expense of $1.3 million related to the estimated 2015 Bonus payment. The Company recorded bonus expense in the fourth quarter of 2015 and paid the cash bonuses in March 2016.
On December 14, 2017, the Company announced that, on and effective December 13, 2017, the Board of Directors appointed Franklin (Fritz) W. Hobbs as the Company's President and Chief Executive Officer, and the Former CEO resigned his position as the Company's President and Chief Executive Officer and as a member of the Board of Directors. In connection with the separation of the Former CEO from the Company and in accordance with his employment agreement with the
96
Company, as amended, the Company accelerated the vesting of his then-unvested RSAs (including those that had been converted from PSUs in connection with the Merger, as described above). These shares are reported as "Vested" in the RSA table below. However, due to the terms of the Former CEO's separation agreement with the Company and applicable employment laws, the shares were not released until January 2018. Accordingly, these shares were not considered outstanding as of December 31, 2017.
Stock Options
Options are issued to purchase shares of common stock of the Company at prices that are equal to the fair market value of the shares on the date the option is granted. Options granted under the Stock Plan generally expire ten years from the date of grant. Outstanding options under the 2008 Plan generally expire seven years from the date of grant. Outstanding options under the 2012 Plan generally expire five years from the date of grant. The grant date fair value of options, adjusted for estimated forfeitures, is recognized as expense on a straight-line basis over the requisite service period, which is generally the vesting period. Forfeitures are estimated based on historical experience.
The activity related to the Company's outstanding stock options during the year ended December 31, 2017 was as follows:
Number of Shares | Weighted Average Exercise Price | Weighted Average Remaining Contractual Term (years) | Aggregate Intrinsic Value (in thousands) | |||||||||
Outstanding at January 1, 2016 | 5,610,106 | $ | 15.73 | |||||||||
Granted | 7,760 | $ | 6.67 | |||||||||
Exercised | (105,688 | ) | $ | 5.85 | ||||||||
Forfeited | (35,907 | ) | $ | 13.82 | ||||||||
Expired | (5,041,084 | ) | $ | 16.02 | ||||||||
Outstanding at December 31, 2017 | 435,187 | $ | 14.71 | 4.30 | $ | 66 | ||||||
Vested or expected to vest at December 31, 2017 | 435,187 | $ | 14.71 | 4.30 | $ | 66 | ||||||
Exercisable at December 31, 2017 | 435,187 | $ | 14.71 | 4.30 | $ | 66 | ||||||
The grant date fair values of options to purchase common stock granted in the years ended December 31, 2017, 2016 and 2015 were estimated using the Black-Scholes valuation model with the following assumptions:
Year ended December 31, | |||||
2017 | 2016 | 2015 | |||
Risk-free interest rate | 1.22% - 1.95% | 1.00% - 1.61% | 1.46%-1.75% | ||
Expected dividends | — | — | — | ||
Weighted average volatility | 51.1% | 54.8% | 54.3% | ||
Expected life (years) | 5.0 | 5.0-10.0 | 5.0-6.0 | ||
The risk-free interest rate used is the average U.S. Treasury Constant Maturities Rate for the expected life of the award. The expected dividend yield of zero is based on the fact that the Company has never paid dividends and has no present intention to pay cash dividends. The expected life for stock options is based on a combination of the Company's historical option patterns and expectations of future employee actions.
The weighted average grant-date fair values of options granted during the year were $3.05 for the year ended December 31, 2017, $4.39 for the year ended December 31, 2016 and $7.30 for the year ended December 31, 2015.
The total intrinsic values of options exercised during the year were $0.2 million for the year ended December 31, 2017, $42,000 for the year ended December 31, 2016 and $0.9 million for the year ended December 31, 2015.
97
The Company received cash from option exercises of $0.6 million in the year ended December 31, 2017, $0.2 million in the year ended December 31, 2016 and $1.8 million in the year ended December 31, 2015.
Restricted Stock Grants - Restricted Stock Awards and Restricted Stock Units
The Company's outstanding restricted stock grants consist of both RSAs and RSUs. Holders of unvested RSAs have voting rights and rights to receive dividends, if declared; however, these rights are forfeited if the underlying unvested RSA shares are forfeited. Holders of unvested RSUs do not have such voting and dividend rights. The grant date fair value of restricted stock grants, adjusted for estimated forfeitures, is recognized as expense on a straight-line basis over the requisite service period. The fair value of restricted stock grants is determined based on the market value of the Company's shares on the date of grant.
The activity related to the Company's RSAs for the year ended December 31, 2017 was as follows:
Shares | Weighted Average Grant Date Fair Value | |||||
Unvested balance at January 1, 2017 | 2,030,028 | $ | 9.69 | |||
Granted | 1,763,912 | $ | 6.77 | |||
Unvested PSUs converted to RSAs in connection with the Merger | 95,834 | $ | 9.44 | |||
Vested | (2,080,179 | ) | $ | 8.93 | ||
Forfeited | (113,013 | ) | $ | 8.80 | ||
Unvested balance at December 31, 2017 | 1,696,582 | $ | 7.68 | |||
The activity related to the Company's RSUs for the year ended December 31, 2017 was as follows:
Shares | Weighted Average Grant Date Fair Value | |||||
Unvested balance at January 1, 2017 | 110,219 | $ | 11.95 | |||
Granted | — | $ | — | |||
Vested | (80,374 | ) | $ | 7.06 | ||
Forfeited | (11,913 | ) | $ | 8.66 | ||
Unvested balance at December 31, 2017 | 17,932 | $ | 6.99 | |||
The total fair value of vested restricted stock grant shares was $19.1 million in the year ended December 31, 2017, $10.1 million in the year ended December 31, 2016 and $8.5 million in the year ended December 31, 2015.
Performance-Based Stock Grants - Performance-Based Stock Units
In 2016, the Company's outstanding performance-based stock grants consisted of PSUs. Holders of unvested PSUs do not have voting and dividend rights. The Company recognizes the grant date fair value of PSUs on a graded attribution basis through the vest date of the respective awards so long as it remains probable that the related service conditions will be satisfied.
98
The activity related to the Company's PSUs for the year ended December 31, 2017 was as follows:
Shares | Weighted Average Grant Date Fair Value | |||||
Unvested balance at January 1, 2017 | 147,085 | $ | 12.11 | |||
Granted | 165,000 | $ | 8.45 | |||
Unvested PSUs converted to RSAs in connection with the Merger | (95,834 | ) | $ | 9.44 | ||
Vested | (145,357 | ) | $ | 9.44 | ||
Forfeited | (10,060 | ) | $ | 11.87 | ||
Unvested balance at December 31, 2017 | 60,834 | $ | 9.65 | |||
The total fair value of vested performance-based stock grant shares was $1.4 million in the year ended December 31, 2017, $0.2 million in the year ended December 31, 2016 and $0.6 million in the year ended December 31, 2015.
ESPP
The ESPP is designed to provide eligible employees of the Company and its participating subsidiaries an opportunity to purchase common stock of the Company through accumulated payroll deductions.
The ESPP provides for six-month consecutive offering periods, with the purchase price of the stock equal to 85% of the lesser of the market price on the first or last day of the offering period. The maximum number of shares of common stock an employee may purchase during each offering period is 500, subject to certain adjustments pursuant to the ESPP.
In May 2017, the Compensation Committee determined to suspend all offering periods under the ESPP, effective September 1, 2017, until such time after the Merger Date as the Compensation Committee determines is best in its sole discretion.
At December 31, 2017, 5.0 million shares, the maximum number of shares that may be issued under the ESPP, were authorized, and 1.4 million shares were available under the ESPP for future issuance.
Stock-Based Compensation
The consolidated statements of operations included stock-based compensation for the years ended December 31, 2017, 2016 and 2015 as follows (in thousands):
Year ended December 31, | |||||||||||
2017 | 2016 | 2015 | |||||||||
Product cost of revenue | $ | 514 | $ | 359 | $ | 317 | |||||
Service cost of revenue | 1,448 | 1,314 | 1,524 | ||||||||
Research and development | 7,337 | 5,014 | 5,439 | ||||||||
Sales and marketing | 4,885 | 6,209 | 5,423 | ||||||||
General and administrative | 11,473 | 6,872 | 8,996 | ||||||||
$ | 25,657 | $ | 19,768 | $ | 21,699 | ||||||
There was no income tax benefit for employee stock-based compensation expense for the years ended December 31, 2017, 2016 and 2015 due to the valuation allowance recorded.
Stock-based compensation expense recorded for the year ended December 31, 2017 included $8.6 million of incremental expense related to the acceleration of stock options and full value awards and subsequent adjustments to the vesting schedules of the remaining unvested full value awards in connection with the Merger. In addition, the Company recorded $1.6 million of incremental expense related to the accelerated vesting of RSAs held by the Former CEO in connection with his separation from the Company effective December 13, 2017. These incremental amounts were all recorded in the fourth quarter of 2017.
99
During the three months ended March 31, 2017, the Company reversed $1.0 million of incremental expense to correct an error in 2016 related to the acceleration of certain stock awards held by an executive who separated from the Company in 2016. Management had reviewed and considered the impact of the error and determined that it was not material to the Company's consolidated financial results for the third and fourth quarters of 2016, as well as the 2016 fiscal year. Management has also determined that the correction of this error is not material to the results of operations for the 2017 reporting periods.
At December 31, 2017, there was $7.5 million, net of expected forfeitures, of unrecognized stock-based compensation expense related to unvested stock options, RSAs, RSUs and PSUs. This expense is expected to be recognized over a weighted average period of approximately two years.
Common Stock Reserved
Common stock reserved for future issuance at December 31, 2017 consists of the following:
Amended and Restated Stock Incentive Plan | 5,359,243 | |
ESPP | 1,431,513 | |
6,790,756 | ||
The Company's policy is to issue authorized but unissued shares upon the exercise of stock options, grant restricted common stock awards and settlement of restricted stock units and performance-based stock units, and authorize the purchase of shares of the Company's common stock under the ESPP.
(16) EMPLOYEE DEFINED CONTRIBUTION PLANS
The Company offers 401(k) savings plans to eligible employees. In the year ended December 31, 2015, the Company did not provide a matching contribution for deferral contributions made by employees and accordingly, did not record expense related to its employee defined contribution plan. However, in June 2016, at the recommendation of the Compensation Committee, the Company’s Board of Directors elected to reinstate a discretionary limited 401(k) match program of up to $2,000 per year ($1,000 per each half-year) per eligible employee, contingent upon the Company’s achievement of certain financial metric targets set by the Compensation Committee. The matching contribution became effective July 1, 2016.
The Company assumed GENBAND's 401(k) savings plan in connection with the Merger.
The Company recorded $1.4 million of expense in the year ended December 31, 2017 and $0.6 million of expense related to its employee defined contribution plans in the year ended December 31, 2016. Effective January 1, 2018, the Company will match 50% of each employee's contributions to the 401(k) program up to 4% of the employee's eligible earnings, for a maximum match of 2% of eligible earnings.
(17) NON-U.S. EMPLOYEE DEFINED BENEFIT PLANS
In connection with the Merger, the Company assumed GENBAND's defined benefit retirement plans that cover some employees at various international locations. The Company has also adopted GENBAND's policy to contribute amounts at least sufficient to satisfy the minimum amount required by applicable law and regulations, or to directly pay benefits where appropriate. Benefits under the defined benefit plans are typically based either on years of service and the employee's compensation (generally during a fixed number of years immediately before retirement) or on annual credits. The range of assumptions that are used for the non-U.S. defined benefit plans reflect the different economic environments within the various countries.
A reconciliation of the changes in the benefit obligations and fair value of the assets of the defined benefit plans for the period from the Merger Date to December 31, 2017, the funded status of the plans and the amounts recognized in the consolidated balance sheet as of December 31, 2017 are as follows (in thousands):
100
Changes in projected benefit obligations: | |||
Projected benefit obligation at Merger Date | $ | 10,515 | |
Service cost | 68 | ||
Interest cost | 25 | ||
Participant contributions | 5 | ||
Benefits paid | (3 | ) | |
Net actuarial loss on obligation | 562 | ||
Currency loss | 312 | ||
Projected benefit obligation at December 31, 2017 | $ | 11,484 | |
Changes in plan assets: | |||
Fair value of plan assets at Merger Date | $ | 3,776 | |
Actual return on plan assets | (8 | ) | |
Employer contributions | 22 | ||
Participant contributions | 5 | ||
Additional charges | (4 | ) | |
Benefits paid | (3 | ) | |
Currency gain | 105 | ||
Fair value of plan assets at December 31, 2017 | $ | 3,893 | |
Funded status at December 31, 2017 | $ | (7,591 | ) |
Amounts recognized in accumulated other comprehensive loss consist of: | |||
Net actuarial loss | $ | 578 | |
Amounts recognized in the consolidated balance sheet consist of: | |||
Accrued compensation and benefits (current pension liability) | $ | (67 | ) |
Other long-term liabilities (non-current pension liability) | (7,524 | ) | |
Net amount recognized | $ | (7,591 | ) |
Plans with underfunded or non-funded accumulated benefit obligations at December 31, 2017 are as follows (in thousands):
Aggregate projected benefit obligation | $ | 11,484 | |
Aggregate accumulated benefit obligation | $ | 7,793 | |
Aggregate fair value of plan assets | $ | 3,893 | |
Net periodic benefit costs for the period from the Merger Date to December 31, 2017 are as follows (in thousands):
Service cost | $ | 68 | |
Interest cost | 25 | ||
Expected return on plan assets | (8 | ) | |
Additional charges | 4 | ||
Net periodic benefit costs | $ | 89 | |
101
The Company made benefit payments of $3,000 for the period from the Merger Date to December 31, 2017. Expected benefit payments for the next ten years are as follows:
Years ending December 31, | |||
2018 | $ | 67 | |
2019 | 68 | ||
2020 | 49 | ||
2021 | 50 | ||
2022 | 50 | ||
2023 to 2027 | 847 | ||
$ | 1,131 | ||
The change in plan assets and benefit obligations recognized in other comprehensive loss before tax for the period from the Merger Date to December 31, 2017 was as follows (in thousands):
Net loss | $ | 578 | |
The Company defers all actuarial gains and losses resulting from variances between actual results and economic estimates or actuarial assumptions. The unrecognized actuarial gains and losses are recorded as unrealized pension actuarial gains (losses) in accumulated other comprehensive loss. These unrecognized gains and losses are amortized as a component of net periodic benefit cost when the net gains and losses exceed 10% of the greater of the market value of plan assets or the projected benefit obligation at the beginning of the year. No amortization of accumulated other comprehensive loss, net, into net periodic benefit cost is expected for the year ended December 31, 2018.
The principal weighted average assumptions used to determine the benefit obligation at December 31, 2017 are as follows:
Discount rate | 1.31 | % |
Rate of compensation increase | 3.38 | % |
The principal weighted average assumptions used to determine net period benefit cost for the period from the Merger Date to December 31, 2017 are as follows:
Discount rate | 1.49 | % |
Expected long-term return on plan assets | 1.23 | % |
Rate of compensation increase | 3.38 | % |
Assumed discount rates are used in the measurement of the projected, accumulated and vested benefit obligations and the service and interest components of net periodic pension cost. Estimated discount rates reflect the rates at which the pension benefits could be effectively settled. The Company determines the discount rates of the plans in the Euro zone using the iBoxx Euro Corporate AA Bond indices with appropriate adjustments for the duration of the plan obligations. In other international locations, the Company determines the discount rates based primarily on local AA to AAA rated Corporate Bond Indices and the Citigroup Pension Discount Curve with the duration appropriate to the duration of the plan obligations.
The plans in the Netherlands and Switzerland are funded through insurance contracts, which provide guaranteed interest credit. The fair value of the contract is derived from the insurance company's assessment of the minimum value of the benefits provided by the insurance contract. The methodology used to value the plan assets assumes that the value of the plan assets equals the guaranteed insured benefits. For consistency, the same discount rate used in the valuation of the benefit obligations is used to place a value on the plan assets. The assets are assumed to grow each year in line with the discount rate, and therefore, the expected return on the assets is set equal to the discount rate. The fair value of the combined plan assets was $3.9 million at December 31, 2017. The Company classifies the fair value of these plan assets as Level 2 in the fair value hierarchy as discussed in Note 5.
102
During the period from the Merger Date to December 31, 2017, employees in the Netherlands and Switzerland made contributions to the respective pension plans aggregating $5,000. Employee contributions to these plans are based on a fixed 5% of the relevant pensionable earnings. The Company funds these plans by contributing at least the minimum amount required by applicable regulations and as recommended by an independent actuary. During the period from October 27, 2017 to December 31, 2017, the Company contributed $22,000 to its pension plans and expects to contribute approximately $0.2 million to its pension plans in 2018.
(18) INCOME TAXES
The components of loss from continuing operations before income taxes consisted of the following (in thousands):
Year ended December 31, | |||||||||||
2017 | 2016 | 2015 | |||||||||
Income (loss) before income taxes: | |||||||||||
United States | $ | (55,932 | ) | $ | (11,973 | ) | $ | (29,595 | ) | ||
Foreign | 2,240 | 557 | (293 | ) | |||||||
$ | (53,692 | ) | $ | (11,416 | ) | $ | (29,888 | ) | |||
The provision (benefit) for income taxes from continuing operations consisted of the following (in thousands):
Year ended December 31, | |||||||||||
2017 | 2016 | 2015 | |||||||||
Provision (benefit) for income taxes: | |||||||||||
Current: | |||||||||||
Federal | $ | (200 | ) | $ | 12 | $ | 60 | ||||
State | 115 | 24 | 150 | ||||||||
Foreign | 1,960 | 1,378 | 982 | ||||||||
Total current | 1,875 | 1,414 | 1,192 | ||||||||
Deferred: | |||||||||||
Federal | 49,570 | (301 | ) | (7,069 | ) | ||||||
State | (4,833 | ) | (1,007 | ) | 4,962 | ||||||
Foreign | (816 | ) | 338 | 155 | |||||||
Change in valuation allowance | (64,236 | ) | 2,072 | 2,767 | |||||||
Total deferred | (20,315 | ) | 1,102 | 815 | |||||||
Total | $ | (18,440 | ) | $ | 2,516 | $ | 2,007 | ||||
103
A reconciliation of the Company's effective tax rate for continuing operations to the statutory federal rate is as follows:
Year ended December 31, | ||||||||
2017 | 2016 | 2015 | ||||||
U.S. statutory income tax rate | (35.0 | )% | (35.0 | )% | (35.0 | )% | ||
State income taxes, net of federal benefit | (1.2 | ) | — | — | ||||
Foreign income taxes | 0.5 | 7.9 | 3.6 | |||||
Foreign tax audit | — | 5.2 | — | |||||
Acquisition costs | 6.0 | — | — | |||||
Foreign deemed dividends | 3.8 | 5.0 | 1.7 | |||||
Stock-based compensation | (26.8 | ) | 38.9 | 14.4 | ||||
Tax credits | 33.3 | (11.6 | ) | (3.3 | ) | |||
Uncertain tax positions | 1.2 | — | — | |||||
NOL and credit limitations | 18.9 | — | — | |||||
Valuation allowance | (29.0 | ) | 1.9 | 24.3 | ||||
Goodwill amortization | 1.7 | 6.7 | 2.2 | |||||
Meals and entertainment | 0.5 | 1.4 | 0.8 | |||||
Tax reform | (8.8 | ) | — | — | ||||
Other, net | 0.6 | 1.6 | (2.0 | ) | ||||
Effective income tax rate | (34.3 | )% | 22.0 | % | 6.7 | % | ||
The following is a summary of the significant components of deferred income tax assets and liabilities (in thousands):
December 31, | |||||||
2017 | 2016 | ||||||
Assets: | |||||||
Net operating loss carryforwards | $ | 58,624 | $ | 77,425 | |||
Research and development tax credits | 24,499 | 24,440 | |||||
Other tax credits | — | 230 | |||||
Intangible assets | — | 9,270 | |||||
Deferred revenue | 5,886 | 3,176 | |||||
Accrued expenses | 10,786 | 6,699 | |||||
Inventory | 5,980 | 5,010 | |||||
Stock-based compensation | 7,452 | 14,295 | |||||
Fixed assets | 727 | 2,879 | |||||
Other temporary differences | 1,556 | 13 | |||||
115,510 | 143,437 | ||||||
Valuation allowance | (89,600 | ) | (141,895 | ) | |||
Total deferred tax assets | 25,910 | 1,542 | |||||
Liabilities: | |||||||
Purchased intangible assets | (17,092 | ) | (3,047 | ) | |||
Unremitted foreign income | (3,171 | ) | — | ||||
Total deferred tax liabilities | (20,263 | ) | (3,047 | ) | |||
Total net deferred tax assets | $ | 5,647 | $ | (1,505 | ) | ||
The deferred tax assets and liabilities based on tax jurisdictions are presented in the Company's consolidated balance sheets as follows: | |||||||
Deferred income taxes - noncurrent assets | $ | 8,434 | $ | 1,542 | |||
Deferred income taxes - noncurrent liabilities | (2,787 | ) | (3,047 | ) | |||
$ | 5,647 | $ | (1,505 | ) | |||
At December 31, 2017, the Company had cumulative federal and state net operating losses ("NOLs") of $221.5 million. The federal NOL carryforwards expire at various dates from 2020 through 2037. The state NOL carryforwards expire at various dates from 2018 through 2037.
104
The Company adopted ASU 2016-09 in 2017, which amended the tax accounting for stock-based compensation. Of the federal NOL at December 31, 2016, $150.8 million was attributable to stock option deductions. As of December 31, 2017, the financial reporting NOL and tax NOL were in alignment. At December 31, 2016, the Company's federal NOL carryforwards for tax return purposes were $14.0 million greater than its recognized federal NOL for financial reporting purposes, primarily due to excess tax benefits (stock-based compensation deductions in excess of financial reporting compensation costs) not recognized for financial statement purposes until realized. Prior to the adoption of ASU 2016-09, the tax benefit of this loss would be recognized for financial statement purposes in the period in which the tax benefit reduces income taxes payable, which will not be recognized until the Company recognizes a reduction in taxes payable from all other NOL carryforwards. In addition, the Company had $0.7 million of deferred taxes as of December 31, 2017 related to stock-based compensation expense recognized for financial reporting purposes that is not deductible for tax purposes until options are exercised or shares vest. The ultimate realization of the benefit related to stock options is directly associated with the price of the Company's common stock. Employees will not exercise the underlying options unless the current market price exceeds the option exercise price.
The Company also has available federal and state research and development credit carryforwards of $24.5 million that expire at various dates from 2018 through 2037.
Under the provisions of the Internal Revenue Code, the net operating losses and tax credit carryforwards are subject to review and possible adjustment by the Internal Revenue Service and state tax authorities. Net operating losses and tax credit carryforwards may become subject to an annual limitation in the event of certain cumulative changes in the ownership of significant shareholders over a three-year period in excess of 50%, as defined under Sections 382 and 383 of the Internal Revenue Code, as well as a similar state provision. The Company incurred a change in ownership as defined in the Internal Revenue Code, and as a result, expects that approximately $31 million of federal and state net operating loss carryforwards and approximately $21 million of research and development tax credits will expire unused. There was no impact to the financial statements due to the Company's full valuation allowance against these assets.
During 2017, the valuation allowance against the deferred tax asset related to net operating losses in Canada was reversed, amounting to a tax benefit approximating $2 million. It had become apparent that the entity had been sufficiently profitable in each of the last three years plus the current year to recognize the deferred tax asset related to the net operating loss carryovers. The valuation allowance was reversed due to the objective verifiable evidence provided by the most recent history of positive income generated by Sonus Canada. The loss carryovers will also be utilized due to the impact of the amalgamation of Sonus Canada into GENBAND Canada. While the Company is recognizing the deferred tax asset related to the net operating losses carried over, it is still carrying a valuation allowance, at 100%, against the SRED credit carryovers associated with the development activity performed in Canada. The newly combined entity has determined that it has excess credit carryover and the objective verifiable evidence is negative in that these credits will likely expire unused.
On December 22, 2017, the U.S. government enacted comprehensive tax legislation commonly referred to as the Tax Cuts and Jobs Act (the "Tax Act"). The Tax Act makes broad and complex changes to the U.S. tax code, including, but not limited to: reducing the U.S. federal corporate tax rate from 35% to 21%; requiring companies to pay a one-time transition tax on certain unrepatriated earnings of foreign subsidiaries; generally eliminating U.S. federal income taxes on dividends from foreign subsidiaries; requiring a current inclusion in U.S. federal taxable income of certain earnings (the Global Intangible Low-taxed Income ("GILTI")) of controlled foreign corporations; eliminating the corporate alternative minimum tax ("AMT") and changing how existing AMT credits can be realized; creating the base erosion anti-abuse tax ("BEAT"); creating a new limitation on deductible interest expense; (8) changing rules related to uses and limitations of net operating loss carryforwards created in tax years beginning after December 31, 2017; providing a tax deduction for foreign derived intangible income ("FDII") ; and changing rules related to deductibility of compensation for certain officers.
The impact of certain effects of the Tax Act has been recognized in the period in which the new legislation was enacted per guidance in Staff Accounting Bulletin 118, which allows for a measurement period to complete the accounting for certain elements of the tax reform. The Company has not yet completed a full evaluation of the impact of the Tax Act on its financial statements; however, it has provided a reasonable estimate for the impact related to remeasured deferred tax assets based on the new federal income tax rate of 21%. The Company has also provided for the provisional impact related to the Tax Act's change to the federal NOL and AMT carryovers. The total estimated impact of $4.8 million is reflected in income from continuing operations, and increased the tax benefit for the year ended December 31, 2017. The Company will continue to make and
105
refine its calculations as additional analysis is completed. The Company cannot predict with certainty how the Tax Act will affect the Company's financial position or results of operations.
The Tax Act reduces the corporate tax rate to 21% effective January 1, 2018. Consequently, the Company has recorded a decrease related to net deferred tax assets of $36.5 million and a decrease to the valuation allowance of $38.4 million, with a corresponding provisional net income tax benefit of $1.9 million for the year ended December 31, 2017.
The Tax Act changed the NOL carryover rules and created a new limitation on their use. NOLs created after December 31, 2017 may be carried forwarded indefinitely but are limited to 80% of taxable income in any year. As a result of this change, the Company believes it is appropriate to offset some of its indefinite-lived deferred tax liabilities against its deferred tax assets, and as a result, recognized a $2.8 million estimated benefit in the year ended December 31, 2017.
The Tax Act eliminated the corporate AMT. As a result, the Tax Act made any AMT credit carryovers refundable to the extent not used against the regular tax liability in the 2018 through 2021 tax years. The Company recognized an estimated benefit of $0.1 million in the year ended December 31, 2017 as a result of this change.
The Deemed Repatriation Transition Tax ("Transition Tax") is a tax on previously untaxed accumulated and current earnings and profits ("E&P") of certain of the Company's foreign subsidiaries. To determine the amount of the Transition Tax, the Company must determine, in addition to other factors, the amount of post-1986 E&P of the relevant subsidiaries, as well as the amount of non-U.S. income taxes paid on such earnings. Due to the net E&P deficit of the Company's foreign subsidiaries, the Company does not believe it will incur the Transition Tax and has not recorded a provision Transition Tax obligation.
With regards to the BEAT, the GILTI, the deduction for FDII and other provisions of the Tax Act, the Company will require additional detailed analysis in order to assess its impact.
During 2017 and 2016, the Company performed an analysis to determine if, based on all available evidence, it considered it more likely than not that some portion or all of the recorded deferred tax assets will not be realized in a future period. As a result of the Company's evaluation, the Company concluded that there was insufficient positive evidence to overcome the more objective negative evidence related to its cumulative losses and other factors. Accordingly, the Company has maintained a valuation allowance against its domestic deferred tax asset amounting to $73.1 million at December 31, 2017 and $141.9 million at December 31, 2016. A similar analysis and conclusion was made with regard to the valuation allowance on the deferred tax assets of the Company's Ireland subsidiary, acquired as part of the acquisition of GENBAND, resulting in a valuation allowance of $6.2 million at December 31, 2017. In analyzing the deferred tax assets related to the Company's Canada subsidiaries, the Company concluded that it was more likely than not that the Canadian federal Scientific Research and Experimental Development ("SRED") credits would not be realized in a future period. This resulted in a valuation allowance of $10.3 million.
A reconciliation of the Company's unrecognized tax benefits is as follows (in thousands):
2017 | 2016 | 2015 | |||||||||
Unrecognized tax benefits at January 1 | $ | 8,969 | $ | 8,888 | $ | 8,875 | |||||
Increases related to current year tax positions | 139 | 36 | 13 | ||||||||
Increases related to prior period tax positions | 430 | 723 | — | ||||||||
Increases related to business acquisitions | 2,012 | — | — | ||||||||
Decreases related to prior period tax positions | (7,022 | ) | (81 | ) | — | ||||||
Settlements | — | (597 | ) | — | |||||||
Unrecognized tax benefits at December 31 | $ | 4,528 | $ | 8,969 | $ | 8,888 | |||||
The Company recorded liabilities for potential penalties and interest of $0.2 million for the year ended December 31, 2017, $0.1 million for the year ended December 31, 2016 and $13,000 for the year ended December 31, 2015. The Company had cumulative deferred tax liabilities recorded related to interest and penalties of $0.6 million for the year ended December 31, 2017, $0.2 million for the year ended December 31, 2016 and $0.2 million for the year ended December 31, 2015. Some of the unrecognized tax benefit items are expected to reverse in 2018 due to statute of limitation lapses.
106
The Company and its subsidiaries file income tax returns in the U.S. federal jurisdiction, as well as various state and foreign jurisdictions. Generally, the tax years 2014 through 2017 remain open to examination by the major taxing jurisdictions to which the Company is subject. The Company's federal NOLs generated prior to 2014 could be adjusted on examination even though the year in which the loss was generated is otherwise closed by the statute of limitations.
As of December 31, 2017, the Company had ongoing income tax audits in certain foreign countries. Management believes that an adequate provision has been recorded for any adjustments that may result from tax examinations.
The 2017 acquisition of GENBAND was accounted for as a non-taxable business combination. GENBAND had previously been treated as a partnership for U.S. tax purposes. Consequently, U.S. federal and state deferred taxes were recorded as part of the business combination based on the differences between the tax basis of the acquired assets and assumed liabilities and their reported amounts for financial reporting purposes. The Company concluded that there was insufficient positive evidence to overcome the more objective negative evidence related to cumulated losses and other factors. The Company recorded a valuation allowance against the acquired deferred tax assets. The Company recorded identifiable intangible assets as part of the purchase accounting for the acquisition. For U.S. tax purposes, the future amortization of these intangibles will be non-deductible, thereby creating income. Since the Company will be filing a consolidated U.S. tax return, the benefit from these identifiable intangible assets will be utilizable. The Company is required to determine its ability to use the tax benefit against the valuation allowance previously established. The Company has determined that it is more likely than not that these benefits will be recognized. As a result, the valuation allowance has been reduced for the assumed net deferred tax liabilities, resulting in an income tax benefit of $16.4 million. This benefit is included as a component of the Company's provision for income taxes for the year ended December 31, 2017.
The 2016 acquisition of Taqua was a taxable purchase of a business under Section 197 of the Internal Revenue Code. The tax amortization related to Taqua goodwill created a deferred tax liability. The 2015 acquisition of the SDN Business was a taxable purchase of a business under Section 197 of the Internal Revenue Code. The tax amortization related to the SDN Business goodwill created a deferred tax liability.
(19) MAJOR CUSTOMERS
The following customers contributed 10% or more of the Company's revenue in at least one of the years ended December 31, 2017, 2016 and 2015:
Year ended December 31, | |||||
2017 | 2016 | 2015 | |||
Verizon Communications Inc. | 17% | * | * | ||
AT&T Inc. | * | 12% | 13% | ||
At December 31, 2017, two customers accounted for 10% or more of the Company's accounts receivable balance, representing approximately 31% in the aggregate of total accounts receivable. At December 31, 2016, no customer accounted for 10% or more of the Company's accounts receivable balance. The Company performs ongoing credit evaluations of its customers and generally does not require collateral on accounts receivable. The Company maintains an allowance for doubtful accounts and such losses have been within management's expectations.
107
(20) GEOGRAPHIC AND SEGMENT INFORMATION
The Company's classification of revenue by geographic area is determined by the location of the Company's customers. The following table summarizes revenue by geographic area as a percentage of total revenue:
Year ended December 31, | ||||||||
2017 | 2016 | 2015 | ||||||
United States | 66 | % | 69 | % | 71 | % | ||
Europe, Middle East and Africa | 14 | 13 | 13 | |||||
Japan | 7 | 10 | 10 | |||||
Other Asia Pacific | 7 | 5 | 4 | |||||
Other | 6 | 3 | 2 | |||||
100 | % | 100 | % | 100 | % | |||
The Company's service revenue is comprised of the following (in thousands):
Year ended December 31, | |||||||||||
2017 | 2016 | 2015 | |||||||||
Maintenance | $ | 114,735 | $ | 86,995 | $ | 89,280 | |||||
Professional services | 34,088 | 19,215 | 17,841 | ||||||||
$ | 148,823 | $ | 106,210 | $ | 107,121 | ||||||
(21) RELATED PARTIES
As a portion of the consideration for the Merger, on October 27, 2017, the Company issued a promissory note for $22.5 million to certain of GENBAND's equity holders who following the Merger, owned greater than five percent of the Company's outstanding shares. As described in Note 12 above, the promissory note does not amortize and the principal thereon is payable in full on the third anniversary of its execution. Interest on the promissory note is payable quarterly in arrears and accrues at a rate of 7.5% per year for the first six months after issuance, and thereafter at a rate of 10% per year. The failure to make any payment under the promissory note when due and, with respect to payment of any interest, the continuation of such failure for a period of thirty days thereafter, constitutes an event of default under the promissory note. If an event of default occurs under the promissory note, the payees may declare the entire balance of the promissory note due and payable (including principal and accrued and unpaid interest) within five business days of the payees' notification to the Company of such acceleration.
H. Brian Thompson, who was an independent member of the Company's Board of Directors until the Company's 2016 Annual Meeting on June 9, 2016, is the Executive Chairman of GTT Communications, Inc., a leading global cloud networking provider to multinational clients ("GTT"). Howard Janzen was an independent member of the Company's Board of Directors through the Merger Date and also served as an independent director of GTT. In October 2015, GTT completed the acquisition of One Source Networks Inc., a provider of global data, Internet, SIP trunking and managed services ("One Source"). One Source is a customer of the Company. The Company had a well-established and ongoing business relationship with One Source prior to its acquisition by GTT. The Company recognized revenue aggregating approximately $23,000 from One Source in the period from January 1, 2016 through June 9, 2016, and approximately $150,000 in the year ended December 31, 2015, pursuant to the terms of a contract between the parties, effective June 28, 2010. The Company believes the terms of this contract are consistent with third-party arrangements that provide similar services.
(22) COMMITMENTS AND CONTINGENCIES
Leases
The Company leases its facilities under operating leases, which expire at various times through 2028. The Company is responsible for certain real estate taxes, utilities and maintenance costs under these leases. The Company's corporate headquarters is located in a leased facility in Westford, Massachusetts, consisting of 97,500 square feet under a lease that
108
expires in August 2028.
Escalation clauses, free rent and other lease concessions are recognized on a straight-line basis over the minimum lease term. Rent expense was $5.9 million for the year ended December 31, 2017, $4.5 million for the year ended December 31, 2016 and $5.2 million for the year ended December 31, 2015.
Future minimum payments under operating lease arrangements as of December 31, 2017 were as follows (in thousands):
Years ending December 31, | |||
2018 | $ | 14,703 | |
2019 | 11,067 | ||
2020 | 6,632 | ||
2021 | 5,612 | ||
2022 | 3,680 | ||
Thereafter | 15,866 | ||
$ | 57,560 | ||
Litigation and Contingencies
The Company is fully cooperating with an SEC inquiry regarding the development and issuance of Sonus’ first quarter 2015 revenue and earnings guidance. Following recent communications with the SEC's Division of Enforcement (the "Staff"), the Company has reached an agreement in principle to resolve this matter. The Company is negotiating the terms of an order with the Staff in which it will neither admit nor deny, and that as part of the settlement the Company will pay a $1.9 million civil penalty and agree not to violate the securities laws in the future. The Company recorded $1.9 million in the year ended December 31, 2017, including $0.3 million in the three months ended December 31, 2017, for potential fines in connection with this investigation.
In addition, through GENBAND, the Company is involved in three ongoing patent infringement lawsuits with Metaswitch Networks Ltd., Metaswitch Networks Corp. and Metaswitch Inc. (collectively, “Metaswitch”). First, on January 21, 2014, GENBAND and the Company’s indirectly-owned subsidiary, GENBAND US LLC, filed a complaint alleging that Metaswitch infringed certain patents owned by GENBAND. Following unsuccessful mediation, a trial took place and on January 15, 2016 the jury awarded approximately $8,168,000 in past royalty damages to GENBAND, which neither GENBAND nor the Company has recorded. On September 29, 2016, the court confirmed the jury verdict following motions from both parties. GENBAND is seeking additional royalty and other damages and has appealed a ruling of the court denying a permanent injunction against continued infringement by Metaswitch. GENBAND appealed the denial of its request for a permanent injunction and presented oral argument on this issue before the U.S. Court of Appeals for the Federal Circuit on June 8, 2017. On July 10, 2017, the U.S. Court of Appeals for the Federal Circuit vacated the lower court’s denial of a permanent injunction and remanded the case for further consideration of GENBAND’s request for a permanent injunction. On December 18, 2017, the lower court held a hearing on all remaining issues regarding the appeal. All briefing for reconsideration has been completed and the court’s decision is pending.
A second lawsuit was filed on July 7, 2014 by Metaswitch against GENBAND in which both parties asserted claims of patent infringement against each other. The trial for the second lawsuit concluded on March 17, 2016 with no damages awarded to either party. The court entered a final judgment on April 14, 2016 awarding GENBAND its costs as the prevailing party. On August 28, 2017, the court denied all parties’ motions for judgment as a matter of law and for a new trial. On October 26, 2017, the court granted GENBAND’s motion for bill of costs and awarded GENBAND approximately $315,000 against Metaswitch, which was subsequently recorded by the Company in early 2018, when received.
On June 2, 2016, the federal district court signed an order lifting a stay and severing and consolidating various non-patent claims and counterclaims that were previously stayed in the first two lawsuits into a third lawsuit. On March 28, 2017, the court dismissed all parties’ claims in this third lawsuit without prejudice, concluding that it lacked subject-matter jurisdiction over GENBAND’s claims, declining to exercise jurisdiction over Metaswitch’s federal Lanham Act counterclaim, and dismissing Metaswitch’s remaining counterclaims concluding that it lacked subject-matter jurisdiction over those claims. Immediately following the dismissal of this federal court action on March 28, 2017, GENBAND filed a petition against Metaswitch in Texas state court asserting the claims that GENBAND had previously asserted in the federal court action. Metaswitch filed its answer
109
on April 21, 2017 and asserted counterclaims against GENBAND. On August 16, 2017, Metaswitch then amended its counterclaims against GENBAND. A hearing on discovery motions was held on January 4, 2018. The Texas state court has issued a scheduling order setting trial for this case in November 2018. At this time, it is not possible to predict the outcome of the litigation, but the Company does not expect the results of these Metaswitch-related matters to have a material adverse effect on its business or consolidated financial statements.
In addition, the Company is often a party to disputes and legal proceedings that it considers routine and incidental to its business. Management does not expect the results of any of these actions to have a material effect on the Company's business or consolidated financial statements.
(23) QUARTERLY RESULTS (UNAUDITED)
The following tables present the Company's quarterly operating results for the years ended December 31, 2017 and 2016. The information for each of these quarters is unaudited and has been prepared on the same basis as the audited consolidated financial statements. In the opinion of management, all necessary adjustments, consisting only of normal recurring adjustments, have been included to present fairly the unaudited consolidated quarterly results when read in conjunction with the Company's audited consolidated financial statements and related notes.
First Quarter | Second Quarter | Third Quarter | Fourth Quarter (1) | ||||||||||||
(In thousands, except per share data) | |||||||||||||||
Fiscal 2017 | |||||||||||||||
Revenue | $ | 53,368 | $ | 55,733 | $ | 74,629 | $ | 146,212 | |||||||
Cost of revenue | 19,620 | 19,331 | 20,082 | 69,413 | |||||||||||
Gross profit | $ | 33,748 | $ | 36,402 | $ | 54,547 | $ | 76,799 | |||||||
Income (loss) from operations | $ | (10,782 | ) | $ | (12,703 | ) | $ | 3,919 | $ | (35,663 | ) | ||||
Net income (loss) | $ | (10,646 | ) | $ | (12,345 | ) | $ | 3,453 | $ | (15,714 | ) | ||||
Earnings (loss) per share (3): | |||||||||||||||
Basic | $ | (0.22 | ) | $ | (0.25 | ) | $ | 0.07 | $ | (0.18 | ) | ||||
Diluted | $ | (0.22 | ) | $ | (0.25 | ) | $ | 0.07 | $ | (0.18 | ) | ||||
Shares used in computing earnings (loss) per share: | |||||||||||||||
Basic | 49,114 | 49,543 | 49,753 | 86,567 | |||||||||||
Diluted | 49,114 | 49,543 | 50,131 | 86,567 | |||||||||||
110
First Quarter | Second Quarter | Third Quarter (2) | Fourth Quarter | ||||||||||||
(In thousands, except per share data) | |||||||||||||||
Fiscal 2016 | |||||||||||||||
Revenue | $ | 59,151 | $ | 60,857 | $ | 65,011 | $ | 67,572 | |||||||
Cost of revenue | 20,748 | 20,629 | 21,425 | 22,178 | |||||||||||
Gross profit | $ | 38,403 | $ | 40,228 | $ | 43,586 | $ | 45,394 | |||||||
Loss from operations | $ | (3,881 | ) | $ | (2,708 | ) | $ | (4,316 | ) | $ | (2,704 | ) | |||
Net loss | $ | (4,654 | ) | $ | (2,916 | ) | $ | (3,731 | ) | $ | (2,631 | ) | |||
Loss per share (3): | |||||||||||||||
Basic | $ | (0.09 | ) | $ | (0.06 | ) | $ | (0.08 | ) | $ | (0.05 | ) | |||
Diluted | $ | (0.09 | ) | $ | (0.06 | ) | $ | (0.08 | ) | $ | (0.05 | ) | |||
Shares used in computing loss per share: | |||||||||||||||
Basic | 49,484 | 49,423 | 49,402 | 49,232 | |||||||||||
Diluted | 49,484 | 49,423 | 49,402 | 49,232 | |||||||||||
__________________________________
(1) | Includes the results of GENBAND for the period subsequent to October 27, 2017. |
(2) | Includes the results of Taqua for the period subsequent to September 26, 2016. |
(3) | Income (loss) per share is calculated independently for each of the quarters presented; accordingly, the sum of the quarterly earnings (loss) per share amounts may not equal the total calculated for the year. |
111
Item 9. Changes in and Disagreements With Accountants on Accounting and Financial Disclosure
None.
Item 9A. Controls and Procedures
Disclosure Controls and Procedures
Our management, with the participation of our principal executive officer and principal financial officer, evaluated the effectiveness of our disclosure controls and procedures (as defined in Rules 13a-15(e) and 15d-15(e) under the Securities Exchange Act of 1934, as amended (the "Exchange Act")), as of the end of the period covered by this Annual Report on Form 10-K. Based on this evaluation, our principal executive officer and principal financial officer concluded that our disclosure controls and procedures were effective as of December 31, 2017.
Management's Annual Report on Internal Control over Financial Reporting
Our management, with the participation of our principal executive officer and principal financial officer, is responsible for establishing and maintaining adequate internal control over financial reporting as defined in Rules 13a-15(f) and 15d-15(f) under the Exchange Act. Our internal control system is designed to provide reasonable assurance to our management and Board of Directors regarding the preparation and fair presentation of published financial statements.
Our management assessed the effectiveness of our internal control over financial reporting as of December 31, 2017. In making its assessment of internal control over financial reporting, our management used the criteria set forth by the Committee of Sponsoring Organizations of the Treadway Commission in Internal Control—Integrated Framework (2013). Based on this assessment, management concluded that, as of December 31, 2017, our internal control over financial reporting was effective.
Our evaluation excluded GENBAND, which was acquired on October 27, 2017. Our consolidated statement of operations for the year ended December 31, 2017 included gross revenue of $69.1 million and $12.5 million of net loss. Our balance sheet as of December 31, 2017 included total assets of $617.5 million and net assets of $398.9 million attributable to GENBAND. In accordance with guidance issued by the Securities and Exchange Commission, companies are allowed to exclude acquisitions from their assessment of internal control over financial reporting during the first year subsequent to the acquisition while integrating the acquired operations.
Deloitte & Touche LLP, an independent registered public accounting firm that audited our financial statements included in this Annual Report on Form 10-K, has issued an attestation report on management's internal control over financial reporting, which is included in this Item 9A under the caption "Report of Independent Registered Public Accounting Firm."
Changes in Internal Control over Financial Reporting
There have been no changes in our internal control over financial reporting during the fiscal quarter ended December 31, 2017 that have materially affected, or are reasonably likely to materially affect, our internal control over financial reporting.
112
REPORT OF INDEPENDENT REGISTERED PUBLIC ACCOUNTING FIRM
To the Board of Directors and Stockholders of Ribbon Communications Inc.
Opinion on Internal Control over Financial Reporting
We have audited the internal control over financial reporting of Ribbon Communications Inc. and subsidiaries (the "Company") as of December 31, 2017, based on criteria established in Internal Control - Integrated Framework (2013) issued by the Committee of Sponsoring Organizations of the Treadway Commission (COSO). In our opinion, the Company maintained, in all material respects, effective internal control over financial reporting as of December 31, 2017, based on criteria established in Internal Control - Integrated Framework (2013) issued by COSO.
We have also audited, in accordance with the standards of the Public Company Accounting Oversight Board (United States) (PCAOB), the consolidated financial statements as of and for the year ended December 31, 2017, of the Company and our report dated March 8, 2018, expressed an unqualified opinion on those financial statements.
As described in Management's Annual Report on Internal Control over Financial Reporting, management excluded from its assessment the internal control over financial reporting at GENBAND, which was acquired on October 27, 2017 and whose financial statements constitute $617.5 million and $398.9 million of total and net assets, respectively, $69.1 million of revenues and $12.5 million of net loss of the consolidated financial statement amounts as of and for the year ended December 31, 2017. Accordingly, our audit did not include the internal control over financial reporting at GENBAND.
Basis for Opinion
The Company's management is responsible for maintaining effective internal control over financial reporting and for its assessment of the effectiveness of internal control over financial reporting, included in the accompanying Management's Report on Internal Control over Financial Reporting. Our responsibility is to express an opinion on the Company's internal control over financial reporting based on our audit. We are a public accounting firm registered with the PCAOB and are required to be independent with respect to the Company in accordance with the U.S. federal securities laws and the applicable rules and regulations of the Securities and Exchange Commission and the PCAOB.
We conducted our audit in accordance with the standards of the PCAOB. Those standards require that we plan and perform the audit to obtain reasonable assurance about whether effective internal control over financial reporting was maintained in all material respects. Our audit included obtaining an understanding of internal control over financial reporting, assessing the risk that a material weakness exists, testing and evaluating the design and operating effectiveness of internal control based on the assessed risk, and performing such other procedures as we considered necessary in the circumstances. We believe that our audit provides a reasonable basis for our opinion.
Definition and Limitations of Internal Control over Financial Reporting
A company's internal control over financial reporting is a process designed to provide reasonable assurance regarding the reliability of financial reporting and the preparation of financial statements for external purposes in accordance with generally accepted accounting principles. A company's internal control over financial reporting includes those policies and procedures that (1) pertain to the maintenance of records that, in reasonable detail, accurately and fairly reflect the transactions and dispositions of the assets of the company; (2) provide reasonable assurance that transactions are recorded as necessary to permit preparation of financial statements in accordance with generally accepted accounting principles, and that receipts and expenditures of the company are being made only in accordance with authorizations of management and directors of the company; and (3) provide reasonable assurance regarding prevention or timely detection of unauthorized acquisition, use, or disposition of the company's assets that could have a material effect on the financial statements.
Because of its inherent limitations, internal control over financial reporting may not prevent or detect misstatements. Also, projections of any evaluation of effectiveness to future periods are subject to the risk that controls may become inadequate because of changes in conditions, or that the degree of compliance with the policies or procedures may deteriorate.
/s/ Deloitte & Touche LLP
Boston, Massachusetts
March 8, 2018
113
Item 9B. Other Information
None.
PART III
Item 10. Directors, Executive Officers and Corporate Governance
The information required by this Item 10 is included in our definitive Proxy Statement with respect to our 2018 Annual Meeting of Stockholders to be filed with the SEC not later than 120 days after the end of the fiscal year ended December 31, 2017 and is incorporated herein by reference.
Item 11. Executive Compensation
The information required by this Item 11 is included in our definitive Proxy Statement with respect to our 2018 Annual Meeting of Stockholders to be filed with the SEC not later than 120 days after the end of the fiscal year ended December 31, 2017 and is incorporated herein by reference.
Item 12. Security Ownership of Certain Beneficial Owners and Management and Related Stockholder Matters
The information required by this Item 12 is included in our definitive Proxy Statement with respect to our 2018 Annual Meeting of Stockholders to be filed with the SEC not later than 120 days after the end of the fiscal year ended December 31, 2017 and is incorporated herein by reference.
Item 13. Certain Relationships and Related Transactions, and Director Independence
The information required by this Item 13 is included in our definitive Proxy Statement with respect to our 2018 Annual Meeting of Stockholders to be filed with the SEC not later than 120 days after the end of the fiscal year ended December 31, 2017 and is incorporated herein by reference.
Item 14. Principal Accounting Fees and Services
The information required by this Item 14 will be included in our definitive Proxy Statement with respect to our 2018 Annual Meeting of Stockholders to be filed with the SEC and is incorporated herein by reference.
114
PART IV
Item 15. Exhibits, Financial Statement Schedules
1) Financial Statements
The consolidated financial statements of the Company are listed in the index under Part II, Item 8, of this Annual Report on Form 10-K.
2) Financial Statement Schedules
None. All schedules are omitted because they are not applicable, not required under the instructions or the information is contained in the consolidated financial statements, or notes thereto, included herein.
3) List of Exhibits
The Exhibits filed as part of this Annual Report on Form 10-K are listed in the Exhibit Index immediately preceding the signature page of this Annual Report, which Exhibit Index is incorporated herein by reference.
Item 16. Form 10-K Summary
None.
115
EXHIBIT INDEX
Exhibit No. | Description | |||
2.1 | ** | |||
3.1 | ||||
3.2 | ||||
3.3 | * | |||
10.1 | ||||
10.2 | ||||
10.3 | ||||
10.4 | ||||
10.5 | +* | |||
10.6 | + | |||
10.7 | +* | |||
10.8 | + | |||
10.9 | + | |||
10.10 | ||||
10.11 | ||||
10.12 | ||||
10.13 | + | |||
10.14 | + | |||
10.15 | + | |||
116
10.16 | + | |||
10.17 | + | |||
10.18 | + | |||
10.19 | ||||
10.20 | + | |||
10.21 | + | |||
10.22 | + | |||
10.23 | + | |||
10.24 | + | |||
10.25 | + | |||
10.26 | + | |||
10.27 | + | |||
10.28 | +* | |||
10.29 | +* | |||
10.30 | +* | |||
10.31 | +* | |||
21.1 | * | |||
23.1 | * | |||
31.1 | * | |||
31.2 | * | |||
32.1 | # | |||
32.2 | # | |||
101.INS | XBRL Instance Document | |||
101.SCH | XBRL Taxonomy Extension Schema | |||
101.CAL | XBRL Taxonomy Extension Calculation Linkbase | |||
101.DEF | XBRL Taxonomy Extension Definition Linkbase | |||
117
101.LAB | XBRL Taxonomy Extension Label Linkbase | |||
101.PRE | XBRL Taxonomy Extension Presentation Linkbase | |||
_______________________________________
* | Filed herewith. |
# | Furnished herewith. |
+ | Management contract or compensatory plan or arrangement filed in response to Item 15(a)(3) of the Instructions to the Annual Report on Form 10-K. |
** | Certain schedules and exhibits have been omitted pursuant to Item 601(b)(2) of Regulation S-K. The Registrant hereby undertakes to furnish copies of any of the omitted schedules and exhibits upon request by the U.S. Securities and Exchange Commission. |
118
SIGNATURES
Pursuant to the requirements of Section 13 or 15(d) of the Securities Exchange Act of 1934, the registrant has duly caused this report to be signed on its behalf by the undersigned, thereunto duly authorized.
RIBBON COMMUNICATIONS INC. | |||
By: | /s/ Franklin W. Hobbs | ||
March 8, 2018 | Franklin W. Hobbs President and Chief Executive Officer | ||
Pursuant to the requirements of the Securities Exchange Act of 1934, this report has been signed below by the following persons on behalf of the registrant and in the capacities and on the dates indicated:
Signature | Title | Date | |
/s/ Franklin W. Hobbs | President, Chief Executive Officer and Director (Principal Executive Officer) | March 8, 2018 | |
Franklin W. Hobbs | |||
/s/ Daryl E. Raiford | Executive Vice President and Chief Financial Officer (Principal Financial Officer) | March 8, 2018 | |
Daryl E. Raiford | |||
/s/ Eric Marmurek | Senior Vice President, Finance (Principal Accounting Officer) | March 8, 2018 | |
Eric Marmurek | |||
/s/ Richard J. Lynch | Chairman | March 8, 2018 | |
Richard J. Lynch | |||
/s/ Kim S. Fennebresque | Director | March 8, 2018 | |
Kim S. Fennebresque | |||
/s/ Bruns H. Grayson | Director | March 8, 2018 | |
Bruns H. Grayson | |||
/s/ Beatriz V. Infante | Director | March 8, 2018 | |
Breatriz V. Infante | |||
/s/ Kent J. Mathy | Director | March 8, 2018 | |
Kent J. Mathy | |||
/s/ Scott E. Schubert | Director | March 8, 2018 | |
Scott E. Schubert | |||
/s/ Rick W. Smith | Director | March 8, 2018 | |
Rick W. Smith | |||
119