Attached files
| file | filename |
|---|---|
| 8-K - 8-K - Hilton Grand Vacations Inc. | d500337d8k.htm |
Exhibit 99.1
HILTON GRAND VACATIONS Investor Presentation Q4 2017 © 2018 Hilton Grand Vacations Inc. Proprietary
D I S C L A I M E R This presentation contains forward-looking statements within the meaning of the Private Securities Litigation Reform Act of 1995. These forward-looking statements are based on management’s beliefs, expectations and assumptions and information currently available to management, and are subject to risks and uncertainties. Actual results could differ materially because of factors such as: inherent business, financial and operating risks of the timeshare industry; adverse economic or market conditions that may affect the purchasing and vacationing decisions of consumers or otherwise harm our business; intense competition in the timeshare industry, which could lead to lower revenue or operating margins; the termination of material fee-for-service agreements with third parties; the ability of the Company to manage risks associated with our international activities, including complying with laws and regulations affecting our international operations; exposure to increased economic and operational uncertainties from expanding global operations, including the effects of foreign currency exchange; potential liability under anti-corruption and other laws resulting from our global operations; changes in tax rates and exposure to additional tax liabilities; the impact of future changes in legislation, regulations or accounting pronouncements; acquisitions, joint ventures, and strategic alliances that that may not result in expected benefits and that may have an adverse effect on our business; our dependence on development activities to secure inventory; cyber-attacks and security vulnerabilities that could lead to reduced revenue, increased costs, liability claims, or harm to our reputation or competitive position; disclosure of personal data that could cause liability and harm to our reputation; abuse of our advertising or social platforms that may harm our reputation or user engagement; outages, data losses, and disruptions of our online services; claims against us that may result in adverse outcomes in legal disputes; risks associated with our debt agreements and instruments, including variable interest rates, operating and financial restrictions, and our ability to service our indebtedness; the continued service and availability of key executives and employees; and catastrophic events or geo-political conditions that may disrupt our business. For more information about these risks and uncertainties as well as other potential factors that could affect our financial results, please refer to the “Risk Factors” and “Management’s Discussion and Analysis of Financial Condition and Results of Operations” sections of our SEC filings, including, but not limited to our most recent annual report on Form 10-K and quarterly reports on Form 10-Q. All information in this presentation is as of March 1, 2018. We assume no obligation to update any forward-looking statements or information to conform to actual results or changes in the Company’s expectations. This presentation is not an offer to sell or the solicitation of an offer to buy any securities of the company, nor will there be any sales of securities of the company in any jurisdiction in which the offer, solicitation or sale would be unlawful prior to registration or qualification under the securities laws of any such jurisdiction. This presentation includes certain terms that are not recognized terms under U.S. Generally Accepted Accounting Principles (“GAAP”), and certain financial measures that are not calculated in accordance with U.S. GAAP, including earnings before interest expense (excluding interest expense relating to our non-recourse debt), income tax expense, depreciation and amortization (“EBITDA”), Adj. EBITDA, Adj. EBITDA Margin, Net Debt and Net Debt / Adj. EBITDA, Contract Sales, Free Cash Flow and Return on Invested Capital (“ROIC”). Non-GAAP financial measures Adj. EBITDA, Adj. EBITDA Margin, Net Debt and Net Debt / Adj. EBITDA should be considered only as supplemental to, and not as superior to, financial measures prepared in accordance with U.S. GAAP. Please refer to the footnotes of this presentation for a reconciliation of the historical and forward-looking non-GAAP financial measures included in this presentation to the most directly comparable financial measures prepared in accordance with U.S. GAAP. 2 © 2018 Hilton Grand Vacations Inc. Proprietary
COMPANY OVERVIEW © 2018 Hilton Grand Vacations Inc. Proprietary
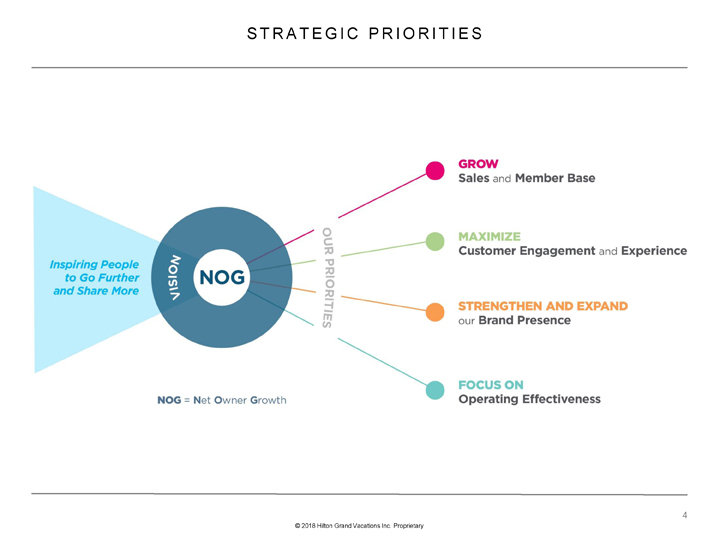
S T R A T E G I C P R I O R I T I E S Inspiring People to Go Further and Share More VISION NOG OUR PRIORITIES GROW Sales and Member Base MAXIMIZE Customer Engagement and Experience STRENGTHEN AND EXPAND FOCUS ON Operating Effectiveness NOG = Net Owner Growth © 2018 Hilton Grand Vacations Inc. Proprietary
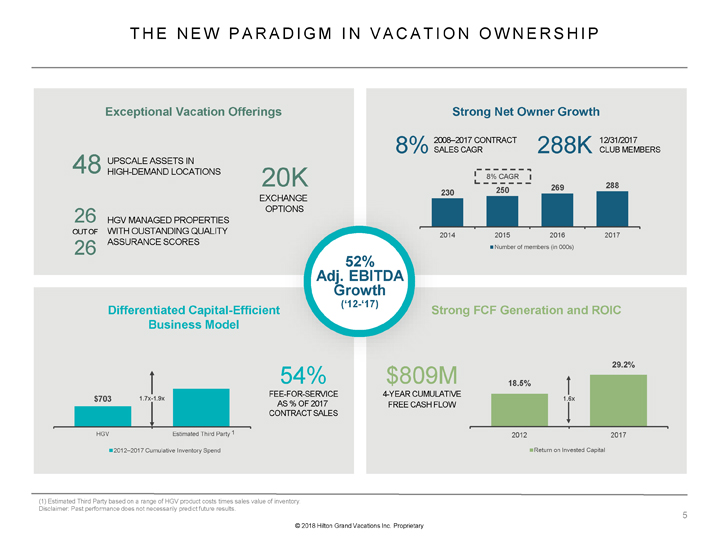
T H E N E W P A R A D I G M I N V A C A T I O N O W N E R S H I P Exceptional Vacation Offerings 48 UPSCALE ASSETS IN HIGH-DEMAND LOCATIONS 20K EXCHANGE 26 OPTIONS HGV MANAGED PROPERTIES OUT OF WITH OUSTANDING QUALITY 26 ASSURANCE SCORES Strong Net Owner Growth 2008–2017 CONTRACT 12/31/2017 8% SALES CAGR 288K CLUB MEMBERS 8% CAGR 269 288 230 250 2014 2015 2016 2017 Number of members (in 000s) 52% Adj. EBITDA v Growth (‘12-‘17) Differentiated Capital-Efficient Business Model 54% FEE-FOR-SERVICE $703 1.7x-1.9x AS % OF 2017 CONTRACT SALES HGV Estimated Third Party 1 2012–2017 Cumulative Inventory Spend Strong FCF Generation and ROIC $809M 29.2% 18.5% 4-YEAR CUMULATIVE FREE CASH FLOW 1.6x 2012 2017 Return on Invested Capital (1) Estimated Third Party based on a range of HGV product costs times sales value of inventory. Disclaimer: Past performance does not necessarily predict future results. © 2018 Hilton Grand Vacations Inc. Proprietary
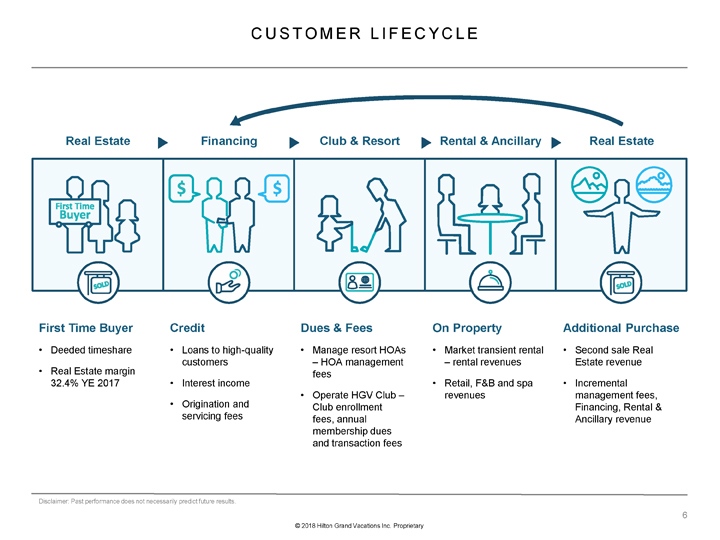
C U S T O M E R L I F E C Y C L E Real Estate Financing Club & Resort Rental & Ancillary Real Estate First Time Buyer • Deeded timeshare • Real Estate margin 32.4% YE 2017 Credit • Loans to high-quality customers • Interest income • Origination and servicing fees Dues & Fees • Manage resort HOAs – HOA management fees • Operate HGV Club –Club enrollment fees, annual membership dues and transaction fees On Property • Market transient rental – rental revenues • Retail, F&B and spa revenues Additional Purchase • Second sale Real Estate revenue • Incremental management fees, Financing, Rental & Ancillary revenue Disclaimer: Past performance does not necessarily predict future results. © 2018 Hilton Grand Vacations Inc. Proprietary
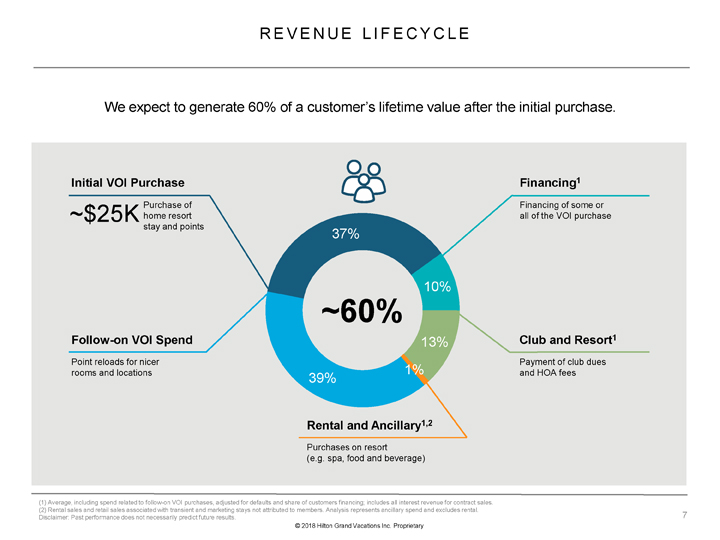
R E V E N U E L I F E C Y C L E We expect to generate 60% of a customer’s lifetime value after the initial purchase. Initial VOI Purchase Purchase of ~$25K home resort stay and points Financing1 Financing of some or all of the VOI purchase Follow-on VOI Spend Point reloads for nicer rooms and locations 37% 10% ~60% 13% 1% 39% Club and Resort1 Payment of club dues and HOA fees Rental and Ancillary1,2 Purchases on resort (e.g. spa, food and beverage) (1) Average, including spend related to follow-on VOI purchases, adjusted for defaults and share of customers financing; includes all interest revenue for contract sales. (2) Rental sales and retail sales associated with transient and marketing stays not attributed to members. Analysis represents ancillary spend and excludes rental. Disclaimer: Past performance does not necessarily predict future results. © 2018 Hilton Grand Vacations Inc. Proprietary
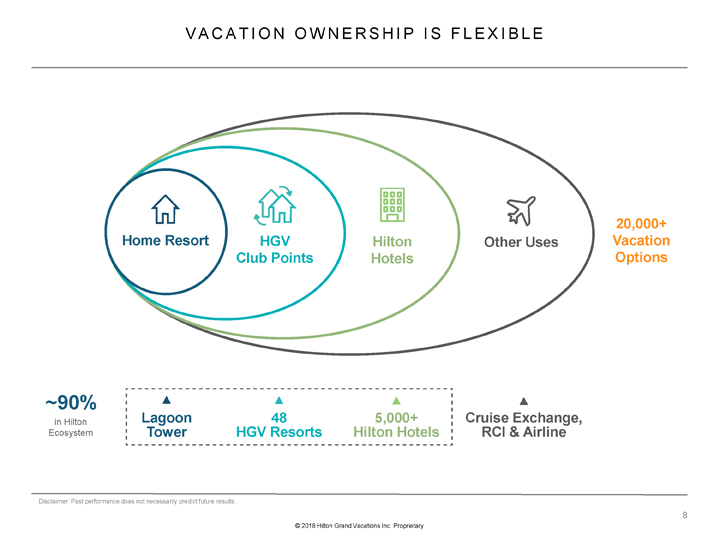
V A C A T I O N O W N E R S H I P I S F L E X I B L E 20,000+ Home Resort HGV Hilton Other Uses Vacation Club Points Hotels Options ~90% in Hilton Lagoon 48 5,000+ Cruise Exchange, Ecosystem Tower HGV Resorts Hilton Hotels RCI & Airline Disclaimer: Past performance does not necessarily predict future results. © 2018 Hilton Grand Vacations Inc. Proprietary
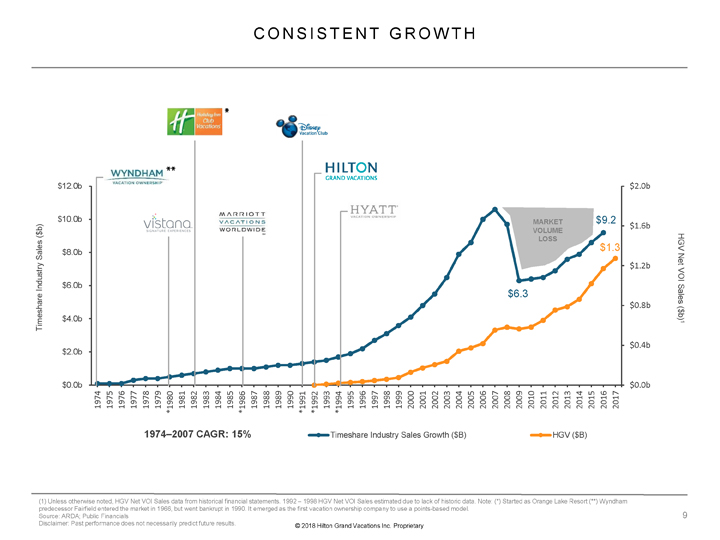
C O N S I S T E N T G R O W T H $12.0b $2.0b $10.0b MARKET $9.2 $1.6b $ b) VOLUME ( LOSS HGV $1.3 Sales $8.0b y Net $1.2b VOI Industr $6.0b $6.3 Sales $0.8b ( b) $ $4.0b Timeshare 1 $2.0b $0.4b $0.0b $0.0b 1974 1975 1976 1977 1978 1979 *1980 1981 1982 1983 1984 1985 *1986 1987 1988 1989 1990 *1991 *1992 1993 *1994 1995 1996 1997 1998 1999 2000 2001 2002 2003 2004 2005 2006 2007 2008 2009 2010 2011 2012 2013 2014 2015 2016 2017 1974–2007 CAGR: 15% Timeshare Industry Sales Growth ($B) HGV ($B) (1) Unless otherwise noted, HGV Net VOI Sales data from historical financial statements. 1992 – 1998 HGV Net VOI Sales estimated due to lack of historic data. Note: (*) Started as Orange Lake Resort (**) Wyndham predecessor Fairfield entered the market in 1966, but went bankrupt in 1990. It emerged as the first vacation ownership company to use a points-based model. Source: ARDA; Public Financials Disclaimer: Past performance does not necessarily predict future results. © 2018 Hilton Grand Vacations Inc. Proprietary
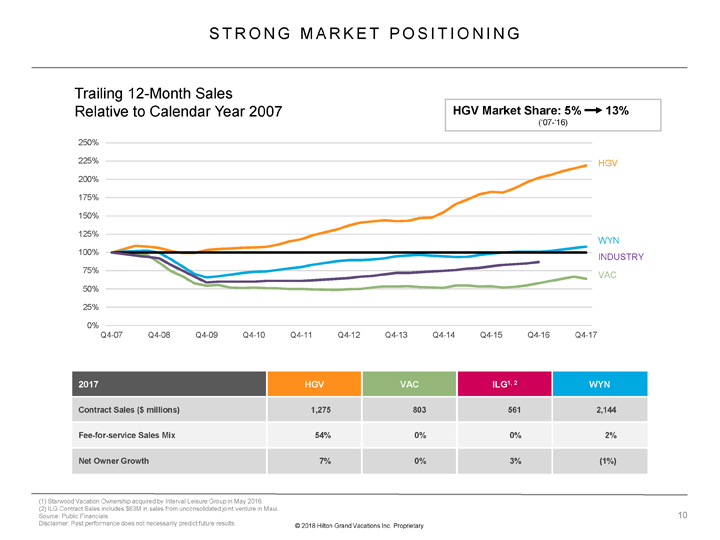
S T R O N G M A R K E T P O S I T I O N I N G Trailing 12-Month Sales Relative to Calendar Year 2007 HGV Market Share: 5% 13% (‘07-‘16) 250% 225% HGV 200% 175% 150% 125% WYN 100% INDUSTRY 75% VAC 50% 25% 0% Q4-07 Q4-08 Q4-09 Q4-10 Q4-11 Q4-12 Q4-13 Q4-14 Q4-15 Q4-16 Q4-17 2017 HGV VAC ILG1, 2 WYN Contract Sales ($ millions) 1,275 803 561 2,144 Fee-for-service Sales Mix 54% 0% 0% 2% Net Owner Growth 7% 0% 3% (1%) (1) Starwood Vacation Ownership acquired by Interval Leisure Group in May 2016. (2) ILG Contract Sales includes $63M in sales from unconsolidated joint venture in Maui. Source: Public Financials Disclaimer: Past performance does not necessarily predict future results. © 2018 Hilton Grand Vacations Inc. Proprietary
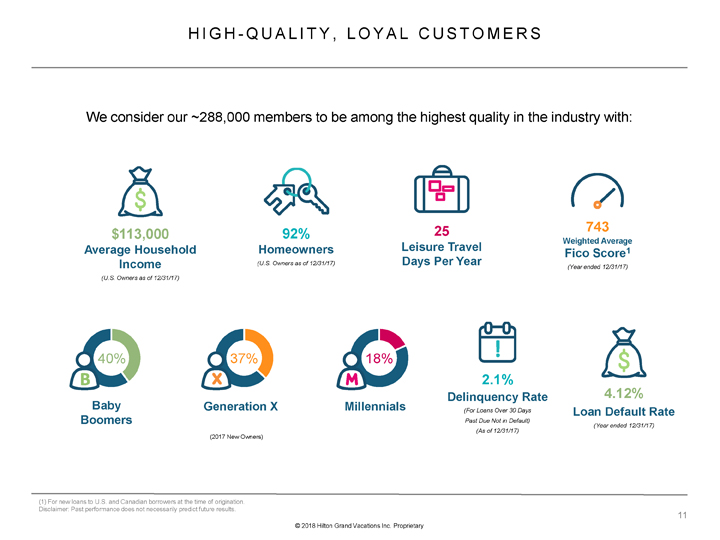
H I G H—Q U A L I T Y , L O Y A L C U S T O M E R S We consider our ~288,000 members to be among the highest quality in the industry with: 25 743 $113,000 92% Weighted Average Average Household Homeowners Leisure Travel 1 Fico Score Income (U.S. Owners as of 12/31/17) Days Per Year (Year ended 12/31/17) (U.S. Owners as of 12/31/17) 40% 37% 18% 2.1% Delinquency Rate 4.12% Baby Generation X Millennials (For Loans Over 30 Days Loan Default Rate Boomers Past Due Not in Default) (Year ended 12/31/17) (As of 12/31/17) (2017 New Owners) (1) For new loans to U.S. and Canadian borrowers at the time of origination. Disclaimer: Past performance does not necessarily predict future results. © 2018 Hilton Grand Vacations Inc. Proprietary
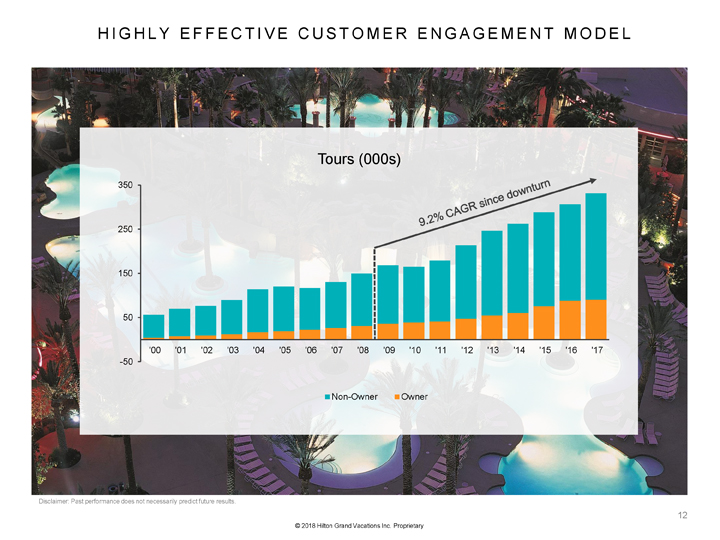
H I G H L Y E F F E C T I V E C U S T O M E R E N G A G E M E N T M O D E L Tours (000s) 350 250 150 50 ‘00 ‘01 ‘02 ‘03 ‘04 ‘05 ‘06 ‘07 ‘08 ‘09 ‘10 ‘11 ‘12 ‘13 ‘14 ‘15 ‘16 ‘17 -50 Non-Owner Owner Disclaimer: Past performance does not necessarily predict future results. © 2018 Hilton Grand Vacations Inc. Proprietary
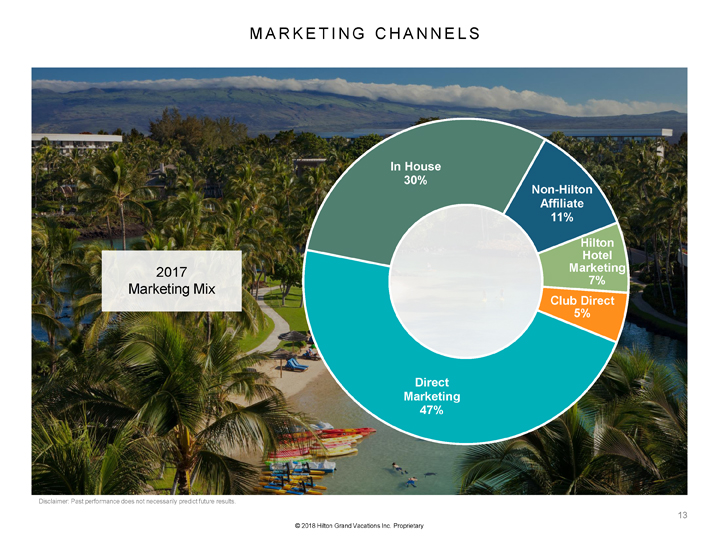
M A R K E T I N G C H A N N E L S 2017 Marketing Mix In House 30% Non-Hilton Affiliate 11% Hilton Hotel Marketing 7% Club Direct 5% Direct Marketing 47% Disclaimer: Past performance does not necessarily predict future results. © 2018 Hilton Grand Vacations Inc. Proprietary
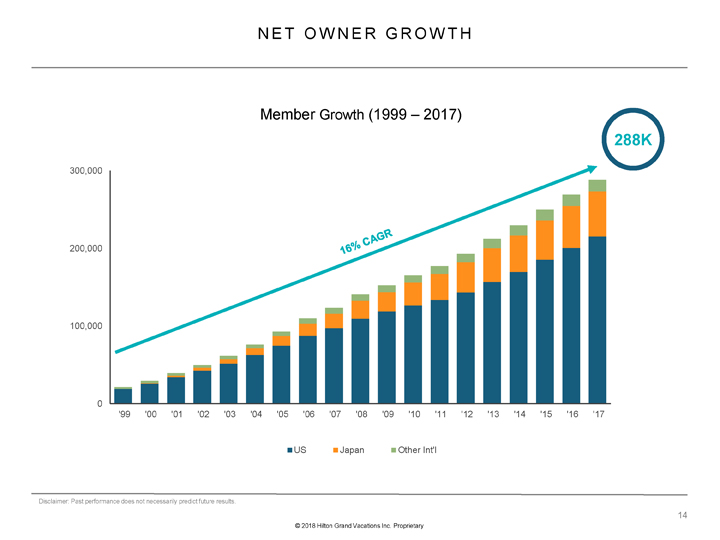
N E T O W N E R G R O W T H Member Growth (1999 – 2017) 288K 300,000 200,000 100,000 0 ‘99 ‘00 ‘01 ‘02 ‘03 ‘04 ‘05 ‘06 ‘07 ‘08 ‘09 ‘10 ‘11 ‘12 ‘13 ‘14 ‘15 ‘16 ‘17 US Japan Other Int’l Disclaimer: Past performance does not necessarily predict future results. © 2018 Hilton Grand Vacations Inc. Proprietary
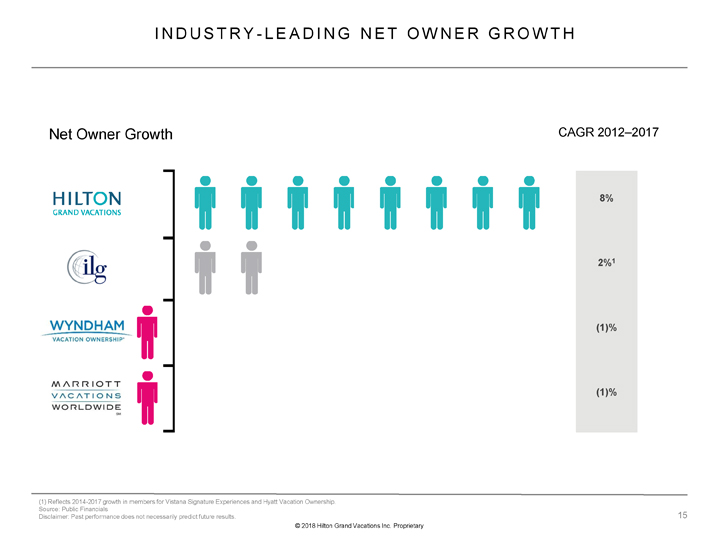
I N D U S T R Y—L E A D I N G N E T O W N E R G R O W T H Net Owner Growth CAGR 2012–2017 8% 2%1 (1)% (1)% (1) Reflects 2014-2017 growth in members for Vistana Signature Experiences and Hyatt Vacation Ownership. Source: Public Financials Disclaimer: Past performance does not necessarily predict future results. © 2018 Hilton Grand Vacations Inc. Proprietary
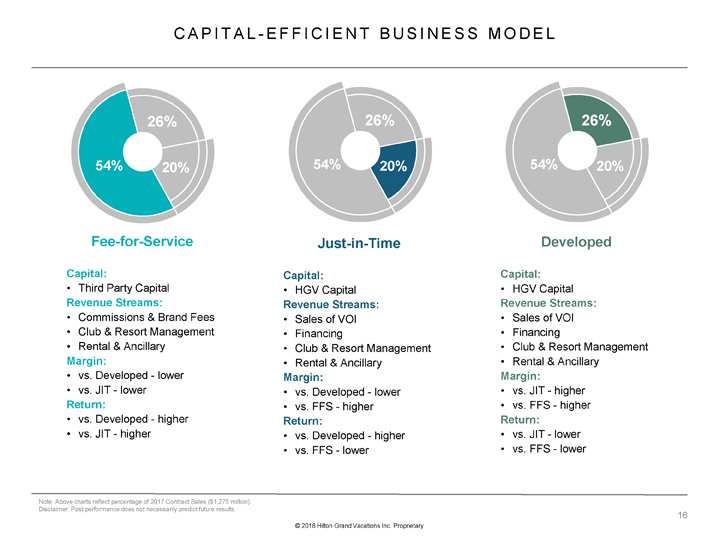
C A P I T A L—E F F I C I E N T B U S I N E S S M O D E L 26% 54% 20% 26% 54% 20% 26% 54% 20% Fee-for-Service Capital: • Third Party Capital Revenue Streams: • Commissions & Brand Fees • Club & Resort Management • Rental & Ancillary Margin: • vs. Developed—lower • vs. JIT—lower Return: • vs. Developed—higher • vs. JIT—higher Just-in-Time Capital: • HGV Capital Revenue Streams: • Sales of VOI • Financing • Club & Resort Management • Rental & Ancillary Margin: • vs. Developed—lower • vs. FFS—higher Return: • vs. Developed—higher • vs. FFS—lower Developed Capital: • HGV Capital Revenue Streams: • Sales of VOI • Financing • Club & Resort Management • Rental & Ancillary Margin: • vs. JIT—higher • vs. FFS—higher Return: • vs. JIT—lower • vs. FFS—lower Note: Above charts reflect percentage of 2017 Contract Sales ($1,275 million). Disclaimer: Past performance does not necessarily predict future results. © 2018 Hilton Grand Vacations Inc. Proprietary
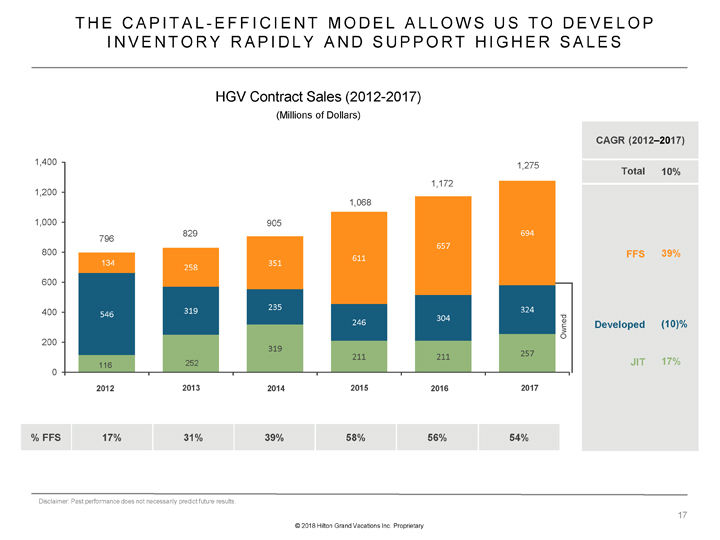
T H E C A P I T A L—E F F I C I E N T M O D E L A L L O W S U S T O D E V E L O P I N V E N T O R Y R A P I D L Y A N D S U P P O R T H I G H E R S A L E S HGV Contract Sales (2012-2017) (Millions of Dollars) 1,400 1,275 1,172 1,200 1,068 1,000 905 829 694 796 657 52 800 611 134 351 258 600 235 324 400 319 546 304 246 Owned 200 319 257 211 211 116 252 0 2012 2013 2014 2015 2016 2017 CAGR (2012–2017) Total 10% FFS 39% Developed (10)% JIT 17% % FFS 17% 31% 39% 58% 56% 54% Disclaimer: Past performance does not necessarily predict future results. © 2018 Hilton Grand Vacations Inc. Proprietary
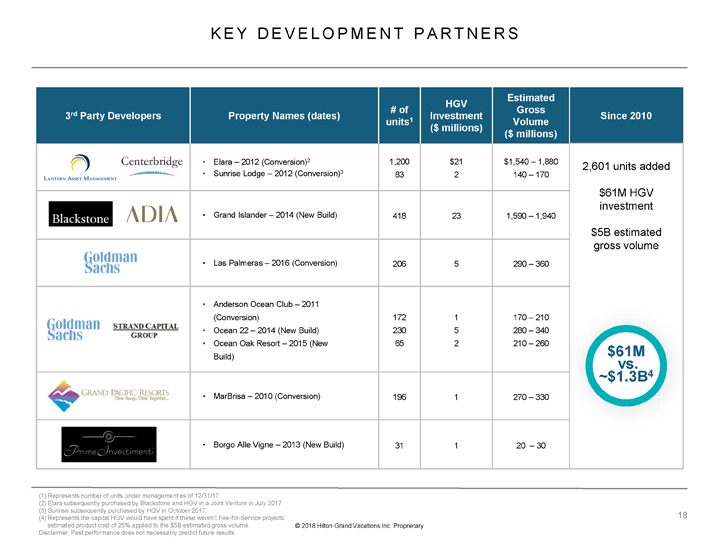
K E Y D E V E L O P M E N T P A R T N E R S Estimated HGV # of Gross 3rd Party Developers Property Names (dates) units1 Investment Volume Since 2010 ($ millions) ($ millions) • Elara – 2012 (Conversion)2 1,200 $21 $1,540 – 1,880 2,601 units added • Sunrise Lodge – 2012 (Conversion)3 83 2 140 – 170 $61M HGV investment • Grand Islander – 2014 (New Build) 418 23 1,590 – 1,940 $5B estimated gross volume • Las Palmeras – 2016 (Conversion) 206 5 290 – 360 • Anderson Ocean Club – 2011 (Conversion) 172 1 170 – 210 • Ocean 22 – 2014 (New Build) 230 5 280 – 340 • Ocean Oak Resort – 2015 (New 65 2 210 – 260 Build) $61M vs. v ~$1.3B4 • MarBrisa – 2010 (Conversion) 196 1 270 – 330 • Borgo Alle Vigne – 2013 (New Build) 31 1 20 – 30 (1) Represents number of units under management as of 12/31/17. (2) Elara subsequently purchased by Blackstone and HGV in a Joint Venture in July 2017. (3) Sunrise subsequently purchased by HGV in October 2017. (4) Represents the capital HGV would have spent if these weren’t Fee-for-Service projects: estimated product cost of 25% applied to the $5B estimated gross volume. Disclaimer: Past performance does not necessarily predict future results. © 2018 Hilton Grand Vacations Inc. Proprietary
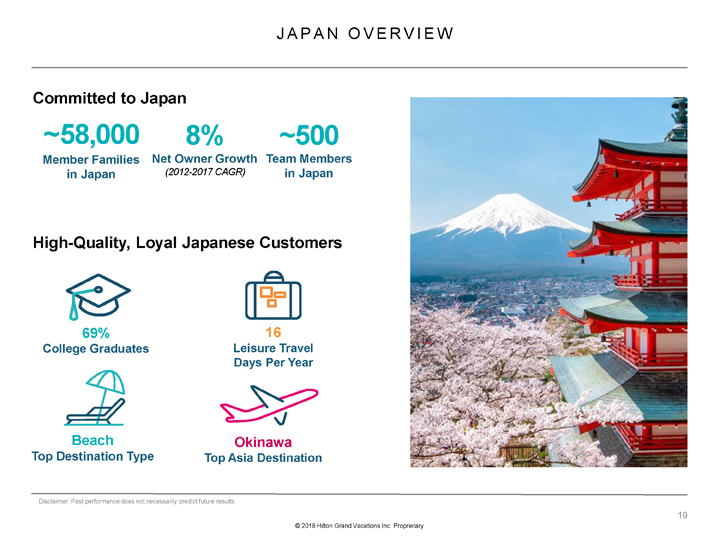
J A P A N O V E R V I E W Committed to Japan ~58,000 8% ~500 Member Families Net Owner Growth Team Members in Japan (2012-2017 CAGR) in Japan High-Quality, Loyal Japanese Customers 69% 16 College Graduates Leisure Travel Days Per Year Beach Okinawa Top Destination Type Top Asia Destination Disclaimer: Past performance does not necessarily predict future results. © 2018 Hilton Grand Vacations Inc. Proprietary
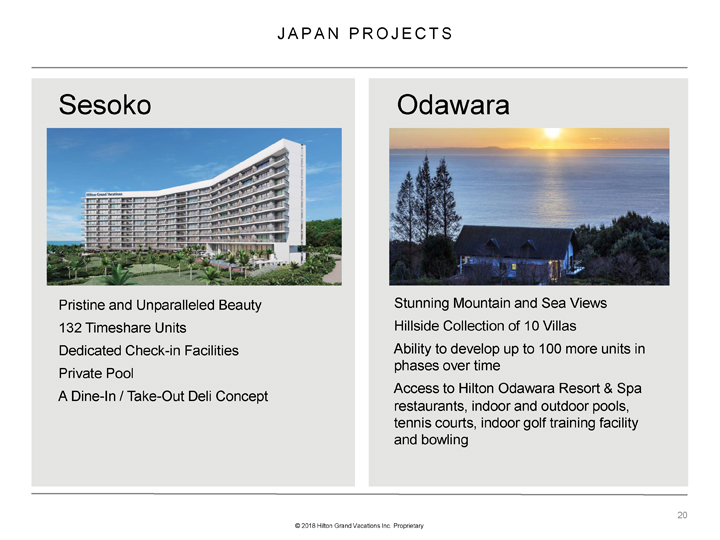
J A P A N P R O J E C T S Sesoko Pristine and Unparalleled Beauty 132 Timeshare Units Dedicated Check-in Facilities Private Pool A Dine-In / Take-Out Deli Concept Odawara Stunning Mountain and Sea Views Hillside Collection of 10 Villas Ability to develop up to 100 more units in phases over time Access to Hilton Odawara Resort & Spa restaurants, indoor and outdoor pools, tennis courts, indoor golf training facility and bowling © 2018 Hilton Grand Vacations Inc. Proprietary

FINANCIAL STRENGTHS © 2018 Hilton Grand Vacations Inc. Proprietary
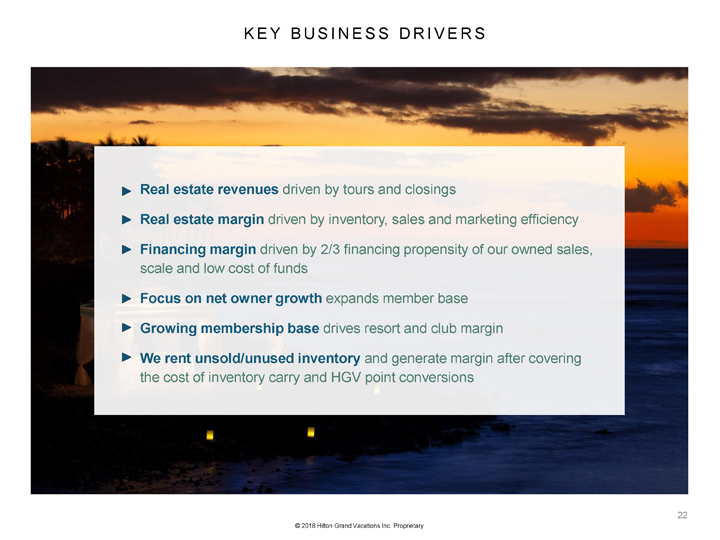
K E Y B U S I N E S S D R I V E R S Real estate revenues driven by tours and closings Real estate margin driven by inventory, sales and marketing efficiency Financing margin driven by 2/3 financing propensity of our owned sales, scale and low cost of funds Focus on net owner growth expands member base Growing membership base drives resort and club margin We rent unsold/unused inventory and generate margin after covering the cost of inventory carry and HGV point conversions © 2018 Hilton Grand Vacations Inc. Proprietary
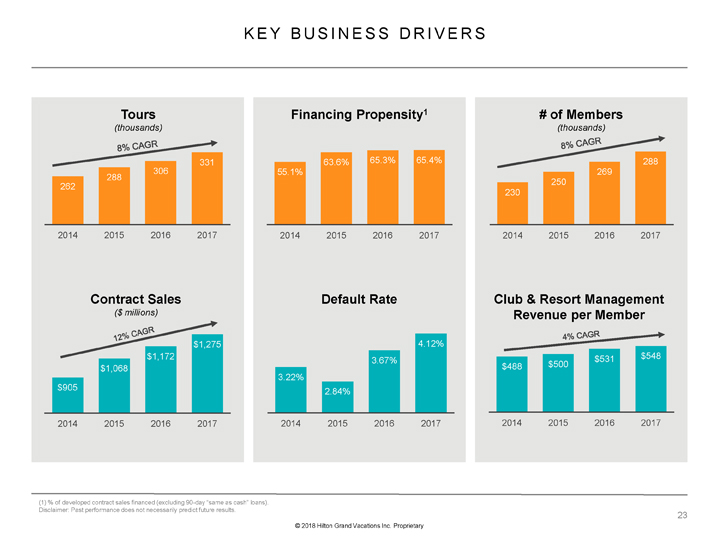
K E Y B U S I N E S S D R I V E R S Tours (thousands) 331 306 288 262 2014 2015 2016 2017 Contract Sales ($ millions) $1,275 $1,172 $1,068 $905 2014 2015 2016 2017 Financing Propensity1 63.6% 65.3% 65.4% 55.1% 2014 2015 2016 2017 Default Rate 4.12% 3.67% 3.22% 2.84% 2014 2015 2016 2017 # of Members (thousands) 288 269 250 230 2014 2015 2016 2017 Club & Resort Management Revenue per Member $531 $548 $488 $500 2014 2015 2016 2017 (1) % of developed contract sales financed (excluding 90-day “same as cash” loans). Disclaimer: Past performance does not necessarily predict future results. © 2018 Hilton Grand Vacations Inc. Proprietary
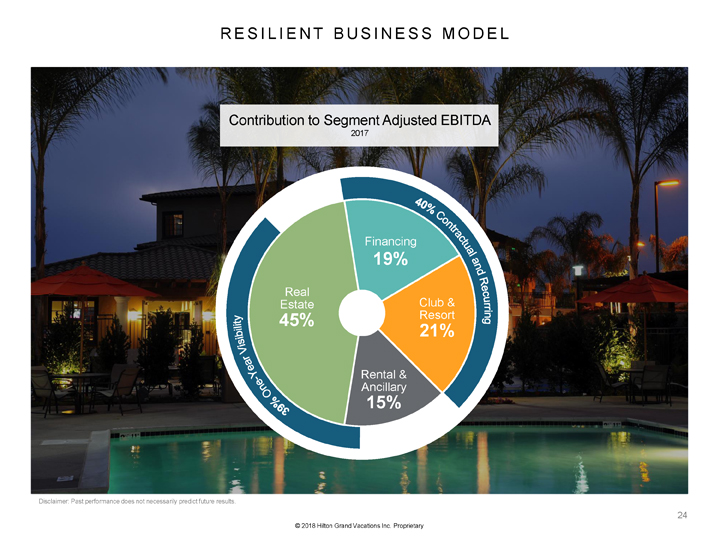
R E S I L I E N T B U S I N E S S M O D E L Contribution to Segment Adjusted EBITDA 2017 Financing 19% Real Club & Estate Resort 45% 21% Rental & Ancillary 15% Disclaimer: Past performance does not necessarily predict future results. © 2018 Hilton Grand Vacations Inc. Proprietary
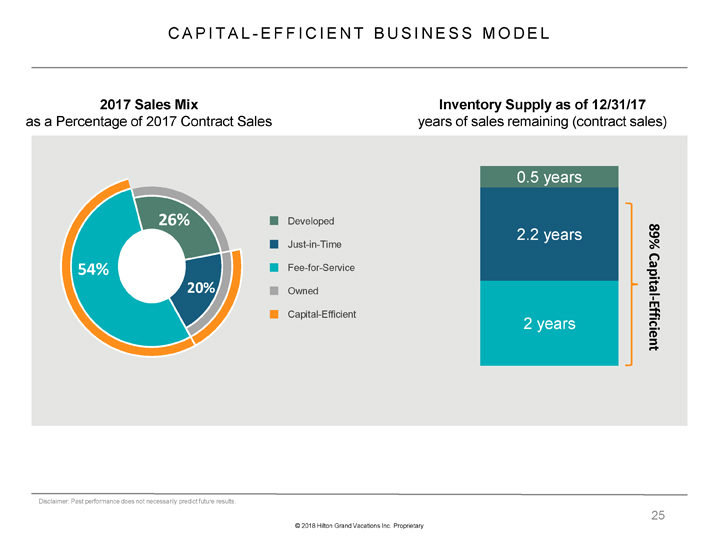
C A P I T A L—E F F I C I E N T B U S I N E S S M O D E L 2017 Sales Mix as a Percentage of 2017 Contract Sales 26% Developed Just-in-Time 54% Fee-for-Service 20% Owned Capital-Efficient Inventory Supply as of 12/31/17 years of sales remaining (contract sales) 0.5 years 2.2 years 89% Capital -2 years Efficient Disclaimer: Past performance does not necessarily predict future results. © 2018 Hilton Grand Vacations Inc. Proprietary
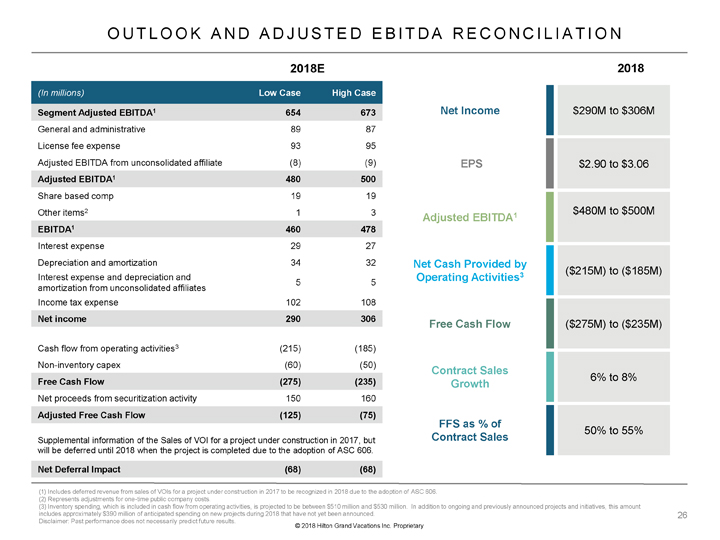
O U T L O O K A N D A D J U S T E D E B I T D A R E C O N C I L I A T I O N 2018E (In millions) Low Case High Case Segment Adjusted EBITDA1 654 673 General and administrative 89 87 License fee expense 93 95 Adjusted EBITDA from unconsolidated affiliate (8) (9) Adjusted EBITDA1 480 500 Share based comp 19 19 Other items2 1 3 EBITDA1 460 478 Interest expense 29 27 Depreciation and amortization 34 32 Interest expense and depreciation and 5 5 amortization from unconsolidated affiliates Income tax expense 102 108 Net income 290 306 Cash flow from operating activities3 (215) (185) Non-inventory capex (60) (50) Free Cash Flow (275) (235) Net proceeds from securitization activity 150 160 Adjusted Free Cash Flow (125) (75) Supplemental information of the Sales of VOI for a project under construction in 2017, but will be deferred until 2018 when the project is completed due to the adoption of ASC 606. Net Deferral Impact (68) (68) 2018 Net Income $290M to $306M EPS $2.90 to $3.06 $480M to $500M Adjusted EBITDA1 Net Cash Provided by ($215M) to ($185M) Operating Activities3 Free Cash Flow ($275M) to ($235M) Contract Sales 6% to 8% Growth FFS as % of 50% to 55% Contract Sales (1) Includes deferred revenue from sales of VOIs for a project under construction in 2017 to be recognized in 2018 due to the adoption of ASC 606. (2) Represents adjustments for one-time public company costs. (3) Inventory spending, which is included in cash flow from operating activities, is projected to be between $510 million and $530 million. In addition to ongoing and previously announced projects and initiatives, this amount includes approximately $390 million of anticipated spending on new projects during 2018 that have not yet been announced. Disclaimer: Past performance does not necessarily predict future results. © 2018 Hilton Grand Vacations Inc. Proprietary
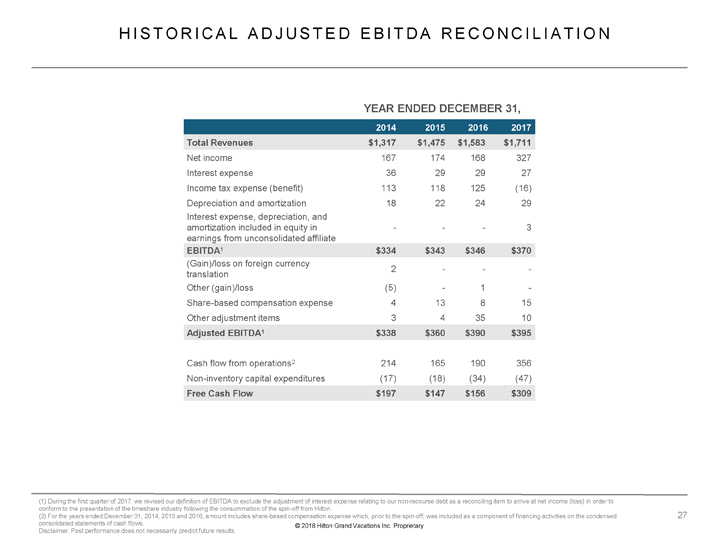
H I S T O R I C A L A D J U S T E D E B I T D A R E C O N C I L I A T I O N YEAR ENDED DECEMBER 31, 2014 2015 2016 2017 Total Revenues $1,317 $1,475 $1,583 $1,711 Net income 167 174 168 327 Interest expense 36 29 29 27 Income tax expense (benefit) 113 118 125 (16) Depreciation and amortization 18 22 24 29 Interest expense, depreciation, and amortization included in equity in ——3 earnings from unconsolidated affiliate EBITDA1 $334 $343 $346 $370 (Gain)/loss on foreign currency 2 — -translation Other (gain)/loss (5)—1 -Share-based compensation expense 4 13 8 15 Other adjustment items 3 4 35 10 Adjusted EBITDA1 $338 $360 $390 $395 Cash flow from operations2 214 165 190 356 Non-inventory capital expenditures (17) (18) (34) (47) Free Cash Flow $197 $147 $156 $309 (1) During the first quarter of 2017, we revised our definition of EBITDA to exclude the adjustment of interest expense relating to our non-recourse debt as a reconciling item to arrive at net income (loss) in order to conform to the presentation of the timeshare industry following the consummation of the spin-off from Hilton. (2) For the years ended December 31, 2014, 2015 and 2016, amount includes share-based compensation expense which, prior to the spin-off, was included as a component of financing activities on the condensed consolidated statements of cash flows. © 2018 Hilton Grand Vacations Inc. Proprietary Disclaimer: Past performance does not necessarily predict future results.
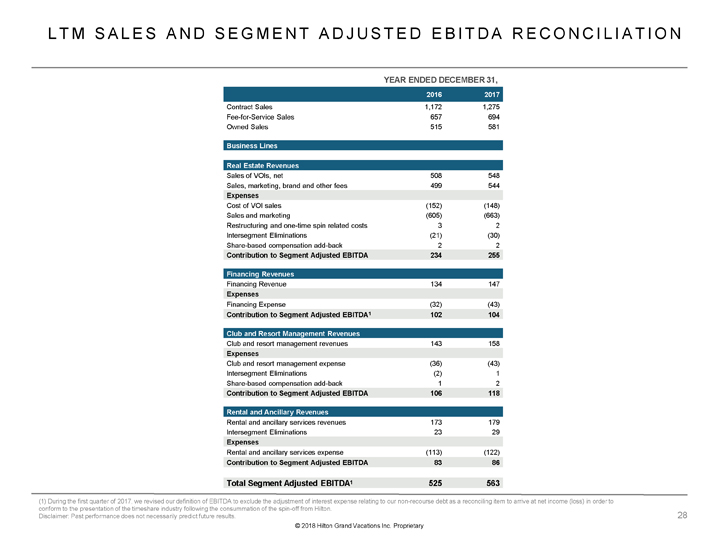
L T M S A L E S A N D S E G M E N T A D J U S T E D E B I T D A R E C O N C I L I A T I O N YEAR ENDED DECEMBER 31, 2016 2017 Contract Sales 1,172 1,275 Fee-for-Service Sales 657 694 Owned Sales 515 581 Business Lines Real Estate Revenues Sales of VOIs, net 508 548 Sales, marketing, brand and other fees 499 544 Expenses Cost of VOI sales (152) (148) Sales and marketing (605) (663) Restructuring and one-time spin related costs 3 2 Intersegment Eliminations (21) (30) Share-based compensation add-back 2 2 Contribution to Segment Adjusted EBITDA 234 255 Financing Revenues Financing Revenue 134 147 Expenses Financing Expense (32) (43) Contribution to Segment Adjusted EBITDA1 102 104 Club and Resort Management Revenues Club and resort management revenues 143 158 Expenses Club and resort management expense (36) (43) Intersegment Eliminations (2) 1 Share-based compensation add-back 1 2 Contribution to Segment Adjusted EBITDA 106 118 Rental and Ancillary Revenues Rental and ancillary services revenues 173 179 Intersegment Eliminations 23 29 Expenses Rental and ancillary services expense (113) (122) Contribution to Segment Adjusted EBITDA 83 86 Total Segment Adjusted EBITDA1 525 563 (1) During the first quarter of 2017, we revised our definition of EBITDA to exclude the adjustment of interest expense relating to our non-recourse debt as a reconciling item to arrive at net income (loss) in order to conform to the presentation of the timeshare industry following the consummation of the spin-off from Hilton. Disclaimer: Past performance does not necessarily predict future results. © 2018 Hilton Grand Vacations Inc. Proprietary
HILTON GRAND VACATIONS © 2018 Hilton Grand Vacations Inc. Proprietary