Attached files
UNITED STATES
SECURITIES AND EXCHANGE COMMISSION
Washington, D.C. 20549
____ _____
FORM 10-K
ANNUAL REPORT PURSUANT TO SECTION 13 OR 15(d) OF THE SECURITIES EXCHANGE ACT OF 1934
For the Fiscal Year Ended December 31, 2017
OR
TRANSITION REPORT PURSUANT TO SECTION 13 OR 15(d) OF THE SECURITIES EXCHANGE ACT OF 1934
For the transition period from _________ to __________.
Commission File Number 000-30707
First Northern Community Bancorp
(Exact name of Registrant as specified in its charter)
|
California
|
|
68-0450397
|
|
(State or other jurisdiction of incorporation or organization)
|
|
(I.R.S. Employer Identification Number)
|
|
195 N. First St., Dixon, CA
|
|
95620
|
|
(Address of principal executive offices)
|
|
(Zip Code)
|
707-678-3041
(Registrant's telephone number including area code)
|
Securities registered pursuant to Section 12(b) of the Act:
|
None
|
|
Securities registered pursuant to Section 12(g) of the Act:
|
Common Stock, no par value (Title of Class)
|
Indicate by check mark if the registrant is a well-known seasoned issuer, as defined in Rule 405 of the Securities Act.
|
Yes
|
No
|
Indicate by check mark if the registrant is not required to file reports pursuant to Section 13 or Section 15(d) of the Exchange Act.
|
Yes
|
No
|
Indicate by check mark whether the registrant (1) has filed all reports required to be filed by Section 13 or 15(d) of the Securities Exchange Act of 1934 during the preceding 12 months (or for such shorter period that the registrant was required to file such reports) and (2) has been subject to such filing requirements for the past 90 days.
|
Yes
|
No
|
Indicate by check mark whether the registrant has submitted electronically and posted on its corporate Web site, if any, every Interactive Data File required to be submitted and posted pursuant to Rule 405 of Regulation S-T (§ 232.405 of this chapter) during the preceding 12 months (or for such shorter period that the registrant was required to submit and post such files).
|
Yes
|
No
|
Indicate by check mark if disclosure of delinquent filers pursuant to Item 405 of Regulation S-K (Section 229.405 of this chapter) is not contained herein, and will not be contained, to the best of registrant's knowledge, in definitive proxy or information statements incorporated by reference in Part III of this Form 10-K or any amendment to this Form 10-K.
Indicate by check mark whether the registrant is a large accelerated filer, an accelerated filer, a non-accelerated filer or a smaller reporting company. See the definitions of "large accelerated filer," "accelerated filer" and "smaller reporting company" in Rule 12b-2 of the Exchange Act.
|
Large accelerated filer
|
Accelerated filer
|
Non-accelerated filer
|
Smaller reporting company
|
|
Emerging growth company
|
(Do not check if smaller reporting company)
|
||
If an emerging growth company, indicate by check mark if the registrant has elected not to use the extended transition period for complying with any new or revised financial accounting standards provided pursuant to Section 13(a) of the Exchange Act.
The registrant will no longer qualify as a smaller reporting company for 2017 because the aggregate market value of the registrant's Common Stock held by non-affiliates of the registrant on June 30, 2016 exceeded $75,000,000.
Indicate by check mark whether the registrant is a shell company (as defined in Rule 12b-2 of the Exchange Act).
|
Yes
|
No
|
The aggregate market value of the registrant's Common Stock held by non-affiliates of the registrant on June 30, 2017 (based upon the last reported sales price of such stock on the OTC Markets on June 30, 2017) was $122,072,716.
The number of shares of the registrant's Common Stock outstanding as of March 1, 2018 was 11,213,576.
DOCUMENTS INCORPORATED BY REFERENCE
Items 10, 11, 12 (as to security ownership of certain beneficial owners and management), 13 and 14 of Part III incorporate by reference information from the registrant's proxy statement to be filed with the Securities and Exchange Commission in connection with the solicitation of proxies for the registrant's 2018 Annual Meeting of Shareholders.
1
TABLE OF CONTENTS
|
PART I
|
Page
|
|
|
|
|
|
|
Item 1
|
Business
|
4
|
|
|
|
|
|
Item 1A
|
Risk Factors
|
13
|
|
|
|
|
|
Item 1B
|
Unresolved Staff Comments
|
21
|
|
|
|
|
|
Item 2
|
Properties
|
21
|
|
|
|
|
|
Item 3
|
Legal Proceedings
|
21
|
|
|
|
|
|
Item 4
|
Mine Safety Disclosures
|
21
|
|
|
|
|
|
PART II
|
|
|
|
|
|
|
|
Item 5
|
Market for Registrant's Common Equity, Related Stockholder Matters and Issuer Purchases of Equity Securities
|
22
|
|
|
|
|
|
Item 6
|
Selected Financial Data
|
24
|
|
|
|
|
|
Item 7
|
Management's Discussion and Analysis of Financial Condition and Results of Operations
|
25
|
|
|
|
|
|
Item 7A
|
Quantitative and Qualitative Disclosures About Market Risk
|
54
|
|
|
|
|
|
Item 8
|
Financial Statements and Supplementary Data
|
56
|
|
|
|
|
|
Item 9
|
Changes in and Disagreements with Accountants on Accounting and Financial Disclosure
|
108
|
|
|
|
|
|
Item 9A
|
Controls and Procedures
|
108
|
|
|
|
|
|
Item 9B
|
Other Information
|
108
|
|
|
|
|
|
PART III
|
|
|
|
|
|
|
|
Item 10
|
Directors, Executive Officers and Corporate Governance
|
109
|
|
|
|
|
|
Item 11
|
Executive Compensation
|
109
|
|
|
|
|
|
Item 12
|
Security Ownership of Certain Beneficial Owners and Management and Related Stockholder Matters
|
110
|
|
|
|
|
|
Item 13
|
Certain Relationships and Related Transactions and Director Independence
|
110
|
|
|
|
|
|
Item 14
|
Principal Accountant Fees and Services
|
110
|
|
|
|
|
|
PART IV
|
|
|
|
|
|
|
|
Item 15
|
Exhibits and Financial Statement Schedules
|
111
|
|
Item 16
|
Form 10-K Summary
|
113
|
|
|
|
|
|
Signatures
|
114
|
|
2
NOTE REGARDING FORWARD-LOOKING STATEMENTS
This report includes forward-looking statements, which include forecasts of our financial results and condition, expectations for our operations and business, and our assumptions for those forecasts and expectations. Do not rely unduly on forward-looking statements. Actual results might differ significantly compared to our forecasts and expectations. See Part I, Item 1A. "Risk Factors," and the other risks described in this report for factors to be considered when reading any forward-looking statements in this filing.
This report includes forward-looking statements, which are subject to the "safe harbor" created by section 27A of the Securities Act of 1933, as amended, and section 21E of the Securities Exchange Act of 1934, as amended. We may make forward-looking statements in our Securities and Exchange Commission ("SEC") filings, press releases, news articles and when we are speaking on behalf of the Company. Forward-looking statements can be identified by the fact that they do not relate strictly to historical or current facts. Often, they include the words "believe," "expect," "target," "anticipate," "intend," "plan," "seek," "estimate," "potential," "project," or words of similar meaning, or future or conditional verbs such as "will," "would," "should," "could," "might," or "may." These forward-looking statements are intended to provide investors with additional information with which they may assess our future potential. All of these forward-looking statements are based on assumptions about an uncertain future and are based on information available to us at the date of these statements. We do not undertake to update forward-looking statements to reflect facts, circumstances, assumptions or events that occur after the date the forward-looking statements are made.
In this document, for example, we make forward-looking statements, which discuss our expectations about:
Our business objectives, strategies and initiatives, our organizational structure, the growth of our business and our competitive position and prospects, and the effect of competition on our business and strategies
| |
Our assessment of significant factors and developments that have affected or may affect our results
|
| |
Pending and recent legal and regulatory actions, and future legislative and regulatory developments, including the effects of the Dodd-Frank Wall Street Reform and Protection Act (the "Dodd-Frank Act") and other legislation and governmental measures introduced in response to the financial crises affecting the banking system, financial markets and the U.S. economy
|
| |
Regulatory and compliance controls, processes and requirements and their impact on our business
|
| |
The costs and effects of legal or regulatory actions
|
| |
Expectations regarding draws on performance letters of credit
|
| |
Our regulatory capital requirements, including the capital rules adopted in the past several years by the U.S. federal banking agencies
|
| |
Expectations regarding our non-payment of a cash dividend on our common stock in the foreseeable future
|
| |
Credit quality and provision for credit losses and management of asset quality and credit risk, and expectations regarding collections
|
| |
Our allowances for credit losses, including the conditions we consider in determining the unallocated allowance and our portfolio credit quality, underwriting standards, and risk grading
|
| |
Our assessment of economic conditions and trends and credit cycles and their impact on our business
|
| |
The seasonal nature of our business
|
| |
The impact of changes in interest rates and our strategy to manage our interest rate risk profile and the possible effect of increases in residential mortgage interest rates on new originations and refinancing of existing residential mortgage loans
|
| |
Loan portfolio composition and risk grade trends, expected charge-offs, portfolio credit quality, our strategy regarding troubled debt restructurings ("TDRs"), delinquency rates and our underwriting standards
|
| |
Our deposit base including renewal of time deposits
|
| |
The impact on our net interest income and net interest margin from the current low-interest rate environment
|
3
| ● |
Possible changes in the initiatives and policies of the federal bank regulatory agencies
|
| |
Tax rates and the possible impact of changes in the U.S. tax laws
|
| |
Our pension and retirement plan costs
|
| |
Our liquidity position
|
| |
Critical accounting policies and estimates, the impact or anticipated impact of recent accounting pronouncements or changes in accounting principles
|
| |
Expected rates of return, maturities, loss exposure, growth rates, yields and projected results
|
| |
The possible impact of weather related conditions, including drought or flooding, and related governmental responses on economic conditions, especially in the agricultural sector
|
| |
Maintenance of insurance coverages appropriate for our operations
|
| |
Threats to the banking sector and our business due to cybersecurity issues and attacks and regulatory expectations related to cybersecurity
|
| |
Descriptions of assumptions underlying or relating to any of the foregoing
|
There are numerous risks and uncertainties that could and will cause actual results to differ materially from those discussed in our forward-looking statements. Many of these factors are beyond our ability to control or predict and could have a material adverse effect on our financial condition and results of operations or prospects. Such risks and uncertainties include but are not limited to those listed in this "Note Regarding Forward-Looking Statements," Part I, Item 1A "Risk Factors," Part II, Item 7 "Management's Discussion and Analysis of Financial Condition and Results of Operations," and Part II, Item 7A "Quantitative and Qualitative Disclosures about Market Risk."
Readers of this document should not rely unduly on forward-looking information and should consider all uncertainties and risks disclosed throughout this document and in our other reports to the SEC, including, but not limited to, those discussed below. Any factor described in this report could by itself, or together with one or more other factors, adversely affect our business, future prospects, results of operations or financial condition. We do not undertake to update forward-looking statements to reflect facts, circumstances, assumptions or events that occur after the date the forward-looking statements are made.
PART I
ITEM 1 - BUSINESS
General
First Northern Community Bancorp (the "Company") is a bank holding company registered under the Bank Holding Company Act of 1956, as amended ("BHCA"). Its legal headquarters and principal administrative offices are located at 195 N. First Street, Dixon, CA 95620 and its telephone number is (707) 678-3041. The Company provides a full range of community banking services to individual and corporate customers throughout the California Counties of Solano, Yolo, Placer and Sacramento as well as portions of El Dorado and Contra Costa Counties through its wholly owned subsidiary bank, First Northern Bank of Dixon ("First Northern" or the "Bank"). The Company's operating policy since inception has emphasized the banking needs of individuals and small to medium sized businesses. In addition, the Bank owns 100% of the capital stock of Yolano Realty Corporation, a subsidiary created for the purpose of managing selected other real estate owned properties.
The Bank was established in 1910 under a California state charter as Northern Solano Bank, and opened for business on February 1st of that year. On January 2, 1912, the First National Bank of Dixon was established under a federal charter, and until 1955, the two entities operated side by side under the same roof and with the same management. In an effort to increase efficiency of operation, reduce operating expense, and improve lending capacity, the two banks were consolidated on April 8, 1955, with the First National Bank of Dixon as the surviving entity. On January 1, 1980, the Bank's federal charter was relinquished in favor of a California state charter, and the Bank's name was changed to First Northern Bank of Dixon.
4
In April of 2000, the shareholders of First Northern approved a corporate reorganization, which provided for the creation of the bank holding company. This reorganization, effected May 19, 2000, enabled the Company to better compete and grow in its competitive and rapidly changing marketplace.
The Bank has ten full service branches located in the cities of Auburn, Davis, Dixon, Fairfield, Roseville, Sacramento, Vacaville, West Sacramento, Winters and Woodland. The Bank has one satellite banking office inside a retirement community in the city of Davis and a residential mortgage loan office in Davis. The Bank's Asset Management & Trust Department is headquartered in Downtown Sacramento and serves the Bank's entire market area. Similarly, the Bank engages financial advisors, through Raymond James Financial Services, Inc., who offer non-FDIC insured investment and brokerage services throughout the region from offices strategically located in West Sacramento, Davis and Auburn. The Bank also has a commercial loan office in the Contra Costa County city of Walnut Creek that serves the East Bay Area's small to medium-sized business lending needs. The Bank's operations center is located in Dixon and provides back-office support including information services, central operations, and the central loan department.
The Bank is in the commercial banking business and generates most of its revenue by providing a wide range of products and services to small and middle sized businesses and individuals including accepting demand, interest bearing transaction, savings, and time deposits, and making commercial, consumer, and real estate related loans. It also issues cashier's checks, sells travelers' checks, rents safe deposit boxes, and provides other customary banking services.
First Northern offers a broad range of alternative investment products and services through Raymond James Financial Services, Inc. First Northern also offers equipment leasing, credit cards, merchant card processing, payroll services, and limited international banking services through third parties.
Fiduciary services are offered to individuals, businesses, governments, and charitable organizations in the Solano, Yolo, Sacramento, Placer, El Dorado and Contra Costa County regions.
The Bank's principal source of revenue comes from interest income. Interest income is primarily derived from interest and fees on loans and leases, interest on investments, and due from banks interest bearing accounts. For the year ended December 31, 2017, these sources comprised 83%, 13% and 4%, respectively of the Company's interest income.
The Bank is a member of the Federal Deposit Insurance Corporation ("FDIC") and all deposit accounts are insured by the FDIC to the maximum amount permitted by law, currently $250,000 per depositor. Most of the Bank's deposits are attracted from the market of northern and central Solano County and southern and central Yolo County. The Bank's deposits are not received from a single depositor or group of affiliated depositors, the loss of any one which would have a materially adverse impact on the business of the Bank. A material portion of the Bank's deposits are not concentrated within a single industry group of related industries.
As of December 31, 2017, the Company had consolidated assets of approximately $1.2 billion, deposits of approximately $1.1 billion and shareholder's equity of $100.0 million. The Company and its subsidiaries employed 191 full-time equivalent employees as of December 31, 2017. The Company and the Bank consider their relationship with their employees to be good and have not experienced any interruptions of operations due to labor disagreements.
Available Information
The Company makes available free of charge on its website, www.thatsmybank.com, its Annual Reports on Form 10-K, Quarterly Reports on Form 10-Q, Current Reports on Form 8-K and amendments to those reports, as soon as reasonably practicable after the Company electronically files such material with, or furnishes it to, the SEC. These filings are also accessible on the SEC's website at www.sec.gov. The information found on the Company's website shall not be deemed incorporated by reference by any general statement incorporating by reference this report into any filing under the Securities Act of 1933 or under the Securities Exchange Act of 1934 and shall not otherwise be deemed filed under such Acts.
The Effect of Government Policy on Banking
The earnings and growth of the Bank are affected not only by local market area factors and general economic conditions, but also by government monetary and fiscal policies. For example, the Board of Governors of the Federal Reserve System ("FRB") influences the supply of money through its open market operations in U.S. Government securities, adjustments to the discount rates applicable to borrowings by depository institutions and others and establishment of reserve requirements against both member and non-member financial institutions' deposits. Such actions significantly affect the overall growth and distribution of loans, investments, and deposits and also affect interest rates charged on loans and paid on deposits. Since the financial crisis of 2008, the banking industry has operated in an extremely low interest rate environment relative to historical averages, and the FRB has pursued a variety of monetary measures aimed at sustaining a very low interest rate environment in the U.S. in an effort to stimulate economic growth and reduce levels of unemployment, including purchases of long-term U.S. Treasury and federal agency backed securities and maintaining a very low target range for the federal funds rate. These policies of the FRB for the past several years have placed a downward pressure on the net interest margins of banks in the United States, including that of the Bank. In December 2016, the FRB raised the target range for the federal funds rate to 0.50% to 0.75%. In 2017, the FRB raised the federal funds rate by 25 bps three times in March, June, and December. In December 2017, the target range for the federal funds rate was 1.25% to 1.50%. The FRB has also begun to gradually reduce its balance sheet as part of its movement away from its accommodative monetary policy. The FRB has indicated that it expects that economic conditions will evolve in a manner that will warrant gradual increases in the federal funds rate. However, the actual path of the federal funds rate and other aspects of the FRB's monetary policy will depend on the economic outlook as informed by incoming data. We cannot predict with any certainty the degree to which the FRB will continue its accommodative monetary policies, nor the timing of further easing of these policies.
5
The nature and impact of future changes in such policies on the business and earnings of the Company cannot be predicted. Additionally, state and federal tax policies can impact banking organizations.
As a consequence of the extensive regulation of commercial banking activities in the United States, the business of the Company is particularly susceptible to being affected by the enactment of federal and state legislation which may have the effect of increasing or decreasing the cost of doing business, modifying permissible activities or enhancing the competitive position of other financial institutions. Any change in applicable laws, regulations, or policies may have a material adverse effect on the business, financial condition, or results of operations, or prospects of the Company.
During 2017, the Trump Administration appointed new leadership in key positions at the FRB, FDIC and other federal banking agencies. New leadership at the FRB has expressed its intentions to explore opportunities to improve the efficiency, transparency and simplicity of its regulatory supervision. This initiative may involve small bank capital simplification, resolution planning burden reduction, and increasing submission cycles from one to two years, leverage ratio recalibration, and have as its objective to reconsider the effects of these existing regulatory frameworks on the resiliency of the financial system, credit availability, economic growth and their respective and collective costs and benefits. Whether and to what extent these leadership changes will result in new regulatory initiatives and policies, or modifications of existing regulations and policies, which may impact our business, cannot be predicted at this time.
Supervision and Regulation of Bank Holding Companies
The Company is a bank holding company subject to the Bank Holding Company Act of 1956, as amended ("BHCA"). The Company reports to, registers with, and is subject to supervision and examination by, the FRB. The FRB also has the authority to examine the Company's subsidiaries. The costs of any examination by the FRB are payable by the Company.
The FRB has significant supervisory, regulatory and enforcement authority over the Company and its affiliates. The FRB requires the Company to maintain certain levels of capital. See "Capital Standards" below for more information. The FRB also has the authority to take enforcement action against any bank holding company that commits any unsafe or unsound practice, or violates certain laws, regulations, or conditions imposed in writing by the FRB. See "Prompt Corrective Action and Other Enforcement Mechanisms" below for more information. Such enforcement powers include the power to assess civil money penalties against any bank holding company violating any provision of the BHCA or any regulation or order of the FRB under the BHCA. Knowing violations of the BHCA or regulations or orders of the FRB can also result in criminal penalties for the company and any individuals participating in such conduct. Under long-standing FRB policy and provisions of the Dodd-Frank Act, bank holding companies are required to act as a source of financial and managerial strength to their subsidiary banks, and to commit resources to support their subsidiary banks. This support may be required at times when a bank holding company may not be able to provide such support.
Under the BHCA, a company generally must obtain the prior approval of the FRB before it exercises a controlling influence over a bank, or acquires, directly or indirectly, more than 5% of the voting shares or substantially all of the assets of any bank or bank holding company. Thus, the Company is required to obtain the prior approval of the FRB before it acquires, merges, or consolidates with any bank or bank holding company. Any company seeking to acquire, merge, or consolidate with the Company also would be required to obtain the prior approval of the FRB.
The Company is generally prohibited under the BHCA from acquiring ownership or control of more than 5% of the voting shares of any company that is not a bank or bank holding company and from engaging directly or indirectly in activities other than banking, managing banks, or providing services to affiliates of the holding company. However, a bank holding company, with the approval of the FRB, may engage, or acquire the voting shares of companies engaged, in activities that the FRB has determined to be so closely related to banking or managing or controlling banks as to be a proper incident thereto. A bank holding company must demonstrate that the benefits to the public of the proposed activity will outweigh the possible adverse effects associated with such activity.
6
The FRB generally prohibits a bank holding company from declaring or paying a cash dividend which would impose undue pressure on the capital of subsidiary banks or would be funded only through borrowing or other arrangements that might adversely affect a bank holding company's financial position. The FRB's policy is that a bank holding company should not continue its existing rate of cash dividends on its common stock unless its net income is sufficient to fully fund each dividend and its prospective rate of earnings retention appears consistent with its capital needs, asset quality, and overall financial condition. The Company is also subject to restrictions relating to the payment of dividends under California corporate law. See "Restrictions on Dividends and Other Distributions" below for additional restrictions on the ability of the Company and the Bank to pay dividends.
Supervision and Regulation of the Bank
The Bank is subject to regulation, supervision and regular examination by the Financial Institutions Division of the California Department of Business Oversight ("DBO") and the FDIC. The regulations of these agencies affect most aspects of the Bank's business and prescribe permissible types of loans and investments, the amount of required reserves, requirements for branch offices, the permissible scope of the Bank's activities and various other requirements. While the Bank is not a member of the FRB, it is directly subject to certain regulations of the FRB dealing with such matters as check clearing activities, establishment of banking reserves, Truth-in-Lending ("Regulation Z"), and Equal Credit Opportunity ("Regulation B"). The Bank is also subject to regulations of (although not direct supervision and examination by) the Consumer Financial Protection Bureau ("CFPB"), which was created by the Dodd-Frank Act. Among the CFPB's responsibilities are implementing and enforcing federal consumer financial protection laws, reviewing the business practices of financial services providers for legal compliance, monitoring the marketplace for transparency on behalf of consumers and receiving complaints and questions from consumers about consumer financial products and services. The Dodd-Frank Act added prohibitions on unfair, deceptive or abusive acts and practices to the scope of consumer protection regulations overseen and enforced by the CFPB.
The banking industry is also subject to significantly increased regulatory controls and processes regarding Bank Secrecy Act and anti-money laundering laws. In recent years, a number of banks and bank holding companies announced the imposition of regulatory sanctions, including regulatory agreements and cease and desist orders and, in some cases, fines and penalties, by the bank regulators due to failures to comply with the Bank Secrecy Act and other anti-money laundering legislation. In a number of these cases, the fines and penalties have been significant. Failure to comply with these additional requirements may also adversely affect the Bank's ability to obtain regulatory approvals for future initiatives requiring regulatory approval, including acquisitions.
Under California law, the Bank is subject to various restrictions on, and requirements regarding, its operations and administration including the maintenance of branch offices and automated teller machines, capital and reserve requirements, deposits and borrowings, and investment and lending activities.
California law permits a state chartered bank to invest in the stock and securities of other corporations, subject to a state chartered bank receiving either general authorization or, depending on the amount of the proposed investment, specific authorization from the DBO. Federal banking laws, however, impose limitations on the activities and equity investments of state chartered, federally insured banks. The FDIC rules on investments prohibit a state bank from acquiring an equity investment of a type, or in an amount, not permissible for a national bank. FDIC rules also prohibit a state bank from engaging as a principal in any activity that is not permissible for a national bank, unless the bank is adequately capitalized and the FDIC approves the activity after determining that such activity does not pose a significant risk to the deposit insurance fund. The FDIC rules on activities generally permit subsidiaries of banks, without prior specific FDIC authorization, to engage in those activities that have been approved by the FRB for bank holding companies because such activities are so closely related to banking to be a proper incident thereto. Other activities generally require specific FDIC prior approval, and the FDIC may impose additional restrictions on such activities on a case-by-case basis in approving applications to engage in otherwise impermissible activities.
The USA Patriot Act
Title III of the United and Strengthening America by Providing Appropriate Tools Required to Intercept and Obstruct Terrorism Act of 2001 ("USA Patriot Act") includes numerous provisions for fighting international money laundering and blocking terrorism access to the U.S. financial system. The USA Patriot Act requires certain additional due diligence and record keeping practices, including, but not limited to, new customers, correspondent and private banking accounts.
Part of the USA Patriot Act is the International Money Laundering Abatement and Financial Anti-Terrorism Act of 2001 ("IMLAFATA"). Among its provisions, IMLAFATA requires each financial institution to: (i) establish an anti-money laundering program; (ii) establish appropriate anti-money laundering policies, procedures, and controls; (iii) appoint a Bank Secrecy Act officer responsible for day-to-day compliance; and (iv) conduct independent audits. In addition, IMLAFATA contains a provision encouraging cooperation among financial institutions, regulatory authorities, and law enforcement authorities with respect to individuals, entities and organizations engaged in, or reasonably suspected of engaging in, terrorist acts or money laundering activities. IMLAFATA expands the circumstances under which funds in a bank account may be forfeited and requires covered financial institutions to respond under certain circumstances to requests for information from federal banking agencies within 120 hours. IMLAFATA also amends the BHCA and the Bank Merger Act to require the federal banking agencies to consider the effectiveness of a financial institution's anti-money laundering activities when reviewing an application under these Acts.
7
Pursuant to IMLAFATA, the Secretary of the Treasury, in consultation with the heads of other government agencies, has adopted and proposed measures applicable to banks, bank holding companies, and/or other financial institutions. These measures include enhanced record keeping and reporting requirements for certain financial transactions that are of primary money laundering concern, due diligence requirements concerning the beneficial ownership of certain types of accounts, and restrictions or prohibitions on certain types of accounts with foreign financial institutions.
Privacy Restrictions
The Gramm-Leach-Bliley Act ("GLBA"), which became law in 1999, in addition to the previous described changes in permissible non-banking activities permitted to banks, bank holding companies and financial holding companies, also requires financial institutions in the U.S. to provide certain privacy disclosures to customers and consumers, to comply with certain restrictions on the sharing and usage of personally identifiable information, and to implement and maintain commercially reasonable customer information safeguarding standards.
The Company believes that it complies with all provisions of GLBA and all implementing regulations, and that the Bank has developed appropriate policies and procedures to meet its responsibilities in connection with the privacy provisions of GLBA.
California and other state legislatures have adopted privacy laws, including laws prohibiting sharing of customer information without the customer's prior permission. These laws may make it more difficult for the Company to share information with its marketing partners, reduce the effectiveness of marketing programs, and increase the cost of marketing programs.
Capital Standards
The FRB and the federal banking agencies have in place guidelines for risk-based capital requirements applicable to U.S. bank holding companies and banks. In July 2013, the FRB and the other U.S. federal banking agencies adopted final rules making significant changes to the U.S. regulatory capital framework for U.S. banking organizations and to conform this framework to the guidelines published by the Basel Committee on Banking Supervision (Basel Committee) known as the Basel III Global Regulatory Framework for Capital and Liquidity. The Basel Committee is a committee of banking supervisory authorities from major countries in the global financial system which formulates broad supervisory standards and guidelines relating to financial institutions for implementation on a country-by-country basis. These rules adopted by the FRB and the other federal banking agencies (the U.S. Basel III Capital Rules) replaced the federal banking agencies' general risk-based capital rules, advanced approaches rule, market risk rule, and leverage rules, in accordance with certain transition provisions.
Banks, such as First Northern, became subject to the new rules on January 1, 2015. The new rules implement higher minimum capital requirements, include a new common equity Tier 1 capital requirement, and establish criteria that instruments must meet in order to be considered common equity Tier 1 capital, additional Tier 1 capital, or Tier 2 capital. When fully phased in by January 1, 2019, the final rules will provide for increased minimum capital ratios as follows: (a) a common equity Tier1 capital ratio of 4.5%; (b) a Tier 1 capital ratio of 6% (which is an increase from 4.0%); (c) a total capital ratio of 8%; and (d) a Tier 1 leverage ratio to average consolidated assets of 4%. Under the new rules, in order to avoid certain limitations on capital distributions, including dividend payments and certain discretionary bonus payments to executive officers, a banking organization must hold a capital conservation buffer composed of common equity Tier 1 capital above its minimum risk-based capital requirements (equal to 2.5% of total risk-weighted assets when fully phased in). The phase-in of the capital conservation buffer begins January 1, 2016 and must be completed by January 1, 2019. The U.S. Basel III capital rules also provide for various adjustments and deductions to the definitions of regulatory capital that phased in from January 1, 2014 to December 31, 2017.
8
The following tables present the capital ratios for the Company and the Bank as of December 31, 2017 (calculated in accordance with the Basel III capital rules):
|
The Company
|
||||||||||||
|
|
2017
|
Adequately Capitalized
|
||||||||||
|
|
Capital
|
Ratio
|
Ratio
|
|||||||||
|
Tier 1 Leverage Capital (to Average Assets)
|
$
|
104,441
|
8.6
|
%
|
4.0
|
%
|
||||||
|
Common Equity Tier 1 Capital (to Risk-Weighted Assets)
|
104,441
|
12.3
|
%
|
4.5
|
%
|
|||||||
|
Tier 1 Capital (to Risk-Weighted Assets)
|
104,441
|
12.3
|
%
|
6.0
|
%
|
|||||||
|
Total Risk-Based Capital (to Risk-Weighted Assets)
|
115,082
|
13.5
|
%
|
8.0
|
%
|
|||||||
|
The Bank
|
||||||||||||||||
|
|
2017
|
Adequately Capitalized
|
Well Capitalized
|
|||||||||||||
|
|
Capital
|
Ratio
|
Ratio
|
Ratio
|
||||||||||||
|
Tier 1 Leverage Capital (to Average Assets)
|
$
|
101,631
|
8.4
|
%
|
4.0
|
%
|
5.0
|
%
|
||||||||
|
Common Equity Tier 1 Capital (to Risk-Weighted Assets)
|
101,631
|
12.0
|
%
|
4.5
|
%
|
6.5
|
%
|
|||||||||
|
Tier 1 Capital (to Risk-Weighted Assets)
|
101,631
|
12.0
|
%
|
6.0
|
%
|
8.0
|
%
|
|||||||||
|
Total Risk-Based Capital (to Risk-Weighted Assets)
|
112,272
|
13.2
|
%
|
8.0
|
%
|
10.0
|
%
|
|||||||||
The federal banking agencies must take into consideration concentrations of credit risk and risks from non-traditional activities, as well as an institution's ability to manage those risks, when determining the adequacy of an institution's capital. This evaluation will be made as a part of the institution's regular safety and soundness examination. The federal banking agencies must also consider interest rate risk (when the interest rate sensitivity of an institution's assets does not match the sensitivity of its liabilities or its off-balance-sheet position) in evaluating a Bank's capital adequacy.
In January 2014, the Basel Committee issued an updated version of its leverage ratio and disclosure guidance. The Basel Committee guidance continues to set a minimum Basel III leverage ratio of 3%. The Basel III leverage ratio will be subject to further calibration until 2017, with final implementation expected in 2018. The Basel Committee is expected to collect data during this observation period to assess whether a minimum leverage ratio of 3% is appropriate over a full credit cycle and for various types of business models and to assess the impact of using common equity tier 1 capital or total regulatory capital as the numerator.
Prompt Corrective Action and Other Enforcement Mechanisms
The Federal Deposit Insurance Corporation Improvement Act of 1991 ("FDICIA") requires each federal banking agency to take prompt corrective action to resolve the problems of insured depository institutions, including but not limited to those that fall below one or more prescribed minimum capital ratios. The law required each federal banking agency to promulgate regulations defining the following five categories in which an insured depository institution will be placed, based on the level of its capital ratios: well capitalized, adequately capitalized, under-capitalized, significantly undercapitalized, and critically undercapitalized.
Under the prompt corrective action provisions of FDICIA, an insured depository institution generally will be classified in one of five capital categories ranging from "well-capitalized" to "critically under-capitalized."
An institution that, based upon its capital levels, is classified as "well capitalized," "adequately capitalized" or "under-capitalized" may be treated as though it were in the next lower capital category if the appropriate federal banking agency, after notice and opportunity for hearing, determines that an unsafe or unsound condition or an unsafe or unsound practice warrants such treatment. At each successive lower capital category, an insured depository institution is subject to more restrictions. Management believes that at December 31, 2017, the Company and the Bank exceeded the required ratios for classification as "well capitalized." Institutions that are "under-capitalized" or lower are subject to certain mandatory supervisory corrective actions. Failure to meet regulatory capital guidelines can result in a bank being required to raise additional capital. An "under-capitalized" bank must develop a capital restoration plan and its parent holding company must guarantee compliance with the plan subject to certain limits.
In addition to measures taken under the prompt corrective action provisions, commercial banking organizations may be subject to potential enforcement actions by the federal regulators for unsafe or unsound practices in conducting their businesses or for violations of any law, rule, regulation or any condition imposed in writing by the agency or any written agreement with the agency. Enforcement actions may include the imposition of a conservator or receiver, the issuance of a cease-and-desist order that can be judicially enforced, the termination of insurance of deposits (in the case of a depository institution), the imposition of civil money penalties, the issuance of directives to increase capital, the issuance of formal and informal agreements, the issuance of removal and prohibition orders against institution-affiliated parties and the enforcement of such actions through injunctions or restraining orders based upon a judicial determination that the agency would be harmed if such equitable relief was not granted. Additionally, a holding company's inability to serve as a source of strength to its subsidiary banking organizations could serve as an additional basis for a regulatory action against the holding company.
9
Safety and Soundness Standards
FDICIA also implemented certain specific restrictions on transactions and required federal banking regulators to adopt overall safety and soundness standards for depository institutions related to internal control, loan underwriting and documentation and asset growth. Among other things, FDICIA limits the interest rates paid on deposits by undercapitalized institutions, restricts the use of brokered deposits, limits the aggregate extensions of credit by a depository institution to an executive officer, director, principal shareholder, or related interest, and reduces deposit insurance coverage for deposits offered by undercapitalized institutions for deposits by certain employee benefits accounts.
The federal banking agencies may require an institution to submit to an acceptable compliance plan as well as have the flexibility to pursue other more appropriate or effective courses of action given the specific circumstances and severity of an institution's non-compliance with one or more standards.
Restrictions on Dividends and Other Distributions
The power of the board of directors of an insured depository institution to declare a cash dividend or other distribution with respect to capital is subject to statutory and regulatory restrictions which limit the amount available for such distribution depending upon the earnings, financial condition and liquidity needs of the institution, as well as general business conditions. FDICIA prohibits insured depository institutions from paying management fees to any controlling persons or, with certain limited exceptions, making capital distributions, including dividends, if, after such transaction, the institution would be undercapitalized.
The federal banking agencies also have authority to prohibit a depository institution from engaging in business practices, which are considered to be unsafe or unsound, possibly including payment of dividends or other payments under certain circumstances even if such payments are not expressly prohibited by statute.
In addition to the restrictions imposed under federal law, banks chartered under California law generally may only pay cash dividends to the extent such payments do not exceed the lesser of retained earnings of the bank's net income for its last three fiscal years (less any distributions to shareholders during such period). In the event a bank desires to pay cash dividends in excess of such amount, the bank may pay a cash dividend with the prior approval of the DBO in an amount not exceeding the greatest of the bank's retained earnings, the bank's net income for its last fiscal year, or the bank's net income for its current fiscal year.
Premiums for Deposit Insurance
The Bank is a member of the Deposit Insurance Fund ("DIF") maintained by the FDIC. Through the DIF, the FDIC insures the deposits of the Bank up to prescribed limits for each depositor. To maintain the DIF, member institutions are assessed an insurance premium based on their deposits and their institutional risk category. The FDIC determines an institution's risk category by combining its supervisory ratings with its financial ratios and other risk measures. The FDIC also has the authority to impose special assessments at any time it estimates that DIF reserves could fall to a level that would adversely affect public confidence. In October 2010, the FDIC adopted a comprehensive, long-range "restoration" plan for the DIF to better ensure the adequacy of the ratio of the fund's reserves to insured deposits. There can be no assurance that the FDIC will not impose special assessments or increase annual assessments in the future.
Community Reinvestment Act and Fair Lending
The Bank is subject to certain fair lending requirements and reporting obligations involving its home mortgage lending operations and is also subject to the Community Reinvestment Act ("CRA"). The CRA generally requires the federal banking agencies to evaluate the record of a financial institution in meeting the credit needs of the Bank's local communities, including low- and moderate-income neighborhoods. In addition to substantive penalties and corrective measures that may be required for a violation of certain fair lending laws, the federal banking agencies may take compliance with such laws and CRA into account when reviewing other activities by the Bank, particularly applications involving business expansion such as acquisitions or de novo branching.
Certain CFPB Rules
The Consumer Financial Protection Bureau (CFPB) has adopted an Ability-to-Repay rule that all newly originated residential mortgages must meet. The Ability-to-Repay rule establishes guidelines that the lender must follow when reviewing an applicant's income, obligations, assets, liabilities, and credit history and requires that the lender make a reasonable and good faith determination of an applicant's ability to repay the loan according to its terms. Lenders will be presumed to have met the Ability-to-Repay rule by originating loans that meet the criteria for "Qualified Mortgages", which are set forth in detail in the rule. The mortgage loans originated by the Bank with the intent to sell them to Freddie Mac meet the Qualified Mortgage criteria.
10
The CFPB has also adopted a rule on simplified and improved mortgage loan disclosures, otherwise known as Know Before You Owe. The rule provides that mortgage borrowers receive a loan estimate three business days after application and a closing disclosure three days before closing. These forms will replace disclosure forms previously provided to borrowers under other provisions of federal law. The rule provides for limitations on application fees and increases in closing costs.
These rules and any new regulatory requirements promulgated by the CFPB could have an adverse impact on our residential mortgage lending business as the industry adapts to the rule and any additional regulations. Our business strategy, product offerings and profitability may change as the market adjusts to the new rules and any additional regulations and as these requirements are interpreted by the regulators and courts.
Conservatorship and Receivership of Insured Depository Institutions
If any insured depository institution becomes insolvent and the FDIC is appointed its conservator or receiver, the FDIC may, under federal law, disaffirm or repudiate any contract to which such institution is a party, if the FDIC determines that performance of the contract would be burdensome, and that disaffirmance or repudiation of the contract would promote the orderly administration of the institution's affairs. Such disaffirmance or repudiation would result in a claim by its holder against the receivership or conservatorship. The amount paid upon such claim would depend upon, among other factors, the amount of receivership assets available for the payment of such claim and its priority relative to the priority of others. In addition, the FDIC as conservator or receiver may enforce most contracts entered into by the institution notwithstanding any provision providing for termination, default, acceleration, or exercise of rights upon or solely by reason of insolvency of the institution, appointment of a conservator or receiver for the institution, or exercise of rights or powers by a conservator or receiver for the institution. The FDIC as conservator or receiver also may transfer any asset or liability of the institution without obtaining any approval or consent of the institution's shareholders or creditors.
The Dodd-Frank Act
On July 21, 2010, the Dodd-Frank Act was signed into law. This sweeping legislation has affected U.S. financial institutions, including us, in many ways, some of which have increased, or may increase in the future, the cost of doing business and have presented other challenges to the financial services industry. Many of the law's provisions have been implemented by rules and regulations of the federal banking agencies, but certain provisions of the law are yet to be implemented and, therefore, the full scope and impact of the law on banking institutions generally and on our business cannot be fully determined at this time. The law contains many provisions which may have particular relevance to our business, including provisions that have resulted in adjustments to our FDIC deposit insurance premiums and that can be expected to result in increased capital and liquidity requirements, increased supervision, increased regulatory and compliance risks and costs and other operational costs and expenses, reduced fee-based revenues and restrictions on some aspects of our operations, and increased interest expense on our demand deposits.
The environment in which financial institutions continue to operate since the U.S. financial crisis, including legislative and regulatory changes affecting capital, liquidity, supervision, permissible activities, corporate governance and compensation, and changes in fiscal policy may have long-term effects on the business model and profitability of financial institutions that cannot now be foreseen.
Overdraft and Interchange Fees
The FRB's Regulation E imposes restrictions on banks' abilities to charge overdraft services and fees. The rule prohibits financial institutions from charging fees for paying overdrafts on ATM and one-time debit card transactions, unless a consumer consents, or opts in, to the overdraft service for those types of transactions. The Dodd-Frank Act, through a provision known as the Durbin Amendment, required the FRB to establish standards for interchange fees that are "reasonable and proportional" to the cost of processing the debit card transaction and imposes other requirements on card networks. Under the rule, the maximum permissible interchange fee that a bank may receive is the sum of $0.21 per transaction and five basis points multiplied by the value of the transaction, with an additional upward adjustment of no more than $0.01 per transaction if a bank develops and implements policies and procedures reasonably designed to achieve fraud-prevention standards set by regulation. The FRB's regulation is resulting in decreased revenues and increased compliance costs for the banking industry and the Bank, and there can be no assurance that alternative sources of revenues can be implemented to offset the impact of these developments.
11
Interest on Demand Deposits
On July 21, 2011, the FRB's final rule repealing Regulation Q's prohibition against the payment of interest on demand deposit accounts became effective. Over time, permitting the payment of interest on business checking accounts could have a significant impact on our commercial deposit business.
Sarbanes – Oxley Act
The Sarbanes-Oxley Act of 2002 ("Sarbanes-Oxley") implemented a broad range of corporate governance and accounting measures to increase corporate responsibility, to provide for enhanced penalties for accounting and auditing improprieties at publicly traded companies, and to protect investors by improving the accuracy and reliability of disclosures under federal securities laws. Among other things, Sarbanes-Oxley and its implementing regulations established new membership requirements and additional responsibilities for our audit committee, imposed restrictions on the relationship between us and our outside auditors (including restrictions on the types of non-audit services our auditors may provide to us), imposed additional responsibilities for our external financial statements on our chief executive officer and chief financial officer, expanded the disclosure requirements for our corporate insiders and contained new evaluation, auditing and reporting requirements relating to disclosure controls and procedures and our internal control over financial reporting.
Possible Future Legislation and Regulatory Initiatives
The recent economic and political environment has led to a number of proposed legislative, governmental and regulatory initiatives, described above, that may significantly impact our industry. These and other initiatives could significantly change the competitive and operating environment in which we and our subsidiaries operate. We cannot predict whether these or any other proposals will be enacted or the ultimate impact of any such initiatives on our operations, competitive situation, financial condition or results of operations.
Competition
In the past, an independent bank's principal competitors for deposits and loans have been other banks (particularly large financial institutions that have substantial capital, technology and marketing resources, which are well in excess of ours, although these larger institutions may be required to hold more regulatory capital and as a result, achieve lower returns on equity), savings and loan associations, and credit unions. For agricultural loans, the Bank also competes with constituent entities with the Federal Farm Credit System. To a lesser extent, competition is also provided by thrift and loans, mortgage brokerage companies and insurance companies. Other institutions, such as brokerage houses, mutual fund companies, credit card companies, and even retail establishments have offered new investment vehicles, which also compete with banks for deposit business. Additionally, technology has lowered barriers to entry and made it possible for non-banks to offer products and services traditionally provided by banks, such as automatic transfer and payment systems. We also experience competition, especially for deposits, from internet-based banking institutions and other financial companies, which do not always have a presence in our market footprint and have grown rapidly in recent years.
Current federal law has made it easier for out-of-state banks to enter and compete in the states in which we operate. Competition in our principal markets may further intensify as a result of the Dodd-Frank Act which, among other things, permits out-of-state de novo branching by national banks, state banks and foreign banks from other states. While the impact of these changes, and of other proposed changes, cannot be predicted with certainty, it is clear that the business of banking in California will remain highly competitive.
We also compete for deposits and loans with much larger financial institutions. Competition in our industry is likely to further intensify as a result of continued consolidation of financial services companies, including large consolidations of significance in our market area. In order to compete with major financial institutions and other competitors in its primary service areas, the Bank relies upon the experience of its executive and senior officers in serving business clients, and upon its specialized services, local promotional activities and the personal contacts made by its officers, directors and employees.
For customers whose loan demand exceeds the Bank's legal lending limit, the Bank may arrange for such loans on a participation basis with correspondent banks. The seasonal swings discussed earlier have, in the past, had some impact on the Bank's liquidity. The management of investment maturities, sale of loan participations, federal fund borrowings, qualification for funds under the Federal Reserve Bank's seasonal credit program, and the ability to sell mortgages in the secondary market is intended to allow the Bank to satisfactorily manage its liquidity.
12
ITEM 1A – RISK FACTORS
In addition to factors mentioned elsewhere in this Report, the factors contained below, among others, could cause our financial condition and results of operations to be materially and adversely affected. If this were to happen, the value of our common stock could decline, perhaps significantly, and you could lose all or part of your investment.
U.S. and global economies continue to experience significant challenges.
In the past decade, adverse financial developments have impacted the U.S. and global economies and financial markets and present challenges for the banking and financial services industry and for us. These developments include a general recession both globally and in the U.S. accompanied by substantial volatility in the financial markets.
In response, various significant economic and monetary stimulus measures were enacted by the U.S. Congress. The FRB also pursued a highly accommodative monetary policy aimed at keeping interest rates at historically low levels although the FRB has begun to modify certain aspects of this policy by gradually increasing short-term interest rates and reducing its balance sheet. U.S. economic activity has shown substantial improvement, but there can be no assurance that this progress will continue or will not reverse. If, notwithstanding the government's fiscal and monetary measures, the U.S. economy were to become subject to a recessionary condition for an extended period, this would present additional significant challenges for the U.S. banking and financial services industry and for us.
The Bank is Subject to Lending Risks of Loss and Repayment Associated with Commercial Banking Activities which could Adversely Affect the Bank's Financial Condition and Results of Operations
The Bank's business strategy is to focus on commercial business loans (which includes agricultural loans), construction loans, and commercial and multi-family real estate loans. The principal factors affecting the Bank's risk of loss in connection with commercial business loans include the borrower's ability to manage its business affairs and cash flows, general economic conditions and, with respect to agricultural loans, weather and climate conditions. In recent years, California has experienced severe drought conditions. While rainfall levels have improved considerably since 2015, there can be no assurance that the drought will not return with consequent difficulties for the California economy and our commercial loan customers, particularly in the agricultural sector. Loans secured by commercial real estate are generally larger and involve a greater degree of credit and transaction risk than residential mortgage (one to four family) loans. Because payments on loans secured by commercial and multi-family real estate properties are often dependent on successful operation or management of the underlying properties, repayment of such loans may be dependent on factors other than the prevailing conditions in the real estate market or the economy. Real estate construction financing is generally considered to involve a higher degree of credit risk than long-term financing on improved, owner-occupied real estate. Risk of loss on a construction loan is dependent largely upon the accuracy of the initial estimate of the property's value at completion of construction or development compared to the estimated cost (including interest) of construction. If the estimate of value proves to be inaccurate, the Bank may be confronted with a project which, when completed, has a value which is insufficient to assure full repayment of the construction loan.
Although the Bank manages lending risks through its underwriting and credit administration policies, no assurance can be given that such risks will not materialize, in which event, the Company's financial condition, results of operations, cash flows, and business prospects could be materially adversely affected.
Increases in the Allowance for Loan Losses Would Adversely Affect the Bank's Financial Condition and Results of Operations
The Bank's allowance for estimated losses on loans was approximately $11.1 million, or 1.49% of total loans, at December 31, 2017, compared to $10.9 million, or 1.60% of total loans, at December 31, 2016, and 300.1% of total non-performing loans net of guaranteed portions at December 31, 2017, compared to 258.5% of total non-performing loans, net of guaranteed portions at December 31, 2016. Material future additions to the allowance for estimated losses on loans may be necessary if material adverse changes in economic conditions occur and the performance of the Bank's loan portfolio deteriorates. In addition, an allowance for losses on other real estate owned may also be required in order to reflect changes in the markets for real estate in which the Bank's other real estate owned is located and other factors which may result in adjustments which are necessary to ensure that the Bank's foreclosed assets are carried at the lower of cost or fair value, less estimated costs to dispose of the properties. Moreover, the FDIC and the DBO, as an integral part of their examination process, periodically review the Bank's allowance for estimated losses on loans and the carrying value of its assets. Increases in the provisions for estimated losses on loans and foreclosed assets would adversely affect the Bank's financial condition and results of operations. See "Management's Discussion and Analysis of Financial Condition and Results of Operations - Summary of Loan Loss Experience" below.
13
The Bank's Dependence on Real Estate Lending Increases Our Risk of Losses
At December 31, 2017, approximately 75% of the Bank's loans in principal amount (excluding loans held-for-sale) were secured by real estate. The value of the Bank's real estate collateral has been, and could in the future continue to be, adversely affected by the economic recession and resulting adverse impact on the real estate market in Northern California.
The Bank's primary lending focus has historically been commercial (including agricultural), construction, and real estate mortgage. At December 31, 2017, real estate mortgage (excluding loans held-for-sale) and construction loans (residential and other) comprised approximately 71% and 4%, respectively, of the total loans in the Bank's portfolio. At December 31, 2017, all of the Bank's real estate mortgage and construction loans and approximately 2% of its commercial loans were secured fully or in part by deeds of trust on underlying real estate. The Company's dependence on real estate increases the risk of loss in both the Bank's loan portfolio and its holdings of other real estate owned if economic conditions in Northern California deteriorate in the future. Deterioration of the real estate market in Northern California would have a material adverse effect on the Company's business, financial condition, and results of operations.
The CFPB has adopted various regulations which have impacted, and will continue to impact, our residential mortgage lending business. For additional information, see "Business – Certain CFPB Rules" in Item 1 of this Report on Form 10-K.
See "U.S. and global economies continue to experience significant challenges" above, and "Adverse California Economic Conditions Could Adversely Affect the Bank's Business" below.
Adverse economic factors affecting certain industries the Bank serves could adversely affect our business.
We are subject to certain industry specific economic factors. For example, a portion of the Bank's total loan portfolio is related to residential and commercial real estate, especially in California. Increases in residential mortgage loan interest rates could have an adverse effect on the Bank's operations by depressing new mortgage loan originations, which in turn could negatively impact the Bank's title and escrow deposit levels. Additionally, a further downturn in the residential real estate and housing industries in California could have an adverse effect on the Bank's operations and the quality of its real estate and construction loan portfolio. Although the Bank does not engage in subprime or negative amortization lending, effects of recent subprime market challenges, combined with the ongoing challenges in the U.S. and California real estate markets, could result in further price reductions in single family home prices and a lack of liquidity in refinancing markets. These factors could adversely impact the quality of the Bank's residential construction, residential mortgage and construction related commercial portfolios in various ways, including by decreasing the value of the collateral for our loans. These factors could also negatively affect the economy in general and thereby the Bank's overall loan portfolio.
The Bank provides financing to, and receives deposits from, businesses in a number of other industries that may be particularly vulnerable to industry-specific economic factors, including the home building, commercial real estate, retail, agricultural, industrial, and commercial industries. The home building industry in California has been especially adversely impacted by the deterioration in residential real estate markets, which has lead the Bank to take additional provisions and charge-offs against credit losses in this portfolio. Continued increases in fuel prices and energy costs and the continuation of the drought in California could adversely affect businesses in several of these industries. Recent wildfires across California and in our market area have resulted in significant damage and destruction of property and equipment. The fire damage caused may result in adverse economic impacts to those affected markets and beyond. Industry specific risks are beyond the Bank's control and could adversely affect the Bank's portfolio of loans, potentially resulting in an increase in non-performing loans or charge-offs and a slowing of growth or reduction in our loan portfolio.
The effects of changes or increases in, or supervisory enforcement of, banking or other laws and regulations or governmental fiscal or monetary policies could adversely affect us.
We are subject to significant federal and state banking regulation and supervision, which is primarily for the benefit and protection of our customers and the Deposit Insurance Fund and not for the benefit of investors in our securities. In the past, our business has been materially affected by these regulations. This will continue and likely intensify in the future. Laws, regulations or policies, including accounting standards and interpretations, currently affecting us may change at any time. Regulatory authorities may also change their interpretation of and intensify their examination of compliance with these statutes and regulations. Therefore, our business may be adversely affected by changes in laws, regulations, policies or interpretations or regulatory approaches to compliance and enforcement, as well as by supervisory action or criminal proceedings taken as a result of noncompliance, which could result in the imposition of significant civil money penalties or fines. Changes in laws and regulations may also increase our expenses by imposing additional supervision, fees, taxes or restrictions on our operations. Compliance with laws and regulations, especially new laws and regulations, increases our operating expenses and may divert management attention from our business operations.
14
On July 21, 2010, President Obama signed into law the Dodd-Frank Act. This important legislation has affected U.S. financial institutions in many ways, some of which have increased, or may increase in the future, the cost of doing business and present other challenges to the financial services industry. Many provisions of the law have been implemented by rules and regulations of the federal banking agencies, but certain provisions of the law are yet to be implemented by the federal banking agencies and therefore the full scope and impact of the law on banking institutions generally and on our business cannot be fully determined at this time. The law contains many provisions that may have particular relevance to the business of the Bank. While the full effect of these provisions of the Dodd-Frank Act on the Bank cannot be predicted at this time, they have resulted in adjustments to our FDIC deposit insurance premiums, and can be expected to result in increased capital and liquidity requirements, increased supervision, increased regulatory and compliance risks and costs and other operational costs and expenses, reduced fee-based revenues and restrictions on some aspects of our operations, as well as increased interest expense on our demand deposits, some or all of which may be material.
Proposals to reform the housing finance market in the U.S. could also significantly affect our business. These proposals, among other things, consider reducing or eliminating over time the role of the GSEs in guaranteeing mortgages and providing funding for mortgage loans, as well as the implementation of reforms relating to borrowers, lenders, and investors in the mortgage market, including reducing the maximum size of a loan that the GSEs can guarantee, phasing in a minimum down payment requirement for borrowers, improving underwriting standards, and increasing accountability and transparency in the securitization process.
While the specific nature of these reforms and their impact on the financial services industry in general, and on the Bank in particular, is uncertain at this time, such reforms, if enacted, are likely to have a substantial impact on the mortgage market and could potentially reduce our income from mortgage originations by increasing mortgage costs or lowering originations. The GSE reforms could also reduce real estate prices, which could reduce the value of collateral securing outstanding mortgage loans. This reduction of collateral value could negatively impact the value or perceived collectability of these mortgage loans and may increase our allowance for loan losses. Such reforms may also include changes to the Federal Home Loan Bank System, which could adversely affect a significant source of term funding for lending activities by the banking industry, including the Bank. These reforms may also result in higher interest rates on residential mortgage loans, thereby reducing demand, which could have an adverse impact on our residential mortgage lending business.
In July 2013, the FRB and the other U.S. federal banking agencies adopted final rules making significant changes to the U.S. regulatory capital framework for U.S. banking organizations. For additional information, see "Business-Capital Standards" in Item 1 of this Form 10-K.
We maintain systems and procedures designed to comply with applicable laws and regulations. However, some legal/regulatory frameworks provide for the imposition of criminal or civil penalties (which can be substantial) for noncompliance. In some cases, liability may attach even if the noncompliance was inadvertent or unintentional and even if compliance systems and procedures were in place at the time. There may be other negative consequences from a finding of noncompliance, including restrictions on certain activities and damage to our reputation.
Additionally, our business is affected significantly by the fiscal and monetary policies of the U.S. federal government and its agencies. We are particularly affected by the policies of the FRB, which regulates the supply of money and credit in the U.S. Under the Dodd-Frank Act and a long-standing policy of the FRB, a bank holding company is expected to act as a source of financial and managerial strength for its subsidiary banks. As a result of that policy, we may be required to commit financial and other resources to our subsidiary bank in circumstances where we might not otherwise do so. Among the instruments of monetary policy available to the FRB are (a) conducting open market operations in U.S. Government securities, (b) changing the discount rates on borrowings by depository institutions and the federal funds rate, and (c) imposing or changing reserve requirements against certain borrowings by banks and their affiliates. These methods are used in varying degrees and combinations to directly affect the availability of bank loans and deposits, as well as the interest rates charged on loans and paid on deposits. The policies of the FRB may have a material effect on our business, prospects, results of operations and financial condition.
Refer to "Business – Supervision and Regulation of Bank Holding Companies" and "Business – Supervision and Regulation of the Bank" in Item 1 of this Form 10-K for discussion of certain existing and proposed laws and regulations that may affect our business.
Adverse California Economic Conditions Could Adversely Affect the Bank's Business
The Bank's operations and a substantial majority of the Bank's assets and deposits are generated and concentrated primarily in Northern California, particularly the counties of Placer, Sacramento, Solano and Yolo, and are likely to remain so for the foreseeable future. At December 31, 2017, approximately 75% of the Bank's loan portfolio in principal amount (excluding loans held-for-sale) consisted of real estate-related loans, all of which were secured by collateral located in Northern California. As a result, a downturn in the economic conditions in Northern California may cause the Bank to incur losses associated with high default rates and decreased collateral values in its loan portfolio. Economic conditions in California are subject to various uncertainties including deterioration in the California real estate market and housing industry.
15
At times, economic conditions in California, and especially the regional markets we serve, have been subject to various challenges, including significant deterioration in the residential real estate sector and the California state government's budgetary and fiscal difficulties. While California home prices and the California economy in general have experienced a recovery in recent years, there can be no assurance that the recovery will continue. Recent growth in home prices in some California markets may be unsustainable relative to market fundamentals, and home price declines may occur.
In addition, until 2013, the State government of California experienced budget shortfalls or deficits that led to protracted negotiations between the Governor and the State Legislature over how to address the budget gap. The California electorate approved, in the 2012 general elections, certain increases in the rate of income taxation in California. However, there can be no assurance that the state's fiscal and budgetary challenges will not recur. In addition, the impact of increased rates of income taxation on the level of economic activity in California cannot be predicted at this time.
Also, municipalities and other governmental units within California have been experiencing budgetary difficulties, and several California municipalities have filed for protection under the Bankruptcy Code. As a result, concerns also have arisen regarding the outlook for the State of California's governmental obligations, as well as those of California municipalities and other governmental units.
Poor economic conditions in California, and especially the regional markets we serve, will cause us to incur losses associated with higher default rates and decreased collateral values in our loan portfolio. If the budgetary and fiscal difficulties of the California State government and California municipalities and other governmental units were to recur or economic conditions in California decline, we expect that our level of problem assets will increase and our prospects for growth will be impaired.
The Bank is Subject to Interest Rate Risk
The income of the Bank depends to a great extent on "interest rate differentials" and the resulting net interest margins (i.e., the difference between the interest rates earned on the Bank's interest-earning assets such as loans and investment securities, and the interest rates paid on the Bank's interest-bearing liabilities such as deposits and borrowings). These rates are highly sensitive to many factors, which are beyond the Bank's control, including, but not limited to, general economic conditions and the policies of various governmental and regulatory agencies, in particular, the FRB. The Bank is generally adversely affected by declining interest rates. In response to the financial crisis which began in 2008 and the ensuing recession, the FRB has pursued a variety of monetary measures aimed at sustaining a very low interest rate environment in the U.S. in order to stimulate economic growth, including purchases of long-term U.S. Treasury and federal agency backed securities and maintaining a very low target range for the federal funds rate. These policies of the FRB placed a downward pressure on the net interest margins of banks in the United States, including that of the Bank. In December 2016, the FRB raised the target range for the federal funds rate to 0.50% to 0.75%. In 2017, the FRB raised the federal funds rate by 25 bps three times in March, June, and December. In December 2017, the target range for the federal funds rate was 1.25% to 1.50%. The FRB also began to reduce its balance sheet. The FRB expects that economic conditions will evolve in a manner that will warrant gradual increases in the federal funds rate; the federal funds rate is likely to remain, for some time, below levels that are expected to prevail in the longer run. However, the actual path of the federal funds rate will depend on the economic outlook as informed by incoming data. We cannot predict with any certainty the degree to which the FRB will continue its accommodative monetary policies, nor the timing of further easing of these policies. Changes in the relationship between short-term and long-term market interest rates or between different interest rate indices can also impact our interest rate differential, possibly resulting in a decrease in our interest income relative to interest expense. In addition, changes in monetary policy, including changes in interest rates, influence the origination of loans, the purchase of investments and the generation of deposits and affect the rates received on loans and investment securities and paid on deposits, which could have a material adverse effect on the Company's business, financial condition, and results of operations. See Part II, Item 7A "Quantitative and Qualitative Disclosures about Market Risk."
Our Ability to Pay Dividends is Subject to Legal Restrictions
As a bank holding company, our cash flow typically comes from dividends of the Bank. Various statutory and regulatory provisions restrict the amount of dividends the Bank can pay to the Company without regulatory approval. The ability of the Company to pay cash dividends in the future also depends on the Company's profitability, growth, and capital needs. In addition, California law restricts the ability of the Company to pay dividends. No assurance can be given that the Company will pay any dividends in the future or, if paid, such dividends will not be discontinued. See "Business - Restrictions on Dividends and Other Distributions" above.
Competition Adversely Affects our Profitability
In California generally, and in the Bank's primary market area specifically, major banks dominate the commercial banking industry. By virtue of their larger capital bases, such institutions have substantially greater lending limits than those of the Bank. Competition is likely to further intensify as a result of recent adverse economic and financial market conditions which have led to increased consolidation of financial services companies, including large consolidations of significance in our market area. In obtaining deposits and making loans, the Bank competes with these larger commercial banks and other financial institutions, such as savings and loan associations, credit unions and member institutions of the Farm Credit System, which offer many services that traditionally were offered only by banks. Using the financial holding company structure, insurance companies, and securities firms may compete more directly with banks and bank holding companies. In addition, the Bank competes with other institutions such as mutual fund companies, brokerage firms, and even retail stores seeking to penetrate the financial services market. Current federal law has also made it easier for out-of-state banks to enter and compete in the states in which we operate. Competition in our principal markets may further intensify as a result of the Dodd-Frank Act which, among other things, permits out-of-state de novo branching by national banks, state banks and foreign banks from other states. Also, technology and other changes increasingly allow parties to complete financial transactions electronically, and in many cases, without banks. For example, consumers can pay bills and transfer funds over the internet and by telephone without banks. Non-bank financial service providers may have lower overhead costs and are subject to fewer regulatory constraints. If consumers do not use banks to complete their financial transactions, we could potentially lose fee income, deposits and income generated from those deposits. During periods of declining interest rates, competitors with lower costs of capital may solicit the Bank's customers to refinance their loans. Furthermore, during periods of economic slowdown or recession, the Bank's borrowers may face financial difficulties and be more receptive to offers from the Bank's competitors to refinance their loans. No assurance can be given that the Bank will be able to compete with these lenders. See "Business - Competition" above.
16
Government Regulation and Legislation Could Adversely Affect the Company
The Company and the Bank are subject to extensive state and federal regulation, supervision, and legislation, which govern almost all aspects of the operations of the Company and the Bank. The business of the Bank is particularly susceptible to being affected by the enactment of federal and state legislation, which may have the effect of increasing the cost of doing business, modifying permissible activities, or enhancing the competitive position of other financial institutions. Such laws are subject to change from time to time and are primarily intended for the protection of consumers, depositors and the Deposit Insurance Fund and not for the benefit of shareholders of the Company. Regulatory authorities may also change their interpretation of these laws and regulations. The Company cannot predict what effect any presently contemplated or future changes in the laws or regulations or their interpretations would have on the business and prospects of the Company, but it could be material and adverse. See "Business – Supervision and Regulation of the Bank" and "The effects of changes or increases in, or supervisory enforcement of, banking or other laws and regulations or governmental fiscal or monetary policies could adversely affect us" above.
We maintain systems and procedures designed to comply with applicable laws and regulations. However, some legal/regulatory frameworks provide for the imposition of criminal or civil penalties (which can be substantial) for non-compliance. In some cases, liability may attach even if the non-compliance was inadvertent or unintentional and even if compliance systems and procedures were in place at the time. There may be other negative consequences from a finding of non-compliance, including restrictions on certain activities and damage to the Company's reputation.
Our Controls and Procedures May Fail or be Circumvented Which Could Have a Material Adverse Effect on the Company's Financial Condition or Results of Operations
The Company maintains controls and procedures to mitigate against risks such as processing system failures and errors, and customer or employee fraud, and maintains insurance coverage for certain of these risks. Any system of controls and procedures, however well designed and operated, is based in part on certain assumptions and can provide only reasonable, not absolute, assurances that the objectives of the system are met. Events could occur which are not prevented or detected by the Company's internal controls or are not insured against or are in excess of the Company's insurance limits. Any failure or circumvention of the Company's controls and procedures or failure to comply with regulations related to controls and procedures could have a material adverse effect on the Company's business, results of operations and financial condition.
Changes in Deposit Insurance Premiums Could Adversely Affect Our Business
As discussed above in Part I under the caption "Business – Premiums for Deposit Insurance," the FDIC adopted a comprehensive, long-range "restoration" plan for the Deposit Insurance Fund to ensure that the ratio of the fund's reserves to insured deposits reaches 1.35 percent by 2020, as required by the Dodd-Frank Act. The FDIC could further increase deposit premiums or impose special assessments in the future. Any further increases in the deposit insurance assessments the Bank pays would further increase our costs.
Negative Public Opinion Could Damage Our Reputation and Adversely Affect Our Earnings
Reputational risk, or the risk to our earnings and capital from negative public opinion, is inherent in our business. Negative public opinion can result from the actual or perceived manner in which we conduct our business activities, management of actual or potential conflicts of interest and ethical issues, and our protection of confidential client information. Negative public opinion can adversely affect our ability to keep and attract customers and employees and can expose us to litigation and regulatory action. We take steps to minimize reputation risk in the way we conduct our business activities and deal with our clients and communities.
17
We may not be able to hire or retain additional qualified personnel and recruiting and compensation costs may increase as a result of turnover, both of which may increase costs and reduce profitability and may adversely impact our ability to implement our business strategy.
Our success depends upon the ability to attract and retain highly motivated, well-qualified personnel. We face significant competition in the recruitment of qualified employees. Executive compensation in the financial services sector has been controversial and the subject of regulation. The FDIC has proposed rules which would increase deposit premiums for institutions with compensation practices deemed to increase risk to the institution. Over time, this guidance and the proposed rules, upon their adoption, could have the effect of making it more difficult for banks to attract and retain skilled personnel.
The Continuing War on Terrorism and Foreign Hostilities Could Adversely Affect U.S. and Global Economic Conditions
Acts or threats of terrorism and actions taken by the U.S. or other governments as a result of such acts or threats and other international hostilities may result in a disruption of U.S. economic and financial conditions and could adversely affect business, economic and financial conditions in the U.S. generally and in our principal markets. Continued foreign hostilities have also generated various political and economic uncertainties affecting the global and U.S. economies.
Changes in Accounting Standards Could Materially Impact Our Financial Statements
The Company's consolidated financial statements are presented in accordance with accounting principles generally accepted in the United States of America, called GAAP. The financial information contained within our consolidated financial statements is, to a significant extent, financial information that is based on approximate measures of the financial effects of transactions and events that have already occurred. A variety of factors could affect the ultimate value that is obtained either when earning income, recognizing an expense, recovering an asset or relieving a liability. Along with other factors, we use historical loss factors to determine the inherent loss that may be present in our loan portfolio. Actual losses could differ significantly from the historical loss factors that we use. Other estimates that we use are fair value of our securities and expected useful lives of our depreciable assets. We have not entered into derivative contracts for our customers or for ourselves, which relate to interest rate, credit, equity, commodity, energy, or weather-related indices. GAAP itself may change from one previously acceptable method to another method. Although the economics of our transactions would be the same, the timing of events that would impact our transactions could change. Accounting standards and interpretations currently affecting the Company and its subsidiaries may change at any time, and the Company's financial condition and results of operations may be adversely affected. In some cases, we could be required to apply a new or revised standard retroactively, resulting in our restating prior period financial statements.
There is a Limited Public Market for the Company's Common Stock Which May Make It Difficult for Shareholders to Dispose of Their Shares
The Company's common stock is not listed on any exchange. However, trades may be reported on the OTC Markets under the symbol "FNRN". The Company is aware that Howe Barnes Hoefer & Arnett, Stone & Youngberg, Wedbush Securities, and Monroe Securities, Inc., all currently make a market in the Company's common stock. Management is aware that there are also private transactions in the Company's common stock. However, the limited trading market for the Company's common stock may make it difficult for shareholders to dispose of their shares. Also, the price of the Company's common stock may be affected by general market price movements as well as developments specifically related to the financial services sector, including interest rate movements, quarterly variations, or changes in financial estimates by securities analysts and a significant reduction in the price of the stock of another participant in the financial services industry.
Advances and Changes in Technology, and the Company's Ability to Adapt Its Technology, could Impact Its Ability to Compete and Its Business and Operations
Advances and changes in technology can significantly impact the business and operations of the Company. The Company faces many challenges including the increased demand for providing computer access to Bank accounts and the systems to perform banking transactions electronically. The Company's merchant processing services require the use of advanced computer hardware and software technology and rapidly changing customer and regulatory requirements. The Company's ability to compete effectively depends on its ability to continue to adapt its technology on a timely and cost-effective basis to meet these requirements. In addition, the Company's business and operations are susceptible to negative impacts from computer system failures, communication and energy disruption, and unethical individuals with the technological ability to cause disruptions or failures of the Company's data processing systems.
18
Information Security Breaches or other technological difficulties could adversely affect the Company
Our operations rely on the secure processing, storage, transmission and reporting of personal, confidential and other sensitive information in our computer systems, networks and business applications. Although we take protective measures, our computer systems may be vulnerable to breaches, unauthorized access, misuse, computer viruses or other malicious code, and other events that could have significant negative consequences to us. Such events could result in interruptions or malfunctions in our or our customers' operations, interception, misuse or mishandling of personal or confidential information, or processing of unauthorized transactions or loss of funds. These events could result in litigation and financial losses that are either not insured against or not fully covered by our insurance, regulatory consequences or reputational harm, any of which could harm our competitive position, operating results and financial condition. These types of incidents can remain undetected for extended periods of time, thereby increasing the associated risks. We may also be required to expend significant resources to modify our protective measures or to investigate and remediate vulnerabilities or exposures arising from cybersecurity risks.
We depend on the continued efficacy of our technical systems, operational infrastructure, relationships with third parties and our employees in our day-to-day and ongoing operations. Our dependence upon automated systems to record and process transactions may further increase the risk that technical system flaws or employee tampering or manipulation of those systems will result in losses that are difficult to detect. With regard to the physical infrastructure that supports our operations, we have taken measures to implement backup systems and other safeguards, but our ability to conduct business may be adversely affected by any disruption to that infrastructure. Failures in our internal control or operational systems, security breaches or service interruptions could impair our ability to operate our business and result in potential liability to customers, reputational damage and regulatory intervention, any of which could harm our operating results and financial condition.
We may also be subject to disruptions of our operating systems arising from other events that are wholly or partially beyond our control, such as electrical, internet or telecommunications outages or unexpected difficulties with the implementation of our technology enhancement projects, which may give rise to disruption of service to customers and to financial loss or liability. Our business recovery plan may not work as intended or may not prevent significant interruptions of our operations.
In recent years, it has been reported that several of the larger U.S. banking institutions have been the target of cyberattacks that have, for limited periods, resulted in the disruption of various operations of the targeted banks. While we have a variety of cyber-security measures in place, the consequences to our business, if we were to become a target of such attacks, cannot be predicted with any certainty.
In addition, there have been increasing efforts on the part of third parties to breach data security at financial institutions or with respect to financial transactions, including through the use of social engineering schemes such as "phishing." The ability of our customers to bank remotely, including online and though mobile devices, requires secure transmission of confidential information and increases the risk of data security breaches.
Under the applicable Federal regulatory guidance, financial institutions should design multiple layers of security controls to establish lines of defense and to ensure that their risk management processes also address the risk posed by compromised customer credentials, including security measures to reliably authenticate customers accessing internet-based services of the financial institution. The other statement indicates that a financial institution's management is expected to maintain sufficient business continuity planning processes to ensure the rapid recovery, resumption and maintenance of the institution's operations after a cyber-attack involving destructive malware. A financial institution is also expected to develop appropriate processes that enable recovery of data and business operations and that address rebuilding network capabilities and restoring data if the institution or its critical service providers fall victim to this type of cyber-attack. While we do not believe that these statements contain any new regulatory expectations, they do indicate that the regulators regard cyber-security to be a matter of great importance for U.S. financial institutions. A financial institution which fails to observe the regulatory guidance could be subject to various regulatory sanctions, including financial sanctions.
In July of 2015, the Federal bank regulators announced the issuance of a cybersecurity assessment tool, the output of which can assist a financial institution's senior management and board of directors in assessing the institution's cybersecurity risk and preparedness. The first part of the assessment tool is the inherent risk profile, which aims to assist management in determining an institution's level of cybersecurity risk. The second part of the assessment tool is cybersecurity maturity, which is designed to help management assess whether their controls provide the desired level of preparedness. The Federal bank regulators plan to utilize the assessment tool as part of their examination process when evaluating financial institutions' cybersecurity preparedness in information technology and safety and soundness examinations and inspections. Failure to effectively utilize this tool would result in regulatory criticism. Significant resources may be required to adequately implement the tool and address any assessment concerns regarding preparedness. Management has conducted cyber-security assessments using this tool and expects to perform additional periodic assessments to facilitate the identification and remediation of any concerns regarding our cyber-security preparedness.
19
Even if cyber-attacks and similar tactics are not directed specifically at the Bank, such attacks on other large financial institutions could disrupt the overall functioning of the financial system and undermine consumer confidence in banks generally, to the detriment of other financial institutions, including the Bank. A data security breach at a large U.S. retailer resulted in the compromise of data related to credit and debit cards of large numbers of customers requiring many banks, including the Bank, to reissue credit and debit cards for affected customers and reimburse these customers for losses sustained.
We maintain an insurance policy which we believe provides sufficient coverage at a manageable expense for an institution of our size and scope with similar technological systems. However, we cannot assure that this policy would be sufficient to cover all financial losses, damages, penalties, including lost revenues, should we experience any one or more of our or a third-party's systems failing or experiencing attack.
Environmental Hazards Could Have a Material Adverse Effect on the Company's Business, Financial Condition and Results of Operations
The Company, in its ordinary course of business, acquires real property securing loans that are in default, and there is a risk that hazardous substances or waste, contaminants or pollutants could exist on such properties. The Company may be required to remove or remediate such substances from the affected properties at its expense, and the cost of such removal or remediation may substantially exceed the value of the affected properties or the loans secured by such properties. Furthermore, the Company may not have adequate remedies against the prior owners or other responsible parties to recover its costs. Finally, the Company may find it difficult or impossible to sell the affected properties either prior to or following any such removal. In addition, the Company may be considered liable for environmental liabilities in connection with its borrowers' properties, if, among other things, it participates in the management of its borrowers' operations. The occurrence of such an event could have a material adverse effect on the Company's business, financial condition, results of operations and cash flows.
The Company may not be successful in raising additional capital needed in the future
If additional capital is needed in the future as a result of losses, our business strategy or regulatory requirements, there is no assurance that our efforts to raise such additional capital will be successful or that shares sold in the future will be sold at prices or on terms equal to or better than the current market price. The inability to raise additional capital when needed or at prices and terms acceptable to us could adversely affect our ability to implement our business strategies.
In the future the Company may be required to recognize impairment with respect to investment securities which may adversely affect our Results of Operations
The Company's securities portfolio currently includes securities with unrecognized losses. The Company may continue to observe declines in the fair market value of these securities. Management evaluates the securities portfolio for any other-than-temporary impairment each reporting period, as required by generally accepted accounting principles. There can be no assurance, however, that future evaluations of the securities portfolio will not require us to recognize impairment charges with respect to these and other holdings.
The Changes in the U.S. tax laws which generally became effective on January 1, 2018, will have both positive and negative effects on our business and results of operations.
On December 22, 2017, President Trump signed into law the Tax Cuts and Jobs Act ("TCJA") which made sweeping changes to the U.S. federal tax laws generally effective as of January 1, 2018. Certain of these changes will have positive effects on our business and results of operations and others will have negative effects. The TCJA reduces the corporate tax rate to 21 percent from 35 percent which we expect will result in a net reduction in our annual income tax expense and which should also benefit many of our corporate and other small business borrowers. However, our ability to utilize tax credits, such as those arising from low-income housing and alternative energy investments may be constrained by the lower tax rate. Also, the new law required us to re-measure the value of our deferred tax asset resulting in a reduction of the value of such asset by $1.4 million or $0.14 per diluted share. The new law also led to new accounting pronouncement which caused us to reclassify $599,000 from retained earnings to other comprehensive income, thus reducing regulatory capital. For additional information, see "Management's Discussion and Analysis of Financial Condition and Results of Operations – Impact of Recently Issued Accounting Standards" and "Income Taxes."
20
ITEM 1B – UNRESOLVED STAFF COMMENTS
Not applicable.
ITEM 2 – PROPERTIES
The Company and the Bank are engaged in the banking business through fourteen offices in five counties in Northern California operating out of three offices in Solano County, six in Yolo County, two in Sacramento County, two in Placer County, and one in Contra Costa County. In addition, the Company owns four vacant lots, three in northern Solano County and one in eastern Sacramento County, for possible future bank sites.
The Bank owns three branch office locations and two administrative facilities and leases ten facilities. Most of the leases contain multiple renewal options and provisions for rental increases, principally for changes in the cost of living index, property taxes and maintenance.
See Item 1 "Business - General" in this report for more information regarding our properties.
ITEM 3 - LEGAL PROCEEDINGS
Neither the Company nor the Bank is a party to any material pending legal proceeding, nor is any of its property the subject of any material pending legal proceeding, except ordinary routine litigation arising in the ordinary course of the Bank's business and incidental to its business, none of which is expected to have a material adverse impact upon the Company's or the Bank's business, financial position or results of operations.
ITEM 4 – MINE SAFETY DISCLOSURES
Not applicable.
21
PART II
ITEM 5 - MARKET FOR REGISTRANT'S COMMON EQUITY, RELATED STOCKHOLDER MATTERS AND ISSUER PURCHASES OF EQUITY SECURITIES
The Company's common stock is not listed on any exchange. However, trades may be reported on the OTC Markets under the symbol "FNRN". The Company is aware that Howe Barnes Hoefer & Arnett, Stone & Youngberg, Wedbush Securities, and Monroe Securities, Inc., all currently make a market in the Company's common stock. Management is aware that there are also private transactions in the Company's common stock, and the data set forth below may not reflect all such transactions.
The following table summarizes the range of reported high and low bid quotations of the Company's Common Stock for each quarter during the last two fiscal years and is based on information provided by Stone & Youngberg. The quotations reflect the price that would be received by the seller without retail mark-up, mark-down or commissions and may not have represented actual transactions:
|
QUARTER/YEAR
|
HIGH*
|
LOW*
|
||||||
|
4th Quarter 2017
|
$
|
12.79
|
$
|
11.63
|
||||
|
3rd Quarter 2017
|
$
|
11.68
|
$
|
11.44
|
||||
|
2nd Quarter 2017
|
$
|
11.73
|
$
|
11.20
|
||||
|
1st Quarter 2017
|
$
|
11.96
|
$
|
9.23
|
||||
|
4th Quarter 2016
|
$
|
8.97
|
$
|
7.44
|
||||
|
3rd Quarter 2016
|
$
|
7.53
|
$
|
7.27
|
||||
|
2nd Quarter 2016
|
$
|
7.34
|
$
|
7.10
|
||||
|
1st Quarter 2016
|
$
|
7.61
|
$
|
7.10
|
||||
* Price adjusted for stock dividends in the indicated periods for the 4% stock dividends payable March 29, 2018 and March 31, 2017, as described below.
As of March 1, 2018, there were approximately 1,354 holders of record of the Company's common stock, no par value.
In the last two fiscal years the Company has declared the following stock dividends:
|
Shareholder Record Date
|
|
Dividend Percentage
|
|
Date Payable
|
|
February 29, 2016
|
4%
|
March 31, 2016
|
||
|
February 28, 2017
|
|
4%
|
|
March 31, 2017
|
|
February 28, 2018
|
|
4%
|
|
March 29, 2018
|
The Company does not expect to pay a cash dividend in the foreseeable future. Our ability to declare and pay dividends is affected by certain regulatory restrictions. See "Business – Restrictions on Dividends and Other Distributions" above. The Company made no repurchases of common stock in the twelve months ended December 31, 2017.
For information regarding securities authorized for issuance under equity compensation plans, see Part III, Item 12 of this report on Form 10-K.
22
Stock performance
The following chart compares the cumulative return on the Company's stock during the five years ended December 31, 2017 with the cumulative return on the S&P 500 composite stock index, SNL Micro Cap U.S. Bank Index and KBW Nasdaq Bank Index. The comparison assumes $100 invested in each on December 31, 2012 and reinvestment of all dividends.
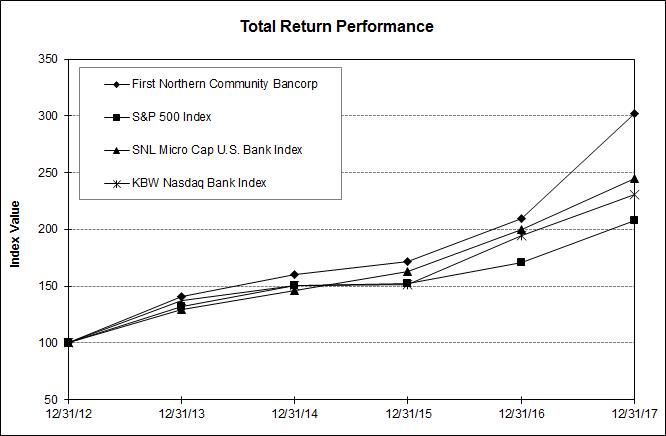
|
|
Period Ending
|
|||||
|
Index
|
12/31/12
|
12/31/13
|
12/31/14
|
12/31/15
|
12/31/16
|
12/31/17
|
|
First Northern Community Bancorp
|
100.00
|
141.23
|
160.01
|
172.09
|
209.78
|
302.26
|
|
S&P 500 Index
|
100.00
|
132.39
|
150.51
|
152.59
|
170.84
|
208.14
|
|
SNL Micro Cap U.S. Bank Index
|
100.00
|
129.02
|
146.32
|
162.71
|
200.04
|
244.72
|
|
KBW Nasdaq Bank Index
|
100.00
|
137.75
|
150.65
|
151.39
|
194.56
|
230.73
|
|
Source: S&P Global Market Intelligence
|
|
|||||
|
© 2017
|
||||||
23
ITEM 6 - SELECTED FINANCIAL DATA
The selected consolidated financial data below have been derived from the Company's audited consolidated financial statements. The selected consolidated financial data set forth below as of December 31, 2014, and 2013 have been derived from the Company's historical consolidated financial statements not included in this Report. The financial information for 2017, 2016, and 2015 should be read in conjunction with "Management's Discussion and Analysis of Financial Condition and Results of Operations," which is in Part II (Item 7) of this Report and with the Company's audited consolidated financial statements and the notes thereto, which are included in Part II (Item 8) of this Report.
Consolidated Financial Data as of and for the years ended December 31,
(in thousands, except share and per share amounts)
|
|
2017
|
2016
|
2015
|
2014
|
2013
|
|||||||||||||||
|
|
||||||||||||||||||||
|
Interest and Dividend Income
|
$
|
40,017
|
$
|
35,967
|
$
|
31,440
|
$
|
29,585
|
$
|
27,537
|
||||||||||
|
Interest Expense
|
(1,079
|
)
|
(1,157
|
)
|
(1,154
|
)
|
(1,291
|
)
|
(1,265
|
)
|
||||||||||
|
Net Interest Income
|
38,938
|
34,810
|
30,286
|
28,294
|
26,272
|
|||||||||||||||
|
Provision for Loan Losses
|
(600
|
)
|
(1,800
|
)
|
(650
|
)
|
(1,800
|
)
|
(1,200
|
)
|
||||||||||
|
Net Interest Income after Provision for Loan Losses
|
38,338
|
33,010
|
29,636
|
26,494
|
25,072
|
|||||||||||||||
|
Non-Interest Income
|
8,128
|
7,278
|
7,596
|
7,480
|
9,300
|
|||||||||||||||
|
Non-Interest Expense
|
(29,400
|
)
|
(27,352
|
)
|
(26,571
|
)
|
(25,314
|
)
|
(26,134
|
)
|
||||||||||
|
Income before Taxes
|
17,066
|
12,936
|
10,661
|
8,660
|
8,238
|
|||||||||||||||
|
Provision for Taxes
|
(8,318
|
)
|
(4,885
|
)
|
(3,740
|
)
|
(2,790
|
)
|
(2,854
|
)
|
||||||||||
|
Net Income
|
$
|
8,748
|
$
|
8,051
|
$
|
6,921
|
$
|
5,870
|
$
|
5,384
|
||||||||||
|
|
||||||||||||||||||||
|
Preferred Stock Dividend and Accretion
|
—
|
—
|
(105
|
)
|
(129
|
)
|
(677
|
)
|
||||||||||||
|
|
||||||||||||||||||||
|
Net Income available to common shareholders
|
$
|
8,748
|
$
|
8,051
|
$
|
6,816
|
$
|
5,741
|
$
|
4,707
|
||||||||||
|
|
||||||||||||||||||||
|
Basic Income Per Share
|
$
|
0.76
|
$
|
0.70
|
$
|
0.60
|
$
|
0.50
|
$
|
0.41
|
||||||||||
|
|
||||||||||||||||||||
|
Diluted Income Per Share
|
$
|
0.75
|
$
|
0.70
|
$
|
0.59
|
$
|
0.50
|
$
|
0.41
|
||||||||||
|
|
||||||||||||||||||||
|
Total Assets
|
$
|
1,217,658
|
$
|
1,166,763
|
$
|
1,044,625
|
$
|
957,884
|
$
|
897,669
|
||||||||||
|
|
||||||||||||||||||||
|
Total Investments
|
$
|
280,741
|
$
|
277,079
|
$
|
183,351
|
$
|
151,226
|
$
|
173,269
|
||||||||||
|
|
||||||||||||||||||||
|
Total Loans, including Loans Held-for-Sale, net
|
$
|
740,152
|
$
|
673,096
|
$
|
606,204
|
$
|
538,470
|
$
|
508,113
|
||||||||||
|
|
||||||||||||||||||||
|
Total Deposits
|
$
|
1,104,740
|
$
|
1,063,696
|
$
|
948,114
|
$
|
857,052
|
$
|
803,787
|
||||||||||
|
|
||||||||||||||||||||
|
Total Equity
|
$
|
100,044
|
$
|
92,298
|
$
|
85,849
|
$
|
92,051
|
$
|
84,908
|
||||||||||
|
|
||||||||||||||||||||
|
Weighted Average Shares of Common Stock outstanding used for Basic Income Per Share Computation (1)
|
11,505,108
|
11,475,942
|
11,444,066
|
11,400,251
|
11,375,569
|
|||||||||||||||
|
|
||||||||||||||||||||
|
Weighted Average Shares of Common Stock outstanding used for Diluted Income Per Share Computation (1)
|
11,651,331
|
11,549,803
|
11,507,459
|
11,459,678
|
11,418,925
|
|||||||||||||||
|
|
||||||||||||||||||||
|
Return on Average Total Assets
|
0.74
|
%
|
0.74
|
%
|
0.69
|
%
|
0.62
|
%
|
0.62
|
%
|
||||||||||
|
|
||||||||||||||||||||
|
Net Income/Average Equity
|
8.88
|
%
|
8.87
|
%
|
7.41
|
%
|
6.59
|
%
|
6.36
|
%
|
||||||||||
|
|
||||||||||||||||||||
|
Net Income/Average Deposits
|
0.82
|
%
|
0.81
|
%
|
0.76
|
%
|
0.69
|
%
|
0.70
|
%
|
||||||||||
|
|
||||||||||||||||||||
|
Average Loans/Average Deposits
|
63.40
|
%
|
63.57
|
%
|
62.18
|
%
|
60.71
|
%
|
61.06
|
%
|
||||||||||
|
|
||||||||||||||||||||
|
Average Equity to Average Total Assets
|
8.36
|
%
|
8.31
|
%
|
9.25
|
%
|
9.46
|
%
|
9.83
|
%
|
||||||||||
(1) All years have been restated to give retroactive effect for stock dividends issued and stock splits.
24
ITEM 7 – MANAGEMENT'S DISCUSSION AND ANALYSIS OF FINANCIAL CONDITION AND RESULTS OF OPERATION
Introduction
This overview highlights selected information in this Annual Report on Form 10-K and may not contain all of the information that is important to you. For a more complete understanding of trends, events, commitments, uncertainties, liquidity, capital resources, and critical accounting estimates, you should carefully read this entire Annual Report on Form 10-K.
Our subsidiary, First Northern Bank of Dixon, is a California state-chartered bank that derives most of its revenues from lending and deposit taking in the Sacramento Valley region of Northern California. Interest rates, business conditions and customer confidence all affect our ability to generate revenues. In addition, the regulatory environment and competition can challenge our ability to generate those revenues.
Financial highlights for 2017 include:
The Company reported net income of $8.7 million for 2017, a 7.4% increase compared to net income of $8.1 million for 2016. Net income per common share for 2017 was $0.76 and resulted in an increase in net income per common share of 8.6% compared to net income per common share of $0.70 for 2016. Net income per common share on a fully diluted basis was $0.75 for 2017, an increase of 7.1% compared to net income per common share on a fully diluted basis of $0.70 for 2016.
Net interest income totaled $38.9 million for 2017, an increase of 11.8% from $34.8 million in 2016, primarily due to increased average loan volumes, increased loan rates, increased average investment securities volumes, increased investment securities rates, increased interest bearing due from rates and decreased rates on interest-bearing deposits, which was partially offset by decreased average due from banks and increased average interest-bearing transaction, savings and money market account volumes.
The provision for loan losses in 2017 totaled $0.6 million, a decrease of 66.7% from $1.8 million in 2016. Net charge-offs were $366 thousand in 2017 compared to $152 thousand in 2016. The decrease in the provision for loan losses was primarily due to a decrease in specific reserves on impaired loans and improved credit quality, which was partially offset by an increase in loan balances as well as increases in qualitative risk factors compared to the same periods in 2016. The increase in qualitative risk factors were primarily for residential mortgage, commercial real estate, agriculture and commercial loans and were primarily due to the nature and volume of the portfolio, concentrations of credit risk, competition and regulatory requirements and various economic factors.
Non-interest income totaled $8.1 million for 2017, an increase of 11.0% from $7.3 million in 2016. The increase was primarily due to the recognition of a pre-tax gain of $1.2 million on a sale-leaseback transaction related to land and building which was partially occupied by a Bank branch.
Non-interest expenses totaled $29.4 million for 2017, up 7.3% from $27.4 million in 2016. The increase was primarily due to increases in salaries and employee benefits, data processing expense, and other operating expenses.
The Company reported total assets of $1.22 billion as of December 31, 2017, up 4.4% from $1.17 billion as of December 31,2016.
Investments increased to $280.7 million as of December 31, 2017, a 1.3% increase from $277.1 million as of December 31, 2016. U.S. Treasury securities totaled $18.4 million as of December 31, 2017, down 35.6% from $28.7 million as of December 31, 2016; securities of U.S. government agencies and corporations totaled $21.1 million, down 12.8% from $24.2 million as of December 31, 2016; obligations of state and political subdivisions totaled $23.2 million, down 24.9% from $30.9 million as of December 31, 2016; collateralized mortgage obligations totaled $66.1 million, up 32.3% from $49.9 million as of December 31, 2016; and mortgage-backed securities totaled $151.9 million, up 5.9% from $143.4 million as of December 31, 2016.
Loans (including loans held-for-sale), net of allowance, increased to $740.2 million as of December 31, 2017, a 10.0% increase from $673.1 million as of December 31, 2016. Commercial loans totaled $135.0 million as of December 31, 2017, up 6.9% from $126.3 million as of December 31, 2016; commercial real estate loans were $398.3 million, up 15.7% from $344.2 million as of December 31, 2016; agriculture loans were $113.6 million, up 11.5% from $101.9 million as of December 31, 2016; residential mortgage loans were $42.1 million, up 4.73% from $40.2 million as of December 31, 2016; residential construction loans were $21.3 million, down 10.1% from $23.7 million as of December 31, 2016; and consumer loans totaled $38.9 million, down 10.2% from $43.3 million as of December 31, 2016.
Deposits increased to $1.10 billion as of December 31, 2017, a 3.9% increase from $1.06 billion as of December 31, 2016.
25
Stockholders' equity increased to $100.0 million as of December 31, 2017, an 8.4% increase from $92.3 million as of December 31, 2016.
On December 22, 2017, the Tax Cuts and Jobs Act was signed into law. Among other changes, the new law provides a reduction in the federal corporate income tax rate from 35% to 21% effective January 1, 2018. As a result of the reduction in the corporate income tax rate, the Company re-measured its net deferred tax asset in December 2017 (as was required given the law was enacted in 2017 even though the tax rate reduction did not take effect until 2018). This re-measurement resulted in a reduction in the value of our net deferred tax asset of $1,700,000, or $0.14 per diluted share, which was recorded as additional income tax expense for 2017.
Critical Accounting Policies and Estimates
The Company's discussion and analysis of its financial condition and results of operations are based upon the Company's consolidated financial statements, which have been prepared in accordance with accounting principles generally accepted in the United States. The preparation of these financial statements requires the Company to make estimates and judgments that affect the reported amounts of assets, liabilities, income and expenses, and related disclosure of contingent assets and liabilities. On an on-going basis, the Company evaluates its estimates, including those related to the allowance for loan losses, other real estate owned, investments, and income taxes. The Company bases its estimates on historical experience and on various other assumptions that are believed to be reasonable under the circumstances, the results of which form the basis for making judgments about the carrying values of assets and liabilities that are not readily apparent from other sources. Actual results may differ from these estimates under different assumptions or conditions.
The Company believes the following critical accounting policies affect its more significant judgments and estimates used in the preparation of its consolidated financial statements:
Allowance for Loan Losses
The Company believes the allowance for loan losses accounting policy is critical because the loan portfolio represents the largest asset type on the consolidated balance sheet, and there is significant judgment used in determining the adequacy of the allowance for loan losses. The Company maintains an allowance for loan losses resulting from the inability of borrowers to make required loan payments. Loan losses are charged off against the allowance, while recoveries of amounts previously charged off are credited to the allowance. A provision for loan losses is based on the Company's periodic evaluation of the factors mentioned below, as well as other pertinent factors. The allowance for loan losses consists of an allocated component and a general component. The components of the allowance for loan losses represent an estimate. The allocated component of the allowance for loan losses reflects expected losses resulting from analyses developed through specific credit allocations for individual loans and historical loss experience for each loan category. The specific credit allocations are based on regular analyses of all loans where the internal credit rating is at or below a predetermined classification. These analyses involve a high degree of judgment in estimating the amount of loss associated with specific loans, including estimating the amount and timing of future cash flows and collateral values. The historical loan loss element is determined using analysis that examines loss experience.
The allocated component of the allowance for loan losses also includes consideration of concentrations and changes in portfolio mix and volume. The general portion of the allowance reflects the Company's estimate of probable inherent but undetected losses within the portfolio due to uncertainties in economic conditions, delays in obtaining information, including unfavorable information about a borrower's financial condition, the difficulty in identifying triggering events that correlate perfectly to subsequent loss rates, and risk factors that have not yet manifested themselves in loss allocation factors. Uncertainty surrounding the strength and timing of economic cycles also affects estimates of loss. There are many factors affecting the allowance for loan losses; some are quantitative while others require qualitative judgment. Although the Company believes its process for determining the allowance adequately considers all of the potential factors that could potentially result in credit losses, the process includes subjective elements and may be susceptible to significant change. To the extent actual outcomes differ from Company estimates, additional provision for credit losses could be required that could adversely affect earnings or financial position in future periods.
Impaired Loans
A loan is considered impaired when, based on current information and events, it is probable that the Company will be unable to collect all amounts due according to the contractual terms of the loan agreement, including scheduled interest payments. For a loan that has been restructured, the contractual terms of the loan agreement refer to the contractual terms specified by the original loan agreement, not the contractual terms specified by the restructuring agreement. An impaired loan is measured based upon the present value of future cash flows discounted at the loan's effective rate, the loan's observable market price, or the fair value of collateral if the loan is collateral dependent. If the measurement of the impaired loan is less than the recorded investment in the loan, an impairment is recognized by a charge to the allowance for loan losses.
26
Other-than-temporary Impairment in Investment Securities
Investments with fair values that are less than amortized cost are considered impaired. Impairment may result from either a decline in the financial condition of the issuing entity or, in the case of fixed interest rate investments, from rising interest rates. At each consolidated financial statement date, management assesses each investment to determine if impaired investments are temporarily impaired or if the impairment is other than temporary. This assessment includes consideration regarding the duration and severity of impairment, the credit quality of the issuer and a determination of whether the Company intends to sell the security, or if it is more likely than not that the Company will be required to sell the security before recovery of its amortized cost basis less any current-period credit losses. Other-than-temporary impairment is recognized in earnings if one of the following conditions exists: 1) the Company's intent is to sell the security; 2) it is more likely than not that the Company will be required to sell the security before the impairment is recovered; or 3) the Company does not expect to recover its amortized cost basis. If, by contrast, the Company does not intend to sell the security and will not be required to sell the security prior to recovery of the amortized cost basis, the Company recognizes only the credit loss component of other-than-temporary impairment in earnings. The credit loss component is calculated as the difference between the security's amortized cost basis and the present value of its expected future cash flows. The remaining difference between the security's fair value and the present value of the future expected cash flows is deemed to be due to factors that are not credit related and is recognized in other comprehensive income.
Fair Value Measurements
The Company utilizes fair value measurements to record fair value adjustments to certain assets and liabilities and to determine fair value disclosures. Securities available-for-sale are recorded at fair value on a recurring basis. Additionally, from time to time, the Company may be required to record at fair value other assets on a non-recurring basis, such as loans held-for-sale, loans held-for-investment and certain other assets. These non-recurring fair value adjustments typically involve application of lower of cost or market accounting or write-downs of individual assets. Transfers between levels of the fair value hierarchy are recognized on the actual date of the event or circumstances that caused the transfer, which generally corresponds with the Company's quarterly valuation process. For additional discussion, see Note 12 to the Consolidated Financial Statements in this Form 10-K.
Share-Based Payment
The Company determines the fair value of stock options at grant date using the Black-Scholes-Merton pricing model that takes into account the stock price at the grant date, the exercise price, the expected dividend yield, stock price volatility, and the risk-free interest rate over the expected life of the option. The Black-Scholes-Merton model requires the input of highly subjective assumptions including the expected life of the stock-based award and stock price volatility. The estimates used in the model involve inherent uncertainties and the application of Management's judgment. As a result, if other assumptions had been used, our recorded stock-based compensation expense could have been materially different from that reflected in these financial statements. The fair value of non-vested restricted common shares generally equals the stock price at grant date. In addition, we are required to estimate the expected forfeiture rate and only recognize expense for those share-based awards expected to vest. If our actual forfeiture rate is materially different from the estimate, the share-based compensation expense could be materially different. For additional discussion, see Note 14 to the Consolidated Financial Statements in this Form 10-K.
Accounting for Income Taxes
Income taxes reported in the consolidated financial statements are computed based on an asset and liability approach. We recognize the amount of taxes payable or refundable for the current year, and deferred tax assets and liabilities for the expected future tax consequences that have been recognized in the financial statements. Under this method, deferred tax assets and liabilities are determined based on the differences between the financial statements and tax basis of assets and liabilities using enacted tax rates in effect for the year in which the differences are expected to reverse. We record net deferred tax assets to the extent it is more-likely-than-not that they will be realized. In evaluating our ability to recover the deferred tax assets, Management considers all available positive and negative evidence, including scheduled reversals of deferred tax liabilities, projected future taxable income, tax planning strategies and recent financial operations. In projecting future taxable income, Management develops assumptions including the amount of future state and federal pretax operating income, the reversal of temporary differences, and the implementation of feasible and prudent tax planning strategies. These assumptions require significant judgment about the forecasts of future taxable income and are consistent with the plans and estimates being used to manage the underlying business. The Company files consolidated federal and combined state income tax returns.
A "more-likely-than-not" recognition threshold must be met before a tax benefit can be recognized in the financial statements. For tax positions that meet the more-likely-than-not threshold, an enterprise may recognize only the largest amount of tax benefit that is greater than fifty percent likely of being realized upon ultimate settlement with the taxing authority. To the extent tax authorities disagree with these tax positions, our effective tax rates could be materially affected in the period of settlement with the taxing authorities. For additional discussion, see Note 17 to the Consolidated Financial Statements in this Form 10-K.
27
Mortgage Servicing Rights
Transfers and servicing of financial assets and extinguishments of liabilities are accounted for and reported based on consistent application of a financial-components approach that focuses on control. Transfers of financial assets that are sales are distinguished from transfers that are secured borrowings. Retained interests (mortgage servicing rights) in loans sold are measured by allocating the previous carrying amount of the transferred assets between the loans sold and retained interest, if any, based on their relative fair value at the date of transfer. Fair values are estimated using discounted cash flows based on a current market interest rate. The Company recognizes a gain and a related asset for the fair value of the rights to service loans for others when loans are sold.
The recorded value of mortgage servicing rights is included in other assets on the Consolidated Balance Sheets initially at fair value, and is amortized in proportion to, and over the period of, estimated net servicing revenues. The Company assesses capitalized mortgage servicing rights for impairment based upon the fair value of those rights at each reporting date. For purposes of measuring impairment, the rights are stratified based upon the product type, term and interest rates. Fair value is determined by discounting estimated net future cash flows from mortgage servicing activities using discount rates that approximate current market rates and estimated prepayment rates, among other assumptions. The amount of impairment recognized, if any, is the amount by which the capitalized mortgage servicing rights for a stratum exceeds their fair value. Impairment, if any, is recognized through a valuation allowance for each individual stratum.
Impact of Recently Issued Accounting Standards
In May 2014, the Financial Accounting Standards Board (FASB) issued Accounting Standards Update (ASU) 2014-09, Revenue from Contracts with Customers (Topic 606). ASU 2014-09 requires an entity to recognize the amount of revenue to which it expects to be entitled for the transfer of promised goods or services to customers. This ASU will replace most existing revenue recognition guidance in GAAP when it becomes effective. ASU 2014-09 was initially effective for the Company's reporting period beginning on January 1, 2017. However, in August 2015, the FASB issued ASU 2015-14, Revenue from Contracts with Customers - Deferral of the Effective Date, which defers the effective date by one year. For financial reporting purposes, the standard allows for either a full retrospective or modified retrospective adoption. The FASB has also issued additional updates to provide further clarification to specific implementation issues associated with ASU 2014-09. These updates include ASU 2016-08, Principal versus Agent Considerations, ASU 2016-10, Identifying Performance Obligations and Licensing, ASU 2016-12, Narrow-Scope Improvements and Practical Expedients, and ASU 2016-20, Technical Corrections and Improvements to Topic 606. Our revenue is comprised of net interest income on financial assets and financial liabilities, which is explicitly excluded from the scope of ASU 2014-09, and non-interest income. We expect that ASU 2014-09 will require us to change how we recognize certain recurring revenue streams; however, we do not expect these changes to have a material impact on non-interest income. We adopted the standard on January 1, 2018, which resulted in no material adjustment.
In February 2016, the FASB issued ASU 2016-02, Leases (Topic 842). The amendments in ASU 2016-02, among other things, require lessees to recognize the following for all leases (with the exception of short-term leases) at the commencement date:
|
●
|
A lease liability, which is a lessee's obligation to make lease payments arising from a lease, measured on a discounted basis; and
|
|
●
|
A right-of-use asset, which is an asset that represents the lessee's right to use, or control the use of, a specified asset for the lease term.
|
The amendments in this ASU are effective for public companies for fiscal years, and interim periods within those fiscal years, beginning after December 15, 2018. Early adoption is permitted. The Company currently leases ten properties. The effect to the Company's financial statements will result in the recording of a lease liability and a related right-of-use asset. Management has not yet quantified the lease liability and right-of-use asset and is currently evaluating the impact of this ASU on the Company's consolidated financial statements.
In June 2016, FASB issued ASU 2016-13, Financial Instruments – Credit Losses (Topic 326): Measurement of Credit Losses on Financial Instruments. The amendments in ASU 2016-13, among other things, require the measurement of all expected credit losses for financial assets held at the reporting date based on historical experience, current conditions, and reasonable and supportable forecasts. Financial institutions and other organizations will now use forward-looking information to better inform their credit loss estimates. Many of the loss estimation techniques applied today will still be permitted, although the inputs to those techniques will change to reflect the full amount of expected credit losses. In addition, ASU 2016-13 amends the accounting for credit losses on available-for-sale debt securities and purchased financial assets with credit deterioration. The amendments are effective for public companies for annual periods beginning after December 15, 2019. Early application will be permitted for all organizations for fiscal years, and interim periods within those fiscal years, beginning after December 15, 2018. Management is currently gathering data required to measure expected credit losses in accordance with this ASU and will then evaluate the impact of this ASU on the Company's consolidated financial statements. While the Company has not quantified the impact of this ASU, it does expect changing from the current loss model to an expected loss model to result in an earlier recognition of losses.
28
In January 2017, FASB issued ASU 2017-01, Business Combinations (Topic 805) - Clarifying the Definition of a Business. The amendments in ASU 2017-01 clarify the definition and provide a more robust framework to use in determining when a set of assets and activities constitutes a business. ASU 2017-01 is intended to provide guidance when evaluating whether transactions should be accounted for as acquisitions (or disposals) of assets or businesses. The amendments are effective for public companies for annual periods beginning after December 15, 2017, including interim periods within those annual periods. The Company does not expect the adoption of this update to have a significant impact on its consolidated financial statements.
In January 2017, FASB issued ASU 2017-03, Accounting Changes and Error Corrections (Topic 250) and Investments - Equity Method and Joint Ventures (Topic 323): Amendments to SEC Paragraphs Pursuant to Staff Announcements at the September 22, 2016 and November 17, 2016 EITF Meetings. These amendments apply to ASU 2014-09 (Revenue from Contracts with Customers), ASU 2016-02 (Leases), and ASU 2016-13 (Financial Instruments - Credit Losses). These amendments add paragraph 250-10-S99-6 which includes the text of "SEC Staff Announcement: Disclosure of the Impact That Recently Issued Accounting Standards Will Have on the Financial Statements of a Registrant When Such Standards Are Adopted in a Future Period (in accordance with Staff Accounting Bulletin [SAB] Topic 11.M)." The Company does not expect the adoption of this update to have a significant impact on its consolidated financial statements.
In March 2017, FASB issued ASU 2017-07, Compensation – Retirement Benefits (Topic 715): Improving the Presentation of Net Periodic Pension Cost and Net Periodic Postretirement Benefit Cost. The amendments require that an employer report the service cost component in the same line item or items as other compensation costs arising from services rendered by the pertinent employees during the period. The other components of net benefit cost are required to be presented in the income statement separately from the service cost component and outside a subtotal of income from operations, if one is presented. The amendments also allow only the service cost component to be eligible for capitalization when applicable. The amendments are effective for public companies for annual periods beginning after December 15, 2017, including interim periods within those periods. The Company does not expect the adoption of this update to have a significant impact on its consolidated financial statements.
In March 2017, FASB issued ASU 2017-08, Receivables – Nonrefundable Fees and Other Costs (Subtopic 310-20), Premium Amortization on Purchased Callable Debt Securities. The amendments shorten the amortization period for certain callable debt securities held at a premium. Specifically, the amendments require the premium to be amortized to the earliest call date. The amendments do not require an accounting change for securities held at a discount; the discount continues to be amortized to maturity. The amendments are effective for public companies for annual periods beginning after December 15, 2018, including interim periods within those annual periods. The Company does not expect the adoption of this update to have a significant impact on its consolidated financial statements.
In May 2017, FASB issued ASU 2017-09, Compensation - Stock Compensation (Topic 718): Scope of Modification Accounting. The amendments provide guidance on determining which changes to the terms and conditions of share-based payment awards require an entity to apply modification accounting under Topic 718. The amendments are effective for public companies for annual periods beginning after December 15, 2017, including interim periods within those annual periods. The Company does not expect the adoption of this update to have a significant impact on its consolidated financial statements.
In July 2017, FASB issued ASU 2017-11, Earnings Per Share (Topic 260); Distinguishing Liabilities from Equity (Topic 480); Derivatives and Hedging (Topic 815): (Part I) Accounting for Certain Financial Instruments with Down Round Features, (Part II) Replacement of the Indefinite Deferral for Mandatorily Redeemable Financial Instruments of Certain Nonpublic Entities and Certain Mandatorily Redeemable Noncontrolling Interests with a Scope Exception. These amendments simplify the accounting for certain financial instruments with down round features. The amendments are effective for public companies for annual periods beginning after December 15, 2018, including interim periods within those annual periods. The Company currently does not have any financial instruments with down round features and therefore does not expect the adoption of this update to have a significant impact on its consolidated financial statements.
29
In February 2018, FASB issued ASU 2018-02, Income Statement – Reporting Comprehensive Income (Topic 220). The amendments in this update allow a reclassification from retained earnings to accumulated other comprehensive income for stranded tax effects resulting from the Tax Cuts and Jobs Act. However, because the amendments only relate to the reclassification of the income tax effects of the Tax Cuts and Jobs Act, the underlying guidance that requires that the effect of a change in tax laws or rates be included in income from continuing operations is not affected. The amendments in this update are effective for all entities for fiscal years beginning after December 15, 2018, and interim periods within those fiscal years. Early adoption of the amendments in this Update is permitted, including adoption in any interim period, (1) for public business entities for reporting periods for which financial statements have not yet been issued and (2) for all other entities for reporting periods for which financial statements have not yet been made available for issuance. The amendments in this Update should be applied either in the period of adoption or retrospectively to each period (or periods) in which the effect of the change in the U.S. federal corporate income tax rate in the Tax Cuts and Jobs Act is recognized. The Company elected the early adoption of ASU 2018-02 as of and for the period ending December 31, 2017. As a result, the Company reclassified $599 from retained earnings to accumulated other comprehensive income as a result of the stranded tax effects resulting from the Tax Cuts and Jobs Act. The reclassification amount of $599 is comprised of a $473 unrealized loss on investment securities and $126 unrealized loss on retirement plans.
30
STATISTICAL INFORMATION AND DISCUSSION
The following statistical information and discussion should be read in conjunction with the Selected Financial Data included in Part II (Item 6) and the audited consolidated financial statements and accompanying notes included in Part II (Item 8) of this Annual Report on Form 10-K.
The following tables present information regarding the consolidated average assets, liabilities and stockholders' equity, the amounts of interest income from average earning assets and the resulting yields, and the amount of interest expense paid on interest-bearing liabilities. Average loan balances include non-performing loans. Interest income includes proceeds from loans on non-accrual status only to the extent cash payments have been received and applied as interest income. Tax-exempt income is not shown on a tax equivalent basis.
Distribution of Assets, Liabilities and Stockholders' Equity;
Interest Rates and Interest Differential
(Dollars in thousands)
|
|
2017
|
2016
|
2015
|
|||||||||||||||||||||
|
|
||||||||||||||||||||||||
|
|
Average
Balance
|
Percent
|
Average
Balance
|
Percent
|
Average
Balance
|
Percent
|
||||||||||||||||||
|
ASSETS
|
||||||||||||||||||||||||
|
Cash and Due From Banks
|
$
|
156,638
|
13.3
|
%
|
$
|
169,823
|
15.5
|
%
|
$
|
242,556
|
24.0
|
%
|
||||||||||||
|
Certificates of Deposit
|
6,923
|
0.6
|
%
|
16,615
|
1.5
|
%
|
12,704
|
1.3
|
%
|
|||||||||||||||
|
Investment Securities
|
296,924
|
25.2
|
%
|
237,127
|
21.7
|
%
|
153,340
|
15.2
|
%
|
|||||||||||||||
|
Loans (1)
|
677,522
|
57.5
|
%
|
631,181
|
57.8
|
%
|
564,275
|
55.9
|
%
|
|||||||||||||||
|
Stock in Federal Home Loan Bank and other equity securities, at cost
|
5,218
|
0.4
|
%
|
4,263
|
0.4
|
%
|
3,934
|
0.4
|
%
|
|||||||||||||||
|
Other Real Estate Owned
|
—
|
0.0
|
%
|
7
|
0.0
|
%
|
173
|
0.0
|
%
|
|||||||||||||||
|
Other Assets
|
34,759
|
2.9
|
%
|
33,958
|
3.1
|
%
|
32,556
|
3.2
|
%
|
|||||||||||||||
|
Total Assets
|
$
|
1,177,984
|
100.0
|
%
|
$
|
1,092,974
|
100.0
|
%
|
$
|
1,009,538
|
100.0
|
%
|
||||||||||||
|
|
||||||||||||||||||||||||
|
LIABILITIES &
|
||||||||||||||||||||||||
|
STOCKHOLDERS' EQUITY
|
||||||||||||||||||||||||
|
Deposits:
|
||||||||||||||||||||||||
|
Demand
|
$
|
361,729
|
30.7
|
%
|
$
|
329,933
|
30.2
|
%
|
$
|
303,760
|
30.1
|
%
|
||||||||||||
|
Interest-Bearing Transaction Deposits
|
293,464
|
24.9
|
%
|
269,197
|
24.6
|
%
|
243,063
|
24.1
|
%
|
|||||||||||||||
|
Savings & MMDAs
|
335,709
|
28.5
|
%
|
309,638
|
28.3
|
%
|
276,561
|
27.4
|
%
|
|||||||||||||||
|
Time Certificates
|
77,705
|
6.6
|
%
|
84,087
|
7.7
|
%
|
84,038
|
8.3
|
%
|
|||||||||||||||
|
Borrowed Funds
|
—
|
0.0
|
%
|
—
|
0.0
|
%
|
—
|
0.0
|
%
|
|||||||||||||||
|
Other Liabilities
|
10,860
|
0.9
|
%
|
9,309
|
0.9
|
%
|
8,706
|
0.9
|
%
|
|||||||||||||||
|
Stockholders' Equity
|
98,517
|
8.4
|
%
|
90,810
|
8.3
|
%
|
93,410
|
9.3
|
%
|
|||||||||||||||
|
Total Liabilities & Stockholders' Equity
|
$
|
1,177,984
|
100.0
|
%
|
$
|
1,092,974
|
100.0
|
%
|
$
|
1,009,538
|
100.0
|
%
|
||||||||||||
| (1) |
Average balances for loans include loans held-for-sale and non-accrual loans and are net of the allowance for loan losses.
|
31
Net Interest Earnings
Average Balances, Yields and Rates
(Dollars in thousands)
|
|
2017
|
2016
|
2015
|
|||||||||||||||||||||||||||||||||
|
Assets
|
Average
Balance
|
Interest
Income/
Expense
|
Yields
Earned/
Rates
Paid
|
Average
Balance
|
Interest
Income/
Expense
|
Yields
Earned/
Rates
Paid
|
Average
Balance
|
Interest
Income/
Expense
|
Yields
Earned/
Rates
Paid
|
|||||||||||||||||||||||||||
|
|
||||||||||||||||||||||||||||||||||||
|
Total Loans, Including
Loan Fees(1)
|
$
|
677,522
|
$
|
33,115
|
4.89
|
%
|
$
|
631,181
|
$
|
30,697
|
4.86
|
%
|
$
|
564,275
|
$
|
27,304
|
4.84
|
%
|
||||||||||||||||||
|
|
||||||||||||||||||||||||||||||||||||
|
Due From Banks
|
131,478
|
1,428
|
1.09
|
%
|
144,996
|
746
|
0.51
|
%
|
220,119
|
566
|
0.26
|
%
|
||||||||||||||||||||||||
|
Certificates of Deposit
|
6,923
|
72
|
1.04
|
%
|
16,615
|
145
|
0.87
|
%
|
12,704
|
93
|
0.73
|
%
|
||||||||||||||||||||||||
|
|
||||||||||||||||||||||||||||||||||||
|
Investment Securities:
|
||||||||||||||||||||||||||||||||||||
|
Taxable
|
279,711
|
4,762
|
1.70
|
%
|
223,011
|
3,582
|
1.61
|
%
|
144,849
|
2,725
|
1.88
|
%
|
||||||||||||||||||||||||
|
|
||||||||||||||||||||||||||||||||||||
|
Non-taxable (2)
|
17,213
|
257
|
1.49
|
%
|
14,116
|
276
|
1.96
|
%
|
8,491
|
271
|
3.19
|
%
|
||||||||||||||||||||||||
|
|
||||||||||||||||||||||||||||||||||||
|
Total Investment Securities
|
296,924
|
5,019
|
1.69
|
%
|
237,127
|
3,858
|
1.63
|
%
|
153,340
|
2,996
|
1.95
|
%
|
||||||||||||||||||||||||
|
|
||||||||||||||||||||||||||||||||||||
|
Other Earning Assets
|
5,218
|
383
|
7.34
|
%
|
4,263
|
521
|
12.22
|
%
|
3,934
|
481
|
12.23
|
%
|
||||||||||||||||||||||||
|
|
||||||||||||||||||||||||||||||||||||
|
|
||||||||||||||||||||||||||||||||||||
|
Total Earning Assets
|
$
|
1,118,065
|
$
|
40,017
|
3.58
|
%
|
$
|
1,034,182
|
$
|
35,967
|
3.48
|
%
|
$
|
954,372
|
$
|
31,440
|
3.29
|
%
|
||||||||||||||||||
|
|
||||||||||||||||||||||||||||||||||||
|
Cash and Due from Banks
|
25,160
|
24,827
|
22,437
|
|||||||||||||||||||||||||||||||||
|
|
||||||||||||||||||||||||||||||||||||
|
Other Real Estate Owned
|
—
|
7
|
173
|
|||||||||||||||||||||||||||||||||
|
|
||||||||||||||||||||||||||||||||||||
|
Interest Receivable and Other Assets
|
34,759
|
33,958
|
32,556
|
|||||||||||||||||||||||||||||||||
|
|
||||||||||||||||||||||||||||||||||||
|
Total Assets
|
$
|
1,177,984
|
$
|
1,092,974
|
$
|
1,009,538
|
||||||||||||||||||||||||||||||
| (1) |
Average balances for loans include loans held-for-sale and non-accrual loans and are net of the allowance for loan losses, but non-accrued interest thereon is excluded. Includes amortization of deferred loan fees and costs.
|
| (2) |
Interest income and yields on tax-exempt securities are not presented on a taxable equivalent basis.
|
32
Continuation of
Net Interest Earnings
Average Balances, Yields and Rates
(Dollars in thousands)
|
|
2017
|
2016
|
2015
|
|||||||||||||||||||||||||||||||||
|
|
||||||||||||||||||||||||||||||||||||
|
Liabilities and Stockholders' Equity
|
Average
Balance
|
Interest
Income/
Expense
|
Yields
Earned/
Rates
Paid
|
Average
Balance
|
Interest
Income/
Expense
|
Yields
Earned/
Rates
Paid
|
Average
Balance
|
Interest
Income/
Expense
|
Yields
Earned/
Rates
Paid
|
|||||||||||||||||||||||||||
|
|
||||||||||||||||||||||||||||||||||||
|
Interest-Bearing Deposits:
|
||||||||||||||||||||||||||||||||||||
|
Interest-Bearing
|
||||||||||||||||||||||||||||||||||||
|
Transaction Deposits
|
$
|
293,464
|
$
|
246
|
0.08
|
%
|
$
|
269,197
|
$
|
309
|
0.11
|
%
|
$
|
243,063
|
$
|
294
|
0.12
|
%
|
||||||||||||||||||
|
|
||||||||||||||||||||||||||||||||||||
|
Savings & MMDAs
|
335,709
|
530
|
0.16
|
%
|
309,638
|
511
|
0.17
|
%
|
276,561
|
521
|
0.19
|
%
|
||||||||||||||||||||||||
|
|
||||||||||||||||||||||||||||||||||||
|
Time Certificates
|
77,705
|
303
|
0.39
|
%
|
84,087
|
337
|
0.40
|
%
|
84,038
|
339
|
0.40
|
%
|
||||||||||||||||||||||||
|
|
||||||||||||||||||||||||||||||||||||
|
Total Interest-Bearing Deposits
|
706,878
|
1,079
|
0.15
|
%
|
662,922
|
1,157
|
0.17
|
%
|
603,662
|
1,154
|
0.19
|
%
|
||||||||||||||||||||||||
|
|
||||||||||||||||||||||||||||||||||||
|
Borrowed Funds
|
—
|
—
|
0.00
|
%
|
—
|
—
|
0.00
|
%
|
—
|
—
|
0.00
|
%
|
||||||||||||||||||||||||
|
|
||||||||||||||||||||||||||||||||||||
|
Total Interest-Bearing
|
||||||||||||||||||||||||||||||||||||
|
Deposits and Funds
|
706,878
|
1,079
|
0.15
|
%
|
662,922
|
1,157
|
0.17
|
%
|
603,662
|
1,154
|
0.19
|
%
|
||||||||||||||||||||||||
|
|
||||||||||||||||||||||||||||||||||||
|
Demand Deposits
|
361,729
|
—
|
0.00
|
%
|
329,933
|
—
|
0.00
|
%
|
303,760
|
—
|
0.00
|
%
|
||||||||||||||||||||||||
|
|
||||||||||||||||||||||||||||||||||||
|
Total Deposits and Borrowed Funds
|
1,068,607
|
$
|
1,079
|
0.10
|
%
|
992,855
|
$
|
1,157
|
0.12
|
%
|
907,422
|
$
|
1,154
|
0.13
|
%
|
|||||||||||||||||||||
|
|
||||||||||||||||||||||||||||||||||||
|
Interest payable and Other Liabilities
|
10,860
|
9,309
|
8,706
|
|||||||||||||||||||||||||||||||||
|
|
||||||||||||||||||||||||||||||||||||
|
Stockholders' Equity
|
98,517
|
90,810
|
93,410
|
|||||||||||||||||||||||||||||||||
|
|
||||||||||||||||||||||||||||||||||||
|
Total Liabilities and Stockholders' Equity
|
$
|
1,177,984
|
$
|
1,092,974
|
$
|
1,009,538
|
||||||||||||||||||||||||||||||
|
|
||||||||||||||||||||||||||||||||||||
|
Net Interest Income and
|
||||||||||||||||||||||||||||||||||||
|
Net Interest Margin (1)
|
$
|
38,938
|
3.48
|
%
|
$
|
34,810
|
3.37
|
%
|
$
|
30,286
|
3.17
|
%
|
||||||||||||||||||||||||
|
|
||||||||||||||||||||||||||||||||||||
|
Net Interest Spread (2)
|
3.43
|
%
|
3.31
|
%
|
3.10
|
%
|
||||||||||||||||||||||||||||||
| (1) |
Net interest margin is computed by dividing net interest income by total average interest-earning assets.
|
| (2) |
Net interest spread represents the average yield earned on interest-earning assets less the average rate paid on interest-bearing liabilities.
|
33
Analysis of Changes
in Interest Income and Interest Expense
(Dollars in thousands)
Following is an analysis of changes in interest income and expense (dollars in thousands) for 2017 over 2016 and 2016 over 2015. Changes not solely due to interest rate or volume have been allocated proportionately to interest rate and volume.
|
|
2017 Over 2016
|
2016 Over 2015
|
||||||||||||||||||||||
|
|
Volume
|
Interest
Rate
|
Change
|
Volume
|
Interest
Rate
|
Change
|
||||||||||||||||||
|
|
||||||||||||||||||||||||
|
Increase (Decrease) in Interest Income:
|
||||||||||||||||||||||||
|
|
||||||||||||||||||||||||
|
Loans
|
$
|
2,481
|
$
|
(63
|
)
|
$
|
2,418
|
$
|
3,338
|
$
|
55
|
$
|
3,393
|
|||||||||||
|
|
||||||||||||||||||||||||
|
Due From Banks
|
(76
|
)
|
758
|
682
|
(241
|
)
|
421
|
180
|
||||||||||||||||
|
Certificates of Deposit
|
(97
|
)
|
24
|
(73
|
)
|
32
|
20
|
52
|
||||||||||||||||
|
|
||||||||||||||||||||||||
|
Investment Securities - Taxable
|
967
|
213
|
1,180
|
1,294
|
(437
|
)
|
857
|
|||||||||||||||||
|
Investment Securities - Non-taxable
|
54
|
(73
|
)
|
(19
|
)
|
135
|
(130
|
)
|
5
|
|||||||||||||||
|
|
||||||||||||||||||||||||
|
Other Earning Assets
|
100
|
(238
|
)
|
(138
|
)
|
40
|
—
|
40
|
||||||||||||||||
|
|
||||||||||||||||||||||||
|
|
$
|
3,429
|
$
|
621
|
$
|
4,050
|
$
|
4,598
|
$
|
(71
|
)
|
$
|
4,527
|
|||||||||||
|
|
||||||||||||||||||||||||
|
Increase (Decrease) in Interest Expense:
|
||||||||||||||||||||||||
|
|
||||||||||||||||||||||||
|
Deposits:
|
||||||||||||||||||||||||
|
|
||||||||||||||||||||||||
|
Interest-Bearing Transaction Deposits
|
$
|
25
|
$
|
(88
|
)
|
$
|
(63
|
)
|
$
|
36
|
$
|
(21
|
)
|
$
|
15
|
|||||||||
|
|
||||||||||||||||||||||||
|
Savings & MMDAs
|
48
|
(29
|
)
|
19
|
53
|
(63
|
)
|
(10
|
)
|
|||||||||||||||
|
|
||||||||||||||||||||||||
|
Time Certificates
|
(26
|
)
|
(8
|
)
|
(34
|
)
|
(2
|
)
|
—
|
(2
|
)
|
|||||||||||||
|
|
||||||||||||||||||||||||
|
Borrowed Funds
|
—
|
—
|
—
|
—
|
—
|
—
|
||||||||||||||||||
|
|
||||||||||||||||||||||||
|
|
$
|
47
|
$
|
(125
|
)
|
$
|
(78
|
)
|
$
|
87
|
$
|
(84
|
)
|
$
|
3
|
|||||||||
|
|
||||||||||||||||||||||||
|
Increase in Net Interest Income:
|
$
|
3,382
|
$
|
746
|
$
|
4,128
|
$
|
4,511
|
$
|
13
|
$
|
4,524
|
||||||||||||
34
INVESTMENT PORTFOLIO
Composition of Investment Securities
The mix of investment securities held by the Company at December 31, of the previous three fiscal years is as follows (dollars in thousands):
|
|
2017
|
2016
|
2015
|
|||||||||
|
Investment securities available-for-sale (at fair value):
|
||||||||||||
|
|
||||||||||||
|
U.S. Treasury Securities
|
$
|
18,464
|
$
|
28,652
|
$
|
20,186
|
||||||
|
Securities of U.S. Government Agencies and Corporations
|
21,109
|
24,197
|
33,997
|
|||||||||
|
Obligations of State & Political Subdivisions
|
23,208
|
30,888
|
25,709
|
|||||||||
|
Collateralized Mortgage Obligations
|
66,083
|
49,938
|
10,932
|
|||||||||
|
Mortgage-Backed Securities
|
151,877
|
143,404
|
92,527
|
|||||||||
|
|
||||||||||||
|
Total Investments
|
$
|
280,741
|
$
|
277,079
|
$
|
183,351
|
||||||
Maturities of Investment Securities
The following table is a summary of the relative maturities (dollars in thousands) and projected yields of the Company's investment securities as of December 31, 2017. The yields on tax-exempt securities are shown on a tax equivalent basis.
Period to Maturity
|
|
Within One Year
|
After One But
Within Five Years
|
After Five But
Within Ten Years
|
|||||||||||||||||||||
|
|
Amount
|
Yield
|
Amount
|
Yield
|
Amount
|
Yield
|
||||||||||||||||||
|
|
||||||||||||||||||||||||
|
Investment securities available-for-sale (at fair value):
|
||||||||||||||||||||||||
|
U.S. Treasury Securities
|
$
|
10,004
|
0.97
|
%
|
$
|
8,460
|
1.15
|
%
|
$
|
—
|
—
|
|||||||||||||
|
Securities of U.S. Government Agencies and Corporations
|
7,554
|
1.05
|
%
|
13,555
|
1.37
|
%
|
—
|
—
|
||||||||||||||||
|
Obligations of State & Political Subdivisions
|
6,239
|
1.49
|
%
|
12,744
|
2.19
|
%
|
4,225
|
4.20
|
%
|
|||||||||||||||
|
Collateralized Mortgage Obligations
|
6
|
5.00
|
%
|
66,077
|
1.82
|
%
|
—
|
—
|
||||||||||||||||
|
Mortgage-Backed Securities
|
1,094
|
2.56
|
%
|
148,660
|
1.78
|
%
|
—
|
—
|
||||||||||||||||
|
|
||||||||||||||||||||||||
|
TOTAL
|
$
|
24,897
|
1.19
|
%
|
$
|
249,496
|
1.77
|
%
|
$
|
4,225
|
4.20
|
%
|
||||||||||||
|
|
After Ten Years
|
Total
|
||||||||||||||
|
|
Amount
|
Yield
|
Amount
|
Yield
|
||||||||||||
|
|
||||||||||||||||
|
Investment securities available-for-sale (at fair value):
|
||||||||||||||||
|
U.S. Treasury Securities
|
$
|
—
|
—
|
$
|
18,464
|
1.05
|
%
|
|||||||||
|
Securities of U.S. Government Agencies and Corporations
|
—
|
—
|
21,109
|
1.26
|
%
|
|||||||||||
|
Obligations of State & Political Subdivisions
|
—
|
—
|
23,208
|
2.37
|
%
|
|||||||||||
|
Collateralized Mortgage Obligations
|
—
|
—
|
66,083
|
1.82
|
%
|
|||||||||||
|
Mortgage-Backed Securities
|
2,123
|
3.19
|
%
|
151,877
|
1.81
|
%
|
||||||||||
|
|
||||||||||||||||
|
TOTAL
|
$
|
2,123
|
3.19
|
%
|
$
|
280,741
|
1.77
|
%
|
||||||||
35
LOAN PORTFOLIO
Composition of Loans
The mix of loans, net of deferred origination fees and costs and allowance for loan losses and excluding loans held-for-sale, at December 31, for the previous five fiscal years is as follows (dollars in thousands):
|
|
December 31,
|
|||||||||||||||||||||||
|
|
2017
|
2016
|
2015
|
|||||||||||||||||||||
|
|
||||||||||||||||||||||||
|
|
Balance
|
Percent
|
Balance
|
Percent
|
Balance
|
Percent
|
||||||||||||||||||
|
|
||||||||||||||||||||||||
|
Commercial
|
$
|
135,015
|
18.0
|
%
|
$
|
126,311
|
18.6
|
%
|
$
|
136,095
|
22.2
|
%
|
||||||||||||
|
Commercial Real Estate
|
398,346
|
53.2
|
%
|
344,210
|
50.6
|
%
|
292,316
|
47.6
|
%
|
|||||||||||||||
|
Agriculture
|
113,555
|
15.2
|
%
|
101,905
|
15.0
|
%
|
84,813
|
13.8
|
%
|
|||||||||||||||
|
Residential Mortgage
|
42,081
|
5.6
|
%
|
40,237
|
5.9
|
%
|
43,375
|
7.0
|
%
|
|||||||||||||||
|
Residential Construction
|
21,299
|
2.8
|
%
|
23,650
|
3.5
|
%
|
12,110
|
2.0
|
%
|
|||||||||||||||
|
Consumer
|
38,900
|
5.2
|
%
|
43,250
|
6.4
|
%
|
45,386
|
7.4
|
%
|
|||||||||||||||
|
|
749,196
|
100.0
|
%
|
679,563
|
100.0
|
%
|
614,095
|
100.0
|
%
|
|||||||||||||||
|
Allowance for loan losses
|
(11,133
|
)
|
(10,899
|
)
|
(9,251
|
)
|
||||||||||||||||||
|
Net deferred origination fees and costs
|
1,049
|
1,106
|
1,009
|
|||||||||||||||||||||
|
TOTAL
|
$
|
739,112
|
$
|
669,770
|
$
|
605,853
|
||||||||||||||||||
|
|
2014
|
2013
|
||||||||||||||
|
|
||||||||||||||||
|
|
Balance
|
Percent
|
Balance
|
Percent
|
||||||||||||
|
|
||||||||||||||||
|
Commercial
|
$
|
120,751
|
22.1
|
%
|
$
|
110,644
|
21.5
|
%
|
||||||||
|
Commercial Real Estate
|
256,955
|
47.1
|
%
|
235,296
|
45.7
|
%
|
||||||||||
|
Agriculture
|
61,144
|
11.2
|
%
|
51,730
|
10.0
|
%
|
||||||||||
|
Residential Mortgage
|
50,511
|
9.3
|
%
|
52,809
|
10.3
|
%
|
||||||||||
|
Residential Construction
|
5,963
|
1.1
|
%
|
10,444
|
2.0
|
%
|
||||||||||
|
Consumer
|
49,911
|
9.2
|
%
|
54,079
|
10.5
|
%
|
||||||||||
|
|
545,235
|
100.0
|
%
|
515,002
|
100.0
|
%
|
||||||||||
|
Allowance for loan losses
|
(8,583
|
)
|
(9,353
|
)
|
||||||||||||
|
Net deferred origination fees and costs
|
1,327
|
1,201
|
||||||||||||||
|
TOTAL
|
$
|
537,979
|
$
|
506,850
|
||||||||||||
Commercial loans are primarily for financing the needs of a diverse group of businesses located in the Bank's market area. Commercial real estate loans generally fall into two categories, owner-occupied and non-owner occupied. Real estate construction loans are generally for financing the construction of single-family residential homes for individuals and builders we believe are well-qualified. These loans are secured by real estate and have short maturities. Residential mortgage loans, which are secured by real estate, include owner-occupied and non-owner occupied properties in the Bank's market area. Loans are considered agriculture loans when the primary source of repayment is from the sale of an agricultural or agricultural-related product or service. Such loans are secured and/or unsecured to producers and processors of crops and livestock. The Bank also makes loans to individuals for investment purposes. Most of these loans are relatively short-term (an overall average life of approximately two years) and secured by various types of collateral.
As shown in the comparative figures for loan mix during 2017 and 2016, total loans increased as a result of increases in commercial loans, commercial real estate, agriculture loans, and residential mortgage loans, which were partially offset by decreases in residential construction and consumer loans.
36
Maturities and Sensitivities of Loans to Changes in Interest Rates
Loan maturities of the loan portfolio at December 31, 2017 are as follows (dollars in thousands) (excludes loans held-for-sale):
|
Maturing
|
Fixed Rate
|
Variable Rate
|
Total
|
|||||||||
|
|
||||||||||||
|
Within one year
|
$
|
11,369
|
$
|
78,645
|
$
|
90,014
|
||||||
|
After one year through five years
|
94,132
|
51,112
|
145,244
|
|||||||||
|
After five years
|
103,738
|
410,200
|
513,938
|
|||||||||
|
|
||||||||||||
|
Total
|
$
|
209,239
|
$
|
539,957
|
$
|
749,196
|
||||||
Non-accrual, Past Due, OREO and Restructured Loans
It is generally the Company's policy to discontinue interest accruals once a loan is past due for a period of 90 days as to interest or principal payments. When a loan is placed on non-accrual, interest accruals cease and uncollected accrued interest is reversed and charged against current income. Payments received on non-accrual loans are applied against principal. A loan may only be restored to an accruing basis when it again becomes well secured and in the process of collection or all past due amounts have been collected and an appropriate period of performance has been demonstrated.
The following tables summarize the Company's non-accrual loans by loan category (dollars in thousands), net of guarantees of the State of California and U.S. Government, including its agencies and its government-sponsored agencies at December 31, 2017, 2016, 2015, 2014, and 2013.
|
|
At December 31, 2017
|
At December 31, 2016
|
||||||||||||||||||||||
|
|
Gross
|
Guaranteed
|
Net
|
Gross
|
Guaranteed
|
Net
|
||||||||||||||||||
|
|
||||||||||||||||||||||||
|
|
||||||||||||||||||||||||
|
|
||||||||||||||||||||||||
|
Commercial
|
$
|
1,057
|
$
|
32
|
$
|
1,025
|
$
|
5,000
|
$
|
2,000
|
$
|
3,000
|
||||||||||||
|
Commercial real estate
|
1,724
|
70
|
1,654
|
540
|
81
|
459
|
||||||||||||||||||
|
Agriculture
|
—
|
—
|
—
|
—
|
—
|
—
|
||||||||||||||||||
|
Residential mortgage
|
781
|
—
|
781
|
654
|
—
|
654
|
||||||||||||||||||
|
Residential construction
|
—
|
—
|
—
|
—
|
—
|
—
|
||||||||||||||||||
|
Consumer
|
205
|
—
|
205
|
103
|
—
|
103
|
||||||||||||||||||
|
Total non-accrual loans
|
$
|
3,767
|
$
|
102
|
$
|
3,665
|
$
|
6,297
|
$
|
2,081
|
$
|
4,216
|
||||||||||||
|
|
At December 31, 2015
|
At December 31, 2014
|
||||||||||||||||||||||
|
|
Gross
|
Guaranteed
|
Net
|
Gross
|
Guaranteed
|
Net
|
||||||||||||||||||
|
|
||||||||||||||||||||||||
|
|
||||||||||||||||||||||||
|
|
||||||||||||||||||||||||
|
Commercial
|
$
|
112
|
$
|
57
|
$
|
55
|
$
|
2,151
|
$
|
82
|
$
|
2,069
|
||||||||||||
|
Commercial real estate
|
964
|
95
|
869
|
672
|
—
|
672
|
||||||||||||||||||
|
Agriculture
|
—
|
—
|
—
|
—
|
—
|
—
|
||||||||||||||||||
|
Residential mortgage
|
1,092
|
—
|
1,092
|
1,691
|
—
|
1,691
|
||||||||||||||||||
|
Residential construction
|
—
|
—
|
—
|
71
|
—
|
71
|
||||||||||||||||||
|
Consumer
|
560
|
—
|
560
|
652
|
—
|
652
|
||||||||||||||||||
|
Total non-accrual loans
|
$
|
2,728
|
$
|
152
|
$
|
2,576
|
$
|
5,237
|
$
|
82
|
$
|
5,155
|
||||||||||||
37
|
|
At December 31, 2013
|
|||||||||||
|
|
Gross
|
Guaranteed
|
Net
|
|||||||||
|
|
||||||||||||
|
|
||||||||||||
|
Commercial
|
$
|
2,609
|
$
|
202
|
$
|
2,407
|
||||||
|
Commercial real estate
|
2,607
|
200
|
2,407
|
|||||||||
|
Agriculture
|
1,590
|
—
|
1,590
|
|||||||||
|
Residential mortgage
|
2,166
|
—
|
2,166
|
|||||||||
|
Residential construction
|
93
|
—
|
93
|
|||||||||
|
Consumer
|
505
|
23
|
482
|
|||||||||
|
Total non-accrual loans
|
$
|
9,570
|
$
|
425
|
$
|
9,145
|
||||||
Non-accrual loans amounted to $3,767,000 at December 31, 2017 and were comprised of three residential mortgage loans totaling $781,000, three commercial real estate loans totaling $1,724,000, three commercial loans totaling $1,057,000, and one consumer loan totaling $205,000. Non-accrual loans amounted to $6,297,000 at December 31, 2016 and were comprised of three residential mortgage loans totaling $654,000, two commercial real estate loans totaling $540,000, one commercial loan totaling $5,000,000, and one consumer loan totaling $103,000. Non-accrual loans amounted to $2,728,000 at December 31, 2015 and were comprised of four residential mortgage loans totaling $1,092,000, four commercial real estate loans totaling $964,000, four commercial loans totaling $112,000, and four consumer loans totaling $560,000.
If interest on non-accrual loans had been accrued, such interest income would have approximated $158,000, $270,000 and $268,000 during the years ended December 31, 2017, 2016, and 2015, respectively. Income actually recognized for these loans approximated $50,000, $38,000 and $39,000 for the years ended December 31, 2017, 2016, and 2015, respectively.
Loans for which it is probable that payment of interest and principal will not be made in accordance with the contractual terms of the loan agreement are considered impaired. Non-performing impaired loans are non-accrual loans and loans that are 90 days or more past due and still accruing. Total non-performing impaired loans at December 31, 2017, 2016, and 2015 consisting of loans on non-accrual status totaled $3,767,000, $6,297,000 and $2,728,000, respectively. A restructuring of a loan can constitute a troubled debt restructuring if the Company for economic or legal reasons related to the borrower's financial difficulties grants a concession to the borrower that it would not otherwise consider. A loan that is restructured in a troubled debt restructuring is considered an impaired loan. Performing impaired loans, which consisted of loans modified as troubled debt restructurings, totaled $5,234,000, $4,662,000 and $5,350,000 at December 31, 2017, 2016, and 2015, respectively. The Company expects to collect all principal and interest due from performing impaired loans. These loans are not on non-accrual status. No assurance can be given that the existing or any additional collateral will be sufficient to secure full recovery of the obligations owed under these loans.
The Company had one loan totaling $45,000 that was 90 days past due and still accruing at December 31, 2017. The Company had no loans 90 days past due and still accruing as of December 31, 2016. The Company had one loan totaling $2,000 that was 90 days past due and still accruing at December 31, 2015.
38
As the following table illustrates, total non-performing assets, which consists of loans on non-accrual status, loans past due 90-days and still accruing and Other Real Estate Owned ("OREO") net of guarantees of the State of California and U.S. Government, including its agencies and its government-sponsored agencies, decreased $506,000, or 12.0%, to $3,710,000 from December 31, 2016 and increased $1,638,000 or 63.5%, at December 31, 2016 from December 31, 2015. Non-performing assets net of guarantees represent 0.3%, 0.4% and 0.3% of total assets at December 31, 2017, 2016, and 2015, respectively. The Bank's management believes that the $3,767,000 in non-accrual loans were appropriately reflected at their fair value at December 31, 2017. However, no assurance can be given that the existing or any additional collateral will be sufficient to secure full recovery of the obligations owed under these loans.
|
|
At December 31, 2017
|
At December 31, 2016
|
||||||||||||||||||||||
|
|
Gross
|
Guaranteed
|
Net
|
Gross
|
Guaranteed
|
Net
|
||||||||||||||||||
|
(dollars in thousands)
|
||||||||||||||||||||||||
|
Non-accrual loans
|
$
|
3,767
|
$
|
102
|
$
|
3,665
|
$
|
6,297
|
$
|
2,081
|
$
|
4,216
|
||||||||||||
|
Loans 90 days past due and still accruing
|
45
|
—
|
45
|
—
|
—
|
—
|
||||||||||||||||||
|
Total non-performing loans
|
3,812
|
102
|
3,710
|
6,297
|
2,081
|
4,216
|
||||||||||||||||||
|
Other real estate owned
|
—
|
—
|
—
|
—
|
—
|
—
|
||||||||||||||||||
|
Total non-performing assets
|
3,812
|
102
|
3,710
|
6,297
|
2,081
|
4,216
|
||||||||||||||||||
|
Non-performing loans (net of guarantees) to total loans
|
0.5
|
%
|
0.6
|
%
|
||||||||||||||||||||
|
Non-performing assets (net of guarantees) to total assets
|
0.3
|
%
|
0.4
|
%
|
||||||||||||||||||||
|
Allowance for loan and lease losses to non-performing loans (net of guarantees)
|
300.1
|
%
|
258.5
|
%
|
||||||||||||||||||||
|
|
At December 31, 2015
|
At December 31, 2014
|
||||||||||||||||||||||
|
|
Gross
|
Guaranteed
|
Net
|
Gross
|
Guaranteed
|
Net
|
||||||||||||||||||
|
(dollars in thousands)
|
||||||||||||||||||||||||
|
Non-accrual loans
|
$
|
2,728
|
$
|
152
|
$
|
2,576
|
$
|
5,237
|
$
|
82
|
$
|
5,155
|
||||||||||||
|
Loans 90 days past due and still accruing
|
2
|
—
|
2
|
—
|
—
|
—
|
||||||||||||||||||
|
Total non-performing loans
|
2,730
|
152
|
2,578
|
5,237
|
82
|
5,155
|
||||||||||||||||||
|
Other real estate owned
|
—
|
—
|
—
|
736
|
—
|
736
|
||||||||||||||||||
|
Total non-performing assets
|
2,730
|
152
|
2,578
|
5,973
|
82
|
5,891
|
||||||||||||||||||
|
Non-performing loans (net of guarantees) to total loans
|
0.4
|
%
|
0.9
|
%
|
||||||||||||||||||||
|
Non-performing assets (net of guarantees) to total assets
|
0.3
|
%
|
0.6
|
%
|
||||||||||||||||||||
|
Allowance for loan and lease losses to non-performing loans (net of guarantees)
|
358.8
|
%
|
166.5
|
%
|
||||||||||||||||||||
|
|
At December 31, 2013
|
|||||||||||
|
|
Gross
|
Guaranteed
|
Net
|
|||||||||
|
(dollars in thousands)
|
||||||||||||
|
Non-accrual loans
|
$
|
9,570
|
$
|
425
|
$
|
9,145
|
||||||
|
Loans 90 days past due and still accruing
|
—
|
—
|
—
|
|||||||||
|
Total non-performing loans
|
9,570
|
425
|
9,145
|
|||||||||
|
Other real estate owned
|
-
|
—
|
-
|
|||||||||
|
Total non-performing assets
|
9,570
|
425
|
9,145
|
|||||||||
|
Non-performing loans (net of guarantees) to total loans
|
1.8
|
%
|
||||||||||
|
Non-performing assets (net of guarantees) to total assets
|
1.0
|
%
|
||||||||||
|
Allowance for loan and lease losses to non-performing loans (net of guarantees)
|
102.3
|
%
|
||||||||||
OREO consists of property that the Company has acquired by deed in lieu of foreclosure or through foreclosure proceedings, and property that the Company does not hold title to but is in actual control of, known as in-substance foreclosure. The estimated fair value of the property is determined prior to transferring the balance to OREO. The balance transferred to OREO is the estimated fair value of the property less estimated cost to sell. Impairment may be deemed necessary to bring the book value of the loan equal to the appraised value. Appraisals or loan officer evaluations are then conducted periodically thereafter charging any additional impairment to the appropriate expense account. The Company had no OREO as of the periods ended December 31, 2017, 2016, and 2015.
39
Potential Problem Loans
The Company manages asset quality and credit risk by maintaining diversification in its loan portfolio and through review processes that include analysis of credit requests and ongoing examination of outstanding loans and delinquencies, with particular attention to portfolio dynamics and loan mix. The Company strives to identify loans experiencing difficulty early enough to correct the problems, to record charge-offs promptly based on realistic assessments of collectability and current collateral values and to maintain an adequate allowance for loan losses at all times. Asset quality reviews of loans and other non-performing assets are administered using credit risk rating standards and criteria similar to those employed by state and federal banking regulatory agencies. The federal banking regulatory agencies utilize the following definitions for assets adversely classified for supervisory purposes: "Substandard Assets: a substandard asset is inadequately protected by the current sound worth and paying capacity of the obligor or of the collateral pledged, if any. Assets so classified must have a well-defined weakness or weaknesses that jeopardize the liquidation of the debt. They are characterized by the distinct possibility that the institution will sustain some loss if the deficiencies are not corrected." "Doubtful Assets: An asset classified doubtful has all the weaknesses inherent in one classified substandard with the added characteristic that the weaknesses make collection or liquidation in full, on the basis of currently existing facts, conditions, and values, highly questionable and improbable." Other Real Estate Owned" and loans rated Substandard and Doubtful are deemed "classified assets". This category, which includes both performing and non-performing assets, receives an elevated level of attention regarding collection.
Commercial loans, whether secured or unsecured, generally are made to support the short-term operations and other needs of small businesses. These loans are generally secured by the receivables, equipment, and other real property of the business and are susceptible to the related risks described above. Problem commercial loans are generally identified by periodic review of financial information that may include financial statements, tax returns, and payment history of the borrower. Based on this information, the Company may decide to take any of several courses of action, including demand for repayment, requiring the borrower to provide a significant principal payment and/or additional collateral or requiring similar support from guarantors. Notwithstanding, when repayment becomes unlikely based on the borrower's income and cash flow, repossession or foreclosure of the underlying collateral may become necessary. Collateral values may be determined by appraisals obtained through Bank-approved, licensed appraisers, qualified independent third parties, purchase invoices, or other appropriate documentation. Appropriate valuations are obtained at origination of the credit and periodically thereafter (generally every 12 months depending on the collateral type and market conditions), once repayment is questionable, and the loan has been deemed classified.
Commercial real estate loans generally fall into two categories, owner-occupied and non-owner occupied. Loans secured by owner occupied real estate are primarily susceptible to changes in the market conditions of the related business. This may be driven by, among other things, industry changes, geographic business changes, changes in the individual financial capacity of the business owner, general economic conditions and changes in business cycles. These same risks apply to commercial loans whether secured by equipment, receivables or other personal property or unsecured. Problem commercial real estate loans are generally identified by periodic review of financial information that may include financial statements, tax returns, payment history of the borrower, and site inspections. Based on this information, the Company may decide to take any of several courses of action, including demand for repayment, requiring the borrower to provide a significant principal payment and/or additional collateral or requiring similar support from guarantors. Notwithstanding, when repayment becomes unlikely based on the borrower's income and cash flow, repossession or foreclosure of the underlying collateral may become necessary. Losses on loans secured by owner-occupied real estate, equipment, or other personal property generally are dictated by the value of underlying collateral at the time of default and liquidation of the collateral. When default is driven by issues related specifically to the business owner, collateral values tend to provide better repayment support and may result in little or no loss. Alternatively, when default is driven by more general economic conditions, underlying collateral generally has devalued more and results in larger losses due to default. Loans secured by non-owner occupied real estate are primarily susceptible to risks associated with swings in occupancy or vacancy and related shifts in lease rates, rental rates or room rates. Most often, these shifts are a result of changes in general economic or market conditions or overbuilding and resultant over-supply of space. Losses are dependent on the value of underlying collateral at the time of default. Values are generally driven by these same factors and influenced by interest rates and required rates of return as well as changes in occupancy costs. Collateral values may be determined by appraisals obtained through Bank-approved, licensed appraisers, qualified independent third parties, sales invoices, or other appropriate means. Appropriate valuations are obtained at origination of the credit and periodically thereafter (generally every 12 months depending on the collateral type and market conditions), once repayment is questionable, and the loan has been deemed classified.
Agricultural loans, whether secured or unsecured, generally are made to producers and processors of crops and livestock. Repayment is primarily from the sale of an agricultural product or service. Agricultural loans are generally secured by inventory, receivables, equipment, and other real property. Agricultural loans primarily are susceptible to changes in market demand for specific commodities. This may be exacerbated by, among other things, industry changes, changes in the individual financial capacity of the business owner, general economic conditions and changes in business cycles, as well as changing weather conditions. Problem agricultural loans are generally identified by periodic review of financial information that may include financial statements, tax returns, crop budgets, payment history, and crop inspections. Based on this information, the Company may decide to take any of several courses of action, including demand for repayment, requiring the borrower to provide a significant principal payment and/or additional collateral or requiring similar support from guarantors. Notwithstanding, when repayment becomes unlikely based on the borrower's income and cash flow, repossession or foreclosure of the underlying collateral may become necessary. Collateral values may be determined by appraisals obtained through Bank-approved, licensed appraisers, qualified independent third parties, purchase invoices, or other appropriate documentation. Appropriate valuations are obtained at origination of the credit and periodically thereafter (generally every 12 months depending on the collateral type and market conditions), once repayment is questionable, and the loan has been deemed classified.
40
Residential mortgage loans, which are secured by real estate, are primarily susceptible to three risks; non-payment due to diminished or lost income, over-extension of credit, a lack of borrower's cash flow to sustain payments, and shortfalls in collateral value. In general, non-payment is due to loss of employment and follows general economic trends in the marketplace, particularly the upward movement in the unemployment rate, loss of collateral value, and demand shifts.
Construction loans, whether owner occupied or non-owner occupied residential development loans, are not only susceptible to the related risks described above but the added risks of construction itself, including cost over-runs, mismanagement of the project, or lack of demand and market changes experienced at time of completion. Again, losses are primarily related to underlying collateral value and changes therein as described above. Problem construction loans are generally identified by periodic review of financial information that may include financial statements, tax returns and payment history of the borrower. Based on this information the Company may decide to take any of several courses of action, including demand for repayment, requiring the borrower to provide a significant principal payment and/or additional collateral or requiring similar support from guarantors, or repossession or foreclosure of the underlying collateral. Collateral values may be determined by appraisals obtained through Bank-approved, licensed appraisers, qualified independent third parties, purchase invoices, or other appropriate documentation. Appropriate valuations are obtained at origination of the credit and periodically thereafter (generally every 12 months depending on the collateral type and market conditions), once repayment is questionable, and the loan has been deemed classified.
Consumer loans, whether unsecured or secured, are primarily susceptible to four risks: non-payment due to diminished or lost income, over-extension of credit, a lack of borrower's cash flow to sustain payments, and shortfall in collateral value. In general, non-payment is due to loss of employment and will follow general economic trends in the marketplace, particularly the upward movements in the unemployment rate, loss of collateral value, and demand shifts.
Once a loan becomes delinquent or repayment becomes questionable, a Company collection officer will address collateral shortfalls with the borrower and attempt to obtain additional collateral or a principal payment. If this is not forthcoming and payment of principal and interest in accordance with the contractual terms of the loan agreement becomes unlikely, the Company will consider the loan to be impaired and will estimate its probable loss, using the present value of future cash flows discounted at the loan's effective interest rate, the loan's observable market price, or the fair value of the collateral if the loan is collateral dependent. For collateral dependent loans, the Company will utilize a recent valuation of the underlying collateral less estimated costs of sale, and charge-off the loan down to the estimated net realizable amount. Depending on the length of time until final collection, the Company may periodically revalue the estimated loss and take additional charge-offs or specific reserves as warranted. Revaluations may occur as often as every 3-12 months depending on the underlying collateral and volatility of values. Final charge-offs or recoveries are taken when the collateral is liquidated and the actual loss is confirmed. Unpaid balances on loans after or during collection and liquidation may also be pursued through legal action and attachment of wages or judgment liens on the borrower's other assets.
Excluding the non-performing loans cited previously, loans totaling $2,045,000 and $3,324,000 were classified as substandard or doubtful loans, representing potential problem loans at December 31, 2017 and 2016, respectively. In Management's opinion, the potential loss related to these problem loans was sufficiently covered by the Bank's existing loan loss reserve (Allowance for Loan Losses) at December 31, 2017 and 2016. The ratio of the Allowance for Loan Losses to total loans at December 31, 2017 and 2016 was 1.49% and 1.60%, respectively.
41
SUMMARY OF LOAN LOSS EXPERIENCE
The Company's allowance for credit losses is maintained at a level considered adequate to provide for losses that can be estimated based upon specific and general conditions. These include conditions unique to individual borrowers, as well as overall credit loss experience, the amount of past due, non-performing loans and classified loans, recommendations of regulatory authorities, prevailing economic conditions and other factors. A portion of the allowance is specifically allocated to classified loans whose full collectability is uncertain. Such allocations are determined by Management based on loan-by-loan analyses. In addition, loans with similar characteristics not usually criticized using regulatory guidelines are analyzed based on the historical loss rates and delinquency trends, grouped by the number of days the payments on these loans are delinquent. Last, allocations are made to non-criticized and classified commercial loans and residential real estate loans based on historical loss rates, and other statistical data. The remainder of the allowance is considered to be unallocated. The unallocated allowance is established to provide for probable losses that have been incurred as of the reporting date but not reflected in the allocated allowance. It addresses additional qualitative factors consistent with Management's analysis of the level of risks inherent in the loan portfolio, which are related to the risks of the Company's general lending activity. Included in the unallocated allowance is the risk of losses that are attributable to national or local economic or industry trends which have occurred but have yet been recognized in past loan charge-off history (external factors). The external factors evaluated by the Company include: economic and business conditions, external competitive issues, and other factors. Also included in the unallocated allowance is the risk of losses attributable to general attributes of the Company's loan portfolio and credit administration (internal factors). The internal factors evaluated by the Company include: loan review system, adequacy of lending Management and staff, loan policies and procedures, problem loan trends, concentrations of credit, and other factors. By their nature, these risks are not readily allocable to any specific loan category in a statistically meaningful manner and are difficult to quantify. Management assigns a range of estimated risk to the qualitative risk factors described above based on Management's judgment as to the level of risk and assigns a quantitative risk factor from the range of loss estimates to determine the appropriate level of the unallocated portion of the allowance. Management considered the $11,133,000 allowance for credit losses to be adequate as a reserve against losses as of December 31, 2017.
42
Analysis of the Allowance for Loan Losses
(Dollars in thousands)
|
|
2017
|
2016
|
2015
|
2014
|
2013
|
|||||||||||||||
|
|
||||||||||||||||||||
|
Balance at Beginning of Year
|
$
|
10,899
|
$
|
9,251
|
$
|
8,583
|
$
|
9,353
|
$
|
8,554
|
||||||||||
|
Provision for Loan Losses
|
600
|
1,800
|
650
|
1,800
|
1,200
|
|||||||||||||||
|
Loans Charged-Off:
|
||||||||||||||||||||
|
Commercial
|
(681
|
)
|
(446
|
)
|
(44
|
)
|
(2,288
|
)
|
(168
|
)
|
||||||||||
|
Commercial Real Estate
|
—
|
(15
|
)
|
(7
|
)
|
(69
|
)
|
(17
|
)
|
|||||||||||
|
Agriculture
|
—
|
—
|
—
|
—
|
(1
|
)
|
||||||||||||||
|
Residential Mortgage
|
(121
|
)
|
(13
|
)
|
(211
|
)
|
(71
|
)
|
(333
|
)
|
||||||||||
|
Residential Construction
|
—
|
—
|
—
|
—
|
(127
|
)
|
||||||||||||||
|
Consumer
|
(33
|
)
|
(65
|
)
|
(175
|
)
|
(393
|
)
|
(572
|
)
|
||||||||||
|
|
||||||||||||||||||||
|
Total Charged-Off
|
(835
|
)
|
(539
|
)
|
(437
|
)
|
(2,821
|
)
|
(1,218
|
)
|
||||||||||
|
|
||||||||||||||||||||
|
Recoveries:
|
||||||||||||||||||||
|
Commercial
|
302
|
37
|
102
|
58
|
377
|
|||||||||||||||
|
Commercial Real Estate
|
—
|
—
|
18
|
—
|
51
|
|||||||||||||||
|
Agriculture
|
—
|
81
|
—
|
—
|
3
|
|||||||||||||||
|
Residential Mortgage
|
96
|
1
|
219
|
—
|
157
|
|||||||||||||||
|
Residential Construction
|
5
|
5
|
60
|
86
|
45
|
|||||||||||||||
|
Consumer
|
66
|
263
|
56
|
107
|
184
|
|||||||||||||||
|
|
||||||||||||||||||||
|
Total Recoveries
|
469
|
387
|
455
|
251
|
817
|
|||||||||||||||
|
|
||||||||||||||||||||
|
Net (Charge-offs) Recoveries
|
(366
|
)
|
(152
|
)
|
18
|
(2,570
|
)
|
(401
|
)
|
|||||||||||
|
|
||||||||||||||||||||
|
Balance at End of Year
|
$
|
11,133
|
$
|
10,899
|
$
|
9,251
|
$
|
8,583
|
$
|
9,353
|
||||||||||
|
|
||||||||||||||||||||
|
Ratio of Net (Charge-Offs) Recoveries
|
||||||||||||||||||||
|
During the Year to Average Loans
|
||||||||||||||||||||
|
Outstanding During the Year
|
(0.05
|
%)
|
(0.02
|
%)
|
0.00
|
%
|
(0.49
|
%)
|
(0.09
|
%)
|
||||||||||
|
Allowance as a percentage of Total Loans
|
1.49
|
%
|
1.60
|
%
|
1.51
|
%
|
1.57
|
%
|
1.81
|
%
|
||||||||||
|
Allowance as a percentage of Non-performing loans, net of guarantees
|
300.1
|
%
|
258.5
|
%
|
358.8
|
%
|
166.5
|
%
|
102.3
|
%
|
||||||||||
43
Allocation of the Allowance for Loan Losses
The Allowance for Loan Losses has been established as a general component available to absorb probable inherent losses throughout the loan portfolio. The following table is an allocation of the Allowance for Loan Losses balance on the dates indicated (dollars in thousands):
|
|
December 31, 2017
|
December 31, 2016
|
December 31, 2015
|
|||||||||||||||||||||||||||||||||
|
|
||||||||||||||||||||||||||||||||||||
|
|
Allocation of Allowance for Loan Losses Balance
|
Allowance as a % of Total Allowance
|
Loans as a % of Total Loans, net
|
Allocation of Allowance for Loan Losses Balance
|
Allowance as a % of Total Allowance
|
Loans as a % of Total Loans, net
|
Allocation of Allowance for Loan Losses Balance
|
Allowance as a % of Total Allowance
|
Loans as a % of Total Loans, net
|
|||||||||||||||||||||||||||
|
Loan Type:
|
||||||||||||||||||||||||||||||||||||
|
|
||||||||||||||||||||||||||||||||||||
|
Commercial
|
$
|
2,625
|
23.7
|
%
|
18.0
|
%
|
$
|
3,571
|
32.8
|
%
|
18.3
|
%
|
$
|
3,097
|
33.5
|
%
|
22.0
|
%
|
||||||||||||||||||
|
Commercial Real Estate
|
5,460
|
49.0
|
%
|
53.2
|
%
|
3,910
|
35.9
|
%
|
50.9
|
%
|
3,343
|
36.1
|
%
|
47.8
|
%
|
|||||||||||||||||||||
|
Agriculture
|
1,547
|
13.9
|
%
|
15.2
|
%
|
1,262
|
11.6
|
%
|
15.0
|
%
|
1,060
|
11.5
|
%
|
13.9
|
%
|
|||||||||||||||||||||
|
Residential Mortgage
|
628
|
5.6
|
%
|
5.6
|
%
|
660
|
6.0
|
%
|
5.9
|
%
|
739
|
8.0
|
%
|
7.0
|
%
|
|||||||||||||||||||||
|
Residential Construction
|
360
|
3.2
|
%
|
2.8
|
%
|
440
|
4.0
|
%
|
3.5
|
%
|
334
|
3.6
|
%
|
1.9
|
%
|
|||||||||||||||||||||
|
Consumer
|
342
|
3.1
|
%
|
5.2
|
%
|
498
|
4.6
|
%
|
6.4
|
%
|
641
|
6.9
|
%
|
7.4
|
%
|
|||||||||||||||||||||
|
Unallocated
|
171
|
1.5
|
%
|
—
|
558
|
5.1
|
%
|
—
|
37
|
0.4
|
%
|
—
|
||||||||||||||||||||||||
|
|
||||||||||||||||||||||||||||||||||||
|
Total
|
$
|
11,133
|
100.0
|
%
|
100.0
|
%
|
$
|
10,899
|
100.0
|
%
|
100.0
|
%
|
$
|
9,251
|
100.0
|
%
|
100.0
|
%
|
||||||||||||||||||
|
|
December 31, 2014
|
December 31, 2013
|
||||||||||||||||||||||
|
|
||||||||||||||||||||||||
|
|
Allocation of Allowance for Loan Losses Balance
|
Allowance as a % of Total Allowance
|
Loans as a % of Total Loans, net
|
Allocation of Allowance for Loan Losses Balance
|
Allowance as a % of Total Allowance
|
Loans as a % of Total Loans, net
|
||||||||||||||||||
|
Loan Type:
|
||||||||||||||||||||||||
|
|
||||||||||||||||||||||||
|
Commercial
|
$
|
3,581
|
41.7
|
%
|
21.8
|
%
|
$
|
3,199
|
34.2
|
%
|
21.2
|
%
|
||||||||||||
|
Commercial Real Estate
|
1,825
|
21.2
|
%
|
47.5
|
%
|
2,290
|
24.5
|
%
|
46.0
|
%
|
||||||||||||||
|
Agriculture
|
580
|
6.8
|
%
|
11.3
|
%
|
557
|
6.0
|
%
|
10.1
|
%
|
||||||||||||||
|
Residential Mortgage
|
1,181
|
13.8
|
%
|
9.2
|
%
|
1,216
|
13.0
|
%
|
10.2
|
%
|
||||||||||||||
|
Residential Construction
|
161
|
1.9
|
%
|
1.1
|
%
|
441
|
4.7
|
%
|
2.0
|
%
|
||||||||||||||
|
Consumer
|
886
|
10.3
|
%
|
9.1
|
%
|
1,023
|
10.9
|
%
|
10.5
|
%
|
||||||||||||||
|
Unallocated
|
369
|
4.3
|
%
|
—
|
627
|
6.7
|
%
|
—
|
||||||||||||||||
|
|
||||||||||||||||||||||||
|
Total
|
$
|
8,583
|
100.0
|
%
|
100.0
|
%
|
$
|
9,353
|
100.0
|
%
|
100.0
|
%
|
||||||||||||
The Bank believes that any breakdown or allocation of the allowance into loan categories lends an appearance of exactness, which does not exist, because the allowance is available for all loans. The allowance breakdown shown above is computed taking actual experience into consideration but should not be interpreted as an indication of the specific amount and allocation of actual charge-offs that may ultimately occur.
44
Deposits
The following table sets forth the average amount and the average rate paid on each of the listed deposit categories (dollars in thousands) during the periods specified:
|
|
2017
|
2016
|
2015
|
|||||||||||||||||||||
|
|
Average Amount
|
Average Rate
|
Average Amount
|
Average Rate
|
Average Amount
|
Average Rate
|
||||||||||||||||||
|
|
||||||||||||||||||||||||
|
Deposit Type:
|
||||||||||||||||||||||||
|
|
||||||||||||||||||||||||
|
Non-interest-Bearing Demand
|
$
|
361,729
|
—
|
$
|
329,933
|
—
|
$
|
303,760
|
—
|
|||||||||||||||
|
|
||||||||||||||||||||||||
|
Interest-Bearing Demand (NOW)
|
$
|
293,464
|
0.08
|
%
|
$
|
269,197
|
0.11
|
%
|
$
|
243,063
|
0.12
|
%
|
||||||||||||
|
|
||||||||||||||||||||||||
|
Savings and MMDAs
|
$
|
335,709
|
0.16
|
%
|
$
|
309,638
|
0.17
|
%
|
$
|
276,561
|
0.19
|
%
|
||||||||||||
|
|
||||||||||||||||||||||||
|
Time
|
$
|
77,705
|
0.39
|
%
|
$
|
84,087
|
0.40
|
%
|
$
|
84,038
|
0.40
|
%
|
||||||||||||
The following table sets forth by time remaining to maturity the Bank's time deposits over $250,000 (dollars in thousands) as of December 31, 2017:
|
Three months or less
|
$
|
2,093
|
||
|
|
||||
|
Over three months through twelve months
|
9,454
|
|||
|
|
||||
|
Over twelve months
|
7,344
|
|||
|
|
||||
|
Total
|
$
|
18,891
|
Short-Term Borrowings
The Company had no secured borrowings and no Federal Funds purchased at December 31, 2017 and December 31, 2016.
Additional short-term borrowings available to the Company consist of a line of credit and advances from the Federal Home Loan Bank ("FHLB") secured under terms of a blanket collateral agreement by a pledge of FHLB stock and certain other qualifying collateral such as commercial and mortgage loans. At December 31, 2017, the Company had collateral borrowing capacity from the FHLB of $308,657,000 and at such date, also had unsecured Federal Funds lines of credit totaling $80,000,000 with correspondent banks.
Long-Term Borrowings
The Company had no long-term borrowings at December 31, 2017 and 2016. Average outstanding balances of long-term borrowings, were $0 during 2017 and 2016.
Supplemental Compensation Plans
The Company and the Bank maintain an unfunded non-contributory defined benefit pension plan ("Salary Continuation Plan") and related split dollar plan for a select group of highly compensated employees. Eligibility to participate in the Salary Continuation Plan is limited to a select group of management or highly compensated employees of the Bank that are designated by the Board. Additionally, the Company and the Bank adopted a supplemental executive retirement plan ("SERP") in 2006. The SERP is intended to integrate the various forms of retirement payments offered to executives. There are currently three participants in the SERP. At December 31, 2017 and 2016, the accrued benefit obligation was $3,450,000 and $3,381,000, respectively, and is recorded in interest payable and other liabilities in the Consolidated Statements of Condition.
The Company and the Bank maintain an unfunded non-contributory defined benefit pension plan ("Directors' Retirement Plan") and related split dollar plan for the directors of the Bank. At December 31, 2017 and 2016, the accrued benefit obligation was $860,000 and $852,000, respectively, and is recorded in interest payable and other liabilities in the Consolidated Statements of Condition.
For additional information, see Note 16 to the Consolidated Financial Statements in this Form 10-K.
45
Overview
Year Ended December 31, 2017 Compared to Year Ended December 31, 2016
Net income for the year ended December 31, 2017, was $8.7 million, representing an increase of $0.6 million, or 7.4%, compared to net income of $8.1 million for the year ended December 31, 2016. The increase in net income was principally attributable to a $4.1 million increase in interest income, a $1.2 million decrease in provision for loan loss, and a $0.9 million increase in non-interest income, which was partially offset by a $2.0 million increase in non-interest expense and a $3.4 million increase in provision for income tax. On December 22, 2017, the Tax Cuts and Jobs Act was signed into law. Among other changes, the new law provides a reduction in the federal corporate income tax rate from 35% to 21% effective January 1, 2018. As a result of the reduction in the corporate income tax rate, the Company re-measured its net deferred tax asset in December 2017 (as was required given the law was enacted in 2017 even though the tax rate reduction did not take effect until 2018). This re-measurement resulted in a reduction in the value of our net deferred tax asset of $1.7 million, or $0.14 per diluted share, which was recorded as additional income tax expense for 2017.
Total assets increased by $50.9 million, or 4.4%, to $1.218 billion as of December 31, 2017, compared to $1.167 billion at December 31, 2016. The increase in total assets was mainly due to a $67.1 million increase in net loans (including loans held-for-sale) and a $3.7 million increase in investment securities, which was partially offset by a $14.2 million decrease in certificates of deposit and a $6.8 million decrease in cash and cash equivalents. Total deposits increased $41.0 million, or 3.9%, to $1.105 billion as of December 31, 2017, compared to $1.064 billion at December 31, 2016.
Year Ended December 31, 2016 Compared to Year Ended December 31, 2015
Net income available to common shareholders for the year ended December 31, 2016, was $8.1 million, representing an increase of $1.3 million, or 19.1%, compared to net income available to common shareholders of $6.8 million for the year ended December 31, 2015. The increase in net income available to common shareholders was principally attributable to a $4.5 million increase in interest income, which was partially offset by a $1.2 million increase in provision for loan loss, a $0.8 million increase in non-interest expense, and a $1.1 million increase in provision for income tax.
Total assets increased by $122.1 million, or 11.7%, to $1.167 billion as of December 31, 2016, compared to $1.045 billion at December 31, 2015. The increase in total assets was mainly due to a $93.7 million increase in investment securities and a $66.9 million increase in net loans (including loans held-for-sale), which was partially offset by a $41.2 million decrease in cash. Total deposits increased $115.6 million, or 12.2%, to $1.064 billion as of December 31, 2016, compared to $948.1 million at December 31, 2015.
46
Results of Operations
Net Interest Income
Net interest income is the excess of interest and fees earned on the Bank's loans, investment securities, federal funds sold and banker's acceptances over the interest expense paid on deposits, mortgage notes and other borrowed funds. It is primarily affected by the yields on the Bank's interest-earning assets and loan fees and interest-bearing liabilities outstanding during the period. The $4,128,000 increase in the Bank's net interest income in 2017 from 2016 was due primarily to the effects of higher loan and investment securities volumes and higher interest rates on both loan and investment securities. The $4,524,000 increase in the Bank's net interest income in 2016 from 2015 was due primarily to the effects of higher loan and investment securities volumes, and higher loan interest rates, which was partially offset by lower return on investment securities.
Since the financial crisis of 2008, the banking industry has operated in an extremely low interest rate environment relative to historical averages, and the FRB has pursued a variety of monetary measures aimed at sustaining a very low interest rate environment in the U.S. in an effort to stimulate economic growth and reduce levels of unemployment, including purchases of long-term U.S. Treasury and federal agency backed securities and maintaining a very low target range for the federal funds rate. These policies of the FRB for the past several years have placed a downward pressure on the net interest margins of banks in the United States, including that of the Bank. In December 2016, the FRB raised the target range for the federal funds rate to 0.50% to 0.75%. In 2017, the FRB raised the federal funds rate by 25 bps three times in March, June, and December. In December 2017, the target range for the federal funds rate was 1.25% to 1.50%. The FRB also began to reduce its balance sheet. The FRB expects that economic conditions will evolve in a manner that will warrant gradual increases in the federal funds rate; the federal funds rate is likely to remain, for some time, below levels that are expected to prevail in the longer run. However, the actual path of the federal funds rate will depend on the economic outlook as informed by incoming data. See "Analysis of Changes in Interest Income and Interest Expense" set forth on page 34 of this Annual Report on Form 10-K for a discussion of the effects of interest rates and loan/deposit volume on net interest income. Another factor that affected net interest income was the average earning asset to average total asset ratio. This ratio was 94.9% in 2017, 94.6% in 2016, and 94.5% in 2015.
The nature and impact of future changes in such policies on the business and earnings of the Company cannot be predicted. Additionally, state and federal tax policies can impact banking organizations.
Interest income on loans for 2017 was up 7.9% from 2016, increasing from $30,697,000 to $33,115,000, and was up 12.4% from 2016 to 2015, increasing from $27,304,000 to $30,697,000. The increase in interest income on loans for 2017 as compared to 2016 was the result of a 7.3% increase in average loan volume and a 3 basis point increase in loan yields. The increase in interest income on loans for 2016 as compared to 2015 was the result of an 11.9% increase in average loan volume and a 2 basis point increase in loan yields.
Interest income on investment securities for 2017 was up 30.1% from 2016, increasing from $3,858,000 to $5,019,000, and was up 28.8% from 2016 to 2015, increasing from $2,996,000 to $3,858,000. The increase in interest income on investment securities for 2017 as compared to 2016 was the result of a 25.2% increase in average investment securities volume and a 6 basis point increase in investment securities yields. The increase in interest income on investment securities for 2016 as compared to 2015 was the result of a 54.6% increase in average investment securities volume, which was partially offset by a 32 basis point decrease in investment securities yields. The Bank's strategy in 2017 was to use its excess cash to purchase investment securities and increase the investment portfolio. Investment securities yields were 1.69%, 1.63%, and 1.95% for 2017, 2016, and 2015, respectively.
Interest income on interest-bearing due from banks for 2017 was up 91.4% from 2016, increasing from $746,000 to $1,428,000, and was up 31.8% from 2016 to 2015, increasing from $566,000 to $746,000. The increase in interest income on interest-bearing due from banks for 2017 as compared to 2016 was the result of a 58 basis point increase in yield on interest-bearing due from banks, which was partially offset by a 9.3% decrease in average balances of interest-bearing due from banks. The increase in interest income on interest-bearing due from banks for 2016 as compared to 2015 was the result of a 25 basis point increase in yield on interest-bearing due from banks, which was partially offset by a 34.1% decrease in average balances of interest-bearing due from banks.
Interest income on certificates of deposit for 2017 was down 50.3% from 2016, decreasing from $145,000 to $72,000, and was up 55.9% from 2016 to 2015, increasing from $93,000 to $145,000. The decrease in interest income on certificates of deposit for 2017 as compared to 2016 was the result of a 58.3% decrease in average balances of certificates of deposit, which was partially offset by a 17 basis point increase in yield on certificates of deposit. The increase in interest income on interest-bearing due from banks for 2016 as compared to 2015 was the result of a 14 basis point increase in yield on certificates of deposit and a 30.8% increase in average balances of certificates of deposit.
Interest expense on deposits for 2017 was down 6.7% from 2016, decreasing from $1,157,000 to $1,079,000, and was up 0.3% from 2016 to 2015, increasing from $1,154,000 to $1,157,000. The decrease in interest expense on deposits for 2017 as compared to 2016 was the result of a 2 basis point decrease in interest rates paid on interest-bearing deposits, which was partially offset by a 6.6% increase in average balances of interest-bearing deposits. The increase in interest expense on deposits for 2016 as compared to 2015 was the result of a 9.8% increase in average balances of interest-bearing deposits, which was partially offset by a 2 basis point decrease in interest rates paid on interest-bearing deposits.
47
The mix of deposits for the previous three years was as follows (dollars in thousands):
|
|
2017
|
2016
|
2015
|
|||||||||||||||||||||
|
|
||||||||||||||||||||||||
|
|
Average Balance
|
Percent
|
Average Balance
|
Percent
|
Average Balance
|
Percent
|
||||||||||||||||||
|
|
||||||||||||||||||||||||
|
Non-interest-Bearing Demand
|
$
|
361,729
|
33.8
|
%
|
$
|
329,933
|
33.2
|
%
|
$
|
303,760
|
33.5
|
%
|
||||||||||||
|
|
||||||||||||||||||||||||
|
Interest-Bearing Demand (NOW)
|
293,464
|
27.5
|
%
|
269,197
|
27.1
|
%
|
243,063
|
26.8
|
%
|
|||||||||||||||
|
|
||||||||||||||||||||||||
|
Savings and MMDAs
|
335,709
|
31.4
|
%
|
309,638
|
31.2
|
%
|
276,561
|
30.5
|
%
|
|||||||||||||||
|
|
||||||||||||||||||||||||
|
Time
|
77,705
|
7.3
|
%
|
84,087
|
8.5
|
%
|
84,038
|
9.2
|
%
|
|||||||||||||||
|
|
||||||||||||||||||||||||
|
Total
|
$
|
1,068,607
|
100.0
|
%
|
$
|
992,855
|
100.0
|
%
|
$
|
907,422
|
100.0
|
%
|
||||||||||||
Loan rates decreased in 2015 and increased in 2016 and 2017. Deposit rates decreased in 2017, 2016, and 2015. The Bank's net interest margin (net interest income divided by average earning assets) was 3.48% in 2017, 3.37% in 2016 and 3.17% in 2015. The net spread between the rate for total earning assets and the rate for interest-bearing deposits and borrowed funds increased 12 basis points in the period from 2016 to 2017 and increased 21 basis point in the period from 2015 to 2016. The increase in 2017 from 2016 was primarily due to an overall increase in interest rates on earning assets coupled with a decrease in interest paid on interest-bearing deposits.
Provision for Loan Losses
The provision for loan losses is established by charges to earnings based on management's overall evaluation of the collectability of the loan portfolio. Based on this evaluation, the provision for loan losses decreased to $600,000 in 2017 from $1,800,000 in 2016, primarily as a result of a decrease in specific reserves on impaired loans and improved credit quality, which was partially offset by an increase in loan balances as well as an increase in qualitative risk factors. The amount of loans charged-off increased in 2017 to $835,000 from $539,000 in 2016, and recoveries increased to $469,000 in 2017 from $387,000 in 2016. The increase in charge-offs was due to an increase in charge-offs on commercial and residential mortgage loans, which was partially offset by a decrease in charge-offs of commercial real estate and consumer loans. The ratio of the Allowance for Loan Losses to total loans at December 31, 2017 was 1.49% compared to 1.60% at December 31, 2016. The ratio of the Allowance for Loan Losses to total non-accrual loans and loans past due 90 days or more, net of guarantees was 300.1% at December 31, 2017, compared to 258.5% at December 31, 2016.
The provision for loan losses increased to $1,800,000 in 2016 from $650,000 in 2015, primarily as a result of increased charge-offs and loan volumes, which was offset by improved credit quality. The amount of loans charged-off increased in 2016 to $539,000 from $437,000 in 2015, and recoveries decreased to $387,000 in 2016 from $455,000 in 2015. The increase in charge-offs was due to an increase in charge-offs of commercial loans, which was partially offset by a decrease in charge-offs of residential mortgage and consumer loans. The ratio of the Allowance for Loan Losses to total loans at December 31, 2016 was 1.60% compared to 1.51% at December 31, 2015. The ratio of the Allowance for Loan Losses to total non-accrual loans and loans past due 90 days or more, net of guarantees was 258.5% at December 31, 2016, compared to 358.8% at December 31, 2015.
48
Non-Interest Income and Expenses
Non-interest income consisted primarily of service charges on deposit accounts, net gains on sales of investment securities, net realized gains on loans held-for-sale, and other income. In 2017, the Company recognized a pre-tax gain of $1,187,000 on a sale-leaseback transaction related to land and building which is partially occupied by a Bank branch. The lease carries an initial term of six years and is classified as an operating lease. The sale resulted in a total gain of $1,682,000, of which $495,000 was deferred as a component of Other Liabilities and is being accounted for as a reduction of Occupancy and equipment expense over the initial lease term. Service charges on deposit accounts decreased $54,000 in 2017 over 2016 and increased $5,000 in 2016 over 2015. Realized gains on sale of investment securities decreased $13,000 in 2017 over 2016 and decreased $30,000 in 2016 over 2015. The decrease in 2017 was primarily due to a decrease in fair value of securities sold. Net realized gains on loans held-for-sale decreased $330,000 in 2017 over 2016 and increased $57,000 in 2016 over 2015. The decrease in 2017 was primarily due to a decrease in the volume of loan sales. Gains on sales of other real estate owned decreased $4,000 in 2017 over 2016 and decreased $212,000 in 2016 over 2015. The decrease in 2017 was due to no sales of other real estate owned in 2017. Other income increased $64,000 in 2017 over 2016 and decreased $138,000 in 2016 over 2015. The increase in 2017 was due, for the most part, to increases in investment and brokerage income, mortgage brokerage income, fiduciary activities income, and debit card income, which was partially offset by a decrease in loan servicing income.
Non-interest expenses consisted primarily of salaries and employee benefits, occupancy and equipment expense, data processing expense, stationery and supplies expense, advertising and other expenses. Non-interest expenses increased to $29,400,000 in 2017 from $27,352,000 in 2016, and increased to $27,352,000 in 2016 from $26,571,000 in 2015, representing an increase of $2,048,000, or 7.5%, in 2017 over 2016, and an increase of $781,000, or 2.9%, in 2016 over 2015.
Following is an analysis of the increase or decrease in the components of non-interest expenses (dollars in thousands) during the periods specified:
|
|
2017 over 2016
|
2016 over 2015
|
||||||||||||||
|
|
||||||||||||||||
|
|
Amount
|
Percent
|
Amount
|
Percent
|
||||||||||||
|
|
||||||||||||||||
|
Salaries and Employee Benefits
|
$
|
1,513
|
9.0
|
%
|
$
|
574
|
3.5
|
%
|
||||||||
|
Occupancy and Equipment
|
(81
|
)
|
(2.8
|
%)
|
113
|
4.0
|
%
|
|||||||||
|
Data Processing
|
238
|
15.2
|
%
|
(96
|
)
|
(5.8
|
%)
|
|||||||||
|
Stationery and Supplies
|
(13
|
)
|
(3.8
|
%)
|
(1
|
)
|
(0.3
|
%)
|
||||||||
|
Advertising
|
20
|
6.5
|
%
|
(3
|
)
|
(1.0
|
%)
|
|||||||||
|
Directors Fees
|
18
|
6.2
|
%
|
(6
|
)
|
(2.0
|
%)
|
|||||||||
|
OREO Expense and Impairment
|
4
|
200.0
|
%
|
1
|
100.0
|
%
|
||||||||||
|
(Recovery) Impairment on Equity Investment
|
—
|
0.0
|
%
|
12
|
(100.0
|
%)
|
||||||||||
|
Other Expense
|
349
|
6.8
|
%
|
187
|
3.8
|
%
|
||||||||||
|
|
||||||||||||||||
|
Total
|
$
|
2,048
|
7.5
|
%
|
$
|
781
|
2.9
|
%
|
||||||||
The increase in salaries and employee benefits in 2017 was primarily due to a 6% increase in regular salaries, 4% increase in payroll taxes, and 34% increase in profit sharing expense. The increase in regular salaries expense and related payroll tax expense was due to current year salary increases and increases in staffing levels. The increase in profit sharing expense was due to increased performance results of the Company. The decrease in occupancy and equipment expense in 2017 was primarily due to decreases in rent expense and depreciation expense. The decrease in rent expense was primarily due to the amortization of the deferred portion of the gain on sale of lease-back transaction discussed in Non-Interest Income above. The increase in other expenses in 2017 was primarily due to an increase in amortization expense on housing tax credits, sundry losses, and off-balance sheet loan losses.
The increase in salaries and employee benefits in 2016 was primarily due to increases in regular salaries, contingent compensation expense, and profit sharing expense. The increase in regular salaries expense was due to current year salary increases and an increase in staffing. The increase in contingent compensation was due to the increased performance results of the Company when compared with budgeted goals for the year. The increase in profit sharing expense was due to increased performance results of the Company. The increase in occupancy and equipment expense in 2016 was primarily due to increases in rent expense, utilities expense, and branch relocation expenses. The increase in rent expense was primarily due to the addition of new leases. The increase in other expenses in 2016 was primarily due to an increase in debit card expenses, which was partially offset by a decrease in legal expenses.
49
Income Taxes
The provision for income taxes is primarily affected by the tax rate, the level of earnings before taxes and the level of tax-exempt income. In 2017, tax expense increased $3,433,000 to $8,318,000 from $4,885,000 for 2016. In 2016, tax expense increased $1,145,000 to $4,885,000 from $3,740,000 for 2015. On December 22, 2017, the Tax Cuts and Jobs Act was signed into law. Among other changes, the new law provides a reduction in the federal corporate income tax rate from 35% to 21% effective January 1, 2018. As a result of the reduction in the corporate income tax rate, the Company re-measured its net deferred tax asset in December 2017 (as was required given the law was enacted in 2017 even though the tax rate reduction did not take effect until 2018). This re-measurement resulted in a reduction in the value of our net deferred tax asset of $1,700,000, or $0.14 per diluted share, which was recorded as additional income tax expense for 2017. In addition to the increase due to tax reform, the increase in taxable income contributed to the increase in provision in 2017. The increase in 2016 was primarily attributable to an increase in taxable income. Non-taxable municipal bond income was $257,000, $276,000, and $271,000 for the years ended December 31, 2017, 2016, and 2015, respectively.
Liquidity
Liquidity is defined as the ability to generate cash at a reasonable cost to fulfill lending commitments and support asset growth, while satisfying the withdrawal demands of deposit customers and any debt repayment requirements. The Bank's principal sources of liquidity are core deposits and loan and investment payments and prepayments. Providing a secondary source of liquidity is the available-for-sale investment portfolio. The Company held $280,741,000 in total investment securities at December 31, 2017. Under certain deposit, borrowing, and other arrangements, the Company must hold and pledge investment securities as collateral. At December 31, 2017, such collateral requirements totaled approximately $32,399,000. As a smaller source of liquidity, the Bank can utilize existing credit arrangements.
The Company's primary source of liquidity on a stand-alone basis is dividends from the Bank. As discussed in Part I (Item 1) of this Annual Report on Form 10-K, dividends from the Bank are subject to regulatory and corporate law restrictions.
Liquidity risk can result from the mismatching of asset and liability cash flows, or from disruptions in the financial markets. As discussed in Part I (Item 1) of this Annual Report on Form 10-K, the Bank experiences seasonal swings in deposits, which impact liquidity. Management has sought to address these seasonal swings by scheduling investment maturities and developing seasonal credit arrangements with the Federal Home Loan Bank, Federal Reserve Bank and Federal Funds lines of credit with correspondent banks. In addition, the ability of the Bank's real estate department to originate and sell loans into the secondary market has provided another tool for the management of liquidity. As of December 31, 2017, the Company has not created any special purpose entities to securitize assets or to obtain off-balance sheet funding.
The liquidity position of the Bank is managed daily, thus enabling the Bank to adapt its position according to market fluctuations. Liquidity is measured by various ratios, the most common of which is the ratio of net loans (including loans held-for-sale) to deposits. This ratio was 67.0% on December 31, 2017, 63.3% on December 31, 2016, and 63.9% on December 31, 2015. At December 31, 2017 and 2016, the Bank's ratio of core deposits to total assets was 89.2% and 89.9%, respectively. Core deposits include demand deposits, interest-bearing transaction deposits, savings and money market deposit accounts, and time deposits $250,000 or less. Core deposits are important in maintaining a strong liquidity position as they represent a stable and relatively low cost source of funds. Management believes that the Bank's liquidity position was adequate in 2017. This is best illustrated by the change in the Bank's net non-core ratio, which explains the degree of reliance on non-core liabilities to fund long-term assets. At December 31, 2017, the Bank's net core funding dependence ratio, the difference between non-core funds, time deposits $250,000 or more and brokered time deposits under $250,000, and short-term investments to long-term assets, was (12.22%) as of December 31, 2017 and (15.54%) as of December 31, 2016. This ratio indicated at December 31, 2017, the Bank did not significantly rely upon non-core deposits and borrowings to fund the Bank's long-term assets, namely loans and investments. The Bank believes that by maintaining adequate volumes of short-term investments and implementing competitive pricing strategies on deposits, it can ensure adequate liquidity to support future growth. The Bank also believes that its liquidity position remains strong to meet both present and future financial obligations and commitments, events or uncertainties that have resulted or are reasonably likely to result in material changes with respect to the Bank's liquidity.
50
Contractual Obligations
The Company has various financial obligations, including contractual obligations and commitments that will require future cash payments. The following table presents, as of December 31, 2017, the Company's significant fixed and determinable contractual obligations to third parties by payment date (amounts in thousands):
|
|
Payments due by period
|
|||||||||||||||||||
|
Contractual Obligations
|
Total
|
Less than 1 year
|
1-3 years
|
3-5 years
|
More than 5 years
|
|||||||||||||||
|
|
||||||||||||||||||||
|
Deposits without a stated maturity (a)
|
$
|
1,031,318
|
$
|
1,031,318
|
$
|
—
|
$
|
—
|
$
|
—
|
||||||||||
|
Certificates of Deposit (a)
|
73,422
|
55,209
|
15,227
|
2,986
|
—
|
|||||||||||||||
|
Operating Leases
|
5,523
|
934
|
1,596
|
1,406
|
1,587
|
|||||||||||||||
|
Purchase Obligations
|
1,932
|
1,932
|
—
|
—
|
—
|
|||||||||||||||
|
Total
|
$
|
1,112,195
|
$
|
1,089,393
|
$
|
16,823
|
$
|
4,392
|
$
|
1,587
|
||||||||||
| (a) |
Excludes interest
|
The Company's operating lease obligations represent short-term and long-term lease and rental payments for facilities, certain software and data processing and other equipment. Purchase obligations represent obligations under agreements to purchase goods or services that are enforceable and legally binding on the Company and that specify all significant terms, including: fixed or minimum quantities to be purchased; fixed, minimum or variable price provisions; and the approximate timing of the transaction. The purchase obligation amounts presented above primarily relate to certain contractual payments for services provided for information technology, capital expenditures, and the outsourcing of certain operational activities.
Commitments
The following table details the amounts and expected maturities of commitments as of December 31, 2017 (amounts in thousands):
|
|
Maturities by period
|
|||||||||||||||||||
|
Commitments
|
Total
|
Less than 1 year
|
1-3 years
|
3-5 years
|
More than 5 years
|
|||||||||||||||
|
|
||||||||||||||||||||
|
Commitments to extend credit
|
||||||||||||||||||||
|
Commercial
|
$
|
89,023
|
$
|
67,113
|
$
|
12,828
|
$
|
6,998
|
$
|
2,084
|
||||||||||
|
Commercial Real Estate
|
17,667
|
6,949
|
—
|
8
|
10,710
|
|||||||||||||||
|
Agriculture
|
26,575
|
13,981
|
6,988
|
—
|
5,606
|
|||||||||||||||
|
Residential Mortgage
|
885
|
750
|
—
|
—
|
135
|
|||||||||||||||
|
Residential Construction
|
27,875
|
16,625
|
11,250
|
—
|
—
|
|||||||||||||||
|
Consumer
|
58,857
|
16,533
|
5,905
|
6,282
|
30,137
|
|||||||||||||||
|
Commitments to sell loans
|
1,283
|
1,283
|
—
|
—
|
—
|
|||||||||||||||
|
Standby Letters of Credit
|
2,635
|
2,497
|
138
|
—
|
—
|
|||||||||||||||
|
Total
|
$
|
224,800
|
$
|
125,731
|
$
|
37,109
|
$
|
13,288
|
$
|
48,672
|
||||||||||
Commitments to extend credit are agreements to lend to a customer as long as there is no violation of any condition established in the contract. Commitments generally have fixed expiration dates or other termination clauses and may require payment of a fee. Since many of the commitments are expected to expire without being drawn upon, the total commitment amounts do not necessarily represent future cash requirements.
51
Off-Balance Sheet Arrangements
The Company is a party to financial instruments with off-balance sheet risk in the normal course of business to meet the financing needs of its customers. These financial instruments include commitments to extend credit in the form of loans or through standby letters of credit. These instruments involve, to varying degrees, elements of credit and interest rate risk in excess of the amounts recognized in the balance sheet. The contract amounts of those instruments reflect the extent of involvement the Company has in particular classes of financial instruments. These loans have been sold to third parties without recourse, subject to customary default, representations and warranties, recourse for breaches of the terms of the sales contracts and payment default recourse.
Financial instruments, whose contract amounts represent credit risk at December 31 of the indicated years, were as follows (amounts in thousands):
|
|
2017
|
2016
|
||||||
|
|
||||||||
|
Undisbursed loan commitments
|
$
|
220,882
|
$
|
207,207
|
||||
|
Standby letters of credit
|
2,635
|
3,518
|
||||||
|
Commitments to sell loans
|
1,283
|
1,848
|
||||||
|
|
||||||||
|
|
$
|
224,800
|
$
|
212,573
|
||||
The Bank expects its liquidity position to remain strong in 2018 as the Bank expects to continue to grow into existing markets. The stock market remained volatile this past year, but with the overall trend being favorable. While the Bank did not experience an outflow of deposits in 2017, the potential of outflows still exists if the stock market values continue to improve. Regardless of the outcome, the Bank believes that it has the means to provide adequate liquidity for funding normal operations in 2018.
Capital
The Company believes a strong capital position is essential to the Company's continued growth and profitability. A solid capital base provides depositors and shareholders with a margin of safety, while allowing the Company to take advantage of profitable opportunities, support future growth and provide protection against any unforeseen losses.
At December 31, 2017, stockholders' equity totaled $100.0 million, an increase of $8.4 million from $92.3 million at December 31, 2016. The increase was primarily due to net income of $8.7 million, which was partially offset by other comprehensive income, net of tax from unrealized loss on sale of securities and retirement plans adjustments of $2.0 million. Also affecting capital in 2017 was paid in capital in the amount of $0.5 million resulting from employee stock purchases and stock plan accruals. The Company's Tier 1 Leverage Capital ratio was 8.6% and 8.2% at December 31, 2017 and December 31, 2016, respectively. See the section entitled "Business – Supervision and Regulation of Bank" for additional information.
The capital of the Company and the Bank historically have been maintained at a level that is in excess of regulatory guidelines for a "well capitalized" institution. The policy of annual stock dividends has, over time, allowed the Company to match capital and asset growth through retained earnings and a managed program of geographic growth.
52
Quarterly Financial Data
|
2017 Quarters Ended
|
||||||||||||||||
|
|
Dec. 31
|
Sept. 30
|
Jun. 30
|
Mar. 31
|
||||||||||||
|
|
||||||||||||||||
|
Interest and Dividend Income
|
$
|
10,371
|
$
|
10,219
|
$
|
9,849
|
$
|
9,578
|
||||||||
|
Interest Expense
|
287
|
272
|
255
|
265
|
||||||||||||
|
Net Interest Income
|
10,084
|
9,947
|
9,594
|
9,313
|
||||||||||||
|
Provision for Loan Losses
|
—
|
—
|
—
|
600
|
||||||||||||
|
Net Interest Income after Provision for Loan Losses
|
10,084
|
9,947
|
9,594
|
8,713
|
||||||||||||
|
Non-Interest Income
|
1,748
|
1,780
|
1,755
|
2,845
|
||||||||||||
|
Non-Interest Expense
|
7,516
|
7,161
|
7,220
|
7,503
|
||||||||||||
|
Income before Taxes
|
4,316
|
4,566
|
4,129
|
4,055
|
||||||||||||
|
Provision for Taxes
|
(3,429
|
)
|
(1,766
|
)
|
(1,581
|
)
|
(1,542
|
)
|
||||||||
|
Net Income
|
$
|
887
|
$
|
2,800
|
$
|
2,548
|
$
|
2,513
|
||||||||
|
|
||||||||||||||||
|
|
||||||||||||||||
|
Basic Income Per Share
|
$
|
0.08
|
$
|
0.24
|
$
|
0.22
|
$
|
0.22
|
||||||||
|
Diluted Income Per Share
|
$
|
0.08
|
$
|
0.23
|
$
|
0.22
|
$
|
0.22
|
||||||||
|
2016 Quarters Ended
|
||||||||||||||||
|
|
Dec. 31
|
Sept. 30
|
Jun. 30
|
Mar. 31
|
||||||||||||
|
|
||||||||||||||||
|
Interest and Dividend Income
|
$
|
9,436
|
$
|
9,062
|
$
|
8,882
|
$
|
8,587
|
||||||||
|
Interest Expense
|
309
|
289
|
273
|
286
|
||||||||||||
|
Net Interest Income
|
9,127
|
8,773
|
8,609
|
8,301
|
||||||||||||
|
Provision for Loan Losses
|
450
|
450
|
450
|
450
|
||||||||||||
|
Net Interest Income after Provision for Loan Losses
|
8,677
|
8,323
|
8,159
|
7,851
|
||||||||||||
|
Non-Interest Income
|
2,081
|
1,657
|
1,855
|
1,685
|
||||||||||||
|
Non-Interest Expense
|
7,126
|
6,599
|
6,808
|
6,819
|
||||||||||||
|
Income before Taxes
|
3,632
|
3,381
|
3,206
|
2,717
|
||||||||||||
|
Provision for Taxes
|
(1,366
|
)
|
(1,362
|
)
|
(1,171
|
)
|
(986
|
)
|
||||||||
|
Net Income
|
$
|
2,266
|
$
|
2,019
|
$
|
2,035
|
$
|
1,731
|
||||||||
|
|
||||||||||||||||
|
|
||||||||||||||||
|
Basic Income Per Share
|
$
|
0.19
|
$
|
0.18
|
$
|
0.18
|
$
|
0.15
|
||||||||
|
Diluted Income Per Share
|
$
|
0.20
|
$
|
0.17
|
$
|
0.18
|
$
|
0.15
|
||||||||
All income per share amounts have been adjusted to give retroactive effect to stock dividends and stock splits, including the 4% stock dividend declared on January 25, 2018, payable March 29, 2018, to shareholders of record as of February 28, 2018.
53
ITEM 7A – QUANTITATIVE AND QUALITATIVE DISCLOSURES ABOUT MARKET RISK
Market risk is the possibility of experiencing losses due to factors that affect the overall performance of financial markets. In the normal course of business, the Company is exposed to market risk. Credit risk, liquidity risk and interest rate risk are the most significant market risks affecting the Company. Credit risk is described in the preceding sections regarding "Loan Portfolio – Potential Problem Loans." Liquidity risk is described in the preceding section regarding "Liquidity". Interest rate risk is further described below. Other types of market risk, such as foreign currency exchange risk and commodity price risk, are not significant in the normal course of the Company's business activities.
Interest Rate Risk
Interest rate risk is a significant market risk affecting the Company. Many factors affect the Company's exposure to interest rates such as general economic and financial conditions, customer preferences, historical pricing relationships, and re-pricing characteristics of financial instruments. Assets and liabilities may mature of re-price at different times. Assets and liabilities may re-price at the same time but by different amounts. Short-term and long-term market interest rates may change by different amounts. The timing and amount of cash flows of various assets or liabilities may shorten or lengthen as interest rates change. In addition, changing levels of interest rates may have an impact on loan demand, demand for various deposit products, credit losses, and other elements of earnings such as account analysis fees on commercial deposit accounts and correspondent bank service charges.
The Company's earnings are affected not only by general economic conditions, but also by the monetary and fiscal policies of the United States government and its agencies, particularly the Federal Reserve Board (the "FRB"). The monetary policies of the FRB can influence the overall growth of loans, investment securities, deposits and level of interest rates earned on assets and paid for liabilities. The nature and impact of future changes in monetary policies are generally not predictable.
The Company's success is largely dependent upon its ability to manage interest rate risk. The Company's primary objective in managing interest rate risk is to minimize the adverse impact of changes in interest rates on the Company's net interest income and capital. The Company relies primarily on its asset liability structure to control interest rate risk. The Company does not currently engage in trading activities or use derivative instruments to control interest rate risk, even though such activities may be permitted with the approval of the Company's Board of Directors. In the opinion of management, the Company is currently asset sensitive. An asset sensitive position results in a slightly larger change in interest income that in interest expense resulting from application of assumed interest rate changes.
Exposure to interest rate risk is reviewed at least quarterly by the Asset/Liability Committee ("ALCO") which reports to the Board of Directors and is charged with determining overall interest rate risk limits. Simulation models are used to measure interest rate risk and to evaluate strategies to improve profitability. A simplified statement of condition is prepared on a quarterly basis as a starting point, using instrument level data of our actual loans, investments, borrowings and deposits as inputs. If potential changes to net equity value and net interest income resulting from hypothetical interest rate changes are not within the limits established by the ALCO, Management may adjust the asset and liability mix to bring the risk position within approved limits.
The following table estimates the effect of interest rate changes in all points of the yield curve as measured against a flat rate scenario. For modeling purposes, the likelihood of a decrease in interest rates beyond 100 basis points as of December 31, 2017 was considered to be remote given prevailing low interest rate levels. The interest rate risk at December 31, 2017 was within policy guidelines established by the ALCO.
Effect of Interest Rate Change on Net Interest Income (NII) at December 31, 2017
|
Immediate Changes in Interest Rates (in basis points)
|
Estimated Change in NII in Year 1 (as a percent of NII)
|
|
Estimated Change in NII in Year 2 (as a percent of NII)
|
||
|
|
|
|
|
||
|
up 400
|
12.6
|
%
|
|
24.1
|
%
|
|
up 300
|
5.5
|
%
|
|
14.1
|
%
|
|
up 200
|
4.2
|
%
|
|
10.7
|
%
|
|
up 100
|
2.9
|
%
|
|
6.9
|
%
|
|
down 100
|
(2.2)
|
%
|
|
(6.6)
|
%
|
54
Interest rate sensitivity is a function of the repricing characteristics of our assets and liabilities. The Bank runs a combination of scenarios and sensitivities in its attempt to capture the range of interest rate risk. As with any simulation model or other method of measuring interest rate risk, limitations are inherent in the process and dependent on assumptions. For example, if we choose to pay interest on certain business deposits that are currently non-interest bearing, causing these deposits to become rate sensitive in the future, we would become less asset sensitive than the model currently indicates. Assets and liabilities may react differently to changes in market interest rates in terms of both timing and responsiveness to market rate movements. Further, the actual rates and timing of prepayments on loans and investment securities, and the behavior of depositors, could vary significantly from the assumptions applied in the various scenarios. Lastly, changes in U.S. Treasury rates accompanied by a change in the shape of the yield curve could produce different results from those presented in the table. Accordingly, the results presented should not be relied upon as indicative of actual results in the event of changing market interest rates.
55
ITEM 8 – FINANCIAL STATEMENTS AND SUPPLEMENTARY DATA
|
Management's Report on Internal Control over Financial Reporting
|
Page 57
|
|
|
|
|
Report of Independent Registered Public Accounting Firm
|
Page 58
|
|
|
|
|
Consolidated Balance Sheets as of December 31, 2017 and 2016
|
Page 60
|
|
|
|
|
Consolidated Statements of Income for Years Ended December 31, 2017, 2016, and 2015
|
Page 61
|
|
|
|
|
Consolidated Statements of Comprehensive Income for Years Ended December 31, 2017, 2016, and 2015
|
Page 62
|
|
|
|
|
Consolidated Statement of Stockholders' Equity for Years Ended December 31, 2017, 2016, and 2015
|
Page 63
|
|
|
|
|
Consolidated Statements of Cash Flows for Years Ended December 31, 2017, 2016, and 2015
|
Page 64
|
|
|
|
|
Notes to Consolidated Financial Statements
|
Page 65
|
56
Management's Report
FIRST NORTHERN COMMUNITY BANCORP AND SUBSIDIARY
MANAGEMENT'S REPORT ON INTERNAL CONTROL OVER FINANCIAL REPORTING
The management of First Northern Community Bancorp and subsidiary (the "Company") is responsible for establishing and maintaining adequate internal control over financial reporting as defined in Rules 13a-15(f) and 15d-15(f) under the Exchange Act. Our internal control system was designed to ensure that material information regarding our operations is made available to management and the board of directors to provide them reasonable assurance that the published financial statements are fairly presented. There are limitations inherent in any internal control, such as the possibility of human error and the circumvention or overriding of controls. As a result, even effective internal controls can provide only reasonable assurance with respect to financial statement preparation. As conditions change over time so too may the effectiveness of internal controls.
An internal control significant deficiency is a control deficiency, or combination of control deficiencies, that adversely affects a company's ability to initiate, authorize, record, process, or report external financial data reliably in accordance with generally accepted accounting principles such that there is more than a remote likelihood that a misstatement of the Company's annual or interim financial statements that is more than inconsequential will not be prevented or detected. An internal control material weakness is a significant deficiency, or combination of significant deficiencies, that results in more than a remote likelihood that a material misstatement of the annual or interim financial statements will not be prevented or detected.
Our management has evaluated our internal control over financial reporting as of December 31, 2017 based on the framework in Internal Control — Integrated Framework issued by the Committee of Sponsoring Organizations (COSO) of the Treadway Commission. Based on this assessment, our management concluded that our internal control over financial reporting was effective as of December 31, 2017.
|
|
/s/ Louise A. Walker
|
|
|
|
|
|
Louise A. Walker
|
|
|
President/Chief Executive Officer/Director
|
|
|
(Principal Executive Officer)
|
|
|
|
|
|
|
|
|
/s/ Kevin Spink
|
|
|
|
|
|
Kevin Spink
|
|
|
Executive Vice President/Chief Financial Officer
|
|
|
(Principal Financial Officer)
|
March 8, 2018
57
Report of Independent Registered Public Accounting Firm
To the Shareholders and the Board of Directors of
First Northern Community Bancorp
Opinions on the Financial Statements and Internal Control over Financial Reporting
We have audited the accompanying consolidated balance sheets of First Northern Community Bancorp and subsidiaries (the "Company") as of December 31, 2017 and 2016, the related consolidated statements of income, comprehensive income, stockholders' equity, and cash flows for each of the three years in the period ended December 31, 2017, and the related notes (collectively referred to as the "consolidated financial statements"). We also have audited the Company's internal control over financial reporting as of December 31, 2017, based on criteria established in Internal Control - Integrated Framework 2013 issued by the Committee of Sponsoring Organizations of the Treadway Commission (COSO).
In our opinion, the consolidated financial statements referred to above present fairly, in all material respects, the consolidated financial position of the Company as of December 31, 2017 and 2016, and the consolidated results of its operations and its cash flows for each of the three years in the period ended December 31, 2017, in conformity with accounting principles generally accepted in the United States of America. Also in our opinion, the Company maintained, in all material respects, effective internal control over financial reporting as of December 31, 2017, based on criteria established in Internal Control - Integrated Framework 2013 issued by COSO.
Basis for Opinions
The Company's management is responsible for these consolidated financial statements, for maintaining effective internal control over financial reporting, and for its assessment of the effectiveness of internal control over financial reporting, included in the accompanying Management Report on Internal Control over Financial Reporting. Our responsibility is to express an opinion on the Company's consolidated financial statements and an opinion on the Company's internal control over financial reporting based on our audits. We are a public accounting firm registered with the Public Company Accounting Oversight Board (United States) ("PCAOB") and are required to be independent with respect to the Company in accordance with the U.S. federal securities laws and the applicable rules and regulations of the Securities and Exchange Commission and the PCAOB.
We conducted our audits in accordance with the standards of the PCAOB. Those standards require that we plan and perform the audits to obtain reasonable assurance about whether the consolidated financial statements are free of material misstatement, whether due to error or fraud, and whether effective internal control over financial reporting was maintained in all material respects.
Our audit of the consolidated financial statements included performing procedures to assess the risks of material misstatement of the consolidated financial statements, whether due to error or fraud, and performing procedures to respond to those risks. Such procedures included examining, on a test basis, evidence regarding the amounts and disclosures in the consolidated financial statements. Our audit also included evaluating the accounting principles used and significant estimates made by management, as well as evaluating the overall presentation of the consolidated financial statements. Our audit of internal control over financial reporting included obtaining an understanding of internal control over financial reporting, assessing the risk that a material weakness exists, and testing and evaluating the design and operating effectiveness of internal control based on the assessed risk. Our audits also included performing such other procedures as we considered necessary in the circumstances. We believe that our audits provide a reasonable basis for our opinions.
Definition and Limitations of Internal Control Over Financial Reporting
A company's internal control over financial reporting is a process designed to provide reasonable assurance regarding the reliability of financial reporting and the preparation of financial statements for external purposes in accordance with generally accepted accounting principles. A company's internal control over financial reporting includes those policies and procedures that (1) pertain to the maintenance of records that, in reasonable detail, accurately and fairly reflect the transactions and dispositions of the assets of the company; (2) provide reasonable assurance that transactions are recorded as necessary to permit preparation of financial statements in accordance with generally accepted accounting principles, and that receipts and expenditures of the company are being made only in accordance with authorizations of management and directors of the company; and (3) provide reasonable assurance regarding prevention or timely detection of unauthorized acquisition, use, or disposition of the company's assets that could have a material effect on the financial statements.
58
Because of its inherent limitations, internal control over financial reporting may not prevent or detect misstatements. Also, projections of any evaluation of effectiveness to future periods are subject to the risk that controls may become inadequate because of changes in conditions, or that the degree of compliance with the policies or procedures may deteriorate.
/s/ MOSS ADAMS LLP
Los Angeles, California
March 8, 2018
We have served as the Company's auditor since 2006.
59
FIRST NORTHERN COMMUNITY BANCORP
AND SUBSIDIARY
Consolidated Balance Sheets
December 31, 2017 and 2016
(in thousands, except shares and share amounts)
|
|
2017
|
2016
|
||||||
|
Assets
|
||||||||
|
Cash and cash equivalents
|
$
|
152,892
|
$
|
159,643
|
||||
|
Certificates of deposit
|
1,984
|
16,213
|
||||||
|
Investment securities – available-for-sale, at fair value (includes securities pledged to creditors with the right to sell or repledge of $32,399 at December 31, 2017 and $38,152 at December 31, 2016)
|
280,741
|
277,079
|
||||||
|
Loans (net of allowance for loan losses of $11,133 at December 31, 2017 and $10,899 at December 31, 2016)
|
739,112
|
669,770
|
||||||
|
Loans held-for-sale
|
1,040
|
3,326
|
||||||
|
Stock in Federal Home Loan Bank and other equity securities, at cost
|
5,567
|
4,409
|
||||||
|
Premises and equipment, net
|
6,248
|
7,304
|
||||||
|
Interest receivable and other assets
|
30,074
|
29,019
|
||||||
|
|
||||||||
|
Total Assets
|
$
|
1,217,658
|
$
|
1,166,763
|
||||
|
|
||||||||
|
Liabilities and Stockholders' Equity
|
||||||||
|
Liabilities:
|
||||||||
|
Deposits:
|
||||||||
|
Demand
|
$
|
382,157
|
$
|
362,688
|
||||
|
Interest-bearing transaction deposits
|
312,569
|
293,343
|
||||||
|
Savings and MMDAs
|
336,592
|
331,730
|
||||||
|
Time, $250,000 or less
|
54,531
|
60,677
|
||||||
|
Time, over $250,000
|
18,891
|
15,258
|
||||||
|
|
||||||||
|
Total Deposits
|
1,104,740
|
1,063,696
|
||||||
|
|
||||||||
|
Interest payable and other liabilities
|
12,874
|
10,769
|
||||||
|
|
||||||||
|
Total Liabilities
|
1,117,614
|
1,074,465
|
||||||
|
|
||||||||
|
Commitments and contingencies
|
||||||||
|
|
||||||||
|
Stockholders' Equity:
|
||||||||
|
Common stock, no par value; 16,000,000 shares authorized; 11,630,129 and 11,148,446 shares issued and outstanding at December 31, 2017 and 2016, respectively
|
85,583
|
79,114
|
||||||
|
Additional paid-in capital
|
977
|
977
|
||||||
|
Retained earnings
|
17,881
|
14,557
|
||||||
|
Accumulated other comprehensive loss, net
|
(4,397
|
)
|
(2,350
|
)
|
||||
|
Total Stockholders' Equity
|
100,044
|
92,298
|
||||||
|
|
||||||||
|
Total Liabilities and Stockholders' Equity
|
$
|
1,217,658
|
$
|
1,166,763
|
||||
See accompanying notes to consolidated financial statements.
60
FIRST NORTHERN COMMUNITY BANCORP
AND SUBSIDIARY
Consolidated Statements of Income
Years Ended December 31, 2017, 2016 and 2015
(in thousands, except per share amounts)
|
|
2017
|
2016
|
2015
|
|||||||||
|
Interest and dividend income:
|
||||||||||||
|
Interest and fees on loans
|
$
|
33,115
|
$
|
30,697
|
$
|
27,304
|
||||||
|
Due from banks interest bearing accounts
|
1,500
|
891
|
659
|
|||||||||
|
Investment securities:
|
||||||||||||
|
Taxable
|
4,762
|
3,582
|
2,725
|
|||||||||
|
Non-taxable
|
257
|
276
|
271
|
|||||||||
|
Other earning assets
|
383
|
521
|
481
|
|||||||||
|
Total interest and dividend income
|
40,017
|
35,967
|
31,440
|
|||||||||
|
Interest expense:
|
||||||||||||
|
Time deposits over $250,000
|
78
|
67
|
81
|
|||||||||
|
Other deposits
|
1,001
|
1,090
|
1,073
|
|||||||||
|
Total interest expense
|
1,079
|
1,157
|
1,154
|
|||||||||
|
Net interest income
|
38,938
|
34,810
|
30,286
|
|||||||||
|
Provision for loan losses
|
600
|
1,800
|
650
|
|||||||||
|
Net interest income after provision for loan losses
|
38,338
|
33,010
|
29,636
|
|||||||||
|
Non-interest income:
|
||||||||||||
|
Service charges on deposit accounts
|
1,957
|
2,011
|
2,006
|
|||||||||
|
Net (loss) gain on sale of available-for-sale securities
|
(14
|
)
|
(1
|
)
|
29
|
|||||||
|
Net gain on sale of loans held-for-sale
|
512
|
842
|
785
|
|||||||||
|
Net gain on sale of other real estate owned
|
—
|
4
|
216
|
|||||||||
|
Gain on sale-leaseback of real estate
|
1,187
|
—
|
—
|
|||||||||
|
Other income
|
4,486
|
4,422
|
4,560
|
|||||||||
|
Total non-interest income
|
8,128
|
7,278
|
7,596
|
|||||||||
|
Non-interest expenses:
|
||||||||||||
|
Salaries and employee benefits
|
18,284
|
16,771
|
16,197
|
|||||||||
|
Occupancy and equipment
|
2,862
|
2,943
|
2,830
|
|||||||||
|
Data processing
|
1,808
|
1,570
|
1,666
|
|||||||||
|
Stationery and supplies
|
332
|
345
|
346
|
|||||||||
|
Advertising
|
328
|
308
|
311
|
|||||||||
|
Directors fees
|
309
|
291
|
297
|
|||||||||
|
Other real estate owned expense and impairment
|
6
|
2
|
1
|
|||||||||
|
(Recovery) loss on disposal of other equity investment
|
—
|
—
|
(12
|
)
|
||||||||
|
Other expense
|
5,471
|
5,122
|
4,935
|
|||||||||
|
Total non-interest expenses
|
29,400
|
27,352
|
26,571
|
|||||||||
|
Income before provision for income tax
|
17,066
|
12,936
|
10,661
|
|||||||||
|
Provision for income tax
|
(8,318
|
)
|
(4,885
|
)
|
(3,740
|
)
|
||||||
|
Net income
|
8,748
|
8,051
|
6,921
|
|||||||||
|
Preferred stock dividends
|
—
|
—
|
(105
|
)
|
||||||||
|
Net income available to common shareholders
|
$
|
8,748
|
$
|
8,051
|
$
|
6,816
|
||||||
|
Basic income per share
|
$
|
0.76
|
$
|
0.70
|
$
|
0.60
|
||||||
|
Diluted income per share
|
$
|
0.75
|
$
|
0.70
|
$
|
0.59
|
||||||
See accompanying notes to consolidated financial statements.
61
FIRST NORTHERN COMMUNITY BANCORP
AND SUBSIDIARY
Consolidated Statements of Comprehensive Income
Years Ended December 31, 2017, 2016 and 2015
(in thousands)
|
|
2017
|
2016
|
2015
|
|||||||||
|
Net income
|
$
|
8,748
|
$
|
8,051
|
$
|
6,921
|
||||||
|
Other comprehensive loss, net of tax:
|
||||||||||||
|
Unrealized holding losses on securities arising during the current period, net of tax effect of ($570), ($1,218), and ($356) for the years ended December 31, 2017, December 31, 2016, and December 31, 2015, respectively
|
(854
|
)
|
(1,829
|
)
|
(536
|
)
|
||||||
|
Reclassification adjustment due to losses (gains) realized on sales of securities, net of tax effect of $6, $0, and ($12) for the years ended December 31, 2017, December 31, 2016, and December 31, 2015, respectively
|
8
|
1
|
(17
|
)
|
||||||||
|
Officers' retirement plan equity adjustments, net of tax effect of ($236), ($16), and $11 for the years ended December 31, 2017, December 31, 2016, and December 31, 2015, respectively
|
(591
|
)
|
(24
|
)
|
16
|
|||||||
|
Directors' retirement plan equity adjustments, net of tax effect of ($7), ($2), and (16) for the years ended December 31, 2017, December 31, 2016, and December 31, 2015, respectively
|
(11
|
)
|
(3
|
)
|
(24
|
)
|
||||||
|
Total other comprehensive loss, net of tax effect of ($807), ($1,236), and ($373) for the years ended December 31, 2017, December 31, 2016, and December 31, 2015, respectively
|
(1,448
|
)
|
(1,855
|
)
|
(561
|
)
|
||||||
|
Comprehensive income
|
$
|
7,300
|
$
|
6,196
|
$
|
6,360
|
||||||
See accompanying notes to consolidated financial statements.
62
FIRST NORTHERN COMMUNITY BANCORP
AND SUBSIDIARY
Consolidated Statement of Stockholders' Equity
Years Ended December 31, 2017, 2016 and 2015
(in thousands, except share data)
|
Preferred Stock
|
Common Stock
|
|||||||||||||||||||||||||||||||
|
Shares
|
Amounts
|
Shares
|
Amounts
|
Additional
Paid-in
Capital
|
Retained
Earnings
|
Accumulated
Other
Comprehensive
Income/(Loss)
|
Total
|
|||||||||||||||||||||||||
|
Balance at December 31, 2014
|
12,847
|
$
|
12,847
|
10,207,043
|
$
|
70,015
|
$
|
977
|
$
|
8,146
|
$
|
66
|
$
|
92,051
|
||||||||||||||||||
|
Net income
|
6,921
|
6,921
|
||||||||||||||||||||||||||||||
|
Other comprehensive loss, net of tax
|
(561
|
)
|
(561
|
)
|
||||||||||||||||||||||||||||
|
Redemption of preferred stock
|
(12,847
|
)
|
(12,847
|
)
|
(12,847
|
)
|
||||||||||||||||||||||||||
|
Stock dividend adjustment
|
682
|
6
|
(6
|
)
|
—
|
|||||||||||||||||||||||||||
|
4% stock dividend declared in 2016
|
410,636
|
3,347
|
(3,347
|
)
|
—
|
|||||||||||||||||||||||||||
|
Dividend on preferred stock
|
(105
|
)
|
(105
|
)
|
||||||||||||||||||||||||||||
|
Cash in lieu of fractional shares
|
(128
|
)
|
(6
|
)
|
(6
|
)
|
||||||||||||||||||||||||||
|
Stock-based compensation
|
230
|
230
|
||||||||||||||||||||||||||||||
|
Common shares issued related to restricted stock grants, net of restricted stock reversals
|
38,603
|
82
|
82
|
|||||||||||||||||||||||||||||
|
Stock options exercised
|
19,721
|
84
|
84
|
|||||||||||||||||||||||||||||
|
Balance at December 31, 2015
|
—
|
$
|
—
|
10,676,557
|
$
|
73,764
|
$
|
977
|
$
|
11,603
|
$
|
(495
|
)
|
$
|
85,849
|
|||||||||||||||||
|
Net income
|
8,051
|
8,051
|
||||||||||||||||||||||||||||||
|
Other comprehensive loss, net of tax
|
(1,855
|
)
|
(1,855
|
)
|
||||||||||||||||||||||||||||
|
Stock dividend adjustment
|
505
|
4
|
(4
|
)
|
—
|
|||||||||||||||||||||||||||
|
4% stock dividend declared in 2017
|
428,786
|
5,088
|
(5,088
|
)
|
—
|
|||||||||||||||||||||||||||
|
Cash in lieu of fractional shares
|
(101
|
)
|
(5
|
)
|
(5
|
)
|
||||||||||||||||||||||||||
|
Stock-based compensation
|
286
|
286
|
||||||||||||||||||||||||||||||
|
Tax deficiency related to expired, vested non-qualified stock options
|
(114
|
)
|
(114
|
)
|
||||||||||||||||||||||||||||
|
Common shares issued related to restricted stock grants, net of restricted stock reversals
|
34,976
|
61
|
61
|
|||||||||||||||||||||||||||||
|
Stock options exercised
|
7,723
|
25
|
25
|
|||||||||||||||||||||||||||||
|
Balance at December 31, 2016
|
—
|
$
|
—
|
11,148,446
|
$
|
79,114
|
$
|
977
|
$
|
14,557
|
$
|
(2,350
|
)
|
$
|
92,298
|
|||||||||||||||||
|
Net income
|
8,748
|
8,748
|
||||||||||||||||||||||||||||||
|
Other comprehensive loss, net of tax
|
(1,448
|
)
|
(1,448
|
)
|
||||||||||||||||||||||||||||
|
Stock dividend adjustment
|
289
|
207
|
(207
|
)
|
—
|
|||||||||||||||||||||||||||
|
Tax Rate Change Reclassification
|
599
|
(599
|
)
|
—
|
||||||||||||||||||||||||||||
|
4% stock dividend declared in 2018
|
447,312
|
5,806
|
(5,806
|
)
|
—
|
|||||||||||||||||||||||||||
|
Cash in lieu of fractional shares
|
(129
|
)
|
(10
|
)
|
(10
|
)
|
||||||||||||||||||||||||||
|
Stock-based compensation
|
378
|
378
|
||||||||||||||||||||||||||||||
|
Common shares issued related to restricted stock grants, net of restricted stock reversals
|
34,211
|
78
|
78
|
|||||||||||||||||||||||||||||
|
Balance at December 31, 2017
|
—
|
$
|
—
|
11,630,129
|
$
|
85,583
|
$
|
977
|
$
|
17,881
|
$
|
(4,397
|
)
|
$
|
100,044
|
|||||||||||||||||
See accompanying notes to consolidated financial statements.
63
FIRST NORTHERN COMMUNITY BANCORP
AND SUBSIDIARY
Consolidated Statements of Cash Flows
Years Ended December 31, 2017, 2016 and 2015
(in thousands)
|
|
2017
|
2016
|
2015
|
|||||||||
|
Cash flows from operating activities:
|
||||||||||||
|
Net income
|
$
|
8,748
|
$
|
8,051
|
$
|
6,921
|
||||||
|
Adjustments to reconcile net income to net cash provided by operating activities:
|
||||||||||||
|
Provision for loan losses
|
600
|
1,800
|
650
|
|||||||||
|
Stock plan accruals
|
378
|
286
|
230
|
|||||||||
|
Gain on sale-leaseback of real estate
|
(1,187
|
)
|
—
|
—
|
||||||||
|
Depreciation and amortization of bank premises and equipment
|
600
|
633
|
640
|
|||||||||
|
Accretion and amortization of securities, net
|
3,587
|
3,158
|
2,083
|
|||||||||
|
Net loss (gain) on sale/call of available-for-sale securities
|
14
|
1
|
(29
|
)
|
||||||||
|
Net gain on sale of loans held-for-sale
|
(512
|
)
|
(842
|
)
|
(785
|
)
|
||||||
|
Net gain on sale of other real estate owned
|
—
|
(4
|
)
|
(216
|
)
|
|||||||
|
Net loss on sale of bank premises and equipment
|
—
|
—
|
63
|
|||||||||
|
Provision for deferred income taxes
|
1,919
|
(437
|
)
|
688
|
||||||||
|
Valuation adjustment on mortgage servicing rights
|
(21
|
)
|
21
|
—
|
||||||||
|
Proceeds from sales of loans held-for-sale
|
27,596
|
41,822
|
45,644
|
|||||||||
|
Originations of loans held-for-sale
|
(24,798
|
)
|
(43,955
|
)
|
(44,719
|
)
|
||||||
|
Increase (decrease) in deferred loan origination fees and costs, net
|
57
|
(97
|
)
|
318
|
||||||||
|
(Increase) decrease in interest receivable and other assets
|
(2,147
|
)
|
(793
|
)
|
195
|
|||||||
|
Net increase in interest payable and other liabilities
|
1,261
|
62
|
1,868
|
|||||||||
|
Net cash provided by operating activities
|
16,095
|
9,706
|
13,551
|
|||||||||
|
Cash flows from investing activities:
|
||||||||||||
|
Proceeds from maturities of available-for-sale securities
|
21,290
|
37,464
|
4,575
|
|||||||||
|
Proceeds from sales of available-for-sale securities
|
462
|
1,945
|
17,798
|
|||||||||
|
Principal repayments on available-for-sale securities
|
50,354
|
36,698
|
25,934
|
|||||||||
|
Purchase of available-for-sale securities
|
(80,779
|
)
|
(176,041
|
)
|
(83,408
|
)
|
||||||
|
Net decrease (increase) in Certificates of Deposit
|
14,229
|
436
|
(3,789
|
)
|
||||||||
|
Net increase in stock in Federal Home Loan Bank and other equity securities, at cost
|
(1,158
|
)
|
(475
|
)
|
—
|
|||||||
|
Net increase in loans
|
(69,999
|
)
|
(65,837
|
)
|
(69,249
|
)
|
||||||
|
Purchases of bank premises and equipment, net
|
(1,225
|
)
|
(926
|
)
|
(436
|
)
|
||||||
|
Proceeds from the sale of bank premises and equipment
|
2,868
|
—
|
—
|
|||||||||
|
Proceeds from sales of other real estate owned
|
—
|
221
|
1,359
|
|||||||||
|
Net cash used in investing activities
|
(63,958
|
)
|
(166,515
|
)
|
(107,216
|
)
|
||||||
|
Cash flows from financing activities:
|
||||||||||||
|
Net increase in deposits
|
41,044
|
115,582
|
91,062
|
|||||||||
|
Redemption of preferred stock
|
—
|
—
|
(12,847
|
)
|
||||||||
|
Dividends on preferred stock
|
—
|
—
|
(105
|
)
|
||||||||
|
Cash dividends paid in lieu of fractional shares
|
(10
|
)
|
(5
|
)
|
(6
|
)
|
||||||
|
Common stock issued
|
78
|
61
|
82
|
|||||||||
|
Stock options exercised
|
—
|
21
|
84
|
|||||||||
|
Tax benefit for stock options
|
—
|
(4
|
)
|
—
|
||||||||
|
Net cash provided by financing activities
|
41,112
|
115,655
|
78,270
|
|||||||||
|
Net decrease in cash and cash equivalents
|
(6,751
|
)
|
(41,154
|
)
|
(15,395
|
)
|
||||||
|
Cash and cash equivalents at beginning of year
|
159,643
|
200,797
|
216,192
|
|||||||||
|
Cash and cash equivalents at end of year
|
$
|
152,892
|
$
|
159,643
|
$
|
200,797
|
||||||
See accompanying notes to consolidated financial statements.
64
FIRST NORTHERN COMMUNITY BANCORP
AND SUBSIDIARY
Notes to Consolidated Financial Statements
Years Ended December 31, 2017, 2016 and 2015
(in thousands, except shares and share amounts)
| (1) |
Summary of Significant Accounting Policies
|
First Northern Community Bancorp ("Company") is a bank holding company whose only subsidiary, First Northern Bank of Dixon ("Bank"), a California state-chartered bank, conducts general banking activities, including collecting deposits and originating loans, and serves Solano, Yolo, Sacramento, Placer, El Dorado, and Contra Costa Counties. All intercompany transactions between the Company and the Bank have been eliminated in consolidation. The consolidated financial statements also include the accounts of Yolano Realty Corporation, a wholly-owned subsidiary of the Bank. Yolano Realty Corporation was formed in September 2009 for the purpose of managing selected other real estate owned properties. Yolano Realty Corporation was an inactive subsidiary in 2017.
The accounting and reporting policies of the Company conform with accounting principles generally accepted in the United States of America. In preparing the consolidated financial statements, management is required to make estimates and assumptions that affect the reported amounts of assets and liabilities as of the date of the balance sheet and revenues and expenses for the period. Actual results could differ from those estimates applied in the preparation of the accompanying consolidated financial statements. For the Company, the most significant accounting estimates are the allowance for loan losses, recognition and measurement of impaired loans, other-than-temporary impairment of securities, fair value measurements, share based compensation, valuation of mortgage servicing rights and deferred tax asset realization. A summary of the significant accounting policies applied in the preparation of the accompanying consolidated financial statements follows.
| (a) |
Cash Equivalents
|
For purposes of the consolidated statements of cash flows, the Company considers due from banks, federal funds sold for one-day periods and short-term bankers acceptances to be cash equivalents. At times, the Company maintains deposits with other financial institutions in amounts that may exceed federal deposit insurance coverage. Management regularly evaluates the credit risk associated with correspondent banks.
| (b) |
Investment Securities
|
Investment securities consist of U.S. Treasury securities, U.S. Agency securities, obligations of states and political subdivisions, obligations of U.S. Corporations, mortgage-backed securities and other securities. At the time of purchase of a security the Company designates the security as held-to-maturity or available-for-sale, based on its investment objectives, operational needs, and intent to hold. The Company does not purchase securities with the intent to engage in trading activity.
Held-to-maturity securities are recorded at amortized cost, adjusted for amortization or accretion of premiums or discounts. Available-for-sale securities are recorded at fair value with unrealized holding gains and losses, net of the related tax effect, reported as a separate component of stockholders' equity until realized. The amortized cost of available-for-sale securities is adjusted for amortization of premiums and accretion of discounts over the life of the related security using the effective interest method. Such amortization and accretion is included in investment income, along with interest and dividends. The cost of securities sold is based on the specific identification method; realized gains and losses resulting from such sales are included in earnings.
Investments with fair values that are less than amortized cost are considered impaired. Impairment may result from either a decline in the financial condition of the issuing entity or, in the case of fixed interest rate investments, from rising interest rates. At each consolidated financial statement date, management assesses each investment to determine if impaired investments are temporarily impaired or if the impairment is other than temporary. This assessment includes consideration regarding the duration and severity of impairment, the credit quality of the issuer and a determination of whether the Company intends to sell the security, or if it is more likely than not that the Company will be required to sell the security before recovery of its amortized cost basis less any current-period credit losses. Other-than-temporary impairment is recognized in earnings if one of the following conditions exists: 1) the Company's intent is to sell the security; 2) it is more likely than not that the Company will be required to sell the security before the impairment is recovered; or 3) the Company does not expect to recover its amortized cost basis. If, by contrast, the Company does not intend to sell the security and will not be required to sell the security prior to recovery of the amortized cost basis, the Company recognizes only the credit loss component of other-than-temporary impairment in earnings. The credit loss component is calculated as the difference between the security's amortized cost basis and the present value of its expected future cash flows. The remaining difference between the security's fair value and the present value of the future expected cash flows is deemed to be due to factors that are not credit related and is recognized in other comprehensive income.
65
(c) Federal Home Loan Bank Stock and Other Equity Securities, at Cost
Federal Home Loan Bank (FHLB) stock represents an equity interest that does not have a readily determinable fair value because its ownership is restricted and it lacks a market (liquidity). FHLB stock and other securities are recorded at cost.
| (d) |
Loans
|
Loans are reported at the principal amount outstanding, net of deferred loan fees and the allowance for loan losses. A loan is considered impaired when, based on current information and events, it is probable that the Company will be unable to collect all amounts due according to the contractual terms of the loan agreement, including scheduled interest payments. For a loan that has been restructured, the contractual terms of the loan agreement refer to the contractual terms specified by the original loan agreement, not the contractual terms specified by the restructuring agreement. Restructured loans are loans on which concessions in terms have been granted because of the borrowers' financial difficulties. A restructuring constitutes a troubled debt restructuring, and thus an impaired loan, if the restructuring constitutes a concession and the debtor is experiencing financial difficulties. An impaired loan is measured based upon the present value of future cash flows discounted at the loan's effective rate, the loan's observable market price, or the fair value of collateral if the loan is collateral dependent. Interest on impaired loans is recognized on a cash basis. If the measurement of the impaired loan is less than the recorded investment in the loan, an impairment is recognized by a charge to the allowance for loan losses.
Unearned discount on installment loans is recognized as income over the terms of the loans by the interest method. Interest on other loans is calculated by using the simple interest method on the daily balance of the principal amount outstanding.
Loan fees net of certain direct costs of origination, which represent an adjustment to interest yield are deferred and amortized over the contractual term of the loan using the interest method.
Loans on which the accrual of interest has been discontinued are designated as non-accrual loans. Accrual of interest on loans is discontinued either when reasonable doubt exists as to the full and timely collection of interest or principal or when a loan becomes contractually past due by ninety days or more with respect to interest or principal. When a loan is placed on non-accrual status, all interest previously accrued but not collected is reversed against current period interest income. Interest accruals are resumed on such loans only when they are brought fully current with respect to interest and principal and when, in the judgment of management, the loans are estimated to be fully collectible as to both principal and interest. Accrual of interest on loans that are troubled debt restructurings commence after a sustained period of performance. Interest is generally accrued on such loans in accordance with the new terms.
| (e) |
Loans Held-for-Sale
|
Loans originated and held-for-sale are carried at the lower of cost or estimated fair value in the aggregate. Net unrealized losses are recognized through a valuation allowance by charges to income.
| (f) |
Allowance for Loan Losses
|
The allowance for loan losses is established through a provision charged to expense. It is the Company's policy to charge-off loans when the following exists: management determines that a loss is expected or when specified by regulatory examination; impairment analysis shows an impaired amount, which requires a partial charge-off; interest and/or principal are past due 90 days or more unless the credit is both well secured and in process of collection; consumer loans become 90 days delinquent, except those well secured by real estate collateral and in the process of collection; loan is canceled as part of a court judgment.
The allowance is an amount that management believes will be adequate to absorb losses inherent in existing loans and overdrafts on evaluations of collectability and prior loss experience. The loan portfolio is segregated into loan types to facilitate the assessment of risk to pools of loans based on historical charge-off experience and internal and external factors. Individual loans are reviewed for impairment, while all other loans, including individually evaluated loans determined not to be impaired, are collectively evaluated for impairment. The evaluations take into consideration internal and external factors such as trends in portfolio volume, maturity and composition, overall portfolio quality, loan concentrations, levels of and trends in charge-offs and recoveries, current and anticipated economic conditions that may affect the borrowers' ability to pay and national and local economic trends and conditions. While management uses these evaluations to determine the allowance for loan losses, additional provisions may be necessary based on changes in the factors used in the evaluations.
66
Material estimates relating to the determination of the allowance for loan losses are particularly susceptible to significant change in the near term. Management believes that the allowance for loan losses was adequate at December 31, 2017. While management uses available information to recognize losses on loans, future additions to the allowance may be necessary based on changes in economic conditions and other factors. In addition, various regulatory agencies, as an integral part of their examination process, periodically review the Bank's allowance for loan losses. Such agencies may require the Bank to recognize additional allowance based on their judgment about information available to them at the time of their examination.
| (g) |
Premises and Equipment
|
Premises and equipment are stated at cost, less accumulated depreciation. Depreciation is computed substantially by the straight-line method over the estimated useful lives of the related assets. Leasehold improvements are depreciated over the estimated useful lives of the improvements or the terms of the related leases, whichever is shorter. The useful lives used in computing depreciation are as follows:
|
Buildings and improvements 15 to 50 years
|
|
|
Furniture and equipment 3 to 10 years
|
|
| (h) |
Impairment of Long-Lived Assets and Long-Lived Assets to Be Disposed Of
|
Long-lived assets and certain identifiable intangibles are required to be reviewed for impairment whenever events or changes in circumstances indicate that the carrying amount of an asset may not be recoverable. The Company currently has no identifiable intangible assets. Recoverability of assets to be held and used is measured by a comparison of the carrying amount of an asset to future net cash flows expected to be generated by the asset. If such assets are considered to be impaired, the impairment to be recognized is measured by the amount by which the carrying amount of the assets exceeds the fair value of the assets. Assets to be disposed of are reported at the lower of the carrying amount or fair value less costs to sell.
| (i) |
Gain or Loss on Sale of Loans and Servicing Rights
|
Transfers and servicing of financial assets and extinguishments of liabilities are accounted for and reported based on consistent application of a financial-components approach that focuses on control. Transfers of financial assets that are sales are distinguished from transfers that are secured borrowings. A sale is recognized when the transaction closes and the proceeds are other than beneficial interests in the assets sold. A gain or loss is recognized to the extent that the sales proceeds and the fair value of the servicing asset exceed or are less than the book value of the loan. Additionally, a normal cost for servicing the loan is considered in the determination of the gain or loss.
The Company recognizes a gain and a related asset for the fair value of the rights to service loans for others when loans are sold. The Company sold substantially all of its conforming long-term residential mortgage loans originated during the years ended December 31, 2017, 2016, and 2015 for cash proceeds equal to the fair value of the loans.
Mortgage servicing rights (MSR) in loans sold are measured by allocating the previous carrying amount of the transferred assets between the loans sold and retained interest, if any, based on their relative fair value at the date of transfer. The Company determines its classes of servicing assets based on the asset type being serviced along with the methods used to manage the risk inherent in the servicing assets, which includes the market inputs used to value the servicing assets. The Company measures and reports its residential mortgage servicing assets initially at fair value and amortizes the servicing rights in proportion to, and over the period of, estimated net servicing revenues. Management assesses servicing rights for impairment as of each financial reporting date. Fair value adjustments that encompass market-driven valuation changes and the runoff in value that occurs from the passage of time are each separately reported.
In determining the fair value of the MSR, the Company uses quoted market prices when available. Subsequent fair value measurements are determined using a discounted cash flow model. In order to determine the fair value of the MSR, the present value of expected future cash flows is estimated. Assumptions used include market discount rates, anticipated prepayment speeds, delinquency and foreclosure rates, and ancillary fee income. This model is periodically validated by an independent external model validation group. The model assumptions and the MSR fair value estimates are also compared to observable trades of similar portfolios as well as to MSR broker valuations and industry surveys, as available. Key assumptions used in measuring the fair value of MSR as of December 31 were as follows:
|
|
2017
|
2016
|
2015
|
|||||||||
|
Constant prepayment rate
|
10.80
|
%
|
12.67
|
%
|
10.94
|
%
|
||||||
|
Discount rate
|
10.02
|
%
|
10.02
|
%
|
10.03
|
%
|
||||||
|
Weighted average life (years)
|
6.02
|
5.51
|
6.17
|
|||||||||
67
The expected life of the loan can vary from management's estimates due to prepayments by borrowers, especially when rates fall. Prepayments in excess of management's estimates would negatively impact the recorded value of the mortgage servicing rights. The value of the mortgage servicing rights is also dependent upon the discount rate used in the model, which we base on current market rates. Management reviews this rate on an ongoing basis based on current market rates. A significant increase in the discount rate would reduce the value of mortgage servicing rights.
| (j) |
Income Taxes
|
The Company accounts for income taxes under the asset and liability method. Under the asset and liability method, deferred tax assets and liabilities are recognized for the future tax consequences attributable to differences between the financial statement carrying amounts of existing assets and liabilities and their respective tax bases and operating loss and tax credit carry forwards. Deferred tax assets and liabilities are measured using enacted tax rates expected to apply to taxable income in the years in which those temporary differences are expected to be recovered or settled. The effect on deferred tax assets and liabilities of a change in tax rates is recognized in income in the period that includes the enactment date.
(k) Share Based Compensation
The Company accounts for stock-based payment transactions whereby the Company receives employee services in exchange for equity instruments, including stock options and restricted stock. The Company recognizes in the consolidated statements of income the grant-date fair value of stock options and other equity-based forms of compensation issued to employees over their requisite service period (generally the vesting period). The fair value of options granted is determined on the date of the grant using a Black-Scholes-Merton pricing model. The grant date fair value of restricted stock is determined by the closing market price of the day prior to the grant date. The Company issues new shares of common stock upon the exercise of stock options. See Note 14 of Notes to Consolidated Financial Statements.
| (l) |
Earnings Per Share ("EPS")
|
Basic EPS includes no dilution and is computed by dividing income available to common shareholders by the weighted-average number of common shares outstanding for the period, excluding non-vested restricted shares. Diluted EPS reflects the potential dilution of securities that could share in the earnings of an entity. The number of potential common shares included in annual diluted EPS is a year to date average of the number of potential common shares included in each quarter's diluted EPS computation under the treasury stock method. The calculation of weighted average shares includes two classes of the Company's outstanding common stock: common stock and restricted stock awards. Holders of restricted stock also receive non-forfeitable dividends at the same rate as common shareholders and they both share equally in undistributed earnings. See Note 13 of Notes to Consolidated Financial Statements.
| (m) |
Advertising Costs
|
Advertising costs were $328, $308, and $311 for the years ended December 31, 2017, 2016, and 2015, respectively. Advertising costs are expensed as incurred.
| (n) |
Comprehensive Income
|
Accounting principles generally accepted in the United States require that recognized revenue, expenses, gains, and losses be included in net income. Certain changes in assets and liabilities, such as unrealized gain and losses on available-for-sale securities and directors' and officers' retirement plans, are reported as a separate component of the equity section of the consolidated balance sheet. Such items, along with net income, are components of comprehensive income.
| (o) |
Fiduciary Powers
|
On July 1, 2002, the Bank received trust powers from applicable regulatory agencies and offers fiduciary services for individuals, businesses, governments, and charitable organizations in the Solano, Yolo, Sacramento, Placer, El Dorado, and Contra Costa County areas. The Bank's full-service asset management and trust department, which offers and manages such fiduciary services, is located in downtown Sacramento.
68
| (p) |
Stock Dividend
|
On January 26, 2017, the Company announced that its Board of Directors had declared a 4 % stock dividend which resulted in 429,075 shares, which was paid on March 31, 2017 to shareholders of record as of February 28, 2017. On January 25, 2018, the Company announced that its Board of Directors had declared a 4% stock dividend which will result in an estimate of 447,312 shares, which will be paid on March 29, 2018 to shareholders of record as of February 28, 2018.
The earnings per share data for all periods presented have been adjusted to give retroactive effect to stock dividends and stock splits, including the 4% stock dividend declared on January 25, 2018. December 31, 2017 figures included in the Consolidated Balance Sheets and Consolidated Statement of Changes in Stockholders' Equity have been adjusted to reflect the estimated impact of the 2018 stock dividend. Figures that have been adjusted include common stock shares issued and outstanding, Common stock balance and Retained earnings balance. The December 31, 2016, 2015 and 2014 balances included in the Consolidated Balance Sheets and Statement of Changes in Stockholders' Equity have not been adjusted to retroactively reflect the stock dividends, but instead show the historical rollforward of stock dividends declared.
| (q) |
Segment Reporting
|
The "Segment Reporting" topic of the FASB ASC requires that public companies report certain information about operating segments. It also requires that public companies report certain information about their products and services, the geographic areas in which they operate, and their major customers. The Company is a holding company for a community bank, which offers a wide array of products and services to its customers. Pursuant to its banking strategy, emphasis is placed on building relationships with its customers, as opposed to building specific lines of business. As a result, the Company is not organized around discernible lines of business and prefers to work as an integrated unit to customize solutions for its customers, with business line emphasis and product offerings changing over time as needs and demands change. Therefore, the Company only reports one segment.
(r) Impact of Recently Issued Accounting Standards
In May 2014, the Financial Accounting Standards Board (FASB) issued Accounting Standards Update (ASU) 2014-09, Revenue from Contracts with Customers (Topic 606). ASU 2014-09 requires an entity to recognize the amount of revenue to which it expects to be entitled for the transfer of promised goods or services to customers. This ASU will replace most existing revenue recognition guidance in GAAP when it becomes effective. ASU 2014-09 was initially effective for the Company's reporting period beginning on January 1, 2017. However, in August 2015, the FASB issued ASU 2015-14, Revenue from Contracts with Customers - Deferral of the Effective Date, which defers the effective date by one year. For financial reporting purposes, the standard allows for either a full retrospective or modified retrospective adoption. The FASB has also issued additional updates to provide further clarification to specific implementation issues associated with ASU 2014-09. These updates include ASU 2016-08, Principal versus Agent Considerations, ASU 2016-10, Identifying Performance Obligations and Licensing, ASU 2016-12, Narrow-Scope Improvements and Practical Expedients, and ASU 2016-20, Technical Corrections and Improvements to Topic 606. Our revenue is comprised of net interest income on financial assets and financial liabilities, which is explicitly excluded from the scope of ASU 2014-09, and non-interest income. We expect that ASU 2014-09 will require us to change how we recognize certain recurring revenue streams; however, we do not expect these changes to have a material impact on non-interest income. We adopted the standard on January 1, 2018, which resulted in no material adjustment.
In February 2016, the FASB issued ASU 2016-02, Leases (Topic 842). The amendments in ASU 2016-02, among other things, require lessees to recognize the following for all leases (with the exception of short-term leases) at the commencement date:
|
●
|
A lease liability, which is a lessee's obligation to make lease payments arising from a lease, measured on a discounted basis; and
|
|
●
|
A right-of-use asset, which is an asset that represents the lessee's right to use, or control the use of, a specified asset for the lease term.
|
The amendments in this ASU are effective for public companies for fiscal years, and interim periods within those fiscal years, beginning after December 15, 2018. Early adoption is permitted. The Company currently leases ten properties. The effect to the Company's financial statements will result in the recording of a lease liability and a related right-of-use asset. Management has not yet quantified the lease liability and right-of-use asset and is currently evaluating the impact of this ASU on the Company's consolidated financial statements.
69
In June 2016, FASB issued ASU 2016-13, Financial Instruments – Credit Losses (Topic 326): Measurement of Credit Losses on Financial Instruments. The amendments in ASU 2016-13, among other things, require the measurement of all expected credit losses for financial assets held at the reporting date based on historical experience, current conditions, and reasonable and supportable forecasts. Financial institutions and other organizations will now use forward-looking information to better inform their credit loss estimates. Many of the loss estimation techniques applied today will still be permitted, although the inputs to those techniques will change to reflect the full amount of expected credit losses. In addition, ASU 2016-13 amends the accounting for credit losses on available-for-sale debt securities and purchased financial assets with credit deterioration. The amendments are effective for public companies for annual periods beginning after December 15, 2019. Early application will be permitted for all organizations for fiscal years, and interim periods within those fiscal years, beginning after December 15, 2018. Management is currently gathering data required to measure expected credit losses in accordance with this ASU and will then evaluate the impact of this ASU on the Company's consolidated financial statements. While the Company has not quantified the impact of this ASU, it does expect changing from the current loss model to an expected loss model to result in an earlier recognition of losses.
In January 2017, FASB issued ASU 2017-01, Business Combinations (Topic 805) - Clarifying the Definition of a Business. The amendments in ASU 2017-01 clarify the definition and provide a more robust framework to use in determining when a set of assets and activities constitutes a business. ASU 2017-01 is intended to provide guidance when evaluating whether transactions should be accounted for as acquisitions (or disposals) of assets or businesses. The amendments are effective for public companies for annual periods beginning after December 15, 2017, including interim periods within those annual periods. The Company does not expect the adoption of this update to have a significant impact on its consolidated financial statements.
In January 2017, FASB issued ASU 2017-03, Accounting Changes and Error Corrections (Topic 250) and Investments - Equity Method and Joint Ventures (Topic 323): Amendments to SEC Paragraphs Pursuant to Staff Announcements at the September 22, 2016 and November 17, 2016 EITF Meetings. These amendments apply to ASU 2014-09 (Revenue from Contracts with Customers), ASU 2016-02 (Leases), and ASU 2016-13 (Financial Instruments - Credit Losses). These amendments add paragraph 250-10-S99-6 which includes the text of "SEC Staff Announcement: Disclosure of the Impact That Recently Issued Accounting Standards Will Have on the Financial Statements of a Registrant When Such Standards Are Adopted in a Future Period (in accordance with Staff Accounting Bulletin [SAB] Topic 11.M)." The Company does not expect the adoption of this update to have a significant impact on its consolidated financial statements.
In March 2017, FASB issued ASU 2017-07, Compensation – Retirement Benefits (Topic 715): Improving the Presentation of Net Periodic Pension Cost and Net Periodic Postretirement Benefit Cost. The amendments require that an employer report the service cost component in the same line item or items as other compensation costs arising from services rendered by the pertinent employees during the period. The other components of net benefit cost are required to be presented in the income statement separately from the service cost component and outside a subtotal of income from operations, if one is presented. The amendments also allow only the service cost component to be eligible for capitalization when applicable. The amendments are effective for public companies for annual periods beginning after December 15, 2017, including interim periods within those periods. The Company does not expect the adoption of this update to have a significant impact on its consolidated financial statements.
In March 2017, FASB issued ASU 2017-08, Receivables – Nonrefundable Fees and Other Costs (Subtopic 310-20), Premium Amortization on Purchased Callable Debt Securities. The amendments shorten the amortization period for certain callable debt securities held at a premium. Specifically, the amendments require the premium to be amortized to the earliest call date. The amendments do not require an accounting change for securities held at a discount; the discount continues to be amortized to maturity. The amendments are effective for public companies for annual periods beginning after December 15, 2018, including interim periods within those annual periods. The Company does not expect the adoption of this update to have a significant impact on its consolidated financial statements.
In May 2017, FASB issued ASU 2017-09, Compensation - Stock Compensation (Topic 718): Scope of Modification Accounting. The amendments provide guidance on determining which changes to the terms and conditions of share-based payment awards require an entity to apply modification accounting under Topic 718. The amendments are effective for public companies for annual periods beginning after December 15, 2017, including interim periods within those annual periods. The Company does not expect the adoption of this update to have a significant impact on its consolidated financial statements.
In July 2017, FASB issued ASU 2017-11, Earnings Per Share (Topic 260); Distinguishing Liabilities from Equity (Topic 480); Derivatives and Hedging (Topic 815): (Part I) Accounting for Certain Financial Instruments with Down Round Features, (Part II) Replacement of the Indefinite Deferral for Mandatorily Redeemable Financial Instruments of Certain Nonpublic Entities and Certain Mandatorily Redeemable Noncontrolling Interests with a Scope Exception. These amendments simplify the accounting for certain financial instruments with down round features. The amendments are effective for public companies for annual periods beginning after December 15, 2018, including interim periods within those annual periods. The Company currently does not have any financial instruments with down round features and therefore does not expect the adoption of this update to have a significant impact on its consolidated financial statements.
70
In February 2018, FASB issued ASU 2018-02, Income Statement – Reporting Comprehensive Income (Topic 220). The amendments in this update allow a reclassification from retained earnings to accumulated other comprehensive income for stranded tax effects resulting from the Tax Cuts and Jobs Act. However, because the amendments only relate to the reclassification of the income tax effects of the Tax Cuts and Jobs Act, the underlying guidance that requires that the effect of a change in tax laws or rates be included in income from continuing operations is not affected. The amendments in this update are effective for all entities for fiscal years beginning after December 15, 2018, and interim periods within those fiscal years. Early adoption of the amendments in this Update is permitted, including adoption in any interim period, (1) for public business entities for reporting periods for which financial statements have not yet been issued and (2) for all other entities for reporting periods for which financial statements have not yet been made available for issuance. The amendments in this Update should be applied either in the period of adoption or retrospectively to each period (or periods) in which the effect of the change in the U.S. federal corporate income tax rate in the Tax Cuts and Jobs Act is recognized. The Company elected the early adoption of ASU 2018-02 as of and for the period ending December 31, 2017. As a result, the Company reclassified $599 from retained earnings to accumulated other comprehensive income as a result of the stranded tax effects resulting from the Tax Cuts and Jobs Act. The reclassification amount of $599 is comprised of a $473 unrealized loss on investment securities and $126 unrealized loss on retirement plans.
| (2) |
Cash and Due from Banks
|
The Bank is required to maintain reserves with the Federal Reserve Bank based on a percentage of deposit liabilities. No aggregate reserves were required at December 31, 2017 and 2016. The Bank has met its average reserve requirements during 2017, 2016, and 2015 and the minimum required balance at December 31, 2017 and 2016.
71
| (3) |
Investment Securities
|
The amortized cost, unrealized gains and losses and estimated fair values of investments in debt and other securities at December 31, 2017 are summarized as follows:
|
|
Amortized cost
|
Unrealized gains
|
Unrealized losses
|
Estimated fair value
|
||||||||||||
|
Investment securities available-for-sale:
|
||||||||||||||||
|
U.S. Treasury securities
|
$
|
18,589
|
$
|
—
|
$
|
(125
|
)
|
$
|
18,464
|
|||||||
|
Securities of U.S. government agencies and corporations
|
21,353
|
—
|
(244
|
)
|
21,109
|
|||||||||||
|
Obligations of states and political subdivisions
|
23,138
|
216
|
(146
|
)
|
23,208
|
|||||||||||
|
Collateralized mortgage obligations
|
67,724
|
—
|
(1,641
|
)
|
66,083
|
|||||||||||
|
Mortgage-backed securities
|
154,143
|
95
|
(2,361
|
)
|
151,877
|
|||||||||||
|
|
||||||||||||||||
|
Total debt securities
|
$
|
284,947
|
$
|
311
|
$
|
(4,517
|
)
|
$
|
280,741
|
|||||||
The amortized cost, unrealized gains and losses and estimated fair values of investments in debt and other securities at December 31, 2016 are summarized as follows:
|
|
Amortized cost
|
Unrealized gains
|
Unrealized losses
|
Estimated fair value
|
||||||||||||
|
Investment securities available-for-sale:
|
||||||||||||||||
|
U.S. Treasury Securities
|
$
|
28,738
|
$
|
2
|
$
|
(88
|
)
|
$
|
28,652
|
|||||||
|
Securities of U.S. government agencies and corporations
|
24,382
|
2
|
(187
|
)
|
24,197
|
|||||||||||
|
Obligations of states and political subdivisions
|
30,870
|
271
|
(253
|
)
|
30,888
|
|||||||||||
|
Collateralized mortgage obligations
|
51,002
|
1
|
(1,065
|
)
|
49,938
|
|||||||||||
|
Mortgage-backed securities
|
144,883
|
280
|
(1,759
|
)
|
143,404
|
|||||||||||
|
|
||||||||||||||||
|
Total debt securities
|
$
|
279,875
|
$
|
556
|
$
|
(3,352
|
)
|
$
|
277,079
|
|||||||
Gross realized gains from sales and calls of available-for-sale securities were $2, $24, and $56 for the years ended December 31, 2017, 2016, and 2015, respectively. Gross realized losses from sales of available-for-sale securities were $16, $25, and $27 for the years ended December 31, 2017, 2016, and 2015, respectively.
The amortized cost and estimated fair value of debt and other securities at December 31, 2017, by contractual and expected maturity, are shown in the following table:
|
Amortized
cost
|
Estimated
fair value
|
|||||||
|
|
||||||||
|
Maturity in years:
|
||||||||
|
Due in one year or less
|
$
|
23,854
|
$
|
23,796
|
||||
|
Due after one year through five years
|
35,178
|
34,759
|
||||||
|
Due after five years through ten years
|
4,048
|
4,226
|
||||||
|
Due after ten years
|
—
|
—
|
||||||
|
Subtotal
|
63,080
|
62,781
|
||||||
|
MBS and CMO
|
221,867
|
217,960
|
||||||
|
Total
|
$
|
284,947
|
$
|
280,741
|
||||
Expected maturities may differ from contractual maturities because borrowers may have the right to call or prepay obligations with or without call or prepayment penalties. In addition, factors such as prepayments and interest rates may affect the yield on the carrying value of mortgage-related securities.
72
An analysis of gross unrealized losses of the available-for-sale investment securities portfolio as of December 31, 2017, follows:
|
|
Less than 12 months
|
12 months or more
|
Total
|
|||||||||||||||||||||
|
|
Fair Value
|
Unrealized losses
|
Fair Value
|
Unrealized losses
|
Fair Value
|
Unrealized losses
|
||||||||||||||||||
|
U.S. Treasury securities
|
$
|
10,004
|
$
|
(2
|
)
|
$
|
8,460
|
$
|
(123
|
)
|
$
|
18,464
|
$
|
(125
|
)
|
|||||||||
|
Securities of U.S. government agencies and corporations
|
6,049
|
(50
|
)
|
15,060
|
(194
|
)
|
21,109
|
(244
|
)
|
|||||||||||||||
|
Obligations of states and political subdivisions
|
7,677
|
(34
|
)
|
7,116
|
(112
|
)
|
14,793
|
(146
|
)
|
|||||||||||||||
|
Collateralized mortgage obligations
|
31,679
|
(576
|
)
|
34,404
|
(1,065
|
)
|
66,083
|
(1,641
|
)
|
|||||||||||||||
|
Mortgage-backed securities
|
62,320
|
(650
|
)
|
76,478
|
(1,711
|
)
|
138,798
|
(2,361
|
)
|
|||||||||||||||
|
|
||||||||||||||||||||||||
|
Total
|
$
|
117,729
|
$
|
(1,312
|
)
|
$
|
141,518
|
$
|
(3,205
|
)
|
$
|
259,247
|
$
|
(4,517
|
)
|
|||||||||
No decline in value was considered "other-than-temporary" during 2017. Eighty-eight securities, all considered investment grade, which had a fair value of $117,729 and a total unrealized loss of $1,312 have been in an unrealized loss position for less than twelve months as of December 31, 2017. One hundred twenty-two securities, all considered investment grade, which had a fair value of $141,518 and a total unrealized loss of $3,205, have been in an unrealized loss position for more than twelve months as of December 31, 2017. The unrealized losses on the Company's investment securities were caused by market conditions for these types of investments, particularly changes in risk-free interest rates. The Company does not intend to sell the securities and has concluded it is not more likely than not that we will be required to sell these securities prior to recovery of their anticipated cost basis. Therefore, the Company does not consider these investments to be other than temporarily impaired as of December 31, 2017.
The fair value of investment securities could decline in the future if the general economy deteriorates, inflation increases, credit ratings decline, the issuer's financial condition deteriorates, or the liquidity for securities declines. As a result, other than temporary impairments may occur in the future.
An analysis of gross unrealized losses of the available-for-sale investment securities portfolio as of December 31, 2016, follows:
|
|
Less than 12 months
|
12 months or more
|
Total
|
|||||||||||||||||||||
|
|
Fair Value
|
Unrealized losses
|
Fair Value
|
Unrealized losses
|
Fair Value
|
Unrealized losses
|
||||||||||||||||||
|
U.S. Treasury Securities
|
$
|
23,564
|
$
|
(88
|
)
|
$
|
—
|
$
|
—
|
$
|
23,564
|
$
|
(88
|
)
|
||||||||||
|
Securities of U.S. government agencies and corporation
|
22,195
|
(187
|
)
|
—
|
—
|
22,195
|
(187
|
)
|
||||||||||||||||
|
Obligations of states and political subdivision
|
16,168
|
(245
|
)
|
996
|
(8
|
)
|
17,164
|
(253
|
)
|
|||||||||||||||
|
Collateralized mortgage obligations
|
49,805
|
(1,065
|
)
|
—
|
—
|
49,805
|
(1,065
|
)
|
||||||||||||||||
|
Mortgage-backed securities
|
109,092
|
(1,678
|
)
|
4,829
|
(81
|
)
|
113,921
|
(1,759
|
)
|
|||||||||||||||
|
|
||||||||||||||||||||||||
|
Total
|
$
|
220,824
|
$
|
(3,263
|
)
|
$
|
5,825
|
$
|
(89
|
)
|
$
|
226,649
|
$
|
(3,352
|
)
|
|||||||||
Investment securities carried at $32,399 and $38,152 at December 31, 2017 and 2016, respectively, were pledged to secure public deposits or for other purposes as required or permitted by law.
73
| (4) |
Loans
|
The composition of the Company's loan portfolio, by loan class, at December 31, is as follows:
|
|
2017
|
2016
|
||||||
|
Commercial
|
$
|
135,015
|
$
|
126,311
|
||||
|
Commercial Real Estate
|
398,346
|
344,210
|
||||||
|
Agriculture
|
113,555
|
101,905
|
||||||
|
Residential Mortgage
|
42,081
|
40,237
|
||||||
|
Residential Construction
|
21,299
|
23,650
|
||||||
|
Consumer
|
38,900
|
43,250
|
||||||
|
|
||||||||
|
|
749,196
|
679,563
|
||||||
|
Allowance for loan losses
|
(11,133
|
)
|
(10,899
|
)
|
||||
|
Net deferred origination fees and costs
|
1,049
|
1,106
|
||||||
|
|
||||||||
|
Loans, net
|
$
|
739,112
|
$
|
669,770
|
||||
The Company manages asset quality and credit risk by maintaining diversification in its loan portfolio and through review processes that include analysis of credit requests and ongoing examination of outstanding loans and delinquencies, with particular attention to portfolio dynamics and loan mix. The Company strives to identify loans experiencing difficulty early enough to correct the problems, to record charge-offs promptly based on realistic assessments of collectability and current collateral values and to maintain an adequate allowance for loan losses at all times. Asset quality reviews of loans and other non-performing assets are administered using credit risk rating standards and criteria similar to those employed by state and federal banking regulatory agencies.
Commercial loans, whether secured or unsecured, generally are made to support the short-term operations and other needs of small businesses. These loans are generally secured by the receivables, equipment, and other real property of the business and are susceptible to the related risks described above. Problem commercial loans are generally identified by periodic review of financial information that may include financial statements, tax returns, and payment history of the borrower. Based on this information, the Company may decide to take any of several courses of action, including demand for repayment, requiring the borrower to provide a significant principal payment and/or additional collateral or requiring similar support from guarantors. Notwithstanding, when repayment becomes unlikely based on the borrower's income and cash flow, repossession or foreclosure of the underlying collateral may become necessary. Collateral values may be determined by appraisals obtained through Bank-approved, licensed appraisers, qualified independent third parties, purchase invoices, or other appropriate documentation.
Commercial real estate loans generally fall into two categories, owner-occupied and non-owner occupied. Loans secured by owner-occupied real estate are primarily susceptible to changes in the market conditions of the related business. This may be driven by, among other things, industry changes, geographic business changes, changes in the individual financial capacity of the business owner, general economic conditions and changes in business cycles. These same risks apply to Commercial loans whether secured by equipment, receivables or other personal property or unsecured. Problem commercial real estate loans are generally identified by periodic review of financial information that may include financial statements, tax returns, payment history of the borrower, and site inspections. Based on this information, the Company may decide to take any of several courses of action, including demand for repayment, requiring the borrower to provide a significant principal payment and/or additional collateral or requiring similar support from guarantors. Notwithstanding, when repayment becomes unlikely based on the borrower's income and cash flow, repossession or foreclosure of the underlying collateral may become necessary. Losses on loans secured by owner occupied real estate, equipment, or other personal property generally are dictated by the value of underlying collateral at the time of default and liquidation of the collateral. When default is driven by issues related specifically to the business owner, collateral values tend to provide better repayment support and may result in little or no loss. Alternatively, when default is driven by more general economic conditions, underlying collateral generally has devalued more and results in larger losses due to default. Loans secured by non-owner occupied real estate are primarily susceptible to risks associated with swings in occupancy or vacancy and related shifts in lease rates, rental rates or room rates. Most often, these shifts are a result of changes in general economic or market conditions or overbuilding and resulting over-supply of space. Losses are dependent on the value of underlying collateral at the time of default. Values are generally driven by these same factors and influenced by interest rates and required rates of return as well as changes in occupancy costs. Collateral values may be determined by appraisals obtained through Bank-approved, licensed appraisers, qualified independent third parties, sales invoices, or other appropriate means.
Agricultural loans, whether secured or unsecured, generally are made to producers and processors of crops and livestock. Repayment is primarily from the sale of an agricultural product or service. Agricultural loans are generally secured by inventory, receivables, equipment, and other real property. Agricultural loans primarily are susceptible to changes in market demand for specific commodities. This may be exacerbated by, among other things, industry changes, changes in the individual financial capacity of the business owner, general economic conditions and changes in business cycles, as well as adverse weather conditions such as drought or floods. Problem agricultural loans are generally identified by periodic review of financial information that may include financial statements, tax returns, crop budgets, payment history, and crop inspections. Based on this information, the Company may decide to take any of several courses of action, including demand for repayment, requiring the borrower to provide a significant principal payment and/or additional collateral or requiring similar support from guarantors. Notwithstanding, when repayment becomes unlikely based on the borrower's income and cash flow, repossession or foreclosure of the underlying collateral may become necessary.
74
Residential mortgage loans, which are secured by real estate, are primarily susceptible to four risks; non-payment due to diminished or lost income, over-extension of credit, a lack of borrower's cash flow to sustain payments, and shortfalls in collateral value. In general, non-payment is usually due to loss of employment and follows general economic trends in the economy, particularly the upward movement in the unemployment rate, loss of collateral value, and demand shifts.
Construction loans, whether owner-occupied or non-owner occupied residential development loans, are not only susceptible to the related risks described above but the added risks of construction, including cost over-runs, mismanagement of the project, or lack of demand and market changes experienced at time of completion. Losses are primarily related to underlying collateral value and changes therein as described above. Problem construction loans are generally identified by periodic review of financial information that may include financial statements, tax returns and payment history of the borrower. Based on this information, the Company may decide to take any of several courses of action, including demand for repayment, requiring the borrower to provide a significant principal payment and/or additional collateral or requiring similar support from guarantors, or repossession or foreclosure of the underlying collateral. Collateral values may be determined by appraisals obtained through Bank-approved, licensed appraisers, qualified independent third parties, purchase invoices, or other appropriate documentation.
Consumer loans, whether unsecured or secured, are primarily susceptible to four risks: non-payment due to diminished or lost income, over-extension of credit, a lack of borrower's cash flow to sustain payments, and shortfall in collateral value. In general, non-payment is usually due to loss of employment and will follow general economic trends in the economy, particularly the upward movements in the unemployment rate, loss of collateral value, and demand shifts.
Collateral values may be determined by appraisals obtained through Bank-approved, licensed appraisers, qualified independent third parties, purchase invoices, or other appropriate documentation. Collateral valuations are obtained at origination of the credit and periodically thereafter (generally annually but may be more frequent depending on the collateral type), once repayment is questionable, and the loan has been deemed classified.
As of December 31, 2017, approximately 53% in principal amount of the Company's loans were secured by commercial real estate, which consists primarily of loans secured by commercial properties and construction and land development loans. Approximately 6% in principal amount of the Company's loans were residential mortgage loans. Approximately 3% in principal amount of the Company's loans were residential construction loans. Approximately 15% in principal amount of the Company's loans were for agriculture and 18% in principal amount of the Company's loans were for general commercial uses, including professional, retail and small businesses. Approximately 5% in principal amount of the Company's loans were consumer loans.
Once a loan becomes delinquent or repayment becomes questionable, a Company collection officer will address collateral shortfalls with the borrower and attempt to obtain additional collateral or a principal payment. If this is not forthcoming and payment of principal and interest in accordance with the contractual terms of the loan agreement becomes unlikely, the Company will consider the loan to be impaired and will estimate its probable loss, using the present value of future cash flows discounted at the loan's effective interest rate, the loan's observable market price, or the fair value of the collateral if the loan is collateral dependent. For collateral dependent loans, the Company will utilize a recent valuation of the underlying collateral less estimated costs of sale, and charge-off the loan down to the estimated net realizable amount. Depending on the length of time until final collection, the Company may periodically revalue the estimated loss and take additional charge-offs or specific reserves as warranted. Revaluations may occur as often as every 3-12 months depending on the underlying collateral and volatility of values. Final charge-offs or recoveries are taken when the collateral is liquidated and the actual loss is confirmed. Unpaid balances on loans after or during collection and liquidation may also be pursued through legal action and attachment of wages or judgment liens on the borrower's other assets.
At December 31, 2017 and December 31, 2016, all loans were pledged under a blanket collateral lien to secure actual and potential borrowings from the Federal Home Loan Bank.
75
Non-accrual and Past Due Loans
The Company's loans by delinquency and non-accrual status, as of December 31, 2017 and December 31, 2016 was as follows:
|
|
Current & Accruing
|
30-59 Days Past Due & Accruing
|
60-89 Days Past Due & Accruing
|
90 Days or
more Past Due & Accruing
|
Nonaccrual
|
Total Loans
|
||||||||||||||||||
|
December 31, 2017
|
||||||||||||||||||||||||
|
Commercial
|
$
|
133,913
|
$
|
—
|
$
|
—
|
$
|
45
|
$
|
1,057
|
$
|
135,015
|
||||||||||||
|
Commercial Real Estate
|
396,521
|
101
|
—
|
—
|
1,724
|
398,346
|
||||||||||||||||||
|
Agriculture
|
113,555
|
—
|
—
|
—
|
—
|
113,555
|
||||||||||||||||||
|
Residential Mortgage
|
40,354
|
349
|
597
|
—
|
781
|
42,081
|
||||||||||||||||||
|
Residential Construction
|
21,299
|
—
|
—
|
—
|
—
|
21,299
|
||||||||||||||||||
|
Consumer
|
38,656
|
1
|
38
|
—
|
205
|
38,900
|
||||||||||||||||||
|
Total
|
$
|
744,298
|
$
|
451
|
$
|
635
|
$
|
45
|
$
|
3,767
|
$
|
749,196
|
||||||||||||
|
|
||||||||||||||||||||||||
|
December 31, 2016
|
||||||||||||||||||||||||
|
Commercial
|
$
|
121,311
|
$
|
—
|
$
|
—
|
$
|
—
|
$
|
5,000
|
$
|
126,311
|
||||||||||||
|
Commercial Real Estate
|
343,186
|
484
|
—
|
—
|
540
|
344,210
|
||||||||||||||||||
|
Agriculture
|
101,905
|
—
|
—
|
—
|
—
|
101,905
|
||||||||||||||||||
|
Residential Mortgage
|
39,463
|
—
|
120
|
—
|
654
|
40,237
|
||||||||||||||||||
|
Residential Construction
|
23,650
|
—
|
—
|
—
|
—
|
23,650
|
||||||||||||||||||
|
Consumer
|
43,106
|
—
|
41
|
—
|
103
|
43,250
|
||||||||||||||||||
|
Total
|
$
|
672,621
|
$
|
484
|
$
|
161
|
$
|
—
|
$
|
6,297
|
$
|
679,563
|
||||||||||||
Non-accrual loans amounted to $3,767 at December 31, 2017 and were comprised of three residential mortgage loans totaling $781, three commercial real estate loans totaling $1,724, three commercial loans totaling $1,057, and one consumer loan totaling $205. Non-accrual loans amounted to $6,297 at December 31, 2016 and were comprised of three residential mortgage loans totaling $654, two commercial real estate loans totaling $540, one commercial loan totaling $5,000 and one consumer loan totaling $103. All non-accrual loans are measured for impairment based upon the present value of future cash flows discounted at the loan's effective interest rate, the loan's observable market price, or the fair value of collateral, if the loan is collateral dependent. If the measurement of the non-accrual loan is less than the recorded investment in the loan, an impairment is recognized through the establishment of a specific reserve sufficient to cover expected losses and/or a charge-off against the allowance for loan losses. If the loan is considered to be collateral dependent, it is generally the Company's policy to charge-off the portion of any non-accrual loan that the Company does not expect to collect by writing the loan down to the estimated net realizable value of the underlying collateral. There were no commitments to lend additional funds to borrowers whose loans were on non-accrual status at December 31, 2017.
76
Impaired Loans
A loan is considered impaired when, based on current information and events, it is probable that the Company will be unable to collect all amounts due according to the contractual terms of the loan agreement, including scheduled interest payments. Loans to be considered for impairment include non-accrual loans, troubled debt restructurings and loans with a risk rating of 5 (special mention) or worse and an aggregate exposure of five hundred thousand or greater. Once identified, impaired loans are measured individually for impairment using one of three methods: present value of expected cash flows discounted at the loan's effective interest rate; the loan's observable market price; or fair value of collateral if the loan is collateral dependent. In general, any portion of the recorded investment in a collateral dependent loan in excess of the fair value of the collateral that can be identified as uncollectible, and is, therefore, deemed a confirmed loss, is promptly charged-off against the allowance for loan losses.
Impaired loans, segregated by loan class, as of December 31, 2017 and December 31, 2016 were as follows:
|
|
Unpaid Contractual Principal Balance
|
Recorded Investment with no Allowance
|
Recorded Investment with Allowance
|
Total Recorded Investment
|
Related Allowance
|
|||||||||||||||
|
December 31, 2017
|
||||||||||||||||||||
|
Commercial
|
$
|
3,882
|
$
|
1,057
|
$
|
2,603
|
$
|
3,660
|
$
|
53
|
||||||||||
|
Commercial Real Estate
|
2,114
|
1,724
|
272
|
1,996
|
36
|
|||||||||||||||
|
Agriculture
|
—
|
—
|
—
|
—
|
—
|
|||||||||||||||
|
Residential Mortgage
|
2,628
|
781
|
1,496
|
2,277
|
302
|
|||||||||||||||
|
Residential Construction
|
651
|
—
|
650
|
650
|
76
|
|||||||||||||||
|
Consumer
|
418
|
205
|
213
|
418
|
3
|
|||||||||||||||
|
Total
|
$
|
9,693
|
$
|
3,767
|
$
|
5,234
|
$
|
9,001
|
$
|
470
|
||||||||||
|
|
||||||||||||||||||||
|
December 31, 2016
|
||||||||||||||||||||
|
Commercial
|
$
|
5,578
|
$
|
—
|
$
|
5,578
|
$
|
5,578
|
$
|
898
|
||||||||||
|
Commercial Real Estate
|
885
|
540
|
283
|
823
|
39
|
|||||||||||||||
|
Agriculture
|
—
|
—
|
—
|
—
|
—
|
|||||||||||||||
|
Residential Mortgage
|
3,392
|
654
|
2,380
|
3,034
|
584
|
|||||||||||||||
|
Residential Construction
|
820
|
—
|
820
|
820
|
98
|
|||||||||||||||
|
Consumer
|
708
|
103
|
601
|
704
|
25
|
|||||||||||||||
|
Total
|
$
|
11,383
|
$
|
1,297
|
$
|
9,662
|
$
|
10,959
|
$
|
1,644
|
||||||||||
The average recorded investment in impaired loans and the amount of interest income recognized on impaired loans during the years ended December 31, 2017, 2016, and 2015 was as follows:
|
|
December 31, 2017
|
December 31, 2016
|
December 31, 2015
|
|||||||||||||||||||||
|
|
Average Recorded Investment
|
Interest Income Recognized
|
Average Recorded Investment
|
Interest Income Recognized
|
Average Recorded Investment
|
Interest Income Recognized
|
||||||||||||||||||
|
Commercial
|
$
|
3,980
|
$
|
157
|
$
|
3,276
|
$
|
33
|
$
|
1,794
|
$
|
46
|
||||||||||||
|
Commercial Real Estate
|
1,780
|
15
|
857
|
16
|
1,251
|
42
|
||||||||||||||||||
|
Agriculture
|
—
|
—
|
—
|
—
|
—
|
—
|
||||||||||||||||||
|
Residential Mortgage
|
2,543
|
92
|
3,131
|
93
|
3,836
|
123
|
||||||||||||||||||
|
Residential Construction
|
732
|
37
|
945
|
44
|
906
|
37
|
||||||||||||||||||
|
Consumer
|
548
|
26
|
736
|
71
|
1,376
|
39
|
||||||||||||||||||
|
Total
|
$
|
9,583
|
$
|
327
|
$
|
8,945
|
$
|
257
|
$
|
9,163
|
$
|
287
|
||||||||||||
None of the interest on impaired loans was recognized using a cash basis of accounting for the years ended December 31, 2017, 2016, and 2015.
77
Troubled Debt Restructurings
The Company's loan portfolio includes certain loans that have been modified in a Troubled Debt Restructuring ("TDR"), which are loans on which concessions in terms have been granted because of the borrowers' financial difficulties and, as a result, the Company receives less than the current market-based compensation for the loan. These concessions may include reductions in the interest rate, payment extensions, forgiveness of principal, forbearance, or other actions. Certain TDRs are placed on non-accrual status at the time of restructure and may be returned to accruing status after considering the borrower's sustained repayment performance for a reasonable period, generally six months.
When a loan is modified, it is measured based upon the present value of future cash flows discounted at the contractual interest rate of the original loan agreement, or the fair value of collateral less selling costs if the loan is collateral dependent. If the value of the modified loan is less than the recorded investment in the loan, impairment is recognized through a specific allowance or a charge-off of the loan.
The Company had $5,896 and $9,663 in TDR loans as of December 31, 2017 and December 31, 2016, respectively. Specific reserves for TDR loans totaled $470 and $1,644 as of December 31, 2017 and December 31, 2016, respectively. TDR loans performing in compliance with modified terms totaled $5,234 and $4,662 as of December 31, 2017 and December 31, 2016, respectively. There were no commitments to advance additional funds on existing TDR loans as of December 31, 2017.
Loans modified as troubled debt restructurings during the year ended December 31, 2017, 2016, and 2015 were as follows:
|
|
Year Ended December 31, 2017
|
|||||||||||
|
|
Number of Contracts
|
Pre-modification outstanding recorded investment
|
Post-modification outstanding recorded investment
|
|||||||||
|
Commercial
|
1
|
$
|
2,410
|
$
|
2,410
|
|||||||
|
Total
|
1
|
$
|
2,410
|
$
|
2,410
|
|||||||
|
|
Year Ended December 31, 2016
|
|||||||||||
|
|
Number of Contracts
|
Pre-modification outstanding recorded investment
|
Post-modification outstanding recorded investment
|
|||||||||
|
Commercial
|
2
|
$
|
5,180
|
$
|
5,180
|
|||||||
|
Total
|
2
|
$
|
5,180
|
$
|
5,180
|
|||||||
|
|
Year Ended December 31, 2015
|
|||||||||||
|
|
Number of Contracts
|
Pre-modification outstanding recorded investment
|
Post-modification outstanding recorded investment
|
|||||||||
|
Commercial
|
1
|
$
|
419
|
$
|
419
|
|||||||
|
Consumer
|
1
|
109
|
109
|
|||||||||
|
Total
|
2
|
$
|
528
|
$
|
528
|
|||||||
Loan modifications generally involve reductions in the interest rate, payment extensions, forgiveness of principal, or forbearance. There were no troubled debt restructurings modified within the previous 12 months and for which there was a payment default during the year ended December 31, 2017. There was one commercial loan with a recorded investment of $5,000 that was modified as a troubled debt restructuring within the previous 12 months and for which there was a payment default during the year ended December 31, 2016. There were no troubled debt restructurings modified within the previous 12 months and for which there was a payment default during the year ended December 31, 2015. The Company considers a loan to be in payment default when it is 90 days or more past due.
78
Credit Quality Indicators
All new loans are rated using the credit risk ratings and criteria adopted by the Company. Risk ratings are adjusted as future circumstances warrant. All credits risk rated 1, 2, 3 or 4 equate to a Pass as indicated by Federal and State regulatory agencies; a 5 equates to a Special Mention; a 6 equates to Substandard; a 7 equates to Doubtful; and an 8 equates to a Loss. General definitions for each risk rating are as follows:
Risk Rating "1" – Pass (High Quality): This category is reserved for loans fully secured by Company CD's or savings accounts and properly margined (as defined in the Company's Credit Policy) and actively traded securities (including stocks, as well as corporate, municipal and U.S. Government bonds).
Risk Rating "2" – Pass (Above Average Quality): This category is reserved for borrowers with strong balance sheets that are well structured with manageable levels of debt and good liquidity. Cash flow is sufficient to service all debt, including the Company's, as agreed. Historical earnings, cash flow, and payment performance have all been strong and trends are positive and consistent. Collateral protection is better than the Company's Credit Policy guidelines.
Risk Rating "3" – Pass (Average Quality): Credits within this category are considered to be of average, but acceptable, quality. Loan characteristics, including term and collateral advance rates, meet the Company's Credit Policy guidelines; unsecured lines to borrowers with above average liquidity and cash flow may be considered for this category; the borrower's financial strength is well documented, with adequate, but consistent, cash flow to meet all obligations. Liquidity should be sufficient and leverage should be moderate. Monitoring of collateral may be required, including a borrowing base or construction budget. Alternative financing is typically available.
Risk Rating "4" – Pass (Below Average Quality): Credits within this category are considered sound, but merit additional attention due to industry concentrations within the borrower's customer base, problems within their industry, deteriorating financial or earnings trends, declining collateral values, increased frequency of past due payments and/or overdrafts, discovery of documentation deficiencies which may impair our borrower's ability to repay, or the Company's ability to liquidate collateral. Financial performance is average but inconsistent. There also may be changes of ownership, management or professional advisors, which could be detrimental to the borrower's future performance.
Risk Rating "5" – Special Mention (Criticized): Loans in this category are currently protected by their collateral value and have no loss potential identified, but have potential weaknesses which may, if not monitored or corrected, weaken our ability to collect payments from the borrower or satisfactorily liquidate our collateral position. Loans where terms have been modified due to their failure to perform as agreed may be included in this category. Adverse trends in the borrower's operation, such as reporting losses or inadequate cash flow, increasing and unsatisfactory leverage, or an adverse change in economic or market conditions may have weakened the borrower's business and impaired their ability to repay based on original terms. The condition or value of the collateral has deteriorated to the point where adequate protection for our loan may be jeopardized in the future. Loans in this category are in transition and, generally, do not remain in this category beyond 12 months. During this time, efforts are focused on strategies aimed at upgrading the credit or locating alternative financing.
Risk Rating "6" – Substandard (Classified): Loans in this category are inadequately protected by the borrower's net worth, capacity to repay or collateral pledged, if any. Loans so classified have a well-defined weakness or weaknesses that jeopardize the repayment of the debt. There exists a strong possibility of loss if the deficiencies are not corrected. Loans that are dependent on the liquidation of collateral to repay are included in this category, as well as borrowers in bankruptcy or where legal action is required to effect collection of our debt.
Risk Rating "7" – Doubtful (Classified): Loans in this category indicate all of the weaknesses of a Substandard classification, however, collection of loan principal, in full, is highly questionable and improbable; possibility of loss is very high, but there is still a possibility that certain collection strategies may, yet, be successful, rendering a definitive loss difficult to estimate, at this time. Loans in this category are in transition and, generally, do not remain in this category more than 6 months.
79
Risk Rating "8" – Loss (Classified):
Active Charge-Off. Loans in this category are considered uncollectible and of such little value that their removal from the Company's books is required. The charge-off is pending or already processed. Collateral positions have been or are in the process of being liquidated and the borrower/guarantor may or may not be cooperative in repayment of the debt. Recovery prospects are unknown at this time, but we are still actively engaged in the collection of the loan.
Inactive Charge-Off. Loans in this category are considered uncollectible and of such little value that their removal from the Company's books is required. The charge-off is pending or already processed. Collateral positions have been liquidated and the borrower/guarantor has nothing of any value remaining to apply to the repayment of our loan. Any further collection activities would be of little value.
The following table presents the risk ratings by loan class as of December 31, 2017 and December 31, 2016.
|
|
Pass
|
Special Mention
|
Substandard
|
Doubtful
|
Loss
|
Total
|
||||||||||||||||||
|
December 31, 2017
|
||||||||||||||||||||||||
|
Commercial
|
$
|
132,846
|
$
|
1,050
|
$
|
1,119
|
$
|
—
|
$
|
—
|
$
|
135,015
|
||||||||||||
|
Commercial Real Estate
|
378,632
|
16,101
|
3,613
|
—
|
—
|
398,346
|
||||||||||||||||||
|
Agriculture
|
110,370
|
3,140
|
45
|
—
|
—
|
113,555
|
||||||||||||||||||
|
Residential Mortgage
|
39,142
|
2,147
|
792
|
—
|
—
|
42,081
|
||||||||||||||||||
|
Residential Construction
|
21,299
|
-
|
-
|
—
|
—
|
21,299
|
||||||||||||||||||
|
Consumer
|
38,157
|
500
|
243
|
—
|
—
|
38,900
|
||||||||||||||||||
|
Total
|
$
|
720,446
|
$
|
22,938
|
$
|
5,812
|
$
|
—
|
$
|
—
|
$
|
749,196
|
||||||||||||
|
|
||||||||||||||||||||||||
|
December 31, 2016
|
||||||||||||||||||||||||
|
Commercial
|
$
|
112,656
|
$
|
7,294
|
$
|
6,361
|
$
|
—
|
$
|
—
|
$
|
126,311
|
||||||||||||
|
Commercial Real Estate
|
331,653
|
11,058
|
1,499
|
—
|
—
|
344,210
|
||||||||||||||||||
|
Agriculture
|
101,820
|
—
|
85
|
—
|
—
|
101,905
|
||||||||||||||||||
|
Residential Mortgage
|
37,831
|
1,751
|
655
|
—
|
—
|
40,237
|
||||||||||||||||||
|
Residential Construction
|
23,070
|
436
|
144
|
—
|
—
|
23,650
|
||||||||||||||||||
|
Consumer
|
41,826
|
547
|
877
|
—
|
—
|
43,250
|
||||||||||||||||||
|
Total
|
$
|
648,856
|
$
|
21,086
|
$
|
9,621
|
$
|
—
|
$
|
—
|
$
|
679,563
|
||||||||||||
80
Allowance for Loan Losses
The following table details activity in the allowance for loan losses by loan category for the years ended December 31, 2017, 2016 and 2015.
|
|
Commercial
|
Commercial Real Estate
|
Agriculture
|
Residential Mortgage
|
Residential Construction
|
Consumer
|
Unallocated
|
Total
|
||||||||||||||||||||||||
|
Balance as of
December 31, 2016
|
$
|
3,571
|
$
|
3,910
|
$
|
1,262
|
$
|
660
|
$
|
440
|
$
|
498
|
$
|
558
|
$
|
10,899
|
||||||||||||||||
|
Provision for loan losses
|
(567
|
)
|
1,550
|
285
|
(7
|
)
|
(85
|
)
|
(189
|
)
|
(387
|
)
|
600
|
|||||||||||||||||||
|
|
||||||||||||||||||||||||||||||||
|
Charge-offs
|
(681
|
)
|
—
|
—
|
(121
|
)
|
—
|
(33
|
)
|
—
|
(835
|
)
|
||||||||||||||||||||
|
Recoveries
|
302
|
—
|
—
|
96
|
5
|
66
|
—
|
469
|
||||||||||||||||||||||||
|
Net charge-offs
|
(379
|
)
|
—
|
—
|
(25
|
)
|
5
|
33
|
—
|
(366
|
)
|
|||||||||||||||||||||
|
Ending Balance
|
2,625
|
5,460
|
1,547
|
628
|
360
|
342
|
171
|
11,133
|
||||||||||||||||||||||||
|
Period-end amount allocated to:
|
||||||||||||||||||||||||||||||||
|
Loans individually evaluated for impairment
|
53
|
36
|
—
|
302
|
76
|
3
|
—
|
470
|
||||||||||||||||||||||||
|
Loans collectively evaluated for impairment
|
2,572
|
5,424
|
1,547
|
326
|
284
|
339
|
171
|
10,663
|
||||||||||||||||||||||||
|
Balance as of
December 31, 2017
|
$
|
2,625
|
$
|
5,460
|
$
|
1,547
|
$
|
628
|
$
|
360
|
$
|
342
|
$
|
171
|
$
|
11,133
|
||||||||||||||||
|
|
Commercial
|
Commercial Real Estate
|
Agriculture
|
Residential Mortgage
|
Residential Construction
|
Consumer
|
Unallocated
|
Total
|
||||||||||||||||||||||||
|
Balance as of December 31, 2015
|
$
|
3,097
|
$
|
3,343
|
$
|
1,060
|
$
|
739
|
$
|
334
|
$
|
641
|
$
|
37
|
$
|
9,251
|
||||||||||||||||
|
Provision for loan losses
|
883
|
582
|
121
|
(67
|
)
|
101
|
(341
|
)
|
521
|
1,800
|
||||||||||||||||||||||
|
|
||||||||||||||||||||||||||||||||
|
Charge-offs
|
(446
|
)
|
(15
|
)
|
—
|
(13
|
)
|
—
|
(65
|
)
|
—
|
(539
|
)
|
|||||||||||||||||||
|
Recoveries
|
37
|
—
|
81
|
1
|
5
|
263
|
—
|
387
|
||||||||||||||||||||||||
|
Net charge-offs
|
(409
|
)
|
(15
|
)
|
81
|
(12
|
)
|
5
|
198
|
—
|
(152
|
)
|
||||||||||||||||||||
|
Ending Balance
|
3,571
|
3,910
|
1,262
|
660
|
440
|
498
|
558
|
10,899
|
||||||||||||||||||||||||
|
Period-end amount allocated to:
|
||||||||||||||||||||||||||||||||
|
Loans individually evaluated for impairment
|
898
|
39
|
—
|
584
|
98
|
25
|
—
|
1,644
|
||||||||||||||||||||||||
|
Loans collectively evaluated for impairment
|
2,673
|
3,871
|
1,262
|
76
|
342
|
473
|
558
|
9,255
|
||||||||||||||||||||||||
|
Balance as of December 31, 2016
|
$
|
3,571
|
$
|
3,910
|
$
|
1,262
|
$
|
660
|
$
|
440
|
$
|
498
|
$
|
558
|
$
|
10,899
|
||||||||||||||||
81
|
|
Commercial
|
Commercial Real Estate
|
Agriculture
|
Residential Mortgage
|
Residential Construction
|
Consumer
|
Unallocated
|
Total
|
||||||||||||||||||||||||
|
Balance as of December 31, 2014
|
$
|
3,581
|
$
|
1,825
|
$
|
580
|
$
|
1,181
|
$
|
161
|
$
|
886
|
$
|
369
|
$
|
8,583
|
||||||||||||||||
|
Provision for loan losses
|
(542
|
)
|
1,507
|
480
|
(450
|
)
|
113
|
(126
|
)
|
(332
|
)
|
650
|
||||||||||||||||||||
|
|
||||||||||||||||||||||||||||||||
|
Charge-offs
|
(44
|
)
|
(7
|
)
|
—
|
(211
|
)
|
—
|
(175
|
)
|
—
|
(437
|
)
|
|||||||||||||||||||
|
Recoveries
|
102
|
18
|
—
|
219
|
60
|
56
|
—
|
455
|
||||||||||||||||||||||||
|
Net recoveries
|
58
|
11
|
—
|
8
|
60
|
(119
|
)
|
—
|
18
|
|||||||||||||||||||||||
|
Ending Balance
|
3,097
|
3,343
|
1,060
|
739
|
334
|
641
|
37
|
9,251
|
||||||||||||||||||||||||
|
Period-end amount allocated to:
|
||||||||||||||||||||||||||||||||
|
Loans individually evaluated for impairment
|
43
|
42
|
—
|
615
|
119
|
33
|
—
|
852
|
||||||||||||||||||||||||
|
Loans collectively evaluated for impairment
|
3,054
|
3,301
|
1,060
|
124
|
215
|
608
|
37
|
8,399
|
||||||||||||||||||||||||
|
Balance as of December 31, 2015
|
$
|
3,097
|
$
|
3,343
|
$
|
1,060
|
$
|
739
|
$
|
334
|
$
|
641
|
$
|
37
|
$
|
9,251
|
||||||||||||||||
The Company's investment in loans as of December 31, 2017, 2016, and 2015 related to each balance in the allowance for loan losses by loan category and disaggregated on the basis of the Company's impairment methodology was as follows:
|
|
Commercial
|
Commercial Real Estate
|
Agriculture
|
Residential Mortgage
|
Residential Construction
|
Consumer
|
Total
|
|||||||||||||||||||||
|
December 31, 2017
|
||||||||||||||||||||||||||||
|
Loans individually evaluated for impairment
|
$
|
3,660
|
$
|
1,996
|
$
|
—
|
$
|
2,277
|
$
|
650
|
$
|
418
|
$
|
9,001
|
||||||||||||||
|
Loans collectively evaluated for impairment
|
131,355
|
396,350
|
113,555
|
39,804
|
20,649
|
38,482
|
740,195
|
|||||||||||||||||||||
|
Ending Balance
|
$
|
135,015
|
$
|
398,346
|
$
|
113,555
|
$
|
42,081
|
$
|
21,299
|
$
|
38,900
|
$
|
749,196
|
||||||||||||||
|
|
||||||||||||||||||||||||||||
|
December 31, 2016
|
||||||||||||||||||||||||||||
|
Loans individually evaluated for impairment
|
$
|
5,578
|
$
|
823
|
$
|
—
|
$
|
3,034
|
$
|
820
|
$
|
704
|
$
|
10,959
|
||||||||||||||
|
Loans collectively evaluated for impairment
|
120,733
|
343,387
|
101,905
|
37,203
|
22,830
|
42,546
|
668,604
|
|||||||||||||||||||||
|
Ending Balance
|
$
|
126,311
|
$
|
344,210
|
$
|
101,905
|
$
|
40,237
|
$
|
23,650
|
$
|
43,250
|
$
|
679,563
|
||||||||||||||
|
December 31, 2015
|
||||||||||||||||||||||||||||
|
Loans individually evaluated for impairment
|
$
|
918
|
$
|
1,258
|
$
|
—
|
$
|
3,576
|
$
|
1,005
|
$
|
1,321
|
$
|
8,078
|
||||||||||||||
|
Loans collectively evaluated for impairment
|
135,177
|
291,058
|
84,813
|
39,799
|
11,105
|
44,065
|
606,017
|
|||||||||||||||||||||
|
Ending Balance
|
$
|
136,095
|
$
|
292,316
|
$
|
84,813
|
$
|
43,375
|
$
|
12,110
|
$
|
45,386
|
$
|
614,095
|
||||||||||||||
82
| (5) |
Mortgage Operations
|
Mortgage servicing rights are initially measured at fair value and amortized in proportion to, and over the period of, estimated net servicing revenues. The Company assesses capitalized mortgage servicing rights for impairment based upon the fair value of those rights at each reporting date. For purposes of measuring impairment, the rights are stratified based upon the product type, term and interest rates. Fair value is determined by discounting estimated net future cash flows from mortgage servicing activities using discount rates that approximate current market rates and estimated prepayment rates, among other assumptions. The amount of impairment recognized, if any, is the amount by which the capitalized mortgage servicing rights for a stratum exceeds their fair value. Impairment, if any, is recognized through a valuation allowance for each individual stratum. Changes in the carrying amount of mortgage servicing rights through impairment charges or recoveries in fair value are reported in earnings as other non-interest income.
The Company had $1,040 and $3,326 of mortgage loans held-for-sale at December 31, 2017 and December 31, 2016, respectively. At December 31, 2017 and 2016, the Company serviced real estate mortgage loans for others totaling $221,591 and $231,310, respectively.
The following table summarizes the activity related to the Company's mortgage servicing rights assets for the years ended December 31, 2017, December 31, 2016 and December 31, 2015. Mortgage servicing rights are included in Interest Receivable and Other Assets on the consolidated balance sheets.
|
|
December 31, 2016
|
Additions
|
Reductions
|
December 31, 2017
|
||||||||||||
|
Mortgage servicing rights
|
$
|
1,815
|
$
|
229
|
$
|
(332
|
)
|
$
|
1,712
|
|||||||
|
Valuation allowance
|
(21
|
)
|
—
|
21
|
—
|
|||||||||||
|
Mortgage servicing rights, net of valuation allowance
|
$
|
1,794
|
$
|
229
|
$
|
(311
|
)
|
$
|
1,712
|
|||||||
|
|
December 31, 2015
|
Additions
|
Reductions
|
December 31, 2016
|
||||||||||||
|
Mortgage servicing rights
|
$
|
1,862
|
$
|
348
|
$
|
(395
|
)
|
$
|
1,815
|
|||||||
|
Valuation allowance
|
—
|
(169
|
)
|
148
|
(21
|
)
|
||||||||||
|
Mortgage servicing rights, net of valuation allowance
|
$
|
1,862
|
$
|
179
|
$
|
(247
|
)
|
$
|
1,794
|
|||||||
|
|
December 31, 2014
|
Additions
|
Reductions
|
December 31, 2015
|
||||||||||||
|
Mortgage servicing rights
|
$
|
1,862
|
$
|
361
|
$
|
(361
|
)
|
$
|
1,862
|
|||||||
|
Valuation allowance
|
—
|
—
|
—
|
—
|
||||||||||||
|
Mortgage servicing rights, net of valuation allowance
|
$
|
1,862
|
$
|
361
|
$
|
(361
|
)
|
$
|
1,862
|
|||||||
The Company received contractually specified servicing fees of $575, $598, and $598 for the years ended December 31, 2017, 2016, and 2015, respectively. Contractually specified servicing fees are included in Other Income on the consolidated statements of income.
83
(6) Premises and Equipment
Premises and equipment consist of the following at December 31 of the indicated years:
|
|
2017
|
2016
|
||||||
|
Land
|
$
|
2,679
|
$
|
3,003
|
||||
|
Buildings
|
5,006
|
6,017
|
||||||
|
Furniture and equipment
|
11,206
|
11,214
|
||||||
|
Leasehold improvements
|
1,987
|
2,033
|
||||||
|
|
||||||||
|
|
20,878
|
22,267
|
||||||
|
Less accumulated depreciation and amortization
|
14,630
|
14,963
|
||||||
|
|
||||||||
|
|
$
|
6,248
|
$
|
7,304
|
||||
Depreciation and amortization expense, included in occupancy and equipment expense, was $600, $633, and $640 for the years ended December 31, 2017, 2016, and 2015, respectively.
| (7) |
Interest Receivable and other assets
|
Interest receivable and other assets consisted of the following at December 31 of the indicated years:
|
|
2017
|
2016
|
||||||
|
Interest receivable
|
$
|
4,117
|
$
|
3,996
|
||||
|
Mortgage servicing rights asset
|
1,712
|
1,794
|
||||||
|
Officer's Life Insurance
|
15,821
|
15,372
|
||||||
|
Investment in Limited Partnerships
|
291
|
581
|
||||||
|
Deferred tax assets, net (see Note 17)
|
4,548
|
5,660
|
||||||
|
Prepaid and other
|
3,585
|
1,616
|
||||||
|
|
||||||||
|
|
$
|
30,074
|
$
|
29,019
|
||||
| (8) |
Short-Term and Long-Term Borrowings
|
The Company had no secured borrowings and no Federal Funds purchased at December 31, 2017 and December 31, 2016.
Additional short-term borrowings available to the Company consist of a line of credit and advances with the Federal Home Loan Bank ("FHLB") secured under terms of a blanket collateral agreement by a pledge of FHLB stock and all loans. At December 31, 2017, the Company had a current collateral borrowing capacity with the FHLB of $308,657 and, at such date, also had unsecured formal lines of credit totaling $80,000 with correspondent banks.
The Company had no long-term borrowings at December 31, 2017 and 2016. Average outstanding balances of long-term borrowings consisting of FHLB advances were $0 during 2017, 2016, and 2015. The weighted average interest rate paid was 0% in 2017, 2016, and 2015.
84
| (9) |
Financial Instruments with Off-Balance Sheet Risk
|
The Company is a party to financial instruments with off-balance sheet risk in the normal course of business to meet the financing needs of its customers. These financial instruments include commitments to extend credit in the form of loans or through standby letters of credit. These instruments involve, to varying degrees, elements of credit and interest rate risk in excess of the amounts recognized in the balance sheet. The contract amounts of those instruments reflect the extent of involvement the Company has in particular classes of financial instruments.
The Bank's exposure to credit loss in the event of non-performance by the other party to the financial instrument for commitments to extend credit and standby letters of credit is represented by the contractual notional amount of those instruments. The Bank uses the same credit policies in making commitments and conditional obligations as it does for on-balance sheet instruments.
Financial instruments, whose contract amounts represent credit risk at December 31 of the indicated periods, were as follows:
|
|
2017
|
2016
|
||||||
|
Undisbursed loan commitments
|
$
|
220,882
|
$
|
207,207
|
||||
|
Standby letters of credit
|
2,635
|
3,518
|
||||||
|
Commitments to sell loans
|
1,283
|
1,848
|
||||||
|
|
||||||||
|
|
$
|
224,800
|
$
|
212,573
|
||||
Commitments to extend credit are agreements to lend to a customer as long as there is no violation of any condition established in the contract. Commitments generally have fixed expiration dates or other termination clauses and may require payment of a fee. Since many of the commitments are expected to expire without being drawn upon, the total commitment amounts do not necessarily represent future cash requirements. The Bank evaluates each customer's creditworthiness on a case-by-case basis. The amount of collateral obtained, if deemed necessary by the Bank upon extension of credit, is based on management's credit evaluation. Collateral held varies but may include accounts receivable, inventory, property, plant and equipment, and income-producing commercial properties.
Standby letters of credit are conditional commitments issued by the Bank to guarantee the performance of a customer to a third party. The credit risk involved in issuing letters of credit is essentially the same as that involved in extending loan facilities to customers. The Bank issues both financial and performance standby letters of credit. The financial standby letters of credit are primarily to guarantee payment to third parties. At December 31, 2017, there were no financial standby letters of credit outstanding. The performance standby letters of credit are typically issued to municipalities as specific performance bonds. At December 31, 2017, there was $2,635 issued in performance standby letters of credit and the Bank carried no liability. The Bank has experienced no draws on these letters of credit and does not expect to in the future; however, should a triggering event occur, the Bank either has collateral in excess of the letter of credit or imbedded agreements of recourse from the customer. The Bank has set aside a reserve for unfunded commitments in the amount of $850 and $793 at December 31, 2017 and 2016, respectively, which is recorded in "interest payable and other liabilities" on the consolidated balance sheets.
Commitments to extend credit and standby letters of credit bear similar credit risk characteristics as outstanding loans. As of December 31, 2017, the Company had no off-balance sheet derivatives requiring additional disclosure.
Mortgage loans sold to investors may be sold with servicing rights retained, for which the Company makes only standard legal representations and warranties as to meeting certain underwriting and collateral documentation standards. In the past two years, the Company has not had to repurchase any loans due to deficiencies in underwriting or loan documentation. Management believes that any liabilities that may result from such recourse provisions are not significant.
85
(10) Commitments and Contingencies
The Company is obligated for rental payments under certain operating lease agreements, some of which contain renewal options. Total rental expense for all leases included in net occupancy and equipment expense amounted to approximately $868, $1,078, and $980 for the years ended December 31, 2017, 2016, and 2015, respectively. At December 31, 2017, the future minimum payments under non-cancelable operating leases with initial or remaining terms in excess of one year were as follows:
|
Year ending December 31:
|
||||
|
2018
|
$
|
934
|
||
|
2019
|
805
|
|||
|
2020
|
791
|
|||
|
2021
|
735
|
|||
|
2022
|
671
|
|||
|
Thereafter
|
1,587
|
|||
|
|
||||
|
|
$
|
5,523
|
||
At December 31, 2017, the aggregate maturities for time deposits were as follows:
|
Year ending December 31:
|
||||
|
2018
|
$
|
55,209
|
||
|
2019
|
10,347
|
|||
|
2020
|
4,880
|
|||
|
2021
|
2,599
|
|||
|
2022
|
387
|
|||
|
Thereafter
|
—
|
|||
|
|
||||
|
|
$
|
73,422
|
||
The Company is subject to various legal proceedings in the normal course of its business. In the opinion of management, after having consulted with legal counsel, the outcome of the pending legal proceedings should not have a material adverse effect on the consolidated financial condition or results of operations of the Company.
86
| (11) |
Capital Adequacy and Restriction on Dividends
|
The Company and the Bank are subject to various regulatory capital requirements administered by the federal banking agencies. Failure to meet minimum capital requirements can initiate mandatory and possibly additional discretionary actions by regulators that, if undertaken, could have a material effect on the Company's and the Bank's consolidated financial statements. Under capital adequacy guidelines and the regulatory framework for prompt corrective action, the Company and the Bank must meet specific capital guidelines that involve quantitative measures of the Company's and the Bank's assets, liabilities, and certain off-balance-sheet items as calculated under regulatory accounting practices. The Company's and the Bank's capital amounts and classification are also subject to qualitative judgments by the regulators about components, risk-weightings, and other factors.
Quantitative measures established by regulation to help ensure capital adequacy require the Company and the Bank to maintain minimum amounts and ratios (set forth in the table below).
In July 2013, the Federal Reserve Board and the other U.S. federal banking agencies adopted final rules making significant changes to the U.S. regulatory capital framework for U.S. banking organizations and to conform this framework to the Basel Committee's current international regulatory capital accord (Basel III). These rules replaced the federal banking agencies' general risk-based capital rules, advanced approaches rule, market-risk rule, and leverage rules, in accordance with certain transition provisions. The Bank became subject to the new rules on January 1, 2015. The new rules implement higher minimum capital requirements, include a new common equity Tier 1 capital requirement, and establish criteria that instruments must meet in order to be considered common equity Tier 1 capital, additional Tier 1 capital, or Tier 2 capital. When fully phased in, the final rules will provide for increased minimum capital ratios as follows: (a) a common equity Tier 1 capital ratio of 4.5%; (b) a Tier 1 capital ratio of 6% (which is an increase from 4.0%); (c) a total capital ratio of 8%; and (d) a Tier 1 leverage ratio to average consolidated assets of 4%. Under the new rules, in order to avoid certain limitations on capital distributions, including dividend payments and certain discretionary bonus payments to executive officers, a banking organization must hold a capital conservation buffer composed of common equity Tier 1 capital above its minimum risk based capital requirements (equal to 2.5% of total risk-weighted assets). The phase-in of the capital conservation buffer began on January 1, 2016 and will be completed by January 1, 2019. The new rules also provide for various adjustments and deductions to the definitions of regulatory capital that was phased in through December 31, 2017.
Management believes, as of December 31, 2017, that the Bank met all capital adequacy requirements to which it is subject. As of December 31, 2017, the most recent notification from the Federal Deposit Insurance Corporation ("FDIC") categorized the Bank as "well capitalized" under the regulatory framework for prompt corrective action. To be categorized as well capitalized the Bank must meet the minimum ratios as set forth below. As of the date hereof, there have been no conditions or events since that notification that management believes have changed the institution's category.
The Company and the Bank had Tier I Leverage, Common Equity Tier 1, Tier I Risk-Based and Total Risk-Based capital above the "well capitalized" levels at December 31, 2017 and 2016, respectively, as set forth in the following tables (calculated in accordance with the Basel III capital rules):
| The Company | ||||||||||||||||||||
|
|
2017
|
2016
|
Adequately Capitalized
|
|||||||||||||||||
|
|
Capital
|
Ratio
|
Capital
|
Ratio
|
Ratio
|
|||||||||||||||
|
Tier 1 Leverage Capital (to Average Assets)
|
$
|
104,441
|
8.6
|
%
|
$
|
94,648
|
8.2
|
%
|
4.0
|
%
|
||||||||||
|
Common Equity Tier 1 Capital (to Risk-Weighted Assets)
|
104,441
|
12.3
|
%
|
94,648
|
12.1
|
%
|
4.5
|
%
|
||||||||||||
|
Tier 1 Capital (to Risk-Weighted Assets)
|
104,441
|
12.3
|
%
|
94,648
|
12.1
|
%
|
6.0
|
%
|
||||||||||||
|
Total Risk-Based Capital (to Risk-Weighted Assets)
|
115,082
|
13.5
|
%
|
104,486
|
13.3
|
%
|
8.0
|
%
|
||||||||||||
|
The Bank
|
||||||||||||||||||||||||
|
|
2017
|
2016
|
Adequately Capitalized
|
Well Capitalized
|
||||||||||||||||||||
|
|
Capital
|
Ratio
|
Capital
|
Ratio
|
Ratio
|
Ratio
|
||||||||||||||||||
|
Tier 1 Leverage Capital (to Average Assets)
|
$
|
101,631
|
8.4
|
%
|
$
|
92,153
|
8.0
|
%
|
4.0
|
%
|
5.0
|
%
|
||||||||||||
|
Common Equity Tier 1 Capital (to Risk-Weighted Assets)
|
101,631
|
12.0
|
%
|
92,153
|
11.7
|
%
|
4.5
|
%
|
6.5
|
%
|
||||||||||||||
|
Tier 1 Capital (to Risk-Weighted Assets)
|
101,631
|
12.0
|
%
|
92,153
|
11.7
|
%
|
6.0
|
%
|
8.0
|
%
|
||||||||||||||
|
Total Risk-Based Capital (to Risk-Weighted Assets)
|
112,272
|
13.2
|
%
|
101,991
|
13.0
|
%
|
8.0
|
%
|
10.0
|
%
|
||||||||||||||
Cash dividends declared by the Bank are restricted under California State banking laws to the lesser of the Bank's retained earnings or the Bank's net income for the latest three fiscal years, less dividends previously declared during that period.
87
(12) Fair Value Measurement
The Company utilizes fair value measurements to record fair value adjustments to certain assets and liabilities and to determine fair value disclosures. Securities available-for-sale and trading securities are recorded at fair value on a recurring basis. Additionally, from time to time, the Company may be required to record at fair value other assets on a non-recurring basis, such as loans held-for-sale, loans held-for-investment and certain other assets. These non-recurring fair value adjustments typically involve application of lower of cost or market accounting or write-downs of individual assets. Transfers between levels of the fair value hierarchy are recognized on the actual date of the event or circumstances that caused the transfer, which generally corresponds with the Company's quarterly valuation process.
Assets Recorded at Fair Value on a Recurring Basis
The tables below present the recorded amount of assets and liabilities measured at fair value on a recurring basis as of December 31, 2017 and 2016.
|
December 31, 2017
|
Total
|
Quoted Prices in Active Markets for Identical Assets (Level 1)
|
Significant Other Observable Inputs
(Level 2)
|
Significant Unobservable Inputs
(Level 3)
|
||||||||||||
|
U.S. Treasury securities
|
$
|
18,464
|
$
|
18,464
|
$
|
—
|
$
|
—
|
||||||||
|
Securities of U.S. government agencies and corporations
|
21,109
|
—
|
21,109
|
—
|
||||||||||||
|
Obligations of states and political subdivisions
|
23,208
|
—
|
23,208
|
—
|
||||||||||||
|
Collateralized mortgage obligations
|
66,083
|
—
|
66,083
|
—
|
||||||||||||
|
Mortgage-backed securities
|
151,877
|
—
|
151,877
|
—
|
||||||||||||
|
|
||||||||||||||||
|
Total investments at fair value
|
$
|
280,741
|
$
|
18,464
|
$
|
262,277
|
$
|
—
|
||||||||
|
December 31, 2016
|
Total
|
Quoted Prices in Active Markets for Identical Assets (Level 1)
|
Significant Other Observable Inputs
(Level 2)
|
Significant Unobservable Inputs
(Level 3)
|
||||||||||||
|
U.S. Treasury securities
|
$
|
28,652
|
$
|
28,652
|
$
|
—
|
$
|
—
|
||||||||
|
Securities of U.S. government agencies and corporations
|
24,197
|
—
|
24,197
|
—
|
||||||||||||
|
Obligations of states and political subdivisions
|
30,888
|
—
|
30,888
|
—
|
||||||||||||
|
Collateralized mortgage obligations
|
49,938
|
—
|
49,938
|
—
|
||||||||||||
|
Mortgage-backed securities
|
143,404
|
—
|
143,404
|
—
|
||||||||||||
|
|
||||||||||||||||
|
Total investments at fair value
|
$
|
277,079
|
$
|
28,652
|
$
|
248,427
|
$
|
—
|
||||||||
There were no transfers of assets measured at fair value on a recurring basis between level 1 and level 2 of the fair value hierarchy.
88
Assets Recorded at Fair Value on a Non-recurring Basis
Assets measured at fair value on a non-recurring basis are included in the table below by level within the fair value hierarchy as of December 31, 2017 and 2016.
|
December 31, 2017
|
Total
|
Level 1
|
Level 2
|
Level 3
|
||||||||||||
|
Impaired loans
|
$
|
1,468
|
$
|
—
|
$
|
—
|
$
|
1,468
|
||||||||
|
|
||||||||||||||||
|
Total assets at fair value
|
$
|
1,468
|
$
|
—
|
$
|
—
|
$
|
1,468
|
||||||||
|
December 31, 2016
|
Total
|
Level 1
|
Level 2
|
Level 3
|
||||||||||||
|
Impaired loans
|
$
|
4,128
|
$
|
—
|
$
|
—
|
$
|
4,128
|
||||||||
|
Loan servicing rights
|
1,794
|
—
|
—
|
1,794
|
||||||||||||
|
|
||||||||||||||||
|
Total assets at fair value
|
$
|
5,922
|
$
|
—
|
$
|
—
|
$
|
5,922
|
||||||||
There were no liabilities measured at fair value on a recurring or non-recurring basis at December 31, 2017 and 2016.
Key methods and assumptions used in measuring the fair value of impaired loans and loan servicing rights as of December 31, 2017 and 2016 were as follows:
|
|
Method
|
Assumption Inputs
|
|
Impaired loans
|
Collateral, market, income, enterprise, liquidation and discounted cash flows
|
External appraised values, management assumptions regarding market trends or other relevant factors; selling costs ranging 6% to 7%.
|
|
Loan servicing rights
|
Discounted cash flows
|
Present value of expected future cash flows was estimated using a discount rate factor of 10.02% as of December 31, 2016. A constant prepayment rate of 12.67% as of December 31, 2016 was utilized.
|
The following section describes the valuation methodologies used for assets recorded at fair value.
Investment Securities Available-for-Sale
Investment securities available-for-sale are recorded at fair value on a recurring basis. Fair value measurement is based upon quoted market prices, if available. If quoted market prices are not available, fair values are measured using independent pricing models or other model-based valuation techniques such as the present value of future cash flows, adjusted for the security's credit rating, prepayment assumptions, and other factors such as credit loss assumptions. Level 1 securities include those traded on an active exchange, such as the New York Stock Exchange, U.S. Treasury securities that are traded by dealers or brokers in active over-the-counter markets and money market funds. Level 2 securities include mortgage-backed securities issued by government sponsored entities, municipal bonds and corporate debt securities. Securities classified as Level 3 include asset-backed securities in less liquid markets where valuations include significant unobservable assumptions.
Loans Held-for-Sale
Loans held-for-sale are carried at the lower of cost or fair value. The fair value of loans held-for-sale is based on what secondary markets are currently offering for portfolios with similar characteristics. As such, the Company classifies loans subjected to non-recurring fair value adjustments as Level 2. At December 31, 2017 and 2016, there were no loans held-for-sale that required a write-down.
Impaired Loans
The Company does not record loans at fair value on a recurring basis. However, from time to time, a loan is considered impaired and an allowance for loan losses is established. Loans for which it is probable that payment of interest and principal will not be made in accordance with the contractual terms of the loan agreement are considered impaired. Once a loan is identified as individually impaired, the Company measures impairment. The fair value of impaired loans is estimated using one of several methods, including collateral value, market value of similar debt, enterprise value, liquidation value and discounted cash flows. Inputs include external appraised values, management assumptions regarding market trends or other relevant factors, selling and commission costs generally ranging from 6% to 7%, and amount and timing of cash flows based upon current discount rates. Those impaired loans not requiring an allowance represent loans for which the fair value of the expected repayments or collateral exceed the recorded investments in such loans.
89
At December 31, 2017, certain impaired loans were considered collateral dependent and were evaluated based on the fair value of the underlying collateral securing the loan. Impaired loans where an allowance is established based on the fair value of collateral require classification in the fair value hierarchy. When a loan is evaluated based on the fair value of the underlying collateral securing the loan, the Company records the impaired loan as non-recurring Level 3.
Other Real Estate Owned
Other real estate assets ("OREO") acquired through, or in lieu of, foreclosure are held-for-sale and are initially recorded at the lower of cost or fair value, less selling costs. Any write-downs to fair value at the time of transfer to OREO are charged to the allowance for loan losses. Appraisals or evaluations are then done periodically thereafter charging any additional write-downs or valuation allowances to the appropriate expense accounts. Values are derived from appraisals of underlying collateral and discounted cash flow analysis. OREO is classified within Level 3 of the hierarchy. At December 31, 2017 and 2016, there were no OREO that required a write-down.
Loan Servicing Rights
Loan servicing rights are subject to impairment testing. The Company utilizes a third party service provider to calculate the fair value of the Company's loan servicing rights. Loan servicing rights are measured at fair value as of the date of sale. The Company uses quoted market prices when available. Subsequent fair value measurements are determined using a discounted cash flow model. In order to determine the fair value of the loan servicing rights, the present value of expected future cash flows is estimated. Assumptions used include market discount rates, anticipated prepayment speeds, delinquency and foreclosure rates, and ancillary fee income.
The model used to calculate the fair value of the Company's loan servicing rights is periodically validated by an independent external model validation group. The model assumptions and the loan servicing rights fair value estimates are also compared to observable trades of similar portfolios as well as to loan servicing rights broker valuations and industry surveys, as available. If the valuation model reflects a value less than the carrying value, loan servicing rights are adjusted to fair value through a valuation allowance as determined by the model. As such, the Company classifies loan servicing rights subjected to non-recurring fair value adjustments as Level 3.
Disclosures about Fair Value of Financial Instruments
The estimated fair values of the Company's financial instruments for the years ended December 31 were as follows:
|
|
2017
|
2016
|
||||||||||||||||||
|
|
Level
|
Carrying amount
|
Fair value
|
Carrying amount
|
Fair value
|
|||||||||||||||
|
Financial assets:
|
||||||||||||||||||||
|
Cash and cash equivalents
|
1
|
$
|
152,892
|
$
|
152,892
|
$
|
159,643
|
$
|
159,643
|
|||||||||||
|
Certificates of deposit
|
2
|
1,984
|
1,983
|
16,213
|
16,230
|
|||||||||||||||
|
Other equity securities
|
3
|
5,567
|
5,567
|
4,409
|
4,409
|
|||||||||||||||
|
Loans receivable:
|
||||||||||||||||||||
|
Net loans
|
3
|
739,112
|
736,292
|
669,770
|
669,437
|
|||||||||||||||
|
Loans held-for-sale
|
2
|
1,040
|
1,060
|
3,326
|
3,363
|
|||||||||||||||
|
Interest receivable
|
2
|
4,117
|
4,117
|
3,996
|
3,996
|
|||||||||||||||
|
Mortgage servicing rights
|
3
|
1,712
|
1,876
|
1,794
|
1,794
|
|||||||||||||||
|
Financial liabilities:
|
||||||||||||||||||||
|
Deposits
|
3
|
1,104,740
|
993,425
|
1,063,696
|
1,001,460
|
|||||||||||||||
|
Interest payable
|
2
|
72
|
72
|
78
|
78
|
|||||||||||||||
The following section describes the valuation methodologies used by the Company for estimating fair value of financial instruments not recorded at fair value on the Balance Sheet.
Cash and Cash Equivalents
The carrying amounts reported in the consolidated balance sheets for cash and cash equivalent short-term instruments are a reasonable estimate of fair value. The carrying amount is a reasonable estimate of fair value because of the relatively short term between the origination of the instrument and its expected realization. Therefore, the Company believes the measurement of fair value of cash and cash equivalents is derived from Level 1 inputs.
90
Certificates of Deposit
The Company measures the fair value of Certificates of deposit using Level 2 inputs. The fair values of Certificates of deposit were derived by discounting their future expected cash flows back to their present values based upon a constant maturity curve. The constant maturity curve is based on similar instruments, taking into account factors such as instrument type, coupon type, currency, issuer, sector, country of issuer, credit rating, and prevailing market conditions. The Company believes these inputs fall under Level 2 of the fair value hierarchy.
Other Equity Securities
The carrying amounts reported in the consolidated balance sheets approximate fair value as the shares can only be redeemed by the issuing institution. The Company believes the measurement of the fair value of other equity securities is derived from Level 3 inputs.
Loans Receivable
For variable-rate loans that reprice frequently and with no significant change in credit risk, fair values are based on carrying values. The fair values for other loans (e.g., commercial real estate and rental property mortgage loans, commercial and industrial loans, and agricultural loans) are estimated using discounted cash flow analyses, using interest rates currently being offered for loans with similar terms to borrowers of similar credit quality. The allowance for loan losses is considered to be a reasonable estimate of loan discount due to credit risks. Given that the estimation of expected credit losses involves management estimates for assumptions that are not directly observable in a market, the Company believes the fair value of loans receivable is derived from Level 3 inputs.
Interest Receivable and Payable
The carrying amount of interest receivable and payable approximates its fair value. The Company believes the measurement of the fair value of interest receivable and payable is derived from Level 2 inputs.
Deposit Liabilities
The Company measures fair value of deposits using both observable and unobservable inputs. The fair value of deposits was derived by discounting their expected future cash flows back to their present values based on the FHLB yield curve, and their expected decay rates for non-maturing deposits. The Company is able to obtain FHLB yield curve rates as of the measurement date, and believes these inputs fall under Level 2 of the fair value hierarchy. Decay rates were developed through internal analysis and are supported by recent years of the Bank's transaction history. The inputs used by the Company to derive the decay rate assumptions are unobservable inputs, and therefore fall under Level 3 of the fair value hierarchy.
Limitations
Fair value estimates are made at a specific point in time, based on relevant market information and information about the financial instrument. These estimates do not reflect any premium or discount that could result from offering for sale at one time the Company's entire holdings of a particular financial instrument. Because no market exists for a significant portion of the Company's financial instruments, fair value estimates are based on judgments regarding future expected loss experience, current economic conditions, risk characteristics of various financial instruments, and other factors. These estimates are subjective in nature and involve uncertainties and matters of significant judgment and therefore cannot be determined with precision. Changes in assumptions could significantly affect the estimates.
Fair value estimates are based on existing on- and off-balance sheet financial instruments without attempting to estimate the value of anticipated future business and the value of assets and liabilities that are not considered financial instruments. Other significant assets and liabilities that are not considered financial assets or liabilities include deferred tax liabilities and premises and equipment. In addition, the tax ramifications related to the realization of the unrealized gains and losses can have a significant effect on fair value estimates and have not been considered in many of the estimates.
91
| (13) |
Outstanding Shares and Earnings Per Share
|
All income per share amounts have been adjusted to give retroactive effect to stock dividends and stock splits, including the 4% stock dividend declared on January 25, 2018, payable March 29, 2018, to shareholders of record as of February 28, 2018.
Earnings Per Share
Basic and diluted earnings per share for the years ended December 31, were computed as follows:
|
|
(in thousands, except per share amounts)
|
|||||||||||
|
|
2017
|
2016
|
2015
|
|||||||||
|
Basic earnings per share:
|
||||||||||||
|
Net income
|
$
|
8,748
|
$
|
8,051
|
$
|
6,921
|
||||||
|
Preferred stock dividend
|
—
|
—
|
(105
|
)
|
||||||||
|
Net income available to common shareholders
|
$
|
8,748
|
$
|
8,051
|
$
|
6,816
|
||||||
|
|
||||||||||||
|
Weighted average common shares outstanding
|
11,505,108
|
11,475,942
|
11,444,066
|
|||||||||
|
|
||||||||||||
|
Basic earnings per share
|
$
|
0.76
|
$
|
0.70
|
$
|
0.60
|
||||||
|
|
||||||||||||
|
Diluted earnings per share:
|
||||||||||||
|
Net income
|
$
|
8,748
|
$
|
8,051
|
$
|
6,921
|
||||||
|
Preferred stock dividend
|
—
|
—
|
(105
|
)
|
||||||||
|
Net income available to common shareholders
|
$
|
8,748
|
$
|
8,051
|
$
|
6,816
|
||||||
|
Weighted average common shares outstanding
|
11,505,108
|
11,475,942
|
11,444,066
|
|||||||||
|
|
||||||||||||
|
Effect of dilutive shares
|
146,223
|
73,861
|
63,393
|
|||||||||
|
|
||||||||||||
|
Adjusted weighted average common shares outstanding
|
11,651,331
|
11,549,803
|
11,507,459
|
|||||||||
|
|
||||||||||||
|
Diluted earnings per share
|
$
|
0.75
|
$
|
0.70
|
$
|
0.59
|
||||||
Options not included in the computation of diluted earnings per share because they would have had an anti-dilutive effect amounted to 67,023 shares, 160,296 shares, and 179,906 shares for the years ended December 31, 2017, 2016, and 2015, respectively.
92
| (14) |
Stock Compensation Plans
|
The Company has one stock option plan. Under the 2006 Stock Incentive Plan, the Company may grant option grants, stock appreciation rights, restricted stock, or stock units to an employee for an amount up to 25,000 total shares in any calendar year. With respect to awards granted to non-employee directors under the 2006 Stock Incentive Plan, no outside director can receive option grants, stock appreciation rights, restricted stock, or stock units in excess of 3,000 total shares in any calendar year. There were 982,926 shares authorized under the 2006 Stock Incentive Plan. The 2006 Stock Incentive Plan terminated on January 28, 2016.
On May 19, 2015, the Company's shareholders approved the 2016 Stock Incentive Plan, which became effective on January 28, 2016 concurrent with the termination of the 2006 Stock Incentive Plan. There are 700,528 shares authorized under the 2016 Stock Incentive Plan. The total number of shares authorized has been adjusted to give retroactive effect to stock dividends and stock splits, including the 4% stock dividend declared on January 25, 2018, payable March 29, 2018 to shareholders of record as of February 28, 2018. The 2016 Stock Incentive Plan will terminate on March 15, 2026.
The Compensation Committee of the Board of Directors is authorized to prescribe the terms and conditions of each option, including exercise price, vestings, or duration of the option. Generally, option grants vest at a rate of 25% per year after the first anniversary of the date of grant and restricted stock awards vest at a rate of 100% after four years. Options expire 10 years after the date of grant. Options are granted with an exercise price of the fair value of the related common stock on the date of grant.
Stock option activity for the Company's Stock Incentive Plan during the year ended December 31, 2017 is as follows:
|
|
Stock Options
|
|||||||
|
|
Number of shares
|
Weighted average exercise price
|
||||||
|
Balance at December 31, 2016
|
236,651
|
$
|
7.81
|
|||||
|
Granted
|
62,941
|
11.10
|
||||||
|
Exercised
|
—
|
—
|
||||||
|
Cancelled
|
—
|
—
|
||||||
|
Expired
|
(38,974
|
)
|
15.68
|
|||||
|
|
||||||||
|
Balance at December 31, 2017
|
260,618
|
$
|
7.42
|
|||||
All number of shares and weighted average exercise price amounts have been adjusted to give retroactive effect to stock dividends and stock splits, including the 4% stock dividend declared on January 25, 2018, payable March 29, 2018 to shareholders of record as of February 28, 2018.
The following table presents information on stock options for the year ended December 31, 2017:
|
|
Number of Shares
|
Weighted Average Exercise Price
|
Aggregate Intrinsic Value
|
Weighted Average Remaining Contractual Term
|
||||||||||||
|
Stock options outstanding and expected to vest:
|
260,618
|
$
|
7.42
|
$
|
1,398
|
6.73
|
||||||||||
|
|
||||||||||||||||
|
Stock options vested and currently exercisable:
|
123,480
|
$
|
5.80
|
$
|
863
|
4.96
|
||||||||||
The weighted average grant date fair value per share of options granted during the years ended December 31 was $2.67 in 2017, $1.97 in 2016, and $2.37 in 2015. All weighted average grant date fair value per share amounts have been adjusted to give retroactive effect to stock dividends and stock splits, including the 4% stock dividend declared on January 25, 2018, payable March 29, 2018 to shareholders of record as of February 28, 2018.
The intrinsic value of options exercised during the years ended December 31 was $0 in 2017, $37 in 2016, and $65 in 2015. The fair value of awards vested during December 31 was $85 in 2017, $67 in 2016, and $48 in 2015.
At December 31, 2017, the range of exercise prices for all outstanding options ranged from $3.43 to $11.90. The range of exercise prices have been adjusted to give retroactive effect to stock dividends and stock splits, including the 4% stock dividend declared on January 25, 2018, payable March 29, 2018 to shareholders of record as of February 28, 2018.
93
As of December 31, 2017, there was $227 of total unrecognized compensation related to non-vested stock options. This cost is expected to be recognized over a weighted average period of approximately 2.6 years.
For the years ended December 31, 2017, 2016, and 2015 there was $111, $85, and $63, respectively, of recognized compensation related to stock options.
The Company determines fair value at grant date using the Black-Scholes-Merton pricing model that takes into account the stock price at the grant date, the exercise price, the risk-free interest rate, the volatility of the underlying stock and the expected life of the option.
The weighted average assumptions used in the pricing model are noted in the following table. The expected term of options granted is derived from historical data on employee exercise and post-vesting employment termination behavior. The risk-free rate for periods within the contractual life of the option is based on the U.S. Treasury yield curve in effect at the time of the grant. Expected volatility is based on both the implied volatilities from the traded option on the Company's stock and historical volatility on the Company's stock.
The Company expenses the fair value of the option on a straight line basis over the vesting period. The Company estimates forfeitures and only recognizes expense for those shares that actually vest.
The following table shows our weighted average assumptions used in valuing stock options granted for the years ended December 31:
|
|
2017
|
2016
|
2015
|
|||||||||
|
Risk-Free Interest Rate
|
1.89
|
%
|
1.23
|
%
|
1.61
|
%
|
||||||
|
|
||||||||||||
|
Expected Dividend Yield
|
0.00
|
%
|
0.00
|
%
|
0.00
|
%
|
||||||
|
|
||||||||||||
|
Expected Life in Years
|
5.00
|
5.00
|
5.00
|
|||||||||
|
|
||||||||||||
|
Expected Price Volatility
|
22.88
|
%
|
28.41
|
%
|
37.38
|
%
|
||||||
In addition to stock options, the Company also grants restricted stock awards to directors, certain officers and employees. The restricted shares awarded become fully vested after one to four years of continued employment or service from the date of grant. Restricted shares are forfeited if officers and employees terminate prior to the lapsing of restrictions.
The following table presents information about non-vested restricted stock awards outstanding for the year ended December 31, 2017:
|
|
Restricted Stock Awards
|
|||||||
|
|
Number of shares
|
Weighted average grant date fair value
|
||||||
|
Balance at December 31, 2016
|
103,151
|
$
|
6.44
|
|||||
|
Granted
|
27,499
|
11.06
|
||||||
|
Vested
|
(17,758
|
)
|
4.88
|
|||||
|
Cancelled/Forfeited
|
(1,522
|
)
|
6.65
|
|||||
|
|
||||||||
|
Balance at December 31, 2017
|
111,370
|
$
|
7.83
|
|||||
All number of shares and weighted average grant date fair value amounts have been adjusted to give retroactive effect to stock dividends and stock splits, including the 4% stock dividend declared on January 25, 2018, payable March 29, 2018 to shareholders of record as of February 28, 2018.
The aggregate intrinsic value of restricted stock awards vested in calendar year 2017, 2016, and 2015 was $200, $141, and $139, respectively.
The weighted average fair value per share of restricted stock awards granted during the years ended December 31 was $11.06 in 2017, $7.23 in 2016, and $6.75 in 2015. All weighted average grant date fair value per share amounts have been adjusted to give retroactive effect to stock dividends and stock splits, including the 4% stock dividend declared on January 25, 2018, payable March 29, 2018 to shareholders of record as of February 28, 2018.
94
As of December 31, 2017, there was $415 of total unrecognized compensation related to non-vested restricted stock awards. This cost is expected to be recognized over a weighted average period of approximately 2.5 years.
For the year ended December 31, 2017, 2016, and 2015, there was $211, $177, and $142, respectively, of recognized compensation related to restricted stock awards.
Employee Stock Purchase Plan
The Company has an Employee Stock Purchase Plan ("ESPP"). Under the 2006 Amended ESPP, the Company is authorized to issue to an eligible employee shares of common stock. There are 322,385 shares authorized under the 2006 Amended ESPP. The 2006 Amended ESPP was terminated on November 19, 2015. On May 19, 2015, the Company's shareholders approved the 2016 ESPP, which became effective on November 19, 2015. There are 281,216 shares authorized under the 2016 ESPP, which include authorized but unissued shares under the 2006 Amended ESPP. The total number of shares authorized has been adjusted to give retroactive effect to stock dividends and stock splits, including the 4% stock dividend declared on January 25, 2018, payable March 29, 2018 to shareholders of record as of February 28, 2018. The 2016 ESPP will expire on March 16, 2026.
The ESPP is implemented by participation periods of not more than twenty-seven months each. The Board of Directors determines the commencement date and duration of each participation period. An eligible employee is one who has been continually employed for at least ninety (90) days prior to commencement of a participation period. Under the terms of the Plan, employees can choose to have up to 10 percent of their compensation withheld to purchase the Company's common stock each participation period. The purchase price of the stock is 85 percent of the lower of the fair value on the last trading day before the Date of Participation or the fair value on the last trading day during the participation period. Approximately 30 percent of eligible employees are participating in the Plan in the current participation period, which began November 24, 2017 and will end November 23, 2018.
Under the Plan, at the annual stock purchase date of November 24, 2017, there were $78 in contributions, and 10,584 shares were purchased at an average price of $7.36. The total number of shares purchased and average price have been adjusted to give retroactive effect to the 4% stock dividend declared on January 25, 2018, payable March 29, 2018 to shareholders of record as of February 28, 2018. For the year ended December 31, 2017, 2016, and 2015, there was $56, $24, and $25, respectively, of recognized compensation related to ESPP issuances. Compensation cost is reported in salaries and employee benefits expense in the consolidated statements of income.
(15) Profit Sharing Plan
The Bank maintains a profit sharing plan for the benefit of its employees. Employees who have completed 12 months and 1,000 hours of service are eligible. Under the terms of this plan, a portion of the Bank's profits, as determined by the Board of Directors, will be set aside and maintained in a trust fund for the benefit of qualified employees. Contributions to the plan, included in salaries and employee benefits in the consolidated statements of income, were $2,050, $1,525 and $1,259 in 2017, 2016, and 2015, respectively.
95
| (16) |
Supplemental Compensation Plans
|
EXECUTIVE SALARY CONTINUATION PLAN
Pension Benefit Plans
The Company and the Bank maintain an unfunded non-contributory defined benefit pension plan ("Salary Continuation Plan") and related split dollar plan for a select group of highly compensated employees. The plan provides defined annual benefit levels between $50 and $125 depending on responsibilities at the Bank. The retirement benefits are paid for 10 years following retirement at age 65. Reduced retirement benefits are available after age 55 and 10 years of service.
Eligibility to participate in the Salary Continuation Plan is limited to a select group of management or highly compensated employees of the Bank that are designated by the Board.
Additionally, the Company and the Bank adopted a supplemental executive retirement plan ("SERP") in 2006. The SERP is intended to integrate the various forms of retirement payments offered to executives. There are currently three participants in the SERP.
The SERP benefit is calculated using 3-year average salary plus 7-year average bonus (average compensation). For each year of service, the benefit formula credits 2% - 2.5% of average compensation up to a cumulative maximum of 50%. Therefore, for an executive serving 20 - 25 years, the target benefit is 50% of average compensation.
The target benefit is reduced for other forms of retirement income provided by the Bank. Reductions are made for 50% of the social security benefit expected at age 65 and for the accumulated value of contributions the Bank makes to the executive's profit sharing plan. For purposes of this reduction, contributions to the profit sharing plan are accumulated each year at a 3-year average of the yields on 10-year Treasury securities. Retirement benefits are paid monthly for 120 months, plus 6 months for each full year of service over 10 years, up to a maximum of 180 months.
Reduced benefits are payable for retirement prior to age 65. Should retirement occur prior to age 65, the benefit determined by the formula described above is reduced 5% for each year payments commence prior to age 65. Therefore, the new SERP benefit is reduced 50% for retirement at age 55. No benefit is payable for voluntary terminations prior to age 55.
The Bank uses a December 31 measurement date for these plans.
96
|
|
For the Year Ended December 31,
|
|||||||||||
|
|
2017
|
2016
|
2015
|
|||||||||
|
Change in benefit obligation
|
||||||||||||
|
Benefit obligation at beginning of year
|
$
|
4,523
|
$
|
4,261
|
$
|
4,076
|
||||||
|
Service cost
|
99
|
104
|
140
|
|||||||||
|
Interest cost
|
171
|
161
|
143
|
|||||||||
|
Plan loss (gain)
|
948
|
177
|
127
|
|||||||||
|
Benefits Paid
|
(322
|
)
|
(180
|
)
|
(225
|
)
|
||||||
|
Benefit obligation at end of year
|
$
|
5,419
|
$
|
4,523
|
$
|
4,261
|
||||||
|
|
||||||||||||
|
Change in plan assets
|
||||||||||||
|
Employer Contribution
|
322
|
180
|
225
|
|||||||||
|
Benefits Paid
|
(322
|
)
|
(180
|
)
|
(225
|
)
|
||||||
|
Fair value of plan assets at end of year
|
$
|
—
|
$
|
—
|
$
|
—
|
||||||
|
|
||||||||||||
|
Reconciliation of funded status
|
||||||||||||
|
Funded status
|
$
|
(5,419
|
)
|
$
|
(4,523
|
)
|
$
|
(4,261
|
)
|
|||
|
Unrecognized net plan loss
|
1,929
|
1,065
|
937
|
|||||||||
|
Unrecognized prior service cost
|
40
|
77
|
165
|
|||||||||
|
Net amount recognized
|
$
|
(3,450
|
)
|
$
|
(3,381
|
)
|
$
|
(3,159
|
)
|
|||
|
|
||||||||||||
|
Amounts recognized in the consolidated balance sheets consist of:
|
||||||||||||
|
Accrued benefit liability
|
$
|
(5,419
|
)
|
$
|
(4,523
|
)
|
$
|
(4,261
|
)
|
|||
|
Accumulated other comprehensive loss
|
1,969
|
1,142
|
1,102
|
|||||||||
|
Net amount recognized
|
$
|
(3,450
|
)
|
$
|
(3,381
|
)
|
$
|
(3,159
|
)
|
|||
97
|
|
For the Year Ended December 31,
|
|||||||||||
|
|
2017
|
2016
|
2015
|
|||||||||
|
Components of net periodic benefit cost
|
||||||||||||
|
Service cost
|
$
|
99
|
$
|
104
|
$
|
140
|
||||||
|
Interest cost
|
171
|
161
|
143
|
|||||||||
|
Amortization of prior service cost
|
61
|
88
|
88
|
|||||||||
|
Recognized actuarial loss
|
58
|
50
|
67
|
|||||||||
|
Net periodic benefit cost
|
389
|
403
|
438
|
|||||||||
|
Additional amounts recognized
|
—
|
—
|
13
|
|||||||||
|
Total benefit cost
|
$
|
389
|
$
|
403
|
$
|
451
|
||||||
|
|
||||||||||||
|
Additional Information
|
||||||||||||
|
Minimum benefit obligation at year end
|
$
|
5,419
|
$
|
4,523
|
$
|
4,261
|
||||||
|
Increase (decrease) in minimum liability included in other comprehensive income (loss)
|
$
|
827
|
$
|
40
|
$
|
(27
|
)
|
|||||
|
Assumptions used to determine benefit obligations at December 31
|
2017
|
2016
|
2015
|
|||||||||
|
Discount rate used to determine net periodic benefit cost for years ended December 31
|
3.80
|
%
|
3.80
|
%
|
3.50
|
%
|
||||||
|
|
||||||||||||
|
Discount rate used to determine benefit obligations at December 31
|
3.40
|
%
|
3.80
|
%
|
3.80
|
%
|
||||||
|
|
||||||||||||
|
Future salary increases
|
5.20
|
%
|
4.00
|
%
|
4.00
|
%
|
||||||
Plan Assets
The Bank informally funds the liabilities of the Salary Continuation Plan through life insurance purchased on the lives of plan participants. This informal funding does not meet the definition of "plan assets" under pension accounting standards. Therefore, assets held for this purpose are not disclosed as part of the Salary Continuation Plan.
Cash Flows
Contributions and Estimated Benefit Payments
For unfunded plans, contributions to the Salary Continuation Plan are the benefit payments made to participants. The Bank paid $322 in benefit payments during fiscal 2017. The following benefit payments, which reflect expected future service, are expected to be paid in future fiscal years:
|
Year ending December 31,
|
Pension Benefits
|
|||
|
2018
|
$
|
272
|
||
|
2019
|
272
|
|||
|
2020
|
272
|
|||
|
2021
|
276
|
|||
|
2022
|
324
|
|||
|
2023-2027
|
1,634
|
|||
Disclosure of settlements and curtailments:
There were no events during fiscal 2017 that would constitute a curtailment or settlement.
98
DIRECTORS' RETIREMENT PLAN
Pension Benefit Plans
On July 19, 2001, the Company and the Bank approved an unfunded non-contributory defined benefit pension plan ("Directors' Retirement Plan") and related split dollar plan for the directors of the Bank. The plan provides a retirement benefit equal to $1 per year of service as a director, up to a maximum benefit amount of $15. The retirement benefit is payable for ten years following retirement at age 65. Reduced retirement benefits are available after age 55 and ten years of service.
The Bank uses a December 31 measurement date for the Directors' Retirement Plan.
|
|
For the Year Ended December 31,
|
|||||||||||
|
|
2017
|
2016
|
2015
|
|||||||||
|
Change in benefit obligation
|
||||||||||||
|
Benefit obligation at beginning of year
|
$
|
830
|
$
|
816
|
$
|
752
|
||||||
|
Service cost
|
11
|
11
|
14
|
|||||||||
|
Interest cost
|
27
|
27
|
26
|
|||||||||
|
Plan loss (gain)
|
18
|
6
|
40
|
|||||||||
|
Benefits paid
|
(30
|
)
|
(30
|
)
|
(16
|
)
|
||||||
|
Benefit obligation at end of year
|
$
|
856
|
$
|
830
|
$
|
816
|
||||||
|
|
||||||||||||
|
Change in plan assets
|
||||||||||||
|
Employer contribution
|
$
|
30
|
$
|
30
|
$
|
16
|
||||||
|
Benefits paid
|
(30
|
)
|
(30
|
)
|
(16
|
)
|
||||||
|
Fair value of plan assets at end of year
|
$
|
—
|
$
|
—
|
$
|
—
|
||||||
|
|
||||||||||||
|
Reconciliation of funded status
|
||||||||||||
|
Funded status
|
$
|
(856
|
)
|
$
|
(830
|
)
|
$
|
(816
|
)
|
|||
|
Unrecognized net plan gain
|
(4
|
)
|
(22
|
)
|
(27
|
)
|
||||||
|
Net amount recognized
|
$
|
(860
|
)
|
$
|
(852
|
)
|
$
|
(843
|
)
|
|||
|
|
||||||||||||
|
Amounts recognized in the statement of financial position consist of:
|
||||||||||||
|
Accrued benefit liability
|
$
|
(856
|
)
|
$
|
(830
|
)
|
$
|
(816
|
)
|
|||
|
Accumulated other comprehensive income
|
(4
|
)
|
(22
|
)
|
(27
|
)
|
||||||
|
Net amount recognized
|
$
|
(860
|
)
|
$
|
(852
|
)
|
$
|
(843
|
)
|
|||
99
|
|
For the Year Ended December 31,
|
|||||||||||
|
|
2017
|
2016
|
2015
|
|||||||||
|
Components of net periodic benefit cost
|
||||||||||||
|
Service cost
|
$
|
11
|
$
|
11
|
$
|
14
|
||||||
|
Interest cost
|
27
|
27
|
26
|
|||||||||
|
Recognized actuarial gain
|
—
|
—
|
—
|
|||||||||
|
Net periodic benefit cost
|
38
|
38
|
40
|
|||||||||
|
Additional amounts recognized
|
—
|
—
|
—
|
|||||||||
|
Total benefit cost
|
$
|
38
|
$
|
38
|
$
|
40
|
||||||
|
|
||||||||||||
|
Additional Information
|
||||||||||||
|
Minimum benefit obligation at year end
|
$
|
856
|
$
|
830
|
$
|
816
|
||||||
|
Increase in minimum liability included in other comprehensive income (loss)
|
$
|
18
|
$
|
5
|
$
|
40
|
||||||
|
Assumptions used to determine benefit obligations at December 31
|
2017
|
2016
|
2015
|
|||||||||
|
Discount rate used to determine net periodic benefit cost for years ended December 31
|
3.30
|
%
|
3.40
|
%
|
3.20
|
%
|
||||||
|
|
||||||||||||
|
Discount rate used to determine benefit obligations at December 31
|
3.00
|
%
|
3.30
|
%
|
3.40
|
%
|
||||||
Plan Assets
The Bank informally funds the liabilities of the Directors' Retirement Plan through life insurance purchased on the lives of plan participants. This informal funding does not meet the definition of "plan assets" under pension accounting standards. Therefore, assets held for this purpose are not disclosed as part of the Directors' Retirement Plan.
Cash Flows
Contributions and Estimated Benefit Payments
For unfunded plans, contributions to the Directors' Retirement Plan are the benefit payments made to participants. The Bank paid $30 in benefit payments during fiscal 2017. The following benefit payments, which reflect expected future service, are expected to be paid in future fiscal years:
|
Year ending December 31,
|
Pension Benefits
|
|||
|
2018
|
$
|
69
|
||
|
2019
|
60
|
|||
|
2020
|
60
|
|||
|
2021
|
75
|
|||
|
2022
|
76
|
|||
|
2023-2027
|
384
|
|||
Disclosure of settlements and curtailments:
There were no events during fiscal 2017 that would constitute a curtailment or settlement.
100
EXECUTIVE ELECTIVE DEFERRED COMPENSATION PLAN — 2001 EXECUTIVE DEFERRAL PLAN
On July 19, 2001, the Bank approved a revised Executive Elective Deferred Compensation Plan ("2001 Executive Deferral Plan") for certain officers to provide them the ability to make elective deferrals of compensation due to tax law limitations on benefit levels under qualified plans. Deferred amounts earn interest at an annual rate determined by the Bank's Board. The plan is a non-qualified plan funded with Bank owned life insurance policies taken on the lives of the participating officers. During the year ended December 31, 2001, the Bank purchased insurance making a single-premium payment aggregating $1,125, which is reported in other assets on the Consolidated Balance Sheets. The Bank is the beneficiary and owner of the policies. The cash surrender value of the related insurance policies as of December 31, 2017 and 2016 totaled $2,484 and $2,414, respectively. The increase in accrued liability for the 2001 Executive Deferral Plan during the years ended December 31, 2017 and 2016 totaled $14 and $13, respectively. The expenses for the 2001 Executive Deferral Plan for the years ended December 31, 2017, 2016, and 2015 totaled $14, $13, and $18, respectively.
DIRECTOR ELECTIVE DEFERRED FEE PLAN — 2001 DIRECTOR DEFERRAL PLAN
On July 19, 2001, the Bank approved a Director Elective Deferred Fee Plan ("2001 Director Deferral Plan") for directors to provide them the ability to make elective deferrals of director's fees. Deferred amounts earn interest at an annual rate determined by the Bank's Board. The plan is a non-qualified plan funded with Bank owned life insurance policies taken on the lives of the participating directors. The Bank is the beneficiary and owner of the policies. The cash surrender value of the related insurance policies as of December 31, 2017 and 2016 totaled $136 and $132, respectively. The increase in accrued liability for the 2001 Director Deferral Plan totaled $1 during each of the years ended December 31, 2017 and 2016. The expenses for the 2001 Director Deferral Plan totaled $1 for each of the years ended December 31, 2017, 2016, and 2015.
101
| (17) |
Income Taxes
|
The provision for income tax expense consisted of the following for the years ended December 31:
|
|
2017
|
2016
|
2015
|
|||||||||
|
Current:
|
||||||||||||
|
Federal
|
$
|
4,611
|
$
|
3,903
|
$
|
1,973
|
||||||
|
State
|
1,788
|
1,419
|
1,079
|
|||||||||
|
|
||||||||||||
|
|
6,399
|
5,322
|
3,052
|
|||||||||
|
Deferred:
|
||||||||||||
|
Federal
|
1,914
|
(354
|
)
|
681
|
||||||||
|
State
|
5
|
(83
|
)
|
7
|
||||||||
|
|
||||||||||||
|
|
1,919
|
(437
|
)
|
688
|
||||||||
|
|
||||||||||||
|
|
$
|
8,318
|
$
|
4,885
|
$
|
3,740
|
||||||
On December 22, 2017, H.R.1, commonly known as the Tax Cuts and Jobs Act (the "Act") was signed into law. Among other things, the Act reduces the Company's corporate federal tax rate from 34% to 21% effective January 1, 2018. As a result, the Company is required to re-measure, through income tax expense, our deferred tax assets and liabilities using the enacted rate at which management expects them to be recovered or settled. The re-measurement of the Company's net deferred tax asset resulted in additional income tax expense of approximately $1,680.
The Company early adopted ASU 2018-02, Income Statement – Reporting Comprehensive Income (Topic 220) as of and for the period ending December 31, 2017. As a result, the Company reclassified from retained earnings to accumulated other comprehensive income the stranded tax effects resulting from the newly enacted federal corporate tax rate of 21%. See Note (1)(r) for more information.
The tax effects of temporary differences that give rise to significant portions of the deferred tax assets and deferred tax liabilities at December 31, 2017 and 2016 consisted of:
|
|
2017
|
2016
|
||||||
|
Deferred tax assets:
|
||||||||
|
Allowance for loan losses
|
$
|
3,543
|
$
|
4,812
|
||||
|
Deferred compensation
|
125
|
190
|
||||||
|
Retirement compensation
|
1,273
|
1,741
|
||||||
|
Stock option compensation
|
67
|
81
|
||||||
|
Postretirement benefits
|
565
|
448
|
||||||
|
Current state franchise taxes
|
381
|
489
|
||||||
|
Non-accrual interest
|
41
|
85
|
||||||
|
Other
|
129
|
46
|
||||||
|
Sale-Leaseback
|
124
|
—
|
||||||
|
Investment securities unrealized loss
|
1,209
|
1,119
|
||||||
|
|
||||||||
|
Deferred tax assets
|
7,457
|
9,011
|
||||||
|
|
||||||||
|
Deferred tax liabilities:
|
||||||||
|
Fixed assets depreciation
|
1,461
|
1,660
|
||||||
|
FHLB dividends
|
187
|
260
|
||||||
|
Tax credit – loss on pass-through
|
176
|
261
|
||||||
|
Deferred loan costs
|
941
|
1,158
|
||||||
|
Mortgage servicing rights
|
129
|
—
|
||||||
|
Other
|
15
|
12
|
||||||
|
|
||||||||
|
Total deferred tax liabilities
|
2,909
|
3,351
|
||||||
|
|
||||||||
|
Net deferred tax assets (see Note 7)
|
$
|
4,548
|
$
|
5,660
|
||||
102
Based upon the level of historical taxable income and projections for future taxable income over the periods during which the deferred tax assets are deductible, management believed it is more-likely-than-not the Company will realize the benefits of these deductible differences.
At December 31, 2017, the Company had no state net operating loss carry forwards and no federal tax credit carry forwards.
A reconciliation of income taxes computed at the federal statutory rate of 34% and the provision for income taxes for the years ended December 31, 2017, 2016 and 2015 is as follows:
|
|
2017
|
2016
|
2015
|
|||||||||
|
Federal statutory income tax rate
|
34.0
|
%
|
34.0
|
%
|
34.0
|
%
|
||||||
|
Increase (decrease) in tax rate due to:
|
||||||||||||
|
State franchise tax, net of federal benefit
|
6.9
|
%
|
6.8
|
%
|
6.7
|
%
|
||||||
|
Reduction for tax exempt interest
|
(0.6
|
)%
|
(0.9
|
)%
|
(1.1
|
)%
|
||||||
|
Cash surrender value of life insurance
|
(0.9
|
)%
|
(1.2
|
)%
|
(1.5
|
)%
|
||||||
|
Tax rate change
|
9.8
|
%
|
0.0
|
%
|
0.0
|
%
|
||||||
|
Other tax credits
|
(1.1
|
)%
|
(1.1
|
)%
|
(1.5
|
)%
|
||||||
|
Other
|
0.6
|
%
|
0.1
|
%
|
(1.6
|
)%
|
||||||
|
|
||||||||||||
|
Effective income tax rate
|
48.7
|
%
|
37.7
|
%
|
35.0
|
%
|
||||||
Accounting for Uncertainty in Income Taxes
The Company had unrecognized tax benefits of $0 and $5 for the years ended December 31, 2017 and December 31, 2016, respectively. The Company recognized a change in unrecognized tax benefits during 2017 and 2016 of $5 and $7 due to the expiration of a statute of limitations and other gross decreases, respectively. The Company had no significant uncertain tax positions as of December 31, 2017. The Company does not anticipate any significant increase or decrease in unrecognized tax benefits during 2018. If recognized, the entire amount of the unrecognized tax benefits would affect the effective tax rate.
The Company classifies interest and penalties as a component of the provision for income taxes. At December 31, 2017, there were no unrecognized interest and penalties. The tax years ended December 31, 2016, 2015, and 2014 remain subject to examination by the Internal Revenue Service. The tax years ended December 31, 2016, 2015, 2014, and 2013 remain subject to examination by the California Franchise Tax Board. The deductibility of these tax positions will be determined through examination by the appropriate tax authorities or the expiration of the tax statute of limitations.
103
(18) Accumulated Other Comprehensive Income/(Loss)
The following table details activity in accumulated other comprehensive income (loss) for the year ended December 31, 2017.
|
|
Unrealized Gains (Losses) on Securities
|
Officers' retirement plan
|
Directors' retirement plan
|
Accumulated Other Comprehensive Income/(loss)
|
||||||||||||
|
Balance as of December 31, 2016
|
$
|
(1,678
|
)
|
$
|
(686
|
)
|
$
|
14
|
$
|
(2,350
|
)
|
|||||
|
Current period other comprehensive loss, net of tax
|
(846
|
)
|
(591
|
)
|
(11
|
)
|
(1,448
|
)
|
||||||||
|
Tax rate change reclassification
|
(473
|
)
|
(126
|
)
|
—
|
(599
|
)
|
|||||||||
|
Balance as of December 31, 2017
|
$
|
(2,997
|
)
|
$
|
(1,403
|
)
|
$
|
3
|
$
|
(4,397
|
)
|
|||||
The following table details activity in accumulated other comprehensive income/(loss) for the year ended December 31, 2016.
|
|
Unrealized Gains (Losses) on Securities
|
Officers' retirement plan
|
Directors' retirement plan
|
Accumulated Other Comprehensive Income/(loss)
|
||||||||||||
|
Balance as of December 31, 2015
|
$
|
150
|
$
|
(662
|
)
|
$
|
17
|
$
|
(495
|
)
|
||||||
|
Current period other comprehensive loss, net of tax
|
(1,828
|
)
|
(24
|
)
|
(3
|
)
|
(1,855
|
)
|
||||||||
|
Balance as of December 31, 2016
|
$
|
(1,678
|
)
|
$
|
(686
|
)
|
$
|
14
|
$
|
(2,350
|
)
|
|||||
The following table details activity in accumulated other comprehensive income/(loss) for the year ended December 31, 2015.
|
|
Unrealized Gains (Losses) on Securities
|
Officers' retirement plan
|
Directors' retirement plan
|
Accumulated Other Comprehensive Income/(loss)
|
||||||||||||
|
Balance as of December 31, 2014
|
$
|
703
|
$
|
(678
|
)
|
$
|
41
|
$
|
66
|
|||||||
|
Current period other comprehensive (loss) income, net of tax
|
(553
|
)
|
16
|
(24
|
)
|
(561
|
)
|
|||||||||
|
Balance as of December 31, 2015
|
$
|
150
|
$
|
(662
|
)
|
$
|
17
|
$
|
(495
|
)
|
||||||
104
(19) Supplemental Consolidated Statements of Cash Flows Information
Supplemental disclosures to the Consolidated Statements of Cash Flows for the years ended December 31, are as follows:
|
|
2017
|
2016
|
2015
|
|||||||||
|
Supplemental disclosure of cash flow information:
|
||||||||||||
|
Cash paid during the year for:
|
||||||||||||
|
Interest
|
$
|
1,085
|
$
|
1,152
|
$
|
1,151
|
||||||
|
|
||||||||||||
|
Income taxes
|
$
|
7,265
|
$
|
5,450
|
$
|
3,745
|
||||||
|
|
||||||||||||
|
Supplemental disclosure of non-cash investing and financing activities:
|
||||||||||||
|
Stock dividend distributed
|
$
|
5,295
|
$
|
3,351
|
$
|
3,103
|
||||||
|
Fair value adjustment of securities available for sale, net of tax of $(564), ($1,218), and $(368) for the years ended December 31, 2017, 2016, and 2015, respectively
|
$
|
(846
|
)
|
$
|
(1,828
|
)
|
$
|
(553
|
)
|
|||
|
Loans held-for-investment transferred to other real estate owned
|
$
|
—
|
$
|
217
|
$
|
407
|
||||||
|
Tax deficiency related to expired, vested non-qualified stock options
|
$
|
—
|
$
|
(114
|
)
|
$
|
—
|
|||||
105
| (20) |
Parent Company Financial Information
|
This information should be read in conjunction with the other notes to the consolidated financial statements. The following presents summary balance sheets and summary statements of income and cash flows information for the years ended December 31:
|
Balance Sheets
|
2017
|
2016
|
||||||
|
Assets
|
||||||||
|
Cash
|
$
|
2,810
|
$
|
2,496
|
||||
|
Investment in wholly owned subsidiary
|
97,234
|
89,802
|
||||||
|
|
||||||||
|
Total assets
|
$
|
100,044
|
$
|
92,298
|
||||
|
Liabilities and stockholders' equity
|
||||||||
|
Liabilities
|
—
|
—
|
||||||
|
Stockholders' equity
|
100,044
|
92,298
|
||||||
|
|
||||||||
|
Total liabilities and stockholders' equity
|
$
|
100,044
|
$
|
92,298
|
||||
|
Statements of Income
|
2017
|
2016
|
2015
|
|||||||||
|
Dividends from subsidiary
|
$
|
—
|
$
|
—
|
$
|
11,000
|
||||||
|
Other operating expenses
|
(224
|
)
|
(203
|
)
|
(153
|
)
|
||||||
|
Income tax benefit
|
92
|
88
|
63
|
|||||||||
|
Income (loss) before undistributed earnings of subsidiary
|
(132
|
)
|
(115
|
)
|
10,910
|
|||||||
|
Equity in undistributed earnings of subsidiary
|
8,880
|
8,166
|
(3,989
|
)
|
||||||||
|
|
||||||||||||
|
Net income
|
$
|
8,748
|
$
|
8,051
|
$
|
6,921
|
||||||
|
Statements of Cash Flows
|
2017
|
2016
|
2015
|
|||||||||
|
Net income
|
$
|
8,748
|
$
|
8,051
|
$
|
6,921
|
||||||
|
Adjustments to reconcile net income to net cash provided by operating activities
|
||||||||||||
|
Stock plan accruals
|
378
|
286
|
230
|
|||||||||
|
Decrease in other liabilities
|
—
|
—
|
(32
|
)
|
||||||||
|
Equity in undistributed earnings of subsidiary
|
(8,880
|
)
|
(8,166
|
)
|
3,989
|
|||||||
|
|
||||||||||||
|
Net cash provided by operating activities
|
246
|
171
|
11,108
|
|||||||||
|
|
||||||||||||
|
Cash flows from financing activities:
|
||||||||||||
|
Redemption of preferred stock
|
—
|
—
|
(12,847
|
)
|
||||||||
|
Dividend on preferred stock
|
—
|
—
|
(105
|
)
|
||||||||
|
Common stock issued
|
78
|
61
|
82
|
|||||||||
|
Stock options exercised
|
—
|
25
|
84
|
|||||||||
|
Cash in lieu of fractional shares
|
(10
|
)
|
(5
|
)
|
(6
|
)
|
||||||
|
|
||||||||||||
|
Net cash provided by (used in) financing activities
|
68
|
81
|
(12,792
|
)
|
||||||||
|
|
||||||||||||
|
Net change in cash
|
314
|
252
|
(1,684
|
)
|
||||||||
|
|
||||||||||||
|
Cash at beginning of year
|
2,496
|
2,244
|
3,928
|
|||||||||
|
|
||||||||||||
|
Cash at end of year
|
$
|
2,810
|
$
|
2,496
|
$
|
2,244
|
||||||
106
(21) Related Party Transactions
The Bank, in the ordinary course of business, has loan and deposit transactions with directors and executive officers. In management's opinion, these transactions were on substantially the same terms as comparable transactions with other customers of the Bank. The amount of such deposits totaled approximately $5,283, $5,858 and $5,534 at December 31, 2017, 2016, and 2015, respectively.
The following is an analysis of the activity of loans to executive officers and directors for the years ended December 31:
|
|
2017
|
2016
|
2015
|
|||||||||
|
Outstanding balance, beginning of year
|
$
|
2,373
|
$
|
2,340
|
$
|
2,364
|
||||||
|
Credit granted
|
3,014
|
4,970
|
4,236
|
|||||||||
|
Repayments / Reductions
|
(2,915
|
)
|
(4,937
|
)
|
(4,260
|
)
|
||||||
|
|
||||||||||||
|
Outstanding balance, end of year
|
$
|
2,472
|
$
|
2,373
|
$
|
2,340
|
||||||
| (22) |
Gain on Sale-leaseback of Real Estate
|
On January 6, 2017, the Company executed a sale-leaseback transaction related to land and building which is partially occupied by our Auburn Branch. The lease carries an initial lease term of six years and is classified as an operating lease. The sale resulted in a total gain of $1,682, of which $495 has been deferred as a component of Other Liabilities and will be accounted for as a reduction of Occupancy and equipment expense over the initial lease term. The Company recognized $76 as a reduction of Occupancy and equipment expense for the year ended December 31, 2017.
107
ITEM 9 - CHANGES IN AND DISAGREEMENTS WITH ACCOUNTANTS ON ACCOUNTING AND FINANCIAL DISCLOSURE
None.
ITEM 9A – CONTROLS AND PROCEDURES
Disclosure controls and procedures
The Company maintains "disclosure controls and procedures," as such term is defined in Rule 13a-15(e) and Rule 15d-15(e) under the Securities Exchange Act of 1934 ("Exchange Act"), that are designed to ensure that information required to be disclosed in reports that the Company files or submits under the Exchange Act is recorded, processed, summarized, and reported within the time periods specified in Securities and Exchange Commission rules and forms, and that such information is accumulated and communicated to management, including the Company's chief executive officer and chief financial officer, as appropriate, to allow timely decisions regarding required disclosure. The Company's disclosure controls and procedures have been designed to meet and management believes that they meet reasonable assurance standards. Based on their evaluation as of the end of the period covered by this Annual Report on Form 10-K, the chief executive officer and chief financial officer have concluded that the Company's disclosure controls and procedures were effective to ensure that material information relating to the Company, including its consolidated subsidiary, is made known to them by others within those entities.
Internal controls over financial reporting
Management of the Company is responsible for establishing and maintaining adequate internal control over financial reporting. This internal control system has been designed to provide reasonable assurance to the Company's management and Board of Directors regarding the preparation and fair presentation of the Company's published financial statements. All internal control systems, no matter how well designed, have inherent limitations. Therefore, even those systems determined to be effective can provide only reasonable assurance with respect to financial statement preparation and presentation. As required by Rule 13a-15(d), management, including the Chief Executive Officer and Chief Financial Officer, conducted an evaluation of our internal control over financial reporting to determine whether any changes occurred during the period covered by this Annual Report on Form 10-K that have materially affected, or are reasonably likely to materially affect, the Company's internal control over financial reporting. Based on that evaluation, the Chief Executive Officer and Chief Financial Officer concluded that there has been no such change during the last quarter of the fiscal year covered by this Annual Report on Form 10-K that has materially affected, or is reasonably likely to materially affect, the Company's internal control over financial reporting. See "Management's Report" included in Item 8 for management's report on the adequacy of internal control over financial reporting.
ITEM 9B – OTHER INFORMATION
None.
108
PART III
ITEM 10 – DIRECTORS, EXECUTIVE OFFICERS, AND CORPORATE GOVERNANCE
The information called for by this item with respect to director and executive officer information is incorporated by reference herein from the sections of the Company's proxy statement for its 2018 Annual Meeting of Shareholders entitled "Executive Officers," "Security Ownership of Certain Beneficial Owners and Management," "Executive Compensation" "Report of Audit Committee," "Section 16(a) Beneficial Ownership Compliance" and "Nomination and Election of Directors."
The Company has adopted a Code of Conduct, which complies with the Code of Ethics requirements of the Securities and Exchange Commission. A copy of the Code of Conduct is posted on the "Investor Relations" page of the Company's website, or is available, without charge, upon the written request of any shareholder directed to Devon Camara-Soucy, Corporate Secretary, First Northern Community Bancorp, 195 North First Street, Dixon, California 95620. The Company intends to disclose promptly any amendment to, or waiver from any provision of, the Code of Conduct applicable to senior financial officers, and any waiver from any provision of the Code of Conduct applicable to directors, on the "Investor Relations" page of its website.
The Company's website address is www.thatsmybank.com.
ITEM 11 - EXECUTIVE COMPENSATION
The information called for by this item is incorporated by reference herein from the sections of the Company's proxy statement for its 2018 Annual Meeting of Shareholders entitled "Nomination and Election of Directors," "Transactions with Related Persons," "Director Compensation," and "Executive Compensation."
109
ITEM 12 - SECURITY OWNERSHIP OF CERTAIN BENEFICIAL OWNERS AND MANAGEMENT AND RELATED STOCKHOLDER MATTERS
Information concerning ownership of the equity stock of the Company by certain beneficial owners and management is incorporated herein by reference from the sections of the Company's proxy statement for the 2018 Annual Meeting of Shareholders entitled "Security Ownership of Certain Beneficial Owners and Management" and "Nomination and Election of Directors."
Stock Purchase Equity Compensation Plan Information
The following table shows the Company's equity compensation plans approved by security holders. The table also indicates the number of securities to be issued upon exercise of outstanding options, weighted-average exercise price of outstanding options, non-vested restricted stock and the number of securities remaining available for future issuance under the Company's equity compensation plans as of December 31, 2017. All amounts have been adjusted to give retroactive effect to stock dividends and stock splits, including the 4% stock dividend declared on January 25, 2018, payable March 29, 2018 to shareholders of record as of February 28, 2018. The plans included in this table are the Company's 2006 Stock Incentive Plan and 2016 Stock Incentive Plan. See "Stock Compensation Plans" in Note 14 of Notes to Consolidated Financial Statements included in this report.
|
Plan category
|
Number of securities to be issued upon exercise of outstanding options, warrants and rights
|
Weighted-average exercise price of outstanding options, warrants and rights
|
Number of securities to be issued upon vesting of restricted stock
|
Weighted-average grant date fair value of restricted stock
|
Number of securities remaining available for future issuance under equity compensation plans (excluding securities reflected in the first column)
|
|||||||||||||||
|
|
||||||||||||||||||||
|
Equity compensation plans approved by security holders
|
260,618
|
$
|
7.42
|
111,370
|
$
|
7.83
|
519,293
|
|||||||||||||
|
Equity compensation plans not approved by security holders
|
—
|
—
|
—
|
—
|
—
|
|||||||||||||||
|
Total
|
260,618
|
$
|
7.42
|
111,370
|
$
|
7.83
|
519,293
|
|||||||||||||
ITEM 13 - CERTAIN RELATIONSHIPS AND RELATED TRANSACTIONS AND DIRECTOR INDEPENDENCE
The information called for by this item is incorporated herein by reference from the sections of the Company's proxy statement for its 2018 Annual Meeting of Shareholders entitled "Director Independence" and "Transactions with Related Persons."
ITEM 14 – PRINCIPAL ACCOUNTANT FEES AND SERVICES
The information called for by this item is incorporated herein by reference from the section of the Company's proxy statement for its 2018 Annual Meeting of Shareholders entitled "Audit and Non-Audit Fees."
110
PART IV
ITEM 15 – EXHIBITS AND FINANCIAL STATEMENT SCHEDULES
(a)(1) Financial Statements:
Reference is made to the Index to Financial Statements under Item 8 in Part II of this Form 10-K.
(a)(2)Financial Statement Schedules:
All schedules to the Company's Consolidated Financial Statements are omitted because of the absence of the conditions under which they are required or because the required information is included in the Consolidated Financial Statements or accompanying notes.
(a)(3)Exhibits:
The following is a list of all exhibits filed as part of this Annual Report on Form 10-K:
|
|
|
Exhibit
|
|
Exhibit Number
|
|
|
|
|
|
|
|
3.1
|
|
Amended Articles of Incorporation of First Northern Community Bancorp ("Company") – incorporated herein by reference to Exhibit 3.1 of the Company's Annual Report on Form 10-K for the fiscal year ended December 31, 2006
|
|
|
|
|
|
3.2
|
|
Certificate of Amendment to the Articles of Incorporation of the Company – incorporated herein by reference to Exhibit 3.1 to the Company's Current Report on Form 8-K dated March 9, 2009
|
|
|
|
|
|
3.3
|
|
Amended and Restated Bylaws of the Company – incorporated herein by reference to Exhibit 3.1 of the Company's Current Report on Form 8-K dated September 15, 2005
|
|
|
|
|
|
10.1
|
|
First Northern Community Bancorp 2000 Stock Option Plan – incorporated herein by reference to Exhibit 4.1 of the Company's Registration Statement on Form S-8 dated May 25, 2000*
|
|
|
|
|
|
10.2
|
|
First Northern Community Bancorp Outside Directors 2000 Non-statutory Stock Option Plan – incorporated herein by reference to Exhibit 4.3 of the Company's Registration Statement dated Form S-8 on May 25, 2000*
|
|
|
|
|
|
10.3
|
|
Amended First Northern Community Bancorp Employee Stock Purchase Plan – incorporated herein by reference to Appendix B of the Company's Definitive Proxy Statement on Schedule 14A for its 2006 Annual Meeting of Shareholders
|
|
|
|
|
|
10.4
|
|
First Northern Community Bancorp 2000 Stock Option Plan Forms "Incentive Stock Option Agreement" and "Notice of Exercise of Stock Option" – incorporated herein by reference to Exhibit 4.2 of the Company's Registration Statement on Form S-8 dated May 25, 2000*
|
|
|
|
|
|
10.5
|
|
First Northern Community Bancorp 2000 Outside Directors 2000 Non-statutory Stock Option Plan Forms "Non-statutory Stock Option Agreement" and "Notice of Exercise of Stock Option" – incorporated herein by reference to Exhibit 4.4 of the Company's Registration Statement on Form S-8 dated May 25, 2000*
|
|
|
|
|
|
10.6
|
|
First Northern Community Bancorp 2000 Employee Stock Purchase Plan Forms "Participation Agreement" and "Notice of Withdrawal" – incorporated herein by reference to Exhibit 4.6 of the Company's Registration Statement on Form S-8 dated May 25, 2000*
|
|
|
|
|
|
10.7
|
|
Amended and Restated Employment Agreement entered into as of July 23, 2001 by and between First Northern Bank of Dixon and Don Fish – incorporated herein by reference to Exhibit 10.1 to the Company's Quarterly Report on Form 10-Q for the quarter ended September 30, 2001*
|
|
|
|
|
|
10.8
|
|
Employment Agreement entered into as of July 23, 2001 by and between First Northern Bank of Dixon and Owen J. Onsum – incorporated herein by reference to Exhibit 10.2 of the Company's Quarterly Report on Form 10-Q for the quarter ended September 30, 2001*
|
111
|
10.9
|
|
Employment Agreement for Louise A. Walker, President and Chief Executive Officer – incorporated herein by reference to Exhibit 10.1 of the Company's Quarterly Report on Form 10-Q for the three months ended June 30, 2012*
|
|
|
|
|
|
10.10
|
|
Employment Agreement entered into as of July 23, 2001 by and between First Northern Bank of Dixon and Robert Walker – incorporated herein by reference to Exhibit 10.4 of the Company's Quarterly Report on Form 10-Q for the quarter ended September 30, 2001*
|
|
|
|
|
|
10.11
|
|
Form of Director Retirement and Split Dollar Agreements between First Northern Bank of Dixon and Lori J. Aldrete, Frank J. Andrews Jr., John M. Carbahal, Gregory DuPratt, John F. Hamel, Diane P. Hamlyn, Foy S. McNaughton, William Jones, Jr. and David Schulze – incorporated herein by reference to Exhibit 10.11 to Company's Annual Report on Form 10-K for the year ended December 31, 2001*
|
|
|
|
|
|
10.12
|
|
Form of Salary Continuation and Split Dollar Agreement between First Northern Bank of Dixon and Owen J. Onsum, Louise A. Walker, Don Fish, and Robert Walker – incorporated herein by reference to Exhibit 10.12 to Company's Annual Report on Form 10-K for the year ended December 31, 2001*
|
|
|
|
|
|
10.13
|
|
Amended Form of Director Retirement and Split Dollar Agreements between First Northern Bank of Dixon and Lori J. Aldrete, Frank J. Andrews Jr., John M. Carbahal, Gregory DuPratt, John F. Hamel, Diane P. Hamlyn, Foy S. McNaughton, William Jones, Jr. and David Schulze – incorporated herein by reference to Exhibit 10.13 to the Company's Annual Report on Form 10-K for the year ended December 31, 2004*
|
|
|
|
|
|
10.14
|
|
Amended Form of Salary Continuation and Split Dollar Agreement between First Northern Bank of Dixon and Owen J. Onsum, Louise A. Walker, Don Fish, and Robert Walker – incorporated herein by reference to Exhibit 10.14 to the Company's Annual Report on Form 10-K for the year ended December 31, 2004*
|
|
|
|
|
|
10.15
|
|
Form of Salary Continuation Agreement between Pat Day and First Northern Bank of Dixon – incorporated herein by reference to Exhibit 10.15 to the Company's Annual Report on Form 10-K for the year ended December 31, 2006*
|
|
|
|
|
|
10.16
|
|
Form of Supplemental Executive Retirement Plan Agreement between First Northern Bank of Dixon and Owen J. Onsum and Louise A. Walker – incorporated herein by reference to Exhibit 10.16 to the Company's Annual Report on Form 10-K for the year ended December 31, 2006*
|
|
|
|
|
|
10.17
|
|
First Northern Bancorp 2006 Stock Incentive Plan – incorporated by reference to Appendix A of the Company's Definitive Proxy Statement on Schedule 14A for its 2006 Annual Meeting of Shareholders*
|
|
|
|
|
|
10.18
|
|
First Northern Bank Annual Incentive Compensation Plan – incorporated herein by reference to Exhibit 10.18 to the Company's Annual Report on Form 10-K for the year ended December 31, 2006*
|
|
|
|
|
|
10.20
|
|
First Northern Community Bancorp 2006 Stock Option Plan Forms "Stock Option Agreement" and "Notice of Exercise of Stock Option" incorporated herein by reference to Exhibit 10.20 to the Company's Annual Report for the year ended December 31, 2009 *
|
|
|
|
|
|
10.21
|
|
First Northern Community Bancorp 2006 Stock Incentive Plan "Restricted Stock Agreement incorporated by reference to Exhibit 10.21 to the Company's Annual Report on Form 10-K for the fiscal year ended December 31, 2009 *
|
|
|
|
|
|
10.22
|
|
Employment Agreement for Jeremiah Z. Smith, Executive Vice President and Chief Financial Officer - incorporated herein by reference to Exhibit 10.2 to the Company's Quarterly Report on Form 10-Q for the fiscal quarter ended June 30, 2012*
|
|
|
|
|
|
10.23
|
|
Employment Agreement for Patrick S. Day, Executive Vice President and Chief Credit Officer - incorporated herein by reference to Exhibit 10.3 to the Company's Quarterly Report on Form 10-Q for the fiscal quarter ended June 30, 2012*
|
|
10.24
10.25
|
|
First Northern Bancorp 2016 Stock Incentive Plan – incorporated by reference to Appendix A of the Company's Definitive Proxy Statement on Schedule 14A for its 2015 Annual Meeting of Shareholders*.
First Northern Bancorp 2016 Employee Stock Purchase Plan – incorporated by reference to Appendix B of the Company's Definitive Proxy Statement on Schedule 14A for its 2015 Annual Meeting of Shareholders*.
|
|
10.26
|
Amended and Restated Executive Deferral Plan of First Northern Bank effective July 20, 2017 – incorporated herein by reference to Exhibit 10.26 of the Company's Quarterly Report on Form 10-Q for the quarter-ended September 30, 2017*
|
112
|
10.27
|
Executive Retirement/Retention Participation Agreement for Joe Danelson, Executive Vice President and Chief Credit Officer – incorporated herein by reference to Exhibit 10.27 of the Company's Quarterly Report on Form 10-Q for the quarter-ended September 30, 2017*
|
|
|
10.28
|
Executive Retirement/Retention Participation Agreement for Jeremiah Z. Smith, Senior Executive Vice President and Chief Financial Officer & Chief Operating Officer – incorporated herein by reference to Exhibit 10.28 of the Company's Quarterly Report on Form 10-Q for the quarter-ended September 30, 2017*
|
|
|
11.1
|
|
Statement of Computation of Per Share Earnings (See FN 13 of this Form 10-K)
|
|
|
|
|
|
21.1
|
|
Subsidiaries of the Company – provided herewith
|
|
23.1
|
|
Consent of independent registered public accounting firm – provided herewith
|
|
|
|
|
|
31.1
|
|
Rule 13(a) – 14(a) / 15(d) –14(a) Certification of the Company's Chief Executive Officer – provided herewith
|
|
|
|
|
|
31.2
|
|
Rule 13(a) – 14(a) / 15(d) –14(a) Certification of the Company's Chief Financial Officer – provided herewith
|
|
|
|
|
|
32.1**
|
|
Section 1350 Certification of the Chief Executive Officer – provided herewith
|
|
|
|
|
|
32.2**
|
|
Section 1350 Certification of the Chief Financial Officer – provided herewith
|
|
|
|
|
|
101
|
|
Pursuant to Rule 405 of Regulation S-T, the following financial information from the Registrant's Annual Report on Form 10-K for the twelve months ended December 31, 2017, is formatted in XBRL interactive data files: (i) Consolidated Balance Sheets; (ii) Consolidated Statements of Operations; (iii) Consolidated Statement of Comprehensive Income; (iv) Consolidated Statements of Stockholders' Equity; (v) Consolidated Statements of Cash Flows; and (vi) Notes to Consolidated Financial Statements.
|
* Management contract or compensatory plan, contract or arrangement.
** In accordance with Item 601(b)(32)(ii) of Regulation S-K and SEC Release No. 34-47986, the certifications furnished in Exhibits 32.1 and 32.2 hereto are deemed to accompany this Form 10-K and will not be deemed "filed" for purposes of Section 18 of the Exchange Act. Such certifications will not be deemed to be incorporated by reference into any filing under the Securities Act or the Exchange Act.
ITEM 16 – FORM 10-K SUMMARY
Not applicable.
113
SIGNATURES
Pursuant to the requirements of Section 13 or 15(d) of the Securities Exchange Act of 1934, as amended, the registrant has duly caused this report to be signed on its behalf by the undersigned, thereunto duly authorized, on March 8, 2018.
|
|
FIRST NORTHERN COMMUNITY BANCORP
|
|
|
|
|
|
|
|
By:
|
/s/ Louise A. Walker
|
|
|
|
|
|
|
|
Louise A. Walker
|
|
|
|
President/Chief Executive Officer/Director
|
|
|
|
(Principal Executive Officer)
|
Pursuant to the requirements of the Securities Exchange Act of 1934, this report has been signed below by the following persons on behalf of the registrant and in the capacities and on the dates indicated.
114
|
Name
|
Title
|
Date
|
|
|
|
|
|
/s/ Louise A. Walker
|
President/Chief Executive Officer/Director
|
March 8, 2018
|
|
Louise A. Walker
|
(Principal Executive Officer)
|
|
|
|
|
|
|
/s/ Jeremiah Z. Smith
|
Senior Executive Vice President/Chief Operating Officer
|
March 8, 2018
|
|
Jeremiah Z. Smith
|
(Principal Operating Officer)
|
|
|
|
|
|
|
/s/ Kevin Spink
|
Executive Vice President/Chief Financial Officer
|
March 8, 2018
|
|
Kevin Spink
|
(Principal Financial Officer)
|
|
|
|
|
|
|
/s/ LORI J. ALDRETE
|
Director and Chairman of the Board
|
March 8, 2018
|
|
Lori J. Aldrete
|
|
|
|
|
|
|
|
/s/ FRANK J. ANDREWS, JR.
|
Director
|
March 8, 2018
|
|
Frank J. Andrews, Jr.
|
|
|
|
|
|
|
|
/s/ PATRICK R. BRADY
|
Director
|
March 8, 2018
|
|
Patrick R. Brady
|
|
|
|
|
|
|
|
/s/ JOHN M. CARBAHAL
|
Director
|
March 8, 2018
|
|
John M. Carbahal
|
|
|
|
|
|
|
|
/s/ GREGORY DUPRATT
|
Director
|
March 8, 2018
|
|
Gregory DuPratt
|
|
|
|
|
|
|
|
/s/ BARBARA HAYES
|
Director
|
March 8, 2018
|
|
Barbara Hayes
|
|
|
|
|
|
|
|
/s/ RICHARD M. MARTINEZ
|
Director and Vice Chairman of the Board
|
March 8, 2018
|
|
Richard M. Martinez
|
|
|
|
|
|
|
|
/s/ FOY S. MCNAUGHTON
|
Director
|
March 8, 2018
|
|
Foy S. McNaughton
|
|
|
|
/s/ SEAN P. QUINN
|
Director
|
March 8, 2018
|
|
Sean P. Quinn
|
|
|
|
|
|
|
|
/s/ MARK C. SCHULZE
|
Director
|
March 8, 2018
|
|
Mark C. Schulze
|
|
|
115