Attached files
| file | filename |
|---|---|
| EX-31.2 - EX-31.2 - Alteryx, Inc. | d530988dex312.htm |
| EX-99.1 - EX-99.1 - Alteryx, Inc. | d530988dex991.htm |
| EX-32.2 - EX-32.2 - Alteryx, Inc. | d530988dex322.htm |
| EX-32.1 - EX-32.1 - Alteryx, Inc. | d530988dex321.htm |
| EX-31.1 - EX-31.1 - Alteryx, Inc. | d530988dex311.htm |
| EX-23.1 - EX-23.1 - Alteryx, Inc. | d530988dex231.htm |
| EX-21.1 - EX-21.1 - Alteryx, Inc. | d530988dex211.htm |
| EX-10.11 - EX-10.11 - Alteryx, Inc. | d530988dex1011.htm |
| EX-10.9 - EX-10.9 - Alteryx, Inc. | d530988dex109.htm |
| EX-10.8 - EX-10.8 - Alteryx, Inc. | d530988dex108.htm |
| EX-10.6 - EX-10.6 - Alteryx, Inc. | d530988dex106.htm |
Table of Contents
UNITED STATES
SECURITIES AND EXCHANGE COMMISSION
Washington, D.C. 20549
FORM 10-K
(Mark One)
| ☒ | ANNUAL REPORT PURSUANT TO SECTION 13 OR 15(d) OF THE SECURITIES EXCHANGE ACT OF 1934 |
For the fiscal year ended December 31, 2017
or
| ☐ | TRANSITION REPORT PURSUANT TO SECTION 13 OR 15(d) OF THE SECURITIES EXCHANGE ACT OF 1934 |
For the transition period from to
Commission file number: 001-38034
Alteryx, Inc.
(Exact name of registrant as specified in its charter)
| Delaware | 90-0673106 | |
| (State or other jurisdiction of incorporation or organization)
|
(I.R.S. Employer Identification No.) | |
| 3345 Michelson Drive, Suite 400, Irvine, California | 92612 | |
| (Address of principal executive offices) | (Zip Code) |
(888) 836-4274
(Registrant’s telephone number, including area code)
Securities registered pursuant to Section 12(b) of the Act:
| Title of Each Class |
Name of Each Exchange on Which Registered | |
| Class A Common Stock, $0.0001 par value per share | New York Stock Exchange |
Securities registered pursuant to Section 12(g) of the Act: None
Indicate by check mark if the registrant is a well-known seasoned issuer, as defined in Rule 405 of the Securities Act. Yes ☐ No ☒
Indicate by check mark if the registrant is not required to file reports pursuant to Section 13 or Section 15(d) of the Act. Yes ☐ No ☒
Indicate by check mark whether the registrant (1) has filed all reports required to be filed by Section 13 or 15(d) of the Securities Exchange Act of 1934 during the preceding 12 months (or for such shorter period that the registrant was required to file such reports), and (2) has been subject to such filing requirements for the past 90 days. Yes ☒ No ☐
Indicate by check mark whether the registrant has submitted electronically and posted on its corporate Web site, if any, every Interactive Data File required to be submitted and posted pursuant to Rule 405 of Regulation S-T (§232.405 of this chapter) during the preceding 12 months (or for such shorter period that the registrant was required to submit and post such files). Yes ☒ No ☐
Indicate by check mark if disclosure of delinquent filers pursuant to Item 405 of Regulation S-K (§229.405 of this chapter) is not contained herein, and will not be contained, to the best of the Registrant’s knowledge, in definitive proxy or information statements incorporated by reference in Part III of this Form 10-K or any amendment to this Form 10-K. ☐
Indicate by check mark whether the registrant is a large accelerated filer, an accelerated filer, a non-accelerated filer, a smaller reporting company, or emerging growth company. See the definitions of “large accelerated filer,” “accelerated filer,” “smaller reporting company,” and “emerging growth company” in Rule 12b-2 of the Exchange Act.
| Large accelerated filer | ☐ | Accelerated filer | ☐ | |||
| Non-accelerated filer | ☒ (Do not check if a smaller reporting company) | Smaller reporting company | ☐ | |||
| Emerging growth company | ☒ | |||||
If an emerging growth company, indicate by check mark if the registrant has elected not to use the extended transition period for complying with any new or revised financial accounting standards provided pursuant to Section 13(a) of the Exchange Act. ☐
Indicate by check mark whether the registrant is a shell company (as defined in Rule 12b-2 of the Exchange Act). Yes ☐ No ☒
The aggregate market value of the registrant’s voting and non-voting common equity held by non-affiliates of the registrant, as of June 30, 2017, the last business day of the registrant’s most recently completed second fiscal quarter, was approximately $331.3 million based upon the closing price reported for such date on the New York Stock Exchange.
Indicate the number of shares outstanding of each of the issuer’s classes of common stock, as of the latest practicable date.
As of February 28, 2018, there were 27,669,778 shares of the registrant’s Class A common stock outstanding and 32,553,260 shares of the registrant’s Class B common stock outstanding.
DOCUMENTS INCORPORATED BY REFERENCE
Portions of the registrant’s definitive proxy statement for its 2018 Annual Meeting of Stockholders, or Proxy Statement, to be filed within 120 days after the end of the fiscal year covered by this Annual Report on Form 10-K, are incorporated by reference in Parts II and III. Except with respect to information specifically incorporated by reference in this Annual Report, the Proxy Statement shall not be deemed to be filed as part hereof.
Table of Contents
Alteryx, Inc.
Annual Report on Form 10-K
For the Fiscal Year Ended December 31, 2017
| Page Number | ||||||
| Special Note Regarding Forward-looking Statements |
| |||||
| Industry and Market Data |
| |||||
| PART I |
| |||||
| Item 1. | 5 | |||||
| Item 1A. | 17 | |||||
| Item 1B. | 49 | |||||
| Item 2. | 49 | |||||
| Item 3. | 49 | |||||
| Item 4. | 49 | |||||
| PART II |
| |||||
| Item 5. | 50 | |||||
| Item 6. | 52 | |||||
| Item 7. | Management’s Discussion and Analysis of Financial Condition and Results of Operations |
53 | ||||
| Item 7A. | 69 | |||||
| Item 8. | 71 | |||||
| Item 9. | Changes in and Disagreements with Accountants on Accounting and Financial Reporting |
107 | ||||
| Item 9A. | 107 | |||||
| Item 9B. | 108 | |||||
| PART III |
| |||||
| Item 10. | 109 | |||||
| Item 11. | 109 | |||||
| Item 12. | Security Ownership of Certain Beneficial Owners and Management and Related Stockholder Matters |
109 | ||||
| Item 13. | Certain Relationships and Related Transactions and Director Independence |
109 | ||||
| Item 14. | 109 | |||||
| PART IV |
| |||||
| Item 15. | 110 | |||||
| Signatures | 113 | |||||
1
Table of Contents
SPECIAL NOTE REGARDING FORWARD-LOOKING STATEMENTS
This Annual Report on Form 10-K, or Annual Report, includes “forward-looking statements” within the meaning of the federal securities laws. All statements contained in this Annual Report, other than statements of historical fact, including statements regarding our future results of operations and financial position, our business strategy and plans, and our objectives for future operations, are forward-looking statements. In some cases, forward-looking statements can be identified by the use of terminology such as “believe,” “may,” “will,” “intend,” “expect,” “plan,” “anticipate,” “estimate,” “potential,” or “continue,” or other comparable terminology. Forward-looking statements contained in this Annual Report include, but are not limited to, statements about our expectations regarding:
| • | trends in revenue, cost of revenue, and gross margin; |
| • | our investments in cloud infrastructure and mobile capability and the cost of third-party data center hosting fees; |
| • | trends in operating expenses, including research and development expense, sales and marketing expense, and general and administrative expense, and expectations regarding these expenses as a percentage of revenue; |
| • | maintaining a valuation allowance for domestic net deferred tax assets to the extent they are not expected to be recoverable; |
| • | the global opportunity for our self-service data analytics solutions; |
| • | our investments in our marketing efforts and sales organization and the impact of any changes to our sales organization on revenue and growth; |
| • | the continued development of our user community, distribution channels and other partner relationships; |
| • | expansion of and within our customer base; |
| • | continued investments in research and development; |
| • | competitors and competition in our markets; |
| • | the impact of foreign currency exchange rates; |
| • | legal proceedings and the impact of such proceedings; |
| • | cash and cash equivalents and short-term investments and any positive cash flows from operations being sufficient to support our working capital and capital expenditure requirements for at least the next 12 months; and |
| • | other statements regarding our future operations, financial condition, and prospects and business strategies. |
Although we believe that the expectations reflected in the forward-looking statements contained herein are reasonable, these expectations or any of the forward-looking statements could prove to be incorrect, and actual results could differ materially from those projected or assumed in the forward-looking statements. Our future financial condition and results of operations, as well as any forward-looking statements, are subject to risks and uncertainties, including, but not limited to, the factors set forth in this Annual Report under Part I, Item 1A. Risk Factors. Moreover, we operate in a very competitive and rapidly changing environment. New risks emerge from time to time. It is not possible for us to predict all risks, nor can we assess the impact of all factors on our business or the extent to which any factor, or combination of factors, may cause actual results to differ materially from those contained in any forward-looking statements we may make. In light of these risks, uncertainties, and assumptions, the forward-looking statements made in this Annual Report may not occur and actual results could differ materially and adversely from those anticipated or implied in the forward-looking statements.
2
Table of Contents
All forward-looking statements and reasons why results may differ included in this Annual Report are made as of the date of the filing of this Annual Report, and we assume no obligation to update any such forward-looking statements or reasons why actual results may differ. The following discussion should be read in conjunction with our consolidated financial statements and notes thereto appearing in Part II, Item 8 of this Annual Report.
3
Table of Contents
INDUSTRY AND MARKET DATA
Unless otherwise indicated, information contained in this Annual Report concerning our industry and the markets in which we operate, including our general expectations and market position, market opportunity, and market size, is based on information from the sources set forth below. In presenting this information, we have also made assumptions based on such data and other similar sources, and on our knowledge of, and in our experience to date in, the market for our platform. This information involves a number of assumptions and limitations, and you are cautioned not to give undue weight to such estimates. The industry in which we operate is subject to a high degree of uncertainty and risk due to a variety of factors, including those described in Part I, Item 1A. Risk Factors and elsewhere in this Annual Report. These and other factors could cause results to differ materially from those expressed in the estimates made by the independent parties and by us.
This Annual Report contains statistical data, estimates, and forecasts that are based on industry publications or reports generated by third-party providers, including reports prepared by IDC that we sponsored or commissioned, or other publicly available information, as well as other information based on our internal sources. The reports described herein represent data, research, opinions, or viewpoints prepared by IDC. These reports speak as of their original publication dates (and not as of the date of this Annual Report) and the opinions expressed in the reports are subject to change without notice.
The sources of certain statistical data, estimates, and forecasts contained in this report are provided below:
| • | IDC, The State of Self-Service Data Preparation and Analysis Using Spreadsheets (commissioned by Alteryx), December 2016. |
| • | IDC, Data Age 2025: The Evolution of Data to Life-Critical, April 2017. |
| • | IDC, Worldwide Big Data and Analytics Software Forecast, 2017-2021, July 2017. |
4
Table of Contents
PART I
Overview
We are a leading provider of self-service data analytics software. Our software platform enables organizations to dramatically improve business outcomes and the productivity of their business analysts. Our subscription-based platform allows organizations to easily prepare, blend, and analyze data from a multitude of sources and more quickly benefit from data-driven decisions. The ease-of-use, speed, and sophistication that our platform provides is enhanced through intuitive and highly repeatable visual workflows. We aim to make our platform as ubiquitous in the workplace as spreadsheets are today.
As the volume, velocity, and variety of data continue to expand, the ability to leverage this data for actionable insights has become increasingly foundational to modern business success. However, traditional data analysis tools and processes are slow, difficult to use, and resource-intensive, often requiring multiple steps by data analysts, data scientists, information technology, or IT, employees, and other data workers to complete even the most basic analysis. As a result, these tools and processes are unable to keep pace with the rapid analytics demanded by organizations today.
Our platform democratizes access to data-driven insights by expanding the capabilities and analytical sophistication available to all data workers, ranging from business analysts to expert programmers and trained data scientists. We bring the fragmented analytic process into one simple and cohesive self-service experience, combining tasks that were previously distributed among multiple tools and parties. Our platform allows a single user to access various data sources, clean and prepare data, perform a variety of analyses, and then deploy the results for consumption and to operationalize the insights discovered. This is done through visual workflows and an intuitive drag-and-drop interface that can eliminate the need to write code and reduce tedious, time-consuming tasks to a few mouse-clicks. The resulting opportunity is significant, as our platform can enable millions of underserved data workers to more effectively do their jobs.
Organizations of all sizes and across a wide variety of industries have adopted our platform. As of December 31, 2017, we had approximately 3,400 customers in more than 70 countries, including over 400 of the Global 2,000 companies. Our customers include Ford Motor Company, Kaiser Foundation Health Plan, Inc., Knight Transportation Inc., Nike, Inc., Southwest Airlines Co., Tableau Software, Inc., and Tesco PLC. Our platform is also leveraged by leading management consulting organizations such as Accenture plc, Bain & Company, and Boston Consulting Group.
We employ a “land and expand” business model. Our go-to-market approach often begins with a free trial and is followed by an initial purchase of our platform offerings. As organizations realize the benefits derived from our platform, use frequently spreads across departments, divisions, and geographies through word-of-mouth, collaboration, and standardization of business processes. Over time, many of our customers find that the use of our platform is more strategic in nature and our platform becomes a fundamental element of their regular analytical processes.
Customers license our platform under a subscription-based model, and we have seen rapid expansion as adoption spreads. For each of the last twelve quarters, including the quarter ended December 31, 2017, our dollar-based net revenue retention rate has exceeded 120%. In addition, our customer base has increased from approximately 1,400 as of December 31, 2015 to approximately 3,400 as of December 31, 2017. See the section titled “Management’s Discussion and Analysis of Financial Condition and Results of Operations—Key Business Metrics” for additional information regarding our dollar-based net revenue retention rate and customers. For the years ended December 31, 2017, 2016, and 2015, our revenue was $131.6 million, $85.8 million, and
5
Table of Contents
$53.8 million, respectively, representing year-over-year growth of 53% and 59%, respectively. We have made significant investments to grow our business, including in sales and marketing, infrastructure, operations, and headcount. We have incurred net losses for the years ended December 31, 2017, 2016, and 2015 of $17.5 million, $24.3 million, and $21.5 million, respectively. We had an accumulated deficit of $103.5 million as of December 31, 2017.
Our Opportunity
Our self-service data analytics platform disrupts well-established portions of the business analytics software market. According to IDC, the worldwide market for big data and analytics software represented approximately $49 billion in 2016 and is expected to grow to approximately $81 billion in 2021. Within the broader big data and analytics software market, our solutions currently address the business intelligence and analytic tools, analytic data integration and spatial information analysis markets, which collectively represented approximately $19 billion in 2016 and are expected to grow to approximately $29 billion in 2021.
There is significant additional potential spend not included in the above estimates associated with spreadsheet users who we believe can benefit from our platform. According to a separate IDC study that we commissioned, an estimated 21 million spreadsheet users worldwide worked on advanced data preparation and analytics in 2016. Based on this study, we estimate that there is an additional opportunity of over $10 billion that our platform can address. In the same study, IDC estimated that over 80% of spreadsheet users are using manual copy and paste methods to acquire data. The IDC study also estimated that in the United States alone, there is a cost to companies of approximately $60 billion per year associated with time spent by data workers repeating processes when data sources are updated.
Our Solution
Our analytics platform enables organizations to dramatically improve business outcomes and the productivity of their business analysts and citizen data scientists. Our subscription-based platform allows organizations to easily profile, prepare, blend, and analyze data from a multitude of sources and benefit from data-driven decisions. Our platform is:
| • | Efficient. We offer a self-service platform that allows business analysts to perform analysis on their own that traditionally required multiple parties and work streams to complete. Our in-memory software “engine” is designed to ingest and process large volumes of data rapidly and enable responsive and agile analysis, delivering dramatically “faster time to insights”. Once a workflow has been assembled, the analysis can be repeated in minutes and shared with others who can easily replicate the analysis. With our platform, data analysis is automated, repeatable, and shareable. |
| • | Independent. We enable business analysts to rapidly answer challenging business questions on their own, without the need for support from expert programmers, trained data scientists, or other members of the IT department. Our platform offers analytics with easily understandable drag-and-drop tools that have easy-to-configure parameters that do not require coding. With our platform, business analysts can manage all steps in an analytic process without the assistance of their IT departments. |
| • | Flexible. Our platform does not require a pre-packaged, static data set and instead allows the user to create a visual workflow to securely interact with the underlying source data. Workflows can be easily changed and reconfigured to iterate an analysis and add a new data source or new logic. They also can be easily adapted to conform with changes in the underlying data to repeat the analysis. This flexibility allows workflows to be configured to address a wide range of use cases. Business analysts can build apps that let others interact with the workflow through a simple interface available on the public or private cloud or they can configure a workflow to output results directly to a database or system of record. Our platform also outputs to most visual formats such as those offered by Microsoft Corporation, Qlik Technologies, Inc., and Tableau. |
6
Table of Contents
| • | Sophisticated. Our platform provides business analysts an extensive set of analytical capabilities. Our drag-and-drop visual workflow environment includes capabilities that allow users to: access data from a variety of locations such as a local desktop, a relational database, or the cloud; prepare data for analysis; blend multiple data sources regardless of the data structure or format, including big data technologies; gain access to over 50 pre-packaged tools of the most widely used procedures for predictive analytics, grouping, and forecasting; and take advantage of geospatial data to drive understanding of topics such as trade areas and drive-time analysis. |
| • | Scalable. Our platform offers a secure collaboration environment for even the largest organizations. Business analysts can create, publish, and share analytic applications across the organization, embed analytic processes into other internal applications, and save and access workflows within a centralized repository with version control when working across multiple teams. The ability to deploy our platform on-premise or in the cloud also provides additional flexibility to scale as each customer’s business needs grow. By pushing analytical workloads to a reliable server architecture, customers can run sophisticated compute-intensive processes more efficiently than local machines allow, while automating and scheduling these workflows to give business analysts stronger control of their analytic landscape. |
Growth Strategy
Our focus on empowering business analysts and the organizations they serve to quickly and easily access data-driven insights presents a significant opportunity. Key elements of our strategy for growth include:
| • | Increase our overall customer base. We are accelerating the secular shift towards self-service analytics. As a result, we have the opportunity to substantially increase our current customer base of approximately 3,400 customers through an active “land and expand” strategy. We plan to expand our online and offline marketing efforts to increase demand for our platform and awareness of our brand. We also plan to make significant investments in growing both our direct sales teams and indirect sales channels. |
| • | Expand within our current customer base. We plan on expanding existing customers’ use of our platform by identifying additional use cases, departments, and divisions for our platform and increasing the number of users within our existing customers’ organizations. Over time, many of our customers find that the use of our platform is more strategic in nature and our platform becomes a fundamental element of their regular analytical processes. |
| • | Continue to penetrate international markets. We have continued to increase our focus on international markets. We believe that the global opportunity for self-service data analytics solutions is significant and should continue to expand as organizations outside the United States seek to adopt self-service platforms as we have experienced with our existing customers. |
| • | Extend our value proposition. We intend to continue to rapidly improve the capabilities of our platform and invest in innovation and our category leadership. For example, in January 2017, we acquired Semanta s.r.o., or Semanta, to enhance our data governance capabilities and, in May 2017, we acquired Yhat, Inc., or Yhat, to enhance our capabilities for managing and deploying advanced analytic models. We plan to continue to invest in research and development, including hiring top technical talent and maintaining an agile organization that focuses on core technology innovation. In particular, we intend to focus on further developing our cloud and mobile capabilities, improving the governance capabilities of Alteryx Server, and updating our in-memory engine. |
| • | Grow our distribution channels and channel partner ecosystem. We plan to continue investing in distribution channels and our relationships with technology alliances, system integrators, management consulting firms, and value-added-resellers, or VARs, to help us enter and grow in new markets while complementing our direct sales efforts. We also plan to continue to collaborate with management consulting firms to drive additional business activity. |
7
Table of Contents
| • | Deepen our user community. We benefit from a vibrant and engaged user community and continue to promote initiatives intended to further expand and energize our community. Our online community site and live events, such as our annual Inspire customer conferences, which have grown from over 270 attendees in 2012 to over 2,800 attendees in 2017, help us broaden and strengthen our community. Additionally, university courses and analytic clubs help evangelize the benefits of our platform and introduce its capabilities to business analysts just starting their careers. We intend to expand our community development efforts and seek to continue enriching the lives of business analysts everywhere. |
Our Platform
Our subscription-based software analytics platform allows organizations to easily prepare, blend, and analyze data from a multitude of sources and benefit from better data-driven decisions, including through consumption of results and insights discovered and through real-time model deployment. The ease-of-use, speed, and sophistication of the analysis that our platform enables are enhanced through highly repeatable visual workflows. Our platform’s intuitive user interface includes over 200 drag-and-drop tools that can be used to create and share these analytics. These tools allow business analysts to assemble workflows that represent their models visually, making them easily comprehensible and highly repeatable. Our user interface allows business analysts to seamlessly view the underlying data, metadata, and applied analytics at any stage during the process.
Our platform is designed to interact with almost any data source. Native connectors exist for a wide variety of sources ranging from traditional databases including IBM, Microsoft, Oracle, and SAP, to an array of emerging data platforms including Amazon Web Services, Cloudera, Databricks, Hortonworks, Microsoft Azure, and MongoDB. Additionally, our platform is capable of processing data from cloud applications, such as Google Analytics, Marketo, NetSuite, Salesforce, and Workday, as well as social media platforms, such as Facebook and Twitter.
Powered by our proprietary in-memory engine, our analytics platform comprises:
| • | Alteryx Designer. Our data profiling, preparation, blending, and analytics product deployable to the cloud and on premise. |
| • | Alteryx Server. Our secure and scalable server-based product for scheduling, sharing, and running analytic processes and applications in a web-based environment. |
| • | Alteryx Connect. Our collaborative data exploration platform for discovering information assets and sharing recommendations across the enterprise. |
| • | Alteryx Promote. Our advanced analytics model management product for data scientists and analytics teams to build, manage, monitor, and deploy predictive models to production. |
In addition, Alteryx Analytics Gallery, our cloud-based collaboration offering, is a key feature of our platform allowing users to share workflows in a centralized repository. With Alteryx Analytics Gallery, users can share workflows with version control to enable effective and secure collaboration within and across organizations, create analytic apps and macros that can be shared both privately and publicly, and discover new analytic apps and macros to leverage best practices or to be used as the blueprint for a customized purpose-built analytic workflow.
We sell Alteryx Designer as single seat licenses as well as through broad enterprise-level agreements. Alteryx Server is deployed in larger scale environments and is typically sold on a per-CPU core or unlimited basis as an extension of Alteryx Designer.
8
Table of Contents
Alteryx Designer
Alteryx Designer, our self-service data profiling, preparation, blending, and analytics product, allows business analysts to perform analysis on their own in a matter of hours or even minutes. In addition to dramatically reducing the time and resources required, Alteryx Designer delivers more accurate, transparent, and sophisticated results. The ability to share workflows and analytic outputs through the Alteryx Analytics Gallery allows the analytic power of Alteryx Designer to be consumed by anyone in an organization. Key capabilities include:
| • | Data profiling. Empowers data workers and analysts with a platform to independently assess the health and quality of a dataset prior to building analytic models. For a large number of analysts, assessing data quality often requires turning to statisticians or data scientists, delaying the model development and decision making process. Automated data profiling accelerates the data preparation and insight development process, and can enable the analysts to maintain control of the entire analytic process. |
| • | Data preparation and blending. Provides the ability to easily connect, clean, transform, and filter data significantly faster than traditional analytic tools. Business analysts can easily blend structured, unstructured, and semi-structured data sources without complex programming requirements. Business analysts use a simple visual workspace and straightforward drag-and-drop tools to clean and combine data and create a repeatable workflow. Once a workflow is assembled, it automates the analytic process and can be rerun in seconds. |
| • | Analytics. Enables business analysts to perform analytics ranging from basic to highly complex. Our platform supports cleansing, calculations, aggregations, and advanced analytics functions including those used to understand data relative to spatial criteria or tools used to apply R-based statistical algorithms for predictive analysis. Business analysts can create a data set optimized for a specific analysis, run a broad set of analytics, and share the results in a variety of formats. Additionally, our platform embeds a suite of tutorials and samples, and the expertise of thousands of analysts from our community within the interface to help familiarize users with our platform’s capabilities, enabling business analysts to adopt sophisticated analytic methodologies without significant training. |
| • | Analytic application creation. Offers native drag-and-drop app-building capabilities for business analysts to create, publish, and share applications for any user to execute. These applications can also be configured to share the results in a variety of formats, including visualization and dashboard programs such as those offered by Microsoft, Qlik, or Tableau, or to write back to a database. In addition, they can be published in Alteryx Server to grant multiple users access. Business analysts can use workflows within other workflows as building blocks to leverage functionality that has already been built. These workflows can also be utilized as reusable blueprints for designing and deploying analytical applications to Alteryx Server or Alteryx Analytics Gallery. |
Alteryx Server
Alteryx Server is a comprehensive and scalable server-based product that enables business analysts to share and run analytic applications in a web-based environment. Alteryx Server offers enterprise-class data scalability, distribution, and security designed to maximize the value enterprises can achieve from their analytics. Key capabilities include:
| • | Collaboration. Enables business analysts to easily create, publish, share, and reference analytic workflows or applications and collaborate with others across their organizations. Business analysts can also develop analytic applications that act as front-end interfaces for their workflows, and these analytic results can be shared publicly and privately in Alteryx Analytics Gallery. |
| • | Workload scaling. Allows for data-intensive workloads to be offloaded from user desktops to a server or cluster of servers, harnessing greater computing power. Business analysts can schedule and execute workflows to refresh data sets and analytic outputs automatically, without slowing down the work process. |
9
Table of Contents
| • | Analytic application consumption. Allows business analysts to access previously built macros or analytic models in a secure, custom application library. Business analysts can also extend the analytic tools they have built directly into other applications using our application program interfaces, or APIs, and macros. |
| • | Enterprise-compliant governance. Restrict, create, edit, or revoke access to appropriate data with corporate authentication, permission, and encryption protocols through a centralized data connection manager for data access control and governance. Workflows are stored centrally with version control and governance capabilities, allowing multiple users to build, run, and reference the same workflow all within the confines of existing IT governance controls. Detailed usage reporting, auditing, and standardized logging tools enable system administrators to properly control access and security and meet service level agreements. |
Alteryx Connect
Alteryx Connect is a collaborative data exploration platform for the enterprise. Alteryx Connect empowers business analysts to find, manage, understand, and collaborate on the data that resides in their organization. Alteryx Connect combines data cataloging with social collaboration to accelerate insights by connecting to data, analytics, and content. Key capabilities include:
| • | Asset Catalog. Allows business analysts to assemble information in one place by collecting metadata from information systems, business intelligence reports, and workflows in a comprehensive and fully indexed data store. |
| • | Business Glossary. Defines standard business terms within an organization in a data dictionary and links them to assets in the catalog to ensure consistent use, as well as identify relevant sources for each item. |
| • | Data Discovery. Allows users to run a comprehensive search of content in the system and sort results by certification or user rating. |
| • | Data Enrichment and Collaboration. Unlocks knowledge in an organization using social techniques to gather information about data systems. Annotates, discusses, and rates information assets to provide business context and enables the organization with relevant data. |
| • | Certification and Trust. Understands the trustworthiness of information assets through certification, lineage, and versioning. |
Alteryx Promote
Alteryx Promote is an analytics model management product for the enterprise. Alteryx Promote makes deploying, managing, and monitoring predictive models easier and faster. As an end-to-end data science model production system, Alteryx Promote allows data scientists and analytics teams to build, manage, and deploy predictive models to production faster and more reliably via a code-friendly and code-free environment. Key capabilities include:
| • | Model Deployment. Deploys predictive models easily for users, including data scientists and business analysts, by utilizing the code-free environment of Alteryx Designer to build and deploy models. Delivers and deploys R and Python models via standard REST API without recoding, making models immediately accessible. |
| • | Embed Models. Embeds predictive models in any business application capable of making REST API requests, including CRM systems, web and mobile applications, and internal applications. |
| • | Real-time Scoring. Executes real-time predictions in consumer-facing applications or uses batch mode for scoring from within other workflows. |
10
Table of Contents
| • | Model Management. Ensures that analytic models deliver quality and insights by using model versioning throughout the production process, from development to staging and production. |
| • | Monitoring. Understands the ongoing performance and health of production-based analytic models to ensure their effectiveness. |
Our Technology
Underpinning our platform is a set of technological innovations that make robust data analytics easy through an in-memory engine, sophisticated analytic models, and an open and modular core:
In-Memory Engine
Our in-memory engine is optimized to process data within RAM and can utilize disk, when necessary, as temporary virtual memory. This facilitates significantly faster and more secure processing of data than traditional disk-based mechanisms while ensuring that the source data remains unaltered and is not duplicated. Key features of our engine include:
| • | Connected. Business analysts can rapidly connect to data in existing formats and locations, reducing the need for time-consuming data transformation processes that typically require IT personnel. |
| • | Non-persisted. Our engine leverages non-persisted data pipelines to enable users to process large amounts of data securely while applying complex logic every time they run an analytic workflow. |
| • | Scaled-out. While most workflows can be run on any single desktop or laptop, when greater processing capability is required, workloads can be pushed to a server or cluster of servers, including Hadoop or Spark clusters. In addition to our high speed in-memory processing capabilities, our platform enables in-database processing to take advantage of computing resources where the data resides for certain use cases. |
Sophisticated Analytic Models
We enable business analysts to run analytics ranging from basic to highly complex, including predictive, prescriptive, and spatial analytics. Specifically, we enable predictive analytics through utilization of R, an open source programming language and software environment for statistical computing, and Python, a popular programming language for analytics with many publicly available packages. Our capabilities allow transparency and editing of the R and Python code without requiring prior coding experience. In addition, in-database processing enables analysts to scale predictive analytics and harness the value of large sets of data without moving the data out of a database, improving predictive model development performance over traditional approaches. Deep geo-spatial tools, such as a drive time engine, create the basis for performing location-based analysis.
Open and Modular Core
Our platform is built with an open and modular core that enables additional functions and programming models to interact with it. For example, our platform can utilize R for advanced analytics while providing a simple drag-and-drop interface that abstracts the complexity of the underlying code. For sophisticated business analysts, the underlying code is available for review and adjustment. The integration of our platform and R takes advantage of segmented, but integrated main-memory resources to ensure seamless, fast operations. More recently, we introduced the JavaScript V8 engine for our platform in a similar capacity. This enables the introduction of new HTML5 UI, Server-side Javascript, and JSON/REST APIs to all fuel the innovation being driven from our platform.
11
Table of Contents
Our Customers
Organizations of all sizes and across a wide variety of industries have adopted our platform. As of December 31, 2017, we had approximately 3,400 customers in more than 70 countries, including over 400 of the Global 2,000 companies. Our customer base has grown from 1,398 customers as of December 31, 2015 to 3,392 customers as of December 31, 2017.
Our customers include Ford, Kaiser Foundation Health Plan, Knight Transportation, Nike, Southwest Airlines, Tableau, and Tesco. Our platform is also leveraged by leading management consulting organizations such as Accenture, Bain, and BCG.
No customer represented more than 10% of our revenue in the years ended December 31, 2017, 2016, and 2015.
Support and Training
Although our platform is designed to operate on a self-service basis, we also provide technical support, instruction, and customer service to further our customer experience. Our customer support team is available to assist with questions about installation, licensing, workflow development, technical and functional matters, and our APIs and software development kit. Additionally, we provide our customers with support five days a week across multiple geographies. We also rely on our engaged user community to enhance the support experience of our customers through our community webpage.
In order to facilitate adoption and rapid benefits from the use of our platform, we offer free online training through our website that includes hundreds of hours of training videos and sample analytic workflows. We also provide a variety of fee-based training options ranging from instructor-led courses in a traditional classroom setting to online courses.
Our Community
We have built a strong and growing community of employees, users, customers, potential customers, and channel partners who are passionate about our platform and mission. The purpose of our community is to create a support channel for all constituents to gain valuable insights from one another, collaborate and share their experiences and ideas, and innovate around our platform.
Our online community currently offers:
| • | discussions and knowledge bases that help users, customers, and channel partners learn about topics of interest, ask questions, and share ideas and insights; |
| • | user groups, which are independent volunteer organizations that provide a platform for users to meet locally throughout the year and provide other users with an opportunity to network with peers and share ideas, experiences, and best practices; |
| • | an avenue for users, customers, and channel partners to share product suggestions with us; and |
| • | blogs and news and events portals. |
We also organize events to engage and foster our user community. Attendance at our annual U.S. Inspire customer conference has grown from over 270 attendees in 2012 to over 1,800 attendees in 2017. We also had nearly 1,000 attendees at our Inspire Europe conference. At such events, our users, customers, potential customers, and channel partners have the opportunity to network, learn best practices, attend training sessions
12
Table of Contents
and workshops, and present their questions and suggestions directly to our software developers, executives, and other employees. We also host roadshows and workshops domestically and internationally with our channel partners to teach our users how self-service data analytics simplifies and automates the analysis of data.
Employees and Culture
Our corporate culture is a critical component of our success. Our employees, who we refer to as associates, are the lifeblood of our company and we strive to create an environment where they can advance their careers, work hard, and have fun at the same time. Our culture focuses on fostering an environment of growth and development and we offer a series of collaborative activities for our employees including leadership activities and teambuilding workshops. Each day our employees bring passion and energy towards further developing our platform and serving our customers by exemplifying the following core values: customer-centric; innovative; accountable; character; and compassion.
Our “Alteryx for Good” program provides our employees with the opportunity to use volunteer hours each year to partner with charity organizations of their choice to make a difference. The program also provides universities, not-for-profit organizations, and government entities the opportunity to obtain a license to use our platform to help them achieve their goals.
As of December 31, 2017, we had 555 full-time employees, including 95 employees located outside the United States. None of our employees are represented by a labor union or covered by a collective bargaining agreement. We have not experienced any work stoppages, and we consider our relations with our employees to be good.
Sales and Marketing
Our sales and marketing teams work closely together to increase market awareness, drive demand for our platform, and cultivate customer relationships to drive revenue growth.
Sales
We sell our platform through our direct sales organization and indirect channel partners internationally. Our sales strategy relies on a “land and expand” model. We offer fully functional free trial versions of our platform on our website with free trials becoming leads for our marketing and sales teams. Our initial deployments with new customers are typically individual business analysts focused on a single use case such as data preparation and data blending. These initial deployments frequently expand across departments, divisions, and geographies as additional use cases are identified and deployed, and through word-of-mouth, collaboration, and standardization of business processes. As our platform expands throughout organizations and becomes increasingly strategic in nature, our platform is recognized by corporate executives, IT personnel, and organization leaders as the solution to their analytics needs.
Our sales organization is comprised of inside sales teams dedicated to selling to new customers and direct field sales teams responsible for identifying and maximizing future expansion opportunities with our existing customers. Our inside sales and direct field sales teams are tightly integrated to promote efficient customer acquisition and seamless growth for expansion opportunities. Our customer success and support organizations are responsible for post-sales training and support, maintaining customer relationships, and renewing existing contracts.
The majority of our domestic sales are through our direct sales organization. We serve the Asia-Pacific, Europe, the Middle East, and Africa, and Latin America regions, and select other emerging countries through our direct sales organization and a variety of channel partners, including VARs and management consulting firms.
13
Table of Contents
Marketing
Our marketing organization is responsible for increasing awareness of and generating demand for our platform, creating high quality leads for our salesforce through a mix of volume demand generation and account-based marketing, and fostering our community of users. A central focus of our marketing efforts is to drive awareness of our platform and increase website traffic. These goals are intended to increase downloads of our free trials of our platform and encourage use of our free online training, which are integral parts of our customer acquisition process. We utilize a wide range of online and offline marketing initiatives including our website, social media, paid search, email, webinars, channel partner events, and field events often with analytic leaders and data scientists. Our annual U.S. and European Inspire customer conferences play a key role in providing current and prospective customers with a better understanding of our platform through interactions with peers, training, and the highlighting of customer use cases and best practices.
Our sales and marketing expense was $66.4 million, $57.6 million, and $43.2 million for the years ended December 31, 2017, 2016, and 2015, respectively.
Strategic Partnerships
We have cultivated strong relationships with channel partners to help us extend the reach of our sales and marketing efforts, especially internationally. Our partnerships are primarily with technology alliances, system integrators, management consulting firms, and a growing network of VARs.
Technology Alliances
Our technology partner ecosystem consists of independent software vendors, cloud and data platforms, and offerings that enhance and extend our platform. We work closely with over 20 technology partners to deliver a seamless analytic user experience. We have optimized connectors for more than 80 data sources, including many from Amazon, Cloudera, Databricks, Google, Hortonworks, IBM, Marketo, Microsoft, MongoDB, NetSuite, Oracle, Salesforce, and SAP. We natively support output to visualization and dashboard programs such as those offered by Microsoft, Qlik, or Tableau.
System Integrators and Management Consulting Firms
Systems integrators and management consulting firms provide advisory, managed, and implementation services to our customers across all market segments. Our over 60 systems integrators and management consulting firms as of December 31, 2017 leverage their deep analytic expertise in concert with us to solve complex business challenges while generating reusable analytic intellectual property.
Value Added Resellers
VARs bring product expertise and implementation best practices to our customers globally. As of December 31, 2017, we had over 200 VARs that create scale for our platform through their network of trained consultants, on-point analytic services, and deep domain expertise. They provide vertical expertise and technical advice in addition to reselling or bundling our software. Our reseller program is designed to scale growth, help generate new opportunities, optimize customer experience and care, increase profitability, and increase sales efficiency.
Research and Development
Our research and development efforts focus on improving current technology, developing new technologies in current and adjacent markets, and supporting existing customer deployments. Our research and development
14
Table of Contents
team, which consisted of 160 employees as of December 31, 2017 located primarily in Broomfield, Colorado, the Czech Republic, and the United Kingdom, is comprised of dedicated research employees, software engineers, quality assurance engineers, user experience experts, site and site operations engineers, and product managers. We leverage agile development methodologies and work with the latest technologies, resulting in a dynamic, state of the art, automated software development process that has allowed us to deliver high-quality products and services and adapt to market changes and new requirements quickly.
Our research and development expense was $29.3 million, $17.5 million, and $11.1 million for the years ended December 31, 2017, 2016, and 2015, respectively.
Competition
The market for self-service data analytics solutions is new and rapidly evolving. In many cases, our primary competitors are manual, spreadsheet-driven processes and custom built approaches in which potential customers have made significant investments. In addition, we compete with large software companies, including providers of traditional business intelligence tools, that offer one or more capabilities that are competitive with our platform. These capabilities include data preparation and/or advanced analytic modeling tools from IBM, Microsoft, Oracle, SAP, and SAS Institute. Other large software and data visualization companies already provide products and services in adjacent markets and may decide to enter our market. We could also face competition from new market entrants, some of whom might be our current technology partners of ours. In addition, some business analytics software companies offer niche data preparation options that are competitive with some of the features within our platform, such as MicroStrategy and TIBCO Software.
Many of our competitors, particularly the large software companies named above, have longer operating histories, significantly greater financial, technical, marketing, distribution, professional services, or other resources and greater name recognition than us. We expect competition to increase as other established and emerging companies enter the self-service data analytics software market, as customer requirements evolve, and as new products and services and technologies are introduced.
We believe the principal competitive factors in our market include:
| • | ease of use; |
| • | platform features, quality, functionality, reliability, performance, and effectiveness; |
| • | ability to automate analytical tasks or processes; |
| • | ability to integrate with other technology infrastructures; |
| • | vision for the market and product innovation; |
| • | software analytics expertise; |
| • | total cost of ownership; |
| • | adherence to industry standards and certifications; |
| • | strength of sales and marketing efforts; |
| • | brand awareness and reputation; and |
| • | customer experience, including support. |
We believe we compete favorably with our competitors on the basis of the factors described above. Our ability to remain competitive will largely depend on our ongoing performance and quality of our platform.
15
Table of Contents
Intellectual Property
Intellectual property is an important aspect of our business, and we seek protection for our intellectual property as appropriate. We currently rely on a combination of copyrights, trademarks, trade secrets, confidentiality procedures, contractual commitments, and other legal rights to protect our intellectual property. We also currently have four patent applications pending in the United States. We pursue the registration of our domain names and trademarks and service marks in the United States and in certain locations outside the United States. Additionally, we generally require employees, consultants, customers, suppliers, and channel partners to execute confidentiality agreements with us that restrict the disclosure of our intellectual property. We also generally require our employees and consultants to execute employee intellectual property protection agreements with us that protect our intellectual property rights.
Intellectual property laws, procedures, and restrictions provide only limited protection and any of our intellectual property rights may be challenged, invalidated, circumvented, infringed, or misappropriated. Further, the laws of certain countries do not protect proprietary rights to the same extent as the laws of the United States and, therefore, in certain jurisdictions, we may be unable to protect our proprietary technology. Despite our efforts to protect our proprietary technology and our intellectual property rights, unauthorized parties may attempt to copy or obtain and use our technology to develop applications with the same functionality as our applications. Policing unauthorized use of our technology and intellectual property rights is difficult.
We expect that software and other applications in our industry may be subject to third-party infringement claims as the number of competitors grows and the functionality of applications in different industry segments overlaps. Any of these third parties might make a claim of infringement against us at any time.
Corporate Information
We were organized in California in March 1997 as SRC, LLC. We changed our name to Alteryx, LLC in March 2010 and converted into a Delaware corporation in March 2011 under the name Alteryx, Inc. Our principal executive offices are located at 3345 Michelson Drive, Suite 400, Irvine, California 92612, and our telephone number is (888) 836-4274. Our website address is www.alteryx.com. The information contained on, or that can be accessed through, our website is not incorporated by reference into, and is not a part of, this Annual Report.
Unless the context indicates otherwise, the terms “Alteryx,” “the Company,” “we,” “us,” and “our” refer to Alteryx, Inc., a Delaware corporation, together with its consolidated subsidiaries, unless otherwise noted.
Alteryx, the Alteryx logo, Alteryx Designer, Alteryx Server, Alteryx Analytics Gallery, Alteryx Connect, Alteryx Promote, Semanta, Yhat, and other registered or common law trade names, trademarks, or service marks of Alteryx appearing in this Annual Report are the property of Alteryx. This Annual Report contains additional trade names, trademarks, and service marks of other companies that are the property of their respective owners. We do not intend our use or display of other companies’ trade names, trademarks or service marks to imply a relationship with, or endorsement or sponsorship of us, by these other companies. Solely for convenience, our trademarks and tradenames referred to in this Annual Report appear without the ® and ™ symbols, but those references are not intended to indicate, in any way, that we will not assert, to the fullest extent under applicable law, our rights, or the right of the applicable licensor, to these trademarks and tradenames.
We are an “emerging growth company,” as defined in the Jumpstart Our Business Startups Act of 2012, and, as such, we have elected to comply with certain reduced public company reporting requirements. We will remain an “emerging growth company” until the earliest of (i) the last day of the fiscal year following the fifth anniversary of the completion of our initial public offering, (ii) the last day of the first fiscal year in which our annual gross revenue is $1.07 billion or more, (iii) the date on which we have, during the previous rolling three-
16
Table of Contents
year period, issued more than $1 billion in non-convertible debt securities or (iv) the date on which we are deemed to be a “large accelerated filer” as defined in the Securities Exchange Act of 1934, as amended, or the Exchange Act. We refer to the Jumpstart Our Business Startups Act of 2012 herein as the “JOBS Act,” and references herein to “emerging growth company” are intended to have the meaning associated with it in the JOBS Act.
Available Information
We file annual reports on Form 10-K, quarterly reports on Form 10-Q, current reports on Form 8-K, and amendments to reports filed or furnished pursuant to Sections 13(a), 14 and 15(d) of the Exchange Act. The public may obtain these filings at the Securities and Exchange Commission, or SEC, Public Reference Room at 100 F Street, NE, Washington, DC 20549 or by calling the SEC at 1-800-SEC-0330. The SEC also maintains a website at http://www.sec.gov that contains reports, and other information regarding us and other companies that file materials with the SEC electronically. Copies of our reports on Forms 10-K, Forms 10-Q and Forms 8-K, may be obtained, free of charge, electronically through our corporate website at www.alteryx.com as soon as reasonably practicable after we file such material electronically with, or furnish to, the SEC.
An investment in our Class A common stock involves a high degree of risk. You should carefully consider the risks described below and the other information in this Annual Report and in our other public filings before making an investment decision. Our business, prospects, financial condition, or operating results could be harmed by any of these risks, as well as other risks not currently known to us or that we currently consider immaterial. If any of such risks and uncertainties actually occurs, our business, prospects, financial condition, or operating results could differ materially from the plans, projections, and other forward-looking statements included in the section titled “Management’s Discussion and Analysis of Financial Condition and Results of Operations” and elsewhere in this Annual Report and in our other public filings. The trading price of our Class A common stock could decline due to any of these risks, and, as a result, you may lose all or part of your investment.
Risks Related to Our Business and Industry
We have a limited operating history under our current business model, which makes it difficult to evaluate our business and prospects and increases the risks associated with your investment.
Although we have been operating our business since 1997, we changed our business model significantly and first launched our software platform in 2010. Further, since 2013, we have licensed our platform to customers under a subscription-based model. As a result, our business model has not been fully proven, and we have only a limited operating history with our new business model to evaluate our business and future prospects, which subjects us to a number of uncertainties, including our ability to plan for and model future growth. Our historical revenue growth should not be considered indicative of our future performance. We have encountered and will continue to encounter risks and difficulties frequently experienced by growing companies in rapidly changing industries, including achieving market acceptance of our platform, attracting and retaining customers, growing partnerships and distribution of our platform, increasing competition, and increasing expenses as we continue to grow our business. We cannot assure you that we will be successful in addressing these and other challenges we may face in the future and if we do not manage these risks successfully, our business may be adversely affected. In addition, we may not achieve sufficient revenue to achieve or maintain positive cash flow from operations or profitability in any given period.
17
Table of Contents
We have a history of losses, anticipate increasing our operating expenses in the future, and may not achieve or sustain profitability.
We have incurred net losses in each fiscal year since our inception, including net losses of $17.5 million, $24.3 million, and $21.5 million in the years ended December 31, 2017, 2016, and 2015, respectively. As of December 31, 2017, we had an accumulated deficit of $103.5 million. We expect our operating expenses to increase substantially in the foreseeable future as we implement initiatives designed to grow our business, including increasing our overall customer base and expanding sales within our current customer base, continuing to penetrate international markets, investing in research and development to improve the capabilities of our platform, growing our distribution channels and channel partner ecosystem, deepening our user community, hiring additional employees, expanding our operations and infrastructure, both domestically and internationally, and in connection with legal, accounting, and other administrative expenses related to operating as a public company. These efforts may prove more expensive than we currently anticipate, and we may not succeed in increasing our revenue sufficiently, or at all, to offset these higher expenses and to achieve and sustain profitability. Growth of our revenue may slow or revenue may decline for a number of possible reasons, including a decrease in our ability to attract and retain customers, a failure to increase our number of channel partners, increasing competition, decreasing growth of our overall market, and an inability to timely and cost-effectively introduce new products and services that are favorably received by customers and partners. If we are unable to meet these risks and challenges as we encounter them, our business and operating results may be adversely affected, and even if we are able to achieve profitability, we may not be able to sustain or increase such profitability.
Our operating results may fluctuate from quarter to quarter, which makes our future results difficult to predict.
Our quarterly operating results have fluctuated in the past and may fluctuate in the future. Additionally, we have a limited operating history with the current scale of our business, which makes it difficult to forecast our future results. As a result, you should not rely upon our past quarterly operating results as indicators of future performance. You should take into account the risks and uncertainties frequently encountered by companies in rapidly evolving markets. Our operating results in any given quarter can be influenced by numerous factors, many of which are unpredictable or are outside of our control, including:
| • | our ability to generate significant revenue from new products and services; |
| • | our ability to maintain and grow our customer base; |
| • | our ability to expand our number of partners and distribution of our platform; |
| • | the development and introduction of new products and services by us or our competitors; |
| • | increases in and timing of operating expenses that we may incur to grow and expand our operations and to remain competitive; |
| • | seasonal purchasing patterns of our customers; |
| • | the timing of our Inspire customer conferences; |
| • | costs related to the acquisition of businesses, talent, technologies, or intellectual property, including potentially significant amortization costs and possible write-downs; |
| • | actual or perceived failures or breaches of security or privacy, and the costs associated with remediating any actual failures or breaches; |
| • | adverse litigation, judgments, settlements, or other litigation-related costs; |
| • | changes in the legislative or regulatory environment, such as with respect to privacy; |
| • | fluctuations in currency exchange rates and changes in the proportion of our revenue and expenses denominated in foreign currencies; and |
| • | general economic conditions in either domestic or international markets. |
18
Table of Contents
We have been growing rapidly and expect to continue to invest in our growth for the foreseeable future. If we are unable to manage our growth effectively, our revenue and profits could be adversely affected.
We have experienced rapid growth in a relatively short period of time. Our revenue grew from $53.8 million in the year ended December 31, 2015 to $85.8 million in the year ended December 31, 2016 to $131.6 million in the year ended December 31, 2017. Our number of full-time employees has increased significantly over the last few years, from 206 employees as of December 31, 2014 to 555 employees as of December 31, 2017. During this period, we also established operations in a number of countries outside the United States.
We plan to continue to expand our operations and headcount significantly, and we anticipate that further significant expansion will be required. In addition, we sell our platform to customers in more than 70 countries and have employees in the United States, Canada, the Czech Republic, France, Germany, Singapore, and the United Kingdom. We plan to continue to expand our operations into other countries in the future, which will place additional demands on our resources and operations. Our future operating results depend to a large extent on our ability to manage this expansion and growth successfully. Sustaining our growth will place significant demands on our management as well as on our administrative, operational, and financial resources. To manage our growth, we must continue to improve our operational, financial, and management information systems and expand, motivate, and manage our workforce. If we are unable to manage our growth successfully without compromising our quality of service or our profit margins, or if new systems that we implement to assist in managing our growth do not produce the expected benefits, our revenue and profits could be harmed. Risks that we face in undertaking future expansion include:
| • | effectively recruiting, integrating, training, and motivating a large number of new employees, including our direct sales force and engineering and development employees, while retaining existing employees, maintaining the beneficial aspects of our corporate culture, and effectively executing our business plan; |
| • | satisfying existing customers and attracting new customers; |
| • | successfully improving and expanding the capabilities of our platform and introducing new products and services; |
| • | expanding our channel partner ecosystem; |
| • | controlling expenses and investments in anticipation of expanded operations; |
| • | implementing and enhancing our administrative, operational, and financial infrastructure, systems, and processes; |
| • | addressing new markets; and |
| • | expanding operations in the United States and international regions. |
A failure to manage our growth effectively could harm our business, operating results, financial condition, and ability to market and sell our platform.
Further, due to our recent rapid growth, we have limited experience operating at our current scale and potentially at a larger scale, and as a result, it may be difficult for us to fully evaluate future prospects and risks. Our recent and historical growth should not be considered indicative of our future performance. We have encountered in the past, and will encounter in the future, risks and uncertainties frequently experienced by growing companies in rapidly changing industries. If our assumptions regarding these risks and uncertainties, which we use to plan and operate our business, are incorrect or change, or if we do not address these risks successfully, our financial condition and operating results could differ materially from our expectations, our growth rates may slow and our business would by adversely impacted.
19
Table of Contents
Our revenue growth and ability to achieve and sustain profitability depends on being able to expand our direct sales force and increase the productivity of our sales force successfully.
To date, most of our revenue has been attributable to the efforts of our direct sales force in the United States. In order to increase our revenue and achieve and sustain profitability, we must increase the size of our direct sales force, both in the United States and internationally, to generate additional revenue from new and existing customers. We intend to substantially further increase our number of direct sales professionals.
We believe that there is significant competition for sales personnel with the skills and technical knowledge that we require. Our ability to achieve significant revenue growth will depend, in large part, on our success in recruiting, training, and retaining sufficient numbers of direct sales personnel to support our growth. New hires require significant training and typically take six months or more to achieve full productivity. Our recent hires and planned hires may not become productive as quickly as we expect and if our new sales employees do not become fully productive on the timelines that we have projected or at all, our revenue will not increase at anticipated levels and our ability to achieve long term projections may be negatively impacted. We may also be unable to hire or retain sufficient numbers of qualified individuals in the markets where we do business or plan to do business. Furthermore, hiring sales personnel in new countries requires additional set up and upfront costs that we may not recover if the sales personnel fail to achieve full productivity. In addition, as we continue to grow rapidly, a large percentage of our sales force will be new to our company and our platform, which may adversely affect our sales if we cannot train our sales force quickly or effectively. Attrition rates may increase, and we may face integration challenges as we continue to seek to aggressively expand our sales force. If we are unable to hire and train sufficient numbers of effective sales personnel, or the sales personnel are not successful in obtaining new customers or increasing sales to our existing customer base, our business will be adversely affected.
We periodically change and make adjustments to our sales organization in response to market opportunities, competitive threats, management changes, product introductions or enhancements, acquisitions, sales performance, increases in sales headcount, cost levels and other internal and external considerations. Any future sales organization changes may result in a temporary reduction of productivity, which could negatively affect our rate of growth. In addition, any significant change to the way we structure our compensation of our sales organization may be disruptive and may affect our revenue growth.
If we cannot maintain our corporate culture as we grow, we could lose the innovation, teamwork, passion, and focus on execution that we believe contribute to our success, and our business may be harmed.
We believe that our corporate culture has been vital to our success, including in attracting, developing, and retaining personnel, as well as our customers. As we continue to grow and face industry challenges, it may become more challenging to maintain that culture. In addition, we plan to expand our international operations into other countries in the future, which may impact our culture as we seek to find, hire, and integrate additional employees while maintaining our corporate culture. If we are unable to maintain our corporate culture, we could lose the innovation, passion, and dedication of our team and as a result, our business and ability to focus on our corporate objectives may be harmed.
If the market for analytics products and services fails to grow as we expect, or if businesses fail to adopt our platform, our business, operating results, and financial condition could be adversely affected.
Since 2013, nearly all our revenue has come from sales of our subscription-based software platform. We expect these sales to account for a large portion of our revenue for the foreseeable future. Although demand for analytics products and services has grown in recent years, the market for analytics products and services continues to evolve and the secular shift towards self-service analytics may not be as significant as we expect. We cannot be sure that this market will continue to grow or, even if it does grow, that businesses will adopt our platform. Our future success will depend in large part on our ability to further penetrate the existing market for business analytics software, as well as the continued growth and expansion of what we believe to be an emerging
20
Table of Contents
market for analytics products and services that are faster, easier to adopt, easier to use, and more focused on self-service capabilities. Our ability to further penetrate the business analytics market depends on a number of factors, including the cost, performance, and perceived value associated with our platform, as well as customers’ willingness to adopt a different approach to data analysis. We have spent, and intend to keep spending, considerable resources to educate potential customers about analytics products and services in general and our platform in particular. However, we cannot be sure that these expenditures will help our platform achieve any additional market acceptance. Furthermore, potential customers may have made significant investments in legacy analytics software systems and may be unwilling to invest in new products and services. In addition, resistance from consumer and privacy groups to increased commercial collection and use of data on spending patterns and other personal behavior and governmental restrictions on the collection and use of personal data may impair the further growth of this market by reducing the value of data to organizations, as may other developments. If the market fails to grow or grows more slowly than we currently expect or businesses fail to adopt our platform, our business, operating results, and financial condition could be adversely affected.
We derive substantially all of our revenue from our software platform, and our future growth is dependent on its success.
Since 2013, nearly all of our revenue has come from sales of our subscription-based software platform. We expect these sales to account for substantially all of our revenue for the foreseeable future. As such, the continued growth in market demand for our platform is critical to our continued success. We recently announced two new products for our software platform, Alteryx Connect and Alteryx Promote, but cannot be certain that either product will generate significant revenue, if any. In addition, these products are designed to be used with our Alteryx Server product and will not be sold independently. Accordingly, our business and financial results will continue to be substantially dependent on our single software platform.
If we are unable to attract new customers and expand sales to existing customers, both domestically and internationally, our revenue growth could be slower than we expect and our business may be harmed.
Our future revenue growth depends in part upon increasing our customer base. Our ability to achieve significant growth in revenue in the future will depend, in large part, upon the effectiveness of our marketing efforts, both domestically and internationally, and our ability to attract new customers. This may be particularly challenging where an organization has already invested substantial personnel and financial resources to integrate traditional data analytics tools into its business, as such organization may be reluctant or unwilling to invest in new products and services. If we fail to attract new customers and maintain and expand those customer relationships, our revenue will grow more slowly than expected and our business will be harmed.
Our future revenue growth also depends upon expanding sales and renewals of subscriptions to our platform with existing customers. If our customers do not purchase additional licenses or capabilities, our revenue may grow more slowly than expected, may not grow at all or may decline. Additionally, increasing incremental sales to our current customer base requires increasingly sophisticated and costly sales efforts that are targeted at senior management. For example, during the years ended December 31, 2017 and 2016, sales and marketing expenses represented 50% and 67% of our revenue, respectively. We plan to continue expanding our sales efforts, both domestically and internationally, but we may be unable to hire qualified sales personnel, may be unable to successfully train those sales personnel that we are able to hire, and sales personnel may not become fully productive on the timelines that we have projected or at all. Additionally, although we dedicate significant resources to sales and marketing programs, including Internet and other online advertising, these sales and marketing programs may not have the desired effect and may not expand sales. We cannot assure you that our efforts would result in increased sales to existing customers, and additional revenue. If our efforts to upsell to our customers are not successful, our business and operating results would be adversely affected.
Our customers generally enter into license agreements with one to three year subscription terms and have no obligation or contractual right to renew their subscriptions after the expiration of their initial subscription
21
Table of Contents
period. Moreover, our customers that do renew their subscriptions may renew for lower subscription amounts or for shorter subscription periods. Customer renewal rates may decline or fluctuate as a result of a number of factors, including the breadth of early deployment, reductions in our customers’ spending levels, our pricing or pricing structure, the pricing or capabilities of products or services offered by our competitors, our customers’ satisfaction or dissatisfaction with our platform, or the effects of economic conditions. If our customers do not renew their agreements with us, or renew on terms less favorable to us, our revenue may decline.
If we are unable to develop and release product and service enhancements and new products and services to respond to rapid technological change in a timely and cost-effective manner, our business, operating results, and financial condition could be adversely affected.
The market for our platform is characterized by rapid technological change, frequent new product and service introductions and enhancements, changing customer demands, and evolving industry standards. The introduction of products and services embodying new technologies can quickly make existing products and services obsolete and unmarketable. Analytics products and services are inherently complex, and it can take a long time and require significant research and development expenditures to develop and test new or enhanced products and services. The success of any enhancements or improvements to our platform or any new products and services depends on several factors, including timely completion, competitive pricing, adequate quality testing, integration with existing technologies and our platform, and overall market acceptance. We cannot be sure that we will succeed in developing, marketing, and delivering on a timely and cost-effective basis enhancements or improvements to our platform or any new products and services that respond to technological change or new customer requirements, nor can we be sure that any enhancements or improvements to our platform or any new products and services will achieve market acceptance. Any new products that we develop may not be introduced in a timely or cost-effective manner, may contain errors or defects, or may not achieve the broad market acceptance necessary to generate sufficient revenue. Moreover, even if we introduce new products and services, we may experience a decline in revenue of our existing products and services that is not offset by revenue from the new products or services. For example, customers may delay making purchases of new products and services to permit them to make a more thorough evaluation of these products and services or until industry and marketplace reviews become widely available. Some customers may hesitate migrating to a new product or service due to concerns regarding the complexity of migration and product or service infancy issues on performance. In addition, we may lose existing customers who choose a competitor’s products and services rather than migrate to our new products and services. This could result in a temporary or permanent revenue shortfall and adversely affect our business.
Further, the emergence of new industry standards related to analytics products and services may adversely affect the demand for our platform. This could happen if new Internet standards and technologies or new standards in the field of operating system support emerged that were incompatible with customer deployments of our platform. For example, if we are unable to adapt our platform on a timely basis to new database standards, the ability of our platform to access customer databases and to analyze data within such databases could be impaired. In addition, because part of our platform is cloud-based, we need to continually enhance and improve our platform to keep pace with changes in Internet-related hardware, software, communications, and database technologies and standards.
Any failure of our platform to operate effectively with future infrastructure platforms and technologies could reduce the demand for our platform. If we are unable to respond to these changes in a timely and cost-effective manner, our platform may become less marketable, less competitive, or obsolete, and our operating results may be adversely affected.
Moreover, software-as-a-service, or SaaS, business models have become increasingly demanded by customers and adopted by other software providers, including our competitors. While part of our platform is cloud-based, most of our platform is currently deployed on premise and therefore, if customers demand that our platform be provided through a SaaS business model, we would be required to make additional investments to
22
Table of Contents
our infrastructure in order to be able to more fully provide our platform through a SaaS model so that our platform remains competitive. Such investments may involve expanding our data centers, servers, and networks and increasing our technical operations and engineering teams.
The competitive position of our software platform depends in part on its ability to operate with third-party products and services, and if we are not successful in maintaining and expanding the compatibility of our platform with such third-party products and services, our business, financial position, and operating results could be adversely impacted.
The competitive position of our software platform depends in part on its ability to operate with products and services of third parties, software services and infrastructure. As such, we must continuously modify and enhance our platform to adapt to changes in hardware, software, networking, browser, and database technologies. In the future, one or more technology companies may choose not to support the operation of their hardware, software, or infrastructure, or our platform may not support the capabilities needed to operate with such hardware, software, or infrastructure. In addition, to the extent that a third party were to develop software or services that compete with ours, that provider may choose not to support our platform. We intend to facilitate the compatibility of our software platform with various third-party hardware, software, and infrastructure by maintaining and expanding our business and technical relationships. If we are not successful in achieving this goal, our business, financial condition, and operating results could be adversely impacted.
We face intense and increasing competition, and we may not be able to compete effectively, which could reduce demand for our platform and adversely affect our business, revenue growth, and market share.
The market for self-service data analytics solutions is new and rapidly evolving. In many cases, our primary competitors are manual, spreadsheet-driven processes or more traditional custom built approaches in which potential customers have made significant investments. In addition, we compete with large software companies, including providers of traditional business intelligence tools that offer one or more capabilities that are competitive with our platform, such as International Business Machines Corporation, Microsoft Corporation, Oracle Corporation, SAP SE, and SAS Institute Inc. Moreover, business analytics software companies offer capabilities that are competitive with a subset of the solutions we provide, such as MicroStrategy Incorporated and TIBCO Software Inc.
In addition, other large software companies, such as salesforce.com, inc. and Amazon.com, Inc., and data visualization companies, such as Tableau Software, Inc. and Qlik Technology, Inc., already provide products and services in adjacent markets and may decide to enter into our market. We also compete with open source initiatives and custom development efforts. We could also face competition from new market entrants, some of whom might be current technology partners of ours. We expect competition to increase as other established and emerging companies enter the business analytics software market, as customer requirements evolve and as new products and services and technologies are introduced.
Many of our current and potential competitors, particularly the large software companies named above, have longer operating histories, significantly greater financial, technical, marketing, distribution, professional services, or other resources and greater name recognition than we do. In addition, many of our current and potential competitors have strong relationships with current and potential customers and extensive knowledge of the business analytics industry. As a result, our current and potential competitors may be able to respond more quickly and effectively than we can to new or changing opportunities, technologies, standards, or customer requirements or devote greater resources than we can to the development, promotion, and sale of their products and services. Moreover, many of these companies are bundling their analytics products and services into larger deals or subscription renewals, often at significant discounts as part of a larger sale. In addition, some current and potential competitors may offer products or services that address one or a limited number of functions at lower prices or with greater depth than our platform. Our current and potential competitors may develop and market new technologies with comparable functionality to our platform. We may experience fewer customer orders,
23
Table of Contents
reduced gross margins, longer sales cycles, and loss of market share. This could lead us to decrease prices, implement alternative pricing structures, or introduce products and services available for free or a nominal price in order to remain competitive. We may not be able to compete successfully against current and future competitors, and our business, operating results, and financial condition will be harmed if we fail to meet these competitive pressures.
Our ability to compete successfully in our market depends on a number of factors, both within and outside of our control. Some of these factors include: ease of use; platform features, quality, functionality, reliability, performance, and effectiveness; ability to automate analytical tasks or processes; ability to integrate with other technology infrastructures; vision for the market and product innovation; software analytics expertise; total cost of ownership; adherence to industry standards and certifications; strength of sales and marketing efforts; brand awareness and reputation; and customer experience, including support. Any failure by us to compete successfully in any one of these or other areas may reduce the demand for our platform, as well as adversely affect our business, operating results, and financial condition.
Moreover, current and future competitors may also make strategic acquisitions or establish cooperative relationships among themselves or with others, including our current or future technology partners. By doing so, these competitors may increase their ability to meet the needs of our customers or potential customers. In addition, our current or prospective indirect sales channel partners may establish cooperative relationships with our current or future competitors. These relationships may limit our ability to sell or certify our platform through specific distributors, technology providers, database companies, and distribution channels and allow our competitors to rapidly gain significant market share. These developments could limit our ability to obtain revenue from existing and new customers. If we are unable to compete successfully against current and future competitors, our business, operating results, and financial condition would be harmed.
If we fail to develop, maintain, and enhance our brand and reputation cost-effectively, our business and financial condition may be adversely affected.
We believe that developing, maintaining, and enhancing awareness and integrity of our brand and reputation in a cost-effective manner are important to achieving widespread acceptance of our platform and are important elements in attracting new customers and maintaining existing customers. We believe that the importance of our brand and reputation will increase as competition in our market further intensifies. Successful promotion of our brand will depend on the effectiveness of our marketing efforts, our ability to provide a reliable and useful platform at competitive prices, the perceived value of our platform, and our ability to provide quality customer support. Brand promotion activities may not yield increased revenue, and even if they do, the increased revenue may not offset the expenses we incur in building and maintaining our brand and reputation. We also rely on our customer base and community of end-users in a variety of ways, including to give us feedback on our platform and to provide user-based support to our other customers. If we fail to promote and maintain our brand successfully or to maintain loyalty among our customers, or if we incur substantial expenses in an unsuccessful attempt to promote and maintain our brand, we may fail to attract new customers and partners or retain our existing customers and partners and our business and financial condition may be adversely affected. Any negative publicity relating to our employees, partners, or others associated with these parties, may also tarnish our own reputation simply by association and may reduce the value of our brand. Damage to our brand and reputation may result in reduced demand for our platform and increased risk of losing market share to our competitors. Any efforts to restore the value of our brand and rebuild our reputation may be costly and may not be successful.
We use channel partners and if we are unable to establish and maintain successful relationships with them, our business, operating results, and financial condition could be adversely affected.
In addition to our direct sales force, we use channel partners such as technology alliances, system integrators, management consulting firms, and value-added resellers to sell and support our platform. Channel
24
Table of Contents
partners are becoming an increasingly important aspect of our business, particularly with regard to enterprise, governmental, and international sales. Our future growth in revenue and ability to achieve and sustain profitability depends in part on our ability to identify, establish, and retain successful channel partner relationships in the United States and internationally, which will take significant time and resources and involve significant risk. We intend to make significant investments to grow our indirect sales channel. If we are unable to maintain our relationships with these channel partners, or otherwise develop and expand our indirect distribution channel, our business, operating results, financial condition, or cash flows could be adversely affected.
We cannot be certain that we will be able to identify suitable indirect sales channel partners. To the extent we do identify such partners, we will need to negotiate the terms of a commercial agreement with them under which the partner would distribute our platform. We cannot be certain that we will be able to negotiate commercially-attractive terms with any channel partner, if at all. In addition, all channel partners must be trained to distribute our platform. In order to develop and expand our distribution channel, we must develop and improve our processes for channel partner introduction and training. If we do not succeed in identifying suitable indirect sales channel partners, our business, operating results, and financial condition may be adversely affected.
We also cannot be certain that we will be able to maintain successful relationships with any channel partners and, to the extent that our channel partners are unsuccessful in selling our platform, our ability to sell our platform and our business, operating results, and financial condition could be adversely affected. Our channel partners may offer customers the products and services of several different companies, including products and services that compete with our platform. Because our channel partners generally do not have an exclusive relationship with us, we cannot be certain that they will prioritize or provide adequate resources to selling our platform. Moreover, divergence in strategy by any of these channel partners may materially adversely affect our ability to develop, market, sell, or support our platform. We cannot assure you that our channel partners will continue to cooperate with us. In addition, actions taken or omitted to be taken by such parties may adversely affect us. In addition, we rely on our channel partners to operate in accordance with the terms of their contractual agreements with us. For example, our agreements with our channel partners limit the terms and conditions pursuant to which they are authorized to resell or distribute our platform and offer technical support and related services. We also typically require our channel partners to represent to us the dates and details of licenses sold through to our customers. If our channel partners do not comply with their contractual obligations to us, our business, operating results, and financial condition may be adversely affected.
In addition, all our sales to Federal government entities have been made indirectly through our channel partners. Government entities may have statutory, contractual, or other legal rights to terminate contracts with our channel partners for convenience or due to a default, and, in the future, if the portion of government contracts that are subject to renegotiation or termination at the election of the government entity are material, any such termination or renegotiation may adversely impact our future operating results. In the event of such termination, it may be difficult for us to arrange for another channel partner to sell our platform to these government entities in a timely manner, and we could lose sales opportunities during the transition. Government entities routinely investigate and audit government contractors’ administrative processes, and any unfavorable audit could result in the government entity refusing to renew its subscription to our platform, a reduction of revenue, or fines or civil or criminal liability if the audit uncovers improper or illegal activities.
We depend on technology and data licensed to us by third parties that may be difficult to replace or cause errors or failures that may impair or delay implementation of our products and services or force us to pay higher license fees.
We license third-party technologies and data that we incorporate into, use to operate, and provide with our platform. We cannot assure you that the licenses for such third-party technologies or data will not be terminated or that we will be able to license third-party software or data for future products and services. Third parties may terminate their licenses with us for a variety of reasons, including actual or perceived failures or breaches of security or privacy. In addition, we may be unable to renegotiate acceptable third-party replacement license terms
25
Table of Contents
in the event of termination, or we may be subject to infringement liability if third-party software or data that we license is found to infringe intellectual property or privacy rights of others. In addition, the data that we license from third parties for potential use in our platform may contain errors or defects, which could negatively impact the analytics that our customers perform on or with such data. This may have a negative impact on how our platform is perceived by our current and potential customers and could materially damage our reputation and brand.
Changes in or the loss of third-party licenses could lead to our platform becoming inoperable or the performance of our platform being materially reduced resulting in our potentially needing to incur additional research and development costs to ensure continued performance of our platform or a material increase in the costs of licensing, and we may experience decreased demand for our platform.
Our long-term success depends, in part, on our ability to expand the sales of our software platform to customers located outside of the United States and our current, and any further, expansion of our international operations exposes us to risks that could have a material adverse effect on our business, operating results, and financial condition.
We are generating a growing portion of our revenue from international sales, and conduct our business activities in various foreign countries, including some emerging markets where we have limited experience, where the challenges of conducting our business can be significantly different from those we have faced in more developed markets and where business practices may create internal control risks. For example, we acquired Semanta in January 2017, which has operations in the Czech Republic and Ukraine. There are certain risks inherent in conducting international business, including:
| • | fluctuations in foreign currency exchange rates; |
| • | new, or changes in, regulatory requirements; |
| • | tariffs, export and import restrictions, restrictions on foreign investments, sanctions, and other trade barriers or protection measures; |
| • | costs of localizing products and services; |
| • | lack of acceptance of localized products and services; |
| • | difficulties in and costs of staffing, managing, and operating our international operations; |
| • | tax issues, including with respect to our corporate operating structure and intercompany arrangements; |
| • | weaker intellectual property protection; |
| • | economic weakness or currency related crises; |
| • | the burden of complying with a wide variety of laws, including those relating to labor matters, consumer and data protection, privacy, network security, encryption, and taxes; |
| • | generally longer payment cycles and greater difficulty in collecting accounts receivable; |
| • | our ability to adapt to sales practices and customer requirements in different cultures; |
| • | corporate espionage; and |
| • | political instability and security risks in the countries where we are doing business. |
For example, in June 2016, the United Kingdom held a referendum and voted in favor of leaving the European Union and in March 2017 the United Kingdom provided notification of its intent to leave the European Union. This has created political and economic uncertainty, particularly in the United Kingdom and the European Union, and could cause disruptions to, and create uncertainty surrounding, our business in the United Kingdom and European Union, including affecting our relationships with our existing and prospective customers, partners, and employees, and could have a material impact on the regulatory regime applicable to our operations in the United Kingdom.
26
Table of Contents
We have undertaken, and might undertake additional, corporate operating restructurings that involve our group of foreign country subsidiaries through which we do business abroad. We consider various factors in evaluating these restructurings, including the alignment of our corporate legal entity structure with our organizational structure and its objectives, the operational and tax efficiency of our group structure, and the long-term cash flows and cash needs of our business. If ineffectual, such restructurings could increase our income tax liabilities, and in turn, increase our global effective tax rate.
Tax laws are dynamic and subject to change as new laws are passed and new interpretations of the law are issued or applied. The U.S. enacted significant tax reform in December 2017, and certain provisions of the new law may adversely affect us. In addition, the Organization for Economic Co-operation and Development, or OECD, issued final action items or proposals related to its initiative to combat base erosion and profit shifting, or BEPS. The OECD urged its members to adopt some or all of the proposals to counteract the effects of the use of tax havens and preferential tax regimes globally. One BEPS proposal redefines a “permanent establishment,” and changes how profits would be attributed to the permanent establishment. Another proposal calls for insuring transfer pricing outcomes are commensurate with value creation, adopting the view the current rules facilitate the transfer of risks, capital, and income away from countries where economic activity takes place. We expect many countries to incorporate the BEPS proposals into their laws. Several countries have changed or proposed changes that incorporate some or all of the proposals.
Some of these proposals, if enacted into law in the United States and in the foreign countries where we do business, could increase the burden and costs of our tax compliance. Moreover, such changes could increase the amount of taxes we incur in those jurisdictions, and in turn, increase our global effective tax rate. It is unclear whether, and to what extent, the United States and other countries will enact into law the above or similar proposals.
In addition, compliance with foreign and U.S. laws and regulations that are applicable to our international operations is complex and may increase our cost of doing business in international jurisdictions, and our international operations could expose us to fines and penalties if we fail to comply with these regulations. These laws and regulations include import and export requirements and anti-bribery laws, such as the United States Foreign Corrupt Practices Act of 1977, as amended, or the FCPA, the United Kingdom Bribery Act 2010, or the Bribery Act, and local laws prohibiting corrupt payments to governmental officials. Although we have implemented policies and procedures designed to help ensure compliance with these laws, we cannot assure you that our employees, partners, and other persons with whom we do business will not take actions in violation of our policies or these laws. Any violations of these laws could subject us to civil or criminal penalties, including substantial fines or prohibitions on our ability to offer our platform in one or more countries, and could also materially damage our reputation and our brand. These factors may have an adverse effect on our future sales and, consequently, on our business, operating results, and financial condition.
Because we recognize revenue from our subscriptions over the subscription term, downturns or upturns in new sales and renewals may not be immediately reflected in our operating results and may be difficult to discern.
We generally recognize revenue from customers ratably over the terms of their subscriptions. A significant portion of the revenue we report in each quarter is derived from the recognition of deferred revenue relating to subscriptions entered into during previous quarters. Consequently, a decline in new or renewed subscriptions in any single quarter may have a small impact on our revenue for that quarter. However, such a decline will negatively affect our revenue in future quarters. Accordingly, the effect of significant downturns in sales and market acceptance of our platform, and potential changes in our rate of renewals, may not be fully reflected in our operating results until future periods. We may also be unable to reduce our operating expenses in the event of a significant deterioration in sales. In addition, a significant majority of our costs are expensed as incurred, while a significant portion of our revenue is recognized over the life of the agreement with our customer. As a result, increased growth in the number of our customers could continue to result in our recognition of more costs than
27
Table of Contents
revenue in the earlier periods of the terms of our agreements. Our revenue from subscriptions also makes it more difficult for us to rapidly increase our revenue through additional sales in any period, as revenue from certain new customers is recognized over the applicable term.
As we continue to pursue sales to large enterprises, our sales cycle, forecasting processes, and deployment processes may become more unpredictable and require greater time and expense.
Sales to large enterprises involve risks that may not be present or that are present to a lesser extent with sales to smaller organizations and accordingly, our sales cycle may lengthen as we continue to pursue sales to large enterprises. As we seek to increase our sales to large enterprise customers, we face longer sales cycles, more complex customer requirements, substantial upfront sales costs, and less predictability in completing some of our sales than we do with smaller customers. With larger organizations, the decision to subscribe to our platform frequently requires the approvals of multiple management personnel and more technical personnel than would be typical of a smaller organization and, accordingly, sales to larger organizations may require us to invest more time educating these potential customers. In addition, large enterprises often require extensive configuration, integration services, and pricing negotiations, which increase our upfront investment in the sales effort with no guarantee that these customers will deploy our platform widely enough across their organization to justify our substantial upfront investment. Purchases by large enterprises are also frequently subject to budget constraints and unplanned administrative, processing, and other delays, which means we may not be able to come to agreement on the terms of the sale to large enterprises. In addition, our ability to successfully sell our platform to large enterprises is dependent on us attracting and retaining sales personnel with experience in selling to large organizations. If we are unable to increase sales of our platform to large enterprise customers while mitigating the risks associated with serving such customers, our business, financial position, and operating results may be adversely impacted. Furthermore, if we fail to realize an expected sale from a large customer in a particular quarter or at all, our business, operating results, and financial condition could be adversely affected for a particular period or in future periods.
Our business is affected by seasonality.
Our business is affected by seasonality. Due to the budgeting cycles of our current and potential customers, historically, we enter into more agreements with new customers and more renewed agreements with existing customers in the fourth quarter of each calendar year than in any other quarter. Accordingly, our cash flow from operations has historically been higher in the first quarter of each calendar year than in other quarters. This seasonality is reflected to a much lesser extent, and sometimes is not immediately apparent, in our revenue results, due to the fact that, in accordance with U.S. generally accepted accounting principles, or U.S. GAAP, we recognize revenue from the sale of our platform over the term of the customer agreement. In addition, we have experienced increased sales and marketing expenses associated with our annual sales kickoff in the first quarter and our annual U.S. and European Inspire customer conferences in the second and third quarters, respectively. Our rapid growth in recent years may obscure the extent to which seasonality trends have affected our business and may continue to affect our business. Accordingly, yearly or quarterly comparisons of our operating results may not be useful and our operating results in any particular period will not necessarily be indicative of the results to be expected for any future period. Seasonality in our business can also be impacted by introductions of new or enhanced products and services, including the costs associated with such introductions.
Any failure to offer high-quality technical support may harm our relationships with our customers and have a negative impact on our business and financial condition.
Once our platform is deployed, our customers depend on our customer support team to resolve technical and operational issues relating to our platform. Our ability to provide effective customer support is largely dependent on our ability to attract, train, and retain qualified personnel with experience in supporting customers on platforms such as ours. The number of our customers has grown significantly and that has and will put additional pressure on our customer support team. We may be unable to respond quickly enough to accommodate short-
28
Table of Contents
term increases in customer demand for technical support. We also may be unable to modify the future, scope, and delivery of our technical support to compete with changes in the technical support provided by our competitors. Increased customer demand for support, without corresponding revenue, could increase costs and negatively affect our operating results. In addition, as we continue to grow our operations and expand internationally, we need to be able to provide efficient customer support that meets our customers’ needs globally at scale and our customer support team will face additional challenges, including those associated with delivering support, training, and documentation in languages other than English. If we are unable to provide efficient customer support globally at scale, our ability to grow our operations may be harmed and we may need to hire additional support personnel, which could negatively impact our operating results. In addition, we provide self-service support resources to our customers. Some of these resources, such as our community page, rely on engagement and collaboration by and with other customers. If we are unable to continue to develop self-service support resources that are easy to use and that our customers utilize to resolve their technical issues or if our customers choose not to collaborate or engage with other customers on technical support issues, customers may continue to direct support requests to our customer support team instead of relying on our self-service support resources and our customers’ experience with our platform may be negatively impacted. Any failure to maintain high-quality support, or a market perception that we do not maintain high-quality support, could harm our reputation, our ability to sell our platform to existing and prospective customers, and our business, operating results, and financial condition.
Failure to protect our intellectual property could adversely affect our business.
We currently rely on a combination of copyrights, trademarks, trade secrets, confidentiality procedures, contractual commitments, and other legal rights to protect our intellectual property. We also have four pending patent applications in the United States. Despite our efforts, the steps we take to protect our intellectual property may be inadequate. Unauthorized third parties may try to copy or reverse engineer portions of our platform or otherwise obtain and use our intellectual property. In addition, we may not be able to obtain sufficient intellectual property protection for important features of our platform, in which case our competitors may discover ways to provide similar features without infringing or misappropriating our intellectual property rights.
Any patents that we may own and rely on in the future may be challenged or circumvented by others or invalidated through administrative process or litigation. Our current and future patent applications may not be issued with the scope of the claims we seek, if at all. In addition, any patents issued in the future may not provide us with competitive advantages, may not be enforceable in actions against alleged infringers or may be successfully challenged by third parties.
Moreover, recent amendments to U.S. patent law, developing jurisprudence regarding U.S. patent law, and possible future changes to U.S. or foreign patent laws and regulations may affect our ability to protect our intellectual property and defend against claims of patent infringement. In addition, the laws of some countries do not provide the same level of protection of our intellectual property as do the laws of the United States. As we expand our international activities, our exposure to unauthorized copying and use of our platform and proprietary information will likely increase. Despite our precautions, it may be possible for unauthorized third parties to infringe upon or misappropriate our intellectual property, to copy our platform, and use information that we regard as proprietary to create products and services that compete with ours. Effective intellectual property protection may not be available to us in every country in which our platform is available. For example, some foreign countries have compulsory licensing laws under which a patent owner must grant licenses to third parties. In addition, many countries limit the enforceability of patents against certain third parties, including government agencies or government contractors. In these countries, patents may provide limited or no benefit. We may need to expend additional resources to defend our intellectual property rights domestically or internationally, which could impair our business or adversely affect our domestic or international expansion. If we cannot protect our intellectual property against unauthorized copying or use, we may not remain competitive and our business, operating results, and financial condition may be adversely affected.
29
Table of Contents
We enter into confidentiality and invention assignment agreements with our employees and consultants and enter into confidentiality agreements with other parties. We cannot assure you that these agreements will be effective in controlling access to, use of, and distribution of our proprietary information or in effectively securing exclusive ownership of intellectual property developed by our employees and consultants. Further, these agreements may not prevent our competitors from independently developing technologies that are substantially equivalent or superior to our platform.
In order to protect our intellectual property rights, we may be required to spend significant resources to acquire, maintain, monitor, and protect our intellectual property rights. We cannot assure you that our monitoring efforts will detect every infringement of our intellectual property rights by a third party. Litigation may be necessary in the future to enforce our intellectual property rights and to protect our trade secrets. Litigation brought to protect and enforce our intellectual property rights could be costly, time-consuming, and distracting to management, and could result in the impairment or loss of portions of our intellectual property. Further, our efforts to enforce our intellectual property rights may be met with defenses, counterclaims, and countersuits attacking the validity and enforceability of our intellectual property rights. Our inability to protect our proprietary technology against unauthorized copying or use, as well as any costly litigation or diversion of our management’s attention and resources, could delay further sales or the implementation of our platform, impair the functionality of our platform, delay introductions of new products and services, result in our substituting inferior or more costly technologies into our platform, or damage our brand and reputation.
Additionally, the United States Patent and Trademark Office and various foreign governmental patent agencies require compliance with a number of procedural, documentary, fee payment, and other similar provisions during the patent application process and to maintain issued patents. There are situations in which noncompliance can result in abandonment or lapse of the patent or patent application, resulting in partial or complete loss of patent rights in the relevant jurisdiction. If this occurs, it could have a material adverse effect on our business operations and financial condition.
Our platform may infringe the intellectual property rights of third parties and this may create liability for us or otherwise harm our business.
Third parties may claim that our current or future products and services infringe their intellectual property rights, and such claims may result in legal claims against our customers and us. These claims may damage our brand and reputation, harm our customer relationships, and create liability for us. We expect the number of such claims will increase as the number of products and services and the level of competition in our market grows, the functionality of our platform overlaps with that of other products and services, and the volume of issued software patents and patent applications continues to increase. We generally agree in our customer contracts to indemnify customers for expenses or liabilities they incur as a result of third party intellectual property infringement claims associated with our platform. To the extent that any claim arises as a result of third-party technology we have licensed for use in our platform, we may be unable to recover from the appropriate third party any expenses or other liabilities that we incur.
Companies in the software and technology industries, including some of our current and potential competitors, own large numbers of patents, copyrights, trademarks, and trade secrets and frequently enter into litigation based on allegations of infringement or other violations of intellectual property rights. In addition, many of these companies have the capability to dedicate substantially greater resources to enforce their intellectual property rights and to defend claims that may be brought against them. Furthermore, patent holding companies, non-practicing entities, and other adverse patent owners that are not deterred by our existing intellectual property protections may seek to assert patent claims against us. From time to time, third parties, including certain of these leading companies, have contacted us inviting us to license their patents and may, in the future, assert patent, copyright, trademark, or other intellectual property rights against us, our channel partners, our technology partners, or our customers. We have received, and may in the future receive, notices that claim we have misappropriated, misused, or infringed other parties’ intellectual property rights, and, to the extent
30
Table of Contents
we gain greater market visibility, we face a higher risk of being the subject of intellectual property infringement claims, which is not uncommon with respect to the enterprise software market.
There may be third-party intellectual property rights, including issued or pending patents, that cover significant aspects of our technologies or business methods. In addition, if we acquire or license technologies from third parties, we may be exposed to increased risk of being the subject of intellectual property infringement due to, among other things, our lower level of visibility into the development process with respect to such technology and the care taken to safeguard against infringement risks. Any intellectual property claims, with or without merit, could be very time-consuming, could be expensive to settle or litigate, and could divert our management’s attention and other resources. These claims could also subject us to significant liability for damages, potentially including treble damages if we are found to have willfully infringed patents or copyrights, and may require us to indemnify our customers for liabilities they incur as a result of such claims. These claims could also result in our having to stop using technology found to be in violation of a third party’s rights. We might be required to seek a license for the intellectual property, which may not be available on reasonable terms or at all. Even if a license were available, we could be required to pay significant royalties, which would increase our operating expenses. Alternatively, we could be required to develop alternative non-infringing technology, which could require significant time, effort, and expense, and may affect the performance or features of our platform. If we cannot license or develop alternative non-infringing substitutes for any infringing technology used in any aspect of our business, we would be forced to limit or stop sales of our platform and may be unable to compete effectively. Any of these results would adversely affect our business operations and financial condition.
Our platform contains third-party open source software components, and failure to comply with the terms of the underlying open source software licenses could restrict our ability to sell our platform.
Our platform incorporates open source software code. An open source license allows the use, modification, and distribution of software in source code form. Certain kinds of open source licenses further require that any person who creates a product or service that contains, links to, or is derived from software that was subject to an open source license must also make their own product or service subject to the same open source license. Using software that is subject to this kind of open source license can lead to a requirement that our platform be provided free of charge or be made available or distributed in source code form. Although we do not believe our platform includes any open source software in a manner that would result in the imposition of any such requirement, the interpretation of open source licenses is legally complex and, despite our efforts, it is possible that our platform could be found to contain this type of open source software.
Moreover, we cannot assure you that our processes for controlling our use of open source software in our platform will be effective. If we have not complied with the terms of an applicable open source software license, we could be required to seek licenses from third parties to continue offering our platform on terms that are not economically feasible, to re-engineer our platform to remove or replace the open source software, to discontinue the sale of our platform if re-engineering could not be accomplished on a timely basis, to pay monetary damages, or to make generally available the source code for our proprietary technology, any of which could adversely affect our business, operating results, and financial condition.
In addition to risks related to license requirements, use of open source software can involve greater risks than those associated with use of third-party commercial software, as open source licensors generally do not provide warranties or assurance of title, performance, non-infringement, or controls on origin of the software. There is typically no support available for open source software, and we cannot assure you that the authors of such open source software will not abandon further development and maintenance. Many of the risks associated with the use of open source software, such as the lack of warranties or assurances of title or performance, cannot be eliminated, and could, if not properly addressed, negatively affect our business. We have established processes to help alleviate these risks, including a review process for screening requests from our development organizations for the use of open source software, but we cannot be sure that all open source software is identified or submitted for approval prior to use in our platform.
31
Table of Contents
Responding to any infringement claim, regardless of its validity, or discovering open source software code in our platform could harm our business, operating results, and financial condition, by, among other things:
| • | resulting in time-consuming and costly litigation; |
| • | diverting management’s time and attention from developing our business; |
| • | requiring us to pay monetary damages or enter into royalty and licensing agreements that we would not normally find acceptable; |
| • | causing delays in the deployment of our platform; |
| • | requiring us to stop selling some aspects of our platform; |
| • | requiring us to redesign certain components of our platform using alternative non-infringing or non-open source technology or practices, which could require significant effort and expense; |
| • | requiring us to disclose our software source code, the detailed program commands for our software; and |
| • | requiring us to satisfy indemnification obligations to our customers. |
Future litigation could have a material adverse impact on our operating results and financial condition.
From time to time, we have been subject to litigation. For example, in December 2017 and January 2018, four putative consumer class action lawsuits were filed against us based upon claims we failed to properly secure on AWS a commercially available, third-party marketing dataset that provided consumer marketing information intended to help marketing professionals advertise and sell their products. These proceedings are further described in Note 15, “Commitments and Contingencies” in the notes to our consolidated financial statements included elsewhere in this Annual Report. The complaints assert claims for violation of the Fair Credit Reporting Act, 15 U.S.C. §§ 1681 et seq. and state consumer-protection statutes, as well as claims for common law negligence. Additional actions alleging similar claims could be brought in the future. These proceedings all remain in the early stages and we intend to vigorously defend against these claims. However, the outcome of any litigation, including the litigation relating to the third-party marketing dataset, regardless of its merits, is inherently uncertain. Regardless of the merits of any claims that may be brought against us, pending or future litigation could result in a diversion of management’s attention and resources and we may be required to incur significant expenses defending against these claims. If we are unable to prevail in litigation, we could incur payments of substantial monetary damages or fines, or undesirable changes to our products or business practices, and accordingly our business, financial condition, or results of operations could be materially and adversely affected. Where we can make a reasonable estimate of the liability relating to pending litigation and determine that it is probable, we record a related liability. As additional information becomes available, we assess the potential liability and revise estimates as appropriate. However, because of uncertainties relating to litigation, the amount of our estimates could change. Any adverse determination related to litigation could require us to change our technology or our business practices, pay monetary damages, or enter into royalty or licensing arrangements, which could adversely affect our operating results and cash flows, harm our reputation, or otherwise negatively impact our business.
The nature of our platform makes it particularly vulnerable to undetected errors or bugs, which could cause problems with how our platform performs and which could, in turn, reduce demand for our platform, reduce our revenue, and lead to product liability claims against us.
Because our platform is complex, it may contain errors or defects, especially when new updates or enhancements are released. Our software is often installed and used in large-scale computing environments with different operating systems, system management software, and equipment and networking configurations, which may cause errors or failures of our software or other aspects of the computing environment into which it is deployed. In addition, deployment of our software into these computing environments may expose previously
32
Table of Contents
undetected errors, compatibility issues, failures, or bugs in our software. Although we test our platform extensively, we have in the past discovered software errors in our platform after introducing new updates or enhancements. Despite testing by us and by our current and potential customers, errors may be found in new updates or enhancements after deployment by our customers. Real or perceived errors, failures, vulnerabilities, or bugs in our platform could result in negative publicity, loss of customer data, loss of or delay in market acceptance of our platform, loss of competitive position, or claims by customers for losses sustained by them, all of which could negatively impact our business and operating results and materially damage our reputation and brand. We may also have to expend resources and capital to correct these defects. Alleviating any of these problems could require significant expenditures of our capital and other resources and could cause interruptions, delays, or cessation in the sale of our platform, which could cause us to lose existing or potential customers and could adversely affect our operating results and growth prospects.
Our agreements with customers typically contain provisions designed to limit our exposure to product liability, warranty, and other claims. However, these provisions do not eliminate our exposure to these claims. In addition, it is possible that these provisions may not be effective under the laws of certain domestic or international jurisdictions and we may be exposed to product liability warranty, and other claims. A successful product liability, warranty, or other similar claim against us could have an adverse effect on our business, operating results, and financial condition.
Business disruptions or performance problems associated with our technology and infrastructure, including interruptions, delays, or failures in service from our third-party data center hosting facility and other third-party services, could adversely affect our operating results or result in a material weakness in our internal controls that could adversely affect the market price of our Class A common stock.
Continued adoption of our platform depends in part on the ability of our existing and potential customers to access our platform within a reasonable amount of time. We have experienced, and may in the future experience, disruptions, data loss, outages, and other performance problems with our infrastructure and website due to a variety of factors, including infrastructure changes, introductions of new functionality, human or software errors, capacity constraints, denial of service attacks, or other security-related incidents. If our platform is unavailable or if our users and customers are unable to access our platform within a reasonable amount of time, or at all, we may experience a decline in renewals, damage to our brand, or other harm to our business. To the extent that we do not effectively address capacity constraints, upgrade our systems as needed, and continually develop our technology and network architecture to accommodate actual and anticipated changes in technology, our business, operating results, and financial condition could be adversely affected.
A significant portion of our critical business operations are concentrated in the United States. In addition, we serve our customers and manage certain critical internal processes using a third-party data center hosting facility located in Colorado and other third-party services, including cloud services. We are a highly automated business, and a disruption or failure of our systems, or the third-party hosting facility or other third-party services that we use, could cause delays in completing sales and providing services. For example, from time to time, our data center hosting facility has experienced outages. Such disruptions or failures could also include a major earthquake, blizzard, fire, cyber-attack, act of terrorism, or other catastrophic event, or a decision by one of our third-party service providers to close facilities that we use without adequate notice or other unanticipated problems with the third-party services that we use, including a failure to meet service standards.
Interruptions or performance problems with either our technology and infrastructure or our data center hosting facility could, among other things:
| • | result in the destruction or disruption of any of our critical business operations, controls, or procedures or information technology systems; |
| • | severely affect our ability to conduct normal business operations; |
| • | result in a material weakness in our internal control over financial reporting; |
33
Table of Contents
| • | cause our customers to terminate their subscriptions; |
| • | result in our issuing credits or paying penalties or fines; |
| • | harm our brand and reputation; |
| • | adversely affect our renewal rates or our ability to attract new customers; or |
| • | cause our platform to be perceived as not being secure. |
Any of the above could adversely affect our business operations and financial condition.
We have experienced, and may in the future experience, security breaches and if unauthorized parties obtain access to our customers’ data, our data, or our platform, networks, or other systems, our platform may be perceived as not being secure, our reputation may be harmed, demand for our platform may be reduced, our operations may be disrupted, we may incur significant legal liabilities, and our business could be materially adversely affected.
As part of our business, we process, store, and transmit our customers’ information and data as well as our own, including in our platform, networks, and other systems, and we rely on third parties that are not directly under our control to do so as well. We, and our third-party partners, have security measures and disaster response plans in place to help protect our customers’ data, our data, and our platform, networks, and other systems against unauthorized access or inadvertent exposure. However, we cannot assure you that these security measures and disaster response plans will be effective against all security threats and natural disasters. Our or our third-party partners’ security measures have in the past been, and may in the future be, breached as a result of third-party action, including intentional misconduct by computer hackers, fraudulent inducement of employees or customers to disclose sensitive information such as user names or passwords, and employee error or malfeasance. Such a breach could result in someone obtaining unauthorized access to our customers’ data, our data, or our platform, networks, or other systems. Although we have incurred significant costs and expect to incur additional significant costs to prevent unauthorized access to our systems and data, because there are many different security breach techniques and such techniques continue to evolve, we and our third-party partners may be unable to anticipate attempted security breaches and implement adequate preventative measures. Third parties may also conduct attacks designed to temporarily deny customers access to our services.
Any unauthorized or inadvertent access to, or an actual or perceived security breach of, our systems or networks, could result in an actual or perceived loss of, or unauthorized access to, our data or the data of our third-party partners, regulatory investigations and orders, litigation, indemnity obligations, damages, penalties, fines, and other costs in connection with actual and alleged contractual breaches, violations of applicable laws and regulations, and other liabilities. Any such incident could also materially damage our reputation and harm our business, operating results, and financial condition, including reducing our revenue, resulting in our customers or third-party partners terminating their relationship with us, subjecting us to costly notification and remediation requirements, or harming our brand. We maintain cyber liability insurance policies covering certain security and privacy damages. However, we cannot be certain that our coverage will be adequate for liabilities actually incurred or that insurance will continue to be available to us on economically reasonable terms, or at all. For example, we are currently subject to lawsuits filed against us related to potential access to a commercially available, third-party marketing dataset that provided consumer marketing information intended to help marketing professionals advertise and sell their products. Risks related to cybersecurity will increase as we continue to grow the scale and functionality of our platform and process, store, and transmit increasingly large amounts of our customers’ information and data, which may include proprietary or confidential data or personal or identifying information.
34
Table of Contents
We may be adversely affected by natural disasters and other catastrophic events, and by man-made problems such as terrorism, that could disrupt our business operations and our business continuity and disaster recovery plans may not adequately protect us from a serious disaster.
Natural disasters or other catastrophic events may also cause damage or disruption to our operations, international commerce, and the global economy, and could have an adverse effect on our business, operating results, and financial condition. Our business operations are subject to interruption by natural disasters, fire, power shortages, pandemics, and other events beyond our control. In addition, acts of terrorism and other geo-political unrest could cause disruptions in our business or the businesses of our partners or the economy as a whole. In the event of a natural disaster, including a major earthquake, blizzard, or hurricane, or a catastrophic event such as a fire, power loss, or telecommunications failure, we may be unable to continue our operations and may endure system interruptions, reputational harm, delays in development of our platform, lengthy interruptions in service, breaches of data security, and loss of critical data, all of which could have an adverse effect on our future operating results. For example, our corporate offices are located in California, a state that frequently experiences earthquakes. Additionally, all the aforementioned risks may be further increased if we do not implement a disaster recovery plan or our partners’ disaster recovery plans prove to be inadequate.
Failure to comply with governmental laws and regulations could harm our business.
Our business is subject to regulation by various federal, state, local and foreign governments. In certain jurisdictions, these regulatory requirements may be more stringent than those in the United States. Noncompliance with applicable regulations or requirements could subject us to investigations, sanctions, mandatory product recalls, enforcement actions, disgorgement of profits, fines, damages, civil and criminal penalties, injunctions or other collateral consequences. If any governmental sanctions are imposed, or if we do not prevail in any possible civil or criminal litigation, our business, operating results, and financial condition could be materially adversely affected. In addition, responding to any action will likely result in a significant diversion of management’s attention and resources and an increase in professional fees. Enforcement actions and sanctions could harm our business, reputation, operating results and financial condition.
Changes in laws or regulations relating to privacy or the protection or transfer of personal data, or any actual or perceived failure by us to comply with such laws and regulations or our privacy policies, could adversely affect our business.
Components of our business, including our platform, involve processing, storing, and transmitting confidential data, which is subject to our privacy policies and certain federal, state, and foreign laws and regulations relating to privacy and data protection. The amount of customer and employee data that we store through our platform, networks, and other systems, including personal data, is increasing. In recent years, the collection and use of personal data by companies have come under increased regulatory and public scrutiny.
For example, in the United States, protected health information is subject to the Health Insurance Portability and Accountability Act, or HIPAA. HIPAA has been supplemented by the Health Information Technology for Economic and Clinical Health Act with the result of increased civil and criminal penalties for noncompliance. Under HIPAA, entities performing certain functions and creating, receiving, maintaining, or transmitting protected health information provided by covered entities and other business associates are directly subject to HIPAA. If we have access to protected health information through our platform, we may be obligated to comply with certain privacy rules and data security requirements under HIPAA. Any systems failure or security breach that results in the release of, or unauthorized access to, personal data, or any failure or perceived failure by us to comply with our privacy policies or any applicable laws or regulations relating to privacy or data protection, could result in proceedings against us by governmental entities or others. Such proceedings could result in the imposition of sanctions, fines, penalties, liabilities, or governmental orders requiring that we change our data practices, any of which could have a material adverse effect on our business, operating results, and financial condition.
35
Table of Contents
Various local, state, federal, and international laws, directives, and regulations apply to the collection, use, retention, protection, disclosure, transfer, and processing of personal data. These data protection and privacy laws and regulations continue to evolve. Various federal, state, and foreign legislative or regulatory bodies may enact new or additional laws or regulations concerning privacy and data protection that could adversely impact our business. Complying with these varying requirements could cause us to incur substantial costs or require us to change our business practices, either of which could adversely affect our business and operating results. For example, the European Commission adopted a new law regarding data practices called the General Data Protection Regulation, or GDPR, which will become effective in May 2018, and will supersede current EU data protection legislation. The GDPR will impose new and more stringent EU data protection requirements, which could increase the risk of non-compliance and the costs of providing our products and services in a compliant matter. The GDPR provides for greater monetary penalties for noncompliance, including a penalty of up to the greater of €20 million or 4% of total worldwide annual turnover. Changing definitions of personal data and information may also limit or inhibit our ability to operate or expand our business, including limiting strategic partnerships that may involve the sharing of data. Also, some jurisdictions require that certain types of data be retained on servers within these jurisdictions. Our failure to comply with applicable laws, directives, and regulations may result in enforcement action against us, including fines, and damage to our reputation, any of which may have an adverse effect on our business and operating results.
Failure to comply with anti-corruption and anti-money laundering laws, including the FCPA and similar laws associated with our activities outside of the United States, could subject us to penalties and other adverse consequences.
We are subject to the FCPA, the U.S. domestic bribery statute contained in 18 U.S.C. § 201, the U.S. Travel Act, the USA PATRIOT Act, the Bribery Act, and possibly other anti-bribery and anti-money laundering laws in countries in which we conduct activities. We face significant risks if we fail to comply with the FCPA and other anti-corruption laws that prohibit companies and their employees and third-party intermediaries from authorizing, offering, or providing, directly or indirectly, improper payments or benefits to foreign government officials, political parties, and private-sector recipients for the purpose of obtaining or retaining business, directing business to any person, or securing any advantage. In many foreign countries, particularly in countries with developing economies, it may be a local custom that businesses engage in practices that are prohibited by the FCPA or other applicable laws and regulations. In addition, we use various third parties to sell our platform and conduct our business abroad. We or our third-party intermediaries may have direct or indirect interactions with officials and employees of government agencies or state-owned or affiliated entities and we can be held liable for the corrupt or other illegal activities of these third-party intermediaries, our employees, representatives, contractors, partners, and agents, even if we do not explicitly authorize such activities. We have implemented an anti-corruption compliance program but cannot assure you that all our employees and agents, as well as those companies to which we outsource certain of our business operations, will not take actions in violation of our policies and applicable law, for which we may be ultimately held responsible.
Any violation of the FCPA, other applicable anti-corruption laws, and anti-money laundering laws could result in whistleblower complaints, adverse media coverage, investigations, loss of export privileges, severe criminal or civil sanctions and, in the case of the FCPA, suspension or debarment from U.S. government contracts, which could have an adverse effect on our reputation, business, operating results, and prospects. In addition, responding to any enforcement action may result in a significant diversion of management’s attention and resources and significant defense costs and other professional fees.
We are required to comply with governmental export control laws and regulations. Our failure to comply with these laws and regulations could have an adverse effect on our business and operating results.
Our platform is subject to governmental, including United States and European Union, export control laws and regulations. U.S. export control laws and regulations and economic sanctions prohibit the shipment of certain products and services to U.S. embargoed or sanctioned countries, governments, and persons, and complying with
36
Table of Contents
export control and sanctions regulations for a particular sale may be time-consuming and may result in the delay or loss of sales opportunities. While we take precautions to prevent our platform from being exported in violation of these laws, if we were to fail to comply with U.S. export laws, U.S. Customs regulations and import regulations, U.S. economic sanctions, and other countries’ import and export laws, we could be subject to substantial civil and criminal penalties, including fines for the company and incarceration for responsible employees and managers, and the possible loss of export or import privileges.
We incorporate encryption technology into certain of our products. Encryption products may be exported outside of the United States only with the required export authorization including by license, a license exception or other appropriate government authorization. In addition, various countries regulate the import of certain encryption technology, including import permitting and licensing requirements, and have enacted laws that could limit our ability to distribute our products or could limit our customers’ ability to implement our products in those countries. Although we take precautions to prevent our products from being provided in violation of such laws, we cannot assure you that inadvertent violations of such laws have not occurred or will not occur in connection with the distribution of our products despite the precautions we take. Governmental regulation of encryption technology and regulation of imports or exports, or our failure to obtain required import or export approval for our products, could harm our international sales and adversely affect our operating results.
Further, if our channel or other partners fail to obtain appropriate import, export, or re-export licenses or permits, we may also be harmed, become the subject of government investigations or penalties, and incur reputational harm. Changes in our platform or changes in export and import regulations may create delays in the introduction of our platform in international markets, prevent our customers with international operations from deploying our platform globally or, in some cases, prevent the export or import of our platform to certain countries, governments, or persons altogether. Any change in export or import laws or regulations, economic sanctions, or related legislation, shift in the enforcement or scope of existing laws and regulations, or change in the countries, governments, persons, or technologies targeted by such laws and regulations, could result in decreased use of our platform by, or in our decreased ability to export or sell our platform to, existing or potential customers with international operations. Any decreased use of our platform or limitation on our ability to export or sell our platform would likely harm our business, financial condition, and operating results.
If we are unable to recruit or retain skilled personnel, or if we lose the services of any of our senior management or other key personnel, our business, operating results, and financial condition could be adversely affected.
Our future success depends on our continuing ability to attract, train, assimilate, and retain highly skilled personnel. We face intense competition for qualified individuals from numerous software and other technology companies. We may not be able to retain our current key employees or attract, train, assimilate, or retain other highly skilled personnel in the future. We may incur significant costs to attract and retain highly skilled personnel, and we may lose new employees to our competitors or other technology companies before we realize the benefit of our investment in recruiting and training them. As we move into new geographies, we will need to attract and recruit skilled personnel in those areas. If we are unable to attract and retain suitably qualified individuals who are capable of meeting our growing technical, operational, and managerial requirements, on a timely basis or at all, our business may be adversely affected. Volatility or lack of performance in our stock price may also affect our ability to attract and retain our key employees.
Further, several members of our management team have only been with our company for a short period of time. Four of our six executive officers joined our company after April 2016, and our management team has limited experience working together. If our management team cannot work together effectively or any member of our management team leaves our company, our business, operating results, and financial condition could be adversely affected.
Our future success also depends in large part on the continued service of senior management and other key personnel. In particular, we are highly dependent on the services of our senior management team, many of whom
37
Table of Contents
are critical to the development of our technology, platform, future vision, and strategic direction. We rely on our leadership team in the areas of operations, security, marketing, sales, support, and general and administrative functions, and on individual contributors on our research and development team. Our senior management and other key personnel are all employed on an at-will basis, which means that they could terminate their employment with us at any time, for any reason and without notice. If we lose the services of senior management or other key personnel, or if we are unable to attract, train, assimilate, and retain the highly skilled personnel we need, our business, operating results, and financial condition could be adversely affected.
If currency exchange rates fluctuate substantially in the future, the results of our operations, which are reported in U.S. dollars, could be adversely affected.
As we continue to expand our international operations, we become more exposed to the effects of fluctuations in currency exchange rates. Although we expect an increasing number of sales contracts to be denominated in currencies other than the U.S. dollar in the future, the majority of our sales contracts have historically been denominated in U.S. dollars, and therefore, most of our revenue has not been subject to foreign currency risk. However, a strengthening of the U.S. dollar could increase the real cost of our platform to our customers outside of the United States, which could adversely affect our business, operating results, financial condition, and cash flows. In addition, we incur expenses for employee compensation and other operating expenses at our non-U.S. locations in the local currency. Fluctuations in the exchange rates between the U.S. dollar and other currencies could result in the dollar equivalent of such expenses being higher. This could have a negative impact on our operating results. Although we may in the future decide to undertake foreign exchange hedging transactions to cover a portion of our foreign currency exchange exposure, we currently do not hedge our exposure to foreign currency exchange risks.
We may have exposure to additional tax liabilities.
We are subject to complex tax laws and regulations in the United States and a variety of foreign jurisdictions. All of these jurisdictions have in the past and may in the future make changes to their corporate income tax rates and other income tax laws which could increase our future income tax provision.
Our future income tax obligations could be affected by earnings that are lower than anticipated in jurisdictions where we have lower statutory rates and by earnings that are higher than anticipated in jurisdictions where we have higher statutory rates, by changes in the valuation of our deferred tax assets and liabilities, changes in the amount of unrecognized tax benefits, or by changes in tax laws, regulations, accounting principles, or interpretations thereof.
Our determination of our tax liability is subject to review by applicable U.S. and foreign tax authorities. Any adverse outcome of such a review could harm our operating results and financial condition. The determination of our worldwide provision for income taxes and other tax liabilities requires significant judgment and, in the ordinary course of business, there are many transactions and calculations where the ultimate tax determination is complex and uncertain. Moreover, as a multinational business, we have subsidiaries that engage in many intercompany transactions in a variety of tax jurisdictions where the ultimate tax determination is complex and uncertain. Our existing corporate structure and intercompany arrangements have been implemented in a manner we believe is in compliance with current prevailing tax laws. However, the taxing authorities of the jurisdictions in which we operate may challenge our methodologies for valuing developed technology or intercompany arrangements, which could impact our worldwide effective tax rate and harm our financial position and operating results.
We are also subject to non-income taxes, such as payroll, sales, use, value-added, net worth, property, and goods and services taxes in the United States and various foreign jurisdictions. We are periodically reviewed and audited by tax authorities with respect to income and non-income taxes. Tax authorities may disagree with certain positions we have taken and we may have exposure to additional income and non-income tax liabilities
38
Table of Contents
which could have an adverse effect on our operating results and financial condition. In addition, our future effective tax rates could be favorably or unfavorably affected by changes in tax rates, changes in the valuation of our deferred tax assets or liabilities, the effectiveness of our tax planning strategies, or changes in tax laws or their interpretation. Such changes could have an adverse impact on our financial condition.
As a result of these and other factors, the ultimate amount of tax obligations owed may differ from the amounts recorded in our financial statements and any such difference may harm our operating results in future periods in which we change our estimates of our tax obligations or in which the ultimate tax outcome is determined.
Our ability to use our net operating losses to offset future taxable income may be subject to certain limitations which could subject our business to higher tax liability.
Our ability to use our net operating losses to offset future taxable income may be subject to certain limitations which could subject our business to higher tax liability. We may be limited in the portion of net operating loss, or NOL, carryforwards that we can use in the future to offset taxable income for U.S. federal and state income tax purposes, and federal tax credits to offset federal tax liabilities. Sections 382 and 383 of the Internal Revenue Code limit the use of NOLs and tax credits after a cumulative change in corporate ownership of more than 50% occurs within a three-year period. The limitation could prevent a corporation from using some or all its NOL and tax credits before they expire within their normal 20-year lifespan, as it places a formula limit of how much NOL and tax credits a loss corporation can use in a tax year. We concluded we had an ownership change in 2015, but the ownership change will not prevent us from using all our NOLs and tax credits before they expire. We may also experience ownership changes in the future that further restrict the use of our NOLs as a result of subsequent shifts in our stock ownership. Furthermore, under the Tax Cuts and Jobs Act of 2017, although the treatment of tax losses generated in taxable years ending before December 31, 2017 has generally not changed, tax losses generated in taxable years beginning after December 31, 2017 may be utilized to offset no more than 80% of taxable income annually. This change may require us to pay federal income taxes in future years despite generating a loss for federal income tax purposes in prior years.
Economic uncertainty or downturns, particularly as it impacts particular industries, could adversely affect our business and operating results.
In recent years, the United States and other significant markets have experienced cyclical downturns and worldwide economic conditions remain uncertain. Economic uncertainty and associated macroeconomic conditions make it extremely difficult for our customers and us to accurately forecast and plan future business activities, and could cause our customers to slow spending on our platform, which could delay and lengthen sales cycles. Furthermore, during uncertain economic times our customers may face issues gaining timely access to sufficient credit, which could result in an impairment of their ability to make timely payments to us. If that were to occur, we may be required to increase our allowance for doubtful accounts and our results would be negatively impacted.
Furthermore, we have customers in a variety of different industries. A significant downturn in the economic activity attributable to any particular industry, including, but not limited to, the retail and financial industries, may cause organizations to react by reducing their capital and operating expenditures in general or by specifically reducing their spending on information technology. In addition, our customers may delay or cancel information technology projects or seek to lower their costs by renegotiating vendor contracts. To the extent purchases of our platform are perceived by customers and potential customers to be discretionary, our revenue may be disproportionately affected by delays or reductions in general information technology spending. Also, customers may choose to develop in-house software as an alternative to using our platform. Moreover, competitors may respond to challenging market conditions by lowering prices and attempting to lure away our customers.
39
Table of Contents
We cannot predict the timing, strength, or duration of any economic slowdown or any subsequent recovery generally, or any industry in particular. If the conditions in the general economy and the markets in which we operate worsen from present levels, our business, financial condition, and operating results could be materially adversely affected.
We may require additional capital to fund our business and support our growth, and any inability to generate or obtain such capital may adversely affect our operating results and financial condition.
In order to support our growth and respond to business challenges, such as developing new features or enhancements to our platform to stay competitive, acquiring new technologies, and improving our infrastructure, we have made significant financial investments in our business and we intend to continue to make such investments. As a result, we may need to engage in equity or debt financings to provide the funds required for these investments and other business endeavors. If we raise additional funds through equity or convertible debt issuances, our existing stockholders may suffer significant dilution and these securities could have rights, preferences, and privileges that are superior to that of holders of our common stock. If we obtain additional funds through debt financing, we may not be able to obtain such financing on terms favorable to us. Such terms may involve restrictive covenants making it difficult to engage in capital raising activities and pursue business opportunities, including potential acquisitions. If we are unable to obtain adequate financing or financing on terms satisfactory to us when we require it, our ability to continue to support our business growth and to respond to business challenges could be significantly impaired and our business may be adversely affected, requiring us to delay, reduce, or eliminate some or all of our operations.
The requirements of being a public company may strain our resources, divert management’s attention, and affect our ability to attract and retain additional executive management and qualified board members.
We are subject to the reporting requirements of the Exchange Act, the Sarbanes-Oxley Act of 2002, or Sarbanes-Oxley Act, the Dodd-Frank Wall Street Reform and Consumer Protection Act of 2010, the listing requirements of the New York Stock Exchange, and other applicable securities rules and regulations. Compliance with these rules and regulations have increased our legal and financial compliance costs, make some activities more difficult, time-consuming, or costly and increase demand on our systems and resources, particularly after we are no longer an emerging growth company. The Exchange Act requires, among other things, that we file annual, quarterly, and current reports with respect to our business and operating results. The Sarbanes-Oxley Act requires, among other things, that we maintain effective disclosure controls and procedures and internal control over financial reporting. In order to maintain and, if required, improve our disclosure controls and procedures and internal control over financial reporting to meet this standard, significant resources and management oversight may be required. As a result, management’s attention may be diverted from other business concerns, which could adversely affect our business and operating results. Although we have already hired additional employees to comply with these requirements, we may need to hire more employees in the future or engage outside consultants, which will increase our costs and expenses.
In addition, changing laws, regulations, and standards relating to corporate governance and public disclosure are creating uncertainty for public companies, increasing legal and financial compliance costs, and making some activities more time consuming. These laws, regulations, and standards are subject to varying interpretations, in many cases due to their lack of specificity, and, as a result, their application in practice may evolve over time as new guidance is provided by regulatory and governing bodies. This could result in continuing uncertainty regarding compliance matters and higher costs necessitated by ongoing revisions to disclosure and governance practices. We intend to invest resources to comply with evolving laws, regulations, and standards, and this investment may result in increased general and administrative expenses and a diversion of management’s time and attention from revenue-generating activities to compliance activities. If our efforts to comply with new laws, regulations, and standards differ from the activities intended by regulatory or governing bodies due to ambiguities related to their application and practice, regulatory authorities may initiate legal proceedings against us and our business may be adversely affected.
40
Table of Contents
The new rules and regulations applicable to public companies make it more expensive for us to obtain and maintain director and officer liability insurance, and we may be required to accept reduced coverage or incur substantially higher costs to obtain coverage. These factors could also make it more difficult for us to attract and retain qualified members of our board of directors, particularly to serve on our audit committee and compensation committee, and qualified executive officers.
As a result of disclosure of information in filings required of a public company, our business and financial condition has become more visible, which we believe may result in threatened or actual litigation, including by competitors and other third parties. If such claims are successful, our business and operating results could be adversely affected, and even if the claims do not result in litigation or are resolved in our favor, these claims, and the time and resources necessary to resolve them, could divert the resources of our management and adversely affect our business and operating results.
We are obligated to develop and maintain proper and effective internal control over financial reporting. We have identified a material weakness in our internal control over financial reporting and if our remediation of this material weakness is not effective, or if we fail to maintain an effective system of internal control over financial reporting in the future, we may not be able to accurately or timely report our financial condition or operating results, which may adversely affect investor confidence in our company and, as a result, the value of our Class A common stock.
As a public company, we are required, pursuant to Section 404 of the Sarbanes-Oxley Act, to furnish a report by management on, among other things, the effectiveness of our internal control over financial reporting commencing with our second annual report on Form 10-K. Effective internal control over financial reporting is necessary for us to provide reliable financial reports and, together with adequate disclosure controls and procedures, are designed to prevent fraud. Any failure to implement required new or improved controls, or difficulties encountered in their implementation, could cause us to fail to meet our reporting obligations. Ineffective internal controls could also cause investors to lose confidence in our reported financial information, which could have a negative effect on the trading price of our Class A common stock.
This assessment will need to include disclosure of any material weaknesses identified by our management in our internal control over financial reporting, as well as a statement that our independent registered public accounting firm has issued an opinion on our internal control over financial reporting, provided that our independent registered public accounting firm will not be required to attest to the effectiveness of our internal control over financial reporting until our first annual report required to be filed with the SEC following the later of the date we are deemed to be an “accelerated filer” or a “large accelerated filer,” each as defined in the Exchange Act, or the date we are no longer an emerging growth company, as defined in the Jumpstart Our Business Startups Act of 2012, or the JOBS Act. We could remain an emerging growth company until the last day of the fiscal year following the fifth anniversary of the completion of our initial public offering; however, if the market value of our common stock that is held by non-affiliates exceeds $700 million as of the end of the second quarter of a fiscal year prior to the fifth anniversary, we would cease to be an emerging growth company as of the following December 31 and our independent registered public accounting firm would be required to attest to the effectiveness of our internal control over financial reporting with the immediately following annual report. An independent assessment of the effectiveness of our internal controls could detect problems that our management’s assessment might not. Undetected material weaknesses in our internal controls could lead to financial statement restatements and require us to incur the expense of remediation. We are required to disclose changes made in our internal controls and procedures on a quarterly basis. To comply with the requirements of being a public company, we may need to undertake various actions, such as implementing new internal controls and procedures and hiring additional accounting or internal audit staff.
In the course of preparing our financial statements as of and for the year ended December 31, 2016, we identified a material weakness in our internal control over financial reporting. A material weakness is a deficiency, or combination of deficiencies, in internal control over financial reporting, such that there is a
41
Table of Contents
reasonable possibility that a material misstatement of the annual or interim consolidated financial statements will not be prevented or detected on a timely basis. The material weakness identified related to the evaluation of the accounting impact of certain contractual terms related to our arrangements with licensed data providers, which resulted in the misstatement in the recording of prepaid and other assets and royalty costs that were recorded in cost of revenue in the first three fiscal quarters of 2016. This material weakness resulted in an immaterial revision of those quarterly results of operations data. This material weakness could result in additional misstatements to the accounts and disclosures that would result in a material misstatement of our consolidated financial statements that would not be prevented or detected. Because of this material weakness in our internal control over financial reporting, our Chief Executive Officer and Chief Financial Officer concluded that, as of December 31, 2017, our disclosure controls and procedures were not effective.
In response to this material weakness, we have begun taking actions to remediate our material weakness by enhancing our existing control activities related to the review of royalty contracts, including the implementation of additional control activities related to the identification and evaluation of the terms of royalty contracts that require consideration in assessing the accounting for the arrangement. These remediation measures are ongoing. While we believe that these efforts will improve our internal control over financial reporting, the implementation of our remediation is ongoing and will require validation and testing of the design and operating effectiveness of internal controls over a sustained period of financial reporting cycles. Furthermore, while we believe we are making progress toward achieving the effectiveness of our internal controls and disclosure controls, we cannot assure you that these measures will significantly improve or remediate the material weakness described. We also cannot assure you that we have identified all our existing material weaknesses, or that we will not in the future have additional material weaknesses.
We are in the early stages of the costly and challenging process of compiling the system and processing documentation necessary to perform the evaluation needed to comply with Section 404. We may not be able to complete our evaluation, testing, and any required remediation in a timely fashion. During the evaluation and testing process, if we identify additional material weaknesses in our internal control over financial reporting, we will be unable to assert that our internal control over financial reporting is effective.
If we are unable to assert that our internal control over financial reporting is effective, or if our independent registered public accounting firm is unable to express an opinion on the effectiveness of our internal control, including as a result of the material weakness described above, we could lose investor confidence in the accuracy and completeness of our financial reports, which would cause the price of our Class A common stock to decline, and we may be subject to investigation or sanctions by the SEC. In addition, if we are unable to continue to meet these requirements, we may not be able to remain listed on the New York Stock Exchange.
Our management team has limited experience managing a public company.
Most members of our management team have limited experience managing a publicly traded company, interacting with public company investors, and complying with the increasingly complex laws pertaining to public companies. Our management team may not successfully or efficiently manage our transition to being a public company subject to significant regulatory oversight and reporting obligations under the federal securities laws and the continuous scrutiny of securities analysts and investors. These new obligations and constituents will require significant attention from our senior management and could divert their attention away from the day-to-day management of our business, which could adversely affect our business, financial condition, and operating results.
42
Table of Contents
Future acquisitions of, or investments in, other companies, products, or technologies could require significant management attention, disrupt our business, dilute stockholder value, and adversely affect our operating results.
Our business strategy has included, and may in the future include, acquiring other complementary products, technologies, or businesses. For example, in January 2017, we acquired Semanta to enhance our data governance capabilities and, in May 2017, we acquired Yhat to enhance our capabilities for managing and deploying advanced analytic models. We also may enter into relationships with other businesses in order to expand our platform, which could involve preferred or exclusive licenses, additional channels of distribution, or discount pricing or investments in other companies. Negotiating these transactions can be time-consuming, difficult, and expensive, and our ability to close these transactions may be subject to third-party approvals, such as government regulatory approvals, which are beyond our control. Consequently, we can make no assurance that these transactions once undertaken and announced, will close.
These kinds of acquisitions or investments may result in unforeseen operating difficulties and expenditures. If we acquire businesses or technologies, we may not be able to integrate the acquired personnel, operations, and technologies successfully, or effectively manage the combined business following the acquisition. We also may not achieve the anticipated benefits from the acquired business due to a number of factors, including:
| • | inability to integrate or benefit from acquired technologies or services in a profitable manner; |
| • | unanticipated costs or liabilities associated with the acquisition; |
| • | incurrence of acquisition-related costs; |
| • | difficulty integrating the accounting systems, operations, and personnel of the acquired business; |
| • | difficulties and additional expenses associated with supporting legacy products and hosting infrastructure of the acquired business; |
| • | difficulty converting the customers of the acquired business onto our platform and contract terms; |
| • | diversion of management’s attention from other business concerns; |
| • | adverse effects to our existing business relationships with business partners and customers as a result of the acquisition; |
| • | the potential loss of key employees; |
| • | use of resources that are needed in other parts of our business; and |
| • | use of substantial portions of our available cash to consummate the acquisition. |
Moreover, we cannot assure you that the anticipated benefits of any acquisition or investment would be realized or that we would not be exposed to unknown liabilities.
In connection with these types of transactions, we may issue additional equity securities that would dilute our stockholders, use cash that we may need in the future to operate our business, incur debt on terms unfavorable to us or that we are unable to repay, incur large charges or substantial liabilities, encounter difficulties integrating diverse business cultures, and become subject to adverse tax consequences, substantial depreciation, or deferred compensation charges. These challenges related to acquisitions or investments could adversely affect our business, operating results, financial condition, and prospects.
43
Table of Contents
Changes in financial accounting standards or practices may cause adverse, unexpected financial reporting fluctuations and affect our reported operating results.
U.S. GAAP is subject to interpretation by the FASB, the SEC, and various bodies formed to promulgate and interpret appropriate accounting principles. A change in accounting standards or practices can have a significant effect on our reported results and may even affect our reporting of transactions completed before the change is effective. New accounting pronouncements and varying interpretations of accounting pronouncements have occurred and may occur in the future. Changes to existing rules or the questioning of current practices may adversely affect our reported financial results or the way we conduct our business. Accounting for revenue from sales of subscriptions to software is particularly complex, is often the subject of intense scrutiny by the SEC, and will evolve as FASB continues to consider applicable accounting standards in this area.
In particular, in May 2014, the FASB issued ASU No. 2014-09, Revenue from Contracts with Customers (Topic 606), or ASC 606, which supersedes the revenue recognition requirements in ASC 605, Revenue Recognition. The core principle of ASC 606 is that an entity should recognize revenue to depict the transfer of promised goods or services to customers in an amount that reflects the consideration to which the entity expects to be entitled in exchange for those goods or services. As an emerging growth company, we are allowed under the JOBS Act to delay adoption of new or revised accounting pronouncements applicable to public companies until such pronouncements are made applicable to private companies. We have elected to take advantage of this extended transition period under the JOBS Act with respect to ASC 606. For as long as we remain an emerging growth company, ASC 606 will become effective for annual reporting periods beginning after December 15, 2018, and interim reporting periods within annual reporting periods beginning after December 15, 2019, unless we choose to adopt it earlier or we exit emerging growth company status prior to the fifth anniversary of the completion of our initial public offering. Any difficulties in implementing these pronouncements could cause us to fail to meet our financial reporting obligations, which could result in regulatory discipline and harm investors’ confidence in us.
We are evaluating ASC 606 and have not determined the impact it may have on our financial reporting. If, for example, we were required to recognize revenue differently, the differential revenue recognition may cause variability in our reported operating results due to periodic or long-term changes in the mix among our offerings.
Our financial statements are subject to change and if our estimates or judgments relating to our critical accounting policies prove to be incorrect, our operating results could be adversely affected.
The preparation of financial statements in conformity with U.S. GAAP requires management to make estimates and assumptions that affect the amounts reported in our consolidated financial statements and related notes. We base our estimates on historical experience and on various other assumptions that we believe to be reasonable under the circumstances, as provided in the section titled “Management’s Discussion and Analysis of Financial Condition and Results of Operations” in this Annual Report. The results of these estimates form the basis for making judgments about the carrying values of assets, liabilities, and equity, and the amount of revenue and expenses that are not readily apparent from other sources. Critical accounting policies and estimates used in preparing our consolidated financial statements include those related to revenue recognition, sales commissions, business combinations, accounting for income taxes, and stock-based compensation expense. Our operating results may be adversely affected if our assumptions change or if actual circumstances differ from those in our assumptions, which could cause our operating results to fall below the expectations of securities analysts and investors, resulting in a decline in the price of our Class A common stock.
44
Table of Contents
If our goodwill or intangible assets become impaired, we may be required to record a significant charge to earnings.
We review our goodwill and intangible assets for impairment when events or changes in circumstances indicate the carrying value may not be recoverable, such as declines in stock price, market capitalization, or cash flows and slower growth rates in our industry. Goodwill is required to be tested for impairment at least annually. If we are required to record a significant charge in our financial statements during the period in which any impairment of our goodwill or intangible assets is determined, that would negatively affect our operating results.
We are an emerging growth company and we cannot be certain if the reduced disclosure requirements applicable to emerging growth companies will make our Class A common stock less attractive to investors.
We are an emerging growth company, as defined in the JOBS Act, and, for so long as we continue to be an emerging growth company, we may take advantage of certain exemptions from various reporting requirements that are applicable to other public companies that are not emerging growth companies including, but not limited to, not being required to comply with the auditor attestation requirements of Section 404 of the Sarbanes-Oxley Act, reduced disclosure obligations regarding executive compensation in our periodic reports and proxy statements, and exemptions from the requirements of holding a nonbinding advisory vote on executive compensation and stockholder approval of any golden parachute payments not previously approved. Pursuant to Section 107 of the JOBS Act, as an emerging growth company, we have elected to use the extended transition period for complying with new or revised accounting standards until those standards would otherwise apply to private companies. As a result, our consolidated financial statements may not be comparable to the financial statements of issuers who are required to comply with the effective dates for new or revised accounting standards that are applicable to public companies, which may make our Class A common stock less attractive to investors. In addition, if we cease to be an emerging growth company, we will no longer be able to use the extended transition period for complying with new or revised accounting standards and could be required to adopt new or revised accounting standards earlier than planned, which could divert management’s attention and resources and increase costs associated with the implementation of the new or revised accounting standards.
We will remain an emerging growth company until the earliest of (i) the last day of the fiscal year following the fifth anniversary of the effectiveness of our initial public offering, or IPO, (ii) the last day of the first fiscal year in which our annual gross revenue is $1.07 billion or more, (iii) the date on which we have, during the previous rolling three-year period, issued more than $1.0 billion in non-convertible debt securities, or (iv) the last day of the fiscal year in which the market value of our common stock that is held by non-affiliates exceeds $700.0 million as of June 30.
We cannot predict if investors will find our Class A common stock less attractive or our company less comparable to certain other public companies because we will rely on these exemptions. For example, if we do not adopt a new or revised accounting standard, our future operating results may not be as comparable to the operating results of certain other companies in our industry that adopted such standards. If some investors find our Class A common stock less attractive as a result, there may be a less active trading market for our Class A common stock and our stock price may be more volatile.
We are exposed to fluctuations in the market values of our investments.
Credit ratings and pricing of our investments can be negatively affected by liquidity, credit deterioration, financial results, economic risk, political risk, sovereign risk, changes in interest rates, or other factors. As a result, the value and liquidity of our cash and cash equivalents and investments may fluctuate substantially. Therefore, although we have not realized any significant losses on our cash and cash equivalents and investments, future fluctuations in their value could result in a significant realized loss, which could materially adversely affect our financial condition and operating results.
45
Table of Contents
Risks Related to Ownership of Our Class A Common Stock
The market price of our Class A common stock has been, and will likely continue to be, volatile, and you could lose all or part of your investment.
The market price of our Class A common stock has been, and will likely continue to be, volatile. Since shares of our Class A common stock were sold in our IPO in March 2017 at a price of $14.00 per share, our closing stock price has ranged from $14.80 to $28.60, through December 31, 2017. In addition to the other factors discussed in this Annual Report, the market price of our Class A common stock may continue to fluctuate significantly in response to numerous factors, many of which are beyond our control, including:
| • | overall performance of the equity markets; |
| • | actual or anticipated fluctuations in our revenue and other operating results; |
| • | changes in the financial projections we may provide to the public or our failure to meet these projections; |
| • | failure of securities analysts to initiate or maintain coverage of us, changes in financial estimates by any securities analysts who follow our company, or our failure to meet these estimates or the expectations of investors; |
| • | recruitment or departure of key personnel; |
| • | the economy as a whole and market conditions in our industry; |
| • | negative publicity related to the real or perceived quality of our platform, as well as the failure to timely launch new products and services that gain market acceptance; |
| • | rumors and market speculation involving us or other companies in our industry; |
| • | announcements by us or our competitors of significant technical innovations; |
| • | acquisitions, strategic partnerships, joint ventures, or capital commitments; |
| • | new laws or regulations or new interpretations of existing laws or regulations applicable to our business; |
| • | lawsuits threatened or filed against us; |
| • | developments or disputes concerning our intellectual property or our platform, or third-party proprietary rights; |
| • | the inclusion of our Class A common stock on stock market indexes, including the impact of rules adopted by certain index providers, such as S&P Dow Jones Indices and FTSE Russell, that limit or preclude inclusion of companies with multi-class capital structures; |
| • | changes in accounting standards, policies, guidelines, interpretations, or principles; |
| • | other events or factors, including those resulting from war, incidents of terrorism, or responses to these events; and |
| • | sales of shares of our Class A common stock by us or our stockholders. |
In addition, the stock markets have experienced extreme price and volume fluctuations that have affected and continue to affect the market prices of equity securities of many companies. Stock prices of many companies, and technology companies in particular, have fluctuated in a manner unrelated or disproportionate to the operating performance of those companies. In the past, stockholders have instituted securities class action litigation following periods of market volatility. If we were to become involved in securities litigation, it could subject us to substantial costs, divert resources and the attention of management from our business, and adversely affect our business.
46
Table of Contents
Sales of substantial amounts of our Class A common stock in the public markets, or the perception that they might occur, could cause the market price of our Class A common stock to decline.
Sales of a substantial number of shares of our Class A common stock into the public market, particularly sales by our directors, executive officers, and principal stockholders, or the perception that these sales might occur, could cause the market price of our Class A common stock to decline. We had a total of 59,634,569 shares of our Class A and Class B common stock outstanding as of December 31, 2017. All shares of our common stock are freely tradable, without restrictions or further registration under the Securities Act of 1933, as amended, or Securities Act, except that any shares held by our “affiliates” as defined in Rule 144 under the Securities Act would only be able to be sold in compliance with Rule 144.
In addition, certain holders of our common stock are, subject to certain conditions, entitled, under contracts providing for registration rights, to require us to file registration statements for the public resale of the Class A common stock issuable upon conversion of such holders’ shares of Class B common stock or to include such shares in registration statements that we may file for us or other stockholders.
Sales of our shares pursuant to registration rights may make it more difficult for us to sell equity securities in the future at a time and at a price that we deem appropriate. These sales also could cause the trading price of our Class A common stock to fall and make it more difficult for you to sell shares of our Class A common stock.
In addition, we have filed a registration statement to register shares reserved for future issuance under our equity compensation plans. Subject to the satisfaction of applicable exercise periods, the shares issued upon exercise of outstanding stock options or settlement of outstanding restricted stock units, or RSUs, will be available for immediate resale in the United States in the open market.
We may also issue our shares of common stock or securities convertible into shares of our common stock from time to time in connection with a financing, acquisition, investment, or otherwise. For example, we agreed to issue shares of our Class A common stock with an aggregate value of up to $2.3 million upon the achievement of certain milestones in connection with our acquisition of Semanta, of which 12,492 shares of Class A common stock were issued in August 2017 upon partial satisfaction of certain milestones. Any further such issuance could result in substantial dilution to our existing stockholders and cause the market price of our Class A common stock to decline.
The dual class structure of our common stock has the effect of concentrating voting control with holders of our Class B common stock, including our directors, executive officers, and 5% stockholders and their affiliates, which limits or precludes your ability to influence corporate matters, including the election of directors and the approval of any change of control transaction.
Our Class B common stock has ten votes per share and our Class A common stock has one vote per share. As of December 31, 2017, our directors, executive officers, and holders of more than 5% of our common stock, and their respective affiliates, held a substantial majority of the voting power of our capital stock. Because of the ten-to-one voting ratio between our Class B common stock and Class A common stock, the holders of our Class B common stock collectively control a majority of the combined voting power of our common stock and therefore are able to control all matters submitted to our stockholders for approval until the earliest of (i) the date specified by a vote of the holders of at least 66 2/3% of the outstanding shares of Class B common stock, (ii) March 29, 2027, or (iii) the date the shares of Class B common stock cease to represent at least 10% of the aggregate number of shares of Class A common stock and Class B common stock then outstanding. This concentrated control limits or precludes your ability to influence corporate matters for the foreseeable future, including the election of directors, amendments of our organizational documents, and any merger, consolidation, sale of all or substantially all of our assets, or other major corporate transaction requiring stockholder approval. In addition, this may prevent or discourage unsolicited acquisition proposals or offers for our capital stock that you may feel are in your best interest as one of our stockholders.
47
Table of Contents
Future transfers by holders of Class B common stock will generally result in those shares converting to Class A common stock, subject to limited exceptions, such as certain permitted transfers effected for estate planning purposes. The conversion of Class B common stock to Class A common stock will have the effect, over time, of increasing the relative voting power of those holders of Class B common stock who retain their shares in the long term.
If securities or industry analysts do not publish research, or publish inaccurate or unfavorable research, about our business, the price of our Class A common stock and trading volume could decline.
The trading market for our Class A common stock depends in part on the research and reports that securities or industry analysts publish about us or our business. If few securities analysts commence coverage of us, or if industry analysts cease coverage of us, the trading price for our common stock would be negatively affected. If one or more of the analysts who cover us downgrade our Class A common stock or publish inaccurate or unfavorable research about our business, the price of our Class A common stock would likely decline. If one or more of these analysts cease coverage of us or fail to publish reports on us regularly, demand for our Class A common stock could decrease, which might cause our Class A common stock price and trading volume to decline.
We do not intend to pay dividends for the foreseeable future.
We have never declared or paid any cash dividends on our common stock and do not intend to pay any cash dividends in the foreseeable future. We anticipate that for the foreseeable future we will retain all of our future earnings for use in the development of our business and for general corporate purposes. Any determination to pay dividends in the future will be at the discretion of our board of directors. Accordingly, investors must rely on sales of their common stock after price appreciation, which may never occur, as the only way to realize any future gains on their investments.
Provisions in our charter documents and under Delaware law could make an acquisition of our company more difficult, limit attempts by our stockholders to replace or remove our current management, limit our stockholders’ ability to obtain a favorable judicial forum for disputes with us or our directors, officers, or employees, and limit the market price of our Class A common stock.
Provisions in our restated certificate of incorporation and restated bylaws may have the effect of delaying or preventing a change of control or changes in our management. Our restated certificate of incorporation and restated bylaws include provisions that:
| • | provide that our board of directors will be classified into three classes of directors with staggered three-year terms; |
| • | permit the board of directors to establish the number of directors and fill any vacancies and newly-created directorships; |
| • | require super-majority voting to amend some provisions in our restated certificate of incorporation and restated bylaws; |
| • | authorize the issuance of “blank check” preferred stock that our board of directors could use to implement a stockholder rights plan; |
| • | provide that only the chairman of our board of directors, our chief executive officer, president, lead independent director, or a majority of our board of directors will be authorized to call a special meeting of stockholders; |
| • | provide for a dual class common stock structure in which holders of our Class B common stock have the ability to control the outcome of matters requiring stockholder approval, even if they own significantly less than a majority of the outstanding shares of our common stock, including the election of directors and significant corporate transactions, such as a merger or other sale of our company or its assets; |
48
Table of Contents
| • | prohibit stockholder action by written consent, which requires all stockholder actions to be taken at a meeting of our stockholders; |
| • | provide that the board of directors is expressly authorized to make, alter, or repeal our bylaws; and |
| • | establish advance notice requirements for nominations for election to our board of directors or for proposing matters that can be acted upon by stockholders at annual stockholder meetings. |
In addition, our restated certificate of incorporation provides that the Court of Chancery of the State of Delaware will be the exclusive forum for: any derivative action or proceeding brought on our behalf; any action asserting a breach of fiduciary duty; any action asserting a claim against us arising pursuant to the Delaware General Corporation Law, or DGCL, our restated certificate of incorporation, or our restated bylaws; or any action asserting a claim against us that is governed by the internal affairs doctrine. This choice of forum provision may limit a stockholder’s ability to bring a claim in a judicial forum that it finds favorable for disputes with us or any of our directors, officers, or other employees, which may discourage lawsuits with respect to such claims. Alternatively, if a court were to find the choice of forum provision contained in our restated certificate of incorporation to be inapplicable or unenforceable in an action, we may incur additional costs associated with resolving such action in other jurisdictions, which could harm our business, operating results, and financial condition.
Moreover, Section 203 of the DGCL may discourage, delay, or prevent a change of control of our company. Section 203 imposes certain restrictions on mergers, business combinations, and other transactions between us and holders of 15% or more of our common stock.
| Item 1B. | Unresolved Staff Comments. |
None
| Item 2. | Properties. |
Our corporate headquarters are located in Irvine, California, where we occupy facilities totaling approximately 70,000 square feet under a lease agreement that expires in August 2025. We also maintain offices in California, Colorado, Illinois, New York and Texas in the United States and Canada, the Czech Republic, France, Germany, Singapore, Ukraine, and the United Kingdom.
We intend to procure additional space as we add employees and expand geographically. We believe that our facilities are adequate to meet our needs for the immediate future, and that, should it be needed, suitable additional or substitute space will be available as needed to accommodate any such expansion of our operations.
| Item 3. | Legal Proceedings. |
For a description of our legal proceedings, see Note 15 of the notes to our consolidated financial statements included elsewhere in this Annual Report, which is incorporated by reference in response to this item.
In addition to the legal proceedings described in our consolidated financial statements, from time to time, we are involved in other legal proceedings arising in the ordinary course of our business. We are not a party to any other legal proceedings that, if determined adversely to us, would individually or taken together have a material adverse effect on our business, operating results, financial condition, or cash flows. Regardless of the outcome, litigation can have an adverse impact on us because of defense and settlement costs, diversion of management resources, and other factors.
| Item 4. | Mine Safety Disclosures. |
Not applicable.
49
Table of Contents
PART II
| Item 5. | Markets for Registrant’s Common Equity, Related Stockholder Matters and Issuer Purchases of Equity Securities. |
Market Information for Common Stock
Our Class A common stock has been traded on the New York Stock Exchange under the symbol “AYX” since March 24, 2017. Prior to that time, there was no public market for our common stock. The following table sets forth, for the periods indicated, the high and low intraday sales prices for our Class A common stock as reported by the New York Stock Exchange. On February 28, 2018, the closing price of our Class A common stock was $34.19.
| 2017 | ||||||||
| High | Low | |||||||
| First Quarter (from March 24, 2017) |
$ | 17.50 | $ | 14.61 | ||||
| Second Quarter |
$ | 20.50 | $ | 14.79 | ||||
| Third Quarter |
$ | 24.07 | $ | 18.64 | ||||
| Fourth Quarter |
$ | 29.16 | $ | 19.98 | ||||
Our Class B common stock is not listed or traded on any stock exchange.
Holders of Record
As of February 28, 2018, there were 49 registered holders of our Class A common stock and 62 registered holders of our Class B common stock. Because many of our shares of Class A common stock are held by brokers and other institutions on behalf of stockholders, we are unable to estimate the total number of stockholders represented by these record holders.
Dividend Policy
We have never declared or paid cash dividends on our capital stock. We do not expect to pay dividends on our capital stock for the foreseeable future. Instead, we anticipate that all of our earnings for the foreseeable future will be used for the operation and growth of our business. Any future determination to declare cash dividends would be subject to the discretion of our board of directors and would depend upon various factors, including our operating results, financial condition, and capital requirements, restrictions that may be imposed by applicable law, and other factors deemed relevant by our board of directors.
Securities Authorized for Issuance under Equity Compensation Plans
The information required by this item will be included in our Proxy Statement for the 2018 Annual Meeting of Stockholders to be filed with the SEC within 120 days of the fiscal year ended December 31, 2017, and is incorporated herein by reference.
Stock Performance Graph
The following performance graph and related information shall not be deemed “filed” for purposes of Section 18 of the Exchange Act or incorporated by reference into any of our other filings under the Securities Act or the Exchange Act, except as shall be expressly set forth by specific reference in such filing.
The chart compares the cumulative return on our Class A common stock with that of the NYSE Composite Index and the NASDAQ Computer and Data Processing Services Index. The chart assumes $100 was invested at the close of market on March 24, 2017, which was our initial trading day, in our Class A common stock, the
50
Table of Contents
NYSE Composite Index, and the NASDAQ Computer and Data Processing Services Index, and assumes the reinvestment of any dividend. The stock price performance reflected in the performance graph is not necessarily indicative of future stock performance.
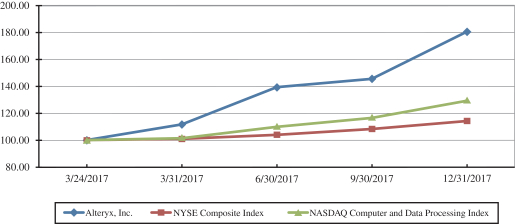
Recent Sales of Unregistered Securities
None.
Use of Proceeds
On March 23, 2017, the SEC declared our registration statement on Form S-1 (File No. 333-216237) for our IPO effective, and the offering commenced the following day. The offering did not terminate before all of the securities registered in the registration statement were sold. Goldman, Sachs & Co. and J.P. Morgan Securities LLC acted as joint book-running managers for the offering. Pacific Crest Securities, a division of KeyBanc Capital Markets Inc., William Blair & Company, L.L.C., JMP Securities LLC, Raymond James & Associates, Inc., and Cowen and Company, LLC acted as co-managers.
We registered an aggregate of 10,350,000 shares of our Class A common stock, including 1,350,000 shares pursuant to the underwriters’ option to purchase additional shares. On March 29, 2017, we closed our IPO, in which we sold 9,000,000 shares of our Class A common stock. On April 18, 2017, we closed the sale of the additional 1,350,000 shares of our Class A common stock. The shares were sold at a public offering price of $14.00 per share for an aggregate gross offering price of approximately $144.9 million. We received net proceeds of $134.8 million after deducting underwriting discounts and commissions of $10.1 million but before deducting offering costs. We incurred offering expenses of approximately $3.4 million, of which $1.0 million was paid in the year ended December 31, 2016 and $2.4 million was paid in the year ended December 31, 2017. Thus, the net offering proceeds, after deducting underwriting discounts and offering expenses, were approximately $131.4 million. No payments were made to our directors or officers or their associates, holders of 10% or more of any class of our equity securities, or to our affiliates in connection with the issuance and sale of the securities registered.
There has been no material change in the planned use of proceeds from our IPO as described in our final prospectus filed with the SEC on March 24, 2017 pursuant to Rule 424(b)(4).
Issuer Purchases of Equity Securities
None
51
Table of Contents
| Item 6. | Selected Financial Data |
The following tables provide our historical selected consolidated financial data for the periods indicated. We have derived the selected consolidated statements of operations data for the fiscal years ended December 31, 2017, 2016, and 2015 and the selected consolidated balance sheet data as of December 31, 2017 and 2016 from our audited consolidated financial statements included elsewhere in this Annual Report. We have derived the selected consolidated statements of operations data for the fiscal year ended December 31, 2014 and the selected consolidated balance sheet data as of December 31, 2015 and 2014 from our audited consolidated financial statements, which are not included in this Annual Report. Our historical results are not necessarily indicative of the results we expect in the future.
The following historical selected consolidated financial data should be read in conjunction with, and are qualified in their entirety by reference to, the section entitled “Management’s Discussion and Analysis of Financial Condition and Results of Operations” and our consolidated financial statements and the related notes included elsewhere in this Annual Report.
| Year Ended December 31, | ||||||||||||||||
| 2017 | 2016 | 2015 | 2014 | |||||||||||||
| (in thousands) | ||||||||||||||||
| Consolidated Statements of Operations Data: |
||||||||||||||||
| Revenue |
$ | 131,607 | $ | 85,790 | $ | 53,821 | $ | 37,984 | ||||||||
| Cost of revenue(1)(2) |
21,803 | 16,026 | 10,521 | 8,533 | ||||||||||||
|
|
|
|
|
|
|
|
|
|||||||||
| Gross profit |
109,804 | 69,764 | 43,300 | 29,451 | ||||||||||||
|
|
|
|
|
|
|
|
|
|||||||||
| Operating expenses: |
||||||||||||||||
| Research and development(1) |
29,342 | 17,481 | 11,103 | 7,787 | ||||||||||||
| Sales and marketing(1)(2) |
66,420 | 57,585 | 43,244 | 24,612 | ||||||||||||
| General and administrative(1) |
32,241 | 17,720 | 10,039 | 17,264 | ||||||||||||
|
|
|
|
|
|
|
|
|
|||||||||
| Total operating expenses |
128,003 | 92,786 | 64,386 | 49,663 | ||||||||||||
|
|
|
|
|
|
|
|
|
|||||||||
| Loss from operations |
(18,199 | ) | (23,022 | ) | (21,086 | ) | (20,212 | ) | ||||||||
| Other expense, net |
(205 | ) | (1,028 | ) | (186 | ) | (81 | ) | ||||||||
|
|
|
|
|
|
|
|
|
|||||||||
| Loss before provision for (benefit of) income taxes |
(18,404 | ) | (24,050 | ) | (21,272 | ) | (20,293 | ) | ||||||||
| Provision for (benefit of) income taxes |
(905 | ) | 208 | 178 | 36 | |||||||||||
|
|
|
|
|
|
|
|
|
|||||||||
| Net loss |
$ | (17,499 | ) | $ | (24,258 | ) | $ | (21,450 | ) | $ | (20,329 | ) | ||||
|
|
|
|
|
|
|
|
|
|||||||||
| Less: Accretion of Series A redeemable convertible preferred stock |
(1,983 | ) | (6,442 | ) | (2,603 | ) | (1,669 | ) | ||||||||
|
|
|
|
|
|
|
|
|
|||||||||
| Net loss attributable to common stockholders |
$ | (19,482 | ) | $ | (30,700 | ) | $ | (24,053 | ) | $ | (21,998 | ) | ||||
|
|
|
|
|
|
|
|
|
|||||||||
| Net loss per share attributable to common stockholders, basic and diluted |
$ | (0.37 | ) | $ | (0.95 | ) | $ | (0.76 | ) | $ | (1.37 | ) | ||||
|
|
|
|
|
|
|
|
|
|||||||||
| Weighted-average shares used to compute net loss per share attributable to common stockholders, basic and diluted(3) |
53,006 | 32,440 | 31,697 | 16,112 | ||||||||||||
|
|
|
|
|
|
|
|
|
|||||||||
52
Table of Contents
| (1) | Amounts include stock-based compensation expense as follows: |
| Year Ended December 31, | ||||||||||||||||
| 2017 | 2016 | 2015 | 2014 | |||||||||||||
| (in thousands) | ||||||||||||||||
| Cost of revenue |
$ | 485 | $ | 106 | $ | 34 | $ | 34 | ||||||||
| Research and development |
1,635 | 338 | 239 | 1,081 | ||||||||||||
| Sales and marketing |
2,302 | 1,281 | 800 | 183 | ||||||||||||
| General and administrative |
4,519 | 1,559 | 409 | 9,379 | ||||||||||||
|
|
|
|
|
|
|
|
|
|||||||||
| Total |
$ | 8,941 | $ | 3,284 | $ | 1,482 | $ | 10,677 | ||||||||
|
|
|
|
|
|
|
|
|
|||||||||
| (2) | Amounts include amortization of intangible assets as follows: |
| Year Ended December 31, | ||||||||||||||||
| 2017 | 2016 | 2015 | 2014 | |||||||||||||
| (in thousands) | ||||||||||||||||
| Cost of revenue |
$ | 1,213 | $ | — | $ | — | $ | — | ||||||||
| Sales and marketing |
12 | — | — | — | ||||||||||||
|
|
|
|
|
|
|
|
|
|||||||||
| Total |
$ | 1,225 | $ | — | $ | — | $ | — | ||||||||
|
|
|
|
|
|
|
|
|
|||||||||
| (3) | See Notes 2 and 17 of the notes to our consolidated financial statements included elsewhere in this Annual Report for an explanation of the calculations of our net loss per share attributable to common stockholders, basic and diluted. |
| As of December 31, | ||||||||||||||||
| 2017 | 2016 | 2015 | 2014 | |||||||||||||
| (in thousands) | ||||||||||||||||
| Consolidated Balance Sheet Data: |
||||||||||||||||
| Cash and cash equivalents and short-term and long- term investments |
$ | 194,066 | $ | 52,700 | $ | 61,143 | $ | 24,642 | ||||||||
| Working capital |
111,499 | 14,861 | 14,842 | 9,220 | ||||||||||||
| Total assets |
291,416 | 111,415 | 97,138 | 48,669 | ||||||||||||
| Deferred revenue—current |
110,213 | 71,050 | 44,179 | 28,927 | ||||||||||||
| Redeemable convertible preferred stock |
— | 99,182 | 92,740 | 41,618 | ||||||||||||
| Total stockholders’ equity (deficit) |
153,504 | (77,610 | ) | (52,911 | ) | (31,671 | ) | |||||||||
| Item 7. | Management’s Discussion and Analysis of Financial Condition and Results of Operations. |
You should read the following discussion and analysis of our financial condition and results of operations together with the consolidated financial statements and related notes that are included elsewhere in this Annual Report. This discussion contains forward-looking statements based upon current expectations that involve risks and uncertainties. Our actual results may differ materially from those anticipated in these forward-looking statements as a result of various factors, including those set forth under “Risk Factors,” set forth in Part I, Item 1A of this Annual Report. See “Special Note Regarding Forward-Looking Statements” above.
Overview
We are a leading provider of self-service data analytics software. Our software platform enables organizations to dramatically improve business outcomes and the productivity of their business analysts. Our subscription-based platform allows organizations to easily prepare, blend, and analyze data from a multitude of sources and more quickly benefit from data-driven decisions. The ease-of-use, speed, and sophistication that our platform provides is enhanced through intuitive and highly repeatable visual workflows. We aim to make our platform as ubiquitous in the workplace as spreadsheets are today.
53
Table of Contents
Our platform includes Alteryx Designer, our data preparation, blending, and analytics product deployable to the cloud and on premise, Alteryx Server, our secure and scalable product for sharing and running analytic applications in a web-based environment, Alteryx Connect, our collaborative data exploration platform for discovering information assets and sharing recommendations across the enterprise, and Alteryx Promote, our real-time model deployment solution for data scientists and analytics teams to build, manage, and deploy predictive models to production. In addition, Alteryx Analytics Gallery, our cloud-based collaboration offering, is a key feature of our platform allowing users to share workflows in a centralized repository. Our platform has been adopted by organizations across a wide variety of industries and sizes. As of December 31, 2017, we had 3,392 customers in more than 70 countries, including over 400 of the Global 2,000 companies.
We derive substantially all our revenue from subscriptions for use of our platform. Our software can be licensed for use on a desktop or server, or it can be delivered through a hosted model. Subscription periods for our platform generally range from one to three years and the subscription fees are typically billed annually in advance. We recognize revenue from subscription fees ratably over the term of the contract. Revenue from subscriptions represented over 95% of revenue for each of the years ended December 31, 2017 and December 31, 2016. We also generate revenue from professional services, including training and consulting services.
We employ a “land and expand” business model. Our go-to-market approach often begins with a free trial and is followed by an initial purchase of our platform. As organizations realize the benefits derived from our platform, use frequently spreads across departments, divisions, and geographies through word-of-mouth, collaboration, and standardization of business processes. Over time, many of our customers find that the use of our platform is more strategic in nature and our platform becomes a fundamental element of their regular analytical processes.
We sell our platform primarily through direct sales and marketing channels utilizing a wide range of online and offline sales and marketing activities. In addition, we have cultivated strong relationships with channel partners to help us extend the reach of our sales and marketing efforts, especially internationally. Our channel partners include technology alliances, system integrators, management consulting firms, and value-added resellers. These channel partners also provide solution-based selling, services, and training internationally.
Key Factors Affecting Our Performance
We believe that our future performance will depend on many factors, including those described below. While these areas present significant opportunity, they also present risks that we must manage to achieve successful results. For more information about these risks, see the section titled “Risk Factors” included elsewhere in this Annual Report. If we are unable to address these risks, our business and operating results could be adversely affected.
Expansion and Further Penetration of Our Customer Base. We employ a “land and expand” business model that focuses on efficiently acquiring new customers and growing our relationships with existing customers over time. Our future revenue growth and our ability to achieve and maintain profitability is dependent upon our ability to continue landing new customers and expanding the adoption of our platform by additional users within their organizations. We believe significant opportunity exists for us to acquire new customers, as well as expand existing customers’ use of our platform by identifying additional use cases, departments, and divisions for our platform and increasing the number of users within our existing customers’ organizations. We believe this expansion would provide us with substantial operating leverage because the costs to expand sales within existing customers are significantly less than the costs to acquire new customers.
International Expansion. We have recently increased our focus on international markets. For the years ended December 31, 2017, 2016, and 2015, we derived 23%, 19%, and 14% of our revenue outside of the United States, respectively. We believe that the global opportunity for self-service data analytics solutions is significant,
54
Table of Contents
and should continue to expand as organizations outside the United States seek to adopt self-service platforms as we have experienced with our existing customers. To capitalize on this opportunity, we intend to continue to invest in growing our presence internationally. Our growth and the success of our initiatives in markets outside of the United States will depend on the continued adoption of our platform by our existing customers, as well as our ability to attract new customers.
Investment in Growth. We plan to continue investing in our business so that we can capitalize on our market opportunity. We intend to continue to add headcount to our global sales and marketing team to acquire new customers and to increase sales to existing customers. We intend to continue to add headcount to our research and development team to extend the functionality and range of our platform by bringing new and improved products and services to our customers. We believe that these investments will contribute to our long-term growth, although they may adversely affect our operating results in the near term.
Market Adoption of Our Platform. A key focus of our sales and marketing efforts is to continue creating market awareness about the benefits of our platform. While we cannot predict customer adoption rates and demand, the future growth rate and size of the self-service data analytics market, or the introduction of competitive products and services, our business and operating results will be significantly affected by the degree to and speed with which organizations adopt self-service data analytics solutions and our platform.
Acquisitions. Our business strategy has included, and may in the future include, acquiring other complementary products, technologies, or businesses that allow us to reduce the time or costs required to develop new technologies, incorporate enhanced functionality into and complement our existing product offerings, augment our engineering workforce, and enhance our technological capabilities. In January 2017, we acquired Semanta to enhance our data governance capabilities and, in May 2017, we acquired Yhat to enhance our capabilities for managing and deploying advanced analytic models. The consolidated financial statements include the results of operations of the acquired companies commencing as of their respective acquisition dates. See Note 3 of the notes to our consolidated financial statements included in Part III, Item 8 of this Annual Report for additional information related to these acquisitions.
Key Business Metrics
We review the following key business metrics to evaluate our business, measure our performance, identify trends affecting our business, formulate business plans, and make strategic decisions:
Number of Customers. We believe that our ability to expand our customer base is a key indicator of our market penetration, the growth of our business, and our future potential business opportunities. We define a customer at the end of any particular period as an entity with a subscription agreement that runs through the current or future period as of the measurement date. Organizations with free trials have not entered into a subscription agreement and are not considered customers. A single organization with separate subsidiaries, segments, or divisions that use our platform may represent multiple customers, as we treat each entity that is invoiced separately as a single customer. In cases where customers subscribe to our platform through our channel partners, each end customer is counted separately.
The following table summarizes the number of our customers at each quarter end for the periods indicated:
| As of | ||||||||||||||||||||||||||||||||
| Mar. 31, | Jun. 30, | Sep. 30, | Dec. 31, | Mar. 31, | Jun. 30, | Sep. 30, | Dec. 31, | |||||||||||||||||||||||||
| 2016 | 2016 | 2016 | 2016 | 2017 | 2017 | 2017 | 2017 | |||||||||||||||||||||||||
| Customers |
1,578 | 1,834 | 2,047 | 2,328 | 2,565 | 2,823 | 3,054 | 3,392 | ||||||||||||||||||||||||
Dollar-Based Net Revenue Retention Rate. We believe that our dollar-based net revenue retention rate is a key measure to provide insight into the long-term value of our customers and our ability to retain and expand
55
Table of Contents
revenue from our customer base over time. Our dollar-based net revenue retention rate is a trailing four-quarter average of the subscription revenue from a cohort of customers in a quarter as compared to the same quarter in the prior year. Dollar-based net revenue retention rate equal to 100% would indicate that we received the same amount of revenue from our cohort of customers in the current quarter as we did in the same quarter of the prior year. Dollar-based net revenue retention rate less than 100% would indicate that we received less revenue from our cohort of customers in the current quarter than we did in the same quarter of the prior year.
To calculate our dollar-based net revenue retention rate, we first identify a cohort of customers, or the Base Customers, in a particular quarter, or the Base Quarter. A customer will not be considered a Base Customer unless such customer has an active subscription for the entirety of the Base Quarter. We then divide the revenue in the same quarter of the subsequent year attributable to the Base Customers, or the Comparison Quarter, including Base Customers from which we no longer derive revenue in the Comparison Quarter, by the revenue attributable to those Base Customers in the Base Quarter. Our dollar- based net revenue retention rate in a particular quarter is then obtained by averaging the result from that particular quarter by the corresponding result from each of the prior three quarters. The dollar-based net revenue retention rate excludes revenue from professional services from that cohort.
The following table summarizes our dollar-based net revenue retention rate for each quarter for the periods indicated:
| Three Months Ended | ||||||||||||||||||||||||||||||||
| Mar. 31, 2016 |
Jun. 30, 2016 |
Sep. 30, 2016 |
Dec. 31, 2016 |
Mar. 31, 2017 |
Jun. 30, 2017 |
Sep. 30, 2017 |
Dec. 31, 2017 |
|||||||||||||||||||||||||
| Dollar-based net revenue retention rate |
126 | % | 127 | % | 129 | % | 135 | % | 133 | % | 134 | % | 133 | % | 131 | % | ||||||||||||||||
Components of Our Results of Operations
Revenue
We derive our revenue primarily from the sale of software subscriptions. Revenue from subscriptions reflects the revenue recognized from sales of licenses to our platform to new customers and additional licenses to existing customers. Subscription fees are based primarily on the number of users of our platform. We recognize subscription revenue ratably over the term of the contract, commencing with the date on which the platform is first made available to the customer, and when all other revenue recognition criteria are met. Our subscription agreements generally have terms ranging from one to three years and are billed annually in advance. Subscriptions are generally non-cancelable during the subscription term and subscription fees are non-refundable. Our subscription agreements provide for unspecified future updates, upgrades, and enhancements, and technical product support. We also generate revenue from licensing third-party syndicated data packaged with subscriptions, which we recognize ratably over the subscription period. We also derive revenue from professional services fees earned for consulting engagements related to training customers and channel partners, and consulting services. Revenue from professional services relating to training results from contracts to provide educational services to customers and channel partners regarding the use of our technologies and is recognized as the services are provided. Consulting revenue is recognized on a time and materials basis as services are provided. Revenue from professional services represented 5% or less of revenue for each of the years ended December 31, 2017, 2016, and 2015. Over the long term, we expect our revenue from professional services to decrease as a percentage of our revenue. In addition, due to our “land and expand” business model, a substantial majority of our revenue in any given period is attributable to our existing customers compared to new customers.
For a description of our revenue recognition policies, see the section titled “Critical Accounting Policies and Estimates” within this Management’s Discussion and Analysis of Financial Condition and Result of Operations.
56
Table of Contents
Cost of Revenue
Cost of revenue consists primarily of employee-related costs, including salaries and bonuses, stock-based compensation expense, and employee benefit costs associated with our customer support and professional services organizations. It also includes expenses related to hosting and operating our cloud infrastructure in a third-party data center, licenses of third-party syndicated data, amortization of intangible assets, and related overhead expenses. The majority of our cost of revenue does not fluctuate directly with increases in revenue.
We allocate shared overhead costs such as information technology infrastructure, rent, and occupancy charges in each expense category based on headcount in that category. As such, general overhead expenses are reflected in cost of revenue.
We intend to continue to invest additional resources in our cloud infrastructure. We expect that the cost of third-party data center hosting fees will increase over time as we continue to expand our cloud-based offering.
Gross Profit and Gross Margin
Gross profit is revenue less cost of revenue. Gross margin is gross profit expressed as a percentage of revenue. Our gross margin has fluctuated and may fluctuate from period to period based on a number of factors, including the mix of products and services we sell, the channel through which we sell our products and services, and, to a lesser degree, the utilization of customer support and professional services resources, as well as third-party hosting and syndicated data fees in any given period. Our gross margin may fluctuate from period to period depending on the interplay of the factors discussed above.
Operating Expenses
Our operating expenses are classified as research and development, sales and marketing, and general and administrative. For each of these categories, the largest component is employee-related costs, which include salaries and bonuses, stock-based compensation expense, and employee benefit costs. We allocate shared overhead costs such as information technology infrastructure, rent, and occupancy charges in each expense category based on headcount in that category.
Research and development. Research and development expense consists primarily of employee-related costs, including salaries and bonuses, stock-based compensation expense, and employee benefit costs, for our research and development employees, depreciation of equipment used in research and development, third-party contractors, and related allocated overhead costs. We expect research and development expenses to continue to increase in absolute dollars for the foreseeable future as we continue to increase the functionality and otherwise enhance our platform and develop new products and services. However, we expect research and development expense to decrease as a percentage of revenue over the long term, although research and development expense may fluctuate as a percentage of revenue from period to period due to the seasonality of revenue and the timing and extent of these expenses.
Sales and marketing. Sales and marketing expense consists primarily of employee-related costs, including salaries and bonuses, sales commissions, stock-based compensation expense, and employee benefit costs, for our sales and marketing employees, marketing programs, and related allocated overhead costs. Our sales and marketing employees include quota-carrying headcount, sales operations, and administration, marketing, and management. Marketing programs consist of advertising, promotional events such as our U.S. and European Inspire customer conferences, corporate communications, brand building, and product marketing activities such as online lead generation.
We plan to continue to invest in sales and marketing by expanding our global promotional activities, building brand awareness, attracting new customers, and sponsoring additional marketing events. The timing of
57
Table of Contents
these events, such as our annual sales kickoff in the first quarter and our annual U.S. and European Inspire customer conferences in the second and third quarters, respectively, will affect our sales and marketing expense in a particular quarter. We expect sales and marketing expense to continue to increase in absolute dollars for the foreseeable future as we expand our online and offline marketing efforts to increase demand for our platform and awareness of our brand and as we continue to expand our direct sales team and indirect sales channels both in the United States and internationally, and to continue to be our largest operating expense category. However, we expect sales and marketing expense to decrease as a percentage of revenue over the long term, although sales and marketing expense may fluctuate as a percentage of revenue from period to period due to the seasonality of revenue and the timing and extent of these expenses.
General and administrative. General and administrative expense consists primarily of employee-related costs, including salaries and bonuses, stock-based compensation expense, and employee benefit costs, for our executive officers and finance, legal, human resources, and administrative personnel, professional fees for external legal, accounting, and other consulting services, including those incurred in connection with our business combinations and follow-on public offering, changes in the fair value of contingent consideration, and related allocated overhead costs. We expect general and administrative expense to continue to increase in absolute dollars for the foreseeable future as we continue to grow and incur the costs associated with being a publicly traded company, including increased legal, audit, and consulting fees. However, we expect general and administrative expense to decrease as a percentage of revenue over the long term as we improve our processes, systems, and controls to enable our internal support functions to scale with the growth of our business, although general and administrative expense may fluctuate as a percentage of revenue from period to period due to the seasonality of revenue and the timing and extent of these expenses.
Other Expense, Net
Other expense, net, consists primarily of foreign exchange gains and losses from foreign currency transactions denominated in currency other than the functional currency, interest income from our available-for-sale investments, and impairment of a cost method investment.
Provision for (Benefit of) Income Taxes
Provision for (benefit of) income taxes consists primarily of income taxes in certain foreign jurisdictions in which we conduct business, and discrete tax benefits related to our business acquisitions. As we have expanded our international operations, we have incurred increased foreign tax expense, and we expect this trend to continue. We maintain a valuation allowance for domestic net deferred tax assets, including net operating loss carryforwards, and tax credits related primarily to research and development to the extent that they are not expected to be recoverable. Due to our history of domestic losses, we expect to maintain this valuation allowance for the foreseeable future.
Results of Operations for the Years Ended December 31, 2017, 2016, and 2015
Revenue
| Year Ended December 31, | 2017 vs 2016 | 2016 vs 2015 | ||||||||||||||||||||||||||
| 2017 | 2016 | 2015 | $ Change | % Change | $ Change | % Change | ||||||||||||||||||||||
| (in thousands, except percentages) | ||||||||||||||||||||||||||||
| Revenue |
$ | 131,607 | $ | 85,790 | $ | 53,821 | $ | 45,817 | 53.4 | % | $ | 31,969 | 59.4 | % | ||||||||||||||
The increase in revenue for the year ended December 31, 2017 as compared to the year ended December 31, 2016 and the increase in revenue for the year ended December 31, 2016 as compared to the year ended
58
Table of Contents
December 31, 2015 was $45.8 million, or 53%, and $32.0 million, or 59%, respectively. The increases are attributable primarily to additional sales to existing customers and, to a lesser extent, the increase in our total number of customers. For the years ended December 31, 2017, 2016, and 2015, revenue attributed to existing customers was 90%, 92%, and 89%, respectively, of our revenue.
Cost of Revenue and Gross Margin
| Year Ended December 31, | 2017 vs 2016 | 2016 vs 2015 | ||||||||||||||||||||||||||
| 2017 | 2016 | 2015 | $ Change | % Change | $ Change | % Change | ||||||||||||||||||||||
| (in thousands, except percentages) | ||||||||||||||||||||||||||||
| Cost of revenue |
$ | 21,803 | $ | 16,026 | $ | 10,521 | $ | 5,777 | 36.0 | % | $ | 5,505 | 52.3 | % | ||||||||||||||
| % of revenue |
16.6 | % | 18.7 | % | 19.5 | % | ||||||||||||||||||||||
| Gross margin |
83.4 | % | 81.3 | % | 80.5 | % | ||||||||||||||||||||||
Cost of revenue increased $5.8 million, or 36%, for the year ended December 31, 2017 as compared to the year ended December 31, 2016. The increase was primarily due to an increase in royalties associated with third-party syndicated data costs of $3.1 million, an increase in the amortization of intangible assets acquired in our recent acquisitions of $1.2 million, and an increase in our use of third-party contractors to provide professional services to our customers of $0.9 million. The use of third-party contractors also resulted in the reduction of headcount in cost of revenue personnel from 63 at December 31, 2016 to 58 as of December 31, 2017.
Cost of revenue increased $5.5 million, or 52%, for the year ended December 31, 2016 as compared to the year ended December 31, 2015. The increase in cost of revenue was primarily due to an increase in employee-related costs of $2.9 million due to higher headcount and the timing of when these employees were hired, an increase in royalties associated with third-party syndicated data costs of $1.8 million, and an increase of $0.7 million in allocated overhead expenses. A majority of the employees hired during the year ended December 31, 2015 were hired later in the period; accordingly, the corresponding increase in cost of revenue was not fully reflected in employee-related costs for that period. Employee-related costs for the year ended December 31, 2016 reflected the full cost of these employees and the additional employees hired in 2016. As of December 31, 2016, we had 63 customer support, professional service, and fulfillment personnel compared to 58 as of December 31, 2015.
The increase in gross margin for the year ended December 31, 2017 as compared to the year ended December 31, 2016 and for the year ended December 31, 2016 as compared to the year ended December 31, 2015 was the result of an increase in the proportion of revenue from subscriptions relative to revenue from professional services, as well as an increase in the use of our community site for self-service support, which relies on engagement with other end-users and our partners, resulting in lower support costs as a percentage of revenue.
Research and Development
| Year Ended December 31, | 2017 vs 2016 | 2016 vs 2015 | ||||||||||||||||||||||||||
| 2017 | 2016 | 2015 | $ Change | % Change | $ Change | % Change | ||||||||||||||||||||||
| (in thousands, except percentages) | ||||||||||||||||||||||||||||
| Research and development |
$ | 29,342 | $ | 17,481 | $ | 11,103 | $ | 11,861 | 67.9 | % | $ | 6,378 | 57.4 | % | ||||||||||||||
| % of revenue |
22.3 | % | 20.4 | % | 20.6 | % | ||||||||||||||||||||||
Research and development expense increased $11.9 million, or 68%, for the year ended December 31, 2017 as compared to the year ended December 31, 2016. The increase in research and development expense was primarily due to an increase in employee-related costs, excluding stock-based compensation, of $8.2 million due to higher headcount, an increase in stock-based compensation of $1.3 million due to higher headcount and stock
59
Table of Contents
awards issued in connection with the acquisition of Yhat, and an increase of $1.2 million in IT and facilities overhead expenses including depreciation. As of December 31, 2017, we had 160 research and development personnel compared to 106 as of December 31, 2016.
Research and development expense increased $6.4 million, or 57%, for the year ended December 31, 2016 as compared to the year ended December 31, 2015. The increase in research and development expense was primarily due to an increase in employee-related costs of $5.0 million due to higher headcount and an increase of $1.0 million in allocated overhead expenses. As of December 31, 2016, we had 106 research and development personnel compared to 71 as of December 31, 2015.
Sales and Marketing
| Year Ended December 31, | 2017 vs 2016 | 2016 vs 2015 | ||||||||||||||||||||||||||
| 2017 | 2016 | 2015 | $ Change | % Change | $ Change | % Change | ||||||||||||||||||||||
| (in thousands, except percentages) | ||||||||||||||||||||||||||||
| Sales and marketing |
$ | 66,420 | $ | 57,585 | $ | 43,244 | $ | 8,835 | 15.3 | % | $ | 14,341 | 33.2 | % | ||||||||||||||
| % of revenue |
50.5 | % | 67.1 | % | 80.3 | % | ||||||||||||||||||||||
Sales and marketing expense increased $8.8 million, or 15%, for the year ended December 31, 2017 as compared to the year ended December 31, 2016. The increase in sales and marketing expense was primarily due to an increase in employee-related costs of $7.0 million due to higher headcount and an increase of $1.2 million in IT and facilities overhead expenses including depreciation. The increase in employee-related costs includes a decrease of $1.2 million for certain cash-based performance awards for eligible sales personnel due to an increase in the proportion of the cash-based performance awards that were directly related to a specific customer contract which have been deferred and will be recognized over the term of the contract in the year ended December 31, 2017 as compared to December 31, 2016. In addition, a majority of the employees hired during the year ended December 31, 2017 were hired later in the period; accordingly, the corresponding increase in sales and marketing expense was not fully reflected in employee-related costs for the year ended December 31, 2017. As of December 31, 2017, we had 252 sales and marketing personnel compared to 190 as of December 31, 2016.
Sales and marketing expense increased $14.3 million, or 33%, for the year ended December 31, 2016 as compared to the year ended December 31, 2015. The increase in sales and marketing expense was primarily due to an increase in employee-related costs of $10.2 million due to higher headcount and an increase of $2.4 million in costs associated with marketing programs, including increased costs associated with our annual Inspire customer conference in the United States and costs associated with our first Inspire customer conference in Europe. As of December 31, 2016, we had 190 sales and marketing personnel compared to 152 as of December 31, 2015.
General and Administrative
| Year Ended December 31, | 2017 vs 2016 | 2016 vs 2015 | ||||||||||||||||||||||||||
| 2017 | 2016 | 2015 | $ Change | % Change | $ Change | % Change | ||||||||||||||||||||||
| (in thousands, except percentages) | ||||||||||||||||||||||||||||
| General and administrative |
$ | 32,241 | $ | 17,720 | $ | 10,039 | $ | 14,521 | 81.9 | % | $ | 7,681 | 76.5 | % | ||||||||||||||
| % of revenue |
24.5 | % | 20.7 | % | 18.7 | % | ||||||||||||||||||||||
General and administrative expense increased $14.5 million, or 82%, for the year ended December 31, 2017 as compared to the year ended December 31, 2016. The increase in general and administrative expense was primarily due to an increase in employee-related costs, excluding stock-based compensation, of $4.1 million due to higher headcount as we continue to expand our infrastructure to support our growth, an increase in stock-based compensation of $3.0 million due to higher headcount and the recognition of expenses related to RSUs triggered by our IPO, an increase of $3.2 million in consulting, accounting, legal and professional fees related to becoming
60
Table of Contents
a public company, our recent acquisitions and costs related to our follow-on public offering, and an increase of $2.5 million in IT and facilities overhead expenses, including depreciation. As of December 31, 2017, we had 85 general and administrative personnel compared to 65 as of December 31, 2016.
General and administrative expense increased $7.7 million, or 77%, for the year ended December 31, 2016 as compared to the year ended December 31, 2015. The increase in general and administrative expense was primarily due to an increase in employee-related costs of $4.6 million due to higher headcount as we continued to expand our infrastructure to support our growth and prepared to become a publicly traded company, and an increase in legal and professional fees of $1.3 million. As of December 31, 2016, we had 65 general and administrative personnel compared to 45 as of December 31, 2015.
Other Expense, Net
| Year Ended December 31, | 2017 vs 2016 | 2016 vs 2015 | ||||||||||||||||||||||||||
| 2017 | 2016 | 2015 | $ Change | % Change | $ Change | % Change | ||||||||||||||||||||||
| (in thousands, except percentages) | ||||||||||||||||||||||||||||
| Other expense, net |
$ | (205 | ) | $ | (1,028 | ) | $ | (186 | ) | $ | 823 | (80.1 | %) | $ | (842 | ) | 452.7 | % | ||||||||||
The decrease in other expense, net of $0.8 million, or 80%, for the year ended December 31, 2017 as compared to the year ended December 31, 2016 was primarily due to increases in interest income due to an increase in the balance of available-for-sale securities and foreign currency transaction gains and losses due to fluctuations in foreign currencies against the U.S. Dollar, offset in part by a $1.1 million impairment of a cost method investment.
Increases in other expense, net in the year ended December 31, 2016 as compared to the year ended December 31, 2015 was the result of foreign currency transaction losses from billings to customers and payments of operating expenses not denominated in U.S. dollars.
Provision for (Benefit of) Income Taxes
| Year Ended December 31, | 2017 vs 2016 | 2016 vs 2015 | ||||||||||||||||||||||||||
| 2017 | 2016 | 2015 | $ Change | % Change | $ Change | % Change | ||||||||||||||||||||||
| (in thousands, except percentages) | ||||||||||||||||||||||||||||
| Provision for (benefit of) income taxes |
$ | (905 | ) | $ | 208 | $ | 178 | $ | (1,113 | ) | * | $ | 30 | * | ||||||||||||||
| * | Not meaningful |
The benefit of income taxes of $0.9 million for the year ended December 31, 2017 is primarily due to a tax benefit of $1.0 million related to a decrease in our valuation allowance against our deferred tax assets related to the Yhat acquisition, offset in part by foreign taxes as a result of our global expansion during the year ended December 31, 2017.
The increase in the provision for income taxes for the year ended December 31, 2016 as compared to the year ended December 31, 2015 was primarily due to higher foreign taxes as a result of our global expansion during the year ended December 31, 2016.
Liquidity and Capital Resources
| As of December 31, | ||||||||||||
| 2017 | 2016 | $ Change | ||||||||||
| (in thousands) | ||||||||||||
|
Cash and cash equivalents and short-term and long-term investments |
$ | 194,066 | $ | 52,700 | $ | 141,366 | ||||||
| Working capital |
$ | 111,499 | $ | 14,861 | $ | 96,638 | ||||||
61
Table of Contents
The increase in cash, cash equivalents and short-term and long-term investments is primarily related to the completion of our IPO in March 2017, which resulted in net proceeds of $131.4 million, including $17.6 million from the exercise in full of the underwriters’ option to purchase additional shares in April 2017, after underwriting discounts and commissions and offering expenses, and cash provided by operating activities of $18.9 million, offset in part by $9.1 million net cash paid in connection with our business acquisitions. As of December 31, 2017, $13.0 million of our cash and cash equivalents and short-term and long-term investments were held by our foreign subsidiaries.
We believe that our existing cash and cash equivalents and short-term investments and any positive cash flows from operations will be sufficient to support our working capital and capital expenditure requirements for at least the next 12 months. To the extent existing cash and cash equivalents and short-term investments and cash from operations are not sufficient to fund future activities, we may need to raise additional funds. We may seek to raise additional funds through equity, equity-linked, or debt financings. If we raise additional funds through the incurrence of indebtedness, such indebtedness may have rights that are senior to holders of our equity securities and could contain covenants that restrict operations. Any additional equity or convertible debt financing may be dilutive to stockholders. If we are unable to raise additional capital when desired, our business, operating results, and financial condition could be adversely affected.
Our future capital requirements and the adequacy of available funds will depend on many factors, including the rate of our revenue growth, the timing and extent of our spending on research and development efforts and other business initiatives, the expansion of our sales and marketing activities, the timing of new product and service introductions, market acceptance of our platform, and overall economic conditions.
Cash Flows
The following table sets forth cash flows for the periods indicated:
| Year Ended December 31, | ||||||||||||
| 2017 | 2016 | 2015 | ||||||||||
| (in thousands) | ||||||||||||
| Net cash provided by (used in) operating activities |
$ | 18,943 | $ | (6,031 | ) | $ | (8,035 | ) | ||||
| Net cash provided by (used in) investing activities |
(66,421 | ) | 11,735 | (40,359 | ) | |||||||
| Net cash provided by financing activities |
135,863 | 823 | 48,531 | |||||||||
Operating Activities
Our net loss and cash flow from operating activities are significantly influenced by our investments in headcount and infrastructure to support anticipated growth. In addition, our net loss in recent periods has generally been significantly greater than our use of cash for operating activities due to our subscription-based model in which billings and collections occur in advance of revenue recognition and significant non-cash expenses such as stock-based compensation and depreciation and amortization.
For the year ended December 31, 2017, net cash provided by operating activities was $18.9 million. Net cash provided by operating activities primarily reflected a change in operating assets and liabilities of $22.8 million and net non-cash activity of $13.6 million, offset in part by a net loss of $17.5 million. The changes in operating assets and liabilities primarily related to an increase in billings during the year ended December 31, 2017 as compared to the year ended December 31, 2016. The increase in billings resulted in an increase to deferred revenue of $39.8 million, offset in part by an increase in accounts receivable of $15.3 million and an increase in deferred commissions of $3.7 million. Net non-cash activity primarily consisted of stock-based compensation of $8.9 million and depreciation and amortization of $4.0 million.
For the year ended December 31, 2016, net cash used in operating activities was $6.0 million. Net cash used in operating activities primarily reflected our net loss of $24.3 million, partially offset by non-cash expenses that included $3.3 million of stock-based compensation and $1.7 million of depreciation and amortization, and changes in working capital. Working capital sources of cash included a $27.8 million increase in deferred
62
Table of Contents
revenue, primarily resulting from the growth in the number of customers invoiced during the period, a $2.1 million increase in accounts payable as a result of timing of payments to vendors, a $1.2 million increase in accrued payroll and payroll-related liabilities resulting from the timing of payments and related expenses, a $1.1 million increase in accrued expenses, and a $0.7 million increase in other liabilities. These sources of cash were partially offset by a $14.2 million increase in accounts receivable as a result of increased billings to customers consistent with the overall growth of the business, a $4.3 million increase in prepaid expenses primarily associated with deferred royalties on third-party syndicated data and timing of amortization, and a $1.6 million increase in deferred commission as a result of increased billings to customers consistent with the overall growth of the business.
For the year ended December 31, 2015, net cash used in operating activities was $8.0 million. Net cash used in operating activities primarily reflected our net loss of $21.5 million, partially offset by non-cash expenses that included $1.5 million of stock-based compensation, and $0.8 million of depreciation and amortization, and changes in working capital. Working capital sources of cash included a $15.3 million increase in deferred revenue, primarily resulting from the growth in the number of customers invoiced during the period, a $2.7 million increase in accrued payroll and payroll-related liabilities associated with our growth in headcount and related expenses, $1.9 million in accrued expenses due to our growth and timing of payments, and a $0.9 million increase in other liabilities. These sources of cash were partially offset by a $6.2 million increase in accounts receivable and a $2.2 million increase in deferred commissions as a result of increased billings to customers consistent with the overall growth of the business, a $0.8 million decrease in accounts payable as a result of timing of payments to vendors, and a $0.8 million increase in prepaid expenses.
Investing Activities
Our investing activities consist primarily of purchases, sales and maturities of available-for-sale securities, property and equipment purchases, including computer-related equipment, and leasehold improvements to leased office facilities, and cash used in our business acquisitions.
Net cash used in investing activities for the year ended December 31, 2017 was $66.4 million, consisting primarily of $53.6 million of net purchases of investments, $9.1 million of net cash paid in connection with our business acquisitions, and $3.7 million of purchases of property and equipment.
Net cash provided by investing activities for the year ended December 31, 2016 was $11.7 million, consisting primarily of $20.8 million of maturities of investments and a $1.0 million change in restricted cash, partially offset by $5.7 million of purchases of investments and $4.3 million of purchases of property and equipment associated with additional headcount and office locations.
Net cash used in investing activities for the year ended December 31, 2015 was $40.4 million, consisting primarily of $36.4 million of purchases of investments from the proceeds from the issuance of Series C convertible preferred stock, $2.7 million of purchases of property and equipment associated with additional headcount and office locations, and $1.2 million related to a change in restricted cash associated with deposits on new office locations.
Financing Activities
Our financing activities consist primarily of proceeds from, and costs associated with, the issuances of convertible preferred stock and common stock, proceeds from the exercise of stock options, our payment of our then existing line of credit, and repurchases of our common stock.
Net cash provided by financing activities for the year ended December 31, 2017 was $135.9 million, consisting primarily of proceeds from our IPO of $134.8 million and $4.5 million of proceeds from stock option exercises and purchases under our employee stock purchase plan including the excess tax benefit from stock-
63
Table of Contents
based compensation, partially offset by $2.4 million in payments of IPO costs, $0.7 million in minimum tax withholding paid on behalf of employees for shares issued pursuant to RSUs, and $0.3 million of principal payments on our capital lease.
Net cash provided by financing activities for the year ended December 31, 2016 consisted primarily of proceeds from repayment of a stockholder note of $2.2 million and $0.4 million of proceeds from stock option exercises, partially offset by $0.9 million in payments of initial public offering costs and $0.6 million of costs paid in connection with the issuance of Series C convertible preferred stock and a repurchase of common stock.
Net cash provided by financing activities for the year ended December 31, 2015 consisted primarily of $49.6 million of proceeds received from the issuance of Series C convertible preferred stock, net of issuance costs, $35.0 million of proceeds from the issuance of common stock, $1.9 million of advances from a line of credit, and $0.7 million of proceeds from stock option exercises, partially offset by $34.8 million for repurchases of common stock and a $3.9 million repayment of the line of credit.
Contractual Obligations and Commitments
The following table summarizes our contractual obligations, including interest, as of December 31, 2017:
| Payments Due by Period | ||||||||||||||||||||
| Total | Less Than 1 Year |
1 to 3 Years | 3 to 5 Years | More Than 5 Years |
||||||||||||||||
| (in thousands) | ||||||||||||||||||||
| Capital leases |
$ | 384 | $ | 329 | $ | 55 | $ | — | $ | — | ||||||||||
| Operating leases(1) |
44,512 | 5,316 | 12,973 | 12,521 | 13,702 | |||||||||||||||
| Purchase obligations(2) |
5,428 | 3,999 | 1,429 | — | — | |||||||||||||||
|
|
|
|
|
|
|
|
|
|
|
|||||||||||
| Total |
$ | 50,324 | $ | 9,644 | $ | 14,457 | $ | 12,521 | $ | 13,702 | ||||||||||
|
|
|
|
|
|
|
|
|
|
|
|||||||||||
| (1) | We have leases that expire at various dates through 2025. |
| (2) | Purchase obligations relate primarily to non-cancellable agreements for license and royalty agreements. |
Unrecognized tax benefits as of December 31, 2017 were $5.8 million, of which $0.7 million would result in a potential cash payment of taxes and $5.1 million would result in a reduction in certain NOLs. We are not including any amount related to uncertain tax positions in the table presented above because of the difficulty in making reasonably reliable estimates of the timing of settlements with the respective taxing authorities. In addition, we had no accrual for interest or penalties related to uncertain tax positions in our consolidated balance sheets as of December 31, 2017 and 2016.
A portion of the consideration for the Semanta acquisition is subject to earn-out provisions. As of December 31, 2017, we have a liability of $1.0 million related to these earn-out provisions accrued to other liabilities in our consolidated balance sheet. This balance has not been included in the table above because of the uncertainty regarding the final value of the consideration, and the consideration is required to be settled in shares of our Class A common stock.
In the ordinary course of business, we enter into agreements in which we may agree to indemnify clients, suppliers, vendors, lessors, channel partners, lenders, stockholders, and other parties with respect to certain matters, including losses resulting from claims of intellectual property infringement, damages to property or persons, business losses, or other liabilities. In addition, we have entered into indemnification agreements with our directors, executive officers, and other officers that will require us to indemnify them against liabilities that may arise by reason of their status or service as directors, officers, or employees. There are no claims that we are aware of that could have a material effect on our consolidated financial statements.
64
Table of Contents
Off-Balance Sheet Arrangements
As of December 31, 2017, we did not have any relationships with unconsolidated entities or financial partnerships, such as structured finance or special purpose entities, which would have been established for the purpose of facilitating off-balance sheet arrangements.
Critical Accounting Policies and Estimates
Our consolidated financial statements and the related notes have been prepared in accordance with U.S. GAAP. The preparation of our consolidated financial statements requires us to make estimates and assumptions that affect the reported amounts of assets, liabilities, revenue, costs and operating expenses, provision for income taxes, and related disclosures. Generally, we base our estimates on historical experience and on various other assumptions in accordance with U.S. GAAP that we believe to be reasonable under the circumstances. Actual results may differ from these estimates. To the extent that there are material differences between these estimates and our actual results, our future financial statements will be affected.
Critical accounting policies and estimates are those that we consider the most important to the portrayal of our financial condition and operating results because they require our most difficult, subjective or complex judgments, often as a result of the need to make estimates about the effect of matters that are inherently uncertain. Our critical accounting policies and estimates are described below.
Revenue Recognition
Our revenue is derived from the licensing of subscription, time-based software, sale of a hosted version of our software, data subscription services, and professional services, including training and consulting services. The time-based subscriptions include post-contract support, or PCS, which provides the customer the right to receive when-and-if-available unspecified future updates, upgrades and enhancements, and technical product support.
Revenue is recognized when all four revenue recognition criteria have been met: persuasive evidence of an arrangement exists, the product has been delivered or the service has been performed, the fee is fixed or determinable, and collection is probable or reasonably assured. Determining whether and when some of these criteria have been satisfied often involves exercising judgment and using estimates and assumptions that can have a significant impact on the timing and amount of revenue that is recognized. Invoiced amounts have been recorded in accounts receivable and in deferred revenue or revenue, depending on whether the revenue recognition criteria have been met.
We account for revenue from software and related products and services in accordance with Accounting Standard Codification, or ASC, 985-605, Software. For the duration of the license term, the customer receives coterminous PCS. We do not provide PCS on a standalone or renewal basis unless the customer renews the software subscription license and, as such, we are unable to determine vendor specific objective evidence of fair value, or VSOE, of PCS. Accordingly, revenue for the subscription of time-based software licenses and PCS is recognized ratably beginning on the date the license is first made available to the customer and continuing through the end of the subscription term. Revenue from time-based software licenses and PCS comprised more than 90% of revenue for each of the years ended December 31, 2017, 2016, and 2015.
We also recognize revenue from the sale of a hosted version of our platform which is delivered pursuant to a hosting arrangement. Revenue from hosted services is recognized ratably beginning on the date the services are first made available to the customer and continuing through the end of the contractual service term. Hosted revenue arrangements are outside the scope of ASC 986-605 software revenue recognition guidance as customers do not have the right to take possession of the software code underlying our hosted solutions.
65
Table of Contents
Our arrangements may include the resale of third-party syndicated data content pursuant to subscription arrangements, and professional services. Data subscriptions provide the customer the right to receive data that is updated periodically over the term of the license agreement, and revenue is recognized ratably over the contract period once the customer has access to the data. We recognize revenue from the sale of third-party syndicated data on a gross basis when (i) we are the primary obligor, (ii) we have latitude to establish the price charged, and (iii) we bear credit risk in the transaction. Revenue from professional services, which is comprised primarily of training and consulting services, is recognized on a time and materials basis as the services are provided.
We enter into multiple element revenue arrangements in which a customer may purchase a combination of software, data, and services. For multiple element arrangements that contain only software and software-related elements, revenue is allocated and deferred for the undelivered elements based on their VSOE. In situations where VSOE exists for all elements (delivered and undelivered), the revenue to be earned under the arrangement among the various elements is allocated based on their relative fair value. For arrangements where VSOE exists only for the undelivered elements, the full fair value of the undelivered elements is deferred and the difference between the total arrangement fee and the amount deferred for the undelivered items is recognized as revenue. If VSOE does not exist for an undelivered service element, the revenue from the entire arrangement is recognized over the service period, once all services have commenced. Changes in assumptions or judgments or changes to the elements in a software arrangement could cause a material increase or decrease in the amount of revenue recognized in a particular period.
VSOE is determined for each element, or a group of elements sold on a combined basis, such as our software and PCS, based on historical stand-alone sales to third parties or the price to be charged when the product or service, or group of products or services, is available. In determining VSOE, a substantial majority of the selling prices for a product or service must fall within a reasonably narrow pricing range.
Revenue related to the delivered products or services is recognized only if (i) the above revenue recognition criteria are met, (ii) any undelivered products or services are not essential to the functionality of the delivered products and services, (iii) payment for the delivered products or services is not contingent upon delivery of the remaining products or services, and (iv) there is an enforceable claim to receive the amount due in the event that the undelivered products or services are not delivered.
For multiple-element arrangements that contain both software and non-software elements, revenue is allocated on a relative fair value basis to software or software-related elements as a group and any non-software elements separately based on the selling price hierarchy. The selling price for each deliverable is determined using VSOE of selling price, if it exists, or third-party evidence of fair value, or TPE. If neither VSOE nor TPE exist for a deliverable, best estimate of selling price, or BESP, is used. Once revenue is allocated to software or software-related elements as a group, revenue is recognized in accordance with software revenue accounting guidance. Revenue allocated to non-software elements is recognized in accordance with SAB Topic 13, Revenue Recognition. Revenue is recognized when revenue recognition criteria are met for each element.
Judgment is required to determine VSOE or BESP. For VSOE, we consider multiple factors including, but not limited to, product types, geographies, sales channels, and customer sizes and, for BESP, we also consider market conditions, competitive landscape, internal costs, gross margin objectives, and pricing practices. Pricing practices taken into consideration include historic contractually stated prices, volume discounts, where applicable, and price lists. BESP is generally used for offerings that are not typically sold on a stand-alone basis or when the selling prices for a product or service do not fall within a reasonably narrow pricing range.
Revenue generated from sales arrangements through distributors is recognized in accordance with our revenue recognition policies as described above at the amount invoiced to the distributor. We recognize revenue at the net amount invoiced to the distributor, as opposed to the gross amount the distributor invoices their end-customer, as we have determined that (i) we are not the primary obligor in these arrangements, (ii) we do not have latitude to establish the price charged to the end-customer, and (iii) we do not bear credit risk in the transaction with the end-customer.
66
Table of Contents
Deferred revenue includes amounts collected or billed in excess of revenue recognized. We recognize such amounts over the life of the contract upon meeting the revenue recognition criteria. Deferred revenue that will we will recognize during the succeeding 12-month period is recorded as current deferred revenue and the remaining portion is recorded as non-current deferred revenue, which is included in other liabilities in our consolidated balance sheet.
Sales Commissions and Cash-Based Performance Awards
Our sales personnel and other commissioned employees are paid commissions. Commissions are considered direct and incremental costs to customer agreements and are generally paid in the period we receive payment from the customer under the associated customer agreement. These costs are recoverable from future revenue associated with the noncancelable customer agreements that gave rise to the commissions. Commissions are amortized to sales and marketing expense over the term the respective revenue is recognized. For the years ended December 31, 2017, 2016, and 2015, we amortized to sales and marketing expense approximately $11.3 million, $9.4 million, and $6.4 million, respectively.
Certain of our sales personnel and other commissioned employees are also eligible for annual cash-based performance awards based on overall performance of the individuals. Awards that are directly related to a specific customer agreement are amortized to sales and marketing expense over the term the respective revenue is recognized. If awards are not directly related to specific customer agreements, they are expensed to sales and marketing expense during the year they are earned commencing when the award is, both probable of being earned and reasonably estimable, which generally has been in the latter part of the year. For the years ended December 31, 2017, 2016, and 2015, we recognized sales and marketing expense related to these awards of approximately $0.2 million, $1.4 million, and $1.2 million, respectively.
Business Combinations
We allocate the purchase price, including the fair value of any non-cash and contingent consideration, to the tangible and intangible assets acquired and liabilities assumed of the relevant acquired business based upon their estimated fair values at the acquisition date. The purchase price allocation process requires management to make significant estimates and assumptions, especially at the acquisition date with respect to intangible assets.
Determining the fair value of assets acquired and liabilities assumed requires our management to use significant judgment and estimates, including the selection of valuation methodologies, estimates of future revenue, costs and cash flows, discount rates, and selection of comparable companies. We engage the assistance of valuation specialists in concluding on fair value measurements in connection with determining fair values of assets acquired and liabilities assumed in a business combination.
Contingent consideration arising from business combinations is recorded at fair value as of the acquisition date. Determining the fair value of contingent consideration requires management to make assumptions and judgements, including the probability-weighted expected future cash flows and applying a discount rate that appropriately captures the risk associated with the obligation. Liability classified contingent consideration is remeasured each reporting period subsequent to the business combination until the contingency is settled. Changes in fair value are recorded in general and administrative expenses in the consolidated statements of operations. These estimates involve inherent uncertainties and if different assumptions had been used, the fair value of contingent consideration could have been materially different.
Unanticipated events and circumstances may occur which may affect the accuracy or validity of such assumptions, estimates or actual results.
Stock-Based Compensation
We recognize stock-based compensation expense in accordance with the provisions of ASC 718, Compensation—Stock Compensation. ASC 718 requires the measurement and recognition of compensation
67
Table of Contents
expense for all stock-based payment awards made to employees and directors based on the grant date fair values of the awards. We use the Black-Scholes option-pricing method for valuing stock options and shares granted under the employee share purchase plan. RSUs are valued based on the fair value of our common stock on the date of grant, less our expected dividend yield. For awards that vest solely based on continued service, the fair value of an award, net of estimated forfeitures, is recognized as an expense over the requisite service period on a straight-line basis. For awards that contain performance conditions, the fair value of an award, net of estimated forfeitures, is recognized based on the probability of the performance condition being met using the graded vesting method. Stock-based compensation expense is included in cost of revenue and operating expenses within our consolidated statements of operations and comprehensive loss based on the classification of the individual earning the award.
The determination of the grant date fair value of stock-based awards is affected by the estimated fair value per share of our common stock as well as other highly subjective assumptions, including, but not limited to, the expected term of the stock-based awards, expected stock price volatility, risk-free interest rates, and expected dividend yields, which are estimated as follows:
| • | Fair value per share of our common stock. Prior to our initial public offering, in March 2017, given the absence of an active market for our common stock, our board of directors determined the fair value of our common stock at the time of grant for each stock-based award based upon several factors, including consideration of input from management and contemporaneous third-party valuations. The fair value of our common stock was determined in accordance with applicable elements of the practice aid issued by the American Institute of Certified Public Accountants, Valuation of Privately Held Company Equity Securities Issued as Compensation. Each fair value estimated was based on a variety of factors including, the prices, rights, preferences and privileges of our preferred stock relative to those of our common stock, pricing and timing of transactions in our equity, the lack of marketability of our common stock, our actual operating and financial performance, developments and milestones in our company, the market performance of comparable publicly traded companies, the likelihood of achieving a liquidity event, and U.S. and global capital market conditions, among other factors. Subsequent to our initial public offering, the fair value of our common stock is based on the closing price of our Class A common stock, as reported on the New York Stock Exchange, on the date of grant. |
| • | Expected term. We determine the expected term of the awards using the simplified method, which estimates the expected term based on the average of the vesting period and contractual term of the stock option. |
| • | Expected volatility. We estimate the expected volatility based on the volatility of similar publicly held entities (referred to as “guideline companies”) over a period equivalent to the expected term of the awards. In evaluating the similarity of guideline companies to us, we considered factors such as industry, stage of life cycle, size, and financial leverage. We intend to continue to consistently apply this process using the same or similar guideline companies to estimate the expected volatility until sufficient historical information regarding the volatility of the share price of our common stock becomes available. |
| • | Risk-free interest rate. The risk-free interest rate used to value our stock-based awards is based on the U.S. Treasury yield in effect at the time of grant for a period consistent with the expected term of the award. |
| • | Estimated dividend yield. The expected dividend was assumed to be zero as we have never declared or paid any cash dividends and do not currently intend to declare dividends in the foreseeable future. |
In addition, we are required to estimate at the time of grant the expected forfeiture rate and only recognize expense for those stock-based awards expected to vest. Our estimated forfeiture rate is based on our estimate of pre-vesting award forfeitures.
68
Table of Contents
The assumptions used in calculating the fair value of stock-based awards represent our best estimates, but these estimates involve inherent uncertainties and the application of judgment. As a result, if factors change or we use different assumptions, stock-based compensation expense could be materially different in the future.
Income Taxes
Our provision for income taxes, deferred tax assets and liabilities, and reserves for unrecognized tax benefits reflect our best assessment of estimated future taxes to be paid. Significant judgments and estimates based on interpretations of existing tax laws or regulations in the United States and the numerous foreign jurisdictions where we are subject to income tax are required in determining our provision for income taxes. Changes in tax laws, statutory tax rates, and estimates of our future taxable income could impact the deferred tax assets and liabilities provided for in the consolidated financial statements and would require an adjustment to the provision for income taxes.
Deferred tax assets are regularly assessed to determine the likelihood they will be realized from future taxable income. A valuation allowance is established when we believe it is not more likely than not all or some of a deferred tax asset will be realized. In evaluating our ability to recover deferred tax assets within the jurisdiction in which they arise, we consider all available positive and negative evidence. Factors reviewed include the cumulative pre-tax book income for the past three years, scheduled reversals of deferred tax liabilities, our history of earnings and reliable forecasting, projections of pre-tax book income over the foreseeable future, and the impact of any feasible and prudent tax planning strategies.
We recognize the impact of a tax position in our consolidated financial statements only if that position is more likely than not of being sustained upon examination by taxing authorities, based on the technical merits of the position. Tax authorities may examine our returns in the jurisdictions in which we do business and we regularly assess the tax risk of our return filing positions. Due to the complexity of some of the uncertainties, the ultimate resolution may result in payments that are materially different from our current estimate of the tax liability. These differences, as well as any interest and penalties, will be reflected in the provision for income taxes in the period in which they are determined.
Recent Accounting Pronouncements
See Note 2 of the notes to our consolidated financial statements in Part II, Item 8 of this Annual Report for a description of recent accounting pronouncements.
| Item 7A. | Quantitative and Qualitative Disclosures about Market Risk. |
Foreign Currency Exchange Risk
Due to our international operations, we have foreign currency risks related to revenue and operating expenses denominated in currencies other than the U.S. dollar, primarily the British Pound and Euro. Our sales contracts are primarily denominated in the local currency of the customer making the purchase. In addition, a portion of our operating expenses are incurred outside the United States and are denominated in foreign currencies where our operations are located. Decreases in the relative value of the U.S. dollar to other currencies may negatively affect revenue and other operating results as expressed in U.S. dollars. We do not believe that an immediate 10% increase or decrease in the relative value of the U.S. dollar to other currencies would have a material effect on our operating results.
We have experienced and will continue to experience fluctuations in net loss as a result of transaction gains or losses related to remeasuring certain current asset and current liability balances that are denominated in currencies other than the functional currency of the entities in which they are recorded. To date, we have not
69
Table of Contents
entered into derivatives or hedging transactions, as our exposure to foreign currency exchange rates has historically been partially hedged as our U.S. dollar denominated inflows have covered our U.S. dollar denominated expenses and our foreign currency denominated inflows have covered our foreign currency denominated expenses. However, we may enter into derivative or hedging transactions in the future if our exposure to foreign currency should become more significant.
Interest Rate Risk
We had cash and cash equivalents and short-term and long-term investments of $194.1 million as of December 31, 2017. The primary objective of our investment activities is the preservation of capital, and we do not enter into investments for trading or speculative purposes. A hypothetical 10% increase in interest rates during the year ended December 31, 2017 would not have had a material impact on our consolidated financial statements. We do not have material exposure to market risk with respect to short-term and long-term investments, as any investments we enter into are primarily highly liquid investments.
Inflation Risk
We do not believe that inflation has had a material effect on our business, financial condition, or operating results.
70
Table of Contents
| Item 8. | Consolidated Financial Statements and Supplementary Data. |
Alteryx, Inc.
Index to Consolidated Financial Statements
| Page Number |
||||
| 72 | ||||
| Consolidated Financial Statements: |
||||
| Consolidated Statements of Operations and Comprehensive Loss |
73 | |||
| 74 | ||||
| Consolidated Statements of Redeemable Convertible Preferred Stock and Stockholders’ Equity (Deficit) |
75 | |||
| 76 | ||||
| 78 | ||||
71
Table of Contents
Report of Independent Registered Public Accounting Firm
To the Board of Directors and Stockholders
of Alteryx, Inc.
Opinion on the Financial Statements
We have audited the accompanying consolidated balance sheets of Alteryx, Inc. and its subsidiaries as of December 31, 2017 and 2016, and the related consolidated statements of operations and comprehensive loss, redeemable convertible preferred stock and stockholders’ equity (deficit), and cash flows for each of the three years in the period ended December 31, 2017, including the related notes (collectively referred to as the “consolidated financial statements”). In our opinion, the consolidated financial statements present fairly, in all material respects, the financial position of the Company as of December 31, 2017 and 2016, and the results of their operations and their cash flows for each of the three years in the period ended December 31, 2017 in conformity with accounting principles generally accepted in the United States of America.
Basis for Opinion
These consolidated financial statements are the responsibility of the Company’s management. Our responsibility is to express an opinion on the Company’s consolidated financial statements based on our audits. We are a public accounting firm registered with the Public Company Accounting Oversight Board (United States) (“PCAOB”) and are required to be independent with respect to the Company in accordance with the U.S. federal securities laws and the applicable rules and regulations of the Securities and Exchange Commission and the PCAOB.
We conducted our audits of these consolidated financial statements in accordance with the standards of the PCAOB. Those standards require that we plan and perform the audit to obtain reasonable assurance about whether the consolidated financial statements are free of material misstatement, whether due to error or fraud.
Our audits included performing procedures to assess the risks of material misstatement of the consolidated financial statements, whether due to error or fraud, and performing procedures that respond to those risks. Such procedures included examining, on a test basis, evidence regarding the amounts and disclosures in the consolidated financial statements. Our audits also included evaluating the accounting principles used and significant estimates made by management, as well as evaluating the overall presentation of the consolidated financial statements. We believe that our audits provide a reasonable basis for our opinion.
/s/ PricewaterhouseCoopers LLP
Los Angeles, California
March 7, 2018
We have served as the Company’s auditor since 2012
72
Table of Contents
Alteryx, Inc.
Consolidated Statements of Operations and Comprehensive Loss
(in thousands, except per share data)
| Year Ended December 31, | ||||||||||||
| 2017 | 2016 | 2015 | ||||||||||
| Revenue |
$ | 131,607 | $ | 85,790 | $ | 53,821 | ||||||
| Cost of revenue |
21,803 | 16,026 | 10,521 | |||||||||
|
|
|
|
|
|
|
|||||||
| Gross profit |
109,804 | 69,764 | 43,300 | |||||||||
| Operating expenses: |
||||||||||||
| Research and development |
29,342 | 17,481 | 11,103 | |||||||||
| Sales and marketing |
66,420 | 57,585 | 43,244 | |||||||||
| General and administrative |
32,241 | 17,720 | 10,039 | |||||||||
|
|
|
|
|
|
|
|||||||
| Total operating expenses |
128,003 | 92,786 | 64,386 | |||||||||
|
|
|
|
|
|
|
|||||||
| Loss from operations |
(18,199 | ) | (23,022 | ) | (21,086 | ) | ||||||
| Other expense, net |
(205 | ) | (1,028 | ) | (186 | ) | ||||||
|
|
|
|
|
|
|
|||||||
| Loss before provision for (benefit of) income taxes |
(18,404 | ) | (24,050 | ) | (21,272 | ) | ||||||
| Provision for (benefit of) income taxes |
(905 | ) | 208 | 178 | ||||||||
|
|
|
|
|
|
|
|||||||
| Net loss |
$ | (17,499 | ) | $ | (24,258 | ) | $ | (21,450 | ) | |||
|
|
|
|
|
|
|
|||||||
| Less: Accretion of Series A redeemable convertible preferred stock |
(1,983 | ) | (6,442 | ) | (2,603 | ) | ||||||
|
|
|
|
|
|
|
|||||||
| Net loss attributable to common stockholders |
$ | (19,482 | ) | $ | (30,700 | ) | $ | (24,053 | ) | |||
|
|
|
|
|
|
|
|||||||
| Net loss per share attributable to common stockholders, basic and diluted |
$ | (0.37 | ) | $ | (0.95 | ) | $ | (0.76 | ) | |||
|
|
|
|
|
|
|
|||||||
| Weighted-average shares used to compute net loss per share attributable to common stockholders, basic and diluted |
53,006 | 32,440 | 31,697 | |||||||||
|
|
|
|
|
|
|
|||||||
| Other comprehensive income (loss), net of tax: |
||||||||||||
| Change in net unrealized holding gains (losses) on investments, net of tax |
(217 | ) | 72 | (81 | ) | |||||||
| Foreign currency translation adjustments, net of tax |
(128 | ) | — | — | ||||||||
|
|
|
|
|
|
|
|||||||
| Other comprehensive income (loss), net of tax |
(345 | ) | 72 | (81 | ) | |||||||
|
|
|
|
|
|
|
|||||||
| Total comprehensive loss |
$ | (17,844 | ) | $ | (24,186 | ) | $ | (21,531 | ) | |||
|
|
|
|
|
|
|
|||||||
The accompanying notes are an integral part of these consolidated financial statements.
73
Table of Contents
Alteryx, Inc.
(in thousands, except par value)
| As of December 31, | ||||||||
| 2017 | 2016 | |||||||
| Assets |
||||||||
| Current assets: |
||||||||
| Cash and cash equivalents |
$ | 119,716 | $ | 31,306 | ||||
| Short-term investments |
54,386 | 21,394 | ||||||
| Accounts receivable, net of allowance for doubtful accounts and sales reserves of $1,714 and $758 as of December 31, 2017 and December 31, 2016, respectively |
49,797 | 35,367 | ||||||
| Deferred commissions |
11,213 | 7,358 | ||||||
| Prepaid expenses and other current assets |
7,227 | 5,013 | ||||||
|
|
|
|
|
|||||
| Total current assets |
242,339 | 100,438 | ||||||
| Property and equipment, net |
7,492 | 6,212 | ||||||
| Long-term investments |
19,964 | — | ||||||
| Goodwill |
8,750 | — | ||||||
| Intangible assets, net |
7,995 | — | ||||||
| Restricted cash |
200 | 200 | ||||||
| Other assets |
4,063 | 4,525 | ||||||
| Deferred income taxes, net |
613 | 40 | ||||||
|
|
|
|
|
|||||
| Total assets |
$ | 291,416 | $ | 111,415 | ||||
|
|
|
|
|
|||||
| Liabilities, Redeemable Convertible Preferred Stock, and Stockholders’ Equity (Deficit) |
||||||||
| Current liabilities: |
||||||||
| Accounts payable |
$ | 522 | $ | 1,780 | ||||
| Accrued payroll and payroll related liabilities |
11,835 | 7,760 | ||||||
| Accrued expenses and other current liabilities |
7,941 | 4,658 | ||||||
| Deferred revenue |
110,213 | 71,050 | ||||||
| Capital lease obligation |
329 | 329 | ||||||
|
|
|
|
|
|||||
| Total current liabilities |
130,840 | 85,577 | ||||||
| Deferred revenue |
3,545 | 3,084 | ||||||
| Other liabilities |
3,313 | 1,182 | ||||||
| Deferred income tax, net |
214 | — | ||||||
|
|
|
|
|
|||||
| Total liabilities |
137,912 | 89,843 | ||||||
|
|
|
|
|
|||||
| Commitments and contingencies (Note 15) |
||||||||
| Redeemable convertible preferred stock, $0.0001 par value: no shares and 14,899 shares authorized as of December 31, 2017 and December 31, 2016, respectively; no shares and 14,647 shares issued and outstanding as of December 31, 2017 and December 31, 2016, respectively; aggregate liquidation preference of $0 and $87,448 of December 31, 2017 and December 31, 2016, respectively. |
— | 99,182 | ||||||
| Stockholders’ equity (deficit): |
||||||||
| Preferred stock, $0.0001 par value: 10,000 and no shares authorized as of December 31, 2017 and December 31, 2016, respectively; no shares issued and outstanding as of December 31, 2017 and December 31, 2016, respectively. |
— | — | ||||||
| Common stock, Class A, $0.0001 par value: 500,000 and no shares authorized as of December 31, 2017 and December 31, 2016, respectively; 26,687 and no shares issued and outstanding as of December 31, 2017 and December 31, 2016, respectively |
2 | — | ||||||
| Common stock, Class B, $0.0001 par value: 500,000 and 56,025 shares authorized as of December 31, 2017 and December 31, 2016, respectively; 32,948 and 32,674 shares issued and outstanding as of December 31, 2017 and December 31, 2016, respectively |
3 | 3 | ||||||
| Additional paid-in capital |
257,399 | 8,443 | ||||||
| Accumulated deficit |
(103,546 | ) | (86,047 | ) | ||||
| Accumulated other comprehensive loss |
(354 | ) | (9 | ) | ||||
|
|
|
|
|
|||||
| Total stockholders’ equity (deficit) |
153,504 | (77,610 | ) | |||||
|
|
|
|
|
|||||
| Total liabilities, redeemable convertible preferred stock, and stockholders’ equity (deficit) |
$ | 291,416 | $ | 111,415 | ||||
|
|
|
|
|
|||||
The accompanying notes are an integral part of these consolidated financial statements.
74
Table of Contents
Alteryx, Inc.
Consolidated Statements of Redeemable Convertible Preferred Stock and Stockholders’ Equity (Deficit)
(in thousands)
| Redeemable Convertible Preferred Stock |
Common Stock | Additional Paid-in Capital |
Notes Receivable From Stockholders |
Accumulated Deficit |
Accumulated Other Comprehensive Loss |
Total | ||||||||||||||||||||||||||||||
| Shares | Amount | Shares | Amount | |||||||||||||||||||||||||||||||||
| Balances at December 31, 2014 |
11,240 | $ | 41,618 | 31,290 | $ | 3 | $ | 10,902 | $ | (2,237 | ) | $ | (40,339 | ) | $ | — | $ | (31,671 | ) | |||||||||||||||||
| Issuance of Series C convertible preferred stock, net of issuance costs of $775 |
3,659 | 49,225 | — | — | — | — | — | — | — | |||||||||||||||||||||||||||
| Issuance of common stock |
— | — | 2,944 | — | 35,000 | — | — | — | 35,000 | |||||||||||||||||||||||||||
| Repurchase of common stock |
— | — | (2,962 | ) | — | (35,006 | ) | — | — | — | (35,006 | ) | ||||||||||||||||||||||||
| Conversion of Series A redeemable convertible referred stock to common stock |
(252 | ) | (706 | ) | 252 | — | 706 | — | — | — | 706 | |||||||||||||||||||||||||
| Accretion of Series A redeemable convertible preferred stock issuance costs and redemption feature |
— | 2,603 | — | — | (2,603 | ) | — | — | — | (2,603 | ) | |||||||||||||||||||||||||
| Exercise of stock options |
— | — | 734 | — | 686 | — | — | — | 686 | |||||||||||||||||||||||||||
| Stock-based compensation |
— | — | — | — | 1,482 | — | — | — | 1,482 | |||||||||||||||||||||||||||
| Excess tax benefit from stock-based compensation |
— | — | — | — | 26 | — | — | — | 26 | |||||||||||||||||||||||||||
| Unrealized loss on investments |
— | — | — | — | — | — | — | (81 | ) | (81 | ) | |||||||||||||||||||||||||
| Net loss |
— | — | — | — | — | — | (21,450 | ) | — | (21,450 | ) | |||||||||||||||||||||||||
|
|
|
|
|
|
|
|
|
|
|
|
|
|
|
|
|
|
|
|||||||||||||||||||
| Balances at December 31, 2015 |
14,647 | 92,740 | 32,258 | 3 | 11,193 | (2,237 | ) | (61,789 | ) | (81 | ) | (52,911 | ) | |||||||||||||||||||||||
|
|
|
|
|
|
|
|
|
|
|
|
|
|
|
|
|
|
|
|||||||||||||||||||
| Issuance of common stock |
— | — | 2 | — | 21 | — | — | — | 21 | |||||||||||||||||||||||||||
| Repurchase of common stock |
— | — | (17 | ) | — | (6 | ) | — | — | — | (6 | ) | ||||||||||||||||||||||||
| Accretion of Series A redeemable convertible preferred stock issuance costs and redemption feature |
— | 6,442 | — | — | (6,442 | ) | — | — | — | (6,442 | ) | |||||||||||||||||||||||||
| Exercise of stock options |
— | — | 431 | — | 413 | — | — | — | 413 | |||||||||||||||||||||||||||
| Stock-based compensation |
— | — | — | — | 3,263 | — | — | — | 3,263 | |||||||||||||||||||||||||||
| Excess tax benefit from stock- based compensation |
— | — | — | — | 1 | — | — | — | 1 | |||||||||||||||||||||||||||
| Repayment of stockholder note |
— | — | — | — | — | 2,237 | — | — | 2,237 | |||||||||||||||||||||||||||
| Unrealized gain on investments |
— | — | — | — | — | — | — | 72 | 72 | |||||||||||||||||||||||||||
| Net loss |
— | — | — | — | — | — | (24,258 | ) | — | (24,258 | ) | |||||||||||||||||||||||||
|
|
|
|
|
|
|
|
|
|
|
|
|
|
|
|
|
|
|
|||||||||||||||||||
| Balances at December 31, 2016 |
14,647 | 99,182 | 32,674 | 3 | 8,443 | — | (86,047 | ) | (9 | ) | (77,610 | ) | ||||||||||||||||||||||||
|
|
|
|
|
|
|
|
|
|
|
|
|
|
|
|
|
|
|
|||||||||||||||||||
| Issuance of common stock in initial public offering, net of issuance costs of $3,344 |
— | 10,350 | 1 | 131,412 | — | — | — | 131,413 | ||||||||||||||||||||||||||||
| Accretion of Series A redeemable convertible preferred stock issuance costs and redemption feature |
— | 1,983 | — | — | (1,983 | ) | — | — | — | (1,983 | ) | |||||||||||||||||||||||||
| Conversion redeemable convertible preferred stock to common stock |
(14,647 | ) | (101,165 | ) | 14,647 | 1 | 101,164 | — | — | — | 101,165 | |||||||||||||||||||||||||
| Shares issued pursuant to stock awards, net of shares withheld |
— | — | 1,687 | — | 3,655 | — | — | — | 3,655 | |||||||||||||||||||||||||||
| Equity issued in business combination |
— | — | 265 | — | 5,285 | — | — | — | 5,285 | |||||||||||||||||||||||||||
| Stock-based compensation |
— | — | — | — | 8,886 | — | — | — | 8,886 | |||||||||||||||||||||||||||
| Equity settled contingent consideration |
— | — | 12 | — | 375 | — | — | — | 375 | |||||||||||||||||||||||||||
| Excess tax benefit from stock- based compensation |
— | — | — | — | 162 | — | — | — | 162 | |||||||||||||||||||||||||||
| Cumulative translation adjustment |
— | — | — | — | — | — | — | (128 | ) | (128 | ) | |||||||||||||||||||||||||
| Unrealized loss on investments |
— | — | — | — | — | — | (217 | ) | (217 | ) | ||||||||||||||||||||||||||
| Net loss |
— | — | — | — | — | — | (17,499 | ) | — | (17,499 | ) | |||||||||||||||||||||||||
|
|
|
|
|
|
|
|
|
|
|
|
|
|
|
|
|
|
|
|||||||||||||||||||
| Balances at December 31, 2017 |
— | $ | — | 59,635 | $ | 5 | $ | 257,399 | $ | — | $ | (103,546 | ) | $ | (354 | ) | $ | 153,504 | ||||||||||||||||||
|
|
|
|
|
|
|
|
|
|
|
|
|
|
|
|
|
|
|
|||||||||||||||||||
The accompanying notes are an integral part of these consolidated financial statements.
75
Table of Contents
Alteryx, Inc.
Consolidated Statements of Cash Flows
(in thousands)
| Year Ended December 31, | ||||||||||||
| 2017 | 2016 | 2015 | ||||||||||
| Cash flows from operating activities: |
||||||||||||
| Net loss |
$ | (17,499 | ) | $ | (24,258 | ) | $ | (21,450 | ) | |||
| Adjustments to reconcile net loss to net cash provided by (used in) operating activities: |
||||||||||||
| Depreciation and amortization |
3,957 | 1,677 | 759 | |||||||||
| Stock-based compensation |
8,886 | 3,284 | 1,482 | |||||||||
| Provision for doubtful accounts and sales reserve, net of recoveries |
820 | 432 | 380 | |||||||||
| Deferred income taxes |
(1,425 | ) | (27 | ) | (12 | ) | ||||||
| Loss on disposal of assets |
175 | 66 | 47 | |||||||||
| Change in fair value of contingent consideration |
190 | — | — | |||||||||
| Impairment of long-lived assets |
1,050 | — | — | |||||||||
| Changes in operating assets and liabilities, net of effect of business acquisitions: |
||||||||||||
| Accounts receivable |
(15,325 | ) | (14,248 | ) | (6,216 | ) | ||||||
| Deferred commissions |
(3,663 | ) | (1,582 | ) | (2,233 | ) | ||||||
| Prepaid expenses and other current assets and other assets |
(3,508 | ) | (4,314 | ) | (768 | ) | ||||||
| Accounts payable |
(1,483 | ) | 2,134 | (802 | ) | |||||||
| Accrued payroll and payroll related liabilities |
4,047 | 1,177 | 2,744 | |||||||||
| Accrued expenses and other current liabilities |
2,444 | 1,122 | 1,908 | |||||||||
| Deferred revenue |
39,835 | 27,840 | 15,252 | |||||||||
| Other liabilities |
442 | 666 | 874 | |||||||||
|
|
|
|
|
|
|
|||||||
| Net cash provided by (used in) operating activities |
18,943 | (6,031 | ) | (8,035 | ) | |||||||
|
|
|
|
|
|
|
|||||||
| Cash flows from investing activities: |
||||||||||||
| Purchases of property and equipment |
(3,669 | ) | (4,307 | ) | (2,714 | ) | ||||||
| Purchases of investments |
(91,517 | ) | (5,720 | ) | (36,445 | ) | ||||||
| Maturities of investments |
37,862 | 20,762 | — | |||||||||
| Acquisitions, net of cash acquired |
(9,097 | ) | — | — | ||||||||
| Change in restricted cash |
— | 1,000 | (1,200 | ) | ||||||||
|
|
|
|
|
|
|
|||||||
| Net cash provided by (used in) investing activities |
(66,421 | ) | 11,735 | (40,359 | ) | |||||||
|
|
|
|
|
|
|
|||||||
| Cash flows from financing activities: |
||||||||||||
| Proceeds from initial public offering, net of underwriting commissions and discounts |
134,757 | — | — | |||||||||
| Proceeds from issuance of Series C convertible preferred stock, net of issuance costs paid |
— | (350 | ) | 49,575 | ||||||||
| Proceeds from issuance of common stock |
— | — | 35,000 | |||||||||
| Payment of initial public offering costs |
(2,396 | ) | (948 | ) | — | |||||||
| Repurchase of common stock, net of costs paid |
— | (256 | ) | (34,756 | ) | |||||||
| Advance from line of credit |
— | — | 1,875 | |||||||||
| Repayment of line of credit |
— | — | (3,875 | ) | ||||||||
| Repayment of loans to stockholders |
— | 2,237 | — | |||||||||
| Principal payments on capital lease obligations |
(328 | ) | (274 | ) | — | |||||||
| Proceeds from exercise of stock options |
4,342 | 413 | 686 | |||||||||
| Minimum tax withholding paid on behalf of employees for restricted stock units |
(674 | ) | — | — | ||||||||
| Excess tax benefit from stock-based compensation |
162 | 1 | 26 | |||||||||
|
|
|
|
|
|
|
|||||||
| Net cash provided by financing activities |
135,863 | 823 | 48,531 | |||||||||
|
|
|
|
|
|
|
|||||||
| Effect of exchange rate changes on cash |
25 | — | — | |||||||||
| Net increase in cash and cash equivalents |
88,410 | 6,527 | 137 | |||||||||
| Cash and cash equivalents—beginning of year |
31,306 | 24,779 | 24,642 | |||||||||
|
|
|
|
|
|
|
|||||||
| Cash and cash equivalents—end of year |
$ | 119,716 | $ | 31,306 | $ | 24,779 | ||||||
|
|
|
|
|
|
|
|||||||
The accompanying notes are an integral part of these consolidated financial statements.
76
Table of Contents
Alteryx, Inc.
Consolidated Statements of Cash Flows (Continued)
(in thousands)
| Year Ended December 31, | ||||||||||||
| 2017 | 2016 | 2015 | ||||||||||
| Supplemental disclosure of cash flow information: |
||||||||||||
| Cash paid for interest |
$ | — | $ | — | $ | 101 | ||||||
|
|
|
|
|
|
|
|||||||
| Cash paid for income taxes |
$ | 333 | $ | 12 | $ | 7 | ||||||
|
|
|
|
|
|
|
|||||||
| Supplemental disclosure of noncash investing and financing activities: |
||||||||||||
| Property and equipment recorded in accounts payable |
$ | — | $ | 38 | $ | 27 | ||||||
|
|
|
|
|
|
|
|||||||
| Consideration for business acquisition initially included in accrued expenses and other current liabilities and other liabilities |
$ | 1,660 | $ | — | $ | — | ||||||
|
|
|
|
|
|
|
|||||||
| Consideration for business acquisition from issuance of common stock |
$ | 5,285 | $ | — | $ | — | ||||||
|
|
|
|
|
|
|
|||||||
| Contingent consideration settled through issuance of common stock |
$ | 375 | $ | — | $ | — | ||||||
|
|
|
|
|
|
|
|||||||
| Accretion of Series A redeemable convertible preferred stock |
$ | 1,983 | $ | 6,442 | $ | 2,603 | ||||||
|
|
|
|
|
|
|
|||||||
| Deferred initial public offering costs included in other assets and accounts payable and accrued expense and other current liabilities |
$ | — | $ | 452 | $ | — | ||||||
|
|
|
|
|
|
|
|||||||
| Property and equipment funded by capital lease borrowing |
$ | — | $ | 987 | $ | — | ||||||
|
|
|
|
|
|
|
|||||||
| Conversion of redeemable convertible preferred stock to common shares |
$ | 101,165 | $ | — | $ | 706 | ||||||
|
|
|
|
|
|
|
|||||||
| Series C convertible preferred stock issuance costs recorded in accrued expenses and other current liabilities |
$ | — | $ | — | $ | 350 | ||||||
|
|
|
|
|
|
|
|||||||
| Repurchase of common stock costs recorded in accrued expenses and other current liabilities |
$ | — | $ | — | $ | 250 | ||||||
|
|
|
|
|
|
|
|||||||
The accompanying notes are an integral part of these consolidated financial statements.
77
Table of Contents
Alteryx, Inc.
Notes to Consolidated Financial Statements
1. Organization and Nature of Operations
Our Company
Alteryx, Inc. was initially organized in California in March 1997 as SRC, LLC, commenced principal operations in November 1997, changed its name to Alteryx, LLC in March 2010, and converted into a Delaware corporation in March 2011 under the name Alteryx, Inc. Alteryx, Inc. and its subsidiaries, or we, our, or us, are headquartered in Irvine, California.
We are a provider of self-service data analytics software. Our software platform enables organizations to improve business outcomes and the productivity of their business analysts. Our subscription-based platform allows organizations to easily prepare, blend, and analyze data from a multitude of sources and benefit from data-driven decisions. The ease-of-use, speed, and sophistication that our platform provides is enhanced through intuitive and highly repeatable visual workflows.
Initial Public Offering and Follow-on Public Offering
In March 2017, we completed an initial public offering, or IPO, of our Class A common stock. In connection with the IPO, we sold 10.4 million shares of Class A common stock, which included the exercise in full of the underwriters’ option to purchase an additional 1.4 million shares in April 2017, at $14.00 per share for aggregate net proceeds of $131.4 million after underwriting discounts and commissions and offering expenses. Prior to the closing of the IPO, all shares of common stock then outstanding were reclassified as Class B common stock and all shares of our then outstanding convertible preferred stock held prior to the IPO were converted into Class B common stock. See Note 12 for further discussion of our Class A and Class B common stock.
In September 2017, we completed a follow-on public offering in which a total of 8.0 million shares of our Class A common stock (issued upon automatic conversion of shares of our Class B common stock) were sold by certain selling stockholders at a price of $21.25 per share. We did not receive any proceeds from the sale of shares of our Class A common stock by the selling stockholders and we incurred offering costs of $0.7 million in the year ended December 31, 2017 in connection with this offering. These costs are included in general and administrative expense in our consolidated statement of operations and comprehensive loss.
2. Significant Accounting Policies
Principles of Consolidation and Basis of Presentation
Our consolidated financial statements are presented in accordance with accounting standards generally accepted in the United States of America, or U.S. GAAP, and include the accounts of Alteryx, Inc. and its wholly owned subsidiaries after elimination of intercompany transactions and balances.
Use of Estimates
The preparation of consolidated financial statements in conformity with U.S. GAAP requires management to make estimates and assumptions that affect the reported amounts of assets and liabilities, disclosure of contingent liabilities at the date of the consolidated financial statements, and the reported amounts of revenue and expenses during the reporting period. Actual results could differ from these estimates and assumptions.
On an ongoing basis, our management evaluates estimates and assumptions based on historical data and experience, as well as various other factors that our management believes to be reasonable under the circumstances, the results of which form the basis for making judgments about the carrying value of assets and liabilities.
78
Table of Contents
Concentration of Risk
Financial instruments, which subject us to concentrations of credit risk, consist primarily of cash and cash equivalents, investments, and trade accounts receivable. We maintain our cash and cash equivalents and investments with three major financial institutions and a portion of such balances exceed or are not subject to Federal Deposit Insurance Corporation, or FDIC, insurance limits.
We extend differing levels of credit to customers, do not require collateral deposits, and, when necessary, maintain reserves for potential credit losses based upon the expected collectability of accounts receivable. We manage credit risk related to our customers by following credit approval processes, establishing credit limits, performing periodic evaluations of credit worthiness and applying other credit risk monitoring procedures.
Accounts receivable include amounts due from customers with principal operations primarily in the United States.
Significant customers are those which represent 10% or more of our revenue for each period presented or total net accounts receivable at each balance sheet date presented. For all years presented, we had no customer which accounted for 10% or more of our accounts receivable balance or 10% or more of our revenue.
Fair Value of Financial Instruments
We utilize valuation techniques that maximize the use of observable inputs and minimize the use of unobservable inputs to the extent possible. We determine fair value based on assumptions that market participants would use in pricing an asset or liability in the principal or most advantageous market. When considering market participant assumptions in fair value measurements, the following fair value hierarchy distinguishes between observable and unobservable inputs, which are categorized in one of the following levels:
| Level 1 | Unadjusted quoted prices in active markets for identical assets or liabilities at the measurement date. |
| Level 2 | Inputs other than Level 1 that are observable, either directly or indirectly, such as quoted prices for similar assets or liabilities; quoted prices in markets that are not active near the measurement date; or other inputs that are observable or can be corroborated by observable market data for substantially the full term of the assets or liabilities. |
| Level 3 | Unobservable inputs that are supported by little or no market activity and that are significant to the fair value of the assets or liabilities. |
The fair value of our money market funds was determined based on “Level 1” inputs.
The fair value of certificates of deposit, U.S. Treasury and agency bonds, and corporate bonds were determined based on “Level 2” inputs. The valuation techniques used to measure the fair value of certificates of deposit included observable market-based inputs for similar assets, which primarily include yield curves and time-to-maturity factors. The valuation techniques used to measure the fair value of U.S. Treasury and agency bonds and corporate bonds included standard observable inputs, including reported trades, quoted market prices, matrix pricing, benchmark yields, broker/dealer quotes, issuer spreads, two-sided markets or benchmark securities and data provided by third parties as many of the bonds are not actively traded.
There were no marketable securities measured on a recurring basis in the “Level 3” category.
We have not elected the fair value option as prescribed by ASC 825, The Fair Value Option for Financial Assets and Financial Liabilities, for our financial assets and liabilities that are not otherwise required to be carried at fair value. Under ASC 820, material financial assets and liabilities not carried at fair value, such as our accounts receivable and payables, are reported at their carrying values.
79
Table of Contents
Cash and Cash Equivalents and Restricted Cash
We consider cash and cash equivalents to include short-term, highly liquid investments that are readily convertible to known amounts of cash and so near their maturity that they present an insignificant risk of changes in the value, including investments that mature within three months from the date of original purchase. Amounts receivable from a credit card processor of approximately $0.7 million and $0.3 million as of December 31, 2017 and 2016, respectively, are considered cash equivalents because they were both short-term and highly liquid in nature and are typically converted to cash within three days of the sales transaction.
Restricted cash as of December 31, 2017 and 2016 related to amounts required to be restricted as to use by our credit card processor.
Investments in Marketable Securities
Our investments include available-for-sale marketable securities. The classification of investments is determined at the time of purchase and reevaluated at each balance sheet date. We classify investments as current or non-current based on the nature of the securities as well as their stated maturities. Investments are stated at fair value. The net unrealized gains or losses on available-for-sale securities are recorded as a component of accumulated other comprehensive loss, net of income taxes.
At each balance sheet date, we assess available-for-sale securities in an unrealized loss position to determine whether the unrealized loss is other than temporary. We consider factors including the significance of the decline in value as compared to the cost basis, underlying factors contributing to a decline in the prices of securities in a single asset class, how long the market value of the security has been less than its cost basis, the security’s relative performance versus its peers, sector or asset class, expected market volatility, and the market and economy in general, and, if determined to be other than temporary, will record an other than temporary impairment charge.
Accounts Receivable, Allowance for Doubtful Accounts, and Sales Reserves
Our accounts receivable consist of amounts due from customers and are typically unsecured. Accounts receivable are recorded at the invoiced amount and are non-interest bearing.
The allowance for doubtful accounts is estimated and established by assessing individual accounts receivable over a specific age and dollar value, and all other balances are pooled based on historical collection experience. Additions to the allowance are charged to general and administrative expenses. Accounts receivable are written off against the allowance when an account balance is deemed uncollectible.
We estimate a sales reserve based upon the historical adjustments made to customer billings. Such reserve is recorded as a reduction of revenue and deferred revenue.
Sales Commissions and Cash-Based Performance Awards
Our sales personnel and other commissioned employees are paid commissions. Commissions are considered direct and incremental costs to customer agreements and are generally paid in the period we receive payment from the customer under the associated customer agreement. These costs are recoverable from future revenue associated with the noncancelable customer agreements that gave rise to the commissions. Commissions are amortized to sales and marketing expense over the term the respective revenue is recognized. For the years ended December 31, 2017, 2016, and 2015, we amortized to sales and marketing expense approximately $11.3 million, $9.4 million, and $6.4 million, respectively.
Certain of our sales personnel and other commissioned employees are also eligible for annual cash-based performance awards based on overall performance of the individuals. Awards that are directly related to a
80
Table of Contents
specific customer agreement are amortized to sales and marketing expense over the term the respective revenue is recognized. If awards are not directly related to specific customer agreements, they are expensed to sales and marketing expense during the year they are earned commencing when the award is both probable of being earned and reasonably estimable, which generally has been in the latter part of the year. For the years ended December 31, 2017, 2016, and 2015, we recognized sales and marketing expense related to these awards of approximately $0.2 million, $1.4 million, and $1.2 million, respectively.
Royalties
We pay royalties associated with licensed data sold with our platform and we recognize royalty expense to cost of revenue when incurred. For the years ended December 31, 2017, 2016, and 2015, we recognized royalty expense of approximately $9.4 million, $6.0 million, and $4.1 million, respectively. Under certain of our contractual arrangements we prepay royalties. Prepaid royalties were approximately $1.1 million and $1.3 million as of December 31, 2017 and 2016, respectively, and are included in prepaid expenses and other current assets in our consolidated balance sheet.
Property and Equipment
Property and equipment are stated at historical cost, less accumulated depreciation and amortization. Depreciation of property and equipment is calculated using the straight-line method over the estimated useful lives of the assets. Leasehold improvements are amortized on a straight-line basis over the shorter of their estimated useful lives or lease terms. Useful lives by asset category are as follows:
| Computer equipment |
3 years | |
| Furniture and fixtures |
3 to 7 years | |
| Leasehold improvement |
Shorter of useful life or lease term |
Repairs and maintenance costs are charged to expense as incurred. Upon the sale or retirement of property and equipment, the cost and the related accumulated depreciation or amortization are removed from the accounts, with any resulting gain or loss included in our consolidated statement of operations and comprehensive loss.
Intangible Assets
Intangible assets consist primarily of acquired developed technology. We determine the appropriate useful life of our intangible assets by performing an analysis of expected cash flows of the acquired assets. Intangible assets are amortized over their estimated useful lives of two to eight years, using the straight-line method, which approximates the pattern in which the economic benefits are consumed.
Impairment of Long-Lived Assets
We review our long-lived assets for impairment whenever events or changes in circumstances indicate the carrying amount of such assets may not be fully recoverable. Recoverability of these assets is determined by comparing the forecasted undiscounted cash flows attributable to such assets to their carrying value. If the carrying value of the assets exceeds the forecasted undiscounted cash flows, then the assets are written down to their fair value. Fair value is determined based on discounted cash flows or appraised values, depending upon the nature of the assets. To date, no such impairments have been recorded.
Business Combinations
The results of businesses acquired in a business combination are included in our consolidated financial statements from the date of the acquisition. We allocated the purchase price, including the fair value of any non-cash and contingent consideration, to the identifiable assets and liabilities of the relevant acquired business at their acquisition date fair values. Any excess consideration over the fair value of assets acquired and liabilities assumed is recognized as goodwill.
81
Table of Contents
Contingent consideration payable in cash or a fixed dollar amount settleable in a variable number of shares is classified as a liability and recorded at fair value, with changes in fair value recorded in general and administrative expenses each period. Transaction costs associated with business combinations are expensed as incurred, and are included in general and administrative expense in the consolidated statements of operations and comprehensive loss.
We perform valuations of assets acquired, liabilities assumed, and contingent consideration and allocate the purchase price to its respective assets and liabilities. Determining the fair value of assets acquired, liabilities assumed, and contingent consideration requires us to use significant judgment and estimates including the selection of valuation methodologies, estimates of future revenue, costs and cash flows, discount rates, the probability of the achievement of specified milestones, and selection of comparable companies. We engage the assistance of valuation specialists in concluding on fair value measurements in connection with determining fair values of assets acquired, liabilities assumed, and contingent consideration in a business combination.
Goodwill
Goodwill represents the excess of the purchase price over the fair value of net assets acquired in a business combination. We test goodwill for impairment in accordance with the provisions of Accounting Standards Codification, or ASC, 350, Intangibles – Goodwill and Other. Goodwill is tested for impairment at least annually at the reporting unit level or whenever events or changes in circumstances indicate that goodwill might be impaired. Events or changes in circumstances which could trigger an impairment review include a significant adverse change in legal factors or in the business climate, unanticipated competition, loss of key personnel, significant changes in the use of the acquired assets or our strategy, significant negative industry or economic trends, or significant underperformance relative to expected historical or projected future results of operations.
ASC 350 provides that an entity has the option to first assess qualitative factors to determine whether the existence of events or circumstances leads to a determination that it is more likely than not that the fair value of a reporting unit is less than its carrying amount. If, after assessing the totality of events or circumstances, an entity determines it is not more likely than not that the fair value of a reporting unit is less than its carrying amount, then additional impairment testing is not required. However, if an entity concludes otherwise, then it is required to perform the first of a two-step impairment test.
The first step involves comparing the estimated fair value of a reporting unit with its book value, including goodwill. If the estimated fair value exceeds book value, goodwill is considered not to be impaired and no additional steps are necessary. If, however, the fair value of the reporting unit is less than book value, then the carrying amount of the goodwill is compared with its implied fair value. The estimate of implied fair value of goodwill may require valuations of certain internally generated and unrecognized intangible assets. If the carrying amount of goodwill exceeds the implied fair value of that goodwill, an impairment loss is recognized in an amount equal to the excess.
We have one reporting unit and we test for goodwill impairment annually during the fourth quarter of each calendar year. At December 31, 2017, we determined our goodwill was not impaired as our fair value significantly exceeded the carrying value of our net assets.
Revenue Recognition
Our revenue is derived from the licensing of subscription, time-based software, sale of a hosted version of our software, data subscription services, and professional services, including training and consulting services. The time-based subscriptions include post-contract support, or PCS, which provides the customer the right to receive when-and-if-available unspecified future updates, upgrades and enhancements, and technical product support.
82
Table of Contents
Revenue is recognized when all four revenue recognition criteria have been met: persuasive evidence of an arrangement exists, the product has been delivered or the service has been performed, the fee is fixed or determinable, and collection is probable or reasonably assured. Determining whether and when some of these criteria have been satisfied often involves exercising judgment and using estimates and assumptions that can have a significant impact on the timing and amount of revenue that is recognized. Invoiced amounts have been recorded in accounts receivable and in deferred revenue or revenue, depending on whether the revenue recognition criteria have been met.
We account for revenue from software and related products and services in accordance with ASC 985-605, Software. For the duration of the license term, the customer receives coterminous PCS. We do not provide PCS on a standalone or renewal basis unless the customer renews the software subscription license and, as such, we are unable to determine vendor specific objective evidence of fair value, or VSOE, of PCS. Accordingly, revenue for the subscription of time-based software licenses and PCS is recognized ratably beginning on the date the license is first made available to the customer and continuing through the end of the subscription term. Revenue from time-based software licenses and PCS comprised more than 90% of revenue for each of the years ended December 31, 2017, 2016, and 2015.
We also recognize revenue from the sale of a hosted version of our platform which is delivered pursuant to a hosting arrangement. Revenue from hosted services is recognized ratably beginning on the date the services are first made available to the customer and continuing through the end of the contractual service term. Hosted revenue arrangements are outside the scope of ASC 986-605 software revenue recognition guidance as customers do not have the right to take possession of the software code underlying our hosted solutions.
Our arrangements may include the resale of third-party syndicated data content pursuant to subscription arrangements, and professional services. Data subscriptions provide the customer the right to receive data that is updated periodically over the term of the license agreement, and revenue is recognized ratably over the contract period once the customer has access to the data. We recognize revenue from the resale of third-party syndicated data on a gross basis when (i) we are the primary obligor, (ii) we have latitude to establish the price charged, and (iii) we bear credit risk in the transaction. Revenue from professional services, which is comprised primarily of training and consulting services, is recognized on a time and materials basis as the services are provided.
Multiple Element Arrangements
We enter into multiple element revenue arrangements in which a customer may purchase a combination of software, data, and services.
For multiple element arrangements that contain only software and software-related elements, revenue is allocated and deferred for the undelivered elements based on their VSOE. In situations where VSOE exists for all elements (delivered and undelivered), the revenue to be earned under the arrangement among the various elements is allocated based on their relative fair value. For arrangements where VSOE exists only for the undelivered elements, the full fair value of the undelivered elements is deferred and the difference between the total arrangement fee and the amount deferred for the undelivered items is recognized as revenue. If VSOE does not exist for an undelivered service element, the revenue from the entire arrangement is recognized over the service period, once all services have commenced. Changes in assumptions or judgments or changes to the elements in a software arrangement could cause a material increase or decrease in the amount of revenue recognized in a particular period.
VSOE is determined for each element, or a group of elements sold on a combined basis, such as our software and PCS, based on historical stand-alone sales to third parties or the price to be charged when the product or service, or group of products or services, is available. In determining VSOE, a substantial majority of the selling prices for a product or service must fall within a reasonably narrow pricing range.
83
Table of Contents
Revenue related to the delivered products or services is recognized only if (i) the above revenue recognition criteria are met, (ii) any undelivered products or services are not essential to the functionality of the delivered products and services, (iii) payment for the delivered products or services is not contingent upon delivery of the remaining products or services, and (iv) there is an enforceable claim to receive the amount due in the event that the undelivered products or services are not delivered.
For multiple-element arrangements that contain both software and non-software elements, revenue is allocated on a relative fair value basis to software or software-related elements as a group and any non-software elements separately based on the selling price hierarchy. The selling price for each deliverable is determined using VSOE of selling price, if it exists, or third-party evidence of fair value, or TPE. If neither VSOE nor TPE exist for a deliverable, best estimate of selling price, or BESP, is used. Once revenue is allocated to software or software-related elements as a group, revenue is recognized in accordance with software revenue accounting guidance. Revenue allocated to non-software elements is recognized in accordance with SAB Topic 13, Revenue Recognition. Revenue is recognized when revenue recognition criteria are met for each element.
Judgment is required to determine VSOE or BESP. For VSOE, we consider multiple factors including, but not limited to, product types, geographies, sales channels, and customer sizes and, for BESP, we also consider market conditions, competitive landscape, internal costs, gross margin objectives, and pricing practices. Pricing practices taken into consideration include historic contractually stated prices, volume discounts, where applicable, and price lists. BESP is generally used for offerings that are not typically sold on a stand-alone basis or when the selling prices for a product or service do not fall within a reasonably narrow pricing range.
Revenue generated from sales arrangements through distributors is recognized in accordance with our revenue recognition policies as described above at the amount invoiced to the distributor. We recognize revenue at the net amount invoiced to the distributor, as opposed to the gross amount the distributor invoices their end customer, as we have determined that (i) we are not the primary obligor in these arrangements, (ii) we do not have latitude to establish the price charged to the end-customer, and (iii) we do not bear credit risk in the transaction with the end-customer.
Deferred Revenue
Deferred revenue includes amounts collected or billed in excess of revenue recognized. Such amounts are recognized by us over the life of the contract upon meeting the revenue recognition criteria. Deferred revenue that will be recognized during the succeeding 12-month period is recorded as current deferred revenue and the remaining portion is recorded as non-current deferred revenue in our consolidated balance sheet.
Cost of Revenue
Cost of revenue is accounted for in accordance with ASC 705, Cost of Sales and Services, and consists of employee-related costs, including salaries and bonuses, stock-based compensation expense, and employee benefit costs associated with our customer support and professional services organizations, expenses related to hosting and operating our cloud infrastructure in a third-party data center, licenses of third-party syndicated data, amortization of acquired completed technology intangible assets, and related overhead expenses. Out-of-pocket travel costs related to the delivery of professional services are typically reimbursed by the customers and are accounted for as both revenue and cost of revenue in the period in which the cost is incurred.
Research and Development
Research and development expense consists primarily of employee-related costs, including salaries and bonuses, stock-based compensation expense, and employee benefits costs, depreciation of equipment used in research and development for our research and development employees, third-party contractor costs, and related allocated overhead costs. Product development expenses, other than software development costs qualifying for capitalization, are expensed as incurred.
84
Table of Contents
Software Development Costs
Costs incurred in the development of new software products and enhancements to existing software products to be accounted for under software revenue recognition guidance are accounted for in accordance with ASC 985-20, Costs of Software to be Sold, Leased, or Marketed. These costs, consisting primarily of salaries and related payroll costs, are expensed as incurred until technological feasibility has been established. After technological feasibility is established, costs are capitalized in accordance with ASC 985-20. Because our process for developing software is completed concurrently with the establishment of technological feasibility, no internally generated software development costs have been capitalized as of December 31, 2017 and 2016.
We account for costs to develop or obtain internal-use software in accordance with ASC 350-40, Internal-Use Software. We also account for costs of significant upgrades and enhancements resulting in additional functionality under ASC 350-40. These costs are primarily software purchased for internal-use, purchased software licenses, implementation costs, and development costs related to our hosted product which is accessed by customers on a subscription basis. Costs incurred for maintenance, training, and minor modifications or enhancements are expensed as incurred. Internal-use software is amortized on a straight-line basis over its estimated useful life, which is generally three years. Management evaluates the useful lives of these assets on an annual basis and tests for impairment whenever events or changes in circumstances occur that could impact the recoverability of these assets. Development costs related to internal-use software were insignificant during the years ended December 31, 2017 and 2016 and, therefore, have not been capitalized.
Advertising Costs
Advertising costs are expensed as incurred. We incurred advertising costs of approximately $5.5 million, $5.0 million, and $3.7 million for the years ended December 31, 2017, 2016, and 2015, respectively. Such costs primarily relate to our annual customer conferences, online and print advertising as well as sponsorship of public marketing events, and are reflected in sales and marketing expense in our consolidated statements of operations and comprehensive loss.
Stock-Based Compensation
We recognize stock-based compensation expense in accordance with the provisions of ASC 718, Compensation—Stock Compensation. ASC 718 requires the measurement and recognition of compensation expense for all stock-based payment awards made to employees and directors based on the grant date fair values of the awards. We use the Black-Scholes option-pricing method for valuing stock options and shares granted under the employee share purchase plan. Restricted stock units, or RSUs are valued based on the fair value of our common stock on the date of grant, less our expected dividend yield. For awards that vest solely based on continued service the fair value of an award, net of estimated forfeitures, is recognized as an expense over the requisite service period on a straight-line basis. For awards that contain performance conditions, the fair value of an award, net of estimated forfeitures, is recognized based on the probability of the performance condition being met using the graded vesting method. Stock-based compensation expense is included in cost of revenue and operating expenses within our consolidated statements of operations and comprehensive loss based on the classification of the individual earning the award.
The determination of the grant date fair value of stock-based awards is affected by the estimated fair value per share of our common stock as well as other highly subjective assumptions, including, but not limited to, the expected term of the stock-based awards, expected stock price volatility, risk-free interest rates, and expected dividends yields, which are estimated as follows:
| • | Fair value per share of our common stock. Prior to our initial public offering, in March 2017, given the absence of an active market for our common stock, our board of directors determined the fair value of our common stock at the time of grant for each stock-based award based upon several factors, including consideration of input from management and contemporaneous third-party valuations. The |
85
Table of Contents
| fair value of our common stock was determined in accordance with applicable elements of the practice aid issued by the American Institute of Certified Public Accountants, Valuation of Privately Held Company Equity Securities Issued as Compensation. Each fair value estimated was based on a variety of factors including, the prices, rights, preferences and privileges of our preferred stock relative to those of our common stock, pricing and timing of transactions in our equity, the lack of marketability of our common stock, our actual operating and financial performance, developments and milestones in our company, the market performance of comparable publicly traded companies, the likelihood of achieving a liquidity event, and U.S. and global capital market conditions, among other factors. Subsequent to our initial public offering, the fair value of our common stock is based on the closing price of our Class A common stock, as reported on the New York Stock Exchange, on the date of grant. |
| • | Expected term. We determine the expected term of the awards using the simplified method, which estimates the expected term based on the average of the vesting period and contractual term of the stock option. |
| • | Expected volatility. We estimate the expected volatility based on the volatility of similar publicly held entities (referred to as “guideline companies”) over a period equivalent to the expected term of the awards. In evaluating the similarity of guideline companies to us, we considered factors such as industry, stage of life cycle, size, and financial leverage. We intend to continue to consistently apply this process using the same or similar guideline companies to estimate the expected volatility until sufficient historical information regarding the volatility of the share price of our common stock becomes available. |
| • | Risk-free interest rate. The risk-free interest rate used to value our stock-based awards is based on the U.S. Treasury yield in effect at the time of grant for a period consistent with the expected term of the award. |
| • | Estimated dividend yield. The expected dividend was assumed to be zero as we have never declared or paid any cash dividends and do not currently intend to declare dividends in the foreseeable future. |
In addition, we are required to estimate at the time of grant the expected forfeiture rate and only recognize expense for those stock-based awards expected to vest. Our estimated forfeiture rate is based on our estimate of pre-vesting award forfeitures.
The assumptions used in calculating the fair value of stock-based awards represent our best estimates, but these estimates involve inherent uncertainties and the application of judgment. As a result, if factors change or we use different assumptions, stock-based compensation expense could be materially different in the future.
Foreign Currency Remeasurement and Transactions
The functional currency of our wholly owned subsidiaries is the currency of the primary economic environment in which the entity operates. Assets and liabilities denominated in currencies other than the functional currency are remeasured using the current exchange rate for monetary accounts and historical exchange rates for nonmonetary accounts, with exchange differences on remeasurement included in other expense in our consolidated statements of operations and comprehensive loss. Our foreign subsidiaries that utilize foreign currency as their functional currency translate such currency into U.S. Dollars using (i) the exchange rate on the balance sheet dates for assets and liabilities, (ii) the average exchange rates prevailing during the period for revenues and expenses, and (iii) historical exchange rates for equity. Any translation adjustments resulting from this process are shown separately as a component of accumulated other comprehensive income (loss) within stockholder’s equity (deficit) in the consolidated balance sheets.
Transactions denominated in currencies other than the U.S. dollar may result in transaction gains or losses at the end of the period and when the related receivable or payable is settled, which are recorded in other income (expense), net. Transaction losses were $0.3 million, $0.5 million, and $0.2 million for the years ended December 31, 2017, 2016, and 2015, respectively.
86
Table of Contents
Income Taxes
We apply the provisions of ASC 740, Income Taxes. Under ASC 740, we account for our income taxes using the asset and liability method whereby deferred tax assets and liabilities are determined based on temporary differences between the bases used for financial reporting and income tax reporting purposes. Deferred income taxes are provided based on the enacted tax rates and laws that will be in effect at the time such temporary differences are expected to reverse. A valuation allowance is provided for deferred tax assets if it is more likely than not that we will not realize those tax assets through future operations.
We also utilize the guidance in ASC 740 to account for uncertain tax positions. ASC 740 contains a two-step approach to recognizing and measuring uncertain tax positions. The first step is to evaluate the tax position for recognition by determining if the weight of available evidence indicates it is more likely than not that the position will be sustained on audit, including resolution of related appeals or litigation processes, if any. The second step is to measure the tax benefit as the largest amount which is more likely than not to be realized and effectively settled. We consider many factors when evaluating and estimating our tax positions and tax benefits, which may require periodic adjustments and which may not accurately reflect actual outcomes. We recognize interest and penalties on unrecognized tax benefits as a component of income tax expense in our consolidated statement of operations and comprehensive loss.
Net Loss Per Share Attributable to Common Stockholders
In periods in which we have net income, we apply the two-class method for calculating earnings per share. Under the two-class method, net income is attributed to common stockholders and participating securities based on their participation rights. Participating securities include convertible preferred stock. In periods in which we have net losses after accretion of convertible preferred stock, we do not attribute losses to participating securities as they are not contractually obligated to share our losses.
Under the two-class method, basic net income (loss) per share attributable to common stockholders is computed by dividing the net income (loss) attributable to common stockholders by the weighted-average number of shares of common stock outstanding during the period. Net income (loss) attributable to common stockholders is calculated as net income (loss) including current period convertible preferred stock accretion.
Diluted earnings per share attributable to common stockholders adjusts basic earnings per share for the potentially dilutive impact of stock options and convertible preferred stock. As we have reported losses for all periods, all potentially dilutive securities are antidilutive and accordingly, basic net loss per share equals diluted net loss per share.
Variable Interest Entities
In accordance with ASC 810, Consolidation, the applicable accounting guidance for the consolidation of variable interest entities, or VIEs, we analyze our interests to determine if such interests are variable interests. If variable interests are identified, then the related entity is assessed to determine if it is a VIE. VIEs are generally entities that have either a total equity investment that is insufficient to permit the entity to finance its activities without additional subordinated financial support, or whose equity investors lack the characteristics of a controlling financial interest (i.e., ability to make significant decisions through voting rights and a right to receive the expected residual returns of the entity or an obligation to absorb the expected losses of the entity). If we determine that the entity is a VIE, we then assess if we must consolidate the VIE. We deem ourselves to be the primary beneficiary if we have both (i) the power to direct the activities of the VIE that most significantly impact the entity’s economic performance, and (ii) an obligation to absorb losses of the entity that could potentially be significant to the VIE, or a right to receive benefits from the entity that could be significant to the VIE.
As of December 31, 2017 and December 31, 2016, we determined that two of our distributors were VIEs under the guidance of ASC 810, Consolidation, due to (i) our participation in the design of the distributor’s legal
87
Table of Contents
entity, (ii) having a variable interest in the distributor, and (iii) having the right to residual returns. We determined that we were not the primary beneficiary of these VIEs because we did not have (a) the power to direct the activities that most significantly impact the VIE’s economic performance, and (b) the obligation to absorb losses of the VIE or the right to receive benefits from the VIE that could potentially be significant. Therefore, we did not consolidate any assets or liabilities of these distributors in our consolidated balance sheets or record the results of these distributors in our consolidated statements of operations and comprehensive loss. Transactions with the distributors were accounted for in the same manner as our other distributors and resellers. As of December 31, 2017 and December 31, 2016, we had no exposure to losses from the contractual relationships with these VIEs or commitments to fund these VIEs. Subsequent to December 31, 2017, we acquired 100% of the outstanding equity of one of our VIEs. See Note 20 for additional information.
Recent Accounting Pronouncements
Under the Jumpstart our Business Startups Act, or the JOBS Act, we meet the definition of an emerging growth company, or EGC. We have elected to use this extended transition period for complying with new or revised accounting standards pursuant to Section 107(b) of the JOBS Act.
In January 2017, the Financial Accounting Standards Board, or FASB issued Accounting Standards Update, or ASU, 2017-04, Simplifying the Test for Goodwill Impairment, which simplifies the subsequent measurement of goodwill by removing the requirement to perform a hypothetical purchase price allocation to compute the implied fair value of goodwill to measure impairment. Instead, any goodwill impairment will equal the amount by which a reporting unit’s carrying value exceeds its fair value, not to exceed the carrying amount of goodwill. Further, the guidance eliminates the requirements for any reporting unit with a zero or negative carrying amount to perform a qualitative assessment and, if it fails that qualitative test, to perform Step 2 of the goodwill impairment test. For public companies, this guidance is effective for annual or any interim goodwill impairment test in annual reporting periods beginning after December 15, 2020. For as long as we remain an EGC, the new guidance is effective for any annual or interim goodwill impairment test in annual reporting periods beginning after December 15, 2021. Early adoption is permitted. While we continue to assess the potential impact of the adoption of this guidance, we do not expect the adoption of this guidance to have a material impact on our consolidated financial statements.
In January 2017, the FASB issued ASU 2017-01, Clarifying the Definition of a Business, which narrows the application of when an integrated set of assets and activities is considered a business and provides a framework to assist entities in evaluating whether both an input and a substantive process are present to be considered a business. It is expected that the new guidance will reduce the number of transactions that would need to be further evaluated and accounted for as a business. For public companies, this guidance is effective for annual reporting periods beginning after December 15, 2017, including interim periods within those fiscal years. For as long as we remain an EGC, the new guidance is effective for annual reporting periods beginning after December 15, 2018 and interim periods within annual periods beginning after December 15, 2019. Early adoption is permitted. We are evaluating the potential impact of adopting this guidance on our consolidated financial statements.
In November 2016, the FASB issued ASU 2016-18, Restricted Cash, which requires that restricted cash be included with cash and cash equivalents when reconciling the beginning and ending total amounts shown on the statement of cash flows. For public companies, this guidance is effective for fiscal years beginning after December 15, 2017, including interim periods within those fiscal years. For as long as we remain an EGC, the new guidance is effective for annual reporting periods beginning after December 15, 2018 and interim periods within fiscal years beginning after December 15, 2019, and should be applied using a retrospective transition method to each period presented. Early adoption is permitted, including adoption in an interim period. If an entity early adopts the amendments in an interim period, any adjustments should be reflected as of the beginning of the fiscal year that includes that interim period. We have not yet determined the timing of adoption. We currently
88
Table of Contents
present changes in restricted cash within investing activities and so the adoption of this guidance will result in changes in net cash flows from investing activities and to certain beginning and ending cash and cash equivalent totals shown on our consolidated statement of cash flows.
In October 2016, the FASB issued ASU 2016-16, Intra-Entity Transfers of Assets Other Than Inventory. This guidance removes the prohibition in ASC 740, Income Taxes, against the immediate recognition of the current and deferred income tax effects of intra-entity transfers of assets other than inventory. This guidance is intended to reduce the complexity of U.S. GAAP and diversity in practice related to the tax consequences of certain types of intra-entity asset transfers, particularly those involving intellectual property. For public companies, this guidance is effective for annual reporting periods beginning after December 15, 2017, including interim periods within those fiscal years. For as long as we remain an EGC, the new guidance is effective for annual reporting periods beginning after December 15, 2018, and interim periods within fiscal years beginning after December 15, 2019. Early adoption is permitted. We are currently evaluating the potential impact of this guidance on our consolidated financial statements.
In August 2016, the FASB issued ASU 2016-15, Classification of Certain Cash Receipts and Cash Payments, which addresses eight specific cash flow issues with the objective of reducing the existing diversity in practice, including presentation of cash flows relating to contingent consideration payments, proceeds from the settlement of insurance claims, and debt prepayment or debt extinguishment costs, among other matters. For public companies, this guidance is effective for fiscal years beginning after December 15, 2017, including interim periods within those fiscal years. For as long as we remain an EGC, the new guidance is effective for annual reporting periods beginning after December 15, 2018, and interim periods within fiscal years beginning after December 15, 2019. Early adoption is permitted, including adoption in an interim period. If adopted in an interim period, any adjustments should be reflected as of the beginning of the fiscal year that includes that interim period. Adoption of this guidance is required to be applied using a retrospective transition method to each period presented, unless impracticable to do so. We are currently evaluating the potential impact of this guidance on our consolidated statement of cash flows.
In March 2016, the FASB issued ASU 2016-09, Compensation—Stock Compensation (Topic 718): Improvements to Employee Share-Based Payment Accounting, or ASU 2016-09, which simplifies several aspects of the accounting for share-based payment transactions and related tax impacts, the classification of excess tax benefits on the statement of cash flows, statutory tax withholding requirements, and other stock-based compensation classification matters. For public companies, this guidance is effective for annual reporting periods beginning after December 15, 2016, including interim periods within those fiscal years. For as long as we remain an EGC, the new guidance is effective for annual reporting periods beginning after December 15, 2017, and interim periods within annual periods beginning after December 31, 2018. Early adoption is permitted in any interim or annual period. All the amendments in the new guidance must be adopted in the same period. We expect to adopt this standard during the first quarter ending March 31, 2018. We do not expect this standard to have a material impact on our consolidated financial statements as we anticipate that the majority of our previously unrecognized excess tax benefits, recognized upon adoption, will be offset by a corresponding increase to our U.S. federal and state deferred tax asset valuation allowance. Additionally, we plan to make the policy election to account for forfeitures as they occur; however, we do not anticipate that this change will have a material impact on our consolidated financial statements.
In February 2016, the FASB issued ASU 2016-02, Leases, creating Topic 842, which requires lessees to record the assets and liabilities arising from all leases in the statement of financial position. Under ASU 2016-02, lessees will recognize a liability for lease payments and a right-of-use asset. When measuring assets and liabilities, a lessee should include amounts related to option terms, such as the option of extending or terminating the lease or purchasing the underlying asset, that are reasonably certain to be exercised. For leases with a term of 12 months or less, lessees are permitted to make an accounting policy election to not recognize lease assets and liabilities. This guidance retains the distinction between finance leases and operating leases and the classification criteria remains similar. For financing leases, a lessee will recognize the interest on a lease liability separate from
89
Table of Contents
amortization of the right-of-use asset. In addition, repayments of principal will be presented within financing activities, and interest payments will be presented within operating activities in the statement of cash flows. For operating leases, a lessee will recognize a single lease cost on a straight-line basis and classify all cash payments within operating activities in the statement of cash flows. For public companies, this guidance will be effective for fiscal years beginning after December 15, 2018, including interim periods within those fiscal years. For as long as we remain an EGC, the new guidance is effective for annual reporting periods beginning after December 15, 2019, and interim periods within fiscal years beginning after December 15, 2020, and is required to be applied using a modified retrospective approach. Early adoption is permitted. We are evaluating the potential impact of this guidance on our consolidated financial statements.
In May 2014, the FASB issued ASU 2014-09, Revenue from Contracts with Customers. This guidance replaces most existing revenue recognition guidance. It provides principles for recognizing revenue for the transfer of promised goods or services to customers with the consideration to which the entity expects to be entitled in exchange for those goods or services. In August 2015, the FASB issued ASU 2015-14, which deferred the effective date of ASU 2014-09 by one year. During 2016, the FASB continued to issue additional amendments to this new revenue guidance. For public companies, this new revenue guidance will be effective for annual reporting periods beginning after December 15, 2017, including interim periods within those fiscal years. For as long as we remain an EGC, the new guidance is effective for annual reporting periods beginning after December 15, 2018, and interim reporting periods within annual reporting periods beginning after December 15, 2019. Early adoption is permitted for annual periods beginning after December 15, 2016. We are evaluating the potential impact of this guidance on our consolidated financial statements.
3. Business Combinations
In January 2017, we acquired 100% of the outstanding equity of Semanta, s.r.o., or Semanta, a software development firm based in Prague, Czech Republic that delivers a cloud-based data governance and metadata management platform. In May 2017, we acquired 100% of the outstanding equity of Yhat, Inc., or Yhat, a data science software company based in Brooklyn, New York that provides data scientists and analysts with self-service data science tools for developing, managing, and deploying analytical models. These acquisitions were made to enhance our platform with additional data governance capabilities and the ability to deploy and manage advanced analytic models.
The following table presents details of the purchase consideration related to each acquisition (in thousands):
| Company Acquired |
Month Acquired |
Cash Consideration Paid |
Equity Consideration Paid |
Cash Holdback |
Contingent Consideration Maximum |
Contingent Consideration Fair Value |
||||||||||||||||||
| Semanta |
January 2017 | $ | 3,944 | $ | — | $ | 500 | $ | 2,300 | $ | 1,160 | |||||||||||||
| Yhat |
May 2017 | 5,535 | 5,285 | — | — | — | ||||||||||||||||||
|
|
|
|
|
|
|
|
|
|
|
|||||||||||||||
| $ | 9,479 | $ | 5,285 | $ | 500 | $ | 2,300 | $ | 1,160 | |||||||||||||||
|
|
|
|
|
|
|
|
|
|
|
|||||||||||||||
The acquisition of Semanta included cash consideration held back for customary indemnification matters for a period of 24-months following the acquisition date. A portion of the cash consideration in the Yhat acquisition is currently held in escrow pursuant to the terms of the acquisition agreement and is reflected in goodwill.
The consolidated financial statements include the results of operations of the acquired companies commencing as of their respective acquisition dates. Revenue and operating results of the acquired companies for the year ended December 31, 2017 were not material to the consolidated financial statements. During the year ended December 31, 2017, we recognized $0.9 million of acquisition related costs in general and administrative expense in the consolidated statement of operations and comprehensive loss.
90
Table of Contents
The following table summarizes the estimated fair values of the assets acquired and liabilities assumed as of the dates of each acquisition (in thousands):
| Assets acquired and liabilities assumed: |
||||
| Cash and cash equivalents |
$ | 382 | ||
| Accounts receivable |
247 | |||
| Prepaid expenses and other assets |
68 | |||
| Property and equipment |
54 | |||
| Intangible assets |
9,220 | |||
| Goodwill |
8,724 | |||
| Accounts payable |
(479 | ) | ||
| Accrued expenses, deferred revenue and other current liabilities |
(205 | ) | ||
| Deferred tax liability, included in other liabilities |
(1,587 | ) | ||
|
|
|
|||
| Total purchase consideration |
$ | 16,424 | ||
|
|
|
Goodwill represents the excess of the purchase consideration over the fair value of the underlying intangible assets and net liabilities assumed. We believe the amount of goodwill resulting from the acquisitions is primarily attributable to expected synergies from an assembled workforce, increased development capabilities, increased offerings to customers, and enhanced opportunities for growth and innovation. The goodwill resulting from the acquisitions is not tax deductible.
We determined the fair value of the completed technology acquired in the acquisitions using the multiple period excess earnings and the replacement cost models. These models utilize certain unobservable inputs classified as Level 3 measurements as defined by ASC 820, Fair Value Measurements and Disclosures. Key inputs utilized in the models include discount rates ranging from 35% to 45%, a market participant tax rate of 40%, an estimated level of future cash flows based on current product and market data, and estimated costs to recreate the technology. Based on the valuation models, we determined the fair value of the completed technology to be $9.2 million with a weighted-average amortization period of 5.7 years.
A portion of the consideration for the Semanta acquisition is subject to earn-out provisions. Additional contingent earn-out consideration of up to $2.3 million in shares of our Class A common stock may be paid out to the former shareholders of Semanta over two years upon the achievement of specified milestones. The number of shares that will be issued will be determined based on the total dollar value of consideration earned upon the achievement of a particular milestone divided by the prior 20-day average trading value of our Class A common stock calculated at the time of the issuance. We utilized a probability weighted scenario based model to determine the fair value of the contingent consideration. Based on this valuation model we determined the fair value of the contingent consideration to be $1.2 million as of the acquisition date.
Pro forma information as if the acquisitions occurred on January 1, 2016 has not been presented as the pro forma impact is not material to our consolidated financial statements.
91
Table of Contents
4. Fair Value Measurements
Instruments Measured at Fair Value on a Recurring Basis. The following tables present our cash and cash equivalents and investments’ costs, gross unrealized gains (losses), and fair value by major security type recorded as cash and cash equivalents or short-term or long-term investments as of December 31, 2017 and December 31, 2016 (in thousands):
| As of December 31, 2017 | ||||||||||||||||||||||||
| Cost | Gross Unrealized Gains (Losses) |
Fair Value | Cash and Cash Equivalents |
Short-term Investments |
Long-term Investments |
|||||||||||||||||||
| Cash |
$ | 100,651 | $ | — | $ | 100,651 | $ | 100,651 | $ | — | $ | — | ||||||||||||
|
|
|
|
|
|
|
|
|
|
|
|
|
|||||||||||||
| Level 1: |
||||||||||||||||||||||||
| Money market funds |
19,065 | — | 19,065 | 19,065 | — | — | ||||||||||||||||||
|
|
|
|
|
|
|
|
|
|
|
|
|
|||||||||||||
| Subtotal |
19,065 | — | 19,065 | 19,065 | — | — | ||||||||||||||||||
|
|
|
|
|
|
|
|
|
|
|
|
|
|||||||||||||
| Level 2: |
||||||||||||||||||||||||
| U.S. Treasury and agency bonds |
44,968 | (176 | ) | 44,792 | — | 25,923 | 18,869 | |||||||||||||||||
| Corporate bonds |
29,608 | (50 | ) | 29,558 | — | 28,463 | 1,095 | |||||||||||||||||
|
|
|
|
|
|
|
|
|
|
|
|
|
|||||||||||||
| Subtotal |
74,576 | (226 | ) | 74,350 | — | 54,386 | 19,964 | |||||||||||||||||
|
|
|
|
|
|
|
|
|
|
|
|
|
|||||||||||||
| Level 3 |
— | — | — | — | — | — | ||||||||||||||||||
|
|
|
|
|
|
|
|
|
|
|
|
|
|||||||||||||
| Total |
$ | 194,292 | $ | (226 | ) | $ | 194,066 | $ | 119,716 | $ | 54,386 | $ | 19,964 | |||||||||||
|
|
|
|
|
|
|
|
|
|
|
|
|
|||||||||||||
| As of December 31, 2016 | ||||||||||||||||||||||||
| Cost | Gross Unrealized Gains (Losses) |
Fair Value | Cash and Cash Equivalents |
Short-term Investments |
Long-term Investments |
|||||||||||||||||||
| Cash |
$ | 10,499 | $ | — | $ | 10,499 | $ | 10,499 | $ | — | $ | — | ||||||||||||
|
|
|
|
|
|
|
|
|
|
|
|
|
|||||||||||||
| Level 1: |
||||||||||||||||||||||||
| Money market funds |
20,807 | — | 20,807 | 20,807 | — | — | ||||||||||||||||||
|
|
|
|
|
|
|
|
|
|
|
|
|
|||||||||||||
| Subtotal |
20,807 | — | 20,807 | 20,807 | — | — | ||||||||||||||||||
|
|
|
|
|
|
|
|
|
|
|
|
|
|||||||||||||
| Level 2: |
— | |||||||||||||||||||||||
| Certificates of deposit |
10,552 | — | 10,552 | — | 10,552 | — | ||||||||||||||||||
| Corporate bonds |
10,770 | 72 | 10,842 | — | 10,842 | — | ||||||||||||||||||
|
|
|
|
|
|
|
|
|
|
|
|
|
|||||||||||||
| Subtotal |
21,322 | 72 | 21,394 | — | 21,394 | — | ||||||||||||||||||
|
|
|
|
|
|
|
|
|
|
|
|
|
|||||||||||||
| Level 3 |
— | — | — | — | — | — | ||||||||||||||||||
|
|
|
|
|
|
|
|
|
|
|
|
|
|||||||||||||
| Total |
$ | 52,628 | $ | 72 | $ | 52,700 | $ | 31,306 | $ | 21,394 | $ | — | ||||||||||||
|
|
|
|
|
|
|
|
|
|
|
|
|
|||||||||||||
There were no transfers between Level 1, Level 2, or Level 3 securities during the year ended December 31, 2017. As of December 31, 2017, there were 27 securities with a fair value of $74.4 million in an unrealized loss position for less than 12 months. The gross unrealized losses of $0.2 million as of December 31, 2017 were due to changes in market rates, and we have determined the losses are temporary in nature.
All the long-term investments had maturities of between one and two years in duration as of December 31, 2017. Cash and cash equivalents, restricted cash, and investments as of December 31, 2017 and December 31, 2016 held domestically were approximately $181.3 million and $52.9 million, respectively.
Contingent Consideration. Contingent consideration in connection with acquisitions is measured at fair value each reporting period based on significant unobservable inputs, classified as Level 3 measurement. See
92
Table of Contents
Note 3 for additional information on the valuation of the contingent consideration as of the acquisition date. The contingent earn-out consideration has been recorded in other liabilities in our accompanying consolidated balance sheet with any changes in fair value each reporting period recorded in general and administrative expenses in our consolidated statements of operations and comprehensive loss. Changes in fair value depend on several factors including estimates of the timing and ability to achieve the milestones.
The following table presents a reconciliation of the beginning and ending balances of acquisition-related accrued contingent consideration using significant unobservable inputs (Level 3) (in thousands):
| Year Ended December 31, 2017 |
||||
| Beginning balance |
$ | — | ||
| Obligations assumed |
1,160 | |||
| Change in fair value |
190 | |||
| Settlement |
(375 | ) | ||
|
|
|
|||
| Ending balance |
$ | 975 | ||
|
|
|
|||
Upon the achievement of certain milestones in connection with our acquisition of Semanta, we released 12,492 shares of Class A common stock to the former shareholders of Semanta in the year ended December 31, 2017. In addition, 4,824 shares were earned, but held back for customary indemnification matters in accordance with the acquisition agreement, and the value of the shares is presented within additional paid-in capital in the consolidated balance sheet as of December 31, 2017. Subject to any indemnification claims that may arise during the indemnification period, these shares will be issued to the former shareholders upon the completion of the indemnification period.
Instruments Not Recorded at Fair Value on a Recurring Basis. The carrying amounts of our financial instruments, including cash, accounts receivable, prepaid expenses and other current assets, accounts payable, and accrued liabilities approximate their current fair value because of their nature and relatively short maturity dates or durations.
Assets and Liabilities Recorded at Fair Value on a Non-Recurring Basis. The fair value of our cost method investment is measured when it is deemed to be other-than-temporarily impaired, assets acquired and liabilities assumed in a business acquisition, and goodwill and other long lived assets when they are held for sale or determined to be impaired. See Notes 3 and 5 for fair value measurements of certain assets and liabilities recorded at fair value on a non-recurring basis.
5. Cost Method Investment
In November 2014, we entered into a definitive agreement with a privately held company, in which we agreed to invest approximately $1.1 million in exchange for shares of convertible preferred stock equal to approximately 15% ownership of the privately held company. We account for our investment in this company using the cost method of accounting and the investment balance is included in other non-current assets in our consolidated balance sheets. We evaluate the investment at each reporting date to determine if any indicators of other-than-temporary impairment exist. If such indicators are identified, we will estimate the fair value of the investment and determine if any decline in the fair value of the investment below its carrying value is other-than-temporary. The estimated fair value is determined using unobservable inputs including forecasted cash flow information from the investee’s management. These inputs are classified as Level 3. During the year ended December 31, 2017, we determined that indicators of other-than-temporary impairment existed. Based on our evaluation, we estimated the fair value of the investment and recorded an impairment for the full value of the investment of $1.1 million. The impairment is included in other expenses, net in our consolidated statements of operations for the year ended December 31, 2017.
93
Table of Contents
6. Allowance for Doubtful Accounts
The following table summarizes the changes in the allowance for doubtful accounts (in thousands):
| Year Ended December 31, | ||||||||||||
| 2017 | 2016 | 2015 | ||||||||||
| Beginning balance |
$ | 670 | $ | 280 | $ | 62 | ||||||
| Charge-offs |
(337 | ) | (97 | ) | (19 | ) | ||||||
| Recoveries |
(783 | ) | (283 | ) | (1 | ) | ||||||
| Provision |
1,905 | 770 | 238 | |||||||||
|
|
|
|
|
|
|
|||||||
| Ending balance |
$ | 1,455 | $ | 670 | $ | 280 | ||||||
|
|
|
|
|
|
|
|||||||
7. Property and Equipment
Property and equipment, net consisted of the following (in thousands):
| As of December 31, | ||||||||
| 2017 | 2016 | |||||||
| Computer equipment & software |
$ | 5,852 | $ | 4,736 | ||||
| Furniture and fixtures |
1,812 | 1,910 | ||||||
| Leasehold improvements |
2,229 | 1,297 | ||||||
| Construction in process |
1,493 | 765 | ||||||
|
|
|
|
|
|||||
| $ | 11,386 | $ | 8,708 | |||||
| Less: Accumulated depreciation and amortization |
(3,894 | ) | (2,496 | ) | ||||
|
|
|
|
|
|||||
| Total property and equipment, net |
$ | 7,492 | $ | 6,212 | ||||
|
|
|
|
|
|||||
Depreciation and amortization expense for the years ended December 31, 2017, 2016, and 2015 was approximately $2.3 million, $1.7 million, and $0.8 million, respectively.
8. Goodwill and Intangible Assets
The change in carrying amount of goodwill for the year ended December 31, 2017 was as follows (in thousands):
| Goodwill as of December 31, 2016 |
$ | — | ||
| Goodwill recorded in connection with acquisitions |
8,724 | |||
| Effects of foreign currency translation |
26 | |||
|
|
|
|||
| Goodwill as of December 31, 2017 |
$ | 8,750 | ||
|
|
|
Intangible assets consisted of the following (in thousands, except years):
| As of December 31, 2017 | ||||||||||||||||
| Weighted Average Useful Life in Years |
Gross Carrying Value |
Accumulated Amortization |
Net Carrying Value |
|||||||||||||
| Customer Relationships |
2.0 | $ | 40 | $ | (12 | ) | $ | 28 | ||||||||
| Completed Technology |
5.7 | 9,180 | (1,213 | ) | 7,967 | |||||||||||
|
|
|
|
|
|
|
|||||||||||
| $ | 9,220 | $ | (1,225 | ) | $ | 7,995 | ||||||||||
|
|
|
|
|
|
|
|||||||||||
94
Table of Contents
We classified intangible asset amortization expense in the accompanying consolidated statements of operations and comprehensive loss as follows (in thousands):
| Year Ended December 31, | ||||||||||||
| 2017 | 2016 | 2015 | ||||||||||
| Cost of revenue |
$ | 1,213 | $ | — | $ | — | ||||||
| Sales and marketing |
12 | — | — | |||||||||
|
|
|
|
|
|
|
|||||||
| Total |
$ | 1,225 | $ | — | $ | — | ||||||
|
|
|
|
|
|
|
|||||||
The following table presents our estimates of remaining amortization expense for each of the five succeeding fiscal years and thereafter for finite-lived intangible assets at December 31, 2017 (in thousands):
| 2018 |
$ | 1,829 | ||
| 2019 |
1,817 | |||
| 2020 |
1,503 | |||
| 2021 |
1,293 | |||
| 2022 |
747 | |||
| Thereafter |
806 | |||
|
|
|
|||
| Total amortization expense |
$ | 7,995 | ||
|
|
|
9. Accrued Expenses and Other Current Liabilities
Accrued commissions of approximately $4.9 million and $4.1 million as of December 31, 2017 and 2016, respectively, were included in accrued payroll and payroll-related liabilities in our consolidated balance sheets.
10. Notes Receivable From Stockholder
Pursuant to a Loan and Security Agreement, dated March 18, 2011, we agreed to lend Dean A. Stoecker, the Chairman of our board of directors and Chief Executive Officer, or Borrower, up to $4.2 million, or Loan, in monthly advances of $0.1 million commencing on April 1, 2011. We were obligated to make the advances until the earlier of the termination of the Borrower’s employment agreement with us or November 1, 2017. The Loan bore interest on the outstanding principal balance at the applicable federal rate, as published monthly, and the accrued, but unpaid, interest was due and payable annually, or Annual Interest, by the Borrower no later than December 31 of each year. On or before December 31 of each year, we were obligated to pay the Borrower a bonus equal to the Annual Interest plus an amount equal to the estimated income taxes which the Borrower was required to pay on the bonus. In the event that we suspended the bonus for any reason, the Borrower’s obligation to pay the Annual Interest was also suspended until such time as we resumed payment of the bonus. The Loan was secured by our common stock held by an entity affiliated with the Borrower, or the Collateral Stock, and, prior to the Modification (as described below), was due and payable in full upon the sale of all shares of the Collateral Stock or, if less than all of the shares of the Collateral Stock were sold, the net proceeds from such sale were required to be paid to us towards repayment of the Loan.
On September 30, 2014, the terms of the Loan were modified, or the Modification, principally to (a) eliminate our obligation to make additional advances, (b) provide that the outstanding principal and accrued interest was due and payable upon the earlier of (i) the date that our unrestricted cash and cash equivalents was less than $15 million for more than thirty consecutive days, (ii) the date prior to the date we determine that the Loan would be deemed a prohibited loan under U.S. securities or other applicable laws, (iii) March 18, 2018, or (iv) the date of sale of any or all of the Collateral Stock, and (c) remove the restriction that limited our recourse solely to the Collateral Stock, resulting in the Loan becoming full recourse, or the Recourse Loan. The terms of the Loan were also modified to eliminate our obligations to pay the Borrower a bonus. Interest on the Loan
95
Table of Contents
balance continued to accrue monthly at the applicable federal rate. Concurrent with the Modification, the Borrower sold shares of common stock. As of December 31, 2015, an aggregate amount of approximately $2.3 million was outstanding pursuant to the Loan, including accrued, but unpaid, interest and 9.8 million shares held by the Borrower collateralized the Loan. The outstanding principal and accrued interest of approximately $2.3 million was fully repaid to us in November 2016.
We accounted for the original issuance of the Loan secured solely by shares of common stock as a repurchase of common stock and a concurrent grant of an option to purchase the shares of common stock, or the Note Option, with an effective exercise price equal to the borrowings under the Loan. The fair value of the Note Option was not material. We accounted for the Modification of the Loan as an exercise of the Note Option through the issuance of the Recourse Loan. Prior to the Modification, the Collateral Stock was treated as treasury stock and therefore was excluded from the basic net loss per share computations.
11. Line of Credit
On October 22, 2012, we entered into a line of credit agreement, as subsequently amended, with a commercial bank, or Bank, whereby we had a borrowing capacity of $10.0 million. Interest at the Bank’s prime rate was payable monthly. The loan was collateralized by a lien on substantially all of our assets. In December 2015, we paid off the line of credit in full and cancelled the line of credit agreement.
12. Redeemable Convertible Preferred Stock and Stockholders’ Equity (Deficit)
Redeemable Convertible Preferred Stock
Upon the closing of our initial public offering in March 2017, all shares of our then-outstanding convertible preferred stock automatically converted on a one-for-one basis into shares of Class B common stock.
As of December 31, 2016, our convertible preferred stock consisted of the following (in thousands, except per share data):
| As of December 31, 2016 | ||||||||||||||||||||
| Shares Authorized |
Shares Outstanding |
Price Per Share |
Net Carrying Value |
Liquidation Preference |
||||||||||||||||
| Series A |
8,238 | 7,986 | $ | 2.1850 | $ | 30,043 | $ | 17,448 | ||||||||||||
| Series B |
3,002 | 3,002 | 6.6630 | 19,914 | 20,000 | |||||||||||||||
| Series C |
3,659 | 3,659 | 13.6632 | 49,225 | 50,000 | |||||||||||||||
|
|
|
|
|
|
|
|
|
|||||||||||||
| Total |
14,899 | 14,647 | $ | 99,182 | $ | 87,448 | ||||||||||||||
|
|
|
|
|
|
|
|
|
|||||||||||||
The rights, privileges, and preferences of the Series A redeemable convertible preferred stock, Series B convertible preferred stock, and Series C convertible preferred stock, or collectively, Preferred Stock, were as follows:
Dividends
Dividends on the Preferred Stock were payable only when, and if, declared by the board of directors. No dividends on the Preferred Stock were declared by our board of directors or paid since inception.
Voting
The holders of each share of Preferred Stock were entitled to the number of votes equal to the number of shares of common stock into which their respective shares were convertible.
96
Table of Contents
Liquidation
In the event of our liquidation, dissolution, or winding up, the holders of Series A redeemable convertible preferred stock, Series B convertible preferred stock, and Series C convertible preferred stock were entitled to receive their full preferential amounts plus any declared but unpaid dividends prior to any distribution to the holders of common stock.
Classification of Preferred Stock
The deemed liquidation preference provisions of the Series A redeemable convertible preferred stock, Series B convertible preferred stock, and Series C convertible preferred stock were considered contingent redemption provisions that were not solely within our control. Accordingly, the Preferred Stock has been presented outside of permanent equity in the mezzanine portion of our consolidated balance sheets.
Reverse Stock Split
In February 2017, we effected a 2-to-1 reverse stock split of our outstanding common and preferred stock and a corresponding reduction in the number of authorized shares of preferred stock. All share and per share amounts for all periods presented in these consolidated financial statements and notes have been adjusted retrospectively to reflect this reverse stock split.
Dual Class Common Stock Structure
In February 2017, we implemented a dual class common stock structure in which each then existing share of common stock converted into a share of Class B common stock and we also authorized a new class of common stock, the Class A common stock. The Class A common stock is entitled to one vote per share and the Class B common stock is entitled to ten votes per share. The Class A common stock and Class B common stock have the same dividend and liquidation rights, and the Class B common stock converts to Class A common stock at any time at the option of the holder, or automatically upon the date that is the earliest of (i) the date specified by a vote of the holders of at least 66 2/3% of the outstanding shares of Class B common stock, (ii) March 29, 2027, and (iii) the date that the total number of shares of Class B common stock outstanding cease to represent at least 10% of the aggregate number of shares of Class A common stock and Class B common stock then outstanding. In addition, each share of Class B common stock will convert automatically into one share of Class A common stock upon any transfer, except for certain permitted transfers described in our restated certificate of incorporation, or the Restated Certificate. Upon the creation of the dual class common stock structure all outstanding options to purchase common stock became options to purchase an equivalent number of shares of Class B common stock, and all RSUs, became RSUs for an equivalent number of shares of Class B common stock.
Upon the effectiveness of the Restated Certificate in March 2017, the number of shares of capital stock that were authorized to be issued consisted of 500,000,000 shares of Class A common stock, $0.0001 par value per share, 500,000,000 shares of Class B common stock, $0.0001 par value per share, and 10,000,000 shares of undesignated preferred stock, $0.0001 par value per share.
Preferred Stock
Our board of directors is authorized, subject to limitations prescribed by Delaware law, to issue preferred stock in one or more series, to establish from time to time the number of shares to be included in each series, and to fix the designation, powers, preferences, and rights of the shares of each series and any of its qualifications, limitations, or restrictions, in each case without further vote or action by our stockholders. As of December 31, 2017, no shares of preferred stock were outstanding.
97
Table of Contents
Repurchase of Common Stock
In connection with the Series C convertible preferred stock financing in September 2015, we conducted a tender offer to repurchase $35.0 million outstanding shares of our common stock at a price per share of $11.887 from our employees and existing stockholders. At the close of the transaction, 2.9 million shares of common stock were tendered for an aggregate price of approximately $35.0 million.
13. Equity Awards
Amended and Restated 2013 Stock Plan
We granted options and RSUs under our Amended and Restated 2013 Stock Plan, or 2013 Plan, until March 22, 2017, when the plan was terminated in connection with our IPO. Accordingly, no shares are available for future issuance under the 2013 Plan following the IPO. The 2013 Plan continues to govern outstanding equity awards granted thereunder.
2017 Equity Incentive Plan
In February 2017, our board of directors adopted and our stockholders approved the 2017 Equity Incentive Plan, or 2017 Plan. The 2017 Plan became effective on March 22, 2017 and is the successor plan to the 2013 Plan. Under the 2017 Plan, we initially reserved (i) 5.1 million shares of Class A common stock for future issuance and (ii) 0.5 million shares of Class A common stock equal to the number of Class B shares reserved but not issued under the 2013 Plan as of the effective date of the 2017 Plan. The number of shares of Class A common stock reserved for issuance under our 2017 Plan will increase automatically on the first day of January of each of 2018 through 2027 by the lesser of (a) 5% of the total outstanding shares of our Class A and Class B common stock as of the immediately preceding December 31 and (b) the number of shares determined by our board of directors. The share reserve may also increase to the extent that outstanding awards under our 2013 Plan expire or terminate. As of December 31, 2017, an aggregate of 5.3 million shares of Class A common stock were reserved for issuance under the 2017 Plan.
2017 Employee Stock Purchase Plan
In February 2017, our board of directors adopted and our stockholders approved the 2017 Employee Stock Purchase Plan, or 2017 ESPP. The 2017 ESPP became effective on March 23, 2017. Under the 2017 ESPP, we reserved 1.1 million shares of Class A common stock for future issuance. The number of shares of Class A common stock reserved for issuance under our 2017 ESPP will increase automatically on the first day of January of each of 2018 through 2027 by the lesser of (a) 1% of the total outstanding shares of our Class A and Class B common stock as of the immediately preceding December 31 and (b) the number of shares determined by our board of directors. The aggregate number of shares issued over the term of the 2017 ESPP may not exceed 11,000,000 shares of Class A common stock.
Under the 2017 ESPP, eligible employees are allowed to purchase shares of our Class A common stock at a discount through payroll deductions of up to 15% of their eligible compensation, subject to plan limitations. Except for the first offering period, which began on the date our Registration Statement on Form S-1 covering the initial public offering of our shares of Class A common stock was declared effective by the SEC, purchase periods are approximately six months in duration starting on the first trading date on or after February 15th and August 15th of each year. Participants are able to purchase shares of our Class A common stock at 85% of the lower of its fair market value on (i) the first day of the purchase period or on (ii) the purchase date, which is the last day of the purchase period.
In 2017, employees purchased 0.1 million shares of Class A common stock at a price per share of $11.90. As of December 31, 2017, 1.0 million shares of Class A common stock were available for future issuance under the 2017 ESPP.
98
Table of Contents
Stock Options
Stock options generally vest over four years and expire ten years from the date of grant. Vested stock options generally expire three months after termination of employment. We allow for early exercise of certain stock option grants.
Stock option activity, excluding activity related to the ESPP, during the year ended December 31, 2017 consisted of the following (in thousands, except weighted-average information):
| Number of Options |
Weighted- Average Exercise Price |
Aggregate Intrinsic Value |
Weighted- Average Remaining Contractual Term (Years) |
|||||||||||||
| Options outstanding at December 31, 2016 |
6,318 | $ | 5.65 | $ | 51,752 | 8.1 | ||||||||||
| Granted |
1,056 | 17.48 | ||||||||||||||
| Exercised |
(1,549 | ) | 2.12 | $ | 25,724 | |||||||||||
| Cancelled/forfeited |
(629 | ) | 8.98 | |||||||||||||
|
|
|
|||||||||||||||
| Options outstanding at December 31, 2017 |
5,196 | $ | 8.70 | $ | 86,108 | 7.8 | ||||||||||
|
|
|
|||||||||||||||
| Exercisable |
3,163 | $ | 5.39 | $ | 62,900 | 7.1 | ||||||||||
| Vested and expected to vest |
5,016 | $ | 8.50 | $ | 84,121 | 7.7 | ||||||||||
The total intrinsic value of options exercised in the years ended December 31, 2017, 2016, and 2015 was $25.7 million, $4.1 million, and $6.8 million, respectively. The intrinsic value represents the excess of the fair market value of our common stock on the date of exercise over the exercise price of each option.
As of December 31, 2017, there was $11.4 million of unrecognized compensation cost related to unvested stock options, which is expected to be recognized over a weighted-average period of 2.8 years.
Valuation Assumptions
The following table presents the weighted-average assumptions used for stock options granted for each of the years indicated:
| Stock Options | Employee Stock Purchase Plan | |||||||||||||||||||||||
| 2017 | 2016 | 2015 | 2017 | 2016 | 2015 | |||||||||||||||||||
| Expected term (in years) |
6.1 | 6.0 | 6.0 | 0.4 | — | — | ||||||||||||||||||
| Estimated volatility |
42 | % | 41 | % | 56 | % | 29 | % | — | — | ||||||||||||||
| Risk-free interest rate |
2 | % | 2 | % | 2 | % | 1 | % | — | — | ||||||||||||||
| Estimated dividend yield |
— | — | — | — | — | — | ||||||||||||||||||
| Weighed average fair value |
$ | 7.53 | $ | 4.47 | $ | 4.23 | $ | 4.02 | — | — | ||||||||||||||
99
Table of Contents
Restricted Stock Units
RSUs granted under the 2017 Plan generally vest over four years and expire ten years from date of grant. RSUs will be forfeited in case of a termination of employment or service before the satisfaction of the vesting schedule. RSU activity during the year ended December 31, 2017 consisted of the following (in thousands, except weighted-average information):
| Awards Outstanding |
Weighted- Average Grant Date Fair Value |
Aggregate Intrinsic Value |
||||||||||
| RSUs outstanding at December 31, 2016 |
373 | $ | 12.30 | |||||||||
| Granted |
261 | 20.43 | ||||||||||
| Vested |
(71 | ) | 12.31 | $ | 1,769 | |||||||
| Forfeited |
(99 | ) | 12.66 | |||||||||
|
|
|
|||||||||||
| RSUs outstanding at December 31, 2017 |
464 | $ | 16.81 | $ | 11,731 | |||||||
|
|
|
|||||||||||
RSUs outstanding as of December 31, 2016, or pre-2017 RSUs, vest upon the satisfaction of both a service condition and a liquidity condition. The service condition for these awards will be satisfied over four years. The liquidity condition was satisfied on September 25, 2017, which was 180 days following the closing of the IPO. Beginning on the closing of the IPO in March 2017, we recognized a cumulative stock-based compensation expense for the portion of the pre-2017 RSUs that had met the service condition. In the year ended December 31, 2017, stock-based compensation expense related to our pre-2017 RSUs was $1.8 million.
As of December 31, 2017, total unrecognized compensation expense, adjusted for estimated forfeitures, related to unvested RSUs was approximately $4.7 million, which is expected to be recognized over a weighted-average period of 2.7 years.
We classified stock-based compensation expense in the accompanying consolidated statements of operations and comprehensive loss as follows (in thousands):
| Year Ended December 31, | ||||||||||||
| 2017 | 2016 | 2015 | ||||||||||
| Cost of revenue |
$ | 485 | $ | 106 | $ | 34 | ||||||
| Research and development |
1,635 | 338 | 239 | |||||||||
| Sales and marketing |
2,302 | 1,281 | 800 | |||||||||
| General and administrative |
4,519 | 1,559 | 409 | |||||||||
|
|
|
|
|
|
|
|||||||
| Total |
$ | 8,941 | $ | 3,284 | $ | 1,482 | ||||||
|
|
|
|
|
|
|
|||||||
14. Retirement Plan
We established a savings plan that qualifies as a defined contribution plan under Section 401(k) of the Internal Revenue Code of 1986, as amended, or the Code, for the benefit of our employees. Our contributions to the savings plan are discretionary and vest immediately. We contributed approximately $1.6 million, $1.1 million, and $0.6 million to the savings plan for the years ended December 31, 2017, 2016, and 2015, respectively.
15. Commitments and Contingencies
Leases
We have various non-cancelable operating leases for our offices. These leases expire at various times through 2025. Certain lease agreements contain renewal options, rent abatement, and escalation clauses. We recognize rent expense on a straight-line basis over the lease term, commencing when we take possession of the property. Total rent expense under operating leases was approximately $4.1 million, $2.7 million, and $1.3 million for the years ended December 31, 2017, 2016, and 2015, respectively.
100
Table of Contents
The aggregate undiscounted future minimum rental payments under our leases as of December 31, 2017 were as follows (in thousands):
| Year Ending December 31, |
Amounts | |||
| 2018 |
$ | 5,645 | ||
| 2019 |
6,458 | |||
| 2020 |
6,570 | |||
| 2021 |
6,304 | |||
| 2022 |
6,217 | |||
| Thereafter |
13,702 | |||
|
|
|
|||
| Total minimum lease payments |
$ | 44,896 | ||
|
|
|
|||
Indemnification
In the ordinary course of business, we enter into agreements in which we may agree to indemnify other parties with respect to certain matters, including losses resulting from claims of intellectual property infringement, damages to property or persons, business losses, or other liabilities. In addition, we have entered into indemnification agreements with our directors, executive officers, and certain other employees that will require us to indemnify them against liabilities that may arise by reason of their status or service as directors, officers, or employees. The term of these indemnification agreements with our directors, executive officers, and other employees, are generally perpetual after execution of the agreement. The maximum potential amount of future payments we could be required to make under these indemnification provisions is unlimited; however, we maintain insurance that reduces our exposure and enables us to recover a portion of any future amounts paid. As of December 31, 2017 and December 31, 2016, we have not accrued a liability for these indemnification provisions because the likelihood of incurring a payment obligation, if any, in connection with these arrangements is not probable or reasonably estimable.
Litigation
From time to time, we may be involved in lawsuits, claims, investigations, and proceedings, consisting of intellectual property, commercial, employment, and other matters, which arise in the ordinary course of business. Other than the matters described below, we are not currently party to any material legal proceedings or claims, nor are we aware of any pending or threatened litigation or claims that could have a material adverse effect on our business, operating results, cash flows, or financial condition should such litigation or claim be resolved unfavorably.
On December 19, 2017, we disclosed that individuals with an Amazon Web Services, or AWS, login could have had access to a third-party marketing dataset that provided consumer marketing information intended to help marketing professionals advertise and sell their products, or the AWS Matter. This dataset is commercially available and provides some location information, contact information and other estimated information that is used for marketing purposes. It does not include names, credit card numbers, social security numbers, bank account information or passwords.
To date, four putative consumer class action lawsuits have been filed against us in U.S. federal courts relating to the AWS Matter: (1) Kacur v. Alteryx, Inc., Case No. 8:17-cv-2222 (CD Cal) (asserting claims for putative national class and Ohio subclass); (2) Jackson v. Alteryx, Inc., Case No. 3:17-cv-02021 (D. Or.) (asserting claims for putative Oregon class); (3) Foskaris v. Alteryx, Inc., Case No. 2:17-cv-03088 (D. Nev.) (asserting claims for putative national class and Nevada subclass); and (4) Ruderman et al. v. Alteryx, Inc., Case No. 8:18-cv-00022 (C.D. Cal.) (asserting claims for putative national class and Florida, New Jersey, and New York subclasses). Three actions were filed on December 20, 2017 (Kacur, Jackson, Foskaris), and the fourth was
101
Table of Contents
filed on January 8, 2018 (Ruderman). The plaintiffs in these cases, who purport to represent various classes of individuals whose information was contained within the dataset, claim to have been harmed or to be facing harm as a result of the exposure of their personal information. The complaints assert claims for violation of the Fair Credit Reporting Act, 15 U.S.C. §§ 1681 et seq. and state consumer-protection statutes, as well as claims for common-law negligence. Additional actions alleging similar claims could be brought in the future. These proceedings all remain in the early stages. We intend to vigorously defend against these claims. Because of the early stages of these matters, we are unable to estimate a reasonably possible range of loss, if any, that may result for these matters.
Warranty
We warrant to customers that our platform will operate substantially in accordance with its specifications. Historically, no significant costs have been incurred related to product warranties and none are expected in the future and, as such, no accruals for product warranty costs have been made.
16. Income Taxes
The components of income (loss) before provision for (benefit of) income taxes were as follows (in thousands):
| Year Ended December 31, | ||||||||||||
| 2017 | 2016 | 2015 | ||||||||||
| Domestic |
$ | 24,460 | $ | (24,741 | ) | $ | (21,605 | ) | ||||
| Foreign |
(42,864 | ) | 691 | 333 | ||||||||
|
|
|
|
|
|
|
|||||||
| Total |
$ | (18,404 | ) | $ | (24,050 | ) | $ | (21,272 | ) | |||
|
|
|
|
|
|
|
|||||||
The components of the provision for (benefit of) income taxes were as follows (in thousands):
| Year Ended December 31, | ||||||||||||
| 2017 | 2016 | 2015 | ||||||||||
| Current: |
||||||||||||
| Federal |
$ | 38 | $ | — | $ | — | ||||||
| State |
70 | 6 | 1 | |||||||||
| Foreign |
297 | 229 | 189 | |||||||||
|
|
|
|
|
|
|
|||||||
| Total current income tax expense |
405 | 235 | 190 | |||||||||
| Deferred: |
||||||||||||
| Federal |
$ | (1,564 | ) | $ | — | $ | — | |||||
| State |
— | — | — | |||||||||
| Foreign |
254 | (27 | ) | (12 | ) | |||||||
|
|
|
|
|
|
|
|||||||
| Total deferred income tax benefit |
(1,310 | ) | (27 | ) | (12 | ) | ||||||
|
|
|
|
|
|
|
|||||||
| Total |
$ | (905 | ) | $ | 208 | $ | 178 | |||||
|
|
|
|
|
|
|
|||||||
102
Table of Contents
For purposes of reconciling our provision for (benefit of) income taxes at the statutory rate and our provision for (benefit of) income taxes at the effective tax rate, a notional 34% tax rate was applied as follows (in thousands):
| Year Ended December 31, | ||||||||||||
| 2017 | 2016 | 2015 | ||||||||||
| Income tax at federal statutory rate |
$ | (6,257 | ) | $ | (8,177 | ) | $ | (7,225 | ) | |||
| Increase/(decrease) in tax resulting from: |
||||||||||||
| State income tax expense, net of federal |
1,428 | (716 | ) | (589 | ) | |||||||
| Foreign rate differential |
15,375 | (88 | ) | (46 | ) | |||||||
| Stock-based compensation |
(1,086 | ) | 602 | 346 | ||||||||
| Change in valuation allowance |
(20,500 | ) | 8,449 | 7,549 | ||||||||
| Tax impact due to tax law change |
2,627 | — | — | |||||||||
| Change in uncertain tax position reserves |
7,854 | — | — | |||||||||
| Current year research credits |
(965 | ) | — | — | ||||||||
| Prior years research credits |
(1,284 | ) | — | — | ||||||||
| Other |
1,903 | 138 | 143 | |||||||||
|
|
|
|
|
|
|
|||||||
| Total |
$ | (905 | ) | $ | 208 | $ | 178 | |||||
|
|
|
|
|
|
|
|||||||
Significant components of deferred income tax assets (liabilities) were as follows (in thousands):
| As of December 31, | ||||||||
| 2017 | 2016 | |||||||
| Deferred revenue |
$ | 764 | $ | 812 | ||||
| Net operating losses |
5,655 | 28,736 | ||||||
| Accruals and reserves |
1,022 | 75 | ||||||
| State taxes |
(212 | ) | (1,131 | ) | ||||
| Deferred commissions |
(2,467 | ) | (1,837 | ) | ||||
| Stock-based compensation |
1,572 | 690 | ||||||
| Fixed assets & intangibles |
(1,327 | ) | — | |||||
| Research & other credits |
2,407 | — | ||||||
| Other |
289 | 499 | ||||||
| Valuation allowance |
(7,304 | ) | (27,804 | ) | ||||
|
|
|
|
|
|||||
| Net non-current deferred tax assets |
$ | 399 | $ | 40 | ||||
|
|
|
|
|
|||||
We have evaluated the available positive and negative evidence supporting the realization of our gross deferred tax assets, including our cumulative losses, and the amount and timing of future taxable income. Accordingly, we recorded a valuation allowance against our U.S. federal and state deferred tax assets to the extent that they are not expected to be recoverable as of December 31, 2017 and 2016.
The changes in the valuation allowance were as follows (in thousands):
| Year Ended December 31, | ||||||||||||
| 2017 | 2016 | 2015 | ||||||||||
| Beginning balance |
$ | 27,804 | $ | 19,355 | $ | 11,806 | ||||||
| Decrease in valuation allowance due to Yhat acquisition |
(998 | ) | — | — | ||||||||
| Increase (decrease) in valuation allowance |
(19,502 | ) | 8,449 | 7,549 | ||||||||
|
|
|
|
|
|
|
|||||||
| Ending balance |
$ | 7,304 | $ | 27,804 | $ | 19,355 | ||||||
|
|
|
|
|
|
|
|||||||
103
Table of Contents
As of December 31, 2017, we had U.S. federal and state income tax net operating loss carryforwards of approximately $55.4 million and $20.3 million, respectively. The U.S. federal and state net operating losses will begin to expire in 2034 and 2025, respectively, unless previously utilized.
As of December 31, 2017 and 2016, our pre-tax unrecognized excess tax benefits of $13.6 million and $11.0 million, respectively, relating to stock-based compensation expense, were not included in the deferred tax assets, and will create a benefit to additional paid-in capital when recognized. This amount will be included in the overall adoption of ASU 2016-09, as described in Note 2.
Under Sections 382 and 383 of the Internal Revenue Code, annual use of our net operating loss carryforwards and tax credits may be limited if a cumulative change in ownership of more than 50% occurs within a three-year period. We determined that such an ownership change occurred in 2015. This ownership change resulted in limitations of the annual utilization of our net operating loss carryforwards, but did not result in permanent disallowance of any of our net operating loss carryforwards.
On December 22, 2017, the Tax Cuts and Jobs Act of 2017, or the Tax Act became law. The legislation adopts significant changes to the Internal Revenue Code that include, among other things, reduction of the corporate income tax rate from 35% to 21%, effective for tax years beginning after December 31, 2017, the transition of U.S. international taxation from a worldwide tax system to a territorial system, and imposition of a one-time transition tax on cumulative foreign earnings at December 31, 2017. Based on our review of the Tax Act, and the applicable guidance available as of the date of this filing, we have estimated that the Tax Act will have minimal, if any, impact on our income tax provision and income tax accruals as of and for the year ended, December 31, 2017. The Tax Act requires us to measure our U.S. deferred tax assets and liabilities that will reverse after December 31, 2017 at the reduced US corporate income tax rate. As a result, we reduced our net US deferred tax asset and our valuation allowance by $2.6 million, which resulted in no net income tax expense for the year ended December 31, 2017. We have no cumulative foreign earnings at November 2, or December 31, 2017, and as a result, are not impacted by the one-time transition tax included in the Tax Act.
We have not accrued U.S. income taxes or foreign withholding taxes on the earnings of our foreign subsidiaries, as these amounts are intended to be indefinitely reinvested in operations outside the United States. As of December 31, 2017, there are no cumulative amounts of undistributed earnings at our foreign subsidiaries.
We are subject to taxation in the United States and various states and international jurisdictions. Our U.S. federal tax returns are open for examination for tax years 2014 and forward, and our state tax returns are open for examination for tax years 2013 and forward. Our tax returns for international jurisdictions are open for examination for tax years 2013 and forward. However, net operating loss and other tax attribute carryforwards utilized in subsequent years continue to be subject to examination by the tax authorities until the year to which the net operating loss and/or other tax attributes are carried forward is no longer subject to examination. Neither we nor any of our subsidiaries are currently under examination from tax authorities in the jurisdictions in which we do business.
For the year ended December 31, 2017 we recorded unrecognized tax benefits of approximately $5.8 million pertaining to transfer pricing. If fully recognized, the unrecognized tax benefits would not have an impact on our effective tax rate. We recorded no unrecognized tax benefits for each of the years ended December 31, 2016 and 2015. We had no accrual for interest or penalties related to uncertain tax positions in our consolidated balance sheets as of December 31, 2017 and 2016, and have not recognized interest or penalties in our consolidated statement of operations and comprehensive loss for the years ended December 31, 2017, 2016, and 2015.
104
Table of Contents
A rollforward of the activity in the gross unrecognized tax benefits is as follows:
| Year Ended December 31, 2017 |
||||
| Balance at beginning of year |
$ | — | ||
| Additions based on tax positions related to the current year |
5,624 | |||
| Additions for tax positions of prior years |
170 | |||
|
|
|
|||
| Balance at end of year |
$ | 5,794 | ||
|
|
|
|||
17. Basic and Diluted Net Loss Per Share
As we reported losses attributable to common stockholders for all periods presented, all potentially dilutive shares of common stock are antidilutive for those periods.
The following weighted-average equivalent shares of common stock were excluded from the diluted net loss per share calculation because their inclusion would have been anti-dilutive (in thousands):
| Year Ended December 31, | ||||||||||||
| 2017 | 2016 | 2015 | ||||||||||
| Options to purchase common stock |
5,897 | 5,516 | 5,045 | |||||||||
| Unvested restricted stock units |
415 | — | — | |||||||||
| Conversion of convertible preferred stock |
3,290 | 14,647 | 12,198 | |||||||||
| Contingently issuable shares |
7 | — | — | |||||||||
|
|
|
|
|
|
|
|||||||
| Total shares excluded from net loss per share |
9,609 | 20,163 | 17,243 | |||||||||
|
|
|
|
|
|
|
|||||||
18. Segment and Geographic Information
Operating segments are defined as components of an enterprise for which separate financial information is evaluated regularly by the chief operating decision maker, or CODM, who is our chief executive officer, in deciding how to allocate resources and assess our financial and operational performance. Our CODM evaluates our financial information and resources and assesses the performance of these resources on a consolidated and aggregated basis. As a result, we have determined that our business operates in a single operating segment.
Our operations outside the United States include sales offices in Canada, Czech Republic, France, Germany, Singapore, and the United Kingdom, and a research and development center in Ukraine. Revenue by location is determined by the billing address of the customer. The following sets forth our revenue by geographic region (in thousands):
| Year Ended December 31, | ||||||||||||
| 2017 | 2016 | 2015 | ||||||||||
| United States |
$ | 101,932 | $ | 69,420 | $ | 46,078 | ||||||
| International |
29,675 | 16,370 | 7,743 | |||||||||
|
|
|
|
|
|
|
|||||||
| Total |
$ | 131,607 | $ | 85,790 | $ | 53,821 | ||||||
|
|
|
|
|
|
|
|||||||
No countries outside the United States comprised more than 10% of revenue for any of the periods presented.
As of December 31, 2017 and 2016, substantially all of our property and equipment was located in the United States
105
Table of Contents
19. Selected Quarterly Financial Data (Unaudited)
The following table sets forth unaudited quarterly financial information for the years ended December 31, 2017 and 2016. We have prepared the unaudited quarterly consolidated statements of operations data on a basis consistent with the audited annual consolidated financial statements. In the opinion of management, the financial information in this table reflects all adjustments, consisting of normal and recurring adjustments, necessary for the fair statement of this data (in thousands except per share data):
| 2017 | ||||||||||||||||
| Quarter Ended | ||||||||||||||||
| March 31 | June 30 | September 30 | December 31 | |||||||||||||
| Revenue |
$ | 28,545 | $ | 30,319 | $ | 34,155 | $ | 38,588 | ||||||||
| Gross margin |
$ | 23,719 | $ | 25,025 | $ | 28,730 | $ | 32,330 | ||||||||
| Loss from operations |
$ | (5,614 | ) | $ | (8,138 | ) | $ | (2,563 | ) | $ | (1,884 | ) | ||||
| Net loss |
$ | (5,667 | ) | $ | (6,994 | ) | $ | (3,299 | ) | $ | (1,539 | ) | ||||
| Basic and diluted loss per share |
$ | (0.22 | ) | $ | (0.12 | ) | $ | (0.06 | ) | $ | (0.03 | ) | ||||
| 2016 | ||||||||||||||||
| Quarter Ended | ||||||||||||||||
| March 31 | June 30 | September 30 | December 31 | |||||||||||||
| Revenue |
$ | 18,394 | $ | 19,972 | $ | 22,462 | $ | 24,962 | ||||||||
| Gross margin |
$ | 14,495 | $ | 16,206 | $ | 18,400 | $ | 20,663 | ||||||||
| Loss from operations |
$ | (6,406 | ) | $ | (7,215 | ) | $ | (3,850 | ) | $ | (5,551 | ) | ||||
| Net loss |
$ | (6,533 | ) | $ | (7,456 | ) | $ | (4,192 | ) | $ | (6,077 | ) | ||||
| Basic and diluted loss per share |
$ | (0.24 | ) | $ | (0.28 | ) | $ | (0.18 | ) | $ | (0.25 | ) | ||||
20. Subsequent Events
In February 2018, we acquired 100% of the outstanding equity of Alteryx ANZ Pty Limited in Sydney, Australia, our exclusive master distributor in Australia and New Zealand. The total purchase price for the acquisition was approximately $3.3 million in cash and up to $1.5 million in cash paid over two years contingent upon the achievement of specified milestones. Given the timing of the completion of the acquisition, we are currently in the process of valuing the assets acquired and liabilities assumed in the acquisition. As a result, we are unable to provide the amounts recognized as of the acquisition date for the major classes of assets acquired and liabilities assumed and other disclosures.
106
Table of Contents
| Item 9. | Changes in and Disagreements with Accountants on Accounting and Financial Reporting. |
None
| Item 9A. | Controls and Procedures. |
Evaluation of Disclosure Controls and Procedures
Our management, with the participation of our Chief Executive Officer and Chief Financial Officer, evaluated the effectiveness of our disclosure controls and procedures as defined in Rules 13a-15(e) and 15d-15(e) under the Securities Exchange Act of 1934, as amended, or the Exchange Act, as of December 31, 2017. Our disclosure controls and procedures are designed to ensure that information we are required to disclose in the reports we file or submit under the Exchange Act is accumulated and communicated to our management, including our Chief Executive Officer and Chief Financial Officer, as appropriate to allow timely decisions regarding required disclosures, and is recorded, processed, summarized, and reported within the time periods specified in the SEC’s rules and forms.
Because of the material weakness in our internal control over financial reporting, as discussed below, our Chief Executive Officer and Chief Financial Officer concluded that, as of December, 2017, our disclosure controls and procedures were not effective. In light of this fact, our management, including our Chief Executive Officer and Chief Financial Officer, has performed additional analyses, reconciliations, and other post-closing procedures and has concluded that, notwithstanding the material weakness in our internal control over financial reporting, the consolidated financial statements for the periods covered by and included in this Annual Report on Form 10-K fairly present, in all material respects, our financial position, results of operations and cash flows for the periods presented in conformity with U.S. GAAP.
Previously Reported Material Weakness
We previously identified a material weakness in our internal control over financial reporting related to the evaluation of the accounting impact of certain contractual terms in certain arrangements with licensed data providers, which resulted in the misstatement in the recording of prepaid and other assets and royalty costs that were recorded in cost of revenue in the first three fiscal quarters of 2016. This material weakness resulted in an immaterial revision of those quarterly balance sheet and results of operations data.
We commenced measures to remediate the identified material weakness. Those remediation measures are ongoing and include the implementation of additional control activities related to the identification and evaluation of the terms of royalty contracts that require consideration when assessing the accounting for the arrangement.
While we believe that these efforts will improve our internal control over financial reporting, the implementation of our remediation is ongoing and will require validation and testing of the design and operating effectiveness of internal controls over a sustained period of financial reporting cycles.
We believe we are making progress toward achieving the effectiveness of our internal controls and disclosure controls. The actions that we are taking are subject to ongoing senior management review, as well as audit committee oversight. We will not be able to conclude whether the steps we are taking will fully remediate the material weakness in our internal control over financial reporting until we have completed our remediation efforts and subsequent evaluation of their effectiveness. We may also conclude that additional measures may be required to remediate the material weakness in our internal control over financial reporting, which may necessitate additional implementation and evaluation time. We will continue to assess the effectiveness of our internal control over financial reporting and take steps to remediate the known material weakness expeditiously.
107
Table of Contents
Changes in Internal Control over Financial Reporting
We are taking actions to remediate the material weakness relating to our internal control over financial reporting, as described above. Except as otherwise described herein, there was no change in our internal control over financial reporting that occurred during the three months ended December 31, 2017 that has materially affected, or is reasonably likely to materially affect, our internal control over financial reporting.
Limitations on the Effectiveness of Disclosure Controls and Procedures
Our management, including our Chief Executive Officer and Chief Financial Officer, does not expect that our disclosure controls and procedures or internal control over financial reporting will prevent all errors and all fraud. A control system, no matter how well designed and implemented, can provide only reasonable, not absolute, assurance that the control system’s objectives will be met. Further, the design of a control system must reflect the fact that there are resource constraints and the benefits of controls must be considered relative to their costs. Because of the inherent limitations in all control systems, no evaluation of controls can provide absolute assurance that all control issues within a company are detected. The inherent limitations include the realities that judgments in decision-making can be faulty and that breakdowns can occur because of simple errors or mistakes. Controls can also be circumvented by the individual acts of some persons, by collusion of two or more people, or by management override of the controls. Because of the inherent limitations in a cost-effective control system, misstatements due to error or fraud may occur and may not be detected. Also, projections of any evaluation of effectiveness to future periods are subject to the risk that controls may become inadequate because of changes in conditions or that the degree of compliance with the policies or procedures may deteriorate.
Management’s Annual Report on Internal Control over Financial Reporting
This Annual Report does not include a report of management’s assessment regarding internal control over financial reporting or an attestation report of our independent registered public accounting firm as permitted in this transition period under the rules of the SEC for newly public companies.
None
108
Table of Contents
PART III
Item 10. Directors, Executive Officers, and Corporate Governance.
The information required by this item will be included in our Definitive Proxy Statement for the 2018 Annual Meeting of Stockholders to be filed with the SEC, within 120 days of the fiscal year ended December 31, 2017, and is incorporated herein by reference.
Item 11. Executive Compensation.
The information required by this item will be included in our Definitive Proxy Statement for the 2018 Annual Meeting of Stockholders to be filed with the SEC within 120 days of the fiscal year ended December 31, 2017, and is incorporated herein by reference.
Item 12. Security Ownership of Certain Beneficial Owners and Management and Related Stockholder Matters.
The information required by this item will be included in our Definitive Proxy Statement for the 2018 Annual Meeting of Stockholders to be filed with the SEC within 120 days of the fiscal year ended December 31, 2017, and is incorporated herein by reference.
Item 13. Certain Relationships and Related Transactions, and Director Independence.
The information required by this item will be included in our Definitive Proxy Statement for the 2018 Annual Meeting of Stockholders to be filed with the SEC within 120 days of the fiscal year ended December 31, 2017, and is incorporated herein by reference.
Item 14. Principal Accounting Fees and Services.
The information required by this item will be included in our Definitive Proxy Statement for the 2018 Annual Meeting of Stockholders to be filed with the SEC within 120 days of the fiscal year ended December 31, 2017, and is incorporated herein by reference.
109
Table of Contents
PART IV
Item 15. Exhibits and Financial Statement Schedules.
The following documents are filed as part of this Annual Report:
| 1. | Financial Statements |
Our consolidated financial statements are listed in the “Index to Consolidated Financial Statements” under Part II, Item 8, of this Annual Report.
| 2. | Financial Statement Schedules |
All financial statement schedules have been omitted because they are not required or are not applicable, or the required information is shown in our consolidated financial statements or the notes thereto.
| 3. | Exhibits |
110
Table of Contents
111
Table of Contents
| Exhibit Number |
Exhibit Title |
Incorporated by Reference | Filed Herewith |
|||||||||||||||||||
| Form | File No. | Exhibit | Filing Date | |||||||||||||||||||
| 101.LAB | XBRL Taxonomy Extension Labels Linkbase Document. |
X | ||||||||||||||||||||
| 101.PRE | XBRL Taxonomy Extension Presentation Linkbase Document. |
X | ||||||||||||||||||||
| * | Indicates a management contract or compensatory plan. |
| # | This certification is deemed not filed for purposes of section 18 of the Exchange Act, or otherwise subject to the liability of that section, nor shall it be deemed incorporated by reference into any filing under the Securities Act or the Exchange Act. |
112
Table of Contents
Pursuant to the requirements of Section 13 or 15(d) of the Securities Exchange Act of 1934, as amended, the registrant has duly caused this Annual Report on Form 10-K to be signed on its behalf by the undersigned thereunto duly authorized.
| Alteryx, Inc. | ||
| By: |
/s/ Dean A. Stoecker | |
| Dean A. Stoecker Chairman of the Board of Directors and Chief Executive Officer | ||
Date: March 7, 2018
113
Table of Contents
POWER OF ATTORNEY
KNOW ALL PERSONS BY THESE PRESENTS, that each person whose signature appears below hereby constitutes and appoints Dean A. Stoecker and Kevin Rubin, and each of them, as his or her true and lawful attorneys-in-fact, proxies, and agents, each with full power of substitution, for him or her in any and all capacities, to sign any and all amendments to this Annual Report on Form 10-K, and to file the same, with all exhibits thereto and other documents in connection therewith, with the Securities and Exchange Commission, granting unto said attorneys-in-fact, proxies, and agents full power and authority to do and perform each and every act and thing requisite and necessary to be done in connection therewith, as fully for all intents and purposes as he might or could do in person, hereby ratifying and confirming all that said attorneys-in-fact, proxies, and agents, or their or his or her substitute or substitutes, may lawfully do or cause to be done by virtue hereof.
Pursuant to the requirements of the Securities Exchange Act of 1934, this Annual Report on Form 10-K has been signed below by the following persons on behalf of the registrant and in the capacities and on the dates indicated.
| Name |
Title |
Date | ||
| /s/ Dean A. Stoecker Dean A. Stoecker |
Chairman of the Board of Directors and Chief Executive Officer (Principal Executive Officer) |
March 7, 2018 | ||
| /s/ Kevin Rubin Kevin Rubin |
Chief Financial Officer (Principal Financial and Accounting Officer) |
March 7, 2018 | ||
| /s/ Kimberly E. Alexy Kimberly E. Alexy |
Director | March 7, 2018 | ||
| /s/ John Bellizzi John Bellizzi |
Director | March 7, 2018 | ||
| /s/ Charles R. Cory Charles R. Cory |
Director | March 7, 2018 | ||
| /s/ Jayendra Das |
Director | March 7, 2018 | ||
| Jayendra Das | ||||
| /s/ Jeffrey L. Horing |
Director | March 7, 2018 | ||
| Jeffrey L. Horing | ||||
| /s/ Timothy I. Maudlin |
Director | March 7, 2018 | ||
| Timothy I. Maudlin | ||||
| /s/ Eileen M. Schloss |
Director | March 7, 2018 | ||
| Eileen M. Schloss | ||||
114