Attached files
| file | filename |
|---|---|
| EX-99.3 - EXHIBIT 99.3 - THOR INDUSTRIES INC | a51769831ex99_3.htm |
| EX-99.1 - EXHIBIT 99.1 - THOR INDUSTRIES INC | a51769831ex99_1.htm |
| 8-K - THOR INDUSTRIES, INC. 8-K - THOR INDUSTRIES INC | a51769831.htm |

Investor Presentationmarch 7, 2018 www.thorindustries.com

Forward Looking Statements This presentation includes certain statements that are “forward looking” statements within the meaning of the U.S. Private Securities Litigation Reform Act of 1995, Section 27A of the Securities Act of 1933, as amended, and Section 21E of the Securities Exchange Act of 1934, as amended. These forward looking statements are made based on management’s current expectations and beliefs regarding future and anticipated developments and their effects upon Thor, and inherently involve uncertainties and risks. These forward looking statements are not a guarantee of future performance. We cannot assure you that actual results will not differ from our expectations. Factors which could cause materially different results include, among others, raw material and commodity price fluctuations, raw material or chassis supply restrictions, the level of warranty claims incurred, legislative, regulatory and tax law and/or policy developments including their potential impact on our dealers and their retail customers, the costs of compliance with governmental regulation, legal and compliance issues including those that may arise in conjunction with recent transactions, lower consumer confidence and the level of discretionary consumer spending, interest rate fluctuations, the potential impact of interest rate fluctuations on the general economy and specifically on our dealers and consumers, restrictive lending practices, management changes, the success of new and existing products and services, consumer preferences, the pace of obtaining and producing at new production facilities, the pace of acquisitions and the successful closing and financial impact thereof, the potential loss of existing customers of acquisitions, the integration of new acquisitions, our ability to retain key management personnel of acquired companies, a shortage of necessary personnel for production, the loss or reduction of sales to key dealers, the availability of delivery personnel, asset impairment charges, cost structure changes, competition, the impact of potential losses under repurchase agreements, the potential impact of the strength of the U.S. dollar on international demand, general economic, market and political conditions, changes to investment and capital allocation strategies or other facets of our strategic plan, and other risks and uncertainties including those discussed more fully in ITEM 1A of our Annual Report on Form 10-K for the year ended July 31, 2017 and Part II, Item 1A of our quarterly report on Form 10-Q for the period ended January 31, 2018. We disclaim any obligation or undertaking to disseminate any updates or revisions to any forward looking statements contained in this presentation or to reflect any change in our expectations after the date of this presentation or any change in events, conditions or circumstances on which any statement is based, except as required by law. 2

Thor Operating Entities 3 Joint Venture

Table of Contents Overview and Current Industry Conditions 5Second Quarter 2018 Update 16 Appendix: Financial & Market Data 23 4
5 Overview and Current Industry Conditions

Thor – Strong Investment Appeal Solid growth company throughout its 37-year history – 27.9% compounded annual five-year EPS growth*Balance of organic growth and accretive acquisitionsMarket leader in a growing industry – Recreational Vehicle (RV) shipments grew 17.2% in calendar 2017 to a record level of 504,599 units, and a five-year CAGR of 12.0%**History of returning cash to shareholders via dividends and stock buybacks – more than $1 billion returned to shareholders over Thor’s historyStrong financial position – increased profitability and solid balance sheet 6 *** Based on Diluted EPS from continuing operations*** Source: RVIA, RV Shipments, YTD December 2017*** In addition to regular quarterly dividends, Thor paid special dividends of $1.50 in FY13 and $1.00 in FY14. The declaration of future dividends and the establishment of the per share amounts, record dates and payment dates for any such future dividends are subject to compliance with the credit facility and determination of the Board, and are dependent upon future earnings, cash flows and other factors. 5-year CAGR: 22.4% 5-year CAGR: 27.9% + 27.5% + 44.9%

Solid Economic Fundamentals Support Continued RV Industry Growth 7 Continued Favorable Macro Environment High consumer confidenceFavorable general employment and wage trendsContinued gains in household wealthLow interest rate environmentWide credit availability for both wholesale and retailStable fuel prices and wide availabilityFavorable demographicsFavorable macro environment supports strong industry performance: 12% CAGR in new RV unit shipmentssince 2012 * 34% Of RVs sold in 2016 were to first-time buyers – 8 in 10 of those new buyers were under age 65 ** ** Source: RVIA, RV Shipments, YTD December 2017** Source: RVIA, RV Industry Power Breakfast Presentation, May 2017

Consumer Trends Support Continued RV Industry Growth 8 The Opportunity: If an additional 1% of potential first-time buyers interested in new RVs enter the RV lifestyle, that represents the potential for an additional 166,000 units in an industry that recorded 504,599 units** in calendar 2017. ** Source: RVIA, RV Industry Power Breakfast Presentation, May 2017 ** Source: RVIA, RV Shipments, YTD December 2017 Consumers identified as “Active Family Adventurers,” “Adult Adventurers” or “Nature Lovers” =Most likely groups to own or rent an RV in the future * Potential first-time buyers were interested in NEW RVs * Potential first-time buyers have investigated purchase or visited an RV showroom or dealership * Potential RV Buyers

Trends Driving Growth: Demographics 9 +3.4 million new households have started camping since 2014 * Gen X and Millennials made up 72% of campers in 2016 *Younger campers looking for affordable recreation experiencesInterested in trying different accommodations, including RVs Latino, African American, Asian and other ethnicities represented 39% of new campers in 2016; 26% of all campers *RV camping viewed as an attractive way to spend time with families and friends More potential RV buyers ** Population: Drivers:+159% 2X since 1970 ** Source: KOA 2017 North American Camping Report ** Source: RVIA, RV Industry Power Breakfast Presentation, May 2017

Trends Driving Growth: Lifestyle 10 Recreational sports$887 billion spent on “outdoor recreation” in 2016*Trend toward getting more active and leading a healthier lifestyleGrowing use of RVs with youth sports leagues and tournaments CampingIn 2016, 37.1 million U.S. households camped at least once during the year, and 22% of them were RV campers**Opportunity to convert campers into RV campersIncreasing availability of technology in RVs makes them more attractive to younger consumers Wide variety of usesTailgating at spectator sports, from college and professional football to auto racing and youth sports, continues to growLifestyle events, such as equestrian events, pet and craft shows, are also growing demand for RVsFlexibility of using RVs makes them ideal for shorter vacations/weekend getaways ** Source: “The Outdoor Recreation Economy Report” Outdoor Industry Association, 2017 ** Source: KOA 2017 North American Camping Report

Trends Driving Growth: Affordability, Flexibility & Convenience 11 * Source: RVIA 2016 Industry Profile Benefits of RV TravelRV vacations offer greater savings over those taken using a personal car or airline, staying in a hotel or rental home, and eating in restaurants, regardless of duration, distance, or region of the country visited*Added bonus: RVs offer the opportunity for frequent and unplanned getaways to spend quality time outdoors with family and friends in favorite destinations The ability to go where you want, when you want, with few restrictions or limitations is precisely what attracts many to the RV marketRVs offer a comfortable bed, a kitchen, and a restroom Wide variety of RV price points and amenities creates affordable RV options for a wide range of budgets

Health of the RV Channel 12 Dealer Inventory Levels:Overall dealer inventory levels remain healthyTotal days in inventory at dealers are appropriate for current industry conditionsAverage age of RV inventory on dealer lots remains lowUsed inventory levels remain low, supporting trade-in values and demand for new RVsWholesale Financing:Credit broadly availableNormal credit line utilizationNew lenders have entered the market since the downturn endedLenders remain disciplined with curtailments motivating dealers to focus on turning inventoryRetail Financing:Credit broadly availableLenders remain disciplined on down payments and termsMinimal sub-prime exposure

Opportunities for Continued Growth – Product Innovations & Manufacturing 13 Growth Levers Continuous investments in new products, features and floorplansShort product development cycle enables us to introduce new models every year, reinforcing the consumer trade-in cycleOrganic growth through continued investment in new facilities, production lines and equipmentInvested $115 million during fiscal 2017 on property, plant and equipment; approximately $175 million investment expected in fiscal 2018Improvements in operating efficiencies to drive margin growthOngoing efforts to implement continuous process improvement, enhance scheduling and optimize production runs at all production plants

Opportunities for Continued Growth – Further Market Penetration 14 Growth Levers Expanded Thor marketing effortsMarketing to younger families and more diverse consumer segmentsGo Your Own Way™ Campaign launched September 2017Geographic expansion Recent new and expanded campuses added over the last two years Future planned campus expansions slated for Ohio and Idaho
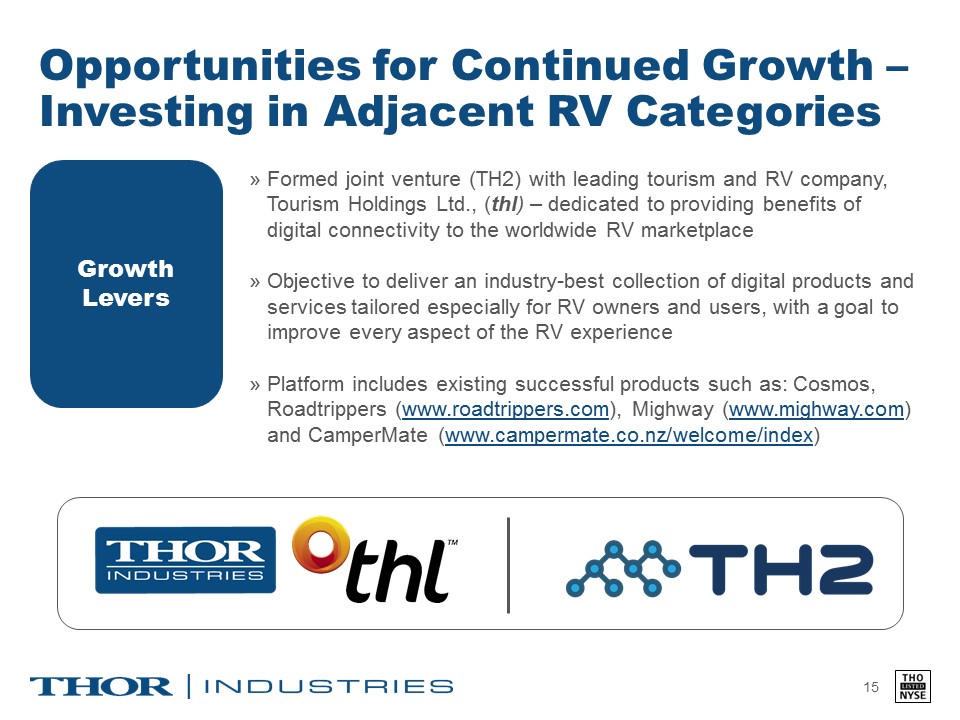
Opportunities for Continued Growth –Investing in Adjacent RV Categories 15 Growth Levers Formed joint venture (TH2) with leading tourism and RV company, Tourism Holdings Ltd., (thl) – dedicated to providing benefits of digital connectivity to the worldwide RV marketplace Objective to deliver an industry-best collection of digital products and services tailored especially for RV owners and users, with a goal to improve every aspect of the RV experiencePlatform includes existing successful products such as: Cosmos, Roadtrippers (www.roadtrippers.com), Mighway (www.mighway.com) and CamperMate (www.campermate.co.nz/welcome/index)

16 Second Quarter 2018 Update

Second Quarter Key Messages 17 Strategic Execution Robust Consumer Demand Outlook All-time record 2nd quarter revenues and profit Double-digit sales growth in both segments – Towables (+26.9%) and Motorized (+17.9%)Execution of our strategic planCapacity expansionsQ2 year-over-year margin enhancement2017 Market Share gains – Towables & Motorized (A’s and C’s) Consolidated RV backlog increased nearly 34% to $2.8 billion as of January 31, 2018, versus $2.1 billion as of January 31, 2017Demand driven by continued strong consumer preference for our more affordably-priced travel trailers and motorhomes with innovative and unique floorplans and features Tight labor market in Northern Indiana and some inflationary price increases in certain raw materials – tougher year-over-year comparatives in the second half of the fiscal 2018 yearContinued strength in the RV industry is supported by:Favorable demographic trends and an expanding RV buying baseHigh consumer confidence and positive macro economics We are confident fiscal 2018 will be another year of meaningful growth

Second Quarter 2018 Results Up Double Digits 18 All-time record 2nd quarter sales and net income Gross profit up, primarily attributable to the increase in sales, and also operating efficiencies attained in the past year, primarily by JaycoSecond quarter diluted EPS of $1.51, up 22.8%. As a result of the Tax Cuts and Jobs Act (the “Tax Act”) enacted in December 2017, the Company’s effective tax rate for the quarter was 43.5%, driven primarily by an income tax charge related to the revaluation of its net deferred tax assets, partially offset by the year-to-date benefit of the lower federal tax rate provided under the Tax Act New consumers continuing to embrace the benefits of RVing

Second Quarter 2018 – Towables 19 Towable Segment Continued mix shift toward more affordably-priced travel trailers and fifth wheelsMarket share continued to improve through December 2017, with U.S. Towable share increasing from 48.0% to 48.5%, while Canadian Towable share fell slightly from 55.4% to 55.1%*Demand remains strong -Towable backlog up 37.3% * Source: Statistical Surveys, Inc. YTD December 31, 2017 vs. YTD December 31, 2016

Second Quarter 2018 - Motorized 20 Motorized Segment Continued mix shift toward more moderately-priced Class C and gas Class A motorhomesMarket share momentum continued through December 2017, with U.S. Class A and C market share increasing from 37.8% to 41.2% and Canadian Class A and C market share increasing from 37.6% to 40.9%*Demand remains strong - Motorized backlog up 28.0% * Source: Statistical Surveys, Inc. YTD December 31, 2017 vs. YTD December 31, 2016 +17.9%
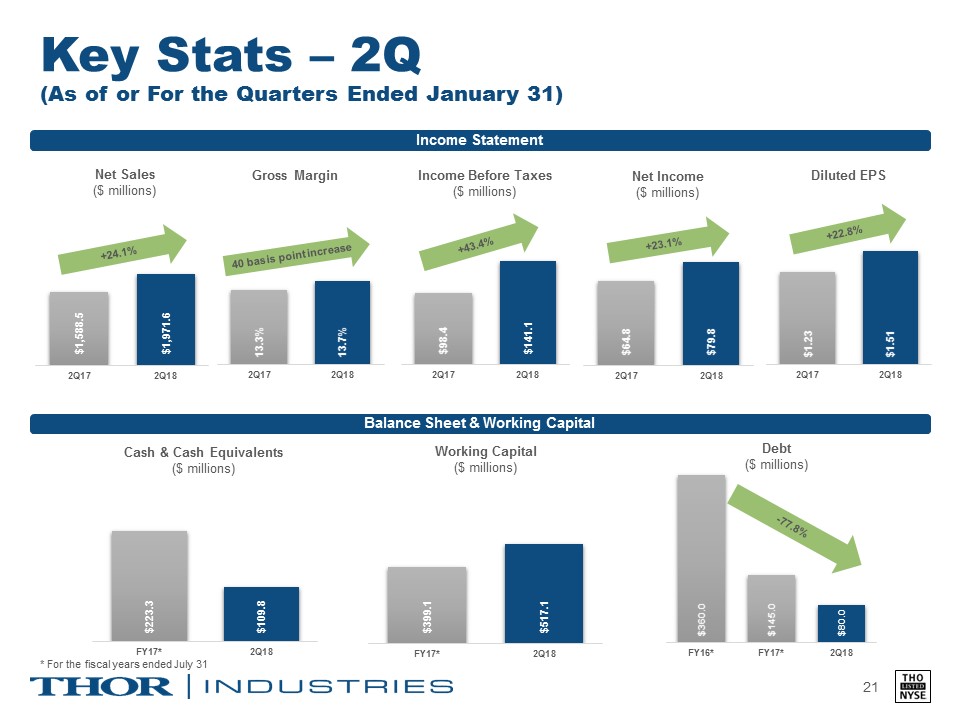
Key Stats – 2Q(As of or For the Quarters Ended January 31) 21 +24.1% Income Statement Balance Sheet & Working Capital 40 basis point increase * For the fiscal years ended July 31

Historical Key Stats (As of or For the Fiscal Years Ended July 31) 22 5-year CAGR: 22.4% Income Statement Balance Sheet & Cash Flow 5-year CAGR: 28.7%

Appendix: Financial & Market Data 23

Thor’s RV Product Range 24 Towable Segment Motorized Segment Class Bvan motorhomes;retail price $150,000 - $250,000 Class Cliving area built on van or pickup chassis;retail price $50,000 - $250,000 Class Afully enclosed, bus-style motorhome; retail price $70,000 - $700,000 Travel Trailershitch to the bumper of the tow vehicle;retail price <$10,000 - $150,000 Fifth Wheelshitch to a specially mounted hitch in the bed of a pickup truck;retail price $25,000 - $185,000 Specialty Trailersincludes camping trailers, truck campers and horse trailers with living quarters;retail price <$10,000 - $110,000 Note: Retail prices noted above are general ranges.

Seasonal Shipment Patterns 25 ** Source: Statistical Surveys, Inc., U.S. and Canada** Source: Recreation Vehicle Industry Association Dec-17

RV Wholesale Market Trends (Units 000s) 26 Historical Data: Recreation Vehicle Industry Association (RVIA)(e) Calendar year 2018 represents most recent RVIA estimate as of Winter RV Roadsigns, published in December 2017 5-year CAGR: 12.0%

RV Wholesale Market Towable Trends (Units 000s) 27 Historical Data: Recreation Vehicle Industry Association (RVIA)(e) Calendar year 2018 represents most recent RVIA estimate as of Winter RV Roadsigns, published in December 2017

RV Wholesale Market Motorized Trends (Units 000s) 28 Historical Data: Recreation Vehicle Industry Association (RVIA)(e) Calendar year 2018 represents most recent RVIA estimate as of Winter RV Roadsigns, published in December 2017
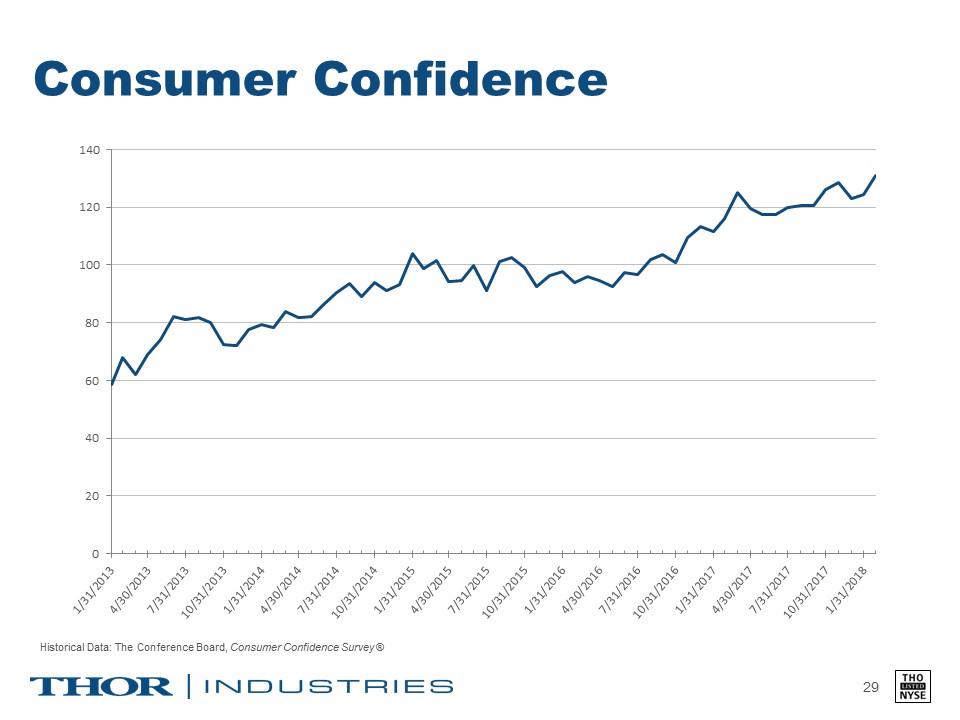
Consumer Confidence 29 Historical Data: The Conference Board, Consumer Confidence Survey ®

RV Industry Demand Industry retail demand has shifted toward lighter-weight, more affordably-priced towables and gas Class A and Class C motorhomes as consumers seek valueWholesale units typically outpace retail in the early part of the calendar year; historically sales become more balanced as we reach the peak retail selling season 30 2015 2016 2017 Industry Retail Registrations* 375,420 units (+14.2%) 416,054 units (+10.8%) 465,272 units (+11.8%) Industry Wholesale Shipments** 374,246 units (+4.9%) 430,691 units (+15.1%) 504,599 units (+17.2%) ** Statistical Surveys, Inc., includes US and Canada. 2015, 2016 & 2017 Full Year Actual** RVIA wholesale shipments for full years 2015, 2016 & 2017 Calendar Year

Thor Dealer Inventory Dealers optimistic about calendar 2018 demand, with inventories at appropriate levels to support the spring selling seasonDealers indicating their strategic preference to carry more inventory to satisfy demand on a timely basisLenders are comfortable with current dealer inventory turns and current credit line utilization; a slight reduction in average age of Thor units on dealers’ lots is reflective of a healthy dealer inventory 31 January 31, 2018 January 31, 2017 Unit Change % Change 155,650 124,000 31,650 25.5% Dealer Inventory (units)

RV Industry Retail Market Share 32 ** Source: Statistical Surveys, Inc., U.S. and Canada** Thor adjusted to include historical results of Jayco, Livin’ Lite, Bison Coach, K-Z, Inc., Cruiser RV, and DRV Luxury Suites for all periods presented ** Forest River includes Palomino, Coachmen, Prime Time, Shasta and Dynamax
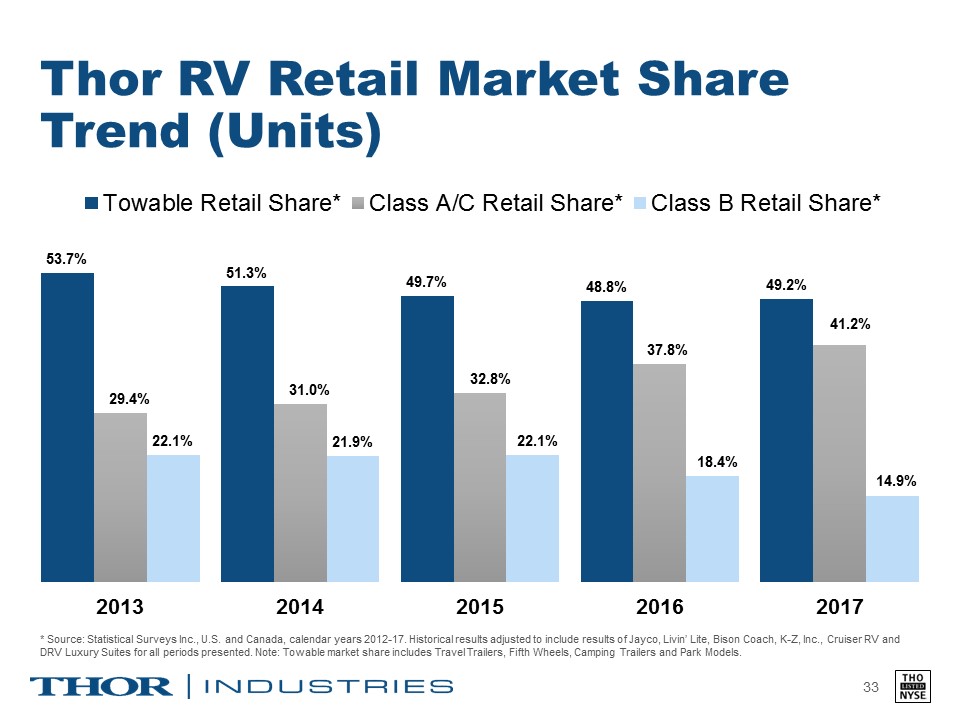
Thor RV Retail Market Share Trend (Units) 33 * Source: Statistical Surveys Inc., U.S. and Canada, calendar years 2012-17. Historical results adjusted to include results of Jayco, Livin’ Lite, Bison Coach, K-Z, Inc., Cruiser RV and DRV Luxury Suites for all periods presented. Note: Towable market share includes Travel Trailers, Fifth Wheels, Camping Trailers and Park Models.