Attached files
| file | filename |
|---|---|
| EX-32.1 - EX-32.1 - BlackRock Capital Investment Corp | bkcc-ex321_7.htm |
| EX-31.2 - EX-31.2 - BlackRock Capital Investment Corp | bkcc-ex312_6.htm |
| EX-31.1 - EX-31.1 - BlackRock Capital Investment Corp | bkcc-ex311_8.htm |
| EX-21.1 - EX-21.1 - BlackRock Capital Investment Corp | bkcc-ex211_9.htm |
| EX-10.1 - EX-10.1 - BlackRock Capital Investment Corp | bkcc-ex101_114.htm |
UNITED STATES
SECURITIES AND EXCHANGE COMMISSION
WASHINGTON, DC 20549
FORM 10-K
(Mark One)
|
☒ |
ANNUAL REPORT PURSUANT TO SECTION 13 OR 15(d) OF THE SECURITIES EXCHANGE ACT OF 1934. |
For the fiscal year ended December 31, 2017
OR
|
☐ |
TRANSITION REPORT PURSUANT TO SECTION 13 OR 15(d) OF THE SECURITIES EXCHANGE ACT OF 1934. |
For the transition period from to
Commission file number 814-00712
BlackRock Capital Investment Corporation
(Exact Name of Registrant as Specified in Its Charter)
|
Delaware |
|
20-2725151 |
|
(State or Other Jurisdiction of |
|
(I.R.S. Employer |
|
|
|
|
|
40 East 52nd Street, New York, New York |
|
10022 |
|
(Address of Principal Executive Offices) |
|
(Zip Code) |
Registrant’s Telephone Number, Including Area Code: 212-810-5800
SECURITIES REGISTERED PURSUANT TO SECTION 12(b) OF THE ACT:
|
Title of Each Class |
|
Name of Each Exchange on Which Registered |
|
Common Stock, par value |
|
The NASDAQ Global Select Market |
SECURITIES REGISTERED PURSUANT TO SECTION 12(g) OF THE ACT: None
Indicate by check mark if the Registrant is a well-known seasoned issuer, as defined in Rule 405 of the Securities Act. Yes ☐ No ☒
Indicate by check mark if the Registrant is not required to file reports pursuant to Section 13 or 15(d) of the Securities Exchange Act. Yes ☐ No ☒
Indicate by check mark whether the Registrant (1) has filed all reports required to be filed by Section 13 or 15(d) of the Securities Exchange Act of 1934 during the preceding 12 months (or for such shorter period that the Registrant was required to file such reports), and (2) has been subject to such filing requirements for the past 90 days. Yes ☒ No ☐
Indicate by check mark whether the registrant has submitted electronically and posted on its corporate Web site, if any, every Interactive Data File required to be submitted and posted pursuant to Rule 405 of Regulation S-T during the preceding 12 months (or for such shorter period that the registrant was required to submit and post such files). Yes ☐ No ☐
Indicate by check mark if disclosure of delinquent filers pursuant to Item 405 of Regulation S-K is not contained herein, and will not be contained, to the best of Registrant’s knowledge, in definitive proxy or information statements incorporated by reference in Part III of this Form 10-K or any amendment to this Form 10-K. ☒
Indicate by check mark whether the registrant is a large accelerated filer, an accelerated filer, a non-accelerated filer, smaller reporting company, or an emerging growth company.
|
Large Accelerated Filer |
☐ |
|
Accelerated Filer |
☒ |
|
Non-Accelerated Filer |
☐ |
|
Smaller reporting company |
☐ |
|
Emerging growth company |
☐ |
|
|
|
If an emerging growth company, indicate by check mark if the registrant has elected not to use the extended transition period for complying with any new or revised financial accounting standards provided pursuant to Section 13(a) of the Exchange Act. ☐
Indicate by check mark whether the Registrant is a shell company (as defined in Rule 12b-2 of the Securities Exchange Act of 1934). Yes ☐ No ☒
The aggregate market value of the Registrant’s common stock held by non-affiliates of the Registrant at June 30, 2017 (the last business day of the Registrant’s most recently completed second quarter) was $538,456,867 based upon the last sales price reported for such date on The NASDAQ Global Select Market. For purposes of this disclosure, shares of common stock beneficially owned by persons who own 5% or more of the outstanding shares of common stock and shares beneficially owned by executive officers and directors of the Registrant and members of their families have been excluded in that such persons may be deemed to be affiliates. This determination of affiliate status is not necessarily conclusive for other purposes. The Registrant has no non-voting common stock.
There were 73,059,322 shares of the Registrant’s common stock outstanding at March 7, 2018.
Documents Incorporated by Reference: Portions of the Registrant’s Proxy Statement relating to the Registrant’s 2018 Annual Meeting of Stockholders to be filed not later than 120 days after the end of the fiscal year covered by this Annual Report on Form 10-K are incorporated by reference into Part III of this Report.
BLACKROCK CAPITAL INVESTMENT CORPORATION
2017 FORM 10-K ANNUAL REPORT
TABLE OF CONTENTS
|
|
|
|
PAGE |
|
|
|
|
|
|
|
1 |
||
|
|
|
|
|
|
Item 1. |
|
1 |
|
|
|
|
|
|
|
Item 1A. |
|
16 |
|
|
|
|
|
|
|
Item 1B. |
|
43 |
|
|
|
|
|
|
|
Item 2. |
|
43 |
|
|
|
|
|
|
|
Item 3. |
|
43 |
|
|
|
|
|
|
|
Item 4. |
|
43 |
|
|
|
|
|
|
|
|
44 |
||
|
|
|
|
|
|
Item 5. |
|
44 |
|
|
|
|
|
|
|
Item 6. |
|
47 |
|
|
|
|
|
|
|
Item 7. |
Management’s Discussion and Analysis of Financial Condition and Results of Operations |
|
48 |
|
|
|
|
|
|
Item 7A. |
|
59 |
|
|
|
|
|
|
|
Item 8. |
|
59 |
|
|
|
|
|
|
|
Item 9. |
Changes in and Disagreements With Accountants on Accounting and Financial Disclosure |
|
59 |
|
|
|
|
|
|
Item 9A. |
|
59 |
|
|
|
|
|
|
|
Item 9B. |
|
60 |
|
|
|
|
|
|
|
|
62 |
||
|
|
|
|
|
|
Item 10. |
|
62 |
|
|
|
|
|
|
|
Item 11. |
|
62 |
|
|
|
|
|
|
|
Item 12. |
Security Ownership of Certain Beneficial Owners and Management and Related Stockholders Matters |
|
62 |
|
|
|
|
|
|
Item 13. |
Certain Relationships and Related Transactions, and Director Independence |
|
62 |
|
|
|
|
|
|
Item 14. |
|
62 |
|
|
|
|
|
|
|
|
63 |
||
|
|
|
|
|
|
Item 15. |
|
63 |
|
|
|
|
|
|
|
|
|
S-1 |
|
General
BlackRock Capital Investment Corporation (“BlackRock Capital,” the “Company” or the “Registrant,” which may also be referred to as “we,” “us” or “our”) provides middle-market companies with flexible financing solutions, including senior and junior secured, unsecured and subordinated debt securities and loans, and equity securities. Our strategy is to provide capital to meet our clients’ current and future needs across this spectrum, creating long-term partnerships with growing middle-market companies.
We were incorporated on April 13, 2005, commenced operations with private funding on July 25, 2005, and completed our initial public offering on July 2, 2007. We are an externally-managed, non-diversified closed-end management investment company. We have elected to be regulated as a business development company, or BDC, under the Investment Company Act of 1940, which we refer to as the 1940 Act. In addition, for tax purposes we intend to continue to qualify as a regulated investment company, or RIC, under the Internal Revenue Code of 1986, which we refer to as the Code. As a BDC, we are required to comply with certain regulatory requirements. See “Regulation” for discussion of BDC regulation and other regulatory considerations. We are also registered as an investment advisor under the Investment Advisers Act of 1940, which we refer to as the “Advisers Act.”
Our investment objective is to generate both current income and capital appreciation through our debt and equity investments. We invest primarily in middle-market companies and target investments throughout the capital structure that we believe provide an attractive risk-adjusted return. The term “middle-market” refers to companies with annual revenues typically between $50 million and $1 billion. Our targeted investment typically ranges between $10 million and $50 million, although the investment sizes may be more or less than the targeted range and the size of our investments may grow with our capital availability. We generally seek to invest in companies that operate in a broad variety of industries and that generate positive cash flow.
Although most of our investments are in senior and junior secured, unsecured and subordinated loans to U.S. private and certain public middle-market companies, we invest throughout the capital structure, which may include common and preferred equity, options and warrants, credit derivatives, high-yield bonds, distressed debt and other structured securities. We may from time to time invest up to 30% of our assets opportunistically in other types of investments, including securities of other public companies and foreign securities. In addition, part of our strategy involves a joint venture with Windward Investments LLC (“Windward”) through the BCIC Senior Loan Partners, LLC (“Senior Loan Partners”). The Senior Loan Partners’ principal purpose is to make investments primarily in senior secured loans to middle-market companies.
The senior and junior secured loans in which we invest generally have stated terms of three to ten years and the subordinated debt investments we make generally have stated terms of up to ten years, but the expected average life of such senior and junior secured loans and subordinated debt is generally between three and seven years. However, we may invest in securities of any maturity or duration. The debt that we invest in typically is not initially rated by any rating agency, but we believe that if such investments were rated, they would be below investment grade (rated lower than “Baa3” by Moody’s Investors Service, lower than “BBB-” by Fitch Ratings or lower than “BBB-” by Standard & Poor’s). We may invest without limit in debt of any rating, as well as debt that has not been rated by any nationally recognized statistical rating organization.
At a special meeting of the Company’s stockholders, held on February 18, 2015, the Company’s stockholders approved a new investment management agreement between the Company and BlackRock Advisors, LLC (“BlackRock Advisors”) to permit BlackRock Advisors to serve as the Company’s investment adviser (the “BlackRock Advisors Management Agreement”) following the completion of the sale of certain assets related to managing the Company from the Company’s previous investment adviser, 52nd Street Capital Advisors LLC, formerly BlackRock Kelso Capital Advisors LLC (the “Previous Advisor,” “BKCA” or “52nd Street”), to BlackRock Advisors (the “Transaction”). BlackRock Advisors is a wholly owned indirect subsidiary of BlackRock, Inc. (together with certain of its affiliates, collectively “BlackRock”). The Transaction was completed on March 6, 2015 and, pursuant to the BlackRock Advisors Management Agreement, dated as of March 6, 2015, BlackRock Advisors began managing the Company’s investment activities. Prior to the consummation of the Transaction, the Company had entered into an investment management agreement with 52nd Street Capital Advisors LLC, the Company’s previous adviser, which is referred to as the “previous management agreement.” The BlackRock Advisors Management Agreement had the same management and incentive fee terms as the previous agreement until March 6, 2017 and thereafter had different management and incentive fees terms as compared to the previous management agreement. On January 16, 2018, BlackRock Advisors assigned the BlackRock Advisors Management Agreement, dated March 6, 2015, to a wholly owned subsidiary, BlackRock Capital Investment Advisors, LLC ("BCIA" or the “Advisor”) pursuant to Rule 2a-6 of the 1940 Act and the Company entered into a new investment management agreement with BCIA (the “Current Management Agreement” or the “Management Agreement”). Accordingly, BCIA is now our investment adviser. The Current Management Agreement has the same management and incentive fee terms as compared to the agreement previously entered into with BlackRock Advisors.
1
Organization of the Advisor and Previous Advisor
BlackRock Advisors and BCIA are Delaware limited liability companies registered with the Securities and Exchange Commission (“SEC”) as investment advisors under the Advisers Act. The Advisor and BlackRock Advisors collectively manage or have committed to manage approximately $507.1 billion of assets as of December 31, 2017. BlackRock has substantial investment and portfolio management experience, which we believe will be beneficial to the Company and our stockholders. As part of the BlackRock platform, we will continue to seek to enhance the risk-return profile of the Company, strengthen its distribution paying capacity and optimize the valuation for our shareholders.
Our investment activities are carried out by the Advisor, which is led by Michael J. Zugay, Chief Executive Officer of the Company and Chairman of the BlackRock US Private Capital Group’s Investment Committee (the “Investment Committee”). On October 18, 2017, Michael Pungello was appointed by the Company’s Board of Directors as the Interim Chief Financial Officer and Interim Treasurer effective October 20, 2017, after Donna Milia, former Chief Financial Officer and Treasurer, notified the Company that she was leaving the Company for personal reasons. Ms. Milia remained with BlackRock Advisors through December 29, 2017 to provide transition assistance with respect to the Company.
Previously, our investment activities were led by Steven F. Sterling, former CEO and Chairman of the Board and Head of BlackRock US Private Capital Group effective March 6, 2015 through December 31, 2016, and Michael J. Zugay, prior Head of Investments for BlackRock US Private Capital Group through December 31, 2016, with guidance from the Investment Committee.
Prior to the Transaction, our investment activities were managed by 52nd Street Capital Advisors LLC, the Previous Advisor. The Previous Advisor is organized as a Delaware limited liability company and was registered as an investment advisor with the SEC under the Advisers Act. Its principal executive offices are located at 40 East 52nd Street, New York, New York. The Previous Advisor was responsible for sourcing potential investments, conducting research on prospective investments, analyzing investment opportunities, structuring our investments, and monitoring our investments and portfolio companies on an ongoing basis. James R. Maher, former Chairman and Chief Executive Officer of the Company, and Michael B. Lazar, former Chief Operating Officer of the Company, were the control persons of the Previous Advisor. Effective March 6, 2015, James R. Maher and Michael B. Lazar stepped down from their roles with the Company. Certain investment professionals of 52nd Street became employees of BlackRock upon the closing of the Transaction.
Market opportunity
We believe that current market conditions present opportunities for investment in middle-market companies with attractive risk-adjusted returns for several reasons, including:
Middle-market companies have faced increasing difficulty in accessing the capital markets. While many middle-market companies were able to raise funds by raising debt in the capital markets in the past, we believe this approach to financing has become more difficult, as transactions have increased in size to address investors’ demands for greater liquidity in securities such as high yield bonds. In addition, we believe that many senior lenders have, in recent years, de-emphasized their service and product offerings to middle-market businesses in favor of lending to large corporate clients and managing large, liquid capital markets transactions.
There is a large pool of uninvested private equity capital likely to seek additional capital to support private investments. We believe there is a large pool of uninvested private equity capital available to middle-market companies. We expect that private equity firms will be active investors in middle-market companies and that these private equity firms will seek to supplement their equity investments with senior secured and junior loans and equity co-investments from other sources, such as us.
Middle-market companies are increasingly seeking private sources for debt and equity capital. We believe that many middle-market companies prefer to execute transactions with private capital providers such as us, rather than execute high-yield bond or equity transactions in the public markets, which may necessitate increased financial and regulatory compliance and reporting obligations.
Consolidation among commercial banks has reduced the focus on middle-market business. We believe that many senior lenders have de-emphasized their service and product offerings to middle-market companies in favor of lending to large corporate clients, managing capital markets transactions and providing other non-credit services to their customers.
Competitive advantages
We believe we possess the following competitive advantages over other capital providers to middle-market companies:
The BlackRock Platform: Our investment activities are carried out by the Advisor, a wholly owned indirect subsidiary of BlackRock. BlackRock is a leading publicly traded investment management firm with $6.3 trillion of assets under management
2
(“AUM”) at December 31, 2017. With employees in more than 30 countries, BlackRock provides a broad range of investment and risk management services to institutional and retail clients worldwide. We believe our affiliation with BlackRock provides us with access to one of the deepest, broadest investment platforms in the financial services industry, with strategies across asset classes and investment styles all backed by our industry leading technology and risk management. BlackRock’s platform provides our investment professionals with market, company and industry insights that enhances our investment and due diligence processes.
Demonstrated ability to deploy capital consistent with our investment policies. Since our inception, we have invested in excess of $4.5 billion across 184 portfolio companies through December 31, 2017. We have a debt and income producing equity yield at fair value of approximately 10.8% at December 31, 2017. During 2017, we invested approximately $243.4 million of gross assets.
Proven transaction sourcing strategy. Since the inception of operations, we have sourced and reviewed more than 4,000 potential investments and have a proven process through which we have invested in excess of $4.5 billion through December 31, 2017. The Advisor identifies potential investments through its dynamic transaction origination efforts. The origination efforts include calling on financial institutions such as investment banks, commercial banks, specialty finance companies and private equity firms; as well as on advisory firms, trade associations and the owners and managers of middle-market companies with whom the investment professionals and investment committee members have relationships. We expect that our ability to leverage these relationships will continue to result in the referral of investment opportunities to us and provide us with a competitive advantage.
Highly experienced investment team. Since January 2017, our investment activities have been carried out by our investment advisors led by Michael J. Zugay, Chief Executive Officer of the Company and Chairman of the Investment Committee, and Jason A. Mehring, Vice Chairman of the Investment Committee. The Investment Committee is comprised of Messrs. Zugay and Mehring, and certain senior personnel of BlackRock. The investment professionals, as well as members of the Investment Committee, have extensive experience in fixed income, public equity and private equity investing, and possess a broad range of transaction, financial, managerial and investment skills.
Our executive officers and directors and the employees of BlackRock and certain of its affiliates, as well as members of the Investment Committee, serve or may serve as investment advisors, officers, directors or principals of entities or investment funds that operate in the same or a related line of business as we do and/or investment funds managed by our affiliates. We note that any affiliated investment vehicle currently formed or formed in the future and managed or to be managed in the future by the Advisor or its affiliates may have overlapping investment objectives with our own and, accordingly, may invest in asset classes similar to those targeted by us. As a result, the Advisor or its affiliates may face conflicts in allocating investment opportunities between us and such other entities. Accordingly, we may not be given the opportunity to participate in certain investments made by investment funds managed by the Advisor or its affiliates. However, the Advisor and its affiliates will endeavor to allocate investment opportunities in a fair and equitable manner and consistent with applicable allocation procedures. In any such case, if the Advisor forms other affiliates in the future, we may co-invest on a concurrent basis with such other affiliates, subject to compliance with applicable regulations and regulatory guidance, as well as applicable allocation procedures. In certain circumstances, negotiated co-investments may be made only if we receive an order from the SEC permitting us to do so.
Disciplined investment process with focus on preservation of capital. In making investment decisions, the Advisor employs a disciplined and selective review process that focuses on, among other things, a thorough analysis of the underlying issuer’s business and the performance drivers of that business, as well as an assessment of the legal and economic features of each particular investment.
Cost-effective and high quality infrastructure. We benefit from the existing infrastructure and administrative capabilities of BlackRock Financial Management, Inc. (the “Administrator”). For providing these services, facilities and personnel, we reimburse the Administrator for our allocable portion of overhead and other expenses incurred by the Administrator in performing its obligations under the administration agreement.
Operating and regulatory structure
Our investment activities are managed by the Advisor and supervised by our Board of Directors, a majority of whom are independent of us, the Advisor and our affiliates. The Advisor is registered as an investment adviser under the Advisers Act. Under our Management Agreement, we have agreed to pay the Advisor an annual base management fee (the “Management Fee”) based on our total assets, as well as an incentive management fee (the “Incentive Fee”) based on our performance. The Current Management Agreement also provides that we will reimburse the Advisor for costs and expenses incurred by the Advisor for office space rental, office equipment and utilities allocable to the Advisor under that agreement, as well as any costs and expenses incurred by the Advisor relating to any non-investment advisory, administrative or operating services provided by the Advisor to us. The BlackRock Advisors Management Agreement had the same Management and Incentive Fee terms as the previous agreement until March 6, 2017 and
3
thereafter had different Management and Incentive Fee terms as compared to the previous agreement. The Current Management Agreement has the same Management and Incentive Fee terms as compared to the BlackRock Advisors Management Agreement.
Also, while we may borrow funds to make investments, our ability to use debt is limited in certain significant respects. As a BDC and a regulated investment company (“RIC”) under the Internal Revenue Code of 1986 (the “Code”), for tax purposes, we are dependent on our ability to raise capital through the issuance of our common stock. RICs generally must distribute substantially all of their earnings to stockholders in order to achieve pass-through tax treatment, which prevents us from using those earnings to support operations, which may include new investments (including investments into existing portfolio companies). Further, BDCs must maintain an asset coverage ratio (the ratio of total assets less total liabilities other than indebtedness to total indebtedness) of not less than 200% in order to incur debt or issue senior securities, meaning generally that for every dollar of debt incurred or senior securities issued, we must have two dollars of assets. Our existing debt arrangements also require that we maintain an asset coverage ratio of not less than 200%, among other things.
Portfolio composition
We have built an investment portfolio that includes primarily senior and junior secured, senior and junior unsecured and subordinated loans to U.S. private middle-market companies. We invest a range of $10 million to $50 million of capital, on average, per transaction, although the investment sizes may be more or less and are expected to grow with our capital availability. Although most of our investments are in senior and junior secured, senior and junior unsecured and subordinated loans to U.S. private and certain public middle-market companies, we invest throughout the capital structure of these companies, which may include investing in common and preferred equity, options and warrants, credit derivatives, high-yield bonds, distressed debt and other structured securities. We generally seek to invest in companies that operate in a broad variety of industries and that generate positive cash flows. While our focus is to generate current income through these investments, we also seek capital appreciation.
We generally are not permitted to invest in any private company in which any of our affiliates holds an existing investment, except to the extent permitted by the 1940 Act. We may, however, co-invest on a concurrent basis with our affiliates, subject to compliance with applicable regulations and regulatory guidance, as well as applicable allocation procedures. We may invest, to the extent permitted by law, in the securities and instruments of other investment companies, including private funds.
Investment selection criteria
The Advisor chooses investments and constructs our portfolio based on the investment experience of its professionals and a detailed investment analysis for each investment opportunity. In analyzing each prospective portfolio company, the Advisor has identified several criteria it believes are important in identifying and investing in prospective portfolio companies. These criteria provide general guidelines for the Advisor’s investment decisions on our behalf, although each prospective portfolio company may fail to meet one or more of these criteria. Generally, the Advisor seeks to utilize its access to information generated by its investment professionals to identify prospective investments and to structure investments quickly and effectively. Furthermore, the Advisor seeks to identify those companies exhibiting superior fundamental risk-reward profiles and strong defensible business franchises while focusing on the relative value of the security in the company’s capital structure.
Value Orientation/Positive Cash Flow. The Advisor’s investment philosophy places a premium on fundamental analysis from an investor’s perspective and has a distinct value orientation. The Advisor focuses on companies in which it can invest at relatively low multiples of operating cash flow and that are profitable at the time of investment on an operating cash flow basis. Typically, the Advisor does not invest in start-up companies or companies having speculative business plans.
Experienced Management. The Advisor generally requires that portfolio companies have an experienced management team. The Advisor also generally requires portfolio companies to have in place proper incentives to induce management to succeed and to act in concert with our interests as investors, which may include having significant equity interests.
Strong Competitive Position in Industry. The Advisor seeks to invest in companies that have strong market positions within their respective markets or market niches and are well positioned to capitalize on growth opportunities. The Advisor seeks companies that demonstrate significant competitive advantages versus their competitors, which it believes should help to protect their market position and profitability.
Exit Strategy. The Advisor seeks to invest in companies that it believes will provide a steady stream of cash flow to repay loans and/or build equity value. With respect to loans and debt securities, the Advisor expects that such internally generated cash flow, leading to the payment of interest on, and the repayment of the principal of, our investments will be a key means by which we exit these investments over time. In addition, the Advisor seeks to invest in companies whose business models and expected future cash
4
flows offer attractive exit possibilities. These companies include candidates for strategic acquisition by other industry participants and companies that may repay our investments through an initial public offering of common stock or another capital market transaction. With respect to our equity investments, the Advisor will look to exit such investments via repurchases by the portfolio company, public offerings and sales pursuant to merger and acquisition transactions.
Liquidation Value of Assets. The prospective liquidation value of the assets, if any, collateralizing loans in which we invest is an important factor in the Advisor’s credit analysis. The Advisor emphasizes both tangible assets, such as accounts receivable, inventory, equipment and real estate, and intangible assets, such as intellectual property, customer lists, networks and databases.
Investment selection process
The Company’s investment activities are managed by the Advisor. The Advisor is responsible for sourcing potential investments, conducting research on prospective investments, analyzing investment opportunities, structuring our investments, and monitoring our investments and portfolio companies on an ongoing basis. The Advisor is supported by a team of employees devoted to the Company, including investment professionals who have extensive experience in commercial lending, investment banking, accounting, corporate law and private equity investing.
If a prospective investment is deemed to warrant further review, an investment team is assigned to the investment and the junior members of the team prepare a screening memo for internal discussion during a screening meeting. The purpose of the screening meeting is to determine if the prospective investment fits the fund mandate and should require incremental team resources to diligence and execute, as determined by vote of the Investment Committee. At this time, the other investment professionals have the opportunity to identify diligence items, ask questions and raise concerns.
The Advisor selectively narrows prospective investment opportunities through a process designed to identify the most attractive opportunities. If the Investment Committee and the Company’s senior management determine that an investment opportunity merits pursuit, the Advisor engages in an intensive due diligence process. This process involves extensive research into the target company, its management, its industry, its growth prospects and its ability to withstand adverse conditions.
In conducting their due diligence, the Advisor’s investment professionals use publicly available information as well as information from their extensive relationships with former and current management teams, consultants, competitors and investment bankers, among others. Though each transaction involves a somewhat different approach, the Advisor often undertakes the following due diligence steps. Initially, the investment team involved in the transaction may meet with management to get an insider’s view of the business and probe for potential weaknesses in business prospects. They may also visit headquarters and company operations, meeting top-and middle-level executives. Independently from the company, the investment team may check management’s backgrounds and references. With information provided by the company, the investment team performs a detailed review of historical financial performance and the quality of earnings. To assess both business prospects and standard practices, they may contact customers and vendors and conduct a competitive analysis, comparing the company to its main competitors on an operating, financial, market share and valuation basis. The investment team also researches the industry for historic growth trends and future prospects utilizing BlackRock’s industry analysts, third party research, industry association literature and general news. Furthermore, they assess asset value and the ability of physical infrastructure and information systems to handle anticipated growth and investigate any legal risks and the viability of current financial and accounting systems. Attorneys and independent accountants as well as outside advisors, as appropriate, may conduct additional due diligence on behalf of the Advisor.
After the Advisor has identified an investment opportunity, received approval at the screening meeting, and completed due diligence, the investment team involved in the transaction prepares a written investment analysis in the form of an investment committee memo, and presents their findings to all of the investment professionals including Messrs. Zugay and Mehring, at an Investment Committee meeting. At that time, the Investment Committee, which consists of the senior investment professionals, cast a vote for or against moving forward with the potential investment.
Investment structure
Once the Advisor determines that a prospective portfolio company is a suitable investment, it works with the management of that company, any intermediaries and other capital providers, including senior and junior debt security investors and equity capital providers, to structure an investment.
We invest in portfolio companies primarily in the form of senior and junior secured loans and unsecured and subordinated loans. The senior and junior secured loans generally have terms of three to ten years. We obtain security interests in the assets of our
5
portfolio companies that serve as collateral in support of the repayment of the senior and junior secured loans. The collateral may take the form of first or second priority liens on the assets of a portfolio company.
The Advisor structures unsecured and subordinated debt securities and loans to have relatively high floating or fixed interest rates that provide us with current investment income. These debt securities and loans generally have terms of up to ten years. Such unsecured and subordinated debt securities and loans may have interest-only payments in the early years, with amortization of principal deferred to the later years of the loan. Also, some of these loans will be collateralized by a subordinate lien on some or all of the assets of the company.
In some cases, our debt investments may provide for a portion of the interest payable to be payment-in-kind (“PIK”) interest. To the extent interest is PIK, it is payable through the increase of the principal amount of the loan by the amount of the interest due on the then-outstanding principal amount of the loan. We are required to recognize PIK interest, a non-cash source of income, as taxable income, increasing the amounts we are required to distribute to stockholders to qualify for the federal income tax benefits applicable to RICs.
In the case of the senior secured and junior loans, the Advisor tailors the terms of the investment to the facts and circumstances of the transaction and the prospective portfolio company, negotiating a structure that aims to protect our rights and manage our risk while creating incentives for the portfolio company to achieve its business plan and improve its profitability. For example, in addition to seeking a senior position in the capital structure of our portfolio companies, the Advisor seeks to limit the downside potential of our investments. The Advisor may accomplish this through requiring a total return on our investment (including both interest and potential equity appreciation) that compensates us for credit risk or through incorporating call protection into the investment structure. The Advisor may also negotiate covenants in connection with our investments that protect the preservation of our capital. Such restrictions may include affirmative and negative covenants, default penalties, lien protection, change of control provisions and board rights, including either observation or participation rights.
In general, our debt investments include financial covenants and terms that require the portfolio company to reduce leverage over time, thereby enhancing its credit quality. These methods may include, among others: maintenance leverage covenants requiring a decreasing ratio of debt to cash flow; maintenance cash flow covenants requiring an increasing ratio of cash flow to interest expense and possibly other cash expenses such as capital expenditures, cash taxes and mandatory principal payments; and debt incurrence prohibitions, limiting a company’s ability to re-lever its balance sheet. In addition, limitations on asset sales and capital expenditures prevent a company from changing the nature of its business or capitalization without our consent.
Structurally, subordinated loans usually rank junior in priority of payment to senior debt, such as senior bank debt, and are often unsecured. As such, other creditors may rank senior to us in the event of insolvency. However, subordinated loans rank senior to common and preferred equity in a borrower’s capital structure. Due to their higher risk profile and often less restrictive covenants as compared to senior loans, subordinated loans generally earn higher interest yields than senior secured loans. We believe that subordinated loans offer an attractive alternative investment opportunity. In many cases investors in subordinated loans receive opportunities to invest directly in the equity securities of borrowers, and from time to time also may receive warrants to purchase equity securities.
Our debt investments may include equity features, such as warrants or options to buy a minority interest in the portfolio company. Warrants we receive with our debt may require only a nominal cost to exercise, and thus, as a portfolio company appreciates in value, we may achieve additional investment return from this equity interest. We generally seek to structure the warrants to provide provisions protecting our rights as a minority-interest holder, and we generally seek to structure puts or rights to sell such securities back to the company upon the occurrence of specified events.
Our equity investments may consist of preferred equity that pays dividends on a current basis or preferred equity that does not pay current dividends. Preferred equity generally has a preference over common equity as to distributions on liquidations and dividends. In some cases, we may acquire common equity. Our equity investments frequently are not control-oriented investments, and in many cases, we acquire equity securities as part of a group of private equity investors in which we are not the lead investor. We may also receive equity through portfolio company restructurings. Our preferred and common equity investments typically are made in conjunction with loans to these companies.
Ongoing relationship with portfolio companies
The Advisor monitors our portfolio companies on an ongoing basis. The Advisor monitors the financial trends of each portfolio company to determine if it is meeting its business plans and to assess the appropriate course of action for each company. The Advisor
6
has several methods of evaluating and monitoring the performance and fair values of our investments, which may include the following and other methods:
|
|
• |
assessment of success of the portfolio company in adhering to its business plan and compliance with covenants; |
|
|
• |
periodic and regular contact with portfolio company management and, if appropriate, the financial or strategic sponsor, to discuss financial position, requirements and accomplishments; |
|
|
• |
comparisons to other companies in the industry; |
|
|
• |
attendance at and participation in board meetings; |
|
|
• |
review of interim and annual financial statements and financial projections for portfolio companies; and |
|
|
• |
retention of third-party valuation firms to assist in determination of fair value. |
Managerial assistance
As a BDC, we offer, and must provide upon request, managerial assistance to our portfolio companies. This assistance could involve, among other things, participating in board and management meetings, consulting with and advising officers of portfolio companies and providing other organizational and financial guidance or exercising strategic or managerial influence over such companies. We may receive fees for these services. The Advisor will provide managerial assistance on our behalf to those portfolio companies that request this assistance. Employees of BlackRock devoted to the Company have experience providing managerial assistance to private operating companies like our portfolio companies, and such assistance has tended to be related to board representation and to strategic and financing transactions. The Advisor generally will not receive any direct compensation from our portfolio companies for providing managerial assistance although it may do so from time to time.
Investment rating system
The Advisor generally employs a grading system for our entire portfolio. The Advisor grades all loans on a scale of 1 to 4. This system is intended to reflect the performance of the borrower’s business, the collateral coverage of the loans and other factors considered relevant. Generally, the Advisor assigns only one loan grade to each portfolio company for all loan investments in that portfolio company; however, the Advisor will assign multiple ratings for different investments in one portfolio company, when appropriate. The following is a description of the conditions associated with each investment rating:
Grade 1: Investments in portfolio companies whose performance is substantially within the Advisor’s expectations and whose risk factors are neutral to favorable to those at the time of the original investment.
Grade 2: Investments in portfolio companies whose performance is below the Advisor’s expectations and that require closer monitoring; however, no loss of investment return (interest and/or dividends) or principal is expected.
Grade 3: Investments in portfolio companies whose performance is below the Advisor’s expectations and for which risk has increased materially since origination. Some loss of investment return is expected, but no loss of principal is expected. Companies graded 3 generally will be out of compliance with debt covenants and will be unlikely to make debt repayments on their original schedule.
Grade 4: Investments in portfolio companies whose performance is materially below the Advisor’s expectations where business trends have deteriorated and risk factors have increased substantially since the original investment. Investments graded 4 are those for which some loss of principal is expected.
The Advisor monitors and, when appropriate, changes the investment ratings assigned to each investment in our portfolio. In connection with our valuation process, the Advisor and Board of Directors review these investment ratings on a quarterly basis. Our average investment rating was 1.35 at December 31, 2017 and 1.35 at December 31, 2016. The following is a distribution of the investment ratings of our portfolio companies at December 31, 2017 and 2016:
|
|
|
December 31, 2017 |
|
|
December 31, 2016 |
|
||
|
Grade 1 |
|
$ |
642,413,532 |
|
|
$ |
696,150,783 |
|
|
Grade 2 |
|
|
35,193,161 |
|
|
|
133,487,483 |
|
|
Grade 3 |
|
|
14,630,321 |
|
|
|
88,655,801 |
|
|
Grade 4 |
|
|
65,698,306 |
|
|
|
5,005,487 |
|
|
Not Rated |
|
|
5,487 |
|
|
|
7,823,936 |
|
|
Total investments |
|
$ |
757,940,807 |
|
|
$ |
931,123,490 |
|
7
The investment rating process begins with each portfolio company or investment being initially evaluated by the investment team, led by a senior investment professional that is responsible for the portfolio company relationship. This evaluation generally is completed no less frequently than quarterly. At the Advisor’s weekly investment professionals’ meeting, the transaction team presents an update on the activities of any company rated below Grade 1. Each quarter, all investment professionals attend a separate investment rating meeting. At these quarterly meetings, the investment team responsible for each portfolio investment reviews each portfolio company and suggests a rating for each investment for discussion among the investment professionals. At the conclusion of discussion, and subject to the approval of the Company’s CEO, the Company’s Chief Financial Officer compiles the internal investment ratings quarterly for review by the Board of Directors.
Valuation Procedures
We conduct the valuation of our assets, pursuant to which our net asset value shall be determined, consistent with U.S. generally accepted accounting principles (“GAAP”) and the 1940 Act. We value our assets on a quarterly basis. Our valuation procedures are set forth in more detail below:
Investments for which market quotations are readily available are valued at such market quotations unless they are deemed not to represent fair value. The Company obtains market quotations, when available, from an independent pricing service or one or more broker-dealers or market makers and utilizes the average of the range of bid and ask quotations.
Debt and equity securities for which market quotations are not readily available or for which market quotations are deemed not to represent fair value are valued at fair value as determined in good faith by or under the direction of the Company’s Board of Directors. Because the Company expects that there will not be a readily available market for substantially all of the investments in its portfolio, the Company expects to value substantially all of its portfolio investments at fair value as determined in good faith by or under the direction of the Board of Directors using a consistently applied valuation process in accordance with a documented valuation policy that has been reviewed and approved by the Board of Directors.
Determination of fair value involves subjective judgments and estimates. Due to the inherent uncertainty and subjectivity of determining the fair value of investments that do not have a readily available market value, the fair value of the Company’s investments may differ significantly from the values that would have been used had a readily available market value existed for such investments and may differ materially from the values that the Company may ultimately realize.
With respect to the Company’s investments for which market quotations are not readily available or for which market quotations are deemed not to represent fair value, the Board of Directors has approved a multi-step valuation process applied each quarter, as described below:
|
(i) |
The quarterly valuation process begins with each portfolio company or investment being initially evaluated and rated by the investment professionals of the Advisor responsible for the portfolio investment; |
|
(ii) |
The investment professionals provide recent portfolio company financial statements and other reporting materials to independent valuation firms engaged by the Board of Directors; such firms conduct independent appraisals each quarter and their preliminary valuation conclusions are documented and discussed with the Company’s senior management; |
|
(iii) |
The Audit Committee of the Board of Directors reviews the preliminary valuations prepared by the independent valuation firms; and |
|
(iv) |
The Board of Directors discusses valuations and determines the fair value of each investment in the portfolio in good faith based on the input of the Advisor, the respective independent valuation firms and the Audit Committee. |
Investment management agreement
At a special meeting of the Company’s stockholders, held on February 18, 2015, the Company’s stockholders approved a new investment management agreement between the Company and BlackRock Advisors to permit BlackRock Advisors to serve as the Company’s investment adviser following the completion of the sale of certain assets related to managing the Company from the Previous Advisor, 52nd Street Capital Advisors LLC, formerly BlackRock Kelso Capital Advisors LLC. BlackRock Advisors is a wholly owned indirect subsidiary of BlackRock, Inc. The Transaction was completed on March 6, 2015 and, pursuant to the BlackRock Advisors Management Agreement, dated as of March 6, 2015, BlackRock Advisors managed the Company’s investment activities. Prior to the consummation of the Transaction, the Company had entered into an investment management agreement with 52nd Street Capital Advisors LLC, the Previous Advisor, which initially became effective on June 22, 2008 and its initial term expired on June 22, 2010. Our Board of Directors then approved the agreement for successive one year terms until the completion of the
8
Transaction with BlackRock Advisors on March 6, 2015, at which time the BlackRock Advisors Management Agreement became effective. The BlackRock Advisors Management Agreement had the same Management and Incentive Fee terms as the previous agreement until March 6, 2017 and thereafter had different Management and Incentive Fees terms as compared to the previous agreement as outlined below. On January 16, 2018, BlackRock Advisors assigned the BlackRock Advisors Management Agreement, dated March 6, 2015, to a wholly owned subsidiary, BCIA pursuant to Rule 2a-6 of the 1940 Act, and the Company entered into the Current Management Agreement with the Advisor. Accordingly, BCIA is now our investment advisor. The Current Management Agreement has the same Management and Incentive Fee terms as compared to the BlackRock Advisors Management Agreement. Unless earlier terminated, the Current Management Agreement will remain in effect from year-to-year if approved annually by the Board or by the affirmative vote of the holders of a majority of outstanding voting securities, including, in either case, approval by a majority of the directors who are not interested persons.
Base Management Fee
Under the Current Management Agreement, our investment advisor, subject to the overall supervision of the Board, manages our day-to-day operations and provides us with investment advisory services. For providing these services, our investment advisor received, until March 6, 2017, a base management fee at an annual rate of 2.0% of our total assets, including any assets acquired with the proceeds of leverage, payable quarterly in arrears. After March 6, 2017, our investment advisor received a base management fee at an annual rate of 1.75% of total assets (excluding cash), including any assets acquired with the proceeds of leverage, payable quarterly in arrears based on total asset valuation at the end of the prior quarter.
For the years ended December 31, 2017, 2016 and 2015, the Company incurred $16,391,532, $21,460,909 and $24,678,087, respectively, in base management fees under the respective management agreements.
Incentive Management Fee Until March 6, 2017
The BlackRock Advisors Management Agreement provided that BlackRock Advisors or its affiliates were entitled to an incentive management fee under certain circumstances until March 6, 2017. The Incentive Fee until March 6, 2017 was calculated in the same manner as the Incentive Fee in the previous management agreement. The determination of the Incentive Fee until March 6, 2017, as described in more detail below, resulted in BlackRock Advisors or its affiliates receiving no Incentive Fee payments if returns to stockholders did not meet an 8.0% annualized rate of return during the applicable fee measurement period, and resulted in BlackRock Advisors or its affiliates receiving less than the full amount of the Incentive Fee percentage until returns to stockholders exceeded an approximate 13.3% annualized rate of return during such period. Annualized rate of return in this context is computed by reference to net asset value and does not take into account changes in the market price of the common stock.
Until March 6, 2017, BlackRock Advisors was entitled to receive the Incentive Fee if the performance exceeded a “hurdle rate” during different measurement periods: trailing four quarters’ periods (which apply only to the portion of the Incentive Fee based on income) and annual periods (which apply only to the portion of the Incentive Fee based on capital gains). The “trailing four quarters’ periods” for purposes of determining the income portion of the Incentive Fee payable for the three months ended December 31, 2017, 2016 and 2015 was determined by reference to the four quarter periods ended on December 31, 2017, 2016 and 2015, respectively. The term “annual period” means the period beginning on July 1 of each calendar year and ending on June 30 of the next calendar year.
The hurdle rate for each measurement period until March 6, 2017 was 2.0% multiplied by net asset values at the beginning of each calendar quarter during the measurement period, calculated after giving effect to any distributions that occurred during the measurement period until March 6, 2017. A portion of the Incentive Fee was based on income and a portion was based on capital gains. Each portion of the Incentive Fee is described below.
|
|
(i) |
Quarterly Incentive Fee Based on Income Until March 6, 2017 |
For each trailing four quarters’ period until March 6, 2017, the Company paid BlackRock Advisors an Incentive Fee based on the amount by which (A) aggregate distributions and amounts distributable out of taxable net income (excluding any capital gain and loss), during the period less the amount, if any, by which net unrealized capital depreciation exceeds net realized capital gains / losses during the period, was in excess of (B) the hurdle rate for the period. The amount of the excess of (A) over (B) described in this paragraph for each period is referred to as the excess income amount.
It should be noted that net realized capital gains / losses during the period were calculated as the proceeds received upon disposition less the fair market value as of the beginning of the measurement period. Since this calculation was not cumulative, but rather performed on a trailing four quarters period, fluctuations in fair market values were captured in net unrealized appreciation and depreciation of prior measurement periods.
9
The portion of the Incentive Fee based on income for each period equaled 50% of the period’s excess income amount, until the cumulative Incentive Fee payments for the period equaled 20% of the period’s income amount distributed or distributable to stockholders as described in clause (A) of the preceding paragraph. Thereafter, the portion of the Incentive Fee based on income for the period equaled 20% of the period’s amount distributed or distributable to stockholders.
For the period from January 1, 2017 through March 6, 2017, BlackRock Advisors did not earn Incentive Fees based on income from the Company. For the years ended December 31, 2016 and 2015, the Company incurred zero and $11,061 in Incentive Fees based on income, respectively.
|
|
(ii) |
Annual Incentive Fee Based on Capital Gains Until March 6, 2017 |
The portion of the Incentive Fee based on capital gains was calculated and paid on an annual basis beginning on July 1 of each annual period and ending on June 30 of the next calendar year. The portion of Incentive Fee based on capital gains was calculated in the same manner as such portion of the Incentive Fee in the prior investment agreement. For each annual period, the Company paid BlackRock Advisors an Incentive Fee on capital gains based on the amount by which (A) net realized capital gains, if any, exceeded gross unrealized capital depreciation, if any, occurring during the period in excess of (B) the amount, if any, by which the period’s hurdle rate exceeded the amount of income used in the determination of the Incentive Fee based on income for the period. The amount of the excess of (A) over (B) described in this paragraph is referred to as the excess gain amount.
|
|
(iii) |
Calculation of Incentive Fee |
The portion of the Incentive Fee based on capital gains for each period equaled 50% of the period’s excess gain amount, until such payments equaled 20% of the period’s capital gain amount distributed or distributable to stockholders. Thereafter, the portion of the Incentive Fee based on capital gains for the period equaled an amount such that the portion of the Incentive Fee payments to BlackRock Advisors based on capital gains for the period equals 20% of the period’s capital gain amount distributed or distributable to stockholders. The result of this formula was that, if the portion of the Incentive Fee based on income for the period exceeded the period’s hurdle, then the portion of the Incentive Fee based on capital gains was capped at 20% of the capital gain amount.
In calculating whether the portion of the Incentive Fee based on capital gains is payable with respect to any period, we account for assets on a security-by-security basis. In addition, the Company uses the “period-to-period” method pursuant to which the portion of the Incentive Fee based on capital gains for any period is based on realized capital gains for the period reduced by realized capital losses and gross unrealized capital depreciation for the period. Based on current interpretations of Section 205(b)(3) of the Investment Advisers Act of 1940 by the SEC and its staff, the calculation of unrealized depreciation for each portfolio security over a period is based on the fair value of the security at the end of the period compared to the fair value at the beginning of the period. Incentive Fees earned in any of the periods described above are not subject to modification or repayment based upon performance in a subsequent period.
The Company is required under GAAP to accrue a hypothetical capital gains Incentive Fee based upon net realized capital gains and unrealized capital appreciation and depreciation on investments held at the end of each period. The accrual of this hypothetical capital gains Incentive Fee assumes all unrealized capital appreciation and depreciation is realized in order to reflect a hypothetical capital gains Incentive Fee that would be payable at each measurement date. If such amount is positive at the end of the period, then we recorded a capital gains Incentive Fee equal to 20% of such amount, less the amount of capital gains related Incentive Fees already accrued in prior periods. If the resulting amount is negative, the accrual for GAAP in a given period may have resulted in the reduction of an expense. There can be no assurance that such unrealized capital appreciation will be realized in the future. However, it should be noted that a fee so calculated and accrued would not be payable under the Advisers Act or the BlackRock Advisors Management Agreement. Amounts actually paid were consistent with the Advisers Act, which specifically excludes consideration of unrealized capital appreciation.
The capital gains Incentive Fee due to BlackRock Advisors as calculated under the BlackRock Advisors Management Agreement and prior management agreement as described above, for the annual period ended June 30, 2017, 2016 and 2015 was zero. In accordance with GAAP, the hypothetical liquidation for the years ended December 31, 2017, 2016 and 2015 resulted in a capital gains Incentive Fee (reversal)/accrual of zero, zero and $(3,200,520), respectively. The Company did not have total cumulative accrued balance at December 31, 2017, 2016 and 2015, respectively.
|
|
(iv) |
Calculation of Capital Gains |
It should be noted that net realized capital gains during each period were calculated as the proceeds received upon disposition in excess of the lower of each security’s amortized cost, or the fair market value as of the beginning of the measurement period. Since
10
this calculation was not cumulative, but rather performed on an annual period commencing each July 1, any unrealized depreciation on a security, if any, was captured in the gross unrealized depreciation of a prior period.
Incentive Management Fee After March 6, 2017
|
|
(i) |
Quarterly Incentive Fee Based on Income After March 6, 2017 |
After March 6, 2017, the BlackRock Advisors Management Agreement provided and the Current Management Agreement provides that our investment advisor or its affiliates may be entitled to an incentive management fee under certain circumstances. The Incentive Fee has two parts. The first portion is based on income other than capital gains and is calculated separately for each calendar quarter and will be paid on a quarterly basis. The Company will pay our investment advisor the portion of the Incentive Fee based on income for each period as follows:
|
|
• |
No Incentive Fee based on income other than capital gains for any calendar quarter in which the Pre-Incentive Fee Net Investment Income does not exceed 1.75% (7.00% annualized) of net assets attributable to common stock at the beginning of such quarter. |
|
|
• |
100% of the Pre-Incentive Fee Net Investment Income in any calendar quarter with respect to that portion of such Pre-Incentive Fee Net Investment Income, if any, for such calendar quarter, that exceeds 1.75% (7.00% annualized) of net assets attributable to common stock at the beginning of such quarter but is less than 2.1875% (8.75% annualized). |
|
|
• |
20% of the Pre-Incentive Fee Net Investment Income, if any, for any calendar quarter that exceeds 2.1875% (8.75% annualized) of net assets attributable to common stock at the beginning of such quarter. |
The calculations described above will be appropriately prorated for any period of less than a quarter and adjusted for the net proceeds from any common stock issuances and the cost of any common stock repurchases during such quarter.
The payment of any such Incentive Fee based on income otherwise earned by our investment advisor will be deferred if, for the most recent four full calendar quarter period ending on or prior to the date such payment is to be made, the Annualized Rate of Return is less than 7.0% of net assets attributable to common stock at the beginning of such four quarter period as adjusted for the net proceeds from any common stock issuances and the cost of any common stock repurchases during such four full calendar quarter period, with any deferred Incentive Fees to be carried over for payment in subsequent quarterly calculation periods to the extent such payment can then be made in accordance with the investment management agreement.
For the period after March 6, 2017 to December 31, 2017, BlackRock Advisors earned $7,980,098 in Incentive Fees based on income from the Company.
On March 7, 2017, BlackRock Advisors, in consultation with the Company’s Board of Directors, agreed to waive incentive fees based on income after March 6, 2017 to December 31, 2018 or approximately 21 months. BCIA has agreed to honor such waiver. The start date of the fee waiver coincides with the change to the fee calculation mentioned above. The waiver for incentive fees based on income for the period after March 6, 2017 to December 31, 2017 is $7,980,098, resulting in no net Incentive Fees based on income earned by the Company.
|
|
(ii) |
Annual Incentive Fee Based on Capital Gains After March 6, 2017 |
The second portion of the Incentive Fee is based on capital gains and is calculated separately for each Annual Period. Our investment advisor will be entitled to receive an Incentive Fee based on capital gains for each Annual Period in an amount equal to 20% of the amount by which (1) net realized capital gains occurring during the period, if any, exceeds (2) gross unrealized capital depreciation, if any, occurring during the period. In calculating the portion of the Incentive Fee based on capital gains payable for any period, investments are accounted for on a security-by-security basis. In addition, the portion of the Incentive Fee based on capital gains is determined using the “period-to-period” method pursuant to which the portion of the Incentive Fee based on capital gains for any period will be based on realized capital gains for the period reduced by realized capital losses for the period and unrealized capital depreciation for the period.
The capital gains Incentive Fee due to BlackRock Advisors as calculated under the BlackRock Advisors Management Agreement as described above, at December 31, 2017, resulted in no capital gains incentive fee accrual. The total cumulative accrued balance at December 31, 2017 was zero.
|
|
(iii) |
Calculation of Incentive Fee |
11
For purposes of calculating the Incentive Fee, (i) “Annual Period” means the period beginning on July 1 of each calendar year, including the calendar year prior to the year in which the investment management agreement became effective, and ending on June 30 of the next calendar year; (ii) “Annualized Rate of Return” is computed by reference to the sum of (i) the aggregate distributions to common stockholders for the period in question and (ii) the change in net assets attributable to common stock (before taking into account any Incentive Fees otherwise payable during such period); (iii) “net assets attributable to common stock” means total assets less indebtedness and preferred stock; and (iv) “Pre-Incentive Fee Net Investment Income” means net investment income (as determined in accordance with United States generally accepted accounting principles) accrued by the Company during the calendar quarter excluding any accruals for or payments in respect of the Incentive Fee.
|
|
(iv) |
Calculation of Capital Gains |
Capital gains and losses are calculated using the proceeds received and either (i) fair market value at the beginning of the Annual Period or (ii) cost for investments acquired during the Annual Period. In calculating whether the portion of the Incentive Fee based on capital gains is payable with respect to any period, we account for assets on a security-by-security basis. In addition, the Company uses the “period-to-period” method pursuant to which the portion of the Incentive Fee based on capital gains for any period is based on realized capital gains for the period reduced by realized capital losses and gross unrealized capital depreciation for the period. Based on current interpretations of Section 205(b)(3) of the Investment Advisers Act of 1940 by the SEC and its staff, the calculation of unrealized depreciation for each portfolio security over a period is based on the fair value of the security at the end of the period compared to the fair value at the beginning of the period. Incentive Fees earned in any of the periods described above are not subject to modification or repayment based upon performance in a subsequent period.
Indemnification
The Current Management Agreement provides that in the absence of willful misfeasance, bad faith, gross negligence or reckless disregard of its obligations thereunder, the Advisor is not liable to us or any of our stockholders for any act or omission by it or its employees in the supervision or management of our investment activities or for any loss sustained by us or our stockholders, and provides for indemnification by us of its members, directors, officers, employees, agents and control persons for liabilities incurred by it in connection with their services to us, subject to certain limitations and conditions.
Duration and termination
Unless earlier terminated, the Current Management Agreement will remain in effect for successive periods of twelve months, provided that each continuance is specifically approved at least annually by both (1) the vote of a majority of our Board or the vote of a majority of our outstanding voting securities and (2) the vote of a majority of the Board who are not parties to the Management Agreement or interested persons (as such term is defined in the 1940 Act) of any such party, cast in person at a meeting called for the purpose of voting on such approval. In November 2017, our Board approved the Management Agreement for a successive 12 months. We may terminate the Current Management Agreement as a whole at any time, without the payment of any penalty, upon the vote of a majority of our Board or a majority of our outstanding voting securities or by the Advisor, on 60 days’ written notice by either party to the other which can be waived by the non-terminating party. The Current Management Agreement will also immediately terminate in the event of its assignment.
Administration agreement
We have entered into an administration agreement with BlackRock Financial Management, Inc., a subsidiary of BlackRock, under which the Administrator provides certain administrative services to us. For providing these services, facilities and personnel, we reimburse the Administrator for our allocable portion of overhead and other expenses incurred by the Administrator in performing its obligations under the administration agreement, including rent and our allocable portion of the cost of certain of our officers and their respective staffs. For the years ended December 31, 2017, 2016 and 2015, we incurred $1,039,221, $1,304,172 and $1,614,561, respectively, for administrative services expenses payable to the Administrator under the administration agreement.
Competition
A number of entities compete with us to make the types of investments that we make. We compete with other BDCs, public and private funds, commercial and investment banks, collateralized loan obligation (“CLO”) funds, commercial financing companies, insurance companies, high yield investors and, to the extent they provide an alternative form of financing, private equity funds. Additionally, because competition for investment opportunities generally has increased among alternative investment vehicles, such as hedge funds, those entities have begun to invest in areas they have not traditionally invested in, including investments in middle-market companies. As a result of these new entrants, competition for investment opportunities at middle-market companies has intensified. Many of our existing and potential competitors are substantially larger and have considerably greater financial, technical
12
and marketing resources than we do. For example, some competitors may have a lower cost of funds and access to funding sources that are not available to us. In addition, some competitors may have higher risk tolerances or different risk assessments, which could allow them to consider a wider variety of investments and establish more relationships than us. Furthermore, many of our competitors are not subject to the regulatory restrictions that the 1940 Act imposes on us as a BDC or the restrictions that the Code imposes on us as a RIC.
Leverage
Unsecured Convertible Senior Notes Due 2022
On June 13, 2017, the Company issued $143,750,000 in aggregate principal amount ($125,000,000 of the initial offering and $18,750,000 of the underwriters’ exercise of the overallotment option) of 5.00% Convertible Notes due 2022 (the “2022 Convertible Notes”) under an indenture, dated as of June 13, 2017. Net proceeds to the Company from the offering, including the exercise of the overallotment option, were approximately $139,800,000. The 2022 Convertible Notes will mature on June 15, 2022, unless previously converted, repurchased or redeemed in accordance with their terms. The interest rate on the notes is 5.00% per year, payable semiannually in arrears on June 15 and December 15 of each year, commencing on December 15, 2017. Holders may convert their notes at their option prior to the close of business on the business day immediately preceding December 15, 2021, in integral multiples of $1,000 principal amount, only under certain circumstances. Upon conversion of a note, we will pay or deliver, as the case may be, cash, shares of our common stock or a combination of cash and shares of our common stock, at our election at an initial conversion rate of 118.2173 shares of common stock per $1,000 principal amount of notes, which is equivalent to an initial conversion price of approximately $8.46 per share of the Company’s common stock. On or after December 23, 2021, the Company may redeem the 2022 Convertible Notes for cash, in whole or from time to time in part, at its option in accordance with their terms.
The 2022 Convertible Notes are accounted for in accordance with ASC 470-20, Debt – Debt with Conversion and Other Options. The Company has determined that the embedded conversion options in the 2022 Convertible Notes are not required to be separately accounted for as a derivative under U.S. GAAP. In accounting for the 2022 Convertible Notes, at the time of issuance the Company estimated separate debt and equity components, and an original issue discount equal to the equity component was recorded in additional paid-in-capital in the accompanying Consolidated Statements of Assets and Liabilities.
Senior Secured Revolving Credit Facility
On February 19, 2016, the Company entered into an Amended and Restated Senior Secured Revolving Credit Facility (the “Credit Facility”), which has an initial aggregate principal amount of up to $440,000,000, a stated commitment termination date of February 19, 2020, and a stated maturity date of February 19, 2021. The interest rate applicable to Eurocurrency borrowings thereunder is generally LIBOR plus an applicable margin of either 1.75% or 2.00% based on a pricing grid using the borrowing base as a multiple of the combined debt amount. The interest rate applicable to ABR borrowings thereunder is generally the prime rate in effect plus an applicable margin of either 0.75% or 1.00% based on a pricing grid using the borrowing base as a multiple of the combined debt amount. The Credit Facility’s commitment may increase in size, under certain circumstances, up to a total of $750,000,000. From the commitment termination date to the stated maturity date, the Company is required to repay outstanding principal amounts under the Credit Facility on a monthly basis in an amount equal to 1/12th of the outstanding amount at the commitment termination date. On June 5, 2017, the Company entered into a Second Amendment to the Second Amended and Restated Senior Secured Revolving Credit Facility which extended the commitment termination date on the Credit Facility from February 29, 2020 to June 5, 2021 and the maturity date from February 19, 2021 to June 5, 2022, respectively.
Senior Secured Term Loan
On February 19, 2016, the Company entered into an Amended and Restated Senior Secured Term Loan Credit Agreement (the “Term Loan”), which has a principal amount of $15,000,000. The Term Loan has a stated maturity date of March 27, 2019. The interest rate applicable to borrowings thereunder is generally LIBOR plus an applicable margin of 3.25%. On June 22, 2017, the Company repaid the aggregate $15,000,000 principal amount of the Term Loan, plus accrued and unpaid interest, as well as a $192,005 make-whole premium, using proceeds from the Credit Facility.
Unsecured Convertible Senior Notes Due 2018
13
On February 19, 2013, the Company closed a private offering of $100,000,000 in aggregate principal amount of 5.50% unsecured convertible senior notes due 2018 (the “Convertible Notes”). The initial purchasers of the Convertible Notes fully exercised their overallotment option and purchased an additional $15,000,000 in aggregate principal amount of the Convertible Notes. The closing of the overallotment option took place on March 4, 2013. With the exercise of the overallotment option, a total of $115,000,000 in aggregate principal amount of the Convertible Notes was sold. Net proceeds to the Company from the offering, including the exercise of the overallotment option, were approximately $111,300,000. The Convertible Notes were only offered to qualified institutional buyers as defined in the Securities Act of 1933, as amended (the “Securities Act”) pursuant to Rule 144A under the Securities Act.
The Convertible Notes are unsecured and bear interest at a rate of 5.50% per year, payable semi-annually in arrears. In certain circumstances and during certain periods, the Convertible Notes are convertible into cash, shares of the Company’s common stock or a combination of cash and shares of common stock, at the Company’s election, at an initial conversion rate of 86.0585 shares of common stock per $1,000 principal amount of the Convertible Notes, which is equivalent to an initial conversion price of approximately $11.62 per share of the Company’s common stock, subject to defined anti-dilution adjustments. The Company does not have the right to redeem the Convertible Notes prior to maturity.
On September 27, 2017, the Company purchased $59,959,000 in aggregate principal amount of its existing $115,000,000 Convertible Notes pursuant to a cash tender offer at a purchase price equal to $1,015 per $1,000 principal amount of notes purchased, plus accrued and unpaid interest, using borrowings under the Credit Facility and cash on hand. All Convertible Notes purchased in the tender offer were retired and cancelled, and are no longer outstanding under the indenture. The aggregate purchase price of the Convertible Notes was $60,858,385, plus approximately $144,852 of reacquisition costs, for a total reacquisition price of $61,003,237, excluding $384,737 of interest expense. The net carrying amount of the Convertible Notes purchased in the tender offer at the time of purchase was $59,754,389, net of unamortized debt issuance costs and unamortized discount. As such, in accordance with ASC 470-50, Debt – Modifications and Extinguishments, the difference between the reacquisition price and the net carrying amount of the Convertible Notes was recorded in the accompanying Consolidated Statements of Operations as a $1,323,442 loss on extinguishment of debt. On February 15, 2018, the remaining Convertible Notes of $55,041,000 matured and the Company paid the principal and interest in cash.
Senior Secured Notes
On January 18, 2011, the Company closed a private placement issuance of $158,000,000 in aggregate principal amount of five-year, senior secured notes with a fixed interest rate of 6.50% and a maturity date of January 18, 2016 and $17,000,000 in aggregate principal amount of seven-year, senior secured notes with a fixed interest rate of 6.60% and a maturity date of January 18, 2018 (collectively, the “Senior Secured Notes”). The $158,000,000 five-year, senior secured notes matured on January 18, 2016 and were repaid using proceeds from the Company’s Credit Facility. On April 17, 2017, the Company redeemed the $17,000,000 aggregate principal amount of 6.60% senior secured notes due 2018, using proceeds from the Credit Facility. The notes were prepaid at 100% of the principal amount, plus accrued and unpaid interest through the prepayment date, as well as $651,472 make-whole premium.
Staffing
Services necessary for our business are provided by individuals who are employees of BlackRock or the Administrator and its affiliates, pursuant to the terms of the Current Management Agreement and the Administration Agreement. Each of our executive officers is an employee of the Advisor or the Administrator and its affiliates. Our day-to-day investment operations are managed by the Advisor. At December 31, 2017, there are 14 investment professionals who focus on origination and transaction development and monitoring of our investments. We reimburse the Advisor for costs and expenses incurred by the Advisor for office space rental, office equipment and utilities allocable to the Advisor under the Current Management Agreement, as well as any costs and expenses incurred by the Advisor relating to any non-investment advisory, administrative or operating services provided by the Advisor to us. In addition, we reimburse the Administrator for our allocable portion of expenses it incurs in performing its obligations under the Administration Agreement, including rent as well as our allocable portion of any costs and expenses incurred by the Administrator relating to any non-investment advisory, administrative or operating services provided by the Administrator to us.
Regulation
We are a BDC under the 1940 Act. The 1940 Act contains prohibitions and restrictions relating to transactions between BDCs and their affiliates (including any investment advisors or sub-advisors), principal underwriters and affiliates of those affiliates or underwriters and requires that a majority of the directors be persons other than “interested persons,” as that term is defined in the 1940 Act. In addition, the 1940 Act provides that we may not change the nature of our business so as to cease to be, or to withdraw our election as, a BDC unless that change is approved by a majority of our outstanding voting securities.
14
We may invest up to 100% of our assets in securities acquired directly from issuers in privately negotiated transactions. With respect to such securities, we may, for the purpose of public resale, be deemed an “underwriter” as that term is defined in the Securities Act. We may purchase or otherwise receive warrants to purchase the common stock of our portfolio companies in connection with acquisition financing or other investment. Similarly, in connection with an acquisition, we may acquire rights to require the issuers of acquired securities or their affiliates to repurchase them under certain circumstances. We also do not intend to acquire securities issued by any investment company that exceed the limits imposed by the 1940 Act. Under these limits, except for registered money market funds we generally cannot acquire more than 3% of the voting stock of any registered investment company, invest more than 5% of the value of our total assets in the securities of one registered investment company or invest more than 10% of the value of our total assets in the securities of registered investment companies in the aggregate. With regard to that portion of our portfolio invested in securities issued by investment companies, it should be noted that such investments might subject our stockholders to additional expenses. None of these are fundamental policies and they may be changed without stockholder approval.
Sarbanes-Oxley Act of 2002
The Sarbanes-Oxley Act of 2002 (the “Sarbanes-Oxley Act”) imposes a wide variety of regulatory requirements on publicly-held companies and their insiders. We have adopted procedures to comply with the Sarbanes-Oxley Act and the regulations promulgated thereunder. The Sarbanes-Oxley Act requires us to review our policies and procedures to determine whether we comply with the Sarbanes-Oxley Act and such regulations. We will continue to monitor our compliance with all regulations that are adopted under the Sarbanes-Oxley Act and will take actions necessary to ensure that we are in compliance therewith.
The NASDAQ Global Select Market corporate governance regulations
The NASDAQ Global Select Market has adopted corporate governance regulations with which listed companies must comply. We believe we are in compliance with such corporate governance listing standards. We will continue to monitor our compliance with all future listing standards and will take actions necessary to ensure that we are in compliance therewith.
Privacy principles
We are committed to maintaining the privacy of stockholders and to safeguarding our nonpublic personal information. The following information is provided to help you understand what personal information we collect, how we protect that information and why, in certain cases, we may share information with select other parties.
Generally, we do not receive any nonpublic personal information relating to our stockholders, although certain nonpublic personal information of our stockholders may become available to us. We do not disclose any nonpublic personal information about our stockholders or former stockholders to anyone, except as permitted by law or as is necessary in order to service stockholder accounts (for example, to a transfer agent or third party administrator).
We restrict access to nonpublic personal information about our stockholders to BlackRock’s employees with a legitimate business need for the information. We maintain physical, electronic and procedural safeguards designed to protect the nonpublic personal information of our stockholders.
Available Information
We file with or submit to the SEC annual, quarterly and current periodic reports, proxy statements and other information meeting the informational requirements of the Securities Exchange Act of 1934 (the “Exchange Act”). This information is available free of charge by calling us at (212) 810-5800 or on our website at www.blackrockbkcc.com. The information on our website is not deemed incorporated by reference in this Annual Report. You also may inspect and copy these reports, proxy statements and other information, as well as the Annual Report and related exhibits and schedules, at the Public Reference Room of the SEC at 100 F Street, NE, Washington, D.C. 20549. You may obtain information on the operation of the Public Reference Room by calling the SEC at 1-800-SEC-0330. The SEC maintains an Internet site that contains reports, proxy and information statements and other information filed electronically by us with the SEC which are available at www.sec.gov. Copies of these reports, proxy and information statements and other information may be obtained, after paying a duplicating fee, by electronic request at the following e-mail address: publicinfo@sec.gov, or by writing the SEC’s Public Reference Room, 100 F Street, NE, Washington, D.C. 20549.
15
Investing in our securities may be speculative and involves a high degree of risk. You should carefully consider these risk factors, together with all of the other information included in this Annual Report on Form 10-K, including our consolidated financial statements and the related notes thereto. The risks set out below are not the only risks we face. If any of the following events occur, our business, financial condition and results of operations could be materially adversely affected. In such case, our net asset value and the trading price of our common stock could decline, and you may lose all or part of your investment in us.
Risks Related to Our Business
We operate in a highly competitive market for investment opportunities.
A number of entities compete with us to make the types of investments that we make. We compete with other BDCs, public and private funds, commercial and investment banks, CLO funds, commercial financing companies, insurance companies, high yield investors, hedge funds and, to the extent they provide an alternative form of financing, private equity funds. Moreover, alternative investment vehicles, such as hedge funds, have begun to invest in areas in which they have not traditionally invested, including making investments in middle market private U.S. companies. As a result of these new entrants, competition for investment opportunities in middle market private U.S. companies may intensify. Many of our competitors are substantially larger and have considerably greater financial, technical and marketing resources than we do. Some competitors may have a lower cost of funds and access to funding sources that are not available to us. In addition, some of our competitors may have higher risk tolerances or different risk assessments, which could allow them to consider a wider variety of investments and establish more relationships than us. Furthermore, many of our competitors are not subject to the regulatory restrictions that the 1940 Act imposes on us as a BDC and that the Code imposes on us as a RIC. We cannot assure you that the competitive pressures we face will not have a material adverse effect on our business, financial condition and results of operations. Also, as a result of this competition, we may not be able to pursue attractive investment opportunities from time to time. We do not seek to compete primarily based on the interest rates we offer and we believe that some of our competitors may make loans with interest rates that are comparable to or lower than the rates we offer. Rather, we compete with our competitors based on our existing investment platform, seasoned investment professionals, experience and focus on middle-market companies, disciplined investment philosophy, extensive industry focus and flexible transaction structuring.
We may lose investment opportunities if we do not match our competitors’ pricing, terms and structure. If we match our competitors’ pricing, terms and structure, we may experience decreased net interest income and increased risk of credit loss. As a result of operating in such a competitive environment, we may make investments that are on less favorable terms than what we may have originally anticipated, which may impact our return on these investments.
Capital markets may experience periods of disruption and instability. Such market conditions may materially and adversely affect debt and equity capital markets in the United States and abroad, which may have a negative impact on our business and operations.
From time to time, capital markets may experience periods of disruption and instability, which may be evidenced by a lack of liquidity in debt capital markets, write-offs in the financial services sector, re-pricing of credit risk and failure of certain major financial institutions. An example of such disruption and instability occurred between 2008 and 2009. During that period, despite actions of the U.S. federal government and foreign governments, such disruption and instability contributed to worsening general economic conditions that materially and adversely impacted the broader financial and credit markets and reduced the availability of debt and equity capital for the market as a whole and financial services firms in particular. While capital markets have improved in recent years, these conditions could deteriorate again and global financial markets could experience significant volatility. During such market disruptions, we may have difficulty raising debt or equity capital especially as a result of regulatory constraints. There can be no assurance that adverse market conditions will not repeat themselves or worsen in the future.
Equity capital may be difficult to raise during periods of adverse or volatile market conditions because, subject to some limited exceptions, as a BDC, we are generally not able to issue additional shares of our common stock at a price less than net asset value without first obtaining approval for such issuance from our stockholders and our independent directors. We may seek approval from our stockholders to have the flexibility to issue up to 25% of our then outstanding shares of our common stock immediately prior to any such sale at a price below net asset value.
Market conditions may in the future make it difficult to extend the maturity of or refinance our existing indebtedness and any failure to do so could have a material adverse effect on our business. The re-appearance of market conditions similar to those experienced from 2008 through 2009 for any substantial length of time could make it difficult to extend the maturity of or refinance
16
our existing indebtedness or obtain new indebtedness with similar terms and any failure to do so could have a material adverse effect on our business. The debt capital that will be available to us in the future, if at all, may be at a higher cost and on less favorable terms and conditions than what we currently experience. Further, if we are unable to raise or refinance debt, then our equity investors may not benefit from the potential for increased returns on equity resulting from leverage and we may be limited in our ability to make new commitments or to fund existing commitments to our portfolio companies.
The illiquidity of our investments may make it difficult for us to sell such investments if required. As a result, we may realize significantly less than the value at which we have recorded our investments. In addition, significant changes in the capital markets, including the disruption and volatility, have had, and may in the future have, a negative effect on the valuations of our investments and on the potential for liquidity events involving our investments. While most of our investments are not publicly traded, applicable accounting standards require us to assume as part of our valuation process that our investments are sold in a principal market to market participants (even if we plan on holding an investment through its maturity). An inability to raise capital, and any required sale of our investments for liquidity purposes, could have a material adverse impact on our business, financial condition and results of operations.
Price declines and illiquidity in the corporate debt markets have adversely affected, and may in the future adversely affect, the fair value of our portfolio investments, reducing our net asset value through increased net unrealized depreciation.
As a BDC, we are required to carry our investments at market value or, if no market value is ascertainable, at fair value as determined in good faith by or under the direction of our Board of Directors. Decreases in the market values or fair values of our investments are recorded as unrealized depreciation, which reduces our net asset value. Depending on market conditions, we could incur substantial realized losses and may suffer additional unrealized losses in future periods, which could have a material adverse impact on our business, financial condition and results of operations.
Uncertainty regarding the impact of United Kingdom’s Departure from the European Union could negatively impact our business, financial condition and earnings.
As a consequence of the United Kingdom’s vote to withdraw from the European Union (the “EU”), the government of the United Kingdom gave notice of its withdrawal from the EU (“Brexit”). As a result of this decision, the financial markets experienced high levels of volatility and it is likely that, in the near term, Brexit will continue to bring about higher levels of uncertainty and volatility. During this period of uncertainty, the negative impact on not only the United Kingdom and European economies, but the broader global economy, could be significant, potentially resulting in increased market and currency volatility (including volatility of the value of the British pound sterling relative to the United States dollar and other currencies and volatility in global currency markets generally), and illiquidity and lower economic growth for companies that rely significantly on Europe for their business activities and revenues. It is possible that certain economic activity will be curtailed until some signs of clarity begin to emerge, including negotiations around the terms for United Kingdom’s exit out of the EU. Additional risks associated with the outcome of Brexit include macroeconomic risk to the United Kingdom and European economies, impetus for further disintegration of the European Union and related political stresses (including those related to sentiment against cross border capital movements and activities of investors like us), prejudice to financial services business that are conducting business in the European Union and which are based in the United Kingdom, legal uncertainty regarding achievement of compliance with applicable financial and commercial laws and regulations in view of the expected steps to be taken pursuant to or in contemplation of Article 50 of the Treaty on European Union and negotiations undertaken under Article 218 of the Treaty on the Functioning of the European Union, and the unavailability of timely information as to expected legal, tax and other regimes. Any further exits from the EU, or the possibility of such exits, would likely cause additional market disruption globally and introduce new legal and regulatory uncertainties.
Rising interest rates may adversely affect the value of our portfolio investments which could have an adverse effect on our business, financial condition and results of operations.
Our debt investments may be based on floating rates, such as London Interbank Offer Rate (“LIBOR”), EURIBOR, the Federal Funds Rate or the Prime Rate. General interest rate fluctuations may have a substantial negative impact on our investments, the value of our common stock and our rate of return on invested capital. A reduction in the interest rates on new investments relative to interest rates on current investments could also have an adverse impact on our net interest income. An increase in interest rates could decrease the value of any investments we hold which earn fixed interest rates, including subordinated loans, senior and junior secured and unsecured debt securities and loans and high yield bonds, and also could increase our interest expense, thereby decreasing our net income. Also, an increase in interest rates available to investors could make investment in our common stock less attractive if we are not able to increase our dividend rate, which could reduce the value of our common stock.
Because we have borrowed money, and may issue preferred stock to finance investments, our net investment income depends, in part, upon the difference between the rate at which we borrow funds or pay distributions on preferred stock and the rate that our investments yield. As a result, we can offer no assurance that a significant change in market interest rates will not have a material
17
adverse effect on our net investment income. In periods of rising interest rates, our cost of funds would increase except to the extent we have issued fixed rate debt or preferred stock, which could reduce our net investment income.
You should also be aware that a change in the general level of interest rates can be expected to lead to a change in the interest rate we receive on many of our debt investments. Accordingly, a change in the interest rate could make it easier for us to meet or exceed the performance threshold and may result in a substantial increase in the amount of Incentive Fees payable to our Advisor with respect to the portion of the Incentive Fee based on income.
Changes relating to the LIBOR calculation process may adversely affect the value of the LIBOR-indexed, floating-rate debt securities in our portfolio.
In July 2017, the head of the United Kingdom Financial Conduct Authority announced the desire to phase out the use of LIBOR by the end of 2021. There is currently no definitive information regarding the future utilization of LIBOR or of any particular replacement rate. As such, the potential effect of any such event on our cost of capital and net investment income cannot yet be determined.
Actions by the British Bankers’ Association (“BBA”), regulators or law enforcement agencies as a result of these or future events, may result in changes to the manner in which LIBOR is determined. Potential changes, or uncertainty related to such potential changes may adversely affect the market for LIBOR-based securities, including our portfolio of LIBOR-indexed, floating-rate debt securities. In addition, any further changes or reforms to the determination or supervision of LIBOR may result in a sudden or prolonged increase or decrease in reported LIBOR, which could have an adverse impact on the market for LIBOR-based securities or the value of our portfolio of LIBOR-indexed, floating-rate debt securities.
Our financial condition and results of operations depend on our ability to manage future growth effectively.
Our ability to achieve our investment objective depends on our ability to manage our business, which depends, in turn, on the ability of the Advisor to identify, invest in and monitor companies that meet our investment criteria. Accomplishing this result is largely a function of the Advisor’s investment process and, in conjunction with the Administrator, its ability to provide competent, attentive and efficient services to us. Some of our executive officers and members of the Investment Committee have substantial responsibilities to other clients in addition to their activities and responsibilities on our behalf. The investment professionals dedicated to us may also be required to provide managerial assistance to our portfolio companies. These demands on their time may distract them or slow our rate of investment. Any failure to manage our business effectively could have a material adverse effect on our business, financial condition and results of operations.
We are dependent upon senior management personnel of our Advisor for our future success, and if our Advisor is unable to hire and retain qualified personnel or if our Advisor loses any member of its senior management team, our ability to achieve our investment objective could be significantly harmed.
We depend on the members of senior management of the Advisor, particularly Michael J. Zugay and Jason A. Mehring, Managing Directors of the Advisor, and other key personnel for the identification, final selection, structuring, closing and monitoring of our investments. These employees of the Advisor have critical industry experience and relationships that we rely on to implement our business plan. Our future success depends on the continued service of our Advisor’s senior management team. The departure of any of the members of our Advisor’s senior management or a significant number of the members of its investment team could have a material adverse effect on our ability to achieve our investment objective as well as our business, financial condition or results of operation. As a result, we may not be able to operate our business as we expect, and our ability to compete could be harmed, which could cause our operating results to suffer. There also could be no assurance the Advisor would replicate its historical success.
Our Board of Directors may change our operating policies and strategies without prior notice or stockholder approval, the effect of which may be adverse.
Our Board of Directors has the authority to modify or waive certain of our operating policies and strategies without prior notice and without stockholder approval (except as required by the 1940 Act). However, absent stockholder approval, we may not change the nature of our business so as to cease to be, or withdraw our election as, a BDC. We cannot predict the effect any changes to our current operating policies and strategies would have on our business, operating results or value of our common stock. Nevertheless, the effects could adversely affect our business and impact our ability to make distributions to our stockholders.
18
Our Advisor has the right to resign on 60 days’ notice, and we may not be able to find a suitable replacement within that time, resulting in a disruption in our operations that could adversely affect our business, financial condition and results of operations.
Our Advisor has the right, under our Current Management Agreement, to resign at any time upon not less than 60 days’ written notice, whether we have found a replacement or not. If our Advisor resigns, we may not be able to find a new investment adviser or hire internal management with similar expertise and ability to provide the same or equivalent services on acceptable terms within 60 days, or at all. If we are unable to do so quickly, our operations are likely to experience a disruption, our business, financial condition and results of operations as well as our ability to pay distributions are likely to be adversely affected and the market price of our shares may decline. In addition, the coordination of our internal management and investment activities is likely to suffer if we are unable to identify and reach an agreement with a single institution or group of executives having the expertise possessed by our Advisor and its affiliates. Even if we are able to retain comparable management, whether internal or external, the integration of such management and their lack of familiarity with our investment objective may result in additional costs and time delays that may adversely affect our business, financial condition and results of operations.
In addition to regulatory restrictions that restrict our ability to raise capital, our debt arrangements contain various covenants which, if not complied with, could accelerate repayment of our debt, thereby materially and adversely affecting our liquidity, financial condition and results of operations.
The agreement governing our Credit Facility requires us to comply with certain financial and operational covenants. These covenants include:
|
|
• |
restrictions on the level of indebtedness that we are permitted to incur in relation to the value of our assets; |
|
|
• |
restrictions on our ability to incur liens; and |
|
|
• |
maintenance of a minimum level of stockholders’ equity. |
As of December 31, 2017, we were in compliance with all applicable covenants for our outstanding borrowings. However, our continued compliance with these covenants depends on many factors, some of which are beyond our control. Accordingly, there are no assurances that we will continue to comply with the covenants in our debt arrangements. Failure to comply with these covenants would result in a default under these arrangements which, if we were unable to obtain a waiver from the lenders thereunder, could result in an acceleration of repayments on our debt and thereby have a material adverse impact on our business, financial condition and results of operations.
The disposition of our investments may result in contingent liabilities.
Most of our investments will involve private securities. In connection with the disposition of an investment in private securities, we may be required to make representations about the business and financial affairs of the portfolio company typical of those made in connection with the sale of a business. We may also be required to indemnify the purchasers of such investment to the extent that any such representations turn out to be inaccurate or with respect to certain potential liabilities. These arrangements may result in contingent liabilities that ultimately yield funding obligations that must be satisfied through our return of certain distributions previously made to us. We do not believe contingent liabilities were material at December 31, 2017.
Substantially all of our assets are subject to security interests under our borrowings and if we default on our obligations, we may suffer adverse consequences, including the lenders foreclosing on our assets.
As of December 31, 2017, substantially all of our assets were pledged as collateral under our Credit Facility. If we default on our obligations under these debt facilities, the lenders may have the right to foreclose upon and sell, or otherwise transfer, the collateral subject to their security interests. In such event, we may be forced to sell our investments to raise funds to repay our outstanding borrowings in order to avoid foreclosure and these forced sales may be at times and at prices we would not consider advantageous. Moreover, such deleveraging of our company could significantly impair our ability to effectively operate our business in the manner in which we have historically operated. As a result, we could be forced to curtail or cease new investment activities and lower or eliminate the distributions that we pay to our stockholders.
In addition, if the lenders exercise their right to sell the assets pledged under our borrowings, such sales may be completed at distressed sale prices, thereby diminishing or potentially eliminating the amount of cash available to us after repayment of the amounts outstanding.
19
Our Credit Facility matures in June 5, 2022, and any inability to renew, extend or replace our Credit Facility could adversely impact our liquidity and ability to find new investments or maintain distributions to our stockholders.
We maintain a multi-currency $440 million senior secured credit facility with a group of lenders, under which we had $16 million of indebtedness outstanding at December 31, 2017. Undrawn amount under our Credit Facility was $424 million at December 31, 2017. The Credit Facility’s commitment may increase in size, under certain circumstances, up to a total of $750 million. The Credit Facility has a stated maturity date of June 5, 2022. There can be no assurance that we will be able to renew, extend or replace the Credit Facility upon its maturity on terms that are favorable to us, if at all. Our ability to renew, extend or replace the Credit Facility will be constrained by then-current economic conditions affecting the credit markets. In the event that we are not able to renew, extend or replace the Credit Facility at the time of its maturity, this could have a material adverse effect on our liquidity and ability to fund new investments, our ability to make distributions to our stockholders and our ability to qualify as a RIC.
Our outstanding convertible notes present other risks to holders of our common stock, including the possibility that such notes could discourage an acquisition of us by a third party and accounting uncertainty.
Certain provisions of our outstanding convertible notes could make it more difficult or more expensive for a third party to acquire us. Upon the occurrence of certain transactions constituting a fundamental change, holders of our convertible notes will have the right, at their option, to require us to repurchase all of their notes or any portion of the principal amount of such notes. We may also be required to increase the conversion rate or provide for conversion into the acquirer’s capital stock in the event of certain fundamental changes with respect to our convertible notes. These provisions could discourage an acquisition of us by a third party.
The accounting for convertible debt securities is subject to frequent scrutiny by the accounting regulatory bodies and is subject to change. We cannot predict if or when any such change could be made and any such change could have an adverse impact on our reported or future financial results. Any such impacts could adversely affect the market price of our common stock.
If we incur additional debt, it could increase the risk of investing in our common stock.
We have indebtedness outstanding pursuant to our Credit Facility and may enter into new facilities and/or may increase the size of our existing credit facilities. As of December 31, 2017, we had outstanding approximately $55 million of Convertible Notes, $144 million of 2022 Convertible Notes, and $16 million outstanding on our Credit Facility. Lenders under our Credit Facility, 2022 Convertible Notes and Convertible Notes have fixed dollar claims on our assets that are superior to the claims of our common stockholders or any preferred stockholders. We have granted a security interest in our assets in connection with our Credit Facility.
In the case of a liquidation event, those lenders would receive proceeds before our stockholders. In addition, borrowings, also known as leverage, magnify the potential for gain or loss on amounts invested and, therefore, increase the risks associated with investing in our common stock. Leverage is generally considered a speculative investment technique. If the value of our assets increases, then leveraging would cause the net asset value attributable to our common stock to increase more than it otherwise would have had we not leveraged. Conversely, if the value of our assets decreases, leveraging would cause the net asset value attributable to our common stock to decline more than it otherwise would have had we not leveraged. Similarly, any increase in our revenue in excess of interest expense on our borrowed funds would cause our net income to increase more than it would without the leverage. Any decrease in our revenue would cause our net income to decline more than it would have had we not borrowed funds and could negatively affect our ability to make distributions on our common stock. Our ability to service any debt that we incur depends largely on our financial performance and is subject to prevailing economic conditions and competitive pressures.
As a BDC, we generally are required to meet an asset coverage ratio of total assets to total borrowings and other senior securities, which include all of our borrowings and any preferred stock we may issue in the future, of at least 200%. This means that for every $100 of net assets, we may raise $100 from senior securities, such as borrowings or issuing secured stock. If this ratio declines below 200%, we may not be able to incur additional debt and may need to sell a portion of our investments to repay some debt when it is disadvantageous to do so, and we may not be able to make distributions.
20
Illustration. The following table illustrates the effect of leverage on returns from an investment in our common stock assuming various annual returns, net of expenses. The calculations in the table below are hypothetical and actual returns may be higher or lower than those appearing below. The calculation is based on our level of borrowing at December 31, 2017, which represented borrowings equal to 26.9% of our total assets. On such date, we also had $799.9 million in total assets; an average cost of funds of 5.0%; $214.8 million in principal amount of debt outstanding; and $571.1 million of total net assets. In order to compute the “Corresponding Return to Common Stockholders,” the “Assumed Return on Portfolio (Net of Expenses Other than Interest)” is multiplied by the total value of our assets at December 31, 2017 to obtain an assumed return to us. From this amount, the interest expense calculated by multiplying the interest rate of 5.0% by the $214.8 million in principal amount of debt outstanding is subtracted to determine the return available to stockholders. The return available to stockholders is then divided by the total value of our net assets at December 31, 2017 to determine the “Corresponding Return to Common Stockholders.” Actual interest payments may be different.
|
Assumed Return on Portfolio (Net of Expenses Other than Interest)(1) |
|
|
-10% |
|
|
|
-5% |
|
|
|
0% |
|
|
|
5% |
|
|
|
10% |
|
|
Corresponding Return to Common Stockholders |
|
|
-15.9 |
% |
|
|
-8.9 |
% |
|
|
-1.9 |
% |
|
|
5.1 |
% |
|
|
12.1 |
% |
|
(1) |
The assumed portfolio return in the table is based on SEC regulations and is not a prediction of, and does not represent, our projected or actual performance. The table also assumes that we will maintain a constant level of leverage. The amount of leverage that we use will vary from time to time. |
Our use of borrowed funds to make investments exposes us to risks typically associated with leverage.
We borrow money and may issue additional debt securities or preferred stock to leverage our capital structure. As a result:
|
|
• |
shares of our common stock are exposed to incremental risk of loss; therefore, a decrease in the value of our investments would have a greater negative impact on the value of our common shares than if we did not use leverage; |
|
|
• |
adverse changes in interest rates could reduce or eliminate the incremental income we make with the proceeds of any leverage; |
|
|
• |
our ability to make distributions on our common stock will be restricted if our asset coverage ratio is not at least 200% and any amounts used to service indebtedness or preferred stock may not be available for such distributions; |
|
|
• |
such securities are governed by an indenture or other instrument containing covenants restricting our operating flexibility; |
|
|
• |
we, and indirectly our stockholders, bear the cost of issuing and paying interest or making distributions on such securities; and |
|
|
• |
any convertible or exchangeable securities that we issue may have rights, preferences and privileges more favorable than those of our common stock. |
We may not make distributions and consequently will be subject to corporate-level income tax.
We intend to make distributions on a quarterly basis to our stockholders out of assets legally available for distribution. We may not be able to achieve operating results that will allow us to make distributions at a specific level or to increase the amount of these distributions from time to time. In addition, due to the asset coverage test applicable to us as a BDC, we may be limited in our ability to make distributions. Also, restrictions and provisions in our existing and any future debt arrangements may limit our ability to make distributions. If we do not distribute a certain percentage of our income annually, we could fail to qualify for tax treatment as a RIC, and we would be subject to corporate-level federal income tax. We cannot assure you that you will receive distributions at a particular level or at all.
A portion of our distributions to stockholders may include a return of stockholder capital.
We intend to make distributions on a quarterly basis to our stockholders out of assets legally available for distribution. A portion of such distributions may include a return of stockholder capital. Distributions in excess of our current and accumulated earnings and profits are considered non-taxable distributions and serve to reduce the basis of our shares in the hands of the common stockholders rather than being currently taxable, and as a result of the reduction of the basis of our shares, common shareholders may incur additional capital gains taxes or may have lower capital losses.
21
We may have difficulty paying our required distributions if we recognize income before or without receiving cash representing such income.
In accordance with U.S. generally accepted accounting principles, or GAAP, and tax regulations, we include in income certain amounts that we have not yet received in cash, such as PIK interest, which represents contractual interest added to the loan balance and due at the end of the loan term. The increases in loan balances as a result of contracted PIK arrangements are included in income for the period in which such PIK interest was received, which is often in advance of receiving cash payment. We also may be required to include in income certain other amounts that we will not receive in cash. Any warrants that we receive in connection with our debt investments are generally valued as part of the negotiation process with the particular portfolio company. As a result, a portion of the aggregate purchase price for the debt investments and warrants are allocated to the warrants that we receive. This will generally result in “original issue discount,” or OID, for tax purposes, which we must recognize as ordinary income, increasing the amounts we are required to distribute to qualify for the federal income tax benefits applicable to RICs. Because such original issue discount income would not be accompanied by cash, we would need to obtain cash from other sources to satisfy such distribution requirements. If we are unable to obtain cash from other sources to satisfy such distribution requirements, we may fail to qualify for favorable tax treatment as a RIC and, thus, could become subject to a corporate-level income tax on all of our income. Other features of the debt instruments that we hold may also cause such instruments to generate original issue discount, resulting in a distribution requirement in excess of current cash received. Similarly, newly enacted tax legislation contains rules that may in certain other circumstances require the recognition of non-cash taxable income or may limit the deductibility of certain of our cash expenses. Since in certain cases we may recognize income before or without receiving cash representing such income or may be subject to limitations on the deductibility of cash expenses, we may have difficulty meeting the requirement to distribute at least 90% of our net ordinary income and realized net short-term capital gains in excess of realized net long-term capital losses, if any. If we are unable to meet these distribution requirements, we will not qualify for favorable tax treatment as a RIC or, even if such distribution requirements are satisfied, we may be subject to tax on the amount that is undistributed. Accordingly, we may have to sell some of our assets, raise additional debt or equity capital or reduce new investment originations to meet these distribution requirements and avoid tax.
To the extent OID and PIK interest constitute a portion of our income, we will be exposed to typical risks associated with such income being required to be included in taxable and accounting income prior to receipt of cash representing such income.
Our investments may include OID instruments and PIK interest arrangements, which represents contractual interest added to a loan balance and due at the end of such loan’s term. To the extent OID or PIK interest constitute a portion of our income, we are exposed to typical risks associated with such income being required to be included in taxable and accounting income prior to receipt of cash, including the following:
|
|
• |
The higher interest rates of OID and PIK instruments reflect the payment deferral and increased credit risk associated with these instruments, and OID and PIK instruments generally represent a significantly higher credit risk than coupon loans. |
|
|
• |
Even if the accounting conditions for income accrual are met, the borrower could still default when our actual collection is supposed to occur at the maturity of the obligation. |
|
|
• |
OID and PIK instruments may have unreliable valuations because their continuing accruals require continuing judgments about the collectability of the deferred payments and the value of any associated collateral. OID and PIK income may also create uncertainty about the source of our cash distributions. |
|
|
• |
For accounting purposes, any cash distributions to shareholders representing OID and PIK income are not treated as coming from paid-in capital, even if the cash to pay them comes from offering proceeds. As a result, despite the fact that a distribution representing OID and PIK income could be paid out of amounts invested by our stockholders, the 1940 Act does not require that stockholders be given notice of this fact by reporting it as a return of capital. |
|
|
• |
PIK interest has the effect of generating investment income at a compounding rate, thereby further increasing the Incentive Fees payable to the Advisor. Similarly, all things being equal, the deferral associated with PIK interest also decreases the loan-to-value ratio at a compounding rate. |
Because we are required to distribute substantially all of our net investment income and net realized capital gains to our stockholders, we will continue to need additional capital to finance our growth.
We have elected to be treated for federal income tax purposes as a RIC under Subchapter M of the Code. If we can meet certain requirements, including source of income, asset diversification and distribution requirements, and if we continue to qualify as a BDC, we will continue to qualify to be a RIC under the Code and will not have to pay corporate-level taxes on income we distribute to our stockholders, allowing us to substantially reduce or eliminate our corporate-level tax liability. As a BDC, we are generally required to meet a coverage ratio of total assets to total senior securities, which includes all of our borrowings and any preferred stock we may issue in the future, of at least 200%. This requirement limits the amount that we may borrow. Because we will continue to need capital to grow our investment portfolio, this limitation may prevent us from incurring debt and require us to raise additional equity at a time when it may be disadvantageous to do so. We cannot assure you that debt and equity financing will be available to us on favorable terms, if at all, and
22
debt financings may be restricted by the terms of any of our outstanding borrowings. In addition, as a BDC, we are generally not permitted to issue equity securities priced below net asset value without stockholder approval. If additional funds are not available to us, we could be forced to curtail or cease new lending and investment activities, and our net asset value and profitability could decline.
Any unrealized losses we experience on our investment portfolio may be an indication of future realized losses, which could reduce our income available for distribution.
Decreases in the market values or fair values of our investments will be recorded as unrealized depreciation. Any unrealized losses in our investment portfolio could be an indication of a portfolio company’s inability to meet its repayment obligations to us with respect to the affected investments. This could result in realized losses in the future and ultimately in reductions of our income available for distribution in future periods.
If we fail to maintain an effective system of internal control over financial reporting, we may not be able to accurately report our financial results or prevent fraud. As a result, stockholders could lose confidence in our financial and other public reporting, which would harm our business and the trading price of our common stock.
Effective internal controls over financial reporting are necessary for us to provide reliable financial reports and, together with adequate disclosure controls and procedures, are designed to prevent fraud. Any failure to implement required new or improved controls, or difficulties encountered in their implementation could cause us to fail to meet our reporting obligations. In addition, any testing by us conducted in connection with Section 404 of the Sarbanes-Oxley Act, or the subsequent testing by our independent registered public accounting firm (when undertaken, as noted below), may reveal deficiencies in our internal controls over financial reporting that are deemed to be material weaknesses or that may require prospective or retroactive changes to our consolidated financial statements or identify other areas for further attention or improvement. Inferior internal controls could also cause investors and lenders to lose confidence in our reported financial information, which could have a negative effect on the trading price of our common stock.
Our Advisor and its affiliates and employees may have certain conflicts of interest.
The Advisor, its employees and members of the Investment Committee serve or may serve as investment advisers, officers, directors or principals of entities or investment funds that operate in the same or a related line of business as us and/or of investment funds managed by our affiliates. Accordingly, these individuals may have obligations to investors in those entities or funds, the fulfillment of which might not be in our best interests or the best interests of our stockholders. In addition, we note that any affiliated investment vehicle currently formed or formed in the future and managed by the Advisor or its affiliates may have overlapping investment objectives with our own and, accordingly, may invest in asset classes similar to those targeted by us. As a result, the Advisor and/or its affiliates may face conflicts in allocating investment opportunities between us and such other entities. Although the Advisor and its affiliates will endeavor to allocate investment opportunities in a fair and equitable manner and consistent with applicable allocation procedures, it is possible that, in the future, we may not be given the opportunity to participate in investments made by investment funds managed by the Advisor or its affiliates. In any such case, if the Advisor forms other affiliates in the future, we may co-invest on a concurrent basis with such other affiliates, subject to compliance with applicable regulations and regulatory guidance, as well as applicable allocation procedures. In certain circumstances, negotiated co-investments may be made only if we receive an order from the SEC permitting us to do so. There can be no assurance when any such order would be obtained or that one will be obtained at all.
BlackRock, the ultimate parent company of the Advisor, and its affiliates, which include the Advisor and PNC, are involved worldwide with a broad spectrum of financial services and asset management activities and may engage in the ordinary course of business in activities in which their interests or the interests of their clients may conflict with our interests. BlackRock and its affiliates may provide investment management services to other funds and discretionary managed accounts that follow an investment program similar to ours. BlackRock and its affiliates intend to engage in such activities and may receive compensation from third parties for their services. Neither BlackRock nor its affiliates are under any obligation to share any investment opportunity, idea or strategy with us. As a result, BlackRock and its affiliates may compete with us for appropriate investment opportunities. The results of our investment activities, therefore, may differ from those of an affiliate or another account managed by an affiliate of BlackRock and it is possible that we could sustain losses during periods in which one or more affiliates of BlackRock and other accounts achieve profits on their trading for proprietary or other accounts. The 1940 Act imposes limitations on certain transactions between a business development company, a registered investment company and affiliated persons of the business development company or registered investment company, as well as affiliated persons of such affiliated persons. Among others, affiliated persons of a business development company or registered investment company include its investment adviser; officers; directors/trustees; any person who directly or indirectly controls, is controlled by or is under common control with such business development company or registered investment company; any person directly or indirectly owning, controlling or holding with power to vote, five percent or more of the outstanding voting securities of such business development or registered investment company; and any person five percent or more of whose outstanding voting securities are directly or indirectly owned, controlled or held with power to vote by such business development company or registered investment company. BlackRock has adopted policies and procedures designed to address potential conflicts of interest.
23
Our base management fee may induce our Advisor to cause us to incur additional leverage.
Our base management fee is calculated on the basis of total assets (excluding cash) including assets acquired with the proceeds of leverage. This may encourage the Advisor to use leverage to increase the aggregate amount of and the return on our investments, even when it may not be appropriate to do so, and to refrain from de-levering when it would otherwise be appropriate to do so. Under certain circumstances, the use of increased leverage may increase the likelihood of default, which would impair the value of our common stock. Given the subjective nature of the investment decisions made by our Adviser on our behalf, we will not be able to monitor this conflict of interest.
Our Incentive Fee structure and the formula for calculating the Incentive Fee may incentivize our Advisor to pursue speculative investments.
The Incentive Fee payable by us to the Advisor may create an incentive for the Advisor to pursue investments on our behalf that are riskier or more speculative than would otherwise be the case in the absence of such compensation arrangement. The Incentive Fee payable to the Advisor is calculated based on a percentage of distributions on our common stock. The Incentive Fee payable by us to the Advisor also may induce the Advisor to invest on our behalf in instruments that have a deferred interest feature, even if such deferred payments would not provide cash necessary to enable us to pay current distributions to our stockholders. Under these investments, we would accrue interest over the life of the investment but would not receive the cash income from the investment until the end of the term, if at all. Our net investment income used to calculate the income portion of our Incentive Fee, however, will include accrued interest. Thus, a portion of this Incentive Fee would be based on income that we have not yet received in cash and may never receive in cash if the portfolio company is unable to satisfy such interest payment obligation to us. The foregoing risks could be increased because the Advisor is not obligated to reimburse us for any Incentive Fee received even if we subsequently incur losses or never receive in cash income that was previously accrued.
We are not managed by BlackRock, but rather one of its subsidiaries and may not replicate the success of that entity.
Our performance may be lower or higher than the performance of other entities managed by BlackRock or its affiliates and their past performance is no guarantee of our future results.
We may not replicate the success of BlackRock.
Our investment strategies differ from those of BlackRock or its affiliates. As a BDC, we are subject to certain investment restrictions that do not apply to BlackRock. Our performance may be lower or higher than the performance of other entities managed by BlackRock or its affiliates and their past performance is no guarantee of our future results.
Our business model depends upon the development and maintenance of strong referral relationships with other asset managers and investment banking firms.
We are substantially dependent on our informal relationships, which we use to help identify and gain access to investment opportunities. If we fail to maintain our relationships with key firms, or if we fail to establish strong referral relationships with other firms or other sources of investment opportunities, we will not be able to grow our portfolio of investments and achieve our investment objective. In addition, persons with whom we have informal relationships are not obligated to inform us of investment opportunities, and therefore such relationships may not lead to the origination of equity or other investments. Any loss or diminishment of such relationships could effectively reduce our ability to identify attractive portfolio companies that meet our investment criteria, either for direct investments or for investments through private secondary market transactions or other secondary transactions.
Our Advisor’s liability is limited under the investment management agreement, and we are required to indemnify our Advisor against certain liabilities, which may lead our Advisor to act in a riskier manner on our behalf than it would when acting for its own account.
Our Advisor has not assumed any responsibility to us other than to render the services described in the investment management agreement, and it will not be responsible for any action of our Board of Directors in declining to follow our Advisor’s advice or recommendations. Pursuant to the investment management agreement, our Advisor and its members and their respective officers, managers, partners, agents, employees, controlling persons and members and any other person or entity affiliated with it will not be liable to us for their acts under the investment management agreement, absent willful misfeasance, bad faith, gross negligence or reckless disregard in the performance of their duties. We have agreed to indemnify, defend and protect our Advisor and its members and their respective officers, managers, partners, agents, employees, controlling persons and members and any other person or entity affiliated with it with respect to all damages, liabilities, costs and expenses resulting from acts of our Advisor not arising out of willful
24
misfeasance, bad faith, gross negligence or reckless disregard in the performance of their duties under the investment and management agreement. These protections may lead our Advisor to act in a riskier manner when acting on our behalf than it would when acting for its own account.
We may not replicate the historical performance of other investment companies and funds with which our investment professionals have been affiliated.
The 1940 Act imposes numerous constraints on the investment activities of BDCs. For example, BDCs are required to invest at least 70% of their total assets primarily in securities of U.S. private companies or thinly traded public companies (public companies with a market capitalization of less than $250 million), cash, cash equivalents, U.S. government securities and high-quality debt investments that mature in one year or less. These constraints may hinder our Advisor’s ability to take advantage of attractive investment opportunities and to achieve our investment objectives. In addition, the investment philosophy and techniques used by our Advisor may differ from those used by other investment companies and funds advised by our Advisor. Accordingly, we can offer no assurance that we will replicate the historical performance of other investment companies and funds with which our investment professionals have been affiliated, and we caution that our investment returns could be substantially lower than the returns achieved by such other companies.
Substantially all of our portfolio investments are recorded at fair value as determined in good faith by or under the direction of our Board of Directors and, as a result, there is uncertainty regarding the value of our portfolio investments.
There is not a readily available market value for substantially all of the investments in our portfolio. We value these investments quarterly at fair value as determined in good faith under the direction of our Board of Directors using a consistently applied valuation process in accordance with a documented valuation policy that has been reviewed and approved by our Board of Directors. Our Board of Directors utilizes the services of one or more independent valuation firms to aid in determining the fair value of these investments. Due to the inherent uncertainty and subjectivity of determining the fair value of investments that do not have a readily available market value, the fair value of our investments may differ significantly from the values that would have been used had a readily available market value existed for such investments and may differ materially from the amounts we realize on any dispositions of such investments. In addition, the impact of changes in the market environment and other events on the fair values of our investments that have no readily available market values may differ from the impact of such changes on the readily available market values for our other investments. Our net asset value could be adversely affected if our determinations regarding the fair value of our investments were materially higher than the values that we ultimately realize upon the disposal of such investments.
We may in the future determine to fund a portion of our investments by issuing preferred stock, which would magnify the potential gains or losses and the risks of investing in us in the same manner as our borrowings.
Preferred stock, which is another form of leverage, has the same risks to our common stockholders as borrowings because the dividends on any preferred stock we issue must be cumulative. Payment of such dividends and repayment of the liquidation preference of such preferred stock must take preference over any dividends or other payments to our common stockholders and preferred stockholders are not subject to any of our expenses or losses, and are not entitled to participate in any income or appreciation in excess of their stated preference. Additionally, if signed into law, the Financial Choice Act would decrease the asset coverage requirement for BDCs to 150 percent from 200 percent under certain circumstances. Other BDCs may be better positioned to take advantage of such changes, potentially leaving the Company at a competitive disadvantage.
The issuance of shares of preferred stock with dividend or conversion rights, liquidation preferences or other economic terms favorable to the holders of preferred stock could adversely affect the market price for our common stock by making an investment in the common stock less attractive. In addition, the dividends on any preferred stock we issue must be cumulative. Payment of dividends and repayment of the liquidation preference of preferred stock must take preference over any dividends or other payments to our common stockholders, and holders of preferred stock are not subject to any of our expenses or losses and are not entitled to participate in any income or appreciation in excess of their stated preference (other than convertible preferred stock that converts into common stock). In addition, under the 1940 Act, preferred stock constitutes a “senior security” for purposes of the 200% asset coverage test.
We may experience fluctuations in our periodic results.
We could experience fluctuations in our periodic results due to a number of factors, some of which are beyond our control, including our ability to make investments in companies that meet our investment criteria, the interest rates payable on the debt investments we make, the default rate on such investments, the level of our expenses (including the interest rates payable on our borrowings and the dividend rates on any preferred stock we may issue), variations in and the timing of the recognition of realized and unrealized gains or losses, the degree to which we encounter competition in our markets and general economic conditions. As a result of these factors, results for any period should not be relied upon as being indicative of performance in future periods.
25
Changes in interest rates may affect our cost of capital and net investment income.
General interest rate fluctuations may have a substantial negative impact on our investments, the value of our common stock and our rate of return on invested capital. A reduction in the interest rates on new investments relative to interest rates on current investments could also have an adverse impact on our net investment income. An increase in interest rates could decrease the value of any investments we hold which earn fixed interest rates, including subordinated loans, senior and junior secured and unsecured debt securities and loans and high-yield bonds, and also could increase our interest expense, thereby decreasing our net investment income. Also, an increase in interest rates available to investors could make investment in our common stock less attractive if we are not able to increase our distributions rate, which could reduce the value of our common stock.
Increased geopolitical unrest, terrorist attacks, or acts of war may affect any market for our common stock, impact the businesses in which we invest, and harm our business, operating results, and financial conditions.
Terrorist activity and the continued threat of terrorism and acts of civil or international hostility, both within the United States and abroad, as well as ongoing military and other actions and heightened security measures in response to these types of threats, may cause significant volatility and declines in the global markets, loss of life, property damage, disruptions to commerce and reduced economic activity, which may negatively impact the businesses in which we invest directly or indirectly and, in turn, could have a material adverse impact on our business, operating results, and financial condition. Losses from terrorist attacks are generally uninsurable.
The downgrade of the U.S. credit rating, economic crisis in Europe, turbulence in the Chinese stock market and global commodity markets or otherwise could negatively impact our business, financial condition and earnings.
Although U.S. lawmakers passed legislation to raise the federal debt ceiling and Standard & Poor’s Ratings Services affirmed its ‘AA+’ long-term sovereign credit rating on the United States and revised the outlook on the long-term rating from negative to stable in June of 2013, U.S. debt ceiling and budget deficit concerns together with signs of deteriorating sovereign debt conditions in Europe continue to present the possibility of a credit-rating downgrade, economic slowdowns, or a recession for the United States. The impact of any further downgrades to the U.S. government’s sovereign credit rating or downgraded sovereign credit ratings of European countries or the Russian Federation, or their perceived creditworthiness could adversely affect the U.S. and global financial markets and economic conditions. These developments, along with any further European sovereign debt issues, could cause interest rates and borrowing costs to rise, which may negatively impact our ability to access the debt markets on favorable terms. Continued adverse economic conditions could have a material adverse effect on our business, financial condition and results of operations.
In 2010, a financial crisis emerged in Europe, triggered by high budget deficits and rising direct and contingent sovereign debt in Greece, Ireland, Italy, Portugal and Spain, which created concerns about the ability of these nations to continue to service their sovereign debt obligations. While the financial stability of many of such countries has improved significantly, risks resulting from any future debt crisis in Europe or any similar crisis could have a detrimental impact on the global economic recovery, sovereign and non-sovereign debt in these countries and the financial condition of European financial institutions. In July and August 2015, Greece reached agreements with its international creditors for bailouts that provide aid in exchange for austerity terms that had previously been rejected by Greek voters. Market and economic disruptions have affected, and may in the future affect, consumer confidence levels and spending, personal bankruptcy rates, levels of incurrence and default on consumer debt and home prices, among other factors. We cannot assure you that market disruptions in Europe, including the increased cost of funding for certain governments and financial institutions, will not impact the global economy, and we cannot assure you that assistance packages will be available, or if available, be sufficient to stabilize countries and markets in Europe or elsewhere affected by a financial crisis. To the extent uncertainty regarding any economic recovery in Europe negatively impacts consumer confidence and consumer credit factors, our business, financial condition and results of operations could be significantly and adversely affected.
In addition, stock prices in China have experienced a significant drop in the second quarter of 2015, resulting primarily from continued sell-off of shares trading in Chinese markets. In August 2015, Chinese authorities sharply devalued China’s currency. The volatility has been followed by volatility in stock markets around the world, including in the United States, as well as increased turbulence in commodity markets, such as reductions in prices of crude oil. Continued sell-off and price drops in the Chinese stock markets may have a contagion effect across the financial markets. These market and economic disruptions affected, and may in the future affect, the U.S. capital markets, which could adversely affect our business.
26
Additionally, Russian intervention in Ukraine during 2014 significantly increased regional geopolitical tensions. The situation remains fluid with potential for further escalation of geopolitical tensions, increased severity of sanctions against Russian interests, and possible Russian counter-measures. Further economic sanctions could destabilize the economic environment and result in increased volatility. Should the economic recovery in the United States be adversely impacted by increased volatility in the global financial markets caused by developments in respect of the Russian sanctions, further turbulence in Chinese stock markets and global commodity markets or for any other reason, loan and asset growth and liquidity conditions at U.S. financial institutions, including us, may deteriorate.
In October 2014, the Federal Reserve announced that it was concluding its bond-buying program, or quantitative easing, which was designed to stimulate the economy and expand the Federal Reserve’s holdings of long-term securities, suggesting that key economic indicators, such as the unemployment rate, had showed signs of improvement since the inception of the program. It is unclear what effect, if any, the conclusion of the Federal Reserve’s bond-buying program will have on credit markets and the value of our investments. However, it is possible that, without quantitative easing by the Federal Reserve, these developments, along with the United States government’s credit and deficit concerns and the European sovereign debt crisis, could cause interest rates and borrowing costs to rise, which may negatively impact our ability to access the debt markets on favorable terms. The Federal Reserve raised the Federal Funds Rate three times in 2017, and it may continue to raise the Federal Funds Rate over time. These developments, along with the United States government's credit and deficit concerns, the European sovereign debt crisis and the economic slowdown in China, could cause interest rates to be volatile, which may negatively impact our ability to access the debt markets on favorable terms.
As of December 31, 2017, the Trump administration has called for significant changes to U.S. trade, healthcare, immigration, foreign, and government regulatory policy. In this regard, there is significant uncertainty with respect to legislation, regulation and government policy at the federal level, as well as the state and local levels. Recent events have created a climate of heightened uncertainty and introduced new and difficult-to-quantify macroeconomic and political risks with potentially far-reaching implications. There has been a corresponding meaningful increase in the uncertainty surrounding interest rates, inflation, foreign exchange rates, trade volumes and fiscal and monetary policy. To the extent the U.S. Congress or Trump administration implements changes to U.S. policy, those changes may impact, among other things, the U.S. and global economy, international trade and relations, unemployment, immigration, corporate taxes, healthcare, the U.S. regulatory environment, inflation and other areas. Some particular areas identified as subject to potential change, amendment or repeal include the Dodd–Frank Wall Street Reform and Consumer Protection Act (the “Dodd-Frank Act”), including the Volcker Rule and various swaps and derivatives regulations, credit risk retention requirements and the authorities of the Federal Reserve, the Financial Stability Oversight Council and the SEC. Although we cannot predict the impact, if any, of these changes to our business, they could adversely affect our business, financial condition, operating results and cash flows. Until we know what policy changes are made and how those changes impact our business and the business of our competitors over the long term, we will not know if, overall, we will benefit from them or be negatively affected by them.
On February 3, 2017, President Trump signed Executive Order 13772 announcing the new Administration's policy to regulate the U.S. financial system in a manner consistent with certain "Core Principles," including regulation that is efficient, effective and appropriately tailored. The Executive Order directed the Secretary of the Treasury, in consultation with the heads of the member agencies of the Financial Stability Oversight Council, to report to the President on the extent to which existing laws, regulations and other government policies promote the Core Principles and to identify government policies that inhibit financial regulation consistent with them. On June 12, 2017, the U.S. Department of the Treasury published the first of four reports in response to the Executive Order on the depository system covering banks and other savings institutions. Subsequent reports are expected to address: capital markets; the asset management and insurance industries, and retail and institutional investment products and vehicles; and non-bank financial institutions, financial technology, and financial innovation. The report included recommendations to reduce fragmentation, overlap, and duplication in the U.S. regulatory structure; to decrease the burden of statutory stress testing and ease liquidity and leverage standards for domestic banks; to restructure the Consumer Financial Protection Bureau; to reduce compliance burdens under the Volcker Rule; to reconsider the implications of implementing the revised standards for credit risk under Basel III; and to require uniform, consistent and rigorous methods to analyze costs and benefits, increase transparency and make available for public comment cost-benefit analyses for all "economically significant" proposed regulations.
On June 8, 2017, the U.S. House of Representatives passed the Financial Choice Act, which includes legislation intended to repeal or replace substantial portions of the Dodd-Frank Act. Among other things, the proposed law would repeal the Volcker Rule limiting certain proprietary investment and trading activities by banks, eliminate the authority of regulators to designate asset managers and other large non-bank institutions as "systemically important financial institutions," and repeal the Department of Labor (DOL) "fiduciary rule" governing standards for dealing with retirement plans until the SEC issues standards for similar dealings by broker-dealers and limiting the substance of any subsequent DOL rule to the SEC standards. The bill must be approved by the Senate, where we believe it is unlikely to pass in its current form. At this time it is unclear what impact the Administration's policies in response to the Executive Order, the Financial Choice Act or other pending legislation and developments will have on regulations that affect our and our competitors' and our portfolio companies' businesses.
27
On December 22, 2017, The Tax Cuts and Jobs Act (the “2017 Tax Act”) was enacted that, among other things, significantly changes the taxation of business entities, the deductibility of certain items of loss and expense, and the timing in which certain income items are recognized. We cannot predict the impact, if any, of these changes to our business or the business of the portfolio companies in which we invest. Until we can evaluate how these changes impact our business and the business of our portfolio companies over the long term, we will not know if, overall, we will benefit from them or be negatively affected by them.
A cyber-attack or a failure to implement effective information and cybersecurity policies, procedures and capabilities could disrupt operations and cause financial losses that may have a material adverse effect on our business, results of operations and financial condition.
We are dependent on the effectiveness of the information and cybersecurity policies, procedures and capabilities maintained by our Advisor and other service providers to protect their computer and telecommunications systems and the data that reside on or are transmitted through them. An externally caused information security incident, such as a hacker attack, virus, phishing scam or worm, or an internally caused issue, such as failure to control access to sensitive systems, could materially interrupt business operations or cause disclosure or modification of sensitive or confidential client or competitive information. Moreover, our Advisor’s and other service providers’ increased use of mobile and cloud technologies could heighten these and other operational risks as certain aspects of the security of such technologies may be complex, unpredictable or beyond their control. Our Advisor’s and other service providers’ reliance on mobile or cloud technology or any failure by mobile technology and cloud service providers to adequately safeguard their systems and prevent cyber-attacks could disrupt their operations and result in misappropriation, corruption or loss of personal, confidential or proprietary information. In addition, there is a risk that encryption and other protective measures may be circumvented, particularly to the extent that new computing technologies increase the speed and computing power available.
There have been a number of recent highly publicized cases involving financial services and consumer-based companies reporting the unauthorized disclosure of client or customer information, as well as cyber-attacks involving the dissemination, theft and destruction of corporate information or other assets, as a result of failure to follow procedures by employees or contractors or as a result of actions by third parties, including actions by terrorist organizations and hostile foreign governments.
Our Advisor has been the target of attempted cyber-attacks, as well as the co-opting of its brand to create fraudulent websites, and must continuously monitor and develop its systems to protect its technology infrastructure and data from misappropriation or corruption, as the failure to do so could disrupt our Advisor’s operations and cause financial losses. Although our Advisor takes protective measures and endeavors to strengthen its computer systems, software, technology assets and networks to prevent and address potential cyber-attacks, there can be no assurance that any of these measures prove effective. Moreover, due to the complexity and interconnectedness of our Advisor’s systems, the process of upgrading or patching our Advisor’s protective measures could itself create a risk of security issues or system disruptions for the Company, as well as for external stakeholders who rely upon, or have exposure to, our Advisor’s systems.
In addition, due to our Advisor’s and other service providers’ interconnectivity with third-party vendors, central agents, exchanges, clearing houses and other financial institutions, our Advisor and other service providers may be adversely affected if any of them are subject to a successful cyber-attack or other information security event, including those arising due to the use of mobile and cloud technologies.
Our Advisor and other service providers also routinely transmit and receive personal, confidential or proprietary information by email and other electronic means. Our Advisor and other service providers collaborate with clients, vendors and other third parties to develop secure transmission capabilities and protect against cyber-attacks. However, our Advisor or our other service providers cannot ensure that they or such third parties have all appropriate controls in place to protect the confidentiality of such information.
Any information security incident or cyber-attack against our Advisor, our other service providers or third parties with whom they are connected, including any interception, mishandling or misuse of personal, confidential or proprietary information, could result in material financial loss, loss of competitive position, regulatory fines and/or sanctions, breach of client contracts, reputational harm or legal liability, which, in turn, may have a material adverse effect on our business, results of operations and financial condition.
The failure in cyber-security systems, as well as the occurrence of events unanticipated in our disaster recovery systems and management continuity planning could impair our ability to conduct business effectively.
The occurrence of a disaster such as a cyber-attack, a natural catastrophe, an industrial accident, a terrorist attack or war, events unanticipated in our disaster recovery systems, or a support failure from external providers, could have an adverse effect on our ability to conduct business and on our results of operations and financial condition, particularly if those events affect our computer-based data processing, transmission, storage, and retrieval systems or destroy data. If a significant number of our managers were unavailable in the event of a disaster, our ability to effectively conduct our business could be severely compromised.
28
We depend heavily upon computer systems to perform necessary business functions. Despite our implementation of a variety of security measures, our computer systems could be subject to cyber-attacks and unauthorized access, such as physical and electronic break-ins or unauthorized tampering. Like other companies, we may experience threats to our data and systems, including malware and computer virus attacks, unauthorized access, system failures and disruptions. If one or more of these events occurs, it could potentially jeopardize the confidential, proprietary and other information processed and stored in, and transmitted through, our computer systems and networks, or otherwise cause interruptions or malfunctions in our operations, which could result in damage to our reputation, financial losses, litigation, increased costs, regulatory penalties and/or customer dissatisfaction or loss.
We are dependent on information systems and systems failures could significantly disrupt our business, which may, in turn, negatively affect the market price of our common stock and our ability to pay dividends.
Our business is dependent on our and third parties’ communications and information systems. Any failure or interruption of those systems, including as a result of the termination of an agreement with any third-party service providers, could cause delays or other problems in our activities. Our financial, accounting, data processing, backup or other operating systems and facilities may fail to operate properly or become disabled or damaged as a result of a number of factors including events that are wholly or partially beyond our control and adversely affect our business. There could be:
|
|
• |
sudden electrical or telecommunications outages; |
|
|
• |
natural disasters such as earthquakes, tornadoes and hurricanes; |
|
|
• |
disease pandemics; |
|
|
• |
events arising from local or larger scale political or social matters, including terrorist acts; and |
|
|
• |
cyber-attacks. |
These events, in turn, could have a material adverse effect on our operating results and negatively affect the market price of our common stock and our ability to pay dividends to our stockholders.
Risks Related to Our Investments
Our investments are risky and highly speculative, and we could lose all or part of our investment.
Investing in private middle-market companies involves a high degree of risk and our financial results may be affected adversely if one or more of our significant portfolio investments defaults on its loans or fails to perform as we expect. We invest primarily in middle-market companies in the form of senior and junior secured and unsecured debt securities and loans, each of which may include an equity component, and by making direct preferred, common and other equity investments in such companies.
Investing in private middle-market companies involves a number of significant risks, including that these companies:
|
|
• |
may have limited financial resources and may be unable to meet their obligations under their debt securities that we hold, which may be accompanied by a deterioration in the value of any collateral and a reduction in the likelihood of us realizing any guarantees we may have obtained in connection with our investment; |
|
|
• |
typically have shorter operating histories, narrower product lines and smaller market shares than larger businesses, which tend to render them more vulnerable to competitors’ actions and market conditions, as well as general economic downturns; |
|
|
• |
are more likely to depend on the management talents and efforts of a small group of persons; therefore, the death, disability, resignation or termination of one or more of these persons could have a material adverse impact on our portfolio company and, in turn, on us; |
|
|
• |
generally have less predictable operating results, may from time to time be parties to litigation, may be engaged in rapidly changing businesses with products subject to a substantial risk of obsolescence, and may require substantial additional capital to support their operations, finance expansion or maintain their competitive position; |
|
|
• |
may have difficulty accessing the capital markets to meet future capital needs, which may limit their ability to grow or to repay their outstanding indebtedness upon maturity; |
|
|
• |
may name our executive officers, directors and the Advisor, in the ordinary course of business, as defendants in litigation arising from our investments in the portfolio companies; |
29
|
|
• |
may be adversely affected by changes in laws and regulations, as well as their interpretations, which may adversely affect the business, financial structure or prospects of these companies; and |
|
|
• |
may have difficulty accessing the capital markets to meet future capital needs. |
In addition, in the course of providing significant managerial assistance to certain of our portfolio companies, certain of our officers and directors may serve as directors on the boards of such companies. To the extent that litigation arises out of our investments in these companies, our officers and directors may be named as defendants in such litigation, which could result in an expenditure of funds (through our indemnification of such officers and directors) and the diversion of management time and resources.
Because our investments are generally not in publicly traded securities, there will be uncertainty regarding the value of our investments, which could adversely affect the determination of our net asset value.
Our portfolio investments will generally not be in publicly traded securities. As a result, although we expect that some of our equity investments may trade on private secondary marketplaces, the fair value of our direct investments in portfolio companies will often not be readily determinable. Under the 1940 Act, for our investments for which there are no readily available market quotations, including securities that while listed on a private securities exchange, have not actively traded, we will value such securities at fair value quarterly as determined in good faith by or under the direction of our Board of Directors. In connection with that determination, members of our Advisor’s portfolio management team will prepare portfolio company valuations using, where available, the most recent portfolio company financial statements and forecasts. The Board of Directors utilizes the services of independent valuation firms, which prepare valuations for each of our portfolio investments that are not publicly traded or for which we do not have readily available market quotations, including securities that while listed on a private securities exchange, have not actively traded. However, the Board of Directors retains ultimate authority as to the appropriate valuation of each such investment. The types of factors that the Board of Directors takes into account in determining fair value with respect to such non-traded investments includes, as relevant and, to the extent available, the portfolio company’s earnings, the markets in which the portfolio company does business, comparison to valuations of publicly traded companies, comparisons to recent sales of comparable companies, the discounted value of the cash flows of the portfolio company and other relevant factors. This information may not be available because it is difficult to obtain financial and other information with respect to private companies, and even where we are able to obtain such information, there can be no assurance that it is complete or accurate. Because such valuations are inherently uncertain and may be based on estimates, our determinations of fair value may differ materially from the values that would be assessed if a readily available market for these securities existed. Due to this uncertainty, our fair value determinations with respect to any non-traded investments we hold may cause our net asset value on a given date to materially understate or overstate the value that we may ultimately realize on one or more of our investments. As a result, investors purchasing our securities based on an overstated net asset value would pay a higher price than the value of our investments might warrant. Conversely, investors selling securities during a period in which the net asset value understates the value of our investments will receive a lower price for their securities than the value of our investments might warrant.
We and the Advisor may be a party to legal proceedings in connection with our investments in our portfolio companies.
From time to time, we and the Advisor may be a party to certain legal proceedings incidental to the normal course of our business, including the enforcement of our rights under contracts with our portfolio companies. While we cannot predict the outcome of these legal proceedings with certainty, we do not expect that these proceedings will have a material effect on our consolidated financial statements.
An investment strategy focused primarily on privately held companies presents certain challenges, including the lack of available information about these companies.
We invest primarily in privately held companies. Generally, little public information exists about these companies. We must therefore rely on the ability of our Advisor to obtain adequate information to evaluate the potential risks of investing in these companies. These companies and their financial information generally are not subject to the Sarbanes-Oxley Act of 2002 and other rules that govern public companies. If we are unable to uncover all material information about these companies, we may not make a fully informed investment decision, and we may lose money on our investments. These factors could affect our investment returns.
30
Our investments in lower credit quality obligations are risky and highly speculative, and we could lose all or part of our investment.
Most of our debt investments are likely to be in lower grade obligations. The lower grade investments in which we invest may be rated below investment grade by one or more nationally-recognized statistical rating agencies at the time of investment or may be unrated but determined by the Advisor to be of comparable quality. Debt securities rated below investment grade are commonly referred to as “junk bonds” and are considered speculative with respect to the issuer’s capacity to pay interest and repay principal. The debt that we invest in typically is not initially rated by any rating agency, but we believe that if such investments were rated, they would be below investment grade (rated lower than “Baa3” by Moody’s Investors Service, lower than “BBB-” by Fitch Ratings or lower than “BBB-” by Standard & Poor’s). We may invest without limit in debt of any rating, as well as debt that has not been rated by any nationally recognized statistical rating organization.
Investment in lower grade investments involves a substantial risk of loss. Lower grade securities or comparable unrated securities are considered predominantly speculative with respect to the issuer’s ability to pay interest and principal and are susceptible to default or decline in market value due to adverse economic and business developments. The market values for lower grade debt tend to be very volatile and are less liquid than investment grade securities. For these reasons, your investment in our company is subject to the following specific risks: increased price sensitivity to a deteriorating economic environment; greater risk of loss due to default or declining credit quality; adverse company specific events are more likely to render the issuer unable to make interest and/or principal payments; and if a negative perception of the lower grade debt market develops, the price and liquidity of lower grade securities may be depressed. This negative perception could last for a significant period of time.
Any investments in distressed debt obligations may not produce income and may require us to bear large expenses in order to protect and recover our investment.
At times, distressed debt obligations may not produce income and may require us to bear certain extraordinary expenses (including legal, accounting, valuation and transaction expenses) in order to protect and recover our investment. Therefore, to the extent we invest in distressed debt, our ability to achieve current income for our stockholders may be diminished. We also will be subject to significant uncertainty as to when and in what manner and for what value the distressed debt we invest in will eventually be satisfied (e.g., through liquidation of the obligor’s assets, an exchange offer or plan of reorganization involving the distressed debt securities or a payment of some amount in satisfaction of the obligation). In addition, even if an exchange offer is made or plan of reorganization is adopted with respect to distressed debt we hold, there can be no assurance that the securities or other assets received by us in connection with such exchange offer or plan of reorganization will not have a lower value or income potential than may have been anticipated when the investment was made. Moreover, any securities received by us upon completion of an exchange offer or plan of reorganization may be restricted as to resale. As a result of our participation in negotiations with respect to any exchange offer or plan of reorganization with respect to an issuer of distressed debt, we may be restricted from disposing of such securities.
If we invest in preferred stock, we may incur additional risks.
To the extent we invest in preferred securities, we may incur particular risks, including:
|
|
• |
Preferred securities may include provisions that permit the issuer, at its discretion, to defer distributions for a stated period without any adverse consequences to the issuer. If we own a preferred security that is deferring its distributions, we may be required to report income for tax purposes before we receive such distributions. Preferred securities are subordinated to bonds and other debt instruments in a company’s capital structure in terms of priority to corporate income and liquidation payments, and therefore will be subject to greater credit risk than more senior debt instruments; and |
|
|
• |
generally, preferred security holders have no voting rights with respect to the issuing company unless preferred dividends have been in arrears for a specified number of periods, at which time the preferred security holders may elect a number of directors to the issuer’s board. Generally, once all of the arrearages have been paid, the preferred security holders no longer have voting rights. |
Our equity investments may decline in value.
The equity securities in which we invest may not appreciate or may decline in value. We may thus not be able to realize gains from our equity securities, and any gains that we do realize on the disposition of any equity securities may not be sufficient to offset any other losses we experience. As a result, the equity securities in which we invest may decline in value, which may negatively impact our ability to pay distributions and cause you to lose all or part of your investment.
31
We may expose ourselves to risks if we engage in hedging transactions.
We may enter into hedging transactions, which could expose us to risks associated with such transactions. We may utilize instruments such as forward contracts and interest rate swaps, caps, collars and floors to seek to hedge against fluctuations in the relative values of our portfolio positions and amounts due under our debt arrangements from changes in market interest rates. Use of these hedging instruments may include counterparty credit risk. Utilizing such hedging instruments does not eliminate the possibility of fluctuations in the values of such positions and amounts due under our debt arrangements or prevent losses if the values of such positions decline. However, such hedging can establish other positions designed to gain from those same developments, thereby offsetting the decline in the value of such portfolio positions. Such hedging transactions may also limit the opportunity for gain if the values of the underlying portfolio positions should increase. Moreover, it may not be possible to hedge against an interest rate fluctuation that is so generally anticipated that we are not able to enter into a hedging transaction at an acceptable price.
The success of our hedging transactions will depend on our ability to correctly predict movements and interest rates. Therefore, while we may enter into such transactions to seek to reduce interest rate risks, unanticipated changes in interest rates may result in poorer overall investment performance than if we had not engaged in any such hedging transactions. In addition, the degree of correlation between price movements of the instruments used in a hedging strategy and price movements in the portfolio positions being hedged may vary. Moreover, for a variety of reasons, we may not seek to establish a perfect correlation between such hedging instruments and the portfolio holdings or debt arrangements being hedged. Any such imperfect correlation may prevent us from achieving the intended hedge and expose us to risk of loss. See also “—Changes in interest rates may affect our cost of capital and net investment income.”
Economic recessions or downturns could impair our portfolio companies and harm our operating results.
Many of our portfolio companies may be susceptible to economic slowdowns or recessions and may be unable to repay our loans during these periods. Therefore, our non-performing assets may increase and the value of our portfolio may decrease during these periods as we are required to record the values of our investments. Adverse economic conditions also may decrease the value of collateral securing some of our loans and the value of our equity investments. Economic slowdowns or recessions could lead to financial losses in our portfolio and a decrease in revenues, net income and assets. Unfavorable economic conditions also could increase our funding costs, limit our access to the capital markets or result in a decision by lenders not to extend credit to us. These events could prevent us from increasing investments and harm our operating results.
The lack of liquidity in our investments may adversely affect our business.
We make investments in private companies. A portion of these investments may be subject to legal and other restrictions on resale, transfer, pledge or other disposition or will otherwise be less liquid than publicly traded securities. The illiquidity of our investments may make it difficult for us to sell such investments if the need arises. In addition, if we are required to liquidate all or a portion of our portfolio quickly, we may realize significantly less than the value at which we have previously recorded our investments. In addition, we face other restrictions on our ability to liquidate an investment in a business entity to the extent that we or the Advisor has or could be deemed to have material non-public information regarding such business entity.
32
Our portfolio companies may incur debt that ranks equally with, or senior to, our investments in such companies.
Our portfolio companies usually will have, or may be permitted to incur, other debt that ranks equally with, or senior to, debt securities in which we invest. By their terms, such debt instruments may provide that the holders are entitled to receive payment of interest or principal on or before the dates on which we are entitled to receive payments. Also, in the event of insolvency, liquidation, dissolution, reorganization or bankruptcy of a portfolio company, holders of debt instruments ranking senior to our investment in that portfolio company would typically be entitled to receive payment in full before we receive any distribution in respect of our investment. After repaying such senior creditors, the portfolio company may not have any remaining assets to use for repaying its obligations to us. In the case of debt ranking equally with debt securities in which we invest, we would have to share on an equal basis any distributions with other creditors holding such debt in the event of an insolvency, liquidation, dissolution, reorganization or bankruptcy of the relevant portfolio company. The rights we may have with respect to the collateral securing any junior priority loans we make to our portfolio companies may also be limited pursuant to the terms of one or more intercreditor agreements (including agreements governing “first out” and “last out” structures) that we enter into with the holders of senior debt. Under such an intercreditor agreement, at any time that senior obligations are outstanding, we may forfeit certain rights with respect to the collateral to the holders of the senior obligations. These rights may include the right to commence enforcement proceedings against the collateral, the right to control the conduct of such enforcement proceedings, the right to approve amendments to collateral documents, the right to release liens on the collateral and the right to waive past defaults under collateral documents. We may not have the ability to control or direct such actions, even if as a result our rights as junior lenders are adversely affected.
When we are a debt or minority equity investor in a portfolio company, we are often not in a position to exert influence on the entity, and other equity holders and management of the company may make decisions that could decrease the value of our portfolio holdings.
When we make debt or minority equity investments, we are subject to the risk that a portfolio company may make business decisions with which we disagree and the other equity holders and management of such company may take risks or otherwise act in ways that do not serve our interests. As a result, a portfolio company may make decisions that could decrease the value of our investment.
In addition, we may not be in a position to control any portfolio company by investing in its debt securities. As a result, we are subject to the risk that a portfolio company in which we invest may make business decisions with which we disagree, and the management of such company, as representatives of the holders of its common equity, may take risks or otherwise act in ways that do not serve our interests as debt investors.
There may be circumstances in which our debt investments could be subordinated to claims of other creditors or we could be subject to lender liability claims.
If one of our portfolio companies were to go bankrupt, even though we may have structured our interest as senior debt, depending on the facts and circumstances, a bankruptcy court might re-characterize our debt holding as an equity investment and subordinate all or a portion of our claim to that of other creditors. In addition, lenders can be subject to lender liability claims for actions taken by them where they become too involved in the borrower’s business or exercise control over the borrower. For example, we could become subject to a lender’s liability claim, if, among other things, we actually render significant managerial assistance.
Our portfolio companies may be highly leveraged.
Some of our portfolio companies may be highly leveraged, which may have adverse consequences to these companies and to us as an investor. These companies may be subject to restrictive financial and operating covenants and the leverage may impair these companies’ ability to finance their future operations and capital needs. As a result, these companies’ flexibility to respond to changing business and economic conditions and to take advantage of business opportunities may be limited. Further, a leveraged company’s income and net assets will tend to increase or decrease at a greater rate than if borrowed money were not used.
33
Because we generally do not hold controlling equity interests in our portfolio companies, we may not be in a position to exercise control over our portfolio companies or to prevent decisions by management of our portfolio companies that could decrease the value of our investments.
We generally do not hold controlling equity positions in our portfolio companies. As a result, we are subject to the risk that a portfolio company may make business decisions with which we disagree, and that the management and/or stockholders of a portfolio company may take risks or otherwise act in ways that are adverse to our interests. In addition, other stockholders, such as private or public funds, that have substantial investments in our portfolio companies may have interests that differ from that of the portfolio company or its minority stockholders, which may lead them to take actions that could materially and adversely affect the value of our investment in the portfolio company. Due to the lack of liquidity of the debt and equity investments that we typically hold in our portfolio companies, we may not be able to dispose of our investments in the event we disagree with the actions of a portfolio company and may therefore suffer a decrease in the value of our investments.
Concentration of our assets in an issuer, industry or sector may present more risks than if we were more broadly diversified over numerous issuers, industries and sectors of the economy.
We are classified as a non-diversified investment company within the meaning of the 1940 Act, which means that we are not limited by the 1940 Act with respect to the proportion of our assets that we may invest in securities of a single issuer. To the extent that we assume large positions in the securities of a small number of issuers, our net asset value may fluctuate to a greater extent than that of a diversified investment company as a result of changes in the financial condition or the market’s assessment of the issuer. We may also be more susceptible to any single economic or regulatory occurrence than a diversified investment company.
In addition, we may, from time to time, invest a substantial portion of our assets in the securities of issuers in any single industry or sector of the economy or in only a few issuers. We cannot predict the industries or sectors in which our investment strategy may cause us to concentrate and cannot predict the level of our diversification among issuers to ensure that we satisfy diversification requirements for qualification as a RIC for U.S. federal income tax purposes. A downturn in an industry or sector in which we are concentrated would have a larger impact on us than on a company that does not concentrate in that particular industry or sector. Furthermore, the Advisor has not made and does not intend to make any determination as to the allocation of assets among different classes of securities. At any point in time we may be highly concentrated in a single type of asset, such as junior unsecured loans or distressed debt. Consequently, events which affect a particular asset class disproportionately could have an equally disproportionate effect on us.
Our failure to make follow-on investments in our portfolio companies could impair the value of our portfolio.
Following an initial investment in a portfolio company, we may make additional investments in that portfolio company as “follow-on” investments in order to: (i) increase or maintain in whole or in part our equity ownership percentage; (ii) exercise warrants, options or convertible securities that were acquired in the original or any subsequent financing; or (iii) attempt to preserve or enhance the value of our investments. We may elect not to make follow-on investments or otherwise lack sufficient funds to make those investments. We will have the discretion to make any follow-on investments, subject to the availability of capital resources. The failure to make follow-on investments may, in some circumstances, jeopardize the continued viability of a portfolio company and our initial investment, or may result in a missed opportunity for us to maintain or increase our participation in a successful operation. Even if we have sufficient capital to make a desired follow-on investment, we may elect not to make a follow-on investment because we may not want to increase our concentration of risk, either because we prefer other opportunities or because we are subject to BDC requirements that would prevent such follow-on investments or the desire to maintain our RIC status.
Our investments in foreign securities may involve significant risks in addition to the risks inherent in U.S. investments.
While we invest primarily in U.S. companies, our investment strategy contemplates that a portion of our investments may be in securities of foreign companies. Accordingly, we may invest on an opportunistic basis in certain non-U.S. companies, including those located in emerging markets, that otherwise meet our investment criteria. In regards to the regulatory requirements for business development companies, some of these investments may not qualify as investments in “eligible portfolio companies,” and thus may not be considered “qualifying assets.” “Eligible portfolio companies” generally include U.S. companies that are not investment companies and that do not have securities listed on a national exchange. If at any time less than 70% of our gross assets are comprised of qualifying assets, including as a result of an increase in the value of any non-qualifying assets or decrease in the value of any qualifying assets, we would generally not be permitted to acquire any additional non-qualifying assets until such time as 70% of our then current gross assets were comprised of qualifying assets. We would not be required, however, to dispose of any non-qualifying assets in such circumstances. In addition, investing in foreign companies, and particularly those in emerging markets, may expose us to additional risks not typically associated with investing in U.S. companies. These risks include changes in exchange control regulations, political and social instability, expropriation, imposition of foreign taxes (potentially at confiscatory levels), less liquid markets and less available information than is generally the case in the U.S., higher transaction costs, less government supervision of exchanges, brokers and issuers, less developed bankruptcy laws, difficulty in enforcing contractual obligations, lack of uniform accounting and auditing standards and greater price volatility. Further, we may have difficulty enforcing our rights as equity holders in
34
foreign jurisdictions. In addition, to the extent we invest in non-U.S. companies, we may face greater exposure to foreign economic developments.
Although most of our investments are denominated in U.S. dollars, our investments that are denominated in a foreign currency are subject to the risk that the value of a particular currency may change in relation to one or more other currencies. Among the factors that may affect currency values are trade balances, the level of short-term interest rates, differences in relative values of similar assets in different currencies, long-term opportunities for investment and capital appreciation, and political developments. We may employ hedging techniques to minimize these risks, but we can offer no assurance that we will, in fact, hedge currency risk or, that if we do, such strategies will be effective.
Our investments in the healthcare sector face considerable uncertainties including substantial regulatory challenges.
Our investments in the healthcare sector are subject to substantial risks. The laws and rules governing the business of healthcare companies and interpretations of those laws and rules are subject to frequent change. Broad latitude is given to the agencies administering those regulations. Existing or future laws and rules could force our portfolio companies engaged in healthcare to change how they do business, restrict revenue, increase costs, change reserve levels, change business practices and increase liability in federal and state courts. Healthcare companies often must obtain and maintain regulatory approvals to market many of their products, change prices for certain regulated products and to consummate some of their acquisitions and divestitures. Delays in obtaining or failure to obtain or maintain these approvals could reduce revenue or increase costs. Policy changes on the local, state and federal level, such as the expansion of the government’s role in the health care arena and alternative assessments and tax increases specific to the healthcare industry or healthcare products as part of federal health care reform initiatives, could fundamentally change the dynamics of the healthcare industry.
Our investments in the financial services sector are subject to various risks including volatility and extensive government regulation.
These risks include the effects of changes in interest rates on the profitability of financial services companies, the rate of corporate and consumer debt defaults, price competition, governmental limitations on a company’s loans, other financial commitments, product lines and other operations and recent ongoing changes in the financial services industry (including consolidations, development of new products and changes to the industry’s regulatory framework). The deterioration of the credit markets starting in late 2007 generally has caused an adverse impact in a broad range of markets, including U.S. and international credit and interbank money markets generally, thereby affecting a wide range of financial institutions and markets. In particular, events in the financial sector in late 2008 resulted, and may continue to result, in an unusually high degree of volatility in the financial markets, both domestic and foreign. This situation has created instability in the financial markets and caused certain financial services companies to incur large losses. Insurance companies have additional risks, such as heavy price competition, claims activity and marketing competition, and can be particularly sensitive to specific events such as man-made and natural disasters (including weather catastrophes), terrorism, mortality risks and morbidity rates.
Our investments in the consumer products sector are subject to various risks including cyclical risks associated with the overall economy.
General risks of companies in the consumer products sector include cyclicality of revenues and earnings, economic recession, currency fluctuations, changing consumer tastes, extensive competition, product liability litigation and increased government regulation. Generally, spending on consumer products is affected by the health of consumers. Companies in the consumer products sectors are subject to government regulation affecting the permissibility of using various food additives and production methods, which regulations could affect company profitability. A weak economy and its effect on consumer spending would adversely affect companies in the consumer products sector.
Our investments in the chemicals, plastics, and rubber sector are subject to various risks including costs of raw materials and energy, increased competition and extensive government regulation.
Our investments in the chemicals, plastics and rubber sectors are subject to various risks including risks related to the costs of raw materials and energy. General risks of companies in the chemicals, plastics, and rubber industries include safety or product liability issues, costs of raw materials and energy, including crude oil, and competition in global markets. The chemicals, plastics, and rubber industries are highly competitive, which puts pressure on prices. Prices are subject to international supply and demand as well as to the purchase costs of raw materials and energy. Markets for these products, as well as prices for raw materials and energy used by these industries, are cyclical and volatile and the costs of raw materials and energy represent a substantial portion of the industries’ production costs and operating expenses. In addition, manufacturing facilities in these industries are subject to planned and unplanned production shutdowns, turnarounds and outages, which could have an adverse effect on long-term production. Companies in these industries are also subject to extensive federal, state, local and foreign environmental, health and safety laws and regulations concerning, among other things, emissions in the air, discharges to land and water and the generation, handling, treatment and disposal of hazardous waste and other materials. These requirements, and enforcement of these requirements, may become more stringent in
35
the future. In addition, future regulatory or other developments could also restrict or eliminate the use of, or require companies in these industries to make modifications to, its products, packaging, manufacturing processes and technology, which could have a significant adverse impact on its financial condition, results of operations and cash flows.
Cyclicality within the energy sector may adversely affect some of our portfolio companies.
Industries within the energy sector are cyclical with fluctuations in commodity prices and demand for, and production of commodities driven by a variety of factors. The highly cyclical nature of the industries within the energy sector may lead to volatile changes in commodity prices, which may adversely affect the earnings of energy companies in which we may invest and the performance and valuation of our portfolio.
New market structure requirements applicable to derivatives could significantly increase the costs of utilizing over-the-counter (“OTC”) derivatives.
The Dodd-Frank Act enacted, and the Commodity Futures Trading Commission (the “CFTC”) and the SEC have issued or proposed rules to implement, both broad new regulatory requirements and broad new structural requirements applicable to OTC derivative markets and, to a lesser extent, listed commodity futures (and futures options) markets. Similar changes are in the process of being adopted in the European Union, Japan, and other major financial markets.
These changes include, but are not limited to: requirements that many categories of the most liquid OTC derivatives (currently limited to specified interest rate swaps and index credit default swaps) be executed on qualifying, regulated exchanges and be submitted for clearing; real-time public and regulatory reporting of specified information regarding OTC derivative transactions; and enhanced documentation requirements and recordkeeping requirements. Margin requirements for uncleared OTC derivatives and position limits are also expected to be adopted by the CFTC and other regulators in the future.
While these changes are intended to mitigate systemic risk and to enhance transparency and execution quality in the OTC derivative markets, the impact of these changes is not known at this time. For instance, cleared OTC derivatives are subject to margin requirements established by regulated clearinghouses, including daily exchanges of cash variation (or mark-to-market) margin and an upfront posting of cash or securities initial margin to cover the clearinghouse’s potential future exposure to the default of a party to a particular OTC derivative transaction. Furthermore, “financial end users,” such as us, that enter into OTC derivatives that are not cleared will, pending finalization of the applicable regulations, generally be required to provide margin to collateralize their obligations under such derivatives. Under current proposed rules, the level of margin that would be required to be collected in connection with uncleared OTC derivatives is in many cases substantially greater than the level currently required by market participants or clearinghouses.
These changes could significantly increase the costs to us of utilizing OTC derivatives, reduce the level of exposure that we are able to obtain (whether for risk management or investment purposes) through OTC derivatives, and reduce the amounts available to us to make non-derivative investments. These changes could also impair liquidity in certain OTC derivatives and adversely affect the quality of execution pricing that we are able to obtain, all of which could adversely impact our investment returns. Furthermore, the margin requirements for cleared and uncleared OTC derivatives may require that the Advisor, in order to maintain its exemption from commodity pool operator (“CPO”) registration under a no-action letter issued by the staff of the CFTC limit our ability to enter into hedging transactions or to obtain synthetic investment exposures, in either case adversely affecting our ability to mitigate risk.
Proposed position aggregation requirements may restrict the swap positions that the Advisor may enter into.
The Dodd-Frank Act significantly expanded the scope of the CFTC’s authority and obligation to require reporting of, and adopt limits on, the size of positions that market participants may own or control in commodity futures and futures options contracts and swaps. The Dodd-Frank Act also narrowed existing exemptions from such position limits for a broad range of risk management transactions.
In accordance with the requirements of the Dodd-Frank Act, the CFTC is required to establish speculative position limits on additional listed futures and options on physical commodities and economically equivalent over-the-counter (“OTC”) derivatives; position limits applicable to swaps that are economically equivalent to United States listed futures and futures options contracts, including contracts on non-physical commodities, such as rates, currencies, equities and credit default swaps; and aggregate position limits for a broad range of derivatives contracts based on the same underlying commodity, including swaps and futures and futures options contracts. The CFTC has proposed potentially significant narrowing of existing precedents and guidance that permit market participants to disaggregate for position limit purposes, positions that are independently controlled. While certain persons, contracts or transactions or classes thereof are exempt from the speculative position limit requirements, such broadened position aggregation requirements may further restrict the swap positions that the Advisor may enter into on our behalf.
36
The full impact of these recent changes is not known at this time. Individually and collectively, these changes could increase our costs of maintaining positions in commodity futures and futures option contracts and swaps and reduce the level of exposure we are able to obtain (whether for risk management or investment purposes) through commodity futures and futures option contracts and swaps. These changes could also impair liquidity in certain swaps and adversely affect the quality of execution pricing that we are able to obtain, all of which could adversely impact our investment returns.
The effect of global climate change may impact the operations of our portfolio companies.
There may be evidence of global climate change. Climate change creates physical and financial risk and some of our portfolio companies may be adversely affected by climate change. For example, the needs of customers of energy companies vary with weather conditions, primarily temperature and humidity. To the extent weather conditions are affected by climate change, energy use could increase or decrease depending on the duration and magnitude of any changes. Increases in the cost of energy could adversely affect the cost of operations of our portfolio companies if the use of energy products or services is material to their business. A decrease in energy use due to weather changes may affect some of our portfolio companies’ financial condition, through decreased revenues. Extreme weather conditions in general require more system backup, adding to costs, and can contribute to increased system stresses, including service interruptions.
Risks Related to Our Operations as a BDC
Our ability to enter into transactions with our affiliates is restricted.
We are prohibited under the 1940 Act from knowingly participating in certain transactions with certain of our affiliates without the prior approval of our independent directors and, in some cases, of the SEC. Any person that owns, directly or indirectly, 5% or more of our outstanding voting securities will be our affiliate for purposes of the 1940 Act and we are generally prohibited from buying or selling any security (other than our securities) from or to such affiliate, absent the prior approval of our independent directors. The 1940 Act also prohibits certain “joint” transactions with certain of our affiliates, which could include investments in the same portfolio company (whether at the same or different times), without prior approval of our independent directors and, in some cases, of the SEC. We are prohibited from buying or selling any security from or to any person who owns more than 25% of our voting securities or certain of that person’s affiliates, or entering into prohibited joint transactions with such persons, absent the prior approval of the SEC through an exemptive order (other than in certain limited situations pursuant to current regulatory guidance). The analysis of whether a particular transaction constitutes a joint transaction requires a review of the relevant facts and circumstances then existing. Similar restrictions limit our ability to transact business with our officers or directors or their affiliates.
Regulations governing our operation as a BDC affect our ability to, and the way in which we, raise additional capital.
Our business requires a substantial amount of capital. We may acquire additional capital from the issuance of senior securities or other indebtedness, the issuance of additional shares of our common stock or from securitization transactions. However, we may not be able to raise additional capital in the future on favorable terms or at all. We may issue debt securities or preferred securities, which we refer to collectively as “senior securities,” and we may borrow money from banks or other financial institutions, up to the maximum amount permitted by the 1940 Act. The 1940 Act permits us to issue senior securities or incur indebtedness only in amounts such that our asset coverage, as defined in the 1940 Act, equals at least 200% after such issuance or incurrence. Our ability to make distributions or issue additional senior securities would be restricted if our asset coverage ratio were not at least 200%. If the value of our assets declines, we may be unable to satisfy this test. If that happens, we may be required to liquidate a portion of our investments and repay a portion of our indebtedness at a time when such sales may be disadvantageous.
|
|
• |
Senior Securities. As a result of issuing senior securities, we would also be exposed to typical risks associated with leverage, including an increased risk of loss. If we issue preferred securities they would rank “senior” to common stock in our capital structure, preferred stockholders would have separate voting rights and may have rights, preferences or privileges more favorable than those of our common stockholders. Furthermore, the issuance of preferred securities could have the effect of delaying, deferring or preventing a transaction or a change of control that might involve a premium price for our common stockholders or otherwise be in the best interests of our common stockholders. |
|
|
• |
Additional Common Stock. Our Board of Directors may decide to issue common stock to finance our operations rather than issuing debt or other senior securities. As a BDC, we are generally not able to issue our common stock at a price below net asset value, or issue securities convertible into common stock, without first obtaining the required approvals from our stockholders and our independent directors. We may also make rights offerings to our stockholders. If we raise additional capital by issuing more common stock or senior securities convertible into, or exchangeable for, our common stock, the percentage ownership of our common stockholders at that time would decrease, and our common stockholders may experience dilution. |
37
Stockholders will likely incur dilution if we sell or otherwise issue shares of our common stock or securities to subscribe for or convertible into shares of our common stock at prices below the then current net asset value per share of our common stock.
We obtained approval at our 2017 Special Meeting of Stockholders to allow us the flexibility, with the approval of our Board of Directors, to sell or otherwise issue shares of our common stock at a price below its then current net asset value per share during the twelve month period following stockholders approval at the 2017 Special Meeting, subject to the policy of our Board of Directors that the Company shall not sell or otherwise issue more than 25% of the Company’s then outstanding shares of common stock (immediately prior to such sale or issuance) at a price below its then current net asset value per share. Since we obtained this approval from stockholders, we may issue shares of our common stock at a price below its then current net asset value per share, subject to the foregoing conditions and the determination by our Board of Directors that such issuance and sale is in our and our stockholders’ best interests.
In addition, we may also issue shares of common stock in certain limited circumstances under our dividend reinvestment plan and under interpretive advice issued by the Internal Revenue Service. Any sale or other issuance of shares of our common stock at a price below net asset value per share would result in an immediate dilution to the net asset value per share. This dilution would occur as a result of a proportionately greater decrease in a stockholder’s interest in our earnings and assets and voting interest in us than the increase in our assets resulting from such issuance. Because the number of shares of common stock that could be so issued and the timing of any issuance is not currently known, the actual dilutive effect cannot be predicted. Such effects may be material, and we undertake to describe material risks and dilutive effects of any offering that we make at a price below our then current net asset value in the future in a prospectus supplement issued in connection with any such offering. We cannot predict whether shares of our common stock will trade above, at or below our net asset value.
Changes in the laws or regulations governing our business or the businesses of our portfolio companies and any failure by us or our portfolio companies to comply with these laws or regulations could negatively affect the profitability of our operations or of our portfolio companies.
We are subject to changing rules and regulations of federal and state governments, as well as the stock exchange on which our common stock is listed. These entities, including the Public Company Accounting Oversight Board, the SEC and The NASDAQ Global Select Market, have issued a significant number of new and increasingly complex requirements and regulations over the course of the last several years and continue to develop additional regulations. In particular, changes in the laws or regulations or the interpretations of the laws and regulations that govern BDCs, RICs or non-depository commercial lenders could significantly affect our operations and our cost of doing business. We are subject to federal, state and local laws and regulations and are subject to judicial and administrative decisions that affect our operations, including our loan originations, maximum interest rates, fees and other charges, disclosures to portfolio companies, the terms of secured transactions, collection and foreclosure procedures and other trade practices. If these laws, regulations or decisions change, or if we expand our business into jurisdictions that have adopted more stringent requirements than those in which we currently conduct business, we may have to incur significant expenses in order to comply, or we might have to restrict our operations. In addition, if we do not comply with applicable laws, regulations and decisions, we may lose licenses needed for the conduct of our business and be subject to civil fines and criminal penalties, any of which could have a material adverse effect upon our business, financial condition and results of operations.
Any failure on our part to maintain our status as a BDC would reduce our operating flexibility.
The 1940 Act imposes numerous constraints on the operations of BDCs. Any failure to comply with the requirements imposed on BDCs by the 1940 Act could cause the SEC to bring an enforcement action against us and/or expose us to claims of private litigants. In addition, upon approval of a majority of our stockholders, we may elect to withdraw our status as a BDC. If we decide to withdraw our election, or if we otherwise fail to qualify, or maintain our qualification, as a BDC, we may be subject to the substantially greater regulation under the 1940 Act as a closed-end investment company. Compliance with such regulations would significantly decrease our operating flexibility, and could significantly increase our costs of doing business.
38
If we do not invest a sufficient portion of our assets in qualifying assets, we could fail to qualify as a BDC or be precluded from investing according to our current business strategy.
As a BDC, we may not acquire any assets other than “qualifying assets” unless, at the time of and after giving effect to such acquisition, at least 70% of our total assets are qualifying assets. We believe that most of the investments that we may acquire in the future will constitute qualifying assets. However, we may be precluded from investing in what we believe are attractive investments if such investments are not qualifying assets for purposes of the 1940 Act. If we do not invest a sufficient portion of our assets in qualifying assets, we could be found to be in violation of the 1940 Act provisions applicable to BDCs, which would have a material adverse effect on our business, financial condition and results of operations. Similarly, these rules could prevent us from making follow-on investments in existing portfolio companies (which could result in the dilution of our position) or could require us to dispose of investments at inappropriate times in order to come into compliance with the 1940 Act. Because most of our investments will be in private companies, and therefore will be relatively illiquid, any such dispositions could be made at disadvantageous prices and could result in substantial losses.
Loss of status as a RIC would reduce our net asset value and distributable income.
We currently qualify as a RIC under the Code and intend to continue to qualify each year as a RIC. As a RIC we do not have to pay federal income taxes on our income (including realized gains) that is distributed to our stockholders, provided that we satisfy certain distribution requirements. Accordingly, we are not permitted under accounting rules to establish reserves for taxes on our unrealized capital gains. If we fail to qualify for RIC status in any year, to the extent that we had unrealized gains, we would have to establish reserves for taxes, which would reduce our net asset value. In addition, if we, as a RIC, were to decide to make a deemed distribution of net realized capital gains and retain the net realized capital gains, we would have to establish appropriate reserves for taxes that we would have to pay on behalf of stockholders. It is possible that establishing reserves for taxes could have a material adverse effect on the value of our common stock.
We will be subject to corporate-level income tax if we are unable to maintain our qualification as a RIC under Subchapter M of the Code or do not satisfy the annual distribution requirement.
To maintain RIC status and be relieved of federal taxes on income and gains distributed to our stockholders, we must meet the following annual distribution, income source and asset diversification requirements.
|
|
• |
The annual distribution requirement for a RIC will be satisfied if we distribute to our stockholders on an annual basis at least 90% of our net ordinary income and realized net short-term capital gains in excess of realized net long-term capital losses, if any. Because we may use debt financing, we are subject to an asset coverage ratio requirement under the 1940 Act and we may be subject to certain financial covenants under our debt arrangements that could, under certain circumstances, restrict us from making distributions necessary to satisfy the distribution requirement. If we are unable to obtain cash from other sources, we could fail to qualify for RIC tax treatment and thus become subject to corporate-level income tax. |
|
|
• |
The income source requirement will be satisfied if we obtain at least 90% of our income for each year from dividends, interest, gains from the sale of stock or securities or similar sources. |
|
|
• |
The asset diversification requirement will be satisfied if we meet certain asset diversification requirements at the end of each quarter of our taxable year. To satisfy this requirement, at least 50% of the value of our assets must consist of cash, cash equivalents, U.S. government securities, securities of other RICs, and other acceptable securities; and no more than 25% of the value of our assets can be invested in the securities, other than U.S. government securities or securities of other RICs, of one issuer, of two or more issuers that are controlled, as determined under applicable Code rules, by us and that are engaged in the same or similar or related trades or businesses or of certain “qualified publicly traded partnerships.” Failure to meet these requirements may result in our having to dispose of certain investments quickly in order to prevent the loss of RIC status. Because most of our investments will be in private companies, and therefore will be relatively illiquid, any such dispositions could be made at disadvantageous prices and could result in substantial losses. |
If we fail to qualify for or maintain RIC status for any reason and are subject to corporate-level income tax, the resulting corporate-level taxes could substantially reduce our net assets, the amount of income available for distribution and the amount of our distributions. Such a failure would have a material adverse effect on us and our stockholders. The Code provides some relief from RIC disqualification due to failures of the income source and asset diversification requirements, although there may be additional taxes due in such cases. We cannot assure you that we would qualify for any such relief should we fail the income source or asset diversification requirements.
39
Risks Relating to Our Common Stock
Our shares of common stock have traded at a discount from net asset value and may do so again in the future, which could limit our ability to raise additional equity capital.
Shares of closed-end investment companies, including business development companies, may trade at a market discount from net asset value. This characteristic of closed-end investment companies and business development companies is separate and distinct from the risk that our net asset value per share may decline. In the past, the stocks of BDCs as an industry, including shares of our common stock, have traded below net asset value and at historic lows as a result of concerns over liquidity, leverage restrictions and distribution requirements. When our common stock is trading below its net asset value per share, we will generally not be able to issue additional shares of our common stock at its market price without first obtaining approval for such issuance from our stockholders and our independent directors. At our 2017 Special Meeting of Stockholders, subject to certain conditions and Board of Directors determinations, our stockholders approved our ability to sell or otherwise issue shares of our common stock at a price below its then current net asset value per share for a twelve month period expiring on the anniversary of the date of stockholder approval.
Investing in our common stock may involve an above average degree of risk.
The investments we make in accordance with our investment objective may result in a higher amount of risk than alternative investment options and a higher risk of volatility or loss of principal. Our investments in portfolio companies involve higher levels of risk, and therefore, an investment in our shares may not be suitable for someone with lower risk tolerance.
The price of our common stock may fluctuate significantly.
As with any company, the price of our common stock will fluctuate with market conditions and other factors. The market price and liquidity of the market for our common stock may from time to time be affected by a number of factors, which include, but are not limited to, the following:
|
|
• |
volatility in the market price and trading volume of common stocks of BDCs or other financial services companies, which are not necessarily related to the operating performance of these companies; |
|
|
• |
investors’ general perception of our company, the economy and general market conditions; |
|
|
• |
our quarterly results of operations; |
|
|
• |
our origination activity, including the pace of, and competition for, new investment opportunities; |
|
|
• |
the financial performance of the specific industries in which we invest on a recurring basis, including without limitation, our investments in the business services and healthcare industries; |
|
|
• |
announcements of strategic developments, acquisitions and other material events by us or our competitors; |
|
|
• |
changes in regulatory policies or tax guidelines, particularly with respect to RICs or BDCs; |
|
|
• |
loss of RIC status; |
|
|
• |
changes in earnings or variations in operating results; |
|
|
• |
changes in the value of our portfolio investments; |
|
|
• |
any shortfall in revenue or net income or any increase in losses from levels expected by investors or securities analysts; |
|
|
• |
departure of key personnel from the Advisor; |
|
|
• |
operating performance of companies comparable to us; |
|
|
• |
short-selling pressure with respect to shares of our common stock or BDCs generally; |
|
|
• |
general economic trends and other external factors, including price and volume fluctuations in the overall stock market; and |
|
|
• |
loss of a major funding source. |
Our shares may trade at discounts from net asset value or at premiums that are unsustainable over the long term.
Shares of BDCs may trade at a market price that is less than the net asset value that is attributable to those shares. Our shares have traded above and below our net asset value. The possibility that our shares of common stock will trade at a discount from net
40
asset value or at a premium that is unsustainable over the long term is separate and distinct from the risk that our net asset value will decrease. It is not possible to predict whether our shares will trade at, above or below net asset value in the future.
Sales of substantial amounts of our common stock in the public market may have an adverse effect on the market price of our common stock.
The shares of our common stock beneficially owned by our principal stockholders are generally available for resale, subject to the provisions of Rule 144 promulgated under the Securities Act. Sales of substantial amounts of our common stock, or the availability of such common stock for sale, could adversely affect the prevailing market prices for our common stock. If this occurs and continues, it could impair our ability to raise additional capital through the sale of securities should we desire to do so.
Our capital-raising activities may have an adverse effect on the market price of our common stock.
When we issue securities or incur debt, we generally obtain cash or cash equivalents. Any increase in our holdings of cash or cash equivalents could adversely affect the prevailing market prices for our common stock, especially if we are unable to timely deploy the capital in suitable investments. The adverse impact on the prevailing market prices for our common stock could be greater if we issue debt securities or other securities requiring the payment of interest and are unable to timely deploy the capital in suitable investments.
There is a risk that investors in our equity securities may not receive distributions or that our distributions may not grow over time.
We intend to make distributions on a quarterly basis to our stockholders out of assets legally available for distribution. There can be no assurance that we will achieve investment results that will allow us to make a specified level of cash distributions or year-to-year increases in cash distributions. If we declare a distribution and if more stockholders opt to receive cash distributions rather than participate in our dividend reinvestment plan, we may be forced to sell some of our investments in order to make cash distributions. In addition, due to the asset coverage test applicable to us as a BDC, we may be limited in our ability to make distributions. Further, if we invest a greater amount of assets in equity securities that do not pay current dividends, it could reduce the amount available for distribution.
If we issue preferred stock, the net asset value and market value of our common stock may become more volatile.
We cannot assure you that the issuance of preferred stock would result in a higher yield or return to the holders of our common stock. The issuance of preferred stock would likely cause the net asset value and market value of our common stock to become more volatile. If the dividend rate on the preferred stock were to approach the net rate of return on our investment portfolio, the benefit of leverage to the holders of our common stock would be reduced. If the dividend rate on the preferred stock were to exceed the net rate of return on our portfolio, the leverage would result in a lower rate of return to the holders of our common stock than if we had not issued preferred stock. Any decline in the net asset value of our investment would be borne entirely by the holders of our common stock. Therefore, if the market value of our portfolio were to decline, the leverage would result in a greater decrease in net asset value to the holders of our common stock than if we were not leveraged through the issuance of preferred stock. This greater net asset value decrease would also tend to cause a greater decline in the market price of our common stock. We might be in danger of failing to maintain the required asset coverage of the preferred stock or of losing our ratings on the preferred stock or, in an extreme case, our current investment income might not be sufficient to meet the dividend requirements on the preferred stock. In order to counteract such an event, we might need to liquidate investments in order to fund a redemption of some or all of the preferred stock. In addition, we would pay (and the holders of our common stock would bear) all costs and expenses relating to the issuance and ongoing maintenance of the preferred stock, including higher Incentive Fees if our total return exceeds the dividend rate on the preferred stock. Holders of preferred stock may have different interests than holders of common stock and may at times have disproportionate influence over our affairs.
We may in the future determine to issue preferred stock, which could adversely affect the market value of our common stock.
The issuance of shares of preferred stock with dividend or conversion rights, liquidation preferences or other economic terms favorable to the holders of preferred stock could adversely affect the market price for our common stock by making an investment in the common stock less attractive. In addition, the dividends on any preferred stock we issue must be cumulative. Payment of dividends and repayment of the liquidation preference of preferred stock must take preference over any dividends or other payments to our common stockholders, and holders of preferred stock are not subject to any of our expenses or losses and are not entitled to participate in any income or appreciation in excess of their stated preference (other than convertible preferred stock that converts into common stock). In addition, under the 1940 Act, preferred stock constitutes a “senior security” for purposes of the 200% asset coverage test.
41
Holders of any preferred stock we might issue would have the right to elect members of our Board of Directors and class voting rights on certain matters.
Holders of any preferred stock we might issue, voting separately as a single class, would have the right to elect two members of our Board of Directors at all times and in the event dividends become two full years in arrears would have the right to elect a majority of the directors until such arrearage is completely eliminated. In addition, preferred stockholders have class voting rights on certain matters, including changes in fundamental investment restrictions and conversion to open-end status, and accordingly can veto any changes. Restrictions imposed on the declarations and payment of dividends or other distributions to the holders of our common stock and preferred stock, both by the 1940 Act and by requirements imposed by rating agencies, might impair our ability to maintain our qualification as a RIC for federal income tax purposes. While we would intend to redeem our preferred stock to the extent necessary to enable us to distribute our income as required to maintain our qualification as a RIC, there can be no assurance that such actions could be effected in time to meet the tax requirements.
Certain provisions of the Delaware General Corporation Law and our certificate of incorporation and bylaws could deter takeover attempts and have an adverse impact on the price of our common stock.
The Delaware General Corporation Law, our amended certificate of incorporation and our amended and restated bylaws contain provisions that may have the effect of discouraging a third party from making an acquisition proposal for us. These anti-takeover provisions may inhibit a change in control in circumstances that could give the holders of our common stock the opportunity to realize a premium over the market price of our common stock. We have also adopted measures that may make it difficult for a third party to obtain control of us, including provisions of our amended certificate of incorporation and amended and restated bylaws dividing our Board of Directors in three classes serving staggered three-year terms, requiring the affirmative vote of the holders of 75% of the then outstanding shares of our capital stock entitled to vote to remove a director for cause, and, subject to the rights of any holders of preferred stock, filling any vacancy on our Board of Directors only by a vote of a majority of the directors then in office. The classification of our Board of Directors and the limitations on removal of directors and filling of vacancies could have the effect of making it more difficult for a third party to acquire us, or of discouraging a third party from acquiring us. Our certificate of incorporation and bylaws also provide that special meetings of the stockholders may only be called by our Board of Directors, Chairman, Chief Executive Officer or Secretary. These provisions, as well as other provisions of our amended certificate of incorporation and our amended and restated bylaws, may delay, defer or prevent a transaction or a change in control that might otherwise be in the best interests of our stockholders.
Your interest in us may be diluted if you do not fully exercise your subscription rights in any rights offering we may conduct. In addition, if the subscription price is less than our net asset value per share, then you will experience an immediate dilution of the aggregate net asset value of your shares.
In the event we issue subscription rights, stockholders who do not fully exercise their subscription rights should expect that they will, at the completion of a rights offering pursuant to this prospectus, own a smaller proportional interest in us than would otherwise be the case if they fully exercised their rights. We cannot state precisely the amount of any such dilution in share ownership because we do not know at this time what proportion of the shares will be purchased as a result of such rights offering.
In addition, if the subscription price is less than the net asset value per share of our common stock, then our stockholders would experience an immediate dilution of the aggregate net asset value of their shares as a result of the offering. The amount of any decrease in net asset value is not predictable because it is not known at this time what the subscription price and net asset value per share will be on the expiration date of a rights offering or what proportion of the shares will be purchased as a result of such rights offering. Such dilution could be substantial.
A trading market or market value of our debt securities may fluctuate.
In the event we issue debt securities, they may or may not have an established trading market. We cannot assure you that a trading market for debt securities will ever develop or be maintained if developed. In addition to our creditworthiness, many factors may materially adversely affect the trading market for, and market value of, debt securities we may issue. These factors include, but are not limited to, the following:
|
|
• |
the time remaining to the maturity of these debt securities; |
|
|
• |
the outstanding principal amount of debt securities with terms identical to these debt securities; |
|
|
• |
the ratings assigned by national statistical ratings agencies; |
|
|
• |
the general economic environment; |
42
|
|
• |
the redemption or repayment features, if any, of these debt securities; |
|
|
• |
the level, direction and volatility of market interest rates generally; and |
|
|
• |
market rates of interest higher or lower than rates borne by the debt securities. |
|
|
• |
You should also be aware that there may be a limited number of buyers if and when you decide to sell your debt securities. This too may materially adversely affect the market value of the debt securities or the trading market for the debt securities. |
Terms relating to redemption may materially adversely affect your return on any debt securities that we may issue.
If your debt securities are redeemable at our option, we may choose to redeem your debt securities at times when prevailing interest rates are lower than the interest rate paid on your debt securities. In addition, if your debt securities are subject to mandatory redemption, we may be required to redeem your debt securities also at times when prevailing interest rates are lower than the interest rate paid on your debt securities. In this circumstance, you may not be able to reinvest the redemption proceeds in a comparable security at an effective interest rate as high as your debt securities being redeemed.
Our credit ratings may not reflect all risks of an investment in our debt securities.
Our credit ratings are an assessment by third parties of our ability to pay our obligations. Consequently, real or anticipated changes in our credit ratings will generally affect the market value of our debt securities. Our credit ratings, however, may not reflect the potential impact of risks related to market conditions generally or other factors discussed above on the market value of or trading market for the publicly issued debt securities.
We may initially invest a portion of the net proceeds of offerings pursuant to this prospectus primarily in high-quality short-term investments, which will generate lower rates of return than those expected from the interest generated on first and second lien senior secured loans and mezzanine debt.
We may initially invest a portion of the net proceeds of offerings pursuant to this prospectus primarily in cash, cash equivalents, U.S. government securities and other high-quality short-term investments. These securities generally earn yields substantially lower than the income that we anticipate receiving once we are fully invested in accordance with our investment objective. As a result, we may not, for a time, be able to achieve our investment objective and/or we may need to, for a time, decrease the amount of any dividend that we may pay to our stockholders to a level that is substantially lower than the level that we expect to pay when the net proceeds of offerings are fully invested in accordance with our investment objective. If we do not realize yields in excess of our expenses, we may incur operating losses and the market price of our shares may decline.
None.
We do not own any real estate or other physical properties materially important to our operation. Our administrative and principal executive offices are located at 40 East 52nd Street, New York, NY 10022. We believe that our office facilities are suitable and adequate for our business as it is contemplated to be conducted.
From time to time, we and the Advisor may be a party to certain legal proceedings incidental to the normal course of our business, including the enforcement of our rights under contracts with our portfolio companies. While we cannot predict the outcome of these legal proceedings with certainty, we do not expect that these proceedings will have a material effect on our consolidated financial statements.
Not applicable
43
|
Item 5. |
Market for Registrant’s Common Equity, Related Stockholder Matters and Issuer Purchases of Equity Securities |
Price range of common stock
Our common stock is quoted on The NASDAQ Global Select Market under the symbol “BKCC.” The following table lists the high, low closing sales price and quarter end price for our common stock, the closing sales price as a percentage of net asset value (“NAV”) per share, and quarterly distributions per share for the years ended December 31, 2017 and 2016.
|
|
|
|
|
|
|
Closing Sales Price |
|
|
Premium/ |
|
|
Premium/ |
|
|
|
|
|
|
|
|
|
|||||||||||
|
|
|
NAV(1) |
|
|
High |
|
|
Low |
|
|
Quarter End Price |
|
|
Discount of High Sales Price to NAV(2) |
|
|
Discount of Low Sales Price to NAV(2) |
|
|
Quarter End Price to NAV(3) |
|
|
Declared Distributions |
|
||||||||
|
Year ended December 31, 2017 |
|
|
|
|
|
|
|
|
|
|
|
|
|
|
|
|
|
|
|
|
|
|
|
|
|
|
|
|
|
|
|
|
|
First Quarter |
|
$ |
8.22 |
|
|
$ |
7.88 |
|
|
$ |
7.19 |
|
|
$ |
7.55 |
|
|
|
(4 |
)% |
|
|
(13 |
)% |
|
|
(8 |
)% |
|
$ |
0.18 |
|
|
Second Quarter |
|
$ |
8.33 |
|
|
$ |
7.81 |
|
|
$ |
7.21 |
|
|
$ |
7.49 |
|
|
|
(6 |
)% |
|
|
(13 |
)% |
|
|
(10 |
)% |
|
$ |
0.18 |
|
|
Third Quarter |
|
$ |
7.96 |
|
|
$ |
7.65 |
|
|
$ |
7.12 |
|
|
$ |
7.50 |
|
|
|
(4 |
)% |
|
|
(11 |
)% |
|
|
(6 |
)% |
|
$ |
0.18 |
|
|
Fourth Quarter |
|
$ |
7.83 |
|
|
$ |
7.56 |
|
|
$ |
6.13 |
|
|
$ |
6.23 |
|
|
|
(3 |
)% |
|
|
(22 |
)% |
|
|
(20 |
)% |
|
$ |
0.18 |
|
|
Year Ended December 31, 2016 |
|
|
|
|
|
|
|
|
|
|
|
|
|
|
|
|
|
|
|
|
|
|
|
|
|
|
|
|
|
|
|
|
|
First Quarter |
|
$ |
9.46 |
|
|
$ |
9.54 |
|
|
$ |
8.43 |
|
|
$ |
9.41 |
|
|
|
1 |
% |
|
|
(11 |
)% |
|
|
(1 |
)% |
|
$ |
0.21 |
|
|
Second Quarter |
|
$ |
9.13 |
|
|
$ |
9.56 |
|
|
$ |
7.36 |
|
|
$ |
7.78 |
|
|
|
5 |
% |
|
|
(19 |
)% |
|
|
(15 |
)% |
|
$ |
0.21 |
|
|
Third Quarter |
|
$ |
8.38 |
|
|
$ |
8.83 |
|
|
$ |
7.83 |
|
|
$ |
8.28 |
|
|
|
5 |
% |
|
|
(7 |
)% |
|
|
(1 |
)% |
|
$ |
0.21 |
|
|
Fourth Quarter |
|
$ |
8.21 |
|
|
$ |
8.24 |
|
|
$ |
6.78 |
|
|
$ |
6.96 |
|
|
|
0 |
% |
|
|
(17 |
)% |
|
|
(15 |
)% |
|
$ |
0.21 |
|
|
(1) |
NAV per share is determined as of the last day in the relevant quarter and therefore may not reflect the NAV per share on the date of the high and low sales prices. The NAVs shown are based on outstanding shares at the end of each relevant quarter. |
|
(2) |
The High/Low Closing Sales Price is calculated as of the close of trading on the NASDAQ on a given day in the applicable quarter and the premium/discount of the High/Low Sales Price to NAV is calculated as a percentage of NAV. |
|
(3) |
Calculated as quarter end price divided by NAV. |
Issuer purchases of equity securities
The following table provides information regarding our purchases of our common stock for each month in the year ended December 31, 2017:
|
Period |
|
Average Price Paid per Share(1) |
|
|
Total Number of Shares Purchased |
|
|
Total Number of Shares Purchased as Part of Publicly Announced Plans or Programs |
|
|
Maximum Number (or Approximate Dollar Value) of Shares that May Yet Be Purchased Under the Plans or Programs |
|
||||
|
January 2017 |
|
$ |
— |
|
|
|
— |
|
|
|
— |
|
|
|
1,958,149 |
|
|
February 2017 |
|
|
— |
|
|
|
— |
|
|
|
— |
|
|
|
1,958,149 |
|
|
March 2017 |
|
|
— |
|
|
|
— |
|
|
|
— |
|
|
|
1,958,149 |
|
|
April 2017 |
|
|
— |
|
|
|
— |
|
|
|
— |
|
|
|
1,958,149 |
|
|
May 2017 |
|
|
— |
|
|
|
— |
|
|
|
— |
|
|
|
1,958,149 |
|
|
June 2017 |
|
|
— |
|
|
|
— |
|
|
|
— |
|
|
|
1,958,149 |
|
|
July 2017 |
|
|
— |
|
|
|
— |
|
|
|
— |
|
|
|
2,500,000 |
|
|
August 2017 |
|
|
— |
|
|
|
— |
|
|
|
— |
|
|
|
2,500,000 |
|
|
September 2017 |
|
|
— |
|
|
|
— |
|
|
|
— |
|
|
|
2,500,000 |
|
|
October 2017 |
|
|
— |
|
|
|
— |
|
|
|
— |
|
|
|
2,500,000 |
|
|
November 2017 |
|
|
6.52 |
|
|
|
1,100 |
|
|
|
1,100 |
|
|
|
2,498,900 |
|
|
December 2017 |
|
|
6.37 |
|
|
|
223,789 |
|
|
|
223,789 |
|
|
|
2,275,111 |
|
|
|
|
$ |
6.37 |
|
|
|
224,889 |
|
|
|
224,889 |
|
|
|
|
|
|
|
(1) |
The average priced paid per share includes $0.03 of commission fee paid per share. |
44
The repurchase plan does not obligate us to acquire any specific number of shares and may be discontinued at any time. We intend to fund any repurchases with available cash.
Holders
At March 7, 2018, there were approximately 256 holders of record of our common stock. Such number of stockholders includes institutional or omnibus accounts that hold common stock for multiple underlying investors.
Distributions
Our quarterly distributions, if any, are determined by our Board of Directors. Distributions are declared considering our estimate of annual taxable income available for distribution to stockholders and the amount of taxable income carried over from the prior year for distribution in the current year. We cannot assure stockholders that they will receive any distributions or distributions at a particular level. The following table lists the quarterly distributions per share from our common stock since December 2015:
|
Distribution Amount Per Share Outstanding |
|
Record Date |
|
Payment Date |
|
$0.21 |
|
December 24, 2015 |
|
January 7, 2016 |
|
$0.21 |
|
March 18, 2016 |
|
April 1, 2016 |
|
$0.21 |
|
June 17, 2016 |
|
July 1, 2016 |
|
$0.21 |
|
September 19, 2016 |
|
October 3, 2016 |
|
$0.21 |
|
December 19, 2016 |
|
January 3, 2017 |
|
$0.18 |
|
March 20, 2017 |
|
April 3, 2017 |
|
$0.18 |
|
June 19, 2017 |
|
July 3, 2017 |
|
$0.18 |
|
September 18, 2017 |
|
October 2, 2017 |
|
$0.18 |
|
December 19, 2017 |
|
January 2, 2018 |
|
$0.18 |
|
March 19, 2018 |
|
April 2, 2018 |
Tax characteristics of all distributions are reported to stockholders on Form 1099 after the end of the calendar year.
We have elected to be taxed as a RIC under Subchapter M of the Code. In order to maintain favorable RIC tax treatment, we must distribute annually to our stockholders at least 90% of our ordinary income and realized net short-term capital gains in excess of realized net long-term capital losses, if any, out of the assets legally available for distribution. Under the Regulated Investment Company Modernization Act of 2010, capital losses incurred by the Company after December 31, 2010 will not be subject to expiration. In addition, such losses must be utilized prior to the losses incurred in the years preceding enactment. In order to avoid certain excise taxes imposed on RICs, we must distribute during each calendar year an amount at least equal to the sum of:
|
|
• |
98% of our ordinary income for the calendar year; |
|
|
• |
98.2% of our capital gains in excess of capital losses for the one-year period ending on October 31st; and |
|
|
• |
any ordinary income and net capital gains for preceding years that were not distributed during such years. |
We may, at our discretion, carry forward taxable income in excess of calendar year distributions and pay a 4% excise tax on this income. If we choose to do so, all other things being equal, this would increase expenses and reduce the amounts available to be distributed to our stockholders. We will accrue excise tax on estimated taxable income as required. In addition, although we currently intend to distribute realized net capital gains (i.e., net long-term capital gains in excess of short-term capital losses), if any, at least annually, out of the assets legally available for such distributions, we may in the future decide to retain such capital gains for investment. There was no provision for federal excise taxes recorded for the years ended December 31, 2017, 2016 and 2015.
We maintain an “opt out” dividend reinvestment plan for our common stockholders. As a result, if we declare a distribution, stockholders’ cash distributions will be automatically reinvested in additional shares of our common stock, unless they specifically “opt out” of the dividend reinvestment plan so as to receive cash distributions. With respect to our distributions paid to stockholders during the years ended December 31, 2017, 2016 and 2015, distributions reinvested pursuant to our dividend reinvestment plan totaled $3,506,620, $3,959,945 and $3,700,331, respectively.
Under the terms of an amendment to our dividend reinvestment plan adopted on March 4, 2009, distributions may be made in newly issued or treasury shares of our common stock at a price equal to 95% of the market price on the payment date. This feature of
45
the plan means that, under certain circumstances, we may issue shares of our common stock at a price below net asset value per share, which could cause our stockholders to experience dilution.
We may not be able to achieve operating results that will allow us to make distributions at a specific level or to increase the amount of these distributions from time to time. Also, we may be limited in our ability to make distributions due to the asset coverage test applicable to us as a BDC under the 1940 Act and due to provisions in our existing and future debt arrangements. If we do not distribute a certain percentage of our income annually, we will suffer adverse tax consequences, including possible loss of favorable RIC tax treatment. In addition, in accordance with GAAP and tax regulations, we include in income certain amounts that we have not yet received in cash, such as PIK interest, which represents contractual interest added to the loan balance that becomes due at the end of the loan term, or the accrual of original issue or market discount. Since we may recognize income before or without receiving cash representing such income, we may have difficulty meeting the requirement to distribute at least 90% of our investment company taxable income to obtain tax benefits as a RIC and may be subject to income or excise taxes.
In order to satisfy the annual distribution requirement applicable to RICs, we may have the ability to declare a large portion of a distribution in shares of our common stock instead of in cash. As long as a sufficient portion of such distribution is paid in cash and certain requirements are met, the entire distribution would generally be treated as a dividend for U.S. federal income tax purposes.
Stock performance graph
The following graph compares the return on our common stock with that of the Standard & Poor’s (“S&P”) 500 Total Return Index and the Russell 2000 Index for the period December 31, 2011 through December 31, 2017. The graph assumes that, on December 31, 2011, a person invested $100 in each of our common stock (“BKCC” in the graph), the S&P 500 Total Return Index, and the Russell 2000 Index. The graph measures total shareholder return, which takes into account both changes in stock price and distributions. It assumes that distributions paid are invested in like securities.
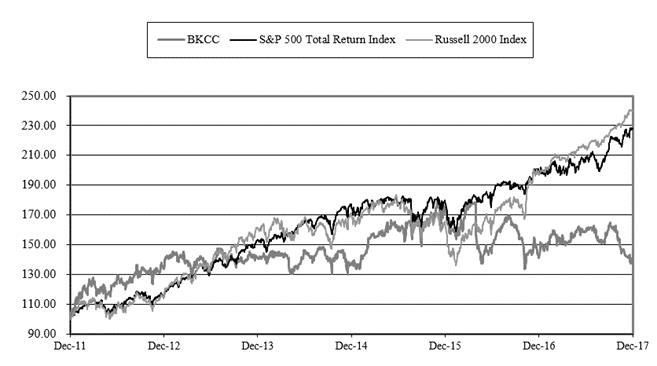
The graph and other information furnished under this Part II Item 5 of this Form 10-K shall not be deemed to be “soliciting material” or to be “filed” with the SEC or subject to Regulation 14A or 14C, or to the liabilities of Section 18 of the Securities Exchange Act of 1934, or the Exchange Act, as amended. The stock price performance included in the above graph is not necessarily indicative of future stock performance.
46
The unaudited Consolidated Statement of Operations Data, Consolidated Per Share Data and Consolidated Balance Sheet Data for each of the five years in the period ended December 31, 2017 are derived from our consolidated financial statements which have been audited by Deloitte & Touche LLP, our independent registered public accounting firm. This selected financial data should be read in conjunction with our consolidated financial statements and related notes thereto and “Management’s Discussion and Analysis of Financial Condition and Results of Operations” included elsewhere in this Annual Report.
|
|
|
Year ended December 31, 2017 |
|
|
Year ended December 31, 2016 |
|
|
Year ended December 31, 2015 |
|
|
Year ended December 31, 2014 |
|
|
Year ended December 31, 2013 |
|
|||||
|
|
|
(Dollars in thousands, except per share data) |
|
|||||||||||||||||
|
Consolidated Statement of Operations Data: |
|
|
|
|
|
|
|
|
|
|
|
|
|
|
|
|
|
|
|
|
|
Total Investment Income |
|
$ |
97,329 |
|
|
$ |
117,411 |
|
|
$ |
129,411 |
|
|
$ |
134,418 |
|
|
$ |
131,626 |
|
|
Total Expenses |
|
|
42,238 |
|
|
|
63,374 |
|
|
|
54,220 |
|
|
|
84,046 |
|
|
|
83,988 |
|
|
Net Investment Income |
|
|
55,092 |
|
|
|
54,037 |
|
|
|
75,191 |
|
|
|
50,372 |
|
|
|
47,638 |
|
|
Net Realized and Unrealized Gain (Loss) including Realized Losses on Extinguishment of Debt |
|
|
(34,190 |
) |
|
|
(138,329 |
) |
|
|
(36,566 |
) |
|
|
86,868 |
|
|
|
45,351 |
|
|
Net Increase (Decrease) in Net Assets Resulting from Operations |
|
|
20,902 |
|
|
|
(84,292 |
) |
|
|
38,625 |
|
|
|
137,240 |
|
|
|
92,989 |
|
|
Consolidated Per Share Data: |
|
|
|
|
|
|
|
|
|
|
|
|
|
|
|
|
|
|
|
|
|
Net Asset Value Per Common Share at Year End |
|
$ |
7.83 |
|
|
$ |
8.21 |
|
|
$ |
10.17 |
|
|
$ |
10.49 |
|
|
$ |
9.54 |
|
|
Market Price at Year End |
|
|
6.23 |
|
|
|
6.96 |
|
|
|
9.40 |
|
|
|
8.20 |
|
|
|
9.33 |
|
|
Net Investment Income |
|
|
0.75 |
|
|
|
0.74 |
|
|
|
1.01 |
|
|
|
0.68 |
|
|
|
0.64 |
|
|
Net Realized and Unrealized Gain (Loss) including Realized Losses on Extinguishment of Debt |
|
|
(0.46 |
) |
|
|
(1.90 |
) |
|
|
(0.49 |
) |
|
|
1.16 |
|
|
|
0.61 |
|
|
Net Increase (Decrease) in Net Assets Resulting from Operations |
|
|
0.29 |
|
|
|
(1.16 |
) |
|
|
0.52 |
|
|
|
1.84 |
|
|
|
1.25 |
|
|
Distributions Declared |
|
|
0.72 |
|
|
|
0.84 |
|
|
|
0.84 |
|
|
|
0.89 |
|
|
|
1.04 |
|
|
Consolidated Balance Sheet Data at Year End: |
|
|
|
|
|
|
|
|
|
|
|
|
|
|
|
|
|
|
|
|
|
Total Assets |
|
$ |
799,880 |
|
|
$ |
957,067 |
|
|
$ |
1,150,315 |
|
|
$ |
1,302,056 |
|
|
$ |
1,281,647 |
|
|
Borrowings Outstanding |
|
|
206,661 |
|
|
|
335,668 |
|
|
|
362,552 |
|
|
|
441,391 |
|
|
|
470,425 |
|
|
Total Net Assets |
|
|
571,100 |
|
|
|
596,320 |
|
|
|
753,753 |
|
|
|
781,959 |
|
|
|
709,704 |
|
|
Other Data: |
|
|
|
|
|
|
|
|
|
|
|
|
|
|
|
|
|
|
|
|
|
Total Return(1) |
|
|
(0.6 |
)% |
|
|
(18.1 |
)% |
|
|
26.5 |
% |
|
|
(2.2 |
)% |
|
|
3.6 |
% |
|
Number of Portfolio Companies at Year End |
|
|
30 |
|
|
|
38 |
|
|
|
45 |
|
|
|
47 |
|
|
|
51 |
|
|
Value of Investments at Year End |
|
$ |
757,941 |
|
|
$ |
931,123 |
|
|
$ |
1,116,997 |
|
|
$ |
1,257,717 |
|
|
$ |
1,217,972 |
|
|
Yield on Investments at Year End(2) |
|
|
9.7 |
% |
|
|
10.5 |
% |
|
|
11.0 |
% |
|
|
11.6 |
% |
|
|
12.0 |
% |
Figures may not total due to rounding
|
(1) |
Total return is based on the change in market price during the respective years. Total return calculations take into account distributions, if any, reinvested in accordance with the Company’s dividend reinvestment plan and do not reflect brokerage commissions. |
|
(2) |
Yield on investments at year end represents the weighted average yield on the debt and income producing equity securities in our portfolio at their current cost basis. Yields are computed using interest rates and dividend yields at year end and include amortization of loan origination and commitment fees, original issue discount and market premium or discount. Yields include joint venture investment and exclude common equity investments, preferred equity investments with no stated dividend rate, short-term investments, and cash and cash equivalents. See portfolio yield in Item 7. |
47
The information contained in this section should be read in conjunction with the Selected Financial Data and our consolidated financial statements and notes thereto appearing elsewhere in this Annual Report.
Forward-looking statements
This report, and other statements that we may make, may contain forward-looking statements with respect to future financial or business performance, strategies or expectations. Forward-looking statements are typically identified by words or phrases such as “trend,” “opportunity,” “pipeline,” “believe,” “comfortable,” “expect,” “anticipate,” “current,” “intention,” “estimate,” “position,” “assume,” “potential,” “outlook,” “continue,” “remain,” “maintain,” “sustain,” “seek,” “achieve” and similar expressions, or future or conditional verbs such as “will,” “would,” “should,” “could,” “may” or similar expressions.
Forward-looking statements are subject to numerous assumptions, risks and uncertainties, which change over time. Forward-looking statements speak only as of the date they are made, and we assume no duty to and do not undertake to update forward-looking statements. Actual results could differ materially from those anticipated in forward-looking statements and future results could differ materially from historical performance.
In addition to factors previously disclosed in our SEC reports and those identified elsewhere in this report, including the “Risk Factors” section, the following factors, among others, could cause actual results to differ materially from forward-looking statements or historical performance:
|
|
• |
our future operating results; |
|
|
• |
our business prospects and the prospects of our portfolio companies; |
|
|
• |
the impact of investments that we expect to make; |
|
|
• |
our contractual arrangements and relationships with third parties; |
|
|
• |
the dependence of our future success on the general economy and its impact on the industries in which we invest; |
|
|
• |
the financial condition of and ability of our current and prospective portfolio companies to achieve their objectives; |
|
|
• |
our expected financings and investments; |
|
|
• |
the adequacy of our cash resources and working capital, including our ability to obtain continued financing on favorable terms; |
|
|
• |
the timing of cash flows, if any, from the operations of our portfolio companies; |
|
|
• |
the impact of increased competition; |
|
|
• |
the ability of the Advisor to locate suitable investments for us and to monitor and administer our investments; |
|
|
• |
changes in law and policy accompanying the new administration and uncertainty pending any such changes; |
|
|
• |
increased geopolitical unrest, terrorist attacks or acts of war, which may adversely affect the general economy, domestic and local financial and capital markets, or the specific industries of our portfolio companies; |
|
|
• |
changes and volatility in political, economic or industry conditions, the interest rate environment, foreign exchange rates or financial and capital markets; |
|
|
• |
the unfavorable resolution of legal proceedings; and |
|
|
• |
the impact of changes to tax legislation and, generally, our tax position. |
Overview
We were incorporated in Delaware on April 13, 2005 and commenced operations with private funding on July 25, 2005, and completed our initial public offering on July 2, 2007. Our investment objective is to generate both current income and capital appreciation through debt and equity investments. We invest primarily in middle-market companies in the form of senior and junior secured and unsecured debt securities and loans, each of which may include an equity component, and by making direct preferred, common and other equity investments in such companies.
48
We are externally managed and have elected to be regulated as a BDC under the 1940 Act. As a BDC, we are required to comply with certain regulatory requirements. For instance, we generally have to invest at least 70% of our total assets in “qualifying assets,” including securities of private or thinly traded public U.S. companies, cash, cash equivalents, U.S. Government securities and high-quality debt investments that mature in one year or less.
Certain items previously reported may have been reclassified to conform to the current year presentation.
Investments
Our level of investment activity can and does vary substantially from period to period depending on many factors, including the amount of debt and equity capital available to middle-market companies, the level of merger and acquisition activity, the general economic environment and the competitive environment for the types of investments we make.
As a BDC, we generally do not acquire any assets other than “qualifying assets” specified in the 1940 Act unless, at the time the acquisition is made, at least 70% of our total assets are qualifying assets (with certain limited exceptions). Qualifying assets include investments in “eligible portfolio companies.” Under the relevant SEC rules, the term “eligible portfolio company” includes most private companies, companies whose securities are not listed on a national securities exchange, and certain public companies that have listed their securities on a national securities exchange and have a market capitalization of less than $250 million. These rules also permit us to include as qualifying assets certain follow-on investments in companies that were eligible portfolio companies at the time of initial investment but that no longer meet the definition.
Revenues
We generate revenues primarily in the form of interest on the debt we hold, dividends on our equity interests and capital gains on the sale of warrants and other debt or equity interests that we acquire in portfolio companies. Our investments in fixed income instruments generally have an expected maturity of three to ten years, although we have no lower or upper constraint on maturity, and typically bear interest at a fixed or floating rate. Interest on our debt securities is generally payable quarterly or semi-annually. In some cases, our debt instruments and preferred stock investments may defer payments of cash interest or dividends or pay interest or dividends in-kind. Any outstanding principal amount of our debt securities and any accrued but unpaid interest will generally become due at the maturity date. In addition, we may generate revenue in the form of prepayment fees, commitment, origination, capital structuring fees, and fees for providing significant managerial assistance.
Expenses
Our primary operating expenses include the payment of a base management fee and, depending on our operating results, an incentive management fee, interest and credit facility fees, expenses reimbursable under the management agreement, professional fees, administration fees and the allocable portion of overhead under the administration agreement. The base management fee and incentive management fee compensate the Advisor for work in identifying, evaluating, negotiating, closing and monitoring our investments. Our Current Management Agreement with the Advisor provides that we will reimburse the Advisor for costs and expenses incurred by the Advisor for office space rental, office equipment and utilities allocable to the Advisor under the Current Management Agreement, as well as any costs and expenses incurred by the Advisor relating to any non-investment advisory, administrative or operating services provided by the Advisor to us. We bear all other costs and expenses of our operations and transactions.
Critical accounting policies
Our discussion and analysis of our financial condition and results of operations are based upon our consolidated financial statements, which have been prepared in accordance with GAAP. The preparation of these consolidated financial statements requires management to make estimates and assumptions that affect the reported amounts of assets, liabilities, revenues and expenses. Changes in the economic environment, financial markets and any other parameters used in determining such estimates could cause actual results to differ.
Management considers the significant accounting policies important to understanding the consolidated financial statements. In addition to the discussion below, our significant accounting policies are further described in the notes to the consolidated financial statements. See Note 2 to the consolidated financial statements for a description of significant accounting policies and of recently issued accounting pronouncements. Management considers Investments to be an area deemed a critical accounting policy.
49
Financial and operating highlights
At December 31, 2017:
Investment portfolio, at fair value: $757.9 million
Net assets: $571.1 million
Indebtedness, excluding deferred financing costs: $210.9 million
Net asset value per share: $7.83
Portfolio Activity for the Year Ended December 31, 2017:
Cost of investments during period, including PIK: $243.4 million
Sales, repayments and other exits during period: $386.4 million
Number of portfolio companies at end of period: 30
Operating Results for the Year Ended December 31, 2017:
Net investment income per share: $0.75
Distributions declared per share: $0.72
Basic earnings per share: $0.29
Net investment income: $55.1 million
Net realized and unrealized (losses): $(32.9) million
Realized (losses) on extinguishment of debt: $(1.3) million
Net increase in net assets from operations: $20.9 million
Net investment income per share, as adjusted1: $0.75
Basic earnings per share, as adjusted1: $0.29
Net investment income, as adjusted1: $55.1 million
Net increase in net assets from operations, as adjusted1: $20.9 million
|
|
As Adjusted1: Amounts are adjusted to remove the incentive management fee expense based on gains, as required by GAAP, and to include only the incremental incentive management fee expense based on income. Until March 6, 2017, the incremental incentive management fee was calculated based on the current quarter’s incremental earnings and without any reduction for incentive management fees paid during the prior calendar quarters. After March 6, 2017, incentive management fee expense based on income is calculated for each calendar quarter and may be paid on a quarterly basis if certain thresholds are met. Amounts reflect the Company’s ongoing operating results and reflect the Company’s financial performance over time. |
Portfolio and investment activity
We invested approximately $243.4 million during the year ended December 31, 2017. The new investments consisted of senior secured loans secured by first liens ($126.7 million, or 52.0%) or second liens ($33.5 million, or 13.8%), senior secured notes ($7.3 million, or 3.0%) and unsecured or subordinated debt securities and equity securities ($75.9 million, or 31.2%). Additionally, we received proceeds from sales, repayments and other exits of approximately $386.4 million during the year ended December 31, 2017.
Concentration of our assets in an issuer, industry or sector may present certain risks. To the extent that we assume large positions in the securities of a small number of issuers, our net asset value may fluctuate to a greater extent than that of a diversified investment company as a result of changes in the financial condition or the market’s assessment of the issuer. At December 31, 2017, our portfolio of $757.9 million (at fair value) consisted of 30 portfolio companies and was invested 53% in senior secured loans, 17% in unsecured or subordinated debt securities, 27% in equity investments and 3% in senior secured notes. Our average investment by portfolio company at amortized cost, excluding investments below $5.0 million, was approximately $33.0 million at December 31, 2017. Our largest portfolio company investment by value was approximately $83.1 million and our five largest portfolio company investments by value comprised approximately 33% of our portfolio at December 31, 2017. At December 31, 2016, our portfolio of $931.1 million (at fair value) consisted of 38 portfolio companies and was invested 59% in senior secured loans, 17% in unsecured or subordinated debt securities, 17% in equity investments and 7% in senior secured notes. Our average investment by portfolio company at amortized cost, excluding investments below $5.0 million, was approximately $31.8 million at December 31, 2016. Our largest portfolio company investment by value was approximately $87.4 million and our five largest portfolio company investments by value comprised approximately 27% of our portfolio at December 31, 2016.
50
In addition, we may, from time to time, invest a substantial portion of our assets in the securities of issuers in any single industry or sector of the economy or in only a few issuers. A downturn in an industry or sector in which we are concentrated could have a larger impact on us than on a company that does not concentrate in that particular industry or sector. Our investment advisor monitors industry and sector uncertainties on an ongoing basis, including substantial regulatory challenges in the healthcare sector, volatility and extensive government regulation in the financial services sector, cyclical risks associated with the overall economy that may affect the consumer products sector, risks related to the costs of raw materials and energy affecting the chemicals sector, cyclicality within the energy sector as a result of fluctuations in commodity prices and demand for, and production of commodities, among various other industry and sector uncertainties due to certain exposures. At December 31, 2017, our top three industry concentrations at fair value consisted of Finance (29.5%), Chemicals, Plastics, & Rubber (16.3%) and Services: Business (9.9%). At December 31, 2016, our top three industry concentrations at fair value consisted of Finance (21.1%), Chemicals, Plastics, & Rubber (12.3%) and Services: Business (11.4%) (See Note 5 to the consolidated financial statements).
The weighted average yield of the debt and income producing equity securities in our portfolio at fair value was 10.8% at December 31, 2017 and 11.7% at December 31, 2016. The weighted average yields on our senior secured loans and other debt securities at fair value were 10.7% and 11.6%, respectively, at December 31, 2017, as compared to 11.3% and 12.4%, respectively, at December 31, 2016. The weighted average yield of the debt and income producing equity securities in our portfolio at their current cost basis was 9.7% at December 31, 2017 and 10.5% at December 31, 2016. The weighted average yields on our senior secured loans and other debt securities at their current cost basis were 9.9% and 8.6%, respectively, at December 31, 2017, as compared to 10.5% and 10.8%, respectively, at December 31, 2016. Yields include joint venture investment and exclude common equity investments, preferred equity investments with no stated dividend rate, short-term investments, and cash and cash equivalents. Additionally, the weighted average yield of the total portfolio, at fair value, was 9.6% and 10.1% for year ended December 31, 2017 and 2016, respectively. The weighted average yield of the total portfolio, at amortized cost, was 8.7% and 9.2% for year ended December 31, 2017 and 2016, respectively.
For the year ended December 31, 2017 and 2016, the total return based on net asset value was 5.89% and (10.70%), respectively, and, the total return based on market price was (0.61%) and (18.10%), respectively. Total returns are historical and are calculated by determining the percentage change in the net asset value or market price with all distributions reinvested, if any. Distributions are assumed to be reinvested in accordance with our dividend reinvestment plan and do not reflect brokerage commissions.
The Advisor generally employs a grading system for our entire portfolio. The Advisor grades all loans on a scale of 1 to 4. This system is intended to reflect the performance of the borrower’s business, the collateral coverage of the loans and other factors considered relevant. Generally, the Advisor assigns only one loan grade to each portfolio company for all loan investments in that portfolio company; however, the Advisor will assign multiple ratings when appropriate for different investments in one portfolio company. The following is a description of the conditions associated with each investment rating:
Grade 1: Investments in portfolio companies whose performance is substantially within the Advisor’s expectations and whose risk factors are neutral to favorable to those at the time of the original investment.
Grade 2: Investments in portfolio companies whose performance is below the Advisor’s expectations and that require closer monitoring; however, no loss of investment return (interest and/or dividends) or principal is expected.
Grade 3: Investments in portfolio companies whose performance is below the Advisor’s expectations and for which risk has increased materially since origination. Some loss of investment return is expected, but no loss of principal is expected. Companies graded 3 generally will be out of compliance with debt covenants and will be unlikely to make debt repayments on their original schedule.
Grade 4: Investments in portfolio companies whose performance is materially below the Advisor’s expectations where business trends have deteriorated and risk factors have increased substantially since the original investment. Investments graded 4 are those for which some loss of principal is expected.
51
The Advisor monitors and, when appropriate, changes the investment ratings assigned to each investment in our portfolio. In connection with our valuation process, the Advisor and Board of Directors review these investment ratings on a quarterly basis. Our average investment rating was 1.35 at December 31, 2017 and 1.35 at December 31, 2016. The following is a distribution of the investment ratings of our portfolio companies at December 31, 2017 and 2016:
|
|
|
December 31, 2017 |
|
|
December 31, 2016 |
|
||
|
Grade 1 |
|
$ |
642,413,532 |
|
|
$ |
696,150,783 |
|
|
Grade 2 |
|
|
35,193,161 |
|
|
|
133,487,483 |
|
|
Grade 3 |
|
|
14,630,321 |
|
|
|
88,655,801 |
|
|
Grade 4 |
|
|
65,698,306 |
|
|
|
5,005,487 |
|
|
Not Rated |
|
|
5,487 |
|
|
|
7,823,936 |
|
|
Total investments |
|
$ |
757,940,807 |
|
|
$ |
931,123,490 |
|
Results of operations
Results comparisons are for the years ended December 31, 2017, 2016 and 2015.
Investment income
|
|
|
Year ended December 31, 2017 |
|
|
Year ended December 31, 2016 |
|
|
Year ended December 31, 2015 |
|
|||
|
Investment Income: |
|
|
|
|
|
|
|
|
|
|
|
|
|
Interest and fees on senior secured loans |
|
$ |
58,293,684 |
|
|
$ |
77,140,788 |
|
|
$ |
83,482,008 |
|
|
Interest and fees on other debt securities |
|
|
26,078,745 |
|
|
|
32,937,283 |
|
|
|
40,396,745 |
|
|
Interest earned on short-term investments, cash equivalents |
|
|
83,604 |
|
|
|
22,328 |
|
|
|
7,142 |
|
|
Dividends on equity securities |
|
|
12,282,748 |
|
|
|
6,209,988 |
|
|
|
5,524,712 |
|
|
Other income |
|
|
590,429 |
|
|
|
1,100,000 |
|
|
|
— |
|
|
Total investment income |
|
$ |
97,329,210 |
|
|
$ |
117,410,387 |
|
|
$ |
129,410,607 |
|
Total investment income for year end December 31, 2017 decreased $20.1 million, or 17.1%, as compared to year ended December 31, 2016, primarily attributable to a 24.6% decrease in the December 31, 2017 debt portfolio, at amortized cost, as compared to December 31, 2016. The decrease in portfolio size is primarily due to dispositions in 2017, the impact of which was partially offset by a higher rate environment during the year and higher dividend income from Senior Loan Partners. Other income of $590,429, and $1,100,000, for the years ended December 31, 2017 and December 31, 2016, respectively, are reimbursements in connection with the legal settlement expense that was incurred during the third quarter of 2016.
Total investment income for year ended December 31, 2016 decreased $12.0 million, or 9.3%, as compared to year ended December 31, 2015, primarily attributable to investments on non-accrual status: 5.4%, 11.1%, 12.7%, and 15.3% of the debt portfolio, at amortized cost, was on non-accrual status as of the end of the fourth, third, second and first quarters of 2016, respectively. In addition, there was a 20.3% decrease in the December 31, 2016 debt portfolio, at amortized cost, as compared to December 31, 2015. The impact of a smaller interest income generating portfolio was partially offset by increase in fee income of $2.5 million, or 44.2%, compared to year ended December 31, 2015.
52
|
|
|
Year ended December 31, 2017 |
|
|
Year ended December 31, 2016 |
|
|
Year ended December 31, 2015 |
|
|||
|
Expenses: |
|
|
|
|
|
|
|
|
|
|
|
|
|
Base management fees |
|
$ |
16,391,532 |
|
|
$ |
21,460,909 |
|
|
$ |
24,678,087 |
|
|
Legal settlement |
|
|
— |
|
|
|
17,500,000 |
|
|
|
— |
|
|
Incentive management fees |
|
|
7,980,098 |
|
|
|
— |
|
|
|
(3,189,459 |
) |
|
Interest and credit facility fees |
|
|
18,205,912 |
|
|
|
16,661,674 |
|
|
|
24,290,518 |
|
|
Professional fees |
|
|
2,708,262 |
|
|
|
2,544,235 |
|
|
|
2,081,220 |
|
|
Administrative services |
|
|
1,039,221 |
|
|
|
1,304,172 |
|
|
|
1,614,561 |
|
|
Director fees |
|
|
668,500 |
|
|
|
706,500 |
|
|
|
698,500 |
|
|
Investment advisor expenses |
|
|
350,004 |
|
|
|
350,004 |
|
|
|
798,139 |
|
|
Other |
|
|
2,874,087 |
|
|
|
2,846,328 |
|
|
|
3,247,998 |
|
|
Total expenses, before incentive management fee waiver |
|
|
50,217,616 |
|
|
|
63,373,822 |
|
|
|
54,219,564 |
|
|
Incentive management fee waiver |
|
|
(7,980,098 |
) |
|
|
— |
|
|
|
— |
|
|
Expenses, net of incentive management fee waiver |
|
$ |
42,237,518 |
|
|
$ |
63,373,822 |
|
|
$ |
54,219,564 |
|
Total expenses, net of incentive management fee waiver, decreased $21.1 million, or 33.4%, for year ended December 31, 2017 from comparable period in 2016, primarily due to a one-time legal settlement expense of $17,500,000 incurred in 2016 related to a former portfolio company. The one-time legal settle expense was one of the primary drivers for the increase of $9.2 million, or 16.9%, in total expenses for year ended December 31, 2016 from comparable period in 2015.
The decrease of $5.1 million, or 23.6%, in base management fees for the year ended December 31, 2017 from comparable period in 2016 was primarily due to a decline in the total assets on which management fees are calculated (in arrears). The decrease in total assets was primarily resulting from net sales, repayments and other exits of $142,987,202 during 2017. Additionally, after March 6, 2017, the rate used to calculate management fees decreased from 2.0% of total assets to 1.75% of total assets, excluding cash (See Note 3 to the consolidated financial statements). The decrease of $3.2 million, or 13.0%, in base management fees for the year ended December 31, 2016 from comparable period in 2015 was primarily due to a decline in the total assets on which management fees are calculated (in arrears), primarily resulting from $53,748,320 of unrealized losses for 2016 as well as $51,745,089 of net sales, repayments and other exits for the year.
Investment advisor and administrative services expenses decreased $0.3 million, or 16.0%, for year ended December 31, 2017 compared to 2016 primarily due to continuous streamlining of processes and efficiency gained from integration on to the BlackRock platform and changes in the mix of employees supporting these processes since the third quarter of 2015. Investment advisor and administrative services expenses decreased $0.8 million, or 31.4%, for year ended December 31, 2016 compared to 2015 for the same reason.
Professional fees and other expenses were substantially consistent for year ended December 31, 2017 compared to year ended December 31, 2016. Professional fees increased $0.5 million, or 22.2%, for year ended December 31, 2016 compared to 2015 primarily to non-recurring legal fees in connection with a legal settlement related to a former portfolio company during 2016. Other expenses for the year ended December 31, 2016 decreased $0.4 million, or 12.4%, from 2015, primarily due to a one-time blocker tax expense incurred in 2015.
Interest and credit facility fees increased $1.5 million, or 9.3%, for the year ended December 31, 2017 compared to 2016, due to interest expense in connection with the newly issued 2022 Convertible Notes, slightly offset by decrease in interest due to partial purchase of 2018 Convertible Notes in 2017 (See Note 7 to the consolidated financial statements). Interest and credit facility fees decreased $7.6 million, or 31.4%, for the year ended December 31, 2016 compared to 2015 primarily due to the refinancing of the Senior Secured Notes under the Credit Facility during January 2016, as well as the refinancing of the Credit Facility during February 2016 which reduced pricing up to 50 basis points per annum.
Of the incentive management fee totals (net of the incentive management fee waiver) for the years ended December 31, 2017, 2016 and 2015, zero, zero and $11,061, respectively, were incentive management fees based on income. As previously disclosed, the Advisor, in consultation with the Company’s Board of Directors, has agreed to waive incentive fees based on income through December 31, 2018 (See Note 3 to the consolidated financial statements). For the years ended December 31, 2017, 2016, and 2015, zero, zero and $(3,200,520), respectively, were incentive management fees based on gains. In accordance with GAAP, a hypothetical liquidation is performed each quarter end resulting in an additional accrual of incentive management fees based on gains if the amount
53
is positive, or a reduction of the expense if the amount is negative. It should be noted, however, that a fee so calculated and accrued is not due or payable, if at all, until the end of each measurement period, or every June 30.
Net investment income
Net investment income was $55,091,692, $54,036,565 and $75,191,043, respectively, for the years ended December 31, 2017, 2016 and 2015. For year ended December 31, 2017, net investment income increased $1.1 million, or 2.0%, compared to 2016, due to a decrease in expenses of 33.4%, partially offset by a decrease in total investment income of 17.1%. For the year ended December 31, 2016, net investment income decreased $21.2 million, or 28.1%, compared to 2015, due to an increase in expenses of 16.9% in addition to a 9.3% decline in total investment income.
Net realized gain or loss
Net realized gain (loss) on investments was $(52,438,824), $(84,580,169) and $122,257,526 for the years ended December 31, 2017, 2016 and 2015, respectively. Of the total net realized losses for the year ended December 31, 2017, there were realized losses of $61,420,809 which were primarily a result of restructurings, amendments or write-offs associated with our debt investments in Advanced Lighting Technologies, Inc, (“Advanced Lighting”), debt and equity investments in U.S. Well Services, LLC (“USWS”), and debt investment in Shoreline Energy LLC (“Shoreline”). These realized losses were partially offset by realized gains of $8,981,985, primarily associated with the disposition of equity investment in USI Senior Holdings, Inc. and equity investments in Bankruptcy Management Solutions, Inc. Of the net realized losses for the year ended December 31, 2016, $82,838,804 was driven by losses realized on the restructuring of our debt and equity investments in ETX Energy, LLC, et al., (“New Gulf”), as well as the restructuring of our debt investments in Hunter Defense Technologies, Inc. (“Hunter”) and Vertellus Specialties Inc. (“Vertellus”). Nearly the entire realized loss was reflected in unrealized depreciation in prior periods. Net realized gains for the year ended December 31, 2015 were generated primarily from the sales of our equity investments in M&M Tradition Holdings Corp., Marquette Transportation Company Holdings LLC, Penton Business Media Holdings, LLC, Oportun Financial Corporation and USI Senior Holdings, Inc., partially offset by realized losses on the restructuring of our investments in Red Apple Stores Inc., WBS Group LLC and Westward Dough Holdings, LLC. Nearly the entire realized gain was reflected in unrealized appreciation in prior periods.
Net change in unrealized appreciation or depreciation
For the year ended December 31, 2017, the net change in unrealized appreciation or depreciation was a decrease in net unrealized depreciation of $19,573,031 comprised of $92,125,454 total unrealized appreciation, $60,149,211 of which is resulting from the reversal of previously recognized depreciation upon dispositions, namely Shoreline, USWS, and Advanced Lighting. The appreciation was partially offset by $72,552,423 of unrealized depreciation, $9,635,137 of which is resulting from the reversal of previously recognized appreciation upon dispositions associated with investments, namely in Bankruptcy Management Solutions, Inc., USI Senior Holdings, Inc., and Higginbotham Investment Holdings, LLC. Additional depreciation is due to portfolio valuations during the year. For the year ended December 31, 2016, the change in net unrealized appreciation or depreciation was an increase in net unrealized depreciation of $53,748,320 comprised of $128,811,954 of overall net declines due to portfolio valuations during the year, partially offset by $75,063,634 of total unrealized appreciation primarily resulting from the reversal of previously recognized depreciation upon dispositions, namely the New Gulf, Hunter and Vertellus restructurings. For the year ended December 31, 2015, the change in net unrealized appreciation or depreciation was a decrease in net unrealized appreciation of $158,823,485 primarily resulting from the reversal of previously recognized appreciation associated with the sale of our equity positions in M&M Tradition Holdings Corp., Marquette Transportation Company Holdings LLC, Penton Business Media Holdings, LLC, Oportun Financial Corporation, and USI Senior Holdings, Inc.
Net increase or decrease in net assets resulting from operations
The net increase (decrease) in net assets resulting from operations was $20,902,457, $(84,291,924) and $38,625,084 for the years ended December 31, 2017, 2016 and 2015, respectively. As compared to the year ended December 31, 2016, the increase during the current year is reflective of i) an overall increase in net investment income of $1,055,127 taken in conjunction with ii) a decrease in net realized and unrealized losses of $105,462,696 year-over-year. The impact of these factors was partially offset by the realized loss of $1,323,442 incurred in 2017 associated with debt extinguishment (See Note 7 to the consolidated financial statements). For the year ended December 31, 2016, as compared to the year ended December 31, 2015, the decrease is reflective of an overall decrease in net investment income of $21,154,478, taken in conjunction with an increase in net realized and unrealized losses of $101,762,530 year-over-year.
54
Supplemental Non-GAAP information
We report our financial results on a GAAP basis; however, management believes that evaluating our ongoing operating results may be enhanced if investors have additional non-GAAP basis financial measures. Management reviews non-GAAP financial measures to assess ongoing operations and, for the reasons described below, considers them to be effective indicators, for both management and investors, of our financial performance over time. Management does not advocate that investors consider such non-GAAP financial measures in isolation from, or as a substitute for, financial information prepared in accordance with GAAP.
Until March 6, 2017, we recorded our liability for Incentive Fees based on income as we become legally obligated to pay them, based on a hypothetical liquidation at the end of each reporting period. Our obligation to pay Incentive Fees with respect to any fiscal quarter until March 6, 2017 was based on a formula that reflects our results over a trailing four-fiscal quarter period ending with the pro-rated period until March 6, 2017. We are legally obligated to pay the amount resulting from the formula less any cash payments of Incentive Fees during the prior three quarters. The formula’s requirement to reduce the Incentive Fees by amounts paid with respect to Incentive Fees in the prior three quarters has caused our Incentive Fees expense to become generally concentrated in the fourth quarter of each year. Management believes that reflecting Incentive Fees throughout the year, as the related investment income is earned on a quarterly basis, is an effective measure of our profitability and financial performance that facilitates comparison of current results with historical results and with those of our peers. Our “as adjusted” results reflect Incentive Fees based on the formula we utilized for each trailing four-fiscal quarter period until March 6, 2017, with the formula applied to each quarter’s incremental earnings and without any reduction for Incentive Fees paid during the prior three quarters. The resulting amount represents an upper limit of each quarter’s incremental Incentive Fees that we may become legally obligated to pay at the end of the year. Prior year amounts are estimated in the same manner. These estimates represent upper limits because, in any calendar year, subsequent quarters’ investment underperformance could reduce the Incentive Fees payable with respect to prior quarters’ operating results. After March 6, 2017, Incentive Fees based on income are calculated for each calendar quarter and may be paid on a quarterly basis if certain thresholds are met. We record our liability for incentive management fees based on capital gains by performing a hypothetical liquidation at the end of each reporting period. The accrual of this hypothetical capital gains incentive management fee is required by GAAP, but it should be noted that a fee so calculated and accrued is not due and payable until the end of the measurement period, or every June 30. The incremental incentive management fees disclosed for a given period are not necessarily indicative of actual full year results. Changes in the economic environment, financial markets and other parameters used in determining such estimates could cause actual results to differ and such differences could be material. See Note 3 to the consolidated financial statements in this Annual Report for a more detailed description of the Company’s incentive management fee.
Computations for all periods are derived from our consolidated financial statements as follows:
|
|
|
Year ended December 31, 2017 |
|
|
Year ended December 31, 2016 |
|
|
Year ended December 31, 2015 |
|
|||
|
GAAP Basis: |
|
|
|
|
|
|
|
|
|
|
|
|
|
Net Investment Income |
$ |
|
55,091,692 |
|
$ |
|
54,036,565 |
|
$ |
|
75,191,043 |
|
|
Net Investment Income per share |
|
|
0.75 |
|
|
|
0.74 |
|
|
|
1.01 |
|
|
Addback: GAAP incentive management fee expense based on Gains |
|
|
— |
|
|
|
— |
|
|
|
(3,200,520 |
) |
|
Addback: GAAP incentive management fee expense based on Income |
|
|
— |
|
|
|
— |
|
|
|
11,061 |
|
|
Pre-Incentive Fee1: |
|
|
|
|
|
|
|
|
|
|
|
|
|
Net Investment Income |
$ |
|
55,091,692 |
|
$ |
|
54,036,565 |
|
$ |
|
72,001,584 |
|
|
Net Investment Income per share |
|
|
0.75 |
|
|
|
0.74 |
|
|
|
0.97 |
|
|
Less: Incremental incentive management fee expense based on Income |
|
|
— |
|
|
|
— |
|
|
|
— |
|
|
As Adjusted2: |
|
|
|
|
|
|
|
|
|
|
|
|
|
Net Investment Income |
$ |
|
55,091,692 |
|
$ |
|
54,036,565 |
|
$ |
|
71,990,523 |
|
|
Net Investment Income per share |
|
|
0.75 |
|
|
|
0.74 |
|
|
|
0.97 |
|
Pre-Incentive Fee1: Amounts are adjusted to remove all incentive management fees. Such fees are calculated but not necessarily due and payable at this time.
As Adjusted2: Amounts are adjusted to remove the incentive management fee expense based on gains, as required by GAAP, and to include only the incremental incentive management fee expense based on income. Until March 6, 2017, the incremental incentive management fee is calculated based on the current quarter’s incremental earnings, and without any reduction for incentive
55
management fees paid during the prior calendar quarters. After March 6, 2017, incentive management fee expense based on income is calculated for each calendar quarter and may be paid on a quarterly basis if certain thresholds are met. Amounts reflect the Company’s ongoing operating results and reflect the Company’s financial performance over time.
Financial condition, liquidity and capital resources
During the year ended December 31, 2017, we generated operating cash flows primarily from interest and fees received on senior secured loans and other debt securities, as well as from sales of selected portfolio company investments or repayments of principal. Net cash provided by operating activities for the year ended December 31, 2017 was $198,924,222. Our primary source of cash from operating activities during the year consisted of proceeds from sales and repayments of $386,382,563, net of purchases of $229,881,402, which excludes PIK, for a net source of $156,501,161.
Net cash used in financing activities for the year ended December 31, 2017 was $180,617,411. Our uses of cash for financing activities consisted of cash distributions paid of $51,137,931, purchases of treasury stock of $1,431,681, and $132,385,430 in debt repayments, net of borrowings.
During the year ended December 31, 2016, we generated operating cash flows primarily from interest and fees received on senior secured loans and other debt securities, as well as from sales of selected portfolio company investments or repayments of principal. Net cash provided by operating activities for the year ended December 31, 2016 was $100,257,026. Our primary source of cash from operating activities during the year consisted of proceeds from sales and repayments of $377,154,842, net of purchases of $313,451,428, which excludes PIK, for a net source of $63,703,414.
Net cash used in financing activities for the year ended December 31, 2016 was $101,963,392. Our uses of cash for financing activities consisted of cash distributions paid of $57,345,936, purchases of treasury stock of $16,093,205, and $28,524,251 in debt repayments, net of borrowings.
Contractual obligations
A summary of our significant contractual payment obligations for the repayment of outstanding borrowings at December 31, 2017 is as follows:
|
|
|
Payments Due By Period (dollars in millions) |
||||||||||||||
|
|
|
Total |
|
|
Less than 1 year |
|
|
1-3 years |
|
|
3-5 years |
|
After 5 years |
|||
|
Credit Facility(1) |
|
$ |
16.0 |
|
|
$ |
— |
|
|
$ |
— |
|
$ |
16.0 |
|
$ — |
|
2022 Convertible Notes |
|
|
139.8 |
|
|
|
— |
|
|
|
— |
|
|
139.8 |
|
— |
|
Convertible Notes(2) |
|
|
55.0 |
|
|
|
55.0 |
|
|
|
— |
|
|
— |
|
— |
|
Interest and Credit Facility Fees Payable |
|
|
1.8 |
|
|
|
1.8 |
|
|
|
— |
|
|
— |
|
— |
|
(1) |
At December 31, 2017, $424.0 million remained undrawn under our Credit Facility. |
|
(2) |
On September 27, 2017, we purchased $60.0 million in aggregate principal amount of our existing $115.0 million Convertible Notes pursuant to a cash tender offer. All Convertible Notes purchased in the tender offer were retired and cancelled, and are no longer outstanding under the indenture. The remaining $55.0 million Convertible Notes matured on February 15, 2018 and we paid the principal and interest in cash (See Note 7 to the consolidated financial statements). |
56
Our quarterly distributions, if any, are determined by our Board of Directors. Distributions are declared considering our estimate of annual taxable income available for distribution to stockholders and the amount of taxable income carried over from the prior year for distribution in the current year. We cannot assure stockholders that they will receive any distributions at all or distributions at a particular level. The following table lists the quarterly distributions per share from our common stock since December 2015:
|
|
Distribution Amount |
|
|
|
|
|
|
|
|
|
Per Share |
|
|
|
|
|
|
|
|
|
Outstanding |
|
|
Record Date |
|
Payment Date |
|
|
|
|
$ |
0.21 |
|
|
December 24, 2015 |
|
January 7, 2016 |
|
|
|
$ |
0.21 |
|
|
March 18, 2016 |
|
April 1, 2016 |
|
|
|
$ |
0.21 |
|
|
June 17, 2016 |
|
July 1, 2016 |
|
|
|
$ |
0.21 |
|
|
September 19, 2016 |
|
October 3, 2016 |
|
|
|
$ |
0.21 |
|
|
December 19, 2016 |
|
January 3, 2017 |
|
|
|
$ |
0.18 |
|
|
March 20, 2017 |
|
April 3, 2017 |
|
|
|
$ |
0.18 |
|
|
June 19, 2017 |
|
July 3, 2017 |
|
|
|
$ |
0.18 |
|
|
September 18, 2017 |
|
October 2, 2017 |
|
|
|
$ |
0.18 |
|
|
December 19, 2017 |
|
January 2, 2018 |
|
|
|
$ |
0.18 |
|
|
March 19, 2018 |
|
April 2, 2018 |
|
Tax characteristics of all distributions are reported to stockholders on Form 1099 after the end of the calendar year.
We have elected to be taxed as a RIC under Subchapter M of the Code. In order to maintain favorable RIC tax treatment, we must distribute annually to our stockholders at least 90% of our ordinary income and realized net short-term capital gains in excess of realized net long-term capital losses, if any, out of the assets legally available for distribution. Under the Regulated Investment Company Modernization Act of 2010, capital losses incurred by the Company after December 31, 2010 will not be subject to expiration. In addition, such losses must be utilized prior to the losses incurred in the years preceding enactment. In order to avoid certain excise taxes imposed on RICs, we must distribute during each calendar year an amount at least equal to the sum of:
|
|
• |
98% of our ordinary income for the calendar year; |
|
|
• |
98.2% of our capital gains in excess of capital losses for the one-year period ending on October 31st; and |
|
|
• |
any ordinary income and net capital gains for preceding years that were not distributed during such years. |
We may, at our discretion, carry forward taxable income in excess of calendar year distributions and pay a 4% excise tax on this income. If we choose to do so, all other things being equal, this would increase expenses and reduce the amounts available to be distributed to our stockholders. We will accrue excise tax on estimated taxable income as required. In addition, although we currently intend to distribute realized net capital gains (i.e., net long-term capital gains in excess of short-term capital losses), if any, at least annually, out of the assets legally available for such distributions, we may in the future decide to retain such capital gains for investment. There was no provision for federal excise taxes recorded for the years ended December 31, 2017, 2016 and 2015.
We maintain an “opt out” dividend reinvestment plan for our common stockholders. As a result, except as discussed below, if we declare a distribution, stockholders’ cash distributions will be automatically reinvested in additional shares of our common stock, unless they specifically “opt out” of the dividend reinvestment plan so as to receive cash distributions. With respect to our distributions paid to stockholders during the years ended December 31, 2017, 2016 and 2015, distributions reinvested pursuant to our dividend reinvestment plan totaled $3,506,620, $3,959,945 and $3,700,331, respectively.
Under the terms of an amendment to our dividend reinvestment plan adopted on March 4, 2009, distributions may be paid in newly issued or treasury shares of our common stock at a price equal to 95% of the market price on the payment date. This feature of the plan means that, under certain circumstances, we may issue shares of our common stock at a price below net asset value per share, which could cause our stockholders to experience dilution. We may not be able to achieve operating results that will allow us to make distributions at a specific level or to increase the amount of these distributions from time to time. Also, we may be limited in our ability to make distributions due to the asset coverage test applicable to us as a BDC under the 1940 Act and due to provisions in our existing and future debt arrangements.
57
If we do not distribute a certain percentage of our income annually, we will suffer adverse tax consequences, including possible loss of favorable RIC tax treatment. In addition, in accordance with U.S. generally accepted accounting principles and tax regulations, we include in income certain amounts that we have not yet received in cash, such as payment-in-kind interest, which represents contractual interest added to the loan balance that becomes due at the end of the loan term, or the accretion of original issue or market discount. Since we may recognize income before or without receiving cash representing such income, we may have difficulty meeting the requirement to distribute at least 90% of our investment company taxable income to obtain tax benefits as a RIC and may be subject to income or excise taxes. In order to satisfy the annual distribution requirement applicable to RICs, we may have the ability to declare a large portion of a dividend in shares of our common stock instead of in cash. As long as a sufficient portion of such dividend is paid in cash and certain requirements are met, the entire distribution would generally be treated as a dividend for U.S. federal income tax purposes.
Off-balance sheet arrangements
In the normal course of business, we may enter into guarantees on behalf of portfolio companies. Under these arrangements, we would be required to make payments to third parties if the portfolio companies were to default on their related payment obligations. There were no such guarantees outstanding at December 31, 2017 and 2016. In addition, from time to time, we may provide for a commitment to a portfolio company for investment in an existing or new security. At December 31, 2017 and 2016, we were obligated to existing portfolio companies for unfunded commitments of $42.1 million and $43.5 million, respectively. Of the $42.1 million total unfunded commitments at December 31, 2017, $12.7 million was on our aggregate $85.0 million equity commitment to the Senior Loan Partners (see Note 5 to the consolidated financial statements). We maintain sufficient cash on hand and available borrowings to fund such unfunded commitments should the need arise.
Recent developments
On March 6, 2018, our Board of Directors declared a distribution of $0.18 per share, payable on April 2, 2018 to stockholders of record at the close of business on March 19, 2018.
On February 15, 2018, the remaining Convertible Notes of $55,041,000 matured and we paid the principal and interest in cash (See Note 7 to the consolidated financial statements).
On January 16, 2018, the SEC issued an order permitting us and certain of our affiliates to complete negotiated co-investment transactions in portfolio companies, subject to certain conditions (the “Order”). Subject to satisfaction of certain conditions to the Order, we are now permitted, together with any future business development companies, registered closed-end funds and certain private funds, each of whose investment advisor is our investment advisor or an investment advisor controlled by our investment advisor, to co-invest in negotiated investment opportunities where doing so would otherwise be prohibited under the 1940 Act, providing our shareholders with access to a broader array of investment opportunities.
On January 16, 2018, we announced that BlackRock Advisors assigned the BlackRock Advisors Management Agreement, dated March 6, 2015, to a wholly owned subsidiary, BlackRock Capital Investment Advisors, LLC ("BCIA") pursuant to Rule 2a-6 of the 1940 Act. Accordingly, BCIA is now our investment adviser. BCIA and we amended and restated the BlackRock Advisors Management Agreement in its entirety to acknowledge such assignment and to delete certain portions of the BlackRock Advisors Management Agreement that are no longer operative in accordance with their terms. There will be no change to the fees, nor to the personnel overseeing the provision of investment management services to us.
Notice is hereby given in accordance with Section 23(c) of the 1940 Act that from time to time the Company may purchase shares of its common stock in the open market at prevailing market prices.
58
We are subject to financial market risks, including changes in interest rates. At December 31, 2017, 73% of our debt investments bore interest based on floating rates, such as LIBOR, the Federal Funds Rate or the Prime Rate. The interest rates on such investments generally reset by reference to the current market index after one to six months. Of those floating rate debt investments, 96% contained an interest rate floor. Floating rate investments subject to a floor generally reset by reference to the current market index after one to six months only if the index exceeds the floor. Interest rate sensitivity refers to the change in our earnings that may result from changes in the level of interest rates. Since we fund a portion of our investments with borrowings, our net investment income is affected by the difference between the rate at which we invest and the rate at which we borrow. Our Credit Facility bears interest at variable rates with no interest rate floors, while our Convertible Notes and 2022 Convertible Notes bear interest at fixed rates. As a result, there can be no assurance that a significant change in market interest rates will not have a material adverse effect on our net investment income.
The following table shows the approximate annual impact on net investment income of base rate changes in interest rates (considering interest rate floors for variable rate instruments) to our debt portfolio and outstanding borrowings as of December 31, 2017, assuming no changes to our investment and borrowing structure:
|
|
|
Net Investment Income(1) |
|
|
Net Investment Income Per Share(1) |
|
||
|
Basis Point Change ($’s in millions, except per share data) |
|
|
|
|
|
|
|
|
|
Up 400 basis points |
|
$ |
15.9 |
|
|
$ |
0.22 |
|
|
Up 300 basis points |
|
$ |
11.9 |
|
|
$ |
0.16 |
|
|
Up 200 basis points |
|
$ |
8.0 |
|
|
$ |
0.11 |
|
|
Up 100 basis points |
|
$ |
4.0 |
|
|
$ |
0.05 |
|
|
Down 100 basis points |
|
$ |
(2.0 |
) |
|
$ |
(0.03 |
) |
|
(1) |
Excludes the impact of incentive management fees based on income |
While hedging activities may help to insulate us against adverse changes in interest rates, they also may limit our ability to participate in the benefits of lower interest rates with respect to our portfolio of investments. There can be no assurance that we will be able to effectively hedge our interest rate risk. During the years ended December 31, 2017, 2016 and 2015, we did not engage in any interest rate hedging activity.
See the Index to Consolidated Financial Statements on page F-1.
None.
(a) Evaluation of Disclosure Controls and Procedures. The Company’s management, with the participation of the Company’s Chief Executive Officer and Interim Chief Financial Officer, has evaluated the effectiveness of the Company’s disclosure controls and procedures (as defined in Rules 13a-15(e) and 15d-15(e) of the Exchange Act) as of the end of the period covered by this report. Based upon such evaluation, the Company’s Chief Executive Officer and Interim Chief Financial Officer concluded that the Company’s disclosure controls and procedures were effective as of December 31, 2017, to provide assurance that information that is required to be disclosed by the Company in the reports that it files or submits under the Exchange Act is recorded, processed, summarized, and reported, within the time periods specified by the SEC’s rules and forms. Disclosure controls and procedures, include without limitation, controls and procedures designed to ensure that information required to be disclosed by the Company in the reports that it files or submits under the Exchange Act is accumulated and communicated to the Company’s management, including its Chief Executive Officer and Interim Chief Financial Officer, or persons performing similar functions, as appropriate to allow timely decisions regarding required disclosure.
59
(b) Management’s Report on Internal Control Over Financial Reporting. The Company’s management is responsible for establishing and maintaining adequate internal control over financial reporting (as defined in Rules 13a-15(f) and 15d-15(f) of the Exchange Act). Under the supervision and with the participation of management, including the Chief Executive Officer and Interim Chief Financial Officer, the Company conducted an evaluation of the effectiveness of the Company’s internal control over financial reporting based on the criteria established in Internal Control—Integrated Framework (2013) issued by the Committee of Sponsoring Organizations of the Treadway Commission (COSO). Based on the Company’s evaluation under the framework in Internal Control—Integrated Framework (2013), management concluded that the Company’s internal control over financial reporting was effective as of December 31, 2017. The Company’s internal control over financial reporting as of December 31, 2017 has been audited by our independent registered public accounting firm, Deloitte & Touche LLP, as stated in its report titled “Report of Independent Registered Public Accounting Firm” on the following page.
Because of its inherent limitations, internal control over financial reporting may not prevent or detect misstatements. Also, projections of any evaluation of effectiveness to future periods are subject to the risk that controls may become inadequate because of changes in conditions, or that the degree of compliance with the policies or procedures may deteriorate.
(c) Attestation Report of the Registered Public Accounting Firm. Our independent registered public accounting firm, Deloitte & Touche LLP, has issued an attestation report on the Company’s internal control over financial reporting, which is set forth on the following page.
(d) Changes in Internal Control Over Financial Reporting. There have been no changes in our internal control over financial reporting (as defined in Rules 13a-15(f) and 15d-15(f) of the Exchange Act) during our most recently completed fiscal quarter, that have materially affected, or are reasonably likely to materially affect, our internal control over financial reporting.
None.
60
REPORT OF INDEPENDENT REGISTERED PUBLIC ACCOUNTING FIRM
To the Board of Directors and Stockholders of
BlackRock Capital Investment Corporation:
Opinion on Internal Control over Financial Reporting
We have audited the internal control over financial reporting of BlackRock Capital Investment Corporation and subsidiaries (the “Company”) as of December 31, 2017, based on criteria established in Internal Control — Integrated Framework (2013) issued by the Committee of Sponsoring Organizations of the Treadway Commission (COSO). In our opinion, the Company maintained, in all material respects, effective internal control over financial reporting as of December 31, 2017, based on criteria established in Internal Control — Integrated Framework (2013) issued by COSO.
We have also audited, in accordance with the standards of the Public Company Accounting Oversight Board (United States) (PCAOB), the consolidated statements of assets and liabilities, including the consolidated schedules of investments, and the related consolidated statements of operations, cash flows, changes in net assets and financial highlights as of and for the year ended December 31, 2017, of the Company and our report dated March 7, 2018, expressed an unqualified opinion on those consolidated financial statements.
Basis for Opinion
The Company’s management is responsible for maintaining effective internal control over financial reporting and for its assessment of the effectiveness of internal control over financial reporting, included in the accompanying Management’s Report on Internal Control over Financial Reporting. Our responsibility is to express an opinion on the Company’s internal control over financial reporting based on our audit. We are a public accounting firm registered with the PCAOB and are required to be independent with respect to the Company in accordance with the U.S. federal securities laws and the applicable rules and regulations of the Securities and Exchange Commission and the PCAOB.
We conducted our audit in accordance with the standards of the PCAOB. Those standards require that we plan and perform the audit to obtain reasonable assurance about whether effective internal control over financial reporting was maintained in all material respects. Our audit included obtaining an understanding of internal control over financial reporting, assessing the risk that a material weakness exists, testing and evaluating the design and operating effectiveness of internal control based on the assessed risk, and performing such other procedures as we considered necessary in the circumstances. We believe that our audit provides a reasonable basis for our opinion.
Definition and Limitations of Internal Control over Financial Reporting
A company’s internal control over financial reporting is a process designed to provide reasonable assurance regarding the reliability of financial reporting and the preparation of financial statements for external purposes in accordance with generally accepted accounting principles. A company’s internal control over financial reporting includes those policies and procedures that (1) pertain to the maintenance of records that, in reasonable detail, accurately and fairly reflect the transactions and dispositions of the assets of the company; (2) provide reasonable assurance that transactions are recorded as necessary to permit preparation of financial statements in accordance with generally accepted accounting principles, and that receipts and expenditures of the company are being made only in accordance with authorizations of management and directors of the company; and (3) provide reasonable assurance regarding prevention or timely detection of unauthorized acquisition, use, or disposition of the company’s assets that could have a material effect on the financial statements.
Because of its inherent limitations, internal control over financial reporting may not prevent or detect misstatements. Also, projections of any evaluation of effectiveness to future periods are subject to the risk that controls may become inadequate because of changes in conditions, or that the degree of compliance with the policies or procedures may deteriorate.
/s/ Deloitte & Touche LLP
New York, New York
March 7, 2018
61
The information required by this item is contained in the Registrant’s definitive Proxy Statement for its 2018 Annual Stockholders Meeting to be filed with the Securities and Exchange Commission within 120 days after December 31, 2017 and is incorporated herein by reference.
The information required by this item is contained in the Registrant’s definitive Proxy Statement for its 2018 Annual Stockholders Meeting to be filed with the Securities and Exchange Commission within 120 days after December 31, 2017 and is incorporated herein by reference.
|
Item 12. |
Security Ownership of Certain Beneficial Owners and Management and Related Stockholders Matters |
The information required by this item is contained in the Registrant’s definitive Proxy Statement for its 2018 Annual Stockholders Meeting to be filed with the Securities and Exchange Commission within 120 days after December 31, 2017 and is incorporated herein by reference.
The information required by this item is contained in the Registrant’s definitive Proxy Statement for its 2018 Annual Stockholders Meeting to be filed with the Securities and Exchange Commission within 120 days after December 31, 2017 and is incorporated herein by reference.
The information required by this item is contained in the Registrant’s definitive Proxy Statement for its 2018 Annual Stockholders Meeting to be filed with the Securities and Exchange Commission within 120 days after December 31, 2017 and is incorporated herein by reference.
62
The following documents are filed as part of this Annual Report:
|
|
(1) |
Consolidated Financial Statements—See the Index to Consolidated Financial Statements on page F-1. |
|
|
(2) |
Consolidated Financial Statement Schedules—None. We have omitted financial statements schedules because they are not required or are not applicable, or the required information is shown in the consolidated financial statements or notes to the consolidated financial statements. |
|
|
(3) |
Exhibits—Please note that the agreements included as exhibits to this Form 10-K are included to provide information regarding their terms and are not intended to provide any other factual or disclosure information about BlackRock Capital Investment Corporation or the other parties to the agreements. The agreements contain representations and warranties by each of the parties to the applicable agreement that have been made solely for the benefit of the other parties to the applicable agreement and may not describe the actual state of affairs as of the date they were made or at any other time. |
63
|
Number |
|
Description |
|
|
|
|
|
|
|
|
|
14.3 |
|
|
|
|
|
|
|
21.1* |
|
|
|
|
|
|
|
31.1* |
|
|
|
|
|
|
|
31.2* |
|
|
|
|
|
|
|
32.1* |
|
|
* |
Filed herewith. |
|
(1) |
Previously filed with the Registrant’s Registration Statement on Form 10 (Commission File No. 000-51327), as amended, originally filed on May 24, 2005. |
|
(2) |
Previously filed with the Registrant’s Form 8-K dated as of March 9, 2015. |
|
(3) |
Previously filed with the Registrant’s pre-effective Amendment No. 2 to the Registration Statement on Form N-2 (Commission File No. 333-141090), filed on June 14, 2007. |
|
(4) |
Previously filed with the Registrant’s Form 10-K dated as of December 31, 2005 |
|
(5) |
Previously filed with the Registrant’s Form 8-K dated as of March 4, 2009. |
|
(6) |
Previously filed with the Registrant’s Form 8-K dated as of February 19, 2013. |
|
(7) |
Previously filed with the Registrant’s Form 8-K dated as of March 27, 2014. |
|
(8) |
Previously filed with the Registrant’s Form 10-K for the year ended December 31, 2009. |
|
(9) |
Previously filed with the Registrant’s Form 10-K for the year ended December 31, 2008. |
|
(10) |
Previously filed with the Registrant’s Form 8-K dated as of June 29, 2016. |
|
(11) |
Previously filed with the Registrant’s Form 8-K dated as of June 5, 2017. |
|
(12) |
Previously filed with the Registrant’s Form 8-K dated as of June 13, 2017. |
|
(13) |
Previously filed with the Registrant’s Form N-2 under the Securities Act of 1933 (File No. 333-203068), filed on March 27, 2015. |
64
INDEX TO CONSOLIDATED FINANCIAL STATEMENTS
|
|
F-2 |
|
|
|
|
|
|
|
F-3 |
|
|
|
|
|
|
|
F-4 |
|
|
|
|
|
|
|
F-5 |
|
|
|
|
|
|
|
F-6 |
|
|
|
|
|
|
|
F-7 |
|
|
|
|
|
|
|
F-21 |
F-1
REPORT OF INDEPENDENT REGISTERED PUBLIC ACCOUNTING FIRM
To the Board of Directors and Stockholders of
BlackRock Capital Investment Corporation:
Opinion on the Financial Statements and Financial Highlights
We have audited the accompanying consolidated statements of assets and liabilities of BlackRock Capital Investment Corporation and subsidiaries (the "Company"), including the consolidated schedules of investments, as of December 31, 2017 and 2016, the related consolidated statements of operations, cash flows, and changes in net assets for each of the three years in the period then ended, the consolidated financial highlights for each of the five years in the period then ended, and the related notes (collectively referred to as the “consolidated financial statements and financial highlights”). In our opinion, the consolidated financial statements and financial highlights present fairly, in all material respects, the financial position of the Company as of December 31, 2017 and 2016, and the results of its operations, changes in net assets, and cash flows for each of the three years in the period then ended, and the financial highlights for each of the five years in the period then ended, in conformity with accounting principles generally accepted in the United States of America.
We have also audited, in accordance with the standards of the Public Company Accounting Oversight Board (United States) (PCAOB), the Company's internal control over financial reporting as of December 31, 2017, based on criteria established in Internal Control — Integrated Framework (2013) issued by the Committee of Sponsoring Organizations of the Treadway Commission and our report dated March 7, 2018, expressed an unqualified opinion on the Company's internal control over financial reporting.
Basis for Opinion
These consolidated financial statements and financial highlights are the responsibility of the Company's management. Our responsibility is to express an opinion on the Company's consolidated financial statements and financial highlights based on our audits. We are a public accounting firm registered with the PCAOB and are required to be independent with respect to the Company in accordance with the U.S. federal securities laws and the applicable rules and regulations of the Securities and Exchange Commission and the PCAOB.
We conducted our audits in accordance with the standards of the PCAOB. Those standards require that we plan and perform the audit to obtain reasonable assurance about whether the consolidated financial statements and financial highlights are free of material misstatement, whether due to error or fraud.
Our audits included performing procedures to assess the risks of material misstatement of the consolidated financial statements and financial highlights, whether due to error or fraud, and performing procedures that respond to those risks. Such procedures included examining, on a test basis, evidence regarding the amounts and disclosures in the consolidated financial statements and financial highlights. Our audits also included evaluating the accounting principles used and significant estimates made by management, as well as evaluating the overall presentation of the consolidated financial statements and financial highlights. Our procedures included confirmation of investments owned as of December 31, 2017 and 2016, by correspondence with the custodian, loan agents, and borrowers; when replies were not received, we performed other auditing procedures. We believe that our audits provide a reasonable basis for our opinion.
/s/ Deloitte & Touche LLP
New York, New York
March 7, 2018
We have served as the Company's auditor since 2005.
F-2
BlackRock Capital Investment Corporation
Consolidated Statements of Assets and Liabilities
|
|
|
December 31, 2017 |
|
|
December 31, 2016 |
|
||
|
Assets |
|
|
|
|
|
|
|
|
|
Investments at fair value: |
|
|
|
|
|
|
|
|
|
Non-controlled, non-affiliated investments (cost of $311,938,762 and $586,176,755) |
|
$ |
261,683,202 |
|
|
$ |
512,308,390 |
|
|
Non-controlled, affiliated investments (cost of $195,354,637 and $112,640,458) |
|
|
215,779,077 |
|
|
|
109,342,171 |
|
|
Controlled investments (cost of $321,999,526 and $322,768,014) |
|
|
280,478,528 |
|
|
|
309,472,929 |
|
|
Total investments at fair value (cost of $829,292,925 and $1,021,585,227) |
|
|
757,940,807 |
|
|
|
931,123,490 |
|
|
Cash and cash equivalents |
|
|
29,014,645 |
|
|
|
10,707,834 |
|
|
Receivable for investments sold |
|
|
1,344,918 |
|
|
|
449,578 |
|
|
Interest, dividends and fees receivable |
|
|
8,342,780 |
|
|
|
10,750,723 |
|
|
Prepaid expenses and other assets |
|
|
3,236,819 |
|
|
|
4,035,866 |
|
|
Total Assets |
|
$ |
799,879,969 |
|
|
$ |
957,067,491 |
|
|
Liabilities |
|
|
|
|
|
|
|
|
|
Debt (net of deferred financing costs of $4,209,445 and $1,054,266) |
|
$ |
206,661,272 |
|
|
$ |
335,667,906 |
|
|
Interest and credit facility fees payable |
|
|
1,820,971 |
|
|
|
3,280,961 |
|
|
Distributions payable |
|
|
13,152,924 |
|
|
|
15,262,010 |
|
|
Base management fees payable |
|
|
3,734,655 |
|
|
|
4,860,614 |
|
|
Payable for investments purchased |
|
|
479,297 |
|
|
|
— |
|
|
Accrued administrative services |
|
|
114,995 |
|
|
|
— |
|
|
Other accrued expenses and payables |
|
|
2,815,923 |
|
|
|
1,675,631 |
|
|
Total Liabilities |
|
|
228,780,037 |
|
|
|
360,747,122 |
|
|
Net Assets |
|
|
|
|
|
|
|
|
|
Common stock, par value $.001 per share, 200,000,000 common shares authorized, 77,723,764 and 77,228,207 issued and 72,946,910 and 72,676,242 outstanding |
|
|
77,723 |
|
|
|
77,228 |
|
|
Paid-in capital in excess of par |
|
858,087,822 |
|
|
|
877,300,709 |
|
|
|
Undistributed / (Distributions in excess of) net investment income |
|
|
(13,918,838 |
) |
|
|
(7,965,655 |
) |
|
Accumulated net realized loss on investments and extinguishment of debt |
|
|
(162,723,790 |
) |
|
|
(144,527,577 |
) |
|
Net unrealized appreciation (depreciation), net of tax |
|
|
(72,688,483 |
) |
|
|
(92,261,515 |
) |
|
Treasury stock at cost, 4,776,854 and 4,551,965 shares held |
|
|
(37,734,502 |
) |
|
|
(36,302,821 |
) |
|
Total Net Assets |
|
|
571,099,932 |
|
|
|
596,320,369 |
|
|
Total Liabilities and Net Assets |
|
$ |
799,879,969 |
|
|
$ |
957,067,491 |
|
|
Net Asset Value Per Share |
|
$ |
7.83 |
|
|
$ |
8.21 |
|
The accompanying notes are an integral part of these consolidated financial statements.
F-3
BlackRock Capital Investment Corporation
Consolidated Statements of Operations
|
|
|
Year ended December 31, 2017 |
|
|
Year ended December 31, 2016 |
|
|
Year ended December 31, 2015 |
|
|||
|
Investment Income: |
|
|
|
|
|
|
|
|
|
|
|
|
|
Non-controlled, non-affiliated investments: |
|
|
|
|
|
|
|
|
|
|
|
|
|
Cash interest income |
|
$ |
42,597,334 |
|
|
$ |
67,604,463 |
|
|
$ |
89,080,256 |
|
|
PIK interest income |
|
|
3,340,360 |
|
|
|
8,712,063 |
|
|
|
5,495,545 |
|
|
Cash dividend income |
|
|
404,780 |
|
|
|
— |
|
|
|
220,379 |
|
|
PIK dividend income |
|
|
65,944 |
|
|
|
774,235 |
|
|
|
793,581 |
|
|
Fee income |
|
|
3,213,513 |
|
|
|
7,780,567 |
|
|
|
5,247,708 |
|
|
Total investment income from non-controlled, non-affiliated investments |
|
|
49,621,931 |
|
|
|
84,871,328 |
|
|
|
100,837,469 |
|
|
Non-controlled, affiliated investments: |
|
|
|
|
|
|
|
|
|
|
|
|
|
Cash interest income |
|
|
10,540,239 |
|
|
|
5,946,132 |
|
|
|
5,832,038 |
|
|
PIK interest income |
|
|
4,054,626 |
|
|
|
— |
|
|
|
— |
|
|
PIK dividend income |
|
|
2,997,385 |
|
|
|
1,869,769 |
|
|
|
1,633,135 |
|
|
Fee income |
|
|
506,632 |
|
|
|
— |
|
|
|
— |
|
|
Total investment income from non-controlled, affiliated investments |
|
|
18,098,882 |
|
|
|
7,815,901 |
|
|
|
7,465,173 |
|
|
Controlled investments: |
|
|
|
|
|
|
|
|
|
|
|
|
|
Cash interest income |
|
|
18,714,928 |
|
|
|
19,769,917 |
|
|
|
17,772,177 |
|
|
PIK interest income |
|
|
1,463,401 |
|
|
|
24,885 |
|
|
|
130,138 |
|
|
Cash dividend income |
|
|
8,814,639 |
|
|
|
2,944,334 |
|
|
|
2,224,204 |
|
|
PIK dividend income |
|
|
— |
|
|
|
621,650 |
|
|
|
653,413 |
|
|
Fee income |
|
|
25,000 |
|
|
|
262,372 |
|
|
|
328,033 |
|
|
Total investment income from controlled investments |
|
|
29,017,968 |
|
|
|
23,623,158 |
|
|
|
21,107,965 |
|
|
Other income |
|
|
590,429 |
|
|
|
1,100,000 |
|
|
|
— |
|
|
Total investment income |
|
|
97,329,210 |
|
|
|
117,410,387 |
|
|
|
129,410,607 |
|
|
Expenses: |
|
|
|
|
|
|
|
|
|
|
|
|
|
Base management fees |
|
|
16,391,532 |
|
|
|
21,460,909 |
|
|
|
24,678,087 |
|
|
Legal settlement |
|
|
— |
|
|
|
17,500,000 |
|
|
|
— |
|
|
Incentive management fees |
|
|
7,980,098 |
|
|
|
— |
|
|
|
(3,189,459 |
) |
|
Interest and credit facility fees |
|
|
18,205,912 |
|
|
|
16,661,674 |
|
|
|
24,290,518 |
|
|
Professional fees |
|
|
2,708,262 |
|
|
|
2,544,235 |
|
|
|
2,081,220 |
|
|
Administrative services |
|
|
1,039,221 |
|
|
|
1,304,172 |
|
|
|
1,614,561 |
|
|
Director fees |
|
|
668,500 |
|
|
|
706,500 |
|
|
|
698,500 |
|
|
Investment advisor expenses |
|
|
350,004 |
|
|
|
350,004 |
|
|
|
798,139 |
|
|
Other |
|
|
2,874,087 |
|
|
|
2,846,328 |
|
|
|
3,247,998 |
|
|
Total expenses, before incentive management fee waiver |
|
|
50,217,616 |
|
|
|
63,373,822 |
|
|
|
54,219,564 |
|
|
Incentive management fee waiver (See Note 3) |
|
|
(7,980,098 |
) |
|
|
— |
|
|
|
— |
|
|
Expenses, net of incentive management fee waiver |
|
|
42,237,518 |
|
|
|
63,373,822 |
|
|
|
54,219,564 |
|
|
Net Investment Income |
|
|
55,091,692 |
|
|
|
54,036,565 |
|
|
|
75,191,043 |
|
|
|
|
|
|
|
|
|
|
|
|
|
|
|
|
Realized and Unrealized Gain (Loss): |
|
|
|
|
|
|
|
|
|
|
|
|
|
Net realized gain (loss): |
|
|
|
|
|
|
|
|
|
|
|
|
|
Non-controlled, non-affiliated investments |
|
|
(54,814,358 |
) |
|
|
(83,048,145 |
) |
|
|
28,721,448 |
|
|
Non-controlled, affiliated investments |
|
|
— |
|
|
|
— |
|
|
|
121,381,408 |
|
|
Controlled investments |
|
|
2,375,534 |
|
|
|
(1,532,024 |
) |
|
|
(27,845,330 |
) |
|
Net realized gain (loss) |
|
|
(52,438,824 |
) |
|
|
(84,580,169 |
) |
|
|
122,257,526 |
|
|
Net change in unrealized appreciation (depreciation) on: |
|
|
|
|
|
|
|
|
|
|
|
|
|
Non-controlled, non-affiliated investments |
|
|
23,612,802 |
|
|
|
(25,979,691 |
) |
|
|
(66,265,415 |
) |
|
Non-controlled, affiliated investments |
|
|
23,722,730 |
|
|
|
(6,008,885 |
) |
|
|
(114,059,303 |
) |
|
Controlled investments |
|
|
(28,225,914 |
) |
|
|
(21,967,719 |
) |
|
|
22,751,536 |
|
|
Foreign currency translation |
|
|
463,413 |
|
|
|
207,975 |
|
|
|
(1,250,303 |
) |
|
Net change in unrealized appreciation (depreciation) |
|
|
19,573,031 |
|
|
|
(53,748,320 |
) |
|
|
(158,823,485 |
) |
|
Net realized and unrealized gain (loss) |
|
|
(32,865,793 |
) |
|
|
(138,328,489 |
) |
|
|
(36,565,959 |
) |
|
Realized losses on extinguishment of debt (See Note 7) |
|
|
(1,323,442 |
) |
|
|
— |
|
|
|
— |
|
|
Net Increase (Decrease) in Net Assets Resulting from Operations |
|
$ |
20,902,457 |
|
|
$ |
(84,291,924 |
) |
|
$ |
38,625,084 |
|
|
Net Investment Income Per Share—basic |
|
$ |
0.75 |
|
|
$ |
0.74 |
|
|
$ |
1.01 |
|
|
Earnings (Loss) Per Share—basic |
|
$ |
0.29 |
|
|
$ |
(1.16 |
) |
|
$ |
0.52 |
|
|
Average Shares Outstanding—basic |
|
|
72,983,354 |
|
|
|
72,757,978 |
|
|
|
74,576,277 |
|
|
Net Investment Income Per Share—diluted |
|
$ |
0.73 |
|
|
$ |
0.74 |
|
|
$ |
0.97 |
|
|
Earnings (Loss) Per Share—diluted |
|
$ |
0.29 |
|
|
$ |
(1.16 |
) |
|
$ |
0.52 |
|
|
Average Shares Outstanding—diluted (for Net Investment Income only) |
|
|
90,927,689 |
|
|
|
82,654,705 |
|
|
|
84,473,005 |
|
|
Distributions Declared Per Share |
|
$ |
0.72 |
|
|
$ |
0.84 |
|
|
$ |
0.84 |
|
The accompanying notes are an integral part of these consolidated financial statements.
F-4
BlackRock Capital Investment Corporation
Consolidated Statements of Changes in Net Assets
|
|
|
December 31, 2017 |
|
|
December 31, 2016 |
|
|
December 31, 2015 |
|
|||
|
Net Increase (Decrease) in Net Assets Resulting from Operations: |
|
|
|
|
|
|
|
|
|
|
|
|
|
Net investment income |
|
$ |
55,091,692 |
|
|
$ |
54,036,565 |
|
|
$ |
75,191,043 |
|
|
Net realized gain (loss) |
|
|
(52,438,824 |
) |
|
|
(84,580,169 |
) |
|
|
122,257,526 |
|
|
Net change in unrealized appreciation (depreciation) |
|
|
19,573,031 |
|
|
|
(53,748,320 |
) |
|
|
(158,823,485 |
) |
|
Realized losses on extinguishment of debt |
|
|
(1,323,442 |
) |
|
|
— |
|
|
|
— |
|
|
Net increase (decrease) in net assets resulting from operations |
|
|
20,902,457 |
|
|
|
(84,291,924 |
) |
|
|
38,625,084 |
|
|
Distributions to Stockholders from(1): |
|
|
|
|
|
|
|
|
|
|
|
|
|
Net investment income |
|
|
(52,535,464 |
) |
|
|
(61,007,062 |
) |
|
|
(59,806,876 |
) |
|
Distributions in excess of net investment income |
|
|
— |
|
|
|
— |
|
|
|
(2,799,461 |
) |
|
Tax return of capital |
|
|
— |
|
|
|
— |
|
|
|
— |
|
|
Total distributions |
|
|
(52,535,464 |
) |
|
|
(61,007,062 |
) |
|
|
(62,606,337 |
) |
|
Capital Share Transactions: |
|
|
|
|
|
|
|
|
|
|
|
|
|
Reinvestment of distributions |
|
|
3,506,620 |
|
|
|
3,959,945 |
|
|
|
3,700,331 |
|
|
Issuance of convertible notes |
|
|
4,337,631 |
|
|
|
— |
|
|
|
— |
|
|
Purchases of treasury stock |
|
|
(1,431,681 |
) |
|
|
(16,093,205 |
) |
|
|
(7,925,631 |
) |
|
Net increase (decrease) in net assets resulting from capital share transactions |
|
|
6,412,570 |
|
|
|
(12,133,260 |
) |
|
|
(4,225,300 |
) |
|
Total Increase (Decrease) in Net Assets |
|
|
(25,220,437 |
) |
|
|
(157,432,246 |
) |
|
|
(28,206,553 |
) |
|
Net assets at beginning of year |
|
|
596,320,369 |
|
|
|
753,752,615 |
|
|
|
781,959,168 |
|
|
Net assets at end of year |
|
$ |
571,099,932 |
|
|
$ |
596,320,369 |
|
|
$ |
753,752,615 |
|
|
Capital Share Activity: |
|
|
|
|
|
|
|
|
|
|
|
|
|
Shares issued from reinvestment of distributions |
|
|
495,557 |
|
|
|
481,124 |
|
|
|
440,846 |
|
|
Purchases of treasury stock |
|
|
(224,889 |
) |
|
|
(1,904,064 |
) |
|
|
(889,286 |
) |
|
Net increase (decrease) in shares outstanding |
|
|
270,668 |
|
|
|
(1,422,940 |
) |
|
|
(448,440 |
) |
|
(1) |
Distributions for annual periods determined in accordance with federal income tax regulations. |
The accompanying notes are an integral part of these consolidated financial statements.
F-5
BlackRock Capital Investment Corporation
Consolidated Statements of Cash Flows
|
|
|
December 31, 2017 |
|
|
December 31, 2016 |
|
|
December 31, 2015 |
|
|||
|
Operating Activities: |
|
|
|
|
|
|
|
|
|
|
|
|
|
Net increase (decrease) in net assets resulting from operations |
|
$ |
20,902,457 |
|
|
$ |
(84,291,924 |
) |
|
$ |
38,625,084 |
|
|
Adjustments to reconcile net increase (decrease) in net assets resulting from operations: |
|
|
|
|
|
|
|
|
|
|
|
|
|
PIK interest, dividends and fees |
|
|
(11,985,336 |
) |
|
|
(13,726,015 |
) |
|
|
(8,705,812 |
) |
|
Net amortization on investments |
|
|
(3,535,612 |
) |
|
|
(4,563,399 |
) |
|
|
(3,718,531 |
) |
|
Amortization of debt issuance costs |
|
|
2,055,354 |
|
|
|
1,640,654 |
|
|
|
2,081,949 |
|
|
Net change in unrealized (appreciation) depreciation on investments |
|
|
(19,109,618 |
) |
|
|
53,956,295 |
|
|
|
157,573,182 |
|
|
Net change in unrealized (appreciation) depreciation on foreign currency translation |
|
|
(463,413 |
) |
|
|
(207,975 |
) |
|
|
1,250,303 |
|
|
Net realized (gain) loss on investments |
|
|
52,438,824 |
|
|
|
84,580,169 |
|
|
|
(122,257,526 |
) |
|
Realized losses on extinguishment of debt |
|
|
1,323,442 |
|
|
|
— |
|
|
|
— |
|
|
Changes in operating assets: |
|
|
|
|
|
|
|
|
|
|
|
|
|
Purchase of investments |
|
|
(229,881,402 |
) |
|
|
(313,451,428 |
) |
|
|
(301,490,318 |
) |
|
Proceeds from disposition of investments |
|
|
386,382,563 |
|
|
|
377,154,842 |
|
|
|
417,736,483 |
|
|
Change in receivable for investments sold |
|
|
(30,039 |
) |
|
|
949,318 |
|
|
|
8,951,361 |
|
|
Change in interest, dividends and fees receivable |
|
|
879,320 |
|
|
|
4,548,716 |
|
|
|
(1,755,523 |
) |
|
Change in prepaid expenses and other assets |
|
|
799,047 |
|
|
|
4,281 |
|
|
|
5,880,457 |
|
|
Changes in operating liabilities: |
|
|
|
|
|
|
|
|
|
|
|
|
|
Change in payable for investments purchased |
|
|
479,297 |
|
|
|
— |
|
|
|
— |
|
|
Change in interest and credit facility fees payable |
|
|
(1,459,990 |
) |
|
|
(4,883,731 |
) |
|
|
(53,757 |
) |
|
Change in base management fees payable |
|
|
(1,125,959 |
) |
|
|
(1,125,841 |
) |
|
|
237,236 |
|
|
Change in incentive management fees payable |
|
|
— |
|
|
|
— |
|
|
|
(37,507,592 |
) |
|
Change in accrued administrative services |
|
|
114,995 |
|
|
|
(219,917 |
) |
|
|
(21,583 |
) |
|
Change in other accrued expenses and payables |
|
|
1,140,292 |
|
|
|
(107,019 |
) |
|
|
(366,511 |
) |
|
Net cash provided by (used in) operating activities |
|
|
198,924,222 |
|
|
|
100,257,026 |
|
|
|
156,458,902 |
|
|
Financing Activities: |
|
|
|
|
|
|
|
|
|
|
|
|
|
Distributions paid in cash |
|
|
(51,137,931 |
) |
|
|
(57,345,936 |
) |
|
|
(59,000,183 |
) |
|
Proceeds from debt |
|
|
338,405,657 |
|
|
|
430,475,749 |
|
|
|
238,554,938 |
|
|
Repayments of debt |
|
|
(470,791,087 |
) |
|
|
(459,000,000 |
) |
|
|
(326,000,000 |
) |
|
Issuance of convertible notes |
|
|
4,337,631 |
|
|
|
— |
|
|
|
— |
|
|
Purchase of treasury stock |
|
|
(1,431,681 |
) |
|
|
(16,093,205 |
) |
|
|
(7,925,631 |
) |
|
Net cash provided by (used in) financing activities |
|
|
(180,617,411 |
) |
|
|
(101,963,392 |
) |
|
|
(154,370,876 |
) |
|
Net increase (decrease) in cash and cash equivalents |
|
|
18,306,811 |
|
|
|
(1,706,366 |
) |
|
|
2,088,026 |
|
|
Cash and cash equivalents, beginning of period |
|
|
10,707,834 |
|
|
|
12,414,200 |
|
|
|
10,326,174 |
|
|
Cash and cash equivalents, end of period |
|
$ |
29,014,645 |
|
|
$ |
10,707,834 |
|
|
$ |
12,414,200 |
|
|
Supplemental disclosure of cash flow information and non-cash financing activities: |
|
|
|
|
|
|
|
|
|
|
|
|
|
Cash paid during period for: |
|
|
|
|
|
|
|
|
|
|
|
|
|
Interest |
|
$ |
15,826,644 |
|
|
$ |
18,600,732 |
|
|
$ |
20,891,371 |
|
|
Taxes |
|
$ |
181,996 |
|
|
$ |
354,829 |
|
|
$ |
612,338 |
|
|
Non-cash activities: |
|
|
|
|
|
|
|
|
|
|
|
|
|
Interest and dividends receivable — PIK |
|
$ |
1,528,623 |
|
|
$ |
(1,767,690 |
) |
|
$ |
1,642,806 |
|
|
Distributions reinvested |
|
$ |
3,506,620 |
|
|
$ |
3,959,945 |
|
|
$ |
3,700,331 |
|
The accompanying notes are an integral part of these consolidated financial statements.
F-6
BlackRock Capital Investment Corporation
Consolidated Schedules of Investments
December 31, 2017
|
Portfolio Company(u) |
|
Industry(w) |
|
Interest Rate |
|
|
Maturity |
|
Principal Amount or Number of Shares/Units |
|
|
Cost(a) |
|
|
Fair Value(b) |
|
||||
|
Senior Secured Notes—4.07% |
|
|
|
|
|
|
|
|
|
|
|
|
|
|
|
|
|
|
|
|
|
Advanced Lighting Technologies, Inc., Second Lien(d)(f)(j) |
|
Capital Equipment |
|
18.34% (L + 700, 1.00% Floor Cash / 10.00% PIK) |
|
|
10/4/23 |
|
$ |
5,928,929 |
|
|
$ |
2,181,306 |
|
|
$ |
1,488,161 |
|
|
|
AGY Holding Corp., Second Lien(f)(j) |
|
Chemicals, Plastics, & Rubber |
|
11.00% |
|
|
11/15/18 |
|
|
21,762,500 |
|
|
|
21,591,977 |
|
|
|
21,762,500 |
|
|
|
Total Senior Secured Notes |
|
|
|
|
|
|
|
|
|
|
|
|
|
|
23,773,283 |
|
|
|
23,250,661 |
|
|
Unsecured Debt—16.68% |
|
|
|
|
|
|
|
|
|
|
|
|
|
|
|
|
|
|
|
|
|
CB-HDT Holdings, Inc.(d)(g)(j) |
|
Aerospace & Defense |
|
12.00% PIK |
|
|
12/15/19 |
|
|
5,030,667 |
|
|
|
5,030,667 |
|
|
|
5,030,667 |
|
|
|
Gordon Brothers Finance Company(g)(q) |
|
Finance |
|
12.38% (L + 1100, 1.00% Floor) |
|
|
10/31/21 |
|
|
83,105,886 |
|
|
|
83,105,886 |
|
|
|
83,105,886 |
|
|
|
SVP Worldwide Ltd.(d)(h)(k)(s)(t) |
|
Consumer Goods: Durable |
|
18.00% (2.50% Cash / 13.50% PIK) |
|
|
6/27/18 |
|
|
64,819,604 |
|
|
|
57,657,319 |
|
|
|
7,130,156 |
|
|
|
Total Unsecured Debt |
|
|
|
|
|
|
|
|
|
|
|
|
|
|
145,793,872 |
|
|
|
95,266,709 |
|
|
Subordinated Debt—5.18% |
|
|
|
|
|
|
|
|
|
|
|
|
|
|
|
|
|
|
|
|
|
First Boston Construction Holdings, LLC(d)(g)(k) |
|
Finance |
|
12.00% |
|
|
12/31/20 |
|
|
29,600,000 |
|
|
|
29,600,000 |
|
|
|
29,600,000 |
|
|
|
Total Subordinated Debt |
|
|
|
|
|
|
|
|
|
|
|
|
|
|
29,600,000 |
|
|
|
29,600,000 |
|
|
Senior Secured Loans—70.78%(e) |
|
|
|
|
|
|
|
|
|
|
|
|
|
|
|
|
|
|
|
|
|
Advanced Lighting Technologies, Inc., First Lien(f)(j) |
|
Capital Equipment |
|
8.89% (L+ 750, 1.00% Floor) |
|
|
10/4/22 |
|
|
5,193,160 |
|
|
|
5,093,265 |
|
|
|
5,193,161 |
|
|
|
AGY Holding Corp., First Lien(f) |
|
Chemicals, Plastics, & Rubber |
|
12.00% |
|
|
9/15/18 |
|
|
24,021,390 |
|
|
|
24,021,390 |
|
|
|
24,021,390 |
|
|
|
Bankruptcy Management Solutions, Inc., First Lien |
|
Services: Business |
|
7.07% (L+ 550) |
|
|
3/31/22 |
|
|
16,872,500 |
|
|
|
16,872,500 |
|
|
|
16,872,500 |
|
|
|
JLL Pioneer Inc., Second Lien |
|
Construction & Building |
|
9.83% (L + 850, 1.00% Floor) |
|
|
12/31/20 |
|
|
20,000,000 |
|
|
|
20,000,000 |
|
|
|
20,000,000 |
|
|
|
K2 Pure Solutions Nocal, L.P., First Lien |
|
Chemicals, Plastics, & Rubber |
|
10.57% (L + 900, 1.00% Floor) |
|
|
2/19/21 |
|
|
13,000,000 |
|
|
|
12,907,875 |
|
|
|
13,000,000 |
|
|
|
MBS Group Holdings Inc., First Lien(d)(g)(s) |
|
Services: Business |
|
9.00% PIK |
|
|
6/30/20 |
|
|
41,850,930 |
|
|
|
40,910,000 |
|
|
|
15,104,674 |
|
|
|
MBS OpCo LLC, First Lien(f) |
|
Services: Business |
|
10.57% (L + 900, 1.00% Floor) |
|
|
12/29/22 |
|
|
15,000,000 |
|
|
|
15,000,000 |
|
|
|
15,000,000 |
|
|
|
Midwest Physician Administrative Services, LLC, Second Lien |
|
Healthcare & Pharmaceuticals |
|
8.42% (L + 700, 0.75% Floor) |
|
|
8/15/25 |
|
|
15,000,000 |
|
|
|
14,856,790 |
|
|
|
15,000,000 |
|
|
The accompanying notes are an integral part of these consolidated financial statements.
F-7
BlackRock Capital Investment Corporation
Consolidated Schedules of Investments—(Continued)
December 31, 2017
|
Portfolio Company(u) |
|
Industry(w) |
|
Interest Rate |
|
|
Maturity |
|
Principal Amount or Number of Shares/Units |
|
|
Cost(a) |
|
|
Fair Value(b) |
|
||||
|
Paragon Films, Inc., Second Lien |
|
Containers, Packaging, & Glass |
|
11.40% (L + 1000, 1.00% Floor) |
|
|
6/9/23 |
|
$ |
25,000,000 |
|
|
$ |
24,900,151 |
|
|
$ |
25,000,000 |
|
|
|
Pathway Partners Vet Management Company, LLC, Second Lien |
|
Services: Consumer |
|
9.57%(L + 800, 1.00% Floor) |
|
|
10/10/25 |
|
|
13,888,889 |
|
|
|
13,753,620 |
|
|
|
13,750,000 |
|
|
|
Pomeroy Group LLC, Second Lien |
|
Services: Business |
|
11.48% (L + 1000, 1.00% Floor) |
|
|
11/30/22 |
|
|
27,500,000 |
|
|
|
27,131,236 |
|
|
|
27,500,000 |
|
|
|
Pre-Paid Legal Services, Inc., Second Lien |
|
Services: Consumer |
|
10.57% (L + 900, 1.25% Floor) |
|
|
7/1/20 |
|
|
32,000,000 |
|
|
|
31,866,165 |
|
|
|
32,000,000 |
|
|
|
Red Apple Stores Inc., Second Lien(g)(h)(k) |
|
Retail |
|
10.00% |
|
|
7/24/20 |
|
|
23,050,000 |
|
|
|
23,050,000 |
|
|
|
16,135,000 |
|
|
|
Sur La Table, Inc., First Lien |
|
Retail |
|
12.00% |
|
|
7/28/20 |
|
|
30,000,000 |
|
|
|
30,000,000 |
|
|
|
30,000,000 |
|
|
|
Tri-Anim Health Services, Inc., et al., Second Lien |
|
Healthcare & Pharmaceuticals |
|
11.07% (L + 950, 1.00% Floor) |
|
|
7/28/22 |
|
|
25,000,000 |
|
|
|
24,648,150 |
|
|
|
25,000,000 |
|
|
|
U.S. Well Services, LLC, Revolver(f) |
|
Energy: Oil & Gas |
|
7.35% (L + 600, 1.00% Floor) |
|
|
2/2/22 |
|
|
7,924,583 |
|
|
|
7,924,583 |
|
|
|
7,924,583 |
|
|
|
U.S. Well Services, LLC, First Lien(d)(f) |
|
Energy: Oil & Gas |
|
12.35% (L + 1100, 1.00% Floor PIK) |
|
|
2/2/22 |
|
|
32,457,904 |
|
|
|
32,457,904 |
|
|
|
32,457,904 |
|
|
|
Vertellus Holdings LLC, First Lien(f) |
|
Chemicals, Plastics, & Rubber |
|
10.57% (L + 900, 1.00% Floor) |
|
|
4/30/18 |
|
|
22,461,298 |
|
|
|
22,461,298 |
|
|
|
22,461,298 |
|
|
|
Vertellus Holdings LLC, Second Lien(f) |
|
Chemicals, Plastics, & Rubber |
|
13.57% (L + 1200, 1.00% Floor) |
|
|
10/29/21 |
|
|
15,109,890 |
|
|
|
15,109,890 |
|
|
|
14,958,791 |
|
|
|
VetCor Professional Practices LLC, First Lien |
|
Services: Consumer |
|
7.69% (L + 600, 1.00% Floor) |
|
|
4/20/21 |
|
|
7,000,000 |
|
|
|
7,000,000 |
|
|
|
7,000,000 |
|
|
|
Westmoreland Resource Partners, LP (Oxford Mining Company, LLC), First Lien(d) |
|
Metals & Mining |
|
13.07% (L + 850, 0.75% Floor Cash / 3.00% PIK) |
|
|
12/31/18 |
|
|
26,502,887 |
|
|
|
26,502,887 |
|
|
|
25,840,315 |
|
|
|
Total Senior Secured Loans |
|
|
|
|
|
|
|
|
|
|
|
|
|
|
436,467,704 |
|
|
|
404,219,616 |
|
|
Preferred Stock—10.44% |
|
|
|
|
|
|
|
|
|
|
|
|
|
|
|
|
|
|
|
|
|
Advantage Insurance Inc.(d)(f)(j) |
|
Insurance |
|
8.00% PIK |
|
|
|
|
|
750,000 |
|
|
|
10,349,184 |
|
|
|
9,495,000 |
|
|
|
CB-HDT Holdings, Inc., Series L(c)(g) |
|
Aerospace & Defense |
|
|
|
|
|
|
|
|
1,500,000 |
|
|
|
15,000,000 |
|
|
|
15,000,000 |
|
|
Gordon Brothers Finance Company(g)(q) |
|
Finance |
|
13.50% |
|
|
|
|
|
20,497 |
|
|
|
20,497,135 |
|
|
|
20,497,135 |
|
|
|
KAGY Holding Company, Inc. (AGY Holding Corp.)(d)(f) |
|
Chemicals, Plastics, & Rubber |
|
20.00% PIK |
|
|
|
|
|
22,960 |
|
|
|
10,321,608 |
|
|
|
14,630,321 |
|
|
|
Red Apple Stores Inc.(c)(g)(h)(k) |
|
Retail |
|
|
|
|
|
|
|
|
6,806,383 |
|
|
|
— |
|
|
|
— |
|
|
Total Preferred Stock |
|
|
|
|
|
|
|
|
|
|
|
|
|
|
56,167,927 |
|
|
|
59,622,456 |
|
The accompanying notes are an integral part of these consolidated financial statements.
F-8
BlackRock Capital Investment Corporation
Consolidated Schedules of Investments—(Continued)
December 31, 2017
|
Portfolio Company(u) |
|
Industry(w) |
|
Interest Rate |
|
Maturity |
|
Principal Amount or Number of Shares/Units |
|
|
Cost(a) |
|
|
Fair Value(b) |
|
|||
|
Common Stock—2.84%(c) |
|
|
|
|
|
|
|
|
|
|
|
|
|
|
|
|
|
|
|
Advanced Lighting Technologies, Inc.(f) |
|
Capital Equipment |
|
|
|
|
|
|
149,717 |
|
|
$ |
— |
|
|
$ |
— |
|
|
CB-HDT Holdings, Inc., Series A(g) |
|
Aerospace & Defense |
|
|
|
|
|
|
744,723 |
|
|
|
7,447,230 |
|
|
|
5,608,529 |
|
|
Gordon Brothers Finance Company(g)(q) |
|
Finance |
|
|
|
|
|
|
10,598 |
|
|
|
10,598,300 |
|
|
|
10,598,300 |
|
|
KAGY Holding Company, Inc. (AGY Holding Corp.)(f) |
|
Chemicals, Plastics, & Rubber |
|
|
|
|
|
|
3,131,292 |
|
|
|
— |
|
|
|
— |
|
|
MBS Group Holdings Inc.(g)(p) |
|
Services: Business |
|
|
|
|
|
|
8,500 |
|
|
|
1,000 |
|
|
|
— |
|
|
Red Apple Stores Inc.(g)(h)(i)(k) |
|
Retail |
|
|
|
|
|
|
8,756,859 |
|
|
|
6,982,711 |
|
|
|
— |
|
|
Total Common Stock |
|
|
|
|
|
|
|
|
|
|
|
|
25,029,241 |
|
|
|
16,206,829 |
|
|
Limited Partnership/Limited Liability Company Interests—22.73% |
|
|
|
|
|
|
|
|
|
|
|
|
|
|
|
|
|
|
|
BCIC Senior Loan Partners, LLC(g)(j)(k)(r) |
|
Finance |
|
|
|
|
|
|
72,376,597 |
|
|
|
72,376,597 |
|
|
|
72,376,597 |
|
|
ECI Cayman Holdings, LP(c)(h)(j)(k) |
|
High Tech Industries |
|
|
|
|
|
|
3,189 |
|
|
|
1,299,542 |
|
|
|
3,584,744 |
|
|
ETX Energy, LLC(c)(f)(o) |
|
Energy: Oil & Gas |
|
|
|
|
|
|
51,119 |
|
|
|
— |
|
|
|
— |
|
|
ETX Energy Management Company, LLC(c)(f) |
|
Energy: Oil & Gas |
|
|
|
|
|
|
53,815 |
|
|
|
— |
|
|
|
— |
|
|
First Boston Construction Holdings, LLC(g)(k) |
|
Finance |
|
|
|
|
|
|
7,400,000 |
|
|
|
7,400,000 |
|
|
|
7,421,740 |
|
|
Marsico Holdings, LLC(c)(j) |
|
Finance |
|
|
|
|
|
|
91,445 |
|
|
|
1,848,077 |
|
|
|
5,487 |
|
|
MBS Parent, LLC(c)(f)(v) |
|
Services: Business |
|
|
|
|
|
|
546 |
|
|
|
500,000 |
|
|
|
500,000 |
|
|
U.S. Well Services, LLC, Class A(c)(f)(j)(l) |
|
Energy: Oil & Gas |
|
|
|
|
|
|
19,582,356 |
|
|
|
11,980,712 |
|
|
|
28,370,328 |
|
|
U.S. Well Services, LLC, Class B(c)(f)(j)(l) |
|
Energy: Oil & Gas |
|
|
|
|
|
|
7,157,374 |
|
|
|
4,378,964 |
|
|
|
2,052,153 |
|
|
U.S. Well Services, LLC, Class D(c)(f)(j)(l) |
|
Energy: Oil & Gas |
|
|
|
|
|
|
8,085 |
|
|
|
4,946 |
|
|
|
1,683,267 |
|
|
V Global Holdings LLC(c)(f)(n) |
|
Chemicals, Plastics, & Rubber |
|
|
|
|
|
|
12,087,912 |
|
|
|
11,977,610 |
|
|
|
13,780,220 |
|
|
Westward Dough Holdings, LLC, Class D(c)(m) |
|
Beverage, Food, & Tobacco |
|
|
|
|
|
|
114,706 |
|
|
|
— |
|
|
|
— |
|
|
Total Limited Partnership/Limited Liability Company Interests |
|
|
|
|
|
|
|
|
|
|
|
|
111,766,448 |
|
|
|
129,774,536 |
|
The accompanying notes are an integral part of these consolidated financial statements.
F-9
BlackRock Capital Investment Corporation
Consolidated Schedules of Investments—(Continued)
December 31, 2017
|
Portfolio Company(u) |
|
Industry(w) |
|
Interest Rate |
|
Maturity |
|
Principal Amount or Number of Shares/Units |
|
|
Cost(a) |
|
|
Fair Value(b) |
|
|||
|
Equity Warrants/Options—0.0%(c) |
|
|
|
|
|
|
|
|
|
|
|
|
|
|
|
|
|
|
|
Advanced Lighting Technologies, Inc.(f)(j) |
|
Capital Equipment |
|
|
|
expire 10/4/27 |
|
|
2,360 |
|
|
$ |
— |
|
|
$ |
— |
|
|
Facet Investment, Inc. |
|
Healthcare & Pharmaceuticals |
|
|
|
expire 1/18/21 |
|
|
1,978 |
|
|
|
250,000 |
|
|
|
— |
|
|
Marsico Parent Superholdco, LLC(j) |
|
Finance |
|
|
|
expire 12/14/19 |
|
|
455 |
|
|
|
444,450 |
|
|
|
— |
|
|
Total Equity Warrants/Options |
|
|
|
|
|
|
|
|
|
|
|
|
694,450 |
|
|
|
— |
|
|
TOTAL INVESTMENTS—132.72% |
|
|
|
|
|
|
|
|
|
|
|
$ |
829,292,925 |
|
|
$ |
757,940,807 |
|
|
OTHER ASSETS & LIABILITIES (NET)—(32.72)% |
|
|
|
|
|
|
|
|
|
|
|
|
|
|
|
|
(186,840,875 |
) |
|
NET ASSETS—100.0% |
|
|
|
|
|
|
|
|
|
|
|
|
|
|
|
$ |
571,099,932 |
|
|
(a) |
Represents amortized cost for fixed income securities and cost for preferred and common stock, limited partnership/limited liability company interests and equity warrants/options. |
|
(b) |
Fair value is determined by or under the direction of the Company’s Board of Directors. See Note 2 for further details. |
|
(c) |
Non-income producing equity securities at December 31, 2017. |
|
(d) |
Interest may be paid in cash or payment-in-kind (“PIK”), or a combination thereof which is generally at the option of the borrower. PIK earned is included in the cost basis of the security. In accordance with the Company’s policy, PIK may be recorded on an effective yield basis. |
|
(e) |
Approximately 78.9% of the senior secured loans in the Company’s portfolio bear interest at a floating rate that may be determined by reference to the London Interbank Offered Rate (LIBOR) or other base rate (commonly the Federal Funds Rate or the Prime Rate), at the borrower’s option. In addition, 94.7% of such senior secured loans have floors of 0.75% to 1.25%. The borrower under a senior secured loan generally has the option to select from interest reset periods of one, two, three or six months and may alter that selection at the end of any reset period. The stated interest rate represents the weighted average interest rate at December 31, 2017 of all contracts within the specified loan facility. |
|
(f) |
Transaction and other information for “non-controlled, affiliated” investments under the Investment Company Act of 1940, whereby the Company owns 5% or more (but not more than 25%) of the portfolio company’s outstanding voting securities, is presented in a separate table in Consolidated Schedules of Investments. |
|
(g) |
Transaction and other information for “controlled” investments under the Investment Company Act of 1940, whereby the Company owns more than 25% of the portfolio company’s outstanding voting securities, is presented in a separate table in Consolidated Schedules of Investments. |
|
(h) |
Non-U.S. company or principal place of business outside the U.S. |
|
(i) |
Original purchase denominated in Canadian dollars. |
|
(j) |
Security is exempt from registration under Rule 144A of the Securities Act of 1933. Such securities may be resold in transactions that are exempt from registration, normally to qualified institutional buyers. In the aggregate, these securities represent 25.5% of the Company’s net assets at December 31, 2017. |
|
(k) |
Investments that the Company has determined are not “qualifying assets” under Section 55(a) of the 1940 Act. Under the 1940 Act, we may not acquire any non-qualifying asset unless, at the time such acquisition is made, qualifying assets represent at least 70% of our total assets. The status of these assets under the 1940 Act may be subject to change. The Company monitors the status of these assets on an ongoing basis. |
|
(l) |
The Company is the sole stockholder of BKC ASW Blocker, Inc., a consolidated subsidiary, which is the beneficiary of 5% or more (but not more than 25%) of the voting securities of U.S. Well Services, LLC and thus a non-controlled, affiliated investment. |
|
(m) |
The Company is the sole stockholder of BKC ASW Blocker, Inc., a consolidated subsidiary, which is the beneficiary of less than 5% of the voting securities of Westward Dough Holdings, LLC and thus a non-controlled, non-affiliated investment. |
|
(n) |
The Company is the sole stockholder of BKC ASW Blocker, Inc., a consolidated subsidiary, which is the beneficiary of 5% or more (but not more than 25%) of the voting securities of V Global Holdings LLC and thus a non-controlled, affiliated investment. |
|
(o) |
The Company is the sole stockholder of BKC ASW Blocker, Inc., a consolidated subsidiary, which is the beneficiary of 5% or more (but not more than 25%) of the voting securities of ETX Energy, LLC and thus a non-controlled, affiliated investment. |
|
(p) |
The Company is the sole stockholder of BCIC-MBS, LLC, a consolidated subsidiary, which is the beneficiary of more than 25% of the voting securities of MBS Group Holdings Inc. and thus a controlled investment. |
The accompanying notes are an integral part of these consolidated financial statements.
F-10
|
|
|
Year ended December 31, 2017 |
|
|
Year ended December 31, 2016 |
|
||
|
($ in millions) |
|
|
|
|
|
|
|
|
|
Total assets |
|
$ |
461.9 |
|
|
$ |
412.8 |
|
|
Total senior debt |
|
$ |
302.5 |
|
|
$ |
248.9 |
|
|
Total revenue |
|
$ |
46.8 |
|
|
$ |
31.4 |
|
|
Net change in owners’ equity resulting from operations |
|
$ |
(4.9 |
) |
|
$ |
(7.5 |
) |
|
Net change in owners’ equity resulting from operations, excluding origination costs, realized & unrealized on foreign currency, unrealized-available for sale assets & provision for loan loss |
|
$ |
(1.1 |
) |
|
$ |
(4.7 |
) |
|
Provision for loan loss reserves |
|
$ |
1.0 |
|
|
$ |
0.5 |
|
Note: Balance sheet amounts are as of period end
|
(r) |
This investment is deemed significant under Regulation S-X Rule 4-08(g). BCIC Senior Loan Partners, LLC was formed on June 23, 2016. See Note 5 for summarized financial information of BCIC Senior Loan Partners, LLC for the year ended December 31, 2017 and the period June 23, 2016 through December 31, 2016. |
|
(s) |
Non-accrual status at December 31, 2017 and therefore non-income producing. At December 31, 2017, the aggregate fair value and amortized cost on non-accrual status represents 4.0% and 15.5% of the Company’s debt investments, respectively. |
|
(t) |
All-in rate includes default interest. |
|
(u) |
Unless otherwise indicated, all investments are considered Level 3 in accordance with ASC Topic 820 (See Note 10). The accompanying notes are an integral part of these consolidated financial statements. |
|
(v) |
The Company is the sole stockholder of MBS Group Holdings Inc., a consolidated subsidiary, which is the beneficiary of 5% or more (but not more than 25%) of the voting securities of MBS Parent, LLC and thus a non-controlled, affiliated investment. |
|
(w) |
Unaudited. |
The accompanying notes are an integral part of these consolidated financial statements.
F-11
|
|
|
|
|
|
|
|
|
|
|
|
|
|
|
|
|
|
|
|
|
|
|
For the Year Ended December 31, 2017 |
|
|||||||||||||
|
Non-controlled, Affiliated Investments |
|
Fair Value at December 31, 2016 |
|
|
Gross Additions (Cost)* |
|
|
Gross Reductions (Cost)** |
|
|
Net Unrealized Gain (Loss) |
|
|
Fair Value at December 31, 2017 |
|
|
Net Realized Gain (Loss) |
|
|
Interest Income |
|
|
Fee Income |
|
|
Dividend Income |
|
|||||||||
|
Advanced Lighting Technologies, Inc.: |
|
|
|
|
|
|
|
|
|
|
|
|
|
|
|
|
|
|
|
|
|
|
|
|
|
|
|
|
|
|
|
|
|
|
|
|
|
Senior Secured Note, Second Lien |
|
$ |
— |
|
|
$ |
2,181,306 |
|
|
$ |
— |
|
|
$ |
(693,145 |
) |
|
$ |
1,488,161 |
|
|
$ |
— |
|
|
$ |
116,531 |
|
|
$ |
— |
|
|
$ |
— |
|
|
Senior Secured Loan, First Lien |
|
|
— |
|
|
|
5,106,280 |
|
|
|
(13,015 |
) |
|
|
99,896 |
|
|
|
5,193,161 |
|
|
|
— |
|
|
|
113,661 |
|
|
|
156,716 |
|
|
|
— |
|
|
Common Stock |
|
|
— |
|
|
|
— |
|
|
|
— |
|
|
|
— |
|
|
|
— |
|
|
|
— |
|
|
|
— |
|
|
|
— |
|
|
|
— |
|
|
Warrants |
|
|
— |
|
|
|
— |
|
|
|
— |
|
|
|
— |
|
|
|
— |
|
|
|
— |
|
|
|
— |
|
|
|
— |
|
|
|
— |
|
|
Advantage Insurance Inc.: |
|
|
|
|
|
|
|
|
|
|
|
|
|
|
|
|
|
|
|
|
|
|
|
|
|
|
|
|
|
|
|
|
|
|
|
|
|
Preferred Stock |
|
|
8,130,000 |
|
|
|
766,607 |
|
|
|
— |
|
|
|
598,393 |
|
|
|
9,495,000 |
|
|
|
— |
|
|
|
— |
|
|
|
— |
|
|
|
766,606 |
|
|
AGY Holding Corp.: |
|
|
|
|
|
|
|
|
|
|
|
|
|
|
|
|
|
|
|
|
|
|
|
|
|
|
|
|
|
|
|
|
|
|
|
|
|
Senior Secured Note, Second Lien |
|
|
21,109,625 |
|
|
|
195,113 |
|
|
|
— |
|
|
|
457,762 |
|
|
|
21,762,500 |
|
|
|
— |
|
|
|
2,695,382 |
|
|
|
— |
|
|
|
— |
|
|
Senior Secured Loan, First Lien |
|
|
24,021,390 |
|
|
|
— |
|
|
|
— |
|
|
|
— |
|
|
|
24,021,390 |
|
|
|
— |
|
|
|
2,914,595 |
|
|
|
— |
|
|
|
— |
|
|
KAGY Holding Company, Inc. (AGY Holding Corp.): |
|
|
|
|
|
|
|
|
|
|
|
|
|
|
|
|
|
|
|
|
|
|
|
|
|
|
|
|
|
|
|
|
|
|
|
|
|
Preferred Stock |
|
|
6,422,056 |
|
|
|
2,230,775 |
|
|
|
— |
|
|
|
5,977,490 |
|
|
|
14,630,321 |
|
|
|
— |
|
|
|
— |
|
|
|
— |
|
|
|
2,230,779 |
|
|
Common Stock |
|
|
— |
|
|
|
— |
|
|
|
— |
|
|
|
— |
|
|
|
— |
|
|
|
— |
|
|
|
— |
|
|
|
— |
|
|
|
— |
|
|
ETX Energy, LLC: |
|
|
|
|
|
|
|
|
|
|
|
|
|
|
|
|
|
|
|
|
|
|
|
|
|
|
|
|
|
|
|
|
|
|
|
|
|
Limited Liability Co. Interest |
|
|
— |
|
|
|
— |
|
|
|
— |
|
|
|
— |
|
|
|
— |
|
|
|
— |
|
|
|
— |
|
|
|
— |
|
|
|
— |
|
|
ETX Energy Management Company, LLC: |
|
|
|
|
|
|
|
|
|
|
|
|
|
|
|
|
|
|
|
|
|
|
|
|
|
|
|
|
|
|
|
|
|
|
|
|
|
Limited Liability Co. Interest |
|
|
— |
|
|
|
— |
|
|
|
— |
|
|
|
— |
|
|
|
— |
|
|
|
— |
|
|
|
— |
|
|
|
— |
|
|
|
— |
|
|
MBS OpCo LLC: |
|
|
|
|
|
|
|
|
|
|
|
|
|
|
|
|
|
|
|
|
|
|
|
|
|
|
|
|
|
|
|
|
|
|
|
|
|
Senior Secured Loan, First Lien |
|
|
— |
|
|
|
15,000,000 |
|
|
|
— |
|
|
|
— |
|
|
|
15,000,000 |
|
|
|
— |
|
|
|
— |
|
|
|
— |
|
|
|
— |
|
|
MBS Parent, LLC: |
|
|
|
|
|
|
|
|
|
|
|
|
|
|
|
|
|
|
|
|
|
|
|
|
|
|
|
|
|
|
|
|
|
|
|
|
|
Limited Liability Co. Interest |
|
|
— |
|
|
|
500,000 |
|
|
|
— |
|
|
|
— |
|
|
|
500,000 |
|
|
|
— |
|
|
|
— |
|
|
|
— |
|
|
|
— |
|
|
U.S. Well Services, LLC: |
|
|
|
|
|
|
|
|
|
|
|
|
|
|
|
|
|
|
|
|
|
|
|
|
|
|
|
|
|
|
|
|
|
|
|
|
|
Revolver |
|
|
— |
|
|
|
7,924,583 |
|
|
|
— |
|
|
|
— |
|
|
|
7,924,583 |
|
† |
|
— |
|
|
|
391,109 |
|
|
|
349,916 |
|
|
|
— |
|
|
Senior Secured Loan, First Lien |
|
|
— |
|
|
|
32,457,904 |
|
|
|
— |
|
|
|
— |
|
|
|
32,457,904 |
|
† |
|
— |
|
|
|
4,054,626 |
|
|
|
— |
|
|
|
— |
|
|
Limited Liability Co. Interest, Class A |
|
|
— |
|
|
|
11,980,712 |
|
|
|
— |
|
|
|
16,389,616 |
|
|
|
28,370,328 |
|
† |
|
— |
|
|
|
— |
|
|
|
— |
|
|
|
— |
|
|
Limited Liability Co. Interest, Class B |
|
|
— |
|
|
|
4,378,964 |
|
|
|
— |
|
|
|
(2,326,811 |
) |
|
|
2,052,153 |
|
† |
|
— |
|
|
|
— |
|
|
|
— |
|
|
|
— |
|
|
Limited Liability Co. Interest, Class D |
|
|
— |
|
|
|
4,947 |
|
|
|
— |
|
|
|
1,678,320 |
|
|
|
1,683,267 |
|
† |
|
— |
|
|
|
— |
|
|
|
— |
|
|
|
— |
|
|
Vertellus Holdings LLC: |
|
|
|
|
|
|
|
|
|
|
|
|
|
|
|
|
|
|
|
|
|
|
|
|
|
|
|
|
|
|
|
|
|
|
|
|
|
Senior Secured Loan, First Lien |
|
|
22,461,298 |
|
|
|
— |
|
|
|
— |
|
|
|
— |
|
|
|
22,461,298 |
|
|
|
— |
|
|
|
2,302,033 |
|
|
|
— |
|
|
|
— |
|
|
Senior Secured Loan, Second Lien |
|
|
15,109,890 |
|
|
|
— |
|
|
|
— |
|
|
|
(151,099 |
) |
|
|
14,958,791 |
|
|
|
— |
|
|
|
2,006,928 |
|
|
|
— |
|
|
|
— |
|
|
V Global Holdings LLC: |
|
|
|
|
|
|
|
|
|
|
|
|
|
|
|
|
|
|
|
|
|
|
|
|
|
|
|
|
|
|
|
|
|
|
|
|
|
Limited Liability Co. Interest |
|
|
12,087,912 |
|
|
|
— |
|
|
|
— |
|
|
|
1,692,308 |
|
|
|
13,780,220 |
|
|
|
— |
|
|
|
— |
|
|
|
— |
|
|
|
— |
|
|
Totals |
|
$ |
109,342,171 |
|
|
$ |
82,727,191 |
|
|
$ |
(13,015 |
) |
|
$ |
23,722,730 |
|
|
$ |
215,779,077 |
|
|
$ |
— |
|
|
$ |
14,594,865 |
|
|
$ |
506,632 |
|
|
$ |
2,997,385 |
|
|
* |
Gross additions include increases in the cost basis of investments resulting from new portfolio investments, PIK interest or dividends, the amortization of unearned income, the exchange of one or more existing securities for one or more new securities and the movement of an existing portfolio company into this category from a different category. |
|
** |
Gross reductions include decreases in the cost basis of investments resulting from principal collections related to investment repayments or sales, the exchange of one or more existing securities for one or more new securities and the movement of an existing portfolio company out of this category into a different category. |
|
† |
Investment moved into the non-controlled, affiliated category from the non-controlled, non-affiliated category. |
The aggregate fair value of non-controlled, affiliated investments at December 31, 2017 represents 37.8% of the Company’s net assets.
The accompanying notes are an integral part of these consolidated financial statements.
F-12
|
|
|
|
|
|
|
|
|
|
|
|
|
|
|
|
|
|
|
|
|
|
|
For the Year Ended December 31, 2017 |
|
|||||||||||||
|
Controlled Investments |
|
Fair Value at December 31, 2016 |
|
|
Gross Additions (Cost)* |
|
|
Gross Reductions (Cost)** |
|
|
Net Unrealized Gain (Loss) |
|
|
Fair Value at December 31, 2017 |
|
|
Net Realized Gain (Loss) |
|
|
Interest Income |
|
|
Fee Income |
|
|
Dividend Income |
|
|||||||||
|
Bankruptcy Management Solutions, Inc.: |
|
|
|
|
|
|
|
|
|
|
|
|
|
|
|
|
|
|
|
|
|
|
|
|
|
|
|
|
|
|
|
|
|
|
|
|
|
Senior Secured Loan, First Lien, A |
|
$ |
736,685 |
|
|
$ |
3,806 |
|
|
$ |
(736,685 |
) |
|
$ |
(3,806 |
) |
|
$ |
— |
|
† |
$ |
— |
|
|
$ |
12,002 |
|
|
$ |
25,000 |
|
|
$ |
— |
|
|
Senior Secured Loan, First Lien, B |
|
|
11,271,747 |
|
|
|
623,357 |
|
|
|
(11,271,747 |
) |
|
|
(623,357 |
) |
|
|
— |
|
† |
|
— |
|
|
|
818,420 |
|
|
|
— |
|
|
|
— |
|
|
Common Stock |
|
|
19,586,856 |
|
|
|
— |
|
|
|
(16,654,505 |
) |
|
|
(2,932,351 |
) |
|
|
— |
|
† |
|
3,369,689 |
|
|
|
— |
|
|
|
— |
|
|
|
— |
|
|
Warrants |
|
|
117,358 |
|
|
|
— |
|
|
|
(1,186,138 |
) |
|
|
1,068,780 |
|
|
|
— |
|
† |
|
(994,155 |
) |
|
|
— |
|
|
|
— |
|
|
|
— |
|
|
BCIC Senior Loan Partners, LLC |
|
|
|
|
|
|
|
|
|
|
|
|
|
|
|
|
|
|
|
|
|
|
|
|
|
|
|
|
|
|
— |
|
|
|
|
|
|
Limited Liability Co. Interest |
|
|
41,675,575 |
|
|
|
29,850,501 |
|
|
|
— |
|
|
|
850,521 |
|
|
|
72,376,597 |
|
|
|
— |
|
|
|
— |
|
|
|
— |
|
|
|
4,981,997 |
|
|
CB-HDT Holdings, Inc.: |
|
|
|
|
|
|
|
|
|
|
|
|
|
|
|
|
|
|
|
|
|
|
|
|
|
|
|
|
|
|
|
|
|
|
|
|
|
Unsecured Debt |
|
|
4,477,360 |
|
|
|
553,307 |
|
|
|
— |
|
|
|
— |
|
|
|
5,030,667 |
|
|
|
— |
|
|
|
553,400 |
|
|
|
— |
|
|
|
— |
|
|
Preferred Stock |
|
|
15,000,000 |
|
|
|
— |
|
|
|
— |
|
|
|
— |
|
|
|
15,000,000 |
|
|
|
— |
|
|
|
— |
|
|
|
— |
|
|
|
— |
|
|
Common Stock |
|
|
7,447,230 |
|
|
|
— |
|
|
|
— |
|
|
|
(1,838,701 |
) |
|
|
5,608,529 |
|
|
|
— |
|
|
|
— |
|
|
|
— |
|
|
|
— |
|
|
First Boston Construction Holdings, LLC: |
|
|
|
|
|
|
|
|
|
|
|
|
|
|
|
|
|
|
|
|
|
|
|
|
|
|
|
|
|
|
|
|
|
|
|
|
|
Subordinated Debt |
|
|
28,800,000 |
|
|
|
800,000 |
|
|
|
— |
|
|
|
— |
|
|
|
29,600,000 |
|
|
|
— |
|
|
|
3,543,734 |
|
|
|
— |
|
|
|
— |
|
|
Limited Liability Co. Interest |
|
|
7,544,001 |
|
|
|
200,000 |
|
|
|
— |
|
|
|
(322,261 |
) |
|
|
7,421,740 |
|
|
|
— |
|
|
|
— |
|
|
|
— |
|
|
|
1,027,097 |
|
|
Gordon Brothers Finance Company: |
|
|
|
|
|
|
|
|
|
|
|
|
|
|
|
|
|
|
|
|
|
|
|
|
|
|
|
|
|
|
|
|
|
|
|
|
|
Unsecured Debt |
|
|
87,429,682 |
|
|
|
22,148,424 |
|
|
|
(26,472,220 |
) |
|
|
— |
|
|
|
83,105,886 |
|
|
|
— |
|
|
|
10,172,890 |
|
|
|
— |
|
|
|
— |
|
|
Preferred Stock |
|
|
20,497,135 |
|
|
|
— |
|
|
|
— |
|
|
|
— |
|
|
|
20,497,135 |
|
|
|
— |
|
|
|
— |
|
|
|
— |
|
|
|
2,805,545 |
|
|
Common Stock |
|
|
10,598,300 |
|
|
|
— |
|
|
|
— |
|
|
|
— |
|
|
|
10,598,300 |
|
|
|
— |
|
|
|
— |
|
|
|
— |
|
|
|
— |
|
|
MBS Group Holdings Inc.: |
|
|
|
|
|
|
|
|
|
|
|
|
|
|
|
|
|
|
|
|
|
|
|
|
|
|
|
|
|
|
|
|
|
|
|
|
|
Senior Secured Loan |
|
|
40,000,000 |
|
|
|
910,000 |
|
|
|
— |
|
|
|
(25,805,326 |
) |
|
|
15,104,674 |
|
|
|
— |
|
|
|
2,750,930 |
|
|
|
— |
|
|
|
— |
|
|
Common Stock |
|
|
— |
|
|
|
— |
|
|
|
— |
|
|
|
— |
|
|
|
— |
|
|
|
— |
|
|
|
— |
|
|
|
— |
|
|
|
— |
|
|
Red Apple Stores Inc.: |
|
|
|
|
|
|
|
|
|
|
|
|
|
|
|
|
|
|
|
|
|
|
|
|
|
|
|
|
|
|
|
|
|
|
|
|
|
Senior Secured Loan |
|
|
14,291,000 |
|
|
|
— |
|
|
|
— |
|
|
|
1,844,000 |
|
|
|
16,135,000 |
|
|
|
— |
|
|
|
2,326,953 |
|
|
|
— |
|
|
|
— |
|
|
Preferred Stock |
|
|
— |
|
|
|
— |
|
|
|
— |
|
|
|
— |
|
|
|
— |
|
|
|
— |
|
|
|
— |
|
|
|
— |
|
|
|
— |
|
|
Common Stock |
|
|
— |
|
|
|
486,793 |
|
|
|
(23,380 |
) |
|
|
(463,413 |
) |
|
|
— |
|
|
|
— |
|
|
|
— |
|
|
|
— |
|
|
|
— |
|
|
Totals |
|
$ |
309,472,929 |
|
|
$ |
55,576,188 |
|
|
$ |
(56,344,675 |
) |
|
$ |
(28,225,914 |
) |
|
$ |
280,478,528 |
|
|
$ |
2,375,534 |
|
|
$ |
20,178,329 |
|
|
$ |
25,000 |
|
|
$ |
8,814,639 |
|
|
* |
Gross additions include increases in the cost basis of investments resulting from new portfolio investments, PIK interest or dividends, the amortization of unearned income, the exchange of one or more existing securities for one or more new securities and the movement of an existing portfolio company into this category from a different category. |
|
** |
Gross reductions include decreases in the cost basis of investments resulting from principal collections related to investment repayments or sales, the exchange of one or more existing securities for one or more new securities and the movement of an existing portfolio company out of this category into a different category. |
|
† |
Investment no longer held as of December 31, 2017. |
The aggregate fair value of controlled investments at December 31, 2017 represents 49.1% of the Company’s net assets.
The accompanying notes are an integral part of these consolidated financial statements.
F-13
BlackRock Capital Investment Corporation
Consolidated Schedules of Investments
December 31, 2016
|
Portfolio Company(t) |
|
Industry(a) |
|
Interest Rate |
|
|
Maturity |
|
Principal Amount or Number of Shares/Units |
|
|
Cost(b) |
|
|
Fair Value(c) |
|
||||
|
Senior Secured Notes—10.7% |
|
|
|
|
|
|
|
|
|
|
|
|
|
|
|
|
|
|
|
|
|
Advanced Lighting Technologies, Inc., First Lien(e)(k) |
|
Capital Equipment |
|
10.50% |
|
|
6/1/19 |
|
$ |
20,000,000 |
|
|
$ |
18,682,622 |
|
|
$ |
5,000,000 |
|
|
|
AGY Holding Corp., Second Lien(g)(k) |
|
Chemicals, Plastics, & Rubber |
|
11.00% |
|
|
11/15/18 |
|
|
21,762,500 |
|
|
|
21,396,864 |
|
|
|
21,109,625 |
|
|
|
Wink Holdco, Inc., Second Lien(k) |
|
Insurance |
|
11.00% (L + 1000, 1.00% Floor) |
|
|
9/30/22 |
|
|
37,500,000 |
|
|
|
36,837,191 |
|
|
|
37,500,000 |
|
|
|
Total Senior Secured Notes |
|
|
|
|
|
|
|
|
|
|
|
|
|
|
76,916,677 |
|
|
|
63,609,625 |
|
|
Unsecured Debt—21.3% |
|
|
|
|
|
|
|
|
|
|
|
|
|
|
|
|
|
|
|
|
|
CB-HDT Holdings, Inc.(h)(k)(q) |
|
Aerospace & Defense |
|
12.00% PIK |
|
|
12/15/19 |
|
|
4,477,360 |
|
|
|
4,477,360 |
|
|
|
4,477,360 |
|
|
|
Gordon Brothers Finance Company(h)(r) |
|
Finance |
|
12.00% (L + 1100, 1.00% Floor) |
|
|
10/31/21 |
|
|
87,429,682 |
|
|
|
87,429,682 |
|
|
|
87,429,682 |
|
|
|
SVP Worldwide Ltd.(i)(l)(q) |
|
Consumer Goods: Durable |
|
16.00% (2.50% Cash / 13.50% PIK) |
|
|
6/27/18 |
|
|
56,657,424 |
|
|
|
55,262,989 |
|
|
|
35,410,890 |
|
|
|
Total Unsecured Debt |
|
|
|
|
|
|
|
|
|
|
|
|
|
|
147,170,031 |
|
|
|
127,317,932 |
|
|
Subordinated Debt—4.8% |
|
|
|
|
|
|
|
|
|
|
|
|
|
|
|
|
|
|
|
|
|
First Boston Construction Holdings, LLC(h)(l)(q) |
|
Finance |
|
12.00% |
|
|
12/31/20 |
|
|
28,800,000 |
|
|
|
28,800,000 |
|
|
|
28,800,000 |
|
|
|
Total Subordinated Debt |
|
|
|
|
|
|
|
|
|
|
|
|
|
|
28,800,000 |
|
|
|
28,800,000 |
|
The accompanying notes are an integral part of these consolidated financial statements.
F-14
BlackRock Capital Investment Corporation
Consolidated Schedules of Investments—(Continued)
December 31, 2016
|
Portfolio Company(t) |
|
Industry(a) |
|
Interest Rate |
|
|
Maturity |
|
Principal Amount or Number of Shares/Units |
|
|
Cost(b) |
|
|
Fair Value(c) |
|
||||
|
Senior Secured Loans—92.0%(f) |
|
|
|
|
|
|
|
|
|
|
|
|
|
|
|
|
|
|
|
|
|
Accriva Diagnostics, Inc., First Lien |
|
Healthcare & Pharmaceuticals |
|
12.25% |
|
|
1/17/19 |
|
$ |
18,900,000 |
|
|
$ |
18,900,000 |
|
|
$ |
18,900,000 |
|
|
|
AGY Holding Corp., First Lien(g) |
|
Chemicals, Plastics, & Rubber |
|
12.00% |
|
|
9/15/18 |
|
|
24,021,390 |
|
|
|
24,021,390 |
|
|
|
24,021,390 |
|
|
|
Bankruptcy Management Solutions, Inc., Term Loan A, First Lien(h) |
|
Services: Business |
|
4.50% (L + 350, 1.00% Floor) |
|
|
6/27/17 |
|
|
736,685 |
|
|
|
732,879 |
|
|
|
736,685 |
|
|
|
Bankruptcy Management Solutions, Inc., Term Loan B, First Lien(h) |
|
Services: Business |
|
7.00% (L + 600,1.00% Floor) |
|
|
6/27/18 |
|
|
11,271,747 |
|
|
|
10,648,390 |
|
|
|
11,271,747 |
|
|
|
GSE Environmental, Inc., First Lien |
|
Environmental Industries |
|
11.00% (L + 1000, 1.00% Floor) |
|
|
8/11/21 |
|
|
36,566,118 |
|
|
|
36,566,118 |
|
|
|
36,566,118 |
|
|
|
JLL Pioneer Inc., Second Lien |
|
Construction & Building |
|
9.50% (L+ 850, 1.00% Floor) |
|
|
12/31/20 |
|
|
20,000,000 |
|
|
|
20,000,000 |
|
|
|
20,000,000 |
|
|
|
K2 Pure Solutions Nocal, L.P., First Lien |
|
Chemicals, Plastics, & Rubber |
|
10.00% (L + 900, 1.00% Floor) |
|
|
2/19/21 |
|
|
13,000,000 |
|
|
|
12,878,533 |
|
|
|
13,000,000 |
|
|
|
Liberty Tire Recycling Holdco, LLC, First Lien |
|
Environmental Industries |
|
9.00% (L + 800,1.00% Floor) |
|
|
7/7/20 |
|
|
19,700,000 |
|
|
|
19,144,826 |
|
|
|
19,700,000 |
|
|
|
Loar Group Inc., Second Lien |
|
Aerospace & Defense |
|
10.25% (L + 925,1.00% Floor) |
|
|
7/12/22 |
|
|
15,000,000 |
|
|
|
14,743,818 |
|
|
|
15,000,000 |
|
|
|
MBS Group Holdings Inc., First Lien(h) |
|
Services: Business |
|
9.00% |
|
|
6/30/20 |
|
|
40,000,000 |
|
|
|
40,000,000 |
|
|
|
40,000,000 |
|
|
|
Oxford Mining Company, LLC, First Lien(q) |
|
Metals & Mining |
|
12.45% (L + 850, 0.75% Floor Cash / 3.00% PIK) |
|
|
12/31/18 |
|
|
25,946,053 |
|
|
|
25,946,053 |
|
|
|
25,686,593 |
|
|
|
Paragon Films, Inc., Second Lien |
|
Containers, Packaging, & Glass |
|
11.00% (L + 1000, 1.00% Floor) |
|
|
6/9/23 |
|
|
20,000,000 |
|
|
|
20,000,000 |
|
|
|
20,000,000 |
|
|
|
Pomeroy Group LLC, Second Lien |
|
Services: Business |
|
11.64% (L + 1000, 1.00% Floor) |
|
|
11/30/22 |
|
|
27,500,000 |
|
|
|
27,056,251 |
|
|
|
27,500,000 |
|
|
|
Pre-Paid Legal Services, Inc., Second Lien |
|
Services: Consumer |
|
10.25% (L + 900, 1.25% Floor) |
|
|
7/1/20 |
|
|
32,000,000 |
|
|
|
31,812,661 |
|
|
|
32,000,000 |
|
|
|
Recorded Books Inc., Second Lien |
|
Media: Advertising, Printing & Publishing |
|
9.50% (L + 850, 1.00% Floor) |
|
|
7/31/22 |
|
|
32,500,000 |
|
|
|
32,500,000 |
|
|
|
32,500,000 |
|
|
The accompanying notes are an integral part of these consolidated financial statements.
F-15
BlackRock Capital Investment Corporation
Consolidated Schedules of Investments—(Continued)
December 31, 2016
|
Portfolio Company(t) |
|
Industry(a) |
|
Interest Rate |
|
|
Maturity |
|
Principal Amount or Number of Shares/Units |
|
|
Cost(b) |
|
|
Fair Value(c) |
|
||||
|
Red Apple Stores Inc., Second Lien(h)(i)(l) |
|
Retail |
|
10.00% |
|
|
7/24/20 |
|
$ |
23,050,000 |
|
|
$ |
23,050,000 |
|
|
$ |
14,291,000 |
|
|
|
Shoreline Energy LLC, Second Lien(e)(q)(s) |
|
Energy: Oil & Gas |
|
16.00% (Base + 825, 2.25% Floor Cash / 2.00% PIK) |
|
|
3/30/19 |
|
|
28,240,003 |
|
|
|
27,236,933 |
|
|
|
— |
|
|
|
SOURCEHOV, LLC, First Lien |
|
Services: Business |
|
7.75% (L + 675, 1.00% Floor) |
|
|
10/31/19 |
|
|
4,593,750 |
|
|
|
4,515,865 |
|
|
|
4,065,468 |
|
|
|
SOURCEHOV, LLC, Second Lien |
|
Services: Business |
|
11.50% (L + 1050, 1.00% Floor) |
|
|
4/30/20 |
|
|
5,000,000 |
|
|
|
4,877,098 |
|
|
|
3,250,000 |
|
|
|
Sur La Table, Inc., First Lien |
|
Retail |
|
12.00% |
|
|
7/28/20 |
|
|
30,000,000 |
|
|
|
30,000,000 |
|
|
|
30,000,000 |
|
|
|
Tri-Anim Health Services, Inc., et al., Second Lien |
|
Healthcare & Pharmaceuticals |
|
10.50% (L + 950,1.00% Floor) |
|
|
7/28/22 |
|
|
25,000,000 |
|
|
|
24,571,248 |
|
|
|
25,000,000 |
|
|
|
U.S. Anesthesia Partners, Inc., Second Lien |
|
Healthcare & Pharmaceuticals |
|
10.25% (L + 925, 1.00% Floor) |
|
|
9/24/20 |
|
|
20,000,000 |
|
|
|
19,685,726 |
|
|
|
20,000,000 |
|
|
|
U.S. Well Services, LLC, First Lien(q)(s) |
|
Energy: Oil & Gas |
|
14.11% (L + 1150, 0.50% Floor PIK) |
|
|
5/2/19 |
|
|
50,083,741 |
|
|
|
50,083,741 |
|
|
|
43,572,855 |
|
|
|
Vertellus Holdings LLC, First Lien(g) |
|
Chemicals, Plastics, & Rubber |
|
10.00% (L + 900, 1.00% Floor) |
|
|
4/30/18 |
|
|
22,461,298 |
|
|
|
22,461,298 |
|
|
|
22,461,298 |
|
|
|
Vertellus Holdings LLC, Second Lien(g) |
|
Chemicals, Plastics, & Rubber |
|
13.00% (L + 1200, 1.00% Floor) |
|
|
10/29/21 |
|
|
15,109,890 |
|
|
|
15,109,890 |
|
|
|
15,109,890 |
|
|
|
Water Pik, Inc., Second Lien |
|
Consumer Goods: Durable |
|
9.75% (L + 875, 1.00% Floor) |
|
|
1/8/21 |
|
|
33,882,271 |
|
|
|
33,407,686 |
|
|
|
33,882,271 |
|
|
|
Total Senior Secured Loans |
|
|
|
|
|
|
|
|
|
|
|
|
|
|
589,950,404 |
|
|
|
548,515,315 |
|
|
Preferred Stock—9.7% |
|
|
|
|
|
|
|
|
|
|
|
|
|
|
|
|
|
|
|
|
|
Advantage Insurance Inc.(g)(k)(q) |
|
Insurance |
|
8.00% PIK |
|
|
|
|
|
750,000 |
|
|
|
9,582,578 |
|
|
|
8,130,000 |
|
|
|
CB-HDT Holdings, Inc., Series L(d)(h) |
|
Aerospace & Defense |
|
|
|
|
|
|
|
|
1,500,000 |
|
|
|
15,000,000 |
|
|
|
15,000,000 |
|
|
Gordon Brothers Finance Company(h)(r) |
|
Finance |
|
13.50% |
|
|
|
|
|
20,497 |
|
|
|
20,497,135 |
|
|
|
20,497,135 |
|
|
|
KAGY Holding Company, Inc. (AGY Holding Corp.)(g)(q) |
|
Chemicals, Plastics, & Rubber |
|
20.00% PIK |
|
|
|
|
|
22,960 |
|
|
|
8,090,828 |
|
|
|
6,422,056 |
|
|
|
Red Apple Stores Inc.(d)(h)(i)(l) |
|
Retail |
|
|
|
|
|
|
|
|
6,806,383 |
|
|
|
— |
|
|
|
— |
|
The accompanying notes are an integral part of these consolidated financial statements.
F-16
BlackRock Capital Investment Corporation
Consolidated Schedules of Investments—(Continued)
December 31, 2016
|
Portfolio Company(t) |
|
Industry(a) |
|
Interest Rate |
|
Maturity |
|
Principal Amount or Number of Shares/Units |
|
|
Cost(b) |
|
|
Fair Value(c) |
|
|||
|
USI Senior Holdings, Inc. (United Subcontractors)(d) |
|
Construction & Building |
|
|
|
|
|
|
260,798 |
|
|
$ |
5,374,318 |
|
|
$ |
7,823,936 |
|
|
Total Preferred Stock |
|
|
|
|
|
|
|
|
|
|
|
|
58,544,859 |
|
|
|
57,873,127 |
|
|
Common Stock—6.3%(d) |
|
|
|
|
|
|
|
|
|
|
|
|
|
|
|
|
|
|
|
Bankruptcy Management Solutions, Inc.(h) |
|
Services: Business |
|
|
|
|
|
|
370,122 |
|
|
|
16,654,505 |
|
|
|
19,586,856 |
|
|
CB-HDT Holdings, Inc., Series A(h) |
|
Aerospace & Defense |
|
|
|
|
|
|
744,723 |
|
|
|
7,447,230 |
|
|
|
7,447,230 |
|
|
Gordon Brothers Finance Company(h)(r) |
|
Finance |
|
|
|
|
|
|
10,598 |
|
|
|
10,598,300 |
|
|
|
10,598,300 |
|
|
KAGY Holding Company, Inc. (AGY Holding Corp.)(g) |
|
Chemicals, Plastics, & Rubber |
|
|
|
|
|
|
3,131,292 |
|
|
|
— |
|
|
|
— |
|
|
MBS Group Holdings Inc.(h)(p) |
|
Services: Business |
|
|
|
|
|
|
8,500 |
|
|
|
1,000 |
|
|
|
— |
|
|
Red Apple Stores Inc.(h)(i)(j)(l) |
|
Retail |
|
|
|
|
|
|
8,756,859 |
|
|
|
6,519,298 |
|
|
|
— |
|
|
Total Common Stock |
|
|
|
|
|
|
|
|
|
|
|
|
41,220,333 |
|
|
|
37,632,386 |
|
|
Limited Partnership/Limited Liability Company Interests—11.3% |
|
|
|
|
|
|
|
|
|
|
|
|
|
|
|
|
|
|
|
BCIC Senior Loan Partners, LLC(h)(k)(l) |
|
Finance |
|
|
|
|
|
|
42,526,097 |
|
|
|
42,526,097 |
|
|
|
41,675,575 |
|
|
ECI Cayman Holdings, LP(d)(i)(k)(l) |
|
High Tech Industries |
|
|
|
|
|
|
3,189 |
|
|
|
2,238,811 |
|
|
|
2,842,546 |
|
|
ETX Energy, LLC(d)(g) |
|
Energy: Oil & Gas |
|
|
|
|
|
|
51,119 |
|
|
|
— |
|
|
|
— |
|
|
ETX Energy Management Company, LLC(d)(g) |
|
Energy: Oil & Gas |
|
|
|
|
|
|
53,815 |
|
|
|
— |
|
|
|
— |
|
|
First Boston Construction Holdings, LLC(h)(l) |
|
Finance |
|
|
|
|
|
|
7,200,000 |
|
|
|
7,200,000 |
|
|
|
7,544,001 |
|
|
Higginbotham Investment Holdings, LLC(d) |
|
Insurance |
|
|
|
|
|
|
1,163 |
|
|
|
239,245 |
|
|
|
1,418,348 |
|
|
Loar Group LLC(d) |
|
Aerospace & Defense |
|
|
|
|
|
|
1,500,000 |
|
|
|
1,500,000 |
|
|
|
1,683,878 |
|
|
Marsico Holdings, LLC(d)(k) |
|
Finance |
|
|
|
|
|
|
91,445 |
|
|
|
1,848,077 |
|
|
|
5,487 |
|
|
U.S. Well Services, LLC(k)(m)(q) |
|
Energy: Oil & Gas |
|
8.00% PIK |
|
|
|
|
8,085 |
|
|
|
9,572,495 |
|
|
|
— |
|
|
V Global Holdings LLC(d)(g)(o) |
|
Chemicals, Plastics, & Rubber |
|
|
|
|
|
|
12,087,912 |
|
|
|
11,977,610 |
|
|
|
12,087,912 |
|
|
Westward Dough Holdings, LLC, Class D(d)(n) |
|
Beverage, Food, & Tobacco |
|
|
|
|
|
|
114,706 |
|
|
|
— |
|
|
|
— |
|
|
Total Limited Partnership/Limited Liability Company Interests |
|
|
|
|
|
|
|
|
|
|
|
|
77,102,335 |
|
|
|
67,257,747 |
|
|
Equity Warrants/Options—0.0%(d) |
|
|
|
|
|
|
|
|
|
|
|
|
|
|
|
|
|
|
|
Bankruptcy Management Solutions, Inc., Tranche A(h) |
|
Services: Business |
|
|
|
expire 6/27/18 |
|
|
28,464 |
|
|
|
375,040 |
|
|
|
117,358 |
|
The accompanying notes are an integral part of these consolidated financial statements.
F-17
BlackRock Capital Investment Corporation
Consolidated Schedules of Investments—(Continued)
December 31, 2016
|
Portfolio Company(t) |
|
Industry(a) |
|
Interest Rate |
|
Maturity |
|
Principal Amount or Number of Shares/Units |
|
|
Cost(b) |
|
|
Fair Value(c) |
|
|||
|
Bankruptcy Management Solutions, Inc., Tranche B(h) |
|
Services: Business |
|
|
|
expire 6/27/19 |
|
|
30,654 |
|
|
$ |
342,295 |
|
|
$ |
— |
|
|
Bankruptcy Management Solutions, Inc., Tranche C(h) |
|
Services: Business |
|
|
|
expire 6/27/20 |
|
|
45,981 |
|
|
|
468,803 |
|
|
|
— |
|
|
Facet Investment, Inc. |
|
Healthcare & Pharmaceuticals |
|
|
|
expire 1/18/21 |
|
|
1,978 |
|
|
|
250,000 |
|
|
|
— |
|
|
Marsico Parent Superholdco, LLC(k) |
|
Finance |
|
|
|
expire 12/14/19 |
|
|
455 |
|
|
|
444,450 |
|
|
|
— |
|
|
Total Equity Warrants/Options |
|
|
|
|
|
|
|
|
|
|
|
|
1,880,588 |
|
|
|
117,358 |
|
|
TOTAL INVESTMENTS—156.1% |
|
|
|
|
|
|
|
|
|
|
|
$ |
1,021,585,227 |
|
|
$ |
931,123,490 |
|
|
OTHER ASSETS & LIABILITIES (NET)—(56.1)% |
|
|
|
|
|
|
|
|
|
|
|
|
|
|
|
|
(334,803,121 |
) |
|
NET ASSETS—100.0% |
|
|
|
|
|
|
|
|
|
|
|
|
|
|
|
$ |
596,320,369 |
|
|
(a) |
Unaudited |
|
(b) |
Represents amortized cost for fixed income securities and cost for preferred and common stock, limited partnership/limited liability company interests and equity warrants/options. |
|
(c) |
Fair value is determined by or under the direction of the Company’s Board of Directors. See Note 2 for further details. |
|
(d) |
Non-income producing equity securities at December 31, 2016. |
|
(e) |
Non-accrual status at December 31, 2016 and therefore non-income producing. At December 31, 2016, the aggregate fair value and amortized cost of the Company’s debt investments on non-accrual status represents 0.7% and 5.4%, respectively. |
|
(f) |
Approximately 77% of the senior secured loans in the Company’s portfolio bear interest at a floating rate that may be determined by reference to the London Interbank Offered Rate (LIBOR) or other base rate (commonly the Federal Funds Rate or the Prime Rate), at the borrower’s option. In addition, 100% of such senior secured loans have floors of 0.50% to 2.25%. The borrower under a senior secured loan generally has the option to select from interest reset periods of one, two, three or six months and may alter that selection at the end of any reset period. The stated interest rate represents the weighted average interest rate at December 31, 2016 of all contracts within the specified loan facility. |
|
(g) |
Transaction and other information for “non-controlled, affiliated” investments under the Investment Company Act of 1940, whereby the Company owns 5% or more (but not more than 25%) of the portfolio company’s outstanding voting securities. |
|
(h) |
Transaction and other information for “controlled” investments under the Investment Company Act of 1940, whereby the Company owns more than 25% of the portfolio company’s outstanding voting securities. |
|
(i) |
Non-U.S. company or principal place of business outside the U.S. |
|
(j) |
Original purchase denominated in Canadian dollars. |
|
(k) |
Security is exempt from registration under Rule 144A of the Securities Act of 1933. Such securities may be resold in transactions that are exempt from registration, normally to qualified institutional buyers. In the aggregate, these securities represent 20.2% of the Company’s net assets at December 31, 2016. |
|
(l) |
Investments that the Company has determined are not “qualifying assets” under Section 55(a) of the 1940 Act. Under the 1940 Act, we may not acquire any non-qualifying asset unless, at the time such acquisition is made, qualifying assets represent at least 70% of our total assets. The status of these assets under the 1940 Act may be subject to change. The Company monitors the status of these assets on an ongoing basis. |
|
(m) |
The Company is the sole stockholder of BKC ASW Blocker, Inc., a consolidated subsidiary, which is the beneficiary of less than 5% of the voting securities of U.S. Well Services, LLC and thus a non-controlled, non-affiliated investment. |
|
(n) |
The Company is the sole stockholder of BKC ASW Blocker, Inc., a consolidated subsidiary, which is the beneficiary of less than 5% of the voting securities of Westward Dough Holdings, LLC and thus a non-controlled, non-affiliated investment. |
|
(o) |
The Company is the sole stockholder of BKC ASW Blocker, Inc., a consolidated subsidiary, which is the beneficiary of 5% or more (but not more than 25%) of the voting securities of V Global Holdings LLC and thus a non-controlled, affiliated investment. |
|
(p) |
The Company is the sole stockholder of BCIC-MBS, LLC, a consolidated subsidiary, which is the beneficiary of more than 25% of the voting securities of MBS Group Holdings Inc. and thus a controlled investment. |
|
(q) |
Interest may be paid in cash or payment-in-kind (“PIK”), or a combination thereof which is generally at the option of the borrower. PIK earned is included in the cost basis of the security. In accordance with the Company’s policy, PIK may be recorded on an effective yield basis. |
The accompanying notes are an integral part of these consolidated financial statements.
F-18
|
|
|
|
|
|
|
|
|
|
|
|
|
|
|
|
|
|
|
|
|
|
|
For the Year Ended December 31, 2016 |
|
|||||||||||||
|
Non-controlled, Affiliated Investments |
|
Fair Value at December 31, 2015 |
|
|
Gross Additions (Cost)* |
|
|
Gross Reductions (Cost)** |
|
|
Net Unrealized Gain (Loss) |
|
|
Fair Value at December 31, 2016 |
|
|
Net Realized Gain (Loss) |
|
|
Interest Income |
|
|
Fee Income |
|
|
Dividend Income |
|
|||||||||
|
Advantage Insurance Inc. |
|
|
|
|
|
|
|
|
|
|
|
|
|
|
|
|
|
|
|
|
|
|
|
|
|
|
|
|
|
|
|
|
|
|
|
|
|
Preferred Stock |
|
$ |
8,872,757 |
|
|
$ |
709,821 |
|
|
$ |
— |
|
|
$ |
(1,452,578 |
) |
|
$ |
8,130,000 |
|
|
$ |
— |
|
|
$ |
— |
|
|
$ |
— |
|
|
$ |
709,821 |
|
|
AGY Holding Corp.: |
|
|
|
|
|
|
|
|
|
|
|
|
|
|
|
|
|
|
|
|
|
|
|
|
|
|
|
|
|
|
|
|
|
|
|
|
|
Senior Secured Note |
|
|
21,327,250 |
|
|
|
334,527 |
|
|
|
— |
|
|
|
(552,152 |
) |
|
|
21,109,625 |
|
|
|
— |
|
|
|
2,728,403 |
|
|
|
— |
|
|
|
— |
|
|
Senior Secured Loan |
|
|
19,763,384 |
|
|
|
4,258,006 |
|
|
|
— |
|
|
|
— |
|
|
|
24,021,390 |
|
|
|
— |
|
|
|
2,492,602 |
|
|
|
— |
|
|
|
— |
|
|
KAGY Holding Company, Inc. (AGY Holding Corp.): |
|
|
|
|
|
|
|
|
|
|
|
|
|
|
|
|
|
|
|
|
|
|
|
|
|
|
|
|
|
|
|
|
|
|
|
|
|
Preferred Stock |
|
|
9,376,565 |
|
|
|
1,159,948 |
|
|
|
— |
|
|
|
(4,114,457 |
) |
|
|
6,422,056 |
|
|
|
— |
|
|
|
— |
|
|
|
— |
|
|
|
1,159,948 |
|
|
Common Stock |
|
|
— |
|
|
|
— |
|
|
|
— |
|
|
|
— |
|
|
|
— |
|
|
|
— |
|
|
|
— |
|
|
|
— |
|
|
|
— |
|
|
ETX Energy, LLC |
|
|
|
|
|
|
|
|
|
|
|
|
|
|
|
|
|
|
|
|
|
|
|
|
|
|
|
|
|
|
|
|
|
|
|
|
|
Limited Liability Co. Interest |
|
|
— |
|
|
|
— |
|
|
|
— |
|
|
|
— |
|
|
— |
|
† |
|
— |
|
|
|
— |
|
|
|
— |
|
|
|
— |
|
|
|
ETX Energy Management Company, LLC |
|
|
|
|
|
|
|
|
|
|
|
|
|
|
|
|
|
|
|
|
|
|
|
|
|
|
|
|
|
|
|
|
|
|
|
|
|
Limited Liability Co. Interest |
|
|
— |
|
|
|
— |
|
|
|
— |
|
|
|
— |
|
|
— |
|
† |
|
— |
|
|
|
— |
|
|
|
— |
|
|
|
— |
|
|
|
USI Senior Holdings, Inc. |
|
|
|
|
|
|
|
|
|
|
|
|
|
|
|
|
|
|
|
|
|
|
|
|
|
|
|
|
|
|
|
|
|
|
|
|
|
Preferred Stock |
|
|
7,823,940 |
|
|
|
— |
|
|
|
(7,823,940 |
) |
|
|
— |
|
|
— |
|
†† |
|
— |
|
|
|
— |
|
|
|
— |
|
|
|
— |
|
|
|
Vertellus Holdings LLC: |
|
|
|
|
|
|
|
|
|
|
|
|
|
|
|
|
|
|
|
|
|
|
|
|
|
|
|
|
|
|
|
|
|
|
|
|
|
Senior Secured Loan, First Lien |
|
|
— |
|
|
|
22,461,298 |
|
|
|
— |
|
|
|
— |
|
|
|
22,461,298 |
|
† |
|
— |
|
|
|
386,833 |
|
|
|
— |
|
|
|
— |
|
|
Senior Secured Loan, Second Lien |
|
|
— |
|
|
|
15,109,890 |
|
|
|
— |
|
|
|
— |
|
|
|
15,109,890 |
|
† |
|
— |
|
|
|
338,294 |
|
|
|
— |
|
|
|
— |
|
|
V Global Holdings LLC |
|
|
|
|
|
|
|
|
|
|
|
|
|
|
|
|
|
|
|
|
|
|
|
|
|
|
|
|
|
|
|
|
|
|
|
|
|
Limited Liability Co. Interest |
|
|
— |
|
|
|
11,977,610 |
|
|
|
— |
|
|
|
110,302 |
|
|
|
12,087,912 |
|
† |
|
— |
|
|
|
— |
|
|
|
— |
|
|
|
— |
|
|
Totals |
|
$ |
67,163,896 |
|
|
$ |
56,011,100 |
|
|
$ |
(7,823,940 |
) |
|
$ |
(6,008,885 |
) |
|
$ |
109,342,171 |
|
|
$ |
— |
|
|
$ |
5,946,132 |
|
|
$ |
— |
|
|
$ |
1,869,769 |
|
|
* |
Gross additions include increases in the cost basis of investments resulting from new portfolio investments, payment-in-kind (“PIK”) interest or dividends, the amortization of unearned income, the exchange of one or more existing securities for one or more new securities and the movement of an existing portfolio company into this category from a different category. |
|
** |
Gross reductions include decreases in the cost basis of investments resulting from principal collections related to investment repayments or sales, the exchange of one or more existing securities for one or more new securities and the movement of an existing portfolio company out of this category into a different category. |
|
† |
Investment moved into the non-controlled, affiliated category from the non-controlled, non-affiliated category. |
|
†† |
Investment moved out of the non-controlled, affiliated category into the non-controlled, non-affiliated category. |
The aggregate fair value of non-controlled, affiliated investments at December 31, 2016 represents 18.3% of the Company’s net assets.
|
(r) |
This investment is deemed significant under Regulation S-X Rule 4-08(g). Gordon Brothers Finance Company commenced operations on October 31, 2014, therefore historical data is limited. The summarized financial information of Gordon Brothers Finance Company for the years ending December 31, 2016 and 2015 is shown below: |
|
|
|
Year ended December 31, 2016 |
|
|
Year ended December 31, 2015 |
|
||
|
($ in millions) |
|
|
|
|
|
|
|
|
|
Total assets |
|
$ |
412.8 |
|
|
$ |
270.5 |
|
|
Total senior debt |
|
$ |
248.9 |
|
|
$ |
135.5 |
|
|
Total revenue |
|
$ |
31.4 |
|
|
$ |
28.7 |
|
|
Net change in owners’ equity resulting from operations |
|
$ |
(7.5 |
) |
|
$ |
(4.8 |
) |
|
Net change in owners’ equity resulting from operations, excluding origination costs, realized & unrealized on foreign currency, unrealized-available for sale assets & provision for loan loss |
|
$ |
(4.7 |
) |
|
$ |
0.4 |
|
|
Provision for loan loss reserves |
|
$ |
0.5 |
|
|
$ |
0.0 |
|
Note: Balance sheet amounts are as of period end
|
(s) |
All-in rate includes 2.00% default interest |
|
(t) |
Unless otherwise indicated, all investments are considered Level 3 in accordance with ASC Topic 820 (See Note 10). |
The accompanying notes are an integral part of these consolidated financial statements.
F-19
|
|
|
|
|
|
|
|
|
|
|
|
|
|
|
|
|
|
|
|
|
|
|
For the Year Ended December 31, 2016 |
|
|||||||||||||
|
Controlled Investments |
|
Fair Value at December 31, 2015 |
|
|
Gross Additions (Cost)* |
|
|
Gross Reductions (Cost)** |
|
|
Net Unrealized Gain (Loss) |
|
|
Fair Value at December 31, 2016 |
|
|
Net Realized Gain (Loss) |
|
|
Interest Income |
|
|
Fee Income |
|
|
Dividend Income |
|
|||||||||
|
Bankruptcy Management Solutions, Inc.: |
|
|
|
|
|
|
|
|
|
|
|
|
|
|
|
|
|
|
|
|
|
|
|
|
|
|
|
|
|
|
|
|
|
|
|
|
|
Senior Secured Loan, First Lien, A |
|
$ |
1,168,176 |
|
|
$ |
16,028 |
|
|
$ |
(455,331 |
) |
|
$ |
7,812 |
|
|
$ |
736,685 |
|
|
$ |
— |
|
|
$ |
55,254 |
|
|
$ |
100,000 |
|
|
$ |
— |
|
|
Senior Secured Loan, First Lien, B |
|
|
10,289,082 |
|
|
|
450,000 |
|
|
|
(289,018 |
) |
|
|
821,683 |
|
|
|
11,271,747 |
|
|
|
— |
|
|
|
1,264,867 |
|
|
|
— |
|
|
|
— |
|
|
Common Stock |
|
|
32,087,254 |
|
|
|
— |
|
|
|
— |
|
|
|
(12,500,398 |
) |
|
|
19,586,856 |
|
|
|
— |
|
|
|
— |
|
|
|
— |
|
|
|
— |
|
|
Warrants |
|
|
2,474,818 |
|
|
|
— |
|
|
|
— |
|
|
|
(2,357,460 |
) |
|
|
117,358 |
|
|
|
— |
|
|
|
— |
|
|
|
— |
|
|
|
— |
|
|
BCIC Senior Loan Partners, LLC |
|
|
|
|
|
|
|
|
|
|
|
|
|
|
|
|
|
|
|
|
|
|
|
|
|
|
|
|
|
|
|
|
|
|
|
|
|
Limited Liability Co. Interest |
|
|
— |
|
|
|
42,526,097 |
|
|
|
— |
|
|
|
(850,522 |
) |
|
|
41,675,575 |
|
|
|
— |
|
|
|
— |
|
|
|
— |
|
|
|
83,230 |
|
|
CB-HDT Holdings, Inc.: |
|
|
|
|
|
|
|
|
|
|
|
|
|
|
|
|
|
|
|
|
|
|
|
|
|
|
|
|
|
|
|
|
|
|
|
|
|
Unsecured Debt |
|
|
— |
|
|
|
4,477,360 |
|
|
|
— |
|
|
|
— |
|
|
|
4,477,360 |
|
|
|
— |
|
|
|
24,885 |
|
|
|
— |
|
|
|
— |
|
|
Preferred Stock |
|
|
— |
|
|
|
15,000,000 |
|
|
|
— |
|
|
|
— |
|
|
|
15,000,000 |
|
†† |
|
— |
|
|
|
— |
|
|
|
— |
|
|
|
— |
|
|
Common Stock |
|
|
— |
|
|
|
7,500,000 |
|
|
|
(52,770 |
) |
|
|
— |
|
|
|
7,447,230 |
|
†† |
|
(52,770 |
) |
|
|
— |
|
|
|
— |
|
|
|
— |
|
|
First Boston Construction Holdings, LLC: |
|
|
|
|
|
|
|
|
|
|
|
|
|
|
|
|
|
|
|
|
|
|
|
|
|
|
|
|
|
|
|
|
|
|
|
|
|
Subordinated Debt |
|
|
17,500,000 |
|
|
|
11,300,000 |
|
|
|
— |
|
|
|
— |
|
|
|
28,800,000 |
|
|
|
— |
|
|
|
2,920,400 |
|
|
|
— |
|
|
|
— |
|
|
Limited Liability Co. Interest |
|
|
4,375,000 |
|
|
|
2,825,000 |
|
|
|
— |
|
|
|
344,001 |
|
|
|
7,544,001 |
|
|
|
— |
|
|
|
— |
|
|
|
— |
|
|
|
291,667 |
|
|
Gordon Brothers Finance Company: |
|
|
|
|
|
|
|
|
|
|
|
|
|
|
|
|
|
|
|
|
|
|
|
|
|
|
|
|
|
|
|
|
|
|
|
|
|
Unsecured Debt |
|
|
64,739,544 |
|
|
|
34,690,877 |
|
|
|
(12,000,739 |
) |
|
|
— |
|
|
|
87,429,682 |
|
|
|
— |
|
|
|
9,577,284 |
|
|
|
162,372 |
|
|
|
— |
|
|
Preferred Stock |
|
|
17,460,098 |
|
|
|
3,037,037 |
|
|
|
— |
|
|
|
— |
|
|
|
20,497,135 |
|
|
|
— |
|
|
|
— |
|
|
|
— |
|
|
|
2,569,439 |
|
|
Common Stock |
|
|
10,598,300 |
|
|
|
— |
|
|
|
— |
|
|
|
— |
|
|
|
10,598,300 |
|
|
|
— |
|
|
|
— |
|
|
|
— |
|
|
|
— |
|
|
MBS Group Holdings Inc.: |
|
|
|
|
|
|
|
|
|
|
|
|
|
|
|
|
|
|
|
|
|
|
|
|
|
|
|
|
|
|
|
|
|
|
|
|
|
Senior Secured Loan |
|
|
40,000,000 |
|
|
|
— |
|
|
|
— |
|
|
|
— |
|
|
|
40,000,000 |
|
|
|
— |
|
|
|
3,660,000 |
|
|
|
— |
|
|
|
— |
|
|
Common Stock |
|
|
3,933,465 |
|
|
|
— |
|
|
|
— |
|
|
|
(3,933,465 |
) |
|
|
— |
|
|
|
— |
|
|
|
— |
|
|
|
— |
|
|
|
— |
|
|
Red Apple Stores Inc.: |
|
|
|
|
|
|
|
|
|
|
|
|
|
|
|
|
|
|
|
|
|
|
|
|
|
|
|
|
|
|
|
|
|
|
|
|
|
Senior Secured Loan |
|
|
18,440,000 |
|
|
|
— |
|
|
|
— |
|
|
|
(4,149,000 |
) |
|
|
14,291,000 |
|
|
|
— |
|
|
|
2,292,112 |
|
|
|
— |
|
|
|
— |
|
|
Preferred Stock |
|
|
— |
|
|
|
621,649 |
|
|
|
(1,479,254 |
) |
|
|
857,605 |
|
|
— |
|
† |
|
(1,479,254 |
) |
|
|
— |
|
|
|
— |
|
|
|
621,648 |
|
|
|
Preferred Stock |
|
|
— |
|
|
|
— |
|
|
|
— |
|
|
|
— |
|
|
|
— |
|
|
|
— |
|
|
|
— |
|
|
|
— |
|
|
|
— |
|
|
Common Stock |
|
|
— |
|
|
|
443,097 |
|
|
|
(235,122 |
) |
|
|
(207,975 |
) |
|
|
— |
|
|
|
— |
|
|
|
— |
|
|
|
— |
|
|
|
— |
|
|
Totals |
|
$ |
223,065,737 |
|
|
$ |
122,887,145 |
|
|
$ |
(14,512,234 |
) |
|
$ |
(21,967,719 |
) |
|
$ |
309,472,929 |
|
|
$ |
(1,532,024 |
) |
|
$ |
19,794,802 |
|
|
$ |
262,372 |
|
|
$ |
3,565,984 |
|
|
* |
Gross additions include increases in the cost basis of investments resulting from new portfolio investments, PIK interest or dividends, the amortization of unearned income, the exchange of one or more existing securities for one or more new securities and the movement of an existing portfolio company into this category from a different category. |
|
** |
Gross reductions include decreases in the cost basis of investments resulting from principal collections related to investment repayments or sales, the exchange of one or more existing securities for one or more new securities and the movement of an existing portfolio company out of this category into a different category. |
|
† |
Investment no longer held at December 31, 2016. |
|
†† |
Investment moved into the controlled category from the non-controlled, non-affiliated category. |
The aggregate fair value of controlled investments at December 31, 2016 represents 51.9% of the Company’s net assets.
The accompanying notes are an integral part of these consolidated financial statements.
F-20
BlackRock Capital Investment Corporation
Notes to Consolidated Financial Statements
1. Organization
BlackRock Capital Investment Corporation (together with its subsidiaries, the “Company”), was organized as a Delaware corporation on April 13, 2005 and was initially funded on July 25, 2005. The Company has elected to be regulated as a business development company (“BDC”) under the Investment Company Act of 1940 (the “1940 Act”). In addition, for tax purposes the Company has qualified and has elected to be treated as a regulated investment company (“RIC”) under the Internal Revenue Code of 1986 (the “Code”).
The Company’s investment objective is to generate both current income and capital appreciation through debt and equity investments. The Company invests primarily in middle-market companies in the form of senior and junior secured and unsecured debt securities and loans, each of which may include an equity component, and by making direct preferred, common and other equity investments in such companies.
2. Significant accounting policies
Basis of Presentation
The accompanying consolidated financial statements are prepared in accordance with accounting principles generally accepted in the United States of America (“GAAP”). The Company is an investment company following the accounting and reporting guidance in Financial Accounting Standards Board (“FASB”) Accounting Standards Codification (“ASC”) 946, Financial Services-Investment Company (“ASC 946”). The preparation of consolidated financial statements in conformity with GAAP requires management to make estimates and assumptions that affect the reported amounts of assets and liabilities as of the date of the consolidated financial statements and the reported amounts of income and expenses during the reported period. Changes in the economic environment, financial markets and any other parameters used in determining these estimates could cause actual results to differ and such differences could be material.
The accompanying consolidated financial statements include the accounts of the Company and its subsidiaries, which were established to hold certain investments of the Company. The Company owns 100% of each subsidiary and, as such, the subsidiaries are consolidated into the Company’s consolidated financial statements. The subsidiaries hold investments which are treated as pass through entities for tax purposes. By investing through these 100% owned subsidiaries, the Company is able to benefit from corporate tax treatment for these entities and thereby create a tax structure that is more advantageous with respect to the RIC status of the Company. Transactions between subsidiaries, to the extent they occur, are eliminated in consolidation.
Certain prior period information has been reclassified to conform to the current period presentation. The reclassification has no effect on the Company’s consolidated financial position or the consolidated results of operations as previously reported.
Expenses are recorded on an accrual basis.
Investments
Security transactions are accounted for on the trade date unless there are substantial conditions to the purchase. Realized gains or losses are measured by the difference between the net proceeds from the sale and the amortized cost basis of the investment. Unrealized gains or losses primarily reflect the change in investment values, including the reversal of previously recorded unrealized gains or losses when gains or losses are realized. Realized gains or losses on the disposition of investments are calculated using the specific identification method.
Investments for which market quotations are readily available are valued at such market quotations unless they are deemed not to represent fair value. The Company obtains market quotations, when available, from an independent pricing service or one or more broker-dealers or market makers and utilizes the average of the range of bid and ask quotations. Debt and equity securities for which market quotations are not readily available or for which market quotations are deemed not to represent fair value are valued at fair value as determined in good faith by or under the direction of the Company’s Board of Directors.
Because the Company expects that there will not be a readily available market for substantially all of the investments in its portfolio, the Company expects to value substantially all of its portfolio investments at fair value as determined in good faith by or under the direction of the Board of Directors using a consistently applied valuation process in accordance with a documented valuation policy that has been reviewed and approved by the Board of Directors. Due to the inherent uncertainty and subjectivity of determining the fair value of investments that do not have a readily available market value, the fair value of the Company’s investments may differ significantly from the values that would have been used had a readily available market value existed for such investments and may differ materially from the values that the Company may ultimately realize.
F-21
In addition, changes in the market environment and other events may have differing impacts on the market quotations used to value some of the Company’s investments than on the fair values of the Company’s investments for which market quotations are not readily available. Market quotations may be deemed not to represent fair value in certain circumstances where BlackRock Advisors, LLC, the Company’s investment advisor (the “Advisor”), believes that facts and circumstances applicable to an issuer, a seller or purchaser or the market for a particular security cause current market quotations to not reflect the fair value of the security. Examples of these events could include cases where a security trades infrequently causing a quoted purchase or sale price to become stale, where there is a “forced” sale by a distressed seller, where market quotations vary substantially among market makers, or where there is a wide bid-ask spread or significant increase in the bid-ask spread.
With respect to the Company’s investments for which market quotations are not readily available or for which market quotations are deemed not to represent fair value, the Board of Directors has approved a multi-step valuation process applied each quarter, as described below:
|
|
(i) |
The quarterly valuation process begins with each portfolio company or investment being initially evaluated and rated by the investment professionals of the Advisor responsible for the portfolio investment; |
|
|
(ii) |
The investment professionals provide recent portfolio company financial statements and other reporting materials to independent valuation firms engaged by the Board of Directors, such firms conduct independent appraisals each quarter and their preliminary valuation conclusions are documented and discussed with senior management of the Advisor; |
|
|
(iii) |
The Audit Committee of the Board of Directors reviews the preliminary valuations prepared by the independent valuation firms; and |
|
|
(iv) |
The Board of Directors discusses valuations and determines the fair value of each investment in the portfolio in good faith based on the input of the Advisor, the respective independent valuation firms and the Audit Committee. |
Those investments for which market quotations are not readily available or for which market quotations are deemed not to represent fair value are valued utilizing a market approach, an income approach, or both approaches, as appropriate. The market approach uses prices and other relevant information generated by market transactions involving identical or comparable assets or liabilities (including a business). The income approach uses valuation techniques to convert future amounts (for example, cash flows or earnings) to a single present amount (discounted). The measurement is based on the value indicated by current market expectations about those future amounts. In following these approaches, the types of factors that the Company may take into account in determining the fair value of its investments include, as relevant and among other factors: available current market data, including relevant and applicable market trading and transaction comparables, applicable market yields and multiples, security covenants, call protection provisions, information rights, the nature and realizable value of any collateral, the portfolio company’s ability to make payments, (e.g. non-performance risk), its earnings and discounted cash flows, the markets in which the portfolio company does business, comparisons of financial ratios of peer companies that are public, M&A comparables, the Company’s principal market (as the reporting entity) and enterprise values.
Until the end of the second calendar quarter following its acquisition, each unquoted investment in a new portfolio company generally is held at amortized cost, which the Advisor believes approximates fair value under the circumstances. As of that date, an independent valuation firm conducts an initial independent appraisal of the investment.
ASC 820-10, Fair Value Measurements and Disclosures (“ASC 820-10”), issued by the FASB, defines fair value, establishes a framework for measuring fair value and requires disclosures about fair value measurements. See Note 10 for further details.
Cash and Cash Equivalents
Cash equivalents include short-term liquid overnight investments with original maturities of three months or less and may not be insured by the FDIC or may exceed federally insured limits.
Revenue Recognition
Interest income is recorded on an accrual basis and includes amortization of discounts and accretion of premiums. Discounts and premiums to par value on securities purchased are amortized/accreted into interest income over the life of the respective security. Discounts and premiums are determined based on the cash flows expected to be received for a particular investment upon maturity.
F-22
Dividend income is recorded on the ex-dividend date and is adjusted to the extent that the Company expects to collect such amounts. For loans and securities with PIK income, which represents contractual interest or dividends accrued and added to the principal balance and generally due at maturity, such income is accrued only to the extent that the Advisor believes that the PIK income is likely to be collected. To maintain the Company’s status as a RIC, this non-cash source of income must be paid out to stockholders in the form of distributions, even though the Company has not yet collected the cash.
Fee income, such as structuring fees, origination, closing, commitment and other upfront fees are generally non-recurring and are recognized as revenue when earned. In instances where the Company does not perform significant services in connection with the related investment, fees paid to the Company may be deferred and amortized over the estimated life of the investment. Upon the prepayment of a loan or debt security, any prepayment penalties and unamortized loan origination, structuring, closing, commitment and other upfront fees are recorded as income.
U.S. Federal Income Taxes
The Company has elected to be treated as a RIC under Subchapter M of the Code and operates in a manner so as to continue to qualify for the tax treatment applicable to RICs.
In order to qualify for favorable tax treatment as a RIC, the Company is required to distribute annually to its stockholders at least 90% of its investment company taxable income, as defined by the Code. To avoid federal excise taxes, the Company must distribute annually at least 98% of our ordinary income and 98.2% of net capital gains from the current year and any undistributed ordinary income and net capital gains from the preceding years. The Company, at its discretion, may carry forward taxable income in excess of calendar year distributions and pay regular federal income taxes or a 4% excise tax on this income. If the Company chooses to do so, all other things being equal, this would increase expenses and reduce the amount available to be distributed to stockholders. The Company will accrue excise tax on estimated undistributed taxable income as required.
Distributions from net investment income and distributions from net realized capital gains are determined in accordance with U.S. federal income tax regulations, which may differ from those amounts determined in accordance with GAAP. These book/tax differences are either temporary or permanent in nature. To the extent these differences are permanent, they are charged or credited to paid-in-capital or accumulated net realized gain (loss), as appropriate, in the period that the differences arise. Temporary and permanent differences are primarily attributable to differences in the tax treatment of certain loans and the tax characterization of income and non-deductible expenses. These differences are generally determined in conjunction with the preparation of the Company’s annual RIC tax return.
Book and tax basis differences relating to stockholder distributions and other permanent book and tax differences are reclassified among the Company’s capital accounts. In addition, the character of income and gains to be distributed is determined in accordance with income tax regulations that may differ from GAAP.
The final tax characterization of distributions is determined after the fiscal year and is reported on Form 1099 and in the Company’s annual report to shareholders. Distributions can be characterized as ordinary income, capital gains and/or return of capital. To the extent that distributions exceed the Company’s current and accumulated earnings and profits, the excess may be treated as a non-taxable return of capital. Distributions that exceed a Company’s taxable income but do not exceed the Company’s current and accumulated earnings and profits, may be classified as ordinary income which is taxable to shareholders.
ASC 740-10, Income Taxes (“ASC 740-10”) clarifies the accounting for income taxes by prescribing the minimum recognition threshold an uncertain tax position is required to meet before tax benefits associated with such uncertain tax position are recognized in the consolidated financial statements. Based on its analysis of its tax position, the Company has concluded that it does not have any uncertain tax positions that met the recognition or measurement criteria of ASC 740-10.
The Company files U.S. federal and various state and local tax returns. No income tax returns are currently under examination. The statute of limitations on the Company’s U.S. federal income tax returns remains open for each of the four years ended December 31, 2017. The statute of limitations on the Company’s state and local tax returns may remain open for an additional year depending upon the jurisdiction.
At December 31, 2017, the Company had a net capital loss carryforward of $140,699,214, which can be used to offset future capital gains. If not utilized against future gains, $32,937,589 of this amount is due to expire on December 31, 2018.
The Company holds certain portfolio investments through taxable subsidiaries as pass through entities. Income earned and gains realized on the investment held by the taxable subsidiary are taxable to such subsidiary. A tax provision for income, if any, is shown as income tax in the Consolidated Statements of Operations for the Company. A tax provision for realized and unrealized gains is included as a reduction of realized and/or unrealized gain (loss) in the Consolidated Statement of Operations for the Company.
F-23
Distributions to Common Stockholders
Distributions to common stockholders are recorded on the ex-dividend date. The amount to be paid out as a distribution is determined by the Board of Directors. Net realized capital gains, if any, generally are distributed at least annually, although the Company may decide to retain such capital gains for investment.
The Company has adopted a dividend reinvestment plan that provides for reinvestment of distributions on behalf of stockholders, unless a stockholder elects to receive cash. As a result, if the Board of Directors authorizes, and the Company declares, a cash distribution, then stockholders who have not “opted out” of the dividend reinvestment plan will have their cash dividends automatically reinvested in additional shares of Common Stock, rather than receiving the cash distributions.
Foreign Currency
Foreign currency amounts are translated into United States dollars on the following basis:
|
|
(i) |
market value of investment securities, other assets and liabilities—at the spot exchange rate on the last business day of the period; and |
|
|
(ii) |
purchases and sales of investment securities, income and expenses—at the rates of exchange prevailing on the respective dates of such transactions, income or expenses. |
Although net assets and fair values are presented based on the applicable foreign exchange rates described above, the Company does not isolate that portion of the results of operations resulting from changes in foreign exchange rates on investments from the fluctuations arising from changes in fair values of investments held. Such fluctuations are included with the net realized and unrealized gain or loss from investments.
Investments denominated in foreign currencies and foreign currency transactions may involve certain considerations and risks not typically associated with those of domestic origin, including unanticipated movements in the value of the foreign currency relative to the U.S. dollar.
Debt Issuance Costs
Debt issuance costs are amortized over the term of the related debt using the straight line method, which approximates the effective interest rate method.
Equity Offering Expenses
The Company records registration expenses related to its shelf registration statement and related SEC filings as prepaid assets. These expenses are charged as a reduction of capital upon utilization, in accordance with ASC 946, Financial Services—Investment Companies.
Non-Accrual Loans
Loans or debt securities are placed on non-accrual status, as a general matter, when principal or interest payments are past due 30 days or more or when there is reasonable doubt that principal or interest will be collected. Accrued interest generally is reversed when a loan or debt security is placed on non-accrual status. Interest payments received on non-accrual loans or debt securities may be recognized as income or applied to principal depending upon management’s judgment. Non-accrual loans and debt securities are restored to accrual status when past due principal and interest is paid and, in management’s judgment, are likely to remain current. The Company may make exceptions to this treatment if the loan has sufficient collateral value and is in the process of collection.
Recently Issued Accounting Pronouncements
In May 2014, the FASB issued ASU 2014-09, Revenue from Contracts with Customers (“ASU 2014-09”), which outlines a single comprehensive model for entities to use in accounting for revenue arising from contracts with customers and supersedes most current revenue recognition guidance, including industry-specific guidance. The core principle of the guidance is that an entity should recognize revenue to depict the transfer of goods or services to customers in an amount that reflects the consideration to which the entity expects to be entitled in exchange for those goods and services. ASU 2014-09 is effective for fiscal years, and interim periods within those fiscal years, beginning after December 15, 2017. The Company adopted the new standard effective on January 1, 2018 using the modified retrospective method. Furthermore, the Company has reached conclusions on key accounting assessments, including identification of performance obligations, and evaluation of existing contracts and revenue streams for potential changes in the amount and timing of revenue recognition. As a result of this analysis, substantially all revenue streams are excluded from the scope of the new standard and the adoption of the standard has no material impact on the Company’s consolidated financial statements.
F-24
In February 2016, the Financial Accounting Standards Board issued Accounting Standards Update (“ASU”) No. 2016‑02, Leases (Topic 842). The guidance in this ASU supersedes the leasing guidance in Leases (Topic 840). Under the new guidance, lessees are required to recognize lease assets and lease liabilities on the balance sheet for those leases previously classified as operating leases. The guidance requires the use of a modified retrospective transition approach, which includes a number of optional practical expedients that entities may elect to apply. The amendments in ASU No. 2016‑02 are effective for annual reporting periods beginning after December 15, 2018, including interim periods within that reporting period, with early adoption permitted. The Company is currently evaluating the effect on its consolidated financial statements.
In August 2016, the FASB issued ASU 2016-15, Classification of Certain Cash Receipts and Cash Payments (“ASU 2016-15”), which amends and clarifies the current guidance to reduce diversity in practice of the classification of certain cash receipts and payments in the statement of cash flows. The Company is currently evaluating the impact of adopting ASU 2016-15, which is effective for the Company on January 1, 2018 with early adoption permitted. The Company must apply the guidance retrospectively to all periods presented. The impact of the adoption of this new accounting standard on the Company’s consolidated financial statements is not expected to be material.
In March 2017, the FASB issued ASU 2017-08, Receivables – Nonrefundable Fees and Other Costs (“ASU 2017-08”). The amendments in this update require premiums on purchased callable debt securities to be amortized to the security’s earliest call date. Prior to this ASU, premiums and discounts on purchased callable debt securities were generally required to be amortized to the security’s maturity date. The amendments do not require an accounting change for securities held at a discount. The amendments are effective on January 1, 2019, with early adoption permitted. The amendments must be applied using a modified retrospective approach with a cumulative-effect adjustment through retained earnings as of the beginning of the fiscal year upon adoption. The Company is currently evaluating the effect on its consolidated financial statements, however, the Company does not expect ASU 2017-08 to have a material impact on the consolidated financial statements.
3. Agreements and Related Party Transactions
Investment Management Agreement
At a Special Meeting of the Company’s Stockholders, held on February 18, 2015, the Company’s stockholders approved a new investment management agreement (“Management Agreement”) between the Company and the Advisor to permit the Advisor to serve as the Company’s investment advisor following the completion of the sale of certain assets related to managing the Company from the Company’s previous investment advisor, 52nd Street Capital Advisors LLC, formerly BlackRock Kelso Capital Advisors LLC (the “Previous Advisor,” “BKCA” or “52nd Street”), to the Advisor (the “Transaction”). The Transaction was completed on March 6, 2015 and, pursuant to the new investment management agreement, dated as of March 6, 2015, the Company’s investment activities are currently managed by the Advisor. Prior to the consummation of the Transaction, the Company had entered into an investment management agreement with the Company’s Previous Advisor, which is referred to as the “Previous Agreement”. The Company’s current Management Agreement had the same management and incentive fee terms as the Previous Agreement until March 6, 2017 and thereafter has different management and incentive fees terms.
Base Management Fee
Under the Management Agreement, the Advisor, subject to the overall supervision of the Board of Directors, manages the day-to-day operations and provides the Company with investment advisory services. For providing these services, the Advisor received, until March 6, 2017, a base management fee at an annual rate of 2.0% of total assets, including any assets acquired with the proceeds of leverage, payable quarterly in arrears. After March 6, 2017, the Advisor receives a base management fee at an annual rate of 1.75% of total assets (excluding cash), including any assets acquired with the proceeds of leverage, payable quarterly in arrears based on the asset valuation as of the end of the prior quarter, and prorated for any period of less than a quarter.
The investment management agreement became effective on March 6, 2015. Unless earlier terminated, the investment management agreement was in effect for a period of two years from the date it first became effective and will remain in effect from year-to-year thereafter if approved annually by the Board of Directors or by the affirmative vote of the holders of a majority of outstanding voting securities, including, in either case, approval by a majority of the directors who are not interested persons. The Company’s Board of Directors approved the continuation of investment management agreement in November 2017.
For the years ended December 31, 2017, 2016 and 2015, the Company incurred $16,391,532, $21,460,909 and $24,678,087, respectively, in base management fees under the Management Agreement.
F-25
Incentive Management Fee Until March 6, 2017
The current investment management agreement provides that the Advisor or its affiliates may be entitled to an incentive management fee (the “Incentive Fee”) as described below under certain circumstances until March 6, 2017. The Incentive Fee was calculated in the same manner as the Incentive Fee in the previous investment management agreement. The determination of the Incentive Fee, as described in more detail below, will result in the Advisor or its affiliates receiving no Incentive Fee payments if returns to stockholders do not meet an 8.0% annualized rate of return during the applicable fee measurement period, and will result in the Advisor or its affiliates receiving less than the full amount of the Incentive Fee percentage until returns to stockholders exceed an approximate 13.3% annualized rate of return during such period. Annualized rate of return in this context is computed by reference to net asset value and does not take into account changes in the market price of the common stock.
The Advisor will be entitled to receive the Incentive Fee if the performance exceeds a “hurdle rate” during different measurement periods: trailing four quarters’ periods (which apply only to the portion of the Incentive Fee based on income) and annual periods (which apply only to the portion of the Incentive Fee based on capital gains). The “trailing four quarters’ periods” for purposes of determining the income portion of the Incentive Fee payable for the three months ended December 31, 2017 and 2016 was determined by reference to the four quarter periods ended on December 31, 2017 and 2016, respectively, however, the periods utilized different incentive management fee calculations, both of which are described in more detail below. The term “annual period” means the period beginning on July 1 of each calendar year and ending on June 30 of the next calendar year.
The hurdle rate for each measurement period is 2.0% multiplied by net asset values at the beginning of each calendar quarter during the measurement period, calculated after giving effect to any distributions that occurred during the measurement period. A portion of the Incentive Fee is based on income and a portion is based on capital gains. Each portion of the Incentive Fee is described below.
|
|
(i) |
Quarterly Incentive Fee Based on Income Until March 6, 2017 |
For each trailing four quarters’ period, the Company will pay the Advisor an Incentive Fee based on the amount by which (A) aggregate distributions and amounts distributable out of taxable net income (excluding any capital gain and loss), during the period less the amount, if any, by which net unrealized capital depreciation exceeds net realized capital gains / losses during the period, is in excess of (B) the hurdle rate for the period. The amount of the excess of (A) over (B) described in this paragraph for each period is referred to as the excess income amount.
It should be noted that net realized capital gains / losses during the period are calculated as the proceeds received upon disposition less the fair market value as of the beginning of the measurement period. Since this calculation is not cumulative, but rather performed on a trailing four quarters period, fluctuations in fair market values are captured in net unrealized appreciation and depreciation of prior measurement periods.
The portion of the Incentive Fee based on income for each period will equal 50% of the period’s excess income amount, until the cumulative Incentive Fee payments for the period equal 20% of the period’s income amount distributed or distributable to stockholders as described in clause (A) of the preceding paragraph. Thereafter, the portion of the Incentive Fee based on income for the period will equal 20% of the period’s amount distributed or distributable to stockholders.
For the period from January 1, 2017 through March 6, 2017, the Advisor did not earn Incentive Fees based on income from the Company. For the years ended December 31, 2016 and 2015, the Company incurred zero and $11,061 in Incentive Fees based on income, respectively.
|
|
(ii) |
Annual Incentive Fee Based on Capital Gains Until March 6, 2017 |
The portion of the Incentive Fee based on capital gains is calculated and paid on an annual basis beginning on July 1 of each annual period and ending on June 30 of the next calendar year. The portion of Incentive Fee based on capital gains is calculated in the same manner as such portion of the Incentive Fee in the prior investment management agreement. For each annual period, the Company pays the Advisor an Incentive Fee on capital gains based on the amount by which (A) net realized capital gains, if any, exceeds gross unrealized capital depreciation, if any, occurring during the period in excess of (B) the amount, if any, by which the period’s hurdle rate exceeds the amount of income used in the determination of the Incentive Fee based on income for the period. The amount of the excess of (A) over (B) described in this paragraph is referred to as the excess gain amount.
|
|
(iii) |
Calculation of Incentive Fee |
The portion of the Incentive Fee based on capital gains for each period will equal 50% of the period’s excess gain amount, until such payments equal 20% of the period’s capital gain amount distributed or distributable to stockholders. Thereafter, the portion of the Incentive Fee based on capital gains for the period equals an amount such that the portion of the Incentive Fee payments to the Advisor based on capital gains for the period equals 20% of the period’s capital gain amount distributed or distributable to
F-26
stockholders. The result of this formula is that, if the portion of the Incentive Fee based on income for the period exceeds the period’s hurdle, then the portion of the Incentive Fee based on capital gains will be capped at 20% of the capital gain amount.
In calculating whether the portion of the Incentive Fee based on capital gains is payable with respect to any period, we account for assets on a security-by-security basis. In addition, the Company uses the “period-to-period” method pursuant to which the portion of the Incentive Fee based on capital gains for any period is based on realized capital gains for the period reduced by realized capital losses and gross unrealized capital depreciation for the period. Based on current interpretations of Section 205(b)(3) of the Investment Advisers Act of 1940 by the SEC and its staff, the calculation of unrealized depreciation for each portfolio security over a period is based on the fair value of the security at the end of the period compared to the fair value at the beginning of the period. Incentive Fees earned in any of the periods described above are not subject to modification or repayment based upon performance in a subsequent period.
The Company is required under GAAP to accrue a hypothetical capital gains Incentive Fee based upon net realized capital gains and unrealized capital appreciation and depreciation on investments held at the end of each period. The accrual of this hypothetical capital gains Incentive Fee assumes all unrealized capital appreciation and depreciation is realized in order to reflect a hypothetical capital gains Incentive Fee that would be payable at each measurement date. If such amount is positive at the end of the period, then we record a capital gains Incentive Fee equal to 20% of such amount, less the amount of capital gains related Incentive Fees already accrued in prior periods. If the resulting amount is negative, the accrual for GAAP in a given period may result in the reduction of an expense. There can be no assurance that such unrealized capital appreciation will be realized in the future. However, it should be noted that a fee so calculated and accrued would not be payable under the Advisers Act or the investment management agreement. Amounts actually paid will be consistent with the Advisers Act which specifically excludes consideration of unrealized capital appreciation.
The capital gains Incentive Fee due to the Advisor as calculated under the investment management agreement as described above, for the annual period ended June 30, 2017, 2016 and 2015 was zero. In accordance with GAAP, the hypothetical liquidation for the years ended December 31, 2017, 2016 and 2015 resulted in a capital gains Incentive Fee (reversal)/accrual of zero, zero and $(3,200,520), respectively. The Company did not have total cumulative accrued balance at December 31, 2017, 2016 and 2015, respectively.
|
|
(iv) |
Calculation of Capital Gains |
It should be noted that net realized capital gains during the period are calculated as the proceeds received upon disposition in excess of the lower of each security’s amortized cost or the fair market value as of the beginning of the measurement period. Since this calculation is not cumulative, but rather performed on an annual period commencing each July 1, any unrealized depreciation on a security, if any, will be captured in the gross unrealized depreciation of a prior period.
Incentive Management Fee After March 6, 2017
|
|
(i) |
Quarterly Incentive Fee Based on Income After March 6, 2017 |
After March 6, 2017, the Management Agreement provides that the Advisor or its affiliates may be entitled to an incentive management fee under certain circumstances. The Incentive Fee has two parts. The first portion is based on income other than capital gains and is calculated separately for each calendar quarter and will be paid on a quarterly basis. The Company will pay the Advisor the portion of the Incentive Fee based on income for each period as follows:
|
|
• |
No Incentive Fee based on income other than capital gains for any calendar quarter in which the Pre-Incentive Fee Net Investment Income does not exceed 1.75% (7.00% annualized) of net assets attributable to common stock at the beginning of such quarter. |
|
|
• |
100% of the Pre-Incentive Fee Net Investment Income in any calendar quarter with respect to that portion of such Pre-Incentive Fee Net Investment Income, if any, for such calendar quarter, that exceeds 1.75% (7.00% annualized) of net assets attributable to common stock at the beginning of such quarter but is less than 2.1875% (8.75% annualized). |
|
|
• |
20% of the Pre-Incentive Fee Net Investment Income, if any, for any calendar quarter that exceeds 2.1875% (8.75% annualized) of net assets attributable to common stock at the beginning of such quarter. |
The calculations described above will be appropriately prorated for any period of less than a quarter and adjusted for the net proceeds from any common stock issuances and the cost of any common stock repurchases during such quarter.
The payment of any such Incentive Fee based on income otherwise earned by the Advisor will be deferred if, for the most recent four full calendar quarter period ending on or prior to the date such payment is to be made, the Annualized Rate of Return is less than 7.0% of net assets attributable to common stock at the beginning of such four quarter period as adjusted for the net proceeds from any common stock issuances and the cost of any common stock repurchases during such four full calendar quarter period, with any
F-27
deferred Incentive Fees to be carried over for payment in subsequent quarterly calculation periods to the extent such payment can then be made in accordance with the investment management agreement.
For the period after March 6, 2017 to December 31, 2017, the Advisor earned $7,980,098 in Incentive Fees based on income from the Company.
On March 7, 2017, the Advisor, in consultation with the Company’s Board of Directors, agreed to waive incentive fees based on income after March 6, 2017 to December 31, 2018 or approximately 21 months. The start date of the fee waiver coincides with the change to the fee calculation mentioned above. The waiver for incentive fees based on income for the period after March 6, 2017 to December 31, 2017 is $7,980,098, resulting in no net Incentive Fees based on income earned by the Company.
|
|
(ii) |
Annual Incentive Fee Based on Capital Gains After March 6, 2017 |
The second portion of the Incentive Fee is based on capital gains and is calculated separately for each Annual Period. The Advisor will be entitled to receive an Incentive Fee based on capital gains for each Annual Period in an amount equal to 20% of the amount by which (1) net realized capital gains occurring during the period, if any, exceeds (2) gross unrealized capital depreciation, if any, occurring during the period. In calculating the portion of the Incentive Fee based on capital gains payable for any period, investments are accounted for on a security-by-security basis. In addition, the portion of the Incentive Fee based on capital gains is determined using the “period-to-period” method pursuant to which the portion of the Incentive Fee based on capital gains for any period will be based on realized capital gains for the period reduced by realized capital losses for the period and unrealized capital depreciation for the period.
The capital gains Incentive Fee due to the Advisor as calculated under the investment management agreement as described above, at December 31, 2017, resulted in no capital gains incentive fee accrual. The total cumulative accrued balance at December 31, 2017 was zero.
|
|
(iii) |
Calculation of Incentive Fee |
For purposes of calculating the Incentive Fee, (i) “Annual Period” means the period beginning on July 1 of each calendar year, including the calendar year prior to the year in which the investment management agreement became effective, and ending on June 30 of the next calendar year; (ii) “Annualized Rate of Return” is computed by reference to the sum of (i) the aggregate distributions to common stockholders for the period in question and (ii) the change in net assets attributable to common stock (before taking into account any Incentive Fees otherwise payable during such period); (iii) “net assets attributable to common stock” means total assets less indebtedness and preferred stock; and (iv) “Pre-Incentive Fee Net Investment Income” means net investment income (as determined in accordance with United States generally accepted accounting principles) accrued by the Company during the calendar quarter excluding any accruals for or payments in respect of the Incentive Fee.
|
|
(iv) |
Calculation of Capital Gains |
Capital gains and losses are calculated using the proceeds received and either (i) fair market value at the beginning of the Annual Period or (ii) cost for investments acquired during the Annual Period. In calculating whether the portion of the Incentive Fee based on capital gains is payable with respect to any period, the Company accounts for assets on a security-by-security basis. In addition, the Company uses the “period-to-period” method pursuant to which the portion of the Incentive Fee based on capital gains for any period is based on realized capital gains for the period reduced by realized capital losses and gross unrealized capital depreciation for the period. Based on current interpretations of Section 205(b)(3) of the Investment Advisers Act of 1940 by the SEC and its staff, the calculation of unrealized depreciation for each portfolio security over a period is based on the fair value of the security at the end of the period compared to the fair value at the beginning of the period. Incentive Fees earned in any of the periods described above are not subject to modification or repayment based upon performance in a subsequent period.
Advisor Reimbursements
The Management Agreement provides that the Company will reimburse the Advisor for costs and expenses incurred by the Advisor for administrative or operating services, office space rental, office equipment and utilities allocable to the Advisor under the Management Agreement, as well as any costs and expenses incurred by the Advisor relating to any non-investment advisory, administrative or operating services provided by the Advisor to us. For the years ended December 31, 2017, 2016 and 2015, we incurred $350,004, $350,004 and $798,139, respectively, for such investment advisor expenses under the Management Agreement.
From time to time, the Advisor may pay amounts owed by the Company to third party providers of goods or services. The Company will subsequently reimburse the Advisor for such amounts paid on its behalf. Reimbursements to the Advisor for such purposes for the years ended December 31, 2017 and 2016 were $182,767 and $5,921, respectively. Reimbursements to both the Previous Advisor and the Advisor for such purposes for the year ended December 31, 2015 was $278,975.
F-28
No person who is an officer, director or employee of the Advisor and who serves as a director of the Company receives any compensation from the Company for such services. Directors who are not affiliated with the Advisor receive compensation for their services and reimbursement of expenses incurred to attend meetings.
Administration
The Company also has entered into an administration agreement with BlackRock Financial Management, Inc. (the “Administrator”) under which the Administrator provides certain administrative services to the Company. For providing these services, facilities and personnel, the Company reimburses the Administrator for the Company’s allocable portion of overhead and other expenses incurred by the Administrator in performing its obligations under the administration agreement, including rent and the Company’s allocable portion of the cost of certain of the Company’s officers and its respective staffs. For the years ended December 31, 2017, 2016 and 2015, the Company incurred $1,039,221, $1,304,172 and $1,614,561, respectively, for administrative services expenses payable to the Administrator under the administration agreement.
Advisor Stock Transactions
Effective upon completion of the Transaction, the Advisor assumed the role as investment advisor to the Company. The Advisor did not own any shares of the Company at December 31, 2017 and 2016.
At December 31, 2017, 2016 and 2015, other entities affiliated with the Administrator and Advisor beneficially owned approximately 462,000, 490,000 and 327,000 shares, respectively, of the Company’s common stock, representing approximately 0.6%, 0.7% and 0.4% of the total shares outstanding.
4. Earnings (Loss) per share
The following information sets forth the computation of basic and diluted net increase (decrease) in net assets from operations per share (earnings (loss) per share) for the years ended December 31, 2017, 2016 and 2015.
|
|
|
Year ended December 31, 2017 |
|
|
Year ended December 31, 2016 |
|
|
Year ended December 31, 2015 |
|
|||
|
Earnings (Loss) per share—basic: |
|
|
|
|
|
|
|
|
|
|
|
|
|
Net increase (decrease) in net assets resulting from operations |
|
$ |
20,902,457 |
|
|
$ |
(84,291,924 |
) |
|
$ |
38,625,084 |
|
|
Weighted average shares outstanding—basic |
|
|
72,983,354 |
|
|
|
72,757,978 |
|
|
|
74,576,277 |
|
|
Earnings (Loss) per share—basic: |
|
$ |
0.29 |
|
|
$ |
(1.16 |
) |
|
$ |
0.52 |
|
|
Earnings (Loss) per share—diluted: |
|
|
|
|
|
|
|
|
|
|
|
|
|
Net increase (decrease) in net assets resulting from operations, before adjustments |
|
$ |
20,902,457 |
|
|
$ |
(84,291,924 |
) |
|
$ |
38,625,084 |
|
|
Adjustments for interest on unsecured convertible senior notes |
|
|
— |
|
|
|
— |
|
|
|
— |
|
|
Net increase (decrease) in net assets resulting from operations, as adjusted |
|
$ |
20,902,457 |
|
|
$ |
(84,291,924 |
) |
|
$ |
38,625,084 |
|
|
Weighted average shares outstanding—diluted(1) |
|
|
72,983,354 |
|
|
|
72,757,978 |
|
|
|
74,576,277 |
|
|
Earnings (Loss) per share—diluted: |
|
$ |
0.29 |
|
|
$ |
(1.16 |
) |
|
$ |
0.52 |
|
|
(1) |
Due to a net decrease in net assets from operations for the 2016 period, no incremental shares were included because the effect would be antidilutive. Additionally, no incremental shares were included for the 2015 and 2017 periods, as the effect of unsecured senior convertible notes would be antidilutive. |
5. Investments
Purchases of investments, including PIK, for the years ended December 31, 2017, 2016 and 2015 totaled $243,395,361, $325,409,753 and $311,838,936, respectively. Proceeds from sales, repayments and other exits of investments for the years ended December 31, 2017, 2016 and 2015 totaled $386,382,563, $377,154,842 and $417,736,483, respectively.
F-29
At December 31, 2017, investments consisted of the following:
|
|
|
Cost |
|
|
Fair Value |
|
||
|
Senior secured notes |
|
$ |
23,773,283 |
|
|
$ |
23,250,661 |
|
|
Unsecured debt |
|
|
145,793,872 |
|
|
|
95,266,709 |
|
|
Subordinated debt |
|
|
29,600,000 |
|
|
|
29,600,000 |
|
|
Senior secured loans: |
|
|
|
|
|
|
|
|
|
First lien |
|
|
241,151,702 |
|
|
|
214,875,825 |
|
|
Second/other priority lien |
|
|
195,316,002 |
|
|
|
189,343,791 |
|
|
Total senior secured loans |
|
|
436,467,704 |
|
|
|
404,219,616 |
|
|
Preferred stock |
|
|
56,167,927 |
|
|
|
59,622,456 |
|
|
Common stock |
|
|
25,029,241 |
|
|
|
16,206,829 |
|
|
Limited partnership/limited liability company interests |
|
|
111,766,448 |
|
|
|
129,774,536 |
|
|
Equity warrants/options |
|
|
694,450 |
|
|
|
— |
|
|
Total investments |
|
$ |
829,292,925 |
|
|
$ |
757,940,807 |
|
At December 31, 2016, investments consisted of the following:
|
|
|
Cost |
|
|
Fair Value |
|
||
|
Senior secured notes |
|
$ |
76,916,677 |
|
|
$ |
63,609,625 |
|
|
Unsecured debt |
|
|
147,170,031 |
|
|
|
127,317,932 |
|
|
Subordinated debt |
|
|
28,800,000 |
|
|
|
28,800,000 |
|
|
Senior secured loans: |
|
|
|
|
|
|
|
|
|
First lien |
|
|
295,899,093 |
|
|
|
289,982,154 |
|
|
Second/other priority lien |
|
|
294,051,311 |
|
|
|
258,533,161 |
|
|
Total senior secured loans |
|
|
589,950,404 |
|
|
|
548,515,315 |
|
|
Preferred stock |
|
|
58,544,859 |
|
|
|
57,873,127 |
|
|
Common stock |
|
|
41,220,333 |
|
|
|
37,632,386 |
|
|
Limited partnership/limited liability company interests |
|
|
77,102,335 |
|
|
|
67,257,747 |
|
|
Equity warrants/options |
|
|
1,880,588 |
|
|
|
117,358 |
|
|
Total investments |
|
$ |
1,021,585,227 |
|
|
$ |
931,123,490 |
|
F-30
The industry composition of the portfolio, at fair value, at December 31, 2017 and 2016 was as follows:
|
|
|
December 31, |
|
|||||
|
Industry |
|
2017 |
|
|
2016 |
|
||
|
Finance |
|
|
29.5 |
% |
|
|
21.1 |
% |
|
Chemicals, Plastics, & Rubber |
|
|
16.3 |
|
|
|
12.3 |
|
|
Services: Business |
|
|
9.9 |
|
|
|
11.4 |
|
|
Energy: Oil & Gas |
|
|
9.6 |
|
|
|
4.7 |
|
|
Services: Consumer |
|
|
7.0 |
|
|
|
3.4 |
|
|
Retail |
|
|
6.1 |
|
|
|
4.8 |
|
|
Healthcare & Pharmaceuticals |
|
|
5.3 |
|
|
|
6.9 |
|
|
Metals & Mining |
|
|
3.4 |
|
|
|
2.8 |
|
|
Aerospace & Defense |
|
|
3.4 |
|
|
|
4.7 |
|
|
Containers, Packaging, & Glass |
|
|
3.3 |
|
|
|
2.1 |
|
|
Construction & Building |
|
|
2.6 |
|
|
|
3.0 |
|
|
Insurance |
|
|
1.3 |
|
|
|
5.1 |
|
|
Consumer Goods: Durable |
|
|
0.9 |
|
|
|
7.4 |
|
|
Capital Equipment |
|
|
0.9 |
|
|
|
0.5 |
|
|
High Tech Industries |
|
|
0.5 |
|
|
|
0.3 |
|
|
Environmental Industries |
|
|
0.0 |
|
|
|
6.0 |
|
|
Media: Advertising, Printing & Publishing |
|
|
0.0 |
|
|
|
3.5 |
|
|
Total |
|
|
100.0 |
% |
|
|
100.0 |
% |
The geographic composition of the portfolio at fair value at December 31, 2017 was United States 96.5%, Canada 2.1%, Bermuda 0.9%, and the Cayman Islands 0.5%, and at December 31, 2016 was United States 94.4%, Bermuda 3.8%, Canada 1.5% and the Cayman Islands 0.3%. The geographic composition is determined by several factors including the location of the corporate headquarters of the portfolio company.
Market and Credit Risk
In the normal course of business, the Company invests in securities and enters into transactions where risks exist due to fluctuations in the market (market risk) or failure of the issuer of a security to meet all its obligations (issuer credit risk). The value of securities held by the Company may decline in response to certain events, including those directly involving the issuers whose securities are owned by the Company; conditions affecting the general economy; overall market changes; local, regional or global political, social or economic instability; and currency and interest rate and price fluctuations. Similar to issuer credit risk, the Company may be exposed to counterparty credit risk, or the risk that an entity with which the Company has unsettled or open transactions may fail to or be unable to perform on its commitments. The Company manages counterparty risk by entering into transactions only with counterparties that they believe have the financial resources to honor their obligations and by monitoring the financial stability of those counterparties. Financial assets, which potentially expose the Company to market, issuer and counterparty credit risks, consist principally of investments in portfolio companies. The extent of the Company’s exposure to market, issuer and counterparty credit risks with respect to these financial assets is generally approximated by their value recorded in the consolidated statements of assets and liabilities. The Company is also exposed to credit risk related to maintaining all of its cash at a major financial institution.
The Company has investments in lower rated and comparable quality unrated senior and junior secured, unsecured and subordinated debt securities and loans, which are subject to a greater degree of credit risk than more highly rated investments. The risk of loss due to default by the issuer is significantly greater for holders of such securities and loans, particularly in cases where the investment is unsecured or subordinated to other creditors of the issuer.
F-31
BCIC Senior Loan Partners, LLC
On June 23, 2016, the Company and Windward Investments LLC (“Windward”) entered into an agreement to create BCIC Senior Loan Partners, LLC (“Senior Loan Partners”), a joint venture. Senior Loan Partners is structured as an unconsolidated Delaware limited liability company, and makes loans to and other investments in portfolio companies. All portfolio and other material decisions regarding Senior Loan Partners must be submitted to its board of directors, which is comprised of four members, two of whom were selected by the Company and two of whom were selected by Windward, and must be approved by at least one member appointed by the Company and one appointed by Windward. In addition, certain matters may be approved by Senior Loan Partners’ investment committee, which is comprised of one member appointed by the Company and one member appointed by Windward.
The Company does not consolidate its non-controlling interests in Senior Loan Partners because the entity is not considered a substantially wholly owned investment company subsidiary, as provided under ASC 946. Senior Loan Partners is a joint venture for which shared power exists relating to the decisions that most significantly impact the economic performance of the entity.
The Company and Windward have committed to provide an aggregate of $100.0 million of equity to Senior Loan Partners, with the Company providing $85.0 million and Windward providing $15.0 million. As of December 31, 2017, Senior Loan Partners had called and received $85.1 million of combined equity capital, of which the Company funded $72.3 million and Windward funded $12.8 million. As of December 31, 2017, Senior Loan Partners had received $1.4 million of contributions in advance from Windward, which is recorded as a liability in Senior Loan Partners’ Consolidated Statements of Assets and Liabilities, as shown in the selected balance sheet information below. As a result, remaining commitments from the Company and Windward as of December 31, 2017 were $12.7 million and $2.2 million, respectively. Capital contributions have been used to make investments and to fund certain start-up expenses and ongoing administrative expenses of Senior Loan Partners.
On June 24, 2016, Senior Loan Partners as Seller and Collateral Manager, and BCIC Senior Loan Funding, LLC (“Senior Loan Funding”), a newly formed Delaware limited liability company consolidated by Senior Loan Partners, as Borrower entered into a $200.0 million Loan and Security Agreement (the “LSA” or the “Senior Facility”) with Citibank, N.A. (“Citi”) acting as Administrative Agent and The Bank of New York Mellon Trust Company (“BoNY”) as Collateral Agent. The Senior Facility is scheduled to mature on June 24, 2021. Senior Loan Partners and Senior Loan Funding, as applicable, have made certain customary representations and warranties, and are required to comply with various covenants, including collateral maintenance, reporting requirements, usual and customary events of default and other customary requirements for similar facilities. Senior Loan Partners and Senior Loan Funding were not in default with any covenants or requirements thereunder as of December 31, 2017.
As of December 31, 2017, $146.9 million was drawn on the Senior Facility, and subject to compliance with applicable covenants and borrowing base limitations, the remaining amount available was $53.1 million. The average outstanding debt balances for the year ended December 2017 and the period June 23, 2016 through December 31, 2016 were $85.9 million and $1.4 million, respectively, and the maximum amounts borrowed were $146.9 million and $7.0 million, respectively. For the year ended December 2017 and the period June 23, 2016 through December 31, 2016, $4.2 million and $0.8 million of interest expenses and other debt related expenses were incurred under the Senior Facility.
As of December 31, 2017 and 2016, Senior Loan Partners had total investments at fair value of $219.2 million and $53.2 million respectively, comprised of senior secured first lien loans, delayed draw term loans and revolving loans to a total of twenty borrowers and six borrowers, respectively. As of December 31, 2017 and 2016, none of these loans were on non-accrual status. Proceeds from investment sales, prepayments or exits for the year ended December 31, 2017 and the period from June 23, 2016 through December 31, 2016 were $32.6 million and $0.5 million, respectively. Additionally, as of December 31, 2017 and 2016, Senior Loan Partners had unfunded commitments to four borrowers and one borrower, respectively, totaling $6.3 million and $1.5 million, respectively. The weighted average yields of the portfolio at cost basis as of December 31, 2017 and 2016 were 6.77% and 6.68%, respectively.
F-32
Below is a summary of Senior Loan Partners’ portfolio as of December 31, 2017:
|
Portfolio Company |
|
Industry |
|
Interest Rate(1) |
|
Maturity |
|
Principal Amount or Number of Shares/Units |
|
|
Cost |
|
|
Fair Value(2) |
|
|||
|
Senior Secured Term & Delayed Draw Loans |
|
|
|
|
|
|
|
|
|
|
|
|
|
|
|
|
|
|
|
Accruent, LLC, First Lien Term Loan |
|
High Tech Industries |
|
6.13% (L + 475, 1.00% Floor) |
|
7/28/23 |
|
$ |
5,727,689 |
|
|
$ |
5,700,622 |
|
|
$ |
5,699,050 |
|
|
Accruent, LLC, Delayed Draw Term Loan |
|
High Tech Industries |
|
6.14% (L + 475, 1.00% Floor) |
|
7/28/23 |
|
|
9,237,075 |
|
|
|
9,193,613 |
|
|
|
9,190,890 |
|
|
Alaska Communications Systems Holdings, Inc. First Lien Term Loan A-1 |
|
Telecommunications |
|
6.57% (L + 500, 1.00% Floor) |
|
3/13/22 |
|
|
2,962,500 |
|
|
|
2,962,500 |
|
|
|
2,947,688 |
|
|
Alaska Communications Systems Holdings, Inc. First Lien Term Loan A-2 |
|
Telecommunications |
|
8.57% (L + 700, 1.00% Floor) |
|
3/13/23 |
|
|
4,987,500 |
|
|
|
4,987,500 |
|
|
|
4,962,563 |
|
|
AP Exhaust Acquisition, LLC, First Lien Term Loan |
|
Automotive |
|
6.41% (L + 500, 1.00% Floor) |
|
5/10/24 |
|
|
13,681,250 |
|
|
|
13,431,524 |
|
|
|
13,407,625 |
|
|
AP Gaming I, LLC, First Lien Term Loan |
|
Hotel, Gaming, & Leisure |
|
7.07% (L + 550, 1.00% Floor) |
|
2/15/24 |
|
|
11,446,241 |
|
|
|
11,423,311 |
|
|
|
11,446,241 |
|
|
AP Plastics Group, LLC, First Lien Term Loan B |
|
Chemicals, Plastics, & Rubber |
|
7.63% (L + 625, 1.00% Floor) |
|
8/1/22 |
|
|
10,858,882 |
|
|
|
10,780,584 |
|
|
|
10,858,882 |
|
|
BARBRI, Inc., First Lien Term Loan |
|
Services: Consumer |
|
5.73% (L + 425, 1.00% Floor) |
|
12/1/23 |
|
|
12,500,000 |
|
|
|
12,438,158 |
|
|
|
12,438,158 |
|
|
Dunn Paper, Inc., First Lien Term Loan |
|
Containers, Packaging & Glass |
|
6.32% (L + 475, 1.00% Floor) |
|
8/26/22 |
|
|
8,197,827 |
|
|
|
8,126,673 |
|
|
|
8,197,827 |
|
|
ENC Holding Corp., First Lien Term Loan |
|
Transportation: Cargo |
|
8.05% (L + 650, 1.00% Floor) |
|
2/8/23 |
|
|
12,203,195 |
|
|
|
12,106,102 |
|
|
|
12,203,195 |
|
|
Entertainment Partners, LLC, First Lien Term Loan |
|
Media: Diversified & Production |
|
7.31% (L + 575, 1.00% Floor) |
|
5/8/23 |
|
|
11,442,500 |
|
|
|
11,442,500 |
|
|
|
11,442,500 |
|
|
Edgewood Partners Holdings, LLC, First Lien Term Loan |
|
Insurance |
|
6.19% (L + 475, 1.00% Floor) |
|
9/8/24 |
|
|
10,000,000 |
|
|
|
9,975,343 |
|
|
|
9,975,343 |
|
|
Give and Go Prepared Foods Corp., First Lien Term Loan |
|
Beverage, Food & Tobacco |
|
5.70% (L + 425, 1.00% Floor) |
|
7/29/23 |
|
|
11,970,000 |
|
|
|
11,941,310 |
|
|
|
11,970,000 |
|
F-33
|
Portfolio Company |
|
Industry |
|
Interest Rate(1) |
|
Maturity |
|
Principal Amount or Number of Shares/Units |
|
|
Cost |
|
|
Fair Value(2) |
|
|||
|
Senior Secured Term & Delayed Draw Loans |
|
|
|
|
|
|
|
|
|
|
|
|
|
|
|
|
|
|
|
Golden West Packaging Group LLC, First Lien |
|
Containers, Packaging & Glass |
|
6.82% (L + 525, 1.00% Floor) |
|
6/20/23 |
|
$ |
9,950,000 |
|
|
$ |
9,856,332 |
|
|
$ |
9,950,000 |
|
|
Highline Aftermarket Acquisition, LLC, First Lien Term Loan |
|
Automotive |
|
6.00% (L + 425, 1.00% Floor) |
|
3/17/24 |
|
|
9,546,984 |
|
|
|
9,502,268 |
|
|
|
9,546,984 |
|
|
MHE Intermediate Holdings, LLC, Delayed Draw Term Loan |
|
Services: Business |
|
6.69% (L + 500, 1.00% Floor) |
|
3/10/24 |
|
|
806,205 |
|
|
|
798,847 |
|
|
|
798,143 |
|
|
MHE Intermediate Holdings, LLC, First Lien Term Loan |
|
Services: Business |
|
6.69% (L + 500, 1.00% Floor) |
|
3/10/24 |
|
|
10,323,216 |
|
|
|
10,229,281 |
|
|
|
10,219,984 |
|
|
National Spine and Pain Centers, LLC, First Lien Term Loan |
|
Healthcare & Pharmaceuticals |
|
6.19% (L + 450, 1.00% Floor) |
|
6/2/24 |
|
|
9,950,000 |
|
|
|
9,904,038 |
|
|
|
9,850,500 |
|
|
NSM Sub Holdings Corp., Delayed Draw Term Loan |
|
Healthcare & Pharmaceuticals |
|
6.58% (L + 500, 1.00% Floor) |
|
10/3/22 |
|
|
753,923 |
|
|
|
753,923 |
|
|
|
753,923 |
|
|
NSM Sub Holdings Corp., First Lien Term Loan |
|
Healthcare & Pharmaceuticals |
|
6.69% (L + 500, 1.00% Floor) |
|
10/3/22 |
|
|
7,263,630 |
|
|
|
7,205,543 |
|
|
|
7,263,630 |
|
|
Pasternack Enterprises, Inc., First Lien Term Loan |
|
Wholesale |
|
6.57% (L + 500, 1.00% Floor) |
|
5/27/22 |
|
|
11,353,532 |
|
|
|
11,317,097 |
|
|
|
11,353,532 |
|
|
Pretium Packaging, LLC, First Lien Term Loan |
|
Containers, Packaging & Glass |
|
7.17% (L + 575, 1.00% Floor) |
|
11/14/22 |
|
|
12,406,050 |
|
|
|
12,297,095 |
|
|
|
12,375,035 |
|
|
Q Holding Company, First Lien Term Loan B |
|
Chemicals, Plastics, & Rubber |
|
6.69% (L + 500, 1.00% Floor) |
|
12/18/21 |
|
|
9,872,773 |
|
|
|
9,792,507 |
|
|
|
9,872,773 |
|
|
Service Logic Acquisition, Inc., First Lien Term Loan |
|
Services: Business |
|
5.94% (L + 425, 1.00% Floor) |
|
7/31/23 |
|
|
12,500,000 |
|
|
|
12,441,758 |
|
|
|
12,437,500 |
|
|
Total |
|
|
|
|
|
|
|
|
|
|
|
$ |
218,608,429 |
|
|
$ |
219,161,966 |
|
|
(1) |
100% of the senior secured loans in BCIC Senior Loan Partners’ portfolio bear interest at a floating rate that may be determined by reference to the London Interbank Offered Rate (LIBOR) or other base rate (commonly the Federal Funds Rate or the Prime Rate), at the borrower’s option. In addition, 100% of such senior secured loans have floors of 1.00%. The borrower under a senior secured loan generally has the option to select from interest reset periods of one, two, three or six months and may alter that selection at the end of any reset period. The stated interest rate represents the weighted average interest rate at December 31, 2017 of all contracts within the specified loan facility. |
|
(2) |
Represents fair value in accordance with ASC Topic 820. The determination of such fair value is not included in the Company’s board of director’s valuation process described elsewhere herein. |
F-34
Below is a summary of Senior Loan Partners’ portfolio as of December 31, 2016:
|
Portfolio Company |
|
Industry |
|
Interest Rate(1) |
|
Maturity |
|
Principal Amount or Number of Shares/Units |
|
|
Cost |
|
|
Fair Value(2) |
|
|||
|
Senior Secured Term & Delayed Draw Loans |
|
|
|
|
|
|
|
|
|
|
|
|
|
|
|
|
|
|
|
AP Plastics Group, LLC, First Lien Term Loan B |
|
Chemicals, Plastics, & Rubber |
|
7.25% (L + 625, 1.00% Floor) |
|
8/1/22 |
|
$ |
9,975,000 |
|
|
$ |
9,880,863 |
|
|
$ |
9,875,250 |
|
|
Digital Room LLC, First Lien Term Loan |
|
Media: Advertising, Printing & Publishing |
|
7.00% (L + 600, 1.00% Floor) |
|
11/21/22 |
|
|
10,000,000 |
|
|
|
9,803,472 |
|
|
|
9,803,472 |
|
|
Dunn Paper, Inc., First Lien Term Loan |
|
Containers, Packaging & Glass |
|
5.75% (L + 475, 1.00% Floor) |
|
8/26/22 |
|
|
8,686,957 |
|
|
|
8,600,904 |
|
|
|
8,600,904 |
|
|
Dunn Paper, Inc., First Lien Term Loan |
|
Containers, Packaging & Glass |
|
7.50% (Base + 375, 2.00% Floor) |
|
8/26/22 |
|
|
39,130 |
|
|
|
38,743 |
|
|
|
38,743 |
|
|
NSM Sub Holdings Corp., First Lien Term Loan |
|
Healthcare & Pharmaceuticals |
|
6.00% (L + 500, 1.00% Floor) |
|
10/3/22 |
|
|
7,337,000 |
|
|
|
7,266,707 |
|
|
|
7,337,000 |
|
|
NSM Sub Holdings Corp., Delayed Draw Term Loan |
|
Healthcare & Pharmaceuticals |
|
6.00% (L + 500, 1.00% Floor) |
|
10/3/22 |
|
|
514,280 |
|
|
|
514,280 |
|
|
|
514,280 |
|
|
NSM Sub Holdings Corp., Revolving Loan |
|
Healthcare & Pharmaceuticals |
|
6.00% (L + 500, 1.00% Floor) |
|
10/3/22 |
|
|
126,817 |
|
|
|
126,817 |
|
|
|
126,817 |
|
|
NSM Sub Holdings Corp., Revolving Loan |
|
Healthcare & Pharmaceuticals |
|
7.75% (Base + 400, 2.00% Floor) |
|
10/3/22 |
|
|
55,900 |
|
|
|
55,900 |
|
|
|
55,900 |
|
|
O2 Partners, LLC, First Lien Term Loan |
|
Consumer Goods: Non-Durable |
|
6.00% (L + 500, 1.00% Floor) |
|
10/7/22 |
|
|
9,975,000 |
|
|
|
9,878,571 |
|
|
|
9,878,571 |
|
|
Pasternack Enterprises, Inc., First Lien Term Loan |
|
Wholesale |
|
6.00% (L + 500, 1.00% Floor) |
|
5/27/22 |
|
|
6,965,000 |
|
|
|
6,932,071 |
|
|
|
6,930,175 |
|
|
Pasternack Enterprises, Inc., First Lien Term Loan |
|
Wholesale |
|
7.75% (Base + 400, 2.00% Floor) |
|
5/27/22 |
|
|
782 |
|
|
|
782 |
|
|
|
778 |
|
|
Total |
|
|
|
|
|
|
|
|
|
|
|
$ |
53,099,110 |
|
|
$ |
53,161,890 |
|
|
(1) |
100% of the senior secured loans in BCIC Senior Loan Partners’ portfolio bear interest at a floating rate that may be determined by reference to the London Interbank Offered Rate (LIBOR) or other base rate (commonly the Federal Funds Rate or the Prime Rate), at the borrower’s option. In addition, 100% of such senior secured loans bear LIBOR floors of 1.00% or base rate floor of 2.00%. The borrower under a senior secured loan generally has the option to select from interest reset periods of one, two, three or six months and may alter that selection at the end of any reset period. The stated interest rate represents the weighted average interest rate at December 31, 2016 of all contracts within the specified loan facility. |
|
(2) |
Represents fair value in accordance with ASC Topic 820. The determination of such fair value is not included in the Company’s board of director’s valuation process described elsewhere herein. |
F-35
Below is certain summarized financial information for Senior Loan Partners as of December 31, 2017 and 2016, and for the year ended December 31, 2017 and the period from June 23, 2016 (commencement of operations) through December 31, 2016:
Selected Balance Sheet Information
|
|
|
December 31, 2017 |
|
December 31, 2016 |
|
||
|
Investments, at fair value (cost of $218,608,429 and $53,099,110) |
|
$ |
219,161,966 |
|
$ |
53,161,890 |
|
|
Cash and cash equivalents |
|
|
13,261,538 |
|
|
2,028,808 |
|
|
Other assets |
|
|
2,740,328 |
|
|
2,408,343 |
|
|
Total assets |
|
$ |
235,163,832 |
|
$ |
57,599,041 |
|
|
Debt |
|
|
146,880,000 |
|
|
7,020,000 |
|
|
Contributions received in advance |
|
|
1,427,659 |
|
|
1,195,394 |
|
|
Distribution payable |
|
|
1,211,787 |
|
|
— |
|
|
Interest and credit facility fees payable |
|
|
407,703 |
|
|
84,584 |
|
|
Other accrued expenses and payables |
|
|
404,006 |
|
|
149,033 |
|
|
Total liabilities |
|
$ |
150,331,155 |
|
$ |
8,449,011 |
|
|
Members’ equity |
|
|
84,832,677 |
|
|
49,150,030 |
|
|
Total liabilities and members’ equity |
|
$ |
235,163,832 |
|
$ |
57,599,041 |
|
Selected Statement of Operations Information
|
|
|
For the Year Ended December 31, 2017 |
|
For the Period from June 23, 2016* through December 31, 2016 |
|
||
|
Investment income |
|
$ |
10,775,628 |
|
$ |
913,735 |
|
|
Interest and credit facility fees |
|
|
4,150,437 |
|
|
798,824 |
|
|
Organizational costs |
|
|
— |
|
|
726,610 |
|
|
Other fees and expenses |
|
|
716,834 |
|
|
233,835 |
|
|
Total expenses |
|
$ |
4,867,271 |
|
$ |
1,759,269 |
|
|
Net investment income (loss) |
|
$ |
5,908,357 |
|
$ |
(845,534 |
) |
|
Unrealized appreciation (depreciation) |
|
$ |
490,757 |
|
$ |
62,780 |
|
|
Net increase (decrease) in members' capital |
|
$ |
6,399,114 |
|
$ |
(782,754 |
) |
|
* |
Commencement of operations |
For the year ended December 31, 2017 and for the period from June 23, 2016 through December 31, 2016, the Company’s share of net estimated taxable income from Senior Loan Partners was $5.0 million and $0.1 million, respectively, which amounts are included in dividend income from controlled investments on the Company’s Consolidated Statements of Operations. As of December 31, 2017 and 2016, $1.0 million and zero, respectively, was included in interest, dividends and fees receivable on the Company’s Consolidated Statements of Assets and Liabilities.
F-36
Foreign Currency
The Company may enter into forward foreign currency contracts from time to time to facilitate settlement of purchases and sales of investments denominated in foreign currencies or to help mitigate the impact that an adverse change in foreign exchange rates would have on the value of the Company’s investments denominated in foreign currencies. A forward foreign currency contract is a commitment to purchase or sell a foreign currency at a future date (usually the security transaction settlement date) at a negotiated forward rate. These contracts are marked-to-market by recognizing the difference between the contract exchange rate and the current market rate as unrealized appreciation or depreciation. Realized gains or losses are recognized when contracts are settled. The Company’s forward foreign currency contracts generally have terms of approximately three months. The volume of open contracts at the end of each reporting period is reflective of the typical volume of transactions during each calendar quarter. Risks may arise as a result of the potential inability of the counterparties to meet the terms of their contracts. The Company attempts to limit this risk by dealing with only creditworthy counterparties. There were no open forward foreign currency contracts at December 31, 2017 and 2016.
Warrants and Options
The Company holds warrants and options in certain portfolio companies in an effort to achieve additional investment return. In purchasing warrants and options, the Company bears the risk of an unfavorable change in the value of the underlying equity interest. The aggregate fair value of warrants and options as of December 31, 2017 and December 31, 2016 represents 0% and 0.02%, respectively, of the Company’s net assets.
The Company may enter into other derivative instruments and incur other exposures with other counterparties in the future. The derivative instruments held as of December 31, 2017 and 2016 reflect the volume of derivative activity throughout the periods presented.
7. Debt
In accordance with the 1940 Act, with certain limited exceptions, the Company is only allowed to borrow amounts such that its asset coverage ratio, calculated pursuant to the 1940 Act, is at least 200% after such borrowing. As of December 31, 2017 and 2016, the Company’s asset coverage ratios were 367% and 275%, respectively.
Unsecured Convertible Senior Notes Due 2022
On June 13, 2017, the Company issued $143,750,000 in aggregate principal amount ($125,000,000 of the initial offering and $18,750,000 of the underwriters’ exercise of the overallotment option) of 5.00% Convertible Notes due 2022 (the “2022 Convertible Notes”) under an indenture, dated as of June 13, 2017. Net proceeds to the Company from the offering, including the exercise of the overallotment option, were approximately $139,800,000. The 2022 Convertible Notes will mature on June 15, 2022, unless previously converted, repurchased or redeemed in accordance with their terms. The interest rate on the notes is 5.00% per year, payable semiannually in arrears on June 15 and December 15 of each year, commencing on December 15, 2017. Holders may convert their notes at their option prior to the close of business on the business day immediately preceding December 15, 2021, in integral multiples of $1,000 principal amount, only under certain circumstances. Upon conversion of a note, we will pay or deliver, as the case may be, cash, shares of our common stock or a combination of cash and shares of our common stock, at our election at an initial conversion rate of 118.2173 shares of common stock per $1,000 principal amount of notes, which is equivalent to an initial conversion price of approximately $8.46 per share of the Company’s common stock. On or after December 23, 2021, the Company may redeem the 2022 Convertible Notes for cash, in whole or from time to time in part, at its option in accordance with their terms.
The 2022 Convertible Notes are accounted for in accordance with ASC 470-20, Debt – Debt with Conversion and Other Options. The Company has determined that the embedded conversion options in the 2022 Convertible Notes are not required to be separately accounted for as a derivative under U.S. GAAP. In accounting for the 2022 Convertible Notes, at the time of issuance the Company estimated separate debt and equity components, and an original issue discount equal to the equity component was recorded in additional paid-in-capital in the accompanying Consolidated Statements of Assets and Liabilities.
Senior Secured Revolving Credit Facility
On February 19, 2016, the Company entered into an Amended and Restated Senior Secured Revolving Credit Facility (the “Credit Facility”) which has an initial aggregate principal amount of up to $440,000,000, a stated commitment termination date of February 19, 2020, and a stated maturity date of February 19, 2021. The interest rate applicable to Eurocurrency borrowings thereunder is generally LIBOR plus an applicable margin of either 1.75% or 2.00% based on a pricing grid using the borrowing base as a multiple of the combined debt amount. The interest rate applicable to ABR borrowings thereunder is generally the prime rate in effect plus an applicable margin of either 0.75% or 1.00% based on a pricing grid using the borrowing base as a multiple of the combined debt amount. The Credit Facility’s commitment may increase in size, under certain circumstances, up to a total of
F-37
$750,000,000. From the commitment termination date to the stated maturity date, the Company is required to repay outstanding principal amounts under the Credit Facility on a monthly basis in an amount equal to 1/12th of the outstanding amount at the commitment termination date. On June 5, 2017, the Company entered into a Second Amendment to the Second Amended and Restated Senior Secured Revolving Credit Facility which extended the commitment termination date on the Credit Facility from February 29, 2020 to June 5, 2021 and the maturity date from February 19, 2021 to June 5, 2022, respectively.
Senior Secured Term Loan
On February 19, 2016, the Company entered into an Amended and Restated Senior Secured Term Loan Credit Agreement (the “Term Loan”) which has a principal amount of $15,000,000. The Term Loan has a stated maturity date of March 27, 2019. The interest rate applicable to borrowings thereunder is generally LIBOR plus an applicable margin of 3.25%. On June 22, 2017, the Company repaid the aggregate $15,000,000 principal amount of the Term Loan, plus accrued and unpaid interest, as well as a $192,005 make-whole premium, using proceeds from the Credit Facility.
Unsecured Convertible Senior Notes Due 2018
On February 19, 2013, the Company closed a private offering of $100,000,000 in aggregate principal amount of 5.50% unsecured convertible senior notes due 2018 (the “Convertible Notes”). The initial purchasers of the Convertible Notes fully exercised their overallotment option and purchased an additional $15,000,000 in aggregate principal amount of the Convertible Notes. The closing of the overallotment option took place on March 4, 2013. With the exercise of the overallotment option, a total of $115,000,000 in aggregate principal amount of the Convertible Notes was sold. Net proceeds to the Company from the offering, including the exercise of the overallotment option, were approximately $111,300,000. The Convertible Notes were only offered to qualified institutional buyers as defined in the Securities Act of 1933, as amended (the “Securities Act”) pursuant to Rule 144A under the Securities Act.
The Convertible Notes are unsecured and bear interest at a rate of 5.50% per year, payable semi-annually in arrears. In certain circumstances and during certain periods, the Convertible Notes are convertible into cash, shares of the Company’s common stock or a combination of cash and shares of the Company’s common stock, at the Company’s election, at an initial conversion rate of 86.0585 shares of common stock per $1,000 principal amount of the Convertible Notes, which is equivalent to an initial conversion price of approximately $11.62 per share of the Company’s common stock, subject to defined anti-dilution adjustments. The Company does not have the right to redeem the Convertible Notes prior to maturity.
On September 27, 2017, the Company purchased $59,959,000 in aggregate principal amount of its existing $115,000,000 Convertible Notes pursuant to a cash tender offer at a purchase price equal to $1,015 per $1,000 principal amount of notes purchased, plus accrued and unpaid interest, using borrowings under the Credit Facility and cash on hand. All Convertible Notes purchased in the tender offer were retired and cancelled, and are no longer outstanding under the indenture. The aggregate purchase price of the Convertible Notes was $60,858,385, plus approximately $144,852 of reacquisition costs, for a total reacquisition price of $61,003,237, excluding $384,737 of interest expense. The net carrying amount of the Convertible Notes purchased in the tender offer at the time of purchase was $59,754,389, net of unamortized debt issuance costs and unamortized discount. As such, in accordance with ASC 470-50, Debt – Modifications and Extinguishments, the difference between the reacquisition price and the net carrying amount of the Convertible Notes was recorded in the accompanying Consolidated Statements of Operations as a $1,323,442 loss on extinguishment of debt. On February 15, 2018, the remaining Convertible Notes of $55,041,000 matured and the Company paid the principal and interest in cash.
Senior Secured Notes
On January 18, 2011, the Company closed a private placement issuance of $158,000,000 in aggregate principal amount of five-year, senior secured notes with a fixed interest rate of 6.50% and a maturity date of January 18, 2016 and $17,000,000 in aggregate principal amount of seven-year, senior secured notes with a fixed interest rate of 6.60% and a maturity date of January 18, 2018 (collectively, the “Senior Secured Notes”). The $158,000,000 five-year, senior secured notes matured on January 18, 2016 and were repaid using proceeds from the Company’s Credit Facility. On April 17, 2017, the Company redeemed the $17,000,000 aggregate principal amount of 6.60% senior secured notes due 2018, using proceeds from the Credit Facility. The notes were prepaid at 100% of the principal amount, plus accrued and unpaid interest through the prepayment date, as well as $651,472 make-whole premium.
F-38
The Company’s outstanding debt as of December 31, 2017 and 2016 was as follows:
|
|
|
As of |
|
|
|||||||||||||||||||||
|
|
|
December 31, 2017 |
|
|
December 31, 2016 |
|
|
||||||||||||||||||
|
|
|
Total Aggregate Principal Amount Available(1) |
|
|
Principal Amount Outstanding |
|
|
Carrying Value |
|
|
Total Aggregate Principal Amount Available(1) |
|
|
Principal Amount Outstanding |
|
|
Carrying Value |
|
|
||||||
|
Credit Facility |
|
$ |
440,000,000 |
|
(2) |
$ |
16,000,000 |
|
|
$ |
16,000,000 |
|
|
$ |
440,000,000 |
|
(2) |
$ |
190,000,000 |
|
|
$ |
190,000,000 |
|
|
|
Senior Secured Notes |
|
|
— |
|
|
|
— |
|
|
|
— |
|
|
|
17,000,000 |
|
|
|
17,000,000 |
|
|
|
16,973,708 |
|
(5) |
|
Convertible Notes |
|
|
55,041,000 |
|
|
|
55,041,000 |
|
|
|
54,994,609 |
|
(3) |
|
115,000,000 |
|
|
|
115,000,000 |
|
|
|
113,856,080 |
|
(4) |
|
2022 Convertible Notes |
|
|
143,750,000 |
|
|
|
143,750,000 |
|
|
|
135,666,663 |
|
(7) |
|
— |
|
|
|
— |
|
|
|
— |
|
|
|
Term Loan |
|
|
— |
|
|
|
— |
|
|
|
— |
|
|
|
15,000,000 |
|
|
|
15,000,000 |
|
|
|
14,838,118 |
|
(6) |
|
|
|
$ |
638,791,000 |
|
|
$ |
214,791,000 |
|
|
$ |
206,661,272 |
|
|
$ |
587,000,000 |
|
|
$ |
337,000,000 |
|
|
$ |
335,667,906 |
|
|
|
(1) |
Subject to borrowing base and leverage restrictions. |
|
(2) |
Provides for a feature that allows the Company, under certain circumstances, up to a total of $750,000,000. |
|
(3) |
Represents the aggregate principal amount outstanding of the Convertible Notes less an unaccreted discount initially recorded upon issuance and unamortized debt issuance costs of zero and $46,391, respectively, as of December 31, 2017. |
|
(4) |
Represents the aggregate principal amount outstanding of the Convertible Notes less an unaccreted discount initially recorded upon issuance and unamortized debt issuance costs of $277,828 and $866,092, respectively, as of December 31, 2016. |
|
(5) |
Represents the aggregate principal amount outstanding of the Senior Secured Notes less unamortized debt issuance costs of $26,292 at December 31, 2016. No longer outstanding at December 31, 2017. |
|
(6) |
Represents the aggregate principal amount outstanding of the Term Loan less unamortized debt issuance costs of $161,882 at December 31, 2016. No longer outstanding at December 31, 2017. |
|
(7) |
Represents the aggregate principal amount outstanding of the 2022 Convertible Notes less an unaccreted discount initially recorded upon issuance and unamortized debt issuance costs of $3,920,287 and $4,163,050, respectively, as of December 31, 2017. |
At December 31, 2017, the Company had $16,000,000 drawn on the Credit Facility as compared to $190,000,000 at December 31, 2016. Subject to compliance with applicable covenants and borrowing base limitations, the remaining undrawn amount under the Credit Facility was $424,000,000 at December 31, 2017 and $250,000,000 at December 31, 2016.
The Company’s average outstanding debt balance during the years ended December 31, 2017, 2016 and 2015 was $297,575,896, $361,314,732 and $399,882,825, respectively. The maximum amounts borrowed during the years ended December 31, 2017, 2016 and 2015 were $412,247,365, $452,539,653 and $478,285,022, respectively.
Amortization of $2,055,354, $1,640,654 and $2,081,949 related to debt issuance costs are included in interest expense within the Consolidated Statements of Operations for the years ended December 31, 2017, 2016 and 2015.
The weighted average annual interest cost, including the amortization of debt issuance cost, for the years ended December 31, 2017, 2016 and 2015 was 5.70%, 4.37% and 5.78%, respectively, exclusive of commitment fees of $1,258,385, $863,479, and $1,161,193, respectively. With respect to any unused portion of the commitments under the Credit Facility, the Company incurs an annual commitment fee of 0.375%.
Under the Credit Facility, the Company is required to comply with various affirmative and restrictive covenants, reporting requirements and other customary requirements for similar debt facilities, including, without limitation, covenants related to: (a) limitations on the incurrence of additional indebtedness and liens, (b) limitations on certain investments, (c) limitations on distributions and certain other restricted payments, (d) certain restrictions on subsidiaries and fundamental changes thereto, (e) maintaining a certain minimum shareholders’ equity, (f) maintaining an asset coverage ratio of not less than 2.0:1.0, (g) limitations on certain transactions with affiliates, (h) limitations on pledging certain unencumbered assets, and (i) limitations on the creation or existence of agreements that prohibit liens on certain properties of the Company and certain of its subsidiaries. These covenants are subject to important limitations and exceptions that are described in the governing documents. Further, amounts available to borrow under the Credit Facility (and the incurrence of certain other permitted debt) are also subject to compliance with a borrowing base that applies different advance rates to different types of assets in the Company’s portfolio that are pledged as collateral. The Credit Facility is secured by a lien on substantially all of the assets of the Company and its subsidiaries.
F-39
The Convertible Notes and 2022 Convertible Notes contain certain covenants, including covenants requiring the Company to reserve shares of common stock for the purpose of satisfying all obligations to issue the underlying securities upon conversion of the securities and to furnish to holders of the securities upon request, any information required to be delivered pursuant to Rule 144A(d)(4) under the Securities Act.
At December 31, 2017, the Company was in compliance with all covenants required under the Credit Facility, Convertible Notes and 2022 Convertible Notes.
8. Capital stock
During April 2016, the Board of Directors approved an increase to the remaining amount of shares authorized to be repurchased to a total of 2,500,000 shares, and an extension to the plan until the earlier of June 30, 2017 or such time that all of the authorized shares have been repurchased. During May 2017, the Board of Directors approved an increase to the remaining amount of shares authorized to be repurchased, effective July 1, 2017, to a total of 2,500,000 shares, and an extension to the plan until the earlier of June 30, 2018 or such time that all of the authorized shares have been repurchased. During the years ended December 31, 2017 and 2016, the Company purchased a total of 224,889 and 1,904,064 shares, respectively, of its common stock on the open market for $1,431,681 and $16,093,205, respectively, including brokerage commissions. Since inception of the repurchase plan through December 31, 2017, the Company has purchased 4,776,854 shares of its common stock on the open market for $37,734,502, including brokerage commissions. At December 31, 2017, the total number of remaining shares authorized for repurchase was 2,275,111. The Company currently holds the shares it repurchased in treasury.
There were no share offerings during the years ended December 31, 2017, 2016 and 2015.
For the years ended December 31, 2017, 2016 and 2015, distributions to common stockholders were $52,535,464, $61,007,062 and $62,606,337, respectively. For the years ended December 31, 2017, 2016 and 2015, distributions reinvested pursuant to the Company’s dividend reinvestment plan were $3,506,620, $3,959,945 and $3,700,331, respectively.
9. Guarantees, commitments and contingencies
In the normal course of business, the Company may enter into guarantees on behalf of portfolio companies. Under these arrangements, the Company would be required to make payments to third parties if the portfolio companies were to default on their related payment obligations. There were no such guarantees outstanding at December 31, 2017 and 2016. In addition, from time to time, the Company may provide for a commitment to a portfolio company for investment in an existing or new security. At December 31, 2017 and 2016, the Company was obligated to existing portfolio companies for unfunded commitments of $42.1 million and $43.5 million, respectively. Of the $42.1 million total unfunded commitments at December 31, 2017, $12.7 million was on our aggregate $85.0 million equity commitment to BCIC Senior Loan Partners, LLC (See Note 5). The aggregate fair value of unfunded commitments at December 31, 2017 and 2016 was $42.1 million and $42.6 million, respectively. We maintain sufficient cash on hand and available borrowings to fund such unfunded commitments should the need arise.
In the normal course of business, the Company enters into contractual agreements that provide general indemnifications against losses, costs, claims and liabilities arising from the performance of individual obligations under such agreements. The Company has had no prior claims or payments pursuant to such agreements. The Company’s individual maximum exposure under these arrangements is unknown, as this would involve future claims that may be made against the Company that have not yet occurred. However, based on management’s experience, the Company expects the risk of loss to be remote.
From time to time, the Company and the Advisor may be a party to certain legal proceedings incidental to the normal course of its business, including the enforcement of its rights under contracts with its portfolio companies. Further, third parties may try to seek to impose liability on the Company in connection with the activities of its portfolio companies. While the Company cannot predict the outcome of these legal proceedings with certainty, it does not expect that these proceedings will have a material effect on its consolidated financial statements.
As previously disclosed, the Company was named as a defendant, together with the Previous Advisor, and certain other defendants, in two wrongful death and personal injury actions that were filed by the families of the three decedents and certain injured persons (the “Plaintiffs”) on June 22, 2012 and August 23, 2012, in the Circuit Court of Hancock County in West Virginia (the “Litigation”). The cases, which were consolidated, involved three deaths and personal injuries to other employees that occurred on December 9, 2010 at the facilities of one of the Company’s portfolio companies. The Company and the Previous Advisor settled the Litigation effective November 28, 2016 for $17,500,000 in exchange for the release and dismissal of all of Plaintiffs’ claims against the Company and Previous Advisor.
F-40
10. Fair value of financial instruments
Fair Value Measurements and Disclosure
ASC 820-10 defines fair value, establishes a framework for measuring fair value and requires disclosures about fair value measurements. ASC 820-10 defines fair value as the price that the Company would receive upon selling an investment or pay to transfer a liability in an orderly transaction to a market participant in the principal or most advantageous market for the investment. ASC 820-10 emphasizes that valuation techniques maximize the use of observable market inputs and minimize the use of unobservable inputs. Inputs refer broadly to the assumptions that market participants would use in pricing an asset or liability, including assumptions about risk. Inputs may be observable or unobservable. Observable inputs are inputs that reflect the assumptions market participants would use in pricing an asset or liability developed based on market data obtained from sources independent of the Company. Unobservable inputs are inputs that reflect the Company’s assumptions about the assumptions market participants would use in pricing an asset or liability developed based on the best information available in the circumstances.
Level 1 – Valuations based on unadjusted quoted prices in active markets for identical assets or liabilities that the Company has the ability to access.
Level 2 – Valuations based on unadjusted quoted prices in markets that are not active or for which all significant inputs are observable, either directly or indirectly.
Level 3 – Valuations based on inputs that are unobservable and significant to the overall fair value measurement. The inputs into the determination of fair value may require significant management judgment or estimation.
Transfers between levels, if any, represent the value as of the beginning of the period of any investment where a change in the pricing level occurred from the beginning to the end of the period.
The Company’s valuation policy and fair value disclosures are consistent with ASC 820-10. The Company evaluates the source of inputs, including any markets in which its investments are trading, in determining fair value and categorizes each investment within the fair value hierarchy pursuant to ASC 820-10.
Under the 1940 Act, the Company is required to separately identify non-controlled investments where it owns 5% or more of a portfolio company’s outstanding voting securities as investments in “affiliated” companies. In addition, under the 1940 Act, the Company is required to separately identify investments where it owns more than 25% of a portfolio company’s outstanding voting securities as investments in “controlled” companies. Detailed information with respect to the Company’s non-controlled non-affiliated, non-controlled affiliated and controlled investments is contained in the accompanying consolidated schedules of investments and consolidated financial statements. The information in the tables below is presented on an aggregate portfolio basis, without segregating the non-controlled non-affiliated, non-controlled affiliated and controlled investment categories.
The carrying values of the Company’s financial instruments approximate fair value. The carrying values of receivables, other assets, accounts payable and accrued expenses approximate fair value due to their short maturities. The fair value of the Company’s Credit Facility, Senior Secured Notes, Convertible Notes, 2022 Convertible Notes and Term Loan is derived by taking the average of the high and low quotes as obtained from a broker. The fair value of the Credit Facility, Senior Secured Notes, Convertible Notes, 2022 Convertible Notes and Term Loan would be classified as Level 2 with respect to the fair value hierarchy.
The carrying and fair values of the Company’s outstanding debt as of December 31, 2017 and 2016 were as follows:
|
|
|
December 31, 2017 |
|
|
December 31, 2016 |
|
||||||||||
|
|
|
Carrying Value |
|
|
Fair Value |
|
|
Carrying Value |
|
|
Fair Value |
|
||||
|
Credit Facility |
|
$ |
16,000,000 |
|
|
$ |
15,120,000 |
|
|
$ |
190,000,000 |
|
|
$ |
179,550,000 |
|
|
Senior Secured Notes |
|
|
— |
|
|
|
— |
|
|
|
16,973,708 |
|
|
|
17,752,420 |
|
|
Convertible Notes |
|
|
54,994,609 |
|
|
|
55,178,607 |
|
|
|
113,856,080 |
|
|
|
118,163,837 |
|
|
2022 Convertible Notes |
|
|
135,666,663 |
|
|
|
144,898,540 |
|
|
|
— |
|
|
|
— |
|
|
Term Loan |
|
|
— |
|
|
|
— |
|
|
|
14,838,118 |
|
|
|
15,093,750 |
|
|
Total |
|
$ |
206,661,272 |
|
|
$ |
215,197,147 |
|
|
$ |
335,667,906 |
|
|
$ |
330,560,007 |
|
F-41
The following tables summarize the fair values of the Company’s investments and cash and cash equivalents based on the inputs used at December 31, 2017 and 2016 in determining such fair values:
|
|
|
|
|
|
|
Fair Value Inputs at December 31, 2017 |
|
|||||||||
|
|
|
Fair Value at December 31, 2017 |
|
|
Price Quotations (Level 1) |
|
|
Significant Other Observable Inputs (Level 2) |
|
|
Significant Unobservable Inputs (Level 3) |
|
||||
|
Senior secured notes |
|
$ |
23,250,661 |
|
|
$ |
— |
|
|
$ |
— |
|
|
$ |
23,250,661 |
|
|
Unsecured debt |
|
|
95,266,709 |
|
|
|
— |
|
|
|
— |
|
|
|
95,266,709 |
|
|
Subordinated debt |
|
|
29,600,000 |
|
|
|
— |
|
|
|
— |
|
|
|
29,600,000 |
|
|
Senior secured loans |
|
|
404,219,616 |
|
|
|
— |
|
|
|
— |
|
|
|
404,219,616 |
|
|
Preferred stock |
|
|
59,622,456 |
|
|
|
— |
|
|
|
— |
|
|
|
59,622,456 |
|
|
Common stock |
|
|
16,206,829 |
|
|
|
— |
|
|
|
— |
|
|
|
16,206,829 |
|
|
Limited partnership/limited liability company interests |
|
|
129,774,536 |
|
|
|
— |
|
|
|
— |
|
|
|
129,774,536 |
|
|
Equity warrants/options |
|
|
— |
|
|
|
— |
|
|
|
— |
|
|
|
— |
|
|
Total investments |
|
|
757,940,807 |
|
|
|
— |
|
|
|
— |
|
|
|
757,940,807 |
|
|
Cash and cash equivalents |
|
|
29,014,645 |
|
|
|
29,014,645 |
|
|
|
— |
|
|
|
— |
|
|
Total |
|
$ |
786,955,452 |
|
|
$ |
29,014,645 |
|
|
$ |
— |
|
|
$ |
757,940,807 |
|
|
|
|
|
|
|
|
Fair Value Inputs at December 31, 2016 |
|
|||||||||
|
|
|
Fair Value at December 31, 2016 |
|
|
Price Quotations (Level 1) |
|
|
Significant Other Observable Inputs (Level 2) |
|
|
Significant Unobservable Inputs (Level 3) |
|
||||
|
Senior secured notes |
|
$ |
63,609,625 |
|
|
$ |
— |
|
|
$ |
— |
|
|
$ |
63,609,625 |
|
|
Unsecured debt |
|
|
127,317,932 |
|
|
|
— |
|
|
|
— |
|
|
|
127,317,932 |
|
|
Subordinated debt |
|
|
28,800,000 |
|
|
|
— |
|
|
|
— |
|
|
|
28,800,000 |
|
|
Senior secured loans |
|
|
548,515,315 |
|
|
|
— |
|
|
|
— |
|
|
|
548,515,315 |
|
|
Preferred stock |
|
|
57,873,127 |
|
|
|
— |
|
|
|
— |
|
|
|
57,873,127 |
|
|
Common stock |
|
|
37,632,386 |
|
|
|
— |
|
|
|
— |
|
|
|
37,632,386 |
|
|
Limited partnership/limited liability company interests |
|
|
67,257,747 |
|
|
|
— |
|
|
|
— |
|
|
|
67,257,747 |
|
|
Equity warrants/options |
|
|
117,358 |
|
|
|
— |
|
|
|
— |
|
|
|
117,358 |
|
|
Total investments |
|
|
931,123,490 |
|
|
|
— |
|
|
|
— |
|
|
|
931,123,490 |
|
|
Cash and cash equivalents |
|
|
10,707,834 |
|
|
|
10,707,834 |
|
|
|
— |
|
|
|
— |
|
|
Total |
|
$ |
941,831,324 |
|
|
$ |
10,707,834 |
|
|
$ |
— |
|
|
$ |
931,123,490 |
|
The valuation techniques generally used at December 31, 2017 and 2016 in determining the fair values of the Company’s investments for which significant unobservable inputs were used were the market approach, income approach or both using third party valuation firms or broker quotes for identical or similar assets. The total fair market value using the market or income approach or using third party valuation firms was $757,940,807 and $931,123,490 as of December 31, 2017 and 2016, respectively. Any remaining balance was determined using broker quotes for identical or similar assets.
The following is a reconciliation for the year ended December 31, 2017 of investments for which Level 3 inputs were used in determining fair value:
|
|
|
Fair Value at December 31, 2016 |
|
|
Net Amortization of Premium/ Discount |
|
|
Net Realized Gain (Loss) |
|
|
Net Change in Unrealized Appreciation or Depreciation |
|
|
Purchases |
|
|
Sales or Repayments |
|
|
Net Transfers in and/or out of Level 3 |
|
|
Fair Value at December 31, 2017 |
|
||||||||
|
Senior secured notes |
|
$ |
63,609,625 |
|
|
$ |
857,923 |
|
|
$ |
(16,663,471 |
) |
|
$ |
12,784,433 |
|
|
$ |
7,343,457 |
|
|
$ |
(44,681,306 |
) |
|
$ |
— |
|
|
$ |
23,250,661 |
|
|
Unsecured debt |
|
|
127,317,932 |
|
|
|
— |
|
|
|
— |
|
|
|
(30,675,064 |
) |
|
|
25,096,061 |
|
|
|
(26,472,220 |
) |
|
|
— |
|
|
|
95,266,709 |
|
|
Subordinated debt |
|
|
28,800,000 |
|
|
|
— |
|
|
|
— |
|
|
|
— |
|
|
|
800,000 |
|
|
|
— |
|
|
|
— |
|
|
|
29,600,000 |
|
|
Senior secured loans |
|
|
548,515,315 |
|
|
|
2,677,689 |
|
|
|
(34,071,370 |
) |
|
|
9,186,999 |
|
|
|
160,177,391 |
|
|
|
(282,266,408 |
) |
|
|
— |
|
|
|
404,219,616 |
|
|
Preferred stock |
|
|
57,873,127 |
|
|
|
— |
|
|
|
2,449,619 |
|
|
|
4,126,261 |
|
|
|
2,997,385 |
|
|
|
(7,823,936 |
) |
|
|
— |
|
|
|
59,622,456 |
|
|
Common stock |
|
|
37,632,386 |
|
|
|
— |
|
|
|
3,369,690 |
|
|
|
(5,234,465 |
) |
|
|
486,793 |
|
|
|
(20,047,575 |
) |
|
|
— |
|
|
|
16,206,829 |
|
|
Limited partnership/LLC Interest |
|
|
67,257,747 |
|
|
|
— |
|
|
|
(7,463,967 |
) |
|
|
27,852,674 |
|
|
|
46,981,069 |
|
|
|
(4,852,987 |
) |
|
|
— |
|
|
|
129,774,536 |
|
|
Equity warrants/options |
|
|
117,358 |
|
|
|
— |
|
|
|
(994,155 |
) |
|
|
1,068,780 |
|
|
|
— |
|
|
|
(191,983 |
) |
|
|
— |
|
|
|
— |
|
|
Total investments |
|
$ |
931,123,490 |
|
|
$ |
3,535,612 |
|
|
$ |
(53,373,654 |
) |
|
$ |
19,109,618 |
|
|
$ |
243,882,156 |
|
|
$ |
(386,336,415 |
) |
|
$ |
— |
|
|
$ |
757,940,807 |
|
F-42
The following is a reconciliation for the year ended December 31, 2016 of investments for which Level 3 inputs were used in determining fair value:
|
|
|
Fair Value at December 31, 2015 |
|
|
Net Amortization of Premium/ Discount |
|
|
Net Realized Gain (Loss) |
|
|
Net Change in Unrealized Appreciation or Depreciation |
|
|
Purchases |
|
|
Sales or Repayments |
|
|
Net Transfers in and/or out of Level 3 |
|
|
Fair Value at December 31, 2016 |
|
||||||||
|
Senior secured notes |
|
$ |
69,875,250 |
|
|
$ |
729,429 |
|
|
$ |
(20,845,550 |
) |
|
$ |
13,228,496 |
|
|
$ |
36,750,000 |
|
|
$ |
(36,128,000 |
) |
|
$ |
— |
|
|
$ |
63,609,625 |
|
|
Unsecured debt |
|
|
126,476,842 |
|
|
|
(1 |
) |
|
|
— |
|
|
|
(11,902,137 |
) |
|
|
44,743,967 |
|
|
|
(32,000,739 |
) |
|
|
— |
|
|
|
127,317,932 |
|
|
Subordinated debt |
|
|
42,608,119 |
|
|
|
— |
|
|
|
(3,971,479 |
) |
|
|
3,863,360 |
|
|
|
11,300,000 |
|
|
|
(25,000,000 |
) |
|
|
— |
|
|
|
28,800,000 |
|
|
Senior secured loans |
|
|
756,394,823 |
|
|
|
3,833,973 |
|
|
|
(57,938,649 |
) |
|
|
(17,375,151 |
) |
|
|
144,984,390 |
|
|
|
(281,384,071 |
) |
|
|
— |
|
|
|
548,515,315 |
|
|
Preferred stock |
|
|
43,533,360 |
|
|
|
(1 |
) |
|
|
(1,238,227 |
) |
|
|
(4,709,434 |
) |
|
|
20,528,456 |
|
|
|
(241,027 |
) |
|
|
— |
|
|
|
57,873,127 |
|
|
Common stock |
|
|
46,629,914 |
|
|
|
(1 |
) |
|
|
(525,641 |
) |
|
|
(15,894,664 |
) |
|
|
7,943,097 |
|
|
|
(520,319 |
) |
|
|
— |
|
|
|
37,632,386 |
|
|
Limited partnership/LLC Interest |
|
|
28,553,438 |
|
|
|
— |
|
|
|
6,942 |
|
|
|
(19,243,651 |
) |
|
|
59,602,940 |
|
|
|
(1,661,922 |
) |
|
|
— |
|
|
|
67,257,747 |
|
|
Equity warrants/options |
|
|
2,924,818 |
|
|
|
— |
|
|
|
(57,619 |
) |
|
|
(2,295,955 |
) |
|
|
— |
|
|
|
(453,886 |
) |
|
|
— |
|
|
|
117,358 |
|
|
Total investments |
|
$ |
1,116,996,564 |
|
|
$ |
4,563,399 |
|
|
$ |
(84,570,223 |
) |
|
$ |
(54,329,136 |
) |
|
$ |
325,852,850 |
|
|
$ |
(377,389,964 |
) |
|
$ |
— |
|
|
$ |
931,123,490 |
|
There were no transfers between levels during years ended December 31, 2017 and 2016. All realized and unrealized gains and losses are included in earnings (changes in net assets) and are reported as separate line items within the Company’s Consolidated Statements of Operations.
Net change in unrealized appreciation (depreciation) for the years ended December 31, 2017, 2016, and 2015 on investments still held by the Company at the respective period ends, for which Level 3 inputs were used in determining fair value were $(31,404,456), $(93,261,061) and $(30,909,758), respectively.
The significant unobservable inputs used in the market approach of fair value measurement of the Company’s investments are the market multiples of earnings before income tax, depreciation and amortization (“EBITDA”) of the comparable guideline public companies. The independent valuation firms select a population of public companies for each investment with similar operations and attributes of the subject company. Using these guideline public companies’ data, a range of multiples of enterprise value to EBITDA is calculated. The independent valuation firms select percentages from the range of multiples for purposes of determining the subject company’s estimated enterprise value based on said multiple and generally the latest twelve months EBITDA of the subject company (or other meaningful measure). Significant increases or decreases in the multiple will result in an increase or decrease in enterprise value, resulting in an increase or decrease in the fair value estimate of the investment.
F-43
The significant unobservable input used in the income approach of fair value measurement of the Company’s investments is the discount rate or market yield used to discount the estimated future cash flows expected to be received from the underlying investment, which include both future principal and interest payments. Significant increases or decreases in the discount rate or market yield would result in a decrease or increase in the fair value measurement. Included in the consideration and selection of discount rates or market yields are the following factors: risk of default, rating of the investment and comparable company investments, and call provisions.
The ranges of significant unobservable inputs used in the fair value measurement of the Company’s Level 3 investments as of December 31, 2017 were as follows:
|
|
|
Low |
|
High |
|
Weighted Average |
|
EBITDA Multiples: |
|
|
|
|
|
|
|
Senior secured notes |
|
8.00x |
|
9.00x |
|
8.50x |
|
Unsecured debt |
|
6.56x |
|
7.65x |
|
7.10x |
|
Subordinated debt |
|
n/a |
|
n/a |
|
n/a |
|
Senior secured loans |
|
5.70x |
|
6.61x |
|
6.15x |
|
Preferred stock |
|
7.12x |
|
7.87x |
|
7.50x |
|
Common stock |
|
7.00x |
|
7.50x |
|
7.25x |
|
Limited partnerships/LLC interest |
|
6.11x |
|
6.86x |
|
6.48x |
|
Equity warrants/options |
|
n/a |
|
n/a |
|
n/a |
|
Market Yields: |
|
|
|
|
|
|
|
Senior secured notes |
|
11.00% |
|
12.00% |
|
11.00% |
|
Unsecured debt |
|
n/a |
|
n/a |
|
n/a |
|
Subordinated debt |
|
n/a |
|
n/a |
|
n/a |
|
Senior secured loans |
|
10.73% |
|
11.40% |
|
11.17% |
|
Preferred stock |
|
n/a |
|
n/a |
|
n/a |
|
Common stock |
|
n/a |
|
n/a |
|
n/a |
|
Limited partnerships/LLC interest |
|
n/a |
|
n/a |
|
n/a |
|
Equity warrants/options |
|
n/a |
|
n/a |
|
n/a |
|
Book Value: |
|
|
|
|
|
|
|
Senior secured notes |
|
n/a |
|
n/a |
|
n/a |
|
Unsecured debt |
|
1.04x |
|
1.14x |
|
1.09x |
|
Subordinated debt |
|
0.95x |
|
1.05x |
|
1.00x |
|
Senior secured loans |
|
n/a |
|
n/a |
|
n/a |
|
Preferred stock |
|
1.02x |
|
1.16x |
|
1.09x |
|
Common stock |
|
1.04x |
|
1.14x |
|
1.09x |
|
Limited partnerships/LLC interest |
|
0.95x |
|
1.05x |
|
1.00x |
|
Equity warrants/options |
|
n/a |
|
n/a |
|
n/a |
|
Net Asset Value: |
|
|
|
|
|
|
|
Senior secured notes |
|
n/a |
|
n/a |
|
n/a |
|
Unsecured debt |
|
n/a |
|
n/a |
|
n/a |
|
Subordinated debt |
|
n/a |
|
n/a |
|
n/a |
|
Senior secured loans |
|
n/a |
|
n/a |
|
n/a |
|
Preferred stock |
|
n/a |
|
n/a |
|
n/a |
|
Common stock |
|
n/a |
|
n/a |
|
n/a |
|
Limited partnerships/LLC interest |
|
0.90x |
|
1.10x |
|
1.00x |
|
Equity warrants/options |
|
n/a |
|
n/a |
|
n/a |
F-44
The ranges of significant unobservable inputs used in the fair value measurement of the Company’s Level 3 investments as of December 31, 2016 were as follows:
|
|
|
Low |
|
|
High |
|
|
Weighted Average |
|
|||
|
EBITDA Multiples: |
|
|
|
|
|
|
|
|
|
|
|
|
|
Senior secured notes |
|
4.00x |
|
|
5.00x |
|
|
4.38x |
|
|||
|
Unsecured debt |
|
6.75x |
|
|
7.75x |
|
|
7.25x |
|
|||
|
Subordinated debt |
|
n/a |
|
|
n/a |
|
|
n/a |
|
|||
|
Senior secured loans |
|
6.16x |
|
|
7.41x |
|
|
6.82x |
|
|||
|
Preferred stock |
|
7.00x |
|
|
7.65x |
|
|
7.32x |
|
|||
|
Common stock |
|
9.17x |
|
|
10.04x |
|
|
9.88x |
|
|||
|
Limited partnerships/LLC interests |
|
8.04x |
|
|
8.91x |
|
|
8.27x |
|
|||
|
Equity warrants/options |
|
10.00x |
|
|
11.00x |
|
|
10.88x |
|
|||
|
Market Yields: |
|
|
|
|
|
|
|
|
|
|
|
|
|
Senior secured notes |
|
11.20% |
|
|
11.88% |
|
|
11.65% |
|
|||
|
Unsecured debt |
|
24.25% |
|
|
24.75% |
|
|
24.50% |
|
|||
|
Subordinated debt |
|
n/a |
|
|
n/a |
|
|
n/a |
|
|||
|
Senior secured loans |
|
10.41% |
|
|
11.24% |
|
|
10.81% |
|
|||
|
Preferred stock |
|
n/a |
|
|
n/a |
|
|
n/a |
|
|||
|
Common stock |
|
n/a |
|
|
n/a |
|
|
n/a |
|
|||
|
Limited partnerships/LLC interests |
|
n/a |
|
|
n/a |
|
|
n/a |
|
|||
|
Equity warrants/options |
|
n/a |
|
|
n/a |
|
|
n/a |
|
|||
|
Book Value: |
|
|
|
|
|
|
|
|
|
|
|
|
|
Senior secured notes |
|
n/a |
|
|
n/a |
|
|
n/a |
|
|||
|
Unsecured debt |
|
1.03x |
|
|
1.13x |
|
|
1.08x |
|
|||
|
Subordinated debt |
|
0.95x |
|
|
1.05x |
|
|
1.00x |
|
|||
|
Senior secured loans |
|
n/a |
|
|
n/a |
|
|
n/a |
|
|||
|
Preferred stock |
|
1.06x |
|
|
1.17x |
|
|
1.12x |
|
|||
|
Common stock |
|
1.03x |
|
|
1.13x |
|
|
1.08x |
|
|||
|
Limited partnerships/LLC interests |
|
0.95x |
|
|
1.05x |
|
|
1.00x |
|
|||
|
Equity warrants/options |
|
n/a |
|
|
n/a |
|
|
n/a |
|
|||
|
Net Asset Value: |
|
|
|
|
|
|
|
|
|
|
|
|
|
Senior secured notes |
|
n/a |
|
|
n/a |
|
|
n/a |
|
|||
|
Unsecured debt |
|
n/a |
|
|
n/a |
|
|
n/a |
|
|||
|
Subordinated debt |
|
n/a |
|
|
n/a |
|
|
n/a |
|
|||
|
Senior secured loans |
|
n/a |
|
|
n/a |
|
|
n/a |
|
|||
|
Preferred stock |
|
n/a |
|
|
n/a |
|
|
n/a |
|
|||
|
Common stock |
|
n/a |
|
|
n/a |
|
|
n/a |
|
|||
|
Limited partnerships/LLC interests |
|
0.90x |
|
|
1.10x |
|
|
1.00x |
|
|||
|
Equity warrants/options |
|
n/a |
|
|
n/a |
|
|
n/a |
|
|||
F-45
11. Consolidated financial highlights
The following per share data and ratios have been derived from information provided in the consolidated financial statements. The following is a schedule of consolidated financial highlights for a common share outstanding for each of the five years in the period ended December 31, 2017.
|
|
|
Year ended December 31, 2017 |
|
|
Year ended December 31, 2016 |
|
|
Year ended December 31, 2015 |
|
|
Year ended December 31, 2014 |
|
|
Year ended December 31, 2013 |
|
|||||
|
Per Share Data: |
|
|
|
|
|
|
|
|
|
|
|
|
|
|
|
|
|
|
|
|
|
Net asset value, beginning of year |
|
$ |
8.21 |
|
|
$ |
10.17 |
|
|
$ |
10.49 |
|
|
$ |
9.54 |
|
|
$ |
9.31 |
|
|
Net investment income |
|
|
0.75 |
|
|
|
0.74 |
|
|
|
1.01 |
|
|
|
0.68 |
|
|
|
0.64 |
|
|
Net realized and unrealized gain (loss) |
|
|
(0.44 |
) |
|
|
(1.90 |
) |
|
|
(0.49 |
) |
|
|
1.16 |
|
|
|
0.61 |
|
|
Realized losses on extinguishment of debt |
|
|
(0.02 |
) |
|
|
— |
|
|
|
— |
|
|
|
— |
|
|
|
— |
|
|
Total from investment operations |
|
|
0.29 |
|
|
|
(1.16 |
) |
|
|
0.52 |
|
|
|
1.84 |
|
|
|
1.25 |
|
|
Distributions to stockholders from: |
|
|
|
|
|
|
|
|
|
|
|
|
|
|
|
|
|
|
|
|
|
Net investment income |
|
|
(0.72 |
) |
|
|
(0.84 |
) |
|
|
(0.80 |
) |
|
|
(0.63 |
) |
|
|
(0.60 |
) |
|
Distributions in excess of net investment income |
|
|
— |
|
|
|
— |
|
|
|
(0.04 |
) |
|
|
— |
|
|
|
— |
|
|
Tax return of capital |
|
|
— |
|
|
|
— |
|
|
|
— |
|
|
|
(0.26 |
) |
|
|
(0.44 |
) |
|
Total distributions |
|
|
(0.72 |
) |
|
|
(0.84 |
) |
|
|
(0.84 |
) |
|
|
(0.89 |
) |
|
|
(1.04 |
) |
|
Equity component of convertible notes and warrant |
|
|
— |
|
|
|
— |
|
|
|
— |
|
|
|
— |
|
|
|
0.01 |
|
|
Issuance of convertible notes |
|
|
0.06 |
|
|
|
— |
|
|
|
— |
|
|
|
— |
|
|
|
— |
|
|
Issuance/reinvestment of stock at prices (below) above net asset value |
|
|
(0.01 |
) |
|
|
(0.01 |
) |
|
|
(0.01 |
) |
|
|
(0.01 |
) |
|
|
0.01 |
|
|
Purchases of treasury stock at prices below net asset value |
|
|
— |
|
|
|
0.05 |
|
|
|
0.01 |
|
|
|
0.01 |
|
|
|
— |
|
|
Net increase (decrease) in net assets |
|
|
(0.38 |
) |
|
|
(1.96 |
) |
|
|
(0.32 |
) |
|
|
0.95 |
|
|
|
0.23 |
|
|
Net asset value, end of year |
|
$ |
7.83 |
|
|
$ |
8.21 |
|
|
$ |
10.17 |
|
|
$ |
10.49 |
|
|
$ |
9.54 |
|
|
Market price, end of year |
|
$ |
6.23 |
|
|
$ |
6.96 |
|
|
$ |
9.40 |
|
|
$ |
8.20 |
|
|
$ |
9.33 |
|
|
Total return(1) |
|
|
(0.61 |
)% |
|
|
(18.10 |
)% |
|
|
26.52 |
% |
|
|
(2.18 |
)% |
|
|
3.56 |
% |
|
Ratios / Supplemental Data: |
|
|
|
|
|
|
|
|
|
|
|
|
|
|
|
|
|
|
|
|
|
Ratio of operating expenses to average net assets (2)(4) |
|
|
4.04 |
% |
|
|
6.97 |
% |
|
|
3.81 |
% |
|
|
8.18 |
% |
|
|
8.78 |
% |
|
Ratio of interest and debt related expenses to average net assets |
|
|
3.06 |
% |
|
|
2.48 |
% |
|
|
3.09 |
% |
|
|
3.38 |
% |
|
|
3.29 |
% |
|
Ratio of total expenses to average net assets (3)(4) |
|
|
7.10 |
% |
|
|
9.45 |
% |
|
|
6.90 |
% |
|
|
11.56 |
% |
|
|
12.07 |
% |
|
Ratio of net investment income to average net assets |
|
|
9.27 |
% |
|
|
8.06 |
% |
|
|
9.57 |
% |
|
|
6.93 |
% |
|
|
6.85 |
% |
|
Net assets, end of year |
|
$ |
571,099,932 |
|
|
$ |
596,320,369 |
|
|
$ |
753,752,615 |
|
|
$ |
781,959,168 |
|
|
$ |
709,704,341 |
|
|
Average debt outstanding |
|
$ |
297,575,896 |
|
|
$ |
361,314,732 |
|
|
$ |
399,882,825 |
|
|
$ |
409,956,985 |
|
|
$ |
359,486,764 |
|
|
Weighted average shares outstanding — basic |
|
|
72,983,354 |
|
|
|
72,757,978 |
|
|
|
74,576,277 |
|
|
|
74,539,159 |
|
|
|
74,174,560 |
|
|
Average debt per share (5) |
|
$ |
4.08 |
|
|
$ |
4.97 |
|
|
$ |
5.36 |
|
|
$ |
5.50 |
|
|
$ |
4.85 |
|
|
Portfolio turnover |
|
|
28 |
% |
|
|
32 |
% |
|
|
26 |
% |
|
|
47 |
% |
|
|
41 |
% |
|
(1) |
Total return is based on the change in market price per share during the respective periods. Total return calculations take into account distributions, if any, reinvested in accordance with the Company's dividend reinvestment plan and do not reflect brokerage commissions. Total return is not annualized. |
|
(2) |
Ratio excluding capital gains Incentive Fees for years ended December 31, 2017, 2016, 2015, 2014, 2013 is 4.04%, 6.97%, 4.22%, 5.77% and 5.87%, respectively. |
|
(3) |
Ratio excluding capital gains Incentive Fees for years ended December 31, 2017, 2016, 2015, 2014, 2013 is 7.10%, 9.45%, 7.31%, 9.15% and 9.16%, respectively. |
|
(4) |
Ratio including incentive fee based on income waiver approved by the Company's Board of Directors for the year ended December 31, 2017 (See Note 3). |
|
(5) |
Average debt per share is calculated as average debt outstanding divided by the weighted average shares outstanding during the applicable period. |
F-46
Distributions from net investment income and net realized capital gains are determined in accordance with U.S. federal income tax regulations, which may differ from those amounts determined in accordance with GAAP. These book/tax differences are either temporary or permanent in nature. To the extent these differences are permanent, they are charged or credited to paid-in-capital, distributions in excess of net investment income or accumulated net realized gain (loss), as appropriate, in the period that the differences arise. The below temporary and permanent differences at December 31, 2017 and 2016 were primarily attributable to differences in the tax characterization of expenses, income recognized from partnership investments, non-deductible expenses and income recognized from investments in wholly owned subsidiaries, which were reclassified for tax purposes.
Taxable income generally differs from the change in net assets resulting from operations for financial reporting purposes due to temporary and permanent differences in the recognition of income and expenses, and generally excludes net unrealized appreciation or depreciation, as unrealized gains or losses are not included in taxable income until they are realized.
Book and tax basis differences relating to stockholder distributions and other permanent book and tax differences are reclassified among the Company’s capital accounts. In addition, the character of income and gains to be distributed is determined in accordance with income tax regulations that may differ from GAAP.
|
|
|
December 31, 2017 |
|
|
December 31, 2016 |
|
||
|
Paid-in capital in excess of par |
|
$ |
(27,056,595 |
) |
|
$ |
3,197 |
|
|
(Increase) decrease in distributions in excess of net investment income |
|
$ |
(8,509,458 |
) |
|
$ |
(978,047 |
) |
|
(Increase) decrease in accumulated net realized loss |
|
$ |
35,566,053 |
|
|
$ |
974,850 |
|
The following reconciles net increase (decrease) in net assets resulting from operations to taxable income for the years ended December 31, 2017 and 2016:
|
|
|
December 31, 2017 |
|
|
December 31, 2016 |
|
||
|
Net increase (decrease) in net assets resulting from operations |
|
$ |
20,902,457 |
|
|
$ |
(84,291,924 |
) |
|
Net unrealized (appreciation) depreciation not taxable |
|
|
(19,573,031 |
) |
|
|
53,748,320 |
|
|
Current year net capital (gains) losses |
|
|
16,720,707 |
|
|
|
91,040,948 |
|
|
Losses not currently taxable |
|
|
37,041,559 |
|
|
|
— |
|
|
Losses recognized on prior year exchange |
|
|
— |
|
|
|
(6,377,901 |
) |
|
Other book/tax differences |
|
|
(1,523,300 |
) |
|
|
(1,057,121 |
) |
|
Amortization of organizational costs |
|
|
(3,804 |
) |
|
|
(3,804 |
) |
|
Taxable income before deductions for distributions |
|
$ |
53,564,588 |
|
|
$ |
53,058,518 |
|
At December 31, 2017 and 2016, the components of accumulated net losses on a tax basis and a reconciliation to accumulated net losses on a book basis were as follows:
|
|
|
Year ended December 31, 2017 |
|
|
Year ended December 31, 2016 |
|
||
|
Net unrealized appreciation (depreciation) |
|
$ |
(72,688,483 |
) |
|
$ |
(92,261,515 |
) |
|
Differences between book and tax loss on investments |
|
|
(35,930,103 |
) |
|
|
(28,497,613 |
) |
|
Capital loss carryforward |
|
|
(140,699,214 |
) |
|
|
(123,978,507 |
) |
|
Expenses not currently deductible |
|
|
(13,311 |
) |
|
|
(17,115 |
) |
|
Total accumulated losses—net, book basis |
|
$ |
(249,331,111 |
) |
|
$ |
(244,754,750 |
) |
At December 31, 2017 and 2016, gross unrealized appreciation and gross unrealized depreciation based on cost for federal income tax purposes were as follows:
|
|
|
December 31, 2017 |
|
|
December 31, 2016 |
|
||
|
Tax cost |
|
$ |
857,326,594 |
|
|
$ |
1,042,134,296 |
|
|
Gross unrealized appreciation |
|
|
35,917,480 |
|
|
|
11,874,482 |
|
|
Gross unrealized depreciation |
|
|
(135,303,267 |
) |
|
|
(122,885,288 |
) |
|
Total investments, at fair market value |
|
$ |
757,940,807 |
|
|
$ |
931,123,490 |
|
F-47
As of December 31, 2017, the Company had capital loss carryforwards available to offset future realized capital gains through the indicated expiration dates as follows:
|
No expiration date |
|
$ |
107,761,625 |
|
|
|
2018 |
|
|
32,937,589 |
|
|
|
Total |
|
$ |
140,699,214 |
|
|
The tax character of distributions declared for the years ended December 31, 2017 and 2016 were as follows:
|
|
|
Year ended December 31, 2017 |
|
|
Year ended December 31, 2016 |
|
||
|
Ordinary income |
|
$ |
52,535,464 |
|
|
$ |
61,007,062 |
|
|
Tax return of capital |
|
|
— |
|
|
|
— |
|
|
Total distributions |
|
$ |
52,535,464 |
|
|
$ |
61,007,062 |
|
Important Tax Information (Unaudited)
During the fiscal year ended December 31, 2017, the following information is provided with respect to the ordinary income distributions paid by the Company.
|
Qualified Dividend Income for Individuals(1) |
|
|
10.83 |
% |
|
Dividends Qualifying for the Dividend Received Deduction for Corporations(1) |
|
|
9.40 |
% |
|
Interest Related Dividends for Non-U.S. Residents(2) |
|
|
48.68 |
% |
|
(1) |
The Company hereby designates the percentage indicated above or the maximum amount allowable by law. |
|
(2) |
Represents the portion of the taxable ordinary income dividends eligible for exemption from US withholding tax for nonresident aliens and foreign corporations. |
ASC 740-10 clarifies the accounting for income taxes by prescribing the minimum recognition threshold an uncertain tax position is required to meet before tax benefits associated with such uncertain tax position are recognized in the consolidated financial statements. Based on its analysis of its tax position, the Company has concluded that it does not have any uncertain tax positions that met the recognition or measurement criteria of ASC 740-10.
The Company files U.S. federal and various state and local tax returns. No income tax returns are currently under examination. The statute of limitations on the Company’s U.S. federal income tax returns remains open for each of the four years ended December 31, 2017. The statute of limitations on the Company’s state and local tax returns may remain open for an additional year depending upon the jurisdiction.
F-48
13. Selected quarterly financial data (unaudited)
|
Quarter Ended |
|
Total Investment Income |
|
|
Net Investment Income |
|
|
Net Realized and Unrealized Gain (Loss) |
|
|
Net Increase (Decrease) in Net Assets Resulting from Operations |
|
|
Basic Earnings (Loss) per Common Share |
|
|
Diluted Earnings (Loss) per Common Share |
|
|
Net Asset Value per Common Share at End of Quarter |
|
|||||||
|
|
|
(Dollars in thousands, except per share data) |
|
|||||||||||||||||||||||||
|
December 31, 2017 |
|
$ |
24,398 |
|
|
$ |
14,518 |
|
|
$ |
(11,169 |
) |
|
$ |
3,349 |
|
|
$ |
0.05 |
|
|
$ |
0.05 |
|
|
$ |
7.83 |
|
|
September 30, 2017 |
|
|
22,761 |
|
|
|
12,140 |
|
|
|
(25,891 |
) |
|
|
(13,751 |
) |
|
|
(0.19 |
) |
|
|
(0.19 |
) |
|
|
7.96 |
|
|
June 30, 2017 |
|
|
25,243 |
|
|
|
13,869 |
|
|
|
3,106 |
|
|
|
16,975 |
|
|
|
0.23 |
|
|
|
0.22 |
|
|
|
8.33 |
|
|
March 31, 2017 |
|
|
24,927 |
|
|
|
14,565 |
|
|
|
(235 |
) |
|
|
14,330 |
|
|
|
0.20 |
|
|
|
0.20 |
|
|
|
8.22 |
|
|
December 31, 2016 |
|
|
28,006 |
|
|
|
17,082 |
|
|
|
(14,572 |
) |
|
|
2,510 |
|
|
|
0.03 |
|
|
|
0.03 |
|
|
|
8.21 |
|
|
September 30, 2016 |
|
|
26,138 |
|
|
|
(2,131 |
) |
|
|
(36,942 |
) |
|
|
(39,073 |
) |
|
|
(0.54 |
) |
|
|
(0.54 |
) |
|
|
8.38 |
|
|
June 30, 2016 |
|
|
33,429 |
|
|
|
21,607 |
|
|
|
(31,161 |
) |
|
|
(9,554 |
) |
|
|
(0.13 |
) |
|
|
(0.13 |
) |
|
|
9.13 |
|
|
March 31, 2016 |
|
|
29,837 |
|
|
|
17,478 |
|
|
|
(55,653 |
) |
|
|
(38,175 |
) |
|
|
(0.52 |
) |
|
|
(0.52 |
) |
|
|
9.46 |
|
|
December 31, 2015 |
|
|
31,784 |
|
|
|
18,534 |
|
|
|
(39,031 |
) |
|
|
(20,497 |
) |
|
|
(0.28 |
) |
|
|
(0.28 |
) |
|
|
10.17 |
|
|
September 30, 2015 |
|
|
33,940 |
|
|
|
23,795 |
|
|
|
(2,067 |
) |
|
|
21,728 |
|
|
|
0.29 |
|
|
|
0.28 |
|
|
|
10.66 |
|
|
June 30, 2015 |
|
|
32,768 |
|
|
|
18,238 |
|
|
|
(3,500 |
) |
|
|
14,738 |
|
|
|
0.20 |
|
|
|
0.19 |
|
|
|
10.56 |
|
|
March 31, 2015 |
|
|
30,919 |
|
|
|
14,624 |
|
|
|
8,032 |
|
|
|
22,656 |
|
|
|
0.30 |
|
|
|
0.29 |
|
|
|
10.58 |
|
Certain prior period information has been reclassified to conform to the current period presentation.
14. Subsequent events
The Company has reviewed subsequent events occurring through the date that these consolidated financial statements were available to be issued, and determined that no subsequent events occurred requiring accrual or disclosure, except as disclosed below and elsewhere in these Notes to Consolidated Financial Statements.
On March 6, 2018, the Company’s Board of Directors declared a distribution of $0.18 per share, payable on April 2, 2018 to stockholders of record at the close of business on March 19, 2018.
On February 15, 2018, the remaining Convertible Notes of $55,041,000 matured and the Company paid the principal and interest in cash (See Note 7).
On January 16, 2018, the Company announced that its Advisor assigned the Management Agreement, dated March 6, 2015, to a wholly owned subsidiary, BlackRock Capital Investment Advisors, LLC ("BCIA") pursuant to Rule 2a-6 of the 1940 Act. Accordingly, BCIA is now the Company’s investment adviser. The Company and BCIA amended and restated the Management Agreement in its entirety to acknowledge such assignment and to delete certain portions of the Management Agreement that are no longer operative in accordance with their terms. There will be no change to the fees, nor to the personnel overseeing the provision of investment management services to the Company.
F-49
Pursuant to the requirements of Section 13 or 15(d) of the Securities Exchange Act of 1934, the registrant has duly caused this report to be signed on its behalf by the undersigned, thereunto duly authorized.
|
|
BLACKROCK CAPITAL INVESTMENT CORPORATION |
||
|
|
|
|
|
|
|
By: |
|
/s/ MICHAEL J. ZUGAY |
|
|
|
|
Michael J. Zugay |
|
|
|
|
Chief Executive Officer |
|
|
|
|
|
|
|
|
|
March 7, 2018 |
Each of the officers and directors of BlackRock Capital Investment Corporation whose signature appears below, in so signing, also makes, constitutes and appoints each of Michael J. Zugay and Michael Pungello, or either of them, each acting alone, his true and lawful attorneys-in-fact, with full power and substitution, for him in any and all capacities, to execute and cause to be filed with the Securities and Exchange Commission any and all amendments to the Annual Report on Form 10-K, with exhibits thereto and other documents connected therewith and to perform any acts necessary to be done in order to file such documents, and hereby ratifies and confirms all that said attorneys-in-fact or their substitute or substitutes may do or cause to be done by virtue hereof.
Pursuant to the requirements of Section 13 or 15(d) of the Securities Exchange Act of 1934, the Registrant has duly caused this report to be signed by the following persons on behalf of the Registrant and in the capacities and on the dates indicated.
|
SIGNATURE |
|
TITLE |
|
DATE |
|
|
|
|
|
|
|
/s/ MICHAEL J. ZUGAY
Michael J. Zugay |
|
Chief Executive Officer (principal executive officer) |
|
March 7, 2018 |
|
|
|
|
|
|
|
/s/ MICHAEL PUNGELLO
Michael Pungello |
|
Interim Chief Financial Officer and Interim Treasurer |
|
March 7, 2018 |
|
|
|
|
|
|
|
/s/ JOHN R. BARON
John R. Baron |
|
Director |
|
March 7, 2018 |
|
|
|
|
|
|
|
/s/ JERROLD B. HARRIS
Jerrold B. Harris |
|
Director |
|
March 7, 2018 |
|
|
|
|
|
|
|
/s/ JAMES E. KEENAN
James E. Keenan |
|
Chairman of the Board |
|
March 7, 2018 |
|
|
|
|
|
|
|
/s/ MARK S. LIES
Mark S. Lies |
|
Director |
|
March 7, 2018 |
|
|
|
|
|
|
|
/s/ WILLIAM E. MAYER
William E. Mayer |
|
Director |
|
March 7, 2018 |
|
|
|
|
|
|
|
/s/ MERIDEE A. MOORE
Meridee A. Moore |
|
Director |
|
March 7, 2018 |
|
|
|
|
|
|
|
/s/ MAUREEN K. USIFER
Maureen K. Usifer |
|
Director |
|
March 7, 2018 |
S-1