Attached files
| file | filename |
|---|---|
| 8-K - 8-K - APPENDIX 4E - REVA Medical, Inc. | rva-8k_20180228.htm |

Preliminary Final Report on
Appendix 4E
Year Ended 31 December 2017
Sydney, Australia and San Diego, California (Wednesday, 28 February 2017, AEDT) – REVA Medical, Inc. (ASX: RVA) (“REVA” or the “Company”), a leader in bioresorbable polymer technologies for vascular medical applications, is pleased to release its preliminary financial report for the year ended 31 December 2017 (the “Results”) in the accompanying Appendix 4E. These Results are in the process of being audited by the Company’s independent registered accounting firm, Grant Thornton LLP.
Summary of the Results
This has been a transformative year for REVA. In the first half of 2017, REVA made the transition to a commercial enterprise with the launch of its Fantom bioresorbable scaffold (“BRS”) in Europe subsequent to receipt of CE Mark on April 3, 2017. We shipped our first product to customers and commenced implants in July 2017. Physicians that have used Fantom have been very positive about its performance and the features that differentiate it from first generation BRS, such as thinner strut profile, improved flexibility and full x-ray visibility.
Clinical Data - The Company released new data at the Transcatheter Cardiovascular Therapeutics (TCT) conference in October 2017. Clinical outcomes were reported for an interim data set of 125 patients followed through 24 months. Findings included a low rate of Major Adverse Cardiac Events (“MACE”) of 5.6%. REVA previously reported a MACE rate of 4.2% through 12 months for the complete 240-patient data set. The 24-month outcomes demonstrate a sustained safety profile for Fantom. The data were presented in an oral presentation by Dr. James B. Hermiller Jr., from the Heart Center of Indiana in Indianapolis, Indiana and in a moderated poster session by trial investigator, Dr. Ricardo A. Costa, from Institute Dante Pazzanese of Cardiology in Sao Paulo, Brazil.
Product Development – The Company announced plans to expand its product portfolio with Fantom Encore at the TCT conference in October 2017 and announced CE Mark of the 2.5 millimeter diameter size and the first implant of Fantom Encore earlier this week. The first implant procedure was conducted by Dr. Matthias Lutz at the Universitätsklinikum Schleswig-Holstein in Kiel, Germany. The 2.5 millimeter diameter size of Fantom Encore has a market-leading 95 micron strut profile. REVA expects to launch the entire Fantom Encore product line in late 2018.
Commercial Sales Force – We hired a VP of Sales in August 2017 and welcomed our first two sales managers to REVA in November 2017. We added three additional sales managers in early 2018. Our small commercial team is focused on differentiating Fantom’s features, benefits and safety track record from other CE Mark approved BRS devices to ensure successful adoption of Fantom and Fantom Encore in select accounts in Germany, Switzerland, and Austria, which are the initial countries identified as part of REVA’s targeted launch.
|
HEAD OFFICE: 5751 Copley Drive, San Diego, CA 92111 • +1 (858) 966-3000 • +1 (858) 966-3099 (FAX) • www.revamedical.com |
|
AUSTRALIAN OFFICE: Suite 4, Level 14, 6 O’Connell Street, Sydney NSW 2000 • +61 2 9237 2800 |
|
ARBN 146 505 777 • REVA Medical, Inc., is a foreign company incorporated in Delaware, USA, whose stockholders have limited liability |
|
REVA Medical, Inc. – ASX Announcement |
Page 2 |
Our focused sales efforts and marketing strategies are expected to increase volume and reorder rates throughout 2018.
For the year ended 31 December 2017 (the “Period”), the Company reports the following results:
|
|
• |
Loss from operations of US$21.3 million, reflecting our progress with the clinical trials of our Fantom bioresorbable scaffold, our European CE Marking that was obtained on April 3, 2017 and commercialization of the product line. |
|
|
• |
Gain from non-operating items of US$28.4 million, primarily arising from non-cash accounting entries for the convertible notes issued in November 2014, and convertible notes and warrants issued in May and June 2017. In accordance with US generally accepted accounting principles, we elected to account for the convertible notes and warrants at fair value, which requires adjustment to their fair value at each reporting period. Whenever the securities increase in value, a loss on change in fair value is recorded and whenever they decrease in value, a gain on change in fair value is recorded. The Company recorded a non-cash gain of US$35.7 million on the change in fair value of the convertible notes and warrants during 2017. Offsetting the gain, a total of US$6.7 million in non-cash interest expense on the convertible notes was recorded during 2017. |
As of 31 December 2017 (the “Period End”), the Company reports:
|
|
• |
Cash, cash equivalents and investment securities of US$20.0 million. |
|
|
• |
Total stockholders’ deficit of US$92.8 million. |
Please refer to the attached Appendix 4E, including the unaudited consolidated financial statements, for additional explanation and details.
Important Information Concerning the Financial Results for the Period
REVA’s unaudited consolidated financial statement and Appendix 4E are prepared in accordance with United States Generally Accepted Accounting Principles. The Results in the attached Appendix 4E are for REVA and its non-operating, wholly owned subsidiary, REVA Germany GmbH. All amounts in the accompanying Appendix 4E are in United States dollars (“US$”) unless otherwise indicated.
|
Briefing Call |
|
Ms. Reggie Groves, the Company’s Chief Executive Officer, will host a briefing call to discuss the Company's business outlook and audited financial results through 31 December 2017 on Thursday, 8 March 2018 at 8:30 a.m. AEDT (which is 1:30 p.m. US PDT on Wednesday, March 7, 2018). Access information will be available approximately one week ahead of the call. |
_________________________________________________________________________________________
HEAD OFFICE: 5751 Copley Drive, San Diego, CA 92111 • +1 (858) 966-3000 • +1 (858) 966-3099 (FAX) • www.revamedical.com
AUSTRALIAN OFFICE: Suite 4, Level 14, 6 O’Connell Street, Sydney NSW 2000 • +61 2 9237 2800
ARBN 146 505 777 • REVA Medical, Inc., is a foreign company incorporated in Delaware, USA, whose stockholders have limited liability
|
REVA Medical, Inc. – ASX Announcement |
Page 3 |
About Fantom and Fantom Encore
Fantom and Fantom Encore are sirolimus-eluting bioresorbable scaffolds developed as an alternative to metallic stents for the treatment of coronary artery disease. Scaffolds provide restoration of blood flow, support the artery through the healing process, and then disappear (or “resorb”) from the body over a period of time. This resorption is intended to allow the return of natural movement and function of the artery. Fantom and Fantom Encore are the only bioresorbable scaffolds made from Tyrocore, REVA’s proprietary tyrosine-derived polymer designed specifically for vascular scaffold applications. Tyrocore is inherently radiopaque, making Fantom and Fantom Encore the first and only bioresorbable scaffolds that are fully visible under x-ray. Fantom and Fantom Encore are designed with thin struts while maintaining strength and with distinct ease-of-use features such as expansion with one continuous inflation.
|
About REVA Medical |
|
REVA Medical is a medical device company focused on the development and commercialization of bioresorbable polymer technologies for vascular applications. The Company’s lead products are the Fantom and Fantom Encore bioresorbable vascular scaffolds for the treatment of coronary artery disease. REVA is located in San Diego, California, USA and employs over 50 people in the U.S. and Europe. |
This announcement contains or may contain forward-looking statements that are based on management's beliefs, assumptions, and expectations and on information currently available to management. All statements that are not statements of historical fact, including those statements that address future operating plans or performance and events or developments that may occur in the future, are forward-looking statements, such as those statements regarding the projections and timing surrounding commercial operations and sales, clinical trials, pipeline product development, and future financings. No undue reliance should be placed on forward-looking statements. Although management believes forward-looking statements are reasonable as and when made, forward-looking statements are subject to a number of risks and uncertainties that may cause actual results to vary materially from those expressed in forward-looking statements, including the risks and uncertainties that are described in the "Risk Factors" section of our Annual Report on Form 10-K filed with the US Securities and Exchange Commission (the “SEC”) on February 28, 2017, and as updated in our periodic reports thereafter. Any forward-looking statements in this announcement speak only as of the date when made. REVA does not assume any obligation to publicly update or revise any forward-looking statements, whether as a result of new information, future events, or otherwise.
|
|
United States |
Australia |
Australia |
|
|
Investor & Media Enquiries: |
Investor Enquiries: |
Media Enquiries: |
|
|
REVA Medical, Inc. |
Inteq Limited |
Buchan Consulting |
|
|
Brandi Roberts |
Kim Jacobs |
Rebecca Wilson |
|
|
Chief Financial Officer |
+61 438 217 279 |
+61 3 9866 4722 |
|
|
+1 858-966-3003 |
Andrew Cohen |
|
|
|
Cheryl Liberatore |
+61 408 333 452 |
|
|
|
Director, Communications |
|
|
|
|
+1 858-966-3045 |
|
|
|
|
ir@revamedical.com |
|
|
_________________________________________________________________________________________
HEAD OFFICE: 5751 Copley Drive, San Diego, CA 92111 • +1 (858) 966-3000 • +1 (858) 966-3099 (FAX) • www.revamedical.com
AUSTRALIAN OFFICE: Suite 4, Level 14, 6 O’Connell Street, Sydney NSW 2000 • +61 2 9237 2800
ARBN 146 505 777 • REVA Medical, Inc., is a foreign company incorporated in Delaware, USA, whose stockholders have limited liability

Preliminary Final Report
Appendix 4E
Year Ended 31 December 2017
_________________________________________________________________________________________
HEAD OFFICE: 5751 Copley Drive, San Diego, CA 92111 • +1 (858) 966-3000 • +1 (858) 966-3099 (FAX) • www.revamedical.com
AUSTRALIAN OFFICE: Suite 4, Level 14, 6 O’Connell Street, Sydney NSW 2000 • +61 2 9237 2800
ARBN 146 505 777 • REVA Medical, Inc., is a foreign company incorporated in Delaware, USA, whose stockholders have limited liability
Appendix 4E
Preliminary Final Report
Appendix 4E
Preliminary Final Report
|
1. |
Company Information |
|
Name of entity REVA Medical, Inc. ABN |
Year ended (“current year”)ARBN 146 505 77731 December 2017 |
The previous corresponding period refers to the comparative amounts for the year ended 31 December 2016.
All values contained in this report are stated in U.S. dollars and have been rounded to the nearest thousand, unless otherwise stated.
|
2. |
Results for Announcement to the Market |
|
Dollars in thousands (USD): |
|
|
|
Current Year |
|
Previous Year |
|
|
|
|
|
|
|
12 Months Ended 31 December 2017 |
|
12 Months Ended 31 December 2016 |
|
$ Change |
|
% Change |
|
2.1 |
Revenue from ordinary activities |
$ 45 |
|
$ — |
|
$ 45 |
|
100% |
|
|
Loss from ordinary operating activities |
$ (21,329) |
|
$ (26,780) |
|
$ 5,451 |
|
20% |
|
|
Non-operating income (expenses) |
$ 28,463 |
|
$ (27,318) |
|
$55,781 |
|
204% |
|
2.2 |
Gain (loss) from ordinary operating activities |
$ 7,134 |
|
$ (54,098) |
|
$61,232 |
|
113% |
|
2.3 |
Net income (loss) attributable to members |
$ 7,134 |
|
$ (54,098) |
|
$61,232 |
|
113% |
|
2.4 |
The Company does not propose to pay dividends to common stockholders at this time. |
|
2.5 |
Not applicable; we are not proposing to pay dividends at this time. |
|
2.6 |
During 2017, our operating activities focused on finalizing processes for commercial operations which commenced in the third quarter of 2017. We continued follow-up assessments of patients in our FANTOM I and II clinical trials. We started two additional clinical trials of Fantom evaluating use of our bioresorbable scaffold in broader patient populations; one in more complex patients with long lesions and/or multiple vessel disease and one in a STEMI indication. Further, we completed a financing transaction with issuances of convertible notes and warrants in May 2017 and June 2017, receiving net cash proceeds of approximately $32.5 million. |
We recognized $45,000 of revenue for the year ended December 31, 2017 compared to no revenue for the year ended December 31, 2016 as we launched our first commercial product in July 2017. Total billings for shipped product were $203,000; the amount by which total billings for shipped product exceeded recognized revenue was recorded as deferred revenue.
|
01/01/2012 |
Appendix 4E Page 1 |
Appendix 4E
Preliminary Final Report
Research and development, or R&D, expenses decreased $5.4 million, or 30%, to $12.8 million for the year ended December 31, 2017, compared to $18.2 million for the year ended December 31, 2016. The decrease in R&D expenses in 2017 compared to 2016 was primarily due to a $1.7 million decrease in R&D materials, $1.3 million decrease in stock-based compensation, $1.2 million decrease in clinical costs, $0.6 million decrease in personnel costs and a $0.5 million decrease in testing and validation costs.
Selling, general and administrative, or SG&A, expenses were $8.6 million for the year ended December 31, 2017, consistent with SG&A expenses for the year ended December 31, 2016. Although SG&A expenses in 2017 and 2016 were consistent, stock-based compensation decreased by $1.4 in 2017, which was offset by increases of $0.5 million in personnel expenses, $0.4 million in sales and marketing expenses, $0.4 million in audit and tax expenses and $0.1 million in consulting expenses.
Other non-operating expenses for the year ended December 31, 2017 were primarily comprised of interest expense, the loss on the issuance of convertible notes and warrants in 2017 and the gain on the change in fair value of convertible notes and warrant liability.
Interest expense increased $4.6 million, or 226%, to $6.7 million for the year ended December 31, 2017, compared to $2.1 million for the year ended December 31, 2016. The $4.6 million increase in interest expense was related to the issuance of convertible notes in 2017 and continuing compounding interest on the convertible notes issued in 2014.
Gain on change in fair value of convertible notes and warrant liability was $35.7 million for the year ended December 31, 2017 compared to a loss of $25.2 million for the year ended December 31, 2016. The gain in 2017 was related to a $30.7 million gain on the change in fair values of the convertible notes issued in 2014, a $2.5 million gain on the change in fair values of the convertible notes issued in 2017 and a $2.5 million gain on the change in fair values on the warrants issued in connection with the convertible notes issued in 2017. The loss in 2016 was related to a $16.3 million loss on the change in fair values of the convertible notes issued in 2014 and a $9.0 million loss on the change in fair values on the warrants issued in connection with such convertible notes between January 1, 2016 and the exercise date of February 12, 2016.
Please see our consolidated financial statements, with accompanying notes, which are attached hereto, for additional detail.
|
3. |
Statement of Operations and Comprehensive Loss |
Please see our consolidated financial statements, with accompanying notes, which are attached hereto.
|
4. |
Statement of Financial Position |
Please see our consolidated financial statements, with accompanying notes, which are attached hereto.
|
5. |
Statement of Cash Flows |
Please see our consolidated financial statements, with accompanying notes, which are attached hereto.
|
6. |
Statement of Retained Earnings |
Please see our consolidated financial statements, with accompanying notes, which are attached hereto.
|
7. |
Dividends per Security |
|
01/01/2012 |
Appendix 4E Page 2 |
Appendix 4E
Preliminary Final Report
We did not declare or pay any dividends on common stock (or CDIs) and we do not propose to pay any such dividends at this time.
|
8. |
Dividend or Distribution Reinvestment Plans |
Not applicable; the Company has no dividend or distribution reinvestment plans.
|
9. |
Net Tangible Assets per Security |
|
Dollars in thousands (USD): |
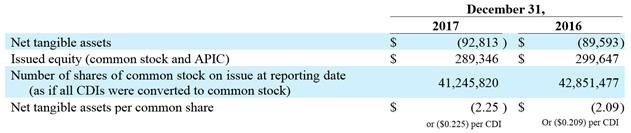
December 31, 2017 2016 Net tangible assets$(92,813)$(89,593)Issued equity (common stock and APIC)$289,346 $299,647 Number of shares of common stock on issue at reporting date (as if all CDIs were converted to common stock) 41,245,820 42,851,477 Net tangible assets per common share$(2.25) $(2.09) or ($0.225) per CDIOr ($0.209) per CDI
|
10. |
Acquisitions and Divestments |
Not applicable; no entities were acquired or disposed during 2017.
|
11. |
Joint Ventures |
Not applicable; we are not and have not been party to any joint ventures.
|
12. |
Other Information |
Please see our consolidated financial statements, with accompanying notes, attached hereto.
|
13. |
Foreign Entity Accounting Standards |
Our financial statements are presented in accordance with accounting principles generally accepted in the United States and are denominated in U.S. dollars.
|
14. |
Commentary on Results |
Please see Section 2 above and our unaudited consolidated financial statements, with accompanying notes, which are attached hereto.
We operated in one segment only during 2017.
|
01/01/2012 |
Appendix 4E Page 3 |
Appendix 4E
Preliminary Final Report
|
15. |
Status of Audit or Review |
The consolidated financial statements, including accompanying notes, attached hereto are in the process of being audited. Such audit will be finalized and the audited consolidated financial statements as of and for the 12 months ended 31 December 2017 will be filed with the ASX and the U.S. Securities and Exchange Commission on or before 16 March 2018.
|
16. |
Audit Report (Unaudited Financials) |
An audit of our financial statements is currently in process. We anticipate that our audited financial statements will be unqualified and include an emphasis of a matter paragraph similar to the following:
The accompanying consolidated financial statements have been prepared assuming that the Company will continue as a going concern. As discussed in Note 2 to the financial statements, the Company has incurred significant operating losses since inception, is still very early in the commercialization stage, and will require additional financing to fund future operations. Management’s plans in regard to those matters are also described in Note 2.
|
17. |
Audit Report (Audited Financials) |
Our consolidated financial statements for the year ended 31 December 2017, including accompanying notes, are in the process of being audited by Grant Thornton LLP.
|
01/01/2012 |
Appendix 4E Page 4 |

Preliminary Final Report
Unaudited Financial Statements
Year Ended 31 December 2017
_________________________________________________________________________________________
HEAD OFFICE: 5751 Copley Drive, San Diego, CA 92111 • +1 (858) 966-3000 • +1 (858) 966-3099 (FAX) • www.revamedical.com
AUSTRALIAN OFFICE: Suite 4, Level 14, 6 O’Connell Street, Sydney NSW 2000 • +61 2 9237 2800
ARBN 146 505 777 • REVA Medical, Inc., is a foreign company incorporated in Delaware, USA, whose stockholders have limited liability
Consolidated Balance Sheets (unaudited)
(in thousands, except share and per share amounts)
|
|
December 31, |
|
|||||
|
|
2017 |
|
|
2016 |
|
||
|
Assets |
|
|
|
|
|
|
|
|
Current Assets: |
|
|
|
|
|
|
|
|
Cash and cash equivalents |
$ |
18,544 |
|
|
$ |
6,674 |
|
|
Investment securities |
|
1,470 |
|
|
|
— |
|
|
Accounts receivable |
|
63 |
|
|
|
— |
|
|
Inventory |
|
627 |
|
|
|
— |
|
|
Prepaid expenses and other current assets |
|
438 |
|
|
|
472 |
|
|
Total current assets |
|
21,142 |
|
|
|
7,146 |
|
|
Non-Current Assets: |
|
|
|
|
|
|
|
|
Property and equipment, net |
|
1,492 |
|
|
|
2,277 |
|
|
Other non-current assets |
|
27 |
|
|
|
60 |
|
|
Total non-current assets |
|
1,519 |
|
|
|
2,337 |
|
|
Total Assets |
$ |
22,661 |
|
|
$ |
9,483 |
|
|
|
|
|
|
|
|
|
|
|
Liabilities and Stockholders' Deficit |
|
||||||
|
Current Liabilities: |
|
|
|
|
|
|
|
|
Accounts payable |
$ |
756 |
|
|
$ |
778 |
|
|
Accrued expenses and other current liabilities |
|
1,737 |
|
|
|
2,173 |
|
|
Deferred revenue |
|
158 |
|
|
|
— |
|
|
Convertible notes payable |
|
— |
|
|
|
91,655 |
|
|
Accrued interest on convertible notes payable |
|
— |
|
|
|
4,204 |
|
|
Total current liabilities |
|
2,651 |
|
|
|
98,810 |
|
|
Long-Term Liabilities: |
|
|
|
|
|
|
|
|
Convertible notes payable |
|
99,368 |
|
|
|
— |
|
|
Accrued interest on convertible notes payable |
|
8,779 |
|
|
|
— |
|
|
Common stock warrant liability |
|
4,176 |
|
|
|
— |
|
|
Other long-term liabilities |
|
500 |
|
|
|
266 |
|
|
Total long-term liabilities |
|
112,823 |
|
|
|
266 |
|
|
Total Liabilities |
|
115,474 |
|
|
|
99,076 |
|
|
|
|
|
|
|
|
|
|
|
Commitments and contingencies (Note 9) |
|
|
|
|
|
|
|
|
|
|
|
|
|
|
|
|
|
Stockholders' Deficit: |
|
|
|
|
|
|
|
|
Common stock ― $0.0001 par value; 100,000,000 shares authorized; 41,245,820 and 42,851,477 shares issued and outstanding at December 31, 2017 and December 31, 2016, respectively |
|
4 |
|
|
|
4 |
|
|
Additional paid-in capital |
|
289,342 |
|
|
|
299,643 |
|
|
Accumulated other comprehensive loss |
|
(2 |
) |
|
|
(2 |
) |
|
Accumulated deficit |
|
(382,157 |
) |
|
|
(389,238 |
) |
|
Total Stockholders' Deficit |
|
(92,813 |
) |
|
|
(89,593 |
) |
|
Total Liabilities and Stockholders' Deficit |
$ |
22,661 |
|
|
$ |
9,483 |
|
The accompanying notes are an integral part of these financial statements.
F-3
Consolidated Statements of Operations and Comprehensive Income (Loss) (unaudited)
(in thousands, except share and per share amounts)
|
|
|
Year Ended December 31, |
|
|||||||||||
|
|
|
2017 |
|
|
|
2016 |
|
|
|
2015 |
|
|||
|
Revenue |
$ |
|
45 |
|
|
$ |
|
— |
|
|
$ |
|
— |
|
|
Cost of revenue |
|
|
42 |
|
|
|
|
— |
|
|
|
|
— |
|
|
Gross profit |
|
|
3 |
|
|
|
|
— |
|
|
|
|
— |
|
|
|
|
|
|
|
|
|
|
|
|
|
|
|
|
|
|
Operating Expense: |
|
|
|
|
|
|
|
|
|
|
|
|
|
|
|
Research and development |
|
|
12,760 |
|
|
|
|
18,171 |
|
|
|
|
16,760 |
|
|
Selling, general and administrative |
|
|
8,572 |
|
|
|
|
8,609 |
|
|
|
|
7,210 |
|
|
Loss from operations |
|
|
(21,329 |
) |
|
|
|
(26,780 |
) |
|
|
|
(23,970 |
) |
|
Other Income (Expense): |
|
|
|
|
|
|
|
|
|
|
|
|
|
|
|
Interest income |
|
|
57 |
|
|
|
|
3 |
|
|
|
|
9 |
|
|
Interest expense |
|
|
(6,690 |
) |
|
|
|
(2,053 |
) |
|
|
|
(1,904 |
) |
|
Loss on issuance of convertible notes payable and warrants to purchase common stock |
|
|
(520 |
) |
|
|
|
— |
|
|
|
|
— |
|
|
Gain (loss) on change in fair value of convertible notes payable and warrant liability |
|
|
35,731 |
|
|
|
|
(25,247 |
) |
|
|
|
(56,788 |
) |
|
Other (expense) income |
|
|
(115 |
) |
|
|
|
(21 |
) |
|
|
|
59 |
|
|
Other income (expense) |
|
|
28,463 |
|
|
|
|
(27,318 |
) |
|
|
|
(58,624 |
) |
|
Net Income (Loss) |
$ |
|
7,134 |
|
|
$ |
|
(54,098 |
) |
|
$ |
|
(82,594 |
) |
|
|
|
|
|
|
|
|
|
|
|
|
|
|
|
|
|
Net income (loss) per share - basic |
$ |
|
0.17 |
|
|
$ |
|
(1.28 |
) |
|
$ |
|
(2.38 |
) |
|
Weighted average shares outstanding - basic |
|
|
41,811,326 |
|
|
|
|
42,120,545 |
|
|
|
|
34,680,634 |
|
|
|
|
|
|
|
|
|
|
|
|
|
|
|
|
|
|
Net loss per share - diluted |
$ |
|
(0.40 |
) |
|
$ |
|
(1.28 |
) |
|
$ |
|
(2.38 |
) |
|
Weighted average shares outstanding - diluted |
|
|
53,317,482 |
|
|
|
|
42,120,545 |
|
|
|
|
34,680,634 |
|
|
|
|
|
|
|
|
|
|
|
|
|
|
|
|
|
|
Comprehensive Income (Loss): |
|
|
|
|
|
|
|
|
|
|
|
|
|
|
|
Net income (loss) |
$ |
|
7,134 |
|
|
$ |
|
(54,098 |
) |
|
$ |
|
(82,594 |
) |
|
Other comprehensive income (loss) |
|
0 |
|
|
|
0 |
|
|
|
0 |
|
|||
|
Comprehensive income (loss) |
$ |
|
7,134 |
|
|
$ |
|
(54,098 |
) |
|
$ |
|
(82,594 |
) |
The accompanying notes are an integral part of these financial statements.
F-4
Consolidated Statements of Cash Flows (unaudited)
(in thousands)
|
|
Year Ended December 31, |
|
|||||||||
|
|
2017 |
|
|
2016 |
|
|
2015 |
|
|||
|
Cash Flows from Operating Activities: |
|
|
|
|
|
|
|
|
|
|
|
|
Net income (loss) |
$ |
7,134 |
|
|
$ |
(54,098 |
) |
|
$ |
(82,594 |
) |
|
Non-cash adjustments to reconcile net income (loss) to net cash used for operating activities: |
|
|
|
|
|
|
|
|
|
|
|
|
Depreciation and amortization |
|
1,062 |
|
|
|
1,139 |
|
|
|
1,096 |
|
|
Loss on sale of property and equipment |
|
52 |
|
|
|
— |
|
|
|
— |
|
|
Stock-based compensation |
|
2,047 |
|
|
|
4,723 |
|
|
|
3,434 |
|
|
Interest on convertible notes payable |
|
6,690 |
|
|
|
2,053 |
|
|
|
1,904 |
|
|
Loss on issuance of convertible notes payable and warrants to purchase common stock |
|
520 |
|
|
|
— |
|
|
|
— |
|
|
(Gain) loss on change in fair value of convertible notes payable and warrant liability |
|
(35,731 |
) |
|
|
25,247 |
|
|
|
56,788 |
|
|
Other non-cash expenses |
|
— |
|
|
|
21 |
|
|
|
46 |
|
|
Changes in operating assets and liabilities: |
|
|
|
|
|
|
|
|
|
|
|
|
Accounts receivable |
|
(63 |
) |
|
|
— |
|
|
|
— |
|
|
Inventory |
|
(570 |
) |
|
|
— |
|
|
|
— |
|
|
Prepaid expenses and other current assets |
|
84 |
|
|
|
(75 |
) |
|
|
9 |
|
|
Other non-current assets |
|
33 |
|
|
|
— |
|
|
|
— |
|
|
Accounts payable |
|
(72 |
) |
|
|
(244 |
) |
|
|
365 |
|
|
Accrued expenses and other current liabilities |
|
(436 |
) |
|
|
(90 |
) |
|
|
33 |
|
|
Deferred revenue |
|
158 |
|
|
|
— |
|
|
|
— |
|
|
Other long-term liabilities |
|
234 |
|
|
|
65 |
|
|
|
(163 |
) |
|
Net cash used for operating activities |
|
(18,858 |
) |
|
|
(21,259 |
) |
|
|
(19,082 |
) |
|
Cash Flows from Investing Activities: |
|
|
|
|
|
|
|
|
|
|
|
|
Purchases of property and equipment |
|
(386 |
) |
|
|
(729 |
) |
|
|
(857 |
) |
|
Purchases of investments |
|
(1,470 |
) |
|
|
— |
|
|
|
— |
|
|
Maturities of investments |
|
— |
|
|
|
— |
|
|
|
995 |
|
|
Net cash (used for) provided by investing activities |
|
(1,856 |
) |
|
|
(729 |
) |
|
|
138 |
|
|
Cash Flows from Financing Activities: |
|
|
|
|
|
|
|
|
|
|
|
|
Proceeds from issuances of common stock |
|
92 |
|
|
|
11,767 |
|
|
|
10,075 |
|
|
Repurchase of common stock |
|
(12,493 |
) |
|
|
— |
|
|
|
— |
|
|
Proceeds from (costs of) issuance of convertible notes payable and warrants, net |
|
44,985 |
|
|
|
— |
|
|
|
(50 |
) |
|
Net cash provided by financing activities |
|
32,584 |
|
|
|
11,767 |
|
|
|
10,025 |
|
|
Net increase (decrease) in cash and cash equivalents |
|
11,870 |
|
|
|
(10,221 |
) |
|
|
(8,919 |
) |
|
Cash and cash equivalents at beginning of period |
|
6,674 |
|
|
|
16,895 |
|
|
|
25,814 |
|
|
Cash and Cash Equivalents at End of Period |
$ |
18,544 |
|
|
$ |
6,674 |
|
|
$ |
16,895 |
|
|
|
|
|
|
|
|
|
|
|
|
|
|
|
Supplemental Non-Cash Information: |
|
|
|
|
|
|
|
|
|
|
|
|
Property and equipment in accounts payable |
$ |
11 |
|
|
$ |
18 |
|
|
$ |
50 |
|
|
Adjustment to beginning accumulated deficit upon adoption of ASU 2016-09 |
$ |
53 |
|
|
$ |
— |
|
|
$ |
— |
|
|
Warrant liability transferred to equity upon exercise |
$ |
— |
|
|
$ |
28,579 |
|
|
$ |
14,970 |
|
The accompanying notes are an integral part of these financial statements.
F-5
Consolidated Statements of Stockholders’ Equity (Deficit) (unaudited)
(in thousands, except share and per share amounts)
|
|
|
|
|
|
|
|
|
|
|
|
|
|
Accumulated |
|
|
|
|
|
|
|
|
|
|
|
|
|
|
|
|
|
|
|
|
|
|
|
|
Other |
|
|
|
|
|
|
Total |
|
||
|
|
Common Stock |
|
|
Additional |
|
|
Comprehensive |
|
|
Accumulated |
|
|
Stockholders' |
|
|||||||||
|
|
Shares |
|
|
Amount |
|
|
Paid-In Capital |
|
|
Income/(Loss) |
|
|
Deficit |
|
|
Deficit |
|
||||||
|
Balance at December 31, 2014 |
|
33,529,778 |
|
|
$ |
3 |
|
|
$ |
226,095 |
|
|
$ |
(1 |
) |
|
$ |
(252,546 |
) |
|
$ |
(26,449 |
) |
|
Net loss and comprehensive loss |
|
— |
|
|
|
— |
|
|
|
— |
|
|
|
— |
|
|
|
(82,594 |
) |
|
|
(82,594 |
) |
|
Common stock issued upon exercise of stock options for cash at $1.25 to $5.60 per share |
|
251,208 |
|
|
|
0 |
|
|
|
570 |
|
|
|
— |
|
|
|
— |
|
|
|
570 |
|
|
Common stock issued upon exercise of warrants for cash at $2.17275 per share |
|
4,375,000 |
|
|
|
1 |
|
|
|
9,505 |
|
|
|
— |
|
|
|
— |
|
|
|
9,506 |
|
|
Fair value of warrant liability transferred to equity upon warrant exercise |
|
— |
|
|
|
— |
|
|
|
14,970 |
|
|
|
— |
|
|
|
— |
|
|
|
14,970 |
|
|
Stock-based compensation expense |
|
— |
|
|
|
— |
|
|
|
3,434 |
|
|
|
— |
|
|
|
— |
|
|
|
3,434 |
|
|
Other comprehensive loss |
|
— |
|
|
|
— |
|
|
|
— |
|
|
|
(1 |
) |
|
|
— |
|
|
|
(1 |
) |
|
Balance at December 31, 2015 |
|
38,155,986 |
|
|
$ |
4 |
|
|
$ |
254,574 |
|
|
$ |
(2 |
) |
|
$ |
(335,140 |
) |
|
$ |
(80,564 |
) |
|
Net loss and comprehensive loss |
|
— |
|
|
|
— |
|
|
|
— |
|
|
|
— |
|
|
|
(54,098 |
) |
|
|
(54,098 |
) |
|
Common stock issued upon exercise of stock options for cash at $1.40 to $4.00 per share |
|
132,916 |
|
|
0 |
|
|
|
360 |
|
|
|
— |
|
|
|
— |
|
|
|
360 |
|
|
|
Common stock issued upon exercise of warrants for cash at $2.6073 per share |
|
4,375,000 |
|
|
0 |
|
|
|
11,407 |
|
|
|
— |
|
|
|
— |
|
|
|
11,407 |
|
|
|
Common stock issued upon vesting of restricted stock units |
|
160,000 |
|
|
0 |
|
|
|
— |
|
|
|
— |
|
|
|
— |
|
|
|
0 |
|
|
|
Common stock issued upon net exercise of stock options |
|
27,575 |
|
|
0 |
|
|
|
— |
|
|
|
— |
|
|
|
— |
|
|
|
0 |
|
|
|
Fair value of warrant liability transferred to equity upon warrant exercise |
|
— |
|
|
|
— |
|
|
|
28,579 |
|
|
|
— |
|
|
|
— |
|
|
|
28,579 |
|
|
Stock-based compensation expense |
|
— |
|
|
|
— |
|
|
|
4,723 |
|
|
|
— |
|
|
|
— |
|
|
|
4,723 |
|
|
Other comprehensive loss |
|
— |
|
|
|
— |
|
|
|
— |
|
|
0 |
|
|
|
— |
|
|
|
0 |
|
|
|
Balance at December 31, 2016 |
|
42,851,477 |
|
|
$ |
4 |
|
|
$ |
299,643 |
|
|
$ |
(2 |
) |
|
$ |
(389,238 |
) |
|
$ |
(89,593 |
) |
|
Net income and comprehensive income |
|
— |
|
|
|
— |
|
|
|
— |
|
|
|
— |
|
|
|
7,134 |
|
|
|
7,134 |
|
|
Adoption of ASU 2016-09 |
|
— |
|
|
|
— |
|
|
|
— |
|
|
|
|
|
|
|
(53 |
) |
|
|
(53 |
) |
|
Common stock issued upon vesting of restricted stock units |
|
47,800 |
|
|
0 |
|
|
|
— |
|
|
|
— |
|
|
|
— |
|
|
|
0 |
|
|
|
Common stock issued upon exercise of stock options for cash at $1.40 to $1.50 per share |
|
65,000 |
|
|
0 |
|
|
|
92 |
|
|
|
— |
|
|
|
— |
|
|
|
92 |
|
|
|
Common stock issued upon net exercise of stock options |
|
13,803 |
|
|
0 |
|
|
|
— |
|
|
|
— |
|
|
|
— |
|
|
|
0 |
|
|
|
Stock repurchase associated with convertible debt financing |
|
(1,732,260 |
) |
|
0 |
|
|
|
(12,493 |
) |
|
|
|
|
|
|
|
|
|
|
(12,493 |
) |
|
|
Stock-based compensation expense |
|
— |
|
|
|
— |
|
|
|
2,100 |
|
|
|
— |
|
|
|
— |
|
|
|
2,100 |
|
|
Other comprehensive income |
|
— |
|
|
|
— |
|
|
|
— |
|
|
0 |
|
|
|
— |
|
|
|
0 |
|
|
|
Balance at December 31, 2017 |
|
41,245,820 |
|
|
$ |
4 |
|
|
$ |
289,342 |
|
|
$ |
(2 |
) |
|
$ |
(382,157 |
) |
|
$ |
(92,813 |
) |
The accompanying notes are an integral part of these financial statements.
F-6
REVA Medical, Inc.
Notes to Consolidated Financial Statements (unaudited)
REVA Medical, Inc. was incorporated in California in 1998 under the name MD3, Inc. In March 2002 we changed our name to REVA Medical, Inc. In October 2010 we reincorporated in Delaware. We established a non-operating wholly owned subsidiary, REVA Germany GmbH, in 2007. In these Notes to Consolidated Financial Statements, the terms “REVA,” the “Company,” “us,” “we,” or “our” refer to REVA and its consolidated subsidiary unless context dictates otherwise.
We are a medical device company focused on developing and commercializing products for use in humans, utilizing our proprietary bioresorbable polymer technologies. On April 3, 2017, we received approval for the marketing and sale of our first product, the Fantom® scaffold, in Europe and other jurisdictions that recognize the CE marking. Our Fantom scaffold is a sirolimus-eluting bioresorbable scaffold used to treat coronary artery disease in humans. We received our first customer order late in the second quarter of 2017 and we recorded our first order shipments and revenues in the third quarter of 2017. Prior to CE Mark, Fantom had been implanted in 247 patients in the FANTOM I and FANTOM II clinical trials conducted in eight countries outside the United States. We used the six-month clinical results from 117 patients in the FANTOM II clinical trial for CE Mark application, which we submitted in 2016.
In December 2010 we completed an initial public offering (the “IPO”) of our common stock in Australia and registered with the U.S. Securities and Exchange Commission (“SEC”) and, consequently, became an SEC reporting company. Our common stock is traded in the form of CHESS Depositary Interests (“CDIs”) on the Australian Securities Exchange (“ASX”); each share of our common stock is equivalent to ten CDIs. Our trading symbol is “RVA.AX.” We may pursue a listing of our common stock on a U.S. stock exchange, at which time we would become dual-listed, if we maintain our listing on the ASX.
|
2. Capital Resources and Basis of Presentation |
Capital Resources: The accompanying consolidated financial statements have been prepared on a going concern basis, which contemplates the realization of assets and the satisfaction of liabilities in the normal course of business. We have incurred significant operating losses since inception and have relied on our ability to fund our operations primarily though equity and debt financings. At December 31, 2017, we had an accumulated deficit of $382.2 million and our cash, cash equivalents and investment securities totaled $20.0 million. Based on our current operating plans and projections, we believe our cash, cash equivalents and investment securities of $20.0 million will be sufficient to fund our operations through the first quarter of 2019. Our projections are predicated on us achieving certain minimum levels of sales of our Fantom scaffold. If we are unable to achieve these levels of sales, we may be compelled to reduce operating and capital expenditures, or sell certain assets.
Although we initiated commercial sales of Fantom in the third quarter of 2017, we are still very early in the commercialization stage and, we have only one commercial product. We have been severely impacted by the withdrawal of Absorb, a competitor’s product, in 2017 and the negative publicity around Absorb’s safety. We are focused on rebuilding the market for bioresorbable scaffolds and educating physicians regarding the unique features of Fantom versus Absorb. We are conducting and initiating additional clinical studies to build the clinical evidence needed to support broad market adoption. During 2018, we will be expanding our commercial and clinical efforts to additional markets that accept the CE Mark or allow registration based on our existing clinical evidence.
Until we generate revenue at a level to support our cost structure, we expect to continue to incur substantial operating losses and net cash outflows. We may never become profitable and even if we do attain profitability, we may not be able to sustain profitability or positive cash flows on a recurring basis. Until we generate positive cash flows from operations on a sustainable basis, we plan to continue to fund our operating and capital needs from our current cash resources and proceeds from future capital raising efforts. Unless we are able to significantly accelerate our sales, we do not anticipate generating positive cash flows in 2018 or 2019, and therefore, will need to raise further capital to support our operations and our ongoing costs, and to conduct a U.S. clinical trial, if we determine to do so. We are pursuing sales expansion, financing and business development opportunities that may provide us with additional capital. There can be no assurance that we will be successful in accelerating our revenue or raising additional capital. If we are unable to significantly increase revenue or raise additional capital when needed or on acceptable terms, we would need to consider a delay, reduction or cessation of our research and development programs and our commercialization efforts. There can be no assurance that our efforts will result in the resolution of our liquidity needs. If we are not able to continue as a going concern, holders of our common stock could lose their investment.
F-7
REVA Medical, Inc.
Notes to Consolidated Financial Statements (unaudited)
The accompanying consolidated financial statements do not include any adjustments that might result should we be unable to continue as a going concern.
Basis of Presentation: We have prepared the accompanying consolidated financial statements in accordance with accounting principles generally accepted in the United States (“U.S. GAAP”). The consolidated financial statements include the accounts of REVA and our wholly owned subsidiary, REVA Germany GmbH. All intercompany transactions and balances, if any, have been eliminated in consolidation.
Use of Estimates: The preparation of financial statements in conformity with U.S. GAAP requires management to make estimates and assumptions that affect the amounts reported in the financial statements and accompanying notes. Actual results could differ from our estimates.
3. Significant Accounting Policies
Cash Equivalents: We consider all highly liquid investments with original maturities of three months or less at the date of purchase to be cash equivalents. Cash equivalents are carried at cost, which we believe approximates fair value due to the short-term maturities of these investments.
Investment Securities: Investment securities are marketable equity or debt securities. All of our investment securities are “available-for-sale” securities and carried at fair value. Fair value for securities with short maturities and infrequent secondary market trades typically is determined by using a curve-based evaluation model that utilizes quoted prices for similar securities. The evaluation model takes into consideration the days to maturity, coupon rate and settlement date convention. Net unrealized gains or losses on these securities are included in accumulated other comprehensive loss, which is a separate component of stockholders’ deficit. Realized gains and realized losses are included in other expense while amortization of premiums and accretion of discounts are included in interest income. Interest and dividends on available-for-sale securities are included in interest income. We periodically evaluate our investment securities for impairment. If we determine that a decline in fair value of any investment security is other than temporary, then the cost basis would be written down to fair value and the decline in value would be charged to earnings.
Our investment securities are under the custodianship of a major financial institution and consist of certificates of deposit that are insured by the Federal Deposit Insurance Corporation. We have classified all of our available-for-sale investment securities as current assets on our consolidated balance sheets because we consider them to be highly liquid and available for use, if needed, in current operations. As of December 31, 2017, none of our $1.5 million of investment securities had contractual maturity dates of more than one year.
Inventory: We received CE Mark approval of our Fantom scaffold on April 3, 2017, at which time we began capitalizing raw material purchases and commercial scaffold production costs to inventory. Inventory is stated at the lower of cost or net realizable value based on the first-in, first-out cost method (“FIFO”). Our policy is to record an estimated allowance against inventory for unsalable, obsolete, or impaired inventory, with a corresponding increase to cost of revenue. We record the cost of products to be used in research and development or clinical trials as research and development expense.
Impairment of Long-Lived Assets: We review our long-lived assets for impairment whenever events or changes in circumstances indicate that the carrying amount of an asset may not be recoverable and exceeds its undiscounted future cash flows. The amount of impairment, if any, is determined by comparing an asset’s estimated fair value to the asset’s respective carrying amount. During the years ended December 31, 2017, 2016, and 2015 we determined there were no indications of long-lived asset impairment.
Convertible Notes: Convertible notes are analyzed at issue date to determine balance sheet classification, issue discounts or premiums, and embedded or derivative features. Embedded or derivative features are evaluated in accordance with accounting guidance for derivative securities and, if the features give rise to separate accounting, we make an election to account for the notes at cost or at fair value. If fair value accounting is elected on the issue date, we record the difference between the issue price of the notes and their fair value as a gain or loss in our consolidated statement of operations. We remeasure the fair value at each reporting date and record a gain (upon a decrease in fair
F-8
REVA Medical, Inc.
Notes to Consolidated Financial Statements (unaudited)
value) or loss (upon an increase in fair value), as a component of other income (expense) in our consolidated statement of operations. Inputs to the models include the market value of the underlying stock, a life equal to the contractual life of the notes, incremental borrowing rates that correspond to debt with similar credit worthiness, and estimated volatility based on the historical prices of our trading securities. For each periodic valuation, we also make assumptions as to our abilities to test and commercialize our product, to obtain future financings when and if needed, and to comply with the terms and conditions of any outstanding notes payable.
Following an analysis of their embedded and derivative features, we elected to utilize fair value accounting for all issues of convertible notes payable as management believes the convertible notes payable will be converted into common stock, rather than repaid, and the fair value method of accounting provides a more appropriate value of these liabilities than would be provided under the cost method.
Common Stock Warrants: The fair value of warrants issued for the purchase of common stock is recorded as a liability whenever warrants call for issuance of registered shares upon exercise, a condition that we may not be able to satisfy at the time of exercise, and which, if not so satisfied, will result in a net settlement of warrants. Until the time warrants are exercised or expire, the fair value is assessed at each reporting date. Any change in value is recorded as a gain or loss component of other income (expense) in our consolidated statement of operations. Inputs to the valuation models are of the same nature as those used to value our convertible notes payable.
Revenue: We received our first order for Fantom in June 2017. We sell Fantom to hospitals, and title and risk of loss transfer upon delivery to these hospitals. We recognize revenue when all of the following four criteria are met: (1) persuasive evidence of an arrangement exists; (2) delivery has occurred; (3) the fee is fixed or determinable; and (4) collectability is reasonably assured. We also consider any return or exchange rights. We analyze product reorder rates to evaluate and determine whether return or exchange rights exist and are likely to be exercised. If the revenue recognition criteria are not met, we defer the recognition of revenue by recording deferred revenue until such time that all criteria are met.
We recognized $45,000 of revenue during the year ended December 31, 2017. Total billings for shipped product for this period were $203,000; the amount by which total billings for shipped product exceeded recognized revenue was recorded as deferred revenue.
Accounts receivable consist of trade receivables recorded upon shipment of product reduced by reserves when necessary for estimated bad debts. Accounts receivable are recorded at the invoiced amount and do not bear interest. Credit is extended based on an evaluation of the customer’s financial condition. The allowance for doubtful accounts is determined based on current customer information and other relevant factors, including specific identification of past due accounts. Once a receivable is deemed to be uncollectible, such balance is charged against the allowance. As of December 31, 2017, our allowance for doubtful accounts was $0.
Research and Development: Research and development costs are expensed as incurred. These costs include salaries, employee benefits, laboratory supplies, consulting services, manufacturing products and services, preclinical and clinical costs, technology license fees, laboratory equipment depreciation, facility costs, and certain indirect costs.
Income Taxes: We account for income taxes using the asset and liability method, under which the current income tax expense or benefit is the amount of income tax expected to be payable or refundable in the current year. Deferred tax assets and liabilities are recorded for the estimated future tax consequences of temporary differences between the financial statement carrying amounts of assets and liabilities and their respective tax bases, and for operating loss and tax credit carryforwards. Deferred tax assets and liabilities are measured using enacted tax rates expected to apply to taxable income in the year in which the temporary differences are expected to be recovered or settled.
We evaluate the realizability of our deferred tax assets and establish a valuation allowance when it is more likely than not that all or a portion of our deferred tax assets will not be realized. In making such a determination, we consider all available positive and negative evidence, including future reversals of existing taxable temporary differences, projected future taxable income, tax planning strategies, and results of recent operations. If we determine that we would be able to realize our deferred tax assets in the future in excess of their net recorded amount, we would make an adjustment to the deferred tax asset valuation allowance, which would reduce the provision for income taxes.
F-9
REVA Medical, Inc.
Notes to Consolidated Financial Statements (unaudited)
We account for the uncertainty in income tax components based on tax positions taken or expected to be taken in a tax return. To recognize a benefit, a tax position must be more likely than not to be sustained upon examination by taxing authorities. We do not recognize tax benefits that have a less than 50 percent likelihood of being sustained. Our policy is to recognize interest and tax penalties related to unrecognized tax benefits in income tax expense; no interest or tax penalties on uncertain tax benefits have been recorded through December 31, 2017.
Stock-Based Compensation: Stock-based compensation expense is recorded in connection with stock options, restricted stock awards, and restricted stock unit awards (“RSUs”) to employees, directors, and consultants. We have granted stock options, restricted stock, and RSUs that vest based on the passage of time (time-based vesting awards) as well as stock options and RSUs that vest based on achievement of performance milestones (performance-based vesting awards).
For time-based vesting stock options granted to employees and directors, we determine compensation expense based on estimated grant date fair values utilizing the Black-Scholes option valuation model. The Black-Scholes model requires the input of assumptions, including volatility, the expected term, and the fair value of the underlying common stock on the date of grant, among other inputs. For time-based vesting restricted stock awards and RSUs, the grant date fair value is equal to the closing market price of our common stock on the date of award. We use the straight-line method to allocate compensation expense to reporting periods over each recipient’s requisite service period, which is generally from one to four years. All stock-based compensation expense is recorded as either research and development or selling, general and administrative expense based on a recipient’s work classification.
For performance-based vesting stock options and RSUs, we record compensation expense for only the performance milestones that are probable of being achieved, with such expense recorded on a straight-line basis over the expected vesting period. We reassess our performance-based estimates each reporting period and, if the estimated service period changes, we recognize all remaining compensation expense over the remaining service period and, if the probability of achievement changes to or from “probable,” we recognize the cumulative effect. Whenever an award recipient terminates service prior to achievement of a performance milestone, the recipient’s unvested awards are cancelled and the related compensation expense previously recorded is reversed.
For stock options granted to consultants, all of which are time-based vesting, we estimate fair values at the date of grant and at each subsequent reporting period and record compensation expense during the consultant’s service period. We estimate the fair value utilizing the Black-Scholes option valuation model with the same approach to inputs and assumptions as we use to estimate the fair value of employee options, except we use the remaining term as the expected life of the option.
Foreign Currency: The functional currency of our subsidiary REVA Germany GmbH is the Euro. Balance sheet accounts of our subsidiary are translated into United States dollars using the exchange rate in effect at the balance sheet date while expenses are translated using the average exchange rate in effect during the period. Gains and losses arising from translation of our subsidiary’s financial statements are recorded to other comprehensive income (loss). These gains and losses, in the aggregate, were insignificant through December 31, 2017.
Concentrations: Financial instruments that potentially subject us to concentrations of credit risk are primarily cash, cash equivalents and investment securities. Our audit committee approved an investment policy that sets our investment parameters and limitations with objectives of preserving principal and liquidity. Our cash and cash equivalent balances consist primarily of money market accounts under the custodianship of major financial institutions. Investment securities are invested in accordance with our investment policy. We do not have any financial instruments with off-balance-sheet risk of accounting loss.
As we recently commenced commercial operations, our revenue in 2017 is more concentrated than we expect it to be as we gain market share. Our top customer represented 26% of our total shipments in 2017.
Segment Information: We operate in one business segment, which is the development and commercialization of medical devices.
F-10
REVA Medical, Inc.
Notes to Consolidated Financial Statements (unaudited)
Recent Adopted Accounting Pronouncements: We adopted ASU 2016-09, Stock Compensation: Improvements to Employee Share-Based Payment Accounting, effective January 1, 2017. ASU 2016-09 simplifies certain aspects of accounting for stock-based compensation, including the accounting for income taxes, the option to recognize forfeiture credits as they occur rather than as an estimate of future activity, and classifications in the statement of cash flows. Upon the adoption, we recorded a cumulative effect adjustment to our accumulated deficit of approximately $53,000, with a corresponding increase to additional paid-in capital, to reverse our forfeiture estimate for unvested awards. All forfeitures occurring after adoption are being recognized in the consolidated statement of operations in the reporting period in which they occur. We had $1.8 million of forfeitures during the year ended December 31, 2017 related to a reduction in force that occurred in July 2017.
Recently Issued Accounting Pronouncements: In May 2014, the Financial Accounting Standards Board, or FASB, issued ASU 2014-09, Revenue from Contracts with Customers, which introduced Accounting Standards Codification 606, Revenue from Contracts with Customers (“ASC 606”), an updated standard on revenue recognition. The standard outlines a single comprehensive model to use in accounting for revenue arising from contracts with customers and supersedes most current revenue recognition guidance. Revenue recognized under ASC 606 will represent the consideration an entity expects to be entitled to in exchange for the transfer of goods or services to a customer; it also requires additional disclosures about the nature, amount, timing, and uncertainty of revenue and cash flows arising from customer contracts. The standard permits two methods of adoption: retrospectively to each prior reporting period (full retrospective method), or retrospectively with the cumulative effect of initially applying the guidance recognized at the date of initial application (modified retrospective method). We adopted ASC 606 effective January 1, 2018 and will utilize the modified retrospective method for adoption. The adoption of the standard will not materially affect the timing of revenue recognition under the new standards to be materially different from our current revenue recognition policy. Total billings for shipped product for the year ended December 31, 2017 were $203,000. We are in the process of finalizing the new required disclosures, however, do not believe such disclosures are material to the December 31, 2017 financial statements.
In February 2016, ASU 2016-02, Leases (Topic 842), was issued. ASU 2016-02 requires lessees to recognize assets and liabilities for all leases with terms exceeding 12 months, including those currently identified and accounted for as operating leases. ASU 2016-02 is effective the first quarter of 2019. We currently have only one lease to which the ASU would apply; we will continue to evaluate the impact of implementation on this lease and potential new leases.
In July 2017, ASU 2017-11, Earnings Per Share, Distinguishing Liabilities from Equity, Derivatives and Hedging, was issued. ASU 2017-11 changes the accounting treatment and the earnings per share calculation for certain instruments with down round features. The amendments in this update should be applied using a cumulative-effect adjustment as of the beginning of the fiscal year of adoption or retrospective adjustment to each period presented. This update is effective for annual periods beginning after December 15, 2018, and interim periods within those periods. We are in the process of determining the impact the adoption will have on our Consolidated Financial Statements as well as whether to early adopt the new guidance.
4. Inventory
The Company began capitalizing inventory upon CE approval in the second quarter of 2017. Inventory consisted of the following at December 31, 2017 (in thousands):
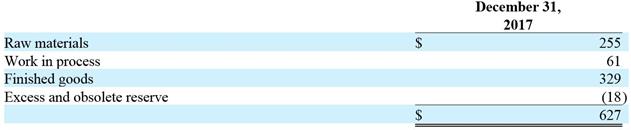
December 31, 2017 Raw materials$255 Work in process 61 Finished goods 329 Excess and obsolete reserve (18)
$627
F-11
REVA Medical, Inc.
Notes to Consolidated Financial Statements (unaudited)
|
5. Property and Equipment |
Property and equipment are stated at cost, less accumulated depreciation. Property and equipment are depreciated using the straight-line method over the estimated useful lives of the assets, which is generally three to five years. Leasehold improvements are amortized over the economic life of the asset or the lease term, whichever is shorter. Upon disposition or retirement of an asset, its cost and related accumulated depreciation are written off and any gain or loss is recognized in the consolidated statement of operations.
Property and equipment at December 31, 2017 and 2016 are as follows (in thousands):
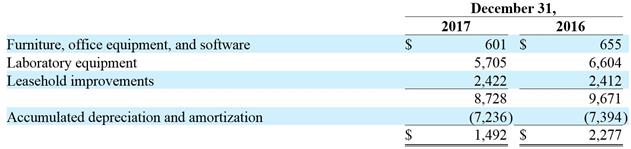
December 31,
2017 2016
$601 $655
5,705 6,604
2,422 2,412
8,728 9,671
(7,236) (7,394)
$1,492 $2,277
|
6. Accrued Expenses and Other Current Liabilities |
Accrued expenses and other current liabilities at December 31, 2017 and 2016 are as follows (in thousands):
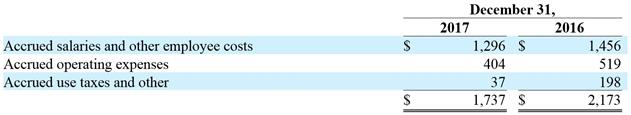
December 31,
2017 2016
$1,296 $1,456
404 519
37 198
$1,737 $2,173
|
7. Convertible Notes and Warrants to Purchase Common Stock |
In May 2017, we issued 338 convertible notes and in June 2017 we issued 133 convertible notes (collectively, the “2017 Notes”), each with a face value of $100,000, for total gross cash proceeds of $47.1 million. We used a portion of the proceeds from this financing to repurchase 1,732,260 shares of our common stock from one of the investors in the 2017 Notes at $7.212 per share, for a total repurchase price of $12.5 million, and incurred transaction costs of $2.1 million, resulting in net proceeds from this financing of $32.5 million. The 2017 Notes are convertible at any time at the holders’ election; the conversion rate as of December 31, 2017 was $8.655 per share, which, if converted at that conversion rate, would result in issuing 5,441,941 shares of common stock upon conversion. The conversion rate may decrease depending on the price at which we issue securities in future financings, if any, to a minimum of $7.212 per share. The 2017 Notes mature five years from issue date, if not converted or redeemed earlier. Interest accrues at the rate of 8.0 percent per annum, compounded annually, and is payable upon redemption or maturity; accrued interest is not payable or convertible upon conversion of the notes. Each holders of the 2017 Notes has a right to request that we redeem the notes (face value plus accrued interest) on November 4, 2019, if they have not been previously converted or redeemed, if the holders have provided at least 30 days’ written notice to elect such a redemption.
On their issue dates, we evaluated the 2017 Notes and, following an analysis of the embedded and derivative features, made an irrevocable election to account for the notes at fair value. The fair value on December 31, 2017 was estimated to be $38.4 million, $8.7 million below the $47.1 million face value of the 2017 Notes.
In November 2014, we issued 250 convertible notes (the “2014 Notes”), each with a face value of $100,000, for total gross cash proceeds of $25.0 million. The 2014 Notes are convertible at any time at the holders’ election into a total of 11,506,156 shares of common stock, which reflects a conversion rate of $2.17275 per share. The 2014 Notes mature on November 14, 2019, if not converted or redeemed earlier. Interest accrues at the rate of 7.54 percent per
F-12
REVA Medical, Inc.
Notes to Consolidated Financial Statements (unaudited)
annum, compounded annually, and is payable upon redemption or maturity; accrued interest is not payable or convertible upon conversion of the 2014 Notes. Effective June 1, 2017, the terms of the 2014 Notes that provided the holders with a one-time option to require us to redeem the notes on June 30, 2017 and that provided for an automatic conversion of the notes were eliminated, and the 2014 Notes were modified to be subordinate to the 2017 Notes. Our stockholders approved the foregoing modifications to the terms of the 2014 Notes.
On their issue date, we evaluated the 2014 Notes and, following an analysis of the embedded and derivative features, we made an irrevocable election to account for the notes at fair value. Following the modifications to the notes that were effective on June 1, 2017, we continued to account for the 2014 Notes under the fair value method. The fair values of the 2014 Notes as of December 31, 2017 and 2016 were calculated to be $61.0 million and $91.7 million, respectively.
Changes in the fair value of the 2014 Notes and 2017 Notes, which collectively we refer to as convertible notes payable, are recorded as gains or losses in the other income (expense) portion of our consolidated statement of operations. During the years ended December 31, 2017, 2016 and 2015, we accrued $4.6 million, $2.1 million and $1.9 million in interest expense on the convertible notes payable, respectively. An additional $2.1 million of transaction costs related to the issuance of the 2017 Notes was recorded as interest expense during the year ended December 31, 2017.
In connection with issuing the 2017 Notes, in May 2017 and June 2017 we issued warrants to purchase up to 2,119,500 shares of our common stock to the purchasers of the 2017 Notes. The warrants are immediately exercisable and expire five years from issue date. The exercise price of each warrant is $5.00 per share, which may increase depending on the price at which we issue securities in future financings, if any, to a maximum of $7.212 per share. The fair value of the warrants on December 31, 2017 was estimated to be $4.2 million. Changes in the fair value of the warrants are recorded as gains or losses in the other income (expense) portion of our consolidated statement of operations.
The aggregate fair value of the 2017 Notes and the warrants on their issue dates was estimated to be $47.6 million, which was $0.5 million higher than the $47.1 million issue price; we recorded this difference as a loss on issuance in our consolidated statement of operations.
The warrants we issued in November 2014 in connection with issuance of the 2014 Notes were exercised in full on or before February 12, 2016. Prior to their exercise, we recorded their change in fair value in our consolidated statement of operations. The loss on the change in fair value from January 1, 2016 to February 12, 2016 was $9.0 million.
|
8. Fair Value Measurements |
Our cash equivalents, investment securities, convertible notes payable and common stock warrant liability are carried at fair value. The fair value of financial assets and liabilities is measured under a framework that establishes “levels” which are defined as follows: (i) Level 1 fair value is determined from observable, quoted prices for identical assets or liabilities; (ii) Level 2 fair value is determined from quoted prices for similar items in active markets or quoted prices for identical or similar items in markets that are not active, and (iii) Level 3 fair value is determined using the entity’s own assumptions about the inputs that market participants would use in pricing an asset or liability.
F-13
REVA Medical, Inc.
Notes to Consolidated Financial Statements (unaudited)
The fair values of our cash equivalents, investment securities, convertible notes payable and common stock warrant liability are summarized in the following tables (in thousands):
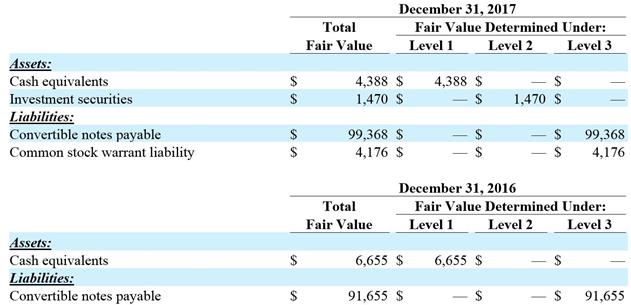
December 31, 2017
Total Fair Value Determined Under:
Fair Value Level 1 Level 2 Level 3
$4,388 $4,388 $— $—
$1,470 $— $1,470 $—
$99,368 $— $— $99,368
$4,176 $— $— $4,176
December 31, 2016
Total Fair Value Determined Under:
Fair Value Level 1 Level 2 Level 3
$6,655 $6,655 $— $—
$91,655 $— $— $91,655
The fair values of our 2017 Notes as of December 31, 2017 and the fair values of our 2014 Notes as of December 31, 2016 were determined utilizing a Least Squares Monte Carlo simulation model; the fair value of our warrants to purchase common stock was determined using either a Least Squares Monte Carlo simulation model or a Black-Scholes valuation model, depending on their exercise price and other features. These models require use of unobservable inputs that are determined by management, with the assistance of independent experts. These inputs represent our best estimates, but involve certain inherent uncertainties. We use the market value of the underlying stock, a life equal to the contractual life of the financial instrument, incremental borrowing rates and bond yields that correspond to instruments of similar credit worthiness and the instrument’s remaining life, an estimate of volatility based on the historical prices of our trading securities, and we make assumptions as to our abilities to test and commercialize our product(s), to obtain future financings when and if needed, to comply with the terms and conditions of our convertible notes payable, and the probability of a change in control event.
A summary of the weighted average assumptions used to value these Level 3 liabilities is as follows:
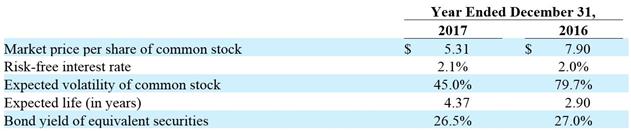
Year Ended December 31,
2017 2016
Market price per share of common stock$5.31 $7.90
Risk-free interest rate2.1% 2.0%
Expected volatility of common stock45.0% 79.7%
Expected life (in years) 4.37 2.90
Bond yield of equivalent securities26.5% 27.0%
A significant change in the market price per share, expected volatility, or bond yield of equivalent securities, in isolation, would result in significantly higher or lower fair value measurements. In combination, changes in these inputs could result in a significantly higher or lower fair value measurement if the input changes were to be aligned, or could result in a minimally higher or lower fair value measurement if the input changes were of a compensating nature.
As the 2014 Notes were significantly in the money and no longer had complex features as of December 31, 2017, we used an “as-converted” method for calculating the fair value of such notes. This involved multiplying the number of shares into which the 2014 Notes convert (11,506,156 shares) by the Company’s stock price as of December 29, 2017 (the last trading day of the year). We performed an evaluation as to whether the as converted method would yield a materially different result from the Least Squares Monte Carlo simulation model used in previous quarters and determined that it would not.
F-14
REVA Medical, Inc.
Notes to Consolidated Financial Statements (unaudited)
A reconciliation of the convertible notes payable and common stock warrant liability that are measured and recorded at fair value on a recurring basis using significant unobservable inputs (Level 3) is as follows:
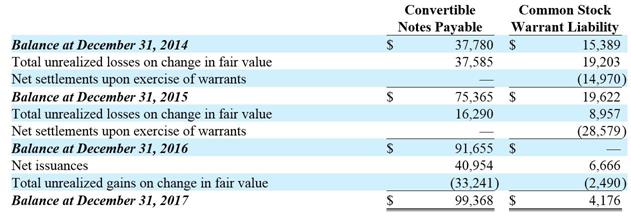
Common Stock
Notes Payable Warrant Liability
$37,780 $15,389
37,585 19,203
— (14,970)
$75,365 $19,622
16,290 8,957
— (28,579)
$91,655 $—
40,954 6,666
(33,241) (2,490)
$99,368 $4,176
9. Commitments and Contingencies
We license certain patents and other intellectual property rights related to the composition and coating of our bioresorbable stent and our other biomaterial products. Terms of these licenses include provisions for royalty payments on future sales of products, if any, utilizing this technology, with provisions for minimum royalties once product sales begin. The amount of royalties varies depending upon type of product, use of product, stage of product, location of sale, and ultimate sales volume, and ranges from a minimum of approximately $15 per unit sold to a maximum of approximately $50 per unit sold, with license provisions for escalating minimum royalties that could be as high as $2.2 million per year. Additionally, in the event we sublicense the technology and receive certain milestone payments, the licenses require that up to 40 percent of the milestone amount be paid to the licensors.
Additional terms of the technology licenses include annual license fees of $175,000 until the underlying technology has been commercialized. Because we began commercial sales of our Fantom scaffold in July 2017, these annual license fees will not continue after 2017. Terms of the licenses also include other payments to occur during commercialization that could total $950,000, payment of $350,000 upon a change in control of ownership of the Company, payments of up to $300,000 annually to extend filing periods related to certain technology (of which, payments totaling up to $250,000 per year during the years 2016, 2017, and 2018 are being deferred to January 1, 2019; accordingly, $500,000 was accrued as a long-term liability at December 31, 2017), and payment of patent filing, maintenance, and defense fees. The license terms remain in effect until the last patent expires.
In connection with our operating and business activities, we periodically enter into contracts with consultants and suppliers. These contracts are generally cancelable with 30 days’ written notice. As of December 31, 2017, the minimum future payments on these contracts totaled approximately $634,000.
We lease approximately 37,000 square feet of office and lab space for our corporate headquarters in San Diego, California. In October 2017, we amended this lease to extend the expiration date by 88 months from January 2018 to May 2025. Effective February 1, 2018, our monthly rent became $66,000 and it will increase every February by three percent. The amended lease also contains a leasehold improvement allowance of $787,000 and rent abatements of $274,000.
We record rent expense on a straight-line basis over the life of the lease; the difference between average rent expense and cash payments for rent is recorded as a deferred liability. As of December 31, 2017, our deferred rent totaled
$17,000, which was classified as a current liability. We recorded rent expense of $758,000, $770,000, and $794,000 for the years ended December 31, 2017, 2016, and 2015, respectively.
Future minimum payments under the lease are as follows (in thousands):
F-15
REVA Medical, Inc.
Notes to Consolidated Financial Statements (unaudited)
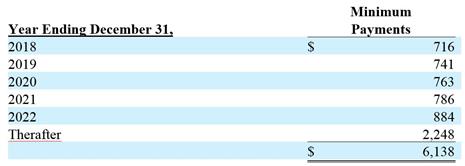
Minimum
Payments
$716
741
763
786
884
2,248
$6,138
10. Capital Stock
Our certificate of incorporation, as amended, authorizes us to issue 100,000,000 shares of common stock, par value $0.0001 per share, 25,000,000 shares of Class B common stock, par value $0.0001 per share and 5,000,000 shares of undesignated preferred stock, par value $0.0001 per share. As of December 31, 2017 and 2016, 41,245,820 and 42,851,477, respectively, shares of common stock were outstanding and no shares of Class B common stock or undesignated preferred stock were outstanding.
|
11. Stock-Based Compensation |
The Plan: Our 2010 Equity Incentive Plan, as amended (the “Plan”), provides for grants of incentive and non-qualified stock options for purchase of our common stock at a price per share equal to the closing market price on the date of grant, and for awards of restricted stock units (“RSUs”) and restricted stock, for which there is no consideration payable by a recipient. An RSU entitles the recipient to one share of our common stock upon vesting. All stock issuances under the Plan are made with new shares from our authorized but unissued common stock. The number of shares reserved under the Plan may be increased annually by up to three percent of our outstanding stock. On January 1, 2017, an additional 1,285,544 shares were added to the Plan, resulting in a total of 9,144,512 shares reserved for issuance under the Plan as of December 31, 2017. Option activity under the Plan is as follows:
F-16
REVA Medical, Inc.
Notes to Consolidated Financial Statements (unaudited)
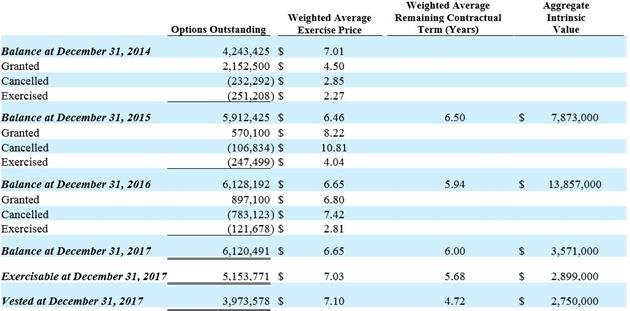
Options OutstandingWeighted Average Exercise PriceWeighted Average Remaining Contractual Term (Years)Aggregate
Intrinsic
4,243,425 $7.01
2,152,500 $4.50
(232,292) $2.85
(251,208) $2.27
5,912,425 $6.46 6.50 $7,873,000
570,100 $8.22
(106,834) $10.81
(247,499) $4.04
6,128,192 $6.65 5.94 $13,857,000
897,100 $6.80
(783,123) $7.42
(121,678) $2.81
6,120,491 $6.65 6.00 $3,571,000
5,153,771 $7.03 5.68 $2,899,000
3,973,578 $7.10 4.72 $2,750,000
Employees, non-employee directors, and consultants are eligible to participate in the Plan. For purposes of determining stock-based compensation expense, we include non-employee directors with employees; we account for consultant compensation expense separately.
The term of awards granted under the Plan may not exceed ten years. Vesting periods of awards are determined by our board of directors.
A majority of the vesting periods of outstanding stock options is four years, with 25 percent vesting on the one-year anniversary of the vesting commencement date and 75 percent vesting in equal monthly installments thereafter. A majority of the options are exercisable at any time but, if exercised prior to vesting, are subject to a lapsing right of repurchase by us at the exercise price until fully vested. As of December 31, 2017 and 2016, no unvested options had been exercised and, therefore, no shares were subject to repurchase.
During March 2015, we granted a total of 316,000 options that vest based on achievement of certain performance milestones. We estimated the vesting term for each performance milestone on the date of grant, and on each reporting date thereafter, based on our internal timelines and operating projections. Our estimates of vesting ranged from approximately nine to 30 months at the grant date in March 2015; we estimated the weighted average remaining vesting term to be 12 months as of both December 31, 2017 and 2016. A total of 65 percent of these options had vested as of December 31, 2017. During the years ended December 31, 2017 and 2016, 63,000 and 12,250 unvested options were cancelled, respectively.
During 2013, we awarded 87,500 shares of restricted stock; 25 percent of each award vests on each annual anniversary date of the award. As of December 31, 2017, all of these awards had vested and none had been cancelled.
F-17
REVA Medical, Inc.
Notes to Consolidated Financial Statements (unaudited)
RSU activity under the Plan is as follows:
|
|
RSUs |
|
|
Performance |
|
|
Time |
|
|||
|
|
Outstanding |
|
|
Based |
|
|
Based |
|
|||
|
Balance at December 31, 2014 |
|
— |
|
|
|
— |
|
|
|
— |
|
|
Granted |
|
984,200 |
|
|
|
824,200 |
|
|
|
160,000 |
|
|
Cancelled |
|
— |
|
|
|
— |
|
|
|
— |
|
|
Vested |
|
— |
|
|
|
— |
|
|
|
— |
|
|
Balance at December 31, 2015 |
|
984,200 |
|
|
|
824,200 |
|
|
|
160,000 |
|
|
Granted |
|
47,800 |
|
|
|
— |
|
|
|
47,800 |
|
|
Cancelled |
|
(118,000 |
) |
|
|
(118,000 |
) |
|
|
— |
|
|
Vested |
|
(160,000 |
) |
|
|
— |
|
|
|
(160,000 |
) |
|
Balance at December 31, 2016 |
|
754,000 |
|
|
|
706,200 |
|
|
|
47,800 |
|
|
Granted |
|
397,300 |
|
|
|
162,500 |
|
|
|
234,800 |
|
|
Cancelled |
|
(526,000 |
) |
|
|
(479,200 |
) |
|
|
(46,800 |
) |
|
Vested |
|
(47,800 |
) |
|
|
— |
|
|
|
(47,800 |
) |
|
Balance at December 31, 2017 |
|
577,500 |
|
|
|
389,500 |
|
|
|
188,000 |
|
We estimated the vesting term for each performance-based RSU on the award date, and on each reporting date thereafter, based on our internal timelines and operating projections. As of December 31, 2017, we estimated the remaining weighted average vesting term to be 8.1 months for the RSUs granted in 2015 and 6 months for the RSUs granted in 2017.
Time-based RSUs generally vest over one year for non-employee directors and ratably over three years for employees.
No tax benefits arising from stock-based compensation have been recognized in our consolidated statements of operations through December 31, 2017.
Grants and Awards to Employees: We account for option grants, restricted stock awards, and RSUs to employees based on their estimated fair values on the date of grant or award, with the resulting stock-based compensation recorded over the requisite service period on a straight-line basis. The fair value of restricted stock and RSUs is equal to the closing market price of our common stock on the date of award. The fair value of option grants was estimated on the date of grant using the following weighted-average assumptions:
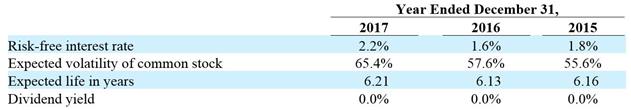
Year Ended December 31,
2017 2016 2015
2.2% 1.6% 1.8%
65.4% 57.6% 55.6%
6.21 6.13 6.16
0.0% 0.0% 0.0%
The assumed risk-free interest rate was based on the implied yield on a U.S. Treasury zero-coupon issue with a remaining term equal to the expected life of the option. The assumed volatility was calculated from the historical market prices of a selected group of publicly traded companies considered to be our peers; we use peer group data because we have limited historical trading data for our common stock, but adjusted the 2016 volatility upward by approximately ten percent to allow us to move toward using historical trading data for our common stock, which is more volatile than our peer group. In 2017, we began to use our historical trading price of our common stock; our common stock began trading on our IPO date of December 23, 2010, which provides approximately 7 years of history as December 31, 2017. For options that have time-based vesting, the expected option life was calculated using the simplified method under the accounting standard for stock compensation and a ten-year option expiration; we use the simplified method because we do not yet have adequate history as a public company traded on a U.S. stock exchange to establish a reasonable expected life. For options that have performance-based vesting, the expected life was calculated based on our internal timelines and operating projections. The expected dividend yield of zero reflects that we have not paid cash dividends since inception and do not intend to pay cash dividends in the foreseeable future.
F-18
REVA Medical, Inc.
Notes to Consolidated Financial Statements (unaudited)
The options granted during the years ended December 31, 2017, 2016 and 2015 had a weighted average grant date fair value of $4.15, $4.48 and $2.40, respectively.
The aggregate intrinsic value of options exercised during the years ended December 31, 2017, 2016 and 2015 was $362,000, $976,000 and $511,000, respectively.
For the options and RSUs that vest upon achievement of performance milestones, we record compensation expense for only those milestones that are probable of being achieved.
The vest-date fair value of RSUs that vested during the year ended December 31, 2017 and 2016 was $320,000 and $1.3 million, respectively. No RSUs vested in the year ended December 31, 2015.
Stock-based compensation arising from employee options and awards under the Plan is as follows (in thousands):
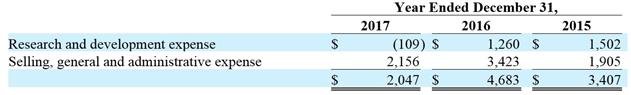
Year Ended December 31,
2017 2016 2015
Research and development expense$(109) $1,260 $1,502
Selling, general and administrative expense 2,156 3,423 1,905
$2,047 $4,683 $3,407
In the years ended December 31, 2017 and 2016, we reversed stock-based compensation of $1.8 million and $163,000, respectively, related to unvested awards for employees that were terminated.
As of December 31, 2017, we had approximately $7.3 million of total unrecognized compensation costs related to unvested employee awards that are expected to be recognized over a weighted average period of 1.7 years.
Stock Options to Consultants: We account for stock options granted to consultants at their fair value. Under this method, the fair value is estimated at each reporting date during the vesting period using the Black-Scholes option valuation model. The resulting stock-based compensation expense, or income if the fair value declines in a reporting period, is recorded over the consultant’s service period.
Fully vested options to purchase 7,500 shares of common stock were granted to consultants during the year ended December 31, 2016. No options were granted to consultants during the years ended December 31, 2017 or 2015.
Consultant stock-based compensation expense is recorded to the financial statement line item for which the consultant’s services are rendered. Stock-based compensation expense arising from consultant options is as follows (in thousands):
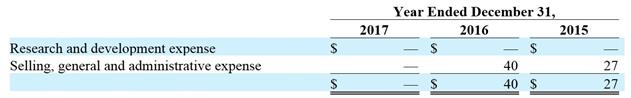
Year Ended December 31,
2017 2016 2015
Research and development expense$— $— $—
Selling, general and administrative expense — 40 27
$— $40 $27
F-19
REVA Medical, Inc.
Notes to Consolidated Financial Statements (unaudited)
A reconciliation of the tax provision to the amount computed by applying the statutory federal rate to the net income/(loss) is summarized as follows (in thousands):
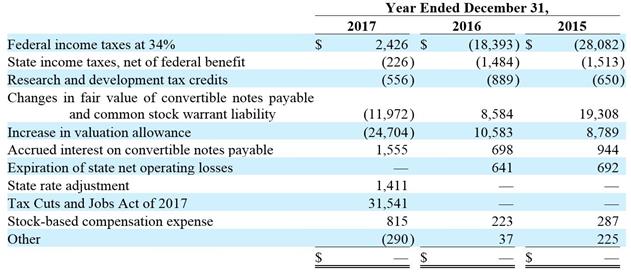
Year Ended December 31,
2017 2016 2015
Federal income taxes at 34%$2,426 $(18,393) $(28,082)
State income taxes, net of federal benefit (226) (1,484) (1,513)
Research and development tax credits (556) (889) (650)
Changes in fair value of convertible notes payable and common stock warrant liability
(11,972) 8,584 19,308
Increase in valuation allowance (24,704) 10,583 8,789
Accrued interest on convertible notes payable 1,555 698 944
Expiration of state net operating losses — 641 692
State rate adjustment 1,411 — —
Tax Cuts and Jobs Act of 2017 31,541 — —
Stock-based compensation expense 815 223 287
Other (290) 37 225
$— $— $—
Our deferred income taxes reflect the net tax effects of temporary differences between the carrying amount of assets and liabilities for financial reporting purposes and the amounts used for income tax purposes. Significant components of our deferred tax assets and liabilities are as follows:
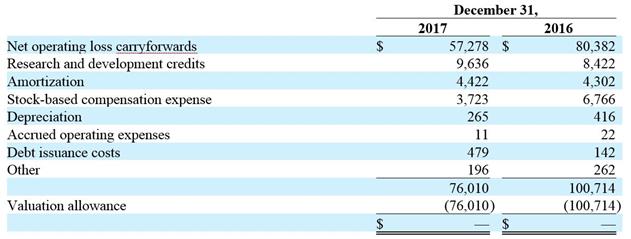
December 31,
2017 2016
Net operating loss carryforwards$57,278 $80,382
Research and development credits 9,636 8,422
Amortization 4,422 4,302
Stock-based compensation expense 3,723 6,766
Depreciation 265 416
Accrued operating expenses 11 22
Debt issuance costs 479 142
Other 196 262
76,010 100,714
Valuation allowance (76,010) (100,714)
$— $—
As of December 31, 2017, we had aggregate federal and California state net operating loss carryforwards of approximately $221.3 million and $154.6 million, respectively, which may be available to offset future taxable income for income tax purposes. The federal and California net operating loss carryforwards begin to expire in 2019 and 2027, respectively.
F-20
REVA Medical, Inc.
Notes to Consolidated Financial Statements (unaudited)
As of December 31, 2017, we also had federal and California state research tax credit carryforwards of approximately $7.5 million and $6.8 million, respectively. The federal research tax credit carryforwards begin to expire in 2020. The California state research tax carryforwards have no expiration.
Under Internal Revenue Code Sections 382 and 383, annual use of our net operating loss and research tax credit carryforwards to offset taxable income may be limited based on cumulative changes in ownership. An analysis of the impact of this provision from December 1, 1999 through December 31, 2017 has been performed and it was determined that, although ownership changes have occurred, the carryovers should be available for use by the Company before they expire, provided we generate sufficient future taxable income. Future ownership changes could result in limitations and may impact the realizability of these loss and credit carryforwards in future periods.
On December 22, 2017, new tax reform legislation in the U.S., known as the Tax Cuts and Jobs Act of 2017 (the “Act”) was signed into law. At December 31, 2017, the Company has not yet completed its accounting assessment for the tax effects of the enactment of the Act; however, as described below, the Company has made a reasonable estimate of the effects on the existing deferred tax balances.
As a result of the lower enacted corporate tax rate, the Company has remeasured certain deferred tax assets and liabilities based on the rates at which they are expected to reverse in the future, which is generally 21%. The provisional amount recorded related to the remeasurement of our deferred tax balance was $31.5 million, that is fully offset by a corresponding decrease to our valuation allowance.
Staff Accounting Bulletin No. 118 ("SAB 118") was issued to address the application of US GAAP in situations when a registrant does not have the necessary information available, prepared, or analyzed (including computations) in reasonable detail to complete the accounting for certain income tax effects of the Act. In accordance with SAB 118, the Company has provisionally determined that there is no deferred tax benefit or expense with respect to the remeasurement of certain deferred tax assets and liabilities due to the full valuation allowance against net deferred tax assets. The Company is still analyzing certain aspects of the Act and refining its calculations, which could potentially affect the measurement of these balances or potentially give rise to new deferred tax amounts. Additional analysis of the law and the impact to the Company will be performed and any impact will be recorded in the respective quarter in 2018.
As of December 31, 2017, we had deferred tax assets of $76.0 million and have established a valuation allowance against those deferred tax assets due to the uncertainty surrounding our ability to generate future taxable income to realize those assets. The change in the valuation allowance for the years ended December 31, 2017 and 2016 was ($24.7 million) and $10.6 million, respectively.
We recognize a tax benefit from an uncertain tax position when it is more likely than not that the position will be sustained upon examination, including resolutions of any related appeals or litigation processes, based on the technical merits. Income tax positions must meet a more-likely-than-not recognition at the effective date to be recognized. As of December 31, 2017, the unrecognized tax benefits recorded were approximately $3.6 million. We do not anticipate a significant change in the unrecognized tax benefits within the next 12 months.
A reconciliation of the beginning and ending amount of gross unrecognized tax benefits for 2017 and 2016, excluding interest and penalties, is as follows:
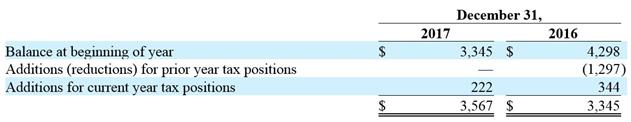
December 31,
2017 2016
$3,345 $4,298
— (1,297)
222 344
$3,567 $3,345
Due to our valuation allowance position, none of the unrecognized tax benefits, if recognized, will impact our effective tax rate. Our policy is to record interest and penalties within tax expense. As of December 31, 2017 and 2016, we had no accrued interest or penalties related to uncertain tax positions.
F-21
REVA Medical, Inc.
Notes to Consolidated Financial Statements (unaudited)
The Company is subject to taxation in the U.S. federal and state jurisdictions. As of December 31, 2017, the Company is no longer subject to U.S. federal and state examinations by tax authorities for years before 2012 and 2011, respectively. However, to the extent allowed by law, the tax authorities may have the right to examine prior periods where net operating losses were generated and carried forward, and make adjustments up to the amount of the net operating loss carryforward amount. The Company is not currently under IRS, state or local tax examination.
13. Net Income (Loss) Per Common Share
Basic net income (loss) per common share is calculated by dividing the net income (loss) attributable to common stockholders by the weighted average number of common shares outstanding for the period, without consideration for common stock equivalents. Diluted net loss per share is computed by dividing the net loss attributable to common stockholders by the weighted average number of common share equivalents outstanding for the period determined using the treasury-stock method and the if-converted method, as applicable. For this calculation, common stock options and restricted stock subject to forfeiture are considered to be common stock equivalents; common stock equivalents are used in the calculation of diluted net loss per share only when their effect is dilutive.
Basic net income (loss) per share reconciles to fully diluted net loss per share as follows (dollars in thousands):
|
|
Year Ended December 31, |
|
|||||||||||
|
|
2017 |
|
|
2016 |
|
|
|
|
2015 |
|
|||
|
Diluted Net Loss: |
|
|
|
|
|
|
|
|
|
|
|
|
|
|
Net income (loss) used for basic net income (loss) per share |
$ |
7,134 |
|
|
$ |
(54,098 |
) |
|
|
|
$ |
(82,594 |
) |
|
Interest expense on 2014 convertible notes payable |
|
2,202 |
|
|
|
— |
|
|
|
|
|
— |
|
|
Gain on change in fair value of 2014 convertible notes payable |
|
(30,672 |
) |
|
|
— |
|
|
|
|
|
— |
|
|
|
$ |
(21,336 |
) |
|
$ |
(54,098 |
) |
|
|
|
$ |
(82,594 |
) |
|
Weighted Average Shares Used to Compute Diluted Net Loss per Share: |
|
|
|
|
|
|
|
|
|
|
|
|
|
|
Shares used for basic net income (loss) per share |
|
41,811,326 |
|
|
|
42,120,545 |
|
|
|
|
|
34,680,634 |
|
|
Common share equivalents |
|
11,506,156 |
|
|
|
— |
|
|
|
|
|
— |
|
|
|
|
53,317,482 |
|
|
|
42,120,545 |
|
|
|
|
|
34,680,634 |
|
The following weighted average shares were excluded from the computations of diluted net loss per share because including them would have been antidilutive.
|
|
Year Ended December 31, |
|
|||||||||
|
|
2017 |
|
|
2016 |
|
|
2015 |
|
|||
|
Weighted Average Shares Excluded: |
|
|
|
|
|
|
|
|
|
|
|
|
Options to purchase common stock |
|
6,352,118 |
|
|
|
6,355,093 |
|
|
|
4,812,372 |
|
|
Unvested restricted stock |
|
5,171 |
|
|
|
31,528 |
|
|
|
61,623 |
|
|
Restricted stock units |
|
726,379 |
|
|
|
882,779 |
|
|
|
768,908 |
|
|
Warrants to purchase common stock |
|
1,334,749 |
|
|
|
502,049 |
|
|
|
7,647,260 |
|
|
Common share equivalents of convertible notes |
|
14,933,203 |
|
|
|
11,506,156 |
|
|
|
11,506,156 |
|
|
|
|
23,351,620 |
|
|
|
19,277,605 |
|
|
|
24,796,319 |
|
|
14. Retirement Plan |
In 2003 we adopted a qualified 401(k) profit sharing plan (the “401(k) Plan”) for the benefit of our employees. Employees are eligible to participate in the 401(k) Plan the month following hire and may defer up to the maximum allowed under IRS regulations, on an annual basis. We match 25 percent of an employee’s deferral amount, up to a
F-22
REVA Medical, Inc.
Notes to Consolidated Financial Statements (unaudited)
maximum of four percent of qualified compensation. We may, at our discretion, make additional contributions. Employees are immediately vested in the employer matching contributions. Our contributions to the 401(k) Plan were $45,000, $49,000, and $42,000 for the years ended December 31, 2017, 2016, and 2015, respectively.
|
15. Related Parties |
Our related parties include the members of our board of directors, investors with five percent or more of our outstanding shares of common stock, and holders of our convertible notes. Other than approved board compensation, the amendment to the 2014 Notes, issuance of the 2017 Notes and warrants and exercise of warrants to purchase common stock (all discussed above), we had no related party transactions during the years ended December 31, 2017 and 2016. See Note 7 Convertible Notes Payable and Warrants to Purchase Common Stock.
|
16. Selected Quarterly Financial Information |
The following table presents selected quarterly financial information that has been derived from our unaudited quarterly consolidated financial statements, which, in the opinion of management, include all adjustments (consisting only of normal recurring items) necessary for a fair presentation. The quarterly per share data presented below was calculated separately and may not sum to the annual figures presented in the consolidated financial statements. These operating results are also not necessarily indicative of results for any future period.
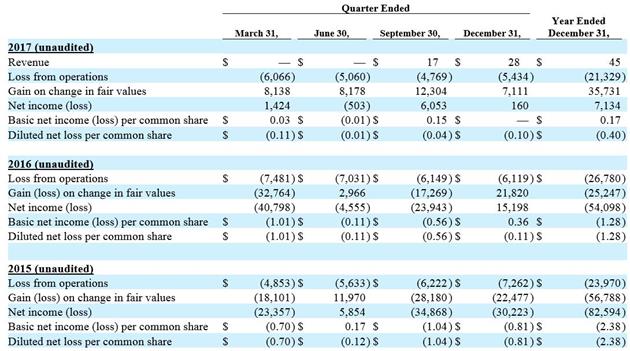
Quarter Ended
March 31, June 30, September 30, December 31, Year Ended
December 31,
2017 (unaudited)
Revenue $ — $ — $ 17 $ 28 $ 45
Loss from operations (6,066 ) (5,060 ) (4,769 ) (5,434 ) (21,329 )
Gain on change in fair values 8,138 8,178 12,304 7,111 35,731
Net income (loss) 1,424 (503 ) 6,053 160 7,134
Basic net income (loss) per common share $ 0.03 $ (0.01 ) $ 0.15 $ — $ 0.17
Diluted net loss per common share $ (0.11 ) $ (0.01 ) $ (0.04 ) $ (0.10 ) $ (0.40 )
2016 (unaudited)
Loss from operations $ (7,481 ) $ (7,031 ) $ (6,149 ) $ (6,119 ) $ (26,780 )
Gain (loss) on change in fair values (32,764 ) 2,966 (17,269 ) 21,820 (25,247 )
Net income (loss) (40,798 ) (4,555 ) (23,943 ) 15,198 (54,098 )
Basic net income (loss) per common share $ (1.01 ) $ (0.11 ) $ (0.56 ) $ 0.36 $ (1.28 )
Diluted net loss per common share $ (1.01 ) $ (0.11 ) $ (0.56 ) $ (0.11 ) $ (1.28 )
2015 (unaudited)
Loss from operations $ (4,853 ) $ (5,633 ) $ (6,222 ) $ (7,262 ) $ (23,970 )
Gain (loss) on change in fair values (18,101 ) 11,970 (28,180 ) (22,477 ) (56,788 )
Net income (loss) (23,357 ) 5,854 (34,868 ) (30,223 ) (82,594 )
Basic net income (loss) per common share $ (0.70 ) $ 0.17 $ (1.04 ) $ (0.81 ) $ (2.38 )
Diluted net loss per common share $ (0.70 ) $ (0.12 ) $ (1.04 ) $ (0.81 ) $ (2.38 )
For the quarterly periods provided above, when the Company recognized net income, diluted net loss per share is computed by dividing the net loss attributable to common stockholders by the weighted average number of common share equivalents outstanding for the period determined using the treasury-stock method and the if-converted method, as applicable. For purpose of this calculation, common stock options and restricted stock subject to forfeiture are considered to be common stock equivalents; common share equivalents are included in the calculation of diluted net loss per share only when their effect is dilutive.
F-23
REVA Medical, Inc.
Notes to Consolidated Financial Statements (unaudited)
Basic net income per share reconciles to fully diluted net loss per share as follows (dollars in thousands):
|
|
Quarter Ended |
|
|||||||||||||||||
|
|
March 31, 2017 |
|
|
September 30, 2017 |
|
|
December 31, 2017 |
|
|
December 31, 2016 |
|
|
June 30, 2015 |
|
|||||
|
Diluted Net Loss: |
|
|
|
|
|
|
|
|
|
|
|
|
|
|
|
|
|
|
|
|
Net income used for basic net income per share |
$ |
1,424 |
|
|
$ |
6,053 |
|
|
$ |
160 |
|
|
$ |
15,198 |
|
|
$ |
5,854 |
|
|
Interest expense on 2014 convertible notes payable |
|
538 |
|
|
|
550 |
|
|
|
571 |
|
|
|
531 |
|
|
|
470 |
|
|
Gain on change in fair value of 2014 convertible notes payable |
|
(8,138 |
) |
|
|
(8,741 |
) |
|
|
(6,213 |
) |
|
|
(21,820 |
) |
|
|
(11,970 |
) |
|
|
$ |
(6,176 |
) |
|
$ |
(2,138 |
) |
|
$ |
(5,482 |
) |
|
$ |
(6,091 |
) |
|
$ |
(5,646 |
) |
|
Weighted Average Shares Used to Compute Diluted Net Loss per Share: |
|
|
|
|
|
|
|
|
|
|
|
|
|
|
|
|
|
|
|
|
Shares used for basic net income per share |
|
42,838,158 |
|
|
|
41,197,348 |
|
|
|
41,245,820 |
|
|
|
42,747,769 |
|
|
|
33,561,959 |
|
|
Common share equivalents |
|
11,506,156 |
|
|
|
11,506,156 |
|
|
|
11,506,156 |
|
|
|
11,506,156 |
|
|
|
15,494,933 |
|
|
|
|
54,344,314 |
|
|
|
52,703,504 |
|
|
|
52,751,976 |
|
|
|
54,253,925 |
|
|
|
49,056,892 |
|
F-24