Attached files
| file | filename |
|---|---|
| 8-K - 8-K - VEREIT, Inc. | verq42017investorreview8-k.htm |

1
Investor Review
Q4 2017
Exhibit 99.1

2
About the Data
INVESTOR REVIEW
This data and other information described herein are as of and for the three months ended December 31, 2017, unless otherwise
indicated. Future performance may not be consistent with past performance and is subject to change and inherent risks and
uncertainties. This information should be read in conjunction with the financial statements and the Management's Discussion and
Analysis of Financial Condition and Results of Operations sections contained in VEREIT, Inc.'s (the "Company", "VEREIT", "us", "our"
and "we") Annual Report on Form 10-K for the year ended December 31, 2017. Effective January 1, 2017, the Company determined
certain non-GAAP measures and operating metrics, which include portfolio metrics, should exclude the impact of properties
owned by the Company for the month beginning with the date that (i) the properties' related mortgage loan is in default and (ii)
management decides to transfer the properties to the lender in connection with settling the mortgage note obligation, and
ending with the disposition date, to better reflect the ongoing operations of the Company. The Company did not update data
presented for periods prior to March 31, 2017, and the three months then ended, as the impact on non-GAAP measures, including
AFFO and Normalized EBITDA, and operating metrics was immaterial. See the definitions section for a description of the Excluded
Properties.
Tenants, Trademarks and Logos
VEREIT is not affiliated with, is not endorsed by, does not endorse and is not sponsored by or a sponsor of the products or services
pictured or mentioned. The names, logos and all related product and service names, design marks and slogans are the trademarks
or service marks of their respective companies.
All data is as of December 31, 2017 and based on Annualized Rental Income (“ARI”), unless otherwise noted.
For definitions and reconciliations of the Company's non-GAAP measures and operating metrics, please view the Definitions &
Reconciliations section of this presentation.
www.VEREIT.com | NYSE: VER | © 2018 VEREIT, Inc.

3
Forward-Looking Statements
INVESTOR REVIEW
Information set forth herein (including information included or incorporated by reference herein) contains “forward-looking
statements” (within the meaning of Section 27A of the Securities Act of 1933, as amended, and Section 21E of the Securities
Exchange Act of 1934, as amended), which reflect VEREIT’s expectations regarding future events and VEREIT's future financial
condition, results of operations and business. The forward-looking statements involve a number of assumptions, risks, uncertainties
and other factors that could cause actual results to differ materially from those contained in the forward-looking statements.
Generally, the words “expects,” “anticipates,”“assumes,” “targets,” “goals,” “projects,” “intends,” “plans,” “believes,” “seeks,”
“estimates,” and variations of such words similar expressions identify forward-looking statements. These forward-looking
statements are subject to a number of risks, uncertainties and assumptions, most of which are difficult to predict and many of
which are beyond VEREIT’s control. If a change occurs, VEREIT’s business, financial condition, liquidity and results of operations may
vary materially from those expressed in the forward-looking statements.
The following factors, among others, could cause actual results to differ from those set forth in the forward-looking statements:
VEREIT’s plans, market and other expectations, objectives, intentions and other statements that are not historical facts; the
developments disclosed herein; VEREIT’s ability to execute on and realize success from its business plan; VEREIT’s ability to meet
its 2018 guidance; the unpredictability of the business plans and financial condition of VEREIT's tenants; the impact of impairment
charges in respect of certain of VEREIT's properties or other assets; risks associated with pending government investigations and
litigations related to VEREIT's previously disclosed audit committee investigation; the ability to retain or hire key personnel; and
continuation or deterioration of current market conditions. Additional factors that may affect future results are contained in VEREIT’s
filings with the U.S. Securities and Exchange Commission (the SEC), which are available at the SEC’s website at www.sec.gov. VEREIT
disclaims any obligation to publicly update or revise any forward-looking statements, whether as a result of changes in underlying
assumptions or factors, new information, future events or otherwise, except as required by law.
www.VEREIT.com | NYSE: VER | © 2018 VEREIT, Inc.
4
Contents
INVESTOR REVIEW
Company Overview 5
Portfolio Metrics & Analysis 11
Key Financial Highlights 23
Highlights & Guidance 27
Contact Information 30
Definitions & Reconciliations 31
www.VEREIT.com | NYSE: VER | © 2018 VEREIT, Inc.
‹#›
DRA
F
T
a
Company Overview
Q4 2017
6
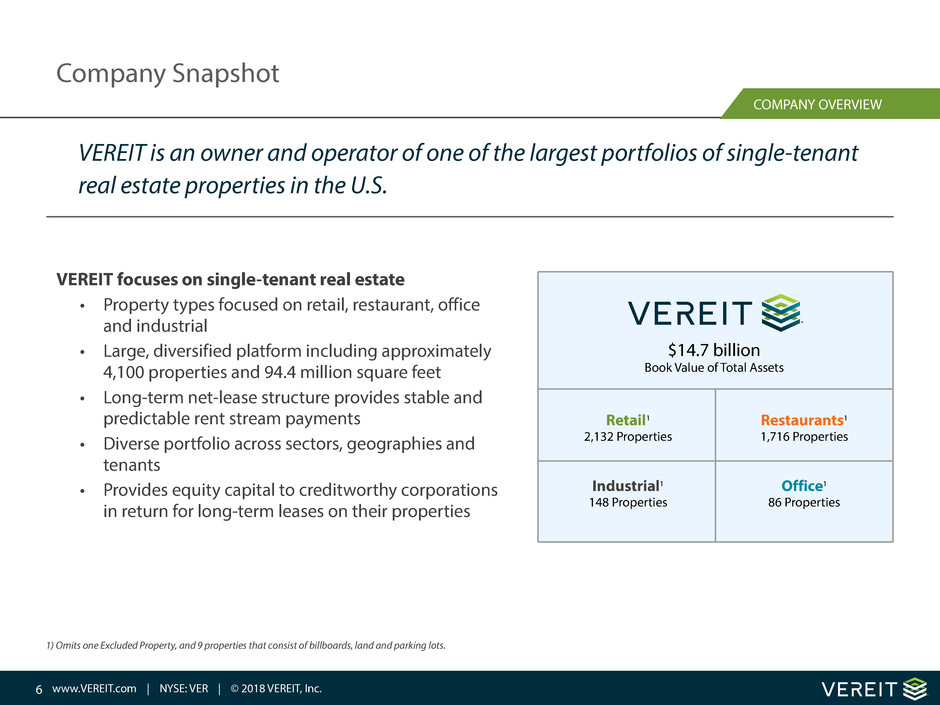
VEREIT focuses on single-tenant real estate
• Property types focused on retail, restaurant, office
and industrial
• Large, diversified platform including approximately
4,100 properties and 94.4 million square feet
• Long-term net-lease structure provides stable and
predictable rent stream payments
• Diverse portfolio across sectors, geographies and
tenants
• Provides equity capital to creditworthy corporations
in return for long-term leases on their properties
VEREIT is an owner and operator of one of the largest portfolios of single-tenant
real estate properties in the U.S.
www.VEREIT.com | NYSE: VER | © 2018 VEREIT, Inc.
COMPANY OVERVIEW
Company Snapshot
$14.7 billion
Book Value of Total Assets
Retail1
2,132 Properties
Industrial1
148 Properties
Restaurants1
1,716 Properties
Office1
86 Properties
1) Omits one Excluded Property, and 9 properties that consist of billboards, land and parking lots.
7
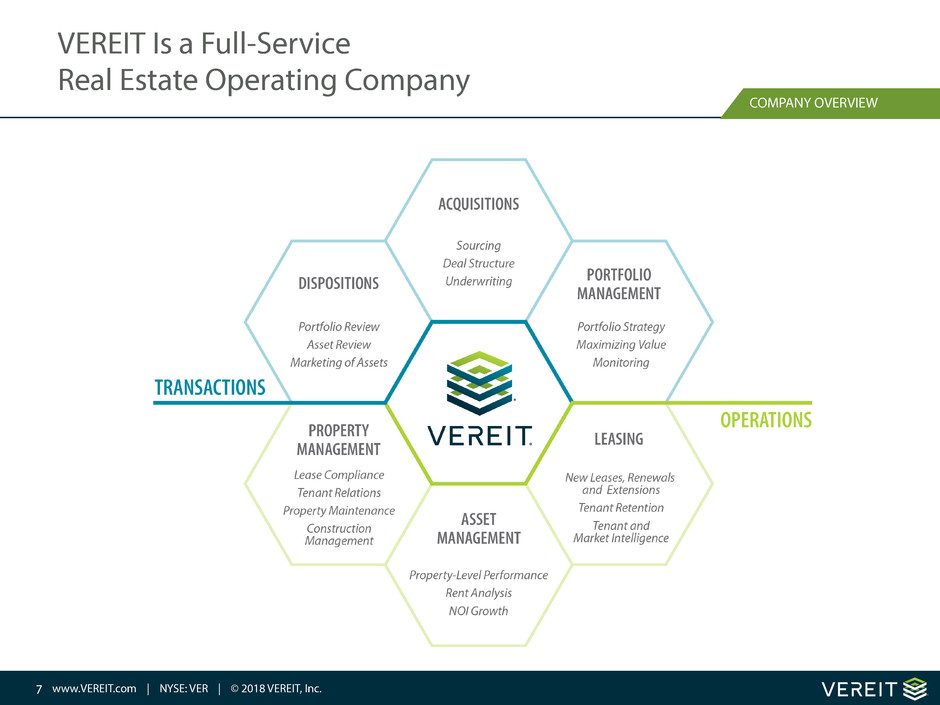
VEREIT Is a Full-Service
Real Estate Operating Company
COMPANY OVERVIEW
www.VEREIT.com | NYSE: VER | © 2018 VEREIT, Inc.

8
VEREIT has established best-in-class corporate governance through the
reconstitution of its Board of Directors and implementing the policies below
www.VEREIT.com | NYSE: VER | © 2018 VEREIT, Inc.
COMPANY OVERVIEW
Corporate Governance
Board of Directors Corporate Governance
• Opted-out of Maryland anti-takeover statutes
• Majority voting for uncontested director elections
• Stockholder rights plan limits
• Proxy access
• Clawback policy for the potential recoupment of officer
compensation
• Hugh R. Frater - Non-Executive Chairman of VEREIT, Inc.
◦ Former Chairman and CEO, Berkadia
• Glenn J. Rufrano - Director
◦ Chief Executive Officer, VEREIT, Inc.
• David B. Henry - Independent Director
◦ Former Vice Chairman and CEO, Kimco Realty Corporation
• Mary Hogan Preusse - Independent Director
◦ Former Managing Director and Co-Head of Americas Real
Estate APG Asset Management US
• Richard J. Lieb - Independent Director
◦ Managing Director and Chairman of Real Estate Greenhill &
Co., LLC
• Mark S. Ordan - Independent Director
◦ Chief Executive Officer, Quality Care Properties, Inc.
• Eugene A. Pinover - Independent Director
◦ Partner and Chair of Real Estate Practice, DLA Piper
• Julie G. Richardson - Independent Director
◦ Former Partner and Managing Director, Providence Equity
Partners

9
VEREIT Has a Best-in-Class Management Team
Glenn J. Rufrano
Chief Executive Officer
• Since assuming role of CEO on April 1, 2015, has reconstituted Board of
Directors, formalized new management team and implemented
business plan to guide the Company’s strategy
• Prior to VEREIT, was Chairman and CEO of O’Connor Capital Partners, a
real estate investment firm he co-founded in 1983
• From 2010 to 2013 was President and CEO of Cushman & Wakefield
• Previously held executive leadership roles at Centro Properties Group
and New Plan Excel Realty Trust
• Serves on Board of Ventas and previously served on Boards of General
Growth Properties and Trizec Properties
• Oversees the Company’s legal and regulatory affairs, compliance and risk
management
• Prior to joining VEREIT, served as EVP, General Counsel and the Chief
Compliance Officer for Revlon, the global cosmetics company, where she was
responsible for legal and regulatory affairs, served on senior operating
committee and oversaw corporate governance
• Previously served as SVP - Law for MacAndrews & Forbes, Inc., Assistant United
States Attorney for the Southern District of New York, and as an associate with
Stillman & Friedman P.C. and Fried, Frank, Harris, Shriver & Jacobson LLP
• Law degree from Columbia Law School and undergraduate degree from the
Wharton School, University of Pennsylvania
• Oversees the accounting, external reporting, financial planning & analysis,
treasury and IT functions at VEREIT
• Prior to joining VEREIT, served as EVP and CFO of Cushman & Wakefield
from 2012 to 2015
• Prior to Cushman, was CFO for EXOR, Inc., a leading European investment
company from 1991 to 2012, where he was involved in over 15 U.S.
acquisitions and divestitures ranging in size from $20mm to $700+mm
• Served on Board of Directors of Cushman & Wakefield
• Responsible for VEREIT’s asset management, property
management, construction management, underwriting, credit
analysis and leasing
• Also serves on VEREIT investment committee, which reviews each
asset to ensure alignment with the Company’s objectives
• Previously was founder of CapLease (NYSE:LSE), a net-lease REIT,
where he served as CEO from 2001-2014 and Chairman from
2007-2014
• Oversees VEREIT’s real estate transaction activities for single-tenant
retail, office and industrial and anchored shopping centers
including acquisitions, sale-leaseback transactions, build-to-suits
and dispositions
• Previously served as President and CEO of Opus West Corporation
from 1993 to 2009, where he was responsible for design,
construction and development of more than 50 million square feet
of commercial real estate
• Served as VP, Real Estate Development for Koll Company prior to
Opus West
Michael J. Bartolotta
Executive Vice President and Chief Financial Officer
Lauren Goldberg
Executive Vice President, General Counsel and Secretary
Paul McDowell
Executive Vice President and Chief Operating Officer
Thomas W. Roberts
Executive Vice President and Chief Investment Officer
COMPANY OVERVIEW
www.VEREIT.com | NYSE: VER | © 2018 VEREIT, Inc.

10 www.VEREIT.com | NYSE: VER | © 2018 VEREIT, Inc.
COMPANY OVERVIEW
Key Accomplishments
Since April 2015, VEREIT has successfully implemented its business plan, enhanced its portfolio,
de-levered its balance sheet and achieved investment-grade ratings
• Glenn Rufrano was hired as CEO April 1,
2015
• Appointed Deloitte & Touche LLP as
VEREIT’s independent registered public
accountant
• Completed $1.4 billion of dispositions;
Achieved $0.84 AFFO per diluted share;
Reduced debt by $2.4 billion; Created
$1.8 billion of capacity on revolving line
of credit; Reduced Net Debt to
Normalized EBITDA from 7.5x to 7.0x
• Remediated all material weaknesses
that existed as of December 31, 2014
• Completed $1.14 billion of dispositions and
$100.2 million of acquisitions; Achieved
AFFO of $0.78 per diluted share; Reduced
debt by $1.7 billion; Reduced Net Debt to
Normalized EBITDA from 7.0x to 5.7x
• Raised approximately $702.5 million in
public offering of common stock to further
reduce debt
• Issued $1.0 billion of senior notes allowing
the Company to refinance February 2017
bonds
• S&P raised its rating of VEREIT's corporate
debt to 'BBB-'
• Received an investment grade rating of
‘BBB-’ with a stable outlook from Fitch
Ratings
• Completed $745.6 million of acquisitions
and $574.9 million of dispositions;
Achieved $0.74 AFFO per diluted share,
including $0.70 from continuing
operations; Reduced secured debt by $580
million; Net Debt to Normalized EBITDA
ended at 5.7x
• Received Investment Grade Corporate
Ratings from S&P, Moody’s and Fitch
remained at Investment Grade
• Simplified Business: Announced sale of
Cole Capital; in connection with the
transaction, VEREIT may receive up to $200
million, comprised of approximately $120
million cash paid at closing under the
purchase agreement and up to $80
million in fees to be paid under a six-year
services agreement based on Cole's future
revenues (transaction closed on February 1,
2018)
‹#›
DRA
F
T
a
Portfolio Metrics & Analysis
Q4 2017

12
Key Portfolio Metrics
PORTFOLIO
Operating Properties 4,091
Total square feet (in millions) 94.4
Annualized Rental Income $1.2 Billion
Economic Occupancy Rate 98.8%
WALT (years) 9.5
Investment Grade 1 39.6%
Number of tenants 651
Number of industries 43
Number of states 2 49
Top 10 tenant concentration 28.3%
Gross Real Estate Investments $14.7 Billion
1) Investment-grade tenants are those with an S&P credit rating of BBB- or higher or a Moody's credit rating of Baa3 or higher. The ratings may reflect those assigned by S&P or Moody's to the lease
guarantor or the parent company, as applicable. 2) The Company’s properties are also located in Puerto Rico (3 properties) and Canada (1 property). 3) Restaurant category includes Casual Dining (13.8%)
and Quick Service (8.9%).
Retail: 41.2%
Restaurant: 22.4%
Industrial: 16.8%
Office: 19.6%
Portfolio Property Type
Lease Expiration (Annualized Rental Income Expiring as a % of Total Portfolio)
20
18
20
19
20
20
20
21
20
22
20
23
20
24
20
25
20
26
20
27
2.3%
3.9% 3.7%
7.3% 7.0%
6.5%
9.1%
5.2%
7.3%
9.0%
3
www.VEREIT.com | NYSE: VER | © 2018 VEREIT, Inc.
As of 12/31/2017
13
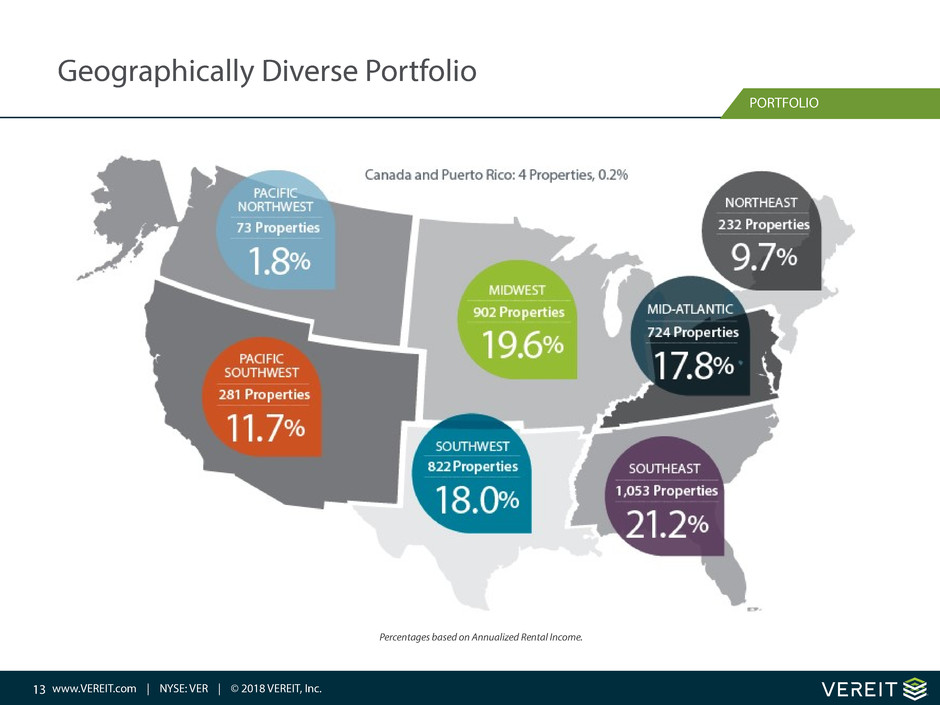
Geographically Diverse Portfolio
PORTFOLIO
www.VEREIT.com | NYSE: VER | © 2018 VEREIT, Inc.
Percentages based on Annualized Rental Income.

14
Portfolio Diversification by Tenant
PORTFOLIO
1) Bold indicates investment grade. Ratings may reflect those of the
tenant, guarantor or a related parent company.
Tenant Group % ARI Public /Private Ratings1
Red Lobster 6.5% Private B-
Walgreens 3.3% Public BBB
Family Dollar 3.2% Public BB+
Dollar General 3.0% Public BBB
CVS 2.7% Public BBB+
FedEx 2.6% Public BBB
Albertson's 2.0% Private B+
BJ's Wholesale Club 1.7% Private B-
Citizens Bank 1.7% Public A-
L.A. Fitness 1.6% Private B+
Petsmart 1.6% Private CCC+
Goodyear 1.4% Public BB
Tractor Supply 1.4% Public NR
Amazon 1.2% Public AA-
Advance Auto Parts 1.0% Public BBB-
Home Depot 1.0% Public A
Lowe's 1.0% Public A-
General Service
Administration 1.0% Private AA+
Merrill Lynch 1.0% Private A+
AON 0.9% Public A-
Bed Bath & Beyond 0.9% Public BBB
Rite Aid 0.9% Public B
Bloomin' Brands 0.8% Public BB
Best Buy 0.8% Public BBB-
Bass Pro Shops
(Cabela's)
0.8% Private B+
Tenant Group % ARI Public /Private Ratings1
Northrop Grumman 0.8% Public BBB+
Academy Sports 0.8% Private CCC+
Stripes 0.7% Private NR
Wal-Mart 0.7% Public AA
Border Holdings, LLC 0.7% Private NR
Bi-Lo, LLC 0.7% Private CCC-
Healthnow 0.7% Private BBB
Apple American Group, LLC 0.7% Private NR
Talbots 0.6% Private B-
GMRI, Inc 0.6% Public BBB
Wendab Associates 0.6% Private NR
Kohl's 0.6% Public BBB-
Golden Corral 0.6% Private NR
RSA Security 0.6% Private BB+
Sun Trust Bank 0.6% Public A-
TJ Maxx 0.6% Public A+
Rubbermaid 0.6% Public BBB-
General Mills 0.6% Public BBB+
Hanesbrands 0.5% Public BB
Rolls-Royce 0.5% Public NR
ConAgra Foods 0.5% Public BBB
Cigna 0.5% Public A
Mattress Firm 0.5% Private NR
Art Van Furniture 0.5% Private NR
DaVita Dialysis 0.5% Public BB
• VEREIT owns and actively manages a
diversified credit portfolio of net-lease real
estate assets primarily comprised of
single-tenant properties
• 50 tenants individually represent 0.5% or
greater of ARI, comprising 59.3% of the
total portfolio. The remaining 601 tenants
comprise 40.7% of the portfolio
• 25 of the 50 tenants are investment-grade
rated
• 30 of the 50 tenants are public companies
www.VEREIT.com | NYSE: VER | © 2018 VEREIT, Inc.
15
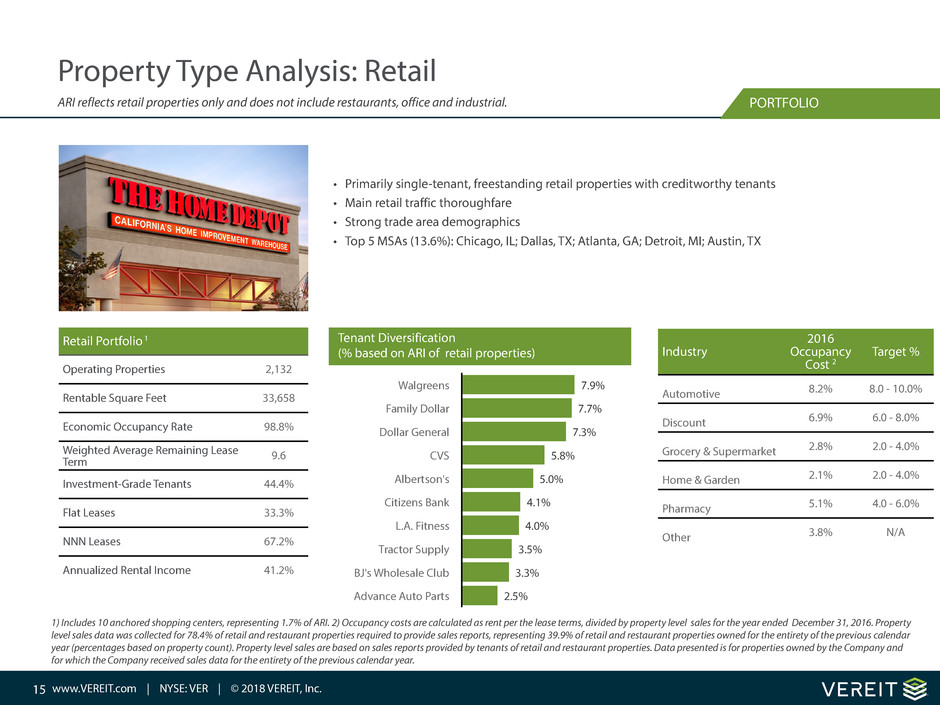
Property Type Analysis: Retail
1) Includes 10 anchored shopping centers, representing 1.7% of ARI. 2) Occupancy costs are calculated as rent per the lease terms, divided by property level sales for the year ended December 31, 2016. Property
level sales data was collected for 78.4% of retail and restaurant properties required to provide sales reports, representing 39.9% of retail and restaurant properties owned for the entirety of the previous calendar
year (percentages based on property count). Property level sales are based on sales reports provided by tenants of retail and restaurant properties. Data presented is for properties owned by the Company and
for which the Company received sales data for the entirety of the previous calendar year.
Retail Portfolio 1
Operating Properties 2,132
Rentable Square Feet 33,658
Economic Occupancy Rate 98.8%
Weighted Average Remaining Lease
Term 9.6
Investment-Grade Tenants 44.4%
Flat Leases 33.3%
NNN Leases 67.2%
Annualized Rental Income 41.2%
• Primarily single-tenant, freestanding retail properties with creditworthy tenants
• Main retail traffic thoroughfare
• Strong trade area demographics
• Top 5 MSAs (13.6%): Chicago, IL; Dallas, TX; Atlanta, GA; Detroit, MI; Austin, TX
Walgreens
Family Dollar
Dollar General
CVS
Albertson's
Citizens Bank
L.A. Fitness
Tractor Supply
BJ's Wholesale Club
Advance Auto Parts
7.9%
7.7%
7.3%
5.8%
5.0%
4.1%
4.0%
3.5%
3.3%
2.5%
PORTFOLIO
Industry
2016
Occupancy
Cost 2
Target %
Automotive 8.2% 8.0 - 10.0%
Discount 6.9% 6.0 - 8.0%
Grocery & Supermarket 2.8% 2.0 - 4.0%
Home & Garden 2.1% 2.0 - 4.0%
Pharmacy 5.1% 4.0 - 6.0%
Other 3.8% N/A
Tenant Diversification
(% based on ARI of retail properties)
www.VEREIT.com | NYSE: VER | © 2018 VEREIT, Inc.
ARI reflects retail properties only and does not include restaurants, office and industrial.

16
Property Type Analysis: Retail
PORTFOLIO
Size, Diversity and Single Tenant Focus Protects Against Disruptors
VEREIT's strategy of well-positioned single tenant properties in a diversified portfolio - made
optimum by our size - helps protect against a variety of cyclical and secular disruptors. In today's
retail environment, one of the key disruptors is the evolution of e-commerce. Retailers who
embrace e-commerce and have the resources to implement omnichannel distribution are
proving successful. Fundamentals of retail should not be forgotten. Those who continue to
provide true retail value - merchandise, price and service - will also thrive.
The core retail merchandise groups within our portfolio are dominated by discount; pharmacy;
grocery; home and garden and convenience. A full listing is provided herein. Within each
category, our focus is to create a portfolio that can both service omnichannel distribution while
always considering the consumer experience.
Ultimate credit protection is a function of multi-layer diversification. The prior pages present
information such as geographies, weighted average lease term and tenant margin analysis. The
following breakdown provides a deeper look into the retail tenant diversification of the VEREIT
portfolio by merchandise category.
VEREIT's Single-Tenant Retail Advantages
• Dominated by off-price and necessity shopping; only 0.3% of income is derived from Apparel &
Jewelry, far less than other retail formats
• Approximately 64% of retail revenue derived from public companies
• Credit tenants on long-term leases with substantial capital investment (44.4% investment grade)
• Generally, no use restrictions or co-tenancy issues
• Ability to target desired tenants and industries
Diversified Retail Portfolio
Industry Group % ARI
Retail - Discount 7.6%
Retail - Pharmacy 6.6%
Retail - Grocery & Supermarket 4.3%
Retail - Home & Garden 3.1%
Finance 2.9%
Retail - Gas & Convenience 2.5%
Retail - Motor Vehicle 2.2%
Retail - Sporting Goods 2.0%
Entertainment & Recreation 1.8%
Retail - Warehouse Clubs 1.6%
Retail - Home Furnishings 1.2%
Retail - Medical Services 1.0%
Retail - Pet Supply 0.9%
Retail - Department Stores 0.7%
Retail - Electronics & Appliances 0.6%
Rental 0.5%
Retail - Specialty (Other) 0.4%
Retail - Hobby, Books & Music 0.4%
Retail - Apparel & Jewelry 0.3%
All Other 1 0.6%
Total 41.2%
1) Includes 12 industries that each represent 0.2% or less.
www.VEREIT.com | NYSE: VER | © 2018 VEREIT, Inc.
ARI reflects retail properties only and does not include restaurants, office and industrial.

17
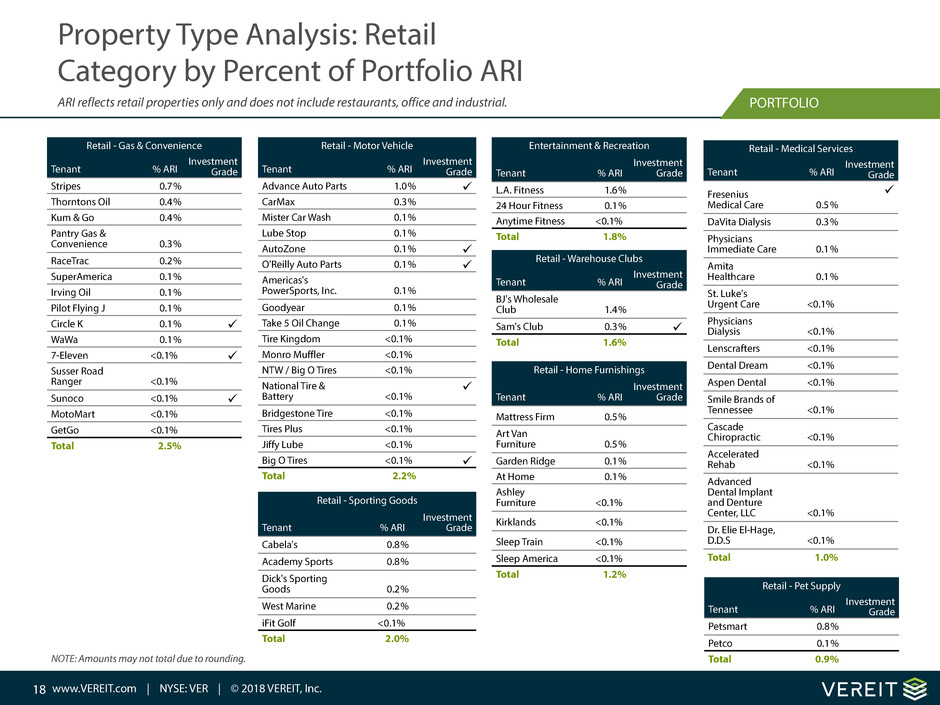
Property Type Analysis: Retail
Category by Percent of Portfolio ARI
PORTFOLIO
Retail - Discount
Tenant % ARI
Investment
Grade
Family Dollar 3.2%
Dollar General 3.0% ü
Wal-Mart 0.7% ü
Dollar Tree 0.2%
Ross 0.2% ü
TJ Maxx 0.1% ü
Marshall's 0.1% ü
Five Below <0.1%
Cost Plus <0.1% ü
Gabe's <0.1%
Big Lots <0.1% ü
Savers <0.1%
Shopko
Hometown <0.1%
Total 7.6%
Retail - Pharmacy
Tenant % ARI InvestmentGrade
Walgreens 3.3% ü
CVS 2.4% ü
Rite Aid 0.9%
Total 6.6%
Retail - Grocery & Supermarket
Tenant % ARI
Investment
Grade
Albertson's 2.0%
Kroger 0.4% ü
Giant Eagle 0.2%
Harps Grocery 0.2%
Dahl's 0.2%
Natural Grocers 0.1%
Koninklijke
Ahold 0.1%
ü
Bi-Lo, LLC 0.1%
Publix 0.1%
Stop & Shop 0.1% ü
Trader Joe's 0.1%
Whole Foods 0.1% ü
Food Lion 0.1% ü
Family Fare
Supermarket 0.1%
Sprouts 0.1%
Fresh Thyme
Farmers Market 0.1%
Glen's Market <0.1%
Price Rite <0.1%
The Fresh
Market <0.1%
Hy-Vee <0.1%
Harris Teeter <0.1% ü
Food 4 Less <0.1% ü
Apple Market <0.1%
Safeway Stores <0.1%
Total 4.3%
Retail - Home & Garden
Tenant % ARI
Investment
Grade
Tractor Supply 1.4%
Lowe's 1.0% ü
Home Depot 0.4% ü
Bed Bath &
Beyond 0.1%
ü
Floor & Décor 0.1%
Pier 1 Imports <0.1%
Sherwin-
Williams <0.1%
ü
Northern Tool &
Equipment <0.1%
Lumber
Liquidators <0.1%
Leslie's Pool &
Spa <0.1%
Total 3.1%
Finance
Tenant % ARI
Investment
Grade
Citizens Bank 1.7% ü
Sun Trust Bank 0.6% ü
US Bank 0.2% ü
PLS Check Cashers 0.2%
Sovereign Bank <0.1% ü
Bank of America <0.1% ü
Synovus Bank <0.1%
PNC Bank <0.1% ü
Community Bank <0.1%
Fifth Third Bank <0.1% ü
First Bank <0.1%
Huntington
National Bank <0.1%
ü
Region's Bank <0.1% ü
Key Bank <0.1% ü
Travis Credit
Union <0.1%
TCF National Bank <0.1% ü
Wells Fargo <0.1% ü
Scottrade <0.1%
TitleMax of
Georgia, Inc. <0.1%
Cashland <0.1%
Edward Jones <0.1%
Chase Bank <0.1% ü
Accomplishments
Through People <0.1%
Total 2.9%
NOTE: Amounts may not total due to rounding.
www.VEREIT.com | NYSE: VER | © 2018 VEREIT, Inc.
ARI reflects retail properties only and does not include restaurants, office and industrial.
18
Property Type Analysis: Retail
Category by Percent of Portfolio ARI
PORTFOLIO
Retail - Gas & Convenience
Tenant % ARI
Investment
Grade
Stripes 0.7%
Thorntons Oil 0.4%
Kum & Go 0.4%
Pantry Gas &
Convenience 0.3%
RaceTrac 0.2%
SuperAmerica 0.1%
Irving Oil 0.1%
Pilot Flying J 0.1%
Circle K 0.1% ü
WaWa 0.1%
7-Eleven <0.1% ü
Susser Road
Ranger <0.1%
Sunoco <0.1% ü
MotoMart <0.1%
GetGo <0.1%
Total 2.5%
Retail - Motor Vehicle
Tenant % ARI
Investment
Grade
Advance Auto Parts 1.0% ü
CarMax 0.3%
Mister Car Wash 0.1%
Lube Stop 0.1%
AutoZone 0.1% ü
O'Reilly Auto Parts 0.1% ü
Americas's
PowerSports, Inc. 0.1%
Goodyear 0.1%
Take 5 Oil Change 0.1%
Tire Kingdom <0.1%
Monro Muffler <0.1%
NTW / Big O Tires <0.1%
National Tire &
Battery <0.1%
ü
Bridgestone Tire <0.1%
Tires Plus <0.1%
Jiffy Lube <0.1%
Big O Tires <0.1% ü
Total 2.2%
Retail - Warehouse Clubs
Tenant % ARI
Investment
Grade
BJ's Wholesale
Club 1.4%
Sam's Club 0.3% ü
Total 1.6%
Entertainment & Recreation
Tenant % ARI
Investment
Grade
L.A. Fitness 1.6%
24 Hour Fitness 0.1%
Anytime Fitness <0.1%
Total 1.8%
Retail - Sporting Goods
Tenant % ARI
Investment
Grade
Cabela's 0.8%
Academy Sports 0.8%
Dick's Sporting
Goods 0.2%
West Marine 0.2%
iFit Golf <0.1%
Total 2.0%
Retail - Medical Services
Tenant % ARI
Investment
Grade
Fresenius
Medical Care 0.5%
ü
DaVita Dialysis 0.3%
Physicians
Immediate Care 0.1%
Amita
Healthcare 0.1%
St. Luke's
Urgent Care <0.1%
Physicians
Dialysis <0.1%
Lenscrafters <0.1%
Dental Dream <0.1%
Aspen Dental <0.1%
Smile Brands of
Tennessee <0.1%
Cascade
Chiropractic <0.1%
Accelerated
Rehab <0.1%
Advanced
Dental Implant
and Denture
Center, LLC <0.1%
Dr. Elie El-Hage,
D.D.S <0.1%
Total 1.0%
Retail - Pet Supply
Tenant % ARI
Investment
Grade
Petsmart 0.8%
Petco 0.1%
Total 0.9%
www.VEREIT.com | NYSE: VER | © 2018 VEREIT, Inc.
Retail - Home Furnishings
Tenant % ARI
Investment
Grade
Mattress Firm 0.5%
Art Van
Furniture 0.5%
Garden Ridge 0.1%
At Home 0.1%
Ashley
Furniture <0.1%
Kirklands <0.1%
Sleep Train <0.1%
Sleep America <0.1%
Total 1.2%
NOTE: Amounts may not total due to rounding.
ARI reflects retail properties only and does not include restaurants, office and industrial.
19
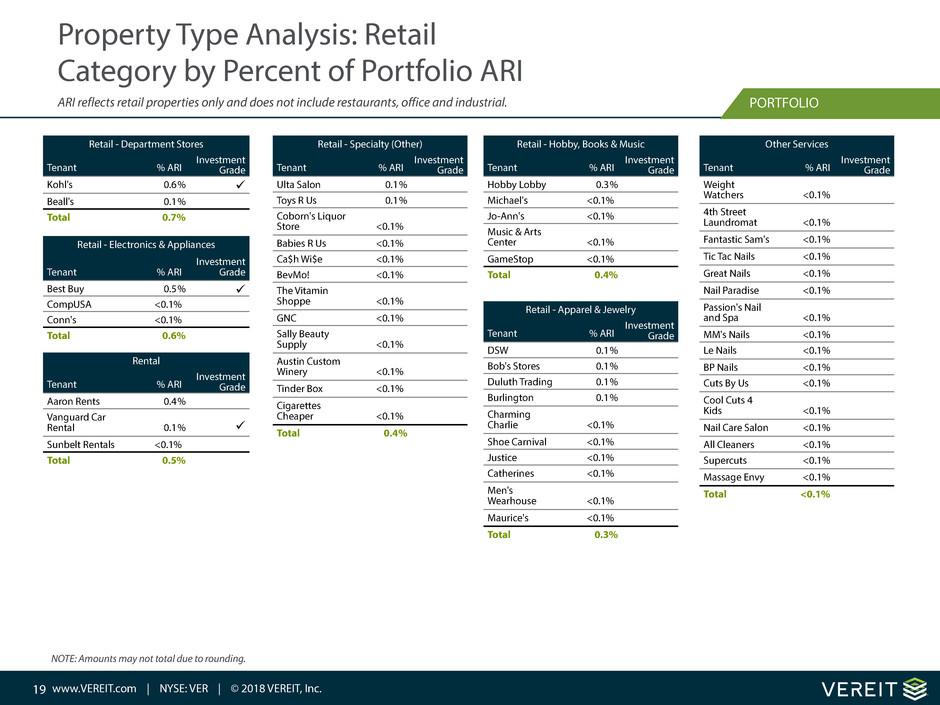
Property Type Analysis: Retail
Category by Percent of Portfolio ARI
PORTFOLIO
Rental
Tenant % ARI
Investment
Grade
Aaron Rents 0.4%
Vanguard Car
Rental 0.1% ü
Sunbelt Rentals <0.1%
Total 0.5%
Retail - Specialty (Other)
Tenant % ARI
Investment
Grade
Ulta Salon 0.1%
Toys R Us 0.1%
Coborn's Liquor
Store <0.1%
Babies R Us <0.1%
Ca$h Wi$e <0.1%
BevMo! <0.1%
The Vitamin
Shoppe <0.1%
GNC <0.1%
Sally Beauty
Supply <0.1%
Austin Custom
Winery <0.1%
Tinder Box <0.1%
Cigarettes
Cheaper <0.1%
Total 0.4%
Retail - Hobby, Books & Music
Tenant % ARI
Investment
Grade
Hobby Lobby 0.3%
Michael's <0.1%
Jo-Ann's <0.1%
Music & Arts
Center <0.1%
GameStop <0.1%
Total 0.4%
Retail - Apparel & Jewelry
Tenant % ARI
Investment
Grade
DSW 0.1%
Bob's Stores 0.1%
Duluth Trading 0.1%
Burlington 0.1%
Charming
Charlie <0.1%
Shoe Carnival <0.1%
Justice <0.1%
Catherines <0.1%
Men's
Wearhouse <0.1%
Maurice's <0.1%
Total 0.3%
Other Services
Tenant % ARI
Investment
Grade
Weight
Watchers <0.1%
4th Street
Laundromat <0.1%
Fantastic Sam's <0.1%
Tic Tac Nails <0.1%
Great Nails <0.1%
Nail Paradise <0.1%
Passion's Nail
and Spa <0.1%
MM's Nails <0.1%
Le Nails <0.1%
BP Nails <0.1%
Cuts By Us <0.1%
Cool Cuts 4
Kids <0.1%
Nail Care Salon <0.1%
All Cleaners <0.1%
Supercuts <0.1%
Massage Envy <0.1%
Total <0.1%
Retail - Department Stores
Tenant % ARI
Investment
Grade
Kohl's 0.6% ü
Beall's 0.1%
Total 0.7%
www.VEREIT.com | NYSE: VER | © 2018 VEREIT, Inc.
Retail - Electronics & Appliances
Tenant % ARI
Investment
Grade
Best Buy 0.5% ü
CompUSA <0.1%
Conn's <0.1%
Total 0.6%
NOTE: Amounts may not total due to rounding.
ARI reflects retail properties only and does not include restaurants, office and industrial.

20
Property Type Analysis: Restaurants
1) Occupancy costs are calculated as rent per the lease terms, divided by property level sales for the year ended December 31, 2016. Property level sales data was collected for 78.4% of retail and restaurant
properties required to provide sales reports, representing 39.9% of retail and restaurant properties owned for the entirety of the previous calendar year (percentages based on property count). Property level sales
are based on sales reports provided by tenants of retail and restaurant properties. Data presented is for properties owned by the Company and for which the Company received sales data for the entirety of the
previous calendar year.
Restaurant Portfolio
Operating Properties 1,716
Rentable Square Feet 8,219
Economic Occupancy Rate 94.3%
Weighted Average Remaining Lease
Term 13.0
Investment-Grade Tenants 2.9%
Flat Leases 7.6%
NNN Leases 99.4%
Annualized Rental Income 22.4%
• Single-tenant quick service, casual and family dining properties
• Creditworthy tenants, including franchisors, operating strong national and regional brands
• Main retail traffic thoroughfare
• Strong trade area demographics
• Top 5 MSAs (13.2%): Atlanta, GA; Dallas, TX; Chicago, IL; Tampa, FL; Detroit, MI
• According to Nation's Restaurant News - which publishes the top industry brands based on
system-wide sales - 86% of our casual dining tenants and 79% of our quick service restaurants
are ranked in the top 25 of their respective category.
Red Lobster
Bloomin' Brands
Border Holdings, LLC
Apple American Group, LLC
GMRI, Inc
Wendab Associates
Golden Corral
Neighborhood Restaurant
Partners Florida, LLC
Cracker Barrel
DineEquity Inc.
29.1%
3.5%
3.2%
2.9%
2.8%
2.8%
2.8%
2.2%
2.0%
2.0%
PORTFOLIO
Industry
2016
Occupancy
Cost 1
Target %
Casual Dining 6.6% 6.75 - 8.0%
Quick Service 7.1% 7.5 - 8.5%
Tenant Diversification
(% based on ARI of restaurant properties)
www.VEREIT.com | NYSE: VER | © 2018 VEREIT, Inc.

21
Property Type Analysis: Industrial
Industrial Portfolio
Operating Properties 148
Rentable Square Feet 39,588
Economic Occupancy Rate 100.0%
Weighted Average Remaining Lease Term 8.4
Investment-Grade Tenants 54.8%
Flat Leases 21.5%
NNN Leases 54.9%
Annualized Rental Income 16.8%
• Property types include single-tenant distribution and warehouse facilities with
creditworthy tenants
• Essential and strategic locations with 87% dedicated to distribution or
warehousing
• Close proximity to ports railways, major freeways and/or interstate highways
• Top 5 MSAs (22.7%): Jacksonville, FL; New York, NY; Philadelphia, PA; Columbia,
SC; Stockton, CA
FedEx
Goodyear
Amazon
Bed Bath & Beyond
Winn-Dixie
Rubbermaid
General Mills
Hanesbrands
TJ Maxx
Tiffany & Co.
15.4%
8.1%
7.3%
5.0%
4.2%
3.5%
3.4%
3.2%
3.0%
2.8%
PORTFOLIO
Tenant Diversification
(% based on ARI of industrial properties)
www.VEREIT.com | NYSE: VER | © 2018 VEREIT, Inc.

22
Property Type Analysis: Office
Office Portfolio
Operating Properties 86
Rentable Square Feet 12,953
Economic Occupancy Rate 98.2%
Weighted Average Remaining Lease Term 6.2
Investment-Grade Tenants 58.2%
Flat Leases 10.2%
NNN Leases 22.0%
Annualized Rental Income 19.6%
• Property types include single-tenant corporate headquarters and
mission-critical business operations with creditworthy tenants
• Strategic location with 33% serving as corporate headquarters and 67%
focused on corporate operations
• Strong 10-mile demographics and local business environment
• Top 5 MSAs (35.7%): Chicago, IL; Dallas, TX; Boston, MA; Washington, DC;
Trenton, NJ
General Service Administration
Merrill Lynch
AON
Northrop Grumman
Petsmart
Healthnow
RSA Security
Rolls-Royce
Cigna
Exelis
5.0%
4.9%
4.8%
4.0%
3.9%
3.5%
3.1%
2.7%
2.6%
2.4%
PORTFOLIO
Tenant Diversification (% based on ARI of office properties)
www.VEREIT.com | NYSE: VER | © 2018 VEREIT, Inc.
‹#›
DRA
F
T
a
Key Financial Highlights
Q4 2017

24
Enhanced Balance Sheet and Credit Metrics
Credit Metric Summary 12/31/2017
Adjusted Debt Outstanding ($bn) 6.1
Net Debt to Normalized EBITDA Annualized 5.65x
Fixed Charge Coverage Ratio 3.10x
Interest Coverage Ratio 4.11x
Net Debt Leverage Ratio 39.0%
Unencumbered Asset Ratio 72.8%
Secured Debt Ratio 13.2%
Total Unencumbered Assets ($bn) 11.3
KEY FINANCIALS
www.VEREIT.com | NYSE: VER | © 2018 VEREIT, Inc.

25
Capital Structure Overview
KEY FINANCIALSShares and dollars in thousands, expect per share values
Capitalization Capitalization Table
Wtd. Avg.
Maturity
(Years)
Rate (1) December 31,2017
Diluted Shares and Units Outstanding 999,740
Stock Price 7.79
Implied Equity Market Capitalization $ 7,787,975
Series F Perpetual Preferred (2) 6.70% $ 1,070,853
Total Secured Debt (3) 4.1 4.88% $ 2,054,838
Revolving credit facility 0.5 3.38% $ 185,000
2018 Convertible Notes 0.6 3.00% 597,500
2019 Corporate Bonds 1.1 3.00% 750,000
2020 Convertible Notes 3.0 3.75% 402,500
2021 Corporate Bonds 3.4 4.13% 400,000
2024 Corporate Bonds 6.1 4.60% 500,000
2026 Corporate Bonds 8.4 4.88% 600,000
2027 Corporate Bonds 9.6 3.95% 600,000
Total Unsecured Debt 4.4 3.82% $ 4,035,000
Total Adjusted Debt Outstanding 4.3 4.18% $ 6,089,838
Total Capitalization $ 14,948,666
Less: Cash and Cash Equivalents 34,176
Less: Cash and cash equivalents related to
discontinued operations 2,198
Enterprise Value $ 14,912,292
Net Debt / Enterprise Value 40.6%
Net Debt / Normalized EBITDA Annualized (4) 5.65x
Net Debt + Preferred / Normalized EBITDA Annualized (4) 6.65x
Fixed Charge Coverage Ratio 3.10x
Liquidity (5) $ 2,151,374
1) Weighted-average interest rate for variable rate debt represents the interest rate in effect as of December 31, 2017. 2)
Balance represents 42.8 million shares outstanding at December 31, 2017 multiplied by the liquidation preference of $25 per
share. 3) Omits one mortgage note payable secured by an Excluded Property with Debt Outstanding of $16.2 million and an
interest rate of 9.48%. 4) Normalized EBITDA Annualized includes continuing and discontinued operations. 5) Liquidity
represents cash and cash equivalents of $36.4 million, including those related to discontinued operations of $2.2 million ,
and $2.1 billion available capacity on our revolving credit facility.
Common Equity 52.2%
Corporate Bonds 19.1%
Secured Debt 13.6%
Preferred Equity 7.2%
Convertible Notes 6.7%
Revolving Credit Facility 1.2%
Fixed Rate 95.4%
Swapped to Fixed Rate 1.3%
Variable Rate 3.3%
www.VEREIT.com | NYSE: VER | © 2018 VEREIT, Inc.
12/31/2017

26
Mortgage Notes Payable (1) Unsecured Credit Facility (2) Corporate Bonds Convertible Notes
$2,500
$2,000
$1,500
$1,000
$500
$0
2018 2019 2020 2021 2022 2023 2024 2025 2026 2027 Thereafter
$315
$145
$1 $3
$973
$753
$1,165
$601 $601
$865
$668
Debt Maturity Profile
Dollars in millions
• Weighted average debt term is 4.3 years
• Weighted average interest rate is 4.18%
1) Omits one mortgage note payable secured by an Excluded Property with Debt Outstanding of $16.2 million and an interest rate of 9.48%.
2) One-year extension option on 6/30/2018 unsecured credit facility is available at the Company's election, subject to no existing default, an extension fee and other customary provisions.
25%
20%
15%
10%
5%
0%
2018 2019 2020 2021 2022 2023 2024 2025 2026 2027 Thereafter
14.2%
16.0%
11.0% 12.4%
5.2%
2.4%
19.1%
—%
9.9% 9.8%
—%
KEY FINANCIALS
www.VEREIT.com | NYSE: VER | © 2018 VEREIT, Inc.
‹#›
DRA
F
T
a
Highlights & Guidance
Q4 2017

28
VEREIT continues to strengthen its portfolio through acquisitions, dispositions and portfolio
management; improves its balance sheet and debt maturity schedule with 10-year bond issuance
completed in August; simplifies and focuses business model with the sale of Cole Capital
HIGHLIGHTS & GUIDANCE
2017 Highlights
• Net income of $32.4 million and net loss per diluted share of $(0.04), including net income of $51.5 million
and a net loss per diluted share of $(0.02) for continuing operations
• Achieved $0.74 AFFO per diluted share, including $0.70 from continuing operations
• Completed $745.6 million of acquisitions and $574.9 million of dispositions
• Decreased Debt from $6.4 billion to $6.1 billion; Net Debt remained at $6.1 billion, or 39.0% Net Debt to
Gross Real Estate Investments
• Net Debt to Normalized EBITDA ended at 5.7x
• Issued $600.0 million of senior notes to repay borrowings under the $500.0 million term loan with the
remaining proceeds used to pay down secured debt
• Received Investment Grade Corporate Ratings from S&P1; Moody’s and Fitch remained at Investment
Grade
• Announced sale of Cole Capital, simplifying the business model
www.VEREIT.com | NYSE: VER | © 2018 VEREIT, Inc.
1) S&P had previously rated the Company's bonds investment grade.

29
2018 Guidance
HIGHLIGHTS & GUIDANCEConsolidated Adjusted Funds From Operations per Diluted Share (Unaudited)
Key Guidance Assumptions:
• AFFO per diluted share guidance range between $0.70 and $0.72
• Dispositions totaling $300 million to $500 million at an average cash cap rate of 6.5% to 7.5% and acquisitions of $200
million to $300 million in excess of dispositions within the same cap rate range
• Acquisitions will be funded through a combination of internal equity, debt capacity within our Net Debt to Normalized
EBITDA target, and proceeds from the sale of Cole Capital
• Real estate operations:
◦ Average occupancy above 98.0%
◦ Same-store rental growth in a range of 0.3% to 1.0%
• The Company also expects to target balance sheet net debt to normalized EBITDA at approximately 6.0x
2018 Per Share
Low High
Diluted net income per share attributable to common stockholders (1) $ — $ 0.01
Depreciation and amortization of real estate assets 0.64 0.65
FFO attributable to common stockholders and limited partners per diluted share 0.64 0.66
Adjustments (2) 0.06 0.06
AFFO attributable to common stockholders and limited partners per diluted share $ 0.70 $ 0.72
Notes: The estimated net income per diluted share is not a projection and is provided solely to satisfy the disclosure requirements of the U.S. Securities and Exchange Commission.
(1) Includes impact of dividends to be paid to preferred shareholders and excludes the effect of non-controlling interests and the impacts of discontinued operations, impairments
and gains or losses on the extinguishment of debt and sale of real estate.
(2) Includes (i) non-routine items such as acquisition-related costs, litigation and other non-routine costs, net of insurance recoveries, gains or losses on sale of investment
securities or mortgage note receivables, legal settlements and insurance recoveries not in the ordinary course of business, (ii) certain non-cash items such as impairments of
goodwill, straight-line rent, net of bad debt expense related to straight-line rent, net direct financing lease adjustments, gains or losses on derivatives, gains or losses on the
extinguishment or forgiveness of debt, reserves for loan loss, equity-based compensation and amortization of intangible assets, deferred financing costs, premiums and discounts
on debt and investments, above-market lease assets and below-market lease liabilities and (iii) the AFFO impact of Excluded Properties and related non-recourse mortgage notes.
www.VEREIT.com | NYSE: VER | © 2018 VEREIT, Inc.
30
Toll Free
800.606.3610
Phoenix
2325 East Camelback Road
Suite 1100
Phoenix, AZ 85016
602.778.6000
New York City
5 Bryant Park
23rd Floor
New York, NY 10018
212.413.9100
Investor Relations
877.405.2653
InvestorRelations@VEREIT.com
Contact Us
CONTACT
Registered Stockholders
Computershare (Transfer Agent)
P.O. Box 43078
Providence, RI 02940
By overnight delivery
Computershare
250 Royal Street
Canton, MA 02021
Telephone inquiries
TFN 855.866.0787
(US, CA, Puerto Rico)
TN 781.575.3100
(non-US)
Email
web.queries@computershare.com
Follow Us
LinkedIn
www.linkedin.com/company/vereit
Twitter
twitter.com/vereitinc
YouTube
https://www.youtube.com/channel/
UCUNu7AUOolITuwpNhr2JEGg
Flickr
https://www.flickr.com/
photos/143027056@N07/
www.VEREIT.com | NYSE: VER | © 2018 VEREIT, Inc.
‹#›
DRA
F
T
a
Definitions & Reconciliations
Q4 2017

32
Definitions
INVESTOR REVIEW
Annualized Rental Income is rental revenue under our leases on Operating Properties on
a straight-line basis, which includes the effect of rent escalations and any tenant concessions,
such as free rent, and excludes any bad debt allowances and any contingent rent, such as
percentage rent. Management uses Annualized Rental Income as a basis for tenant, industry
and geographic concentrations and other metrics within the portfolio. Annualized Rental
Income is not indicative of future performance.
Debt Outstanding and Adjusted Debt Outstanding are non-GAAP measures that
represent the Company's outstanding principal debt balance, excluding certain GAAP
adjustments, such as premiums and discounts, financing and issuance costs, and related
accumulated amortization. Beginning in 2017, Adjusted Debt Outstanding omits the
outstanding principal balance of mortgage notes secured by Excluded Properties. We
believe that the presentation of Debt Outstanding and Adjusted Debt Outstanding, which
show our contractual debt obligations, provides useful information to investors to assess
our overall liquidity, financial flexibility, capital structure and leverage. Debt Outstanding
and Adjusted Debt Outstanding should not be considered as alternatives to the Company's
consolidated debt balance as determined in accordance with GAAP or any other GAAP
financial measures and should only be considered together with, and as a supplement to,
the Company's financial information prepared in accordance with GAAP.
EBITDA and Normalized EBITDA Normalized EBITDA, as disclosed, represents EBITDA, or
earnings before interest, taxes, depreciation and amortization, modified to exclude non-
routine items such as acquisition-related expenses, litigation, merger and other non-routine
transactions costs, net of insurance recoveries, gains or losses on disposition of real estate,
held for sale loss on discontinued operations, gains or losses on sale of investment securities
or mortgage notes receivable and legal settlements and insurance recoveries not in the
ordinary course of business. We also exclude certain non-cash items such as impairments
of goodwill and real estate and intangible assets, straight-line rental revenue, gains or losses
on derivatives, gains or losses on the extinguishment or forgiveness of debt, write-off of
program development costs, and amortization of intangibles, above-market lease assets
and below-market lease liabilities.
Beginning in 2017, Normalized EBITDA omits the Normalized EBITDA impact of Excluded
Properties. Management believes that excluding these costs from EBITDA provides investors
with supplemental performance information that is consistent with the performance
models and analysis used by management, and provides investors a view of the
performance of our portfolio over time.
Therefore, Normalized EBITDA should not be considered as an alternative to net income,
as computed in accordance with GAAP, or as an indicator of the Company's financial
performance. The Company uses Normalized EBITDA as one measure of its operating
performance when formulating corporate goals and evaluating the effectiveness of the
Company's strategies. Normalized EBITDA may not be comparable to similarly titled
measures of other companies.
Economic Occupancy Rate equals the sum of square feet leased (including month-to-
month agreements) divided by Rentable Square Feet.
Excluded Properties are properties for which (i) the related mortgage loan is in default,
and (ii) management decides to transfer the properties to the lender in connection with
settling the mortgage note obligation.
Excluded Properties during the three months ended and at March 31, 2017, were one
vacant office property and one vacant industrial property, comprising an aggregate
of 578,000 square feet with aggregate Debt Outstanding of $41.8 million. Excluded
Properties during the three months ended June 30, 2017, were two vacant office
properties and five industrial properties, two of which were vacant. Excluded
Properties at June 30, 2017, and during the three months ended September 30, 2017,
were two vacant office properties and one vacant industrial property, comprising an
aggregate 991,000 square feet with aggregate Debt Outstanding of $83.9 million. At
September 30, 2017 and December 31, 2017, the Excluded Property was one vacant
industrial property, comprising 307,275 square feet with Debt Outstanding of $16.2
million.
Fixed Charge Coverage Ratio is the sum of (i) Interest Expense, excluding non-cash
amortization, (ii) secured debt principal amortization on Adjusted Debt Outstanding
and (iii) dividends attributable to preferred shares divided by Normalized EBITDA.
Management believes that Fixed Charge Coverage Ratio is a useful supplemental
measure of our ability to satisfy fixed financing obligations.
www.VEREIT.com | NYSE: VER | © 2018 VEREIT, Inc.

33
Definitions
INVESTOR REVIEW
Funds from Operations ("FFO") and Adjusted Funds from Operations ("AFFO"): Due
to certain unique operating characteristics of real estate companies, as discussed below,
the National Association of Real Estate Investment Trusts, Inc. ("NAREIT"), an industry
trade group, has promulgated a supplemental performance measure known as FFO,
which we believe to be an appropriate supplemental performance measure to reflect the
operating performance of a REIT. FFO is not equivalent to our net income or loss as
determined under GAAP.
NAREIT defines FFO as net income or loss computed in accordance with GAAP, excluding
gains or losses from disposition of property, depreciation and amortization of real estate
assets and impairment write-downs on depreciable real estate including the pro rata share
of adjustments for unconsolidated partnerships and joint ventures. We calculated FFO in
accordance with NAREIT's definition described above.
In addition to FFO, we use AFFO as a non-GAAP supplemental financial performance
measure to evaluate the operating performance of the Company. AFFO, as defined by the
Company, excludes from FFO non-routine items such as acquisition-related expenses,
litigation, merger and other non-routine costs, net of insurance recoveries, held for sale loss
on discontinued operations, gains or losses on sale of investment securities or mortgage
notes receivable and legal settlements and insurance recoveries not in the ordinary course
of business. We also exclude certain non-cash items such as impairments of goodwill and
intangible assets, straight-line rent, net of bad debt expense related to straight line rent, net
direct financing lease adjustments, gains or losses on derivatives, reserves for loan loss,
gains or losses on the extinguishment or forgiveness of debt, non-current portion of the tax
benefit or expense, equity-based compensation and amortization of intangible assets,
deferred financing costs, premiums and discounts on debt and investments, above-market
lease assets and below-market lease liabilities
Effective January 1, 2017, we determined to omit the impact of the Excluded Properties and
related non-recourse mortgage notes from FFO to calculate AFFO. We did not adjust AFFO
during the years prior to January 1, 2017 as the impact was immaterial. Management
believes that excluding these costs from FFO provides investors with supplemental
performance information that is consistent with the performance models and analysis used
by management, and provides investors a view of the performance of our portfolio over
time. AFFO allows for a comparison of the performance of our operations with other
publicly-traded REITs, as AFFO, or an equivalent measure, is routinely reported by publicly-
traded REITs, and we believe often used by analysts and investors for comparison purposes.
For all of these reasons, we believe FFO and AFFO, in addition to net income (loss), as defined
by GAAP, are helpful supplemental performance measures and useful in understanding the
various ways in which our management evaluates the performance of the Company over
time. However, not all REITs calculate FFO and AFFO the same way, so comparisons with
other REITs may not be meaningful. FFO and AFFO should not be considered as alternatives
to net income (loss) and are not intended to be used as a liquidity measure indicative of
cash flow available to fund our cash needs. Neither the SEC, NAREIT, nor any other regulatory
body has evaluated the acceptability of the exclusions used to adjust FFO in order to
calculate AFFO and its use as a non-GAAP financial performance measure.
Gross Real Estate Investments represent total gross real estate and related assets of
Operating Properties, including net investments in unconsolidated entities, investment in
direct financing leases, investment securities backed by real estate and loans held for
investment, net of gross intangible lease liabilities.
www.VEREIT.com | NYSE: VER | © 2018 VEREIT, Inc.

34
Definitions
INVESTOR REVIEW
Interest Coverage Ratio equals Normalized EBITDA divided by Interest Expense, excluding
non-cash amortization. Management believes that Interest Coverage Ratio is a useful
supplemental measure of our ability to service our debt obligations.
Interest Expense, excluding non-cash amortization is a non-GAAP measure that
represents interest expense incurred on the outstanding principal balance of our debt. This
measure excludes (i) the amortization of deferred financing costs, premiums and discounts,
which is included in interest expense in accordance with GAAP, and (ii)the impact of
Excluded Properties and related non-recourse mortgage notes. We believe that the
presentation of Interest Expense, excluding non-cash amortization, which shows the
interest expense on our contractual debt obligations, provides useful information to
investors to assess our overall solvency and financial flexibility. Interest Expense, excluding
non-cash amortization should not be considered as an alternative to the Company's interest
expense as determined in accordance with GAAP or any other GAAP financial measures and
should only be considered together with and as a supplement to the Company's financial
information prepared in accordance with GAAP.
Net Debt is a non-GAAP measure used to show the Company's Adjusted Debt Outstanding,
less all cash and cash equivalents, including those related to discontinued operations. We
believe that the presentation of Net Debt provides useful information to investors because
our management reviews Net Debt as part of its management of our overall liquidity,
financial flexibility, capital structure and leverage.
Net Debt Leverage Ratio equals Net Debt divided by Gross Real Estate Investments. We
believe that the presentation of Net Debt Leverage Ratio provides useful information to
investors because our management reviews Net Debt Leverage Ratio as part of its
management of our overall liquidity, financial flexibility, capital structure and leverage.
Net Debt to Normalized EBITDA Annualized equals Net Debt divided by the current
quarter Normalized EBITDA multiplied by four. We believe that the presentation of Net Debt
to Normalized EBITDA Annualized provides useful information to investors because our
management reviews Net Debt to Normalized EBITDA Annualized as part of its management
of our overall liquidity, financial flexibility, capital structure and leverage.
Normalized EBITDA Annualized equals Normalized EBITDA, for the respective quarter,
multiplied by four.
Operating Properties refers to all properties owned by the Company and beginning in
2017, it omits Excluded Properties owned by the Company as of the reporting date.
Rentable Square Feet is leasable square feet of Operating Properties.
Secured Debt Ratio equals secured Adjusted Debt Outstanding divided by Adjusted Debt
Outstanding.
Unencumbered Asset Ratio equals unencumbered Gross Real Estate Investments divided
by Gross Real Estate Investments. Management believes that Unencumbered Asset Ratio is
a useful supplemental measure of our overall liquidity and leverage.
Weighted Average Remaining Lease Term is the number of years remaining on each
respective lease, weighted based on Annualized Rental Income of Operating Properties.
www.VEREIT.com | NYSE: VER | © 2018 VEREIT, Inc.
35
Reconciliations
(dollars in thousands)
INVESTOR REVIEW
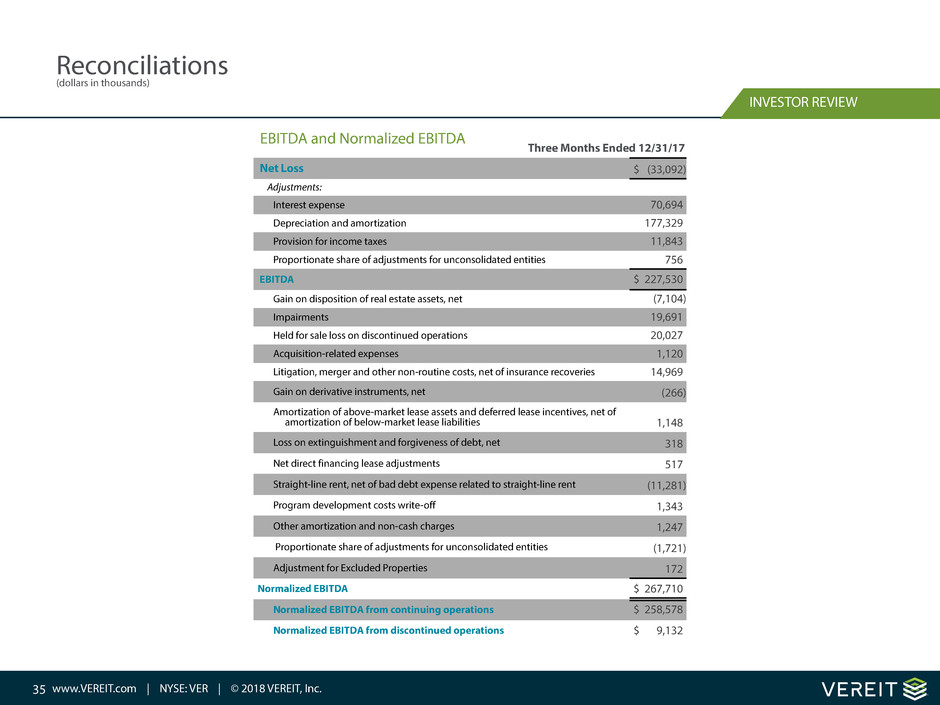
Net Loss $ (33,092)
Adjustments:
Interest expense 70,694
Depreciation and amortization 177,329
Provision for income taxes 11,843
Proportionate share of adjustments for unconsolidated entities 756
EBITDA $ 227,530
Gain on disposition of real estate assets, net (7,104)
Impairments 19,691
Held for sale loss on discontinued operations 20,027
Acquisition-related expenses 1,120
Litigation, merger and other non-routine costs, net of insurance recoveries 14,969
Gain on derivative instruments, net (266)
Amortization of above-market lease assets and deferred lease incentives, net of
amortization of below-market lease liabilities 1,148
Loss on extinguishment and forgiveness of debt, net 318
Net direct financing lease adjustments 517
Straight-line rent, net of bad debt expense related to straight-line rent (11,281)
Program development costs write-off 1,343
Other amortization and non-cash charges 1,247
Proportionate share of adjustments for unconsolidated entities (1,721)
Adjustment for Excluded Properties 172
Normalized EBITDA $ 267,710
Normalized EBITDA from continuing operations $ 258,578
Normalized EBITDA from discontinued operations $ 9,132
EBITDA and Normalized EBITDA
Three Months Ended 12/31/17
www.VEREIT.com | NYSE: VER | © 2018 VEREIT, Inc.
36
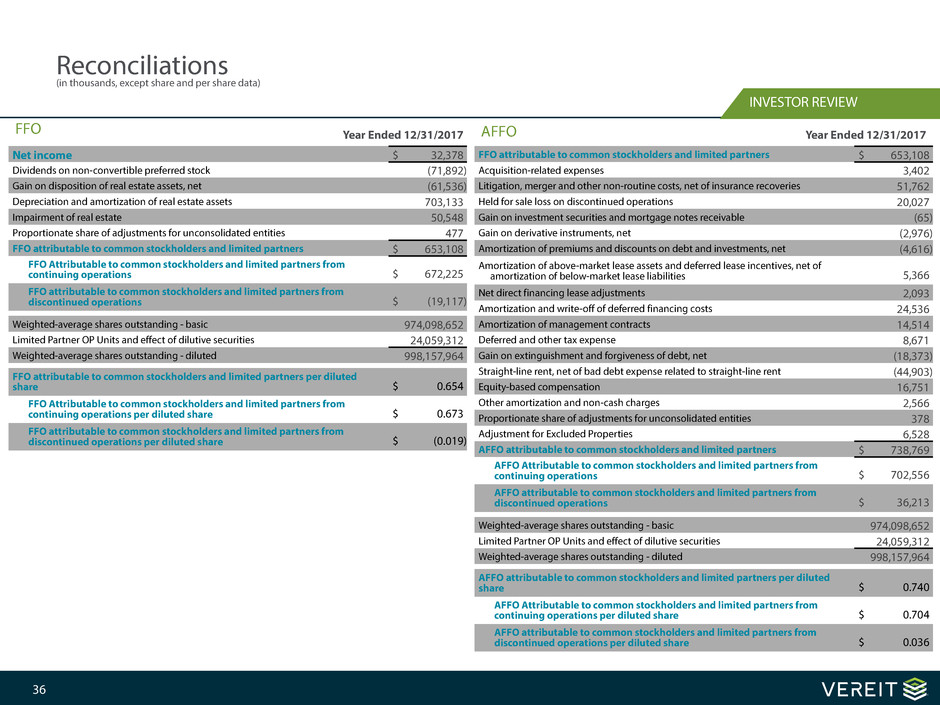
FFO attributable to common stockholders and limited partners $ 653,108
Acquisition-related expenses 3,402
Litigation, merger and other non-routine costs, net of insurance recoveries 51,762
Held for sale loss on discontinued operations 20,027
Gain on investment securities and mortgage notes receivable (65)
Gain on derivative instruments, net (2,976)
Amortization of premiums and discounts on debt and investments, net (4,616)
Amortization of above-market lease assets and deferred lease incentives, net of
amortization of below-market lease liabilities 5,366
Net direct financing lease adjustments 2,093
Amortization and write-off of deferred financing costs 24,536
Amortization of management contracts 14,514
Deferred and other tax expense 8,671
Gain on extinguishment and forgiveness of debt, net (18,373)
Straight-line rent, net of bad debt expense related to straight-line rent (44,903)
Equity-based compensation 16,751
Other amortization and non-cash charges 2,566
Proportionate share of adjustments for unconsolidated entities 378
Adjustment for Excluded Properties 6,528
AFFO attributable to common stockholders and limited partners $ 738,769
AFFO Attributable to common stockholders and limited partners from
continuing operations $ 702,556
AFFO attributable to common stockholders and limited partners from
discontinued operations $ 36,213
Weighted-average shares outstanding - basic 974,098,652
Limited Partner OP Units and effect of dilutive securities 24,059,312
Weighted-average shares outstanding - diluted 998,157,964
AFFO attributable to common stockholders and limited partners per diluted
share $ 0.740
AFFO Attributable to common stockholders and limited partners from
continuing operations per diluted share $ 0.704
AFFO attributable to common stockholders and limited partners from
discontinued operations per diluted share $ 0.036
Net income $ 32,378
Dividends on non-convertible preferred stock (71,892)
Gain on disposition of real estate assets, net (61,536)
Depreciation and amortization of real estate assets 703,133
Impairment of real estate 50,548
Proportionate share of adjustments for unconsolidated entities 477
FFO attributable to common stockholders and limited partners $ 653,108
FFO Attributable to common stockholders and limited partners from
continuing operations $ 672,225
FFO attributable to common stockholders and limited partners from
discontinued operations $ (19,117)
Weighted-average shares outstanding - basic 974,098,652
Limited Partner OP Units and effect of dilutive securities 24,059,312
Weighted-average shares outstanding - diluted 998,157,964
FFO attributable to common stockholders and limited partners per diluted
share $ 0.654
FFO Attributable to common stockholders and limited partners from
continuing operations per diluted share $ 0.673
FFO attributable to common stockholders and limited partners from
discontinued operations per diluted share $ (0.019)
FFO Year Ended 12/31/2017 AFFO Year Ended 12/31/2017
INVESTOR REVIEW
Reconciliations
(in thousands, except share and per share data)

37
Reconciliations
(dollars in thousands)
INVESTOR REVIEW
Interest Expense, excluding non-cash amortization $ 65,097
Normalized EBITDA 267,710
Interest Coverage Ratio 4.11x
Interest Expense, excluding non-cash amortization $ 65,097
Secured debt principal amortization 3,257
Dividends attributable to preferred shares 17,973
Total fixed charges 86,327
Normalized EBITDA 267,710
Fixed Charge Coverage Ratio 3.10x
Mortgage notes payable and other debt, net $ 2,082,692
Corporate bonds, net 2,821,494
Convertible debt, net 984,258
Credit facility, net 185,000
Total debt - as reported 6,073,444
Adjustments:
Deferred financing costs, net 48,232
Net premiums (15,638)
Debt Outstanding $ 6,106,038
Debt Outstanding - Excluded Properties (16,200)
Adjusted Debt Outstanding 6,089,838
Interest expense - as reported $ (70,694)
Less Adjustments:
Amortization of deferred financing costs and other non-cash
charges (5,886)
Amortization of net premiums 681
Interest Expense, excluding non-cash amortization - Excluded
Properties (392)
Interest Expense, excluding non-cash amortization $ (65,097)
Debt
Three Months Ended 12/31/17
12/31/17
Interest
Adjusted Debt Outstanding $ 6,089,838
Less: cash and cash equivalents 34,176
Less: cash and cash equivalents related to discontinued
operations 2,198
Net Debt 6,053,464
Normalized EBITDA annualized 1,070,840
Net Debt to Normalized EBITDA annualized ratio 5.65x
Net Debt $ 6,053,464
Gross Real Estate Investments 15,511,683
Net Debt Leverage Ratio 39.0%
Unencumbered Gross Real Estate Investments $ 11,296,918
Gross Real Estate Investments 15,511,683
Unencumbered Asset Ratio 72.8%
Secured Debt Outstanding $ 2,054,838
Gross Real Estate Investments 15,511,683
Secured Debt Ratio 13.2%
Financial and Operations
Statistics and Ratios
Three Months Ended 12/31/17
www.VEREIT.com | NYSE: VER | © 2018 VEREIT, Inc.
