Attached files
| file | filename |
|---|---|
| EX-10.13 - EXHIBIT 10.13 - Morningstar, Inc. | morn_exhibitx1013x12312017.htm |
| EX-32.2 - EXHIBIT 32.2 - Morningstar, Inc. | morn_exhibitx322x12312017.htm |
| EX-32.1 - EXHIBIT 32.1 - Morningstar, Inc. | morn_exhibitx321x12312017.htm |
| EX-31.2 - EXHIBIT 31.2 - Morningstar, Inc. | morn_exhibitx312x12312017.htm |
| EX-31.1 - EXHIBIT 31.1 - Morningstar, Inc. | morn_exhibitx311x12312017.htm |
| EX-23.1 - EXHIBIT 23.1 - Morningstar, Inc. | morn_exhibitx23112312017.htm |
| EX-21.1 - EXHIBIT 21.1 - Morningstar, Inc. | morn_exhibitx211x12312017.htm |
| EX-10.14 - EXHIBIT 10.14 - Morningstar, Inc. | morn_exhibitx1014x12312017.htm |
| EX-10.12 - EXHIBIT 10.12 - Morningstar, Inc. | morn_exhibitx1012x12312017.htm |
UNITED STATES
SECURITIES AND EXCHANGE COMMISSION
Washington D.C. 20549
FORM 10-K | ||||
x | ANNUAL REPORT PURSUANT TO SECTION 13 OR 15(d) OF THE SECURITIES EXCHANGE ACT OF 1934 |
FOR THE FISCAL YEAR ENDED DECEMBER 31, 2017
OR
¨ | TRANSITION REPORT PURSUANT TO SECTION 13 OR 15(d) OF THE SECURITIES EXCHANGE ACT OF 1934 |
For the transition period from to
Commission File Number: 000-51280
MORNINGSTAR, INC.
(Exact Name of Registrant as Specified in its Charter)

Illinois | 36-3297908 | |
(State or Other Jurisdiction of | (I.R.S. Employer | |
Incorporation or Organization) | Identification Number) | |
22 West Washington Street
Chicago, Illinois
60602
(Address of Principal Executive Offices)
(312) 696-6000
(Registrant's Telephone Number, Including Area Code)
Securities registered pursuant to Section 12(b) of the Act:
Title of Each Class | Name of Each Exchange on Which Registered | |
Common stock, no par value | The Nasdaq Stock Market LLC | |
Securities registered pursuant to Section 12(g) of the Act: None
Indicate by check mark if the Registrant is a well-known seasoned issuer, as defined in Rule 405 of the Securities Act. Yes x No ¨
Indicate by check mark if the Registrant is not required to file reports pursuant to Section 13 or Section 15(d) of the Act. Yes ¨ No x
Indicate by check mark whether the Registrant (1) has filed all reports required to be filed by Section 13 or 15(d) of the Securities Exchange Act of 1934 during the preceding 12 months (or for such shorter period that the Registrant was required to file such reports), and (2) has been subject to such filing requirements for the past 90 days. Yes x No ¨
Indicate by check mark whether the registrant has submitted electronically and posted on its corporate Web site, if any, every Interactive Data File required to be submitted and posted pursuant to Rule 405 of Regulation S-T (§232.405 of this chapter) during the preceding 12 months (or for such shorter period that the registrant was required to submit and post such files). Yes x No ¨
Indicate by check mark if disclosure of delinquent filers pursuant to Item 405 of Regulation S-K is not contained herein, and will not be contained, to the best of Registrant's knowledge, in definitive proxy or information statements incorporated by reference in Part III of this Form 10-K or any amendment to this Form 10-K. x
Indicate by check mark whether the registrant is a large accelerated filer, an accelerated filer, a non-accelerated filer, a smaller reporting company, or an emerging growth company. See the definitions of “large accelerated filer,” “accelerated filer,” “smaller reporting company,” and "emerging growth company" in Rule 12b-2 of the Exchange Act.
(Check one):
Large accelerated filer x | Accelerated filer ¨ | Non-accelerated filer ¨ | Smaller reporting company ¨ | Emerging growth company o | ||
(Do not check if a smaller reporting company) | ||||||
If an emerging growth company, indicate by check mark if the registrant has elected not to use the extended transition period for complying with any new or revised financial accounting standards provided pursuant to Section 13(a) of the Exchange Act. o
Indicate by check mark whether the Registrant is a shell company (as defined in Rule 12b-2 of the Exchange Act). Yes ¨ No x
The aggregate market value of shares of common stock held by non-affiliates of the Registrant as of June 30, 2017 was $1.4 billion. As of February 16, 2018, there were 42,498,136 shares of the Registrant's common stock, no par value, outstanding.
DOCUMENTS INCORPORATED BY REFERENCE
Certain parts of the Registrant's Definitive Proxy Statement for the 2018 Annual Meeting of Shareholders are incorporated into Part III of this Form 10-K.
Table of Contents
2
Part I
Item 1. Business
Overview
Morningstar, Inc. is a leading provider of independent investment research in North America, Europe, Australia, and Asia. The company offers an extensive line of products and services for individual investors, financial advisors, asset managers, retirement plan providers and sponsors, and institutional investors in the private capital markets.
We currently serve approximately 255,000 financial advisors, 1,500 asset management firms, 31 retirement plan providers, 285,000 retirement plan sponsors, and 11.9 million individual investors. We also provide data on the private capital markets to approximately 2,700 institutional clients.
Our data and research are core assets that we seek to leverage to build Morningstar's long-term value. Morningstar provides extensive data and research insights on a wide range of investment offerings, including managed investment products, publicly listed companies, fixed income securities, private capital markets, and real-time global market data.
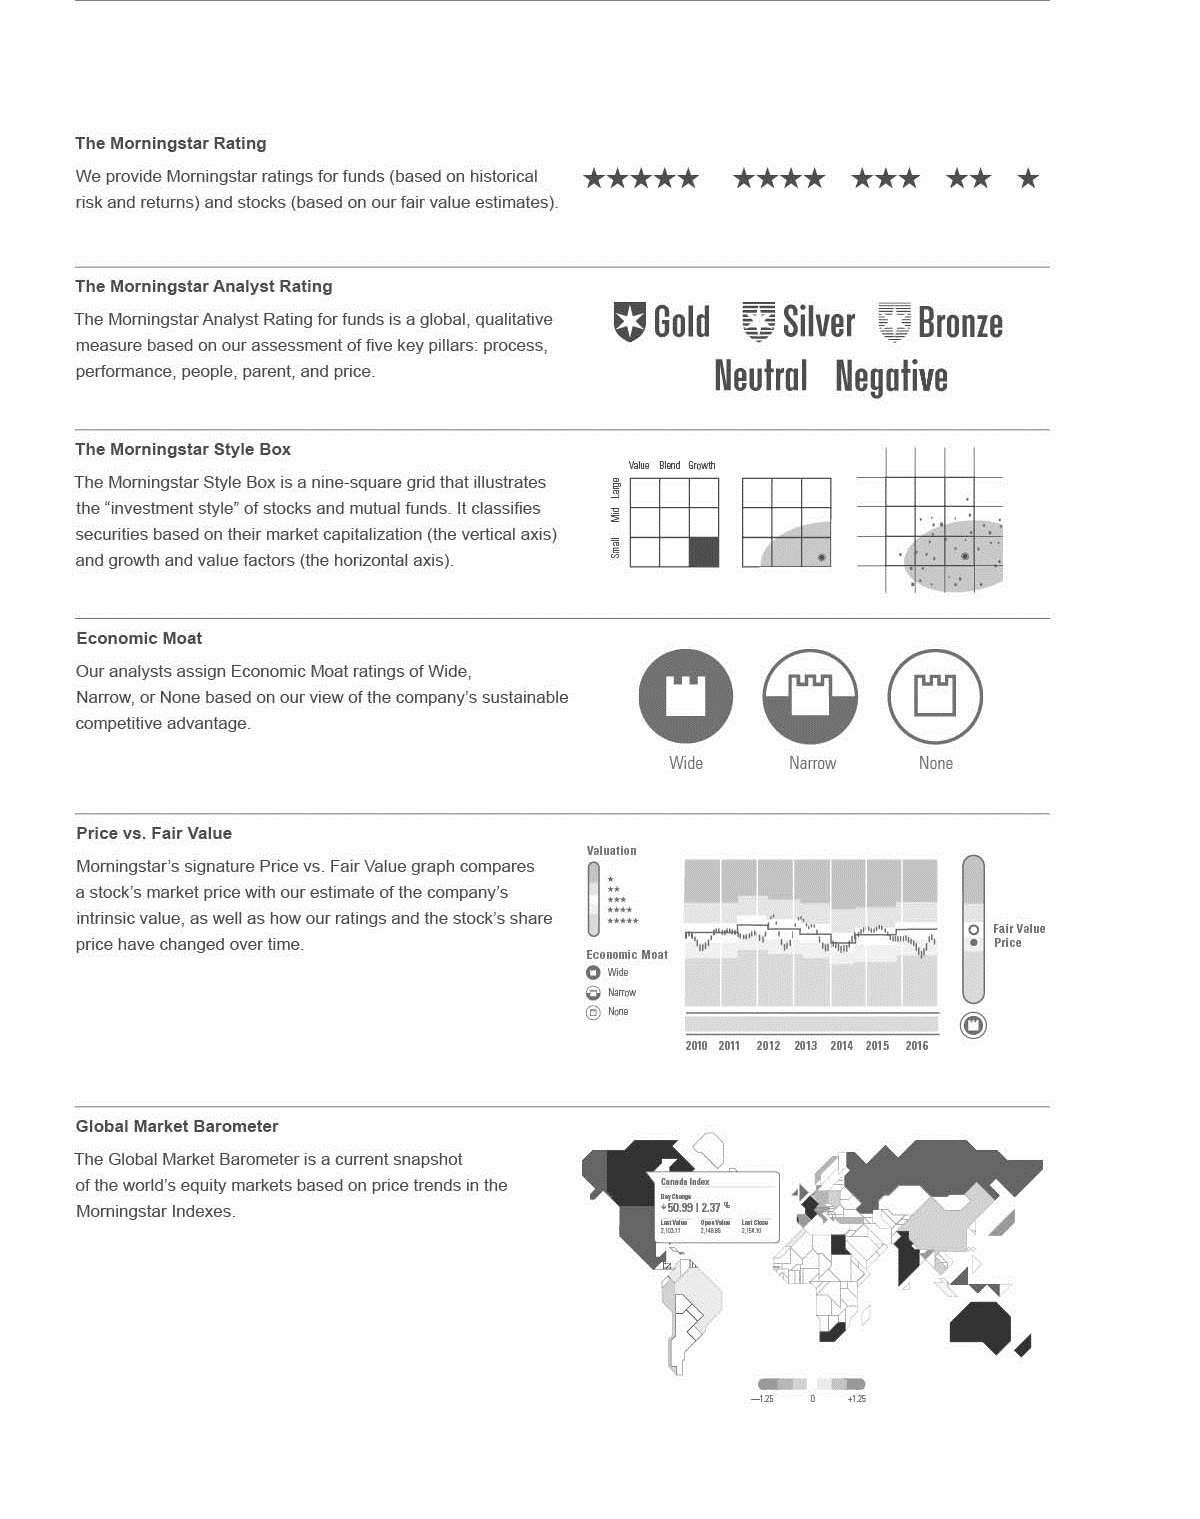
We’ve been providing independent analyst research on mutual funds and other investment vehicles since the mid-1980s. We use this analyst research to provide a qualitative, forward-looking Morningstar Analyst Rating for funds. We now provide research reports and Morningstar Analyst Ratings for approximately 5,100 funds globally, including active, passive, multi-asset, ETF, and closed-end fund strategies. We also offer qualitative research and ratings on alternative funds, state-sponsored college savings plan portfolios, target-date funds, and ETFs. Our data and proprietary analytical tools such as the Morningstar Rating for mutual funds, which rates past performance based on risk- and cost-adjusted returns, and the Morningstar Style Box, which provides a visual summary of a mutual fund's underlying investment style, have become important tools that millions of investors and advisors use in making investment decisions. Other tools, such as the Ownership Zone, Sector Delta, and Market Barometer, allow investors to see how different investments work together to form a portfolio and to track its progress.
The Morningstar Sustainability Rating helps investors evaluate funds based on environmental, social, and governance (ESG) factors. Morningstar now provides Sustainability Ratings for approximately 36,000 investment vehicles. Sustainability ratings for mutual funds and ETFs encompass $21 trillion in assets under management, or more than half of fund assets globally.
As part of our research efforts on individual stocks, we popularized the concepts of economic moat, a measure of competitive advantage originally developed by Warren Buffett, and margin of safety, which reflects the size of the discount in a stock's price relative to its estimated value. The Morningstar Rating for stocks is based on the stock's current price relative to our analyst-generated fair value estimates, as well as the company's level of business risk and economic moat. Our analysts cover approximately 1,500 stocks using a consistent, proprietary methodology that focuses on fundamental analysis, competitive advantage assessment, and intrinsic value estimation.
In addition to our analyst-driven coverage, we provide quantitative ratings and reports for approximately 56,000 companies globally. These equity ratings draw on the fundamental research of our equity analyst team and provide a forward-looking statistical view of the valuation, competitive advantage, and level of uncertainty for stocks that are often under-followed by other research firms.
PitchBook, which we acquired in December 2016, provides venture capital and private equity firms, corporate development teams, investment banks, limited partners, lenders, law firms, and accounting firms with a robust, all-in-one workstation that focuses on private capital markets. Morningstar’s in-depth public company fundamental data and institutional equity research were integrated into the platform in 2017, allowing institutional investors to better capitalize on opportunities in both public and private markets.
3
Through our Morningstar Credit Ratings, LLC subsidiary, which is a Nationally Recognized Statistical Rating Organization (NRSRO), we provide new issue and surveillance ratings and analysis for commercial mortgage-backed securities (CMBS), residential mortgage-backed securities (RMBS), and other types of asset-backed securities. In 2017, the National Association of Insurance Commissioners (NAIC) extended Morningstar Credit Ratings’ designation on its NAIC Credit Rating Provider list to include financial institutions, brokers, and dealers, as well as corporate issuers. Morningstar Credit Ratings also announced the launch of its Real Estate Investment Trust (REIT) ratings initiative in 2017.
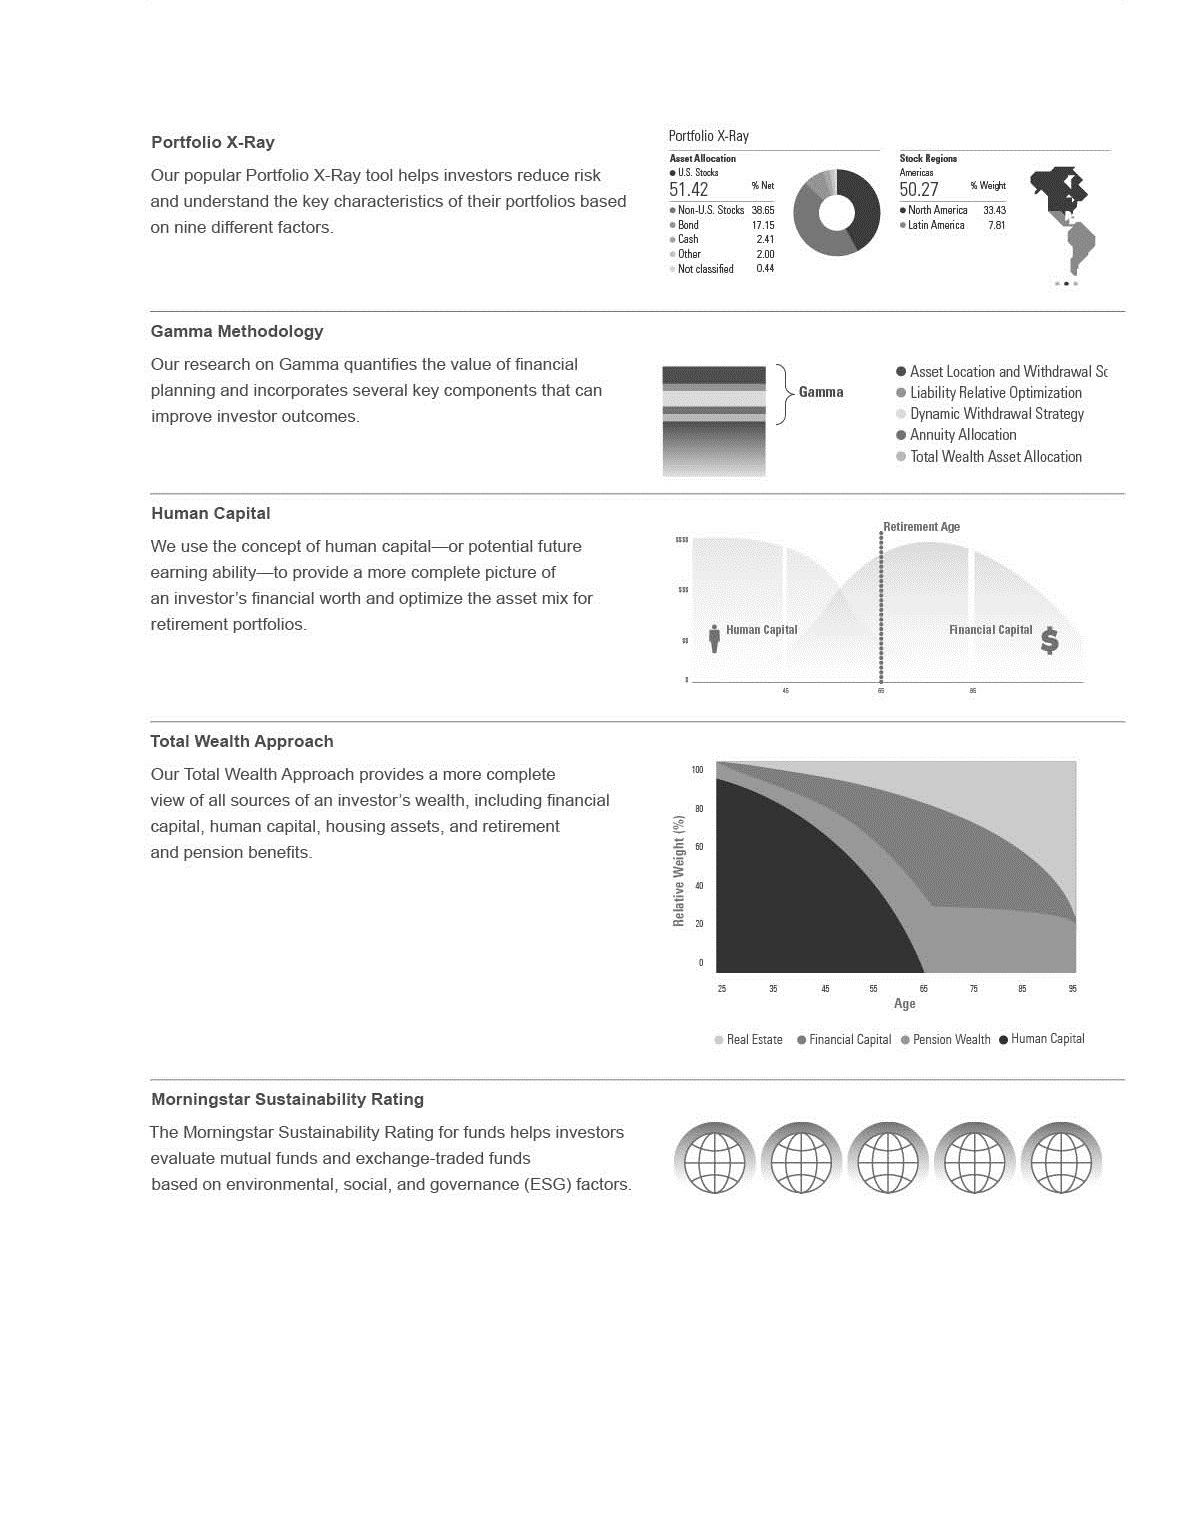
In our investment management business, we've developed in-depth advice on asset allocation, portfolio construction, and security selection to meet the needs of investors and professionals looking for integrated portfolio solutions. We’ve published research on "Gamma," an innovative measure that quantifies how much additional retirement income investors can generate by making better financial planning decisions. We use the concept of human capital-or potential future earning ability-to provide a more complete picture of an investor’s financial worth and optimize a portfolio’s asset mix.
We believe investors rely on these tools because they offer a useful framework for comparing potential investments and making decisions. Our independence and our history of innovation make us a trusted resource for investors.
4
5
6
Strategy and Key Objectives
Our strategy is to widen our economic moat, or sustainable competitive advantage, and build shareholder value by focusing on our three key objectives, which we describe in more detail below.
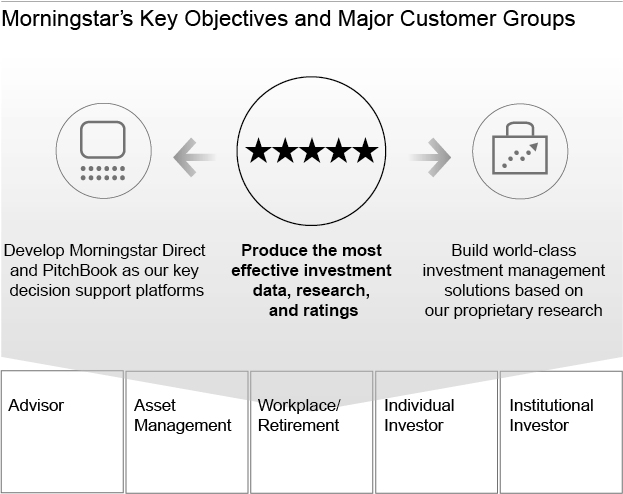
1. Produce the most effective investment data, research, and ratings to help investors reach their financial goals.
We believe the quality and scope of our independent investment research offers a competitive advantage that would be difficult for competitors to replicate. Our goal is to leverage our proprietary research and intellectual property to help investors with both decision support (via Morningstar Direct and PitchBook) and outsourced investment management.
We’re focusing our research efforts on several different areas, as described below.
•Manager research (including mutual funds, ETFs, separate accounts, and other vehicles)
Our goal for manager research is to improve investor outcomes through ratings efficacy, coverage expansion, and innovation. Our analyst team qualitatively assesses thousands of managed investments using a structured and uniform approach. With the release of the Morningstar Quantitative Rating for Funds in the U.S., we have used machine-learning techniques to extend the qualitative Analyst Rating to thousands of funds that our analysts don’t cover. In addition, our analysts contribute to research and data innovations that we surface in the products and services we offer and oversee other ratings systems and tools that we offer to help investors make more-informed decisions when selecting securities, constructing portfolios, or measuring risk.
As of December 31, 2017, we had about 120 manager research analysts, including teams in North America, Europe, Australia, and Asia.
•Equity research
Our analysts follow a rigorous methodology that emphasizes a bottom-up, long-term, fundamentals-based valuation approach. We believe that our deep industry knowledge and Economic MoatTM Ratings, which identify sustainable competitive advantages, differentiate our equity research and help investors achieve better investment outcomes.
As of December 31, 2017, we had about 100 equity analysts globally, making us one of the largest providers of independent equity research.
•Credit ratings
Morningstar Credit Ratings, LLC, our credit ratings subsidiary, is a Nationally Recognized Statistical Rating Organization (NRSRO) that is focused on structured finance and credit ratings for corporate issuers and financial institutions. We bring transparency, unique perspectives, and superior client service to investors across the fixed-income markets.
As of December 31, 2017, we had about 100 credit analysts globally.
•Portfolio advice methodologies (including our research on Gamma and the Total Wealth Approach)
Over the past several years, we’ve developed new research tools that provide a more holistic approach to investing and asset allocation. Whereas traditional asset allocation methodologies focus solely on financial assets (such as stocks and bonds), we’ve developed methodologies that provide a more complete view of all sources of wealth, including financial capital, human capital, housing assets, and retirement and pension benefits.
7
2. Develop Morningstar Direct and PitchBook as our key decision support platforms.
In 2017, we continued to develop the next-generation version of Morningstar Direct, our institutional investment research platform.
The new software is designed to be more intuitive, elegant, and easy-to-use. It provides a more consistent, cohesive experience with a strong emphasis on Morningstar’s proprietary research and tools. We also improved the underlying technology, including a more streamlined development process for commonly used Morningstar capabilities such as portfolio management tools.
The new software is fully web-based, which eliminates the need for desktop software installations and allows immediate access to new features. It allows to us innovate more rapidly and more easily configure our software solutions to meet client needs. It also addresses the growing need for mobile-optimized capabilities to extend the desktop experience onto mobile devices.
Over the past several years, we've started migrating many of our core software capabilities to Morningstar Direct, which will serve as our main platform for clients seeking information to support the investment decisions they make on their own or to validate investment recommendations from another party. We're also continuing to expand the user base for Morningstar Direct by enhancing capabilities for our existing asset management clients and adding workflows for new types of clients, such as financial advisors.
The PitchBook Platform is an all-in-one web-based research and analysis workstation centered on the private capital markets, including venture capital, private equity, and mergers and acquisitions. The PitchBook Platform also offers a mobile application, Excel plug-in, Chrome extension and optional CRM integrations, all designed to help users source deals, raise funds, build buyer lists, create benchmarks, network, and more.
In 2017, we introduced several high-impact data and technology enhancements. Morningstar’s in-depth public company fundamental data and institutional equity research were integrated into the platform, which when combined with PitchBook’s best-in-class private market data, offers seamless access to cross-market insights, allowing institutional investors to better capitalize on opportunities in both public and private markets. We also doubled our private European company coverage.
In 2017, PitchBook also launched a new interface and user experience, creating a more scalable product and helping users quickly uncover trends and opportunities. For example, the new Chrome extension allows users to instantly view hard-to-find company data while browsing other web content, thereby creating efficiency and value for users in their research.
3. Build world-class investment management solutions based on our proprietary research.
We leverage our innovative, proprietary research by building world-class investment management solutions that help investors achieve better outcomes. Leveraging our existing capabilities, we create holistic solutions that help financial advisors, asset managers, and individual investors with portfolio construction, monitoring, security selection, and implementation.
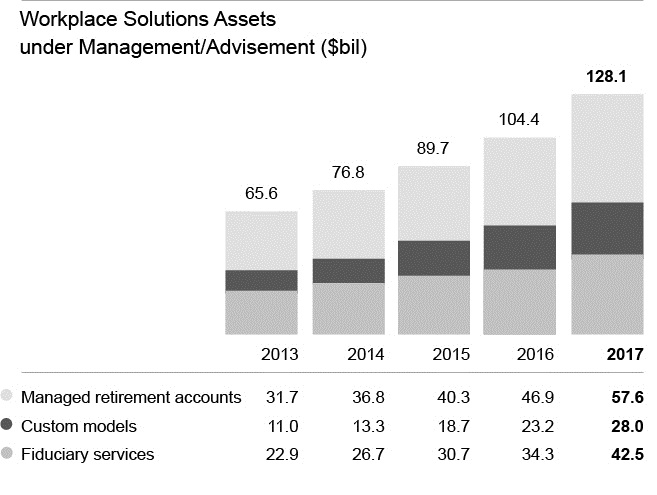
Our investment management solutions include Morningstar Managed Portfolios, which had $39.8 billion in assets under management and advisement as of December 31, 2017, and Workplace Solutions (formerly Retirement Solutions), which had a total of $128.1 billion in assets under management and advisement.
We also expect to expand the investment management solutions we offer through our index business. We currently offer more than 580 investment indexes that can be used for both benchmarking and product creation.
8
Major Customer Groups
Given the core capabilities discussed above, we're focusing on five primary customer groups:
• | Advisor (including independent financial advisors as well as those affiliated with broker-dealers or other intermediaries); |
• | Asset management (including fund companies, insurance companies, and other companies that build and manage portfolios of securities for their clients); |
• | Workplace/retirement (including retirement plan providers and plan sponsors); |
• | Individual investor; and |
• | Institutional investor. |
Advisor
Financial advisors work with individual investors to help them reach their financial goals. This customer group includes independent advisors at registered investment advisor (RIA) firms, advisors affiliated with independent broker-dealers, dually registered advisors, and “captive” advisors who are employees of a broker-dealer. Such broker-dealers include wirehouses, regional broker-dealers, and banks. The advisor landscape is broad in both the United States, and in other parts of the world where we focus. The U.S. is our largest market, and in total, Cerulli Associates estimates there were approximately 313,000 financial advisors in the U.S. as of the end of 2017.
We believe our deep understanding of individual investors’ needs allows us to work with advisors to help them make more efficient use of their time and deliver better investment outcomes for their clients. Our advisor solutions also draw on Morningstar’s proprietary investment research methodologies and research insights.
We sell our advisor-related solutions both directly to independent financial advisors and through enterprise licenses, which allow financial advisors associated with the licensing firm to use our products.
We're expanding the range of services we offer to help financial advisors with all aspects of their daily workflow needs, including investment decision-making, portfolio construction, client monitoring and reporting, practice management, portfolio rebalancing that connects with custodial and trading interfaces, and financial planning. Because advisors are increasingly outsourcing investment management, we're continuing to enhance Morningstar Managed Portfolios to help advisors save time and reduce compliance risk.
Our main products for financial advisors are Morningstar Advisor Workstation (including Morningstar Office) and Morningstar Managed Portfolios.
9
Asset management
Asset management firms manage and distribute investment portfolios. We estimate that there are more than 3,000 asset management firms globally, ranging from large, global firms to firms with small fund lineups and operations in a single market or region. The asset management customer group includes individuals involved in sales, marketing, product development, and distribution, as well as investment management (often referred to as the “buy side”), which includes portfolio management and research.
Our asset management offerings help companies connect with their clients because of Morningstar’s strong brand presence with both financial advisors and individual investors. We offer a global reach and have earned investors’ trust in our unbiased approach, investor-centric mission, and thought leadership.
The key products we offer for asset management firms include Morningstar Direct, Morningstar Data, and Morningstar Indexes. For the buy side, key products include Morningstar Research, Morningstar Credit Ratings, Morningstar Data, and Morningstar Direct.
Workplace/retirement
In the U.S. workplace (also known as retirement) market, millions of investors are now charged with planning for their own retirement, mainly through self-directed retirement plans such as 401(k) plans in the United States. Assets in 401(k) plans totaled an estimated $5.6 trillion as of December 31, 2017, based on data from Cerulli Associates. In the wake of the financial crisis of 2008 and 2009, we believe individual investors, financial advisors, employers, and government organizations have all become more aware of the need for advice and guidance that helps individuals build assets for retirement and beyond.
Our retirement offerings help retirement plan participants of all ages plan and invest for retirement. We offer these services both through retirement plan providers (typically third-party asset management companies that provide administrative and record-keeping services) and directly to plan sponsors (employers that offer retirement plans to their employees).
Our main product offerings for the workplace/retirement customer group include retirement advice and managed accounts, fiduciary services, and custom models.
Individual investor
We offer products for individual investors who invest to build wealth and save for other goals, such as retirement or college tuition. A Gallup survey released in April 2017 found that approximately 54% of individuals in the United States invest in the stock market either directly or through mutual funds or self-directed retirement plans.
We design most of our products for individual investors who are actively involved in the investing process and want to take charge of their own investment decisions. We also reach individuals who want to learn more about investing or want to validate the advice they receive from brokers or financial advisors.
Our main product for individual investors is Morningstar.com, which includes both paid Premium Memberships and free content available to registered users and visitors. We also reach individual investors through investment newsletters, iPad and mobile applications, and through licensing our content to other websites, such as Yahoo Finance, MSN Money, and Google Finance.
Institutional investor
Through PitchBook Data, Inc. (PitchBook), which we acquired in December 2016, we reach approximately 2,700 investment and research firms and their service providers, including venture capital and private equity firms, corporate development teams, investment banks, limited partners, lenders, law firms, and accounting firms. These clients use PitchBook’s platform to access data, discover new connections, and conduct research on potential investment opportunities.
10
PitchBook covers the full lifecycle of venture capital, private equity, and mergers and acquisitions (M&A), including the limited partners, investment funds, and service providers involved. Our main product for this customer group is the PitchBook Platform, an all-in-one research and analysis workstation for sophisticated investment and business professionals.
Acquisitions and Divestitures
Since our founding in 1984, we've supported our organic growth by introducing new products and services and expanding our existing offerings. From 2006 through 2017, we also completed 30 acquisitions to support our growth objectives. In July 2017, we acquired a minority stake in Sustainalytics Holding B.V., an independent ESG and corporate governance research, ratings, and analysis firm supporting investors around the world with the development and implementation of responsible investment strategies. In June 2017, we sold HelloWallet.
For more information about our acquisitions, refer to Note 7 of the Notes to our Consolidated Financial Statements.
For more information about our investments in unconsolidated entities, refer to Note 9 of the Notes to our Consolidated Financial Statements. For more information about our divestiture, refer to Note 8 of the Notes to our Consolidated Financial Statements.
Major Products and Services
The section below describes some of our major products and services (ranked in order of size based on each product's 2017 revenue).
Morningstar Data
Morningstar Data gives institutions access to a full range of investment data spanning numerous investment databases, including real-time pricing and market data. We offer licenses and data feeds for our proprietary statistics, such as the Morningstar Style Box and Morningstar Rating, and a wide range of other data, including information on investment performance, risk, portfolios, operations data, fees and expenses, cash flows, and ownership. Institutions can use Morningstar Data in a variety of investor communications, including websites, print publications, and marketing fact sheets, as well as for internal research and product development.
We also offer Morningstar Data for equities, including financial statement data, consolidated industry statistics, stock ownership information, and proprietary Morningstar statistics.
In 2017, we added several new sets of data to our suite of offerings, including the expansion of our equity data, which added over 1,000 new data elements. We also advanced our fixed income capabilities, expanding portfolio level data and new analytics for funds. We’ve continued developing our data delivery platforms, including application programming interfaces (APIs), which allow for faster and more flexible client access to large groups of data files. We’ve expanded the number of data sets that are available through APIs and expanded the scope of data provided at the request of our clients.
Pricing for Morningstar Data is based on the number of investment vehicles covered, the amount of information provided for each security, the frequency of updates, the method of delivery, the size of the licensing firm, and the level of distribution.
Our main competitors for Morningstar Data include Activ Financial, Bloomberg, FactSet, Financial Express, Interactive Data, S&P Global, Thomson Reuters, and Xignite.
Morningstar Data is our largest product based on revenue and accounted for 17.9%, 19.0%, and 18.3% of our consolidated revenue in 2017, 2016, and 2015, respectively.
11
Morningstar Direct
Morningstar Direct is an institutional investment research platform that includes data and advanced analytical tools on the complete range of securities in Morningstar's global database, as well as privately held investments and data from third-party providers. It helps portfolio managers, investment consultants, financial product managers, wealth managers, and other professionals develop, select, and monitor investments. Users can create advanced performance comparisons and in-depth analyses of an investment's underlying investment style, as well as custom-branded reports and presentations.
In 2017, we further developed Morningstar Direct Cloud (the next-generation version of Morningstar Direct). These ongoing development efforts include rebuilding the platform to make it purely web-based and retooling existing capabilities to support users' daily workflow needs.
We also enhanced the data and research capabilities offered in Morningstar Direct during the year. For example, we expanded the Morningstar Sustainability Rating for funds, which helps investors evaluate mutual funds and ETFs based on how well the companies held in their portfolios are managing their environmental, social, and governance (ESG) risks and opportunities. We also introduced a new Global Risk Model into Direct Cloud, which helps investors understand and visualize the underlying factors that can drive the risk of a stock or portfolio and run scenario analysis to analyze returns.
Morningstar Direct's primary competitors are Bloomberg, eVestment Alliance, FactSet Research Systems, Thomson Reuters, and Zephyr Associates.
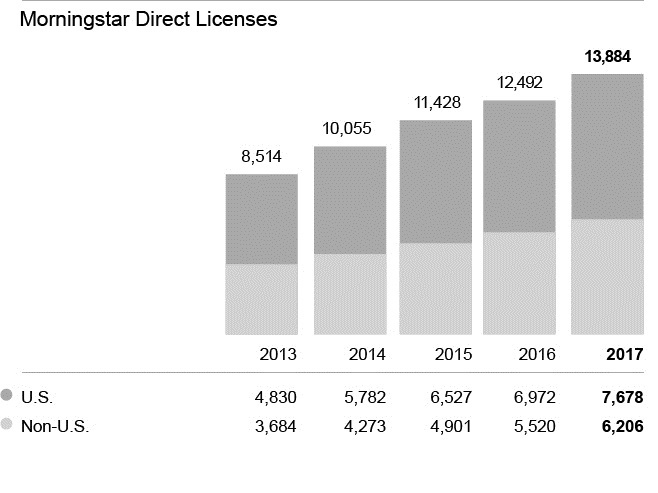
Morningstar Direct had approximately 13,900 licensed users worldwide as of December 31, 2017.
Pricing for Morningstar Direct is based on the number of licenses purchased. For clients in the United States, we generally charge an annual fee of $18,000 for the first user, $11,500 for the second user, and $9,800 for each additional user.
Morningstar Direct is our second-largest product based on revenue and accounted for 13.6%, 13.8%, and 12.9% of our consolidated revenue in 2017, 2016, and 2015, respectively.
Morningstar Investment Management
This product line includes several different offerings, including Morningstar Managed Portfolios, as well as services for institutional asset management, asset allocation, and manager selection.
12
Morningstar Managed Portfolios are widely available as strategist models on third-party managed account platforms and through a fee-based discretionary asset management service also known as a turn-key asset management program (TAMP). In the United States, we offer this service through Morningstar Investment Services LLC, a registered investment advisor, registered broker/dealer, member of the Financial Industry Regulatory Authority, Inc. (FINRA), and wholly owned subsidiary of Morningstar, Inc. Our portfolios are built using mutual funds, ETFs, and equities and tailored to meet specific investment time horizons, risk levels, and outcomes. We offer Morningstar Managed Portfolios mainly through fee-based independent financial advisors. These advisors are often affiliated with independent or insurance-related broker-dealers. Morningstar Managed Portfolios are also available in Australia, South Africa, and the United Kingdom.
We also provide other institutional asset management services for asset management firms, broker-dealers, and insurance providers, which we offer through a variety of registered entities in Australia, Canada, Dubai, France, Hong Kong, India, Japan, South Africa, the United Kingdom, and the United States. All of these entities are wholly owned or majority-owned subsidiaries of Morningstar, Inc., and are authorized to provide investment advisory services by the appropriate regulatory agency in their applicable jurisdictions.
These services include institutional asset management, asset allocation, and manager selection services, which are investment recommendations delivered as select lists, based on a process that draws on our rated universe and manager selection methodology.
In 2017, we continued migrating functionality to the new Morningstar Managed Portfolios website from our legacy platform. We also launched a new portfolio series, U.S. Real Return, as part of our outcome-based lineup. These diversified, multi-asset portfolios align their valuation-driven and best-ideas investment approach with the investors’ financial planning needs and goals.
We charge asset-based fees for Morningstar Managed Portfolios, which are typically based on the type of service (i.e., TAMP vs. strategist models) and the products contained within the portfolios. Fees for our mutual fund and ETF portfolios generally range from 20 to 40 basis points. We charge 40 to 55 basis points for Equity Portfolios, which are customizable stock portfolios based on Morningstar's proprietary equity research. We use third-party custodians for Morningstar Managed Portfolios and do not hold the assets in custody.
We base pricing for our other investment management services on the scope of work, our degree of investment discretion, and the level of service required. In the majority of our contracts, we receive asset-based fees, reflecting our work as a portfolio construction manager or subadvisor for multimanager portfolios.
For Morningstar Managed Portfolios offered through our TAMP, our primary competitors are AssetMark, Brinker Capital, and SEI Investments. Our primary strategist offering competitors are Blackrock, Vanguard, Envestnet PMC and Russell. We also compete with in-house research teams at independent broker-dealers who build proprietary portfolios for use on brokerage firm platforms, as well other registered investment advisors that provide investment strategies or models on these platforms. In our other investment management services, we compete with consulting firms such as Mercer, Callan, and Wilshire Associates, as well as various in-house providers of investment management services.
Morningstar Investment Management is our third-largest product based on revenue and made up 11.6%, 12.3%, and 12.5% of our consolidated revenue in 2017, 2016, and 2015, respectively.
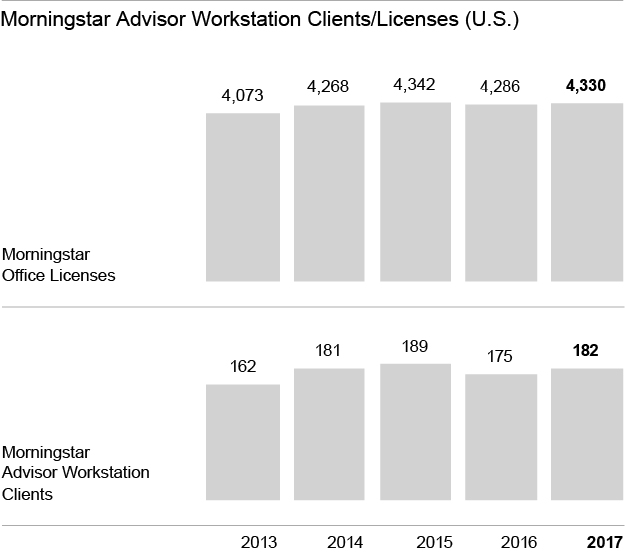
Morningstar Advisor Workstation
Morningstar Advisor Workstation, a web-based investment planning system, provides financial advisors with a comprehensive set of tools for conducting their core business-including investment research, planning, and presentations. It allows advisors to build and maintain a client portfolio database that can be fully integrated with the firm's back-office technology and resources. Moreover, it helps advisors create customized reports for client portfolios that combine different types of investments.
Morningstar Advisor Workstation is available in two versions: Morningstar Office for independent financial advisors and an enterprise version for financial advisors affiliated with larger firms. As of December 31, 2017, approximately 4,300 financial advisors in the United States were licensed to use Morningstar Office, and approximately 180 companies held licenses for the enterprise version of Morningstar Advisor Workstation.
13
In 2017, we continued to enhance integrations with several leading third-party platforms to help advisors with all aspects of their daily workflows. We advanced Morningstar Office CloudSM, our cloud-based practice and portfolio management platform for advisors. We also launched our Best Interest Scorecard, a solution designed to help advisors act as fiduciaries for their clients.
Pricing for Morningstar Advisor Workstation varies based on the number of users, as well as the number of databases licensed and level of functionality. We typically charge annual fees of about $3,500 per licensed user for a base configuration of Morningstar Advisor Workstation, but pricing varies significantly based on the scope of the license. We generally charge $8,000 per firm, on average, for an annual license for Morningstar Office. This average includes a mix of "per account" and "per seat" pricing for access. With the release of our cloud-based platform, we will be more focused on pricing on an account basis versus pricing per user.
Competitors for Morningstar Advisor Workstation and Morningstar Office include Black Diamond, Envestnet, Orion Advisor Services, S&P Global, and Thomson Reuters.
Morningstar Advisor Workstation is our fourth-largest product based on revenue and made up 9.6%, 10.3%, and 10.3% of our consolidated revenue in 2017, 2016, and 2015, respectively.
Workplace Solutions
This product line includes several different offerings, including retirement advice and managed accounts, fiduciary services and custom models.
Our advice and managed accounts program, delivered primarily through Morningstar Retirement Manager, helps retirement plan participants with their retirement goals. As part of this service, we deliver personalized recommendations for a target savings goal, a recommended contribution rate to help achieve that goal, a portfolio mix based on risk tolerance, and specific investment recommendations. Participants can build their own portfolios based on our recommendations or elect to have their accounts managed by us through our managed retirement account offering. We also offer Advisor Managed Accounts, a program that allows financial advisors to specify the portfolios that are used in an employer's managed account offering. We do not hold assets in custody for the managed retirement accounts we provide.
14
In our fiduciary services offering, we work with retirement plan providers and sponsors to help them meet their fiduciary obligations by selecting and monitoring a broad range of diversified plan options. With our custom models, we work with retirement plan providers to design solutions for their investment lineups, including target maturity models and risk-based models.
We also serve as a non-discretionary subadvisor and index provider for the Morningstar Lifetime Allocation Funds, a series of target-date collective investment trust funds (CITs) offered by UBS Asset Management to retirement plan sponsors. Retirement plan sponsors can select a conservative, moderate, or growth version of the funds based on the needs of participants in the plan.
In 2017, we further redesigned the user interface of Retirement Manager and transitioned many of our provider clients to the new version.
Pricing for Workplace Solutions depends on several different factors, including the level of services offered (including whether the services involve acting as a fiduciary under the Employee Retirement Income Security Act, or ERISA), the number of participants, the level of systems integration required, and the availability of competing products.
Our main competitors for Workplace Solutions are Financial Engines and Guided Choice as well as companies that provide automated investment advice, such as Betterment and Wealthfront. For the Lifetime Allocation Funds, we compete with other providers of target-date funds, such as Vanguard, Fidelity, and T. Rowe Price.
Workplace Solutions is our fifth-largest product based on revenue and made up 8.1% of revenue in 2017, compared with 8.9% in 2016 and 8.4% in 2015.
PitchBook Data
PitchBook Data, Inc., which Morningstar acquired in December 2016, provides data, research, and technology covering the private capital markets, including venture capital, private equity, and M&A. PitchBook's main product is the PitchBook Platform, an all-in-one research and analysis workstation for sophisticated investment and research professionals. Close to 14,000 professionals use this software to source deals, raise funds, build buyer lists, create benchmarks, network, and more. To accommodate their diverse needs, the platform offers advanced search functionality, a fully customizable dashboard and email alerts that help users discover and monitor relevant information.
PitchBook also offers a mobile application, Excel plug-in, data feeds, and flexible, à la carte data solutions that allow clients to access a variety of data points on demand.
15
In 2017, we integrated Morningstar’s in-depth fundamental data and equity research into PitchBook and we now provide comprehensive data coverage and information for publicly traded companies worldwide. PitchBook also significantly expanded its European data sets, doubling private European company coverage to over 340,000 companies. We also launched a new interface for the platform, creating a more scalable and intuitive product to enhance the user experience.
PitchBook's main competitors are CB Insights, Dow Jones VentureSource, Prequin, S&P Capital IQ, and Thomson Reuters.
Pricing for the PitchBook Platform is based on the number of seats, with the standard base license generally priced at $32,500 for the first five seats, and pricing for additional seats generally priced at $6,500 per user, with customized prices for large enterprises, boutiques, and startup firms.
PitchBook is our sixth-largest product based on revenue and made up 7% of revenue in 2017, compared with 0.5% in 2016. Because the PitchBook acquisition closed in December, PitchBook contributed approximately one month of revenue in 2016.
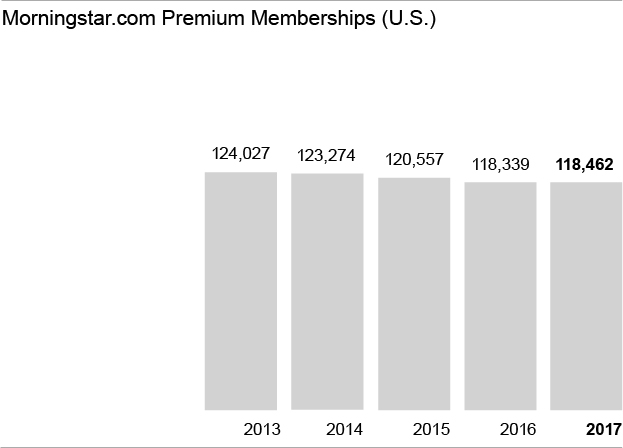
Morningstar.com
Our largest website, Morningstar.com, helps individual investors discover, evaluate, and monitor stocks and funds; build and monitor portfolios; and monitor the markets. Revenue is generated from paid memberships through Morningstar Premium and Internet advertising sales, which respectively made up approximately 53% and 47% of Morningstar.com’s total revenue in 2017.
Our Morningstar Premium offering is focused on bringing clarity and confidence to investment decisions. Members have access to proprietary Morningstar research, ratings, data and tools, including analyst reports, portfolio management tools (such as Portfolio X-Ray), and premium stock and fund screeners.
We currently offer Premium Membership services in Australia, Canada, Italy, the United Kingdom, and the United States.
In 2017, we continued to build out and optimize our redesigned site. The site features a new user interface focused on helping individual investors select and monitor investments. We plan to complete the rollout of the new site during 2018, including a new fund report page and new portfolio and screener experiences.
Morningstar.com primarily competes with The Motley Fool, Seeking Alpha, TheStreet.com, and Yahoo! Finance, as well as other finance and brokerage sites.
As of December 31, 2017, Morningstar.com had about 11.9 million registered free members worldwide. We also had approximately 118,000 paid Premium members in the United States plus an additional 11,000 Premium members across other global markets. We currently charge $23.95 for a monthly subscription, $199 for an annual subscription, $339 for a two-year subscription, and $439 for a three-year subscription for Morningstar.com's Premium Membership service.
16
Morningstar Enterprise Components
Morningstar Enterprise Components is a set of tools and capabilities that help institutional clients build customized websites or enhance their existing solutions. We offer a series of API components, editorial content, and reports that investment firms can license to build or enhance their websites for financial advisors and individual investors. We also offer licenses for investment research, editorial content, and portfolio analysis and comparison tools that allow users to drill down into the underlying data when researching a potential investment.
In 2017, we continued to roll out the new Morningstar Developer platform, now known as Morningstar as a Service, which provides clients with direct access to our tools, components, data, calculation engines, and APIs. The site empowers clients by giving them the flexibility to develop their own solutions using Morningstar components.
For Enterprise Components, our primary competitors include Factset, Financial Express, Interactive Data Corporation, Markit on Demand, and Thomson Reuters.
Pricing for Enterprise Components consists of both ongoing license fees and one-time development fees and depends on the solution being offered, the number of users and level of distribution, and the amount of client integration involved.
Morningstar Research
We offer Morningstar Research, including Equity Research and Manager Research, through Morningstar Research Services LLC and a variety of other subsidiaries outside the United States. We offer Equity Research to institutional investors who use it to supplement their own research, as well as to broker-dealers who provide our research to their affiliated financial advisors or individual investor clients. Our Manager Research services help institutional investors and manager research due diligence teams evaluate funds, investment strategies, and asset management firms.
During 2017, we continued to evolve our manager research solutions, which help wealth management firms evaluate managed investments and perform due diligence on the products they offer to clients. We also progressed our Morningstar Quantitative Rating, a forward-looking rating assigned by a model that is designed to estimate what the Morningstar Analyst Rating would be on managed products not covered by our manager research analysts.
Our Equity Research services compete with CFRA Research (formerly S&P Capital IQ Equity Research) and Zack's Investment Research, as well as sell-side firms, internal providers, and smaller boutique firms. Our Manager Research services mainly compete with Mercer, Willis Towers Watson, and Wilshire Associates.
Pricing for Morningstar Research varies based on the level of distribution, the type of investors who are using our research, the number of securities or investment strategies covered, the amount of custom coverage and client support required, and the length of the contract term.
17
Morningstar Credit Ratings
Morningstar Credit Ratings, LLC is an NRSRO that provides timely new issue and surveillance ratings and analysis for structured credits, as well as operational risk assessment services. We provide ratings on a broad range of structured finance securities, including commercial mortgage-backed securities, residential mortgage-backed securities, single-family rental securities, and asset-backed securities. We also provide ratings for corporate issuers and financial institutions.
In 2017, we expanded our research and ratings, most notably in asset-backed securities, which had a positive impact on financial performance.
Our business competes with several other firms, including DBRS, Fitch, Kroll Bond Ratings, Moody’s, and S&P Global Ratings.
We charge annual fees for our subscription-based CMBS surveillance software and data services, which are paid for by the user. Pricing for these services varies depending on the solution and the level of access within a client organization. For new-issue ratings, we charge one-time fees to the issuer based on the type of security, the size of the transaction, and the complexity of the issue. In addition to the initial rating fee, clients pay annual surveillance fees that continue until the securities mature.
Morningstar Indexes
We offer an extensive set of investment indexes that can be used to benchmark the market and create investment products, including indexes that track the global equity markets, sector, and investment style; strategic beta indexes; dividend indexes; active equity indexes based on Morningstar’s equity research; bond indexes; commodity indexes; hedge fund indexes; asset allocation indexes; and a family of sustainability indexes.
In 2017, we globalized our strategic beta indexes, which included a family of dividend-based indexes and moat-focused indexes that draw upon our proprietary research. We also further developed our Global Sustainability Indexes, which incorporate environmental, social and governance factors into the investment process.
We expanded the Morningstar Open Indexes Project, offering asset managers and other firms the ability to benchmark their investments against more than 100 Morningstar global equity indexes for free. The goal of the project is to lower benchmarking costs for the industry and improve outcomes for investors in response to the escalating cost of market-cap-weighted equity indexes. Participants receive price return, total return, net return, and month-end constituent data for indexes included in the project.
We currently license Morningstar Indexes to numerous institutions that offer ETFs and exchange-traded notes based on the indexes. Firms license Morningstar Indexes for both product creation (where we typically receive the greater of a minimum fee or basis points tied to assets under management) and data licensing (where we typically receive annual licensing fees). In both cases, our pricing varies based on the level of distribution, the type of user, and the specific indexes licensed.
Major competitors for Morningstar Indexes include FTSE Russell, MSCI, and S&P Dow Jones Indices (offered through S&P Global).
International Operations
We conduct our business operations outside of the United States through wholly owned or majority-owned operating subsidiaries based in each of the following 26 countries: Australia, Brazil, Canada, Chile, Denmark, France, Germany, India, Italy, Japan, Luxembourg, Mexico, the Netherlands, New Zealand, Norway, People's Republic of China (both Hong Kong and the mainland), Singapore, South Africa, South Korea, Spain, Sweden, Switzerland, Taiwan, Thailand, United Arab Emirates, and the United Kingdom. See Note 5 of the Notes to our Consolidated Financial Statements for additional information concerning revenue from customers and long-lived assets from our business operations outside the United States.
18
Intellectual Property and Other Proprietary Rights
We treat our brand name and logo, product names, databases and related content, software, technology, know-how, and the like as proprietary. We seek to protect this intellectual property by using: (i) trademark, copyright, patent and trade secrets laws; (ii) licensing and nondisclosure agreements; and (iii) other security and related technical measures designed to restrict unauthorized access and use. For example, we generally provide our intellectual property to third parties through the use of standard licensing agreements, which define the extent and duration of any third-party usage rights and provide for our continued ownership in any intellectual property furnished.
Because of the value of our brand name and logo, we generally seek to register one or both of them as trademarks in all relevant international classes in any jurisdiction in which we have business offices or significant operations. We have registered the Morningstar name and/or logo in approximately 50 jurisdictions, including the European Union, and currently have registrations pending in several others. In some jurisdictions, we may also choose to register one or more product names.
“Morningstar” and the Morningstar logo are both registered marks of Morningstar in the United States. The table below includes some of the trademarks and service marks referenced in this report:
Morningstar® Advisor Workstation SM | Morningstar® Portfolio X-Ray® | |
Morningstar Analyst Rating TM | Morningstar Rating™ | |
Morningstar® ByAllAccounts® | Morningstar® Retirement Manager SM | |
Morningstar® Data | Morningstar® Stewardship Grade SM | |
Morningstar Direct SM | Morningstar Style Box™ | |
Morningstar® Enterprise Components SM | Morningstar Sustainability Rating™ | |
Morningstar® Managed Portfolios SM | Morningstar.com® | |
Morningstar Market Barometer SM | PitchBook® | |
Morningstar Office SM | ||
In addition to trademark registrations, we currently hold several patents in the United States, including a recently issued patent for a coordinate-based document processing system and several patents held by our wholly owned subsidiary, Morningstar Investment Management LLC, for lifetime asset allocation and asset allocation with annuities.
License Agreements
We license our products and related intellectual property to our customers, generally for a fee. As a rule, we use our standard agreement forms and we do not provide our products and services to customers or other users without having an agreement in place.
We maintain licensing agreements with most of our larger Morningstar operating companies around the world to allow them to access and use our intellectual property, including, without limitation, our products, trademarks, databases and content, technology, and know-how. We put these agreements in place to allow our operating companies to both market standard Morningstar products and services in their operating territories and to develop and sell territory-specific variants of those products under the Morningstar name in their specific territories.
In the ordinary course of our business, we obtain and use intellectual property from a wide variety of sources, including licensing it from third-party providers, developing it internally, and gathering it through publicly available sources (e.g., regulatory filings).
Seasonality
We believe our business has a minimal amount of seasonality. Some of our smaller products, such as our annual investment conference in Chicago, generate the majority of their revenue in the first or second quarter of the year. We sell most of our products with subscription or license terms of at least one year, though, and we recognize revenue ratably over the term of each subscription or license agreement. This tends to offset most of the seasonality in our business.
19
We believe market movements generally have more influence on our performance than seasonality. The revenue we earn from asset-based fees depends on the value of assets on which we provide advisory services, and the size of our asset base can increase or decrease along with trends in market performance.
Largest Customer
In 2017, our largest customer accounted for less than 2% of our consolidated revenue.
Competitive Landscape
The economic and financial information industry includes a few large firms as well as numerous smaller companies, including startup firms. Some of our main competitors include Bloomberg, S&P Global, and Thomson Reuters. These companies have financial resources that are significantly greater than ours. We also compete with a variety of other companies in specific areas of our business. We discuss some of the key competitors in each area in the Major Products and Services section of this report.
We believe the most important competitive factors in our industry are brand and reputation, data accuracy and quality, technology, breadth of data coverage, quality of investment research and analytics, design, product reliability, and value of the products and services provided.
Research and Development
A key aspect of our growth strategy is to expand our investment research capabilities and enhance our existing products and services. We strive to adopt new technology that can improve our products and services. As a general practice, we manage our own websites and build our own software rather than relying on outside vendors. This allows us to control our technology development and better manage costs, enabling us to respond quickly to market changes and to meet customer needs efficiently. As of December 31, 2017, our technology team consisted of approximately 1,310 programmers and technology and infrastructure professionals.
Government Regulation
United States
Investment advisory and broker-dealer businesses are subject to extensive regulation in the United States at both the federal and state level, as well as by self-regulatory organizations. Financial services companies are among the nation's most extensively regulated. The SEC is responsible for enforcing the federal securities laws and oversees federally registered investment advisors and broker-dealers.
Three of our subsidiaries, Morningstar Investment Management LLC, Morningstar Investment Services LLC, and Morningstar Research Services LLC, are registered as investment advisors with the SEC under the Investment Advisers Act of 1940 (Advisers Act). As registered investment advisors, these companies are subject to the requirements and regulations of the Advisers Act. These requirements relate to, among other things, record-keeping, reporting, and standards of care, as well as general anti-fraud prohibitions. As registered investment advisors, these subsidiaries are subject to on-site examination by the SEC.
In addition, in cases where these subsidiaries provide investment advisory services to retirement plans and their participants, they may be acting as fiduciaries under the Employee Retirement Income Security Act of 1974 (ERISA). As fiduciaries under ERISA, they have duties of loyalty and prudence, as well as duties to diversify investments and to follow plan documents to comply with the applicable portions of ERISA.
Morningstar Investment Services is a broker-dealer registered under the Securities Exchange Act of 1934 (Exchange Act) and a member of FINRA. The regulation of broker-dealers has, to a large extent, been delegated by the federal securities laws to self-regulatory organizations, including FINRA. Subject to approval by the SEC, FINRA adopts rules that govern its members. FINRA and the SEC conduct periodic examinations of the brokerage operations of Morningstar Investment Services.
20
Broker-dealers are subject to regulations that cover all aspects of the securities business, including sales, capital structure, record-keeping, and the conduct of directors, officers, and employees. Violation of applicable regulations can result in the revocation of a broker-dealer license, the imposition of censures or fines, and the suspension or expulsion of a firm or its officers or employees. As a registered broker-dealer, Morningstar Investment Services is subject to certain net capital requirements under the Exchange Act. These requirements are designed to regulate the financial soundness and liquidity of broker-dealers.
Morningstar Credit Ratings, LLC is registered with the SEC as a Nationally Recognized Statistical Rating Organization (NRSRO) specializing in rating structured finance investments, corporate credit issuers, and financial institutions. As an NRSRO, Morningstar Credit Ratings is subject to certain requirements and regulations under the Exchange Act. These requirements relate to, among other things, record-keeping, reporting, governance, and conflicts of interest. As part of its NRSRO registration, Morningstar Credit Ratings is subject to annual examination by the SEC.
Australia
Our subsidiaries that provide financial information services and advice in Australia, Morningstar Australasia Pty Limited and Morningstar Investment Management Australia Ltd., are registered under an Australian Financial Services license and are subject to oversight by the Australian Securities and Investments Commission (ASIC). This license requires them to, among other things, maintain positive net asset levels and sufficient cash resources to cover three months of expenses and to comply with the audit requirements of the ASIC.
United Kingdom
Morningstar Investment Management Europe Limited is authorized and regulated by the Financial Conduct Authority (FCA) to provide advisory services in the United Kingdom. As an authorized firm, Morningstar Investment Management Europe Limited is subject to the requirements and regulations of the FCA. Such requirements relate to, among other things, financial reporting and other reporting obligations, record-keeping, and cross-border requirements.
In addition, our index business, as a non-European Union administrator of indexes, will be seeking recognition from the FCA under EU benchmark regulations that have recently become effective to administer indexes in the EU. Morningstar Investment Management Europe Limited will act as our legal representative for this purpose in the EU. Compliance with these regulations will require us to, among other things, comply with the IOSCO Principles for Financial Benchmarks and related certification requirements.
Other Regions
We have a variety of other entities (including in Canada, France, Hong Kong, India, Japan, Korea, and South Africa) that are registered with their respective regulatory bodies; however, the amount of business conducted by these entities related to the registration is relatively small.
Additional legislation and regulations, including those relating to the activities of investment advisors and broker-dealers, changes in rules imposed by the SEC or other U.S. or non-U.S. regulatory authorities and self-regulatory organizations, or changes in the interpretation or enforcement of existing laws and rules may adversely affect our business and profitability.
Employees
We had 4,920 employees globally as of December 31, 2017, including approximately 1,050 data analysts, 80 designers, 460 investment analysts (including consulting and quantitative research analysts), 1,310 programmers and technology staff, and 530 sales and marketing professionals. Our U.S.-based employees are not represented by any unions, and we have never experienced a walkout or strike.
Executive Officers
As of March 1, 2018, we had nine executive officers. The table below summarizes information about each of these officers.
21
Name | Age | Position | ||
Joe Mansueto | 61 | Executive Chairman | ||
Kunal Kapoor | 42 | Chief Executive Officer | ||
Jason Dubinsky | 44 | Chief Financial Officer | ||
Bevin Desmond | 51 | Head of Talent and Culture | ||
Danny Dunn | 42 | Chief Revenue Officer | ||
Haywood Kelly | 49 | Head of Global Research | ||
Pat Maloney | 60 | General Counsel | ||
Daniel Needham | 39 | President and Chief Investment Officer, Investment Management | ||
Tricia Rothschild | 51 | Chief Product Officer | ||
Joe Mansueto
Joe Mansueto founded Morningstar in 1984 and became executive chairman in 2017. He has served as chairman of the board since the company's inception. He served as our chief executive officer from 1984 to 1996 and again from 2000 to 2016.
Under Joe’s leadership, Morningstar has been named twice to Fortune magazine’s “100 Best Companies to Work For” list, in 2011 and 2012. The Chicago Tribune recognized Morningstar as one of the top 100 workplaces in the Chicago area in 2010, 2011, and 2012, and Crain’s Chicago Business listed Morningstar in its Fast Fifty feature in 2007, 2008, 2009, and 2011. Morningstar won the 2010 AIGA Chicago Chapter Corporate Design Leadership Award, which recognizes forward-thinking organizations that have advanced design by promoting it as a meaningful business policy.
In December 2016, InvestmentNews named Joe to its list of 20 Icons & Innovators. MutualFundWire.com recognized Joe as one of the 10 most influential individuals in the mutual fund industry in 2015, and he was the recipient of PLANSPONSOR’s Lifetime Achievement Award in 2013. In 2010, Joe received the Tiburon CEO Summit award, MutualFundWire.com named him ninth on its list of the 100 Most Influential People of the year, and Chicago magazine listed Joe among its top 40 Chicago pioneers over the past four decades. In 2007, SmartMoney magazine recognized him in the “SmartMoney Power 30,” its annual list of the 30 most powerful forces in business and finance. He received the Distinguished Entrepreneurial Alumnus Award from the University of Chicago Booth School of Business in 2000.
Joe holds a bachelor's degree in business administration from The University of Chicago and a master's degree in business administration from The University of Chicago Booth School of Business.
Kunal Kapoor
Kunal Kapoor is chief executive officer of Morningstar and a member of our board of directors. Before assuming his current role in 2017, he served as president, responsible for product development and innovation, sales and marketing, and driving strategic prioritization across the firm.
Before becoming president in 2015, Kunal was head of global products and client solutions. Kunal became head of our global client solutions group in 2013 and took on additional responsibility for the products group in February 2014. For part of 2013, he was president of our Data Division, and from 2010 until 2012, he was president of Equity and Market Data/Software. In 2009 and 2010, he was president of Individual Software. Kunal joined Morningstar in 1997.
He holds a bachelor's degree in economics and environmental policy from Monmouth College and a master's degree in business administration from The University of Chicago Booth School of Business. He also holds the Chartered Financial Analyst (CFA) designation.
22
Jason Dubinsky
Jason Dubinsky is chief financial officer for Morningstar, responsible for controllership, tax, treasury, internal audit, financial planning and analysis, and investor relations.
Before joining Morningstar in 2017, Jason served as senior vice president and chief financial officer of planning and central operations for Walgreens Boots Alliance, Inc., where he was responsible for accounting and shared service functions for Walgreens' U.S. operations and led the financial planning and analysis function for the global business. Prior to the merger of Walgreens and Alliance Boots in 2014, he was Walgreens' vice president of finance and treasurer, with responsibility for business unit finance, treasury operations, risk management, and investor relations. Before joining Walgreens in 2009, he served as vice president of investment banking at Goldman Sachs and Lehman Brothers, where he led mergers and acquisitions and corporate finance activity for clients across various industries.
Jason holds a bachelor's degree in business administration from the University of Michigan and a master’s degree in business administration from New York University's Stern School of Business.
Bevin Desmond
Bevin Desmond is head of talent and culture, a role she has held since 2010. She is responsible for overseeing talent and culture for all of Morningstar’s global operations. Previously, she was head of global markets from 2010 to 2017 and head of international operations from 2001 until 2010. She joined Morningstar in 1993.
Bevin holds a bachelor's degree in psychology from St. Mary's College.
Danny Dunn
Danny Dunn is chief revenue officer for Morningstar. He is responsible for sales philosophy, strategy, and execution in order to drive revenue growth.
Before joining Morningstar in 2016, Danny was vice president of the Midwest enterprise unit for IBM, a global information technology firm. He was responsible for marketing, strategy, sales, channels, and customer service for the complete IBM portfolio, including Cloud, Software, Services, Systems, and IBM Credit, LLC in the region. Prior to that, he was regional director for IBM's Chicago enterprise unit in 2013 and 2014, territory director for IBM's Wisconsin business unit from 2011 until June 2013, and territory sales leader for IBM Global Services from 2009 until July 2011. Before joining IBM in 2007, he led sales, account management, and client service at Neology, a software and technology consulting division of SmithBucklin Corporation.
Danny holds a bachelor’s degree from the University of Vermont and a master’s degree in business administration, with concentrations in marketing, strategy, and managerial economics, from the Kellogg School of Management at Northwestern University.
Haywood Kelly
Haywood Kelly is head of global research for Morningstar and oversees our global fund, equity, and credit research and data operations. Before taking on his current role in January 2014, he was head of equity and credit research since 2009 and took on additional responsibility for equity data in 2013. Haywood joined Morningstar in 1991.
He holds a bachelor’s degree in economics from The University of Chicago, where he graduated as a member of Phi Beta Kappa. He also holds the CFA designation.
23
Pat Maloney
Pat Maloney is general counsel for Morningstar. He is responsible for directing Morningstar’s legal department and managing its relationships with outside counsel. He also oversees Morningstar’s compliance department.
Before joining Morningstar in June 2016, Pat was a partner at Sheppard Mullin Richter & Hampton LLP from July 2012 through April 2016 in the firm’s corporate and securities practice. Previously, he was a partner at K&L Gates LLP and its legacy predecessor firm, Bell, Boyd & Lloyd LLP. Early in his career, he was an associate with the New York law firm of Dewey Ballantine and an Assistant General Counsel with the Prudential Insurance Company of America.
Pat holds a bachelor’s degree with honors from The University of Chicago and a juris doctor degree with honors from The University of Chicago Law School. He is admitted to practice law in Illinois and New York.
Daniel Needham
Daniel Needham is president and chief investment officer (CIO) of Morningstar Investment Management and is responsible for building world-class investment management solutions based on our proprietary research. Before taking on his current role in February 2015, he served as CIO for Morningstar Investment Management, and was previously managing director and CIO for Morningstar Investment Management’s Asia-Pacific Operations. He joined our company when Morningstar acquired Intech Pty Ltd (now Ibbotson Associates Australia) in 2009, where he served as chief investment officer. Before joining Intech in 2002, Daniel worked for Zurich Financial Services in Sydney.
He holds a bachelor's degree in commerce with a major in finance and economics from the University of Sydney. He also holds the CFA designation.
Tricia Rothschild
Tricia Rothschild is chief product officer for Morningstar. She is responsible for product strategy, innovation, development, and execution for the solutions delivered to clients.
Before taking on her current role in January 2017, Tricia was head of global advisor solutions for Morningstar, setting the strategic direction for our wealth management and online brokerage business and overseeing priorities for this customer group. From September 2012 until February 2013, Tricia was senior vice president of advisor software for Morningstar. Previously, she served as senior vice president for Morningstar's equity research business and held a variety of research and product management roles after joining Morningstar in 1993.
Tricia holds a bachelor’s degree from Northwestern University and a master’s degree in Russian and Central European economics from Indiana University. She also holds the CFA designation.
Company Information
We were incorporated in Illinois on May 16, 1984. Our corporate headquarters are located at 22 West Washington Street, Chicago, Illinois, 60602.
We maintain a website at http://www.morningstar.com/company. Our annual report on Form 10-K, quarterly reports on Form 10-Q, current reports on Form 8-K, and amendments to any of these documents are available free of charge on this site as soon as reasonably practicable after the reports are filed with or furnished to the SEC. We also post quarterly press releases on our financial results and other documents containing additional information related to our company on this site. We provide this website and the information contained in or connected to it for informational purposes only. That information is not part of this Annual Report on Form 10-K.
24
Item 1A. Risk Factors
You should carefully consider the risks described below and all of the other information included in this Form 10-K when deciding whether to invest in our common stock or otherwise evaluating our business. If any of the following risks materialize, our business, financial condition, or operating results could suffer. In this case, the trading price of our common stock could decline, and you may lose all or part of your investment.
Our investment management operations may subject us to liability for any losses that result from a breach of our fiduciary duties.
Three of our subsidiaries, Morningstar Investment Management LLC, Morningstar Investment Services LLC, and Morningstar Research Services LLC, are registered as investment advisors with the SEC under the Investment Advisers Act of 1940, as amended. As registered investment advisors, these companies are subject to the requirements and regulations of the Advisers Act. These requirements relate to, among other things, record-keeping, reporting, and standards of care, as well as general anti-fraud prohibitions. As registered investment advisors, these subsidiaries are subject to on-site examination by the SEC.
In addition, in cases where these subsidiaries provide investment advisory services to retirement plans and their participants, they may be acting as fiduciaries under the Employee Retirement Income Security Act of 1974. As fiduciaries under ERISA, they have obligations to act in the best interest of their clients. They also have duties of loyalty and prudence, as well as duties to diversify investments and to follow plan documents to comply with the applicable portions of ERISA.
Our subsidiaries outside the United States that have investment advisory operations are subject to similar requirements.
We may face liabilities for actual or claimed breaches of our fiduciary duties, particularly in areas where we provide retirement advice and managed retirement accounts. In some of our retirement contracts, we act as an ERISA fiduciary by, for example, selecting and monitoring a broad range of diversified plan options. We also provide a managed account service for retirement plan participants who elect to have their accounts managed by our programs. Such activities have been the subject of increasing class action litigation in recent years. For example, in 2017, a participant in a pension plan filed a putative class action proceeding against us alleging that we, together with other defendant parties, violated the Racketeer Influenced and Corrupt Organizations Act by allegedly engaging in actions to steer plan participants into high-cost investments that pay unwarranted fees to the defendants. We are vigorously contesting this proceeding, which is described in more detail in Item 3 of this Form 10-K under Legal Proceedings. As of December 31, 2017, we had $57.6 billion in assets under management in our managed retirement accounts. We could face substantial liabilities related to our management of these assets.
We rely on automated investment technology for our retirement advice and managed retirement accounts services. The Wealth Forecasting Engine is our core advice and managed accounts engine that determines appropriate asset allocations for retirement plan participants and assigns individuals to portfolios. We also rely on automated portfolio construction tools. Problems could arise if these programs assigned retirement plan participants to the wrong portfolios, particularly if we failed to detect program errors over an extended period. Clients may take legal action against us for an actual or claimed breach of a fiduciary duty. If we make an error, we may be subject to potentially large liabilities for make-whole payments and/or litigation. We cannot quantify the potential size of these liabilities with any level of precision.
In addition, we may face other legal liabilities based on the quality and outcome of our investment advisory recommendations, even in the absence of an actual or claimed breach of fiduciary duty, or based on our investment management fees and expenses. In total, we provided investment advisory and management services on approximately $195 billion in assets as of December 31, 2017. We could face substantial liabilities related to our work on these assets.
25
Failing to maintain and protect our brand, independence, and reputation may harm our business. Our reputation and business may also be harmed by allegations made about possible conflicts of interest or by other negative publicity or media reports.
We believe independence is at the core of our business, and our reputation is our greatest corporate asset. We rely on our reputation for integrity and high-caliber products and services. Any failure to uphold our high ethical standards and ensure that our customers have a consistently positive experience with us could damage our reputation as an objective, honest, and credible source for investment research and information. Allegations of improper conduct, whether the ultimate outcome is favorable or unfavorable to us, as well as any negative publicity or media reports about Morningstar, whether valid or not, may harm our reputation and damage our business. For instance, in October 2017, The Wall Street Journal ran an article critical of our fund star and analyst ratings. We publicly and comprehensively disputed the assertions made in the article, but the publication of such an article illustrates the risks of negative publicity to our business.
We provide ratings, analyst research, and investment recommendations on mutual funds and other investment products offered by our institutional clients. We also provide investment advisory and investment management services. In some cases, we make investment recommendations (such as Select Lists) within the framework of client constraints. While we don’t charge asset management firms for their products to be rated, we do charge licensing fees for the use of our ratings. We also receive payments from issuers for our new-issue ratings on various types of asset-backed securities and corporate bond issues. These payments may create the perception that our ratings, research, and recommendations are not impartial.
This perception may undermine the confidence of our customers and potential customers in our reputation as a provider of independent research. Any such loss of confidence or damage to our reputation could hurt our business.
Our reputation may also be harmed by factors outside of our control, such as news reports about our clients or adverse publicity about certain investment products. Our reputation could also suffer if we fail to produce competitive performance in our investment management offerings.
Failing to differentiate our products and continuously create innovative, proprietary research tools may harm our competitive position and business results.
We attribute much of our company's success over the past 34 years to our ability to develop innovative, proprietary research tools, such as the Morningstar Rating, Morningstar Style Box, Ownership Zone, and Portfolio X-Ray. More recently, we’ve developed unique concepts and tools such as the Wealth Forecasting Engine, Gamma, Total Wealth Approach, and Best Interest Scorecard. We believe these innovations set us apart because most of our competitors focus on providing data or software rather than creating their own proprietary research frameworks. We also believe our ability to develop innovative, proprietary research tools is at the core of what drives Morningstar’s value for all of our customer groups.
If we fail to continuously innovate and develop new tools to meet the needs of our customers, our competitive position and business results may suffer. In addition, our reputation could be harmed if we’re perceived as not moving quickly enough to meet the changing needs of investors. Clients may also delay purchases of our currently offered research tools in anticipation of us offering new products or enhanced versions of existing products. Our competitive position and business results may also suffer if other companies are able to successfully introduce innovative, proprietary research tools that gain attention from our clients. We believe lower technology costs, the growth of open software platforms, and cloud computing technologies have lowered the barriers to entry for new competitors, making it easier for new players to enter the market. Smaller companies, including startup firms funded by private equity and venture capital, may be able to move more quickly to develop research and tools that gain a wide following.
In addition, the value of our data, research and software tools may be negatively affected by the increasing amount of information and tools that are available for free, or at low cost, through internet sources or other low-cost delivery systems. Although we believe our products and services contain value-added features and functionality that deeply embed them in our customers’ workflows, such developments may over time reduce the demand for, or customers’ willingness to pay for, certain of our products and services.
If we fail to introduce innovative, proprietary research tools and frameworks, we may not generate enough interest from potential clients to win new business. We cannot guarantee that we will successfully develop new product features and tools that differentiate our product offerings from those of our competitors.
26
In addition, we must make long-term investments and commit significant resources often before knowing whether such investments will result in products or services that satisfy our clients’ needs or generate revenues sufficient to justify such investments. In addition, from time to time, we also incur costs to transition clients to new or enhanced products or services. Such transitions can involve material execution risks and challenges. If we are unable to manage these investments and transitions successfully, our business, financial condition, and results of operations could be materially adversely affected.
Failing to respond to technological change, keep pace with new technology developments, or adopt a successful technology strategy may negatively affect our competitive position and business results.
We believe the technology landscape has been changing at an accelerating rate over the past several years. Changes in technology are fundamentally changing the ways investors access data and content. Examples include the shift from local network computing to cloud-based systems, the proliferation of wireless mobile devices, and rapid acceleration in the use of social media platforms.
Our software development process is based on frequently rolling out new features so that we can quickly incorporate user feedback. While some changes in technology may offer opportunities for Morningstar, we cannot guarantee that we will successfully adapt our product offerings to meet evolving customer needs. If we fail to develop and implement new technology rapidly enough, we may sacrifice new business opportunities or renewals from existing customers. We may also incur additional operating expense if major software projects take longer than anticipated. Our competitive position and business results may suffer if we fail to develop new technologies to meet client demands, if our execution speed is too slow, or if we adopt a technology strategy that doesn't align with changes in the market.
Our results could suffer if the mutual fund industry continues to experience slower growth, if actively managed equity funds continue to attract less investor attention, or if the industry continues to meaningfully consolidate.
We generate a significant portion of our revenue from products and services related to mutual funds, and part of our growth since 1984 can be attributed to favorable industry trends. The mutual fund industry has experienced substantial growth over the past 30 to 40 years, but suffered during the market downturn of 2008 and 2009. Since then, fund assets have increased, but at a slower rate than in previous years. Some of that slower growth is attributable to the growth of ETFs as a mutual fund alternative, and we have accordingly expanded our research coverage and analyst ratings to include ETFs. However, ETFs generally track passive investing strategies and charge lower management fees than active strategies, which may affect both the profitability of asset managers, on whose success we in part depend, and the perceived value of our research regarding ETFs.
A significant portion of our fund research has historically focused on equity-related funds. In addition, we are best-known for our data and analyst research on actively managed equity funds. Over the past 15 years, passively managed index funds have seen greater investor interest, and this trend has accelerated in recent years. In 2017, actively managed mutual funds suffered about $7 billion in net outflows, compared with net inflows of more than $690 billion for passively managed funds. Overall, we estimate that passively managed portfolios now account for more than one-third of combined mutual fund and ETF assets. The growth of online wealth management tools that provide automated, algorithm-based portfolio management advice, sometimes called robo-advice, may further accelerate the adoption of passively managed portfolios and reduce demand for our data and analyst research.
The growth of the mutual fund industry is also being affected by increasing merger and acquisition activity within the asset management industry, which is reducing the number of asset managers offering mutual funds and ETFs, the pruning by some mutual fund and ETF platforms of the number of funds available for purchase, and the continuing impacts of regulation, such as MiFID II’s requirement that asset managers pay banks and brokers for investment research, which may be a competitive advantage for larger asset managers better able to absorb such costs.
Prolonged downturns or volatility in the financial markets, increased investor interest in other investment vehicles, or a lack of investor confidence could continue to reduce investor interest and investment activity. In addition, a continued lessening of investor interest in actively managed equity funds could decrease demand for our products, including our software, data, and analyst research.
27
Our business continuity program may not be adequate in the event of a material emergency affecting one or more of our United States or offshore business centers or adverse political or regulatory developments in countries in which we have significant data and development operations.
We have approximately 1,360 employees working at our corporate headquarters in Chicago, Illinois. These include most of our executive leadership team as well as substantial numbers of employees involved in the delivery of most of our major products and services. If our headquarters were to become unusable due to a natural disaster, a violent incident or another dangerous emergency, we might not be able to continue business operations at an acceptable level that would meet all our legal and contractual commitments. Our failure to successfully implement and deploy a business continuity plan, either at an enterprise level or with respect to particular business centers, could materially affect our business operations and have a material adverse effect on our financial condition and results of operations.
We now have approximately 950 employees working in our data and technology development center in Shenzhen, China. We rely on these employees to maintain and update our mutual fund database and work on other projects. Because China has a restrictive government under centralized control and the relationship between the United States and China is experiencing a period of increased political, military, and commercial tensions, our operations are subject to political and regulatory risk, which is inherently unpredictable. Laws and regulations relating to data privacy, security, and protection of intellectual property rights in China, as well as the enforcement environment for such laws and regulations, are in certain cases uncertain and evolving. In addition, this facility is subject from time to time to extreme weather events. The concentration of certain types of development and data work carried out at this facility also involves operational risks for parts of our network infrastructure. While we have short-term backup plans in place, it would be difficult for us to maintain and update our mutual fund database if we were unable to access our Shenzhen operations for an extended period of time. Any difficulties that we face in continuing to operate our development center in China may harm our business and have a negative impact on the products and services we provide.
We have approximately 935 employees who work at our data collection, technology and operational center in Mumbai, India. These employees maintain and update our equity database and provide shared services to many of our operations. This location is subject to extreme weather events and political unrest, including public protests which can disrupt transportation and make it difficult for employees to commute to and from work. The electrical infrastructure of Mumbai is also subject to more frequent interruptions than are experienced at our other major facilities. In addition, Mumbai has experienced and may in the future experience terrorist attacks. While we have short-term backup plans in place to address such business continuity issues, it would be challenging for us to maintain and update our equity database or continue to provide certain shared services to our worldwide operations if we were unable to access our Mumbai operations for an extended period of time.
PitchBook, which we acquired in December 2016, has approximately 230 contract employees based in Calcutta and Pune, India who support its data and research operations and approximately 100 contract employees based in Ukraine who work on software development. Ukraine has been subject to significant political unrest and military incursions. Any disruption to PitchBook's contract operations in these locations would make it difficult for PitchBook to meet its operating goals.
We could face liability related to our storage of personal information about individuals as well as portfolio and account-level information.
Customers routinely enter personal investment and financial information, including portfolio holdings, account numbers, and credit card information, on our websites. In addition, we handle increasing amounts of personally identifiable information in areas such as Morningstar Retirement Manager, Morningstar Managed Portfolios, ByAllAccounts, Morningstar Office, Enterprise Data Management, and Morningstar.com. ByAllAccounts uses technology to collect, consolidate, and transform financial account data and deliver it to any platform, and accordingly handles a large volume of personally identifiable information as part of its normal business operations.
28
Any failure to safeguard this information could damage our reputation and business results. We must continuously invest in systems, processes, and controls to guard against the risk of improper access to this information, which could be disclosed through employee errors, other inadvertent release, social engineering, failure to restrict access, or failure to properly purge and protect data. We may suffer malicious attacks by individuals or groups seeking to attack our products and services or penetrate our network and databases to gain access to personal data or to launch or coordinate distributed denial of service attacks. These attacks have become increasingly frequent, sophisticated, and difficult to detect.
Contractual commitments to customers as well as laws and industry regulations related to data protection, system availability, and privacy require us to safeguard critical data. We are also required to take appropriate steps to safeguard credit card numbers, Social Security numbers, and other information about individuals or their accounts. In the European Union, the General Data Protection Regulation (GDPR), which will become effective in May 2018, will among other things impose stringent additional requirements regarding the information to be provided to, and the consents required from, individuals to justify a business using their personal data, as well as new rights of data subjects to be forgotten, data portability rights and the right to object to certain automated decision-making processes. Given the growing concern over data privacy and identity theft, we have been and expect to continue to be subject to increased scrutiny by clients and regulators. We could be subject to liability if we were to inappropriately collect, retain, or disclose any user's personal information or if third parties were able to penetrate our network security or otherwise gain access to any user's name, address, Social Security number, account numbers, portfolio holdings, credit card information, or other personal information. We could also be subject to liability if we fail to meet the requirements of laws and regulations such as the GDPR, which contemplate substantial enterprise-level penalties for non-compliance, in a timely or thorough manner.
Compliance failures, regulatory action, or changes in laws applicable to our investment advisory or credit rating operations could adversely affect our business.
Our investment management operations are a growing part of our overall business. The securities laws and other laws that govern our investment advisory activities are complex. The activities of our investment advisory operations are subject to provisions of the Advisers Act and ERISA. In addition, Morningstar Investment Services is a broker-dealer registered under the Exchange Act and is subject to the rules of FINRA. We also provide investment advisory services in other areas around the world, and our operations are subject to additional regulations in markets outside the United States. If we fail to comply with securities laws and other regulatory requirements, we may be subject to fines or other events that could have a negative effect on our business.
Over the past several years, we have also made significant investments in our credit rating business. Our Morningstar Credit Ratings, LLC subsidiary is an NRSRO that specializes in structured finance, corporate credit issuers, and financial institutions. Credit rating and research providers continue to be subject to intensive regulatory scrutiny. As an NRSRO, Morningstar Credit Ratings is subject to various requirements and regulations under the Exchange Act relating to, among other things, record-keeping, reporting, governance, and conflicts of interest. As part of its NRSRO registration, Morningstar Credit Ratings is subject to annual examination by the SEC, as well as periodic investigations by the SEC and other governmental authorities relating to matters of regulatory interest such as industry practices and personnel matters. The cost and management distraction resulting from such examinations and investigations may have a negative effect on our credit rating business.
Our index business could be negatively affected by increased regulation of benchmarks generally, which could increase the costs and risks of producing and administering indexes. Such regulations may discourage market participants from continuing to use, administer or contribute to indexes, trigger changes in the rules or methodologies relating indexes, and/or lead to declining demand for indexes.
The laws, rules, and regulations, and their interpretations, applicable to our business may change in the future, and we may not be able to comply with these changes without extensive changes to our business practices. In addition, the broad scope of our business operations makes it more difficult to monitor areas that may be subject to regulatory and compliance risk. If we fail to comply with any applicable law, rule, or regulation, we could be fined, sanctioned, or barred from providing investment advisory, credit rating or index services in the future, which could adversely affect our business.
29
An outage of our database, technology-based products and services, or network facilities could result in reduced revenue and the loss of customers, and our movement of parts of our technological infrastructure to the public cloud could expose us to various third party provider risks
The success of our business depends upon our ability to deliver time-sensitive, up-to-date data and information. We rely primarily on our computer equipment, database storage facilities, and other network equipment, which is located across multiple facilities in the United States. We also have extensive information systems outside the United States. Our mission-critical databases and networks are complex and interdependent, which increases the risk of failure. Problems in our network systems may lead to cascading effects involving product downtime, overloading of third-party data centers, and other issues that may affect our clients. Many of our client contracts contain service-level agreements that require us to meet certain obligations for delivering time-sensitive, up-to-date data and information. We may not be able to meet these obligations in the event of failure or downtime in our information systems.
Our operations and those of our suppliers and customers are vulnerable to interruption by fire, earthquake, power loss, telecommunications failure, terrorist attacks, wars, computer viruses, and other events beyond our control. Our database and network facilities may also be vulnerable to external attacks that misappropriate our data, corrupt our databases, or limit access to our information systems. To defend against these threats, we implement a series of controls focusing on both prevention and detection, including firewalls, intrusion detection systems, automated scanning and testing, server hardening, anti-virus software, training, and patch management. We make significant investments in servers, storage, and other network infrastructure to prevent incidents of network failure and downtime, but we cannot guarantee that these efforts will work as planned.
Most of our products and services currently depend heavily on our electronic delivery systems and the Internet, although we are shifting the delivery of several of our products and services to cloud-based delivery systems. Our ability to deliver information using the Internet may be impaired because of infrastructure failures, service outages at third-party Internet providers, malicious attacks, or other factors. If disruptions, failures, or slowdowns of our electronic delivery systems or the Internet occur, our ability to distribute our products and services effectively and to serve our customers may be impaired.
We maintain off-site back-up facilities for our data, but we cannot guarantee that these facilities will operate as expected during an interruption that affects our headquarters. There may be single points of failure that affect our core databases, data transfer interfaces, or storage area networks. We may not be able to fully recover data or information lost during a database or network facility outage. Any losses, service disruption, or damages incurred by us could have a material adverse effect on our business, operating results, or financial condition.
Our gradual movement of parts of our technological infrastructure to the public cloud and software as a service (SaaS) solutions presents a variety of additional risks, including risks relating to sharing the same computing resources with other users, the use by cloud and SaaS providers of virtualization products and various security issues relating thereto, reliance on cloud and SaaS providers’ authentication, authorization and access control mechanisms, a lack of control over cloud and SaaS providers’ redundancy systems and fault tolerances, and a reduced ability to directly address client concerns over data security and privacy. Any disruption of or interference with our use of the public cloud or SaaS solutions, or any information security breach at any cloud or SaaS provider, could materially impact our operations and have an adverse effect on our business. Over time, a growing dependence of our technology infrastructure on the public cloud and SaaS solutions also risks us becoming overly dependent on particular suppliers, which could adversely affect the pricing we receive from such suppliers and limit our ability to transition away from such suppliers in the event of service-quality issues.
Downturns in the financial sector, global financial markets, and global economy may hurt our results, resulting in lower revenue from asset-based fees, transaction-based revenue, or other parts of our business.
Our business results are partly driven by factors outside of our control, including general economic and financial market trends. Any unfavorable changes in the environment we operate in could cause a corresponding negative effect on our business results. As a result, we may experience lower revenue, operating income, and other financial results in the event of a market downturn.
30
Many of our customers are asset management firms and other financial services companies, which are also subject to external trends and changes. For example, the financial crisis of 2008 and 2009 led to spending cutbacks among many of the companies to which we sell. Some institutional clients have implemented additional review processes for new contracts or started providing certain services, such as investment management, in-house rather than hiring outside service providers. Some institutional clients have also reduced the scope of their operations, and merger and acquisition activity in the asset management sector has in the past, and may in the future, reduce the number of potential asset management clients.
Many companies in the financial services industry have also been subject to increasing government regulation and pressure to reduce fees. In turn, many of these firms have sought to reduce their operating costs by working with fewer service providers and/or negotiating lower fees for services they purchase.
In addition, our revenue from asset-based fees may be adversely affected by market declines, cash outflows from portfolios that we help manage, and the industry-wide trend toward lower asset-based fees.
In 2017, asset-based revenue made up approximately 21% of our consolidated revenue. The amount of asset-based revenue we earn primarily depends on the value of assets on which we provide advisory services, and the size of our asset base can increase or decrease along with trends in market performance. In 2017, the U.S. and many international markets experienced substantial valuation increases. These market trends were highly favorable in terms of the value of assets we have under management or advisement, but there can be no assurance that these trends will continue and, if they do not, our asset-based revenue may be negatively affected.
Asset levels can also be affected if net inflows into the portfolios on which we provide investment advisory services drop or if these portfolios experience redemptions. A drop in net inflows or an increase in redemptions can result from a variety of factors, including overall market conditions and volatility or a decline in investment performance. If the level of assets on which we provide investment advisory or investment management services goes down, we expect our fee-based revenue to show a corresponding decline.
Our business results may also be hurt by negative trends in Internet advertising sales, which made up about 3% of consolidated revenue in 2017. Many advertisers have shifted some of their advertising spend to programmatic buying platforms that target users on other sites, which has from time to time had a negative effect on advertising revenue for our website for individual investors, Morningstar.com. We are uncertain whether this trend will continue.
Our structured credit rating business, which made up about 3% of consolidated revenue in 2017, is subject to volatility from trends in new issuance of commercial mortgage-backed securities and other structured credits. If industry-wide issuance for such securities declines, our revenue associated with this line of business may also go down. We have also expanded our coverage to include corporate credit issuers and financial institutions, which are also subject to volatility in issuance patterns based on market conditions.
Our PitchBook Data business may also be subject to cyclical trends. Many of PitchBook's clients are investment banks and other participants in the capital and merger and acquisition markets, which are subject to periodic business downturns driven by changes in such markets. During these downturns, they often seek to reduce spending on third-party services as well as the number of employees, which would directly affect the number of prospective clients for PitchBook. As a data and research provider focusing on the private capital markets (including venture capital, private equity, and M&A), PitchBook may also be subject to volatility based on the amount of activity and market interest in these areas.
Our acquisitions and other investments may not produce the results we anticipate. We have also incurred debt in connection with acquisitions, which may limit our financial flexibility.
We've completed numerous acquisitions over the past 10 years. In 2016, we acquired PitchBook. This acquisition presents several potential challenges and risks. We may not achieve the growth targets that we established for PitchBook at the time of the acquisition. The process of integration may require more resources than we anticipated. We may assume unintended liabilities or experience operating difficulties or costs that we did not anticipate. We may also fail to retain key personnel of the acquired business, including PitchBook founder and chief executive officer John Gabbert, which would make it difficult to follow through on our operating goals for the acquisition. If our acquisition of PitchBook does not generate the results we anticipate, it could have a material adverse effect on our business, financial condition, and results of operations. We may also fail to generate enough revenue or profits from this acquisition to earn a positive return on the associated purchase price.
31
To fund this acquisition, we increased the principal amount available for borrowing under our existing revolving credit facility to $300.0 million and extended the term of this facility to three years. Under the terms of our agreement with the lender, we are now subject to certain restrictions and financial covenants, which may limit our financial flexibility. As of December 31, 2017, borrowings in the principal amount of $180.0 million remain outstanding under such facility.
In 2017, we purchased a 40% interest in Sustainalytics Holding B.V. (Sustainalytics), a leading global provider of environmental, social and governance (ESG) research and ratings. While we obtained various rights in connection with that investment, including representation on Sustainalytics’ Board of Directors, we do not own a controlling interest in Sustainalytics and the future value of our investment is highly dependent on the management skill of the managers of Sustainalytics.
We expect to continue making acquisitions and establishing investments and joint ventures as part of our long-term business strategy. Acquisitions, investments, and joint ventures involve a number of risks. They can be time-consuming and may divert management’s attention from day-to-day operations, particularly if numerous acquisitions are in process at the same time. Financing an acquisition could result in dilution from issuing equity securities, reduce our financial flexibility because of reductions in our cash balance, or result in a weaker balance sheet from incurring debt.
Our future success depends on our ability to recruit, develop, and retain qualified employees.
We experience competition for analysts, technology experts, and other employees from other companies and organizations. Competition for these employees is intense, and we may not be able to retain our existing employees or be able to recruit and retain other highly qualified personnel in the future.
Our future success also depends on the continued service of our executive officers, including Joe Mansueto, our executive chairman and controlling shareholder. At the end of 2016, Joe changed his role to focus less on our day-to-day business operations, but he remains heavily involved our strategy and overall company direction. The loss of Joe, our chief executive officer, Kunal Kapoor, or other executive officers could hurt our business, operating results, or financial condition. We do not have employment agreements, non-compete agreements, or life insurance policies in place with any of our executive officers. They may leave us and work for our competitors or start their own competing businesses.
Our operations outside of the United States involve additional challenges that we may not be able to meet.
Our operations outside of the United States generated $224.7 million in revenue in 2017, or about 25% of our consolidated revenue. There are risks inherent in doing business outside the United States, including challenges in reaching new markets because of established competitors and limited brand recognition; difficulties in staffing, managing, and integrating non-U.S. operations; difficulties in coordinating and sharing information globally; differences in laws and policies from country to country; exposure to varying legal standards, including intellectual property protection laws; potential tax exposure related to transfer pricing and other issues; heightened risk of fraud and noncompliance; and currency exchange rates and exchange controls. These risks could hamper our ability to expand around the world, which may hurt our financial performance and ability to grow.
We don't engage in currency hedging or have any positions in derivative instruments to hedge our currency risk. Our reported revenue could suffer if certain foreign currencies decline relative to the U.S. dollar, although the impact on operating income may be offset by an opposing currency impact on locally based operating expense.
32
We could face liability for the information we publish or the reports and other documents produced by our software products, including information, reports and documents based on data we obtain from other parties.
We may be subject to claims for securities law violations, defamation (including libel and slander), negligence, or other claims relating to the information we publish, including our research and ratings on issuers of structured credits and corporate credits. For example, investors may take legal action against us if they rely on published information that contains an error, or a company may claim that we have made a defamatory statement about it or its employees. Clients of our software products used by advisors or asset managers or governmental regulation of such clients may make claims against us based on software or data errors that affect investment reporting or client billing. Even though most of our contracts for such products contain limitations of our liability in such cases, we may be required to make such clients or their customers whole for any losses in order to maintain our business relationships. We could also be subject to claims based on the content that is accessible from our website through links to other websites.
We rely on a variety of outside parties as the original sources for the information we use in our published data. These sources include securities exchanges, fund companies, hedge funds, transfer agents, and other data providers. We also incorporate data from a variety of third-party sources for PitchBook Data. Accordingly, in addition to possible exposure for publishing incorrect information that results directly from our own errors, we could face liability based on inaccurate data provided to us by others.
We could be subject to claims by providers of publicly available data and information we compile from websites and other sources that we have improperly obtained that data in violation of the source’s copyrights or terms of use, or based on the provisions of new legislation such as GDPR that limits the bases on which businesses can collect personal information from and about individuals. We could also be subject to claims from third parties from which we license data and information that we have used or re-distributed the data or information in ways not permitted by our license rights. Defending claims based on the information we publish could be expensive and time-consuming and could adversely impact our business, operating results, and financial condition.
Failure to protect our intellectual property rights, or claims of intellectual property infringement against us, could harm our brand and ability to compete effectively.
The steps we have taken to protect our intellectual property may not be adequate to safeguard our proprietary information. We rely primarily on patent, trademark, copyright and trade secret rights, as well as contractual protections and technical safeguards, to protect our intellectual property rights and proprietary information. Despite these efforts, third parties may still attempt to challenge, invalidate or circumvent our rights or improperly obtain our proprietary information. Further, effective trademark, copyright, and trade secret protection may not be available in every country in which we offer our services. Failure to adequately protect our intellectual property could harm our brand, devalue our proprietary content, and affect our ability to compete in the marketplace.
From time to time, we encounter jurisdictions in which one or more third parties have a pre-existing trademark registration in certain relevant international classes that may prevent us from registering our own marks in those jurisdictions. Our continued ability to use the “Morningstar” name or logo, either on a stand-alone basis or in association with certain products or services, could be compromised in those jurisdictions because of these pre-existing registrations. Similarly, from time to time, we encounter situations in certain jurisdictions where one or more third parties are already using the Morningstar name, either as part of a registered corporate name, a registered domain name or otherwise. Our ability to effectively market certain products and/or services in those locations could be adversely affected by these pre-existing usages.
We have from time to time been subject to claims by third parties alleging infringement of their intellectual property rights. Such claims can also be alleged against clients, customers, or distributors of our products or services whom we have agreed to indemnify against third party claims of infringement. The defense of such claims can be costly and consume valuable management time and attention. We may be forced to settle such claims on unfavorable terms, which can include the payment of damages, the entry into royalty or licensing arrangements on commercially unfavorable terms, or the suspension of our ability to offer affected products or services. If litigation were to arise from any such claim, there can be no certainty we would prevail in it. If any of these risks were to materialize, it could have a material adverse effect on our business, financial condition or results of operations.
33
Control by a principal shareholder could adversely affect our other shareholders.
As of December 31, 2017, Joe Mansueto, our executive chairman, owned approximately 57% of our outstanding common stock. As a result, he has the ability to control substantially all matters submitted to our shareholders for approval, including the election and removal of directors and any merger, consolidation, or sale of our assets. He also has the ability to control our management and affairs. This concentration of ownership may delay or prevent a change in control; impede a merger, consolidation, takeover, or other business combination involving Morningstar; discourage a potential acquirer from making a tender offer or otherwise attempting to obtain control of the company; or result in actions that may be opposed by other shareholders.
Fluctuations in our operating results may negatively affect our stock price.
We believe our business has relatively large fixed costs and low variable costs, which magnify the impact of revenue fluctuations on our operating results. As a result, a decline in our revenue may lead to a larger decline in operating income. In addition, because we manage our business with a long-term perspective, we generally don’t make significant adjustments to our strategy or cost structure in response to short-term factors. As a result, our operating results may suffer in the short term. In addition, we do not provide earnings guidance or hold one-on-one meetings with institutional investors and research analysts. Because of this policy and limited analyst coverage on our stock, our stock price may not always reflect the intrinsic value of our business and assets. If our operating results or other operating metrics fail to meet the expectations of outside research analysts and investors, the market price of our common stock may decline.
The future sale of shares of our common stock may negatively affect our stock price.
If our shareholders sell substantial amounts of our common stock, the market price of our common stock could fall. A reduction in ownership by Joe Mansueto or any other large shareholder could cause the market price of our common stock to fall. In addition, the average daily trading volume in our stock is relatively low. The lack of trading activity in our stock may lead to greater fluctuations in our stock price. Low trading volume may also make it difficult for shareholders to make transactions in a timely fashion.
Item 1B. Unresolved Staff Comments
We do not have any unresolved comments from the Staff of the Securities and Exchange Commission regarding our periodic or current reports under the Exchange Act.
Item 2. Properties
As of December 31, 2017, we leased approximately 457,000 square feet of office space for our U.S. operations, primarily for our corporate headquarters located in Chicago, Illinois. We also lease another 435,000 square feet of office space in 26 other countries around the world, including approximately 141,000 square feet in Shenzhen, China. We believe that our existing and planned office facilities are adequate for our needs and that additional or substitute space is available to accommodate growth and expansion.
Item 3. Legal Proceedings
Michael D. Green
In August 2017, Michael D. Green, individually and purportedly on behalf of all others similarly situated, filed a complaint in the United States District Court for the Northern District of Illinois. The complaint names as defendants Morningstar, Inc., Prudential Investment Management Services LLC, and Prudential Retirement Insurance and Annuity Co., and contains one count alleging violation of the Racketeer Influenced and Corrupt Organizations Act (RICO). Plaintiff, a participant in a pension plan, alleges that the defendants engaged in concerted racketeering actions to steer plan participants into high-cost investments that pay unwarranted fees to the defendants. The complaint seeks unspecified compensatory damages for plaintiff and the members of the putative class, treble damages, injunctive relief, costs, and attorneys’ fees. Morningstar has filed a motion to dismiss the complaint, which is fully briefed and under advisement by the court. Although Morningstar is vigorously contesting the claim asserted, we cannot predict the outcome of the proceeding.
34
Other Matters
We are involved from time to time in legal proceedings and litigation that arise in the normal course of our business. While it is difficult to predict the outcome of any particular proceeding, we do not believe the result of any of these matters will have a material adverse effect on our business, operating results, or financial position.
Item 4. Mine Safety Disclosures
Not applicable.
35
Part II
Item 5. Market for Registrant's Common Equity, Related Stockholder Matters and Issuer Purchases of Equity Securities
Our common stock is listed on the Nasdaq Global Select Market under the symbol MORN.
The following table shows the high and low price per share of our common stock for the periods indicated, as reported on the Nasdaq Global Select Market:
2017 | 2016 | |||||||||||||
High | Low | High | Low | |||||||||||
First Quarter | $ | 81.97 | $ | 72.85 | $ | 88.66 | $ | 74.78 | ||||||
Second Quarter | 79.55 | 68.43 | 89.44 | 76.57 | ||||||||||
Third Quarter | 85.58 | 77.46 | 85.49 | 73.84 | ||||||||||
Fourth Quarter | 99.11 | 82.64 | 79.30 | 67.74 | ||||||||||
As of February 16, 2018, the last reported sale price on the Nasdaq Global Select Market for our common stock was $96.55 per share, and there were 1,164 shareholders of record of our common stock.
See Note 12 of the Notes to our Consolidated Financial Statements for a description of our equity compensation plans.
The following table shows dividends declared and paid for the periods indicated:
2017 | 2016 | |||||||||||||
Dividends declared | Dividends paid | Dividends declared | Dividends paid | |||||||||||
First Quarter | $ | 0.23 | $ | 0.23 | $ | 0.22 | $ | 0.22 | ||||||
Second Quarter | 0.23 | 0.23 | 0.22 | 0.22 | ||||||||||
Third Quarter | — | 0.23 | 0.22 | 0.22 | ||||||||||
Fourth Quarter | 0.48 | 0.23 | 0.23 | 0.22 | ||||||||||
We paid four dividends during 2017. Due to timing, we declared two dividends during the fourth quarter of 2017, one at 23 cents per share and one at 25 cents per share. While subsequent dividends will be subject to board approval, we expect to pay a regular quarterly dividend of 25 cents per share in 2018.
Any determination to pay dividends in the future will be at the discretion of our board of directors and will be dependent upon our results of operations, financial condition, contractual restrictions, restrictions imposed by applicable law, and other factors deemed relevant by the board of directors. Future indebtedness and loan facilities could also prohibit or restrict our ability to pay dividends and make distributions to our shareholders.
Issuer Purchases of Equity Securities
Subject to applicable law, we may repurchase shares at prevailing market prices directly on the open market or in privately negotiated transactions in amounts that we deem appropriate.
We had an ongoing authorization, originally approved by our board of directors in September 2010, and subsequently amended, to repurchase up to $1.0 billion in shares of our outstanding common stock. The authorization expired on December 31, 2017. On December 8, 2017, the board of directors approved a new share repurchase program that authorizes the company to repurchase up to $500.0 million in shares of the company's outstanding common stock, effective January 1, 2018. The authorization expires on December 31, 2020.
36
The following table presents information related to repurchases of common stock we made during the three months ended December 31, 2017:
Period: | Total number of shares purchased | Average price paid per share | Total number of shares purchased as part of publicly announced programs | Approximate dollar value of shares that may yet be purchased under the programs | ||||||||||
October 1, 2017 - October 31, 2017 | — | $ | — | — | $ | 286,469,896 | ||||||||
November 1, 2017 - November 30, 2017 | — | — | — | $ | 286,469,896 | |||||||||
December 1, 2017 - December 31, 2017 | 13,361 | 96.62 | 13,361 | $ | — | |||||||||
Total | 13,361 | $ | 96.62 | 13,361 | ||||||||||
Rule 10b5-1 Sales Plans
Our directors and executive officers may exercise stock options or purchase or sell shares of our common stock in the market from time to time. We encourage them to make these transactions through plans that comply with Exchange Act Rule 10b5-1(c). Morningstar will not receive any proceeds, other than proceeds from the exercise of stock options, related to these transactions. The following table, which we are providing on a voluntary basis, shows the Rule 10b5-1 sales plans entered into by our directors and executive officers that were in effect as of February 15, 2018:
Name and Position | Date of Plan | Plan Termination Date | Number of Shares to be Sold under the Plan | Timing of Sales under the Plan | Number of Shares Sold under the Plan through February 15, 2018 | Projected Beneficial Ownership (1) | ||||||||||
Gail Landis Director | 11/3/2017 | 5/1/2019 | 1,531 | Shares to be sold under the plan if the stock reaches specified prices | — | 3,172 | ||||||||||
During the fourth quarter of 2017, the previously disclosed Rule 10b5-1 sales plan for Steven Kaplan, Gail Landis, and Jack Noonan completed in accordance with their terms.
_______________________________
(1) This column reflects an estimate of the number of shares Gail Landis will beneficially own following the sale of all shares under the Rule 10b5-1 sales plan. This information reflects the beneficial ownership of our common stock on December 31, 2017, and includes shares of our common stock subject to options that were then exercisable or that will have become exercisable by March 1, 2018 and restricted stock units that will vest by March 1, 2018. The estimates do not reflect any changes to beneficial ownership that may have occurred since December 31, 2017. Gail may amend or terminate her Rule 10b5-1 sales plan and may adopt additional Rule 10b5-1 plans in the future.
37
Item 6. Selected Financial Data
The selected historical financial data shown below should be read in conjunction with Management's Discussion and Analysis of Financial Condition and Results of Operations and our Consolidated Financial Statements and related notes included elsewhere in this Annual Report on Form 10-K. We have derived our Consolidated Statements of Income Data and Consolidated Cash Flow Data for the years ended December 31, 2017, 2016, and 2015 and Consolidated Balance Sheet Data as of December 31, 2017 and 2016 from our audited Consolidated Financial Statements included elsewhere in this Annual Report on Form 10-K. The Consolidated Statements of Income Data and Consolidated Cash Flow Data for the years ended December 31, 2014 and 2013 and Consolidated Balance Sheet Data as of December 31, 2015, 2014, and 2013 were derived from our audited Consolidated Financial Statements that are not included in this Annual Report on Form 10-K.
Consolidated Statements of Income Data | |||||||||||||||||||||
(in millions except per share amounts) | 2013 | 2014 | 2015 | 2016 | 2017 | ||||||||||||||||
Revenue | $ | 698.3 | $ | 760.1 | $ | 788.8 | $ | 798.6 | $ | 911.7 | |||||||||||
Operating expense | 527.6 | 654.5 | (1) | 598.2 | 617.8 | 741.9 | |||||||||||||||
Operating income | 170.7 | 105.6 | (1) | 190.6 | 180.8 | 169.8 | |||||||||||||||
Non-operating income, net | 7.3 | 8.4 | 3.1 | 44.1 | (2) | 11.3 | (2) | ||||||||||||||
Income before income taxes and equity in net income of unconsolidated entities | 178.0 | 114.0 | 193.7 | 224.9 | 181.1 | ||||||||||||||||
Equity in net income (loss) of unconsolidated entities | 1.4 | — | 1.8 | (0.2 | ) | (1.3 | ) | ||||||||||||||
Income tax expense | 56.0 | 35.7 | 62.7 | 63.7 | 42.9 | ||||||||||||||||
Consolidated net income | 123.4 | 78.3 | 132.8 | 161.0 | 136.9 | ||||||||||||||||
Net (income) loss attributable to noncontrolling interests | 0.1 | — | (0.2 | ) | — | — | |||||||||||||||
Net income attributable to Morningstar, Inc. | $ | 123.5 | $ | 78.3 | $ | 132.6 | $ | 161.0 | $ | 136.9 | |||||||||||
Net income per share attributable to Morningstar, Inc.: | |||||||||||||||||||||
Basic: | |||||||||||||||||||||
Continuing operations | $ | 2.68 | $ | 1.75 | $ | 3.00 | $ | 3.74 | $ | 3.21 | |||||||||||
Diluted: | |||||||||||||||||||||
Continuing operations | $ | 2.66 | $ | 1.74 | $ | 3.00 | $ | 3.72 | $ | 3.18 | |||||||||||
Dividends per common share: | |||||||||||||||||||||
Dividends declared per common share | $ | 0.545 | $ | 0.700 | $ | 0.790 | $ | 0.890 | $ | 0.940 | |||||||||||
Dividends paid per common share | $ | 0.375 | $ | 0.680 | $ | 0.760 | $ | 0.880 | $ | 0.920 | |||||||||||
Weighted average common shares outstanding: | |||||||||||||||||||||
Basic | 46.2 | 44.7 | 44.2 | 43.0 | 42.7 | ||||||||||||||||
Diluted | 46.5 | 44.9 | 44.3 | 43.3 | 43.0 | ||||||||||||||||
38
Consolidated Cash Flow Data (in millions) | 2013 | 2014 | 2015 | 2016 | 2017 | ||||||||||||||||
Cash provided by operating activities | $ | 192.6 | $ | 136.6 | (1) | $ | 241.5 | $ | 213.7 | $ | 250.1 | ||||||||||
Capital expenditures | (33.6 | ) | (58.3 | ) | (57.3 | ) | (62.8 | ) | (66.6 | ) | |||||||||||
Free cash flow (3) | $ | 159.0 | $ | 78.3 | (1) | $ | 184.2 | $ | 150.9 | $ | 183.5 | ||||||||||
Cash provided by (used for) investing activities (4) | $ | (14.9 | ) | $ | (31.2 | ) | $ | (79.5 | ) | $ | (274.2 | ) | $ | (60.8 | ) | ||||||
Cash provided by (used for) financing activities (5) | $ | (172.3 | ) | $ | (76.1 | ) | $ | (127.5 | ) | $ | 123.7 | $ | (157.5 | ) | |||||||
Consolidated Balance Sheet Data | |||||||||||||||||||||
As of December 31 (in millions) | 2013 | 2014 | 2015 | 2016 | 2017 | ||||||||||||||||
Cash, cash equivalents, and investments | $ | 298.6 | $ | 224.6 | $ | 248.6 | $ | 304.0 | $ | 353.3 | |||||||||||
Working capital | 173.5 | 97.0 | 105.5 | 177.1 | 206.6 | ||||||||||||||||
Total assets | 1,026.8 | 1,010.3 | 1,029.0 | 1,350.9 | 1,405.7 | ||||||||||||||||
Deferred revenue (6) | 149.2 | 146.0 | 152.0 | 179.5 | 185.5 | ||||||||||||||||
Long-term liabilities | 66.0 | 62.1 | 84.0 | 359.2 | (7) | 277.6 | (7) | ||||||||||||||
Total equity | 691.3 | 654.4 | 640.6 | 696.8 | 804.9 | ||||||||||||||||
(1) Operating income and free cash flow for 2014 included a $61.0 million litigation settlement expense and corresponding cash outflow.
(2) Non-operating income in 2016 included a $37.1 million holding gain related to the purchase of the remaining ownership interest in PitchBook, which was previously a minority investment. Non-operating income in 2017 includes a $16.7 million gain related to the sale of HelloWallet.
(3) Free cash flow is considered a non-GAAP financial measure under SEC regulations. We present this measure as supplemental information to help investors better understand trends in our business results over time. Our management team uses free cash flow to evaluate our business. Free cash flow is not equivalent to any measure required to be reported under GAAP, nor should this data be considered an indicator of liquidity. Moreover, the free cash flow definition we use may not be comparable to similarly titled measures reported by other companies.
(4) Cash provided by (used for) investing activities consists primarily of cash used for acquisitions, purchases of investments, net of proceeds from the sale of investments, capital expenditures, purchases of equity and cost- method investments, and proceeds from the sale of businesses. The level of investing activities can vary from period to period depending on the level of activity in these categories. Refer to Item 7—Management's Discussion and Analysis of Financial Condition and Results of Operations—Liquidity and Capital Resources for more information concerning cash used for investing activities.
(5) Cash provided by (used for) financing activities consists primarily of cash used to repurchase outstanding common stock through our share repurchase program and dividend payments. These cash outflows are partially offset by proceeds from our revolving credit facility, stock option exercises, and excess tax benefits. Refer to Item 7—Management's Discussion and Analysis of Financial Condition and Results of Operations—Liquidity and Capital Resources for more information concerning cash used for financing activities.
(6) We frequently invoice or collect cash in advance of providing services or fulfilling subscriptions for our customers and record these balances as deferred revenue. These amounts represent both current and non-current deferred revenue.
(7) Long-term liabilities in 2016 and 2017 includes $250.0 million and $180.0 million of long-term debt, respectively.
39
Item 7. Management’s Discussion and Analysis of Financial Condition and Results of Operations
The discussion included in this section, as well as other sections of this Annual Report on Form 10-K, contains forward-looking statements as that term is used in the Private Securities Litigation Reform Act of 1995. These statements are based on our current expectations about future events or future financial performance. Forward-looking statements by their nature address matters that are, to different degrees, uncertain, and often contain words such as “may,” “could,” “expect,” “intend,” “plan,” “seek,” “anticipate,” “believe,” “estimate,” “predict,” “potential,” or “continue.” These statements involve known and unknown risks and uncertainties that may cause the events we discuss not to occur or to differ significantly from what we expect. For us, these risks and uncertainties
include, among others:
• | liability for any losses that result from an actual or claimed breach of our fiduciary duties; |
• | failing to maintain and protect our brand, independence, and reputation; |
• | failing to differentiate our products and continuously create innovative, proprietary research tools; |
• | failing to respond to technological change, keep pace with new technology developments, or adopt a successful technology strategy; |
• | trends in the asset management industry, including the increasing popularity of passively managed investment vehicles; |
• | inadequacy in our business continuity program in the event of a material emergency or adverse political or regulatory developments; |
• | liability related to the storage of personal information related to individuals as well as portfolio and account-level information; |
• | compliance failures, regulatory action, or changes in laws applicable to our investment advisory or credit rating operations; |
• | an outage of our database, technology-based products and services, or network facilities or the movement of parts of our technology infrastructure to the public cloud; |
• | downturns in the financial sector, global financial markets, and global economy; |
• | the effect of market volatility on revenue from asset-based fees; |
• | the failure of acquisitions and other investments to produce the results we anticipate; |
• | the failure to recruit, develop, and retain qualified employees; |
• | challenges faced by our non-U.S. operations, including the concentration of data and development work at our offshore facilities in China and India; |
• | liability relating to the acquisition or redistribution of data or information we acquire or errors included therein; and |
• | the failure to protect our intellectual property rights or claims of intellectual property infringement against us. |
A more complete description of these risks and uncertainties can be found in Item 1A—Risk Factors of this Annual Report on Form 10-K. If any of these risks and uncertainties materialize, our actual future results may vary significantly from what we expected. We do not undertake to update our forward-looking statements as a result of new information or future events.
All dollar and percentage comparisons, which are often accompanied by words such as “increase,” “decrease,” “grew,” “declined,” “was up,” “was down,” “was flat,” or “was similar” refer to a comparison with the same period in the prior year unless otherwise stated.
40
Understanding Our Company
Key Business Characteristics
Our mission is to create great products that help investors reach their financial goals. We offer an extensive line of products and services for individual investors, financial advisors, asset managers, retirement plan providers and sponsors, and institutional investors in the private capital markets. Many of our products are sold through subscriptions or license agreements. As a result, we typically generate recurring revenue.
Revenue
We generate revenue by selling a variety of investment-related products and services. We sell many of our products and services, including Morningstar Data, Morningstar Advisor Workstation, Morningstar Direct, Morningstar Research, and PitchBook Data, through license agreements. Our license agreements typically range from one to three years. We sell some of our other products, such as Premium Membership service on Morningstar.com, via subscriptions. These subscriptions are mainly offered for a one-year term, although we offer terms ranging from one month to three years. We also sell advertising on our websites throughout the world. In our credit ratings business, we generate transaction-based revenue for our ratings on new issues of commercial mortgage-backed securities and other structured credits.
Our investment management business has multiple fee structures, which vary by client and region. In general, we seek to receive asset-based fees for any work we perform that involves managing investments or acting as a subadvisor to investment portfolios. For any individual contract, we may receive flat fees, variable asset-based fees, or a combination of the two. Some of our contracts include minimum fee levels that provide us with a flat payment up to a specified asset level, above which we also receive variable asset-based fees. In the majority of our contracts that include variable asset-based fees, we bill clients quarterly in arrears based on average assets for the quarter. Other contracts may include provisions for monthly billing or billing based on assets as of the last day of the billing period rather than on average assets.
In our Workplace Solutions area, our contracts may include one-time setup fees, technology licensing fees, asset-based fees for managed retirement accounts, fixed and variable fees for advice and guidance, or a combination of these fee structures. We also offer plan sponsor advice and custom target-date consulting arrangements. Fees for these services may be based on the level of assets under advisement.
For Morningstar Managed Portfolios, we charge asset-based fees, which are based on a tiered schedule that depends on the client’s account balance.
Deferred Revenue
We invoice some of our clients and collect cash in advance of providing services or fulfilling subscriptions for our customers. We use some of this cash to fund our operations and invest in new product development. Deferred revenue is the largest liability on our Consolidated Balance Sheets and, at the end of 2017, totaled $185.5 million (of which $171.3 million was classified as a current liability with an additional $14.2 million included in other long-term liabilities). At the end of 2016, the amount of deferred revenue was $179.5 million (of which $165.4 million was classified as a current liability with an additional $14.1 million included in other long-term liabilities). We expect to recognize this deferred revenue in future periods as we fulfill the service obligations under our subscription, license, and service agreements.
In recent years, our deferred revenue balance has increased at a more moderate rate, partly because we've been issuing more quarterly and monthly invoices versus up-front, annual invoices. In addition, as we’ve discontinued some subscription-based products, we have less subscription-based revenue contributing to the deferred revenue balance. Our acquisition of PitchBook in 2016 also contributed to the increase in deferred revenue.
41
Significant Operating Leverage
Our business requires significant investments to create and maintain proprietary software, databases, and content. While the fixed costs of the investments we make in our business are relatively high, the variable cost of adding customers is relatively low. This reflects our business focus on Internet-based platforms and assets under management. At times, we may make investments in building our databases and content that cause weaker short-term operating results. During other periods, our profitability may improve because we're able to increase revenue without increasing our cost base at the same rate. When revenue decreases, however, we may not be able to adjust our cost base at a corresponding rate.
Operating Expense
We classify our operating expense into separate categories for cost of revenue, sales and marketing, general and administrative, and depreciation and amortization, as described below. We include stock-based compensation expense, as appropriate, in each of these categories.
• Cost of revenue. This category includes compensation expense for employees who produce the products and services we deliver to our customers. For example, this category covers production teams and analysts who write investment research reports. It also includes compensation expense for programmers, designers, and other employees who develop new products and enhance existing products. In some cases, we capitalize the compensation costs associated with certain software development projects. This reduces the expense that we would otherwise report in this category. Cost of revenue also includes other expense such as third-party data purchases and data lines.
• Sales and marketing. This category includes compensation expense for our sales teams, product managers, and marketing professionals. We also include the cost of advertising, direct mail campaigns, and other marketing and promotion efforts in this category.
• General and administrative. This category includes compensation expense for our management team and other corporate functions, including employees in our compliance, finance, human resources, and legal departments. It also includes costs for corporate systems and facilities.
• Depreciation and amortization. Our capital expenditures are mainly for capitalized software development costs, information technology equipment, and leasehold improvements. We depreciate property and equipment primarily using the straight-line method based on the useful lives of the assets, which range from three to seven years. We amortize leasehold improvements over the lease term or their useful lives, whichever is shorter. We amortize capitalized software development costs over their estimated economic life, generally three years. We also include amortization related to identifiable intangible assets, which is mainly driven by acquisitions, in this category. We amortize intangible assets using the straight-line method over their estimated economic useful lives, which range from one to 25 years.
International Operations
As of December 31, 2017, we had majority-owned operations in 26 countries outside of the United States and included their results of operations and financial condition in our consolidated financial statements. We account for certain minority-owned investments, including Morningstar Japan K.K. (MJKK), using the equity method.
How We Evaluate Our Business
When our analysts evaluate a stock, they focus on assessing the company's estimated intrinsic value, which is based on estimated future cash flows, discounted to their value in today's dollars. Our approach to evaluating our own business works the same way.
Our goal is to increase the intrinsic value of our business over time, which we believe is the best way to create value for our shareholders. We do not make public financial forecasts for our business because we want to avoid creating any incentives for our management team to make speculative statements about our financial results that could influence our stock price or take actions that help us meet short-term forecasts but may not build long-term shareholder value.
42
We provide three specific measures that can help investors generate their own assessment of how our intrinsic value has changed over time:
• Revenue (including organic revenue);
• Operating income (loss); and
• Free cash flow
Organic revenue and free cash flow are not measures of performance set forth under GAAP (generally accepted accounting principles).
We define organic revenue as consolidated revenue excluding acquisitions, divestitures, and foreign currency translations. We present organic revenue because we believe it helps investors better compare our period-to-period results, and our management team uses this measure to evaluate the performance of our business. We exclude revenue from businesses acquired or divested from organic revenue for a period of 12 months after we complete the acquisition or divestiture. Organic revenue is not equivalent to any measure required under GAAP and may not be comparable to similarly titled measures reported by other companies.
We define free cash flow as cash provided by or used for operating activities less capital expenditures. We present free cash flow as supplemental information to help investors better understand trends in our business results over time. Our management team uses free cash flow to evaluate our business. Free cash flow is not equivalent to any measure required under GAAP and should not be considered an indicator of liquidity. Moreover, the free cash flow definition we use may not be comparable to similarly titled measures reported by other companies.
To evaluate how successful we've been in maintaining existing business for products and services that have renewable revenue, we calculate retention and renewal rates using two different methods. For subscription-based products, we calculate a retention rate based on the number of subscriptions retained during the year as a percentage of the number of subscriptions up for renewal. For products sold through contracts and licenses, we use the contract value method, which is based on tracking the dollar value of renewals compared with the total dollar value of contracts up for renewal during the period. We include changes in the contract value in the renewal amount, unless the change specifically results from adding a new product that we can identify. We also include variable-fee contracts in this calculation and use the previous quarter's actual revenue as the base rate for calculating the renewal percentage. The renewal rate excludes setup and customization fees, migrations to other Morningstar products, and contract renewals that were pending as of January 31, 2018.
The Year 2017 in Review
We monitor developments in the economic and financial information industry on an ongoing basis. We use these insights to help inform our company strategy, product development plans, and marketing initiatives.
2017 was a strong year for equities. With the bull market in U.S. equities fast approaching its nine-year anniversary, we’ve seen a growing tendency for diversification outside of the United States. Morningstar's U.S. Market Index, a broad market benchmark, ended the year with a robust 21.5% gain; however, international equities as a group fared slightly better. Morningstar’s Global Markets ex-U.S. Index finished the year up 28.0%, with the Developed Markets ex-U.S. Index up 25.5% and the Emerging Markets Index up almost 36.0%.
The Federal Reserve raised short-term interest rates three times in 2017. However, all bond categories were still able to deliver healthy returns because the long end of the yield curve was relatively flat in the last year.
Based on Morningstar Asset Flows data, total U.S. mutual fund assets edged up to $18.1 trillion as of December 31, 2017, compared with $15.1 trillion as of December 31, 2016. ETFs continued to increase in popularity relative to traditional mutual funds. The U.S. ETF industry closed out 2017 with $3.4 trillion in assets under management based on Morningstar Asset Flows data, up from about $2.5 trillion as of December 2016.
Based on our analysis of fund flow trends, long-term mutual funds and exchange traded products had aggregate net inflows of about $680 billion in 2017, up significantly from about $160 billion in 2016, and outpacing the most recent record of $460 billion set in 2014. Net outflows in actively managed mutual funds slowed to $7 billion in 2017 versus $340 billion in 2016. Nevertheless, the overall decline remains consistent with the trend of investor preference for passively managed funds, which experienced over $690 billion in net inflows in 2017.
43
Longer-Term Trends and Regulatory Environment
In addition to industry developments in 2017, there are several longer-term trends we consider relevant to our business, as outlined below.
In the wake of the financial crisis of 2008 and 2009, regulators have continued to implement new frameworks for financial services companies globally. Many of these rules relate to financial advisor compensation, fees and expenses, investor disclosure, and the use of hedge funds and alternative investments.
In the United Kingdom, for example, the Retail Distribution Review (RDR), which emphasizes increased regulation of advisory fees, higher professional standards for financial advisors, and "whole of market" investment solutions, became effective in January 2013. The RDR also restricted the use of commission payments for products sold to individual investors, although UK regulators are reportedly considering changes to this restriction. The UK regulator is monitoring the implementation of RDR and is scheduled to publish a review of its findings in 2019. In addition to the RDR, the UK regulator and Her Majesty's Treasury (HMT) launched the Financial Advice Market Review (FAMR) in 2015 in light of concerns that the market for financial advice was not working well for consumers. FAMR aimed to explore ways in which the government, industry, and regulators could take collective steps to stimulate the development of a market which delivers affordable and accessible financial advice and guidance to everyone. FAMR's final report, published in March 2016, set out 28 recommendations intended to tackle barriers to consumers accessing advice. The FCA and HMT will review the outcomes of FAMR in 2019.
In the European Union, the new version of the Markets in Financial Instruments Directive, also known as MiFID II, became effective in January 2018. The main provisions include, among other things, limits on portfolio managers' use of third-party research, quality and organizational rules regarding the provision of advice, additional governance requirements for the manufacturing and distribution of financial instruments and structured deposits, requirements for firms to provide clients with details of all costs and charges related to their investments, and new rules for disclosing the cumulative effect of costs on investor returns.
With respect to indexes, European Union Benchmarks Regulation 2016/1011 came into force on June 30, 2016 with a majority of its provisions having a compliance date of January 1, 2018. The principal objective of the Regulation is to ensure benchmarks used in financial instruments and financial contracts or to measure the performance of investment funds (e.g., a tracking index of a ETF) are free of conflicts of interest, are used appropriately and reflect the actual market or economic reality they are intended to measure. This Regulation applies to Morningstar’s index group as a result of making available its indexes to European investable product sponsors (e.g., ETF sponsors) as the tracking index for their investable product.
In Australia, in an effort to improve trust and confidence in the financial services industry, the government has announced many regulatory reforms and inquiries ranging from enhanced enforcement powers for the Australian Securities and Investments Commission (ASIC), new reforms to significantly raise the professional, educational and ethical standards of financial advisors, and a Royal Commission into the alleged misconduct of Australia's banks and other financial services entities with broad terms of reference and the potential to impact many aspects of the financial services industry. ASIC has been actively enforcing the Future of Financial Advice reforms that began in July 2013 with actions against financial advisors who failed to act in the best interest of clients and a review of the five largest vertically integrated financial institutions and their management of conflicts of interest. The fund management industry also continues to be an area of regulatory reform with the introduction of the Asia Region Funds Passport and Corporate Collective Investment Schemes, the implementation of new costs and fee disclosure for managed investment and superannuation funds, and a proposed update and overhaul of regulatory guidance for fund managers.
In the United States, the U.S. Department of Labor (DOL) published a final version of a new fiduciary standard that would expand the definition of a fiduciary for certain financial advisors who provide advice related to retirement planning. The new rule was previously scheduled to go into effect in April 2017. Parts of the rule went into effect in June 2017 but full implementation of the rule has been pushed back to July 2019. The SEC is also considering possible rulemaking in this area. In December 2017, the SEC released its updated agenda of regulatory priorities in 2018 and beyond, which listed rulemaking regarding a Personalized Investment Advice Standard of Conduct (i.e., a fiduciary standard) as being at the shorter-term proposed rulemaking stage.
44
Despite this uncertainty, we believe recent shifts, such as a greater emphasis on serving investors’ interests and lowering fees, are fundamental changes that will continue. We've introduced several new product offerings and bundled solutions to help financial advisors determine, demonstrate, and document that their advice is in the best interest of the investor. We believe Morningstar is well-positioned to help our clients adapt to this new landscape and have had many positive discussions with financial advisors and asset managers about the solutions we can provide. In particular, we’ve increased our manager research coverage in response to growing demand for information that helps financial advisors show investors the thought process behind their investment recommendations.
45
Supplemental Operating Metrics (Unaudited)
The tables below summarize our key product metrics and other supplemental data.
As of December 31, | |||||||||||||||||||
2017 | 2016 | 2015 | 2017 Change | 2016 Change | |||||||||||||||
Our business | |||||||||||||||||||
Morningstar.com Premium Membership subscriptions (U.S.) | 118,462 | 118,339 | 120,557 | 0.1 | % | (1.8 | )% | ||||||||||||
Morningstar.com average monthly unique users (U.S.) | 9,829,527 | 8,892,203 | 8,529,792 | 10.5 | % | 4.2 | % | ||||||||||||
Advisor Workstation clients (U.S.) | 182 | 175 | 189 | 4.0 | % | (7.4 | )% | ||||||||||||
Morningstar Office licenses (U.S.) | 4,330 | 4,286 | 4,342 | 1.0 | % | (1.3 | )% | ||||||||||||
Morningstar Direct licenses | 13,884 | 12,492 | 11,428 | 11.1 | % | 9.3 | % | ||||||||||||
PitchBook Platform licenses | 13,908 | 9,723 | (1) | 6,700 | (1) | 43.0 | % | 45.1 | % | ||||||||||
Assets under management and advisement (approximate) ($bil) (2) | |||||||||||||||||||
Workplace Solutions (Retirement) | |||||||||||||||||||
Managed Accounts (3) | 57.6 | 46.9 | 40.3 | 22.8 | % | 16.4 | % | ||||||||||||
Fiduciary Services (4) | 42.5 | 34.3 | 30.7 | 23.9 | % | 11.7 | % | ||||||||||||
Custom Models | 28.0 | 23.2 | 18.7 | 20.7 | % | 24.1 | % | ||||||||||||
Workplace Solutions (total) | $ | 128.1 | $ | 104.4 | $ | 89.7 | 22.7 | % | 16.4 | % | |||||||||
Morningstar Investment Management | |||||||||||||||||||
Morningstar Managed Portfolios | 39.8 | 30.2 | (5) | 25.8 | (5) | 31.8 | % | 17.1 | % | ||||||||||
Institutional Asset Management | 17.6 | (6) | 58.0 | 59.4 | (69.7 | )% | (2.4 | )% | |||||||||||
Asset Allocation Services | 9.5 | 7.2 | 7.6 | 31.9 | % | (5.3 | )% | ||||||||||||
Manager Selection Services | 1.4 | 1.2 | 2.1 | 16.7 | % | (42.9 | )% | ||||||||||||
Morningstar Investment Management (total) | $ | 68.3 | $ | 96.6 | $ | 94.9 | (29.3 | )% | 1.8 | % | |||||||||
Average assets under management and advisement ($bil) | $ | 207.9 | $ | 192.8 | $ | 179.9 | 7.8 | % | 7.2 | % | |||||||||
Number of new-issue ratings completed (7) | 97 | 70 | 90 | 38.6 | % | (22.2 | )% | ||||||||||||
Asset value of new-issue ratings ($bil) (7) | $ | 39.0 | $ | 30.7 | $ | 59.8 | 27.0 | % | (48.7 | )% | |||||||||
Our employees (approximate) | |||||||||||||||||||
Worldwide headcount | 4,920 | 4,550 | (8) | 3,880 | (8) | 8.1 | % | 17.3 | % | ||||||||||
46
Year ended December 31, | |||||||||||||||||||
(in millions) | 2017 | 2016 | 2015 | 2017 Change | 2016 Change | ||||||||||||||
Key product and investment area revenue (9) | |||||||||||||||||||
Morningstar Data | $ | 162.9 | $ | 152.1 | $ | 144.5 | 7.2 | % | 5.3 | % | |||||||||
Morningstar Direct | 124.4 | 110.5 | 101.7 | 12.6 | % | 8.7 | % | ||||||||||||
Morningstar Investment Management | 106.0 | 98.4 | 98.8 | 7.7 | % | (0.4 | )% | ||||||||||||
Morningstar Advisor Workstation | 87.3 | 82.4 | 81.4 | (10) | 6.0 | % | 1.2 | % | |||||||||||
Workplace Solutions | 73.5 | 71.3 | 66.6 | 3.2 | % | (11) | 7.0 | % | |||||||||||
PitchBook Data | 63.6 | 4.1 | — | 1,447.9 | % | NMF | |||||||||||||
Morningstar Credit Ratings | 31.4 | 26.4 | 37.7 | 18.8 | % | (30.1 | )% | ||||||||||||
Revenue by Type (9) | |||||||||||||||||||
License-based (12) | $ | 662.9 | $ | 573.4 | $ | 552.3 | 15.6 | % | 3.8 | % | |||||||||
Asset-based (13) | 187.3 | 169.8 | 163.6 | 10.3 | % | 3.8 | % | ||||||||||||
Transaction-based (14) | 61.5 | 55.4 | 72.9 | 11.1 | % | (24.1 | )% | ||||||||||||
(1) Included for informational purposes only; Morningstar did not acquire full ownership of PitchBook until December 2016.
(2) The asset totals shown above (including assets we either manage directly or for which we provide consulting or subadvisory work) only include assets for which we receive basis-point fees. Some of our client contracts include services for which we receive a flat fee, but we do not include those assets in the total reported above.
Excluding changes related to new contracts and cancellations, changes in the value of assets under advisement can come from two primary sources: gains or losses related to overall trends in market performance, and net inflows or outflows caused when investors add to or redeem shares from these portfolios.
Except for Morningstar Managed Portfolios, it's difficult for our Investment Management business to quantify these cash inflows and outflows. The information we receive from most of our clients does not separately identify the effect of cash inflows and outflows on asset balances for each period. We also cannot specify the effect of market appreciation or depreciation because the majority of our clients have discretionary authority to implement their own portfolio allocations.
(3) Many factors can cause changes in assets under management and advisement for our managed retirement accounts, including employer and employee contributions, plan administrative fees, market movements, and participant loans and hardship withdrawals. The information we receive from the plan providers does not separately identify these transactions or the changes in balances caused by market movement.
(4) Formerly Plan Sponsor Advice.
(5) Revised to include assets from South Africa.
(6) Decline due to client losses related to a strategic shift away from our customized investment management offerings to Managed Portfolios.
(7) Includes commercial mortgage-backed securities, residential mortgage-backed securities, other asset-backed securities, and corporate and financial institutions.
(8) Revised to exclude temporary employees and part-time employees who work less than 30 hours a week.
(9) Key product and investment area revenue and revenue by type includes the effect of foreign currency translations.
(10) Revised to exclude Morningstar Office.
(11) Excluding the negative 6.5 percentage point impact of the HelloWallet divestiture, revenue increased by 9.7% for the full year.
47
(12) License-based revenue includes Morningstar Data, Morningstar Direct, Morningstar Advisor Workstation, Morningstar Enterprise Components, Morningstar Research, PitchBook Data, and other similar products.
(13) Asset-based revenue includes Morningstar Investment Management, Workplace Solutions, and Morningstar Indexes.
(14) Transaction-based revenue includes Morningstar Credit Ratings, Internet advertising sales, and Conferences.
48
Consolidated Results
Key Metrics (in millions) | 2017 | 2016 | 2015 | 2017 Change | 2016 Change | ||||||||||||||
Revenue | $ | 911.7 | $ | 798.6 | $ | 788.8 | 14.2 | % | 1.2 | % | |||||||||
Operating income | $ | 169.8 | $ | 180.8 | $ | 190.6 | (6.0 | )% | (5.2 | )% | |||||||||
Operating margin | 18.6 | % | 22.6 | % | 24.2 | % | (4.0 | ) | pp | (1.6 | ) | pp | |||||||
Cash used for investing activities | $ | (60.8 | ) | $ | (274.2 | ) | $ | (79.5 | ) | (77.8 | )% | 244.9 | % | ||||||
Cash provided by (used for) financing activities | $ | (157.5 | ) | $ | 123.7 | $ | (127.5 | ) | (227.3 | )% | 197.0 | % | |||||||
Cash provided by operating activities | $ | 250.1 | $ | 213.7 | $ | 241.5 | 17.0 | % | (11.5 | )% | |||||||||
Capital expenditures | (66.6 | ) | (62.8 | ) | (57.3 | ) | 6.1 | % | 9.6 | % | |||||||||
Free cash flow | $ | 183.5 | $ | 150.9 | $ | 184.2 | 21.6 | % | (18.1 | )% | |||||||||
____________________________________________________________________________________________
pp — percentage points
We define free cash flow as cash provided by or used for operating activities less capital expenditures. Please refer to the discussion in How We Evaluate our Business for more detail.
Consolidated Revenue
(in millions) | 2017 | 2016 | 2015 | 2017 Change | 2016 Change | ||||||||||||||
Consolidated revenue | $ | 911.7 | $ | 798.6 | $ | 788.8 | 14.2 | % | 1.2 | % | |||||||||
In 2017 and 2016, our consolidated revenue rose 14.2% and 1.2%, respectively. Our acquisition of PitchBook Data, Inc. (PitchBook) in December 2016 contributed $57.2 million of revenue growth during 2017. Foreign currency movements had no net material impact on revenue in 2017 and reduced revenue by $9.5 million in 2016.
We experienced strong revenue growth across all revenue types during 2017.
License-based revenue grew 15.6% during 2017. We experienced stronger growth rates for license-based products such as Morningstar Direct and Morningstar Data. Revenue from Morningstar Direct was the biggest contributor to growth in both 2017 and 2016, with revenue increasing by $13.9 million in 2017 and $8.8 million in 2016. The number of licenses for Morningstar Direct increased to 13,884 worldwide at the end of 2017, compared with 12,492 at the end of 2016 and 11,428 at the end of 2015, with modest growth in both the United States and internationally. Growth in Morningstar Direct reflects additional licenses for both new and existing clients.
Morningstar Data revenue increased $10.9 million in 2017, mainly reflecting new contracts and renewals for managed products data and our market data business.
Asset-based revenue increased 10.3% during 2017. Morningstar Managed Portfolios and Workplace Solutions were the primary drivers of the increase. The asset-based fees we earn are generally based on average asset levels during each quarter. Average assets under management and advisement (calculated based on available average quarterly or monthly data) were approximately $207.9 billion in 2017, compared with $192.8 billion in 2016 and $179.9 billion in 2015.
Transaction-based revenue grew 11.1% during 2017. Revenue from Morningstar Credit Ratings (our structured credit ratings business) increased $5.0 million during the year, primarily due to new-issue growth in asset-backed securities partially offset by a slight decrease in ratings on commercial mortgage-backed securities.
Some of the main contributors to the 2016 revenue increase were Morningstar Direct, Morningstar Data, and Workplace Solutions. Positive results for these products were partially offset by decreases in Morningstar Credit Ratings and Internet advertising sales on Morningstar.com.
49
In December 2016, we acquired the remaining interest in PitchBook, which contributed $4.1 million of revenue during the one-month period that PitchBook was included in our consolidated results for 2016.
Organic revenue
To make it easier to compare our results in different periods, we provide information about organic revenue, which reflects our underlying business excluding acquisitions, divestitures, and the effect of foreign currency translations. In 2017, we divested HelloWallet and did not make any acquisitions. During 2016, we acquired Requisight, LLC (RightPond), InvestSoft Technology, Inc. (InvestSoft), and PitchBook Data, Inc. (PitchBook). We did not divest any businesses in 2016.
We exclude revenue from acquired businesses from our organic revenue growth calculation for a period of 12 months after we complete the acquisition. Contribution from PitchBook was treated as acquired revenue through November 2017 and was incorporated into organic growth statistics after December 1, 2017. For divestitures, we exclude revenue in the prior period for which there is no comparable revenue in the current period. Because HelloWallet was divested in the second quarter of 2017, we excluded HelloWallet's last six months of 2016 revenue from our organic revenue growth calculation.
In 2017, we had $57.5 million in incremental revenue from acquisitions, primarily from PitchBook. Revenue in 2016 included $4.4 million of revenue from HelloWallet, which we divested in the second quarter of 2017, and that did not recur in the second half of 2017. In addition, foreign currency translations had no net material impact on revenue in 2017. Excluding acquisitions, divestitures, and foreign currency translations, organic revenue was up 7.6% in 2017.
In 2016, we had $5.5 million in incremental revenue from acquisitions, primarily from PitchBook. In addition, foreign currency translations reduced revenue by about $9.5 million in 2016, mainly because of the weaker British pound and Canadian dollar. Excluding acquisitions, divestitures, and foreign currency translations, organic revenue was up 1.7% in 2016.
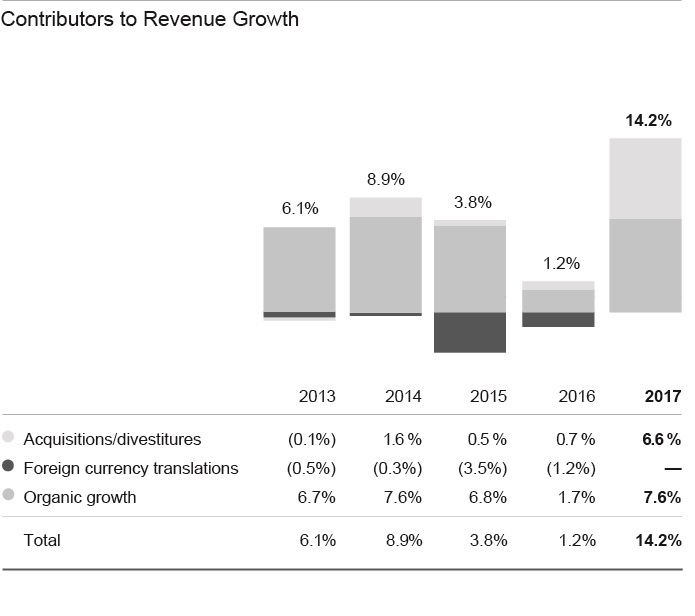
50
The tables below reconcile consolidated revenue with organic revenue (revenue excluding acquisitions, divestitures, and the effect of foreign currency translations):
2017 vs. 2016 (in millions) | 2017 | 2016 | Change | ||||||||
Consolidated revenue | $ | 911.7 | $ | 798.6 | 14.2 | % | |||||
Less: acquisitions | (57.5 | ) | — | NMF | |||||||
Less: divestitures | — | (4.4 | ) | NMF | |||||||
Effect of foreign currency translations | — | — | — | ||||||||
Organic revenue | $ | 854.2 | $ | 794.2 | 7.6 | % | |||||
2016 vs. 2015 (in millions) | 2016 | 2015 | Change | ||||||||
Consolidated revenue | $ | 798.6 | $ | 788.8 | 1.2 | % | |||||
Less: acquisitions | (5.5 | ) | — | NMF | |||||||
Less: divestitures | — | — | — | ||||||||
Unfavorable effect of foreign currency translations | 9.5 | — | NMF | ||||||||
Organic revenue | $ | 802.6 | $ | 788.8 | 1.7 | % | |||||
____________________________________________________________________________________________
NMF — Not meaningful
Organic revenue (revenue excluding acquisitions, divestitures, and the effect of foreign currency translations) is considered a non-GAAP financial measure. The definition of organic revenue we use may not be the same as similarly titled measures used by other companies. Organic revenue should not be considered an alternative to any measure of performance as promulgated under GAAP.
Revenue by region
Year ended December 31 | ||||||||||||||||||
(in millions) | 2017 | 2016 | 2015 | 2017 Change | 2016 Change | |||||||||||||
United States | $ | 687.0 | $ | 590.5 | $ | 585.1 | 16.3 | % | 0.9 | % | ||||||||
United Kingdom | 64.7 | 61.1 | 64.2 | 5.9 | % | (4.8 | )% | |||||||||||
Continental Europe | 69.9 | 62.6 | 58.8 | 11.7 | % | 6.5 | % | |||||||||||
Australia | 34.6 | 32.2 | 30.5 | 7.5 | % | 5.6 | % | |||||||||||
Canada | 29.4 | 28.2 | 27.9 | 4.3 | % | 1.1 | % | |||||||||||
Asia | 21.2 | 20.0 | 18.5 | 6.0 | % | 8.1 | % | |||||||||||
Other | 4.9 | 4.0 | 3.8 | 22.5 | % | 5.3 | % | |||||||||||
Total International | 224.7 | 208.1 | 203.7 | 8.0 | % | 2.2 | % | |||||||||||
Consolidated revenue | $ | 911.7 | $ | 798.6 | $ | 788.8 | 14.2 | % | 1.2 | % | ||||||||
International revenue made up about 25% of our consolidated revenue in 2017, compared with 26% in both 2016 and 2015. About 60% of our international revenue is from Continental Europe and the United Kingdom. We also have a fairly large revenue base in Australia and Canada.
Revenue from international operations increased $16.6 million, or 8.0%, in 2017 and international organic revenue increased 8.0%.
In 2016, revenue from international operations increased 2.2% and international organic revenue increased 6.8%.
51
The tables below present a reconciliation from international revenue to international organic revenue (international revenue excluding acquisitions, divestitures, and the effect of foreign currency translations):
2017 vs. 2016 (in millions) | 2017 | 2016 | Change | ||||||||
International revenue | $ | 224.7 | $ | 208.1 | 8.0 | % | |||||
Less: acquisitions | — | — | — | ||||||||
Less: divestitures | — | — | — | ||||||||
Effect of foreign currency translations | — | — | — | ||||||||
International organic revenue | $ | 224.7 | $ | 208.1 | 8.0 | % | |||||
2016 vs. 2015 (in millions) | 2016 | 2015 | Change | ||||||||
International revenue | $ | 208.1 | $ | 203.7 | 2.2 | % | |||||
Less: acquisitions | — | — | — | ||||||||
Less: divestitures | — | — | — | ||||||||
Unfavorable effect of foreign currency translations | 9.5 | — | NMF | ||||||||
International organic revenue | $ | 217.6 | $ | 203.7 | 6.8 | % | |||||
International revenue as a percentage of consolidated revenue has been relatively flat the past few years, partly reflecting negative effects of foreign currency translations.
International organic revenue (international revenue excluding acquisitions, divestitures, and the effect of foreign currency translations) is considered a non-GAAP financial measure. The definition of international organic revenue we use may not be the same as similarly titled measures used by other companies. International organic revenue should not be considered an alternative to any measure of performance as promulgated under GAAP.
Retention and Renewal Rates
As discussed in How We Evaluate Our Business, we calculate retention and renewal rates to help measure how successful we've been in maintaining existing business for products and services that have renewable revenue. The graph below illustrates these two metrics over the past five years:
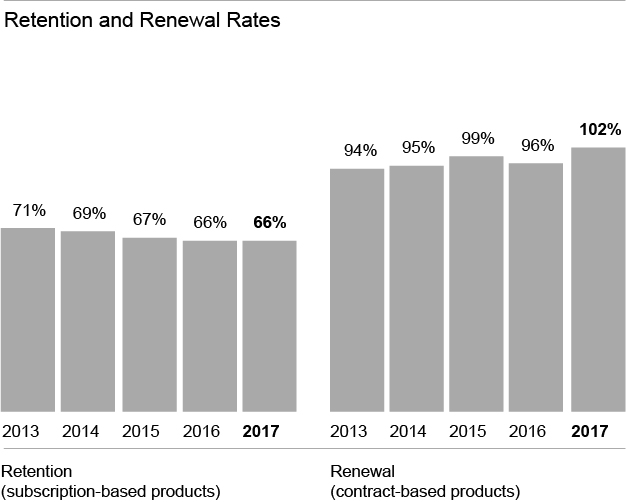
52
For contract-based products and services (such as Morningstar Data including PitchBook, Investment Advisory services, Morningstar Direct, and Morningstar Advisor Workstation), we estimate that our weighted average annual renewal rate was approximately 102% in 2017, compared with 96% in 2016. The increase mainly reflects higher renewal rates for some larger products, including Morningstar Direct, Morningstar Investment Management, Workplace Solutions, Morningstar Research, and PitchBook. The figure for contract-based products includes the effect of price changes; increasing client bases upon contract renewal; changes to the contract value upon renewal (such as increased users); and changes in the value of variable-fee contracts. These factors, therefore, can lead to a renewal rate percentage over 100%.
In 2017, we estimate that our annual retention rate for subscription-based products, including Morningstar.com's Premium Membership service, Morningstar Office, and newsletter products, was approximately 66%, which was unchanged from 2016.
Consolidated Operating Expense
(in millions) | 2017 | 2016 | 2015 | 2017 Change | 2016 Change | |||||||||||||||
Cost of revenue | $ | 386.6 | $ | 344.3 | $ | 330.1 | 12.3 | % | 4.3 | % | ||||||||||
% of revenue | 42.4 | % | 43.1 | % | 41.9 | % | (0.7) | pp | 1.2 | pp | ||||||||||
Sales and marketing | 134.3 | 97.6 | 96.6 | 37.6 | % | 1.0 | % | |||||||||||||
% of revenue | 14.7 | % | 12.2 | % | 12.2 | % | 2.5 | pp | — | pp | ||||||||||
General and administrative | 129.8 | 105.2 | 107.1 | 23.3 | % | (1.7 | )% | |||||||||||||
% of revenue | 14.2 | % | 13.2 | % | 13.6 | % | 1.0 | pp | (0.4) | pp | ||||||||||
Depreciation and amortization | 91.2 | 70.7 | 64.4 | 28.9 | % | 9.9 | % | |||||||||||||
% of revenue | 10.0 | % | 8.9 | % | 8.2 | % | 1.1 | pp | 0.7 | pp | ||||||||||
Total operating expense | $ | 741.9 | $ | 617.8 | $ | 598.2 | 20.1 | % | 3.3 | % | ||||||||||
% of revenue | 81.4 | % | 77.4 | % | 75.8 | % | 4.0 | pp | 1.6 | pp | ||||||||||
In 2017, our operating expense was up $124.1 million, or 20.1%. Foreign currency translations reduced our operating expense by $0.6 million in 2017.
Our acquisition of PitchBook contributed $76.0 million of operating expense, primarily for salaries, amortization expense, professional fees, commission expense, and management bonus expense during the year. PitchBook expenses exceeded revenue in 2017, primarily due to $10.6 million of deal-related intangible amortization and $7.9 million of vesting of performance share awards associated with the acquisition. PitchBook also had $4.6 million of capitalized labor during 2017.
The remaining increase was primarily a result of higher compensation expense (including salaries, bonus, and other company-sponsored benefits), depreciation expense, professional fees, and production expense, which includes third-party data and infrastructure hosting.
Excluding PitchBook, compensation expense (including salaries and other company-sponsored benefits) increased $16.2 million in 2017. Bonus expense also increased $14.5 million in 2017. Bonus expense was higher due to stronger performance against our internal targets.
Depreciation expense in 2017 includes a $4.1 million impairment charge for certain software licenses due to a shift toward a cloud-based strategy.
Partially offsetting our total operating expense increase was an increase in internally developed capitalized software. We have accelerated development of our major software platforms, resulting in an increase in capitalized software development, which reduced operating expense. In 2017, we capitalized $41.7 million, which excludes the PitchBook capitalized labor noted above, associated with software development activities, mainly related to Morningstar Data, Workplace Solutions, and additional enhancements to reporting, financial planning, and other capabilities in our products. In comparison, we capitalized $28.2 million of software development expense in 2016.
53
We had approximately 4,920 employees worldwide at the end of 2017, compared with 4,550 in 2016. This increase reflects continued investment in our key growth initiatives, including data operations in India and China and PitchBook in the United States and Europe.
In 2016, our operating expense was up $19.6 million, or 3.3%. Due to the strength of the U.S. dollar, foreign currency translations reduced our operating expense by $11.5 million in 2016.
Compensation expense (including salaries and other company-sponsored benefits) increased $26.2 million in 2016. We had approximately 4,550 employees worldwide at the end of 2016, compared with 3,880 in 2015. This increase reflects continued investment in our key growth initiatives and mainly includes technology, sales, and analyst roles in the United States, India, and China. The growth in compensation expense was partially offset by a $13.1 million reduction in bonus expense during 2016 compared to 2015. Bonus expense was lower mainly because we did not meet our internal targets for revenue growth during 2016.
Depreciation expense, professional fees, and production expense also increased during 2016 as we continued to invest in our business. We have also accelerated development of our major software platforms and therefore had an increase in capitalized software development, which reduced operating expense.
In 2016, we capitalized $28.2 million of software development expense for ongoing enhancements of key platforms and new development of upgraded software platforms. In comparison, we capitalized $21.8 million of software development expense in 2015.
Sales commission expense decreased $2.8 million in 2016, reflecting declines in new sales closed.
Our acquisition of PitchBook contributed $7.5 million of operating expense, primarily for salaries, professional fees, and amortization expense during the one-month period that PitchBook was included in our consolidated results for 2016.
Cost of revenue
Cost of revenue is our largest category of operating expense, representing about one-half of our total operating expense. Our business relies heavily on human capital, and cost of revenue includes the compensation expense for employees who produce our products and services. We include compensation expense for approximately 80% of our employees in this category.
Cost of revenue increased $42.3 million, or 12.3%, in 2017. Our acquisition of PitchBook contributed $14.0 million of operating expense in this cost category, primarily for professional fees, salary expense, and capitalized labor during 2017. The remaining increase was largely due to higher salary expense of $13.6 million, mainly driven by additional headcount. Higher bonus expense, professional fees, and production expense also contributed to the increase in this category.
Partially offsetting these increases was an increase in internally developed capitalized software. We have accelerated development of our major software platforms, resulting in an increase in capitalized software development, which reduced operating expense. During 2017, we capitalized $41.7 million, which excludes the PitchBook capitalized labor noted above, associated with software development activities, mainly related to Morningstar Data, Workplace Solutions, and additional enhancements to reporting, financial planning, and other capabilities in our products. In comparison, we capitalized $28.2 million in 2016.
Cost of revenue increased $14.2 million in 2016. Higher salary expense of $19.9 million was the largest contributor to the increase and was mainly driven by additional headcount. Higher company-sponsored benefits and software subscriptions also contributed to the growth in this category.
Partially offsetting these increases was a $9.1 million decrease in bonus expense, as well as an increase in capitalized software development. As mentioned above, we capitalized $28.2 million associated with software development activities in 2016, compared with $21.8 million included in 2015.
PitchBook contributed $1.3 million of operating expense in this cost category, primarily for salary expense during the one-month period that PitchBook was included in our consolidated results for 2016.
54
As a percentage of revenue, cost of revenue decreased 0.7 percentage points in 2017 and increased 1.2 percentage points in 2016.
Sales and marketing
Sales and marketing expense increased $36.7 million, or 37.6%, in 2017. Our acquisition of PitchBook contributed $34.9 million of operating expense in this cost category, primarily for salary and sales commission expense in 2017.
The remaining increase was due to an increase in sales commission expense of $3.7 million, partially offset by decreases in compensation expense (including salaries and other company-sponsored benefits), advertising and marketing spend, and professional fees.
Sales and marketing expense increased $1.0 million in 2016, reflecting a $2.7 million increase in compensation expense (including salaries and other company-sponsored benefits) and a $1.0 million increase in advertising and marketing spend. Partly offsetting these increases were decreases in sales commission expense of $1.9 million and bonus expense of $1.0 million.
Our acquisition of PitchBook contributed $2.7 million during the one-month period that PitchBook was included in our consolidated results for 2016.
As a percentage of revenue, sales and marketing expense increased 2.5 percentage points in 2017 and was unchanged in 2016 compared to 2015.
General and administrative
General and administrative expense increased $24.6 million, or 23.3%, during 2017. Our acquisition of PitchBook contributed $16.1 million of operating expense in this cost category, primarily for management bonus plan expense and salary expense during 2017. Bonus expense, software subscriptions, and rent expense contributed to the remaining increase in 2017.
General and administrative expense decreased $1.9 million in 2016, mainly because of a $3.0 million decline in bonus expense and a $2.0 million decline in stock-based compensation expense. Partially offsetting these decreases was an increase of $3.8 million in professional fees in connection with legal and compliance and other company initiatives. Compensation expense (including salaries and other company-sponsored benefits) also increased $0.9 million.
PitchBook contributed $2.5 million in 2016, primarily for salary expense, professional fees, and management bonus plan expense during the one-month period that PitchBook was included in our consolidated results for 2016.
General and administrative expense as a percentage of revenue was up 1.0 percentage points in 2017 and down 0.4 percentage points in 2016.
Depreciation and amortization
Overall, depreciation and amortization increased $20.5 million, or 28.9%, in 2017 and $6.3 million, or 9.9%, in 2016.
Our acquisition of PitchBook contributed $11.0 million of operating expense in this cost category in 2017 and $0.9 million in 2016, primarily for intangible amortization expense related to the acquisition.
Depreciation expense rose $16.3 million in 2017, mainly driven by depreciation expense related to capitalized software development and computer equipment incurred over the past several years. Depreciation expense during 2017 also includes a $4.1 million impairment charge for certain software licenses due to a shift toward a cloud- based strategy. Intangible amortization expense increased $4.2 million in 2017 due to additional amortization expense for the intangible assets of PitchBook offset by certain intangible assets from some previous acquisitions that are now fully amortized.
Depreciation expense rose $8.9 million in 2016, mainly driven by higher capital expenditures for computer equipment and additional depreciation expense for capitalized software development. Intangible amortization expense decreased $2.6 million in 2016 as certain intangible assets from some previous acquisitions are now fully amortized.
55
We expect that amortization of intangible assets will be an ongoing cost. We estimate that this expense will total approximately $20.7 million in 2018. Our estimates of future amortization expense for intangible assets may be affected by additional acquisitions, divestitures, changes in the estimated average useful lives, and foreign currency translation.
Consolidated Operating Income and Operating Margin
(in millions) | 2017 | 2016 | 2015 | ||||||||||
Operating income | $ | 169.8 | $ | 180.8 | $ | 190.6 | |||||||
% change | (6.0 | )% | (5.2 | )% | 80.5 | % | |||||||
Operating margin | 18.6 | % | 22.6 | % | 24.2 | % | |||||||
Change | (4.0 | ) | pp | (1.6 | ) | pp | 10.3 | pp | |||||
Consolidated operating income decreased $11.0 million in 2017 as revenue increased $113.1 million and operating expense increased $124.1 million. Operating margin was 18.6%, down 4.0 percentage points compared with 2016.
Consolidated operating income decreased $9.8 million in 2016 as revenue increased $9.8 million and operating expense increased $19.6 million. Operating margin was 22.6%, down 1.6 percentage points compared with 2015.
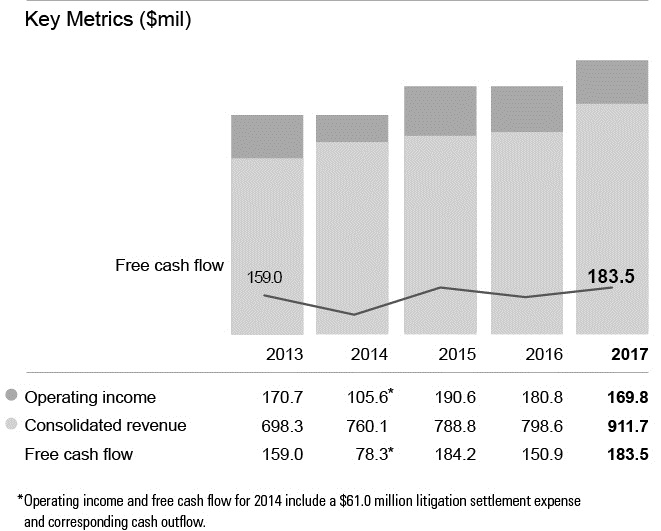
We reported adjusted operating income, which excludes PitchBook, of $182.2 million in 2017 and $184.1 million for 2016. Adjusted operating income is a non-GAAP measure; the table below shows a reconciliation to the comparable GAAP measure.
($000) | 2017 | 2016 | 2015 | 2017 Change | 2016 Change | |||||||||||||
Operating income | $ | 169.8 | $ | 180.8 | $ | 190.6 | (6.0 | )% | (5.2 | )% | ||||||||
Add back: management bonus plan expense | 7.9 | 0.6 | — | NMF | — | |||||||||||||
Add back: intangible amortization expense | 10.6 | 0.9 | — | NMF | — | |||||||||||||
Deduct: capitalized labor benefit | (4.6 | ) | — | — | NMF | — | ||||||||||||
Add back (deduct): other operating (income) loss, net for PitchBook | (1.5 | ) | 1.8 | — | NMF | — | ||||||||||||
Adjusted operating income | $ | 182.2 | $ | 184.1 | $ | 190.6 | (1.1 | )% | (3.4 | )% | ||||||||
56
We present adjusted operating income (operating income excluding PitchBook) to show the effect of this acquisition, to better reflect period-over-period comparisons, and improve overall understanding of our current and future financial performance.
We reported an adjusted operating margin, which excludes PitchBook, of 21.5% in 2017 and 23.2% in 2016. Adjusted operating margin is a non-GAAP measure; the table below shows a reconciliation to the comparable GAAP measure.
($000) | 2017 | 2016 | 2015 | 2017 Change | 2016 Change | |||||||||||
Operating margin | 18.6 | % | 22.6 | % | 24.2 | % | (4.0 | ) | pp | (1.6 | ) | pp | ||||
Add back: management bonus plan expense | 0.7 | % | 0.1 | % | — | % | 0.6 | pp | 0.1 | pp | ||||||
Add back: intangible amortization expense | 1.1 | % | 0.1 | % | — | % | 1.0 | pp | 0.1 | pp | ||||||
Deduct: capitalized labor benefit | (0.2 | )% | — | % | — | % | (0.2 | ) | pp | — | pp | |||||
Add back (deduct): other operating (income) loss, net for PitchBook | 1.3 | % | 0.4 | % | — | % | 0.9 | pp | 0.4 | pp | ||||||
Adjusted operating margin | 21.5 | % | 23.2 | % | 24.2 | % | (1.7 | ) | pp | (1.0 | ) | pp | ||||
We present adjusted operating margin (operating margin excluding PitchBook) to show the effect of this acquisition, better reflect period-over-period comparisons, and improve overall understanding of our current and future financial performance.
Non-Operating Income, Equity in Net Income (Loss) of Unconsolidated Entities, and Effective Tax Rate and Income Tax Expense
Non-Operating Income
The following table presents the components of non-operating income, net:
(in millions) | 2017 | 2016 | 2015 | |||||||||
Interest income | $ | 1.9 | $ | 1.8 | $ | 1.8 | ||||||
Interest expense | (5.5 | ) | (1.5 | ) | (0.5 | ) | ||||||
Gain on sale of investments, net | 3.2 | 0.6 | 0.6 | |||||||||
Gain on sale of business | 16.7 | — | — | |||||||||
Holding gain upon acquisition of additional ownership of equity-method investments | — | 37.1 | — | |||||||||
Other income (expense), net | (5.0 | ) | 6.1 | 1.2 | ||||||||
Non-operating income, net | $ | 11.3 | $ | 44.1 | $ | 3.1 | ||||||
Interest income mainly reflects interest from our investment portfolio. Interest expense mainly relates to the outstanding principal balance of the credit facility we established in 2014. Gain on sale of business relates to our sale of HelloWallet in June 2017.
Non-operating income in 2016 includes the $37.1 million gain we recorded with the purchase of the remaining ownership interest in PitchBook, which was previously a minority investment.
Other income (expense), net primarily includes foreign currency exchange gains and losses arising from resulting from U.S. dollar denominated short-term investments held in non-U.S. jurisdictions.
57
Equity in Net Income (Loss) of Unconsolidated Entities
(in millions) | 2017 | 2016 | 2015 | |||||||||
Equity in net income (loss) of unconsolidated entities | $ | (1.3 | ) | $ | (0.2 | ) | $ | 1.8 | ||||
Equity in net income (loss) of unconsolidated entities primarily reflects income from Morningstar Japan K.K. (MJKK) offset by losses in our other equity method investments.
We describe our investments in unconsolidated entities in more detail in Note 9 of the Notes to our Consolidated Financial Statements.
Effective Tax Rate and Income Tax Expense
The following table summarizes the components of our effective tax rate:
(in millions) | 2017 | 2016 | 2015 | |||||||||
Income before income taxes and equity in net income (loss) of unconsolidated entities | $ | 181.1 | $ | 224.9 | $ | 193.7 | ||||||
Equity in net income (loss) of unconsolidated entities | (1.3 | ) | (0.2 | ) | 1.8 | |||||||
Net income attributable to the noncontrolling interest | — | — | (0.2 | ) | ||||||||
Total | $ | 179.8 | $ | 224.7 | $ | 195.3 | ||||||
Income tax expense | $ | 42.9 | $ | 63.7 | $ | 62.7 | ||||||
Effective tax rate | 23.9 | % | 28.3 | % | 32.1 | % | ||||||
U.S. Tax Reform
On December 22, 2017, the United States enacted tax reform legislation that included a broad range of business tax provisions, including but not limited to a reduction in the U.S. federal tax rate from 35% to 21% as well as provisions that limit or eliminate various deductions or credits. The legislation also causes U.S. allocated expenses (e.g. interest and general administrative expenses) to be taxed and imposes a new tax on U.S. cross-border payments. Furthermore, the legislation includes a one-time transition tax on accumulated foreign earnings and profits.
In response to the enactment of U.S. tax reform, the SEC issued guidance to address the complexity in accounting for this new legislation. When the initial accounting for items under the new legislation is incomplete, the guidance allows us to recognize provisional amounts when reasonable estimates can be made or to continue to apply the prior tax law if a reasonable estimate of the impact cannot be made. The SEC has provided up to a one-year window for companies to finalize the accounting for the impacts of this new legislation and we anticipate finalizing our accounting during 2018.
While our accounting for the new U.S. tax legislation is not complete, we have made reasonable estimates for some provisions and recognized a $10.6 million discrete net tax benefit in our 2017 Consolidated Financial Statements. This net benefit is primarily comprised of a $14.7 million provisional deferred tax benefit from revaluing our net U.S. deferred tax liabilities to reflect the new U.S. corporate tax rate. We have also recorded a provisional tax charge of $7.5 million payable over 8 years. This tax expense is offset by the provisional tax benefit of a $6.4 million reduction of a deferred tax liability previously recorded for our foreign equity method investments. We have also recorded a provisional expense of $3.0 million for the establishment of a deferred tax liability related to changes in our indefinite reinvestment assertion. However, as of the date of this Form 10-K, we are evaluating the accounting impacts of the legislation. As part of our evaluation, we will continue to assemble and analyze all of the information required to quantify the effects of the legislation. The ultimate impact may differ from these provisional amounts, possibly materially, due to, among other things, additional analysis, changes in interpretations and assumptions we have made, additional regulatory guidance that may be issued, and actions we may take. See Note 14 of the Notes to our Consolidated Financial Statements for further details on the impacts of U.S. tax reform.
58
For a reconciliation of the U.S. federal tax rate to our effective income tax rate, refer to Note 14 of the Notes to our Consolidated Financial Statements.
Our effective tax rate in 2017 was 23.9%, a decrease of 4.4 percentage points compared with 28.3% in 2016, primarily because of the provisional tax impacts of the new U.S. tax legislation detailed above.
Our effective tax rate in 2016 was 28.3%, a decrease of 3.8 percentage points compared with 32.1% in 2015, mainly because the $37.1 million holding gain recorded in connection with the December 2016 purchase of the remaining ownership interest in PitchBook was not taxable.
Liquidity and Capital Resources
As of December 31, 2017, we had cash, cash equivalents, and investments of $353.3 million, up $49.3 million from the end of 2016. The increase reflects cash provided by operating activities and proceeds of $23.7 million related to the sale of HelloWallet. These items were partially offset by $70.0 million of repayments of long-term debt, $66.6 million of capital expenditures, and $42.3 million used to repurchase common stock under our share repurchase program, of which $0.7 million was repurchased in the fourth quarter of 2016 but settled and paid early in the first half of 2017. Dividends paid of $39.3 million and purchases of equity-method investments of $24.8 million also offset the cash inflows.
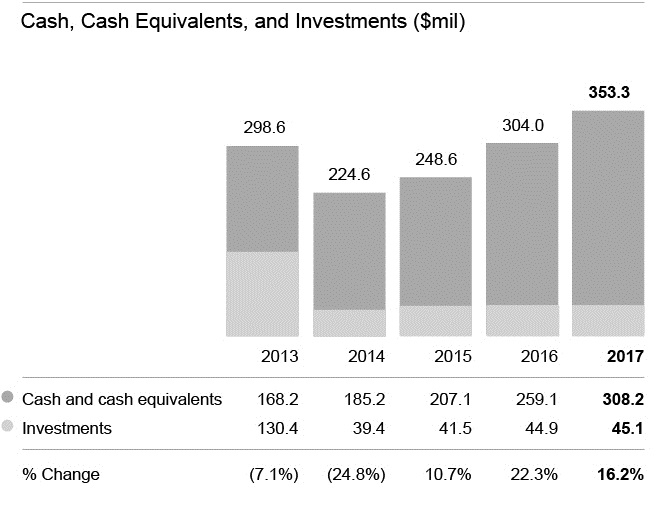
Cash provided by operating activities is our main source of cash. In 2017, cash provided by operating activities was $250.1 million, reflecting $226.8 million of net income, adjusted for non-cash items and $23.3 million in positive changes from our net operating assets and liabilities.
In November 2016, we amended our credit agreement to provide us with a three-year credit facility with a borrowing capacity of up to $300.0 million. We had an outstanding principal balance of $180.0 million as of December 31, 2017, leaving borrowing availability of $120.0 million. The credit agreement also contains financial covenants under which we: (i) may not exceed a maximum consolidated leverage ratio of 3.00 to 1.00 and (ii) are required to maintain a minimum consolidated interest coverage ratio of not less than 3.00 to 1.00. We were in compliance with the financial covenants at December 31, 2017.
59
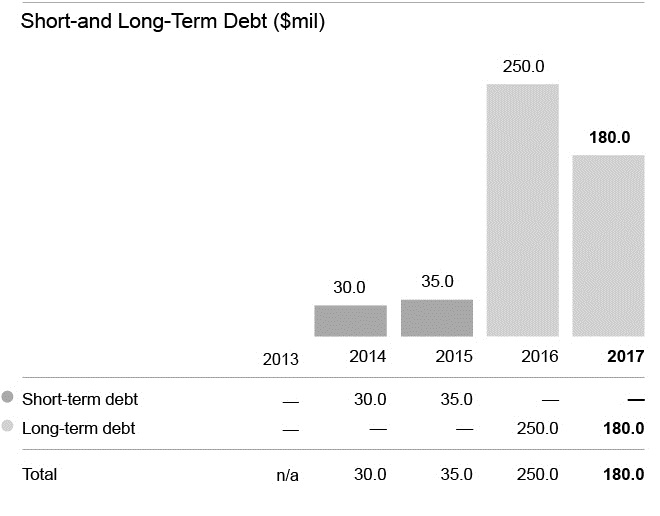
We believe our available cash balances and investments, along with cash generated from operations and our line of credit, will be sufficient to meet our operating and cash needs for at least the next 12 months. We invest our cash reserves in cash equivalents and investments. We maintain a conservative investment policy for our investments. We invest a portion of our investment balance (approximately $23.1 million, or 51% of our total investments balance as of December 31, 2017) in stocks, bonds, options, mutual funds, money market funds, or exchange-traded products that replicate the model portfolios and strategies created by Morningstar. These investment accounts may also include exchange-traded products where Morningstar is an index provider.
Approximately 69% of our cash, cash equivalents, and investments as of December 31, 2017 was held by our operations outside the United States, down from about 71% as of December 31, 2016.
We intend to use our cash, cash equivalents, and investments for general corporate purposes, including working capital and funding future growth.
In December 2015, our board of directors approved a $300.0 million increase to our share repurchase program, bringing the total amount authorized under the program to $1.0 billion. The authorization expired on December 31, 2017. On December 8, 2017, the board of directors approved a new share repurchase program that authorizes the company to repurchase up to $500.0 million in shares of the company's outstanding common stock, effective January 1, 2018. The authorization expires on December 31, 2020.
In 2017, we repurchased a total of approximately 0.5 million shares for $41.9 million. As of December 31, 2017, we had repurchased a total of 10.6 million shares for $714.8 million since we announced the share repurchase program in September 2010.
In 2017, we also paid dividends of $39.3 million. In February 2018, our board of directors declared a quarterly dividend of 25 cents per share. The dividend is payable on April 27, 2018 to shareholders of record as of April 6, 2018. We expect to make regular quarterly dividend payments of 25 cents per share in 2018.
We expect to continue making capital expenditures in 2018, primarily for computer hardware and software, internally developed software, and leasehold improvements for new and existing office locations. We have commenced migrating our infrastructure to the cloud. The migration will have some transitional effects on our level of capital expenditures and operating expenses and we expect to maintain certain redundant infrastructure prior to a full transition.
We also expect to use a portion of our cash and investments balances in the first quarter of 2018 to make annual bonus payments of approximately $48.2 million related to the 2017 bonus compared to $38.0 million in 2016.
60
Consolidated Free Cash Flow
As described in more detail above, we define free cash flow as cash provided by or used for operating activities less capital expenditures. We present free cash flow solely as supplemental disclosure to help investors better understand how much cash is available after we spend money to operate our business. Our management team uses free cash flow to evaluate our business. Free cash flow is not a measure of performance set forth under GAAP. Also, the free cash flow definition we use may not be comparable to similarly titled measures used by other companies.
(in millions) | 2017 | 2016 | 2015 | 2017 Change | 2016 Change | |||||||||||||
Cash provided by operating activities | $ | 250.1 | $ | 213.7 | $ | 241.5 | 17.0 | % | (11.5 | )% | ||||||||
Capital expenditures | (66.6 | ) | (62.8 | ) | (57.3 | ) | 6.1 | % | 9.6 | % | ||||||||
Free cash flow | $ | 183.5 | $ | 150.9 | $ | 184.2 | 21.6 | % | (18.1 | )% | ||||||||
We generated free cash flow of $183.5 million in 2017, an increase of $32.6 million versus 2016. The change reflects a $36.4 million increase in cash provided by operating activities as well as a $3.8 million increase in capital expenditures.
We generated free cash flow of $150.9 million in 2016, a decrease of $33.3 million versus 2015. The change reflects a $27.8 million decrease in cash provided by operating activities as well as a $5.5 million increase in capital expenditures.
Acquisitions
We paid a total of $203.7 million, less cash acquired, related to acquisitions over the past three years. We describe these acquisitions in Note 7 of the Notes to our Consolidated Financial Statements.
We paid a total of $47.5 million related to purchasing additional investments in unconsolidated entities over the past three years. We describe these investments in Note 9 of the Notes to our Consolidated Financial Statements.
Divestitures
We sold HelloWallet in 2017 and received a total of $23.7 million related to this sale. For more information, please see Note 8 of the Notes to our Consolidated Financial Statements.
Application of Critical Accounting Policies and Estimates
Our discussion and analysis of our financial condition and results of operations are based on our Consolidated Financial Statements, which have been prepared in accordance with GAAP. We discuss our significant accounting policies in Note 2 of the Notes to our Consolidated Financial Statements. The preparation of financial statements in accordance with GAAP requires our management team to make estimates and assumptions that affect the reported amounts of assets, liabilities, revenue, expense, and related disclosures included in our Consolidated Financial Statements.
We evaluate our estimates on an ongoing basis. We base our estimates on historical experience and various other assumptions that we believe are reasonable. Based on these assumptions and estimates, we make judgments about the carrying values of assets and liabilities that are not readily apparent from other sources. Our actual results could vary from these estimates and assumptions. If actual amounts are different from previous estimates, we include revisions in our results of operations for the period in which the actual amounts become known.
61
We believe the following critical accounting policies reflect the significant judgments and estimates used in the preparation of our Consolidated Financial Statements:
Revenue Recognition
Much of our revenue comes from the sale of subscriptions or licenses for data, software, and Internet-based products and services. We recognize this revenue in equal amounts over the term of the subscription or license, which generally ranges from one to three years. We also provide research, investment management, retirement advice, and other services. We recognize this revenue when the service is provided or during the service obligation period defined in the contract.
We make significant judgments related to revenue recognition, including whether fees are fixed or determinable and whether the collection of payment is probable. For contracts that combine multiple products and services, we make judgments regarding the value of each element in the arrangement based on selling prices of the items when sold separately. Delivery of our products and services is a prerequisite to the recognition of revenue. If arrangements include an acceptance provision, we begin recognizing revenue upon the receipt of customer acceptance.
We make judgments at the beginning of an arrangement regarding whether or not collection is probable. We typically sell to institutional customers with whom we have a history of successful collections and assess the probability of collection on a case-by-case basis.
Deferred revenue is the amount invoiced or collected in advance for subscriptions, licenses, or services that has not yet been recognized as revenue. Deferred revenue is the second largest liability on our Consolidated Balance Sheets and, at the end of 2017, totaled $185.5 million (of which $171.3 million was classified as a current liability with an additional $14.2 million included in other long-term liabilities). We expect to recognize this deferred revenue in future periods as we fulfill our service obligations under our subscription, license, and service agreements.
The amount of deferred revenue may increase or decrease based on the mix of contracted products and services and the volume of new and renewal subscriptions. The timing of future revenue recognition may change depending on the terms of the license agreements and the timing of fulfilling our service obligations. We believe that the estimate related to revenue recognition is a critical accounting estimate, and to the extent that there are material differences between our determination of deferred revenue and actual results, our financial condition or results of operations may be affected.
Acquisitions, Goodwill, and Other Intangible Assets
Our financial statements reflect the operations of an acquired business starting from the completion of the transaction. We record the estimated fair value of assets acquired and liabilities assumed as of the date of acquisition.
Allocating the purchase price to the acquired assets and liabilities involves management judgment. We base the fair value estimates on available historical information and on future expectations and assumptions that we believe are reasonable, but these estimates are inherently uncertain.
Determining the fair value of intangible assets requires significant management judgment in each of the following areas:
• | Identify the acquired intangible assets: For each acquisition, we identify the intangible assets acquired. These intangible assets generally consist of customer relationships, trademarks and trade names, technology-related intangibles (including internally developed software and databases), and non-compete agreements. |
• | Estimate the fair value of these intangible assets: We consider various approaches to value the intangible assets. These include the cost approach, which measures the value of an asset based on the cost to reproduce it or replace it with another asset of like utility; the market approach, which values the asset through an analysis of sales and offerings of comparable assets; and the income approach, which measures the value of an asset based on the present value of the economic benefits it is expected to produce. |
62
• | Estimate the remaining useful life of the assets: For each intangible asset, we use judgment and assumptions to establish the remaining useful life of the asset. For example, for customer relationships, we determine the estimated useful life with reference to observed customer attrition rates. For technology-related assets such as databases, we make judgments about the demand for current data and historical metrics in establishing the remaining useful life. For internally developed software, we estimate an obsolescence factor associated with the software. |
We record any excess of the purchase price over the estimated fair values of the net assets acquired as goodwill, which is not amortized. Instead, it is subject to an impairment test annually, or whenever indicators of impairment exist, based on a discounted cash-flow model. We review the carrying value of goodwill for impairment at least annually based on the estimated fair value of our reporting unit. If we determine that goodwill is impaired, we reduce the goodwill balance to reflect the revised fair value.
For purposes of performing the impairment test, we determine fair values based on a discounted cash-flow methodology. This requires significant judgments including estimation of future cash flows, which, among other factors, is dependent on internal forecasts, long-term growth estimates, and determination of weighted average cost of capital.
We believe the accounting estimates related to purchase price allocations and subsequent goodwill impairment testing are critical accounting estimates because changes in these assumptions could materially affect the amounts and classifications of assets and liabilities presented in our Consolidated Balance Sheets, as well as the amount of amortization and depreciation expense, if any, recorded in our Consolidated Statements of Income.
Stock-Based Compensation
We include stock-based compensation expense in each of our operating expense categories. Our stock-based compensation expense primarily reflects grants of restricted stock units, restricted stock, performance share awards, and market stock units.
We measure stock-based compensation expense at the grant date based on the fair value of the award and recognize the expense ratably over the award's vesting period. We measure the fair value of our restricted stock units on the date of grant based on the market price of the underlying common stock as of the close of trading on the day before the grant. We estimate expected forfeitures of stock-based awards at the grant date and recognize compensation cost only for those awards expected to vest. We later adjust this forfeiture assumption to the actual forfeiture rate. Therefore, changes in the forfeiture assumptions do not change the total amount of expense ultimately recognized over the vesting period. Instead, different forfeiture assumptions would only affect the timing of expense recognition over the vesting period.
We adjust the stock-based compensation expense to reflect those awards that ultimately vested and update our estimate of the forfeiture rate that will be applied to awards not yet vested.
We believe the estimates related to stock-based compensation expense are critical accounting estimates because the assumptions used could significantly impact the timing and amount of stock-based compensation expense recorded in our Consolidated Financial Statements.
Income Taxes
On December 22, 2017, the United States enacted tax reform legislation that included a broad range of business tax provisions. As a result of the U.S. tax reform and the related SEC guidance, we included provisional estimates in our consolidated financial statements for some impacts of the new tax legislation. See Note 14 of the Notes to our Consolidated Financial Statements for further discussion of the provisional amounts related to U.S. tax reform included in our Consolidated Financial Statements.
Our effective tax rate is based on the mix of income and losses in our U.S. and non-U.S. operations, statutory tax rates, and tax-planning opportunities available to us in the various jurisdictions in which we operate. Significant judgment is required to evaluate our tax positions.
63
Because of timing differences required by tax law, the effective tax rate reflected in our Consolidated Financial Statements is different from the tax rate reported on our tax return (our cash tax rate). Some of these differences, such as expenses that are not deductible in our tax return, are permanent. Other differences, such as depreciation expense, reverse over time. These timing differences create deferred tax assets and liabilities. We determine our deferred tax assets and liabilities based on temporary differences between the financial reporting and the tax basis of assets and liabilities.
As of December 31, 2017, we had gross deferred tax assets of $34.5 million and gross deferred tax liabilities of $56.1 million. The deferred tax assets include $3.1 million of deferred tax assets related to $14.8 million of net operating losses (NOLs) of our non-U.S. operations. In assessing the realizability of our deferred tax assets, we consider whether it is more likely than not that some portion or all of the deferred tax assets will not be realized. We have recorded a valuation allowance against all but approximately $5.4 million of the non-U.S. NOLs, reflecting the likelihood that the benefit of the NOLs will not be realized. We have not recorded a valuation allowance against the U.S. federal NOLs of $9.1 million because we expect the benefit of the U.S. federal NOLs to be fully utilized before expiration.
In assessing the need for a valuation allowance, we consider both positive and negative evidence, including tax planning strategies, projected future taxable income, and recent financial performance. If we determine a lower allowance is required at some point in the future, we would record a reduction to our tax expense and valuation allowance. These adjustments would be made in the same period we determined the change in the valuation allowance was needed. This would cause our income tax expense, effective tax rate, and net income to fluctuate.
We use judgment to identify, recognize, and measure the amounts of uncertain tax positions to be recorded in the financial statements related to tax positions taken or expected to be taken in a tax return. We recognize liabilities to represent our potential future obligations to taxing authorities for the benefits taken in our tax returns. We adjust these liabilities, including any impact of the related interest and penalties, in light of changing facts and circumstances such as the progress of a tax audit. A number of years may elapse before a particular matter for which we have established a reserve is audited and finally resolved. The number of years with open tax audits varies depending on the tax jurisdiction.
We use judgment to classify unrecognized tax benefits as either current or noncurrent liabilities in our Consolidated Balance Sheets. Settlement of any particular issue would usually require the use of cash. We generally classify liabilities associated with unrecognized tax benefits as noncurrent liabilities. It typically takes several years between our initial tax return filing and the final resolution of any uncertain tax positions with the tax authority. We recognize favorable resolutions of tax matters for which we have previously established reserves as a reduction to our income tax expense when the amounts involved become known.
Assessing the future tax consequences of events that have been recognized in our Consolidated Financial Statements or tax returns requires judgment. Variations in the actual outcome of these future tax consequences could materially impact our financial position, results of operations, or cash flows.
Contingencies
We are subject to various claims and contingencies related to legal proceedings and investigations. These legal proceedings involve inherent uncertainties including, but not limited to, court rulings, negotiations between affected parties, and government actions. Assessing the probability of loss for such contingencies and determining how to accrue the appropriate liabilities requires judgment. If actual results differ from our assessments, our financial position, results of operations, or cash flows would be affected.
64
Recently Issued Accounting Pronouncements
On May 28, 2014, the FASB issued ASU No. 2014-09, Revenue from Contracts with Customers, which requires an entity to recognize the amount of revenue to which it expects to be entitled for the transfer of promised goods or services to customers. The ASU will replace most existing revenue recognition guidance in U.S. GAAP when it becomes effective. The original effective date for ASU No. 2014-09 would have required us to adopt it beginning on January 1, 2017. In August 2015, the FASB issued ASU No. 2015-14, Revenue from Contracts with Customers—Deferral of the Effective Date, which defers the effective date of ASU No. 2014-09 for one year and permits early adoption as early as the original effective date of ASU No. 2014-09. We elected the deferral, and the new standard is effective for us on January 1, 2018.
We have obtained an understanding of ASU No. 2014-09 and have substantially completed our analysis of the impact of the new standard on our financial results. We have completed a high-level assessment of the attributes within our contracts for our major products and services, and we have assessed the impacts to our internal processes, control environment, and disclosures. We have determined that the adoption of ASU No. 2014-09 will not result in a material change to the timing of when revenue is recognized and we intend to retain similar accounting treatment used to recognize revenue under current practices. We have identified that there will be certain changes in accounting treatment related to delivery of third-party content (principal vs. agent) and costs to obtain contracts (e.g., sales commissions).
The change related to delivery of third-party content (principal vs. agent) is expected to result in no impact on our consolidated operating income; however it will result in a increase in both revenue and cost of revenue versus prior periods of approximately $6 million to $7 million as revenue will be recognized on a gross rather than net basis for certain arrangements.
The change related to the capitalization of cost to obtain contracts is expected to result in an increase to retained earnings of approximately $25 million to $30 million for commission expenses which were previously expensed. We expected to amortize this adjustment over a period not to exceed three years and expect 2018 commission expense resulting from this change will range between $14 million and $16 million. Additionally, in 2018 we will expense any discretionary payments made under our commission plans as well as pro-rata portions of any new commission amounts paid in 2018.
The standard allows for both retrospective and modified retrospective methods of adoption. We plan to adopt using the modified retrospective transition method applied to those contracts which were not completed as of January 1, 2018. Upon adoption, we will recognize the cumulative effect of adopting this guidance as an adjustment to our opening balance of retained earnings as noted above. Prior periods will not be retrospectively adjusted and we will discuss the comparability of these adjustments within our 2018 results against the prior periods.
We are continuing to evaluate the effect that ASU No. 2014-09 will have on our consolidated financial statement presentation and related disclosures. We expect expanded disclosures related to the revenue recognized in the reporting period that was included in the contract liability (i.e., deferred revenue) balance at the beginning of the period. We also plan to provide additional disclosures on our unsatisfied performance obligations at the end of the period and expected timing of when that contract liability will be recognized into revenue.
65
On March 17, 2016, the FASB issued ASU No. 2016-08, Revenue from Contracts with Customers: Principal versus Agent Considerations (Reporting Revenue Gross versus Net), which provides guidance on assessing whether an entity is a principal or an agent in a revenue transaction and whether an entity reports revenue on a gross or net basis. On April 14, 2016, the FASB issued ASU No. 2016-10, Revenue from Contracts with Customers: Identifying Performance Obligations and Licensing, which provides guidance on identifying performance obligations and accounting for licenses of intellectual property. On May 6, 2016, the FASB issued ASU No. 2016-11, Revenue Recognition and Derivatives and Hedging: Rescission of SEC guidance because of ASU No. 2014-09 and ASU No. 2014-16 pursuant to staff announcements at the March 3, 2016 EITF Meeting, which rescinds the following SEC Staff Observer comments from ASC 605, Revenue Recognition, upon an entity's early adoption of ASC 606, Revenue from Contracts with Customers: Revenue and expense recognition for freight services in process, accounting for shipping and handling fees and costs, and accounting for consideration given by a vendor to a customer (including a reseller of the vendor's products). On May 9, 2016, the FASB issued ASU No. 2016-12, Revenue from Contracts with Customers: Narrow-Scope Improvements and Practical Expedients, which makes narrow-scope amendments to ASU No. 2014-09 and provides practical expedients to simplify the transition to the new standard and clarify certain aspects of the standard. On December 21, 2016, the FASB issued ASU No. 2016-20, Technical Corrections and Improvements to Topic 606, Revenue from Contracts with Customers, which makes narrow-scope amendments to ASU No. 2014-09.
The effective date and transition requirements for ASU No. 2016-08, ASU No. 2016-10, ASU No. 2016-11, ASU No. 2016-12, and ASU No. 2016-20 are the same as the effective date and transition requirements of ASU No. 2014-09. We are evaluating the effect that ASU No. 2016-08, ASU No. 2016-10, ASU No. 2016-11, ASU No. 2016-12, and ASU No. 2016-20 will have on our consolidated financial statements and related disclosures.
On February 25, 2016, the FASB issued ASU No. 2016-02, Leases, which will require lessees to recognize almost all leases on their balance sheet as a right-of-use asset and a lease liability. The new standard is effective for us on January 1, 2019. The new standard must be adopted using a modified retrospective transition and provides for certain practical expedients. Transition will require application of the new guidance at the beginning of the earliest comparative period presented. We are evaluating the effect that ASU No. 2016-02 will have on our consolidated financial statements and related disclosures.
On August 26, 2016, the FASB issued ASU No. 2016-15, Statement of Cash Flows: Classification of Certain Cash Receipts and Cash Payments, which reduces diversity in practice of how certain transactions are classified in the statement of cash flows. The new guidance clarifies the classification of cash activities related to debt prepayment or debt extinguishment costs, settlement of zero-coupon debt instruments, contingent consideration payments made after a business combination, proceeds from the settlement of insurance claims, proceeds from the settlement of corporate and bank-owned life insurance policies, distributions received from equity-method investments, and beneficial interests in securitization transactions. The guidance also describes a predominance principle in which cash flows with aspects of more than one class that cannot be separated should be classified based on the activity that is likely to be the predominant source or use of cash flow.
The new standard is effective for us on January 1, 2018. Early adoption is permitted, including adoption in an interim period, but requires all elements of the amendments to be adopted at once rather than individually. The new standard must be adopted using a retrospective transition method. We are evaluating the effect that ASU No. 2016-15 will have on our consolidated financial statements and related disclosures.
On January 5, 2017, the FASB issued ASU No. 2017-01, Business Combinations: Clarifying the Definition of a Business, which revises the definition of a business. When substantially all of the fair value of gross assets acquired is concentrated in a single asset (or a group of similar assets), the assets acquired would not represent a business. To be considered a business, an acquisition would have to include an input and a substantive process that together significantly contribute to the ability to create outputs. The new guidance provides a framework to evaluate when an input and substantive process are present (including for early-stage companies that have not generated outputs). To be a business without outputs, there will now need to be an organized workforce. The new guidance also narrows the definition of the term outputs to be consistent with how it is described in Topic 606, Revenue from Contracts with Customers. The new standard is effective for us on January 1, 2018. Early adoption is permitted. We are evaluating the effect that ASU No. 2017-01 will have on our consolidated financial statements and related disclosures.
66
On January 26, 2017, the FASB issued ASU No. 2017-04, Intangibles—Goodwill and Other, which simplifies the accounting for goodwill impairment. The guidance removes Step 2 of the goodwill impairment test, which requires a hypothetical purchase price allocation. A goodwill impairment will now be the amount by which a reporting unit’s carrying value exceeds its fair value, not to exceed the carrying amount of goodwill. All other goodwill impairment guidance will remain largely unchanged. Entities will continue to have the option to perform a qualitative assessment to determine if a quantitative impairment test is necessary. The same one-step impairment test will be applied to goodwill at all reporting units, even those with zero or negative carrying amounts. Entities will be required to disclose the amount of goodwill at reporting units with zero or negative carrying amounts. The new standard is effective for us on January 1, 2020. The new standard should be applied prospectively. Early adoption is permitted for any impairment tests performed after January 1, 2017. We are evaluating the effect that ASU No. 2017-04 will have on our consolidated financial statements and related disclosures.
On May 10, 2017, the FASB issued ASU No. 2017-09, Compensation—Stock Compensation: Scope of Modification Accounting, which clarifies when to account for a change to the terms or conditions of a share-based payment award as a modification. Under the new guidance, modification accounting is required only if the fair value, the vesting conditions, or the classification of the award (as equity or liability) changes as a result of the change in terms or conditions. The new standard is effective for us on January 1, 2018. The new standard should be applied prospectively. Early adoption is permitted. We are evaluating the effect that ASU No. 2017-09 will have on our consolidated financial statements and related disclosures.
Contractual Obligations
The table below shows our known contractual obligations as of December 31, 2017 and the expected timing of cash payments related to these contractual obligations:
(in millions) | 2018 | 2019 | 2020 | 2021 | 2022 | Thereafter | Total | ||||||||||||||||||||||
Minimum commitments on non-cancelable operating lease obligations (1) | $ | 26.8 | $ | 30.4 | $ | 32.5 | $ | 29.8 | $ | 19.1 | $ | 54.9 | $ | 193.5 | |||||||||||||||
Minimum payments related to long-term financing agreements | 3.3 | 0.6 | 0.1 | — | — | — | 4.0 | ||||||||||||||||||||||
Minimum payments on credit facility (2) | 4.6 | 183.9 | — | — | — | — | 188.5 | ||||||||||||||||||||||
Unrecognized tax benefits (3) | 8.7 | — | — | — | — | — | 8.7 | ||||||||||||||||||||||
Deemed mandatory repatriation (4) | 0.6 | 0.6 | — | 0.6 | 0.6 | 0.6 | 4.5 | 7.5 | |||||||||||||||||||||
Total | $ | 44.0 | $ | 215.5 | $ | 33.2 | $ | 30.4 | $ | 19.7 | $ | 59.4 | $ | 402.2 | |||||||||||||||
(1) The non-cancelable operating lease obligations are mainly for office space.
(2) The minimum payments on the credit facility reflect the current outstanding principal balance of $180.0 million and an estimate for interest and commitment fees.
(3) Represents unrecognized tax benefits (including penalties and interest, less the impact of any associated tax benefits). The amount included in the table represents items that may be resolved through settlement of tax audits or for which the statutes of limitations are expected to lapse during 2018. The table excludes $7.0 million of unrecognized tax benefits, included as a long-term liability in our Consolidated Balance Sheet as of December 31, 2017, for which we cannot make a reasonably reliable estimate of the period of payment.
(4) U.S. federal income tax on deemed mandatory repatriation is payable over 8 years pursuant to the Tax Reform Act.
67
Item 7A. Quantitative and Qualitative Disclosures about Market Risk
Our investment portfolio is actively managed and may suffer losses from fluctuating interest rates, market prices, or adverse security selection. These accounts may consist of stocks, bonds, options, mutual funds, money market funds, or exchange-traded products that replicate the model portfolios and strategies created by Morningstar. These investment accounts may also include exchange-traded products where Morningstar is an index provider. As of December 31, 2017, our cash, cash equivalents, and investments balance was $353.3 million. Based on our estimates, a 100 basis-point change in interest rates would not have a material effect on the fair value of our investment portfolio.
We are subject to risk from fluctuations in the interest rates related to our long-term debt. The interest rates are based upon the applicable LIBOR rate plus an applicable margin for such loans or the lender's base rate plus an applicable margin for such loans. On an annualized basis, based on December 31, 2017 estimated LIBOR rates, we estimate a 100 basis-point change in the LIBOR rate would have a $1.8 million impact.
We are subject to risk from fluctuations in foreign currencies from our operations outside of the United States. To date, we have not engaged in currency hedging, and we do not currently have any positions in derivative instruments to hedge our currency risk.
The table below shows our exposure to foreign currency denominated revenue and operating income for the year ended December 31, 2017:
(in millions, except foreign currency rates) | Euro | British Pound | Australian Dollar | Other Foreign Currencies | ||||||||||||
Foreign currency rate in U.S. dollars as of December 31, 2017 | 1.1980 | 1.3494 | 0.7807 | — | ||||||||||||
Foreign denominated percentage of revenue | 5.0 | % | 7.1 | % | 3.7 | % | 8.9 | % | ||||||||
Foreign denominated percentage of operating income | 10.1 | % | (1.8 | )% | 2.2 | % | (13.2 | )% | ||||||||
Estimated effect of a 10% adverse currency fluctuation on revenue | $ | (2.1 | ) | $ | (3.8 | ) | $ | (2.8 | ) | $ | (6.2 | ) | ||||
Estimated effect of a 10% adverse currency fluctuation on operating income | $ | (0.8 | ) | $ | 0.3 | $ | (0.3 | ) | $ | 1.7 | ||||||
The table below shows our net investment exposure in foreign currencies as of December 31, 2017:
(in millions) | Euro | British Pound | Australian Dollar | Other Foreign Currencies | ||||||||||||
Assets, net of unconsolidated entities | $ | 111.8 | $ | 123.8 | $ | 88.9 | $ | 173.3 | ||||||||
Liabilities | 58.5 | 15.6 | 64.5 | 63.6 | ||||||||||||
Net currency position | $ | 53.3 | $ | 108.2 | $ | 24.4 | $ | 109.7 | ||||||||
Estimated effect of a 10% adverse currency fluctuation on equity | $ | (5.3 | ) | $ | (10.8 | ) | $ | (2.4 | ) | $ | (11.0 | ) | ||||
68
Item 8. Financial Statements and Supplementary Data
Report of Independent Registered Public Accounting Firm
The Board of Directors and Shareholders
Morningstar, Inc.:
Opinion on the Consolidated Financial Statements
We have audited the accompanying consolidated balance sheets of Morningstar, Inc. and subsidiaries (the Company) as of December 31, 2017 and 2016, the related consolidated statements of income, comprehensive income, equity, and cash flows for each of the years in the three‑year period ended December 31, 2017, and the related notes and financial statement Schedule II - Valuation and Qualifying Accounts (collectively, the consolidated financial statements). In our opinion, the consolidated financial statements present fairly, in all material respects, the financial position of the Company as of December 31, 2017 and 2016, and the results of its operations and its cash flows for each of the years in the three‑year period ended December 31, 2017, in conformity with U.S. generally accepted accounting principles.
We also have audited, in accordance with the standards of the Public Company Accounting Oversight Board (United States) (PCAOB), the Company’s internal control over financial reporting as of December 31, 2017, based on criteria established in Internal Control - Integrated Framework (2013) issued by the Committee of Sponsoring Organizations of the Treadway Commission, and our report dated March 1, 2018, expressed an unqualified opinion on the effectiveness of the Company’s internal control over financial reporting.
Basis for Opinion
These consolidated financial statements are the responsibility of the Company’s management. Our responsibility is to express an opinion on these consolidated financial statements based on our audits. We are a public accounting firm registered with the PCAOB and are required to be independent with respect to the Company in accordance with the U.S. federal securities laws and the applicable rules and regulations of the Securities and Exchange Commission and the PCAOB.
We conducted our audits in accordance with the standards of the PCAOB. Those standards require that we plan and perform the audit to obtain reasonable assurance about whether the consolidated financial statements are free of material misstatement, whether due to error or fraud. Our audits included performing procedures to assess the risks of material misstatement of the consolidated financial statements, whether due to error or fraud, and performing procedures that respond to those risks. Such procedures included examining, on a test basis, evidence regarding the amounts and disclosures in the consolidated financial statements. Our audits also included evaluating the accounting principles used and significant estimates made by management, as well as evaluating the overall presentation of the consolidated financial statements. We believe that our audits provide a reasonable basis for our opinion.
/s/ KPMG LLP
We have served as the Company’s auditor since 2011.
Chicago, Illinois
March 1, 2018
69
Report of Independent Registered Public Accounting Firm
To the Board of Directors and Shareholders
Morningstar, Inc.:
Opinion on Internal Control Over Financial Reporting
We have audited Morningstar, Inc.’s and subsidiaries’ (the Company) internal control over financial reporting as of December 31, 2017, based on criteria established in Internal Control - Integrated Framework (2013) issued by the Committee of Sponsoring Organizations of the Treadway Commission. In our opinion, the Company maintained, in all material respects, effective internal control over financial reporting as of December 31, 2017, based on criteria established in Internal Control - Integrated Framework (2013) issued by the Committee of Sponsoring Organizations of the Treadway Commission.
We also have audited, in accordance with the standards of the Public Company Accounting Oversight Board (United States) (PCAOB), the consolidated balance sheets of the Company as of December 31, 2017 and 2016, the related consolidated statements of income, comprehensive income, equity, and cash flows for each of the years in the three-year period ended December 31, 2017, and the related notes and financial statement Schedule II - Valuation and Qualifying Accounts (collectively, the consolidated financial statements), and our report dated March 1, 2018, expressed an unqualified opinion on those consolidated financial statements.
Basis for Opinion
The Company’s management is responsible for maintaining effective internal control over financial reporting and for its assessment of the effectiveness of internal control over financial reporting, included in the accompanying Management’s Report on Internal Control Over Financial Reporting. Our responsibility is to express an opinion on the Company’s internal control over financial reporting based on our audit. We are a public accounting firm registered with the PCAOB and are required to be independent with respect to the Company in accordance with the U.S. federal securities laws and the applicable rules and regulations of the Securities and Exchange Commission and the PCAOB.
We conducted our audit in accordance with the standards of the PCAOB. Those standards require that we plan and perform the audit to obtain reasonable assurance about whether effective internal control over financial reporting was maintained in all material respects. Our audit of internal control over financial reporting included obtaining an understanding of internal control over financial reporting, assessing the risk that a material weakness exists, and testing and evaluating the design and operating effectiveness of internal control based on the assessed risk. Our audit also included performing such other procedures as we considered necessary in the circumstances. We believe that our audit provides a reasonable basis for our opinion.
Definition and Limitations of Internal Control Over Financial Reporting
A company’s internal control over financial reporting is a process designed to provide reasonable assurance regarding the reliability of financial reporting and the preparation of financial statements for external purposes in accordance with generally accepted accounting principles. A company’s internal control over financial reporting includes those policies and procedures that (1) pertain to the maintenance of records that, in reasonable detail, accurately and fairly reflect the transactions and dispositions of the assets of the company; (2) provide reasonable assurance that transactions are recorded as necessary to permit preparation of financial statements in accordance with generally accepted accounting principles, and that receipts and expenditures of the company are being made only in accordance with authorizations of management and directors of the company; and (3) provide reasonable assurance regarding prevention or timely detection of unauthorized acquisition, use, or disposition of the company’s assets that could have a material effect on the financial statements.
Because of its inherent limitations, internal control over financial reporting may not prevent or detect misstatements. Also, projections of any evaluation of effectiveness to future periods are subject to the risk that controls may become inadequate because of changes in conditions, or that the degree of compliance with the policies or procedures may deteriorate.
70
/s/ KPMG LLP
Chicago, Illinois
March 1, 2018
71
Morningstar, Inc. and Subsidiaries
Consolidated Statements of Income
Year ended December 31 (in millions except per share amounts) | 2017 | 2016 | 2015 | |||||||||
Revenue | $ | 911.7 | $ | 798.6 | $ | 788.8 | ||||||
Operating expense: | ||||||||||||
Cost of revenue | 386.6 | 344.3 | 330.1 | |||||||||
Sales and marketing | 134.3 | 97.6 | 96.6 | |||||||||
General and administrative | 129.8 | 105.2 | 107.1 | |||||||||
Depreciation and amortization | 91.2 | 70.7 | 64.4 | |||||||||
Total operating expense | 741.9 | 617.8 | 598.2 | |||||||||
Operating income | 169.8 | 180.8 | 190.6 | |||||||||
Non-operating income: | ||||||||||||
Interest income (expense), net | (3.6 | ) | 0.3 | 1.3 | ||||||||
Gain on sale of investments, reclassified from other comprehensive income | 3.2 | 0.6 | 0.6 | |||||||||
Gain on sale of business | 16.7 | — | — | |||||||||
Holding gain upon acquisition of additional ownership of equity method investments | — | 37.1 | — | |||||||||
Other income (expense), net | (5.0 | ) | 6.1 | 1.2 | ||||||||
Non-operating income, net | 11.3 | 44.1 | 3.1 | |||||||||
Income before income taxes and equity in net income (loss) of unconsolidated entities | 181.1 | 224.9 | 193.7 | |||||||||
Equity in net income (loss) of unconsolidated entities | (1.3 | ) | (0.2 | ) | 1.8 | |||||||
Income tax expense | 42.9 | 63.7 | 62.7 | |||||||||
Consolidated net income | 136.9 | 161.0 | 132.8 | |||||||||
Net income attributable to noncontrolling interest | — | — | (0.2 | ) | ||||||||
Net income attributable to Morningstar, Inc. | $ | 136.9 | $ | 161.0 | $ | 132.6 | ||||||
Net income per share attributable to Morningstar, Inc.: | ||||||||||||
Basic | $ | 3.21 | $ | 3.74 | $ | 3.00 | ||||||
Diluted | $ | 3.18 | $ | 3.72 | $ | 3.00 | ||||||
Dividends per common share: | ||||||||||||
Dividends declared per common share | $ | 0.94 | $ | 0.89 | $ | 0.79 | ||||||
Dividends paid per common share | $ | 0.92 | $ | 0.88 | $ | 0.76 | ||||||
Weighted average shares outstanding: | ||||||||||||
Basic | 42.7 | 43.0 | 44.2 | |||||||||
Diluted | 43.0 | 43.3 | 44.3 | |||||||||
See notes to consolidated financial statements.
72
Morningstar, Inc. and Subsidiaries
Consolidated Statements of Comprehensive Income
Year ended December 31 (in millions) | 2017 | 2016 | 2015 | |||||||||
Consolidated net income | $ | 136.9 | $ | 161.0 | $ | 132.8 | ||||||
Other comprehensive income (loss), net of tax: | ||||||||||||
Foreign currency translation adjustment | 33.4 | (27.8 | ) | (28.2 | ) | |||||||
Unrealized gains (losses) on securities: | ||||||||||||
Unrealized holding gains (losses) arising during period | 3.4 | 3.3 | (1.0 | ) | ||||||||
Reclassification of gains included in net income | (1.9 | ) | (2.4 | ) | (0.4 | ) | ||||||
Other comprehensive gain (loss) | 34.9 | (26.9 | ) | (29.6 | ) | |||||||
Comprehensive income | 171.8 | 134.1 | 103.2 | |||||||||
Comprehensive income attributable to noncontrolling interest | — | — | (0.4 | ) | ||||||||
Comprehensive income attributable to Morningstar, Inc. | $ | 171.8 | $ | 134.1 | $ | 102.8 | ||||||
See notes to consolidated financial statements.
73
Morningstar, Inc. and Subsidiaries
Consolidated Balance Sheets
As of December 31 (in millions except share amounts) | 2017 | 2016 | ||||||
Assets | ||||||||
Current assets: | ||||||||
Cash and cash equivalents | $ | 308.2 | $ | 259.1 | ||||
Investments | 45.1 | 44.9 | ||||||
Accounts receivable, less allowance of $3.2 and $2.1, respectively | 148.2 | 145.8 | ||||||
Other | 28.3 | 22.2 | ||||||
Total current assets | 529.8 | 472.0 | ||||||
Property, equipment, and capitalized software, net | 147.4 | 152.1 | ||||||
Investments in unconsolidated entities | 62.0 | 40.3 | ||||||
Goodwill | 564.9 | 556.8 | ||||||
Intangible assets, net | 95.4 | 120.9 | ||||||
Other assets | 6.2 | 8.8 | ||||||
Total assets | $ | 1,405.7 | $ | 1,350.9 | ||||
Liabilities and equity | ||||||||
Current liabilities: | ||||||||
Accounts payable and accrued liabilities | $ | 49.2 | $ | 44.6 | ||||
Accrued compensation | 92.0 | 71.7 | ||||||
Deferred revenue | 171.3 | 165.4 | ||||||
Other current liabilities | 10.7 | 13.2 | ||||||
Total current liabilities | 323.2 | 294.9 | ||||||
Accrued compensation | 11.7 | 10.3 | ||||||
Deferred tax liability, net | 23.6 | 38.2 | ||||||
Long-term debt | 180.0 | 250.0 | ||||||
Deferred rent | 26.9 | 24.8 | ||||||
Other long-term liabilities | 35.4 | 35.9 | ||||||
Total liabilities | 600.8 | 654.1 | ||||||
Equity: | ||||||||
Morningstar, Inc. shareholders’ equity: | ||||||||
Common stock, no par value, 200,000,000 shares authorized, of which 42,547,707 and 42,932,994 shares were outstanding as of December 31, 2017 and December 31, 2016, respectively | — | — | ||||||
Treasury stock at cost, 10,633,637 and 10,106,249 shares as of December 31, 2017 and December 31, 2016, respectively | (708.2 | ) | (667.9 | ) | ||||
Additional paid-in capital | 601.0 | 584.0 | ||||||
Retained earnings | 958.7 | 861.9 | ||||||
Accumulated other comprehensive loss: | ||||||||
Currency translation adjustment | (47.9 | ) | (81.3 | ) | ||||
Unrealized gain (loss) on available-for-sale investments | 1.3 | (0.2 | ) | |||||
Total accumulated other comprehensive loss | (46.6 | ) | (81.5 | ) | ||||
Total Morningstar, Inc. shareholders’ equity | 804.9 | 696.5 | ||||||
Noncontrolling interest | — | 0.3 | ||||||
Total equity | 804.9 | 696.8 | ||||||
Total liabilities and equity | $ | 1,405.7 | $ | 1,350.9 | ||||
See notes to consolidated financial statements.
74
Morningstar, Inc. and Subsidiaries
Consolidated Statements of Equity
Morningstar, Inc. Shareholders’ Equity | |||||||||||||||||||||||||||||||
Accumulated Other Comprehensive Loss | |||||||||||||||||||||||||||||||
Common Stock | Additional Paid-in Capital | Non Controlling Interest | |||||||||||||||||||||||||||||
(in millions, except share amounts) | Shares Outstanding | Par Value | Treasury Stock | Retained Earnings | Total Equity | ||||||||||||||||||||||||||
Balance as of December 31, 2014 | 44,345,763 | $ | — | $ | (524.3 | ) | $ | 561.1 | $ | 641.5 | $ | (24.8 | ) | $ | 0.9 | $ | 654.4 | ||||||||||||||
Net income | — | — | — | 132.6 | — | 0.2 | 132.8 | ||||||||||||||||||||||||
Other comprehensive income (loss): | |||||||||||||||||||||||||||||||
Unrealized loss on available-for-sale investments, net of tax of $0.4 | — | — | — | — | (1.0 | ) | — | (1.0 | ) | ||||||||||||||||||||||
Reclassification of adjustments for gains included in net income, net of income tax of $0.1 | — | — | — | — | (0.4 | ) | — | (0.4 | ) | ||||||||||||||||||||||
Foreign currency translation adjustment, net | — | — | — | — | (28.4 | ) | 0.2 | (28.2 | ) | ||||||||||||||||||||||
Other comprehensive income (loss), net | — | — | — | — | (29.8 | ) | 0.2 | (29.6 | ) | ||||||||||||||||||||||
Issuance of common stock related to stock-option exercises and vesting of restricted stock units, net | 298,435 | — | 1.5 | (3.2 | ) | — | — | — | (1.7 | ) | |||||||||||||||||||||
Stock-based compensation — restricted stock units | — | — | 16.1 | — | — | — | 16.1 | ||||||||||||||||||||||||
Stock-based compensation — restricted stock | — | — | 0.1 | — | — | — | 0.1 | ||||||||||||||||||||||||
Stock-based compensation — performance share awards | — | — | 1.0 | — | — | — | 1.0 | ||||||||||||||||||||||||
Stock-based compensation — stock options | — | — | 0.2 | — | — | — | 0.2 | ||||||||||||||||||||||||
Excess tax benefit derived from stock-option exercises and vesting of restricted stock units | — | — | 2.6 | — | — | — | 2.6 | ||||||||||||||||||||||||
Common shares repurchased | (1,241,122 | ) | — | (97.0 | ) | — | — | — | — | (97.0 | ) | ||||||||||||||||||||
Dividends declared — common shares outstanding | — | — | — | (34.8 | ) | — | — | (34.8 | ) | ||||||||||||||||||||||
Dividends declared — restricted stock units | — | — | — | (0.1 | ) | — | — | (0.1 | ) | ||||||||||||||||||||||
Purchase of remaining interest in majority-owned investment | — | — | (2.4 | ) | — | — | (1.0 | ) | (3.4 | ) | |||||||||||||||||||||
Balance as of December 31, 2015 | 43,403,076 | — | (619.8 | ) | 575.5 | 739.2 | (54.6 | ) | 0.3 | 640.6 | |||||||||||||||||||||
Net income | — | — | — | 161.0 | — | — | 161.0 | ||||||||||||||||||||||||
Other comprehensive loss: | |||||||||||||||||||||||||||||||
Unrealized gain on available-for-sale investments, net of tax of $1.3 | — | — | — | — | 3.3 | — | 3.3 | ||||||||||||||||||||||||
Reclassification of adjustments for gains included in net income, net of income tax of $1.8 | — | — | — | — | (2.4 | ) | — | (2.4 | ) | ||||||||||||||||||||||
Foreign currency translation adjustment, net | — | — | — | — | (27.8 | ) | — | (27.8 | ) | ||||||||||||||||||||||
Other comprehensive loss, net | — | — | — | — | (26.9 | ) | — | (26.9 | ) | ||||||||||||||||||||||
Issuance of common stock related to stock-option exercises and vesting of restricted stock units, net | 174,911 | — | 1.4 | (6.0 | ) | — | — | — | (4.6 | ) | |||||||||||||||||||||
Stock-based compensation — restricted stock units | — | — | 14.6 | — | — | — | 14.6 | ||||||||||||||||||||||||
Stock-based compensation — performance share awards | — | — | (0.1 | ) | — | — | — | (0.1 | ) | ||||||||||||||||||||||
Common shares repurchased | (644,993 | ) | — | (49.5 | ) | — | — | — | — | (49.5 | ) | ||||||||||||||||||||
Dividends declared — common shares outstanding | — | — | — | (38.3 | ) | — | — | (38.3 | ) | ||||||||||||||||||||||
Dividends declared — restricted stock units | — | — | — | — | — | — | — | ||||||||||||||||||||||||
Balance as of December 31, 2016 | 42,932,994 | — | (667.9 | ) | 584.0 | 861.9 | (81.5 | ) | 0.3 | 696.8 | |||||||||||||||||||||
Net income | — | — | — | 136.9 | — | — | 136.9 | ||||||||||||||||||||||||
Other comprehensive income: | |||||||||||||||||||||||||||||||
Unrealized gain on available-for-sale investments, net of income tax of $1.8 | — | — | — | — | 3.4 | — | 3.4 | ||||||||||||||||||||||||
Reclassification of adjustments for gains included in net income, net of income tax of $1.2 | — | — | — | — | (1.9 | ) | — | (1.9 | ) | ||||||||||||||||||||||
Foreign currency translation adjustment, net | — | — | — | — | 33.4 | — | 33.4 | ||||||||||||||||||||||||
Other comprehensive income, net | — | — | — | — | 34.9 | — | 34.9 | ||||||||||||||||||||||||
Issuance of common stock related to stock-option exercises and vesting of restricted stock units, net | 161,445 | — | 1.6 | (6.2 | ) | — | — | — | (4.6 | ) | |||||||||||||||||||||
Stock-based compensation — restricted stock units | — | — | 16.5 | — | — | — | 16.5 | ||||||||||||||||||||||||
Stock-based compensation — performance share awards | — | — | 7.1 | — | — | — | 7.1 | ||||||||||||||||||||||||
Stock-based compensation — market stock units | — | — | 0.5 | — | — | — | 0.5 | ||||||||||||||||||||||||
Common shares repurchased | (546,732 | ) | — | (41.9 | ) | — | — | — | — | (41.9 | ) | ||||||||||||||||||||
Dividends declared — common shares outstanding | — | — | — | (40.1 | ) | — | — | (40.1 | ) | ||||||||||||||||||||||
Purchase of additional interest in majority-owned investment | — | — | (0.9 | ) | — | — | (0.3 | ) | (1.2 | ) | |||||||||||||||||||||
Balance as of December 31, 2017 | 42,547,707 | $ | — | $ | (708.2 | ) | $ | 601.0 | $ | 958.7 | $ | (46.6 | ) | $ | — | $ | 804.9 | ||||||||||||||
See notes to consolidated financial statements.
75
Morningstar, Inc. and Subsidiaries
Consolidated Statements of Cash Flows
Year ended December 31 (in millions) | 2017 | 2016 | 2015 | |||||||||
Operating activities | ||||||||||||
Consolidated net income | $ | 136.9 | $ | 161.0 | $ | 132.8 | ||||||
Adjustments to reconcile consolidated net income to net cash flows from operating activities: | ||||||||||||
Depreciation and amortization | 91.2 | 70.7 | 64.4 | |||||||||
Deferred income taxes | (14.1 | ) | 4.7 | 2.9 | ||||||||
Stock-based compensation expense | 24.1 | 14.5 | 17.4 | |||||||||
Provision for bad debt | 2.3 | 1.3 | 0.5 | |||||||||
Equity in net (income) loss of unconsolidated entities | 1.3 | 0.2 | (1.8 | ) | ||||||||
Gain on sale of business | (16.7 | ) | — | — | ||||||||
Holding gain upon acquisition of additional ownership of equity-method investments | — | (37.1 | ) | — | ||||||||
Other, net | 1.8 | (6.8 | ) | (1.1 | ) | |||||||
Changes in operating assets and liabilities, net of effects of acquisitions: | ||||||||||||
Accounts receivable | (1.2 | ) | (0.1 | ) | (6.9 | ) | ||||||
Other assets | (7.8 | ) | 1.1 | 0.7 | ||||||||
Accounts payable and accrued liabilities | 0.7 | 3.4 | 4.7 | |||||||||
Accrued compensation | 20.2 | (8.8 | ) | 7.0 | ||||||||
Income taxes—current | 9.7 | 1.0 | 10.1 | |||||||||
Deferred revenue | 2.5 | 6.7 | 10.6 | |||||||||
Deferred rent | 2.6 | (2.9 | ) | (0.3 | ) | |||||||
Other liabilities | (3.4 | ) | 4.8 | 0.5 | ||||||||
Cash provided by operating activities | 250.1 | 213.7 | 241.5 | |||||||||
Investing activities | ||||||||||||
Purchases of investments | (34.9 | ) | (32.0 | ) | (34.7 | ) | ||||||
Proceeds from maturities and sales of investments | 42.2 | 28.6 | 30.0 | |||||||||
Capital expenditures | (66.6 | ) | (62.8 | ) | (57.3 | ) | ||||||
Acquisitions, net of cash acquired | (1.0 | ) | (191.6 | ) | (11.1 | ) | ||||||
Proceeds from sale of a business, net | 23.7 | — | — | |||||||||
Purchases of equity- and cost-method investments | (24.8 | ) | (16.5 | ) | (6.2 | ) | ||||||
Other, net | 0.6 | 0.1 | (0.2 | ) | ||||||||
Cash used for investing activities | (60.8 | ) | (274.2 | ) | (79.5 | ) | ||||||
Financing activities | ||||||||||||
Common shares repurchased | (42.3 | ) | (48.8 | ) | (97.0 | ) | ||||||
Dividends paid | (39.3 | ) | (37.9 | ) | (33.7 | ) | ||||||
Proceeds from short-term debt | — | 40.0 | 50.0 | |||||||||
Repayment of short-term debt | — | (15.0 | ) | (45.0 | ) | |||||||
Proceeds from long-term debt | — | 190.0 | — | |||||||||
Repayment of long-term debt | (70.0 | ) | — | — | ||||||||
Proceeds from stock-option exercises | 0.2 | 0.4 | 3.9 | |||||||||
Employee taxes withheld for restricted stock units | (4.8 | ) | (5.0 | ) | (5.6 | ) | ||||||
Other, net | (1.3 | ) | — | (0.1 | ) | |||||||
Cash provided by (used for) financing activities | (157.5 | ) | 123.7 | (127.5 | ) | |||||||
Effect of exchange rate changes on cash and cash equivalents | 17.3 | (11.2 | ) | (12.6 | ) | |||||||
Net increase in cash and cash equivalents | 49.1 | 52.0 | 21.9 | |||||||||
Cash and cash equivalents—beginning of period | 259.1 | 207.1 | 185.2 | |||||||||
Cash and cash equivalents—end of period | $ | 308.2 | $ | 259.1 | $ | 207.1 | ||||||
2017 | 2016 | 2015 | ||||||||||
Supplemental disclosure of cash flow information: | ||||||||||||
Cash paid for income taxes | $ | 47.1 | $ | 58.0 | $ | 50.1 | ||||||
Cash paid for interest | $ | 5.4 | $ | 1.2 | $ | 0.4 | ||||||
Supplemental information of non-cash investing and financing activities: | ||||||||||||
Unrealized gain (loss) on available-for-sale investments | $ | 2.0 | $ | 1.2 | $ | (2.0 | ) | |||||
Software and equipment obtained under long-term financing arrangement | $ | 0.6 | $ | 9.0 | $ | 5.3 | ||||||
See notes to consolidated financial statements.
76
MORNINGSTAR, INC. AND SUBSIDIARIES
NOTES TO CONSOLIDATED FINANCIAL STATEMENTS
1. | Description of Business |
Morningstar, Inc. and its subsidiaries (Morningstar, we, our, the company), provides independent investment research for investors around the world. We offer an extensive line of products and services for individual investors, financial advisors, asset managers, retirement plan providers and sponsors, and institutional investors in the private capital markets. We have operations in 27 countries.
2. Summary of Significant Accounting Policies
The acronyms that appear in these Notes to our Consolidated Financial Statements refer to the following:
ASC | Accounting Standards Codification |
ASU | Accounting Standards Update |
EITF | Emerging Issues Task Force |
FASB | Financial Accounting Standards Board |
SEC | Securities and Exchange Commission |
Principles of Consolidation. We conduct our business operations through wholly owned or majority-owned operating subsidiaries. The accompanying consolidated financial statements include the accounts of Morningstar, Inc. and our subsidiaries. We consolidate assets, liabilities, and results of operations of subsidiaries in which we have a controlling interest and eliminate all significant intercompany accounts and transactions.
We account and report the noncontrolling (minority) interest in our Consolidated Financial Statements in accordance with FASB ASC 810, Consolidation. A noncontrolling interest is the portion of equity (net assets) in a subsidiary not attributable, directly or indirectly, to the parent company. We report the noncontrolling interest in our Consolidated Balance Sheet within equity separate from the shareholders' equity attributable to Morningstar, Inc. In addition, we present the net income (loss) and comprehensive income (loss) attributable to Morningstar, Inc.'s shareholders and the noncontrolling interest in our Consolidated Statements of Income, Consolidated Statements of Comprehensive Income, and Consolidated Statements of Equity.
We account for investments in entities in which we exercise significant influence, but do not control, using the equity method.
As part of our investment management operations, we manage certain funds outside of the United States that are considered variable interest entities. For the majority of these variable interest entities, we do not have a variable interest in them. In cases where we do have a variable interest, we are not the primary beneficiary. Accordingly, we do not consolidate any of these variable interest entities.
Use of Estimates. The preparation of financial statements in conformity with accounting principles generally accepted in the United States requires us to make estimates and assumptions that affect the reported amounts of assets, liabilities, revenues, and expenses during the reporting period. Actual results may differ from these estimates.
Cash and Cash Equivalents. Cash and cash equivalents consists of cash and investments with original maturities of three months or less. We state them at cost, which approximates fair value. We state the portion of our cash equivalents that are invested in money market funds at fair value, as these funds are actively traded and have quoted market prices.
Investments. We account for our investments in accordance with FASB ASC 320, Investments—Debt and Equity Securities. We classify our investments into three categories: held-to-maturity, trading, and available-for-sale.
• | Held-to-maturity: We classify certain investments, primarily certificates of deposit, as held-to-maturity securities, based on our intent and ability to hold these securities to maturity. We record held-to-maturity investments at amortized cost in our Consolidated Balance Sheets. |
77
• | Trading: We classify certain other investments, primarily equity securities, as trading securities as these relate mainly to investments tracking the strategies of our newsletter portfolios. We include realized and unrealized gains and losses associated with these investments as a component of our operating income in our Consolidated Statements of Income. We record these securities at their fair value in our Consolidated Balance Sheets. |
• | Available-for-sale: Investments not considered held-to-maturity or trading securities are classified as available-for-sale securities. Available-for-sale securities primarily consist of equity securities, exchange-traded funds, and mutual funds. We report unrealized gains and losses for available-for-sale securities as other comprehensive income (loss), net of related income taxes. We record these securities at their fair value in our Consolidated Balance Sheets. |
Fair Value Measurements. We follow FASB ASC 820, Fair Value Measurements. FASB ASC 820 defines fair value, establishes a framework for measuring fair value, and expands disclosures about fair value measurements. Under FASB ASC 820, fair value is defined as the price that would be received to sell an asset or paid to transfer a liability in an orderly transaction between market participants as of the measurement date. The standard applies whenever other standards require (or permit) assets or liabilities to be measured at fair value. The standard does not expand the use of fair value in any new circumstances and does not require any new fair value measurements.
FASB ASC 820 uses a fair value hierarchy based on three broad levels of valuation inputs:
• | Level 1: Valuations based on quoted prices in active markets for identical assets or liabilities that the company has the ability to access. |
• | Level 2: Valuations based on quoted prices in markets that are not active or for which all significant inputs are observable, either directly or indirectly. |
• | Level 3: Valuations based on inputs that are unobservable and significant to the overall fair value measurement. |
We provide additional information about our cash equivalents and investments that are subject to valuation under FASB ASC 820 in Note 6.
Concentration of Credit Risk. No single customer is large enough to pose a significant credit risk to our operations or financial condition. For the years ended December 31, 2017, 2016, and 2015, no single customer represented 5% or more of our consolidated revenue. If receivables from our customers become delinquent, we begin a collections process. We maintain an allowance for doubtful accounts based on our estimate of the probable losses of accounts receivable.
Property, Equipment, and Depreciation. We state property and equipment at historical cost, net of accumulated depreciation. We depreciate property and equipment primarily using the straight-line method based on the useful life of the asset, which generally is three years. We amortize leasehold improvements over the lease term or their useful lives, whichever is shorter.
Computer Software and Internal Product Development Costs. We capitalize certain costs in accordance with FASB ASC 350-40, Internal-Use Software, FASB ASC 350-50, Website Development Costs, and FASB ASC 985, Software. Internal product development costs mainly consist of employee costs for developing new web-based products and certain major enhancements of existing products. We amortize these costs on a straight-line basis over the estimated economic life, which is generally three to five years. We include capitalized software development costs related to projects that have not been placed into service in our construction in progress balance.
78
The table below summarizes our depreciation expense related to internally developed software for the past three years:
(in millions) | 2017 | 2016 | 2015 | |||||||||
Internally developed software depreciation expense | $ | 30.6 | $ | 20.0 | $ | 13.0 | ||||||
The table below summarizes our capitalized software development costs for the past three years:
(in millions) | 2017 | 2016 | 2015 | |||||||||
Capitalized software development costs | $ | 46.3 | $ | 28.2 | $ | 21.8 | ||||||
Business Combinations. When we make acquisitions, we allocate the purchase price to the assets acquired, liabilities assumed, and goodwill. We follow FASB ASC 805, Business Combinations. We recognize and measure the fair value of the acquired operation as a whole, as well as the assets acquired and liabilities assumed, at their full fair values as of the date we obtain control, regardless of the percentage ownership in the acquired operation or how the acquisition was achieved. We expense direct costs related to the business combination, such as advisory, accounting, legal, valuation, and other professional fees, as incurred. We recognize restructuring costs, including severance and relocation for employees of the acquired entity, as post-combination expenses unless the target entity meets the criteria of FASB ASC 420, Exit or Disposal Cost Obligations, on the acquisition date.
As part of the purchase price allocation, we follow the requirements of FASB ASC 740, Income Taxes. This includes establishing deferred tax assets or liabilities reflecting the difference between the values assigned for financial statement purposes and income tax purposes. In certain acquisitions, the goodwill resulting from the purchase price allocation may not be deductible for income tax purposes. FASB ASC 740 prohibits recognition of a deferred tax asset or liability for temporary differences in goodwill if goodwill is not amortizable and deductible for tax purposes.
Goodwill. Changes in the carrying amount of our recorded goodwill are mainly the result of business acquisitions, divestitures, and the effect of foreign currency translations. In accordance with FASB ASC 350, Intangibles—Goodwill and Other, we do not amortize goodwill; instead, goodwill is subject to an impairment test annually, or whenever indicators of impairment exist. An impairment would occur if the carrying amount of a reporting unit exceeded the fair value of that reporting unit. We performed annual impairment reviews in the fourth quarter of 2017 and 2016. We did not record any impairment losses in 2017 and 2016.
Intangible Assets. We amortize intangible assets using the straight-line method over their estimated useful lives, which range from one to 25 years. We have no intangible assets with indefinite useful lives. In accordance with FASB ASC 360-10-35, Subsequent Measurement—Impairment or Disposal of Long-Lived Assets, we review intangible assets for impairment whenever events or changes in circumstances indicate that the carrying value may not be recoverable. If the value of future undiscounted cash flows is less than the carrying amount of an asset group, we record an impairment loss based on the excess of the carrying amount over the fair value of the asset group. We did not record any impairment losses in 2017 and 2016.
Revenue Recognition. We recognize revenue in accordance with SEC SAB Topic 13, Revenue Recognition, ASC 605-25, Revenue Recognition: Multiple Element Arrangements, and ASC 985-605, Software: Revenue Recognition.
We recognize revenue when all of the following conditions are met:
• | There is persuasive evidence of an arrangement, as evidenced by a signed contract; |
• | Delivery of our products and services has taken place. If arrangements include an acceptance provision, we generally begin recognizing revenue when we receive customer acceptance; |
• | The amount of fees to be paid by the customer is fixed or determinable; and |
• | The collectibility of the fees is reasonably assured. |
79
We generate revenue through sales of Morningstar Data, Morningstar Advisor Workstation (including Morningstar Office), Morningstar Direct, Morningstar Research, Premium Membership subscriptions for Morningstar.com, our structured credit ratings offerings, and a variety of other investment-related products and services. We generally structure the revenue agreements for these offerings as licenses or subscriptions. We recognize revenue from licenses and subscription sales ratably as we deliver the product or service and over the service obligation period defined by the terms of the customer contract. For new-issue ratings and analysis for commercial mortgage-backed securities (CMBS), residential mortgage-backed securities (RMBS), other asset-backed securities (ABS), and corporate and financial institutions, we charge asset-based fees that are paid by the issuer on the rated balance of the transaction and recognize the revenue immediately upon issuance.
We also generate revenue from Internet advertising, primarily from “impression-based” contracts. For advertisers who use our cost-per-impression pricing, we charge fees each time we display their ads on our site.
Our Investment Management business includes a broad range of services. Pricing for consulting services is based on the scope of work and the level of service provided and includes asset-based fees for work we perform that involves investment management or acting as a subadvisor to investment portfolios. In arrangements that involve asset-based fees, we generally invoice clients quarterly in arrears based on average assets for the quarter. We recognize asset-based fees once the fees are fixed or determinable assuming all other revenue recognition criteria are met.
Our Workplace Solutions offerings help retirement plan participants plan and invest for retirement. We offer these services both through retirement plan providers (typically third-party asset management companies that provide administrative and record-keeping services) and directly to plan sponsors (employers that offer retirement plans to their employees). For our Workplace Solutions offerings, we provide both a hosted solution as well as proprietary installed software advice solution. Clients can integrate the installed customized software into their existing systems to help investors accumulate wealth, transition into retirement, and manage income during retirement.
The revenue arrangements for Workplace Solutions generally extend over multiple years. Our contracts may include one-time setup fees, implementation fees, technology licensing and maintenance fees, asset-based fees for managed retirement accounts, fixed and variable fees for advice and guidance, or a combination of these fee structures. Upon customer acceptance, we recognize revenue ratably over the term of the agreement. We recognize asset-based fees and variable fees in excess of any minimum once the value is fixed or determinable.
Some of our revenue arrangements combine multiple products and services. These products and services may be provided at different points in time or over different time periods within the same arrangement. We allocate fees to the separate deliverables based on the deliverables’ relative selling price, which is generally based on the price we charge when the same deliverable is sold separately.
We record taxes imposed on revenue-producing transactions (such as sales, use, value-added, and some excise taxes) on a net basis; therefore, we exclude such taxes from revenue in our Consolidated Statements of Income.
Deferred revenue represents the portion of licenses or subscriptions billed or collected in advance of the service being provided which we expect to recognize as revenue in future periods. Certain arrangements may have cancellation or refund provisions. If we make a refund, it typically reflects the amount collected from a customer for which we have not yet provided services. The refund therefore results in a reduction of deferred revenue.
Sales Commissions. Through December 31, 2013, we paid sales commissions based on a formula driven by the total contract value of sales opportunities closed, with any subsequent adjustments (such as clawbacks for contract cancellations) reflected in future commission payouts. We considered the corresponding commission expense an incremental direct acquisition cost and treated it as a deferred charge, which we expensed over the term of the underlying sales contracts.
In the first quarter of 2014, we modified our sales incentive plan. The revised plan is based on a combination of net new sales and specific business objectives not solely tied to revenue growth. Because of this new structure and the discretion involved in determining the related incentives, we started expensing sales commissions as incurred instead of amortizing them over the contract terms.
80
However, we continued to amortize the deferred charge capitalized in connection with sales commissions paid in 2013 and previous periods as part of the previous incentive plan. This amortization added $0.2 million, $0.6 million, and $3.5 million of sales commission cost in 2017, 2016, and 2015, respectively.
Advertising Costs. Advertising costs include expenses incurred for various print and Internet ads, search engine fees, and direct mail campaigns. We expense advertising costs as incurred. The table below summarizes our advertising expense for the past three years:
(in millions) | 2017 | 2016 | 2015 | |||||||||
Advertising expense | $ | 7.0 | $ | 7.6 | $ | 8.3 | ||||||
Stock-Based Compensation Expense. We account for our stock-based compensation expense in accordance with FASB ASC 718, Compensation—Stock Compensation. Our stock-based compensation expense reflects grants of restricted stock units, restricted stock, performance share awards, market stock units, and stock options. We measure the fair value of our restricted stock units, restricted stock, and performance share awards on the date of grant based on the closing market price of Morningstar's common stock on the day prior to grant. For market stock units, we estimate the fair value of the awards using a Monte Carlo valuation model. For stock options, we estimate the fair value of our stock options on the date of grant using a Black-Scholes option-pricing model. We amortize the fair values to stock-based compensation expense, net of estimated forfeitures, ratably over the vesting period.
We estimate expected forfeitures of all employee stock-based awards and recognize compensation cost only for those awards expected to vest. We determine forfeiture rates based on historical experience and adjust the estimated forfeitures to actual forfeiture experience as needed.
Liability for Sabbatical Leave. In some of our operations, we offer employees a sabbatical leave. Although the sabbatical policy varies by region, Morningstar's full-time employees are generally eligible for six weeks of paid time off after four years of continuous service. We account for our sabbatical liability in accordance with FASB ASC 710-10-25, Compensated Absences. We record a liability for employees' sabbatical benefits over the period employees earn the right for sabbatical leave and include this liability in Accrued Compensation in our Consolidated Balance Sheet.
Income Taxes. We record deferred income taxes for the temporary differences between the carrying amount of assets and liabilities for financial statement purposes and tax purposes in accordance with FASB ASC 740, Income Taxes. FASB ASC 740 prescribes the minimum recognition threshold a tax position is required to meet before being recognized in the financial statements. It also provides guidance on derecognition, measurement, classification, interest and penalties, accounting in interim periods, and disclosure for uncertain tax positions.
We recognize interest and penalties related to unrecognized tax benefits as part of income tax expense in our Consolidated Statements of Income. We classify liabilities related to unrecognized tax benefits as either current or long-term liabilities in our Consolidated Balance Sheet, depending on when we expect to make payment.
3. Credit Arrangements
In November 2016, we amended our credit agreement to provide us with a three-year credit facility with a borrowing capacity of up to $300.0 million. The credit agreement also provides for issuance of up to $25.0 million of letters of credit under the revolving credit facility.
The interest rate applicable to any loan under the credit agreement is, at our option, either: (i) the applicable London interbank offered rate (LIBOR) plus an applicable margin for such loans, which ranges between 1.00% and 1.75%, based on our consolidated leverage ratio or (ii) the lender's base rate plus the applicable margin for such loans, which ranges between 2.00% and 2.75%, based on our consolidated leverage ratio.
The credit agreement also contains financial covenants under which we: (i) may not exceed a maximum consolidated leverage ratio of 3.00 to 1.00 and (ii) are required to maintain a minimum consolidated interest coverage ratio of not less than 3.00 to 1.00. We were in compliance with the financial covenants as of December 31, 2017.
We had an outstanding principal balance of $180.0 million at a one-month LIBOR interest rate plus 100 basis points as of December 31, 2017, leaving borrowing availability of $120.0 million.
81
4. Income Per Share
The following table shows how we reconcile our net income and the number of shares used in computing basic and diluted income per share:
(in millions, except per share amounts) | 2017 | 2016 | 2015 | |||||||||
Basic net income per share attributable to Morningstar, Inc.: | ||||||||||||
Net income attributable to Morningstar, Inc. | $ | 136.9 | $ | 161.0 | $ | 132.6 | ||||||
Weighted average common shares outstanding | 42.7 | 43.0 | 44.2 | |||||||||
Basic net income per share attributable to Morningstar, Inc. | $ | 3.21 | $ | 3.74 | $ | 3.00 | ||||||
Diluted net income per share attributable to Morningstar, Inc.: | ||||||||||||
Net income attributable to Morningstar, Inc. | $ | 136.9 | $ | 161.0 | $ | 132.6 | ||||||
Weighted average common shares outstanding | 42.7 | 43.0 | 44.2 | |||||||||
Net effect of dilutive stock options and restricted stock units | 0.3 | 0.3 | 0.1 | |||||||||
Weighted average common shares outstanding for computing diluted income per share | 43.0 | 43.3 | 44.3 | |||||||||
Diluted net income per share attributable to Morningstar, Inc. | $ | 3.18 | $ | 3.72 | $ | 3.00 | ||||||
The number of weighted average restricted stock units, performance share awards, and market stock units excluded from our calculation of diluted earnings per share because their inclusion would have been anti-dilutive was immaterial during the periods presented.
5. Segment and Geographical Area Information
Segment Information
We report our results in a single reportable segment, which reflects how our chief operating decision maker allocates resources and evaluates our financial results.
Because we have a single reportable segment, all required financial segment information can be found directly in the Consolidated Financial Statements.
The accounting policies for our reportable segment are the same as those described in Note 2. We evaluate the performance of our reporting segment based on revenue and operating income.
82
Geographical Area Information
The tables below summarize our revenue and long-lived assets by geographical area:
External revenue by geographical area | ||||||||||||
Year ended December 31 | ||||||||||||
(in millions) | 2017 | 2016 | 2015 | |||||||||
United States | $ | 687.0 | $ | 590.5 | $ | 585.1 | ||||||
United Kingdom | 64.7 | 61.1 | 64.2 | |||||||||
Continental Europe | 69.9 | 62.6 | 58.8 | |||||||||
Australia | 34.6 | 32.2 | 30.5 | |||||||||
Canada | 29.4 | 28.2 | 27.9 | |||||||||
Asia | 21.2 | 20.0 | 18.5 | |||||||||
Other | 4.9 | 4.0 | 3.8 | |||||||||
Total International | 224.7 | 208.1 | 203.7 | |||||||||
Consolidated revenue | $ | 911.7 | $ | 798.6 | $ | 788.8 | ||||||
Long-lived assets by geographical area | ||||||||
As of December 31 | ||||||||
(in millions) | 2017 | 2016 | ||||||
United States | $ | 131.9 | $ | 139.1 | ||||
United Kingdom | 6.0 | 6.6 | ||||||
Continental Europe | 1.7 | 1.9 | ||||||
Australia | 2.3 | 0.6 | ||||||
Canada | 0.2 | 0.4 | ||||||
Asia | 5.2 | 3.4 | ||||||
Other | 0.1 | 0.1 | ||||||
Total International | 15.5 | 13.0 | ||||||
Consolidated property, equipment, and capitalized software, net | $ | 147.4 | $ | 152.1 | ||||
6. Investments and Fair Value Measurements
We classify our investments into three categories: available-for-sale, held-to-maturity, and trading. Our investment portfolio consists of stocks, bonds, options, mutual funds, money market funds, or exchange-traded products that replicate the model portfolios and strategies created by Morningstar. These investment accounts may also include exchange-traded products where Morningstar is an index provider. We classify our investment portfolio as shown below:
As of December 31 | ||||||||
(in millions) | 2017 | 2016 | ||||||
Available-for-sale | $ | 21.5 | $ | 27.7 | ||||
Held-to-maturity | 21.9 | 15.7 | ||||||
Trading securities | 1.7 | 1.5 | ||||||
Total | $ | 45.1 | $ | 44.9 | ||||
83
The following table shows the cost, unrealized gains (losses), and fair values related to investments classified as available-for-sale and held-to-maturity:
As of December 31, 2017 | As of December 31, 2016 | |||||||||||||||||||||||||||||||
(in millions) | Cost | Unrealized Gain | Unrealized Loss | Fair Value | Cost | Unrealized Gain | Unrealized Loss | Fair Value | ||||||||||||||||||||||||
Available-for-sale: | ||||||||||||||||||||||||||||||||
Equity securities and exchange-traded funds | $ | 17.1 | $ | 2.4 | $ | (0.6 | ) | $ | 18.9 | $ | 25.6 | $ | 1.3 | $ | (1.5 | ) | $ | 25.4 | ||||||||||||||
Mutual funds | 2.4 | 0.2 | — | 2.6 | 2.2 | 0.1 | — | 2.3 | ||||||||||||||||||||||||
Total | $ | 19.5 | $ | 2.6 | $ | (0.6 | ) | $ | 21.5 | $ | 27.8 | $ | 1.4 | $ | (1.5 | ) | $ | 27.7 | ||||||||||||||
Held-to-maturity: | ||||||||||||||||||||||||||||||||
Certificates of deposit | $ | 19.9 | $ | — | $ | — | $ | 19.9 | $ | 13.8 | $ | — | $ | — | $ | 13.8 | ||||||||||||||||
Convertible note | 2.0 | — | — | 2.0 | 1.9 | — | — | 1.9 | ||||||||||||||||||||||||
Total | $ | 21.9 | $ | — | $ | — | $ | 21.9 | $ | 15.7 | $ | — | $ | — | $ | 15.7 | ||||||||||||||||
As of December 31, 2017 and December 31, 2016, investments with unrealized losses for greater than a 12-month period were not material to the Consolidated Balance Sheets and were not deemed to have other than temporary declines in value.
The table below shows the cost and fair value of investments classified as available-for-sale and held-to-maturity based on their contractual maturities as of December 31, 2017 and December 31, 2016.
As of December 31, 2017 | As of December 31, 2016 | |||||||||||||||
(in millions) | Cost | Fair Value | Cost | Fair Value | ||||||||||||
Available-for-sale: | ||||||||||||||||
Equity securities, exchange-traded funds, and mutual funds | $ | 19.5 | $ | 21.5 | $ | 27.8 | $ | 27.7 | ||||||||
Total | $ | 19.5 | $ | 21.5 | $ | 27.8 | $ | 27.7 | ||||||||
Held-to-maturity: | ||||||||||||||||
Due in one year or less | $ | 19.7 | $ | 19.7 | $ | 13.8 | $ | 13.8 | ||||||||
Due in one to three years | 2.2 | 2.2 | 1.9 | 1.9 | ||||||||||||
Total | $ | 21.9 | $ | 21.9 | $ | 15.7 | $ | 15.7 | ||||||||
The following table shows the realized gains and losses arising from sales of our investments classified as available-for-sale recorded in our Consolidated Statements of Income:
(in millions) | 2017 | 2016 | 2015 | |||||||||
Realized gains | $ | 3.4 | $ | 1.6 | $ | 1.3 | ||||||
Realized losses | (0.2 | ) | (1.0 | ) | (0.7 | ) | ||||||
Realized gains, net | $ | 3.2 | $ | 0.6 | $ | 0.6 | ||||||
We determine realized gains and losses using the specific identification method.
84
The following table shows the net unrealized gains (losses) on trading securities as recorded in our Consolidated Statements of Income:
(in millions) | 2017 | 2016 | 2015 | |||||||||
Unrealized gains (losses), net | $ | 0.1 | $ | — | $ | (0.8 | ) | |||||
The table below shows the fair value of our assets subject to fair value measurements that are measured at fair value on a recurring basis using a fair value hierarchy:
Level 1: | Valuations based on quoted prices in active markets for identical assets or liabilities that we have the ability to access. |
Level 2: | Valuations based on quoted prices in markets that are not active or for which all significant inputs are observable, either directly or indirectly. |
Level 3: | Valuations based on inputs that are unobservable and significant to the overall fair value measurement. |
Fair Value | Fair Value Measurements as of December 31, 2017 | |||||||||||||||
as of | Using Fair Value Hierarchy | |||||||||||||||
(in millions) | December 31, 2017 | Level 1 | Level 2 | Level 3 | ||||||||||||
Available-for-sale investments | ||||||||||||||||
Equity securities and exchange-traded funds | $ | 18.9 | $ | 18.9 | $ | — | $ | — | ||||||||
Mutual funds | 2.6 | 2.6 | — | — | ||||||||||||
Trading securities | 1.7 | 1.7 | — | — | ||||||||||||
Cash equivalents | 0.5 | 0.5 | — | — | ||||||||||||
Total | $ | 23.7 | $ | 23.7 | $ | — | $ | — | ||||||||
Fair Value | Fair Value Measurements as of December 31, 2016 | |||||||||||||||
as of | Using Fair Value Hierarchy | |||||||||||||||
(in millions) | December 31, 2016 | Level 1 | Level 2 | Level 3 | ||||||||||||
Available-for-sale investments | ||||||||||||||||
Equity securities and exchange-traded funds | $ | 25.4 | $ | 25.4 | $ | — | $ | — | ||||||||
Mutual funds | 2.3 | 2.3 | — | — | ||||||||||||
Trading securities | 1.5 | 1.5 | — | — | ||||||||||||
Cash equivalents | 0.2 | 0.2 | — | — | ||||||||||||
Total | $ | 29.4 | $ | 29.4 | $ | — | $ | — | ||||||||
Based on our analysis of the nature and risks of our investments in equity securities and mutual funds, we have determined that presenting each of these investment categories in the aggregate is appropriate.
We measure the fair value of money market funds, mutual funds, equity securities, and exchange-traded funds based on quoted prices in active markets for identical assets or liabilities. We did not hold any securities categorized as Level 2 or Level 3 as of December 31, 2017 and December 31, 2016.
85
7. Acquisitions, Goodwill, and Other Intangible Assets
2017 Acquisitions
We did not complete any acquisitions in 2017.
2016 Acquisitions
Increased Ownership Interest in PitchBook Data, Inc. (PitchBook)
In December 2016, we acquired an additional 78% interest in PitchBook Data, Inc. (PitchBook), increasing our ownership to 100% from 22%. PitchBook delivers data, research, and technology covering the private capital markets, including venture capital, private equity, and mergers and acquisitions. We began consolidating the financial results of this acquisition in our Consolidated Financial Statements on December 1, 2016. PitchBook contributed $4.1 million of revenue and $7.5 million of operating expense during the one-month period that PitchBook was included in our consolidated results for 2016.
PitchBook's total estimated fair value of $235.1 million includes $188.2 million in cash paid to acquire the remaining 78% interest in PitchBook as well as a $46.9 million fair value related to our previous 22% ownership interest. The book value of this ownership immediately prior to the acquisition date was $9.8 million, and we recorded a non-cash holding gain of $37.1 million for the difference between the fair value and the book value of our previously held investment. We used the income approach and a discounted cash flow analysis of PitchBook’s projected revenue, operating expense, and other amounts to arrive at the estimated fair value. The gain is classified as "Holding gain upon acquisition of additional ownership of equity-method investments" in our Consolidated Statement of Income for the year ended December 31, 2016.
The transaction has been accounted for using the acquisition method of accounting, which requires that assets acquired and liabilities assumed be recognized at their fair values as of the acquisition date.
Adjustments recorded in the measurement period to the purchase price allocation were not significant. The following table summarizes our allocation of the estimated fair values of the assets acquired and liabilities assumed at the date of acquisition:
(in millions) | ||||
Cash and cash equivalents | $ | 12.4 | ||
Accounts receivable | 10.8 | |||
Other current and non-current assets | 3.2 | |||
Intangible assets | 60.7 | |||
Goodwill | 192.0 | |||
Deferred revenue | (22.0 | ) | ||
Deferred tax liability, net | (12.3 | ) | ||
Other current and non-current liabilities | (9.7 | ) | ||
Total fair value of PitchBook | $ | 235.1 | ||
Accounts receivable acquired were recorded at gross contractual amounts receivable, which approximates fair value.
The allocation includes $60.7 million of acquired intangible assets, as follows:
(in millions) | Weighted Average Useful Life (years) | |||||
Customer-related assets | $ | 17.1 | 10 | |||
Technology-based assets | 40.8 | 5 | ||||
Intellectual property (trademarks and trade names) | 2.8 | 4 | ||||
Total intangible assets | $ | 60.7 | 6 | |||
86
We recognized a net deferred tax liability of $12.3 million mainly because the amortization expense related to certain intangible assets is not deductible for income tax purposes.
Goodwill of $192.0 million represents the excess over the fair value of the net tangible and intangible assets acquired with this acquisition. We paid this premium for a number of reasons, including the opportunity to offer comprehensive data coverage across the full life cycle of private market transactions. The goodwill is not deductible for income tax purposes.
Unaudited Pro Forma Information for PitchBook Acquisition
The following unaudited pro forma information presents a summary of our Consolidated Statements of Income for the years ended December 31, 2016 and 2015 as if we had completed the PitchBook acquisition as of January 1, 2015.
This unaudited pro forma information is presented for illustrative purposes and is not intended to represent or be indicative of the actual results of operations of the combined company that would have been achieved had the acquisition occurred at the beginning of the earliest period presented, nor is it intended to represent or be indicative of future results of operations.
In calculating the pro forma information below, we included an estimate of amortization expense related to the intangible assets acquired, stock-based compensation expense related to the PitchBook bonus plan (see Note 12 for additional information), and interest expense incurred on the long-term debt. The 2016 pro forma net income excludes the $37.1 million non-cash holding gain generated in connection with the transaction.
Unaudited Pro Forma Financial Information (in millions) | 2016 | 2015 | ||||||
Revenue | $ | 834.1 | $ | 813.3 | ||||
Operating income | $ | 157.7 | $ | 170.0 | ||||
Net income | $ | 105.5 | $ | 117.1 | ||||
Basic net income per share attributable to Morningstar, Inc. | $ | 2.45 | $ | 2.65 | ||||
Diluted net income per share attributable to Morningstar, Inc. | $ | 2.44 | $ | 2.65 | ||||
RequiSight, LLC (RightPond)
On March 31, 2016, we acquired RequiSight, LLC, which does business as RightPond, a provider of business intelligence data and analytics on defined contribution and defined benefit plans for financial services firms. We began consolidating the financial results of RightPond in our Consolidated Financial Statements on March 31, 2016.
InvestSoft Technology, Inc. (InvestSoft)
On May 31, 2016, we acquired InvestSoft Technology, Inc. (InvestSoft), a provider of fixed-income analytics. We began consolidating the financial results of InvestSoft in our Consolidated Financial Statements on May 31, 2016.
2015 Acquisitions
Increased Ownership Interest in Ibbotson Associates Japan K.K. (IAJ)
In July 2015, we acquired an additional 28.9% interest in Ibbotson Associates Japan K.K. (IAJ), increasing our ownership to 100% from 71.1%. Because we previously owned more than 50% of the company, IAJ's financial results were consolidated in our Consolidated Financial Statements prior to acquiring the remaining interest.
Total Rebalance Expert (tRx)
In November 2015, we acquired Total Rebalance Expert (tRx), an automated, tax-efficient investment portfolio rebalancing platform for financial advisors. tRx streamlines the rebalancing process for advisors and automates the complexities involved in rebalancing and managing portfolios. We began consolidating the financial results of tRx in our Consolidated Financial Statements on November 2, 2015.
87
Goodwill
The following table shows the changes in our goodwill balances from January 1, 2016 to December 31, 2017:
(in millions) | ||||
Balance as of January 1, 2016 | $ | 364.2 | ||
Acquisition of PitchBook | 193.6 | |||
Other acquisitions and foreign currency translation | (1.0 | ) | ||
Balance as of December 31, 2016 | $ | 556.8 | ||
Divestiture of HelloWallet (See Note 8) | (2.4 | ) | ||
Foreign currency translation and adjustments to purchase price allocation | 10.5 | |||
Balance as of December 31, 2017 | $ | 564.9 | ||
We did not record any impairment losses in 2017 and 2016 as the estimated fair values of our reporting unit exceeded its carrying value. We perform our annual impairment testing during the fourth quarter of each year.
Intangible Assets
The following table summarizes our intangible assets:
As of December 31, 2017 | As of December 31, 2016 | |||||||||||||||||||||||||||
(in millions) | Gross | Accumulated Amortization | Net | Weighted Average Useful Life (years) | Gross | Accumulated Amortization | Net | Weighted Average Useful Life (years) | ||||||||||||||||||||
Intellectual property | $ | 31.5 | $ | (28.9 | ) | $ | 2.6 | 9 | $ | 30.9 | $ | (27.4 | ) | $ | 3.5 | 9 | ||||||||||||
Customer-related assets | 156.6 | (108.1 | ) | 48.5 | 12 | 152.0 | (97.7 | ) | 54.3 | 12 | ||||||||||||||||||
Supplier relationships | 0.2 | (0.1 | ) | 0.1 | 20 | 0.2 | (0.1 | ) | 0.1 | 20 | ||||||||||||||||||
Technology-based assets | 127.9 | (84.2 | ) | 43.7 | 7 | 133.2 | (72.1 | ) | 61.1 | 7 | ||||||||||||||||||
Non-competition agreements | 2.5 | (2.0 | ) | 0.5 | 5 | 5.0 | (3.1 | ) | 1.9 | 5 | ||||||||||||||||||
Total intangible assets | $ | 318.7 | $ | (223.3 | ) | $ | 95.4 | 10 | $ | 321.3 | $ | (200.4 | ) | $ | 120.9 | 10 | ||||||||||||
The following table summarizes our amortization expense related to intangible assets:
(in millions) | 2017 | 2016 | 2015 | |||||||||
Amortization expense | $ | 23.6 | $ | 19.4 | $ | 22.0 | ||||||
We did not record any impairment losses involving intangible assets in 2017 and 2016.
We amortize intangible assets using the straight-line method over their expected economic useful lives.
Based on acquisitions and divestitures completed through December 31, 2017, we expect intangible amortization expense for 2018 and subsequent years to be as follows:
(in millions) | ||||
2018 | $ | 20.7 | ||
2019 | 19.3 | |||
2020 | 16.3 | |||
2021 | 13.0 | |||
2022 | 5.2 | |||
Thereafter | 20.9 | |||
88
Our estimates of future amortization expense for intangible assets may be affected by additional acquisitions, divestitures, changes in the estimated average useful life, and foreign currency translation.
8. Divestiture
In June 2014, we acquired the remaining 81.3% interest in HelloWallet Holdings, Inc. (HelloWallet), increasing our ownership to 100%. This valued HelloWallet at $54.0 million, an amount that included $39.2 million of goodwill and $9.5 million of intangible assets.
On June 30, 2017, we sold HelloWallet to KeyBank National Association, a bank-based financial services company. We recorded a noncash gain on the sale of $16.7 million. This gain mainly represents the sale proceeds of $23.7 million less $2.4 million of goodwill and the write-off of the remaining net book value on the acquired intangible assets. As some aspects of HelloWallet had been integrated into Morningstar's single reporting unit, the goodwill attributable to this transaction was calculated using a relative fair value allocation method.
The sale of HelloWallet did not meet the criteria to be classified as a discontinued operation because the divestiture did not represent a strategic shift that has, or will have, a major effect on our operations and financial results.
The following table summarizes the amounts included in the gain on sale of business for the year ended December 31, 2017:
Year ended December 31 | ||||
(in millions) | 2017 | |||
Proceeds received | $ | 23.7 | ||
Intangibles and internally developed software | (4.5 | ) | ||
Goodwill | (2.4 | ) | ||
Other assets and liabilities | (0.1 | ) | ||
Total gain on sale of business | $ | 16.7 | ||
9. Investments in Unconsolidated Entities
Our investments in unconsolidated entities consist primarily of the following:
As of December 31 | ||||||||
(in millions) | 2017 | 2016 | ||||||
Investment in MJKK | $ | 26.4 | $ | 25.1 | ||||
Investment in Sustainalytics | 20.7 | — | ||||||
Other-equity method investments | 12.6 | 13.5 | ||||||
Investments accounted for using the cost method | 2.3 | 1.7 | ||||||
Total investments in unconsolidated entities | $ | 62.0 | $ | 40.3 | ||||
Morningstar Japan K.K. Morningstar Japan K.K. (MJKK) develops and markets products and services customized for the Japanese market. MJKK’s shares are traded on the Tokyo Stock Exchange under the ticker 47650. We account for our investment in MJKK using the equity method. The following table summarizes our ownership percentage in MJKK and the market value of this investment based on MJKK’s publicly quoted share price:
As of December 31 | ||||||||
2017 | 2016 | |||||||
Morningstar’s approximate ownership of MJKK | 34 | % | 34 | % | ||||
Approximate market value of Morningstar’s ownership in MJKK: | ||||||||
Japanese yen (¥ in millions) | ¥ | 10,649.6 | ¥ | 8,558.2 | ||||
Equivalent U.S. dollars ($ in millions) | $ | 94.6 | $ | 73.2 | ||||
89
Sustainalytics Holding B.V. In July 2017, we acquired a minority stake in Sustainalytics Holding B.V. (Sustainalytics), which is an independent ESG and corporate governance research, ratings, and analysis firm supporting investors around the world with the development and implementation of responsible investment strategies. Our ownership in Sustainalytics as of December 31, 2017 was 40%.
Other Equity Method Investments. As of December 31, 2017 and December 31, 2016, other equity method investments consist of our investment in Ellevate Financial, Inc. (Ellevest), United Income, Inc. (United Income), and YCharts, Inc. (YCharts). Ellevest provides an engaging investing experience to help women meet their financial goals. Our ownership interest in Ellevest was approximately 17% as of December 31, 2017 and 22% as of December 31, 2016. United Income helps investors transition to retirement and manage their retirement income. Our ownership interest in United Income was approximately 35% as of December 31, 2017 and 38% as of December 31, 2016. YCharts is a technology company that provides stock research and analysis. Our ownership interest in YCharts was approximately 22% as of December 31, 2017 and 2016.
As of December 31, 2016, other equity method investments also includes our investment in Inquiry Financial Europe AB (Inquiry Financial). Inquiry Financial is a provider of sell-side consensus estimate data. Our ownership interest in Inquiry Financial was approximately 34% as of December 31, 2016. During 2017, we sold our stake in Inquiry Financial.
In December 2016, we purchased the remaining ownership interest in PitchBook. See Note 7 for additional information concerning our acquisition of PitchBook.
10. Property, Equipment, and Capitalized Software
The following table shows our property, equipment, and capitalized software summarized by major category:
As of December 31 | ||||||||
(in millions) | 2017 | 2016 | ||||||
Computer equipment | $ | 81.6 | $ | 70.1 | ||||
Capitalized software | 239.2 | 189.8 | ||||||
Furniture and fixtures | 27.6 | 26.0 | ||||||
Leasehold improvements | 72.5 | 69.0 | ||||||
Telephone equipment | 2.3 | 2.1 | ||||||
Construction in progress | 8.9 | 9.9 | ||||||
Property, equipment, and capitalized software, at cost | 432.1 | 366.9 | ||||||
Less accumulated depreciation | (284.7 | ) | (214.8 | ) | ||||
Property, equipment, and capitalized software, net | $ | 147.4 | $ | 152.1 | ||||
The following table summarizes our depreciation expense:
(in millions) | 2017 | 2016 | 2015 | |||||||||
Depreciation expense | $ | 67.6 | $ | 51.3 | $ | 42.4 | ||||||
Depreciation expense in 2017 includes a $4.1 million impairment charge for certain software licenses due to a shift toward a cloud-based strategy.
90
11. Operating Leases
The following table shows our minimum future rental commitments due in each of the next five years and thereafter for all non-cancelable operating leases, consisting primarily of commitments for office space:
Minimum Future Rental Commitments | (in millions) | |||
2018 | $ | 26.8 | ||
2019 | 30.4 | |||
2020 | 32.5 | |||
2021 | 29.8 | |||
2022 | 19.1 | |||
Thereafter | 54.9 | |||
Total | $ | 193.5 | ||
The following table summarizes our rent expense, including taxes, insurance, and related operating costs:
(in millions) | 2017 | 2016 | 2015 | |||||||||
Rent expense | $ | 30.3 | $ | 26.3 | $ | 27.1 | ||||||
Deferred rent includes build-out and rent abatement allowances received, which are amortized over the remaining portion of the original term of the lease as a reduction in office lease expense. We include deferred rent, as appropriate, in “Accounts payable and accrued liabilities” and “Deferred rent, noncurrent” on our Consolidated Balance Sheets.
As of December 31 | ||||||||
(in millions) | 2017 | 2016 | ||||||
Deferred rent | $ | 31.2 | $ | 28.4 | ||||
12. Stock-Based Compensation
Stock-Based Compensation Plans
Our shareholders approved the Morningstar 2011 Stock Incentive Plan (the 2011 Plan) on May 17, 2011. As of that date, we stopped granting awards under the Morningstar 2004 Stock Incentive Plan (the 2004 Plan). The 2004 Plan amended and restated the Morningstar 1993 Stock Option Plan, the Morningstar 2000 Stock Option Plan, and the Morningstar 2001 Stock Option Plan.
The 2011 Plan provides for a variety of stock-based awards, including, among other things, restricted stock units, restricted stock, performance share awards, market stock units, and stock options. We granted restricted stock units, restricted stock, and stock options under the 2004 Plan.
All of our employees and our non-employee directors are eligible for awards under the 2011 Plan.
Grants awarded under the 2011 Plan or the 2004 Plan that are forfeited, canceled, settled, or otherwise terminated without a distribution of shares, or shares withheld by us in connection with the exercise of options, will be available for awards under the 2011 Plan. For any shares subject to awards that are withheld by us in connection with the payment of any required income tax withholding, the 2011 Plan provides for the ability to have these shares become available for new awards, but this feature of the 2011 plan has not been implemented.
The following table summarizes the number of shares available for future grants under our 2011 Plan:
As of December 31 | |||
(in millions) | 2017 | ||
Shares available for future grants | 3.4 | ||
91
Accounting for Stock-Based Compensation Awards
The following table summarizes our stock-based compensation expense and the related income tax benefit we recorded in the past three years:
Year ended December 31 | ||||||||||||
(in millions) | 2017 | 2016 | 2015 | |||||||||
Restricted stock units | $ | 16.5 | $ | 14.6 | $ | 16.1 | ||||||
Restricted stock | — | — | 0.1 | |||||||||
Performance share awards | 7.1 | (0.1 | ) | 1.0 | ||||||||
Market stock units | 0.5 | — | — | |||||||||
Stock options | — | — | 0.2 | |||||||||
Total stock-based compensation expense | $ | 24.1 | $ | 14.5 | $ | 17.4 | ||||||
Income tax benefit related to the stock-based compensation expense | $ | 7.8 | $ | 4.3 | $ | 5.0 | ||||||
The following table summarizes the stock-based compensation expense included in each of our operating expense categories for the past three years:
Year ended December 31 | ||||||||||||
(in millions) | 2017 | 2016 | 2015 | |||||||||
Cost of revenue | $ | 9.6 | $ | 7.5 | $ | 8.1 | ||||||
Sales and marketing | 3.0 | 1.9 | 2.2 | |||||||||
General and administrative | 11.5 | 5.1 | 7.1 | |||||||||
Total stock-based compensation expense | $ | 24.1 | $ | 14.5 | $ | 17.4 | ||||||
The following table summarizes the amount of unrecognized stock-based compensation expense as of December 31, 2017 and the expected number of months over which the expense will be recognized:
Unrecognized stock-based compensation expense (in millions) | Weighted average expected amortization period (months) | |||||
Restricted stock units | $ | 36.5 | 35 | |||
Performance share awards | — | 12 | ||||
Market stock units | 2.8 | 32 | ||||
Total unrecognized stock-based compensation expense | $ | 39.3 | 35 | |||
In accordance with FASB ASC 718, Compensation—Stock Compensation, we estimate forfeitures of employee stock-based awards and recognize compensation cost only for those awards expected to vest. Most of our larger annual equity grants typically have vesting dates in the second quarter. We adjust the stock-based compensation expense annually in the third quarter to reflect those awards that ultimately vested and update our estimate of the forfeiture rate that will be applied to awards not yet vested.
Restricted Stock Units
Restricted stock units represent the right to receive a share of Morningstar common stock when that unit vests. Restricted stock units granted to employees vest ratably over a four-year period. Restricted stock units granted to non-employee directors vest ratably over a three-year period.
We measure the fair value of our restricted stock units on the date of grant based on the closing market price of the underlying common stock on the day prior to grant. We amortize that value to stock-based compensation expense, net of estimated forfeitures, ratably over the vesting period.
92
The following table summarizes restricted stock unit activity during the past three years:
Restricted Stock Units (RSUs) | Unvested | Vested but Deferred | Total | Weighted Average Grant Date Value per RSU | |||||||||
RSUs Outstanding - December 31, 2014 | 655,934 | 14,778 | 670,712 | $ | 67.51 | ||||||||
Granted | 235,213 | — | 235,213 | 77.17 | |||||||||
Dividend equivalents | 1,409 | 146 | 1,555 | 56.42 | |||||||||
Vested | (253,038 | ) | — | (253,038 | ) | 64.65 | |||||||
Forfeited | (66,992 | ) | — | (66,992 | ) | 53.61 | |||||||
RSUs Outstanding - December 31, 2015 | 572,526 | 14,924 | 587,450 | $ | 72.14 | ||||||||
Granted | 241,609 | — | 241,609 | 77.82 | |||||||||
Dividend equivalents | 370 | 136 | 506 | 56.52 | |||||||||
Vested | (225,590 | ) | — | (225,590 | ) | 69.39 | |||||||
Issued | — | (5,312 | ) | (5,312 | ) | 44.47 | |||||||
Forfeited | (47,670 | ) | — | (47,670 | ) | 74.45 | |||||||
RSUs Outstanding - December 31, 2016 | 541,245 | 9,748 | 550,993 | $ | 75.77 | ||||||||
Granted | 331,470 | — | 331,470 | 78.33 | |||||||||
Dividend equivalents | — | 78 | 78 | 60.99 | |||||||||
Vested | (212,005 | ) | — | (212,005 | ) | 75.38 | |||||||
Issued | — | (6,547 | ) | (6,547 | ) | 49.40 | |||||||
Forfeited | (55,831 | ) | — | (55,831 | ) | 76.49 | |||||||
RSUs Outstanding - December 31, 2017 | 604,879 | 3,279 | 608,158 | $ | 77.52 | ||||||||
Performance Share Awards
In March 2015 and 2016, executive officers, other than Joe Mansueto, and certain other employees, were granted performance share awards. These awards entitle the holder to a number of shares of Morningstar common stock equal to the number of notional performance shares that become vested. Each award specifies a number of performance shares that will vest if pre-established target performance goals are attained. The number of performance shares that actually vest may be more or less than the specified number of performance shares to the extent Morningstar exceeds or fails to achieve, respectively, the target performance goals over a three-year performance period.
We base the grant date fair value for these awards on the closing market price of the underlying common stock on the day prior to the grant date. We amortize that value to stock-based compensation expense ratably over the vesting period based on the satisfaction of the performance condition that is most likely to be satisfied over the three-year performance period.
The table below shows target performance share awards granted and shares that would be issued at current performance levels for performance share awards granted as of December 31, 2017:
As of December 31, 2017 | ||||
Target performance share awards granted | 93,701 | |||
Weighted average fair value per award | $ | 77.55 | ||
Number of shares that would be issued based on current performance levels | — | |||
Unamortized expense, based on current performance levels (in millions) | $ | — | ||
93
Market Stock Units
In May and November 2017, executive officers, other than Joe Mansueto, and certain other employees, were granted market stock units. These market stock units represent the right to receive a target number of shares that will vest at the end of a three-year performance period depending on the company’s total shareholder return over that three-year period.
We measure the fair value of our market stock units on the date of grant using a Monte Carlo valuation model. We amortize that value to stock-based compensation expense ratably over the vesting period.
We used the following assumptions to estimate the fair value of our market stock units during 2017:
Assumptions for Monte Carlo Valuation Model | |||||||
Grant Date | Expected volatility | Dividend yield | Risk-free interest rate | ||||
May 15, 2017 | 17.4 | % | 1.20 | % | 1.49 | % | |
November 15, 2017 | 17.7 | % | 1.04 | % | 1.79 | % | |
The table below shows market stock units granted and target market stock units outstanding as of December 31, 2017:
As of December 31, 2017 | ||||
Market stock units granted | 45,663 | |||
Weighted average fair value per award | $ | 72.29 | ||
Number of target market stock units outstanding | 44,606 | |||
Unamortized expense, based on current performance levels (in millions) | $ | 2.8 | ||
PitchBook Bonus Plan
In connection with our acquisition of PitchBook, we adopted a management bonus sub-plan under the 2011 Plan for certain employees of PitchBook (the PitchBook Plan). Pursuant to the terms of the PitchBook Plan, awards having an aggregate target value equal to $30.0 million will be available for issuance with annual grants of $7.5 million for 2017, $7.5 million in 2018, and $15.0 million in 2019.
Each grant will consist of performance-based share unit awards which will vest over a one-year period and will be measured primarily based on the achievement of certain annual revenue targets specifically related to PitchBook’s business. Upon achievement of these targets, earned performance units will be settled in shares of our common stock on a one-for-one basis. If PitchBook exceeds certain performance conditions, the PitchBook Plan participants may receive payment for performance units in excess of the aggregate target values described above. If PitchBook fails to meet threshold performance conditions, the PitchBook Plan participants will not be entitled to receive payment for any performance units. In certain circumstances, the PitchBook Plan participants may be able to receive a catch-up award with respect to 2017 or 2018 if certain additional performance conditions are met in a subsequent year.
The table below shows target performance share awards granted and shares that will be issued based on final performance levels for performance share awards granted as of December 31, 2017:
As of December 31, 2017 | ||||
Target performance share awards granted | 100,924 | |||
Weighted average fair value per award | $ | 74.31 | ||
Number of shares that will be issued based on final 2017 performance levels | 113,941 | |||
Unamortized expense, based on current performance levels (in millions) | $ | — | ||
94
Stock Options
Stock options granted to employees vest ratably over a four-year period. Grants to our non-employee directors vest ratably over a three-year period. All grants expire 10 years after the date of grant.
In May 2011, we granted 86,106 stock options under the 2004 Stock Incentive Plan. In November 2011, we granted 6,095 stock options under the 2011 Plan. All options granted in 2011 have an exercise price equal to the fair market value on the grant date. We estimated the fair value of the options on the grant date using a Black-Scholes option-pricing model. The weighted average fair value of options granted during 2011 was $23.81 per share, based on the following assumptions:
Assumptions for Black-Scholes Option Pricing Model | |||
Expected life (years): | 7.4 | ||
Volatility factor: | 35.1 | % | |
Dividend yield: | 0.35 | % | |
Interest rate: | 2.87 | % | |
The following table summarizes stock option activity in the past three years for our various stock option grants:
2017 | 2016 | 2015 | |||||||||||||||||||
All Other Option Grants, Excluding Activity Shown Above | Underlying Shares | Weighted Average Exercise Price | Underlying Shares | Weighted Average Exercise Price | Underlying Shares | Weighted Average Exercise Price | |||||||||||||||
Options outstanding—beginning of year | 46,001 | $ | 57.28 | 52,096 | $ | 57.52 | 169,810 | $ | 40.20 | ||||||||||||
Granted | — | — | — | — | — | — | |||||||||||||||
Canceled | — | — | — | — | — | — | |||||||||||||||
Exercised | (4,316 | ) | 57.28 | (6,095 | ) | 59.35 | (117,714 | ) | 32.91 | ||||||||||||
Options outstanding—end of year | 41,685 | $ | 57.28 | 46,001 | $ | 57.28 | 52,096 | $ | 57.52 | ||||||||||||
Options exercisable—end of year | 41,685 | $ | 57.28 | 46,001 | $ | 57.28 | 52,096 | $ | 57.52 | ||||||||||||
The following table summarizes the total intrinsic value (difference between the market value of our stock on the date of exercise and the exercise price of the option) of options exercised:
(in millions) | 2017 | 2016 | 2015 | |||||||||
Intrinsic value of options exercised | $ | 0.1 | $ | 0.1 | $ | 5.1 | ||||||
The table below shows additional information for options outstanding and exercisable as of December 31, 2017:
Options Outstanding | Options Exercisable | |||||||||||||||||||||||||
Range of Exercise Prices | Number of Options | Weighted Average Remaining Contractual Life (years) | Weighted Average Exercise Price | Aggregate Intrinsic Value (in millions) | Exercisable Shares | Weighted Average Remaining Contractual Life (years) | Weighted Average Exercise Price | Aggregate Intrinsic Value (in millions) | ||||||||||||||||||
$57.28 | 41,685 | 3.37 | $ | 57.28 | $ | 1.7 | 41,685 | 3.37 | $ | 57.28 | $ | 1.7 | ||||||||||||||
Vested or Expected to Vest | ||||||||||||||||||||||||||
$57.28 | 41,685 | 3.37 | $ | 57.28 | $ | 1.7 | ||||||||||||||||||||
95
The aggregate intrinsic value in the table above represents the total pretax intrinsic value all option holders would have received if they had exercised all outstanding options on December 31, 2017. The intrinsic value is based on our closing stock price of $96.97 on December 29, 2017.
13. Defined Contribution Plan
We sponsor a defined contribution 401(k) plan, which allows our U.S.-based employees to voluntarily contribute pre-tax dollars up to a maximum amount allowable by the U.S. Internal Revenue Service. In 2017, 2016, and 2015, we made matching contributions to our 401(k) plan in the United States in an amount equal to 75 cents for every dollar of an employee's contribution, up to a maximum of 7% of the employee's compensation in the pay period.
The following table summarizes our matching contributions:
(in millions) | 2017 | 2016 | 2015 | |||||||||
401(k) matching contributions | $ | 10.4 | $ | 9.0 | $ | 8.3 | ||||||
14. Income Taxes
Income Tax Expense and Effective Tax Rate
The following table shows our income tax expense and our effective tax rate for the years ended December 31, 2017, 2016, and 2015:
(in millions) | 2017 | 2016 | 2015 | |||||||||
Income before income taxes and equity in net income (loss) of unconsolidated entities | $ | 181.1 | $ | 224.9 | $ | 193.7 | ||||||
Equity in net income (loss) of unconsolidated entities | (1.3 | ) | (0.2 | ) | 1.8 | |||||||
Net income attributable to the noncontrolling interest | — | — | (0.2 | ) | ||||||||
Total | $ | 179.8 | $ | 224.7 | $ | 195.3 | ||||||
Income tax expense | $ | 42.9 | $ | 63.7 | $ | 62.7 | ||||||
Effective tax rate | 23.9 | % | 28.3 | % | 32.1 | % | ||||||
On December 22, 2017, the President of the United States signed into law the Tax Cuts and Jobs Act ("Tax Reform Act"). The legislation significantly changes U.S. tax law by, among other things, lowering corporate income tax rates, changing to a territorial tax system and imposing a transitional tax on deemed repatriated earnings of foreign subsidiaries. The Tax Reform Act permanently reduces the U.S. corporate income tax rate from a maximum of 35% to a flat 21% rate, effective January 1, 2018.
On December 22, 2017, the SEC staff issued Staff Accounting Bulletin No. 118 ("SAB 118") to address the application of U.S. GAAP in situations when a registrant does not have the necessary information available, prepared, or analyzed (including computations) in reasonable detail to complete the accounting for certain income tax effects of the Tax Reform Act. We have recognized the provisional tax impacts related to the changes under the Tax Reform Act and have included these amounts in our consolidated financial statements for the year ended December 31, 2017. The ultimate impact may differ from these provisional amounts, possibly materially, due to, among other things, additional analysis, changes in interpretations and assumptions that we have made, additional regulatory guidance that may be issued, and actions that we may take as a result of the Tax Reform Act. The accounting is expected to be complete when our 2017 U.S. corporate income tax return is filed in 2018.
We use the asset and liability method of accounting for income taxes. Under this method, deferred tax assets and liabilities are recognized for the future tax consequences attributable to differences between the financial statement carrying amounts of existing assets and liabilities and their respective tax basis. Deferred tax assets and liabilities are measured using enacted tax rates expected to apply to taxable income in the years in which those temporary differences are expected to reverse. As a result of the reduction in the U.S. corporate income tax rate from 35% to 21% under the Tax Reform Act, we revalued our ending net deferred tax liabilities at December 31, 2017 and recognized a provisional $14.7 million tax benefit in our Consolidated Statement of Income for the year ended December 31, 2017.
96
With respect to the transitional tax related to the change to a territorial system, the Tax Reform Act provided for a one-time deemed mandatory repatriation of post-1986 undistributed foreign subsidiary earnings and profits ("E&P") through the year ended December 31, 2017. We had an estimated $183.7 million of undistributed foreign E&P subject to the deemed mandatory repatriation. After the utilization of corresponding tax credits, we have recorded a provisional tax charge of $7.5 million on the deemed mandatory repatriation of earnings of our foreign subsidiaries payable over 8 years. We have also recorded a provisional reduction of a deferred tax liability of $6.4 million previously recorded for our foreign equity method investments. The transitional tax charge of $7.5 million offset by the reduction of the $6.4 million deferred tax liability results in a net tax expense of $1.1 million on the deemed mandatory repatriation of earnings of our foreign affiliates.
We are continuing to assess our indefinite reinvestment assertion as a result of the Tax Reform Act. We have recorded a provisional estimate of deferred taxes in the amount of $3.0 million for foreign withholding taxes that would be due upon remittance of dividends from certain of our foreign affiliates. We are still evaluating whether to change our overall indefinite reinvestment assertion in light of the Tax Reform Act and consider our conclusion to be incomplete under SAB 118. Accordingly, we consider that most of our remaining foreign outside basis differences to be indefinitely reinvested. Accordingly, we have not recorded deferred taxes on those outside basis differences. As part of our continuing evaluation, we will need to gather additional information to compute outside basis differences for our foreign affiliates in order to assess whether any new deferred taxes should be recorded. We will also need to account for any prospective interpretive guidance issued on the Tax Reform Act as part of our evaluation. If we subsequently change our assertion during the measurement period allowed under SAB 118, we will account for a change in assertion as part of our accounting for the Tax Reform Act.
The Tax Reform Act also establishes other provisions that may affect our 2018 results, including but not limited to, the creation of a new minimum tax called the base erosion anti-abuse tax (BEAT); a new provision that taxes U.S. allocated expenses (e.g. interest and general administrative expenses) as well as currently taxes certain income from foreign operations (Global Intangible Low-Tax Income, or "GILTI"); a new limitation on deductible interest expense; the repeal of the domestic manufacturing deduction; and limitations on the deductibility of certain employee compensation.
The BEAT provisions in the Tax Reform Act eliminate the deduction of certain base-erosion payments made to related foreign corporations and impose a minimum tax if greater than regular tax. We are still evaluating the BEAT provisions which are applicable after December 31, 2017.
While the Tax Reform Act generally eliminates U.S. federal income tax on dividends from foreign subsidiaries going forward, certain income earned by certain subsidiaries may be included in our U.S. taxable income under the new GILTI inclusion rules (as a result of U.S. expense allocation rules). Because of the complexity of the new GILTI tax rules, we are continuing to evaluate this provision of the Tax Reform Act and the application of U.S. GAAP. Under U.S. GAAP, we are allowed to make an accounting policy election and either treat taxes due from GILTI as a current-period expense when they are incurred or factor such amounts into our measurement of deferred taxes. Our selection of an accounting policy with respect to the new GILTI rules will depend in part on analyzing our global income to determine whether we expect to have future U.S. inclusions in taxable income related to GILTI, and if so, what the impact is expected to be. We have not yet computed a reasonable estimate of the effect of this provision, and therefore, we have not made a policy decision regarding whether to record deferred taxes related to GILTI nor have we made any adjustments related to GILTI tax in our year-end financial statements.
97
The following table reconciles our income tax expense at the U.S. federal income tax rate of 35% to income tax expense as recorded:
2017 | 2016 | 2015 | |||||||||||||||||||
(in millions, except percentages) | Amount | % | Amount | % | Amount | % | |||||||||||||||
Income tax expense at U.S. federal rate | $ | 63.0 | 35.0 | % | $ | 78.6 | 35.0 | % | $ | 68.4 | 35.0 | % | |||||||||
State income taxes, net of federal income tax benefit | 3.0 | 1.7 | 4.5 | 2.0 | 6.6 | 3.4 | |||||||||||||||
Change in U.S. tax rate | (14.7 | ) | (8.2 | ) | — | — | — | — | |||||||||||||
Deemed mandatory repatriation | 7.5 | 4.2 | — | — | — | — | |||||||||||||||
Reduction of deferred tax liabilities for foreign equity method investments | (6.4 | ) | (3.6 | ) | — | — | — | — | |||||||||||||
Withholding tax - repatriation | 3.0 | 1.7 | — | — | — | — | |||||||||||||||
Stock-based compensation activity | 0.3 | 0.2 | (0.6 | ) | (0.3 | ) | 0.4 | 0.2 | |||||||||||||
Equity in net income of unconsolidated subsidiaries (including holding gains upon acquisition) | 1.2 | 0.7 | (12.1 | ) | (5.4 | ) | — | — | |||||||||||||
Book gain over tax gain on sale of HelloWallet | (6.8 | ) | (3.8 | ) | — | — | — | — | |||||||||||||
Net change in valuation allowance related to non-U.S. deferred tax assets, primarily net operating losses | 0.1 | 0.1 | (0.1 | ) | — | (2.0 | ) | (1.0 | ) | ||||||||||||
Difference between U.S. federal statutory and foreign tax rates | (5.2 | ) | (2.9 | ) | (5.3 | ) | (2.4 | ) | (4.4 | ) | (2.3 | ) | |||||||||
Change in unrecognized tax benefits | 1.2 | 0.7 | 2.6 | 1.2 | (1.4 | ) | (0.7 | ) | |||||||||||||
Credits and incentives | (3.7 | ) | (2.1 | ) | (3.7 | ) | (1.6 | ) | (5.1 | ) | (2.6 | ) | |||||||||
Other - net | 0.4 | 0.2 | (0.2 | ) | (0.1 | ) | 0.2 | 0.1 | |||||||||||||
Total income tax expense | $ | 42.9 | 23.9 | % | $ | 63.7 | 28.3 | % | $ | 62.7 | 32.1 | % | |||||||||
Income tax expense consists of the following:
Year ended December 31 | ||||||||||||
(in millions) | 2017 | 2016 | 2015 | |||||||||
Current tax expense: | ||||||||||||
U.S. | ||||||||||||
Federal | $ | 40.3 | $ | 42.8 | $ | 42.8 | ||||||
State | 6.6 | 6.5 | 8.3 | |||||||||
Non-U.S. | 9.9 | 9.7 | 8.7 | |||||||||
Current tax expense | 56.8 | 59.0 | 59.8 | |||||||||
Deferred tax expense (benefit): | ||||||||||||
U.S. | ||||||||||||
Federal | (10.9 | ) | 5.1 | 4.3 | ||||||||
State | (1.9 | ) | 0.4 | 1.8 | ||||||||
Non-U.S. | (1.1 | ) | (0.8 | ) | (3.2 | ) | ||||||
Deferred tax expense, net | (13.9 | ) | 4.7 | 2.9 | ||||||||
Income tax expense | $ | 42.9 | $ | 63.7 | $ | 62.7 | ||||||
98
The following table provides our income before income taxes and equity in net income (loss) of unconsolidated entities, generated by our U.S. and non-U.S. operations:
Year ended December 31 | ||||||||||||
(in millions) | 2017 | 2016 | 2015 | |||||||||
U.S. | $ | 143.5 | $ | 186.5 | $ | 160.6 | ||||||
Non-U.S. | 37.6 | 38.4 | 33.1 | |||||||||
Income before income taxes and equity in net income (loss) of unconsolidated entities | $ | 181.1 | $ | 224.9 | $ | 193.7 | ||||||
Deferred Tax Assets and Liabilities
We recognize deferred income taxes for the temporary differences between the carrying amount of assets and liabilities for financial statement purposes and their tax basis. The tax effects of the temporary differences that give rise to the deferred income tax assets and liabilities are as follows:
As of December 31 | ||||||||
(in millions) | 2017 | 2016 | ||||||
Deferred tax assets: | ||||||||
Stock-based compensation expense | $ | 3.7 | $ | 2.6 | ||||
Accrued liabilities | 14.2 | 19.0 | ||||||
Deferred revenue | 3.5 | 5.1 | ||||||
Net operating loss carryforwards - U.S. federal and state | 1.9 | 12.9 | ||||||
Net operating loss carryforwards - Non-U.S. | 3.1 | 3.0 | ||||||
Credits and incentive carryforwards | 0.3 | 0.6 | ||||||
Deferred royalty revenue | 0.2 | 0.3 | ||||||
Allowance for doubtful accounts | 1.1 | 1.2 | ||||||
Deferred rent | 6.2 | 10.3 | ||||||
Other | 0.3 | — | ||||||
Total deferred tax assets | 34.5 | 55.0 | ||||||
Deferred tax liabilities: | ||||||||
Acquired intangible assets | (18.6 | ) | (34.3 | ) | ||||
Property, equipment, and capitalized software | (24.6 | ) | (37.6 | ) | ||||
Unrealized exchange gains, net | (0.6 | ) | (0.1 | ) | ||||
Prepaid expenses | (3.9 | ) | (5.3 | ) | ||||
Investments in unconsolidated entities | (5.4 | ) | (14.0 | ) | ||||
Withholding tax - foreign dividends | (3.0 | ) | — | |||||
Other | — | (0.3 | ) | |||||
Total deferred tax liabilities | (56.1 | ) | (91.6 | ) | ||||
Net deferred tax liability before valuation allowance | (21.6 | ) | (36.6 | ) | ||||
Valuation allowance | (2.0 | ) | (1.6 | ) | ||||
Deferred tax liability, net | $ | (23.6 | ) | $ | (38.2 | ) | ||
99
The deferred tax assets and liabilities are presented in our Consolidated Balance Sheets as follows:
As of December 31 | ||||||||
(in millions) | 2017 | 2016 | ||||||
Deferred tax liability, net | $ | (23.6 | ) | $ | (38.2 | ) | ||
The following table summarizes our U.S. net operating loss (NOL) carryforwards:
As of December 31 | ||||||||||
(in millions) | 2017 | 2016 | ||||||||
Expiration Dates | Expiration Dates | |||||||||
U.S. federal NOLs subject to expiration dates | $ | 9.1 | 2023-2036 | $ | 36.9 | 2023-2036 | ||||
The net decrease in the U.S. federal NOL carryforwards as of December 31, 2017 compared with 2016 primarily reflects the utilization of U.S. federal NOLs. We have not recorded a valuation allowance against the U.S. federal NOLs of $9.1 million because we expect the benefit of the U.S. federal NOLs to be fully utilized before expiration.
The following table summarizes our NOL carryforwards for our non-U.S. operations:
As of December 31 | ||||||||
(in millions) | 2017 | 2016 | ||||||
Non-U.S. NOLs subject to expiration dates from 2019 through 2037 | $ | 5.7 | $ | 3.8 | ||||
Non-U.S. NOLs with no expiration date | 9.1 | 10.8 | ||||||
Total | $ | 14.8 | $ | 14.6 | ||||
Non-U.S. NOLs not subject to valuation allowances | $ | 5.4 | $ | 6.8 | ||||
The change in non-U.S. NOL carryforwards as of December 31, 2017 compared with 2016 primarily reflects the use of NOL carryforwards offset by NOLs generated.
In assessing the realizability of our deferred tax assets, we consider whether it is more likely than not that some portion or all of the deferred tax assets will not be realized. We have recorded a valuation allowance against all but approximately $5.4 million of the non-U.S. NOLs, reflecting the likelihood that the benefit of these NOLs will not be realized.
Uncertain Tax Positions
We conduct business globally and as a result, we file income tax returns in U.S. federal, state, local, and foreign jurisdictions. In the normal course of business, we are subject to examination by tax authorities throughout the world. The open tax years for our U.S. Federal tax returns and most state tax returns include the years 2008 to the present.
We are currently under audit by federal, state and local tax authorities in the United States as well as tax authorities in certain non-U.S. jurisdictions. It is likely that the examination phase of some of these U.S. federal, state, local, and non-U.S. audits will conclude in 2018. It is not possible to estimate the effect of current audits on previously recorded unrecognized tax benefits.
As of December 31, 2017, our Consolidated Balance Sheet included a current liability of $8.7 million and a non-current liability of $7.0 million for unrecognized tax benefits. As of December 31, 2016, our Consolidated Balance Sheet included a current liability of $8.9 million and a non-current liability of $5.4 million for unrecognized tax benefits. These amounts include interest and penalties, less any associated tax benefits.
100
The table below reconciles the beginning and ending amount of the gross unrecognized tax benefits as follows:
(in millions) | 2017 | 2016 | ||||||
Gross unrecognized tax benefits - beginning of the year | $ | 18.4 | $ | 14.5 | ||||
Increases as a result of tax positions taken during a prior-year period | 1.4 | 2.2 | ||||||
Decreases as a result of tax positions taken during a prior-year period | (0.4 | ) | (0.1 | ) | ||||
Increases as a result of tax positions taken during the current period | 1.9 | 2.4 | ||||||
Decreases relating to settlements with tax authorities | — | — | ||||||
Reductions as a result of lapse of the applicable statute of limitations | (2.6 | ) | (0.6 | ) | ||||
Gross unrecognized tax benefits - end of the year | $ | 18.7 | $ | 18.4 | ||||
In 2017, we recorded a net increase of $2.9 million of gross unrecognized tax benefits before settlements and lapses of statutes of limitations, of which $2.9 million increased our income tax expense by $3.1 million. In addition, we reduced our unrecognized tax benefits by $2.6 million for settlements and lapses of statutes of limitations, of which $2.6 million decreased our income tax expense by $2.2 million.
As of December 31, 2017, we had $18.7 million of gross unrecognized tax benefits, of which $15.0 million, if recognized, would reduce our effective income tax rate and decrease our income tax expense by $14.4 million.
We record interest and penalties related to uncertain tax positions as part of our income tax expense. The following table summarizes our gross liability for interest and penalties:
As of December 31 | ||||||||
(in millions) | 2017 | 2016 | ||||||
Liabilities for interest and penalties | $ | 1.7 | $ | 1.6 | ||||
We recorded the increase in the liabilities for penalties and interest, net of any tax benefits, to income tax expense in our Consolidated Statement of Income in 2017.
15. Contingencies
Michael D. Green
In August 2017, Michael D. Green, individually and purportedly on behalf of all others similarly situated, filed a complaint in the United States District Court for the Northern District of Illinois. The complaint names as defendants Morningstar, Inc., Prudential Investment Management Services LLC, and Prudential Retirement Insurance and Annuity Co., and contains one count alleging violation of the Racketeer Influenced and Corrupt Organizations Act (RICO). Plaintiff, a participant in a pension plan, alleges that the defendants engaged in concerted racketeering actions to steer plan participants into high-cost investments that pay unwarranted fees to the defendants. The complaint seeks unspecified compensatory damages for plaintiff and the members of the putative class, treble damages, injunctive relief, costs, and attorneys’ fees. Morningstar has filed a motion to dismiss the complaint, which is fully briefed and under advisement by the court. Although Morningstar is vigorously contesting the claim asserted, we cannot predict the outcome of the proceeding.
Other Matters
We are involved from time to time in legal proceedings and litigation that arise in the normal course of our business. While it is difficult to predict the outcome of any particular proceeding, we do not believe the result of any of these matters will have a material adverse effect on our business, operating results, or financial position.
101
16. Share Repurchase Program
We had an ongoing authorization, originally approved by our board of directors in September 2010 and subsequently amended, to repurchase up to $1.0 billion in shares of our outstanding common stock. The authorization expired on December 31, 2017.
As of December 31, 2017, we had repurchased a total of 10,574,857 shares for $714.8 million under this authorization, leaving no shares available for future repurchases as the plan expired on December 31, 2017. On December 8, 2017, the board of directors approved a new share repurchase program that authorizes the company to repurchase up to $500.0 million in shares of the company's outstanding common stock, effective January 1, 2018. The authorization expires on December 31, 2020. We may repurchase shares from time to time at prevailing market prices on the open market or in private transactions in amounts that we deem appropriate.
17. Recently Issued Accounting Pronouncements
On May 28, 2014, the FASB issued ASU No. 2014-09, Revenue from Contracts with Customers, which requires an entity to recognize the amount of revenue to which it expects to be entitled for the transfer of promised goods or services to customers. The ASU will replace most existing revenue recognition guidance in U.S. GAAP when it becomes effective. The original effective date for ASU No. 2014-09 would have required us to adopt it beginning on January 1, 2017. In August 2015, the FASB issued ASU No. 2015-14, Revenue from Contracts with Customers—Deferral of the Effective Date, which defers the effective date of ASU No. 2014-09 for one year and permits early adoption as early as the original effective date of ASU No. 2014-09. We elected the deferral, and the new standard is effective for us on January 1, 2018.
We have obtained an understanding of ASU No. 2014-09 and have substantially completed our analysis of the impact of the new standard on our financial results. We have completed a high-level assessment of the attributes within our contracts for our major products and services, and we have assessed the impacts to our internal processes, control environment, and disclosures. We have determined that the adoption of ASU No. 2014-09 will not result in a material change to the timing of when revenue is recognized and we intend to retain similar accounting treatment used to recognize revenue under current practices. We have identified that there will be certain changes in accounting treatment related to delivery of third-party content (principal vs. agent) and costs to obtain contracts (e.g., sales commissions).
The change related to delivery of third-party content (principal vs. agent) is expected to result in no impact on our consolidated operating income; however it will result in a increase in both revenue and cost of revenue versus prior periods of approximately $6 million to $7 million as revenue will be recognized on a gross rather than net basis for certain arrangements.
The change related to the capitalization of cost to obtain contracts is expected to result in an increase to retained earnings of approximately $25 million to $30 million for commission expenses which were previously expensed. We expected to amortize this adjustment over a period not to exceed three years and expect 2018 commission expense resulting from this change will range between $14 million and $16 million. Additionally, in 2018 we will expense any discretionary payments made under our commission plans as well as pro-rata portions of any new commission amounts paid in 2018.
The standard allows for both retrospective and modified retrospective methods of adoption. We plan to adopt using the modified retrospective transition method applied to those contracts which were not completed as of January 1, 2018. Upon adoption, we will recognize the cumulative effect of adopting this guidance as an adjustment to our opening balance of retained earnings as noted above. Prior periods will not be retrospectively adjusted and we will discuss the comparability of these adjustments within our 2018 results against the prior periods.
We are continuing to evaluate the effect that ASU No. 2014-09 will have on our consolidated financial statement presentation and related disclosures. We expect expanded disclosures related to the revenue recognized in the reporting period that was included in the contract liability (i.e., deferred revenue) balance at the beginning of the period. We also plan to provide additional disclosures on our unsatisfied performance obligations at the end of the period and expected timing of when that contract liability will be recognized into revenue.
102
On March 17, 2016, the FASB issued ASU No. 2016-08, Revenue from Contracts with Customers: Principal versus Agent Considerations (Reporting Revenue Gross versus Net), which provides guidance on assessing whether an entity is a principal or an agent in a revenue transaction and whether an entity reports revenue on a gross or net basis. On April 14, 2016, the FASB issued ASU No. 2016-10, Revenue from Contracts with Customers: Identifying Performance Obligations and Licensing, which provides guidance on identifying performance obligations and accounting for licenses of intellectual property. On May 6, 2016, the FASB issued ASU No. 2016-11, Revenue Recognition and Derivatives and Hedging: Rescission of SEC guidance because of ASU No. 2014-09 and ASU No. 2014-16 pursuant to staff announcements at the March 3, 2016 EITF Meeting, which rescinds the following SEC Staff Observer comments from ASC 605, Revenue Recognition, upon an entity's early adoption of ASC 606, Revenue from Contracts with Customers: Revenue and expense recognition for freight services in process, accounting for shipping and handling fees and costs, and accounting for consideration given by a vendor to a customer (including a reseller of the vendor's products). On May 9, 2016, the FASB issued ASU No. 2016-12, Revenue from Contracts with Customers: Narrow-Scope Improvements and Practical Expedients, which makes narrow-scope amendments to ASU No. 2014-09 and provides practical expedients to simplify the transition to the new standard and clarify certain aspects of the standard. On December 21, 2016, the FASB issued ASU No. 2016-20, Technical Corrections and Improvements to Topic 606, Revenue from Contracts with Customers, which makes narrow-scope amendments to ASU No. 2014-09.
The effective date and transition requirements for ASU No. 2016-08, ASU No. 2016-10, ASU No. 2016-11, ASU No. 2016-12, and ASU No. 2016-20 are the same as the effective date and transition requirements of ASU No. 2014-09. We are evaluating the effect that ASU No. 2016-08, ASU No. 2016-10, ASU No. 2016-11, ASU No. 2016-12, and ASU No. 2016-20 will have on our consolidated financial statements and related disclosures.
On February 25, 2016, the FASB issued ASU No. 2016-02, Leases, which will require lessees to recognize almost all leases on their balance sheet as a right-of-use asset and a lease liability. The new standard is effective for us on January 1, 2019. The new standard must be adopted using a modified retrospective transition and provides for certain practical expedients. Transition will require application of the new guidance at the beginning of the earliest comparative period presented. We are evaluating the effect that ASU No. 2016-02 will have on our consolidated financial statements and related disclosures.
On August 26, 2016, the FASB issued ASU No. 2016-15, Statement of Cash Flows: Classification of Certain Cash Receipts and Cash Payments, which reduces diversity in practice of how certain transactions are classified in the statement of cash flows. The new guidance clarifies the classification of cash activities related to debt prepayment or debt extinguishment costs, settlement of zero-coupon debt instruments, contingent consideration payments made after a business combination, proceeds from the settlement of insurance claims, proceeds from the settlement of corporate and bank-owned life insurance policies, distributions received from equity-method investments, and beneficial interests in securitization transactions. The guidance also describes a predominance principle in which cash flows with aspects of more than one class that cannot be separated should be classified based on the activity that is likely to be the predominant source or use of cash flow.
The new standard is effective for us on January 1, 2018. Early adoption is permitted, including adoption in an interim period, but requires all elements of the amendments to be adopted at once rather than individually. The new standard must be adopted using a retrospective transition method. We are evaluating the effect that ASU No. 2016-15 will have on our consolidated financial statements and related disclosures.
On January 5, 2017, the FASB issued ASU No. 2017-01, Business Combinations: Clarifying the Definition of a Business, which revises the definition of a business. When substantially all of the fair value of gross assets acquired is concentrated in a single asset (or a group of similar assets), the assets acquired would not represent a business. To be considered a business, an acquisition would have to include an input and a substantive process that together significantly contribute to the ability to create outputs. The new guidance provides a framework to evaluate when an input and substantive process are present (including for early-stage companies that have not generated outputs). To be a business without outputs, there will now need to be an organized workforce. The new guidance also narrows the definition of the term outputs to be consistent with how it is described in Topic 606, Revenue from Contracts with Customers. The new standard is effective for us on January 1, 2018. Early adoption is permitted. We are evaluating the effect that ASU No. 2017-01 will have on our consolidated financial statements and related disclosures.
103
On January 26, 2017, the FASB issued ASU No. 2017-04, Intangibles—Goodwill and Other, which simplifies the accounting for goodwill impairment. The guidance removes Step 2 of the goodwill impairment test, which requires a hypothetical purchase price allocation. A goodwill impairment will now be the amount by which a reporting unit’s carrying value exceeds its fair value, not to exceed the carrying amount of goodwill. All other goodwill impairment guidance will remain largely unchanged. Entities will continue to have the option to perform a qualitative assessment to determine if a quantitative impairment test is necessary. The same one-step impairment test will be applied to goodwill at all reporting units, even those with zero or negative carrying amounts. Entities will be required to disclose the amount of goodwill at reporting units with zero or negative carrying amounts. The new standard is effective for us on January 1, 2020. The new standard should be applied prospectively. Early adoption is permitted for any impairment tests performed after January 1, 2017. We are evaluating the effect that ASU No. 2017-04 will have on our consolidated financial statements and related disclosures.
On May 10, 2017, the FASB issued ASU No. 2017-09, Compensation—Stock Compensation: Scope of Modification Accounting, which clarifies when to account for a change to the terms or conditions of a share-based payment award as a modification. Under the new guidance, modification accounting is required only if the fair value, the vesting conditions, or the classification of the award (as equity or liability) changes as a result of the change in terms or conditions. The new standard is effective for us on January 1, 2018. The new standard should be applied prospectively. Early adoption is permitted. We are evaluating the effect that ASU No. 2017-09 will have on our consolidated financial statements and related disclosures.
18. Selected Quarterly Financial Data (unaudited)
2016 | 2017 | ||||||||||||||||||||||||||||||||
(in millions except per share amounts) | Q1 | Q2 | Q3 | Q4 | Q1 | Q2 | Q3 | Q4 | |||||||||||||||||||||||||
Revenue | $ | 192.1 | $ | 198.2 | $ | 196.1 | $ | 212.2 | $ | 209.5 | $ | 229.2 | $ | 229.9 | $ | 243.1 | |||||||||||||||||
Total operating expense | 149.8 | 153.8 | 151.9 | 162.3 | 181.1 | 183.2 | 177.1 | 200.5 | |||||||||||||||||||||||||
Operating income | 42.3 | 44.4 | 44.2 | 49.9 | 28.4 | 46.0 | 52.8 | 42.6 | |||||||||||||||||||||||||
Non-operating income (expense), net | 0.5 | 3.0 | 2.1 | 38.5 | (1) | (1.3 | ) | 15.3 | (2) | (2.0 | ) | (0.7 | ) | ||||||||||||||||||||
Income before income taxes and equity in net income (loss) of unconsolidated entities | 42.8 | 47.4 | 46.3 | 88.4 | 27.1 | 61.3 | 50.8 | 41.9 | |||||||||||||||||||||||||
Equity in net income (loss) of unconsolidated entities | 0.5 | (0.2 | ) | 0.4 | (0.9 | ) | (0.8 | ) | (0.2 | ) | — | (0.3 | ) | ||||||||||||||||||||
Income tax expense | 14.6 | 15.4 | 16.5 | 17.2 | 8.3 | 15.0 | 16.9 | 2.7 | (3) | ||||||||||||||||||||||||
Consolidated net income | $ | 28.7 | $ | 31.8 | $ | 30.2 | $ | 70.3 | $ | 18.0 | $ | 46.1 | $ | 33.9 | $ | 38.9 | |||||||||||||||||
Net income per share: | |||||||||||||||||||||||||||||||||
Basic | $ | 0.67 | $ | 0.74 | $ | 0.70 | $ | 1.63 | $ | 0.42 | $ | 1.07 | $ | 0.80 | $ | 0.91 | |||||||||||||||||
Diluted | $ | 0.67 | $ | 0.73 | $ | 0.70 | $ | 1.63 | $ | 0.42 | $ | 1.07 | $ | 0.79 | $ | 0.91 | |||||||||||||||||
Dividends per common share: | |||||||||||||||||||||||||||||||||
Dividends declared per common share | $ | 0.22 | $ | 0.22 | $ | 0.22 | $ | 0.23 | $ | 0.23 | $ | 0.23 | $ | — | $ | 0.48 | |||||||||||||||||
Dividends paid per common share | $ | 0.22 | $ | 0.22 | $ | 0.22 | $ | 0.22 | $ | 0.23 | $ | 0.23 | $ | 0.23 | $ | 0.23 | |||||||||||||||||
Weighted average shares outstanding: | |||||||||||||||||||||||||||||||||
Basic | 43.0 | 43.0 | 43.1 | 43.0 | 42.9 | 42.9 | 42.5 | 42.5 | |||||||||||||||||||||||||
Diluted | 43.1 | 43.3 | 43.3 | 43.2 | 43.2 | 43.1 | 42.8 | 42.9 | |||||||||||||||||||||||||
(1) Non-operating income in the fourth quarter of 2016 included a $37.1 million holding gain related to the purchase of the remaining ownership interest in PitchBook, which was previously a minority investment.
(2) Non-operating income in the second quarter of 2017 included a $17.5 million gain on the sale of HelloWallet. We recorded an immaterial adjustment to this gain in the fourth quarter of 2017.
104
(3) Tax expense in the fourth quarter of 2017 includes a net benefit of $10.6 million related to the impact of the Tax Reform Act.
Item 9. Changes in and Disagreements with Accountants on Accounting and Financial Disclosure
Not applicable.
Item 9A. Controls and Procedures
(a) Evaluation of Disclosure Controls and Procedures
We design disclosure controls and procedures to reasonably assure that information required to be disclosed in the reports filed or submitted under the Exchange Act is recorded, processed, summarized, and reported within the time periods specified in the SEC's rules and forms. Disclosure controls and procedures include, without limitation, controls and procedures designed to reasonably assure that information required to be disclosed in the reports filed under the Exchange Act is accumulated and communicated to management, including the chief executive officer and chief financial officer, as appropriate, to allow timely decisions regarding required disclosure.
We carried out an evaluation of the effectiveness of the design and operation of our disclosure controls and procedures, as defined in Rules 13a-15(e) and 15d-15(e) of the Exchange Act, as of December 31, 2017. Management, including our chief executive officer and chief financial officer, participated in and supervised this evaluation. Based on that evaluation, our chief executive officer and chief financial officer concluded that our disclosure controls and procedures are effective to provide reasonable assurance that information required to be disclosed in the reports we file or submit under the Exchange Act meets the requirements listed above.
(b) Management's Report on Internal Control Over Financial Reporting
Our management is responsible for establishing and maintaining adequate internal control over financial reporting. Our internal control over financial reporting is a process designed to provide reasonable assurance regarding the reliability of financial reporting and the preparation of financial statements for external purposes in accordance with U.S. generally accepted accounting principles.
We carried out an evaluation, under the supervision and with the participation of our management, including our chief executive officer and chief financial officer, of the effectiveness of our internal control over financial reporting based on the framework set forth in Internal Control—Integrated Framework (2013) issued by the Committee of Sponsoring Organizations of the Treadway Commission.
Based on that evaluation, our management concluded that our internal control over financial reporting was effective as of December 31, 2017.
KPMG LLP, our independent registered public accounting firm, has issued its report on the effectiveness of our internal control over financial reporting, which is included in Part II, Item 8 of this Form 10-K under the caption “Financial Statements and Supplementary Data” and incorporated herein by reference.
(c) Changes in Internal Control Over Financial Reporting
There were no changes in our internal control over financial reporting during the quarter ended December 31, 2017 that have materially affected, or are reasonably likely to materially affect, our internal control over financial reporting. Internal control over financial reporting now includes the internal controls of PitchBook Data, Inc., which was not included in our assessment as of December 31, 2016.
Item 9B. Other Information
There is no information that was required to be disclosed in a report on Form 8-K during the fourth quarter of the year covered by this Annual Report on Form 10-K that was not reported.
105
Part III
Item 10. Directors, Executive Officers, and Corporate Governance
The information contained under the headings Proposal 1—Election of Directors, Board of Directors and Corporate Governance—Independent Directors, Board of Directors and Corporate Governance—Board Committees and Charters, and Section 16(a) Beneficial Ownership Reporting Compliance in the definitive proxy statement for our 2018 Annual Meeting of Shareholders (the Proxy Statement) and the information contained under the heading Executive Officers in Part I of this report is incorporated herein by reference in response to this item.
We have adopted a code of ethics, which is posted in the Investor Relations area of our corporate website at https://shareholders.morningstar.com in the Governance section. We intend to include on our website any amendments to, or waivers from, a provision of the code of ethics that apply to our principal executive officer, principal financial officer, principal accounting officer, or controller that relates to any element of the code of ethics definition contained in Item 406(b) of SEC Regulation S-K. Shareholders may request a free copy of these documents by sending an e-mail to investors@morningstar.com.
Item 11. Executive Compensation
The information contained under the headings Board of Directors and Corporate Governance—Directors' Compensation, Compensation Discussion and Analysis, Compensation Committee Report, Compensation Committee Interlocks and Insider Participation, and Executive Compensation in the Proxy Statement is incorporated herein by reference in response to this item.
Item 12. Security Ownership of Certain Beneficial Owners and Management and Related Stockholder Matters
The information contained under the headings Security Ownership of Certain Beneficial Owners and Management and Equity Compensation Plan Information in the Proxy Statement is incorporated herein by reference in response to this item.
Item 13. Certain Relationships and Related Transactions, and Director Independence
The information contained under the headings Certain Relationships and Related Party Transactions and Board of Directors and Corporate Governance—Independent Directors in the Proxy Statement is incorporated herein by reference in response to this item.
Item 14. Principal Accountant Fees and Services
The information contained under the headings Audit Committee Report and Principal Accounting Firm Fees in the Proxy Statement is incorporated herein by reference in response to this item.
106
Part IV
Item 15. Exhibits and Financial Statement Schedules
(a)
1. Consolidated Financial Statements
The following documents are filed as part of this Annual Report on Form 10-K under Item 8—Financial Statements and Supplementary Data:
Report of KPMG LLP, Independent Registered Public Accounting Firm | |
Financial Statements: | |
Consolidated Statements of Income—Years ended December 31, 2017, 2016, and 2015 | |
Consolidated Statements of Comprehensive Income—Years ended December 31, 2017, 2016, and 2015 | |
Consolidated Balance Sheets—December 31, 2017 and 2016 | |
Consolidated Statements of Equity—Years ended December 31, 2017, 2016, and 2015 | |
Consolidated Statements of Cash Flows—Years ended December 31, 2017, 2016, and 2015 | |
Notes to Consolidated Financial Statements | |
2. Financial Statement Schedules
REPORT OF INDEPENDENT REGISTERED PUBLIC ACCOUNTING FIRM
The report of KPMG LLP dated March 1, 2018 concerning the Financial Statement Schedule II, Morningstar, Inc., and subsidiaries Valuation and Qualifying Accounts, is included at the beginning of Part II, Item 8 of this Annual Report on Form 10-K for the years ended December 31, 2017, December 31, 2016, and December 31, 2015.
The following financial statement schedule is filed as part of this Annual Report on Form 10-K:
Schedule II: Valuation and Qualifying Accounts
All other schedules have been omitted as they are not required, not applicable, or the required information is otherwise included.
(in millions) | Balance at Beginning of Year | Charged (Credited) to Costs & Expenses | Additions (Deductions) Including Currency Translations | Balance at End of Year | ||||||||||||
Allowance for doubtful accounts: | ||||||||||||||||
Year ended December 31, | ||||||||||||||||
2017 | $ | 2.1 | $ | 2.3 | $ | (1.2 | ) | $ | 3.2 | |||||||
2016 | 1.8 | 1.3 | (1.0 | ) | 2.1 | |||||||||||
2015 | 1.5 | 0.5 | (0.2 | ) | 1.8 | |||||||||||
107
3. Exhibits
Exhibit | Description | |
Amended and Restated Articles of Incorporation of Morningstar are incorporated by reference to Exhibit 3.1 to our Registration Statement on Form S-1, as amended, Registration No. 333-115209 (the Registration Statement). | ||
By-laws of Morningstar, as in effect on February 27, 2018, are incorporated by reference to Exhibit 3.1 to our Current Report on Form 8-K that we filed with the SEC on February 28, 2018. | ||
Specimen Common Stock Certificate is incorporated by reference to Exhibit 4.1 to the Registration Statement. | ||
Form of Indemnification Agreement is incorporated by reference to Exhibit 10.1 to the Registration Statement. | ||
Morningstar Incentive Plan, as amended and restated effective January 1, 2014, is incorporated by reference to Exhibit 10.2 to our Annual Report on Form 10-K for the year ended December 31, 2013. | ||
Morningstar 2004 Stock Incentive Plan, as amended and restated effective as of July 24, 2009, is incorporated by reference to Exhibit 10.1 to our Quarterly Report on Form 10-Q for the quarter ended June 30, 2009. | ||
Morningstar 2011 Stock Incentive Plan is incorporated by reference to Exhibit 10.1 to our Current Report on Form 8-K that we filed with the SEC on May 18, 2011. | ||
Form of Morningstar 2004 Stock Incentive Plan Stock Option Agreement for awards made on May 15, 2011 is incorporated by reference to Exhibit 10.1 to our Quarterly Report on Form 10-Q for the quarter ended June 30, 2011 (the June 2011 10-Q). | ||
Form of Morningstar 2004 Stock Incentive Plan Director Stock Option Agreement for awards made on May 15, 2011 is incorporated by reference to Exhibit 10.2 to the June 2011 10-Q. | ||
Form of Morningstar 2011 Stock Incentive Plan Restricted Stock Award Agreement for awards made on and after May 15, 2013 is incorporated by reference to Exhibit 10.1 to our Quarterly Report on Form 10-Q for the quarter ended June 30, 2013 (the June 2013 10-Q). | ||
Form of Morningstar 2011 Stock Incentive Plan Director Restricted Stock Unit Award Agreement, as amended and restated effective December 3, 2015 is incorporated by reference to Exhibit 10.12 to our Annual Report on Form 10-K for the year ended December 31, 2015 (the 2015 10-K). | ||
Form of Morningstar 2011 Stock Incentive Plan Performance Share Award Agreement, as amended and restated effective December 3, 2015, for awards made on and after March 15, 2015 is incorporated by reference to Exhibit 10.14 to the 2015 10-K. | ||
Form of Morningstar 2011 Stock Incentive Plan CEO Restricted Stock Unit Award Agreement for award made on January 3, 2017 is incorporated by reference to Exhibit 10.11 to our Annual Report on Form 10-K for the year ended December 31, 2016. | ||
Form of Morningstar 2011 Stock Incentive Plan Market Stock Unit Award Agreement for awards made on May 15, 2017 is incorporated by reference to Exhibit 10.1 to our Quarterly Report on Form 10-Q for the quarter ended June 30, 2017. | ||
Form of Morningstar 2011 Stock Incentive Plan Market Stock Unit Award Agreement for awards made on and after November 15, 2017 | ||
Form of Morningstar 2011 Stock Incentive Plan Restricted Stock Unit Award Agreement for awards made on and after November 15, 2017. | ||
Form of Morningstar 2011 Stock Incentive Plan CFO Restricted Stock Unit Award Agreement for award made on November 15, 2017. | ||
Amended and Restated Credit Agreement dated as of November 4, 2016 among Morningstar, Inc., certain subsidiaries of Morningstar, Inc., and Bank of America, N.A. is incorporated by reference to Exhibit 10.1 to our Current Report on Form 8-K that we filed with the SEC on November 8, 2016. | ||
Subsidiaries of Morningstar. | ||
Consent of KPMG LLP. | ||
Certification of Chief Executive Officer pursuant to Rule 13a-14(a) and 15d-14(a) of the Securities Exchange Act of 1934, as amended. | ||
Certification of Chief Financial Officer pursuant to Rule 13a-14(a) and 15d-14(a) of the Securities Exchange Act of 1934, as amended. | ||
Certification of Chief Executive Officer pursuant to 18 U.S.C. 1350, as adopted pursuant to Section 906 of the Sarbanes-Oxley Act of 2002. | ||
Certification of Chief Financial Officer pursuant to 18 U.S.C. 1350, as adopted pursuant to Section 906 of the Sarbanes-Oxley Act of 2002. | ||
108
101† | The following financial information from Morningstar Annual Report on Form 10-K for the year ended December 31, 2017, filed with the SEC on March 1, 2018, formatted in XBRL: (i) Consolidated Statements of Income, (ii) Consolidated Statements of Comprehensive Income, (iii) Consolidated Balance Sheets, (iv) Consolidated Statements of Equity, (v) Consolidated Statements of Cash Flows and (vi) the Notes to Consolidated Financial Statements. | |
* Management contract with a director or executive officer or a compensatory plan or arrangement in which directors or executive officers are eligible to participate.
† Filed or furnished herewith.
Item 16. Form 10-K Summary
None.
109
SIGNATURES
Pursuant to the requirements of Section 13 or 15(d) of the Securities Exchange Act of 1934, the registrant has duly caused this report to be signed on its behalf by the undersigned thereunto duly authorized on March 1, 2018.
MORNINGSTAR, INC. | |||
By: | /s/ Kunal Kapoor | ||
Kunal Kapoor | |||
Title: Chief Executive Officer | |||
Pursuant to the requirements of the Securities Exchange Act of 1934, this report has been signed below by the following persons on behalf of the registrant and in the capacities and on the dates indicated.
Signature | Title | Date | ||
/s/ Kunal Kapoor | Chief Executive Officer | March 1, 2018 | ||
Kunal Kapoor | (principal executive officer) and Director | |||
/s/ Jason Dubinsky | Chief Financial Officer (principal | March 1, 2018 | ||
Jason Dubinsky | financial and accounting officer) | |||
/s/ Joe Mansueto | Chairman of the Board | March 1, 2018 | ||
Joe Mansueto | ||||
/s/ Robin Diamonte | Director | March 1, 2018 | ||
Robin Diamonte | ||||
/s/ Cheryl Francis | Director | March 1, 2018 | ||
Cheryl Francis | ||||
/s/ Steven Kaplan | Director | March 1, 2018 | ||
Steven Kaplan | ||||
/s/ Gail Landis | Director | March 1, 2018 | ||
Gail Landis | ||||
/s/ Bill Lyons | Director | March 1, 2018 | ||
Bill Lyons | ||||
/s/ Jack Noonan | Director | March 1, 2018 | ||
Jack Noonan | ||||
/s/ Caroline Tsay | Director | March 1, 2018 | ||
Caroline Tsay | ||||
/s/ Hugh Zentmyer | Director | March 1, 2018 | ||
Hugh Zentmyer | ||||
110