Attached files
| file | filename |
|---|---|
| EX-32.0 - EX-32.0 - Meridian Bancorp, Inc. | d455643dex320.htm |
| EX-31.2 - EX-31.2 - Meridian Bancorp, Inc. | d455643dex312.htm |
| EX-31.1 - EX-31.1 - Meridian Bancorp, Inc. | d455643dex311.htm |
| EX-23 - EX-23 - Meridian Bancorp, Inc. | d455643dex23.htm |
Table of Contents
UNITED STATES SECURITIES AND EXCHANGE COMMISSION
Washington, D.C. 20549
FORM 10-K
| ☑ |
Annual Report Pursuant to Section 13 or 15(d) of the Securities Exchange Act of 1934 |
For the Fiscal Year Ended December 31, 2017
OR
| ☐ |
Transition Report Pursuant to Section 13 or 15(d) of the Securities Exchange Act of 1934 |
For the transition period from to
Commission file number 001-36573
Meridian Bancorp, Inc.
(Exact name of registrant as specified in its charter)
| Maryland | 46-5396964 | |
| (State or other jurisdiction of incorporation or organization) |
(I.R.S. Employer Identification No.) |
| 67 Prospect Street, Peabody, Massachusetts |
01960 Zip Code | |
| (Address of Principal Executive Offices) |
(617) 567-1500
(Registrant’s telephone number, including area code)
Securities Registered Pursuant to Section 12(b) of the Act:
| Title of Each Class |
Name of Each Exchange on Which Registered | |
| Common Stock, $0.01 par value | The NASDAQ Stock Market, LLC |
Securities Registered Pursuant to Section 12(g) of the Act:
None
Indicate by check mark if the registrant is a well-known seasoned issuer, as defined in Rule 405 of the Securities Act. Yes ☑ No ☐
Indicate by check mark if the registrant is not required to file reports pursuant to Section 13 or Section 15(d) of the Act. Yes ☐ No ☑
Indicate by check mark whether the registrant (1) has filed all reports required to be filed by section 13 or 15(d) of the Securities Exchange Act of 1934 during the preceding 12 months and (2) has been subject to such filing requirements for the past 90 days. Yes ☑ No ☐
Indicate by check mark whether the registrant has submitted electronically and posted on its corporate Website, if any, every Interactive Data File required to be submitted and posted pursuant to Rule 405 of Regulation S-T (§ 232.405 of this chapter) during the preceding 12 months (or for such shorter period that the registrant was required to submit and post such files). Yes ☑ No ☐
Indicate by check mark if disclosure of delinquent filers pursuant to Item 405 of Regulation S-K is not contained herein, and will not be contained, to the best of registrant’s knowledge, in definitive proxy or information statements incorporated by reference in Part III of this Form 10-K or any amendment to this form 10-K. ☐
Indicate by check mark whether the registrant is a large accelerated filer, an accelerated filer, a non-accelerated filer, smaller reporting company, or an emerging growth company. See the definitions of “large accelerated filer,” “accelerated filer,” “smaller reporting company,” and “emerging growth company” in Rule 12b-2 of the Exchange Act. (Check one):
| Large Accelerated Filer |
☑ |
Accelerated Filer | ☐ |
Non-Accelerated Filer |
☐ | |||||
| Smaller Reporting Company |
☐ |
Emerging Growth Company | ☐ |
If an emerging growth company, indicate by check mark if the registrant has elected not to use the extended transition period for complying with any new or revised financial reporting standards provided pursuant to Section 13(a) of the Exchange Act. ☐
Indicate by check mark whether the registrant is a shell company (as defined in Rule 12b-2 of the Act). Yes ☐ No ☑
The aggregate market value of the voting and non-voting common equity held by non-affiliates of the Registrant, computed by reference to price at which the common equity was last sold on June 30, 2017 was $906,684,087. As of February 22, 2018, there were 54,059,992 outstanding shares of the Registrant’s common stock.
DOCUMENTS INCORPORATED BY REFERENCE
Portions of the Proxy Statement for the 2018 Annual Meeting of Stockholders of the Registrant are incorporated by reference in Part III of this Form 10-K.
Table of Contents
MERIDIAN BANCORP, INC.
2017 FORM 10-K ANNUAL REPORT
2
Table of Contents
This report contains forward-looking statements, which can be identified by the use of words such as “estimate,” “project,” “believe,” “intend,” “anticipate,” “plan,” “seek,” “expect” and words of similar meaning. These forward-looking statements include, but are not limited to:
| • | statements of our goals, intentions and expectations; |
| • | statements regarding our business plans, prospects, growth and operating strategies; |
| • | statements regarding the quality of our loan and investment portfolios; and |
| • | estimates of our risks and future costs and benefits. |
These forward-looking statements are based on current beliefs and expectations of our management and are inherently subject to significant business, economic and competitive uncertainties and contingencies, many of which are beyond our control. In addition, these forward-looking statements are subject to assumptions with respect to future business strategies and decisions that are subject to change.
The following factors, among others, could cause actual results to differ materially from the anticipated results or other expectations expressed in the forward-looking statements:
| • | general economic conditions, either nationally or in our market areas, that are worse than expected; |
| • | inflation and changes in the interest rate environment that reduce our margins and yields, our mortgage banking revenues, the fair value of financial instruments or the origination levels in our lending business, or increase the level of defaults, losses and prepayments on loans we have made and make whether held in portfolio or sold in the secondary markets; |
| • | competition among depository and other financial institutions; |
| • | changes in consumer spending, borrowing and savings habits; |
| • | our ability to enter new markets successfully and capitalize on growth opportunities; |
| • | changes in laws or government regulations or policies affecting financial institutions, including changes in regulatory fees and capital requirements; |
| • | changes in monetary or fiscal policies of the U.S. Government, including policies of the U.S. Treasury and the Federal Reserve Board; |
| • | changes in the financial condition, results of operations or future prospects of issuers of securities that we own; |
| • | changes in accounting policies and practices, as may be adopted by the bank regulatory agencies, the Financial Accounting Standards Board or the SEC; |
| • | changes in the level and trends of loan delinquencies and charge-offs and changes in estimates of the adequacy of the allowance for loan losses; |
| • | our ability to access cost-effective funding; |
| • | fluctuations in real estate values and both residential and commercial real estate market conditions; |
| • | demand for loans and deposits in our market area; |
| • | our ability to implement changes in our business strategies; |
| • | adverse changes in the securities or secondary mortgage markets; |
| • | our ability to manage market risk, credit risk and operational risk in the current economic conditions; |
| • | failure or breaches of our IT security systems; |
3
Table of Contents
| • | our ability to successfully integrate any assets, liabilities, customers, systems and management personnel we have acquired or may acquire into our operations and our ability to realize related revenue synergies and cost savings within expected time frames and any goodwill charges related thereto; |
| • | technological changes that may be more difficult or expensive than expected; |
| • | the ability of third-party providers to perform their obligations to us; |
| • | the ability of the U.S. Government to manage federal debt limits; |
| • | our ability to successfully introduce new products and services; |
| • | our ability to retain key employees; and |
| • | significant increases in our loan losses. |
Because of these and other uncertainties, our actual future results may be materially different from the results indicated by these forward-looking statements. Please see “Risk Factors” beginning on page 27.
| ITEM 1. | BUSINESS |
Meridian Bancorp, Inc.
Meridian Bancorp, Inc. (the “Company”) is a Maryland corporation that was incorporated in 2014. The Company owns all of East Boston Savings Bank’s stock and directs, plans and coordinates East Boston Savings Bank’s business activities. The Company is the successor to East Boston Savings Bank’s previous holding company, Meridian Interstate Bancorp, Inc. (“Old Meridian”), and was formed as a result of a second-step mutual-to-stock conversion (the “Conversion”) of Meridian Financial Services, Incorporated, (the “MHC”), the top tier mutual holding company of Old Meridian. The Conversion was completed in 2014 at which point, the MHC and Meridian Interstate Funding Corporation were merged into Old Meridian (and ceased to exist), and Old Meridian merged into the Company. The Company sold 32,500,000 shares of common stock at $10.00 per share in the second-step stock offering. The Company utilized $16.3 million of the proceeds to fund an additional loan to its Employee Stock Ownership Plan (“ESOP”) for the acquisition of 1,625,000 shares at $10.00 per share, representing 5% of the shares sold in the second-step offering, and incurred expenses in connection with the offer and sale of the common stock totaling $6.5 million, resulting in net cash proceeds to the Company of $302.3 million. The Company invested $159.3 million of the net proceeds it received from the sale into East Boston Savings Bank and has retained the remaining amount for general corporate purposes. Concurrent with the completion of the stock offering, each share of Old Meridian common stock owned by public stockholders (stockholders other than the MHC) was exchanged for 2.4484 shares of Company common stock. A total of 22,200,316 shares of Company common stock were issued in the exchange.
On December 29, 2017, the Company completed its acquisition of Meetinghouse Bancorp, Inc. (“Meetinghouse”), the holding company for Meetinghouse Bank, a Massachusetts stock co-operative bank, with two full-service branches that were then merged into East Boston Savings Bank. The Meetinghouse acquisition added $120.4 million in total assets at fair value, including $75.7 million in loans and $93.8 million in deposits. The Company paid total cash consideration of $17.8 million, or $26.00 for each outstanding share of Meetinghouse common stock. Refer to Note 14, Acquisition, in Notes to the Consolidated Financial Statements included in Item 8 Financial Statements and Supplementary Data within this report for further information regarding the Meetinghouse acquisition.
East Boston Savings Bank
East Boston Savings Bank (the “Bank”) is a Massachusetts-chartered stock savings bank, founded in 1848, that conducts its business from 33 full-service locations, one mobile branch and three loan centers in the greater Boston metropolitan area. We offer a variety of deposit and loan products to individuals and businesses located in our primary market, which consists of Suffolk, Norfolk, Middlesex and Essex Counties, Massachusetts. We attract deposits from the general public and use those funds to originate one- to four-family real estate, multi-family and commercial real estate, construction, commercial and industrial, and consumer loans, which we primarily hold for investment. Our lending business also involves the purchase and sale of loan participation interests.
4
Table of Contents
Available Information
The Company is a public company and files interim, quarterly and annual reports with the Securities and Exchange Commission. These respective reports are on file and a matter of public record with the Securities and Exchange Commission and may be read and copied at the Securities and Exchange Commission’s Public Reference Room at 100 F Street, NE, Washington, DC 20549 during the hours of 10:00 a.m. to 3:00 p.m. on official business days. The public may obtain information on the operation of the Public Reference Room by calling the Securities and Exchange Commission at 1-800-SEC-0330. The Securities and Exchange Commission maintains an Internet site that contains reports, proxy and information statements, and other information regarding issuers that file electronically with the SEC (http://www.sec.gov).
The Company’s executive offices are located at 67 Prospect Street, Peabody, Massachusetts 01960, and our telephone number is (617) 567-1500. The Company’s website address is www.ebsb.com. Our public reports are available, free of charge, on our website as soon or reasonably practical after they are with or furnished to the Securities and Exchange Commission. Information on this website is not and should not be considered to be a part of this report.
Market Area
We consider the greater Boston metropolitan area to be our primary market area. While our primary deposit-gathering area is concentrated in the greater Boston metropolitan area, our lending area encompasses a broader market that includes most of eastern Massachusetts, including Cape Cod, and portions of southeastern New Hampshire, Maine and Rhode Island. We conduct our operations through our 33 full-service offices, one mobile branch and three loan centers located in the following counties, all of which are located in the greater Boston metropolitan area: Essex (five offices and two loan centers), Middlesex (seven offices), Suffolk (19 offices and one loan center) and Norfolk (two offices). The greater Boston metropolitan area is the 10th largest metropolitan area in the United States. Located adjacent to major transportation corridors, the Boston metropolitan area provides a highly diversified economic base, with major employment sectors ranging from services, manufacturing and wholesale retail trade, to finance, technology and medical care. The largest employment sector, however, is health care and social services, accounting for 16.8% of businesses in Massachusetts. Based on data from the Federal Reserve Bank of Boston, the unemployment rate for Massachusetts increased to 3.1% in December 2017 as compared to 2.8% in December 2016. Home prices in Massachusetts rose at an annual rate of 5.8% in the third quarter of 2017 as compared to 5.9% for the third quarter of 2016.
Competition
We face significant competition for the attraction of deposits and origination of loans. Our most direct competition for deposits has historically come from the many financial institutions operating in our market area and, to a lesser extent, from other financial service companies such as brokerage firms and insurance companies. Several large holding companies operate banks in our market area. These institutions are significantly larger than us and, therefore, have greater resources. We also face competition for investors’ funds from money market funds, mutual funds and other corporate and government securities. Based on data from the Federal Deposit Insurance Corporation (“FDIC”) as of June 30, 2017 (the latest date for which information is available), the Bank had 1.22% of the deposit market share within the Boston-Cambridge-Quincey, Massachusetts — New Hampshire metropolitan statistical area, giving us the 11th largest market share in our metropolitan statistical area out of 131 financial institutions in our metropolitan statistical area as of that date.
Our competition for loans comes from financial institutions in our market area and from other financial service providers, such as mortgage companies and mortgage brokers. Competition for loans also comes from the increasing number of non-depository financial service companies entering the mortgage market, such as insurance companies, securities companies and specialty finance companies. Some of our competitors offer products and services that we do not offer, such as insurance services, trust services, wealth management and asset-based financing.
5
Table of Contents
Lending Activities
Commercial Real Estate Loans. At December 31, 2017, commercial real estate loans were $2.064 billion, or 44.2%, of our total loan portfolio, including $14.1 million of commercial real estate loans acquired in the Meetinghouse acquisition. The commercial real estate loan portfolio consisted of $649.2 million of fixed-rate loans and $1.415 billion of adjustable-rate loans at December 31, 2017. Our commercial real estate loans are generally secured by properties used for business purposes such as office buildings, industrial facilities and retail facilities. At December 31, 2017, $331.8 million of our commercial real estate portfolio was owner occupied commercial real estate, and the remaining $1.732 billion was secured by income producing, or non-owner occupied commercial real estate. We intend to continue to grow our commercial real estate loan portfolio while maintaining prudent underwriting standards. In addition to originating these loans, we also participate in loans with other financial institutions.
We originate a variety of fixed- and adjustable-rate commercial real estate loans for terms and amortization periods up to 30 years, which may include balloon loans. Interest rates and payments on our adjustable-rate loans adjust every three, five, seven or ten years and generally are adjusted to a rate equal to a percentage above the corresponding U.S. Treasury rate or Federal Home Loan Bank borrowing rate. Most of our adjustable-rate commercial real estate loans adjust every five years and amortize over terms of 20 to 25 years. We also include prepayment penalties on loans we originate. Loan amounts generally do not exceed 75% to 80% of the property’s appraised value at the time the loan is originated. In addition, borrowers are generally required by policy to have a minimum income to debt service ratio of 1.20x. We require independent appraisals or evaluations on all loans secured by commercial real estate from an approved appraisers list. We require most of our commercial real estate loan borrowers to submit annual financial statements and/or rent rolls on the subject property. These properties may also be subject to annual inspections to support that appropriate maintenance is being performed by the owner/borrower. Our policy is to review all commercial real estate loans over $1 million at least annually along with each commercial real estate borrower and, as applicable, each guarantor. The loan and its borrowers and/or guarantors are subject to an annual risk review verifying that the loan is properly risk rated based upon covenant compliance and other terms as provided for in the loan agreements. While this process does not prevent loans from becoming delinquent, it provides us with the opportunity to better identify problem loans in a timely manner and to work with the borrower prior to the loan becoming delinquent.
The following table provides information with respect to our commercial real estate loans by type at December 31, 2017:
| Amount | Percent | |||||||
| (Dollars in thousands) | ||||||||
| Accommodations |
$ | 153,069 | 7.4 | % | ||||
| Industrial/Warehouse |
460,286 | 22.3 | ||||||
| Mixed use |
147,187 | 7.1 | ||||||
| Office building |
532,075 | 25.8 | ||||||
| Office condominium |
20,129 | 1.0 | ||||||
| Restaurant |
6,324 | 0.3 | ||||||
| Retail |
466,998 | 22.6 | ||||||
| Other |
277,713 | 13.5 | ||||||
|
|
|
|
|
|||||
| $ | 2,063,781 | 100.0 | % | |||||
|
|
|
|
|
|||||
If we foreclose on a commercial real estate loan, the marketing and liquidation period to convert the real estate asset to cash can be lengthy with substantial holding costs. In addition, vacancies, deferred maintenance, repairs and market stigma can result in prospective buyers expecting sale price concessions to offset their real or perceived economic losses for the time it takes them to return the property to profitability. Depending on the individual circumstances, initial charge-offs and subsequent losses on commercial real estate loans can be unpredictable and substantial.
6
Table of Contents
The average outstanding loan size in our commercial real estate portfolio was $2.9 million as of December 31, 2017. We currently target new individual commercial real estate loan originations to owners and investors in our market area and generally originate loans to one borrower up to $75.0 million. We generally do not make commercial real estate loans outside our primary market areas. Our largest single commercial real estate relationship at December 31, 2017 totaled $95.9 million. These loans are secured by office buildings. Our next largest borrowing relationship at December 31, 2017 was for $86.9 million and is secured by office buildings. The third largest relationship was for $76.8 million at December 31, 2017 and is secured by industrial/warehouse properties. At December 31, 2017, all of these loans were performing in accordance with their repayment terms.
One- to Four-Family Residential Loans. Our one- to four-family residential loan portfolio consists of mortgage loans that enable borrowers to purchase or refinance existing homes, most of which serve as the primary residence of the owner. At December 31, 2017, one- to four-family residential loans were $603.7 million, or 12.9% of our total loan portfolio, including $46.0 million of one- to four-family residential loans acquired in the Meetinghouse acquisition. The one- to four-family residential portfolio consists of $86.3 million and $517.4 million of fixed-rate and adjustable-rate loans, respectively, at December 31, 2017. We generally offer fixed-rate loans and adjustable-rate loans with terms up to 30 years. Generally, our fixed-rate loans conform to Fannie Mae and Freddie Mac underwriting guidelines and those with longer terms (more than 10 years) are originated with the intention to sell. Our adjustable-rate mortgage loans generally adjust annually or every three years after an initial fixed period that ranges from three to ten years. Management has the intent and ability to hold the remaining fixed-rate loans in our loan portfolio for the foreseeable future or until maturity or pay-off. Interest rates and payments on our adjustable-rate loans generally are adjusted to a rate equal to a percentage above the one or three year U.S. Treasury index. Depending on the loan type, the maximum amount by which the interest rate may be increased or decreased is generally 2% per adjustment period and the lifetime interest rate caps range from 2% to 6% over the initial interest rate of the loan. Our residential loans generally do not have prepayment penalties.
Borrower demand for adjustable-rate compared to fixed-rate loans is a function of the level of interest rates, the expectations of changes in the level of interest rates, and the difference between the interest rates and loan fees offered for fixed-rate mortgage loans as compared to the interest rates and loan fees for adjustable-rate loans. The relative amount of fixed-rate and adjustable-rate mortgage loans that can be originated at any time is largely determined by the demand for each in a competitive environment. The loan fees, interest rates and other provisions of mortgage loans are determined by us on the basis of our own pricing criteria and competitive market conditions.
While one- to four-family residential real estate loans are normally originated with up to 30-year terms, such loans typically remain outstanding for substantially shorter periods because borrowers often prepay their loans in full either upon sale of the property pledged as security or upon refinancing the original loan. Therefore, average loan maturity is a function of, among other factors, the level of purchase and sale activity in the real estate market, prevailing interest rates and the interest rates payable on outstanding loans. We do not offer loans with negative amortization and generally do not offer interest-only, one- to four-family residential real estate loans. Additionally, our current practice is generally (1) to sell to the secondary market newly originated longer-term (terms of 10 years or greater) fixed-rate, one- to four-family residential real estate loans, and (2) to hold in our portfolio shorter-term, fixed-rate loans and adjustable-rate loans. We sell residential real estate loans in the secondary market primarily with servicing released. We also sell loans to Fannie Mae, the Federal Home Loan Bank Mortgage Partnership Finance Program and other investors with servicing retained.
We will make loans with loan-to-value ratios up to 95% (100% for first time home buyers) with such value measured at origination; however, we generally require private mortgage insurance for loans with a loan-to-value ratio over 80%. We require all properties securing mortgage loans to be appraised by a licensed real estate appraiser. We generally require title insurance on all first mortgage loans. Borrowers must obtain hazard insurance, and flood insurance is required for loans on properties located in a flood zone.
In an effort to provide financing for first-time buyers, we offer fixed-rate 30-year residential real estate loans through the Massachusetts Housing Finance Agency First Time Home Buyer Program. We offer mortgage
7
Table of Contents
loans through this program to qualified individuals and originate the loans using modified underwriting guidelines and loan conditions.
We also offer adjustable-rate loans secured by one- to four-family properties that are not owner-occupied. Non-owner-occupied one- to four-family residential loans generally can be made with a loan-to-value ratio of up to 75% with such value measured at origination. At December 31, 2017, these loans totaled $190.6 million. Non-owner-occupied residential loans can have higher risk of loss than owner-occupied residential loans, as payment on such loans often depends on successful operation and management of the properties. In addition, non-owner-occupied residential borrowers may be more willing to default on a loan than an owner-occupied residential borrower as the non-owner-occupied residential borrower would not be losing his or her residence.
Multi-Family Real Estate Loans. At December 31, 2017, multi-family real estate loans were $779.6 million, or 16.7% of our total loan portfolio, including $2.5 million of multi-family real estate loans acquired in the Meetinghouse acquisition. The multi-family loan portfolio consisted of $36.0 million of fixed-rate loans and $743.6 million of adjustable-rate loans at December 31, 2017. Our multi-family real estate loans are generally secured by apartment buildings. We intend to continue to grow our multi-family loan portfolio, while maintaining prudent underwriting standards. In addition to originating these loans, we also participate in loans with other financial institutions.
We originate a variety of adjustable-rate, multi-family real estate loans for terms up to 30 years. Interest rates and payments on our adjustable-rate loans adjust every three, five, seven or ten years and generally are adjusted to a rate equal to a percentage above the corresponding U.S. Treasury rate or Federal Home Loan Bank borrowing rate. Most of our adjustable-rate multi-family real estate loans adjust every five years and amortize over terms of 20 to 25 years. We also include prepayment penalties on loans we originate. Loan amounts generally do not exceed 75% to 80% of the property’s appraised value at the time the loan is originated. Borrowers are generally required by policy to have a minimum income to debt service ratio of 1.20x. We require most of our multi-family real estate loan borrowers to submit annual financial statements and/or rent rolls on the subject property. These properties may also be subject to annual inspections to support that appropriate maintenance is being performed by the owner/borrower.
If we foreclose on a multi-family real estate loan, the marketing and liquidation period to convert the real estate asset to cash can be lengthy with substantial holding costs. In addition, vacancies, deferred maintenance, repairs and market stigma can result in prospective buyers expecting sale price concessions to offset their real or perceived economic losses for the time it takes them to return the property to profitability. Depending on the individual circumstances, initial charge-offs and subsequent losses on multi-family real estate loans can be unpredictable and substantial.
The average outstanding loan size in our multi-family real estate portfolio was $1.8 million as of December 31, 2017. We currently target new individual multi-family real estate loan originations to owners and investors in our market area and generally originate loans to one borrower up to $75.0 million.
We generally do not make multi-family real estate loans outside our primary market areas.
Our largest multi-family real estate relationship at December 31, 2017 totaled $50.2 million and originated in 2016. Our next largest multi-family borrowing relationship at December 31, 2017 was for $47.7 million and the third largest multi-family borrowing relationship was for $37.1 million. Each relationship is secured by apartment buildings. At December 31, 2017, all of these loans were performing in accordance with their terms.
Construction Loans. Historically, we have invested a significant portion of our loan portfolio in construction loans for commercial real estate, multi-family properties and one- to four-family residential developments. Although well diversified with respect to price ranges and borrowers, our construction loans are significantly concentrated in the greater Boston metropolitan area. At December 31, 2017, construction loans were $641.3 million, or 13.7% of our total loan portfolio, including $2.0 million of construction loans acquired in the Meetinghouse acquisition.
We primarily make construction loans for commercial development projects, including apartment buildings, condominiums, small industrial buildings and retail and office buildings. Most of our construction loans provide
8
Table of Contents
for the payment of only interest during the construction phase, which is usually up to 12 to 36 months, although some construction loans are renewed, generally for one or two additional years. At the end of the construction phase, the loan may convert to a permanent mortgage loan or the loan may be paid in full. Loans generally can be made with a maximum loan-to-value ratio of 80% of the discounted appraised market value upon completion of the project. As appropriate to the underwriting, a “discounted cash flow analysis” is utilized. Before making a commitment to fund a construction loan, we require an appraisal of the property by an independent licensed appraiser. We also will generally require an inspection of the property before disbursement of funds during the term of the construction loan.
We also originate construction and site development loans to contractors and builders to finance the construction of single-family homes and subdivisions. While we may originate these loans whether or not the collateral property underlying the loan is under contract for sale, we consider each project carefully in light of current residential real estate market conditions. We actively monitor the number of unsold homes in our construction loan portfolio and local housing markets to attempt to maintain an appropriate balance between home sales and new loan originations. The maximum number of speculative loans (loans that are not pre-sold) approved for each builder is based on a combination of factors, including the financial capacity of the builder, the market demand for the finished product and the ratio of sold to unsold inventory the builder maintains. We have attempted to diversify the risk associated with speculative construction lending by doing business with a large number of experienced small and mid-sized builders within our market area.
We regularly monitor the construction loan portfolio and the economic conditions and housing inventory in each of our markets and increase or decrease this type of lending as we observe market conditions change. We believe that the underwriting policies and internal monitoring systems we have in place have helped to mitigate some of the risks inherent in construction and land lending.
The composition of our construction portfolio at December 31, 2017 is as follows.
| Amount | Percent | |||||||
| (Dollars in thousands) | ||||||||
| Condominium |
$ | 166,834 | 26.0 | % | ||||
| One- to four-family residential real estate |
44,757 | 7.0 | ||||||
| Apartment |
96,166 | 15.0 | ||||||
| Commercial real estate |
33,702 | 5.2 | ||||||
| Mixed use |
33,405 | 5.2 | ||||||
| Accommodations |
62,280 | 9.7 | ||||||
| Retail |
63,016 | 9.8 | ||||||
| Office building |
110,733 | 17.3 | ||||||
| Land |
22,873 | 3.6 | ||||||
| Other |
7,540 | 1.2 | ||||||
|
|
|
|
|
|||||
| $ | 641,306 | 100.0 | % | |||||
|
|
|
|
|
|||||
Our largest construction loan relationship at December 31, 2017 totaled $55.4 million. This relationship is secured by hotel properties. The next largest construction borrowing relationship at December 31, 2017 was for $51.6 million and is secured by office buildings. The third largest construction loan relationship was for $40.5 million. This relationship is secured by apartment buildings. At December 31, 2017, all of these loans were performing in accordance with their terms.
Commercial and Industrial Loans. At December 31, 2017, commercial and industrial loans were $525.6 million, or 11.3% of our total loan portfolio, including $2.1 million of commercial and industrial loans acquired in the Meetinghouse acquisition, and we intend to increase the amount of commercial and industrial loans that we originate. A significant portion of our commercial and industrial loans consists of our direct purchase of tax-exempt bonds issued by non-profit organizations (primarily educational and health organizations) and manufacturers through programs sponsored by the Commonwealth of Massachusetts and the states of Maine and New Hampshire. We underwrite these bonds in substantially the same manner as our other commercial and
9
Table of Contents
industrial loans. At December 31, 2017, tax exempt bonds included in our commercial and industrial loan portfolio were $284.8 million, or 54.2% of our total commercial and industrial loans at that date. A portion of our commercial and industrial loans is secured by owner-occupied commercial real estate. We make commercial and industrial loans primarily in our market area to a variety of professionals, sole proprietorships, nonprofit organizations and small businesses. However, the primary source of repayment for all of our commercial and industrial loans is income from the underlying business. As part of our relationship driven focus, we require many of our commercial and industrial borrowers to maintain their primary deposit accounts with us, which enhances our interest rate spread and overall profitability.
Commercial lending products include term loans and revolving lines of credit. Commercial loans and lines of credit are made with either variable or fixed rates of interest. Variable rates are based on the Prime Rate as published in The Wall Street Journal, plus a margin. Initial rates on fixed-rate business loans are generally based on a corresponding U.S. Treasury or Federal Home Loan Bank rate, plus a margin. Commercial and industrial loans typically have shorter maturity terms and higher interest rates than commercial real estate loans, but may involve more credit risk because of the type and nature of the collateral. We are focusing our efforts on small- to medium-sized, privately-held companies with local or regional businesses and non-profit entities that operate in our market area and generally originate loans to one borrower up to $65.0 million.
When making commercial loans, we consider the financial statements of the borrower, our lending history with the borrower, the debt service capabilities of the borrower, the projected cash flows of the business and the value of the collateral, primarily real estate, accounts receivable, inventory and equipment. Depending on the collateral used to secure the loans, commercial loans are made in amounts of up to 80% of the value of the collateral securing the loan. All of these loans are secured by assets of the respective borrowers.
Our largest single commercial and industrial loan relationship at December 31, 2017 totaled $63.3 million. This loan is secured by gross receipts. Our next largest borrowing relationship at December 31, 2017 was for $36.3 million and is secured by an assisted living facility. The third largest relationship was for $24.4 million at December 31, 2017 and is secured by academic facilities. At December 31, 2017, all of these loans were performing in accordance with their repayment terms.
Home Equity Lines of Credit. We offer home equity lines of credit, which are secured by one- to four-family residences. At December 31, 2017, the outstanding balance owed on home equity lines of credit amounted to $48.4 million, or 1.0% of our total loan portfolio, including $6.5 million of home equity lines of credit acquired in the Meetinghouse acquisition. Home equity lines of credit have adjustable rates of interest with five to ten-year draws and 15 to 20 year terms that are indexed to the Prime Rate as published by The Wall Street Journal on the last business day of the month. Our home equity lines either have a monthly variable interest rate or an interest rate that is fixed for five years and that adjusts in years six and 11. We offer home equity lines of credit with cumulative loan-to-value ratios generally up to 80%, when taking into account both the balance of the home equity loans and first mortgage loan.
The procedures for underwriting home equity lines of credit include an assessment of the applicant’s payment history on other debts and ability to meet existing obligations and payments on the proposed loan. Although the applicant’s creditworthiness is a primary consideration, the underwriting process also includes a comparison of the value of the collateral to the proposed loan amount. The procedures for underwriting one- to four-family residential real estate loans apply equally to home equity loans.
Consumer Loans. We offer automobile loans, loans secured by savings or certificate accounts, credit builder, annuity and overdraft loans. At December 31, 2017, consumer loans were $10.8 million, or 0.2% of total loans. The procedures for underwriting consumer loans include an assessment of the applicant’s payment history on other debts and ability to meet existing obligations and payments on the proposed loan. Although the applicant’s creditworthiness is a primary consideration, the underwriting process also includes a comparison of the value of the collateral, if any, to the proposed loan amount.
Loan Underwriting Risks
Adjustable-Rate Loans. While we anticipate that adjustable-rate loans will better offset the adverse effects of an increase in interest rates as compared to fixed-rate mortgage loans, an increased monthly mortgage
10
Table of Contents
payment required of adjustable-rate loan borrowers in a rising interest rate environment could cause an increase in delinquencies and defaults. The marketability of the underlying property also may be adversely affected in a high interest rate environment. In addition, although adjustable-rate mortgage loans make our asset base more responsive to changes in interest rates, the extent of this interest sensitivity is limited by the annual and lifetime interest rate adjustment limits on residential loans.
Commercial and Multi-Family Real Estate Loans. Loans secured by commercial and multi-family real estate generally have larger balances and involve a greater degree of risk than one- to four-family residential mortgage loans. Of primary concern in commercial and multi-family real estate lending is the borrower’s creditworthiness and the feasibility and cash flow potential of the project. Payments on loans secured by income properties often depend on successful operation and management of the properties. As a result, repayment of such loans may be subject to a greater extent than residential real estate loans, to adverse conditions in the real estate market or the economy. To monitor cash flows on income properties, we require borrowers and loan guarantors, if any, to provide annual financial statements on commercial and multi-family real estate loans. In reaching a decision on whether to make a commercial or multi-family real estate loan, we consider and review a global cash flow analysis of the borrower and consider the net operating income of the property, the borrower’s expertise, credit history and profitability and the value of the underlying property. We have generally required that the properties securing these real estate loans have debt service coverage ratios (the ratio of earnings before debt service to debt service) of at least 1.20x. An environmental phase one report is obtained when the possibility exists that hazardous materials may have existed on the site, or the site may have been impacted by adjoining properties that handled hazardous materials. If the estimate of value proves to be inaccurate, in the event of default and foreclosure, we may be confronted with a property the value of which is insufficient to assure full payment.
Construction Loans. Our construction loans are based upon estimates of costs and values associated with the completed project. Underwriting is focused on the borrowers’ financial strength, credit history and demonstrated ability to produce a quality product and effectively market and manage their operations. All speculative construction loans must be approved by senior loan officers.
Construction lending involves additional risks when compared with permanent residential lending because funds are advanced upon the security of the project, which is of uncertain value prior to its completion. Because of the uncertainties inherent in estimating construction costs, as well as the market value of the completed project and the effects of governmental regulation of real property, it is relatively difficult to evaluate accurately the total funds required to complete a project and the related loan-to-value ratio. This type of lending also typically involves higher loan principal amounts and is often concentrated with a small number of builders. In addition, during the term of a construction loan, interest is funded by the borrower or disbursed from an interest reserve set aside from the construction loan budget. These loans often involve the disbursement of substantial funds with repayment substantially dependent on the success of the ultimate project and the ability of the borrower to sell or lease the property or obtain permanent take-out financing, rather than the ability of the borrower or guarantor to repay principal and interest. If our appraisal of the value of a completed project proves to be overstated, we may have inadequate security for the repayment of the loan upon completion of construction of the project and may incur a loss. A discounted cash flow analysis is utilized for determining the value of any construction project of five or more units. Our ability to continue to originate a significant amount of construction loans is dependent on the strength of the housing market in our market areas.
Commercial and Industrial Loans. Unlike residential mortgage loans, which generally are made on the basis of the borrower’s ability to make repayment from his or her employment or other income, and which are secured by real property whose value tends to be more easily ascertainable, commercial and industrial loans are of higher risk and typically are made on the basis of the borrower’s ability to make repayment from the cash flows of the borrower’s business and the collateral securing these loans may fluctuate in value. Our commercial and industrial loans are originated primarily based on the identified cash flows of the borrower and secondarily on the underlying collateral provided by the borrower. Most often, this collateral consists of real estate, accounts receivable, inventory or equipment. Credit support provided by the borrower for most of these loans and the probability of repayment is based on the liquidation of the pledged collateral and enforcement of a personal guarantee, if any. As a result, the availability of funds for the repayment of commercial and industrial loans may
11
Table of Contents
depend substantially on the success of the business itself. Further, any collateral securing such loans may depreciate over time, may be difficult to appraise and may fluctuate in value.
Consumer Loans. Consumer loans may entail greater risk than residential mortgage loans, particularly in the case of consumer loans that are unsecured or secured by assets that depreciate rapidly, such as motor vehicles. Repossessed collateral for a defaulted consumer loan may not provide an adequate source of repayment for the outstanding loan and a small remaining deficiency often does not warrant further substantial collection efforts against the borrower. Consumer loan collections depend on the borrower’s continuing financial stability, and therefore are likely to be adversely affected by various factors, including job loss, divorce, illness or personal bankruptcy. Furthermore, the application of various federal and state laws, including federal and state bankruptcy and insolvency laws, may limit the amount that can be recovered on such loans.
Loan Originations, Purchase and Sales
Loan originations come from a variety of sources. The primary sources of loan originations are current customers, business development by our relationship managers, walk-in traffic, our website, advertising and referrals from customers as well as our directors, business owners, investors, entrepreneurs, builders, realtors, existing customers and other professional third parties, including brokers. Loan originations are further supported by lending services offered through our internet website, direct mail, cross-selling, and employees’ community service. We also advertise in newspapers that are widely circulated throughout our market area and on local radio and television. We also participate in loans with others to supplement our origination efforts. We generally do not purchase whole loans.
We generally originate loans for our portfolio; however, we generally agree to sell to the secondary market newly originated conforming fixed-rate, 10- to 30-year one- to four-family residential real estate loans. Our decision to sell loans is based on prevailing market interest rate conditions and interest rate risk management. We sell residential real estate loans in the secondary market primarily with servicing released. We also sell loans to Fannie Mae, the Federal Home Loan Bank Mortgage Partnership Finance Program and other investors with servicing retained. For the years ended December 31, 2017 and 2016, we originated $42.7 million and $70.5 million of residential real estate loans for sale, respectively, and sold $45.0 million and $71.3 million of residential real estate loans, respectively. At December 31, 2017, we were servicing $133.9 million of residential real estate loans for other financial institutions. In addition, we sell participation interests in commercial real estate loans to local financial institutions, primarily on the portion of loans exceeding our borrowing limits, or as is prudent in concert with recognition of credit risk.
Loan Approval Procedures and Authority
Our lending activities follow written, non-discriminatory, underwriting standards and loan origination procedures established by the Bank’s Board of Directors and management. The Bank’s Board of Directors has granted loan approval authority to certain officers up to prescribed limits, depending on the officer’s experience, the type of loan and whether the loan is secured or unsecured. Residential loans below $2.0 million require approval by members of senior management. Residential loans in excess of $2.0 million must be authorized by the Bank’s Executive Committee of the Board of Directors. Commercial loans below $2.5 million require approval by members of senior management. Commercial loans from $2.5 million up to $3.5 million require approval by management’s loan committee. Commercial loans in excess of $3.5 million must be authorized by the Bank’s Executive Committee of the Board of Directors. Exceptions are fully disclosed to the approving authority, either an individual officer or the appropriate management or Board committee prior to commitment. All exceptions are reported to the Board of Directors monthly.
Loans-to-One Borrower Limit and Loan Category Concentration
The maximum amount that we may lend to one borrower and the borrower’s related entities is generally limited, by statute, to 20% of our capital, which is defined under Massachusetts law as the sum of our capital stock, surplus account and undivided profits. At December 31, 2017, our regulatory limit on loans-to-one borrower was $110.2 million. At that date, our largest lending relationship consisted of four loans for
12
Table of Contents
$95.9 million and was secured by office buildings. This loan was performing in accordance with its original repayment terms at December 31, 2017.
Loan Commitments
We issue commitments for fixed- and adjustable-rate loans conditioned upon the occurrence of certain events. Commitments to originate loans are legally binding agreements to lend to our customers provided there are no violations of any contractually established conditions. Generally, our commitments to originate loans expire after 60 days. Unfunded commitments under lines of credit are commitments for possible future extensions of credit to existing customers. Our lines of credit usually do not contain a specified maturity date and may not be drawn upon to the total extent to which we are committed. Our letters of credit are conditional commitments issued to guarantee the performance of a customer to a third party, primarily to support borrowing arrangements.
Investment Activities
We have legal authority to invest in various types of liquid assets, including U.S. Treasury obligations, securities of various government-sponsored enterprises, residential mortgage-backed securities and municipal governments, deposits at the Federal Home Loan Bank of Boston (“FHLB”), certificates of deposit of federally insured institutions, investment grade corporate bonds and investment grade marketable equity securities, including common stock and money market mutual funds. Our equity securities generally pay dividends. We also are required to maintain an investment in Federal Home Loan Bank of Boston stock, which investment is based on the level of our FHLB borrowings. While we have the authority under applicable law to invest in derivative securities, we had no investments in derivative securities at December 31, 2017.
At December 31, 2017, our investment portfolio consisted primarily of municipal bonds, investment-grade marketable equity securities and mortgage-backed securities.
Our investment objectives are to provide and maintain liquidity, to establish and maintain an acceptable level of interest rate and credit risk, to provide a use of funds when demand for loans is weak and to generate a favorable return. Our Board of Directors has the overall responsibility for the investment portfolio, including approval of our investment policy. The Executive Committee of the Board of Directors and management are responsible for implementation of the investment policy and monitoring our investment performance. Our Executive Committee reviews the status of our investment portfolio monthly.
Each reporting period, we evaluate all securities with a decline in fair value below the amortized cost of the investment to determine whether other-than-temporary impairment (“OTTI”) exists. OTTI is required to be recognized if (1) we intend to sell the security; (2) it is more likely than not that we will be required to sell the security before recovery of its amortized cost basis; or (3) for debt securities, the present value of expected cash flows is not sufficient to recover the entire amortized cost basis. Marketable equity securities are evaluated for OTTI based on the severity and duration of the impairment and, if deemed to be other than temporary, the declines in fair value are reflected in earnings as realized losses. For impaired debt securities that we intend to sell, or more likely than not will be required to sell, the full amount of the depreciation is recognized as OTTI through earnings. For all other impaired debt securities, credit-related OTTI is recognized through earnings and non-credit-related OTTI is recognized in other comprehensive income/loss, net of applicable taxes.
Deposit Activities and Other Sources of Funds
General. Deposits, borrowings and loan repayments are the major sources of our funds for lending and other investment purposes. Scheduled loan repayments are a relatively stable source of funds, while deposit inflows and outflows and loan prepayments are significantly influenced by general interest rates and market conditions.
Deposit Accounts. The substantial majority of our depositors reside in our market area. Deposits are attracted by advertising and through our website, primarily from within our market area through the offering of a broad selection of deposit instruments, including non-interest-bearing demand deposits (such as checking accounts), interest-bearing demand accounts (such as NOW and money market accounts), savings accounts and
13
Table of Contents
certificates of deposit. In addition to accounts for individuals, we also offer several commercial checking accounts designed for the businesses operating in our market area and accept brokered deposits when it’s deemed cost effective.
Deposit account terms vary according to the minimum balance required, the time period that funds must remain on deposit, and the interest rate, among other factors. In determining the terms of our deposit accounts, we consider the rates offered by our competition, our liquidity needs, profitability, and customer preferences and concerns. We generally review our deposit mix and pricing on a weekly basis. Our deposit pricing strategy has generally been to offer competitive rates and to periodically offer special rates in order to attract deposits of a specific type or term.
Borrowings. We may utilize advances from the Federal Home Loan Bank of Boston to supplement our supply of investable funds. The Federal Home Loan Bank functions as a central reserve bank providing credit for its member financial institutions. As a member, we are required to own capital stock in the Federal Home Loan Bank and are authorized to apply for advances on the security of such stock and certain of our whole first mortgage loans and other assets (principally securities which are obligations of, or guaranteed by, the United States), provided certain standards related to creditworthiness have been met. Advances are made under several different programs, each having its own interest rate and range of maturities. Depending on the program, limitations on the amount of advances are based either on a fixed percentage of an institution’s net worth or on the Federal Home Loan Bank’s assessment of the institution’s creditworthiness. As of December 31, 2017, we had $299.4 million of available borrowing capacity with the Federal Home Loan Bank of Boston, including an available line of credit of $9.4 million at an interest rate that adjusts daily. All of our borrowings from the Federal Home Loan Bank are secured by investment securities and qualified collateral, including one- to four-family loans and multi-family and commercial real estate loans held in the Bank’s portfolio.
Financial Services
We exited the financial services industry effective December 31, 2017. Prior to that time, we offered customers a range of non-deposit financial products, including mutual funds, annuities, stocks and bonds which are offered and cleared by a third-party broker-dealer. We received a portion of the commissions generated by sales to our customers. We also offered customers long-term care insurance through a third-party insurance company, which generated commissions for us. Our non-deposit financial products generated $212,000, $255,000 and $373,000 of non-interest income during the years ended December 31, 2017, 2016 and 2015, respectively.
Personnel
As of December 31, 2017, we had 447 full-time and 91 part-time employees, none of whom is represented by a collective bargaining unit. We believe our working relationship with our employees is good.
Subsidiaries and Affiliates
The Bank’s subsidiaries include Prospect, Inc., which engages in securities transactions on its own behalf; and EBOSCO, LLC which holds foreclosed real estate; and East Boston Investment Services, Inc., which is authorized for third-party investment sales and is currently inactive.
Supervision and Regulation
General
The Bank is a Massachusetts-charted stock savings bank. The Bank’s deposits are insured up to applicable limits by the Federal Deposit Insurance Corporation and by the Depositors Insurance Fund for amounts in excess of the Federal Deposit Insurance Corporation insurance limits. The Bank is subject to extensive regulation by the Massachusetts Commissioner of Banks, as its chartering agency, and by the Federal Deposit Insurance Corporation, as its deposit insurer. The Bank is required to file reports with, and is periodically examined by, the Federal Deposit Insurance Corporation and the Massachusetts Commissioner of Banks concerning its activities
14
Table of Contents
and financial condition and must obtain regulatory approvals prior to entering into certain transactions, including, but not limited to, mergers with or acquisitions of other financial institutions. The Bank is a member of the Federal Home Loan Bank of Boston.
The regulation and supervision of the Bank establish a comprehensive framework of activities in which an institution can engage and is intended primarily for the protection of depositors and borrowers and, for purposes of the Federal Deposit Insurance Corporation, the protection of the insurance fund. The regulatory structure also gives the regulatory authorities extensive discretion in connection with their supervisory and enforcement activities and examination policies, including policies with respect to the classification of assets and the establishment of adequate loan loss reserves for regulatory purposes.
As a bank holding company, the Company is required to comply with the rules and regulations of the Federal Reserve Board. It is required to file certain reports with the Federal Reserve Board and is subject to examination by and the enforcement authority of the Federal Reserve Board. The Company is also subject to the rules and regulations of the Securities and Exchange Commission under the federal securities laws.
Any change in applicable laws or regulations, whether by the Massachusetts Commissioner of Banks, the Federal Deposit Insurance Corporation, the Federal Reserve Board, the Commonwealth of Massachusetts or Congress, could have a material adverse impact on the operations and financial performance of the Company and the Bank. In addition, the Company and the Bank will be affected by the monetary and fiscal policies of various agencies of the United States Government, including the Federal Reserve Board. In view of changing conditions in the national economy and in the money markets, it is impossible for management to accurately predict future changes in monetary policy or the effect of such changes on the business or financial condition of the Company and the Bank.
Set forth below is a brief description of material regulatory requirements that are or will be applicable to the Bank and the Company. The description is limited to certain material aspects of the statutes and regulations addressed, and is not intended to be a complete description of such statutes and regulations and their effects on the Bank and the Company.
Massachusetts Banking Laws and Supervision
The Bank, as a Massachusetts savings bank, is regulated and supervised by the Massachusetts Commissioner of Banks. The Massachusetts Commissioner of Banks is required to regularly examine each state-chartered bank. The approval of the Massachusetts Commissioner of Banks is required to establish or close branches, to merge with another bank, to issue stock or to undertake many other activities. Any Massachusetts bank that does not operate in accordance with the regulations, policies and directives of the Massachusetts Commissioner of Banks may be sanctioned. The Massachusetts Commissioner of Banks may suspend or remove directors or officers of a bank who have violated the law, conducted a bank’s business in a manner that is unsafe, unsound or contrary to the depositors’ interests, or been negligent in the performance of their duties. In addition, the Massachusetts Commissioner of Banks has the authority to appoint a receiver or conservator if it is determined that the bank is conducting its business in an unsafe or unauthorized manner, and under certain other circumstances.
In 2015, the Commonwealth of Massachusetts adopted a law modernizing the Massachusetts banking law, which affords Massachusetts chartered banks with greater flexibility.
The powers that Massachusetts-chartered savings banks can exercise under these laws include, but are not limited to, the following:
Lending Activities. A Massachusetts-chartered savings bank may make a wide variety of mortgage loans including fixed-rate loans, adjustable-rate loans, variable-rate loans, participation loans, graduated payment loans, construction and development loans, condominium and co-operative loans, second mortgage loans and other types of loans that may be made in accordance with applicable regulations. Commercial loans may be made to corporations and other commercial enterprises with or without security. Consumer and personal loans may also be made with or without security.
15
Table of Contents
Insurance Sales. Massachusetts banks may engage in insurance sales activities if the Massachusetts Commissioner of Banks has approved a plan of operation for insurance activities and the bank obtains a license from the Massachusetts Division of Insurance. A bank may be licensed directly or indirectly through an affiliate or a subsidiary corporation established for this purpose. Customers of the Bank are offered certain insurance products through a third party.
Investment Activities. In general, Massachusetts-chartered savings banks may invest in preferred and common stock of any corporation organized under the laws of the United States or any state provided such investments do not involve control of any corporation and do not, in the aggregate, exceed 4.0% of the bank’s deposits. Massachusetts-chartered savings banks may in addition invest an amount equal to 1.0% of their deposits in stocks of Massachusetts corporations or companies with substantial employment in the Commonwealth which have pledged to the Massachusetts Commissioner of Banks that such monies will be used for further development within the Commonwealth. At the present time, the Bank’s authority under Massachusetts law to invest in equity securities is constrained by federal law. See “—Federal Bank Regulation—Investment Activities” for such federal restrictions.
Dividends. A Massachusetts stock bank may declare from net profits cash dividends not more frequently than quarterly and non-cash dividends at any time. No dividends may be declared, credited or paid if the bank’s capital stock is impaired. A Massachusetts savings bank with outstanding preferred stock may not, without the prior approval of the Commissioner of Banks, declare dividends to the common stock without also declaring dividends to the preferred stock. The approval of the Massachusetts Commissioner of Banks is required if the total of all dividends declared in any calendar year exceeds the total of its net profits for that year combined with its retained net profits of the preceding two years, less any required transfer to surplus or a fund for the retirement of any preferred stock. Net profits for this purpose means the remainder of all earnings from current operations plus actual recoveries on loans and investments and other assets after deducting current operating expenses, actual losses, accrued dividends on preferred stock, if any, and all federal and state taxes.
Protection of Personal Information. Massachusetts has adopted regulatory requirements intended to protect personal information. The requirements, which are similar to existing federal laws such as the Gramm-Leach-Bliley Act, discussed below under “—Federal Bank Regulation—Privacy Regulations,” that require organizations to establish written information security programs to prevent identity theft. The Massachusetts regulation also contains technology system requirements, especially for the encryption of personal information sent over wireless or public networks or stored on portable devices.
Parity Regulation. A Massachusetts bank may, in accordance with Massachusetts law and regulations issued by the Massachusetts Commissioner of Banks, exercise any power and engage in any activity that has been authorized for national banks, federal thrifts or state banks in a state other than Massachusetts, provided that the activity is permissible under applicable federal law and not specifically prohibited by Massachusetts law. Such powers and activities must be subject to the same limitations and restrictions imposed on the national bank, federal thrift or out-of-state bank that exercised the power or activity. In some cases, a Massachusetts bank is required to submit advanced written notice to the Massachusetts Commissioner of Banks prior to engaging in certain activities authorized for national banks, federal thrifts or out-of-state banks.
Loans to One Borrower Limitations. Massachusetts banking law grants broad lending authority. However, with certain limited exceptions, total obligations of one borrower to a bank may not exceed 20.0% of the total of the bank’s capital, which is defined under Massachusetts law as the sum of the bank’s capital stock, surplus account and undivided profits.
Regulatory Enforcement Authority. Any Massachusetts bank that does not operate in accordance with the regulations, policies and directives of the Massachusetts Commissioner of Banks may be subject to sanctions for non-compliance, including seizure of the property and business of the Bank and suspension or revocation of its charter. The Massachusetts Commissioner of Banks may, under certain circumstances, suspend or remove officers or directors who have violated the law, conducted the Bank’s business in a manner which is unsafe, unsound or contrary to the depositors interests or been negligent in the performance of their duties. In addition, upon finding that a bank has engaged in an unfair or deceptive act or practice, the Massachusetts Commissioner of Banks may issue an order to cease and desist and impose a fine on the bank concerned. Massachusetts
16
Table of Contents
consumer protection and civil rights statutes applicable to the Bank permit private individual and class action law suits and provide for the rescission of consumer transactions, including loans, and the recovery of statutory and punitive damage and attorney’s fees in the case of certain violations of those statutes.
Depositors Insurance Fund. All Massachusetts-chartered savings banks are required to be members of the Depositors Insurance Fund, a corporation that insures savings bank deposits in excess of federal deposit insurance coverage. The Depositors Insurance Fund is authorized to charge savings banks a risk-based assessment on deposits balances in excess of the amounts insured by the Federal Deposit Insurance Corporation.
Massachusetts has other statutes and regulations that are similar to the federal provisions discussed below.
Federal Bank Regulation
Capital Requirements. Under applicable federal regulations, federally insured depository institutions, including state-chartered banks that are not members of the Federal Reserve System (“state non-member banks”), such as the Bank, are required to comply with minimum capital requirements. The regulations require insured depository institutions to meet several minimum capital standards: a common equity Tier 1 capital to risk-based assets ratio of 4.5%, a Tier 1 capital to risk-based assets ratio of 6.0%, a total capital to risk-based assets of 8.0%, and a 4.0% Tier 1 capital to total assets leverage ratio. The existing capital requirements were effective January 1, 2015 and are the result of a final rule implementing regulatory amendments based on recommendations of the Basel Committee on Banking Supervision and certain requirements of the Dodd-Frank Wall Street Reform and Consumer Protection Act of 2010 (the “Dodd-Frank Act”).
Common equity Tier 1 capital is generally defined as common stockholders’ equity and retained earnings. Tier 1 capital is generally defined as common equity Tier 1 and additional Tier 1 capital. Additional Tier 1 capital includes certain noncumulative perpetual preferred stock and related surplus and minority interests in equity accounts of consolidated subsidiaries. Total capital includes Tier 1 capital (common equity Tier 1 capital plus additional Tier 1 capital) and Tier 2 capital. Tier 2 capital is comprised of capital instruments and related surplus, meeting specified requirements, and may include cumulative preferred stock and long-term perpetual preferred stock, mandatory convertible securities, intermediate preferred stock and subordinated debt. Also included in Tier 2 capital is the allowance for loan and lease losses limited to a maximum of 1.25% of risk-weighted assets and, for institutions that have exercised a permanent opt-out election regarding the treatment of Accumulated Other Comprehensive Income (“AOCI”), up to 45% of net unrealized gains on available-for-sale equity securities with readily determinable fair market values. Institutions that have not exercised the AOCI opt-out have AOCI incorporated into common equity Tier 1 capital (including unrealized gains and losses on available-for-sale-securities). The Bank elected to exercise its option to opt-out. Calculation of all types of regulatory capital is subject to deductions and adjustments specified in the regulations.
In determining the amount of risk-weighted assets for purposes of calculating risk-based capital ratios, all assets, including certain off-balance sheet assets (recourse obligations, direct credit substitutes, residual interests) are multiplied by a risk weight factor assigned by the regulations based on the risks believed inherent in the type of asset. Higher levels of capital are required for asset categories believed to present greater risk. For example, a risk weight of 0% is assigned to cash and U.S. government securities, a risk weight of 50% is generally assigned to prudently underwritten first lien one- to four-family residential mortgages, a risk weight of 100% is assigned to commercial and consumer loans, a risk weight of 150% is assigned to certain past due loans and a risk weight of between 0% to 600% is assigned to permissible equity interests, depending on certain specified factors.
In addition to establishing the minimum regulatory capital requirements, the regulations limit capital distributions and certain discretionary bonus payments to management if the institution does not hold a “capital conservation buffer” consisting of 2.5% of common equity Tier 1 capital to risk-weighted assets above the amount necessary to meet its minimum risk-based capital requirements. The capital conservation buffer requirement is being phased in beginning January 1, 2016 at 0.625% of risk-weighted assets and increasing each year until fully implemented at 2.5% on January 1, 2019. For the 2017 calendar year, the capital conservation buffer was 1.25%. It increased to 1.875% on January 1, 2018.
The Federal Deposit Insurance Corporation Improvement Act required each federal banking agency to revise its risk-based capital standards for insured institutions to ensure that those standards take adequate account
17
Table of Contents
of interest-rate risk, concentration of credit risk and the risk of nontraditional activities, as well as to reflect the actual performance and expected risk of loss on multi-family residential loans. The Federal Deposit Insurance Corporation, along with the other federal banking agencies, has adopted a regulation providing that the agencies will take into account the exposure of a bank’s capital and economic value to changes in interest rate risk in assessing a bank’s capital adequacy. The Federal Deposit Insurance Corporation also has authority to establish individual minimum capital requirements in appropriate cases upon determination that an institution’s capital level is, or is likely to become, inadequate in light of the particular circumstances.
Standards for Safety and Soundness. As required by statute, the federal banking agencies adopted final regulations and Interagency Guidelines Establishing Standards for Safety and Soundness to implement safety and soundness standards. The guidelines set forth the safety and soundness standards that the federal banking agencies use to identify and address problems at insured depository institutions before capital becomes impaired. The guidelines address internal controls and information systems, internal audit system, credit underwriting, loan documentation, interest rate exposure, asset growth, asset quality, earnings and compensation, fees and benefits. Most recently, the agencies have established standards for safeguarding customer information. If the appropriate federal banking agency determines that an institution fails to meet any standard prescribed by the guidelines, the agency may require the institution to submit to the agency an acceptable plan to achieve compliance with the standard.
Investment Activities. All state-chartered Federal Deposit Insurance Corporation insured banks, including savings banks, are generally limited in their investment activities to principal and equity investments of the type and in the amount authorized for national banks, notwithstanding state law, subject to certain exceptions. For example, state chartered banks may, with Federal Deposit Insurance Corporation approval, continue to exercise state authority to invest in common or preferred stocks listed on a national securities exchange or the NASDAQ Global Market and in the shares of an investment company registered under the Investment Company Act of 1940, as amended. The maximum permissible investment is 100.0% of Tier 1 Capital, as specified by the Federal Deposit Insurance Corporation’s regulations, or the maximum amount permitted by Massachusetts law, whichever is less. The Bank received approval from the Federal Deposit Insurance Corporation to retain and acquire such equity instruments equal to the lesser of 100% of the Bank’s Tier 1 capital or the maximum permissible amount specified by Massachusetts law. Such grandfathered authority may be terminated under certain circumstances including a determination by the Federal Deposit Insurance Corporation that such investments pose a safety and soundness risk.
In addition, the Federal Deposit Insurance Corporation is authorized to permit such a state bank to engage in state-authorized activities or investments not permissible for national banks (other than non-subsidiary equity investments) if it meets all applicable capital requirements and it is determined that such activities or investments do not pose a significant risk to the Deposit Insurance Fund. The Federal Deposit Insurance Corporation has adopted procedures for institutions seeking approval to engage in such activities or investments. In addition, a nonmember bank may control a subsidiary that engages in activities as principal that would only be permitted for a national bank to conduct in a “financial subsidiary” if a bank meets specified conditions and deducts its investment in the subsidiary for regulatory capital purposes.
Interstate Banking and Branching. Federal law permits well capitalized and well managed bank holding companies to acquire banks in any state, subject to Federal Reserve Board approval, certain concentration limits and other specified conditions. Interstate mergers of banks are also authorized, subject to regulatory approval and other specified conditions. In addition, banks are permitted to establish de novo branches on an interstate basis to the extent that branching is authorized by the law of the host state for the banks chartered by that state.
Prompt Corrective Regulatory Action. Federal law requires, among other things, that federal bank regulatory authorities take “prompt corrective action” with respect to banks that do not meet minimum capital requirements. For these purpose, the law establishes five capital categories: well capitalized, adequately capitalized, undercapitalized, significantly undercapitalized and critically undercapitalized.
The Federal Deposit Insurance Corporation has adopted regulations to implement the prompt corrective action legislation. Effective January 1, 2015, an institution is deemed to be “well capitalized” if it has a total risk-based capital ratio of 10.0% or greater, a Tier 1 risk-based capital ratio of 8.0% or greater, a leverage ratio of
18
Table of Contents
5.0% or greater and a common equity Tier 1 ratio of 6.5% or greater. An institution is “adequately capitalized” if it has a total risk-based capital ratio of 8.0% or greater, a Tier 1 risk-based capital ratio of 6.0% or greater, a leverage ratio of 4.0% or greater, and a common equity Tier 1 ratio of 4.5% or greater. An institution is “undercapitalized” if it has a total risk-based capital ratio of less than 8.0%, a Tier 1 risk-based capital ratio of less than 6.0%, a leverage ratio of less than 4.0%, or a common equity Tier 1 ratio of less than 4.5%. An institution is deemed to be “significantly undercapitalized” if it has a total risk-based capital ratio of less than 6.0%, a Tier 1 risk-based capital ratio of less than 4.0%, a leverage ratio of less than 3.0% or a common equity Tier 1 ratio of less than 3%. An institution is considered to be “critically undercapitalized” if it has a ratio of tangible equity (as defined in the regulations) to total assets that is equal to or less than 2.0%. As of December 31, 2017, the Bank was classified as a “well capitalized” institution.
“Undercapitalized” banks must adhere to growth, capital distribution (including dividend) and other limitations and are required to submit a capital restoration plan. A bank’s compliance with such a plan is required to be guaranteed by any company that controls the undercapitalized institution in an amount equal to the lesser of 5.0% of the institution’s total assets when deemed undercapitalized or the amount necessary to achieve the status of adequately capitalized. If an “undercapitalized” bank fails to submit an acceptable plan, it is treated as if it is “significantly undercapitalized.” “Significantly undercapitalized” banks must comply with one or more of a number of additional restrictions, including but not limited to an order by the Federal Deposit Insurance Corporation to sell sufficient voting stock to become adequately capitalized, requirements to reduce total assets, cease receipt of deposits from correspondent banks or dismiss directors or officers, and restrictions on interest rates paid on deposits, compensation of executive officers and capital distributions by the parent holding company. “Critically undercapitalized” institutions are subject to additional measures including, subject to a narrow exception, the appointment of a receiver or conservator within 270 days after it obtains such status.
Transactions with Affiliates and Regulation W of the Federal Reserve Regulations. Transactions between banks and their affiliates are governed by federal law. An affiliate of a bank is any company or entity that controls, is controlled by or is under common control with the bank. In a holding company context, the parent bank holding company and any companies which are controlled by such parent holding company are affiliates of the bank (although subsidiaries of the bank itself, except financial subsidiaries, are generally not considered affiliates). Generally, Section 23A of the Federal Reserve Act and the Federal Reserve Board’s Regulation W limits the extent to which the bank or its subsidiaries may engage in “covered transactions” with any one affiliate to an amount equal to 10.0% of such institution’s capital stock and surplus, and with all such transactions with all affiliates to an amount equal to 20.0% of such institution’s capital stock and surplus. Section 23B applies to “covered transactions” as well as to certain other transactions and requires that all such transactions be on terms substantially the same, or at least as favorable, to the institution or subsidiary as those provided to a non-affiliate. The term “covered transaction” includes the making of loans, purchase of assets from, and issuance of a guarantee to an affiliate, and other similar transactions. Section 23B transactions also include the provision of services and the sale of assets by a bank to an affiliate. In addition, loans or other extensions of credit by the financial institution to the affiliate are required to be collateralized in accordance with the requirements set forth in Section 23A of the Federal Reserve Act.
Sections 22(h) and (g) of the Federal Reserve Act and the Federal Reserve Bank’s Regulation O place restrictions on loans to a bank’s insiders, i.e., executive officers, directors and principal stockholders. Under Regulation O, loans to a director, executive officer and to a greater than 10.0% stockholder of a financial institution, and certain of their affiliated interests, together with all other outstanding loans to such person and affiliated interests, may not exceed specified limits. Regulation O also requires that, subject to an exception for certain bank-wide employee programs, loans to directors, executive officers and principal stockholders be made on terms and conditions substantially the same as offered in comparable transactions to persons who are not insiders. Regulation O also requires prior board approval for certain loans. In addition, the aggregate amount of extensions of credit by a financial institution to insiders cannot exceed the institution’s unimpaired capital and surplus. Additional restrictions apply to loans to executive officers.
Enforcement. The Federal Deposit Insurance Corporation has extensive enforcement authority over insured state savings banks, including the Bank. The enforcement authority includes, among other things, the ability to assess civil money penalties, issue cease and desist orders and remove directors and officers. In general, these
19
Table of Contents
enforcement actions may be initiated in response to violations of laws and regulations, breaches of fiduciary duty and unsafe or unsound practices. The Federal Deposit Insurance Corporation is required, with certain exceptions, to appoint a receiver or conservator for an insured state non-member bank if that bank was “critically undercapitalized” on average during the calendar quarter beginning 270 days after the date on which the institution became “critically undercapitalized.” The Federal Deposit Insurance Corporation may also appoint itself as conservator or receiver for an insured state non-member bank under specified circumstances, including: (1) insolvency; (2) substantial dissipation of assets or earnings through violations of law or unsafe or unsound practices; (3) existence of an unsafe or unsound condition to transact business; (4) insufficient capital; or (5) the incurrence of losses that will deplete substantially all of the institution’s capital with no reasonable prospect of replenishment without federal assistance.
Federal Insurance of Deposit Accounts. The Bank is a member of the Deposit Insurance Fund, which is administered by the Federal Deposit Insurance Corporation. Deposit accounts in the Bank are insured up to a maximum of $250,000 for each separately insured depositor.
The Federal Deposit Insurance Corporation imposes deposit insurance assessments. Under the Federal Deposit Insurance Corporation’s risk-based assessment system, insured institutions were initially assigned to risk categories based on supervisory evaluations, regulatory capital levels and certain other factors. An institution’s assessment rate depended upon the category to which it is assigned and certain adjustments specified by Federal Deposit Insurance Corporation regulations, with less risky institutions paying lower rates. Assessment rates (inclusive of possible adjustments) ranged from 2 1/2 to 45 basis points of each institution’s total assets less tangible capital. The Federal Deposit Insurance Corporation’s current system represents a change, required by the Dodd-Frank Act, from its prior practice of basing the assessment on an institution’s volume of deposits.
Effective July 1, 2016, the FDIC adopted changes that eliminated the risk categories. Assessments for most institutions are now based on financial measures and supervisory ratings derived from statistical modeling estimating the probability of failure within three years. In conjunction with the Deposit Insurance Fund reserve ratio achieving 1.15%, the assessment range (inclusive of possible adjustments) was reduced for institutions of less than $10 billion in total assets to 1.5 basis points to 30 basis points, also effective July 1, 2016. The Dodd-Frank Act specifies that banks of greater than $10 billion in assets be required to bear the burden of raising the reserve ratio from 1.15% to 1.35%. Such institutions are subject to an annual surcharge of 4.5 basis points of total assets exceeding $10 billion. This surcharge will remain in place until the earlier of the Deposit Insurance Fund reaching the 1.35% ratio or December 31, 2018, at which point a shortfall assessment would be applied. The FDIC, exercising discretion provided to it by the Dodd-Frank Act, has established a long-term goal of achieving a 2% reverse ratio for the Deposit Insurance Fund.
The Federal Deposit Insurance Corporation has authority to increase insurance assessments. A significant increase in insurance premiums would likely have an adverse effect on the operating expenses and results of operations of the Bank. Future insurance assessment rates cannot be predicted.
Insurance of deposits may be terminated by the Federal Deposit Insurance Corporation upon a finding that the institution has engaged in unsafe or unsound practices, is in an unsafe or unsound condition to continue operations or has violated any applicable law, regulation, rule order or regulatory condition imposed in writing. We do not know of any practice, condition or violation that might lead to termination of deposit insurance.
In addition to the Federal Deposit Insurance Corporation assessments, the Financing Corporation (“FICO”) is authorized to impose and collect, with the approval of the Federal Deposit Insurance Corporation, assessments for anticipated payments, issuance costs and custodial fees on bonds issued by the FICO in the 1980s to recapitalize the former Federal Savings and Loan Insurance Corporation. The bonds issued by the FICO are due to mature in 2017 through 2019. For the quarter ended December 31, 2017, the annualized FICO assessment was equal to 0.54 basis points of total assets less tangible capital.
Privacy Regulations. Federal Deposit Insurance Corporation regulations generally require that the Bank disclose its privacy policy, including identifying with whom it shares a customer’s “non-public personal information,” to customers at the time of establishing the customer relationship and annually thereafter. In addition, the Bank is required to provide its customers with the ability to “opt-out” of having their personal
20
Table of Contents
information shared with unaffiliated third parties and not to disclose account numbers or access codes to non-affiliated third parties for marketing purposes. The Bank currently has a privacy protection policy in place and believes that such policy is in compliance with the regulations.
Community Reinvestment Act. Under the Community Reinvestment Act, or CRA, as implemented by Federal Deposit Insurance Corporation regulations, a non-member bank has a continuing and affirmative obligation, consistent with its safe and sound operation, to help meet the credit needs of its entire community, including low and moderate income neighborhoods. The CRA does not establish specific lending requirements or programs for financial institutions nor does it limit an institution’s discretion to develop the types of products and services that it believes are best suited to its particular community, consistent with the CRA. The CRA does require the Federal Deposit Insurance Corporation, in connection with its examination of a non-member bank, to assess the institution’s record of meeting the credit needs of its community and to take such record into account in its evaluation of certain applications by such institution, including applications to acquire branches and other financial institutions. The CRA requires the Federal Deposit Insurance Corporation to provide a written evaluation of an institution’s CRA performance utilizing a four-tiered descriptive rating system. The Bank’s latest Federal Deposit Insurance Corporation CRA rating was “Satisfactory.”
Massachusetts has its own statutory counterpart to the CRA which is also applicable to the Bank. The Massachusetts version is generally similar to the CRA but utilizes a five-tiered descriptive rating system. Massachusetts law requires the Massachusetts Commissioner of Banks to consider, but not be limited to, a bank’s record of performance under Massachusetts law in considering any application by the bank to establish a branch or other deposit-taking facility, to relocate an office or to merge or consolidate with or acquire the assets and assume the liabilities of any other banking institution. The Bank’s most recent rating under Massachusetts law was “Satisfactory.”
Consumer Protection and Fair Lending Regulations. Massachusetts savings banks are subject to a variety of federal and Massachusetts statutes and regulations that are intended to protect consumers and prohibit discrimination in the granting of credit. These statutes and regulations provide for a range of sanctions for non-compliance with their terms, including imposition of administrative fines and remedial orders, and referral to the Attorney General for prosecution of a civil action for actual and punitive damages and injunctive relief. Certain of these statutes authorize private individual and class action lawsuits and the award of actual, statutory and punitive damages and attorneys’ fees for certain types of violations.
USA Patriot Act. The Bank is subject to the USA PATRIOT Act, which gave federal agencies additional powers to address terrorist threats through enhanced domestic security measures, expanded surveillance powers, increased information sharing, and broadened anti-money laundering requirements. By way of amendments to the Bank Secrecy Act, Title III of the USA PATRIOT Act provided measures intended to encourage information sharing among bank regulatory agencies and law enforcement bodies. Further, certain provisions of Title III impose affirmative obligations on a broad range of financial institutions, including banks, thrifts, brokers, dealers, credit unions, money transfer agents, and parties registered under the Commodity Exchange Act.
Other Regulations
Interest and other charges collected or contracted for by the Bank are subject to state usury laws and federal laws concerning interest rates. Loan operations are also subject to state and federal laws applicable to credit transactions, such as the:
| • | Home Mortgage Disclosure Act of 1975, requiring financial institutions to provide information to enable the public and public officials to determine whether a financial institution is fulfilling its obligation to help meet the housing needs of the community it serves; |
| • | Equal Credit Opportunity Act, prohibiting discrimination on the basis of race, creed or other prohibited factors in extending credit; |
| • | Fair Credit Reporting Act of 1978, governing the use and provision of information to credit reporting agencies; |
21
Table of Contents
| • | Massachusetts Debt Collection Regulations, establishing standards, by defining unfair or deceptive acts or practices, for the collection of debts from persons within the Commonwealth of Massachusetts and the General Laws of Massachusetts, Chapter 167E, which governs the Bank’s lending powers; and |
| • | Rules and regulations of the various federal and state agencies charged with the responsibility of implementing such federal and state laws. |
The deposit operations of the Bank also are subject to, among others, the:
| • | Right to Financial Privacy Act, which imposes a duty to maintain confidentiality of consumer financial records and prescribes procedures for complying with administrative subpoenas of financial records; |
| • | Check Clearing for the 21st Century Act (also known as “Check 21”), which gives “substitute checks,” such as digital check images and copies made from that image, the same legal standing as the original paper check; |
| • | Electronic Funds Transfer Act and Regulation E promulgated thereunder, and, as to East Boston Savings Bank Chapter 167B of the General Laws of Massachusetts, which govern automatic deposits to and withdrawals from deposit accounts and customers’ rights and liabilities arising from the use of automated teller machines and other electronic banking services; and |
| • | General Laws of Massachusetts, Chapter 167D, which governs the Bank’s deposit powers. |
Federal Reserve System
The Federal Reserve Board regulations require depository institutions to maintain reserves against their transaction accounts (primarily NOW and regular checking accounts). The Federal Reserve Board regulations generally require for 2018 that reserves be maintained against aggregate transaction accounts as follows: for that portion of transaction accounts aggregating $122.3 million or less (which may be adjusted by the Federal Reserve Board) the reserve requirement is 3.0% and the amounts greater than $122.3 million require a 10.0% reserve (which may be adjusted annually by the Federal Reserve Board between 8.0% and 14.0%). The first $16.0 million of otherwise reservable balances (which may be adjusted by the Federal Reserve Board) are exempted from the reserve requirements. These amounts are increased from the 2017 threshold of $115.1 million and the exception of $15.5 million. The Bank is in compliance with these requirements.
Federal Home Loan Bank System
The Bank is a member of the Federal Home Loan Bank System, which consists of 11 regional Federal Home Loan Banks. The Federal Home Loan Bank provides a central credit facility primarily for member institutions. Members of the Federal Home Loan Bank are required to acquire and hold shares of capital stock in the Federal Home Loan Bank. The Bank was in compliance with this requirement at December 31, 2017. Based on redemption provisions of the Federal Home Loan Bank of Boston, the stock has no quoted market value and is carried at cost. The Bank reviews for impairment based on the ultimate recoverability of the cost basis of the Federal Home Loan Bank of Boston stock. As of December 31, 2017, no impairment has been recognized.
At its discretion, the Federal Home Loan Bank of Boston may declare dividends on the stock. The Federal Home Loan Banks are required to provide funds for certain purposes including the resolution of insolvent thrifts in the late 1980s and to contributing funds for affordable housing programs. These requirements could reduce the amount of dividends that the Federal Home Loan Banks pay to their members and result in the Federal Home Loan Banks imposing a higher rate of interest on advances to their members. As a result of losses incurred, the Federal Home Loan Bank of Boston suspended and did not pay dividends in 2009 and 2010. However, the Federal Home Loan Bank of Boston resumed payment of quarterly dividends in 2011 and, for 2017, paid dividends with an annual yield of 4.14%. There can be no assurance that such dividends will continue in the future. Further, there can be no assurance that the impact of recent or future legislation on the Federal Home Loan Banks also will not cause a decrease in the value of the Federal Home Loan Bank of Boston stock held by the Bank.
22
Table of Contents
Holding Company
The Company is subject to examination, regulation, and periodic reporting under the Bank Holding Company Act of 1956, as amended, as administered by the Federal Reserve Board. The Company is required to obtain the prior approval of the Federal Reserve Board to acquire all, or substantially all, of the assets of any bank or bank holding company. Prior Federal Reserve Board approval is required for the Company to acquire direct or indirect ownership or control of any voting securities of any bank or bank holding company if, after such acquisition, it would, directly or indirectly, own or control more than 5% of any class of voting shares of the bank or bank holding company. In addition to the approval of the Federal Reserve Board, prior approval may also be necessary from other agencies having supervisory jurisdiction over the bank to be acquired before any bank acquisition can be completed.
A bank holding company is generally prohibited from engaging in non-banking activities, or acquiring direct or indirect control of more than 5% of the voting securities of any company engaged in non-banking activities. One of the principal exceptions to this prohibition is for activities found by the Federal Reserve Board to be so closely related to banking or managing or controlling banks as to be a proper incident thereto. Some of the principal activities that the Federal Reserve Board has determined by regulation to be so closely related to banking are: (i) making or servicing loans; (ii) performing certain data processing services; (iii) providing discount brokerage services; (iv) acting as fiduciary, investment or financial advisor; (v) leasing personal or real property; (vi) making investments in corporations or projects designed primarily to promote community welfare; and (vii) acquiring a savings and loan association whose direct and indirect activities are limited to those permitted for bank holding companies.
The Gramm-Leach-Bliley Act of 1999 authorized a bank holding company that meets specified conditions, including being “well capitalized” and “well managed,” to opt to become a “financial holding company” and thereby engage in a broader array of financial activities than previously permitted. Such activities can include insurance underwriting and investment banking.
The Company is subject to the Federal Reserve Board’s capital adequacy requirements for bank holding companies. The Dodd-Frank Act required the Federal Reserve Board to promulgate consolidated capital requirements for depository institution holding companies that are no less stringent, both quantitatively and in terms of components of capital, than those applicable to institutions themselves. The previously discussed final rule regarding regulatory capital requirements implemented the Dodd-Frank Act as to bank holding company capital standards. Consolidated regulatory capital requirements identical to those applicable to the subsidiary banks applied to bank holding companies (with greater than $1 billion of assets) as of January 1, 2015. As is the case with institutions themselves, the capital conservation buffer is being phased in between 2016 and 2019. The Company was in compliance with the consolidated capital requirements as of December 31, 2017.
A bank holding company is generally required to give the Federal Reserve Board prior written notice of any purchase or redemption of then outstanding equity securities if the gross consideration for the purchase or redemption, when combined with the net consideration paid for all such purchases or redemptions during the preceding 12 months, is equal to 10% or more of the company’s consolidated net worth. The Federal Reserve Board may disapprove such a purchase or redemption if it determines that the proposal would constitute an unsafe and unsound practice, or would violate any law, regulation, Federal Reserve Board order or directive, or any condition imposed by, or written agreement with, the Federal Reserve Board. There is an exception to this approval requirement for well-capitalized bank holding companies that meet certain other conditions.
The Federal Reserve Board has issued a policy statement regarding capital distributions, including dividends, by bank holding companies. In general, the Federal Reserve Board’s policies provide that dividends should be paid only out of current earnings and only if the prospective rate of earnings retention by the bank holding company appears consistent with the organization’s capital needs, asset quality and overall financial condition. The Federal Reserve Board’s policies also require that a bank holding company serve as a source of financial strength to its subsidiary banks by standing ready to use available resources to provide adequate capital funds to those banks during periods of financial stress or adversity and by maintaining the financial flexibility and capital-raising capacity to obtain additional resources for assisting its subsidiary banks where necessary. The Dodd-Frank Act codified the source of strength doctrine. Under the prompt corrective action laws, the ability of a
23
Table of Contents
bank holding company to pay dividends may be restricted if a subsidiary bank becomes undercapitalized. In addition, the Federal Reserve Board has issued guidance which requires consultation with the agency prior to a bank holding company’s payment of dividends or repurchase of its stock under certain circumstances. These regulatory policies could affect the ability of the Company to pay dividends, repurchase its stock or otherwise engage in capital distributions.
Under the Federal Deposit Insurance Act, depository institutions are liable to the Federal Deposit Insurance Corporation for losses suffered or anticipated by the Federal Deposit Insurance Corporation in connection with the default of a commonly controlled depository institution or any assistance provided by the Federal Deposit Insurance Corporation to such an institution in danger of default.
The status of the Company as a registered bank holding company under the Bank Holding Company Act does not exempt it from certain federal and state laws and regulations applicable to corporations generally, including, without limitation, certain provisions of the federal securities laws.
Massachusetts Holding Company Regulation. Under the Massachusetts banking laws, a company owning or controlling two or more banking institutions, including a savings bank, is regulated as a bank holding company. The term “company” is defined by the Massachusetts banking laws similarly to the definition of “company” under the Bank Holding Company Act. Each Massachusetts bank holding company: (i) must obtain the approval of the Massachusetts Board of Bank Incorporation before engaging in certain transactions, such as the acquisition of more than 5% of the voting stock of another banking institution; (ii) must register, and file reports, with the Massachusetts Commissioner of Banks; and (iii) is subject to examination by the Massachusetts Commissioner of Banks.
Federal Securities Laws
The Company’s common stock is registered with the Securities and Exchange Commission under Section 12(b) of the Securities Exchange Act of 1934 (the “Exchange Act”). We are subject to the information, proxy solicitation, insider trading restrictions and other requirements under the Exchange Act.
Sarbanes-Oxley Act of 2002
The Sarbanes-Oxley Act of 2002 is intended to improve corporate responsibility, to provide for enhanced penalties for accounting and auditing improprieties at publicly traded companies and to protect investors by improving the accuracy and reliability of corporate disclosures pursuant to the securities laws. We have policies, procedures and systems designed to comply with these regulations, and we review and document such policies, procedures and systems to ensure continued compliance with these regulations.
Change in Control Regulations
Under the Change in Bank Control Act, no person, or group of persons acting in concert, may acquire control of a bank holding company such as the Company unless the Federal Reserve Board has been given 60 days’ prior written notice and not disapproved the proposed acquisition. The Federal Reserve Board considers several factors in evaluating a notice, including the financial and managerial resources of the acquirer and competitive effects. Control, as defined under the applicable regulations, means the power, directly or indirectly, to direct the management or policies of the company or to vote 25% or more of any class of voting securities of the company. Acquisition of more than 10% of any class of a bank holding company’s voting securities constitutes a rebuttable presumption of control under certain circumstances, including where the issuer has registered securities under Section 12 of the Exchange Act.
In addition, federal regulations provide that no company may acquire control (as defined in the Bank Holding Company Act) of a bank holding company without the prior approval of the Federal Reserve Board. Any company that acquires such control becomes a “bank holding company” subject to registration, examination and regulation by the Federal Reserve Board.
24
Table of Contents
Taxation
The Company and the Bank are subject to federal and state income taxation in the same general manner as other corporations, with some exceptions discussed below. The following discussion of federal and state taxation is intended only to summarize certain pertinent tax matters and is not a comprehensive description of the tax rules applicable to the Company and the Bank.
Federal Taxation
General. The Company reports its income on a calendar year basis using the accrual method of accounting. The federal income tax laws apply to the Company in the same manner as to other corporations with some exceptions, including the reserve for bad debts discussed below. The Company’s federal income tax returns have been either audited or closed under the statute of limitations through December 31, 2013. For its 2017 tax year, the Bank’s maximum federal income tax rate was 35%. With the enactment of the Tax Cuts and Jobs Act (the “Tax Act”) on December 22, 2017, the Company’s federal income tax rate will be reduced to 21% beginning January 1, 2018. As a result of the Tax Act, the Company incurred a $7.1 million charge in 2017 related to the revaluation of its net deferred tax asset.
Bad Debt Reserves. For taxable years beginning before January 1, 1996, thrift institutions that qualified under certain definitional tests and other conditions of the Internal Revenue Code were permitted to use certain favorable provisions to calculate their deductions from taxable income for annual additions to their bad debt reserve. A reserve could be established for bad debts on qualifying real property loans, generally secured by interests in real property improved or to be improved, under the percentage of taxable income method or the experience method. The reserve for non-qualifying loans was computed using the experience method. Federal legislation enacted in 1996 repealed the reserve method of accounting for bad debts and the percentage of taxable income method for tax years beginning after 1995 and required savings institutions to recapture or take into income certain portions of their accumulated bad debt reserves. However, those bad debt reserves accumulated prior to 1988 (“Base Year Reserves”) were not required to be recaptured unless the savings institution failed certain tests. At December 31, 2017, $9.8 million of the Bank’s accumulated bad debt reserves would not be recaptured into taxable income unless the Bank makes a “non-dividend distribution” to the Company as described below.
Distributions. If the Bank makes “non-dividend distributions” to the Company, the distributions will be considered to have been made from the Bank’s un-recaptured tax bad debt reserves, including the balance of its Base Year Reserves as of December 31, 1987, to the extent of the “non-dividend distributions,” and then from the Bank’s supplemental reserve for losses on loans, to the extent of those reserves, and an amount based on the amount distributed, but not more than the amount of those reserves, will be included in the Bank’s taxable income. Non-dividend distributions include distributions in excess of the Bank’s current and accumulated earnings and profits, as calculated for federal income tax purposes, distributions in redemption of stock and distributions in partial or complete liquidation. Dividends paid out of the Bank’s current or accumulated earnings and profits will not be so included in the Company’s taxable income.
The amount of additional taxable income triggered by a non-dividend is an amount that, when reduced by the tax attributable to the income, is equal to the amount of the distribution. Therefore, if the Bank makes a non-dividend distribution to the Company, approximately one and one-half times the amount of the distribution not in excess of the amount of the reserves would be includable in income for federal income tax purposes, assuming a 35% federal corporate income tax rate. With a 21% federal corporate income tax rate for years after 2017, approximately one and one-third times the amount of the distribution would be includable in income for federal tax purposes. The Bank does not intend to pay dividends that would result in a recapture of any portion of its bad debt reserves.
State Taxation. Financial institutions in Massachusetts are generally required to file combined income tax returns. The Massachusetts excise tax rate for savings banks is 9.0% of federal taxable income, adjusted for certain items. Taxable income includes gross income as defined under the Internal Revenue Code, plus interest from bonds, notes and evidences of indebtedness of any state, including Massachusetts, less deductions, but not the credits, allowable under the provisions of the Internal Revenue Code, except for those deductions relating to
25
Table of Contents
dividends received and income or franchise taxes imposed by a state or political subdivision. Carryforwards and carrybacks of net operating losses and capital losses are not allowed. The Company’s state tax returns, as well as those of its subsidiaries, are not currently under audit.
A financial institution or business corporation is generally entitled to special tax treatment as a “security corporation” under Massachusetts law provided that: (a) its activities are limited to buying, selling, dealing in or holding securities on its own behalf and not as a broker; and (b) it has applied for, and received, classification as a “security corporation” by the Commissioner of the Massachusetts Department of Revenue. A security corporation that is also a bank holding company under the Internal Revenue Code must pay a tax equal to 0.33% of its gross income. A security corporation that is not a bank holding company under the Internal Revenue Code must pay a tax equal to 1.32% of its gross income. Prospect, Inc. is qualified as a security corporation. As such, it has received security corporation classification by the Massachusetts Department of Revenue; and does not conduct any activities deemed impermissible under the governing statutes and the various regulations, directives, letter rulings and administrative pronouncements issued by the Massachusetts Department of Revenue.
26
Table of Contents
| ITEM 1A. | RISK FACTORS |
An investment in our securities is subject to risks inherent in our business and the industry in which we operate. Before making an investment decision, you should carefully consider the risks and uncertainties described below and all other information included in this Annual Report on Form 10-K. The risks described below may adversely affect our business, financial condition and operating results. In addition to these risks and the other risks and uncertainties described in Forward Looking Statements and Item 7, “Management’s Discussion and Analysis of Financial Condition and Results of Operations,” there may be additional risks and uncertainties that are not currently known to us or that we currently deem to be immaterial that could materially and adversely affect our business, financial condition or operating results. The value or market price of our securities could decline due to any of these identified or other risks. Past financial performance may not be a reliable indicator of future performance, and historical trends should not be used to anticipate results or trends in future periods.
A worsening of economic conditions could result in increases in our level of non-performing loans and/or reduce demand for our products and services, which could have adverse effect on our results of operations.
Unlike larger financial institutions that are more geographically diversified, our profitability depends on the general economic conditions in the Boston metropolitan area. Local economic conditions have a significant impact on our commercial real estate and construction and consumer loans, the ability of the borrowers to repay these loans and the value of the collateral securing these loans. Almost all of our loans are to borrowers located in the greater Boston metropolitan area or secured by collateral located in the greater Boston metropolitan area.
A deterioration in economic conditions or a prolonged delay in economic recovery in the market areas we serve, in particular the greater Boston metropolitan area, could result in the following consequences, any of which could have a material adverse effect on our business, financial condition, liquidity and results of operations:
| • | demand for our products and services may decline; |
| • | loan delinquencies, problem assets and foreclosures may increase; |
| • | collateral for loans, especially real estate, may decline further in value, in turn reducing customers’ borrowing power, reducing the value of assets and collateral associated with existing loans; |
| • | rental rates may decline reducing the borrower’s cash flow, which may impact their ability to honor their commitments to us; |
| • | the value of our securities portfolio may decline; |
| • | the net worth and liquidity of loan guarantors may decline, impairing their ability to honor commitments to us; and/or |
| • | the amount of our low-cost or non-interest-bearing deposits may decrease. |
Moreover, a significant decline in general economic conditions, caused by inflation, recession, acts of terrorism, an outbreak of hostilities or other international or domestic calamities, unemployment or other factors beyond our control could further impact these local economic conditions and could further negatively affect the financial results of our banking operations. In addition, deflationary pressures, while possibly lowering our operating costs, could have a significant negative effect on our borrowers, especially our business borrowers, and the values of underlying collateral securing loans, which could negatively affect our financial performance.
Changes in interest rates could hurt our profits.
Our profitability, like most financial institutions, depends to a large extent upon our net interest income, which is the difference between our interest income on interest-earning assets, such as loans and securities, and our interest expense on interest-bearing liabilities, such as deposits and borrowed funds. Accordingly, our results of operations depend largely on movements in market interest rates and our ability to manage our interest-rate-sensitive assets and liabilities in response to these movements. Factors such as inflation, recession and instability in financial markets, among other factors beyond our control, may affect interest rates.
27
Table of Contents
If interest rates rise, and if rates on our deposits reprice upwards faster than the rates on our long-term loans and investments, we would experience compression of our interest rate spread, which would have a negative effect on our profitability. Conversely, decreases in interest rates can result in increased prepayments of loans and mortgage-related securities, as borrowers refinance to reduce their borrowing costs. Under these circumstances, we are subject to reinvestment risk as we may have to redeploy such loan or securities proceeds into lower-yielding assets, which might also negatively impact our income.
Any substantial, unexpected, prolonged change in market interest rates could have a material adverse effect on our financial condition, liquidity and results of operations. Further, a prolonged period of exceptionally low market interest rates, such as we are currently experiencing, limits our ability to lower our interest expense, while the average yield on our interest-earning assets may continue to decrease as our loans reprice or are originated at these low market rates. Accordingly, our net interest income may continue to decrease, which would have an adverse effect on our profitability. Also, our interest rate risk modeling techniques and assumptions likely may not fully predict or capture the impact of actual interest rate changes on our balance sheet or projected operating results.
While we pursue an asset/liability strategy designed to mitigate our risk from changes in interest rates, changes in interest rates can still have a material adverse effect on our financial condition and results of operations. Changes in the level of interest rates also may negatively affect our ability to originate real estate loans, the value of our assets and our ability to realize gains from the sale of our assets, all of which ultimately affect our earnings. For further discussion of how changes in interest rates could impact us, see “Management’s Discussion and Analysis of Results of Operations and Financial Condition — Risk Management — Interest Rate Risk Management.”
We may be adversely affected by recent changes in U.S. tax laws.
The Tax Cuts and Jobs Act, which was enacted in December 2017, is likely to have both positive and negative effects on our financial performance. For example, the new legislation will result in a reduction in our federal corporate tax rate from 35% to 21% beginning in 2018, which will have a favorable impact on our earnings and capital generation abilities. However, the new legislation also enacted limitations on certain deductions that will have an impact on the banking industry, borrowers and the market for single-family residential real estate. These limitations include (i) a lower limit on the deductibility of mortgage interest on single-family residential mortgage loans, (ii) the elimination of interest deductions for home equity loans, (iii) a limitation on the deductibility of business interest expense and (iv) a limitation on the deductibility of property taxes and state and local income taxes. In addition, as a result of the lower corporate tax rate, we were required under U.S. generally accepted accounting principles to record a charge to tax expense due to remeasurement in the fourth quarter of 2017 with respect to our net deferred tax asset amounting to $7.1 million. The recent changes in the tax laws may have an adverse effect on the market for, and valuation of, residential properties, and on the demand for such loans in the future, and could make it harder for borrowers to make their loan payments. In addition, these recent changes may also have a disproportionate effect on taxpayers in states with high residential home prices and high state and local taxes, such as Massachusetts. If home ownership becomes less attractive, demand for mortgage loans could decrease. The value of the properties securing loans in our loan portfolio may be adversely impacted as a result of the changing economics of home ownership, which could require an increase in our provision for loan losses, which would reduce our profitability and could materially adversely affect our business, financial condition and results of operations.
Our commercial real estate, multi-family, commercial and industrial, and construction lending involves risks that could adversely affect our financial condition and results of operations.
In recent years, we have focused on shifting our asset mix from increases in the one- to four-family residential loan portfolio to increases in commercial real estate, multi-family, commercial and industrial, and construction loans. As of December 31, 2017, our commercial real estate, multi-family, commercial and industrial, and construction loans totaled $4.010 billion or 85.8% of our loan portfolio. As a result, our credit risk profile is higher than traditional savings institutions that have higher concentrations of one- to four-family residential loans. Also, these types of commercial lending activities, while potentially more profitable than one-to
28
Table of Contents
four-family residential lending, are generally more sensitive to regional and local economic conditions, making loss levels more difficult to predict. Collateral evaluation and financial statement analysis in these types of loans requires a more detailed analysis at the time of loan underwriting and on an ongoing basis. A decline in real estate values would reduce the value of the real estate collateral securing our loans and increase the risk that we would incur losses if borrowers defaulted on their loans. In addition, the repayment of commercial real estate and multi-family loans generally is dependent, in large part, on the successful operation of the property securing the loan or the business conducted on the property securing the loan. In addition, loan balances for commercial real estate, multi-family and construction loans are typically larger than those for single-family and consumer loans. Accordingly, when there are defaults and losses on these types of loans, they are often larger on a per loan basis than those for one- to four-family residential and consumer loans. Commercial and industrial loans expose us to additional risks since they typically are made on the basis of the borrower’s ability to make repayments from the cash flow of the borrower’s business and are secured by non-real estate collateral that may depreciate over time, may be illiquid and may fluctuate in value based on the success of the business. A secondary market for most types of commercial real estate, multi-family, commercial and industrial, and construction loans is not readily liquid, so we have less opportunity to mitigate credit risk by selling part or all of our interest in these loans.
Our construction loans are based upon estimates of costs and values associated with the completed project. These estimates may be inaccurate. Construction lending involves additional risks when compared with permanent residential lending because funds are advanced upon the security of the project, which is of uncertain value prior to its completion. Because of the uncertainties inherent in estimating construction costs, as well as the market value of the completed project and the effects of governmental regulation of real property, it is relatively difficult to evaluate accurately the total funds required to complete a project and the related loan-to-value ratio. This type of lending also typically involves higher loan principal amounts and is often concentrated with a small number of builders. In addition, during the term of a construction loan, interest is funded by the borrower or disbursed from an interest reserve set aside from the construction loan budget. These loans often involve the disbursement of substantial funds with repayment substantially dependent on the success of the ultimate project and the ability of the borrower to sell or lease the property or obtain permanent take-out financing, rather than the ability of the borrower or guarantor to repay principal and interest. If our appraisal of the value of a completed project proves to be overstated, we may have inadequate security for the repayment of the loan upon completion of construction of the project and may incur a loss. In addition, speculative construction loans to a builder are often associated with homes that are not pre-sold, and thus pose a greater potential risk to us than construction loans to individuals on their personal residences. These risks can be significantly affected by supply and demand conditions.
The credit risk related to commercial real estate and multi-family loans is considered to be greater than the risk related to one- to four-family residential or consumer loans because the repayment of commercial real estate loans and multi-family typically is dependent on the income stream of the real estate securing the loan as collateral and the successful operation of the borrower’s business, which can be significantly affected by conditions in the real estate markets or in the economy. For example, if the cash flows from the borrower’s project are reduced as a result of leases not being obtained or renewed, the borrower’s ability to repay the loan may be impaired. In addition, some of our commercial real estate loans are not fully amortizing and contain large balloon payments upon maturity. These balloon payments may require the borrower to either sell or refinance the underlying property in order to make the balloon payment, which may increase the risk of default or non-payment. This risk was exacerbated in the recent recession and could remain an elevated risk in the current slow recovery economic environment.
Further, if we foreclose on a commercial real estate, multi-family or construction loan, our holding period for the collateral may be longer than for one- to four-family residential mortgage loans because there are fewer potential purchasers of the collateral.
The unseasoned nature of our commercial loan portfolio may result in errors in judging its collectability, which may lead to additional provisions for loan losses or charge-offs, which would hurt our profits.
Our commercial loan portfolio, which includes commercial real estate, multi-family, commercial and industrial, and construction loans, has increased to $4.010 billion, or 85.8% of total loans at December 31, 2017
29
Table of Contents
from $1.776 billion, or 77.5% of total loans, at December 31, 2013. A portion of our commercial loan portfolio is unseasoned, meaning they were originated recently. Our limited experience with these borrowers does not provide us with a significant payment history pattern with which to judge future collectability. Further, these loans have not been subjected to unfavorable economic conditions. As a result, it is difficult to predict the future performance of this part of our loan portfolio. These loans may have delinquency or charge-off levels above our historical experience, which could adversely affect our future performance.
Our business strategy includes the continuation of significant growth plans, and our financial condition and results of operations could be negatively affected if we fail to grow or fail to manage our growth effectively.
We expect to continue to experience growth in the amount of our assets, the level of our deposits and the scale of our operations. Achieving our growth targets requires us to attract customers that currently bank at other financial institutions in our market, thereby increasing our share of the market. Our ability to successfully grow will depend on a variety of factors, including our ability to attract and retain experienced bankers, the continued availability of desirable business opportunities, the competitive responses from other financial institutions in our market areas and our ability to manage our growth. Growth opportunities may not be available or we may not be able to manage our growth successfully. If we do not manage our growth effectively, we may not be able to achieve our business plan, and our business could be harmed
Acquisitions may disrupt our business and dilute stockholder value.
We completed the acquisition of Meetinghouse Bancorp, Inc. and Meetinghouse Bank in December 2017. We regularly evaluate merger and acquisition opportunities with other financial institutions and financial services companies. As a result, negotiations may take place and future mergers or acquisitions involving cash, debt, or equity securities may occur at any time. We would seek acquisition partners that offer us either significant market presence or the potential to expand our market footprint and improve profitability through economies of scale or expanded services.
Acquiring other banks, businesses, or branches may have an adverse effect on our financial results and may involve various other risks commonly associated with acquisitions, including, among other things:
| • | difficulty in estimating the value of the target company; |
| • | payment of a premium over book and market values that may dilute our tangible book value and earnings per share in the short and long term; |
| • | potential exposure to unknown or contingent liabilities of the target company; |
| • | exposure to potential asset quality problems of the target company; |
| • | potential volatility in reported income associated with goodwill impairment losses; |
| • | difficulty and expense of integrating the operations and personnel of the target company; |
| • | inability to realize the expected revenue increases, cost savings, increases in geographic or product presence, and/or other projected benefits of the acquisition; |
| • | potential disruption to our business; |
| • | potential diversion of our management’s time and attention; |
| • | the possible loss of key employees and customers of the target company; and |
| • | potential changes in banking or tax laws or regulations that may affect the target company. |
Declines in property values can increase the loan-to-value ratios on our residential mortgage loan portfolio, which could expose us to greater risk of loss.
Some of our residential mortgage loans are secured by liens on mortgage properties in which the borrowers have little or no equity because either we originated the loan with a relatively high combined loan-to-value ratio,
30
Table of Contents
including second mortgage loans issued by us or other institutions, or because of the decline in home values in our market areas. Residential loans with high combined loan-to-value ratios may experience a higher incidence of default and severity of losses. In addition, if the borrowers sell their homes, such borrowers may be unable to repay their loans in full from the sale proceeds. As a result, these loans may experience higher rates of delinquencies, defaults and losses.
If our allowance for loan losses is not sufficient to cover actual loan losses, our earnings could decrease.
We maintain an allowance for loan losses, which is established through a provision for loan losses that represents management’s best estimate of probable losses within the existing portfolio of loans. We make various assumptions and judgments about the collectability of our loan portfolio, including the creditworthiness of borrowers and the value of the real estate and other assets serving as collateral for the repayment of loans. In determining the adequacy of the allowance for loan losses, we rely on our experience and our evaluation of economic conditions. If our assumptions prove to be incorrect, our current allowance for loan losses may not be sufficient to cover losses inherent in our loan portfolio and adjustment may be necessary to allow for different economic conditions or adverse developments in our loan portfolio. Consequently, a problem with one or more loans could require us to significantly increase the level of our provision for loan losses. In addition, federal and state regulators periodically review our allowance for loan losses and may require us to increase our provision for loan losses or recognize further loan charge-offs. Material additions to the allowance would materially decrease our net income.
The Financial Accounting Standards Board has adopted a new accounting standard that will be effective for us beginning January 1, 2020. This standard, which requires a Current Expected Credit Loss (‘CECL”) model, will require financial institutions to determine periodic estimates of lifetime expected credit losses on loans, and recognize the expected credit losses as allowances for loan losses. This will change from the current method of providing allowances for loan losses that have already been incurred, which may require us to increase our allowance for loan losses, and to greatly increase the types of data we would need to collect and review to determine the appropriate level of the allowance for loan losses. Any increase in our allowance for loan losses or expenses incurred to determine the appropriate level of the allowance for loan losses may have a material adverse effect on our financial condition and results of operations.
Our allowance for loan losses increased in 2017, primarily due to growth in the multi-family, commercial real estate, construction, and commercial and industrial loan categories; as such loans have higher inherent credit risk than loans in our residential real estate loan categories. Refer to “Management’s Discussion and Analysis of Results of Operations and Financial Condition — Asset Quality.”
Changes in the valuation of our securities portfolio could hurt our profits.
Our securities portfolio may be impacted by fluctuations in market value, potentially reducing accumulated other comprehensive income and/or earnings. Fluctuations in market value may be caused by changes in market interest rates, lower market prices for securities and limited investor demand. Management evaluates securities for other-than-temporary impairment on a monthly basis, with more frequent evaluation for selected issues. In analyzing a debt issuer’s financial condition, management considers whether the securities are issued by the federal government or its agencies, whether downgrades by bond rating agencies have occurred, industry analysts’ reports and, to a lesser extent given the relatively insignificant levels of depreciation in our debt portfolio, spread differentials between the effective rates on instruments in the portfolio compared to risk-free rates. In analyzing an equity issuer’s financial condition, management considers industry analysts’ reports, financial performance and projected target prices of investment analysts within a one-year time frame. If this evaluation shows impairment to the actual or projected cash flows associated with one or more securities, a potential loss to earnings may occur. Changes in interest rates can also have an adverse effect on our financial condition, as our available-for-sale securities are reported at their estimated fair value, and therefore are impacted by fluctuations in interest rates. We increase or decrease our stockholders’ equity by the amount of change in the estimated fair value of the available-for-sale securities, net of taxes. The declines in market value could result in other-than-temporary impairments of these assets, which would lead to accounting charges that could have a material adverse effect on our net income and capital levels. Refer to “Management’s Discussion and Analysis of Results of Operations and Financial Condition — Securities Portfolio.”
31
Table of Contents
Effective December 10, 2013, pursuant to the Dodd-Frank Act, federal banking and securities regulators issued final rules to implement Section 619 of the Dodd-Frank Act (the “Volcker Rule”). Generally, subject to a transition period and certain exceptions, the Volcker Rule restricts insured depository institutions and their affiliated companies from engaging in short-term proprietary trading of certain securities, investing in funds with collateral comprised of less than 100% loans that are not registered with the Securities and Exchange Commission and from engaging in hedging activities that do not hedge a specific identified risk. After the transition period, the Volcker Rule prohibitions and restrictions will apply to banking entities unless an exception applies.
In January 2016, the Financial Accounting Standards Board issued Accounting Standards Update (“ASU”) No. 2016-01, Financial Instruments — Overall, (Subtopic 825-10). The amendments in this update address certain aspects of recognition, measurement, presentation, and disclosure of financial instruments. Targeted changes to generally accepted accounting principles include the requirement for equity investments (except those accounted for under the equity method of accounting or those that result in consolidation of the investee) to be measured at fair value with changes in fair value recognized in net income and the elimination of the requirement for public business entities to disclose the methods and significant assumptions used to estimate the fair value for financial instruments measured at amortized cost. The amendments in this update are effective for fiscal years beginning after December 15, 2017, including interim periods within those fiscal years. The Company has a portfolio of equity investments and if such guidance were effective for the year ended December 31, 2017, a net unrealized loss of approximately $2.6 million and related deferred tax benefit of $900,000 would have been recognized in net income, instead of in other comprehensive income. The impact of this guidance on future periods is dependent on future market conditions and investment activity.
Impairment of goodwill could require charges to earnings, which could result in a negative impact on our results of operations.
Goodwill arises when a business is purchased for an amount greater than the net fair value of its assets. We recognized goodwill as an asset on our balance sheet in connection with our acquisitions of Mt. Washington Co-operative Bank and Meetinghouse. We evaluate goodwill for impairment at least annually. Although we determined that goodwill was not impaired during 2017, a significant and sustained decline in our stock price, a significant decline in our expected future cash flows, a significant adverse change in the business climate, slower growth rates or other factors could result in impairment of goodwill. If we were to conclude that a future write-down of the goodwill was necessary, then we would record the appropriate charge to earnings, which could be materially adverse to the results of operations and financial position. For further discussion of our methodology of evaluating and impairing goodwill, refer to “Management’s Discussion and Analysis of Results of Operations and Financial Condition — Critical Accounting Policies — Evaluation of Goodwill and Core Deposit Intangible and Analysis for Impairment.”
The building of market share through de novo branching and expansion of our residential, commercial real estate, and commercial and industrial lending capacity could cause our expenses to increase faster than revenues.
We intend to continue to build market share in the greater Boston metropolitan area through de novo branching and expansion of our residential, commercial real estate, and commercial and industrial lending capacity. Since 2007, we have opened 14 de novo branches including the most recent two branches opened in March and December 2016. There are considerable costs involved in opening branches and expanding lending capacity that generally require a period of time to generate the necessary revenues to offset their costs, especially in areas in which we do not have an established presence. Accordingly, any such business expansion may negatively impact our earnings for some period of time until certain economies of scale are reached. Our expenses could be further increased if we encounter delays in the opening of any of our new branches. Finally, our business expansion may not be successful after establishment.
Our funding sources may prove insufficient to replace deposits at maturity and support our future growth.
We must maintain sufficient funds to respond to the needs of depositors and borrowers. As a part of our liquidity management, we use a number of funding sources in addition to core deposit growth and repayments
32
Table of Contents
and maturities of loans and investments. As we continue to grow, we are likely to become more dependent on these sources, which include Federal Home Loan Bank advances, proceeds from the sale of loans, federal funds purchased and brokered certificates of deposit. Adverse operating results or changes in industry conditions could lead to difficulty or an inability to access these additional funding sources. Our financial flexibility will be severely constrained if we are unable to maintain our access to funding or if adequate financing is not available to accommodate future growth at acceptable interest rates. If we are required to rely more heavily on more expensive funding sources to support future growth, our revenues may not increase proportionately to cover our costs. In this case, our operating margins and profitability would be adversely affected.
We are subject to certain capital requirements, which may adversely impact our return on equity, require us to raise additional capital, or constrain us from paying dividends or repurchasing shares.
Effective January 1, 2015, we became subject to more stringent capital requirements as a result of the implementation of Basel III regulatory capital reforms and changes required by the Dodd-Frank Act. The application of more stringent capital requirements could, among other things, result in lower returns on equity, require the raising of additional capital, and result in regulatory actions if we were to be unable to comply with such requirements. The imposition of liquidity requirements in connection with the implementation of Basel III could result in our having to lengthen the term of our funding, restructure our business models, and/or increase our holdings of liquid assets. Furthermore, a financial institution is subject to limitations on paying dividends, engaging in share repurchases, any paying discretionary bonuses if its capital level falls below the capital conversation buffer amount. These limitations establish a maximum percentage of eligible retained income that can be utilized for such actions. See “Supervision and Regulation — Federal Banking Regulation — Capital Requirements.”
The level of our commercial real estate loan portfolio may subject us to additional regulatory scrutiny.
The Federal Deposit Insurance Corporation and the other federal bank regulatory agencies have promulgated joint guidance on sound risk management practices for financial institutions with concentrations in commercial real estate lending. Under the guidance, a financial institution that, like us, is actively involved in commercial real estate lending should perform a risk assessment to identify concentrations. A financial institution may have a concentration in commercial real estate lending if, among other factors, (i) total reported loans for construction, land acquisition and development, and other land represent 100% or more of total capital, or (ii) total reported loans secured by multi-family and non-farm residential properties, loans for construction, land acquisition and development and other land, and loans otherwise sensitive to the general commercial real estate market, including loans to commercial real estate related entities, represent 300% or more of total capital. Based on these factors, we have a concentration in multi-family and commercial real estate lending, as such loans represent 470% of total bank capital as of December 31, 2017. The particular focus of the guidance is on exposure to commercial real estate loans that are dependent on the cash flow from the real estate held as collateral and that are likely to be at greater risk to conditions in the commercial real estate market (as opposed to real estate collateral held as a secondary source of repayment or as an abundance of caution). The purpose of the guidance is to guide banks in developing risk management practices and capital levels commensurate with the level and nature of real estate concentrations. The guidance states that management should employ heightened risk management practices including board and management oversight and strategic planning, development of underwriting standards, risk assessment and monitoring through market analysis and stress testing. While we believe we have implemented policies and procedures with respect to our commercial real estate loan portfolio consistent with this guidance, bank regulators could require us to implement additional policies and procedures consistent with their interpretation of the guidance that may result in additional costs to us or that may result in a curtailment of our multi-family and commercial real estate lending that would adversely affect our loan originations and profitability.
Changes in laws and regulations and the cost of regulatory compliance with new laws and regulations may adversely affect our operations, increase our costs of operations and decrease our efficiency.
The Company and the Bank are subject to extensive regulation, supervision and examination by the Massachusetts Commissioner of Banks, the Federal Deposit Insurance Corporation and the Federal Reserve
33
Table of Contents
Board. Such regulation and supervision governs the activities in which we may engage and are intended primarily for the protection of the insurance fund and the depositors and borrowers of the Bank rather than for holders of our common stock. Regulatory authorities have extensive discretion in their supervisory and enforcement activities, including the imposition of restrictions on our operations, the classification of our assets and the determination of the level of our allowance for loan losses. These regulations, along with the currently existing tax, accounting, securities, insurance, monetary laws, rules, standards, policies, and interpretations control the methods by which financial institutions conduct business, implement strategic initiatives and tax compliance, and govern financial reporting and disclosures. Any change in such regulation and oversight, whether in the form of regulatory policy, regulations, legislation or supervisory action, may have a material impact on our operations. Further, changes in accounting standards can be both difficult to predict and involve judgment and discretion in their interpretation by us and our independent accounting firms. These changes could materially impact, potentially even retroactively, how we report our financial condition and results of our operations as could our interpretation of those changes.
Monetary policies and regulations of the Federal Reserve Board could adversely affect our business, financial condition and results of operations.
In addition to being affected by general economic conditions, our earnings and growth are affected by the policies of the Federal Reserve Board. An important function of the Federal Reserve Board is to regulate the money supply and credit conditions. Among the instruments used by the Federal Reserve Board to implement these objectives are open market purchases and sales of U.S. government securities, adjustments of the discount rate and changes in banks’ reserve requirements against bank deposits. These instruments are used in varying combinations to influence overall economic growth and the distribution of credit, bank loans, investments and deposits. Their use also affects interest rates charged on loans or paid on deposits.
The monetary policies and regulations of the Federal Reserve Board have had a significant effect on the operating results of financial institutions in the past and are expected to continue to do so in the future. The effects of such policies upon our business, financial condition and results of operations cannot be predicted.
We are subject to the Community Reinvestment Act and fair lending laws, and failure to comply with these laws could lead to material penalties.
The Community Reinvestment Act (“CRA”), the Equal Credit Opportunity Act, the Fair Housing Act and other fair lending laws and regulations impose nondiscriminatory lending requirements on financial institutions. A successful regulatory challenge to an institution’s performance under the CRA or fair lending laws and regulations could result in a wide variety of sanctions, including the required payment of damages and civil money penalties, injunctive relief, imposition of restrictions on mergers and acquisitions activity and restrictions on expansion. Private parties may also have the ability to challenge an institution’s performance under fair lending laws in private class action litigation. Such actions could have a material adverse effect on our business, financial condition and results of operations.
Certain regulations could restrict our ability to originate and sell loans.
The Consumer Financial Protection Bureau has issued a rule designed to clarify for lenders how they can avoid legal liability under the Dodd-Frank Act, which would hold lenders accountable for ensuring a borrower’s ability to repay a mortgage. Loans that meet this “qualified mortgage” definition will be presumed to have complied with the new ability-to-repay standard. Under the Consumer Financial Protection Bureau’s rule, a “qualified mortgage” loan must not contain certain specified features, including:
| • | excessive upfront points and fees (those exceeding 3% of the total loan amount, less “bona fide discount points” for prime loans); |
| • | interest-only payments; |
| • | negative-amortization; and |
| • | terms longer than 30 years. |
34
Table of Contents
Also, to qualify as a “qualified mortgage,” a borrower’s total monthly debt-to-income ratio may not exceed 43%. Lenders must also verify and document the income and financial resources relied upon to qualify the borrower for the loan and underwrite the loan based on a fully amortizing payment schedule and maximum interest rate during the first five years, taking into account all applicable taxes, insurance and assessments. In addition, the Dodd-Frank Act requires the regulatory agencies to issue regulations that require securitizers of loans to retain not less than 5% of the credit risk for any asset that is not a “qualified residential mortgage.” The regulatory agencies have issued a final rule to implement this requirement, which provides that the definition of “qualified residential mortgage” includes loans that meet the definition of “qualified mortgage” issued by the Consumer Financial Protection Bureau for purposes of its regulations (as described above).
These final rules could have a significant effect on the secondary market for loans and the types of loans we originate, and restrict our ability to make loans, any of which could limit our growth or profitability.
Non-compliance with the USA PATRIOT Act, Bank Secrecy Act, or other laws and regulations could result in fines or sanctions.
The USA PATRIOT and Bank Secrecy Acts require financial institutions to develop programs to prevent financial institutions from being used for money laundering and terrorist activities. If such activities are detected, financial institutions are obligated to file suspicious activity reports with the U.S. Treasury’s Office of Financial Crimes Enforcement Network. These rules require financial institutions to establish procedures for identifying and verifying the identity of customers seeking to open new financial accounts. Failure to comply with these regulations could result in fines or sanctions. During the last year, several banking institutions have received large fines for non-compliance with these laws and regulations. While we have developed policies and procedures designed to assist in compliance with these laws and regulations, these policies and procedures may not be effective in preventing violations of these laws and regulations.
Legal and regulatory proceedings and related matters could adversely affect us or the financial services industry in general.
We, and other participants in the financial services industry upon whom we rely to operate, have been and may in the future become involved in legal and regulatory proceedings. Most of the proceedings we consider to be in the normal course of our business or typical for the industry; however, it is inherently difficult to assess the outcome of these matters and, other participants in the financial services industry or we may not prevail in any proceeding or litigation. There could be substantial cost and management diversion in such litigation and proceedings, and any adverse determination could have a materially adverse effect on our business, brand or image, or our financial condition and results of our operations.
The Federal Reserve Board may require us to commit capital resources to support the Bank.
Federal law requires that a holding company act as a source of financial and managerial strength to its subsidiary bank and to commit resources to support such subsidiary bank. Under the “source of strength” doctrine, the Federal Reserve Board may require a holding company to make capital injections into a troubled subsidiary bank and may charge the holding company with engaging in unsafe and unsound practices for failure to commit resources to a subsidiary bank. A capital injection may be required at times when the holding company may not have the resources to provide it and therefore may be required to borrow the funds or raise capital. Any loans by a holding company to its subsidiary bank are subordinate in right of payment to deposits and to certain other indebtedness of such subsidiary bank. In the event of a holding company’s bankruptcy, the bankruptcy trustee will assume any commitment by the holding company to a federal bank regulatory agency to maintain the capital of a subsidiary bank. Moreover, bankruptcy law provides that claims based on any such commitment will be entitled to a priority of payment over the claims of the institution’s general unsecured creditors, including the holders of its note obligations. Thus, any borrowing that must be done by the Company to make a required capital injection becomes more difficult and expensive and could have an adverse effect on our business, financial condition and results of operations.
35
Table of Contents
Strong competition within our market area could hurt our profits and slow growth.
We face intense competition in making loans and attracting deposits. Price competition for loans and deposits sometimes results in us charging lower interest rates on our loans and paying higher interest rates on our deposits and may reduce our net interest income. Competition also makes it more difficult and costly to attract and retain qualified employees. Many of the institutions with which we compete have substantially greater resources and lending limits than we have and may offer services that we do not provide. We expect competition to increase in the future as a result of legislative, regulatory and technological changes and the continuing trend of consolidation in the financial services industry. If we are not able to effectively compete in our market area, our profitability may be negatively affected, potentially limiting our ability to pay dividends. The greater resources and broader offering of deposit and loan products of some of our competitors may also limit our ability to increase our interest-earning assets. For more information about our market area and the competition we face, see “Item 1 — Business — Market Area” and “Item 1 — Competition.”
Our success depends on hiring and retaining certain key personnel.
Our performance largely depends on the talents and efforts of highly skilled individuals. We rely on key personnel to manage and operate our business, including major revenue generating functions such as loan and deposit generation. The loss of key staff may adversely affect our ability to maintain and manage these functions effectively, which could negatively affect our revenues. In addition, loss of key personnel could result in increased recruiting and hiring expenses, which could cause a decrease in our net income. Our continued ability to compete effectively depends on our ability to attract new employees and to retain and motivate our existing employees.
Our business may be adversely affected by an increasing prevalence of fraud and other financial crimes.
Our loans to businesses and individuals and our deposit relationships and related transactions are subject to exposure to the risk of loss due to fraud and other financial crimes. Nationally, reported incidents of fraud and other financial crimes have increased. We have also experienced losses due to apparent fraud and other financial crimes. While we have policies and procedures designed to prevent such losses, losses may still occur.
Managing reputational risk is important to attracting and maintaining customers, investors and employees.
Threats to our reputation can come from many sources, including adverse sentiment about financial institutions generally, unethical practices, employee misconduct, failure to deliver minimum standards of service or quality, compliance deficiencies, and questionable or fraudulent activities of our customers. We have policies and procedures in place to protect our reputation and promote ethical conduct, but these policies and procedures may not be fully effective. Negative publicity regarding our business, employees, or customers, with or without merit, may result in the loss of customers, investors and employees, costly litigation, a decline in revenues and increased governmental regulation.
System failure or breaches of our network security could subject us to increased operating costs as well as litigation and other liabilities.
The computer systems and network infrastructure we use could be vulnerable to unforeseen problems. Our operations are dependent upon our ability to protect our computer equipment against damage from physical theft, fire, power loss, telecommunications failure or a similar catastrophic event, as well as from security breaches, denial of service attacks, viruses, worms and other disruptive problems caused by hackers. Any damage or failure that causes an interruption in our operations could have a material adverse effect on our financial condition and results of operations. Computer break-ins, phishing and other disruptions could also jeopardize the security of information stored in and transmitted through our computer systems and network infrastructure, which may result in significant liability to us and may cause existing and potential customers to refrain from doing business with us. Although we, with the help of third-party service providers, intend to continue to implement security technology and establish operational procedures to prevent such damage, our security measures may not be successful. In addition, advances in computer capabilities, new discoveries in the field of cryptography or other
36
Table of Contents
developments could result in a compromise or breach of the algorithms we and our third-party service providers use to encrypt and protect customer transaction data. A failure of such security measures could have a material adverse effect on our financial condition and results of operations.
It is possible that a significant amount of time and money may be spent to rectify the harm caused by a breach or hack. While we have general liability insurance and cyber liability insurance, there are limitations on coverage as well as dollar amount. Furthermore, cyber incidents carry a greater risk of injury to our reputation. Finally, depending on the type of incident, banking regulators can impose restrictions on our business and consumer laws may require reimbursement of customer loss.
Our risk management framework may not be effective in mitigating risk and reducing the potential for significant losses.
Our risk management framework is designed to minimize risk and loss to us. We seek to identify, measure, monitor, report and control our exposure to risk, including strategic, market, liquidity, compliance and operational risks. While we use a broad and diversified set of risk monitoring and mitigation techniques, these techniques are inherently limited because they cannot anticipate the existence or future development of currently unanticipated or unknown risks. Recent economic conditions and heightened legislative and regulatory scrutiny of the financial services industry, among other developments, have increased our level of risk. Accordingly, we could suffer losses as a result of our failure to properly anticipate and manage these risks.
We face significant operational risks because the financial services business involves a high volume of transactions.
We operate in diverse markets and rely on the ability of our employees and systems to process a high number of transactions. Operational risk is the risk of loss resulting from our operations, including but not limited to, the risk of fraud by employees or persons outside our company, the execution of unauthorized transactions by employees, errors relating to transaction processing and technology, breaches of our internal control systems and compliance requirements, and business continuation and disaster recovery. Insurance coverage may not be available for such losses, or where available, such losses may exceed insurance limits. This risk of loss also includes the potential legal actions that could arise as a result of operational deficiencies or as a result of non-compliance with applicable regulatory standards or customer attrition due to potential negative publicity. In the event of a breakdown in our internal control systems, improper operation of systems or improper employee actions, we could suffer financial loss, face regulatory action, and/or suffer damage to our reputation.
We are subject to environmental liability risk associated with lending activities.
A significant portion of our loan portfolio is secured by real estate, and we could become subject to environmental liabilities with respect to one or more of these properties. During the ordinary course of business, we may foreclose on and take title to properties securing defaulted loans. In doing so, there is a risk that hazardous or toxic substances could be found on these properties. If hazardous conditions or toxic substances are found on these properties, we may be liable for remediation costs, as well as for personal injury and property damage, civil fines and criminal penalties regardless of when the hazardous conditions or toxic substances first affected any particular property. Environmental laws may require us to incur substantial expenses to address unknown liabilities and may materially reduce the affected property’s value or limit our ability to use or sell the affected property. In addition, future laws or more stringent interpretations or enforcement policies with respect to existing laws may increase our exposure to environmental liability. Although we have policies and procedures to perform an environmental review before initiating any foreclosure action on nonresidential real property, these reviews may not be sufficient to detect all potential environmental hazards. The remediation costs and any other financial liabilities associated with an environmental hazard could have a material adverse effect on us.
Various factors may make takeover attempts more difficult to achieve.
Certain provisions of our articles of incorporation and state and federal banking laws, including regulatory approval requirements, could make it more difficult for a third party to acquire control of the Company without
37
Table of Contents
our Board of Directors’ approval. Under federal law, subject to certain exemptions, a person, entity or group must notify the Federal Reserve Board before acquiring control of a bank holding company. Acquisition of 10% or more of any class of voting stock of a bank holding company, including shares of our common stock or shares of our preferred stock were those shares to become entitled to vote upon the election of two directors because of missed dividends, creates a rebuttable presumption that the acquirer “controls” the bank holding company. Also, a bank holding company must obtain the prior approval of the Federal Reserve Board before, among other things, acquiring direct or indirect ownership or control of more than 5% of any class of voting shares of any bank, including East Boston Savings Bank.
There also are provisions in our articles of incorporation that may be used to delay or block a takeover attempt, including a provision that prohibits any person from voting more than 10% of the shares of common stock outstanding. Furthermore, shares of restricted stock and stock options that we have granted or may grant to employees and directors, stock ownership by our management and directors, including through our ESOP, employment agreements that we have entered into with our executive officers and other factors may make it more difficult for companies or persons to acquire control of the Company without the consent of our Board of Directors. Taken as a whole, these statutory provisions and provisions in our articles of incorporation could result in our being less attractive to a potential acquirer and thus could adversely affect the market price of our common stock.
Our stock-based benefit plans have increased our expenses and reduced our income, and may dilute your ownership interest.
In 2015, we adopted new stock-based benefit plans. These plans may be funded either through open market purchases or from the issuance of authorized but unissued shares of common stock. Our ability to purchase shares of common stock to fund these plans will be subject to many factors, including applicable regulatory restrictions, the availability of stock in the market, the trading price of the stock, our capital levels, alternative uses for our capital and our financial performance. While our intention is to fund the new stock-based benefit plans through open market purchases, stockholders would experience dilution in ownership interest in the event newly issued shares of our common stock are used to fund stock options and shares of restricted common stock.
Changes in management’s estimates and assumptions may have a material impact on our consolidated financial statements and our financial condition or operating results.
In preparing this annual report as well as other periodic reports we are required to file under the Securities Exchange Act of 1934, including our consolidated financial statements, our management is and will be required under applicable rules and regulations to make estimates and assumptions as of a specified date. These estimates and assumptions are based on management’s best estimates and experience as of that date and are subject to substantial risk and uncertainty. Materially different results may occur as circumstances change and additional information becomes known. Areas requiring significant estimates and assumptions by management include our determination of the allowance for loan losses, the evaluation of goodwill for impairment and the evaluation of securities for other-than-temporary impairment.
Changes in card network fees could impact our operations.
From time to time, the card networks increase the fees (known as interchange fees) that they charge to acquirers and that we charge to our merchants. It is possible that competitive pressures will result in us absorbing a portion of such increases in the future, which would increase our costs, reduce our profit margin and adversely affect our business and financial condition. In addition, the card networks require certain capital requirements. An increase in the required capital level would further limit our use of capital for other purposes.
Changes in card network rules or standards could adversely affect our business.
In order to provide our debit card and cash management solutions, we are members of the Visa network. As such, we are subject to card network rules that could subject us to a variety of fines or penalties that may be assessed on us. The termination of our membership or any changes in card network rules or standards, including
38
Table of Contents
interpretation and implementation of existing rules or standards, could increase the cost of operating our merchant servicer business or limit our ability to provide debit card and cash management solutions to or through our customers, and could have a material adverse effect on our business, financial condition and results of operations.
Our business could suffer if there is a decline in the use of debit cards as a payment mechanism or if there are adverse developments with respect to the financial services industry in general.
As the financial services industry evolves, consumers may find debit financial services to be less attractive than traditional or other financial services. Consumers might not use debit card financial services for any number of reasons, including the general perception of our industry. If consumers do not continue or increase their usage of debit cards, including making changes in the way debit cards are loaded, our operating revenues and debit card deposits may remain at current levels or decline. Any projected growth for the industry may not occur or may occur more slowly than estimated. If consumer acceptance of debit financial services does not continue to develop or develops more slowly than expected or if there is a shift in the mix of payment forms, such as cash, credit cards, traditional debit cards and debit cards, away from our products and services, it could have a material adverse effect on our financial position and results of operations.
| ITEM 1B. | UNRESOLVED STAFF COMMENTS |
Not applicable.
| ITEM 2. | PROPERTIES |
At December 31, 2017, we conducted business through our 33 full service offices, one mobile branch and three loan centers located in Allston, Belmont, Boston, Brookline, Cambridge, Danvers, East Boston, Revere, Somerville, South Boston, Dorchester, Jamaica Plain, West Roxbury, Everett, Medford, Melrose, Wakefield, Winthrop, Lynn, Peabody, Roslindale and Saugus, Massachusetts. We also operate in three administrative/support offices. We own 20 and lease 19 of our offices. At December 31, 2017, the total net book value of our land, buildings, furniture, fixtures and equipment was $41.0 million.
| ITEM 3. | LEGAL PROCEEDINGS |
Periodically, there have been various claims and lawsuits against us, such as claims to enforce liens, condemnation proceedings on properties in which we hold security interests, claims involving the making and servicing of real property loans and other issues incident to our business. We are not a party to any pending legal proceedings that we believe would have a material adverse effect on our financial condition, results of operations or cash flows.
| ITEM 4. | MINE SAFETY DISCLOSURES |
Not Applicable.
39
Table of Contents
| ITEM 5. | MARKET FOR REGISTRANT’S COMMON EQUITY, RELATED STOCKHOLDER MATTERS AND ISSUER PURCHASES OF EQUITY SECURITIES |
Market Information and Holders
The Company’s shares of common stock are traded on the NASDAQ Global Select Market under the symbol “EBSB.” The approximate number of shareholders of record of the Company’s common stock as of February 22, 2018 was 1,840. Certain shares of the Company are held in “nominee” or “street” name and accordingly, the number of beneficial owners of such shares is not known or included in the foregoing number.
The following table sets forth for each quarter of 2017 and 2016 the intra-day high and low sales prices per share of common stock as reported by NASDAQ and the cash dividends declared per share.
| 2017 |
High | Low | Dividends | |||||||||
| Fourth quarter |
$ | 21.30 | $ | 17.96 | $ | 0.05 | ||||||
| Third quarter |
19.00 | 16.35 | 0.04 | |||||||||
| Second quarter |
19.27 | 15.85 | 0.04 | |||||||||
| First quarter |
19.70 | 17.55 | 0.04 | |||||||||
| 2016 |
High | Low | Dividends | |||||||||
| Fourth quarter |
$ | 20.55 | $ | 15.06 | $ | 0.03 | ||||||
| Third quarter |
15.77 | 14.62 | 0.03 | |||||||||
| Second quarter |
15.34 | 13.41 | 0.03 | |||||||||
| First quarter |
14.36 | 12.28 | 0.03 | |||||||||
Dividends
The Company is not permitted to pay dividends on its common stock if its stockholders’ equity would be reduced below the amount of the liquidation account established by the Company in connection with the conversion. The source of dividends will depend on the net proceeds retained by the Company and earnings thereon, and dividends from the Bank. In addition, the Company is subject to state law limitations and federal bank regulatory policy on the payment of dividends. Maryland law generally limits dividends if the corporation would not be able to pay its debts in the usual course of business after giving effect to the dividend or if the corporation’s total assets would be less than the corporation’s total liabilities plus the amount needed to satisfy the preferential rights upon dissolution of stockholders whose preferential rights on dissolution are superior to those receiving the distribution. In addition, the Company is subject to the Federal Reserve Board’s policy that dividends should be paid only out of current earnings and only if the prospective rate of earnings retention by the Company appears consistent with its capital needs, asset quality and overall financial condition. See “Supervision and Regulation — Holding Company Regulation.”
Dividends from the Company may depend, in part, upon receipt of dividends from the Bank because the Company has no source of income other than dividends from the Bank and earnings from investment of net proceeds from the offering retained by the Company. Massachusetts banking law and FDIC regulations limit distributions from the Bank to the Company. For example, the Bank could not pay dividends if it were not in compliance with applicable regulatory capital requirements. See “Supervision and Regulation — Massachusetts Banking Laws and Supervision — Dividends” and “Federal Bank Regulation — Prompt Corrective Regulatory Action.”
In determining whether to declare or pay any dividends, whether regular or special, the Board of Directors takes into account our financial condition and results of operations, tax considerations, statutory and regulatory limitations, and general economic conditions. The payment and amount of any dividend payments depends upon a number of factors. We cannot assure that dividends will not be reduced or eliminated in the future.
40
Table of Contents
Purchases of Equity Securities by the Issuer and Affiliated Purchases
There were no share repurchases during the year ended December 31, 2017. On August 12, 2015, the Company’s Board of Directors voted to adopt a stock repurchase program of up to 5% of its outstanding common stock, or 2,737,334 shares of its common stock. The repurchase program has no expiration date. As of December 31, 2017, 677,723 shares remain available for repurchase under the repurchase program.
Securities Authorized for Issuance under Equity Compensation Plans
Stock-based compensation awards outstanding and available for future grants as of December 31, 2017 represent stock-based compensation plans approved by stockholders. Other than our Employee Stock Ownership Plan, there are no plans that have not been approved by stockholders. Additional information is presented in Note 10, Employee Benefit Plans, in the Notes to Consolidated Financial Statements included in Item 8, Financial Statements and Supplementary Data, within this report. Additional information regarding the Company’s equity compensation plans is included in Part III, Item 12 of this Annual Report on Form 10-K.
Performance Graph
The stock performance graph below compares the Company’s cumulative shareholder return on its common stock from December 31, 2012 to December 31, 2017 with the cumulative total return of the NASDAQ Composite and the SNL Bank and Thrift Composite. Total shareholder return is measured by dividing total dividends (assuming dividend reinvestment) for the measurement period plus share price change for the period from the share price at the beginning of the measurement period. The return is based on an initial investment of $100.00.
Meridian Bancorp, Inc.
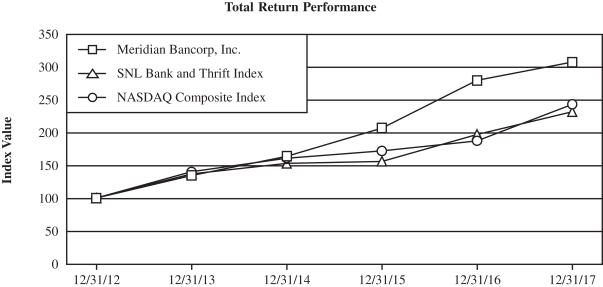
| Period Ending | ||||||||||||||||||||||||
|
Index |
12/31/12 | 12/31/13 | 12/31/14 | 12/31/15 | 12/31/16 | 12/31/17 | ||||||||||||||||||
| Meridian Bancorp, Inc. |
100.00 | 134.56 | 163.71 | 206.64 | 279.14 | 307.04 | ||||||||||||||||||
| NASDAQ Composite Index |
100.00 | 140.12 | 160.78 | 171.97 | 187.22 | 242.71 | ||||||||||||||||||
| SNL Bank and Thrift Index |
100.00 | 136.92 | 152.85 | 155.94 | 196.86 | 231.49 | ||||||||||||||||||
Source: SNL Financial LC, Charlottesville, VA
41
Table of Contents
| ITEM 6. | SELECTED FINANCIAL DATA |
The following tables set forth selected consolidated financial data for the Company. This information should be read in conjunction with the Consolidated Financial Statements and related notes, and the section titled “Management’s Discussion and Analysis of Financial Condition and Results of Operations” that appear elsewhere in this Annual Report.
| At or For the Years Ended December 31, | ||||||||||||||||||||
| 2017 | 2016 | 2015 | 2014 | 2013 | ||||||||||||||||
| (Dollars in thousands, except per share amounts) | ||||||||||||||||||||
| Financial Condition Data |
||||||||||||||||||||
| Total assets |
$ | 5,299,455 | $ | 4,436,002 | $ | 3,524,509 | $ | 3,278,526 | $ | 2,682,101 | ||||||||||
| Securities available for sale |
38,364 | 67,663 | 141,646 | 203,521 | 201,137 | |||||||||||||||
| Loans, net |
4,622,798 | 3,898,668 | 3,045,242 | 2,648,907 | 2,265,400 | |||||||||||||||
| Deposits |
4,107,861 | 3,475,837 | 2,743,018 | 2,503,935 | 2,248,600 | |||||||||||||||
| Borrowings |
513,444 | 322,512 | 167,226 | 171,899 | 161,903 | |||||||||||||||
| Total stockholders’ equity |
646,399 | 607,297 | 588,126 | 577,710 | 249,205 | |||||||||||||||
|
|
|
|
|
|
|
|
|
|
|
|||||||||||
| Operating Data |
||||||||||||||||||||
| Interest and dividend income |
$ | 185,104 | $ | 149,692 | $ | 123,342 | $ | 108,679 | $ | 95,204 | ||||||||||
| Interest expense |
38,912 | 27,137 | 20,451 | 20,513 | 20,135 | |||||||||||||||
|
|
|
|
|
|
|
|
|
|
|
|||||||||||
| Net interest income |
146,192 | 122,555 | 102,891 | 88,166 | 75,069 | |||||||||||||||
| Provision for loan losses |
4,859 | 7,180 | 6,667 | 3,313 | 6,470 | |||||||||||||||
|
|
|
|
|
|
|
|
|
|
|
|||||||||||
| Net interest income, after provision for loan losses |
141,333 | 115,375 | 96,224 | 84,853 | 68,599 | |||||||||||||||
| Non-interest income |
23,064 | 14,190 | 13,040 | 16,056 | 19,416 | |||||||||||||||
| Non-interest expenses |
87,965 | 77,494 | 72,691 | 67,434 | 64,515 | |||||||||||||||
|
|
|
|
|
|
|
|
|
|
|
|||||||||||
| Income before income taxes |
76,432 | 52,071 | 36,573 | 33,475 | 23,500 | |||||||||||||||
| Provision for income taxes |
33,487 | 17,881 | 11,966 | 11,148 | 8,071 | |||||||||||||||
|
|
|
|
|
|
|
|
|
|
|
|||||||||||
| Net income |
$ | 42,945 | $ | 34,190 | $ | 24,607 | $ | 22,327 | $ | 15,429 | ||||||||||
|
|
|
|
|
|
|
|
|
|
|
|||||||||||
| Key Performance Ratios |
||||||||||||||||||||
| Return on average assets |
0.89 | % | 0.87 | % | 0.74 | % | 0.75 | % | 0.62 | % | ||||||||||
| Return on average equity |
6.82 | 5.77 | 4.19 | 5.69 | 6.39 | |||||||||||||||
| Interest rate spread (1) |
2.90 | 2.99 | 2.97 | 2.88 | 3.00 | |||||||||||||||
| Net interest margin (2) |
3.12 | 3.20 | 3.19 | 3.08 | 3.15 | |||||||||||||||
| Non-interest expense to average assets |
1.83 | 1.97 | 2.17 | 2.26 | 2.58 | |||||||||||||||
| Efficiency ratio (3) |
53.71 | 57.95 | 64.05 | 68.84 | 76.04 | |||||||||||||||
| Dividend payout ratio |
20.26 | 17.91 | 12.77 | — | — | |||||||||||||||
| Average interest-earning assets to average |
||||||||||||||||||||
| interest-bearing liabilities |
126.88 | 129.95 | 134.63 | 126.57 | 118.30 | |||||||||||||||
|
|
|
|
|
|
|
|
|
|
|
|||||||||||
| Capital Ratios |
||||||||||||||||||||
| Stockholders’ equity to total assets |
12.20 | % | 13.69 | % | 16.69 | % | 17.62 | % | 9.29 | % | ||||||||||
| Total capital to risk weighted assets |
13.60 | 14.95 | 17.48 | 20.34 | 10.77 | |||||||||||||||
| Tier I capital to risk weighted assets |
12.67 | 13.95 | 16.52 | 19.30 | 9.60 | |||||||||||||||
| Common equity tier I capital to risk weighted assets |
12.67 | 13.95 | 16.52 | — | — | |||||||||||||||
| Tier I capital to average assets |
12.10 | 13.95 | 16.71 | 17.44 | 8.73 | |||||||||||||||
|
|
|
|
|
|
|
|
|
|
|
|||||||||||
| Asset Quality Ratios |
||||||||||||||||||||
| Allowance for loan losses/total loans |
0.97 | % | 1.02 | % | 1.08 | % | 1.06 | % | 1.11 | % | ||||||||||
| Allowance for loan losses/non-accrual loans |
540.30 | 298.82 | 106.58 | 90.35 | 61.00 | |||||||||||||||
| Net charge-offs/average loans outstanding |
0.00 | 0.01 | 0.06 | 0.01 | 0.08 | |||||||||||||||
| Non-accrual loans/total loans |
0.18 | 0.34 | 1.02 | 1.18 | 1.81 | |||||||||||||||
| Non-performing assets/total assets |
0.16 | 0.30 | 0.89 | 0.99 | 1.60 | |||||||||||||||
|
|
|
|
|
|
|
|
|
|
|
|||||||||||
| Per Share Data |
||||||||||||||||||||
| Basic earnings per share |
$ | 0.84 | $ | 0.67 | $ | 0.47 | $ | 0.43 | $ | 0.29 | ||||||||||
| Diluted earnings per share |
0.82 | 0.65 | 0.46 | 0.42 | 0.29 | |||||||||||||||
| Dividends per share |
0.17 | 0.12 | 0.06 | — | — | |||||||||||||||
| Book value per share |
11.96 | 11.33 | 10.72 | 10.56 | 4.58 | |||||||||||||||
| Tangible book value per share (4) |
11.54 | 11.08 | 10.47 | 10.31 | 4.33 | |||||||||||||||
| Market value per share |
20.60 | 18.90 | 14.10 | 11.22 | 9.22 | |||||||||||||||
| Number of shares outstanding at end of year |
54,039,316 | 53,596,105 | 54,875,237 | 54,708,066 | 54,406,335 | |||||||||||||||
|
|
|
|
|
|
|
|
|
|
|
|||||||||||
| Other data: |
||||||||||||||||||||
| Number of offices |
33 | 31 | 29 | 27 | 27 | |||||||||||||||
| Number of full-time equivalent employees |
495 | 462 | 445 | 431 | 420 | |||||||||||||||
|
|
|
|
|
|
|
|
|
|
|
|||||||||||
(footnotes begin on following page)
42
Table of Contents
(footnotes from previous page)
| (1) | Represents the difference between the weighted average yield on average interest-earning assets and the weighted average cost of interest-bearing liabilities. |
| (2) | Represents net interest income as a percent of average interest-earning assets. |
| (3) | The efficiency ratio is a non-GAAP measure representing non-interest expense, excluding merger and acquisition expenses, divided by the sum of net interest income and non-interest income excluding gains or losses on sales of securities. The efficiency ratio is a common measure used by banks to understand expenses related to the generation of revenue. We have removed gains or losses on sales of securities as management deems them to be discretionary and not representative of operating performance. We have removed merger and acquisition expenses as management deems them to be not representative of operating performance. Presented on a basis including merger and acquisition expenses and gains or losses on sales of securities, the efficiency ratio was 51.97%, 56.67%, 62.70%, 64.70% and 68.28% for the years ended December 31, 2017, 2016, 2015, 2014 and 2013 respectively. |
| (4) | Tangible book value per share is calculated as follows. |
| At December 31, | ||||||||||||||||||||
| 2017 | 2016 | 2015 | 2014 | 2013 | ||||||||||||||||
| (Dollars in thousands, except per share amounts) | ||||||||||||||||||||
| Total stockholders’ equity |
$ | 646,399 | $ | 607,297 | $ | 588,126 | $ | 577,710 | $ | 249,205 | ||||||||||
| Less: goodwill |
19,638 | 13,687 | 13,687 | 13,687 | 13,687 | |||||||||||||||
| Less: core deposit intangible |
3,243 | — | — | — | — | |||||||||||||||
|
|
|
|
|
|
|
|
|
|
|
|||||||||||
| Tangible book value |
$ | 623,518 | $ | 593,610 | $ | 574,439 | $ | 564,023 | $ | 235,518 | ||||||||||
|
|
|
|
|
|
|
|
|
|
|
|||||||||||
| Number of shares outstanding at end of year |
54,039,316 | 53,596,105 | 54,875,237 | 54,708,066 | 54,406,335 | |||||||||||||||
| Tangible book value per share |
$ | 11.54 | $ | 11.08 | $ | 10.47 | $ | 10.31 | $ | 4.33 | ||||||||||
| ITEM 7. | MANAGEMENT’S DISCUSSION AND ANALYSIS OF FINANCIAL CONDITION AND RESULTS OF OPERATIONS |
This discussion and analysis reflects our consolidated financial statements and other relevant statistical data, and is intended to enhance your understanding of our financial condition and results of operations. You should read the information in this section in conjunction with our business and financial information and the Consolidated Financial Statements and related notes that appear elsewhere in this Annual Report.
Critical Accounting Policies
A summary of significant accounting policies is described in Note 1 to the Consolidated Financial Statements included in this Annual Report on Form 10-K for the year ended December 31, 2017. Critical accounting estimates are necessary in the application of certain accounting policies and procedures and are particularly susceptible to significant change. Critical accounting policies are defined as those involving significant judgments and assumptions by management that could have a material impact on the carrying value of certain assets or on income under different assumptions or conditions. Management believes that the most critical accounting policies, which involve the most complex or subjective decisions or assessments, are as follows:
Allowance for Loan Losses. The determination of the allowance for loan losses is considered critical due to the high degree of judgment involved, the subjectivity of the underlying assumptions used, and the potential for changes in the economic environment that could result in material changes in the amount of the allowance for loan losses. The allowance for loan losses is utilized to absorb losses inherent in the loan portfolio. The allowance represents management’s estimate of losses as of the date of the financial statements. The allowance includes an allocated component for impaired loans and a general component for pools of non-impaired loans.
The adequacy of the allowance for loan losses is evaluated on a regular basis by management and is based upon management’s periodic review of the collectability of the loans in light of historical experience, the size and composition of the loan portfolio, adverse situations that may affect the borrower’s ability to repay, estimated value of any underlying collateral and prevailing economic conditions. This evaluation is inherently subjective as it requires estimates that are susceptible to significant revision as more information becomes available.
43
Table of Contents
While management believes that it uses the best information available to establish the allowance for loan losses, future adjustments to the allowance may be necessary and results of operations could be adversely affected if circumstances differ substantially from the assumptions used in making its determinations. Because the estimation of inherent losses cannot be made with certainty, there can be no assurance that the existing allowance for loan losses is adequate or that increases will not be necessary should the quality of any loan deteriorate as a result of the factors noted above. Any material increase in the allowance for loan losses may adversely affect the financial condition and results of operations and will be recorded in the period in which the circumstances become known.
Other-than-temporary Impairment of Securities. In analyzing a debt issuer’s financial condition, management considers whether the securities are issued by the federal government or its agencies, whether downgrades by bond rating agencies have occurred, industry analysts’ reports and, to a lesser extent given the relatively insignificant levels of depreciation in our debt portfolio, spread differentials between the effective rates on instruments in the portfolio compared to risk-free rates. Management evaluates securities for other-than-temporary impairment at least on a quarterly basis, and more frequently when economic or market concerns warrant such evaluation.
From time to time, management’s intent to hold depreciated debt securities to recovery or maturity may change as a result of prudent portfolio management. If management’s intent changes, unrealized losses are recognized either as impairment charges to the consolidated income statement or as realized losses if a sale has been executed. In most instances, management sells the securities at the time their intent changes.
In analyzing an equity issuer’s financial condition, management considers industry analysts’ reports, financial performance and projected target prices of investment analysts within a one-year time frame. A decline of 10% or more in the value of an acquired equity security is generally the triggering event for management to review individual securities for liquidation and/or classification as other-than-temporarily impaired. Impairment losses are recognized when management concludes that declines in the value of equity securities are other than temporary, or when they can no longer assert that they have the intent and ability to hold depreciated equity securities for a period of time sufficient to allow for any anticipated recovery in fair value. Unrealized losses on marketable equity securities that are in excess of 25% of cost and that have been sustained for more than twelve months are generally considered-other-than temporary and charged to earnings as impairment losses, or realized through sale of the security.
Business Strategy
We emphasize responsive and personalized service to our customers. Due to the consolidation of financial institutions in our market, we continue to believe there is a significant opportunity for a community-focused bank to provide a full range of financial services to small and middle-market commercial and retail customers. By offering quicker decision making in the delivery of banking products and services, offering customized products where appropriate, and providing customer access to our senior managers, we distinguish ourselves from larger, regional banks operating in our market areas, while our larger capital base and product mix enable us to compete effectively against smaller banks. As a result, we believe we have a substantial opportunity to attract experienced management, loan officers and banking customers. We believe this will provide us a competitive advantage as we continue to expand into attractive, high growth markets within the Boston metropolitan area through the establishment of de novo bank branch offices, the potential acquisition of community banks and bank branches, and organic expansion where possible by growing our existing branches in their respective communities.
Our strategies center on the continued enhancement of our full-service, community-oriented Bank, including the expansion of our branch network to more adequately cover the large geography of the Boston metropolitan area. In order to realize these objectives, we are pursuing the following strategies:
Emphasizing growth in commercial lending. We have diversified our loan portfolio by increasing the percentage of our assets consisting of higher-yielding commercial and industrial loans and commercial real estate loans with higher risk-adjusted returns, shorter maturities and more sensitivity to interest rate fluctuations, while still providing high quality loan products for single-family residential borrowers. We have a highly competitive suite of cash management services, technology solutions, and internal support expertise specific to the needs of
44
Table of Contents
our commercial business customers. Our lending staff is experienced and knowledgeable about local commercial business in our markets, enabling us to build on the relationship-style banking that is our hallmark. We also continue to review the products we offer to provide diversification of revenue sources and to enhance our customer relationships.
Hiring experienced employees with a customer service focus. We have been successful in attracting and retaining banking professionals with strong community relationships and significant knowledge of our markets, which is central to our business strategy. Exceptional service, local involvement and timely decision making are integral parts of our business strategy, and we have attracted highly qualified and highly motivated individuals. We believe that by focusing on experienced bankers who are established in their communities, we enhance our market position and add profitable growth opportunities. Our compensation and incentive systems are aligned with our strategies to grow core deposits and commercial loans, while maintaining superior asset quality. We have a strong corporate culture based on personal accountability, high ethical standards and significant training opportunities, which is supported by our commitment to career development and promotion from within the organization.
Improving profitability through geographic expansion within our market area, disciplined pricing, expense control and balance sheet management. We have achieved many milestones over the last five years as we have grown total assets to $5.299 billion at December 31, 2017 from $2.682 billion at December 31, 2013. On December 29, 2017, the Company completed its acquisition of Meetinghouse, which added $120.4 million in total assets at fair value. Since 2007, we have opened 14 de novo branches and one mobile branch, and acquired six branch offices in our 2010 acquisition of Mt. Washington Co-operative Bank, and two branch offices in our acquisition of Meetinghouse Bank. We intend to continue our geographic expansion in the greater Boston metropolitan area by opening de novo branches in communities contiguous to those we currently serve, as opportunities present themselves in favorable locations. We have also focused significant efforts and invested heavily in our infrastructure to support future growth, creating brand awareness, competitive products and a strong and experienced workforce. We believe these initiatives have positioned us well to implement a strategy focused on improving operating efficiency and earnings growth. While we expect to continue to strive for an appropriate level of loan and deposit growth, we will keenly focus on enhancing our profitability by exercising a disciplined approach to product pricing, expense control and balance sheet mix.
Expanding our presence and market share in contiguous and nearby market areas and capturing business opportunities resulting from changes in the competitive environment. Over the last several years, our markets have been subject to large-scale consolidation of local community banks, primarily by larger, out-of-state financial institutions. We believe there is a large customer base in our market that prefers doing business with a local institution and may be dissatisfied with the service received from larger regional banks. We believe that opportunities currently exist in contiguous and nearby market areas to grow our franchise and to complement our primary market areas. In addition, by delivering high quality, customer-focused products and services, we expect to attract additional borrowers and depositors and thus increase our market share and revenue generation.
We believe the success of our strategy is evidenced by the growth of our deposits to $4.108 billion at December 31, 2017 from $2.249 billion at December 31, 2013, and net loans, which increased to $4.623 billion at December 31, 2017 from $2.265 billion at December 31, 2013. We also believe that community bank consolidation will continue to take place and further believe that, with our capital and liquidity positions, we will be positioned to take advantage of industry consolidation through de novo branching, potential acquisition of individual branches, and the potential for whole bank acquisitions. Our focus will be on the Massachusetts markets we know and understand, with a primary view toward continued growth in the Boston metropolitan area. We believe our management team’s unique understanding of the Massachusetts market facilitates our growth into locations that will provide the right complement to our existing franchise and geographic footprint.
It is our intention to achieve significant market penetration in a relatively short period of time when we enter a new market. In advance of any branch expansion we hire experienced local bankers and make a concerted effort to establish as many high profile contacts as possible in the new target area. We are focused on generating key loan relationships and capturing significant deposit market share in our markets. Upon commencement of
45
Table of Contents
operations in a new location, we monitor and aggressively pursue a core deposit strategy that enhances profitability and we believe provides quality market penetration in the most expedient manner.
Managing credit risk to maintain a low level of nonperforming assets, and interest rate risk to optimize our net interest margin. Managing risk is an essential part of successfully managing a financial institution. Credit risk and interest rate risk are two prominent risk exposures that we face. Credit risk is the risk of not collecting the interest and/or the principal balance of a loan or investment when it is due. Our strategy for credit risk management focuses on having well-defined credit policies and uniform underwriting criteria and providing prompt attention to potential problem loans. We believe that strong asset quality is a key to long-term financial success. We have sought to grow and diversify the loan portfolio, while maintaining strong asset quality and moderate credit risk, using conservative underwriting standards, as well as diligent monitoring of the portfolio and loans in non-accrual status and on-going collection efforts. Although we will continue to originate commercial real estate, multi-family, commercial and industrial, and construction loans, we intend to continue our philosophy of managing large loan exposures through our experienced, risk-based approach to lending. In addition, we intend to remain focused on lending within our immediate market area, with a specific focus on commercial customers disaffected by their relationships with larger banks as a result of turmoil in the industry.
Interest rate risk is the potential reduction of net interest income as a result of changes in interest rates. Our earnings and the market value of our assets and liabilities are subject to fluctuations caused by changes in the level of interest rates. We manage the interest rate sensitivity of our interest-bearing liabilities and interest-earning assets in an effort to minimize the adverse effects of changes in the interest rate environment. To reduce the potential volatility of our earnings, we have sought to improve the match between asset and liability maturities and rates, while maintaining an acceptable interest rate spread. Our strategy for managing interest rate risk emphasizes: originating loans with adjustable interest rates; selling the residential real estate fixed-rate loans with terms 10 years or greater that we originate; promoting core deposit products; and adjusting the interest rates and maturities of funding sources, as necessary.
Increasing core deposits through aggressive marketing and the offering of new deposit products. Deposits are our primary source of funds for investing and lending. Core deposits, which include all deposit account types except certificates of deposit, comprised 66.6% of our total deposits at December 31, 2017. We value our core deposits because they represent a lower cost of funding and are generally less sensitive to withdrawal when interest rates fluctuate as compared to certificate of deposit accounts. We market core deposits through the internet, in-branch and local mail, print and television advertising, as well as programs that link various accounts and services together, minimizing service fees. We will continue to customize existing deposit products and introduce new products to meet the needs of our customers.
Balance Sheet Analysis
Assets. Our total assets increased $863.5 million, or 19.5%, to $5.299 billion at December 31, 2017 from $4.436 billion at December 31, 2016. Net loans increased $724.1 million, or 18.6%, to $4.623 billion at December 31, 2017 from $3.899 billion at December 31, 2016. Cash and due from banks increased $166.3 million, or 70.3%, to $402.7 million at December 31, 2017 from $236.4 million at December 31, 2016. Certificates of deposit decreased $11.0 million, or 13.7%, to $69.3 million at December 31, 2017 from $80.3 million at December 31, 2016, primarily due to maturities of $35.1 million, partially offset by purchases of $22.7 million. Securities available for sale decreased $29.3 million, or 43.3%, to $38.4 million at December 31, 2017 from $67.7 million at December 31, 2016.
Loan Portfolio Analysis. At December 31, 2017, net loans were $4.623 billion, or 87.2% of total assets. During the year ended December 31, 2017, net loans increased $724.1 million, or 18.6%, including $73.6 million of loans acquired in the Meetinghouse acquisition. Loan originations totaled $1.763 billion during the year ended December 31, 2017. The increase in net loans consisted primarily of $287.2 million in commercial real estate loans, $216.7 million in multi-family loans, $138.6 million in construction loans, $10.2 million in commercial and industrial loans and $71.2 million in one- to four-family loans.
Our loan portfolio consists of one- to four-family residential real estate, multi-family, home equity lines of credit, commercial real estate, construction, commercial and industrial and consumer segments. There are no
46
Table of Contents
foreign loans outstanding. Interest rates charged on loans are affected principally by the demand for such loans, the supply of money available for lending purposes and the rates offered by our competitors. Loan detail by category was as follows:
| At December 31, | ||||||||||||||||||||||||||||||||||||||||
| 2017 | 2016 | 2015 | 2014 | 2013 | ||||||||||||||||||||||||||||||||||||
| Amount | Percent | Amount | Percent | Amount | Percent | Amount | Percent | Amount | Percent | |||||||||||||||||||||||||||||||
| (Dollars in thousands) | ||||||||||||||||||||||||||||||||||||||||
| Real estate loans: |
||||||||||||||||||||||||||||||||||||||||
| Residential real estate: |
||||||||||||||||||||||||||||||||||||||||
| One- to four-family |
$ | 603,680 | 12.9 | % | $ | 532,450 | 13.5 | % | $ | 458,423 | 14.9 | % | $ | 468,560 | 17.5 | % | $ | 454,148 | 19.8 | % | ||||||||||||||||||||
| Multi-family |
779,637 | 16.7 | 562,948 | 14.3 | 417,388 | 13.5 | 409,675 | 15.3 | 288,172 | 12.6 | ||||||||||||||||||||||||||||||
| Home equity lines of credit |
48,393 | 1.0 | 42,913 | 1.1 | 46,660 | 1.5 | 50,091 | 1.9 | 54,499 | 2.4 | ||||||||||||||||||||||||||||||
| Commercial real estate |
2,063,781 | 44.2 | 1,776,601 | 45.1 | 1,328,344 | 43.1 | 1,145,820 | 42.8 | 1,032,408 | 45.0 | ||||||||||||||||||||||||||||||
| Construction |
641,306 | 13.7 | 502,753 | 12.8 | 421,531 | 13.7 | 265,980 | 9.9 | 208,799 | 9.1 | ||||||||||||||||||||||||||||||
|
|
|
|
|
|
|
|
|
|
|
|
|
|
|
|
|
|
|
|
|
|||||||||||||||||||||
| Total real estate loans |
4,136,797 | 88.5 | 3,417,665 | 86.8 | 2,672,346 | 86.7 | 2,340,126 | 87.4 | 2,038,026 | 88.9 | ||||||||||||||||||||||||||||||
| Commercial and industrial |
525,604 | 11.3 | 515,430 | 13.0 | 400,051 | 13.0 | 330,813 | 12.3 | 247,005 | 10.8 | ||||||||||||||||||||||||||||||
| Consumer |
10,761 | 0.2 | 9,712 | 0.2 | 10,028 | 0.3 | 8,772 | 0.3 | 7,225 | 0.3 | ||||||||||||||||||||||||||||||
|
|
|
|
|
|
|
|
|
|
|
|
|
|
|
|
|
|
|
|
|
|||||||||||||||||||||
| Total loans |
4,673,162 | 100.0 | % | 3,942,807 | 100.0 | % | 3,082,425 | 100.0 | % | 2,679,711 | 100.0 | % | 2,292,256 | 100.0 | % | |||||||||||||||||||||||||
|
|
|
|
|
|
|
|
|
|
|
|||||||||||||||||||||||||||||||
| Allowance for loan losses |
(45,185 | ) | (40,149 | ) | (33,405 | ) | (28,469 | ) | (25,335 | ) | ||||||||||||||||||||||||||||||
| Net deferred loan origination costs |
(5,179 | ) | (3,990 | ) | (3,778 | ) | (2,335 | ) | (1,521 | ) | ||||||||||||||||||||||||||||||
|
|
|
|
|
|
|
|
|
|
|
|||||||||||||||||||||||||||||||
| Loans, net |
$ | 4,622,798 | $ | 3,898,668 | $ | 3,045,242 | $ | 2,648,907 | $ | 2,265,400 | ||||||||||||||||||||||||||||||
|
|
|
|
|
|
|
|
|
|
|
|||||||||||||||||||||||||||||||
Loan Maturity. The following table sets forth certain information at December 31, 2017 regarding the dollar amount of loan principal repayments becoming due during the periods indicated. The table does not include any estimate of prepayments which significantly shorten the average life of all loans and may cause our actual repayment experience to differ from that shown below. Demand loans having no stated schedule of repayments and no stated maturity are reported as due in one year or less. The amounts shown below exclude net deferred loan origination fees. Our adjustable-rate mortgage loans generally do not provide for downward adjustments below the initial discounted contract rate, other than declines due to a decline in the index rate.
| December 31, 2017 | ||||||||||||||||
| Real estate | Commercial and industrial |
Consumer | Total | |||||||||||||
| (In thousands) | ||||||||||||||||
| Amounts due in: |
||||||||||||||||
| One year or less |
$ | 229,373 | $ | 48,608 | $ | 604 | $ | 278,585 | ||||||||
| More than one to five years |
510,100 | 41,438 | 10,157 | 561,695 | ||||||||||||
| More than five to ten years |
876,417 | 94,218 | — | 970,635 | ||||||||||||
| More than ten years |
2,520,907 | 341,340 | — | 2,862,247 | ||||||||||||
|
|
|
|
|
|
|
|
|
|||||||||
| Total |
$ | 4,136,797 | $ | 525,604 | $ | 10,761 | $ | 4,673,162 | ||||||||
|
|
|
|
|
|
|
|
|
|||||||||
| Interest rate terms on amounts due after one year: |
||||||||||||||||
| Fixed-rate loans |
$ | 934,055 | $ | 108,978 | $ | 10,157 | $ | 1,053,190 | ||||||||
| Adjustable-rate loans |
2,973,369 | 368,018 | — | 3,341,387 | ||||||||||||
|
|
|
|
|
|
|
|
|
|||||||||
| Total |
$ | 3,907,424 | $ | 476,996 | $ | 10,157 | $ | 4,394,577 | ||||||||
|
|
|
|
|
|
|
|
|
|||||||||
47
Table of Contents
At December 31, 2017, our loan portfolio consisted of $1.188 billion of fixed-rate loans and $3.485 billion of adjustable-rate loans.
Asset Quality
Credit Risk Management. Our strategy for credit risk management focuses on having well-defined credit policies and uniform underwriting criteria and providing prompt attention to potential problem loans. Management of asset quality is accomplished by internal controls, monitoring and reporting of key risk indicators, and both internal and independent third-party loan reviews. The primary objective of our loan review process is to measure borrower performance and assess risk for the purpose of identifying loan weakness in order to minimize loan loss exposure. From the time of loan origination through final repayment, multi-family, commercial real estate, construction, and commercial and industrial loans are assigned a risk rating based on pre-determined criteria and levels of risk. The risk rating is monitored annually for most loans; however, it may change during the life of the loan as appropriate.
Internal and independent third-party loan reviews vary by loan type, as well as the size and complexity of the loan. Depending on the size and complexity of the loan, some loans may warrant detailed individual review, while other loans may have less risk based upon size, or be of a homogeneous nature reducing the need for detailed individual analysis. Assets with these characteristics, such as consumer loans and loans secured by residential real estate, may be reviewed on the basis of risk indicators such as delinquency or credit rating. In cases of significant concern, a total re-evaluation of the loan and associated risks are documented by completing a loan risk assessment and action plan. Some loans may be re-evaluated in terms of their fair market value or net realizable value in order to determine the likelihood of potential loss exposure and, consequently, the adequacy of specific and general loan loss reserves.
When a borrower fails to make a required loan payment, we take a number of steps to have the borrower cure the delinquency and restore the loan to current status, including contacting the borrower by letter and phone at regular intervals. When the borrower is in default, we may commence collection proceedings. If a foreclosure action is instituted and the loan is not brought current, paid in full, or refinanced before the foreclosure sale, the real property securing the loan generally is sold at foreclosure. Management informs the Executive Committee monthly of the amount of loans delinquent more than 30 days. Management provides detailed information to the Board of Directors on loans 60 or more days past due and all loans in foreclosure and property that we own.
Delinquencies. Total past due loans decreased $3.9 million, or 37.0%, to $6.6 million at December 31, 2017 from $10.4 million at December 31, 2016, reflecting decreases of $4.4 million in loans 90 days or greater past due, partially offset by an increase of $507,000 in loans 30 to 89 days past due. The decrease in loans 90 days or greater past due was primarily due to the foreclosure of a $2.0 million commercial real estate property and a general decrease in delinquent residential mortgages. Additional reductions were also across all categories of loans 90 days or greater past due. At December 31, 2017 and 2016, non-accrual loans exceeded loans 90 days or greater past due primarily due to loans which were placed on non-accrual status based on a determination that the ultimate collection of all principal and interest due was not expected and certain loans remain on non-accrual status until they attain a sustained payment history of six consecutive months.
Non-performing Assets. Non-performing assets include loans that are 90 or more days past due or on non-accrual status, including troubled debt restructurings (“TDRs”) on non-accrual status, and real estate and other loan collateral acquired through foreclosure. Loans 90 days or greater past due may remain on an accrual basis if adequately collateralized and in the process of collection. At December 31, 2017 and 2016, we did not have any accruing loans past due 90 days or greater. For non-accrual loans, interest previously accrued but not collected is reversed and charged against income at the time a loan is placed on non-accrual status. Loans are returned to accrual status when all the principal and interest amounts contractually due are brought current and future payments are reasonably assured.
Real estate that we acquire as a result of foreclosure or by deed-in-lieu of foreclosure is classified as foreclosed real estate until it is sold. When property is acquired, it is initially recorded at the fair value less estimated costs to sell at the date of foreclosure, establishing a new cost basis. Holding costs and declines in fair
48
Table of Contents
value after acquisition of the property result in charges against income. The recorded investment of consumer mortgage loans secured by residential real estate properties for which formal foreclosure proceedings are in process according to local requirements of the applicable jurisdiction totaled $1.5 million at December 31, 2017. The following table provides information with respect to our non-performing assets at the dates indicated.
| At December 31, | ||||||||||||||||||||
| 2017 | 2016 | 2015 | 2014 | 2013 | ||||||||||||||||
| (Dollars in thousands) | ||||||||||||||||||||
| Loans accounted for on a non-accrual basis: |
||||||||||||||||||||
| Real estate loans: |
||||||||||||||||||||
| Residential real estate: |
||||||||||||||||||||
| One- to four-family |
$ | 6,890 | $ | 8,487 | $ | 9,264 | $ | 14,649 | $ | 17,622 | ||||||||||
| Home equity lines of credit |
562 | 674 | 1,763 | 2,277 | 2,689 | |||||||||||||||
| Commercial real estate |
388 | 2,807 | 3,663 | 5,311 | 8,972 | |||||||||||||||
| Construction |
— | 815 | 15,849 | 8,417 | 11,298 | |||||||||||||||
|
|
|
|
|
|
|
|
|
|
|
|||||||||||
| Total real estate loans |
7,840 | 12,783 | 30,539 | 30,654 | 40,581 | |||||||||||||||
| Commercial and industrial |
523 | 653 | 805 | 855 | 949 | |||||||||||||||
|
|
|
|
|
|
|
|
|
|
|
|||||||||||
| Total non-accrual loans (1) |
8,363 | 13,436 | 31,344 | 31,509 | 41,530 | |||||||||||||||
| Foreclosed assets |
— | — | — | 1,046 | 1,390 | |||||||||||||||
|
|
|
|
|
|
|
|
|
|
|
|||||||||||
| Total non-performing assets |
$ | 8,363 | $ | 13,436 | $ | 31,344 | $ | 32,555 | $ | 42,920 | ||||||||||
|
|
|
|
|
|
|
|
|
|
|
|||||||||||
| Non-accrual loans to total loans |
0.18 | % | 0.34 | % | 1.02 | % | 1.18 | % | 1.81 | % | ||||||||||
| Non-accrual loans to total assets |
0.16 | % | 0.30 | % | 0.89 | % | 0.96 | % | 1.55 | % | ||||||||||
| Non-performing assets to total assets |
0.16 | % | 0.30 | % | 0.89 | % | 0.99 | % | 1.60 | % | ||||||||||
| (1) | TDRs on accrual status not included above totaled $12.7 million at December 31, 2017, $13.3 million at December 31, 2016, $14.2 million at December 31, 2015, $14.5 million at December 31, 2014 and $4.1 million at December 31, 2013. |
Non-performing assets were $8.4 million or 0.16% of total assets, at December 31, 2017, compared to $13.4 million, or 0.30% of total assets, at December 31, 2016. We recognized $400,000 of interest income on non-accrual loans for the year ended December 31, 2017. Additional interest income that would have been recorded for the year ended December 31, 2017 had non-accruing loans been current according to their original terms amounted to $32,000.
Non-accrual loans decreased $5.1 million, or 37.8%, to $8.4 million, or 0.18% of total loans outstanding at December 31, 2017, from $13.4 million, or 0.34% of total loans outstanding at December 31, 2016, primarily due to a $2.4 million decrease in non-accrual commercial real estate loans, a $1.6 million decrease in non-accrual one- to four-family loans and a $815,000 decrease in non-accrual construction loans.
Achieving and maintaining a moderate risk profile by aggressively managing troubled assets has been and will continue to be a primary focus for us. At December 31, 2017, our allowance for loan losses was $45.2 million, or 0.97% of total loans and 540.30% of non-accrual loans, compared to $40.1 million, or 1.02% of total loans and 298.82% of non-accrual loans at December 31, 2016. We increased our allowance primarily as a result of growth in the loan portfolio, and in particular commercial loans, and changes in the composition of the loan portfolio. Included in our allowance at December 31, 2017 was a general component of $45.0 million, which is based upon our evaluation of various factors relating to loans not deemed to be impaired. We continue to believe our level of non-performing loans and assets, which declined significantly during the past two years, is manageable and we believe that we have sufficient capital and human resources to manage the collection of our non-performing assets in an orderly fashion.
49
Table of Contents
The Company did not hold any foreclosed real estate at December 31, 2017 and 2016. We continue to be actively engaged with our borrowers in resolving remaining problem assets and with the effective management of real estate owned as a result of foreclosures.
Troubled Debt Restructurings. In the course of resolving loans of borrowers with financial difficulties, we may choose to restructure the contractual terms of certain loans, with terms modified to fit the ability of the borrower to repay in line with its current financial status. A loan is considered a TDR if, for reasons related to the debtor’s financial difficulties, a concession is granted to the debtor that would not otherwise be considered.
The following table summarizes our TDRs at the dates indicated.
| At December 31, | ||||||||||||||||||||
| 2017 | 2016 | 2015 | 2014 | 2013 | ||||||||||||||||
| (In thousands) | ||||||||||||||||||||
| TDRs on accrual status: |
||||||||||||||||||||
| One- to four-family |
$ | 2,125 | $ | 2,219 | $ | 2,621 | $ | 2,946 | $ | 2,588 | ||||||||||
| Multi-family |
1,315 | 1,359 | 1,402 | 1,443 | 109 | |||||||||||||||
| Home equity lines of credit |
— | 18 | 18 | 20 | 21 | |||||||||||||||
| Commercial real estate |
9,200 | 9,460 | 9,968 | 9,950 | 1,368 | |||||||||||||||
| Construction |
— | 174 | 174 | 121 | — | |||||||||||||||
| Commercial and industrial |
20 | 27 | 33 | — | — | |||||||||||||||
|
|
|
|
|
|
|
|
|
|
|
|||||||||||
| Total TDRs on accrual status |
12,660 | 13,257 | 14,216 | 14,480 | 4,086 | |||||||||||||||
|
|
|
|
|
|
|
|
|
|
|
|||||||||||
| TDRs on non-accrual status: |
||||||||||||||||||||
| One- to four-family |
1,046 | 1,123 | 1,261 | 1,469 | 1,500 | |||||||||||||||
| Commercial real estate |
— | — | 528 | 283 | 4,309 | |||||||||||||||
| Construction |
— | — | 1,136 | 6,496 | 9,489 | |||||||||||||||
| Commercial and industrial |
— | — | 186 | 186 | 192 | |||||||||||||||
|
|
|
|
|
|
|
|
|
|
|
|||||||||||
| Total TDRs on non-accrual status |
1,046 | 1,123 | 3,111 | 8,434 | 15,490 | |||||||||||||||
|
|
|
|
|
|
|
|
|
|
|
|||||||||||
| Total TDRs |
$ | 13,706 | $ | 14,380 | $ | 17,327 | $ | 22,914 | $ | 19,576 | ||||||||||
|
|
|
|
|
|
|
|
|
|
|
|||||||||||
Total TDRs decreased $674,000, or 4.7%, to $13.7 million at December 31, 2017 from $14.4 million at December 31, 2016, due to decreases of $597,000 in TDRs on accrual status and $77,000 in TDRs on non-accrual status, reflecting principal paydowns. Modifications of TDRs consist of rate reductions, loan term extensions or provisions for interest-only payments for specified periods up to 12 months. We have generally been successful with the concessions we have offered to borrowers to date. We generally return TDRs to accrual status when they have sustained payments for six consecutive months based on the restructured terms and future payments are reasonably assured. We recognized $603,000 of interest income on TDRs for the year ended December 31, 2017.
Potential Problem Loans. Certain loans are identified during our loan review process that are currently performing in accordance with their contractual terms and we ultimately expect to receive payment in full of principal and interest, but it is deemed probable that we will be unable to collect all the scheduled payments of principal or interest when due according to the contractual terms of the loan agreement. This may result from deteriorating conditions such as cash flows, collateral values or creditworthiness of the borrower. These loans are classified as impaired but are not accounted for on a non-accrual basis.
Other potential problem loans are those loans that are currently performing, but where known information about possible credit problems of the borrowers causes us to have concerns as to the ability of such borrowers to comply with contractual loan repayment terms. These other potential problem loans are generally loans classified as “substandard” or 8-rated loans in accordance with our ten-grade internal loan rating system that is consistent with guidelines established by banking regulators. At December 31, 2017, other potential problem loans totaled $49.0 million, including $43.4 million of commercial and industrial loans, $3.1 million of multi-family loans and
50
Table of Contents
$2.5 million of commercial real estate loans. The $43.4 million of commercial and industrial loan relationships classified as substandard are comprised of two loans to non-profit educational organizations in eastern Massachusetts with loan balances of $24.4 million and $19.0 million that were identified during our loan review process as having possible financial issues that, if not corrected, could result in some loss to the Company. It was determined that both of these loan relationships are performing in accordance with the terms of their loans with the current expectation that we will be repaid in full in accordance with those terms, but with continual credit monitoring of the relationships.
Allowance for Loan Losses. The allowance for loan losses is maintained at levels considered adequate by management to provide for probable loan losses inherent in the loan portfolio as of the consolidated balance sheet reporting dates. The allowance for loan losses is based on management’s assessment of various factors affecting the loan portfolio, including portfolio composition, delinquent and non-accrual loans, national and local business conditions and loss experience and an overall evaluation of the quality of the underlying collateral.
Changes in the allowance for loan losses during the years indicated were as follows:
| Years Ended December 31, | ||||||||||||||||||||
| 2017 | 2016 | 2015 | 2014 | 2013 | ||||||||||||||||
| (Dollars in thousands) | ||||||||||||||||||||
| Beginning balance |
$ | 40,149 | $ | 33,405 | $ | 28,469 | $ | 25,335 | $ | 20,504 | ||||||||||
| Provision for loan losses |
4,859 | 7,180 | 6,667 | 3,313 | 6,470 | |||||||||||||||
| Charge-offs: |
||||||||||||||||||||
| One- to four-family |
98 | — | 165 | 54 | 531 | |||||||||||||||
| Multi-family |
— | — | — | — | 96 | |||||||||||||||
| Home equity lines of credit |
— | — | 60 | 5 | — | |||||||||||||||
| Commercial real estate |
— | — | — | 116 | — | |||||||||||||||
| Construction |
3 | 486 | 2,287 | 71 | 1,362 | |||||||||||||||
| Commercial and industrial |
— | 49 | 36 | 72 | 288 | |||||||||||||||
| Consumer |
340 | 302 | 306 | 187 | 283 | |||||||||||||||
|
|
|
|
|
|
|
|
|
|
|
|||||||||||
| Total charge-offs |
441 | 837 | 2,854 | 505 | 2,560 | |||||||||||||||
|
|
|
|
|
|
|
|
|
|
|
|||||||||||
| Recoveries: |
||||||||||||||||||||
| One- to four-family |
104 | — | 116 | 67 | 232 | |||||||||||||||
| Multi-family |
1 | — | — | — | — | |||||||||||||||
| Home equity lines of credit |
1 | — | — | — | — | |||||||||||||||
| Commercial real estate |
310 | — | 18 | 30 | — | |||||||||||||||
| Construction |
51 | 230 | 881 | 137 | 555 | |||||||||||||||
| Commercial and industrial |
30 | 60 | 1 | 8 | 24 | |||||||||||||||
| Consumer |
121 | 111 | 107 | 84 | 110 | |||||||||||||||
|
|
|
|
|
|
|
|
|
|
|
|||||||||||
| Total recoveries |
618 | 401 | 1,123 | 326 | 921 | |||||||||||||||
|
|
|
|
|
|
|
|
|
|
|
|||||||||||
| Net (charge-offs) recoveries |
177 | (436 | ) | (1,731 | ) | (179 | ) | (1,639 | ) | |||||||||||
|
|
|
|
|
|
|
|
|
|
|
|||||||||||
| Ending balance |
$ | 45,185 | $ | 40,149 | $ | 33,405 | $ | 28,469 | $ | 25,335 | ||||||||||
|
|
|
|
|
|
|
|
|
|
|
|||||||||||
| Allowance to non-accrual loans |
540.30 | % | 298.82 | % | 106.58 | % | 90.35 | % | 61.00 | % | ||||||||||
| Allowance to total loans outstanding |
0.97 | % | 1.02 | % | 1.08 | % | 1.06 | % | 1.11 | % | ||||||||||
| Net (charge-offs) recoveries to average loans outstanding |
0.00 | % | (0.01 | )% | (0.06 | )% | (0.01 | )% | (0.08 | )% | ||||||||||
Our provision for loan losses was $4.9 million for the year ended December 31, 2017 compared to $7.2 million for the year ended December 31, 2016 and $6.7 million for the year ended December 31, 2015. The allowance for loan losses was $45.2 million or 0.97% of total loans at December 31, 2017, compared to $40.1 million or 1.02% of total loans at December 31, 2016 and $33.4 million or 1.08% of total loans at
51
Table of Contents
December 31, 2015. The changes in the provision were based on management’s assessment of loan portfolio growth and composition changes, declines in historical charge-off trends, reduced levels of problem loans and other improving asset quality trends. The reduction in the provision for loan losses for the year ended December 31, 2017 reflects improvement in these asset quality factors during the year. The increases in the overall allowance for loan losses at December 31, 2017, 2016 and 2015 were primarily due to increases in the multi-family, commercial real estate, construction, and commercial and industrial loan categories. We continue to assess the adequacy of our allowance for loan losses in accordance with established policies.
The following tables set forth the breakdown of the allowance for loan losses by loan category at the dates indicated:
| At December 31, | ||||||||||||||||||||||||||||||||||||
| 2017 | 2016 | 2015 | ||||||||||||||||||||||||||||||||||
| Amount |
Percent of Allowance to Total Allowance |
Percent of Loans in Category of Total Loans |
Amount | Percent of Allowance to Total Allowance |
Percent of Loans in Category of Total Loans |
Amount | Percent of Allowance to Total Allowance |
Percent of Loans in Category of Total Loans |
||||||||||||||||||||||||||||
| (Dollars in thousands) | ||||||||||||||||||||||||||||||||||||
| Real estate loans: |
||||||||||||||||||||||||||||||||||||
| Residential real estate: |
||||||||||||||||||||||||||||||||||||
| One- to four-family |
$ | 1,001 | 2.2 | % | 12.9 | % | $ | 1,367 | 3.4 | % | 13.5 | % | $ | 1,354 | 4.1 | % | 14.9 | % | ||||||||||||||||||
| Multi-family |
6,263 | 13.9 | 16.7 | 4,514 | 11.2 | 14.3 | 3,385 | 10.1 | 13.5 | |||||||||||||||||||||||||||
| Home equity lines of credit |
62 | 0.1 | 1.0 | 73 | 0.2 | 1.1 | 144 | 0.4 | 1.5 | |||||||||||||||||||||||||||
| Commercial real estate |
21,513 | 47.6 | 44.2 | 18,725 | 46.7 | 45.1 | 14,497 | 43.4 | 43.1 | |||||||||||||||||||||||||||
| Construction |
10,166 | 22.5 | 13.7 | 8,931 | 22.2 | 12.8 | 8,313 | 24.9 | 13.7 | |||||||||||||||||||||||||||
|
|
|
|
|
|
|
|
|
|
|
|
|
|
|
|
|
|
|
|||||||||||||||||||
| Total real estate loans |
39,005 | 86.3 | 88.5 | 33,610 | 83.7 | 86.8 | 27,693 | 82.9 | 86.7 | |||||||||||||||||||||||||||
| Commercial and industrial |
6,084 | 13.5 | 11.3 | 6,452 | 16.1 | 13.0 | 5,620 | 16.8 | 13.0 | |||||||||||||||||||||||||||
| Consumer |
96 | 0.2 | 0.2 | 87 | 0.2 | 0.2 | 92 | 0.3 | 0.3 | |||||||||||||||||||||||||||
|
|
|
|
|
|
|
|
|
|
|
|
|
|
|
|
|
|
|
|||||||||||||||||||
| Total loans |
$ | 45,185 | 100.0 | % | 100.0 | % | $ | 40,149 | 100.0 | % | 100.0 | % | $ | 33,405 | 100.0 | % | 100.0 | % | ||||||||||||||||||
|
|
|
|
|
|
|
|
|
|
|
|
|
|
|
|
|
|
|
|||||||||||||||||||
| At December 31, | ||||||||||||||||||||||||
| 2014 | 2013 | |||||||||||||||||||||||
| Amount | Percent of Allowance to Total Allowance |
Percent of Loans in Category of Total Loans |
Amount | Percent of Allowance to Total Allowance |
Percent of Loans in Category of Total Loans |
|||||||||||||||||||
| (Dollars in thousands) | ||||||||||||||||||||||||
| Real estate loans: |
||||||||||||||||||||||||
| Residential real estate: |
||||||||||||||||||||||||
| One- to four-family |
$ | 1,849 | 6.5 | % | 17.5 | % | $ | 1,991 | 7.9 | % | 19.8 | % | ||||||||||||
| Multi-family |
3,635 | 12.8 | 15.3 | 2,419 | 9.5 | 12.6 | ||||||||||||||||||
| Home equity lines of credit |
100 | 0.4 | 1.9 | 155 | 0.6 | 2.4 | ||||||||||||||||||
| Commercial real estate |
13,000 | 45.6 | 42.8 | 12,831 | 50.6 | 45.0 | ||||||||||||||||||
| Construction |
5,155 | 18.1 | 9.9 | 4,374 | 17.3 | 9.1 | ||||||||||||||||||
|
|
|
|
|
|
|
|
|
|
|
|
|
|||||||||||||
| Total real estate loans |
23,739 | 83.4 | 87.4 | 21,770 | 85.9 | 88.9 | ||||||||||||||||||
| Commercial and industrial |
4,633 | 16.3 | 12.3 | 3,433 | 13.6 | 10.8 | ||||||||||||||||||
| Consumer |
97 | 0.3 | 0.3 | 132 | 0.5 | 0.3 | ||||||||||||||||||
|
|
|
|
|
|
|
|
|
|
|
|
|
|||||||||||||
| Total loans |
$ | 28,469 | 100.0 | % | 100.0 | % | $ | 25,335 | 100.0 | % | 100.0 | % | ||||||||||||
|
|
|
|
|
|
|
|
|
|
|
|
|
|||||||||||||
52
Table of Contents
The allowance consists of general and allocated components. The general component relates to pools of non-impaired loans and is based on historical loss experience adjusted for qualitative factors. The allocated component relates to loans that are classified as impaired. A loan is considered impaired when, based on current information and events, it is probable that we will be unable to collect the scheduled payments of principal or interest when due according to the contractual terms of the loan agreement. Factors considered by management in determining impairment include payment status, collateral value and the probability of collecting scheduled principal and interest payments when due. Impairment is measured on a loan by loan basis by either the present value of expected future cash flows discounted at the loan’s effective interest rate, the loan’s obtainable market price, or the fair value of the collateral if the loan is collateral dependent.
We had impaired loans totaling $4.9 million and $8.4 million as of December 31, 2017 and 2016, respectively. At December 31, 2017, impaired loans totaling $1.8 million had a valuation allowance of $184,000. Impaired loans totaling $1.9 million had a valuation allowance of $186,000 at December 31, 2016. Our average recorded investment in impaired loans was $7.0 million and $19.2 million for the years ended December 31, 2017 and 2016, respectively.
Large groups of smaller balance homogeneous loans are collectively evaluated for impairment based on payment status. Accordingly, we do not separately identify individual one- to four-family residential real estate, home equity lines of credit and consumer loans for impairment disclosures, unless such loans are subject to a troubled debt restructuring. We periodically may agree to modify the contractual terms of loans. When a loan is modified and a concession is made to a borrower experiencing financial difficulty, the modification is considered a TDR. All TDRs are initially classified as impaired.
Management has reviewed the collateral value for all impaired and non-accrual loans that were collateral-dependent as of December 31, 2017 and considered any probable loss in determining the allowance for loan losses.
For residential loans measured for impairment based on the collateral value, we will do the following:
| • | When a loan becomes seriously delinquent, generally 60 days past due, we obtain third-party appraisals that are generally the basis for charge-offs when a loss is indicated, prior to the foreclosure sale, but usually no later than when such loans are 180 days past due. We generally are able to complete the foreclosure process within six to nine months from receipt of the third-party appraisal. |
| • | We make adjustments to appraisals based on updated economic information, if necessary, prior to the foreclosure sale. We review current market factors to determine whether, in management’s opinion, downward adjustments to the most recent appraised values may be warranted. If so, we use our best estimate to apply an estimated discount rate to the appraised values to reflect current market factors. |
| • | Appraisals we receive are based on comparable property sales. |
For commercial loans measured for impairment based on the collateral value, we will do the following:
| • | We obtain a third party appraisal at the time a loan is deemed to be in a workout situation and there is no indication that the loan will return to performing status, generally when the loan is 90 days or more past due. One or more updated third party appraisals are obtained prior to foreclosure depending on the foreclosure timeline. In general we order new appraisals annually on loans in the process of foreclosure. |
| • | We make downward adjustments to appraisals when conditions warrant. Adjustments are made by applying a discount to the appraised value based on occupancy, recent changes in condition to the property and certain other factors. Adjustments are also made to appraisals for construction projects involving residential properties based on recent sales of units. Losses are recognized if the appraised value less estimated costs to sell is less than our carrying value of the loan. |
| • | Appraisals we receive are generally based on a reconciliation of comparable property sales and income capitalization approaches. For loans on construction projects involving residential properties, appraisals are generally based on a discounted cash flow analysis assuming a bulk sale to a single buyer. |
53
Table of Contents
Loans that are partially charged off generally remain on non-accrual status until foreclosure or such time that they are performing in accordance with the terms of the loan and have a sustained payment history of at least six consecutive months. The accrual of interest is generally discontinued when the contractual payment of principal or interest has become 90 days past due or management has serious doubts about further collectability of principal or interest, even though the loan is currently performing. Loan losses are charged against the allowance when we believe the uncollectability of a loan balance is confirmed; for collateral-dependent loans, generally when appraised values (as adjusted values, if applicable) less estimated costs to sell, are less than our carrying values.
Although we believe that we use the best information available to establish the allowance for loan losses, future adjustments to the allowance for loan losses may be necessary and our results of operations could be adversely affected if circumstances differ substantially from the assumptions used in making the determinations. Furthermore, while we believe we have established our allowance for loan losses in conformity with generally accepted accounting principles in the United States of America, there can be no assurance that regulators, in reviewing our loan portfolio, will not require us to increase our allowance for loan losses. In addition, because future events affecting borrowers and collateral cannot be predicted with certainty, there can be no assurance that the existing allowance for loan losses is adequate or that increases will not be necessary should the quality of any loans deteriorate as a result of the factors discussed above. Any material increase in the allowance for loan losses may adversely affect our financial condition and results of operations.
Securities Portfolio
At December 31, 2017, our securities portfolio was $38.4 million, or 0.7% of total assets. During the year ended December 31, 2017, the securities portfolio decreased $29.3 million, or 43.3%, primarily due to $16.8 million in maturities, calls and principal payments, and $32.5 million in sales, partially offset by $14.3 million of securities acquired through the purchase of Meetinghouse and $8.4 million in purchases. At December 31, 2017, the securities portfolio consisted of $20.6 million, or 53.7%, in debt securities and $17.8 million, or 46.3%, in marketable equity securities. The debt securities within the portfolio are corporate bonds, government-sponsored enterprises, municipal bonds and mortgage-backed securities issued by government-sponsored enterprises and private companies. Included in marketable equity securities are common stocks and money market mutual funds. We purchase marketable equity securities with the intent to generate long-term capital gains through purchasing investment grade dividend paying securities in companies with relatively low long-term debt and a history of sustained earnings and above-average growth. We typically initiate a securities position based on market opportunities and add to our position through dollar cost averaging on a monthly basis. Refer to Note 2, Securities Available for Sale, in Notes to the Consolidated Financial Statements included in Item 8 Financial Statements and Supplementary Data within this report for more detail regarding industry concentrations in our securities portfolio.
54
Table of Contents
The following table sets forth the amortized cost and fair value of our securities, all of which at the dates indicated were available for sale.
| At December 31, | ||||||||||||||||||||||||
| 2017 | 2016 | 2015 | ||||||||||||||||||||||
| Amortized Cost |
Fair Value |
Amortized Cost |
Fair Value |
Amortized Cost |
Fair Value |
|||||||||||||||||||
| (In thousands) | ||||||||||||||||||||||||
| Debt securities: |
||||||||||||||||||||||||
| Corporate bonds |
$ | — | $ | — | $ | 13,988 | $ | 14,005 | $ | 29,429 | $ | 29,499 | ||||||||||||
| Government-sponsored enterprises |
1,942 | 1,942 | — | — | 11,000 | 10,962 | ||||||||||||||||||
| Municipal bonds |
2,424 | 2,426 | 1,202 | 1,219 | 4,326 | 4,415 | ||||||||||||||||||
| Residential mortgage-backed securities: |
||||||||||||||||||||||||
| Government-sponsored enterprises |
15,916 | 16,145 | 5,284 | 5,606 | 6,948 | 7,381 | ||||||||||||||||||
| Private label |
70 | 76 | 779 | 801 | 878 | 904 | ||||||||||||||||||
| U.S. treasury securities |
— | — | — | — | 24,996 | 24,934 | ||||||||||||||||||
|
|
|
|
|
|
|
|
|
|
|
|
|
|||||||||||||
| Total debt securities |
20,352 | 20,589 | 21,253 | 21,631 | 77,577 | 78,095 | ||||||||||||||||||
| Marketable equity securities: |
||||||||||||||||||||||||
| Common stocks |
17,071 | 17,765 | 42,770 | 46,030 | 65,683 | 62,406 | ||||||||||||||||||
| Money market mutual funds |
10 | 10 | 2 | 2 | 1,193 | 1,145 | ||||||||||||||||||
|
|
|
|
|
|
|
|
|
|
|
|
|
|||||||||||||
| Total marketable equity securities |
17,081 | 17,775 | 42,772 | 46,032 | 66,876 | 63,551 | ||||||||||||||||||
|
|
|
|
|
|
|
|
|
|
|
|
|
|||||||||||||
| Total |
$ | 37,433 | $ | 38,364 | $ | 64,025 | $ | 67,663 | $ | 144,453 | $ | 141,646 | ||||||||||||
|
|
|
|
|
|
|
|
|
|
|
|
|
|||||||||||||
At December 31, 2017, we had no investments in a single company or entity that had an aggregate book value in excess of 10% of our equity.
The following table sets forth the stated maturities and weighted average yields of the securities at December 31, 2017.
| One Year or Less | More than One Year to Five Years |
More than Five Years to Ten Years |
More than Ten Years | Total | ||||||||||||||||||||||||||||||||||||
| Amortized Cost |
Weighted Average Yield |
Amortized Cost |
Weighted Average Yield |
Amortized Cost |
Weighted Average Yield |
Amortized Cost |
Weighted Average Yield |
Amortized Cost |
Weighted Average Yield |
|||||||||||||||||||||||||||||||
| (Dollars in thousands) | ||||||||||||||||||||||||||||||||||||||||
| Debt securities: |
||||||||||||||||||||||||||||||||||||||||
| Government-sponsored enterprises |
$ | — | — | % | $ | — | — | % | $ | 1,339 | 2.26 | % | $ | 603 | 2.45 | % | $ | 1,942 | 2.32 | % | ||||||||||||||||||||
| Municipal bonds |
325 | 3.71 | — | — | 2,099 | 2.87 | — | — | 2,424 | 2.99 | ||||||||||||||||||||||||||||||
| Residential mortgage-backed securities: |
||||||||||||||||||||||||||||||||||||||||
| Government-sponsored enterprises |
— | — | 109 | 2.53 | 1,392 | 3.31 | 14,415 | 3.33 | 15,916 | 3.32 | ||||||||||||||||||||||||||||||
| Private label |
— | — | — | — | — | — | 70 | 4.04 | 70 | 4.04 | ||||||||||||||||||||||||||||||
|
|
|
|
|
|
|
|
|
|
|
|||||||||||||||||||||||||||||||
| Total debt securities |
$ | 325 | 3.71 | % | $ | 109 | 2.53 | % | $ | 4,830 | 2.83 | % | $ | 15,088 | 3.30 | % | $ | 20,352 | 3.19 | % | ||||||||||||||||||||
|
|
|
|
|
|
|
|
|
|
|
|||||||||||||||||||||||||||||||
Each reporting period, we evaluate all securities with a decline in fair value below the amortized cost of the investment to determine whether or not the impairment is deemed to be other-than-temporary (“OTTI”). OTTI is required to be recognized if (1) we intend to sell the security; (2) it is more likely than not that we will be required to sell the security before recovery of its amortized cost basis; or (3) for debt securities, the present value of expected cash flows is not sufficient to recover the entire amortized cost basis. Marketable equity securities are evaluated for OTTI based on the severity and duration of the impairment and, if deemed to be other than temporary, the declines in fair value are reflected in earnings as realized losses. For impaired debt securities that we intend to sell, or more likely than not will be required to sell, the full amount of the depreciation is recognized as OTTI through earnings. For all other impaired debt securities, credit-related OTTI is recognized through earnings and non-credit related OTTI is recognized in other comprehensive income, net of applicable taxes.
55
Table of Contents
At December 31, 2017, 12 marketable equity securities with a fair value of $5.8 million had gross unrealized losses totaling $958,000, or an aggregate depreciation of 14.2% from the Company’s cost basis. These marketable equity securities consisted of six securities with a fair value of $3.5 million and a gross unrealized loss of $348,000 for less than 12 months and six securities with a fair value of $2.3 million and a gross unrealized loss of $610,000 for 12 months or longer. The marketable equity securities in a gross unrealized loss position for 12 months or longer were comprised of one security in the basic materials sector with a fair value of $641,000 and a gross unrealized loss of $163,000, three marketable equity securities in the consumer products and services sector with a fair value of $1.3 million and a gross unrealized loss of $391,000, and two securities in the technology sector with a fair value of $426,000 and a gross unrealized loss of $56,000.
In analyzing an equity issuer’s financial condition, management considers industry analysts’ reports, financial performance and projected target prices of investment analysts within a one-year time frame. A decline of 10% or more in the value of an acquired equity security is generally the triggering event for management to review individual securities for liquidation and/or write-down. Impairment losses are recognized when management concludes that declines in the value of equity securities are other than temporary, or when they can no longer assert that they have the intent and ability to hold depreciated equity securities for a period of time sufficient to allow for any anticipated recovery in fair value. Unrealized losses on marketable equity securities that are in excess of 25% of cost and that have been sustained for more than twelve months are generally considered-other-than temporary and charged to earnings as impairment losses, or realized through sale of the security.
Although issuers within the marketable equity securities portfolio had price declines resulting in unrealized losses, management does not believe these declines in market value are other than temporary and the Company currently has the ability and intent to hold these investments until a recovery of fair value.
Deposits
Deposits are a major source of our funds for lending and other investment purposes. Deposit inflows and outflows are significantly influenced by general interest rates and money market conditions. Our deposit base is comprised of noninterest-bearing demand, interest-bearing demand, money market, regular savings and other deposits, and certificates of deposit, which include brokered certificates of deposit. We consider noninterest-bearing demand, interest-bearing demand, money market, and regular savings and other deposits to be core deposits. Total deposits increased $632.0 million, or 18.2%, to $4.108 billion at December 31, 2017 from $3.476 billion at December 31, 2016. Contributing to the growth was $93.8 million of deposits acquired in the Meetinghouse acquisition. Our continuing focus on the acquisition and expansion of core deposit relationships resulted in net growth in core deposits of $389.6 million, or 16.6%, to $2,737 billion, or 66.6% of total deposits at December 31, 2017.
The following table sets forth the average balances of deposits for the years indicated.
| Years Ended December 31, | |||||||||||||||||||||||||||||||||||||||||||||
| 2017 | 2016 | 2015 | |||||||||||||||||||||||||||||||||||||||||||
| Average Balance |
Average Rate |
Percent of Total Deposits |
Average Balance |
Average Rate |
Percent of Total Deposits |
Average Balance |
Average Rate |
Percent of Total Deposits | |||||||||||||||||||||||||||||||||||||
| (Dollars in thousands) | |||||||||||||||||||||||||||||||||||||||||||||
| Noninterest-bearing demand deposits |
$ | 448,952 | — | % | 11.6 | % | $ | 382,644 | — | % | 13.5 | % | $ | 335,060 | — | % | 13.5 | % | |||||||||||||||||||||||||||
| Interest-bearing demand deposits |
799,377 | 0.92 | 24.4 | 469,103 | 0.64 | 12.2 | 295,958 | 0.58 | 12.2 | ||||||||||||||||||||||||||||||||||||
| Money market deposits |
971,692 | 0.91 | 22.4 | 857,952 | 0.82 | 31.4 | 928,712 | 0.83 | 31.4 | ||||||||||||||||||||||||||||||||||||
| Regular savings and other deposits |
317,717 | 0.14 | 8.1 | 296,951 | 0.14 | 10.5 | 281,389 | 0.16 | 10.5 | ||||||||||||||||||||||||||||||||||||
| Certificates of deposit |
1,193,803 | 1.45 | 33.5 | 1,042,425 | 1.31 | 32.4 | 745,866 | 1.16 | 32.4 | ||||||||||||||||||||||||||||||||||||
|
|
|
|
|
|
|
|
|
|
|
|
|
||||||||||||||||||||||||||||||||||
| Total |
$ | 3,731,541 | 0.91 | % | 100.0 | % | $ | 3,049,075 | 0.79 | % | 100.0 | % | $ | 2,586,985 | 0.71 | % | 100.0 | % | |||||||||||||||||||||||||||
|
|
|
|
|
|
|
|
|
|
|
|
|
||||||||||||||||||||||||||||||||||
56
Table of Contents
The following table indicates the amount of the certificates of deposits of $100,000 or more by time remaining until maturity as of December 31, 2017.
| Certificates of Deposit |
||||
| (In thousands) | ||||
| Maturity Period: |
||||
| Three months or less |
$ | 149,300 | ||
| Over three through six months |
95,633 | |||
| Over six through twelve months |
105,512 | |||
| Over twelve months |
410,501 | |||
|
|
|
|||
| Total |
$ | 760,946 | ||
|
|
|
|||
Borrowings
We use borrowings from the Federal Home Loan Bank of Boston to supplement our supply of funds for loans and investments. At December 31, 2017 and 2016, Federal Home Loan Bank of Boston advances totaled $513.4 million and $322.5 million, respectively, with a weighted average rate of 1.22% and 1.01%, respectively. Total borrowings increased $190.9 million, or 59.2%, during the year ended December 31, 2017, and includes $8.2 million assumed in the acquisition of Meetinghouse. The Bank entered into long-term advances with the Federal Home Loan Bank of Boston totaling $320.6 million with original terms ranging from three to 15 years and initial interest rates ranging from 0.004% to 2.21% during the year ended December 31, 2017. The maturing long–term advances with the Federal Home Loan Bank of Boston totaled $137.9 million and consisted of advances with original terms ranging from two to 15 years and fixed interest rates ranging from of 0.31% to 1.57% during the year ended December 31, 2017. At December 31, 2017, we also had an available line of credit of $9.4 million with the Federal Home Loan Bank of Boston at an interest rate that adjusts daily, none of which was outstanding at that date.
Information relating to borrowings is detailed in the following table.
| Years Ended December 31, | ||||||||
| 2017 | 2016 | |||||||
| (Dollars in thousands) | ||||||||
| Balance outstanding at end of period |
$ | 513,444 | $ | 322,512 | ||||
| Average amount outstanding during the period |
$ | 411,200 | $ | 277,586 | ||||
| Weighted average interest rate during the period |
1.20 | % | 1.09 | % | ||||
| Maximum outstanding at any month end |
$ | 513,429 | $ | 329,551 | ||||
| Weighted average interest rate at end of period |
1.22 | % | 1.01 | % | ||||
Stockholders’ Equity
Total stockholders’ equity increased $39.1 million, or 6.4%, to $646.4 million at December 31, 2017, from $607.3 million at December 31, 2016. The increase for the year ended December 31, 2017 was due primarily to $42.9 million in net income and $6.5 million related to stock-based compensation plans, partially offset by $1.7 million in accumulated other comprehensive losses, reflecting a decrease in the fair value of available-for-sale securities, and three quarterly dividends of $0.04 per share and one quarterly dividend of $0.05 per share totaling $8.7 million. Stockholders’ equity to assets was 12.20% at December 31, 2017, compared to 13.69% at December 31, 2016. Book value per share increased to $11.96 at December 31, 2017 from $11.33 at December 31, 2016. At December 31, 2017, the Company and the Bank continued to exceed all regulatory capital requirements.
Results of Operations for the Years Ended December 31, 2017, 2016 and 2015
Net Income. Our primary source of income is net interest income. Net interest income is the difference between interest income, which is the income that we earn on our loans and investments, and interest expense,
57
Table of Contents
which is the interest that we pay on our deposits and borrowings. Changes in levels of interest rates affect our net interest income. A secondary source of income is non-interest income, which includes revenue that we receive from providing products and services. The majority of our non-interest income generally comes from customer service fees, loan fees, bank-owned life insurance, mortgage banking gains and gains on sales of securities.
Net income information is as follows:
| Years Ended December 31, | Change 2017/2016 | Change 2016/2015 | ||||||||||||||||||||||||||
| 2017 | 2016 | 2015 | Amount | Percent | Amount | Percent | ||||||||||||||||||||||
| (Dollars in thousands) | ||||||||||||||||||||||||||||
| Net interest income |
$ | 146,192 | $ | 122,555 | $ | 102,891 | $ | 23,637 | 19.3 | % | $ | 19,664 | 19.1 | % | ||||||||||||||
| Provision for loan losses |
4,859 | 7,180 | 6,667 | (2,321 | ) | (32.3 | ) | 513 | 7.7 | |||||||||||||||||||
| Non-interest income |
23,064 | 14,190 | 13,040 | 8,874 | 62.5 | 1,150 | 8.8 | |||||||||||||||||||||
| Non-interest expenses |
87,965 | 77,494 | 72,691 | 10,471 | 13.5 | 4,803 | 6.6 | |||||||||||||||||||||
| Net income |
42,945 | 34,190 | 24,607 | 8,755 | 25.6 | 9,583 | 38.9 | |||||||||||||||||||||
| Basic earnings per share |
0.84 | 0.67 | 0.47 | 0.17 | 25.4 | 0.20 | 41.2 | |||||||||||||||||||||
| Diluted earnings per share |
0.82 | 0.65 | 0.46 | 0.17 | 26.2 | 0.19 | 41.1 | |||||||||||||||||||||
| Return on average assets |
0.89 | % | 0.87 | % | 0.74 | % | 0.02 | % | 2.3 | 0.13 | % | 17.6 | ||||||||||||||||
| Return on average equity |
6.82 | % | 5.77 | % | 4.19 | % | 1.05 | % | 18.2 | 1.58 | % | 37.7 | ||||||||||||||||
Net income for the year ended December 31, 2017 reflects a charge to tax expense of approximately $7.1 million, or $0.13 per diluted share, related to enactment of the Tax Act on December 22, 2017 that required the Company to revalue its net deferred tax asset and merger and acquisition expenses totaling $2.1 million (pre-tax) related to the Meetinghouse acquisition.
Net Interest Income.
Average Balance Sheets and Related Yields and Rates
The following table presents information regarding average balances of assets and liabilities, the total dollar amounts of interest income and dividends from average interest-earning assets, the total dollar amounts of interest expense on average interest-bearing liabilities and the resulting annualized average yields and costs. The yields and costs for the periods indicated are derived by dividing income or expense by the average balances of assets or liabilities, respectively, for the periods presented. For purposes of this table, average balances have been calculated using daily average balances, and include non-accrual loans and purchase accounting related premium
58
Table of Contents
and discounts. The loan yields include the effect of amortization or accretion of deferred loan fees/costs and purchase accounting premiums/discounts to interest and fees on loans.
| Years Ended December 31, | |||||||||||||||||||||||||||||||||||||||||||||
| 2017 | 2016 | 2015 | |||||||||||||||||||||||||||||||||||||||||||
| Average Balance |
Interest (1) |
Yield/ Cost (1) |
Average Balance |
Interest (1) |
Yield/ Cost (1) |
Average Balance |
Interest (1) |
Yield/ Cost (1) | |||||||||||||||||||||||||||||||||||||
| (Dollars in thousands) | |||||||||||||||||||||||||||||||||||||||||||||
| Assets: |
|||||||||||||||||||||||||||||||||||||||||||||
| Interest-earning assets: |
|||||||||||||||||||||||||||||||||||||||||||||
| Loans (2) |
$ | 4,286,830 | $ | 184,337 | 4.30 | % | $ | 3,495,088 | $ | 150,182 | 4.30 | % | $ | 2,801,970 | $ | 121,859 | 4.35 | % | |||||||||||||||||||||||||||
| Securities and certificates of deposits |
132,872 | 2,630 | 1.98 | 183,828 | 3,629 | 1.97 | 268,398 | 4,719 | 1.76 | ||||||||||||||||||||||||||||||||||||
| Other interest-earning assets (3) |
266,945 | 3,465 | 1.30 | 146,786 | 1,147 | 0.78 | 158,463 | 724 | 0.46 | ||||||||||||||||||||||||||||||||||||
|
|
|
|
|
|
|
|
|
|
|
|
|
||||||||||||||||||||||||||||||||||
| Total interest-earning assets |
4,686,647 | 190,432 | 4.06 | 3,825,702 | 154,958 | 4.05 | 3,228,831 | 127,302 | 3.94 | ||||||||||||||||||||||||||||||||||||
|
|
|
|
|
|
|
||||||||||||||||||||||||||||||||||||||||
| Noninterest-earning assets |
113,254 | 116,985 | 114,081 | ||||||||||||||||||||||||||||||||||||||||||
|
|
|
|
|
|
|
||||||||||||||||||||||||||||||||||||||||
| Total assets |
$ | 4,799,901 | $ | 3,942,687 | $ | 3,342,912 | |||||||||||||||||||||||||||||||||||||||
|
|
|
|
|
|
|
||||||||||||||||||||||||||||||||||||||||
| Liabilities and stockholders’ equity: |
|||||||||||||||||||||||||||||||||||||||||||||
| Interest-bearing liabilities: |
|||||||||||||||||||||||||||||||||||||||||||||
| Interest-bearing demand deposits |
$ | 799,377 | 7,315 | 0.92 | $ | 469,103 | 2,988 | 0.64 | $ | 295,958 | 1,709 | 0.58 | |||||||||||||||||||||||||||||||||
| Money market deposits |
971,692 | 8,865 | 0.91 | 857,952 | 7,025 | 0.82 | 928,712 | 7,663 | 0.83 | ||||||||||||||||||||||||||||||||||||
| Regular savings and other deposits |
317,717 | 448 | 0.14 | 296,951 | 424 | 0.14 | 281,389 | 459 | 0.16 | ||||||||||||||||||||||||||||||||||||
| Certificates of deposit |
1,193,803 | 17,354 | 1.45 | 1,042,425 | 13,687 | 1.31 | 745,866 | 8,648 | 1.16 | ||||||||||||||||||||||||||||||||||||
|
|
|
|
|
|
|
|
|
|
|
|
|
||||||||||||||||||||||||||||||||||
| Total interest-bearing deposits |
3,282,589 | 33,982 | 1.04 | 2,666,431 | 24,124 | 0.90 | 2,251,925 | 18,479 | 0.82 | ||||||||||||||||||||||||||||||||||||
| Borrowings |
411,200 | 4,930 | 1.20 | 277,586 | 3,013 | 1.09 | 146,364 | 1,972 | 1.35 | ||||||||||||||||||||||||||||||||||||
|
|
|
|
|
|
|
|
|
|
|
|
|
||||||||||||||||||||||||||||||||||
| Total interest-bearing liabilities |
3,693,789 | 38,912 | 1.05 | 2,944,017 | 27,137 | 0.92 | 2,398,289 | 20,451 | 0.85 | ||||||||||||||||||||||||||||||||||||
|
|
|
|
|
|
|
||||||||||||||||||||||||||||||||||||||||
| Noninterest-bearing demand deposits |
448,952 | 382,644 | 335,060 | ||||||||||||||||||||||||||||||||||||||||||
| Other noninterest-bearing liabilities |
27,221 | 23,879 | 22,605 | ||||||||||||||||||||||||||||||||||||||||||
|
|
|
|
|
|
|
||||||||||||||||||||||||||||||||||||||||
| Total liabilities |
4,169,962 | 3,350,540 | 2,755,954 | ||||||||||||||||||||||||||||||||||||||||||
| Total stockholders’ equity |
629,939 | 592,147 | 586,958 | ||||||||||||||||||||||||||||||||||||||||||
|
|
|
|
|
|
|
||||||||||||||||||||||||||||||||||||||||
| Total liabilities and stockholders’ equity |
$ | 4,799,901 | $ | 3,942,687 | $ | 3,342,912 | |||||||||||||||||||||||||||||||||||||||
|
|
|
|
|
|
|
||||||||||||||||||||||||||||||||||||||||
| Net interest-earning assets |
$ | 992,858 | $ | 881,685 | $ | 830,542 | |||||||||||||||||||||||||||||||||||||||
|
|
|
|
|
|
|
||||||||||||||||||||||||||||||||||||||||
| Fully tax-equivalent net interest income |
151,520 | 127,821 | 106,851 | ||||||||||||||||||||||||||||||||||||||||||
| Less: tax-equivalent adjustments |
(5,328 | ) | (5,266 | ) | (3,960 | ) | |||||||||||||||||||||||||||||||||||||||
|
|
|
|
|
|
|
||||||||||||||||||||||||||||||||||||||||
| Net interest income |
$ | 146,192 | $ | 122,555 | $ | 102,891 | |||||||||||||||||||||||||||||||||||||||
|
|
|
|
|
|
|
||||||||||||||||||||||||||||||||||||||||
| Interest rate spread (1)(4) |
3.01 | % | 3.13 | % | 3.09 | % | |||||||||||||||||||||||||||||||||||||||
| Net interest margin (1)(5) |
3.23 | % | 3.34 | % | 3.31 | % | |||||||||||||||||||||||||||||||||||||||
| Average interest-earning assets to average interest-bearing liabilities |
126.88 | % | 129.95 | % | 134.63 | % | |||||||||||||||||||||||||||||||||||||||
| Supplemental Information: |
|||||||||||||||||||||||||||||||||||||||||||||
| Total deposits, including noninterest-bearing demand deposits |
$ | 3,731,541 | $ | 33,982 | 0.91 | % | $ | 3,049,075 | $ | 24,124 | 0.79 | % | $ | 2,586,985 | $ | 18,479 | 0.71 | % | |||||||||||||||||||||||||||
| Total deposits and borrowings, including noninterest-bearing demand deposits |
$ | 4,142,741 | $ | 38,912 | 0.94 | % | $ | 3,326,661 | $ | 27,137 | 0.82 | % | $ | 2,733,349 | $ | 20,451 | 0.75 | % | |||||||||||||||||||||||||||
(footnotes begin on following page)
59
Table of Contents
(footnotes from previous page)
| (1) | Income on debt securities, equity securities and revenue bonds included in commercial real estate loans, as well as resulting yields, interest rate spread and net interest margin, are presented on a tax-equivalent basis. The tax-equivalent adjustments are deducted from tax-equivalent net interest income to agree to amounts reported in the consolidated statements of net income. For the years ended December 31, 2017, 2016 and 2015, yields on loans before tax-equivalent adjustments were 4.19%, 4.16% and 4.23%, respectively, yields on securities and certificates of deposit before tax-equivalent adjustments were 1.67%, 1.63% and 1.50%, respectively, and yield on total interest-earning assets before tax-equivalent adjustments were 3.95%, 3.91% and 3.82%, respectively. Interest rate spread before tax-equivalent adjustments for the years ended December 31, 2017, 2016 and 2015 was 2.90%, 2.99% and 2.97%, respectively, while net interest margin before tax-equivalent adjustments for the years ended December 31, 2017, 2016 and 2015 was 3.12%, 3.20% and 3.19%, respectively, |
| (2) | Loans on non-accrual status are included in average balances. |
| (3) | Includes Federal Home Loan Bank stock and associated dividends. |
| (4) | Interest rate spread represents the difference between the tax-equivalent yield on interest-earning assets and the cost of interest-bearing liabilities. |
| (5) | Net interest margin represents net interest income (tax-equivalent basis) divided by average interest-earning assets. |
Rate/Volume Analysis
The following table sets forth the effects of changing rates and volumes on our fully tax-equivalent net interest income. The rate column shows the effects attributable to changes in rate (changes in rate multiplied by prior volume). The volume column shows the effects attributable to changes in volume (changes in volume multiplied by prior rate). The net column represents the sum of the prior columns. For purposes of this table, changes attributable to changes in both rate and volume that cannot be segregated have been allocated proportionally based on the changes due to rate and the changes due to volume.
| Years Ended December 31, 2017 Compared to 2016 Increase (Decrease) Due to |
Years Ended December 31, 2016 Compared to 2015 Increase (Decrease) Due to |
|||||||||||||||||||||||
| Volume | Rate | Net | Volume | Rate | Net | |||||||||||||||||||
| (In thousands) | ||||||||||||||||||||||||
| Interest income: |
||||||||||||||||||||||||
| Loans |
$ | 34,045 | $ | 110 | $ | 34,155 | $ | 29,800 | $ | (1,477 | ) | $ | 28,323 | |||||||||||
| Securities and certificates of deposits |
(1,009 | ) | 10 | (999 | ) | (1,618 | ) | 528 | (1,090 | ) | ||||||||||||||
| Other interest-earning assets |
1,282 | 1,036 | 2,318 | (57 | ) | 480 | 423 | |||||||||||||||||
|
|
|
|
|
|
|
|
|
|
|
|
|
|||||||||||||
| Total |
34,318 | 1,156 | 35,474 | 28,125 | (469 | ) | 27,656 | |||||||||||||||||
| Interest expense: |
||||||||||||||||||||||||
| Deposits |
5,798 | 4,060 | 9,858 | 4,312 | 1,333 | 5,645 | ||||||||||||||||||
| Borrowings |
1,575 | 342 | 1,917 | 1,486 | (445 | ) | 1,041 | |||||||||||||||||
|
|
|
|
|
|
|
|
|
|
|
|
|
|||||||||||||
| Total |
7,373 | 4,402 | 11,775 | 5,798 | 888 | 6,686 | ||||||||||||||||||
|
|
|
|
|
|
|
|
|
|
|
|
|
|||||||||||||
| Change in fully tax-equivalent net interest income |
$ | 26,945 | $ | (3,246 | ) | $ | 23,699 | $ | 22,327 | $ | (1,357 | ) | $ | 20,970 | ||||||||||
|
|
|
|
|
|
|
|
|
|
|
|
|
|||||||||||||
The net interest rate spread and net interest margin on a tax-equivalent basis were 3.01% and 3.23%, respectively, for the year ended December 31, 2017 compared to 3.13% and 3.34%, respectively, for the year ended December 31, 2016. The increase in net interest income was due primarily to loan growth, partially offset by growth in total deposits and borrowings and an increase in the cost of funds for the year ended December 31, 2017 compared to the same period in 2016.
60
Table of Contents
The Company’s yield on interest-earning assets on a tax-equivalent basis increased one basis point to 4.06% for the year ended December 31, 2017 compared to 4.05% for the year ended December 31, 2016, while the total cost of funds increased 12 basis points to 0.94% for the year ended December 31, 2017 compared to 0.82% for the year ended December 31, 2016. The increase in interest income was primarily due to growth in the Company’s average loan balances of $791.7 million, or 22.7%, to 4.287 billion, while the yield on loans on a tax-equivalent basis remained unchanged at 4.30% for the years ended December 31, 2017 and 2016. The increase in interest expense on deposits was primarily due to the growth in average total deposits of $682.5 million, or 22.4%, to $3.732 billion and an increase in the cost of average total deposits of 12 basis points to 0.91% for the year ended December 31, 2017 compared to 0.79% for the year ended December 31, 2016. The increase in interest expense on borrowings was primarily due to the increase in average borrowings of $133.6 million, or 48.1%, to $411.2 million and an increase in the cost of average borrowings of 11 basis points to 1.20% for the year ended December 31, 2017 compared to 1.09% for the year ended December 31, 2016.
The net interest rate spread and net interest margin on a tax-equivalent basis were 3.13% and 3.34%, respectively, for the year ended December 31, 2016 compared to 3.09% and 3.31%, respectively, for the year ended December 31, 2015. The increase in net interest income was due primarily to loan growth, partially offset by growth in total deposits and borrowings for the year ended December 31, 2016 compared to the same period in 2016.
The Company’s yield on interest-earning assets on a tax-equivalent basis increased 11 basis points to 4.05% for the year ended December 31, 2016 compared to 3.94% for the year ended December 31, 2015, while the total cost of funds increased seven basis points to 0.82% for the year ended December 31, 2016 compared to 0.75% for the year ended December 31, 2015. The increase in interest income was primarily due to growth in the Company’s average loan balances of $693.1 million, or 24.7%, to $3.495 billion, partially offset by a decrease in the yield on loans on a tax-equivalent basis of five basis points to 4.30% for the year ended December 31, 2016 compared to 4.35% for the year ended December 31, 2015. The increase in interest expense on deposits was primarily due to the growth in average total deposits of $462.1 million, or 17.9%, to $3.049 billion and an increase in the cost of average total deposits of eight basis points to 0.79% for the year ended December 31, 2016 compared to 0.71% for the year ended December 31, 2015. The increase in interest expense on borrowings was primarily due to the increase in average borrowings of $131.2 million, or 89.7%, to $277.6 million, partially offset by a decrease in the cost of average borrowings of 26 basis points to 1.09% for the year ended December 31, 2016 compared to 1.35% for the year ended December 31, 2015.
Provision for Loan Losses. Our provision for loan losses was $4.9 million for the year ended December 31, 2017 compared to $7.2 million and $6.7 million for the years ended December 31, 2016 and 2015, respectively. For further discussion of the changes in the provision and allowance for loan losses, refer to “Asset Quality — Allowance for Loan Losses.”
Non-Interest Income. Non-interest income information is as follows:
| Years Ended December 31, | Change 2017/2016 | Change 2016/2015 | ||||||||||||||||||||||||||
| 2017 | 2016 | 2015 | Amount | Percent | Amount | Percent | ||||||||||||||||||||||
| (Dollars in thousands) | ||||||||||||||||||||||||||||
| Customer service fees |
$ | 8,517 | $ | 8,491 | $ | 7,931 | $ | 26 | 0.3 | % | $ | 560 | 7.1 | % | ||||||||||||||
| Loan fees |
1,970 | 918 | 917 | 1,052 | 114.6 | 1 | 0.1 | |||||||||||||||||||||
| Mortgage banking gains, net |
457 | 573 | 535 | (116 | ) | (20.2 | ) | 38 | 7.1 | |||||||||||||||||||
| Gain on sales of securities, net |
9,305 | 3,020 | 2,432 | 6,285 | 208.1 | 588 | 24.2 | |||||||||||||||||||||
| Income from bank-owned life insurance |
1,158 | 1,188 | 1,225 | (30 | ) | (2.5 | ) | (37 | ) | (3.0 | ) | |||||||||||||||||
| Gain on life insurance distribution |
1,657 | — | — | 1,657 | — | — | — | |||||||||||||||||||||
|
|
|
|
|
|
|
|
|
|
|
|||||||||||||||||||
| Total non-interest income |
$ | 23,064 | $ | 14,190 | $ | 13,040 | $ | 8,874 | 62.5 | % | $ | 1,150 | 8.8 | % | ||||||||||||||
|
|
|
|
|
|
|
|
|
|
|
|||||||||||||||||||
The increase in loan fees for the year December 31, 2017 was primarily due to $1.3 million of loan swap fee income recognized in the second quarter of 2017. The increase in gain on sales of securities, net, reflected an increase in the prices of the marketable equity securities sold during the year ended December 31, 2017
61
Table of Contents
compared to the year ended December 31, 2016. In addition, the year ended December 31, 2017 includes a non-taxable gain on life insurance distribution of $1.7 million resulted from the difference between the death benefit payment of $3.3 million and the cash surrender value of the related bank-owned life insurance policy of $1.6 million.
The increase in customer service fees for the year ended December 31, 2016 was primarily due to the growth in checking accounts. The increase in gain on sales of securities, net, reflected an increase in proceeds from sales of marketable equity securities during the year ended December 31, 2016 compared to the year ended December 31, 2015.
Non-Interest Expense. Non-interest expense information is as follows:
| Years Ended December 31, | Change 2017/2016 | Change 2016/2015 | ||||||||||||||||||||||||||
| 2017 | 2016 | 2015 | Amount | Percent | Amount | Percent | ||||||||||||||||||||||
| (Dollars in thousands) | ||||||||||||||||||||||||||||
| Salaries and employee benefits |
$ | 53,161 | $ | 48,828 | $ | 44,737 | $ | 4,333 | 8.9 | % | $ | 4,091 | 9.1 | % | ||||||||||||||
| Occupancy and equipment |
11,533 | 10,809 | 9,876 | 724 | 6.7 | 933 | 9.4 | |||||||||||||||||||||
| Data processing |
5,912 | 5,135 | 5,204 | 777 | 15.1 | (69 | ) | (1.3 | ) | |||||||||||||||||||
| Marketing and advertising |
3,653 | 3,217 | 3,715 | 436 | 13.6 | (498 | ) | (13.4 | ) | |||||||||||||||||||
| Professional services |
3,669 | 2,965 | 2,633 | 704 | 23.7 | 332 | 12.6 | |||||||||||||||||||||
| Deposit insurance |
2,988 | 2,037 | 1,989 | 951 | 46.7 | 48 | 2.4 | |||||||||||||||||||||
| Merger and acquisition |
2,055 | — | — | 2,055 | — | — | — | |||||||||||||||||||||
| Other general and administrative |
4,994 | 4,503 | 4,537 | 491 | 10.9 | (34 | ) | (0.7 | ) | |||||||||||||||||||
|
|
|
|
|
|
|
|
|
|
|
|||||||||||||||||||
| Total non-interest expenses |
$ | 87,965 | $ | 77,494 | $ | 72,691 | $ | 10,471 | 13.5 | % | $ | 4,803 | 6.6 | % | ||||||||||||||
|
|
|
|
|
|
|
|
|
|
|
|||||||||||||||||||
The increases in salaries and employee benefits expenses for the year ended December 31, 2017 reflect annual increases in employee compensation and health benefits during the first quarter of 2017 and a 20% bonus enhancement to the Bank’s Incentive Compensation Plan for 2017. In addition, the increases in salaries and employee benefits, and occupancy and equipment expenses include costs associated with the expansion of our branch and regulatory compliance staff. Professional services increased primarily due to additional costs related to regulatory compliance projects. The merger and acquisition expenses were related to the acquisition of Meetinghouse, which was completed on December 29, 2017. The Company’s efficiency ratio, which excludes gains or losses on sales of securities and non-recurring merger and acquisition expenses, was 53.71% for the year ended December 31, 2017 compared to 57.95% for the year ended December 31, 2016.
The increase in salaries and employee benefits expenses for the year ended December 31, 2016 was primarily due to annual increases in employee compensation and health benefits, and expenses associated with the November 2015 grant of restricted stock and stock options to the Company’s directors, officers and employees. In addition, increases in salaries and employee benefits expenses and occupancy and equipment expenses reflect costs associated with two new branches opened during 2016. The decrease in marketing and advertising expenses reflected lower advertising production and direct mail costs and cost savings associated with the 2015 rebranding of the former Mt. Washington Bank Division into the East Boston Savings Bank brand. The increase in professional services reflected costs associated with regulatory compliance initiatives undertaken during the year. The Company’s efficiency ratio improved to 57.95% for the year ended December 31, 2016 from 64.05% for the year ended December 31, 2015.
Income Tax Provision. We recorded a provision for income taxes of $33.5 million for the year ended December 31, 2017, reflecting an effective tax rate of 43.8%, compared to $17.9 million, or a 34.3% effective tax rate, for the year ended December 31, 2016 and $12.0 million, reflecting an effective tax rate of 32.7%, for the year ended December 31, 2015. The changes in the income tax provision and effective tax rate were primarily due to the $7.1 million charge to tax expense related to enactment of the Tax Act that required the Company to revalue its net deferred tax asset. This charge may be subject to adjustment in future periods.
62
Table of Contents
Risk Management
Overview. Managing risk is an essential part of successfully managing a financial institution. Our most prominent risk exposures are credit risk, interest rate risk and market risk. Credit risk is the risk of not collecting the interest and/or the principal balance of a loan or investment when it is due. Interest rate risk is the potential reduction of net interest income as a result of changes in interest rates. Market risk arises from fluctuations in interest rates that may result in changes in the values of financial instruments, such as available-for-sale securities that are accounted for on a mark-to-market basis. Other risks that we face are operational risks, liquidity risk and reputation risk. Operational risks include risks related to fraud, regulatory compliance, processing errors, and technology and disaster recovery. Liquidity risk is the possible inability to fund obligations to depositors, lenders or borrowers. Reputation risk is the risk that negative publicity or press, whether true or not, could cause a decline in our customer base or revenue.
The Company’s Risk Management and Compliance Officer and the Compliance/Risk Management Committee oversee the risk management process on behalf of the Company’s Board of Directors, with responsibility for the overall risk program and strategy, determining risks and implementing risk mitigation strategies in the following risk areas: interest rates, operational/compliance, liquidity, strategic, reputation, credit and legal/regulatory. The Risk Management Officer reports the activities of the Compliance/Risk Management Committee to the Audit Committee of the Board of Directors on a quarterly basis, or more often as necessary. The Risk Management Officer provides counsel to members of our management team on all issues that affect our risk positions.
In addition, the Risk Management Officer is responsible for the following:
| • | Develops, implements and maintains a risk management program for the entire Bank to withstand regulatory scrutiny and provides operational safety and efficiency; |
| • | Recommends policy to the Board of Directors; |
| • | Chairs the Company’s Compliance/Risk Management Committee; |
| • | Participates in developing long-term strategic risk objectives for the Company; |
| • | Coordinates and reviews risk assessments and provides recommendations on risk controls, testing and mitigation strategies; |
| • | Reviews and provides recommendations and approvals for all proposed business initiatives; and |
| • | Keeps abreast of risk management and regulatory trends and mitigation strategies. |
Asset/Liability Management. Our earnings and the market value of our assets and liabilities are subject to fluctuations caused by changes in the level of interest rates. We manage the interest rate sensitivity of our interest-bearing liabilities and interest-earning assets in an effort to minimize the adverse effects of changes in the interest rate environment. Deposit accounts typically react more quickly to changes in market interest rates than mortgage loans because of the shorter maturities of deposits. As a result, sharp increases in interest rates may adversely affect our earnings while decreases in interest rates may beneficially affect our earnings. To reduce the potential volatility of our earnings, we have sought to improve the match between asset and liability maturities and rates, while maintaining an acceptable interest rate spread. Our strategy for managing interest rate risk emphasizes: originating loans with adjustable interest rates; selling the residential real estate fixed-rate loans with terms greater than 10 years that we originate; promoting core deposit products; and adjusting the interest rates and maturities of funding sources, as necessary.
We have an Asset/Liability Management Committee to coordinate all aspects of asset/liability management. The committee establishes and monitors the volume, maturities, pricing and mix of assets and funding sources with the objective of managing assets and funding sources to provide results that are consistent with liquidity, growth, risk limits and profitability goals.
We analyze our interest rate sensitivity position to manage the risk associated with interest rate movements through the use of interest income simulation. The matching of assets and liabilities may be analyzed by examining the extent to which such assets and liabilities are “interest sensitive.” An asset or liability is said to be interest rate sensitive within a specific time period if it will mature or reprice within that time period.
63
Table of Contents
Our goal is to manage asset and liability positions to moderate the effects of interest rate fluctuations on net interest income. Interest income simulations are completed quarterly and presented to the Asset/Liability Committee and the Board of Directors. The simulations provide an estimate of the impact of changes in interest rates on net interest income under a range of assumptions. The numerous assumptions used in the simulation process are reviewed by the Asset/Liability Committee and the Executive Committee on a quarterly basis. Changes to these assumptions can significantly affect the results of the simulation. The simulation incorporates assumptions regarding the potential timing of the repricing of certain assets and liabilities when market rates change and the changes in spreads between different market rates. The simulation analysis incorporates management’s current assessment of the risk that pricing margins will change adversely over time due to competition or other factors.
Simulation analysis is only an estimate of our interest rate risk exposure at a particular point in time. We continually review the potential effect changes in interest rates could have on the repayment of rate sensitive assets and funding requirements of rate sensitive liabilities.
The simulation uses projected repricing of assets and liabilities on the basis of contractual maturities, anticipated repayments and scheduled rate adjustments. Prepayment rates can have a significant impact on interest income simulation. Because of the large percentage of loans we hold, rising or falling interest rates have a significant impact on the prepayment speeds of our earning assets that in turn affect the rate sensitivity position. When interest rates rise, prepayments tend to slow. When interest rates fall, prepayments tend to rise. Our asset sensitivity would be reduced if prepayments slow and vice versa. While we believe such assumptions to be reasonable, there can be no assurance that assumed prepayment rates will approximate actual future mortgage-backed security and loan repayment activity.
The following table reflects changes in estimated net interest income for the Bank due to immediate non-parallel changes in interest rates for the subsequent one year period as of the dates indicated.
| Increase (Decrease) in Market Interest Rates |
December 31, 2017 | December 31, 2016 | ||||||||||||||||||||||
| Amount | Change | Percent | Amount | Change | Percent | |||||||||||||||||||
| (Dollars in thousands) | ||||||||||||||||||||||||
| 300 |
$ | 149,829 | $ | (6,785 | ) | (4.30 | )% | $ | 115,819 | $ | (17,805 | ) | (13.32 | )% | ||||||||||
| Flat |
156,614 | 133,624 | ||||||||||||||||||||||
| -100 |
159,112 | 2,498 | 1.60 | 131,636 | (1,988 | ) | (1.49 | ) | ||||||||||||||||
The improvements in the changes in estimated net interest income at December 31, 2017 compared to December 31, 2016 reflect the incorporation of initial results of the Bank’s multi-year deposit repricing and runoff analysis of its non-maturity deposits (the “deposit study”) completed during 2017. The initial results of the deposit study produced assumptions demonstrating a lower sensitivity to changes in interest rates than the industry-wide assumptions used in previous simulations, thus reducing the impact of assumed fluctuations in market interest rates. The deposit study will be updated annually and the assumptions used in our simulation analyses will be updated accordingly.
Liquidity Management. Liquidity is the ability to meet current and future financial obligations of a short-term nature. Our primary sources of funds consist of deposit inflows, loan repayments, sales, maturities and payments on investment securities and borrowings from the Federal Home Loan Bank of Boston. While maturities and scheduled amortization of loans and securities are predictable sources of funds, deposit flows and mortgage prepayments are greatly influenced by general interest rates, economic conditions and competition.
We regularly adjust our investments in liquid assets based upon our assessment of (1) expected loan demand, (2) expected deposit flows, (3) yields available on interest-earning deposits and securities and (4) the objectives of our asset/liability management policy.
Our most liquid assets are cash and due from banks, and certificates of deposit with other banks. The levels of these assets depend on our operating, financing, lending and investing activities during any given period. At December 31, 2017, cash and due from banks totaled $402.7 million and certificates of deposit totaled $69.3 million. In addition, at December 31, 2017, we had $299.4 million of available borrowing capacity with the Federal Home Loan Bank of Boston, including a $9.4 million line of credit. On December 31, 2017, we had
64
Table of Contents
$513.4 million of advances outstanding. We periodically pledge additional multi-family and commercial real estate loans held in the Bank’s portfolio as qualified collateral to increase our borrowing capacity with the FHLB.
Our primary investing activities are the origination of loans and the purchase and sale of securities. Our primary financing activities consist of activity in deposit accounts and Federal Home Loan Bank advances. Deposit flows are affected by the overall level of interest rates, the interest rates and products offered by us and our local competitors and other factors. We generally manage the pricing of our deposits to be competitive. Occasionally, we offer promotional rates on certain deposit products to attract deposits.
A significant use of our liquidity is the funding of loan originations. At December 31, 2017 and 2016, we had total loan commitments outstanding of $1.205 billion and $1.178 billion, respectively. Historically, many of the commitments expire without being fully drawn; therefore the total amount of commitments does not necessarily represent future cash requirements. For further information, see Note 9 of the notes to the consolidated financial statements.
Another significant use of our liquidity is the funding of deposit withdrawals. Certificates of deposit due within one year of December 31, 2017 totaled $600.0 million, or 43.8% of total certificates of deposit. If these maturing deposits do not remain with us, we will be required to utilize other sources of funds. Historically, a significant portion of certificates of deposit that mature have remained with us. We have the ability to attract and retain deposits by adjusting the interest rates offered and accept brokered certificates of deposit when it is deemed cost effective.
Meridian Bancorp, Inc. is a separate legal entity from East Boston Savings Bank and it must provide for its own liquidity to pay dividends and repurchase its common stock and for other corporate purposes. Meridian Bancorp, Inc.’s primary source of liquidity is proceeds from the 2014 second-step offering, which may be augmented by dividend payments from East Boston Savings Bank. The ability of East Boston Savings Bank to pay dividends is subject to regulatory requirements. At December 31, 2017, Meridian Bancorp, Inc. (on an unconsolidated basis) had cash and cash equivalents and certificates of deposit totaling $90.9 million.
Contractual Obligations. The following table presents our contractual obligations as of December 31, 2017.
| Payments Due by Period | ||||||||||||||||||||
| Total | Up to One Year |
More than One Year to Three Years |
More than Three Years to Five Years |
More Than Five Years |
||||||||||||||||
| (Dollars in thousands) | ||||||||||||||||||||
| Contractual obligations: |
||||||||||||||||||||
| Long-term debt obligations |
$ | 513,444 | $ | 48,000 | $ | 59,819 | $ | 285,625 | $ | 120,000 | ||||||||||
| Operating lease obligations |
15,509 | 1,902 | 3,300 | 3,027 | 7,280 | |||||||||||||||
| Data processing agreement (1) |
17,308 | 4,327 | 8,654 | 4,327 | — | |||||||||||||||
|
|
|
|
|
|
|
|
|
|
|
|||||||||||
| Total |
$ | 546,261 | $ | 54,229 | $ | 71,773 | $ | 292,979 | $ | 127,280 | ||||||||||
|
|
|
|
|
|
|
|
|
|
|
|||||||||||
(1) Estimated payments subject to change based on transaction volume.
Capital Management. Both the Company and the Bank are subject to various regulatory capital requirements administered by the Federal Reserve Board and the Federal Deposit Insurance Corporation, respectively, including a risk-based capital measure. The risk-based capital guidelines include both a definition of capital and a framework for calculating risk-weighted assets by assigning balance sheet assets and off-balance sheet items to broad risk categories. At December 31, 2017, both the Company and the Bank exceeded all of their respective regulatory capital requirements. The Bank is considered “well capitalized” under regulatory guidelines. See “Supervision and Regulation — Federal Bank Regulation — Capital Requirements,” “Regulatory Capital Compliance” and Note 11, Stockholders’ Equity, “Minimum Regulatory Capital Requirements” in Notes to the Consolidated Financial Statements included in Item 8, Financial Statements and Supplementary Data, within this report.
65
Table of Contents
Federal banking regulations include minimum capital requirements for community banking institutions. The regulations include a new minimum ratio of common equity Tier 1 capital to risk-weighted assets of 4.5%, raise the minimum ratio of Tier 1 capital to risk-weighted assets from 4% to 6% and include a minimum leverage ratio of 4% for all banking organizations. Additionally, community banking institutions must maintain a capital conservation buffer of common equity Tier 1 capital in an amount greater than 2.5% of total to risk-weighted assets to avoid being subject to limitations on capital distributions and discretionary bonuses. The capital conservation buffer is being phased in over three years, which began on January 1, 2016. Also, certain new deductions from and adjustments to regulatory capital will be phased in over several years. Management believes that the Company will remain characterized as “well-capitalized” throughout the phase-in periods.
The Company may use capital management tools such as cash dividends and common share repurchases. We are subject to the Federal Reserve Board’s notice provisions for stock repurchases. In August 2015, the Company received regulatory approval from the Massachusetts Commissioner of Banks and a non-objection from the Federal Reserve Bank to adopt a stock repurchase program for up to 5% of its common stock.
As of December 31, 2017, the Company had repurchased 2,059,611 shares of its stock at an average price of $13.71 per share, or 75.2% of the 2,737,334 shares authorized for repurchase under the Company’s repurchase program. For the year ended December 31, 2017, the Company’s Board of Directors declared three quarterly cash dividends of $0.04 per common share on March 1, 2017, June 1, 2017, and September 1, 2017 and one quarterly dividend of $0.05 per common share on December 1, 2017.
Off-Balance Sheet Arrangements. In the normal course of operations, we engage in a variety of financial transactions that, in accordance with generally accepted accounting principles in the United States of America are not recorded in our financial statements. These transactions involve, to varying degrees, elements of credit, interest rate and liquidity risk. Such transactions are used primarily to manage customers’ requests for funding and take the form of loan commitments and lines of credit.
For the year ended December 31, 2017, we engaged in no off-balance sheet transactions reasonably likely to have a material effect on our financial condition, results of operations or cash flows.
Impact of Recent Accounting Pronouncements. For a discussion of the impact of recent accounting pronouncements, see Note 1, Summary of Significant Accounting Policies, in Notes to Consolidated Financial Statements included in Item 8, Financial Statements and Supplementary Data within this report.
Effect of Inflation and Changing Prices
The consolidated financial statements and related financial data included in this Annual Report have been prepared in accordance with generally accepted accounting principles in the United States of America, which require the measurement of financial position and operating results in terms of historical dollars without considering the change in the relative purchasing power of money over time due to inflation. The primary impact of inflation on our operations is reflected in increased operating costs. Unlike most industrial companies, virtually all the assets and liabilities of a financial institution are monetary in nature. As a result, interest rates generally have a more significant impact on a financial institution’s performance than do general levels of inflation. Interest rates do not necessarily move in the same direction or to the same extent as the prices of goods and services.
| ITEM 7A. | QUANTITATIVE AND QUALITATIVE DISCLOSURES ABOUT MARKET RISK |
Information regarding quantitative and qualitative disclosures about market risk appears under Item 7, “Management’s Discussion and Analysis of Financial Condition and Results of Operations,” under the caption “Asset/Liability Management”.
66
Table of Contents
| ITEM 8. | FINANCIAL STATEMENTS AND SUPPLEMENTARY DATA |
Index to Consolidated Financial Statements
67
Table of Contents
MANAGEMENT’S ANNUAL REPORT ON INTERNAL CONTROL OVER FINANCIAL REPORTING
The management of Meridian Bancorp, Inc. and subsidiaries (the “Company”), is responsible for establishing and maintaining effective internal control over financial reporting. The internal control process has been designed under our supervision to provide reasonable assurance regarding the reliability of financial reporting and the preparation of consolidated financial statements for external reporting purposes in accordance with accounting principles generally accepted in the United States of America.
Management conducted an assessment of the effectiveness of the Company’s internal control over financial reporting as of December 31, 2017, utilizing the framework established in Internal Control-Integrated Framework (2013) issued by the Committee of Sponsoring Organizations of the Treadway Commission (COSO). Based on this assessment, management has determined that the Company’s internal control over financial reporting as of December 31, 2017 is effective.
Our internal control over financial reporting includes policies and procedures that (a) pertain to the maintenance of records that, in reasonable detail, accurately and fairly reflect the transactions and dispositions of the assets of the Company; (b) provide reasonable assurance that transactions are recorded as necessary to permit preparation of consolidated financial statements in accordance with generally accepted accounting principles in the United States of America, and that receipts and expenditures of the Company are being made only in accordance with authorizations of management and directors of the Company; and (c) provide reasonable assurance regarding prevention or timely detection of unauthorized acquisition, use, or disposition of the Company’s assets that could have a material effect on the Company’s consolidated financial statements.
All internal control systems, no matter how well designed, have inherent limitations. Therefore, even those systems designed to be effective can provide only reasonable assurance with respect to financial statement preparation and presentation. Also, projections of any evaluation of effectiveness to future periods are subject to the risk that controls may become inadequate because of changes in conditions, or that the degree of compliance with the policies and procedures may deteriorate.
The effectiveness of the Company’s internal control over financial reporting as of December 31, 2017 has been audited by Wolf & Company, P.C., an independent registered public accounting firm, as stated in their report, which follows. This report expresses an unqualified opinion on the effectiveness of the Company’s internal control over financial reporting as of December 31, 2017.
| Date: March 1, 2018 |
/s/ Richard J. Gavegnano | |||||
| Richard J. Gavegnano | ||||||
| Chairman, President and Chief Executive Officer |
| Date: March 1, 2018 |
/s/ Mark L. Abbate | |||||
| Mark L. Abbate | ||||||
| Executive Vice President, Treasurer and Chief Financial Officer | ||||||
68
Table of Contents
REPORT OF INDEPENDENT REGISTERED PUBLIC ACCOUNTING FIRM – INTERNAL
CONTROL OVER FINANCIAL REPORTING
To the Stockholders and the Board of Directors of
Meridian Bancorp, Inc.
Opinion on Internal Control over Financial Reporting
We have audited Meridian Bancorp, Inc.‘s (the “Company”) internal control over financial reporting as of December 31, 2017, based on criteria established in Internal Control — Integrated Framework (2013) issued by the Committee of Sponsoring Organizations of the Treadway Commission (COSO).
In our opinion, the Company maintained, in all material respects, effective internal control over financial reporting as of December 31, 2017, based on criteria established in Internal Control — Integrated Framework (2013) issued by the COSO.
We have also audited, in accordance with the standards of the Public Company Accounting Oversight Board (United States) (“PCAOB”), the December 31, 2017 consolidated financial statements of the Company and our report dated March 1, 2018 expressed an unqualified opinion.
Basis for Opinion
The Company’s management is responsible for maintaining effective internal control over financial reporting and for its assessment of the effectiveness of internal control over financial reporting included in the accompanying Management’s Annual Report on Internal Control over Financial Reporting. Our responsibility is to express an opinion on the Company’s internal control over financial reporting based on our audit. We are a public accounting firm registered with the PCAOB and are required to be independent with respect to the Company in accordance with the U.S. federal securities laws and the applicable rules and regulations of the Securities and Exchange Commission and the PCAOB.
We conducted our audit in accordance with the standards of the PCAOB. Those standards require that we plan and perform the audit to obtain reasonable assurance about whether effective internal control over financial reporting was maintained in all material respects.
Our audit included obtaining an understanding of internal control over financial reporting, assessing the risk that a material weakness exists, and testing and evaluating the design and operating effectiveness of internal control based on the assessed risk. Our audit also included performing such other procedures as we considered necessary in the circumstances. We believe that our audit provides a reasonable basis for our opinion.
Definition and Limitations of Internal Control Over Financial Reporting
A company’s internal control over financial reporting is a process designed to provide reasonable assurance regarding the reliability of financial reporting and the preparation of financial statements for external purposes in accordance with generally accepted accounting principles. A company’s internal control over financial reporting includes those policies and procedures that (1) pertain to the maintenance of records that, in reasonable detail, accurately and fairly reflect the transactions and dispositions of the assets of the company; (2) provide reasonable assurance that transactions are recorded as necessary to permit preparation of financial statements in accordance with generally accepted accounting principles, and that receipts and expenditures of the company are being made
69
Table of Contents
only in accordance with authorizations of management and directors of the company; and (3) provide reasonable assurance regarding prevention or timely detection of unauthorized acquisition, use, or disposition of the company’s assets that could have a material effect on the financial statements.
Because of its inherent limitations, internal control over financial reporting may not prevent or detect misstatements. Also, projections of any evaluation of effectiveness to future periods are subject to the risk that controls may become inadequate because of changes in conditions, or that the degree of compliance with the policies or procedures may deteriorate.
| /s/ Wolf & Company, P.C. |
| Boston, Massachusetts March 1, 2018 |
70
Table of Contents
REPORT OF INDEPENDENT REGISTERED PUBLIC ACCOUNTING FIRM – CONSOLIDATED
FINANCIAL STATMENTS
To the Stockholders and the Board of Directors of
Meridian Bancorp, Inc.
Opinion on the Consolidated Financial Statements
We have audited the accompanying consolidated balance sheets of Meridian Bancorp, Inc. (the “Company”) as of December 31, 2017 and 2016, the related consolidated statements of net income, comprehensive income, changes in stockholders’ equity and cash flows for each of the three years in the period ended December 31, 2017, and the related notes (collectively referred to as the “consolidated financial statements”). In our opinion, the consolidated financial statements present fairly, in all material respects, the financial position of the Company as of December 31, 2017 and 2016, and the results of its operations and its cash flows for each of the three years in the period ended December 31, 2017, in conformity with accounting principles generally accepted in the United States of America.
We also have audited, in accordance with the standards of the Public Company Accounting Oversight Board (United States) (“PCAOB”), the Company’s internal control over financial reporting as of December 31, 2017, based on criteria established in Internal Control — Integrated Framework (2013) issued by the Committee of Sponsoring Organizations of the Treadway Commission (COSO) and our report dated March 1, 2018 expressed an unqualified opinion.
Basis for Opinion
These consolidated financial statements are the responsibility of the Company’s management. Our responsibility is to express an opinion on the Company’s consolidated financial statements based on our audits. We are a public accounting firm registered with the PCAOB and are required to be independent with respect to the Company in accordance with the U.S. federal securities laws and the applicable rules and regulations of the Securities and Exchange Commission and the PCAOB.
We conducted our audits in accordance with the standards of the PCAOB. Those standards require that we plan and perform the audit to obtain reasonable assurance about whether the consolidated financial statements are free of material misstatement, whether due to error or fraud. Our audits included performing procedures to assess the risks of material misstatement of the consolidated financial statements, whether due to error or fraud, and performing procedures that respond to those risks. Such procedures included examining, on a test basis, evidence regarding the amounts and disclosures in the consolidated financial statements. Our audits also included evaluating the accounting principles used and significant estimates made by management, as well as evaluating the overall presentation of the consolidated financial statements. We believe that our audits provide a reasonable basis for our opinion.
| /s/ Wolf & Company, P.C.
|
| We have served as the Company’s auditor since 2005.
Boston, Massachusetts March 1, 2018 |
71
Table of Contents
MERIDIAN BANCORP, INC. AND SUBSIDIARIES
CONSOLIDATED BALANCE SHEETS
| December 31, | ||||||||
| 2017 | 2016 | |||||||
| (Dollars in thousands) | ||||||||
| ASSETS | ||||||||
| Cash and due from banks |
$ | 402,687 | $ | 236,423 | ||||
| Certificates of deposit |
69,326 | 80,323 | ||||||
| Securities available for sale, at fair value |
38,364 | 67,663 | ||||||
| Federal Home Loan Bank stock, at cost |
24,947 | 18,175 | ||||||
| Loans held for sale |
3,772 | 3,944 | ||||||
| Loans, net of fees and costs |
4,667,983 | 3,938,817 | ||||||
| Less: allowance for loan losses |
(45,185 | ) | (40,149 | ) | ||||
|
|
|
|
|
|||||
| Loans, net |
4,622,798 | 3,898,668 | ||||||
| Bank-owned life insurance |
40,336 | 40,745 | ||||||
| Premises and equipment, net |
40,967 | 41,427 | ||||||
| Accrued interest receivable |
12,902 | 10,381 | ||||||
| Deferred tax asset, net |
15,244 | 21,461 | ||||||
| Goodwill |
19,638 | 13,687 | ||||||
| Core deposit intangible |
3,243 | — | ||||||
| Other assets |
5,231 | 3,105 | ||||||
|
|
|
|
|
|||||
| Total assets |
$ | 5,299,455 | $ | 4,436,002 | ||||
|
|
|
|
|
|||||
| LIABILITIES AND STOCKHOLDERS’ EQUITY | ||||||||
| Deposits: |
||||||||
| Non interest-bearing |
$ | 477,428 | $ | 431,222 | ||||
| Interest-bearing |
3,630,433 | 3,044,615 | ||||||
|
|
|
|
|
|||||
| Total deposits |
4,107,861 | 3,475,837 | ||||||
| Long-term debt |
513,444 | 322,512 | ||||||
| Accrued expenses and other liabilities |
31,751 | 30,356 | ||||||
|
|
|
|
|
|||||
| Total liabilities |
4,653,056 | 3,828,705 | ||||||
|
|
|
|
|
|||||
| Commitments and contingencies (Notes 4, 5 and 9) |
||||||||
| Stockholders’ equity: |
||||||||
| Preferred stock, $0.01 par value, 50,000,000 shares authorized; none issued |
— | — | ||||||
| Common stock, $0.01 par value, 100,000,000 shares authorized; 54,039,316 and 53,596,105 shares issued and outstanding at December 31, 2017 and 2016, respectively |
540 | 536 | ||||||
| Additional paid-in capital |
395,716 | 390,065 | ||||||
| Retained earnings |
268,533 | 234,290 | ||||||
| Accumulated other comprehensive income |
128 | 1,806 | ||||||
| Unearned compensation — ESOP, 2,557,036 and 2,678,800 shares at December 31, 2017 and 2016, respectively |
(18,518 | ) | (19,400 | ) | ||||
|
|
|
|
|
|||||
| Total stockholders’ equity |
646,399 | 607,297 | ||||||
|
|
|
|
|
|||||
| Total liabilities and stockholders’ equity |
$ | 5,299,455 | $ | 4,436,002 | ||||
|
|
|
|
|
|||||
See accompanying notes to consolidated financial statements.
72
Table of Contents
MERIDIAN BANCORP, INC. AND SUBSIDIARIES
CONSOLIDATED STATEMENTS OF NET INCOME
| Years Ended December 31, | ||||||||||||
| 2017 | 2016 | 2015 | ||||||||||
| (Dollars in thousands, except per share amounts) | ||||||||||||
| Interest and dividend income: |
||||||||||||
| Interest and fees on loans |
$ | 179,425 | $ | 145,541 | $ | 118,586 | ||||||
| Interest on debt securities: |
||||||||||||
| Taxable |
302 | 866 | 1,608 | |||||||||
| Tax-exempt |
32 | 114 | 162 | |||||||||
| Dividends on equity securities |
1,066 | 1,529 | 1,638 | |||||||||
| Interest on certificates of deposit |
814 | 495 | 624 | |||||||||
| Other interest and dividend income |
3,465 | 1,147 | 724 | |||||||||
|
|
|
|
|
|
|
|||||||
| Total interest and dividend income |
185,104 | 149,692 | 123,342 | |||||||||
|
|
|
|
|
|
|
|||||||
| Interest expense: |
||||||||||||
| Interest on deposits |
33,982 | 24,124 | 18,479 | |||||||||
| Interest on short-term borrowings |
4 | 6 | 5 | |||||||||
| Interest on long-term debt |
4,926 | 3,007 | 1,967 | |||||||||
|
|
|
|
|
|
|
|||||||
| Total interest expense |
38,912 | 27,137 | 20,451 | |||||||||
|
|
|
|
|
|
|
|||||||
| Net interest income |
146,192 | 122,555 | 102,891 | |||||||||
| Provision for loan losses |
4,859 | 7,180 | 6,667 | |||||||||
|
|
|
|
|
|
|
|||||||
| Net interest income, after provision for loan losses |
141,333 | 115,375 | 96,224 | |||||||||
|
|
|
|
|
|
|
|||||||
| Non-interest income: |
||||||||||||
| Customer service fees |
8,517 | 8,491 | 7,931 | |||||||||
| Loan fees |
1,970 | 918 | 917 | |||||||||
| Mortgage banking gains, net |
457 | 573 | 535 | |||||||||
| Gain on sales of securities, net |
9,305 | 3,020 | 2,432 | |||||||||
| Income from bank-owned life insurance |
1,158 | 1,188 | 1,225 | |||||||||
| Gain on life insurance distribution |
1,657 | — | — | |||||||||
|
|
|
|
|
|
|
|||||||
| Total non-interest income |
23,064 | 14,190 | 13,040 | |||||||||
|
|
|
|
|
|
|
|||||||
| Non-interest expenses: |
||||||||||||
| Salaries and employee benefits |
53,161 | 48,828 | 44,737 | |||||||||
| Occupancy and equipment |
11,533 | 10,809 | 9,876 | |||||||||
| Data processing |
5,912 | 5,135 | 5,204 | |||||||||
| Marketing and advertising |
3,653 | 3,217 | 3,715 | |||||||||
| Professional services |
3,669 | 2,965 | 2,633 | |||||||||
| Deposit insurance |
2,988 | 2,037 | 1,989 | |||||||||
| Merger and acquisition |
2,055 | — | — | |||||||||
| Other general and administrative |
4,994 | 4,503 | 4,537 | |||||||||
|
|
|
|
|
|
|
|||||||
| Total non-interest expenses |
87,965 | 77,494 | 72,691 | |||||||||
|
|
|
|
|
|
|
|||||||
| Income before income taxes |
76,432 | 52,071 | 36,573 | |||||||||
| Provision for income taxes |
33,487 | 17,881 | 11,966 | |||||||||
|
|
|
|
|
|
|
|||||||
| Net income |
$ | 42,945 | $ | 34,190 | $ | 24,607 | ||||||
|
|
|
|
|
|
|
|||||||
| Earnings per share: |
||||||||||||
| Basic |
$ | 0.84 | $ | 0.67 | $ | 0.47 | ||||||
| Diluted |
$ | 0.82 | $ | 0.65 | $ | 0.46 | ||||||
| Weighted average shares: |
||||||||||||
| Basic |
51,153,665 | 51,128,914 | 51,965,036 | |||||||||
| Diluted |
52,663,597 | 52,248,308 | 53,071,932 | |||||||||
See accompanying notes to consolidated financial statements.
73
Table of Contents
MERIDIAN BANCORP, INC. AND SUBSIDIARIES
CONSOLIDATED STATEMENTS OF COMPREHENSIVE INCOME
| Years Ended December 31, | ||||||||||||
| 2017 | 2016 | 2015 | ||||||||||
| (In thousands) | ||||||||||||
| Net income |
$ | 42,945 | $ | 34,190 | $ | 24,607 | ||||||
|
|
|
|
|
|
|
|||||||
| Other comprehensive income (loss): |
||||||||||||
| Securities available for sale: |
||||||||||||
| Unrealized holding gain (loss) |
6,599 | 9,464 | (5,982 | ) | ||||||||
| Reclassification adjustment for gains realized in income (1) |
(9,305 | ) | (3,020 | ) | (2,432 | ) | ||||||
|
|
|
|
|
|
|
|||||||
| Net unrealized gain (loss) |
(2,706 | ) | 6,444 | (8,414 | ) | |||||||
| Tax effect |
1,152 | (2,582 | ) | 3,327 | ||||||||
|
|
|
|
|
|
|
|||||||
| Net-of-tax amount |
(1,554 | ) | 3,862 | (5,087 | ) | |||||||
|
|
|
|
|
|
|
|||||||
| Defined benefit plans: |
||||||||||||
| Reclassification adjustments (2): |
||||||||||||
| Amortization of prior service cost |
17 | 24 | 45 | |||||||||
| Amortization of unrecognized cost |
38 | 32 | 105 | |||||||||
| Actuarial net loss arising during the year |
(210 | ) | (57 | ) | (1 | ) | ||||||
| Settlement costs |
38 | 56 | — | |||||||||
|
|
|
|
|
|
|
|||||||
| (117 | ) | 55 | 149 | |||||||||
| Tax effect |
(7 | ) | (19 | ) | (52 | ) | ||||||
|
|
|
|
|
|
|
|||||||
| Net-of-tax amount |
(124 | ) | 36 | 97 | ||||||||
|
|
|
|
|
|
|
|||||||
| Total other comprehensive income (loss) |
(1,678 | ) | 3,898 | (4,990 | ) | |||||||
|
|
|
|
|
|
|
|||||||
| Comprehensive income |
$ | 41,267 | $ | 38,088 | $ | 19,617 | ||||||
|
|
|
|
|
|
|
|||||||
| (1) | Amounts are included in gain on sales of securities, net in the Consolidated Statements of Net Income. Provision for income tax associated with the reclassification adjustments for the years ended December 31, 2017, 2016 and 2015 was $4.0 million, $1.2 million and $962,000, respectively. |
| (2) | Amounts are included in salaries and employee benefits in the Consolidated Statements of Net Income. Benefit for income tax associated with the reclassification adjustments for the years ended December 31, 2017, 2016 and 2015 was $12,000, $19,000 and $52,000, respectively. |
See accompanying notes to consolidated financial statements.
74
Table of Contents
MERIDIAN BANCORP, INC. AND SUBSIDIARIES
CONSOLIDATED STATEMENTS OF CHANGES IN STOCKHOLDERS’ EQUITY
Years Ended December 31, 2017, 2016 and 2015
| Shares
of Common Stock Outstanding |
Common Stock | Additional Paid-in Capital |
Retained Earnings |
Accumulated Other Comprehensive Income (Loss) |
Unearned Compensation - ESOP |
Total | ||||||||||||||||||||||
| (Dollars in thousands) | ||||||||||||||||||||||||||||
| Balance at December 31, 2014 |
54,708,066 | 547 | $ | 410,714 | $ | 184,715 | $ | 2,898 | $ | (21,164 | ) | $ | 577,710 | |||||||||||||||
| Comprehensive income |
— | — | — | 24,607 | (4,990 | ) | — | 19,617 | ||||||||||||||||||||
| Dividends declared ($0.06 per share) |
— | — | — | (3,108 | ) | — | — | (3,108 | ) | |||||||||||||||||||
| Repurchased stock related to buyback program |
(722,104 | ) | (7 | ) | (9,421 | ) | — | — | — | (9,428 | ) | |||||||||||||||||
| ESOP shares earned (121,764 shares) |
— | — | 713 | — | — | 882 | 1,595 | |||||||||||||||||||||
| Share-based compensation expense — restricted stock, net of awards forfeited |
685,480 | 7 | 724 | — | — | — | 731 | |||||||||||||||||||||
| Share-based compensation expense — stock options, net of awards forfeited |
— | — | 357 | — | — | — | 357 | |||||||||||||||||||||
| Excess tax benefits in connection with share-based compensation |
— | — | 420 | — | — | — | 420 | |||||||||||||||||||||
| Stock options exercised |
203,795 | 2 | 230 | — | — | — | 232 | |||||||||||||||||||||
|
|
|
|
|
|
|
|
|
|
|
|
|
|
|
|||||||||||||||
| Balance at December 31, 2015 |
54,875,237 | 549 | 403,737 | 206,214 | (2,092 | ) | (20,282 | ) | 588,126 | |||||||||||||||||||
| Comprehensive income |
— | — | — | 34,190 | 3,898 | — | 38,088 | |||||||||||||||||||||
| Dividends declared ($0.12 per share) |
— | — | — | (6,114 | ) | — | — | (6,114 | ) | |||||||||||||||||||
| Repurchased stock related to buyback program |
(1,337,507 | ) | (13 | ) | (18,786 | ) | — | — | — | (18,799 | ) | |||||||||||||||||
| ESOP shares earned (121,764 shares) |
— | — | 960 | — | — | 882 | 1,842 | |||||||||||||||||||||
| Share-based compensation expense — restricted stock, net of awards forfeited |
(21,538 | ) | — | 2,104 | — | — | — | 2,104 | ||||||||||||||||||||
| Share-based compensation expense — stock options, net of awards forfeited |
— | — | 1,231 | — | — | — | 1,231 | |||||||||||||||||||||
| Excess tax benefits in connection with share-based compensation |
— | — | 614 | — | — | — | 614 | |||||||||||||||||||||
| Stock options exercised |
79,913 | — | 205 | — | — | — | 205 | |||||||||||||||||||||
|
|
|
|
|
|
|
|
|
|
|
|
|
|
|
|||||||||||||||
| Balance at December 31, 2016 |
53,596,105 | 536 | 390,065 | 234,290 | 1,806 | (19,400 | ) | 607,297 | ||||||||||||||||||||
| Comprehensive income |
— | — | — | 42,945 | (1,678 | ) | — | 41,267 | ||||||||||||||||||||
| Dividends declared ($0.17 per share) |
— | — | — | (8,702 | ) | — | — | (8,702 | ) | |||||||||||||||||||
| ESOP shares earned (121,764 shares) |
— | — | 1,350 | — | — | 882 | 2,232 | |||||||||||||||||||||
| Share-based compensation expense — restricted stock, net of awards forfeited |
259,661 | 2 | 2,393 | — | — | — | 2,395 | |||||||||||||||||||||
| Share-based compensation expense — stock options, net of awards forfeited |
— | — | 1,409 | — | — | — | 1,409 | |||||||||||||||||||||
| Stock options exercised |
183,550 | 2 | 499 | — | — | — | 501 | |||||||||||||||||||||
|
|
|
|
|
|
|
|
|
|
|
|
|
|
|
|||||||||||||||
| Balance at December 31, 2017 |
54,039,316 | $ | 540 | $ | 395,716 | $ | 268,533 | $ | 128 | $ | (18,518 | ) | $ | 646,399 | ||||||||||||||
|
|
|
|
|
|
|
|
|
|
|
|
|
|
|
|||||||||||||||
See accompanying notes to consolidated financial statements.
75
Table of Contents
MERIDIAN BANCORP, INC. AND SUBSIDIARIES
CONSOLIDATED STATEMENTS OF CASH FLOWS
| Years Ended December 31, | ||||||||||||
| 2017 | 2016 | 2015 | ||||||||||
| (In thousands) | ||||||||||||
| Cash flows from operating activities: |
||||||||||||
| Net income |
$ | 42,945 | $ | 34,190 | $ | 24,607 | ||||||
| Adjustments to reconcile net income to net cash provided by operating activities: |
||||||||||||
| Accretion of acquisition fair value adjustments |
(168 | ) | (145 | ) | (133 | ) | ||||||
| ESOP shares earned expense |
2,232 | 1,842 | 1,595 | |||||||||
| Provision for loan losses |
4,859 | 7,180 | 6,667 | |||||||||
| Accretion of net deferred loan origination fees |
(1,738 | ) | (1,273 | ) | (1,011 | ) | ||||||
| Net amortization (accretion) of securities available for sale |
8 | (47 | ) | (64 | ) | |||||||
| Depreciation and amortization expense |
3,069 | 3,004 | 2,524 | |||||||||
| Gain on sales of securities, net |
(9,305 | ) | (3,020 | ) | (2,432 | ) | ||||||
| Net loss and provision for foreclosed real estate |
— | 8 | 214 | |||||||||
| Deferred income tax provision (benefit) |
6,823 | (2,816 | ) | (2,361 | ) | |||||||
| Income from bank-owned life insurance |
(1,158 | ) | (1,188 | ) | (1,225 | ) | ||||||
| Gain on life insurance distribution |
(1,657 | ) | — | — | ||||||||
| Share-based compensation expense |
3,804 | 3,335 | 1,088 | |||||||||
| Excess tax benefits in connection with share-based compensation |
— | (614 | ) | (420 | ) | |||||||
| Net changes in: |
||||||||||||
| Loans held for sale |
2,288 | 725 | (3,698 | ) | ||||||||
| Accrued interest receivable |
(2,245 | ) | (1,807 | ) | (826 | ) | ||||||
| Other assets |
471 | 179 | 3,172 | |||||||||
| Accrued expenses and other liabilities |
198 | 4,458 | 80 | |||||||||
|
|
|
|
|
|
|
|||||||
| Net cash provided by operating activities |
50,426 | 44,011 | 27,777 | |||||||||
|
|
|
|
|
|
|
|||||||
| Cash flows from investing activities: |
||||||||||||
| Cash paid for business combination, net of acquired cash |
(2,005 | ) | — | — | ||||||||
| Purchases of certificates of deposit |
(22,650 | ) | (80,423 | ) | (26,562 | ) | ||||||
| Maturities of certificates of deposit |
35,130 | 99,162 | 12,500 | |||||||||
| Activity in securities available for sale: |
||||||||||||
| Proceeds from maturities, calls and principal payments |
16,759 | 56,353 | 44,470 | |||||||||
| (Purchase) redemption of mutual funds, net |
(8 | ) | 1,191 | 19,867 | ||||||||
| Proceeds from sales |
40,864 | 38,429 | 27,120 | |||||||||
| Purchases |
(8,395 | ) | (12,035 | ) | (35,507 | ) | ||||||
| Proceeds from distribution of bank-owned life insurance |
3,224 | — | 279 | |||||||||
| Loans originated, net of principal payments received |
(655,291 | ) | (860,088 | ) | (401,953 | ) | ||||||
| Purchases of premises and equipment |
(1,213 | ) | (4,100 | ) | (4,177 | ) | ||||||
| (Purchase) redemption of Federal Home Loan Bank stock |
(6,049 | ) | (7,244 | ) | 1,794 | |||||||
| Proceeds from sales of foreclosed real estate |
1,690 | 808 | 832 | |||||||||
|
|
|
|
|
|
|
|||||||
| Net cash used in investing activities |
(597,944 | ) | (767,947 | ) | (361,337 | ) | ||||||
|
|
|
|
|
|
|
|||||||
(continued)
See accompanying notes to consolidated financial statements.
76
Table of Contents
MERIDIAN BANCORP, INC. AND SUBSIDIARIES
CONSOLIDATED STATEMENTS OF CASH FLOWS (Concluded)
| Years Ended December 31, | ||||||||||||
| 2017 | 2016 | 2015 | ||||||||||
| (In thousands) | ||||||||||||
| Cash flows from financing activities: |
||||||||||||
| Net increase in deposits |
538,198 | 732,838 | 239,102 | |||||||||
| Net change in borrowings with maturities less than three months |
— | (20,000 | ) | 20,000 | ||||||||
| Proceeds from Federal Home Loan Bank advances with maturities of three months or more |
320,625 | 220,000 | 18,000 | |||||||||
| Repayment of Federal Home Loan Bank advances with maturities of three months or more |
(137,886 | ) | (44,714 | ) | (42,673 | ) | ||||||
| Cash dividends paid on common stock |
(7,656 | ) | (6,148 | ) | (1,462 | ) | ||||||
| Stock options exercised |
501 | 205 | 232 | |||||||||
| Repurchase of common stock |
— | (18,799 | ) | (9,428 | ) | |||||||
| Excess tax benefits in connection with share-based compensation |
— | 614 | 420 | |||||||||
|
|
|
|
|
|
|
|||||||
| Net cash provided by financing activities |
713,782 | 863,996 | 224,191 | |||||||||
|
|
|
|
|
|
|
|||||||
| Net change in cash and cash equivalents |
166,264 | 140,060 | (109,369 | ) | ||||||||
| Cash and cash equivalents at beginning of year |
236,423 | 96,363 | 205,732 | |||||||||
|
|
|
|
|
|
|
|||||||
| Cash and cash equivalents at end of year |
$ | 402,687 | $ | 236,423 | $ | 96,363 | ||||||
|
|
|
|
|
|
|
|||||||
| Supplemental cash flow information: |
||||||||||||
| Interest paid on deposits |
$ | 33,665 | $ | 23,762 | $ | 18,477 | ||||||
| Interest paid on borrowings |
4,683 | 2,900 | 1,994 | |||||||||
| Income taxes paid, net of refunds |
27,165 | 19,151 | 13,905 | |||||||||
| Non-cash investing and financing activities: |
||||||||||||
| Transfers from loans to foreclosed real estate |
1,690 | 816 | — | |||||||||
| Net amounts due from (to) broker on security transactions |
970 | (462 | ) | — | ||||||||
| In conjunction with the purchase acquisition detailed in Note 14 to the Consolidated Financial Statements, assets were acquired and liabilities were assumed as follows: |
||||||||||||
| Fair value of assets acquired, net of cash acquired |
104,616 | — | — | |||||||||
| Fair value of liabilities assumed |
102,611 | — | — | |||||||||
See accompanying notes to consolidated financial statements.
77
Table of Contents
NOTES TO CONSOLIDATED FINANCIAL STATEMENTS
1. SUMMARY OF SIGNIFICANT ACCOUNTING POLICIES
Basis of Presentation and Consolidation
Meridian Bancorp, Inc. (the “Company”) is a Maryland corporation incorporated on March 6, 2014 to be the successor to Meridian Interstate Bancorp, Inc. (“Old Meridian”) upon completion of the second-step mutual-to-stock conversion (the “Conversion”) of Meridian Financial Services, Incorporated (the “MHC”), the top tier mutual holding company of Old Meridian. Old Meridian was the former mid-tier holding company for East Boston Savings Bank (the “Bank”). Prior to completion of the Conversion, approximately 59% of the shares of common stock of Old Meridian were owned by the MHC. In conjunction with the Conversion, the MHC and Meridian Interstate Funding Corporation were merged into Old Meridian (and ceased to exist), and Old Meridian merged into the Company and the Company became its successor under the name Meridian Bancorp, Inc. The Conversion was completed July 28, 2014.
The consolidated financial statements include the accounts of the Company and all other entities in which it has a controlling financial interest. The Company owns the Bank. The Bank’s subsidiaries include Prospect, Inc., which engages in securities transactions on its own behalf, and EBOSCO, LLC which can hold foreclosed real estate, and East Boston Investment Services, Inc., which is authorized for third-party investment sales and is currently inactive. All significant intercompany balances and transactions have been eliminated in consolidation.
Business and Operating Segments
The Company provides loan and deposit services to its customers through its local banking offices in the greater Boston metropolitan area. The Company is subject to competition from other financial institutions including commercial banks, other savings banks, credit unions, mortgage banking companies and other financial service providers.
Generally, financial information is to be reported on the basis that it is used internally for evaluating segment performance and deciding how to allocate resources to segments. Management evaluates the Company’s performance and allocates resources based on a single segment concept. Accordingly, there is no separately identified material operating segment for which discrete financial information is available. The Company does not derive revenues from, or have assets located in foreign countries, nor does it derive revenues from any single customer that represents 10% or more of the Company’s total revenues.
Use of Estimates
In preparing consolidated financial statements in conformity with accounting principles generally accepted in the United States of America, management is required to make estimates and assumptions that affect the reported amounts of assets and liabilities as of the date of the consolidated balance sheet and reported amounts of revenues and expenses during the reporting period. Actual results could differ from those estimates. Material estimates that are particularly susceptible to significant change in the near term relate to the determination of the allowance for loan losses and evaluation of securities for other-than-temporary impairment.
Significant Concentrations of Credit Risk
Most of the Company’s activities are with customers located within Massachusetts. Note 2 includes the types of securities in which the Company invests and Note 3 includes the types of lending in which the Company engages. The Company believes that it does not have any significant loan concentrations or security in any one industry or with any customer.
Reclassification
Certain amounts in the 2016 and 2015 consolidated financial statements have been reclassified to conform to the 2017 presentation.
78
Table of Contents
NOTES TO CONSOLIDATED FINANCIAL STATEMENTS — (Continued)
Cash and Cash Equivalents
For purposes of the consolidated statements of cash flows, cash and cash equivalents include amounts due from banks and federal funds sold on a daily basis, which mature overnight or on demand. The Company may from time to time have deposits in financial institutions which exceed the federally insured limits. At December 31, 2017, the Company had a concentration of cash on deposit at the Federal Reserve Bank amounting to $353.0 million.
Certificates of Deposit
Certificates of deposit are purchased from FDIC-insured depository institutions, have an original maturity greater than 90 days and up to 24 months and are carried at cost. At December 31, 2017, all certificates of deposit invested in by the Company exceeded the FDIC insurance limit of $250,000 but were insured up to the full amount under the Massachusetts Depositors Insurance Fund, Massachusetts Credit Union Share Insurance Corporation or Massachusetts Cooperative Bank Share Insurance Fund.
Fair Value Hierarchy
The Company groups its assets and liabilities measured at fair value in three levels, based on the markets in which the assets and liabilities are traded and the reliability of the assumptions used to determine fair value.
Level 1 — Valuation is based on quoted prices in active markets for identical assets or liabilities. Valuations are obtained from readily available pricing sources for market transactions involving identical assets or liabilities.
Level 2 — Valuation is based on observable inputs other than Level 1 prices, such as quoted prices for similar assets or liabilities; quoted prices in markets that are not active; or other inputs that are observable or can be corroborated by observable market data for substantially the full term of the assets or liabilities.
Level 3 — Valuation is based on unobservable inputs that are supported by little or no market activity and that are significant to the fair value of the assets or liabilities. Level 3 assets and liabilities include financial instruments whose value is determined using unobservable inputs to pricing models, discounted cash flow methodologies, or similar techniques, as well as instruments for which the determination of fair value requires significant management judgment or estimation.
Transfers between levels are recognized at the end of a reporting period, if applicable.
Securities Available for Sale
Securities are classified as available for sale and recorded at fair value, with unrealized gains and losses excluded from earnings and reported as a separate component in other comprehensive income, net of tax effects. Purchase premiums and discounts are recognized in interest income using the effective interest method over the terms of the securities. Gains and losses on the sale of securities are recorded on the trade date and are determined using the specific identification method.
Each reporting period, the Company evaluates all securities with a decline in fair value below the amortized cost of the investment to determine whether or not other-than-temporary impairment (“OTTI”) exists. OTTI is required to be recognized if (1) the Company intends to sell the security; (2) it is more likely than not that the Company will be required to sell the security before recovery of its amortized cost basis; or (3) for debt securities, the present value of expected cash flows is not sufficient to recover the entire amortized cost basis. Marketable equity securities are evaluated for OTTI based on the severity and duration of the impairment and, if deemed to be other than temporary, the declines in fair value are reflected in earnings as realized losses. For impaired debt securities that the Company intends to sell, or more likely than not will be required to sell, the full amount of the depreciation is recognized as OTTI through earnings. For all other impaired debt securities, credit-related OTTI is recognized through earnings and non-credit related OTTI is recognized in other comprehensive income, net of applicable taxes.
79
Table of Contents
NOTES TO CONSOLIDATED FINANCIAL STATEMENTS — (Continued)
Federal Home Loan Bank Stock
The Bank, as a member of the Federal Home Loan Bank (“FHLB”) system, is required to maintain an investment in capital stock of the FHLB. Based on redemption provisions of the FHLB, the stock has no quoted market value and is carried at cost. At its discretion, the FHLB may declare dividends on the stock. The Company reviews for impairment based on the ultimate recoverability of the cost basis on the FHLB stock. As of December 31, 2017 no impairment has been recognized.
Loans Held For Sale
Loans originated and intended for sale in the secondary market are carried at the lower of cost or estimated fair value in the aggregate. Net unrealized losses, if any, are recognized through a valuation allowance by charges to income.
Loans
The Company grants mortgage, commercial and consumer loans to customers. The Company’s loan portfolio includes one- to four-family residential real estate, multi-family, home equity lines of credit, commercial real estate, construction, commercial and industrial and consumer segments.
A substantial portion of the loan portfolio is represented by mortgage loans throughout eastern Massachusetts. The ability of the Company’s debtors to honor their contracts is dependent upon the real estate and general economic conditions in this area.
Loans that management has the intent and ability to hold for the foreseeable future or until maturity or pay-off generally are reported at their outstanding unpaid principal balances adjusted for charge-offs, the allowance for loan losses, and net deferred loan origination costs or fees. Interest income is accrued on the unpaid principal balance. Loan origination fees, net of certain direct origination costs, are deferred and recognized as an adjustment of the related loan yield using the interest method over the terms of the loans.
The accrual of interest on all loans is discontinued at the time the loan is 90 days past due, unless the credit is well secured and in process of collection. Past due status is based on contractual terms of the loan. In all cases, loans are placed on non-accrual or charged-off at an earlier date if collection of principal or interest is considered doubtful. All interest accrued but not collected for loans that are placed on non-accrual or charged off is reversed against interest income. The interest on these loans is accounted for on the cash-basis or cost-recovery method, until qualifying for return to accrual. Loans are returned to accrual status when all the principal and interest amounts contractually due are brought current and future payments are reasonably assured.
Allowance for Loan Losses
The allowance for loan losses represents management’s estimate of the probable losses inherent in the loan portfolio and is established as losses are estimated to have occurred through a provision for loan losses charged to earnings. Loan losses are charged against the allowance when management believes the uncollectibility of a loan balance is confirmed. Subsequent recoveries, if any, are credited to the allowance.
The adequacy of the allowance for loan losses is evaluated on a regular basis by management. This evaluation is inherently subjective as it requires estimates that are susceptible to significant revision as more information becomes available.
The allowance consists of general and allocated components and may include an unallocated component, as further described below.
General Component
The general component of the allowance for loan losses is based on historical loss experience adjusted for qualitative factors stratified by loan segments and classes. Management uses a rolling average of historical losses
80
Table of Contents
NOTES TO CONSOLIDATED FINANCIAL STATEMENTS — (Continued)
based on a time frame appropriate to capture relevant loss data for each loan segment. This historical loss factor is adjusted for the following qualitative factors: levels/trends in delinquent and non-accrual loans; trends in volume and terms of loans; effects of changes in risk selection and underwriting standards and other changes in lending policies, procedures and practices; experience/ability/depth of lending management and staff; national and local economic trends and conditions, and industry conditions. There were no changes in the Company’s policies or methodology pertaining to the general component of the allowance for loan losses during 2017, 2016 or 2015.
The qualitative factors are determined based on the various risk characteristics of each loan segment. Risk characteristics relevant to each loan segment are as follows:
One- to four-family residential real estate loans and home equity lines of credit — The Company primarily originates loans with a loan-to-value ratio of 80% or less and does not grant subprime loans. The Company may also originate loans with loan-to-value ratios up to 95% (100% for first time home buyers only) with such value measured at origination; however, private mortgage insurance is generally required for loans with a loan-to-value ratio over 80%. All loans in these segments are collateralized by residential real estate and repayment is dependent on the credit quality of the individual borrower. The overall health of the economy, including unemployment rates and housing prices, will have an effect on the credit quality in these segments.
Multi-family and commercial real estate loans — Loans in these segments are primarily income-producing properties such as apartment buildings and properties used for business purposes such as office buildings, industrial facilities and retail facilities. These properties are generally located in the greater Boston metropolitan area and certain other areas in eastern Massachusetts, and in southeastern New Hampshire and Maine. The underlying cash flows generated by the properties can be adversely impacted by a downturn in the economy as evidenced by increased vacancy rates, which in turn, could have an effect on the credit quality in these segments. Management obtains rent rolls annually and continually monitors the cash flows of these loans.
Construction loans — Loans in this segment primarily include loans for construction of commercial development projects, including apartment buildings, small industrial buildings and retail and office buildings. The Company also originates loans to individuals and to builders to finance the construction of residential dwellings. Most of these construction loans provide for the payment of only interest during the construction phase, which is usually up to 12 to 24 months, although some construction loans are renewed, generally for one or two additional years. At the end of the construction phase, the loan may convert to a permanent mortgage loan or the loan may be paid in full. Loans generally are made with a maximum loan to value ratio of 80% of the appraised market value upon completion of the project. Management carefully monitors the existing construction portfolio for performance and project completion, with a goal of moving completed commercial projects to the commercial real estate portfolio and reviewing sales-based projects for tracking toward construction goals. The rent-up or sales of the properties can be adversely impacted by a downturn in the economy as evidenced by increased vacancy rates or decreased home sales.
Commercial and industrial loans — Loans in this segment are made to businesses in the Company’s market area and are generally secured by real estate or other assets of the business. Repayment is expected from the cash flows of the business. A weakened economy, and resultant decreased consumer spending, could have an effect on the credit quality in this segment.
Consumer loans — Loans in this segment may include automobile loans, loans secured by passbook or certificate accounts and overdraft loans and repayment is dependent on the credit quality of the individual borrower.
Allocated Component
The allocated component relates to loans that are classified as impaired. Impairment is measured on a loan by loan basis for multi-family residential, commercial real estate, construction and commercial and industrial
81
Table of Contents
NOTES TO CONSOLIDATED FINANCIAL STATEMENTS — (Continued)
loans by either the present value of expected future cash flows discounted at the loan’s effective interest rate or the fair value of the collateral if the loan is collateral dependent.
An allowance is established when the discounted cash flows (or collateral value) of the impaired loan is lower than the carrying value of that loan. Large groups of smaller balance homogeneous loans are collectively evaluated for impairment. Accordingly, the Company does not separately identify individual one- to four-family residential real estate, home equity lines of credit and consumer loans for impairment disclosures, unless such loans are subject to a troubled debt restructuring agreement.
A loan is considered impaired when, based on current information and events, it is probable that the Company will be unable to collect the scheduled payments of principal or interest when due according to the contractual terms of the loan agreement. Factors considered by management in determining impairment include payment status, collateral value, and the probability of collecting scheduled principal and interest payments when due. Loans that experience insignificant payment delays and payment shortfalls generally are not classified as impaired. Management determines the significance of payment delays and payment shortfalls on a case-by-case basis, taking into consideration all of the circumstances surrounding the loan and the borrower, including the length of the delay, the reasons for the delay, the borrower’s prior payment record, and the amount of the shortfall in relation to the principal and interest owed.
The Company periodically may agree to modify the contractual terms of loans. When a loan is modified and a concession is made to a borrower experiencing financial difficulty, the modification is considered a troubled debt restructuring (“TDR”). All TDRs are initially classified as impaired.
Unallocated Component
An unallocated component may be maintained to cover uncertainties that could affect management’s estimate of probable losses. An unallocated component of the allowance would reflect the margin of imprecision inherent in the underlying assumptions used in the methodologies for estimating allocated and general components of the allowance for loan losses.
Bank-Owned Life Insurance
The Bank has purchased insurance policies on the lives of certain directors, executive officers and employees. Bank-owned life insurance policies are reflected on the consolidated balance sheets at cash surrender value. Changes in net cash surrender value of the policies, as well as excess insurance proceeds received, are reflected in non-interest income on the consolidated statements of net income and are not subject to income taxes.
Premises and Equipment
Land is carried at cost. Buildings, equipment and leasehold improvements are stated at cost, less accumulated depreciation and amortization, computed on the straight-line method over the estimated useful lives of the assets or the expected terms of the leases, if shorter. Expected terms include lease option periods to the extent that the exercise of such options is reasonably assured. It is general practice to charge the cost of maintenance and repairs to earnings when incurred; major expenditures for improvements are capitalized and depreciated.
Derivative Financial Instruments
Derivative financial instruments are recognized as assets and liabilities on the consolidated balance sheet and measured at fair value, if material.
Loan Level Interest Rate Swaps
The Company enters into interest rate swaps with commercial loan customers to synthetically convert the customer’s loan from a variable rate to a fixed rate. These swaps are matched in offsetting terms to swaps that the
82
Table of Contents
NOTES TO CONSOLIDATED FINANCIAL STATEMENTS — (Continued)
Company enters into with an outside third party. The swaps are reported at fair value in other assets and other liabilities. The Company’s swaps qualify as derivatives, but are not designated as hedging instruments, thus any net gain or loss resulting from changes in the fair value is recognized in other non-interest income.
Derivative Loan Commitments
Residential real estate loan commitments are referred to as derivative loan commitments if the loan that will result from exercise of the commitment will be held for sale upon funding. Loan commitments that are derivatives are recognized at fair value on the consolidated balance sheet in other assets and other liabilities with changes in their fair values recorded in mortgage-banking gains, net, if material. Such amounts were immaterial at December 31, 2017 and 2016.
Forward Loan Sale Commitments
To protect against the price risk inherent in derivative loan commitments, the Company utilizes both “mandatory delivery” and “best efforts” forward loan sale commitments to mitigate the risk of potential decreases in the values of loans that would result from the exercise of the derivative loan commitments. Mandatory delivery forward sale commitments are recognized at fair value on the consolidated balance sheet in other assets and other liabilities with changes in their fair values recorded in mortgage-banking gains, net if material. Such amounts were immaterial at December 31, 2017 and 2016.
Foreclosed Assets
Assets acquired through, or in lieu of, loan foreclosure are held for sale and are initially recorded at fair value less costs to sell at the date of foreclosure, establishing a new cost basis. The excess, if any, of the loan balance over the fair value of the asset at the time of transfer from loans to foreclosed assets is charged to the allowance for loan losses. Subsequent to foreclosure, valuations are periodically performed by management and the assets are carried at the lower of carrying amount or fair value less costs to sell. Revenue and expenses from operations, changes in the valuation allowance, any direct write-downs and gains or losses on sales are included in other general and administrative expenses.
Valuation of Goodwill and Core Deposit Intangible and Analysis for Impairment
The Company’s goodwill resulted from the acquisitions of other financial institutions accounted for under the acquisition method of accounting. The amount of goodwill recorded at acquisition was impacted by the recorded fair value of the assets acquired and liabilities assumed, which is an estimate determined by the use of internal or other valuation techniques.
Goodwill is subject to an annual review by management that first assesses qualitative factors to determine whether it is necessary to perform the two-step quantitative goodwill impairment test. The Company is not required to calculate the fair value of the Company unless management determines, based on the qualitative assessment, that it is more likely than not that its fair value is less than its carrying amount. If the two-step quantitative goodwill impairment test is necessary, step one compares the book value of the Company to the fair value of the Company. If book value exceeds fair value, a more detailed analysis is performed, which involves measuring the excess of the fair value of the Company, as determined in step one, over the aggregate fair value of the individual assets, liabilities, and identifiable intangibles as if the Company was being acquired in a business combination. In the event of future changes in fair value, the Company may be exposed to an impairment charge that could be material.
The fair value of the core deposit intangible associated with the acquired non-maturity deposits is amortized on an accelerated method over the estimated life of 10 years. Core deposit intangible is reviewed for impairment whenever events or changes in circumstances indicate that the carrying amount of the asset may not be recoverable.
83
Table of Contents
NOTES TO CONSOLIDATED FINANCIAL STATEMENTS — (Continued)
Transfers of Financial Assets
Transfers of an entire financial asset, a group of entire financial assets, or participating interest in an entire financial asset are accounted for as sales when control over the assets has been surrendered. Control over transferred assets is deemed to be surrendered when (1) the assets have been isolated from the Company, (2) the transferee obtains the right to pledge or exchange the transferred assets, and (3) the Company does not maintain effective control over the transferred assets.
During the normal course of business, the Company may transfer a portion of a financial asset, for example, a participation loan or the government guaranteed portion of a loan. In order to be eligible for sales treatment, the transfer of the portion of the loan must meet the criteria of a participating interest. If it does not meet the criteria of a participating interest, the transfer must be accounted for as a secured borrowing. In order to meet the criteria for a participating interest, all cash flows from the loan must be divided proportionately, the rights of each loan holder must have the same priority, the loan holders must have no recourse to the transferor other than standard representations and warranties and no loan holder has the right to pledge or exchange the entire loan.
Marketing and Advertising
Marketing and advertising costs are expensed as incurred.
Supplemental Director and Executive Retirement and Long-Term Health Care Plans
The Company accounts for certain supplemental director and executive retirement and long-term health care benefits on the net periodic cost method using an actuarial model that allocates costs over the service period of participants in the plans. The Company accounts for the over-funded or under-funded status of these defined benefit plans as an asset or liability in its consolidated balance sheets and recognizes changes in the funded status in the year in which the changes occur through other comprehensive income or loss.
Share-Based Compensation Plans
The Company measures and recognizes compensation cost relating to share-based payment transactions based on the grant-date fair value of the equity instruments issued. Share-based compensation is recognized over the period the employee is required to provide service for the award. Reductions in compensation expense associated with forfeited options are estimated at the date of grant, and this estimated forfeiture rate is adjusted quarterly based on actual forfeiture experience. The Company uses the Black-Scholes option-pricing model to determine the fair value of stock options granted.
Employee Stock Ownership Plan
Compensation expense for the Employee Stock Ownership Plan (“ESOP”) is recorded at an amount equal to the shares allocated by the ESOP, multiplied by the average fair market value of the shares during the period. The Company recognizes compensation expense ratably over the year based upon the Company’s estimate of the number of shares expected to be allocated by the ESOP. Unearned compensation applicable to the ESOP is reflected as a reduction of stockholder’s equity in the consolidated balance sheets. The difference between the average fair market value and the cost of the shares allocated by the ESOP is recorded as an adjustment to additional paid-in capital.
Income Taxes
Deferred income tax assets and liabilities are determined using the liability (or balance sheet) method. Under this method, the net deferred tax asset or liability is determined based on the tax effects of the temporary differences between the book and tax basis of the various balance sheet assets and liabilities and gives current recognition to changes in tax rates and laws in the period of enactment. Accordingly, changes resulting from the Tax Cuts and Jobs Act enacted on December 22, 2017 have been recognized in the consolidated financial statements as of and for the year ended December 31, 2017. See Note 8. A valuation allowance is established
84
Table of Contents
NOTES TO CONSOLIDATED FINANCIAL STATEMENTS — (Continued)
against deferred tax assets when, based upon the available evidence including historical and projected taxable income, it is more likely than not that some or all of the deferred tax assets will not be realized. The Company does not have any uncertain tax positions at December 31, 2017 or 2016 which require accrual or disclosure. The Company records interest and penalties as part of income tax expense. No interest or penalties were recorded for the years ended December 31, 2017, 2016 and 2015.
The Company records excess tax benefits or deficiencies in income tax expense or benefit in the income statement as part of the provision for income taxes beginning in 2017. Previously, such amounts were recorded to additional paid in capital. For interim reporting purposes the excess tax benefits or deficiencies are recorded as discrete items in the period in which they occur. The presentation of the excess tax benefits is presented as an operating activity in the statement of cash flows. In addition, when calculating incremental shares for earnings per share, the Company excludes from assumed proceeds excess tax benefits that previously would have been recorded in additional paid-in capital. The total income tax benefit recorded in the provision for income taxes for the year ended December 31, 2017 was $966,000.
Earnings Per Share
Basic earnings per share excludes dilution and is calculated by dividing net income available to common stockholders by the weighted-average number of common shares outstanding during the period. Rights to dividends on unvested stock awards are non-forfeitable, therefore these unvested stock awards are considered outstanding in the computation of basic earnings per share. Diluted earnings per share is computed in a manner similar to that of basic earnings per share except that the weighted-average number of common shares outstanding is increased to include the number of incremental common shares (computed using the treasury method) that would have been outstanding if all potentially dilutive common stock equivalents (such as options) were issued during the period. Unallocated common shares held by the ESOP are shown as a reduction in stockholders’ equity and are not included in the weighted-average number of common shares outstanding for either basic or diluted earnings per share calculations.
Basic and diluted earnings per share have been computed based on the following:
| Years Ended December 31, | ||||||||||||
| 2017 | 2016 | 2015 | ||||||||||
| (Dollars in thousands, except per share amounts) | ||||||||||||
| Net income available to common stockholders |
$ | 42,945 | $ | 34,190 | $ | 24,607 | ||||||
|
|
|
|
|
|
|
|||||||
| Basic weighted average shares outstanding |
51,153,665 | 51,128,914 | 51,965,036 | |||||||||
| Effect of dilutive stock options |
1,509,932 | 1,119,394 | 1,106,896 | |||||||||
|
|
|
|
|
|
|
|||||||
| Diluted weighted average shares outstanding |
$ | 52,663,597 | $ | 52,248,308 | $ | 53,071,932 | ||||||
|
|
|
|
|
|
|
|||||||
| Earnings per share: |
||||||||||||
| Basic |
$ | 0.84 | $ | 0.67 | $ | 0.47 | ||||||
| Diluted |
$ | 0.82 | $ | 0.65 | $ | 0.46 | ||||||
For the years ended December 31, 2017, 2016 and 2015, options for the exercise of 67,554, 9,440 and 366,002 shares, respectively, were not included in the calculation of diluted earnings per share because to do so would have been anti-dilutive.
Comprehensive Income
Accounting principles generally require that recognized revenue, expenses, gains and losses be included in net income. Although certain changes in assets and liabilities are reported as a separate component of the equity section of the consolidated balance sheets, such items, along with net income, are components of comprehensive
85
Table of Contents
NOTES TO CONSOLIDATED FINANCIAL STATEMENTS — (Continued)
income (loss). The components of accumulated other comprehensive income (loss), included in stockholders’ equity, are as follows:
| December 31, | ||||||||
| 2017 | 2016 | |||||||
| (In thousands) | ||||||||
| Securities available for sale: |
||||||||
| Net unrealized gain on securities available for sale |
$ | 931 | $ | 3,637 | ||||
| Tax effect |
(292 | ) | (1,444 | ) | ||||
|
|
|
|
|
|||||
| Net-of-tax amount |
639 | 2,193 | ||||||
|
|
|
|
|
|||||
| Defined benefit plans: |
||||||||
| Unrecognized prior service cost |
(180 | ) | (197 | ) | ||||
| Unrecognized net actuarial loss |
(533 | ) | (399 | ) | ||||
|
|
|
|
|
|||||
| Total |
(713 | ) | (596 | ) | ||||
| Tax effect |
202 | 209 | ||||||
|
|
|
|
|
|||||
| Net-of-tax amount |
(511 | ) | (387 | ) | ||||
|
|
|
|
|
|||||
| $ | 128 | $ | 1,806 | |||||
|
|
|
|
|
|||||
Unrecognized prior service costs amounting to $17,000 and unrecognized net actuarial losses amounting to $214,000, included in accumulated other comprehensive income at December 31, 2017, are expected to be recognized as a component of net periodic cost for the year ending December 31, 2018.
Recent Accounting Pronouncements
In May 2014, the Financial Accounting Standards Board (“FASB”) issued Accounting Standards Update (“ASU”) No. 2014-09, Revenue from Contracts with Customers (Topic 606). The objective of this ASU was to clarify the principles for recognizing revenue and to develop a common revenue standard for generally accepted accounting principles (“GAAP”) and International Financial Reporting Standards. The guidance in this ASU affects any entity that either enters into contracts with customers to transfer goods or services or enters into contracts for the transfer of nonfinancial assets unless those contracts are within the scope of other standards. The core principal of the guidance is that an entity should recognize revenue to depict the transfer of promised goods or services to customers in an amount that reflects the consideration to which the entity expects to be entitled in exchange for those goods or services. For public entities, the amendments in this update are effective for annual reporting periods beginning after December 15, 2017, including interim periods within that reporting period. As significantly all of the Company’s revenues are excluded from the scope of the guidance, adoption is not expected to have a material impact on the Company’s consolidated financial statements.
In January 2016, the FASB issued ASU No. 2016-01, Financial Instruments — Overall, (Subtopic 825-10). The amendments in this update address certain aspects of recognition, measurement, presentation and disclosure of financial instruments. Targeted changes to GAAP include the requirement for equity investments (except those accounted for under the equity method of accounting or those that result in consolidation of the investee) to be measured at fair value with changes in fair value recognized in net income and the elimination of the requirement for public business entities to disclose the methods and significant assumptions used to estimate the fair value for financial instruments measured at amortized cost. The amendments in this update are effective for fiscal years beginning after December 15, 2017, including interim periods within those fiscal years. The Company has a portfolio of equity investments and if such guidance were effective for the year ended December 31, 2017, a net unrealized loss of approximately $2.6 million and related deferred tax benefit of $900,000 would have been recognized in net income, instead of in other comprehensive income. The impact of this guidance on future periods is dependent on future market conditions and investment activity.
86
Table of Contents
NOTES TO CONSOLIDATED FINANCIAL STATEMENTS — (Continued)
In February 2016, the FASB issued ASU No. 2016-02, Leases (Topic 842). This update is intended to improve financial reporting about leasing transactions and the key provision impacting the Company is the requirement for a lessee to record a right-to-use asset and liability representing the obligation to make lease payments for long-term operating leases. The update will be effective for public business entities for fiscal years beginning after December 15, 2018, including interim periods within those fiscal years. As of December 31, 2017, the Company had future minimum lease payments of $15.5 million, all under operating lease agreements. Upon adoption, the Company expects its assets and liabilities to increase based on the present value of the future minimum lease payments, using the discount rate applicable at the outset of the lease agreement. However, the adoption of this ASU is not expected to be material to the Company’s results of operations or financial position.
In June 2016, the FASB issued ASU No. 2016-13, Financial Instruments – Credit Losses (Topic 326). The main objective of this update is to provide financial statement users with more decision-useful information about the expected credit losses on financial instruments, including loans, held-to-maturity debt securities and commitments to extend credit held by a reporting entity at each reporting date. To achieve this objective, the amendments in this update replace the incurred loss impairment methodology in current GAAP with a methodology, referred to as Current Expected Credit Loss, or CECL, that reflects expected credit losses and requires consideration of a broader range of reasonable and supportable information to inform credit loss estimates. Credit losses on available-for-sale debt securities will be measured in a manner similar to current GAAP, but will be recognized through an allowance rather than as a direct write-down. This update will be effective for fiscal years beginning after December 15, 2019, including interim periods within those fiscal years. Early adoption will be permitted for all entities for fiscal years beginning after December 15, 2018, including interim periods within those fiscal years. The Company is in the early stages of developing a project plan to facilitate the implementation of CECL. This plan will consider potential enhancements to internal controls, loan pool segmentation, loan loss estimation methodology, data gathering resources, data analytics and necessary disclosures. The adoption of this ASU may result in material changes to the allowance for loan losses with a resulting adjustment to retained earnings, however any potential adjustment will be dependent on the credit risks within the portfolio and the economic environment at the time of adoption.
In January 2017, the FASB issued ASU No. 2017-04, Intangibles — Goodwill and Other (Topic 350). The update intends to simplify the subsequent measurement of goodwill by requiring an entity to compare the fair value of a reporting unit to the carrying amount of goodwill. An entity should recognize an impairment charge for the amount by which the carrying amount exceeds the reporting unit’s fair value; however, the impairment charge should not exceed the total amount of goodwill allocated to that reporting unit. This update will be effective for fiscal years beginning after December 15, 2019, including interim periods within those fiscal years. The adoption of this ASU is not expected to be material to the Company’s results of operations or financial position.
In February 2018, the FASB issued ASU No. 2018-02, Income Statement — Reporting Comprehensive Income (Topic 220). The update pertains to the deferred tax amounts that are “stranded” in accumulated other comprehensive income (“AOCI”) as a result of the Tax Cuts and Jobs Act and provides companies with the option to reclassify amounts “stranded” in AOCI to retained earnings. The Company adopted this update for the year ended December 31, 2017. “Stranded” amounts are insignificant and have been removed from accumulated other comprehensive income and reflected in the provision for income taxes.
87
Table of Contents
NOTES TO CONSOLIDATED FINANCIAL STATEMENTS — (Continued)
2. SECURITIES AVAILABLE FOR SALE
The amortized cost and fair values of securities available for sale, with gross unrealized gains and losses, follows:
| Amortized Cost |
Gross Unrealized Gains |
Gross Unrealized Losses |
Fair Value |
|||||||||||||
| (In thousands) | ||||||||||||||||
| December 31, 2017 |
||||||||||||||||
| Debt securities: |
||||||||||||||||
| Government-sponsored enterprises |
$ | 1,942 | $ | — | $ | — | $ | 1,942 | ||||||||
| Municipal bonds |
2,424 | 2 | — | 2,426 | ||||||||||||
| Residential mortgage-backed securities: |
||||||||||||||||
| Government-sponsored enterprises |
15,916 | 231 | (2 | ) | 16,145 | |||||||||||
| Private label |
70 | 6 | — | 76 | ||||||||||||
|
|
|
|
|
|
|
|
|
|||||||||
| Total debt securities |
20,352 | 239 | (2 | ) | 20,589 | |||||||||||
|
|
|
|
|
|
|
|
|
|||||||||
| Marketable equity securities: |
||||||||||||||||
| Common stocks: |
||||||||||||||||
| Basic materials |
3,498 | 207 | (250 | ) | 3,455 | |||||||||||
| Consumer products and services |
5,832 | 377 | (415 | ) | 5,794 | |||||||||||
| Financial services |
1,241 | 294 | — | 1,535 | ||||||||||||
| Healthcare |
1,933 | 111 | (137 | ) | 1,907 | |||||||||||
| Industrials |
2,939 | 469 | — | 3,408 | ||||||||||||
| Technology |
1,628 | 194 | (156 | ) | 1,666 | |||||||||||
|
|
|
|
|
|
|
|
|
|||||||||
| Total common stocks |
17,071 | 1,652 | (958 | ) | 17,765 | |||||||||||
| Money market mutual funds |
10 | — | — | 10 | ||||||||||||
|
|
|
|
|
|
|
|
|
|||||||||
| Total marketable equity securities |
17,081 | 1,652 | (958 | ) | 17,775 | |||||||||||
|
|
|
|
|
|
|
|
|
|||||||||
| Total securities available for sale |
$ | 37,433 | $ | 1,891 | $ | (960 | ) | $ | 38,364 | |||||||
|
|
|
|
|
|
|
|
|
|||||||||
88
Table of Contents
NOTES TO CONSOLIDATED FINANCIAL STATEMENTS — (Continued)
| Amortized Cost |
Gross Unrealized Gains |
Gross Unrealized Losses |
Fair Value |
|||||||||||||
| (In thousands) | ||||||||||||||||
| December 31, 2016 |
||||||||||||||||
| Debt securities: |
||||||||||||||||
| Corporate bonds: |
||||||||||||||||
| Financial services |
$ | 12,989 | $ | 16 | $ | (3 | ) | $ | 13,002 | |||||||
| Industrials |
1,000 | 3 | — | 1,003 | ||||||||||||
|
|
|
|
|
|
|
|
|
|||||||||
| Total corporate bonds |
13,989 | 19 | (3 | ) | 14,005 | |||||||||||
| Municipal bonds |
1,202 | 17 | — | 1,219 | ||||||||||||
| Residential mortgage-backed securities: |
||||||||||||||||
| Government-sponsored enterprises |
5,284 | 325 | (3 | ) | 5,606 | |||||||||||
| Private label |
779 | 22 | — | 801 | ||||||||||||
|
|
|
|
|
|
|
|
|
|||||||||
| Total debt securities |
21,254 | 383 | (6 | ) | 21,631 | |||||||||||
|
|
|
|
|
|
|
|
|
|||||||||
| Marketable equity securities: |
||||||||||||||||
| Common stocks: |
||||||||||||||||
| Basic materials |
6,763 | 901 | (232 | ) | 7,432 | |||||||||||
| Consumer products and services |
13,567 | 1,093 | (382 | ) | 14,278 | |||||||||||
| Financial services |
5,953 | 970 | — | 6,923 | ||||||||||||
| Healthcare |
8,225 | 533 | (456 | ) | 8,302 | |||||||||||
| Industrials |
4,181 | 624 | (11 | ) | 4,794 | |||||||||||
| Technology |
4,081 | 440 | (220 | ) | 4,301 | |||||||||||
|
|
|
|
|
|
|
|
|
|||||||||
| Total common stocks |
42,770 | 4,561 | (1,301 | ) | 46,030 | |||||||||||
| Money market mutual funds |
2 | — | — | 2 | ||||||||||||
|
|
|
|
|
|
|
|
|
|||||||||
| Total marketable equity securities |
42,772 | 4,561 | (1,301 | ) | 46,032 | |||||||||||
|
|
|
|
|
|
|
|
|
|||||||||
| Total securities available for sale |
$ | 64,026 | $ | 4,944 | $ | (1,307 | ) | $ | 67,663 | |||||||
|
|
|
|
|
|
|
|
|
|||||||||
At December 31, 2017, securities with a fair value of $3.3 million and $472,000 were pledged as collateral for Federal Home Loan Bank of Boston borrowings and for the Federal Reserve Bank discount window borrowings, respectively. See Note 7.
89
Table of Contents
NOTES TO CONSOLIDATED FINANCIAL STATEMENTS — (Continued)
The amortized cost and fair value of debt securities by contractual maturity at December 31, 2017 are as follows. Expected maturities may differ from contractual maturities because issuers may have the right to call or prepay obligations with or without prepayment penalties.
| One Year or Less | After One Year Through Five Years |
After Five Years | Total | |||||||||||||||||||||||||||||
| Amortized Cost |
Fair Value |
Amortized Cost |
Fair Value |
Amortized Cost |
Fair Value |
Amortized Cost |
Fair Value |
|||||||||||||||||||||||||
| (In thousands) | ||||||||||||||||||||||||||||||||
| Government-sponsored enterprises |
$ | — | $ | — | $ | — | $ | — | $ | 1,942 | $ | 1,942 | $ | 1,942 | $ | 1,942 | ||||||||||||||||
| Municipal bonds |
325 | 328 | — | — | 2,099 | 2,098 | 2,424 | 2,426 | ||||||||||||||||||||||||
| Residential mortgage-backed securities: |
||||||||||||||||||||||||||||||||
| Government-sponsored enterprises |
— | — | 109 | 109 | 15,807 | 16,036 | 15,916 | 16,145 | ||||||||||||||||||||||||
| Private label |
— | — | — | — | 70 | 76 | 70 | 76 | ||||||||||||||||||||||||
|
|
|
|
|
|
|
|
|
|
|
|
|
|
|
|
|
|||||||||||||||||
| Total |
$ | 325 | $ | 328 | $ | 109 | $ | 109 | $ | 19,918 | $ | 20,152 | $ | 20,352 | $ | 20,589 | ||||||||||||||||
|
|
|
|
|
|
|
|
|
|
|
|
|
|
|
|
|
|||||||||||||||||
For the years ended December 31, 2017, 2016 and 2015, proceeds from sales of securities available for sale amounted to $40.9 million, $38.4 million and $27.1 million, respectively. Gross gains of $9.5 million, $7.2 million and $4.2 million and gross losses of $164,000, $4.2 million and $1.8 million, respectively, were realized on those sales.
Information pertaining to securities available for sale as of December 31, 2017 and 2016, with gross unrealized losses aggregated by investment category and length of time that individual securities have been in a continuous loss position, follows:
| Less Than Twelve Months | Twelve Months or Longer | |||||||||||||||
| Gross Unrealized Losses |
Fair Value |
Gross Unrealized Losses |
Fair Value |
|||||||||||||
| (In thousands) | ||||||||||||||||
| December 31, 2017 |
||||||||||||||||
| Debt securities: |
||||||||||||||||
| Residential mortgage-backed securities: |
||||||||||||||||
| Government-sponsored enterprises |
$ | — | $ | — | $ | 2 | $ | 171 | ||||||||
|
|
|
|
|
|
|
|
|
|||||||||
| Total debt securities |
— | — | 2 | 171 | ||||||||||||
|
|
|
|
|
|
|
|
|
|||||||||
| Marketable equity securities: |
||||||||||||||||
| Common stocks: |
||||||||||||||||
| Basic materials |
87 | 791 | 163 | 641 | ||||||||||||
| Consumer products and services |
24 | 1,196 | 391 | 1,273 | ||||||||||||
| Healthcare |
137 | 1,102 | — | — | ||||||||||||
| Technology |
100 | 408 | 56 | 426 | ||||||||||||
|
|
|
|
|
|
|
|
|
|||||||||
| Total marketable equity securities |
348 | 3,497 | 610 | 2,340 | ||||||||||||
|
|
|
|
|
|
|
|
|
|||||||||
| Total temporarily impaired securities |
$ | 348 | $ | 3,497 | $ | 612 | $ | 2,511 | ||||||||
|
|
|
|
|
|
|
|
|
|||||||||
90
Table of Contents
NOTES TO CONSOLIDATED FINANCIAL STATEMENTS — (Continued)
| Less Than Twelve Months | Twelve Months or Longer | |||||||||||||||
| Gross Unrealized Losses |
Fair Value |
Gross Unrealized Losses |
Fair Value |
|||||||||||||
| (In thousands) | ||||||||||||||||
| December 31, 2016 |
||||||||||||||||
| Debt securities: |
||||||||||||||||
| Corporate bonds-financial services |
$ | 3 | $ | 5,000 | $ | — | $ | — | ||||||||
| Residential mortgage-backed securities: |
||||||||||||||||
| Government-sponsored enterprises |
— | — | 3 | 205 | ||||||||||||
|
|
|
|
|
|
|
|
|
|||||||||
| Total debt securities |
3 | 5,000 | 3 | 205 | ||||||||||||
|
|
|
|
|
|
|
|
|
|||||||||
| Marketable equity securities: |
||||||||||||||||
| Common stocks: |
||||||||||||||||
| Basic materials |
— | — | 232 | 1,568 | ||||||||||||
| Consumer products and services |
237 | 3,496 | 145 | 1,618 | ||||||||||||
| Healthcare |
259 | 2,039 | 197 | 1,377 | ||||||||||||
| Industrials |
11 | 450 | — | — | ||||||||||||
| Technology |
— | — | 220 | 1,681 | ||||||||||||
|
|
|
|
|
|
|
|
|
|||||||||
| Total marketable equity securities |
507 | 5,985 | 794 | 6,244 | ||||||||||||
|
|
|
|
|
|
|
|
|
|||||||||
| Total temporarily impaired securities |
$ | 510 | $ | 10,985 | $ | 797 | $ | 6,449 | ||||||||
|
|
|
|
|
|
|
|
|
|||||||||
The Company determined no securities were other-than-temporarily impaired for the years ended December 31, 2017, 2016 and 2015. Management evaluates securities for other-than-temporary impairment on a quarterly basis, with more frequent evaluation for selected issuers or when economic or market concerns warrant such evaluations.
At December 31, 2017, 12 marketable equity securities with a fair value of $5.8 million had gross unrealized losses totaling $958,000, or an aggregate depreciation of 14.2% from the Company’s cost basis. These marketable equity securities consisted of six securities with a fair value of $3.5 million and a gross unrealized loss of $348,000 for less than 12 months and six securities with a fair value of $2.3 million and a gross unrealized loss of $610,000 for 12 months or longer. The marketable equity securities in a gross unrealized loss position for 12 months or longer were comprised of one security in the basic materials sector with a fair value of $641,000 and a gross unrealized loss of $163,000, three marketable equity securities in the consumer products and services sector with a fair value of $1.3 million and a gross unrealized loss of $391,000, and two securities in the technology sector with a fair value of $426,000 and a gross unrealized loss of $56,000.
In analyzing an equity issuer’s financial condition, management considers industry analysts’ reports, financial performance and projected target prices of investment analysts within a one-year time frame. A decline of 10% or more in the value of an acquired equity security is generally the triggering event for management to review individual securities for liquidation and/or write-down. Impairment losses are recognized when management concludes that declines in the value of equity securities are other than temporary, or when they can no longer assert that they have the intent and ability to hold depreciated equity securities for a period of time sufficient to allow for any anticipated recovery in fair value. Unrealized losses on marketable equity securities that are in excess of 25% of cost and that have been sustained for more than twelve months are generally considered-other-than temporary and charged to earnings as impairment losses, or realized through sale of the security.
Although issuers within the marketable equity securities portfolio had price declines resulting in unrealized losses, management does not believe these declines in market value are other than temporary and the Company currently has the ability and intent to hold these investments until a recovery of fair value.
91
Table of Contents
NOTES TO CONSOLIDATED FINANCIAL STATEMENTS — (Continued)
3. LOANS
A summary of loans follows:
| December 31, | ||||||||
| 2017 | 2016 | |||||||
| (In thousands) | ||||||||
| Real estate loans: |
||||||||
| Residential real estate: |
||||||||
| One- to four-family |
$ | 603,680 | $ | 532,450 | ||||
| Multi-family |
779,637 | 562,948 | ||||||
| Home equity lines of credit |
48,393 | 42,913 | ||||||
| Commercial real estate |
2,063,781 | 1,776,601 | ||||||
| Construction |
641,306 | 502,753 | ||||||
|
|
|
|
|
|||||
| Total real estate loans |
4,136,797 | 3,417,665 | ||||||
| Commercial and industrial |
525,604 | 515,430 | ||||||
| Consumer |
10,761 | 9,712 | ||||||
|
|
|
|
|
|||||
| Total loans |
4,673,162 | 3,942,807 | ||||||
| Allowance for loan losses |
(45,185 | ) | (40,149 | ) | ||||
| Net deferred loan origination fees |
(5,179 | ) | (3,990 | ) | ||||
|
|
|
|
|
|||||
| Loans, net |
$ | 4,622,798 | $ | 3,898,668 | ||||
|
|
|
|
|
|||||
The Company has transferred a portion of its originated commercial real estate loans to participating lenders. The amounts transferred have been accounted for as sales and are therefore not included in the Company’s accompanying balance sheets. The Company and participating lenders share ratably in any gains or losses that may result from a borrower’s lack of compliance with contractual terms of the loan. The Company continues to service the loans on behalf of the participating lenders and, as such, collects cash payments from the borrowers, remits payments to participating lenders and disburses required escrow funds to relevant parties. At December 31, 2017 and 2016, the Company was servicing loans for participants aggregating $247.8 million and $210.5 million, respectively.
At December 31, 2017, multi-family and commercial real estate loans with carrying values totaling $116.7 million and $695.3 million, respectively, were pledged as collateral for Federal Home Loan Bank of Boston borrowings. In addition, there is a blanket lien on one- to four-family loans. See Note 7.
92
Table of Contents
NOTES TO CONSOLIDATED FINANCIAL STATEMENTS — (Continued)
An analysis of the allowance for loan losses and related information follows:
| One- to four-family |
Multi- family |
Home equity lines of credit |
Commercial real estate |
Construction | Commercial and industrial |
Consumer | Total | |||||||||||||||||||||||||||||||||
| (In thousands) | ||||||||||||||||||||||||||||||||||||||||
| Balance at December 31, 2014 |
$ | 1,849 | $ | 3,635 | $ | 100 | $ | 13,000 | $ | 5,155 | $ | 4,633 | $ | 97 | $ | 28,469 | ||||||||||||||||||||||||
| Provision (credit) for loan losses |
(446 | ) | (250 | ) | 104 | 1,479 | 4,564 | 1,022 | 194 | 6,667 | ||||||||||||||||||||||||||||||
| Charge-offs |
(165 | ) | — | (60 | ) | — | (2,287 | ) | (36 | ) | (306 | ) | (2,854 | ) | ||||||||||||||||||||||||||
| Recoveries |
116 | — | — | 18 | 881 | 1 | 107 | 1,123 | ||||||||||||||||||||||||||||||||
|
|
|
|
|
|
|
|
|
|
|
|
|
|
|
|
|
|||||||||||||||||||||||||
| Balance at December 31, 2015 |
1,354 | 3,385 | 144 | 14,497 | 8,313 | 5,620 | 92 | 33,405 | ||||||||||||||||||||||||||||||||
| Provision (credit) for loan losses |
13 | 1,129 | (71 | ) | 4,228 | 874 | 821 | 186 | 7,180 | |||||||||||||||||||||||||||||||
| Charge-offs |
— | — | — | — | (486 | ) | (49 | ) | (302 | ) | (837 | ) | ||||||||||||||||||||||||||||
| Recoveries |
— | — | — | — | 230 | 60 | 111 | 401 | ||||||||||||||||||||||||||||||||
|
|
|
|
|
|
|
|
|
|
|
|
|
|
|
|
|
|||||||||||||||||||||||||
| Balance at December 31, 2016 |
1,367 | 4,514 | 73 | 18,725 | 8,931 | 6,452 | 87 | 40,149 | ||||||||||||||||||||||||||||||||
| Provision (credit) for loan losses |
(372 | ) | 1,748 | (12 | ) | 2,478 | 1,187 | (398 | ) | 228 | 4,859 | |||||||||||||||||||||||||||||
| Charge-offs |
(98 | ) | — | — | — | (3 | ) | — | (340 | ) | (441 | ) | ||||||||||||||||||||||||||||
| Recoveries |
104 | 1 | 1 | 310 | 51 | 30 | 121 | 618 | ||||||||||||||||||||||||||||||||
|
|
|
|
|
|
|
|
|
|
|
|
|
|
|
|
|
|||||||||||||||||||||||||
| Balance at December 31, 2017 |
$ | 1,001 | $ | 6,263 | $ | 62 | $ | 21,513 | $ | 10,166 | $ | 6,084 | $ | 96 | $ | 45,185 | ||||||||||||||||||||||||
|
|
|
|
|
|
|
|
|
|
|
|
|
|
|
|
|
|||||||||||||||||||||||||
| December 31, 2017 |
||||||||||||||||||||||||||||||||||||||||
| Amount of allowance for loan losses for loans deemed to be impaired |
$ | 51 | $ | 133 | $ | — | $ | — | $ | — | $ | — | $ | — | $ | 184 | ||||||||||||||||||||||||
| Amount of allowance for loan losses for loans not deemed to be impaired |
950 | 6,130 | 62 | 21,513 | 10,166 | 6,084 | 96 | 45,001 | ||||||||||||||||||||||||||||||||
|
|
|
|
|
|
|
|
|
|
|
|
|
|
|
|
|
|||||||||||||||||||||||||
| $ | 1,001 | $ | 6,263 | $ | 62 | $ | 21,513 | $ | 10,166 | $ | 6,084 | $ | 96 | $ | 45,185 | |||||||||||||||||||||||||
|
|
|
|
|
|
|
|
|
|
|
|
|
|
|
|
|
|||||||||||||||||||||||||
| Loans deemed to be impaired |
$ | 1,245 | $ | 1,315 | $ | — | $ | 846 | $ | — | $ | 1,539 | $ | — | $ | 4,945 | ||||||||||||||||||||||||
| Loans not deemed to be impaired |
602,435 | 778,322 | 48,393 | 2,062,935 | 641,306 | 524,065 | 10,761 | 4,668,217 | ||||||||||||||||||||||||||||||||
|
|
|
|
|
|
|
|
|
|
|
|
|
|
|
|
|
|||||||||||||||||||||||||
| $ | 603,680 | $ | 779,637 | $ | 48,393 | $ | 2,063,781 | $ | 641,306 | $ | 525,604 | $ | 10,761 | $ | 4,673,162 | |||||||||||||||||||||||||
|
|
|
|
|
|
|
|
|
|
|
|
|
|
|
|
|
|||||||||||||||||||||||||
| December 31, 2016 |
||||||||||||||||||||||||||||||||||||||||
| Amount of allowance for loan losses for loans deemed to be impaired |
$ | 49 | $ | 137 | $ | — | $ | — | $ | — | $ | — | $ | — | $ | 186 | ||||||||||||||||||||||||
| Amount of allowance for loan losses for loans not deemed to be impaired |
1,318 | 4,377 | 73 | 18,725 | 8,931 | 6,452 | 87 | 39,963 | ||||||||||||||||||||||||||||||||
|
|
|
|
|
|
|
|
|
|
|
|
|
|
|
|
|
|||||||||||||||||||||||||
| $ | 1,367 | $ | 4,514 | $ | 73 | $ | 18,725 | $ | 8,931 | $ | 6,452 | $ | 87 | $ | 40,149 | |||||||||||||||||||||||||
|
|
|
|
|
|
|
|
|
|
|
|
|
|
|
|
|
|||||||||||||||||||||||||
| Loans deemed to be impaired |
$ | 1,422 | $ | 1,359 | $ | — | $ | 2,807 | $ | 988 | $ | 1,808 | $ | — | $ | 8,384 | ||||||||||||||||||||||||
| Loans not deemed to be impaired |
531,028 | 561,589 | 42,913 | 1,773,794 | 501,765 | 513,622 | 9,712 | 3,934,423 | ||||||||||||||||||||||||||||||||
|
|
|
|
|
|
|
|
|
|
|
|
|
|
|
|
|
|||||||||||||||||||||||||
| $ | 532,450 | $ | 562,948 | $ | 42,913 | $ | 1,776,601 | $ | 502,753 | $ | 515,430 | $ | 9,712 | $ | 3,942,807 | |||||||||||||||||||||||||
|
|
|
|
|
|
|
|
|
|
|
|
|
|
|
|
|
|||||||||||||||||||||||||
93
Table of Contents
NOTES TO CONSOLIDATED FINANCIAL STATEMENTS — (Continued)
The following table provides information about the Company’s past due and non-accrual loans:
| 30-59 Days Past Due |
60-89 Days Past Due |
90 Days or Greater Past Due |
Total Past Due |
Loans on Non-accrual |
||||||||||||||||
| (In thousands) | ||||||||||||||||||||
| December 31, 2017 |
||||||||||||||||||||
| Real estate loans: |
||||||||||||||||||||
| Residential real estate: |
||||||||||||||||||||
| One- to four-family |
$ | 1,537 | $ | 664 | $ | 1,532 | $ | 3,733 | $ | 6,890 | ||||||||||
| Home equity lines of credit |
195 | 42 | 521 | 758 | 562 | |||||||||||||||
| Commercial real estate |
98 | — | — | 98 | 388 | |||||||||||||||
|
|
|
|
|
|
|
|
|
|
|
|||||||||||
| Total real estate loans |
1,830 | 706 | 2,053 | 4,589 | 7,840 | |||||||||||||||
| Commercial and industrial |
5 | — | 523 | 528 | 523 | |||||||||||||||
| Consumer |
887 | 568 | — | 1,455 | — | |||||||||||||||
|
|
|
|
|
|
|
|
|
|
|
|||||||||||
| Total |
$ | 2,722 | $ | 1,274 | $ | 2,576 | $ | 6,572 | $ | 8,363 | ||||||||||
|
|
|
|
|
|
|
|
|
|
|
|||||||||||
| December 31, 2016 |
||||||||||||||||||||
| Real estate loans: |
||||||||||||||||||||
| Residential real estate: |
||||||||||||||||||||
| One- to four-family |
$ | 641 | $ | 834 | $ | 2,902 | $ | 4,377 | $ | 8,487 | ||||||||||
| Home equity lines of credit |
707 | 131 | 672 | 1,510 | 674 | |||||||||||||||
| Commercial real estate |
105 | — | 1,904 | 2,009 | 2,807 | |||||||||||||||
| Construction |
— | — | 815 | 815 | 815 | |||||||||||||||
|
|
|
|
|
|
|
|
|
|
|
|||||||||||
| Total real estate loans |
1,453 | 965 | 6,293 | 8,711 | 12,783 | |||||||||||||||
| Commercial and industrial |
— | — | 653 | 653 | 653 | |||||||||||||||
| Consumer |
679 | 392 | — | 1,071 | — | |||||||||||||||
|
|
|
|
|
|
|
|
|
|
|
|||||||||||
| Total |
$ | 2,132 | $ | 1,357 | $ | 6,946 | $ | 10,435 | $ | 13,436 | ||||||||||
|
|
|
|
|
|
|
|
|
|
|
|||||||||||
At December 31, 2017 and 2016, the Company did not have any accruing loans past due 90 days or more.
94
Table of Contents
NOTES TO CONSOLIDATED FINANCIAL STATEMENTS — (Continued)
The following tables provide information with respect to the Company’s impaired loans:
| December 31, | ||||||||||||||||||||||||
| 2017 | 2016 | |||||||||||||||||||||||
| Recorded Investment |
Unpaid Principal Balance |
Related Allowance |
Recorded Investment |
Unpaid Principal Balance |
Related Allowance |
|||||||||||||||||||
| (In thousands) | ||||||||||||||||||||||||
| Impaired loans without a valuation allowance: |
||||||||||||||||||||||||
| One- to four-family |
$ | 693 | $ | 1,007 | $ | 841 | $ | 1,281 | ||||||||||||||||
| Multi-family |
59 | 59 | 74 | 74 | ||||||||||||||||||||
| Commercial real estate |
846 | 846 | 2,807 | 3,102 | ||||||||||||||||||||
| Construction |
— | — | 988 | 1,083 | ||||||||||||||||||||
| Commercial and industrial |
1,539 | 1,870 | 1,808 | 2,138 | ||||||||||||||||||||
|
|
|
|
|
|
|
|
|
|||||||||||||||||
| Total |
3,137 | 3,782 | 6,518 | 7,678 | ||||||||||||||||||||
|
|
|
|
|
|
|
|
|
|||||||||||||||||
| Impaired loans with a valuation allowance: |
||||||||||||||||||||||||
| One- to four-family |
552 | 552 | $ | 51 | 581 | 581 | $ | 49 | ||||||||||||||||
| Multi-family |
1,256 | 1,256 | 133 | 1,285 | 1,285 | 137 | ||||||||||||||||||
|
|
|
|
|
|
|
|
|
|
|
|
|
|||||||||||||
| Total |
1,808 | 1,808 | 184 | 1,866 | 1,866 | 186 | ||||||||||||||||||
|
|
|
|
|
|
|
|
|
|
|
|
|
|||||||||||||
| Total impaired loans |
$ | 4,945 | $ | 5,590 | $ | 184 | $ | 8,384 | $ | 9,544 | $ | 186 | ||||||||||||
|
|
|
|
|
|
|
|
|
|
|
|
|
|||||||||||||
| Years Ended December 31, | ||||||||||||||||||||||||||||||||||||
| 2017 | 2016 | 2015 | ||||||||||||||||||||||||||||||||||
| Average Recorded Investment |
Interest Income Recognized |
Interest Income Recognized on Cash Basis |
Average Recorded Investment |
Interest Income Recognized |
Interest Income Recognized on Cash Basis |
Average Recorded Investment |
Interest Income Recognized |
Interest Income Recognized on Cash Basis |
||||||||||||||||||||||||||||
| (In thousands) | ||||||||||||||||||||||||||||||||||||
| One- to four-family |
$ | 1,522 | $ | 89 | $ | 71 | $ | 1,788 | $ | 68 | $ | 47 | $ | 2,625 | $ | 120 | $ | 72 | ||||||||||||||||||
| Multi-family |
1,336 | 53 | — | 1,379 | 55 | — | 1,421 | 55 | — | |||||||||||||||||||||||||||
| Commercial real estate |
2,236 | 53 | 31 | 3,281 | 80 | 80 | 7,425 | 284 | 81 | |||||||||||||||||||||||||||
| Construction |
250 | 6 | 6 | 11,076 | 31 | 17 | 16,273 | 315 | 295 | |||||||||||||||||||||||||||
| Commercial and industrial |
1,647 | 63 | — | 1,635 | 84 | 13 | 930 | 5 | 5 | |||||||||||||||||||||||||||
|
|
|
|
|
|
|
|
|
|
|
|
|
|
|
|
|
|
|
|||||||||||||||||||
| Total impaired loans |
$ | 6,991 | $ | 264 | $ | 108 | $ | 19,159 | $ | 318 | $ | 157 | $ | 28,674 | $ | 779 | $ | 453 | ||||||||||||||||||
|
|
|
|
|
|
|
|
|
|
|
|
|
|
|
|
|
|
|
|||||||||||||||||||
At December 31, 2017, additional funds committed to be advanced in connection with impaired construction loans were immaterial.
95
Table of Contents
NOTES TO CONSOLIDATED FINANCIAL STATEMENTS — (Continued)
The following table summarizes the TDRs at the dates indicated:
| December 31, | ||||||||
| 2017 | 2016 | |||||||
| (In thousands) | ||||||||
| TDRs on accrual status: |
||||||||
| One- to four-family |
$ | 2,125 | $ | 2,219 | ||||
| Multi-family |
1,315 | 1,359 | ||||||
| Home equity lines of credit |
— | 18 | ||||||
| Commercial real estate |
9,200 | 9,460 | ||||||
| Construction |
— | 174 | ||||||
| Commercial and industrial |
20 | 27 | ||||||
|
|
|
|
|
|||||
| Total TDRs on accrual status |
12,660 | 13,257 | ||||||
|
|
|
|
|
|||||
| TDRs on non-accrual status: |
||||||||
| One- to four-family |
1,046 | 1,123 | ||||||
|
|
|
|
|
|||||
| Total TDRs on non-accrual status |
1,046 | 1,123 | ||||||
|
|
|
|
|
|||||
| Total TDRs |
$ | 13,706 | $ | 14,380 | ||||
|
|
|
|
|
|||||
The Company generally places loans modified as TDRs on non-accrual status for a minimum period of six months. Loans modified as TDRs qualify for return to accrual status once they have demonstrated performance with the modified terms of the loan agreement for a minimum of six months and future payments are reasonably assured. TDRs are initially reported as impaired loans with an allowance established as part of the allocated component of the allowance for loan losses when the discounted cash flows of the impaired loan is lower than the carrying value of that loan. TDRs may be removed from impairment disclosures in the year following the restructure if the borrower demonstrates compliance with the modified terms and the restructuring agreement specifies an interest rate equal to that which would be provided to a borrower with similar credit at the time of restructuring. At December 31, 2017 and 2016, the allowance for loan losses included an allocated component related to TDRs of $184,000 and $186,000, respectively. There were no charge-offs related to the TDRs modified during the years ended December 31, 2017 and 2016, respectively.
TDRs that defaulted and became 90 days past due in the first twelve months after restructure were immaterial for the years ended December 31, 2017, 2016 and 2015.
The Company utilizes a ten-grade internal loan rating system for multi-family, commercial real estate, construction, and commercial and industrial loans as follows:
| • | Loans rated 1, 2, 3, 4, 5 and 6: Loans in these categories are considered “pass” rated loans with low to average risk. |
| • | Loans rated 7: Loans in these categories are considered “special mention.” These loans are starting to show signs of potential weakness and are being closely monitored by management. |
| • | Loans rated 8: Loans in this category are considered “substandard.” Generally, a loan is considered substandard if it is inadequately protected by the current net worth and paying capacity of the obligors and/or the collateral pledged. There is a distinct possibility that the Company will sustain some loss if the weakness is not corrected. |
| • | Loans rated 9: Loans in this category are considered “doubtful.” Loans classified as doubtful have all the weaknesses inherent in those classified substandard with the added characteristic that the weaknesses make collection or liquidation in full, on the basis of currently existing facts, highly questionable and improbable. |
96
Table of Contents
NOTES TO CONSOLIDATED FINANCIAL STATEMENTS — (Continued)
| • | Loans rated 10: Loans in this category are considered uncollectible (“loss”) and of such little value that their continuance as loans is not warranted. |
On an annual basis, or more often if needed, the Company formally reviews the ratings on all multi-family, commercial real estate, construction, and commercial and industrial loans. The Company also engages an independent third-party to review a significant portion of loans within these segments on at least an annual basis. Management uses the results of these reviews as part of its annual review process.
The following tables provide the Company’s risk-rated loans by class:
| December 31, | ||||||||||||||||||||||||||||||||
| 2017 | 2016 | |||||||||||||||||||||||||||||||
| Multi-family residential real estate |
Commercial real estate |
Construction | Commercial and industrial |
Multi-family residential real estate |
Commercial real estate |
Construction | Commercial and industrial |
|||||||||||||||||||||||||
| (In thousands) | ||||||||||||||||||||||||||||||||
| Loans rated 1 — 6 |
$ | 774,919 | $ | 2,045,905 | $ | 641,306 | $ | 471,793 | $ | 556,892 | $ | 1,771,671 | $ | 500,565 | $ | 465,979 | ||||||||||||||||
| Loans rated 7 |
275 | 17,030 | — | 6,380 | 841 | 2,123 | — | 22,820 | ||||||||||||||||||||||||
| Loans rated 8 |
4,443 | 846 | — | 47,431 | 5,215 | 2,807 | 2,188 | 26,631 | ||||||||||||||||||||||||
| Loans rated 9 |
— | — | — | — | — | — | — | — | ||||||||||||||||||||||||
| Loans rated 10 |
— | — | — | — | — | — | — | — | ||||||||||||||||||||||||
|
|
|
|
|
|
|
|
|
|
|
|
|
|
|
|
|
|||||||||||||||||
| Total |
$ | 779,637 | $ | 2,063,781 | $ | 641,306 | $ | 525,604 | $ | 562,948 | $ | 1,776,601 | $ | 502,753 | $ | 515,430 | ||||||||||||||||
|
|
|
|
|
|
|
|
|
|
|
|
|
|
|
|
|
|||||||||||||||||
For one- to four-family residential real estate loans, home equity lines of credit and consumer loans, management uses delinquency reports as the key credit quality indicator.
4. SERVICING
Residential real estate loans serviced for others by the Company are not included in the accompanying consolidated balance sheets. The unpaid principal balances of these loans amounted to $133.9 million, $107.8 million and $129.8 million at December 31, 2017, 2016 and 2015, respectively.
Included in these loans serviced for others at December 31, 2017, 2016 and 2015 is $43.0 million, $47.2 million and $56.0 million, respectively, of loans serviced for the Federal Home Loan Bank of Boston with a recourse provision whereby the Company may be obligated to participate in potential losses on a limited basis when a realized loss on a foreclosure occurs. Losses are borne in priority order by the borrower, PMI insurance, the Federal Home Loan Bank and the Company. At December 31, 2017, 2016 and 2015, the maximum contingent liability associated with loans sold with recourse is $1.0 million, $3.0 million and $2.8 million, respectively, which is not recorded in the consolidated financial statements. The Company has never repurchased any loans or incurred any losses under these recourse provisions.
The risks inherent in mortgage servicing assets relate primarily to changes in prepayments that result from shifts in mortgage interest rates. Mortgage servicing rights were immaterial for the years ended December 31, 2017, 2016 and 2015.
97
Table of Contents
NOTES TO CONSOLIDATED FINANCIAL STATEMENTS — (Continued)
5. PREMISES AND EQUIPMENT
A summary of the cost and accumulated depreciation and amortization of premises and equipment follows:
| December 31, | Estimated Useful Lives |
|||||||||||
| 2017 | 2016 | |||||||||||
| (In thousands) | ||||||||||||
| Land and land improvements |
$ | 8,472 | $ | 8,243 | N/A | |||||||
| Buildings |
35,777 | 34,421 | 40 Years | |||||||||
| Leasehold improvements |
9,031 | 8,629 | 5-20 Years | |||||||||
| Equipment |
21,338 | 20,799 | 3-7 Years | |||||||||
|
|
|
|
|
|||||||||
| 74,618 | 72,092 | |||||||||||
| Less accumulated depreciation and amortization |
(33,651 | ) | (30,665 | ) | ||||||||
|
|
|
|
|
|||||||||
| $ | 40,967 | $ | 41,427 | |||||||||
|
|
|
|
|
|||||||||
Depreciation and amortization expense for the years ended December 31, 2017, 2016 and 2015 amounted to $3.1 million, $3.0 million and $2.5 million, respectively.
Lease Commitments
The Company is obligated under non-cancelable operating lease agreements for banking offices and facilities. These leases have terms with renewal options, the cost of which is not included below. The leases generally provide that real estate taxes, insurance, maintenance and other related costs are to be paid by the Company. At December 31, 2017, future minimum lease payments are as follows:
| Years Ending December 31, |
Amount | |||
| (In thousands) | ||||
| 2018 |
$ | 1,902 | ||
| 2019 |
1,688 | |||
| 2020 |
1,612 | |||
| 2021 |
1,556 | |||
| 2022 |
1,471 | |||
| Thereafter |
7,280 | |||
|
|
|
|||
| $ | 15,509 | |||
|
|
|
|||
Total rent expense for all operating leases amounted to $1.9 million, $1.7 million and $1.5 million for the years ended December 31, 2017, 2016 and 2015, respectively.
98
Table of Contents
NOTES TO CONSOLIDATED FINANCIAL STATEMENTS — (Continued)
6. DEPOSITS
A summary of deposit balances, by type, follows:
| December 31, | ||||||||
| 2017 | 2016 | |||||||
| (In thousands) | ||||||||
| Non interest-bearing demand deposits |
$ | 477,428 | $ | 431,222 | ||||
| Interest-bearing demand deposits |
1,004,155 | 630,413 | ||||||
| Money market deposits |
921,895 | 980,344 | ||||||
| Regular savings and other deposits |
333,774 | 305,632 | ||||||
|
|
|
|
|
|||||
| Total non-certificate accounts |
2,737,252 | 2,347,611 | ||||||
|
|
|
|
|
|||||
| Term certificates less than $250,000 |
999,531 | 850,565 | ||||||
| Term certificates $250,000 and greater |
371,078 | 277,661 | ||||||
|
|
|
|
|
|||||
| Total certificate accounts |
1,370,609 | 1,128,226 | ||||||
|
|
|
|
|
|||||
| Total deposits |
$ | 4,107,861 | $ | 3,475,837 | ||||
|
|
|
|
|
|||||
A summary of term certificates, by maturity, follows:
| December 31, | ||||||||||||||||
| 2017 | 2016 | |||||||||||||||
| Maturing |
Amount | Weighted Average Rate |
Amount | Weighted Average Rate |
||||||||||||
| (Dollars in thousands) | ||||||||||||||||
| Within 1 year |
$ | 600,012 | 1.23 | % | $ | 539,903 | 1.16 | % | ||||||||
| Over 1 year to 2 years |
356,203 | 1.60 | 306,120 | 1.29 | ||||||||||||
| Over 2 years to 3 years |
290,909 | 2.05 | 122,952 | 1.69 | ||||||||||||
| Over 3 years to 4 years |
78,461 | 1.88 | 133,256 | 2.02 | ||||||||||||
| Over 4 years to 5 years |
44,798 | 2.34 | 22,483 | 1.61 | ||||||||||||
| Greater than 5 years |
226 | 2.13 | 3,512 | 5.50 | ||||||||||||
|
|
|
|
|
|||||||||||||
| $ | 1,370,609 | 1.57 | % | $ | 1,128,226 | 1.38 | % | |||||||||
|
|
|
|
|
|||||||||||||
The Company had brokered certificates of deposit, which are included in term certificates in the tables above, totaling $232.7 million with a weighted average rate of 1.73% and $158.5 million with a weighted average rate of 1.33% at December 31, 2017 and 2016, respectively. At December 31, 2017 and 2016, the Company also had brokered interest-bearing demand deposits totaling $569.4 million and $296.3 million, respectively, representing reciprocal deposits received from other financial institutions through Authorized Bank Deposit Placement Network Sponsor to facilitate full federal deposit insurance coverage for certain Bank customers. In addition, the Company had $100.0 million in non-reciprocal brokered interest-bearing demand deposits at December 31, 2017. There were no non-reciprocal interest-bearing demand deposits at December 31, 2016.
7. BORROWINGS
The Company had no short-term borrowings at December 31, 2017 or December 31, 2016. The Company has an available line of credit of $9.4 million with the FHLB at an interest rate that adjusts daily and $472,000 of borrowing capacity at the Federal Reserve Bank discount window. No amounts were drawn on the line of credit and no borrowings were outstanding with the Federal Reserve Bank discount window as of December 31, 2017 or December 31, 2016.
99
Table of Contents
NOTES TO CONSOLIDATED FINANCIAL STATEMENTS — (Continued)
Long-term debt consists of FHLB advances as follows:
| December 31, | ||||||||||||||||
| 2017 | 2016 | |||||||||||||||
| Amount | Weighted Average Rate |
Amount | Weighted Average Rate |
|||||||||||||
| (Dollars in thousands) | ||||||||||||||||
| Fixed rate advances maturing: |
||||||||||||||||
| 2017 |
$ | — | — | % | $ | 89,632 | 1.32 | % | ||||||||
| 2018 |
48,000 | 1.26 | 43,000 | 1.25 | ||||||||||||
| 2019 |
6,268 | 1.66 | 4,891 | 1.23 | ||||||||||||
| 2020 |
53,551 | 1.80 | 4,989 | 1.22 | ||||||||||||
| 2021 |
45,000 | 1.46 | 45,000 | 1.46 | ||||||||||||
| 2022 |
105,625 | 1.79 | — | — | ||||||||||||
| Thereafter |
100,000 | 1.21 | 50,000 | 1.01 | ||||||||||||
|
|
|
|
|
|||||||||||||
| 358,444 | 1.51 | 237,512 | 1.26 | |||||||||||||
|
|
|
|
|
|||||||||||||
| Variable rate advances maturing: |
||||||||||||||||
| 2020 |
— | — | 25,000 | 0.27 | ||||||||||||
| 2021 |
35,000 | 0.82 | 60,000 | 0.31 | ||||||||||||
| 2022 |
100,000 | 0.43 | — | — | ||||||||||||
| Thereafter |
20,000 | 0.49 | — | — | ||||||||||||
|
|
|
|
|
|
|
|
|
|||||||||
| 155,000 | 0.53 | 85,000 | 0.29 | |||||||||||||
|
|
|
|
|
|||||||||||||
| Total advances |
$ | 513,444 | 1.22 | % | $ | 322,512 | 1.01 | % | ||||||||
|
|
|
|
|
|||||||||||||
At December 31, 2017, advances amounting to $380.0 million are callable by the FHLB prior to maturity, including advances totaling $35.0 million with variable rates based on the 3-Month London Interbank Offered Rate (“LIBOR”), less 60 basis points, during the first two years, $20.0 million with variable rates based on the 3-month LIBOR, less 130 basis points, during the first year, $55.0 million with variable rates based on the 3-Month LIBOR, less 100 basis points, during the first year, $20.0 million with variable rates based on the 3-Month LIBOR, less 100 basis points, during the first two years and $25.0 million with variable rates based on the 3-month LIBOR, less 75 basis points, during the first year.
All borrowings from the FHLB are secured by investment securities (see Note 2) and qualified collateral, consisting of a blanket lien on one- to four-family loans and certain multi-family and commercial real estate loans held in the Bank’s portfolio. At December 31, 2017, the Company pledged multi-family and commercial real estate loans with carrying values totaling $116.7 million and $695.3 million, respectively. As of December 31, 2017, the Company had $299.4 million of available borrowing capacity with the FHLB.
100
Table of Contents
NOTES TO CONSOLIDATED FINANCIAL STATEMENTS — (Continued)
8. INCOME TAXES
Allocation of federal and state income taxes between current and deferred portions is as follows:
| Years Ended December 31, | ||||||||||||
| 2017 | 2016 | 2015 | ||||||||||
| (In thousands) | ||||||||||||
| Current tax provision: |
||||||||||||
| Federal |
$ | 20,575 | $ | 15,989 | $ | 11,109 | ||||||
| State |
6,089 | 4,708 | 3,218 | |||||||||
|
|
|
|
|
|
|
|||||||
| Total current provision |
26,664 | 20,697 | 14,327 | |||||||||
|
|
|
|
|
|
|
|||||||
| Deferred tax provision (benefit): |
||||||||||||
| Federal |
(16 | ) | (2,176 | ) | (1,841 | ) | ||||||
| State |
(219 | ) | (640 | ) | (520 | ) | ||||||
| Effect of tax rate change |
7,058 | — | — | |||||||||
|
|
|
|
|
|
|
|||||||
| Total deferred provision (benefit) |
6,823 | (2,816 | ) | (2,361 | ) | |||||||
|
|
|
|
|
|
|
|||||||
| Total tax provision |
$ | 33,487 | $ | 17,881 | $ | 11,966 | ||||||
|
|
|
|
|
|
|
|||||||
The reasons for the differences between the statutory federal income tax rate and the effective tax rates are summarized as follows:
| Years Ended December 31, |
||||||||||||
| 2017 | 2016 | 2015 | ||||||||||
| Statutory federal tax rate |
35.0 | % | 35.0 | % | 35.0 | % | ||||||
| Increase (decrease) resulting from: |
||||||||||||
| State taxes, net of federal tax benefit |
5.0 | 5.1 | 4.8 | |||||||||
| Dividends received deduction |
(0.3 | ) | (0.7 | ) | (1.1 | ) | ||||||
| Bank-owned life insurance |
(1.3 | ) | (0.8 | ) | (1.2 | ) | ||||||
| Tax exempt income |
(4.2 | ) | (5.9 | ) | (6.0 | ) | ||||||
| Effect of tax rate change |
9.2 | — | — | |||||||||
| Other, net |
0.4 | 1.6 | 1.2 | |||||||||
|
|
|
|
|
|
|
|||||||
| Effective tax rates |
43.8 | % | 34.3 | % | 32.7 | % | ||||||
|
|
|
|
|
|
|
|||||||
101
Table of Contents
NOTES TO CONSOLIDATED FINANCIAL STATEMENTS — (Continued)
The components of the net deferred tax asset are as follows:
| December 31, | ||||||||
| 2017 | 2016 | |||||||
| (In thousands) | ||||||||
| Deferred tax assets: |
||||||||
| Federal |
$ | 12,353 | $ | 19,275 | ||||
| State |
5,795 | 5,482 | ||||||
|
|
|
|
|
|||||
| 18,148 | 24,757 | |||||||
|
|
|
|
|
|||||
| Deferred tax liabilities |
||||||||
| Federal |
(2,329 | ) | (2,625 | ) | ||||
| State |
(575 | ) | (671 | ) | ||||
|
|
|
|
|
|||||
| (2,904 | ) | (3,296 | ) | |||||
|
|
|
|
|
|||||
| Net deferred tax asset |
$ | 15,244 | $ | 21,461 | ||||
|
|
|
|
|
|||||
The tax effects of each item that give rise to deferred tax assets and deferred tax liabilities are as follows:
| December 31, | ||||||||
| 2017 | 2016 | |||||||
| (In thousands) | ||||||||
| Deferred tax assets: |
||||||||
| Allowance for loan losses |
$ | 12,701 | $ | 16,401 | ||||
| Employee benefit and retirement plans |
3,720 | 5,011 | ||||||
| Acquisition accounting |
1,378 | 2,135 | ||||||
| Non-accrual interest |
82 | 1,091 | ||||||
| Other |
259 | 208 | ||||||
|
|
|
|
|
|||||
| 18,140 | 24,846 | |||||||
|
|
|
|
|
|||||
| Deferred tax liabilities |
||||||||
| Net unrealized gain on securities available for sale |
(292 | ) | (1,444 | ) | ||||
| Depreciation and amortization |
(945 | ) | (1,289 | ) | ||||
| Other |
(1,659 | ) | (652 | ) | ||||
|
|
|
|
|
|||||
| (2,896 | ) | (3,385 | ) | |||||
|
|
|
|
|
|||||
| Net deferred tax asset |
$ | 15,244 | $ | 21,461 | ||||
|
|
|
|
|
|||||
The Company reduces deferred tax assets by a valuation allowance if, based on the weight of available evidence, it is not “more likely than not” that some portion or all of the deferred tax assets will be realized. The Company assesses the realizability of its deferred tax assets by assessing the likelihood of the Company generating federal and state tax income, as applicable, in future periods in amounts sufficient to offset the deferred tax charges in the periods they are expected to reverse. Based on this assessment, management concluded that a valuation allowance was not required as of December 31, 2017, 2016 and 2015.
The federal income tax reserve for loan losses at the Company’s base year is $9.8 million. If any portion of the reserve is used for purposes other than to absorb loan losses, approximately 150% of the amount actually used (limited to the amount of the reserve) would be subject to taxation in the year in which used. As the Company intends to use the reserve to absorb only loan losses, a deferred tax liability of $2.8 million has not been provided.
102
Table of Contents
NOTES TO CONSOLIDATED FINANCIAL STATEMENTS — (Continued)
The Company’s income tax returns are subject to review and examination by federal and state taxing authorities. The Company is currently open to audit under the applicable statutes of limitations by the Internal Revenue Service for the years ended December 31, 2014 through 2017. The years open to examination by state taxing authorities vary by jurisdiction; no years prior to 2014 are open.
On December 22, 2017, the President signed into law the Tax Cuts and Jobs Act (the “Act”). The Act includes a number of changes in existing law impacting businesses including, among other things, a permanent reduction in the corporate income tax rate from 35% to 21%, effective on January 1, 2018. As a result of this rate reduction, the Company revalued its net deferred tax asset as of December 22, 2017 resulting in a reduction in the value of the net deferred tax assets of $7.1 million, which was recorded as additional income tax expense in the Company’s consolidated statement of net income in 2017. The Company believes it has developed a reasonable estimate of other provisions of the Act in determining the current year income tax provision.
9. OTHER COMMITMENTS AND CONTINGENCIES AND DERIVATIVES
In the normal course of business, there are outstanding commitments and contingencies which are not reflected in the accompanying consolidated financial statements.
Loan Commitments
The Company is party to financial instruments with off-balance sheet risk in the normal course of business to meet the financing needs of its customers and to reduce its own exposure to fluctuations in interest rates. The instruments involve, to varying degrees, elements of credit and interest rate risk in excess of the amount recognized in the accompanying consolidated balance sheets. The contract amounts of those instruments reflect the extent of involvement the Company has in particular classes of financial instruments.
The Company’s exposure to credit loss in the event of nonperformance by the counterparty to the financial instrument for loan commitments is represented by the contractual amount of those instruments. The Company uses the same credit policies in making commitments as it does for on-balance sheet instruments.
A summary of outstanding loan commitments whose contract amounts represent credit risk is as follows:
| December 31, | ||||||||
| 2017 | 2016 | |||||||
| (In thousands) | ||||||||
| Unadvanced portion of existing loans: |
||||||||
| Construction |
$ | 603,557 | $ | 503,586 | ||||
| Home equity lines of credit |
46,352 | 36,722 | ||||||
| Other lines and letters of credit |
301,285 | 314,225 | ||||||
| Commitments to originate: |
||||||||
| One- to four-family |
25,432 | 18,272 | ||||||
| Commercial real estate |
116,314 | 42,141 | ||||||
| Construction |
81,937 | 231,274 | ||||||
| Commercial and industrial |
30,589 | 31,463 | ||||||
| Other loans |
— | 350 | ||||||
|
|
|
|
|
|||||
| Total loan commitments outstanding |
$ | 1,205,466 | $ | 1,178,033 | ||||
|
|
|
|
|
|||||
Commitments to originate loans are agreements to lend to a customer provided there is no violation of any condition established in the contract. Commitments generally have fixed expiration dates or other termination clauses and may require payment of a fee. Since a portion of the commitments are expected to expire without being drawn upon, the total commitments do not necessarily represent future cash requirements. The Company evaluates each customer’s credit worthiness on a case by case basis. The amount of collateral obtained, if deemed necessary by the Company for the extension of credit, is based upon management’s credit evaluation of the borrower. Collateral held includes, but is not limited to, residential real estate and deposit accounts.
103
Table of Contents
NOTES TO CONSOLIDATED FINANCIAL STATEMENTS — (Continued)
Unfunded commitments under lines of credit are commitments for possible future extensions of credit to existing customers. These lines of credit are collateralized if deemed necessary and usually do not contain a specified maturity date and may not be drawn upon to the total extent to which the Company is committed. Letters of credit are conditional commitments issued by the Company to guarantee the performance of a customer to a third party. Those letters of credit are primarily issued to support borrowing arrangements. The credit risk involved in issuing letters of credit is essentially the same as that involved in extending loan facilities to customers.
Interest Rate Swaps
The Company is a party to interest rate derivatives that are not designated as hedging instruments. These derivatives relate to interest rate swaps that the Company enters into with commercial business customers to synthetically convert their loans from a variable rate to a fixed rate. The Company pays interest to the customer at a floating rate on the notional amount and receives interest from the customer at a fixed rate for the same notional amount. Concurrently, the Company enters into an offsetting interest rate swap with a third party financial institution. In the offsetting swap, the Company pays the other financial institution interest at the same fixed rate on the same notional amount as the swap entered into with the customer, and receives interest from the financial institution for the same floating rate on the same notional amount. The changes in the fair value of the swaps offset each other, except for the credit risk of the counterparties, which is determined by taking into consideration the risk rating and probability of default. At December 31, 2017 and 2016, the Company had $1.3 million and $1.8 million, respectively, in cash pledged for collateral on its interest rate swaps with the third party financial institution.
Summary information regarding these derivatives is presented below:
| December 31, | |||||||||||||||||||||||||||||||||||
| 2017 | 2016 | ||||||||||||||||||||||||||||||||||
| Maturity | Interest Rate Paid | Interest Rate Received | Notional Amount |
Fair Value |
Notional Amount |
Fair Value | |||||||||||||||||||||||||||||
| (Dollars in thousands) | |||||||||||||||||||||||||||||||||||
| Customer interest rate swap |
06/07/32 | 1 Mo. Libor + 200bp | Fixed (4.40%) | $ | 65,514 | $ | 486 | $ | — | $ | — | ||||||||||||||||||||||||
| Third-party interest rate swap |
06/07/32 | Fixed (4.40%) | 1 Mo. Libor + 200bp | 65,514 | (486 | ) | — | — | |||||||||||||||||||||||||||
| Customer interest rate swap |
10/17/33 | 1 Mo. Libor + 175bp | Fixed (4.1052%) | $ | 10,709 | $ | 720 | $ | 10,922 | $ | 839 | ||||||||||||||||||||||||
| Third-party interest rate swap |
10/17/33 | Fixed (4.1052%) | 1 Mo. Libor + 175bp | 10,709 | (720 | ) | 10,922 | (839 | ) | ||||||||||||||||||||||||||
| Customer interest rate swap |
12/13/26 | 1 Mo. Libor + 205bp | Fixed (3.82%) | $ | 2,884 | $ | (78 | ) | $ | 3,036 | $ | (60 | ) | ||||||||||||||||||||||
| Third-party interest rate swap |
12/13/26 | Fixed (3.82%) | 1 Mo. Libor + 205bp | 2,884 | 78 | 3,036 | 60 | ||||||||||||||||||||||||||||
Other Commitments
As of December 31, 2017, the Company has an outstanding commitment of $17.3 million with its core data processing provider through December 2021.
Employment and Change in Control Agreements
The Company has entered into employment agreements with certain senior executives which provide for a minimum annual salary, subject to increase at the discretion of the Board of Directors, and other benefits, including a severance payment in the event employment is terminated in conjunction with a defined change in control. The agreements may be terminated for cause by the Company without further liability on the part of the Company, or by the executives with prior written notice to the Board of Directors. The Company also has change in control agreements with several officers which provide a severance payment in the event employment is terminated in conjunction with a defined change in control.
104
Table of Contents
NOTES TO CONSOLIDATED FINANCIAL STATEMENTS — (Continued)
Legal Claims
Various legal claims may arise from time to time in the normal course of business, but in the opinion of management, these claims are not expected to have a material effect on the Company’s consolidated financial statements.
10. EMPLOYEE BENEFIT PLANS
401(k) Plan
The Company has a 401(k) plan to provide retirement benefits for eligible employees. Under this plan, each employee reaching the age of eighteen and having completed at least three months of service in any one twelve-month period, beginning with such employee’s date of employment, can elect to be a participant in the retirement plan. All participants are fully vested upon entering the plan. The Company contributes an amount equal to three percent of an employee’s compensation regardless of the employee’s contributions and makes matching contributions equal to fifty percent of the first eight percent of an employee’s compensation contributed to the Plan. For the years ended December 31, 2017, 2016 and 2015, expense attributable to the plan amounted to $2.0 million, $1.6 million and $1.6 million, respectively.
Supplemental Executive Retirement Benefits — Officers and Directors
The Company has supplemental retirement benefit agreements with certain officers. The present value of the estimated future benefits is accrued over the required service periods. At December 31, 2017 and 2016, the accrued liability for these agreements amounted to $6.7 million and $6.4 million, respectively.
The Company also has an unfunded Supplemental Executive Retirement Plan for certain directors which provides for a defined benefit obligation, based on the director’s final average compensation. At both December 31, 2017 and 2016, the accrued liability for the plan amounted to $1.3 million. Both contributions and benefit payments amounted to $259,000 and $411,000 for the years ended December 31, 2017 and 2016, respectively. No amounts were contributed or paid in the form of benefits for the years ended December 31, 2015.
Supplemental executive retirement benefits expense for officers and directors amounted to $497,000, $421,000 and $1.5 million for the years ended December 31, 2017, 2016 and 2015, respectively.
Share-Based Compensation Plan
On September 17, 2015, stockholders of the Company approved the 2015 Equity Incentive Plan (the “2015 EIP”). The 2015 EIP provides for the award of up to 4,550,000 shares of common stock pursuant to grants of restricted stock awards, incentive stock options and non-qualified stock options; provided, however, that no more than 1,300,000 shares may be issued or delivered pursuant to restricted stock awards and no more than 3,250,000 shares may be issued or delivered in the aggregate pursuant to the exercise of stock options. Pursuant to terms of the 2015 EIP, the Board of Directors has granted restricted stock and stock options to employees and directors. All of the awards granted to date vest evenly over a five year period from the date of the grant and the maximum term of each option is ten years. As of December 31, 2017, there were 454,390 restricted stock awards and 1,218,972 stock options that remain available for future grants.
The Company also maintains the 2008 Equity Incentive Plan (the “2008 EIP”). The 2008 EIP provides for the award of up to 3,547,732 shares of common stock pursuant to grants of restricted stock awards, incentive stock options, non-qualified stock options and stock appreciation rights (“SARs”); provided, however, that no more than 1,013,638 shares may be issued or delivered pursuant to restricted stock awards and no more than 2,534,094 shares may be issued or delivered in the aggregate pursuant to the exercise of stock options or SARs. The Board of Directors has granted restricted shares and stock options to employees and directors pursuant to the terms of the 2008 EIP. The options may be treated as stock appreciation rights that are settled in stock at the option of the vested participant. All of the awards granted to date vest evenly over a five year period from the date of the grant and the maximum term of each option is ten years. As of December 31, 2017, there were 10,834 restricted stock awards and 33,493 stock options that remain available for future grants.
105
Table of Contents
NOTES TO CONSOLIDATED FINANCIAL STATEMENTS — (Continued)
The fair value of each option award for the 2015 EIP and 2008 EIP is estimated on the date of grant using the Black-Scholes Option-Pricing Model. The expected volatility is based on historical volatility of the stock price. The dividend yield assumption is based on the Company’s expectation of dividend payouts. The Company uses historical employee turnover data to determine the expected forfeiture rate in the valuation model. The risk-free rate for periods within the contractual life of the option is based on the U.S. Treasury yield curve in effect at the date of grant.
The Company utilized historical experience when determining the expected term of the options granted in 2017 for the 2015 EIP. The simplified method of calculating the expected term was used for the options granted in 2015 for the 2015 EIP and 2008 EIP because limited historical data specific to the shares existed at that time. The weighted-average assumptions used and fair value for options granted during the years ended December 31, 2017 and 2015 respectively are as follows:
| 2017 | 2015 | |||||||
| Expected term (years) |
5.61 | 6.50 | ||||||
| Expected dividend yield |
0.94 | % | 0.83 | % | ||||
| Expected volatility |
24.65 | % | 26.02 | % | ||||
| Risk-free interest rate |
1.93 | % | 1.77 | % | ||||
| Weighted average fair value of options granted |
$ | 4.25 | $ | 3.78 | ||||
| Expected forfeiture rate for expense recognition |
6.02 | % | 6.02 | % | ||||
The aggregate grant date fair value of options granted in 2017 and 2015 was $3.0 million and $5.9 million, respectively. There were no options granted during the years ended December 31, 2016.
A summary of options and SARs under the plans as of December 31, 2017, and activity during the year then ended, is presented below:
| Number of Shares |
Weighted - Average Exercise Price |
Weighted - Average Remaining Contractual Life (in years) |
||||||||||
| Options outstanding at beginning of year |
3,383,089 | $ | 8.60 | 5.39 | ||||||||
| Options granted |
709,654 | 17.73 | ||||||||||
| Options exercised |
(107,960 | ) | 4.38 | |||||||||
| SARs exercised |
(98,108 | ) | 4.32 | |||||||||
| Forfeited |
(56,988 | ) | 13.67 | |||||||||
|
|
|
|||||||||||
| Options outstanding at end of year |
3,829,687 | 10.43 | 5.45 | |||||||||
|
|
|
|||||||||||
| Options exercisable at end of year |
2,226,800 | 6.73 | 3.22 | |||||||||
|
|
|
|||||||||||
The aggregate intrinsic value, which fluctuates based on changes in the fair market value of the Company’s stock, is $38.9 million and $30.9 million for all outstanding and exercisable options, respectively, at December 31, 2017, based on a closing stock price of $20.60. The aggregate intrinsic value represents the total pre-tax intrinsic value (i.e., the difference between the Company’s closing stock price on the last trading day of 2017 and the weighted-average exercise price, multiplied by the number of shares) that would have been received by the option holders had all option holders exercised their options on December 31, 2017. The total pre-tax intrinsic value for options exercised was $3.0 million, $954,000 and $2.3 million for the years ended December 31, 2017, 2016 and 2015, respectively. The total pre-tax intrinsic value for options exercised represents the difference between the weighted-average closing market stock price on the exercise date and the weighted-average exercise price, multiplied by the number of options exercised during the year. Shares for the exercise of stock options are expected to come from the Company’s authorized and unissued shares.
106
Table of Contents
NOTES TO CONSOLIDATED FINANCIAL STATEMENTS — (Continued)
The following table summarizes the Company’s non-vested restricted stock activity for the year ended December 31, 2017:
| Number of Shares |
Weighted - Average Grant-Date Fair Value |
|||||||
| Non-vested restricted stock at beginning of year |
583,503 | $ | 13.50 | |||||
| Granted |
282,500 | 17.72 | ||||||
| Vested |
(156,351 | ) | 12.92 | |||||
| Forfeited |
(22,839 | ) | 14.44 | |||||
|
|
|
|||||||
| Non-vested restricted stock at end of year |
686,813 | 15.34 | ||||||
|
|
|
|||||||
The total fair value of restricted shares vested in 2017 was $3.1 million.
For the years ended December 31, 2017, 2016 and 2015, share-based compensation expense under the plans and the related tax benefit totaled $3.8 million and $926,000, $3.3 million and $1.1 million, and $1.1 million and $289,000, respectively.
As of December 31, 2017, there was $15.5 million of total unrecognized compensation expense related to non-vested options and restricted shares granted under the plan. This cost is expected to be recognized over a weighted-average period of 3.7 years.
Employee Stock Ownership Plan
The Company established an Employee Stock Ownership Plan (the “ESOP”) for its eligible employees effective January 1, 2008 to provide eligible employees the opportunity to own Company stock. The plan is a tax-qualified retirement plan for the benefit of all Company employees. Contributions are allocated to eligible participants on the basis of compensation, subject to federal tax law limits. The ESOP acquired 2,027,275 shares in the Company’s initial stock offering with the proceeds of a loan totaling $8.3 million from the Company’s subsidiary, Meridian Interstate Funding Corporation. The loan was payable annually over 20 years at a rate of 6.5%. In conjunction with the Conversion, Meridian Interstate Funding Corporation was liquidated and merged into the Company. The Company refinanced the original loan to the ESOP with an additional $16.3 million payable over 25 years at a rate of 3.5%. The ESOP then acquired an additional 1,625,000 shares at $10.00 per share representing 5% of the shares issued in the Company’s second-step offering with proceeds from the Company’s loan to the ESOP. In total, the ESOP has purchased 3,652,275 shares at an average price of $7.22 per share (split-adjusted). The loan is secured by the shares purchased, which are held in a suspense account for allocation among participants as the loan is repaid. The Company’s annual cash contributions to the ESOP at a minimum will be sufficient to service the annual debt of the ESOP. Shares used as collateral to secure the loan are released and available for allocation to eligible employees as the principal and interest on the loan is paid. Cash dividends received on unallocated shares are utilized to repay the loan and dividends received on allocated shares are distributed to the participants.
At December 31, 2017, the remaining principal balance on the ESOP debt is payable as follows:
| Year Ending December 31, |
Amount | |||
| (In thousands) | ||||
| 2018 |
$ | 689 | ||
| 2019 |
711 | |||
| 2020 |
734 | |||
| 2021 |
758 | |||
| 2022 |
783 | |||
| Thereafter |
16,612 | |||
|
|
|
|||
| $ | 20,287 | |||
|
|
|
|||
107
Table of Contents
NOTES TO CONSOLIDATED FINANCIAL STATEMENTS — (Continued)
Shares held by the ESOP include the following:
| December 31, | ||||||||
| 2017 | 2016 | |||||||
| (In thousands) | ||||||||
| Allocated |
973 | 851 | ||||||
| Committed to be allocated |
122 | 122 | ||||||
| Unallocated |
2,557 | 2,679 | ||||||
|
|
|
|
|
|||||
| 3,652 | 3,652 | |||||||
|
|
|
|
|
|||||
The fair value of the unallocated shares was $52.7 million and $50.6 million at December 31, 2017 and 2016, respectively. Total compensation expense recognized in connection with the ESOP for the years ended December 31, 2017, 2016 and 2015 was $2.2 million, $1.8 million and $1.6 million, respectively.
Bank-Owned Life Insurance
The Company is the sole owner of life insurance policies pertaining to certain employees. The Company has entered into agreements with these employees whereby the Company will pay to the employees’ estate or beneficiaries a portion of the death benefit that the Company will receive as beneficiary of such policies. These post-retirement benefits are accrued over the expected service period of the employees. Expense associated with this post-retirement benefit for the years ended December 31, 2017, 2016 and 2015 amounted to $400,000, $543,000 and $410,000, respectively.
Incentive Compensation Plan
Eligible officers and employees of the Company participate in an incentive compensation plan which is based on various factors as set forth by the Executive Committee. Incentive compensation plan expense for the years ended December 31, 2017, 2016 and 2015 amounted to $5.6 million, $4.9 million and $4.2 million, respectively.
11. STOCKHOLDERS’ EQUITY
Minimum Regulatory Capital Requirements
Both the Company and the Bank are subject to various regulatory capital requirements administered by the Federal Reserve Board and the Federal Deposit Insurance Corporation, respectively, including a risk-based capital measure. The risk-based capital guidelines include both a definition of capital and a framework for calculating risk-weighted assets by assigning balance sheet assets and off-balance sheet items to broad risk categories. Failure to meet minimum capital requirements can initiate certain mandatory and possibly additional discretionary actions by regulators that, if undertaken, could have a direct material effect on the Company’s and Bank’s consolidated financial statements. Under capital adequacy guidelines and the regulatory framework for prompt corrective action, the Company and the Bank must meet specific capital guidelines that involve quantitative measures of their assets, liabilities and certain off-balance-sheet items as calculated under regulatory accounting practices. The capital amounts and classification are also subject to qualitative judgments by the regulators about components, risk weightings and other factors. Prompt corrective action provisions are not applicable to mutual holding companies.
Federal banking regulations include minimum capital requirements as set forth in the following table. Additionally, community banking institutions must maintain a capital conservation buffer of common equity Tier 1 capital in an amount greater than 2.5% of total to risk-weighted assets to avoid being subject to limitations on capital distributions and discretionary bonuses. The capital conservation buffer is being phased in over three years, beginning on January 1, 2016. The required minimum conservation buffer is 1.25% as of December 31, 2017, increased to 1.875% on January 1, 2018 and will increase to 2.5% on January 1, 2019. Also, certain new deductions from and adjustments to regulatory capital are being phased in over several years. Management
108
Table of Contents
NOTES TO CONSOLIDATED FINANCIAL STATEMENTS — (Continued)
believes that the Company’s capital levels will remain characterized as “well-capitalized” throughout the phase in periods.
The Company’s and the Bank’s actual capital amounts and ratios follow:
| Actual | Minimum Capital Requirement |
Minimum To Be Well Capitalized Under Prompt Corrective Action Provisions |
||||||||||||||||||||||
| Amount | Ratio | Amount | Ratio | Amount | Ratio | |||||||||||||||||||
| (Dollars in thousands) | ||||||||||||||||||||||||
| December 31, 2017 |
||||||||||||||||||||||||
| Total Capital (to Risk Weighted Assets): |
||||||||||||||||||||||||
| Company |
$ | 669,536 | 13.6 | % | $ | 393,875 | 8.0 | % | $ | 492,343 | 10.0 | % | ||||||||||||
| Bank |
555,737 | 11.3 | 392,729 | 8.0 | 490,911 | 10.0 | ||||||||||||||||||
| Tier 1 Capital (to Risk Weighted Assets): |
||||||||||||||||||||||||
| Company |
624,039 | 12.7 | 295,406 | 6.0 | 393,875 | 8.0 | ||||||||||||||||||
| Bank |
510,240 | 10.4 | 294,546 | 6.0 | 392,729 | 8.0 | ||||||||||||||||||
| Common Equity Tier 1 Capital (to Risk Weighted Assets): |
||||||||||||||||||||||||
| Company |
624,039 | 12.7 | 221,554 | 4.5 | 320,023 | 6.5 | ||||||||||||||||||
| Bank |
510,240 | 10.4 | 220,910 | 4.5 | 319,092 | 6.5 | ||||||||||||||||||
| Tier 1 Capital (to Average Assets): |
||||||||||||||||||||||||
| Company |
624,039 | 12.1 | 206,293 | 4.0 | 257,867 | 5.0 | ||||||||||||||||||
| Bank |
510,240 | 10.1 | 202,224 | 4.0 | 252,780 | 5.0 | ||||||||||||||||||
| December 31, 2016 |
||||||||||||||||||||||||
| Total Capital (to Risk Weighted Assets): |
||||||||||||||||||||||||
| Company |
$ | 633,420 | 15.0 | % | $ | 338,878 | 8.0 | % | $ | 423,597 | 10.0 | % | ||||||||||||
| Bank |
493,944 | 11.7 | 337,058 | 8.0 | 421,323 | 10.0 | ||||||||||||||||||
| Tier 1 Capital (to Risk Weighted Assets): |
||||||||||||||||||||||||
| Company |
591,804 | 14.0 | 254,158 | 6.0 | 338,878 | 8.0 | ||||||||||||||||||
| Bank |
452,328 | 10.7 | 252,794 | 6.0 | 337,058 | 8.0 | ||||||||||||||||||
| Common Equity Tier 1 Capital (to Risk Weighted Assets): |
||||||||||||||||||||||||
| Company |
591,804 | 14.0 | 190,619 | 4.5 | 275,338 | 6.5 | ||||||||||||||||||
| Bank |
452,328 | 10.7 | 189,595 | 4.5 | 273,860 | 6.5 | ||||||||||||||||||
| Tier 1 Capital (to Average Assets): |
||||||||||||||||||||||||
| Company |
591,804 | 13.8 | 171,854 | 4.0 | 214,817 | 5.0 | ||||||||||||||||||
| Bank |
452,328 | 10.7 | 168,518 | 4.0 | 210,648 | 5.0 | ||||||||||||||||||
109
Table of Contents
NOTES TO CONSOLIDATED FINANCIAL STATEMENTS — (Continued)
A reconciliation of the Company’s and Bank’s stockholders’ equity to total regulatory capital follows:
| December 31, | ||||||||||||||||
| 2017 | 2016 | |||||||||||||||
| Consolidated | Bank | Consolidated | Bank | |||||||||||||
| (In thousands) | ||||||||||||||||
| Total stockholders’ equity per financial statements |
$ | 646,399 | $ | 532,600 | $ | 607,297 | $ | 467,821 | ||||||||
| Adjustments to Tier 1 and Common Equity Tier 1 capital: |
||||||||||||||||
| Accumulated other comprehensive income |
(128 | ) | (128 | ) | (1,806 | ) | (1,806 | ) | ||||||||
| Goodwill disallowed |
(19,638 | ) | (19,638 | ) | (13,687 | ) | (13,687 | ) | ||||||||
| Core deposit intangible, net of deferred tax liability disallowed |
(2,594 | ) | (2,594 | ) | — | — | ||||||||||
|
|
|
|
|
|
|
|
|
|||||||||
| Total Tier 1 and Common Equity Tier 1 capital |
624,039 | 510,240 | 591,804 | 452,328 | ||||||||||||
|
|
|
|
|
|
|
|
|
|||||||||
| Adjustments to total capital: |
||||||||||||||||
| Allowance for loan losses |
45,185 | 45,185 | 40,149 | 40,149 | ||||||||||||
| 45% of net unrealized gains on marketable equity securities |
312 | 312 | 1,467 | 1,467 | ||||||||||||
|
|
|
|
|
|
|
|
|
|||||||||
| Total regulatory capital |
$ | 669,536 | $ | 555,737 | $ | 633,420 | $ | 493,944 | ||||||||
|
|
|
|
|
|
|
|
|
|||||||||
Liquidation Account
At the time of the minority stock offering, which was completed on January 22, 2008, the Company established a liquidation account totaling $114.2 million. The liquidation account is equal to the net worth of the Company as of the date of the latest consolidated balance sheet appearing in the final prospectus distributed in connection with the minority stock offering. In addition, the Company also established a secondary liquidation account totaling $150.2 million in connection with the second-step offering that was completed on July 28, 2014. This liquidation account is equal to Meridian Financial Services, Incorporated’s ownership interest in Old Meridian’s total stockholders’ equity as of the date of the latest consolidated balance sheet appearing in the final prospectus distributed in connection second-step stock offering plus the value of the net assets of Meridian Financial Services, Incorporated as of the date of the latest statement of financial condition of Meridian Financial Services, Incorporated prior to the consummation of the conversion (excluding its ownership of Old Meridian). The liquidation accounts are maintained for the benefit of the eligible account holders and supplemental eligible account holders who maintain their accounts at the Bank after the offerings. The liquidation accounts are reduced annually to the extent that such account holders have reduced their qualifying deposits as of each anniversary date. Subsequent increases will not restore an account holder’s interest in the liquidation account. In the event of a complete liquidation, each eligible account holder will be entitled to receive balances for accounts held then. At December 31, 2017, the minority stock offering and second-step offering liquidation accounts amounted to $14.3 million and $65.3 million, respectively.
Other Capital Restrictions
Federal and state banking regulations place certain restrictions on dividends paid and loans or advances made by the Bank to the Company. The total amount for dividends which may be paid in any calendar year cannot exceed the Bank’s net income for the current year, plus the Bank’s net income retained for the two previous years, without regulatory approval. At December 31, 2017, the Bank’s retained earnings available for the payment of dividends was $77.0 million. Loans or advances are limited to 10% of the Bank’s capital stock and surplus on a secured basis. Funds available for loans or advances by the Bank to the Company amounted to
110
Table of Contents
NOTES TO CONSOLIDATED FINANCIAL STATEMENTS — (Continued)
$53.3 million. In addition, dividends paid by the Bank to the Company would be prohibited if the effect thereof would cause the Bank’s capital to be reduced below applicable minimum capital requirements.
Stock Repurchases and Dividends
The Company may use capital management tools such as cash dividends and common share repurchases. Massachusetts regulations restrict repurchases for the first three years following the second-step conversion (July 2014) except where compelling and valid business reasons are established to the satisfaction of the Massachusetts Commissioner of Banks. The Company is also subject to the Federal Reserve Board’s notice provisions for stock repurchases. In August 2015, the Company received regulatory approval from the Massachusetts Commissioner of Banks and a non-objection from the Federal Reserve Bank to adopt a stock repurchase program for up to 5% of its common stock. As of December 31, 2017, the Company had repurchased 2,059,611 shares of its stock at an average price of $13.71 per share, or 75.2% of the 2,737,334 shares authorized for repurchase under the Company’s repurchase program. For the year ended December 31, 2017, the Company’s Board of Directors declared three quarterly cash dividends of $0.04 per common share on March 1, 2017, June 1, 2017, September 1, 2017 and one quarterly cash dividend of $0.05 on December 1, 2017.
12. FAIR VALUES OF ASSETS AND LIABILITIES
Determination of Fair Value
The Company uses fair value measurements to record fair value adjustments to certain assets and liabilities and to determine fair value disclosures. The fair value of assets and liabilities is the price that would be received to sell an asset or paid to transfer a liability in an orderly transaction between market participants at the measurement date. Fair value is best determined based upon quoted market prices. However, in many instances, there are no quoted market prices for the Company’s various assets and liabilities. In cases where quoted market prices are not available, fair values are based on estimates using present value or other valuation techniques. Those techniques are significantly affected by the assumptions used including the discount rate and estimates of future cash flows. Accordingly, the fair value estimates may not be realized in an immediate settlement of the asset or liability.
The following methods and assumptions were used by the Company in estimating fair value disclosures:
Cash and cash equivalents — The carrying amounts of cash and short-term instruments approximate fair values, based on the short-term nature of the assets.
Certificates of deposit — Fair values of certificates of deposit are estimated using discounted cash flow analyses based on current market rates for similar types of deposits.
Securities available for sale — All fair value measurements are obtained from a third party pricing service and are not adjusted by management. Marketable equity securities are measured at fair value utilizing quoted market prices (Level 1). Obligations of government-sponsored enterprises, municipal bonds and mortgage-backed securities are determined by pricing models that consider standard input factors such as observable market data, benchmark yields, reported trades, broker/dealer quotes, credit spreads, benchmark securities, as well as new issue data, monthly payment information, and collateral performance, among others (Level 2).
Federal Home Loan Bank stock — The carrying value of Federal Home Loan Bank stock approximates fair value based on the redemption provisions of the Federal Home Loan Bank.
Loans held for sale — The fair value is based on commitments in effect from investors or prevailing market prices.
Loans — For variable-rate loans that reprice frequently and with no significant change in credit risk, fair values are based on carrying values. Fair values for other loans are estimated using discounted cash flow analyses, using market interest rates currently being offered for loans with similar terms to borrowers of similar credit quality. Fair values for non-accrual loans are estimated using discounted cash flow analyses or underlying collateral values, where applicable.
111
Table of Contents
NOTES TO CONSOLIDATED FINANCIAL STATEMENTS — (Continued)
Deposits — The fair values disclosed for non-certificate accounts are, by definition, equal to the amount payable on demand at the reporting date which is their carrying amounts. Fair values for certificates of deposit are estimated using a discounted cash flow calculation that applies market interest rates currently being offered on certificates to a schedule of aggregated expected monthly maturities on time deposits.
Borrowings — The fair value is estimated using discounted cash flow analyses based on the current incremental borrowing rates in the market for similar types of borrowing arrangements.
Accrued interest — The carrying amounts of accrued interest approximate fair value.
Loan level interest rate swaps — The fair value is based on settlement values adjusted for credit risks associated with the counterparties and the Company and observable market interest rate curves.
Off-balance sheet credit-related instruments — Fair values for off-balance-sheet, credit-related financial instruments are based on fees currently charged to enter into similar agreements, taking into account the remaining terms of the agreements and the counterparties’ credit standing. The fair value of these instruments is considered immaterial.
Assets and Liabilities Measured at Fair Value on a Recurring Basis
Assets measured at fair value on a recurring basis are summarized as follows. There were no liabilities measured at fair value on a recurring basis.
| December 31, 2017 | ||||||||||||||||
| Level 1 | Level 2 | Level 3 | Total Fair Value |
|||||||||||||
| (In thousands) | ||||||||||||||||
| Assets: |
||||||||||||||||
| Debt securities |
$ | — | $ | 20,589 | $ | — | $ | 20,589 | ||||||||
| Marketable equity securities |
17,775 | — | — | 17,775 | ||||||||||||
| Loan level interest rate swaps |
— | — | 1,284 | 1,284 | ||||||||||||
|
|
|
|
|
|
|
|
|
|||||||||
| Total assets |
$ | 17,775 | $ | 20,589 | $ | 1,284 | $ | 39,648 | ||||||||
|
|
|
|
|
|
|
|
|
|||||||||
| Liabilities: |
||||||||||||||||
| Loan level interest rate swaps |
— | — | 1,284 | 1,284 | ||||||||||||
|
|
|
|
|
|
|
|
|
|||||||||
| Total liabilities |
$ | — | $ | — | $ | 1,284 | $ | 1,284 | ||||||||
|
|
|
|
|
|
|
|
|
|||||||||
| December 31, 2016 | ||||||||||||||||
| Level 1 | Level 2 | Level 3 | Total Fair Value |
|||||||||||||
| (In thousands) | ||||||||||||||||
| Assets: |
||||||||||||||||
| Debt securities |
$ | — | $ | 21,631 | $ | — | $ | 21,631 | ||||||||
| Marketable equity securities |
46,032 | — | — | 46,032 | ||||||||||||
| Loan level interest rate swaps |
— | — | 899 | 899 | ||||||||||||
|
|
|
|
|
|
|
|
|
|||||||||
| Total assets |
$ | 46,032 | $ | 21,631 | $ | 899 | $ | 68,562 | ||||||||
|
|
|
|
|
|
|
|
|
|||||||||
| Liabilities: |
||||||||||||||||
| Loan level interest rate swaps |
— | — | 899 | 899 | ||||||||||||
|
|
|
|
|
|
|
|
|
|||||||||
| Total liabilities |
$ | — | $ | — | $ | 899 | $ | 899 | ||||||||
|
|
|
|
|
|
|
|
|
|||||||||
112
Table of Contents
NOTES TO CONSOLIDATED FINANCIAL STATEMENTS — (Continued)
Assets Measured at Fair Value on a Non-recurring Basis
The Company may also be required, from time to time, to measure certain other assets on a non-recurring basis in accordance with generally accepted accounting principles. These adjustments to fair value usually result from the application of lower-of-cost-or market accounting or write-downs of individual assets.
Certain impaired loans were adjusted to fair value, less cost to sell, of the underlying collateral securing these loans resulting in losses. The loss is not recorded directly as an adjustment to current earnings, but rather as a component in determining the allowance for loan losses. Fair value was measured using appraised values of collateral and adjusted as necessary by management based on unobservable inputs for specific properties. Impaired loans measured at fair value at December 31, 2017 and December 31, 2016 were $1.9 million and $4.9 million, respectively. The related gains and losses were immaterial for the years ended December 31, 2017 and 2016.
Summary of Fair Values of Financial Instruments
The estimated fair values, and related carrying amounts, of the Company’s financial instruments are as follows. Certain financial instruments and all nonfinancial instruments are exempt from disclosure requirements. Accordingly, the aggregate fair value amounts presented herein do not represent the underlying fair value of the Company.
| December 31, 2017 | ||||||||||||||||||||
| Carrying Amount |
Fair Value | |||||||||||||||||||
| Level 1 | Level 2 | Level 3 | Total | |||||||||||||||||
| (In thousands) | ||||||||||||||||||||
| Financial assets: |
||||||||||||||||||||
| Cash and due from banks |
$ | 402,687 | $ | 402,687 | $ | — | $ | — | $ | 402,687 | ||||||||||
| Certificates of deposit |
69,326 | — | 69,615 | — | 69,615 | |||||||||||||||
| Securities available for sale |
38,364 | 17,775 | 20,589 | — | 38,364 | |||||||||||||||
| Federal Home Loan Bank stock |
24,947 | — | — | 24,947 | 24,947 | |||||||||||||||
| Loans and loans held for sale, net |
4,626,570 | — | — | 4,590,543 | 4,590,543 | |||||||||||||||
| Accrued interest receivable |
12,902 | — | — | 12,902 | 12,902 | |||||||||||||||
| Financial liabilities: |
||||||||||||||||||||
| Deposits |
4,107,861 | — | — | 3,995,215 | 3,995,215 | |||||||||||||||
| Borrowings |
513,444 | — | 508,411 | — | 508,411 | |||||||||||||||
| Accrued interest payable |
2,025 | — | — | 2,025 | 2,025 | |||||||||||||||
| On-balance sheet derivative financial instruments: |
||||||||||||||||||||
| Assets: |
||||||||||||||||||||
| Loan level interest rate swaps |
1,284 | — | — | 1,284 | 1,284 | |||||||||||||||
| Liabilities: |
||||||||||||||||||||
| Loan level interest rate swaps |
1,284 | — | — | 1,284 | 1,284 | |||||||||||||||
113
Table of Contents
NOTES TO CONSOLIDATED FINANCIAL STATEMENTS — (Continued)
| December 31, 2016 | ||||||||||||||||||||
| Carrying Amount |
Fair Value | |||||||||||||||||||
| Level 1 | Level 2 | Level 3 | Total | |||||||||||||||||
| (In thousands) | ||||||||||||||||||||
| Financial assets: |
||||||||||||||||||||
| Cash and due from banks |
$ | 236,423 | $ | 236,423 | $ | — | $ | — | $ | 236,423 | ||||||||||
| Certificates of deposit |
80,323 | — | 80,710 | — | 80,710 | |||||||||||||||
| Securities available for sale |
67,663 | 46,032 | 21,631 | — | 67,663 | |||||||||||||||
| Federal Home Loan Bank stock |
18,175 | — | — | 18,175 | 18,175 | |||||||||||||||
| Loans and loans held for sale, net |
3,902,612 | — | — | 3,970,896 | 3,970,896 | |||||||||||||||
| Accrued interest receivable |
10,381 | — | — | 10,381 | 10,381 | |||||||||||||||
| Financial liabilities: |
||||||||||||||||||||
| Deposits |
3,475,837 | — | — | 3,485,618 | 3,485,618 | |||||||||||||||
| Borrowings |
322,523 | — | 322,928 | — | 322,928 | |||||||||||||||
| Accrued interest payable |
1,384 | — | — | 1,384 | 1,384 | |||||||||||||||
| On-balance sheet derivative financial instruments: |
||||||||||||||||||||
| Assets: |
||||||||||||||||||||
| Loan level interest rate swaps |
899 | — | — | 899 | 899 | |||||||||||||||
| Liabilities: |
||||||||||||||||||||
| Loan level interest rate swaps |
899 | — | — | 899 | 899 | |||||||||||||||
13. CONDENSED FINANCIAL STATEMENTS OF PARENT COMPANY
Financial information pertaining only to Meridian Bancorp, Inc. is as follows:
| December 31, | ||||||||
| 2017 | 2016 | |||||||
| (In thousands) | ||||||||
| BALANCE SHEETS |
||||||||
| Assets |
||||||||
| Cash and cash equivalents from bank subsidiary |
$ | 23,072 | $ | 34,613 | ||||
| Certificates of deposit |
67,843 | 80,323 | ||||||
| Securities available for sale, at fair value |
10 | 5,003 | ||||||
| Investment in bank subsidiary |
532,600 | 467,821 | ||||||
| ESOP loan receivable |
20,287 | 20,954 | ||||||
| Other assets |
3,316 | 2,735 | ||||||
|
|
|
|
|
|||||
| Total assets |
$ | 647,128 | $ | 611,449 | ||||
|
|
|
|
|
|||||
| Liabilities and Stockholders’ Equity |
||||||||
| Accrued expenses and other liabilities |
$ | 729 | $ | 4,152 | ||||
| Stockholders’ equity |
646,399 | 607,297 | ||||||
|
|
|
|
|
|||||
| Total liabilities and stockholders’ equity |
$ | 647,128 | $ | 611,449 | ||||
|
|
|
|
|
|||||
114
Table of Contents
NOTES TO CONSOLIDATED FINANCIAL STATEMENTS — (Continued)
| Years Ended December 31, | ||||||||||||
| 2017 | 2016 | 2015 | ||||||||||
| (In thousands) | ||||||||||||
| STATEMENTS OF INCOME |
||||||||||||
| Income: |
||||||||||||
| Interest on ESOP loan |
$ | 681 | $ | 702 | $ | 722 | ||||||
| Interest on certificates of deposit |
814 | 495 | 624 | |||||||||
| Interest and dividend income on securities |
46 | 184 | 151 | |||||||||
| Other interest and dividend income |
— | 4 | 82 | |||||||||
| Gain on sale of securities, net |
1 | 182 | — | |||||||||
|
|
|
|
|
|
|
|||||||
| Total income |
1,542 | 1,567 | 1,579 | |||||||||
| Expenses: |
||||||||||||
| Merger and acquisition |
484 | — | — | |||||||||
| Other general and administrative |
1,144 | 1,174 | 993 | |||||||||
|
|
|
|
|
|
|
|||||||
| Total operating expenses |
1,628 | 1,174 | 993 | |||||||||
|
|
|
|
|
|
|
|||||||
| Income (loss) before income taxes and equity in undistributed earnings of subsidiaries |
(86 | ) | 393 | 586 | ||||||||
| Applicable income tax provision (benefit) |
(35 | ) | 160 | 240 | ||||||||
|
|
|
|
|
|
|
|||||||
| (51 | ) | 233 | 346 | |||||||||
| Equity in undistributed earnings of subsidiary |
42,996 | 33,957 | 24,261 | |||||||||
|
|
|
|
|
|
|
|||||||
| Net income |
$ | 42,945 | $ | 34,190 | $ | 24,607 | ||||||
|
|
|
|
|
|
|
|||||||
115
Table of Contents
NOTES TO CONSOLIDATED FINANCIAL STATEMENTS — (Continued)
| Years Ended December 31, | ||||||||||||
| 2017 | 2016 | 2015 | ||||||||||
| (In thousands) | ||||||||||||
| STATEMENTS OF CASH FLOWS |
||||||||||||
| Cash flows from operating activities: |
||||||||||||
| Net income |
$ | 42,945 | $ | 34,190 | $ | 24,607 | ||||||
| Adjustments to reconcile net income to net cash provided (used) by operating activities: |
||||||||||||
| Equity in undistributed earnings of subsidiaries |
(42,996 | ) | (33,957 | ) | (24,261 | ) | ||||||
| Net accretion of securities available for sale |
4 | — | (3 | ) | ||||||||
| Gain on sales of securities, net |
(1 | ) | (182 | ) | — | |||||||
| Share-based compensation expense |
379 | 319 | 97 | |||||||||
| Decrease (increase) in other assets |
(582 | ) | 232 | 828 | ||||||||
| Increase in other liabilities |
(4,460 | ) | 550 | 211 | ||||||||
|
|
|
|
|
|
|
|||||||
| Net cash provided (used) by operating activities |
(4,711 | ) | 1,152 | 1,479 | ||||||||
|
|
|
|
|
|
|
|||||||
| Cash flows from investing activities: |
||||||||||||
| Purchases of certificates of deposit |
(22,650 | ) | (80,423 | ) | (26,562 | ) | ||||||
| Maturities of certificates of deposit |
35,130 | 99,162 | 12,500 | |||||||||
| Activity in securities available for sale: |
||||||||||||
| Redemption (purchase) of mutual funds, net |
(8 | ) | 123 | 19,882 | ||||||||
| Proceeds from sales |
— | 782 | — | |||||||||
| Proceeds from maturities |
5,000 | 25,000 | — | |||||||||
| Purchases |
— | (600 | ) | (5,009 | ) | |||||||
| Cash paid as purchase price of acquisition |
(17,805 | ) | — | — | ||||||||
| Principal payments on ESOP loan receivable |
667 | 646 | 626 | |||||||||
|
|
|
|
|
|
|
|||||||
| Net cash provided by investing activities |
334 | 44,690 | 1,437 | |||||||||
|
|
|
|
|
|
|
|||||||
| Cash flows from financing activities: |
||||||||||||
| Cash dividends paid on common stock |
(7,665 | ) | (6,148 | ) | (1,462 | ) | ||||||
| Repurchase of common stock |
— | (18,799 | ) | (9,428 | ) | |||||||
| Stock options exercised |
501 | 205 | 232 | |||||||||
|
|
|
|
|
|
|
|||||||
| Net cash used by financing activities |
(7,164 | ) | (24,742 | ) | (10,658 | ) | ||||||
|
|
|
|
|
|
|
|||||||
| Net change in cash and cash equivalents |
(11,541 | ) | 21,100 | (7,742 | ) | |||||||
| Cash and cash equivalents at beginning of year |
34,613 | 13,513 | 21,255 | |||||||||
|
|
|
|
|
|
|
|||||||
| Cash and cash equivalents at end of year |
$ | 23,072 | $ | 34,613 | $ | 13,513 | ||||||
|
|
|
|
|
|
|
|||||||
14. ACQUISITION
To enable the expansion of its core banking franchise in the Boston market area, the Company completed the acquisition of Meetinghouse Bancorp, Inc. (“Meetinghouse”), the holding company for Meetinghouse Bank, a Massachusetts stock co-operative bank, on December 29, 2017. The two Meetinghouse Bank branch offices became branch offices of the Bank. Pursuant to the merger agreement, the Company paid $26.00 in cash for each outstanding share of Meetinghouse common stock.
The Company accounted for the acquisition using the acquisition method. Accordingly, the Company recorded merger and acquisition expenses of $2.1 million for the year ended December 31, 2017. The acquisition
116
Table of Contents
NOTES TO CONSOLIDATED FINANCIAL STATEMENTS — (Continued)
method also requires an acquirer to recognize the assets acquired and the liabilities assumed at their fair values as of the acquisition date.
Goodwill of $6.0 million arising from the Meetinghouse acquisition consisted largely of synergies and cost savings resulting from combining the operations of the Company and Meetinghouse. The core deposit intangible of $3.2 million represents the fair value associated with the acquired non-maturity deposits.
The following is a summary of the estimated fair value of assets acquired and liabilities assumed as of the date of the acquisition:
| Amount | ||||
| (In thousands) | ||||
| Cash and due from banks |
$ | 15,800 | ||
| Securities available for sale, at fair value |
15,775 | |||
| Loans and loans held for sale, net |
75,708 | |||
| Premises and equipment, net |
1,314 | |||
| Goodwill |
5,951 | |||
| Core deposit intangible |
3,243 | |||
| Other assets |
2,625 | |||
|
|
|
|||
| Total assets acquired |
$ | 120,416 | ||
|
|
|
|||
| Deposits |
$ | 93,845 | ||
| Long-term debt |
8,193 | |||
| Accrued expenses and other liabilities |
573 | |||
|
|
|
|||
| Total liabilities assumed |
$ | 102,611 | ||
|
|
|
|||
| Purchase price |
$ | 17,805 | ||
|
|
|
|||
The loans acquired were recorded at fair value without a carryover of the allowance for loan losses. The fair value of the loans was determined by applying a market-based discount rate in estimating the amount and timing of both principal and interest cash flows expected to be collected, as adjusted for an estimate of future credit losses and prepayments. An overall discount on the loans acquired in this transaction was due to estimated credit risk, as well as considerations for liquidity and market interest rates. In addition, the acquired loans were reviewed to determine if the loan had evidence of deterioration of credit quality at the date of the acquisition and if it was probable that all contractually required payments will not be collected.
The fair value of the core deposit intangible was derived by comparing the interest rate and functional costs that Meetinghouse paid on its non-maturity deposits compared to the current market rate for alternative sources of financing, while factoring in estimates over the remaining life and attrition rate of the non-maturity deposit accounts. The core deposit intangible asset represents the stable and relatively low cost source of funds that the deposits and accompanying relationships provide the Bank when compared to alternative funding sources. The fair value of acquired non-maturity deposit accounts was assumed to approximate the carrying value as these accounts have no stated maturity and are payable on demand. The fair value of term certificates of deposit were determined based on the present value of the contractual cash flows over the remaining period to maturity using a market interest rate.
The fair value adjustments to assets acquired and liabilities assumed are generally amortized using either an effective yield or straight-line basis over periods consistent with the average life, useful life and/or contractual term of the related assets and liabilities. Loans acquired with deteriorated credit quality and related non-accretable discounts are immaterial.
117
Table of Contents
NOTES TO CONSOLIDATED FINANCIAL STATEMENTS — (Continued)
15. SELECTED QUARTERLY CONSOLIDATED FINANCIAL INFORMATION (Unaudited)
The selected quarterly financial data presented below should be read in conjunction with the Consolidated Financial Statements and related notes.
| Years Ended December 31, | ||||||||||||||||||||||||||||||||
| 2017 | 2016 | |||||||||||||||||||||||||||||||
| Fourth Quarter |
Third Quarter |
Second Quarter |
First Quarter |
Fourth Quarter |
Third Quarter |
Second Quarter |
First Quarter |
|||||||||||||||||||||||||
| (Dollars in thousands, except per share amounts) | ||||||||||||||||||||||||||||||||
| Interest and dividend income |
$ | 50,873 | $ | 47,970 | $ | 44,509 | $ | 41,752 | $ | 41,249 | $ | 38,420 | $ | 35,839 | $ | 34,184 | ||||||||||||||||
| Interest expense |
11,544 | 9,916 | 9,053 | 8,399 | 7,830 | 7,118 | 6,384 | 5,805 | ||||||||||||||||||||||||
|
|
|
|
|
|
|
|
|
|
|
|
|
|
|
|
|
|||||||||||||||||
| Net interest income |
39,329 | 38,054 | 35,456 | 33,353 | 33,419 | 31,302 | 29,455 | 28,379 | ||||||||||||||||||||||||
| Provision for loan losses (1) |
(715 | ) | 2,458 | 1,497 | 1,619 | 1,304 | 858 | 3,952 | 1,066 | |||||||||||||||||||||||
|
|
|
|
|
|
|
|
|
|
|
|
|
|
|
|
|
|||||||||||||||||
| Net interest income, after provision for loan losses |
40,044 | 35,596 | 33,959 | 31,734 | 32,115 | 30,444 | 25,503 | 27,313 | ||||||||||||||||||||||||
| Non-interest income (2) |
8,709 | 5,253 | 5,030 | 4,072 | 5,614 | 3,301 | 2,583 | 2,692 | ||||||||||||||||||||||||
| Non-interest expenses |
23,869 | 20,814 | 21,405 | 21,877 | 19,778 | 19,164 | 19,322 | 19,230 | ||||||||||||||||||||||||
|
|
|
|
|
|
|
|
|
|
|
|
|
|
|
|
|
|||||||||||||||||
| Income before income taxes |
24,884 | 20,035 | 17,584 | 13,929 | 17,951 | 14,581 | 8,764 | 10,775 | ||||||||||||||||||||||||
| Provision for income taxes (3) |
15,863 | 6,702 | 6,237 | 4,685 | 6,642 | 5,084 | 2,857 | 3,298 | ||||||||||||||||||||||||
|
|
|
|
|
|
|
|
|
|
|
|
|
|
|
|
|
|||||||||||||||||
| Net income |
$ | 9,021 | $ | 13,333 | $ | 11,347 | $ | 9,244 | $ | 11,309 | $ | 9,497 | $ | 5,907 | $ | 7,477 | ||||||||||||||||
|
|
|
|
|
|
|
|
|
|
|
|
|
|
|
|
|
|||||||||||||||||
| Earnings per share: |
||||||||||||||||||||||||||||||||
| Basic |
$ | 0.18 | $ | 0.26 | $ | 0.22 | $ | 0.18 | $ | 0.22 | $ | 0.19 | $ | 0.12 | $ | 0.14 | ||||||||||||||||
| Diluted |
$ | 0.17 | $ | 0.25 | $ | 0.22 | $ | 0.18 | $ | 0.22 | $ | 0.18 | $ | 0.11 | $ | 0.14 | ||||||||||||||||
| Weighted average shares: |
||||||||||||||||||||||||||||||||
| Basic |
51,425,793 | 51,229,203 | 51,003,967 | 50,949,634 | 50,940,037 | 50,982,633 | 51,026,985 | 51,569,683 | ||||||||||||||||||||||||
| Diluted |
53,026,141 | 52,672,962 | 52,422,486 | 52,526,737 | 52,102,511 | 52,093,009 | 52,137,475 | 52,663,921 | ||||||||||||||||||||||||
| (1) | The provision for loan losses for the fourth quarter of 2017 reflected lower expense primarily due to improvements in several asset quality factors and reduced levels of loan portfolio growth in the commercial loan categories during the quarter. For the second quarter of 2016, the provision for loan losses reflected higher expense primarily due to loan portfolio growth in the commercial loan categories during the quarter. |
| (2) | Non-interest income fluctuates each quarter primarily due to net securities gains. |
| (3) | The provision for income taxes for the fourth quarter of 2017 reflects the revaluation of the Company’s net deferred tax asset as a result of the enactment of the Tax Cuts and Jobs Act. |
118
Table of Contents
| ITEM 9. | CHANGES IN AND DISAGREEMENTS WITH ACCOUNTANTS ON ACCOUNTING AND FINANCIAL DISCLOSURE |
None.
| ITEM 9A. | CONTROLS AND PROCEDURES |
Conclusion Regarding the Effectiveness of Disclosure Controls and Procedures The Company’s management, including the Company’s principal executive officer and principal financial officer, have evaluated the effectiveness of the Company’s “disclosure controls and procedures,” as such term is defined in Rule 13a-15(e) promulgated under the Securities Exchange Act of 1934, as amended (the “Exchange Act”). Based upon their evaluation, the principal executive officer and principal financial officer concluded that, as of the end of the period covered by this report, the Company’s disclosure controls and procedures were effective for the purpose of ensuring that the information required to be disclosed in the reports that the Company files or submits under the Exchange Act with the Securities and Exchange Commission (the “SEC”) (1) is recorded, processed, summarized and reported within the time periods specified in the SEC’s rules and forms and (2) is accumulated and communicated to the Company’s management, including its principal executive and principal financial officers, or persons performing similar functions, as appropriate to allow timely decisions regarding required disclosure.
Changes in Internal Controls over Financial Reporting There have not been any changes in the Company’s internal control over financial reporting (as such term is defined in Rules 13a-15(f) and 15d-15(f) under the Exchange Act) during the fourth quarter that have materially affected, or are reasonably likely to materially affect, the Company’s internal control over financial reporting.
| ITEM 9B. | OTHER INFORMATION |
Not applicable.
119
Table of Contents
| ITEM 10. | DIRECTORS AND EXECUTIVE OFFICERS OF THE REGISTRANT AND CORPORATE GOVERNANCE |
The information in the Company’s definitive Proxy Statement, prepared for the 2018 Annual Meeting of Shareholders, which contains information concerning directors of the Company under the captions “Election of Directors” and “Information About the Board of Directors”; information concerning executive officers of the Company under the caption “Information About the Executive Officers”; information concerning the code of ethics, the audit committee and its composition and the audit committee financial expert under the caption “Corporate Governance;” and information concerning Section 16(a) compliance under the caption “Section 16(a) Beneficial Ownership Reporting Compliance” is incorporated herein by reference or will be filed by an amendment to this Annual Report.
A copy of the Company’s Code of Ethics and Business Conduct is available to stockholders on the Corporate Governance portion of the Investors Relations section on the Bank’s website at www.ebsb.com.
| ITEM 11. | EXECUTIVE COMPENSATION |
The information in the Company’s definitive Proxy Statement, prepared for the 2018 Annual Meeting of Shareholders, which contains information concerning this item, under the captions “Executive Compensation,” and “Compensation Committee Interlocks and Insider Participation,” is incorporated herein by reference or will be filed by an amendment to this Annual Report.
| ITEM 12. | SECURITY OWNERSHIP OF CERTAIN BENEFICIAL OWNERS AND MANAGEMENT AND RELATED STOCKHOLDER MATTERS |
The information in the Company’s definitive Proxy Statement, prepared for the 2018 Annual Meeting of Shareholders, which contains information concerning this item, under the caption “Stock Ownership” is incorporated herein by reference or will be filed by an amendment to this Annual Report.
Equity Compensation Plan Information
The following table provides information as of December 31, 2017, regarding shares outstanding and available for issuance under the Company’s equity compensation plan. Additional information regarding stock-based compensation is presented in Note 10, “Employee Benefit Plans” of the Notes to Consolidated Financial Statements within Part II, Item 8, “Financial Statements and Supplementary Data.” Other than our employee stock ownership plan, there are no equity compensation plans not approved by security holders.
| Plan Category |
(a) Number of Securities to be Issued Upon Exercise of Outstanding Options, Warrants and Rights |
(b) Weighted-Average Exercise Price of Outstanding Options, Warrants and Rights |
(c) Number of Securities Remaining Available for Future Issuance Under Equity Compensation Plans (excluding securities reflected in column (a)) |
|||||||||
| Equity compensation plans approved by security holders |
3,829,687 | $ | 10.43 | 1,717,689 | ||||||||
| Equity compensation plans not approved by security holders |
— | — | — | |||||||||
|
|
|
|
|
|
|
|||||||
| Total |
3,829,687 | $ | 10.43 | 1,717,689 | ||||||||
|
|
|
|
|
|
|
|||||||
| ITEM 13. | CERTAIN RELATIONSHIPS AND RELATED TRANSACTIONS, AND DIRECTOR INDEPENDENCE |
The “Transactions with Certain Related Persons” and information concerning directors independence of the Company under the caption “Election 1 – Election of Directors” section of the 2018 Proxy Statement is incorporated herein by reference or filed by an amendment to this Annual Report.
120
Table of Contents
Table of Contents
| ITEM 15. | EXHIBITS AND FINANCIAL STATEMENT SCHEDULES |
(a)(1) Financial Statements
The following documents are filed as part of this Form 10-K.
| (A) | Reports of Independent Registered Public Accounting Firm |
| (B) | Consolidated Balance Sheets — at December 31, 2017 and 2016 |
| (C) | Consolidated Statements of Net Income — Years ended December 31, 2017, 2016 and 2015 |
| (D) | Consolidated Statements of Comprehensive Income — Years ended December 31, 2017, 2016 and 2015 |
| (E) | Consolidated Statements of Changes in Stockholders’ Equity — Years ended December 31, 2017, 2016 and 2015 |
| (F) | Consolidated Statements of Cash Flows — Years ended December 31, 2017, 2016 and 2015 |
| (G) | Notes to Consolidated Financial Statements. |
| (a)(2) | Financial Statement Schedules |
None.
122
Table of Contents
(a)(3) Exhibits
123
Table of Contents
| ITEM 16. | FORM 10-K SUMMARY |
Not applicable.
124
Table of Contents
Pursuant to the requirements of Section 13 or 15(d) of the Securities Exchange Act of 1934, the Registrant has duly caused this report to be signed on its behalf by the undersigned, thereunto duly authorized.
| MERIDIAN BANCORP, INC. (Registrant) | ||||||
| Date: March 1, 2018 | By: | /s/ Richard J. Gavegnano | ||||
| Richard J. Gavegnano Chairman, President and Chief Executive Officer (Duly Authorized Representative) | ||||||
125
Table of Contents
Pursuant to the requirements of the Securities Exchange of 1934, this report has been signed below by the following persons on behalf of the Registrant and in the capacities and on the dates indicated.
| Signatures |
Title |
Date | ||
| /s/ Richard J. Gavegnano Richard J. Gavegnano |
Chairman, President and Chief Executive Officer (Principal Executive Officer) |
March 1, 2018 | ||
| /s/ Mark L. Abbate Mark L. Abbate |
Executive Vice President, Treasurer and Chief Financial Officer (Principal Financial and Accounting Officer) |
March 1, 2018 | ||
| /s/ Cynthia C. Carney Cynthia C. Carney |
Director | March 1, 2018 | ||
| /s/ Marilyn A. Censullo Marilyn A. Censullo |
Director | March 1, 2018 | ||
| /s/ Russell L. Chin Russell L. Chin |
Director | March 1, 2018 | ||
| /s/ Anna R. DiMaria Anna R. DiMaria |
Director | March 1, 2018 | ||
| /s/ Domenic A. Gambardella Domenic A. Gambardella |
Director | March 1, 2018 | ||
| /s/ Thomas J. Gunning Thomas J. Gunning |
Director | March 1, 2018 | ||
| /s/ Carl A. LaGreca Carl A. LaGreca |
Director | March 1, 2018 | ||
| /s/ Edward J. Merritt Edward J. Merritt |
Director | March 1, 2018 | ||
| /s/ Gregory F. Natalucci Gregory F. Natalucci |
Director | March 1, 2018 | ||
| /s/ James G. Sartori James G. Sartori |
Director | March 1, 2018 | ||
| /s/ Peter Scolaro Peter Scolaro |
Director | March 1, 2018 | ||
126