Attached files
| file | filename |
|---|---|
| EX-32.1 - EXHIBIT 32.1 - LIGAND PHARMACEUTICALS INC | lgnd_123117xexhibit321.htm |
| EX-10.60 - EXHIBIT 10.60 - LIGAND PHARMACEUTICALS INC | indemnificationagreement-d.htm |
| EX-31.2 - EXHIBIT 31.2 - LIGAND PHARMACEUTICALS INC | lgnd_123117xexhibit312.htm |
| EX-31.1 - EXHIBIT 31.1 - LIGAND PHARMACEUTICALS INC | lgnd_123117xexhibit311.htm |
| EX-23.2 - EXHIBIT 23.2 - LIGAND PHARMACEUTICALS INC | lgnd_123117xexhibit232.htm |
| EX-23.1 - EXHIBIT 23.1 - LIGAND PHARMACEUTICALS INC | lgnd_123117xexhibit231.htm |
| EX-21.1 - EXHIBIT 21.1 - LIGAND PHARMACEUTICALS INC | lgnd_123117xexhibit211.htm |
| EX-10.61 - EXHIBIT 10.61 - LIGAND PHARMACEUTICALS INC | indemnificationagreement-o.htm |
| EX-10.7 - EXHIBIT 10.7 - LIGAND PHARMACEUTICALS INC | lgnd-rsugrantnoticeperform.htm |
| EX-10.6 - EXHIBIT 10.6 - LIGAND PHARMACEUTICALS INC | formofrsugrantnoticeexhibi.htm |
| EX-4.1 - EXHIBIT 4.1 - LIGAND PHARMACEUTICALS INC | lgndexhibi41.htm |
UNITED STATES
SECURITIES AND EXCHANGE COMMISSION
Washington, D.C. 20549
_____________________________________________________________________________________________
FORM 10-K
_____________________________________________________________________________________________
x | ANNUAL REPORT PURSUANT TO SECTION 13 OR 15(d) OF THE SECURITIES EXCHANGE ACT OF 1934 |
OR
o | TRANSITION REPORT PURSUANT TO SECTION 13 OR 15(d) OF THE SECURITIES EXCHANGE ACT OF 1934 |
Commission File No. 001-33093
LIGAND PHARMACEUTICALS INCORPORATED
(Exact name of registrant as specified in its charter)
Delaware | 77-0160744 | |
(State or other jurisdiction of incorporation or organization) | (IRS Employer Identification No.) | |
3911 Sorrento Valley Boulevard, Suite 110 San Diego, CA | 92121 | |
(Address of Principal Executive Offices) | (Zip Code) | |
Registrant’s telephone number, including area code: (858) 550-7500
Securities registered pursuant to Section 12(b) of the Act:
Title of Each Class | Name of Each Exchange on Which Registered |
Common Stock, par value $.001 per share | The Nasdaq Global Market of The Nasdaq Stock Market LLC |
Preferred Share Purchase Rights | The Nasdaq Global Market of The Nasdaq Stock Market LLC |
Securities registered pursuant to Section 12(g) of the Act:
None
Indicate by check mark if the registrant is a well-known seasoned issuer, as defined in Rule 405 of the Securities Act. Yes x No o
Indicate by check mark if the registrant is not required to file reports pursuant to Section 13 or Section 15(d) of the Securities Exchange Act of 1934. Yes o No x
Indicate by check mark whether the registrant: (1) has filed all reports required to be filed by Section 13 or 15(d) of the Securities Exchange Act of 1934 during the preceding 12 months (or for such shorter period that the registrant was required to file such reports), and (2) has been subject to such filing requirements for the past 90 days. Yes x No o
Indicate by check mark whether the registrant has submitted electronically and posted on its corporate Web site, if any, every Interactive Data File required to be submitted and posted pursuant to Rule 405 of Regulation S-T (§ 232.405 of this chapter) during the preceding 12 months (or for such shorter period that the registrant was required to submit and post such files). Yes x No o
Indicate by check mark if disclosure of delinquent filers pursuant to Item 405 of Regulation S-K is not contained herein, and will not be contained, to the best of registrant’s knowledge, in definitive proxy or information statements incorporated by reference in Part III of this Form 10-K or any amendment to this Form 10-K. o
Indicate by check mark whether the registrant is a large accelerated filer, an accelerated filer, a non-accelerated filer, a smaller reporting company or an emerging growth company. See definition of “large accelerated filer,” “accelerated filer,” “smaller reporting company” and "emerging growth company" in Rule 12b-2 of the Exchange Act. (Check one):
Large Accelerated Filer x | Accelerated Filer o | Non-accelerated Filer o | Smaller reporting company o | Emerging growth company o | |
(Do not check if a smaller reporting company) | |||||
If an emerging growth company, indicate by check mark if the registrant has elected not to use the extended transition period for complying with any new or revised financial accounting standards provided pursuant to Section 13(a) of the Exchange Act. o
Indicate by check mark whether the registrant is a shell company (as defined in Exchange Act Rule 12b-2 of the Exchange Act). Yes o No x
The aggregate market value of the Registrant’s voting and non-voting stock held by non-affiliates was approximately $2.2 billion based on the last sales price of the Registrant’s Common Stock on the NASDAQ Global Market of the NASDAQ Stock Market LLC on June 30, 2017. For purposes of this calculation, shares of Common Stock held by directors, officers and 10% stockholders known to the Registrant have been deemed
to be owned by affiliates which should not be construed to indicate that any such person possesses the power, direct or indirect, to direct or cause the direction of the management or policies of the Registrant or that such person is controlled by or under common control with the Registrant.
As of February 26, 2018, the Registrant had 21,204,264 shares of Common Stock outstanding.
DOCUMENTS INCORPORATED BY REFERENCE
Portions of the Proxy Statement for the Registrant’s 2018 Annual Meeting of Stockholders to be filed with the Commission within 120 days of December 31, 2017 are incorporated by reference in Part III of this Annual Report on Form 10-K. With the exception of those portions that are specifically incorporated by reference in this Annual Report on Form 10-K, such Proxy Statement shall not be deemed filed as part of this Report or incorporated by reference herein.
Table of Contents
Part I | ||
Item 1. | ||
Item 1A. | ||
Item 1B. | ||
Item 2. | ||
Item 3. | ||
Item 4. | ||
Part II | ||
Item 5. | ||
Item 6. | ||
Item 7. | ||
Item 7A. | ||
Item 8. | ||
Item 9. | ||
Item 9A. | ||
Item 9B. | Other Information | |
Part III | ||
Item 10. | ||
Item 11. | ||
Item 12. | ||
Item 13. | ||
Item 14. | ||
Part IV | ||
Item 15. | ||
Item 16. | Form 10K - Summary | |
Signatures | ||
GLOSSARY OF TERMS AND ABBREVIATIONS | |
Abbreviation | Definition |
2019 Convertible Senior Notes | $245.0 million aggregate principal amount of convertible senior unsecured notes due 2019 |
ADHF | Acute decompensated heart failure |
ESPP | Employee Stock Purchase Plan, as amended and restated |
Amgen | Amgen, Inc. |
AML | Acute myeloid leukemia |
ANDA | Abbreviated New Drug Application |
API | Active pharmaceutical ingredient |
ASCT | Autologous Stem Cell Transplantation |
ASU | Accounting Standards Update |
Azure | Azure Biotech, Inc. |
Baxter | Baxter International, Inc. |
BMS | Bristol Myers Squibb |
Cardioxyl | Cardioxyl Pharmaceuticals, Inc. |
CFDA | China Food and Drug Administration |
CIT | Chemotherapy-induced thrombocytopenia |
Coherus Biosciences | Coherus Biosciences, Inc. |
CoM | Composition of Matter |
Company | Ligand Pharmaceuticals Incorporated, including subsidiaries |
COSO | Committee of Sponsoring Organizations of the Treadway Commission |
CRO | Contract Research Organization |
Crystal | Crystal Bioscience, Inc. |
CURx | CURx Pharmaceuticals, Inc. |
CVR | Contingent value right |
CyDex | CyDex Pharmaceuticals, Inc. |
DMF | Drug Master File |
Eli Lilly | Eli Lilly and Company |
EPOR | Erythropoietin receptor |
EU | European Union |
FASB | Financial Accounting Standards Board |
FDA | Food and Drug Administration |
FSGS | Focal segmental glomerulosclerosis |
GCSF | Granulocyte-colony stimulating factor |
Hovione | Hovione FarmCiencia |
IPR&D | In-Process Research and Development |
IRAK4 | Interleukin-1 Receptor Associated Kinase-4 |
ITP | Chronic immune (idiopathic) thrombocytopenic purpura |
IV | Intravenous |
Ligand | Ligand Pharmaceuticals Incorporated, including subsidiaries |
LSA | Loan and Security Agreement |
LTP | Liver-targeted prodrug |
Lundbeck | Lundbeck A/S |
MDS | Myelodysplastic syndromes |
Melinta | Melinta Therapeutics, Inc. |
Merck | Merck & Co., Inc. |
Merrimack | Merrimack Pharmaceuticals, Inc. |
MLA | Master License Agreement |
MRSA | Methicillin-resistant Staphylococcus aureu |
NASH | Non-alcoholic steatohepatitis |
NDA | New Drug Application |
NOLs | Net Operating Losses |
Novartis | Novartis AG |
OMT | Open Monoclonal Technology, Inc. |
Omthera | Omthera Pharmaceuticals, Inc. |
Orange Book | Publication identifying drug products approved by the FDA based on safety and effectiveness |
Par | Par Pharmaceutical, Inc. |
Pfizer | Pfizer Inc. |
PPD | Post-Partum Depression |
Retrophin | Retrophin Inc. |
SAA | Severe Aplastic Anemia |
SAGE | Sage Therapeutics, Inc. |
SARM | Selective Androgen Receptor Modulator |
Sedor | Sedor Pharmaceuticals, Inc., or RODES, Inc. |
Selexis | Selexis, SA |
Sermonix | Sermonix Pharmaceuticals, LLC |
Spectrum | Spectrum Pharmaceuticals, Inc. |
Takeda | Takeda Pharmaceuticals Company Limited |
Tax Act | The Tax Cuts and Jobs Act |
T2DM | Type 2 Diabetes Mellitis |
TG Therapeutics | TG Therapeutics, Inc. |
TPE | Third-party evidence |
TR-Beta | Thyroid hormone receptor beta |
VentiRx | VentiRx Pharmaceuticals Inc. |
VIE | Variable interest entity |
Viking | Viking Therapeutics |
Vireo | Vireo Health |
X-ALD | X-linked adrenoleukodystrophy |
Zydus Cadila | Zydus Cadila Healthcare Ltd |
PART I
Cautionary Note Regarding Forward-Looking Statements:
You should read the following together with the more detailed information regarding our company, our common stock and our financial statements and notes to those statements appearing elsewhere in this document.
This report contains forward-looking statements that involve a number of risks and uncertainties. Although our forward-looking statements reflect the good faith judgment of our management, these statements can only be based on facts and factors currently known by us. Consequently, these forward-looking statements are inherently subject to risks and uncertainties, and actual results and outcomes may differ materially from results and outcomes discussed in the forward-looking statements.
Forward-looking statements can be identified by the use of forward-looking words such as “believes,” “expects,” “may,” “will,” “plan,” “intends,” “estimates,” “would,” “continue,” “seeks,” “pro forma,” or “anticipates,” or other similar words (including their use in the negative), or by discussions of future matters such as those related to our future results of operations and financial position, royalties and milestones under license agreements, Capitsol material sales, product development, and product regulatory filings and approvals, and the timing thereof, as well as other statements that are not historical. You should be aware that the occurrence of any of the events discussed under the caption “Risk Factors” could negatively affect our results of operations and financial condition and the trading price of our stock.
The cautionary statements made in this report are intended to be applicable to all related forward-looking statements wherever they may appear in this report. We urge you not to place undue reliance on these forward-looking statements, which speak only as of the date of this report. Except as required by law, we assume no obligation to update our forward-looking statements, even if new information becomes available in the future. This caution is made under the safe harbor provisions of Section 21E of the Securities Exchange Act of 1934, as amended.
References to “Ligand Pharmaceuticals Incorporated,” “Ligand,” the “Company,” “we,” “our” and “us” include Ligand Pharmaceuticals Incorporated and our wholly-owned subsidiaries.
Trademarks
Our trademarks, trade names and service marks referenced herein include Ligand®, Captisol®, Captisol-enabled™, LTP technology™, OmniAb®, OmniMouse®, OmniRat®, OmniFlic® and OmniChickenTM. All other trademarks, trade names and service marks including BaxdelaTM, CarnexivTM, Conbriza®, Duavee®, Evomela®,Kyprolis®, Promacta®, Revolade®, SUREtechnology Platform™, Viviant®, Vivitra®, Bryxta®, and Exemptia® are the property of their respective owners. Use or display by us of other parties’ trademarks, trade dress or products is not intended to and does not imply a relationship with, or endorsement or sponsorship of, us by the trademark or trade dress owners.
1
Item 1. | Business |
Overview
We are a biopharmaceutical company focused on developing and acquiring technologies that help pharmaceutical companies discover and develop medicines. Over our more than 30 year history, we have employed research technologies such as nuclear receptor assays, high throughput computer screening, formulation science, liver targeted pro-drug technologies and antibody discovery technologies to assist companies in their work toward securing prescription drug approvals. We currently have partnerships and license agreements with over 95 pharmaceutical and biotechnology companies, and over 165 different programs under license with us are currently in various stages of commercialization and development. We have contributed novel research and technologies for approved medicines that treat cancer, osteoporosis, fungal infections and low blood platelets, among others. Our partners have programs currently in clinical development targeting seizure, coma, cancer, diabetes, cardiovascular disease, muscle wasting, liver disease, and kidney disease, among others. We have over 800 issued patents worldwide.
We have assembled our large portfolio of fully-funded programs either by licensing our own proprietary drug development programs, licensing our platform technologies such as Captisol or OmniAb to partners for use with their proprietary programs, or acquiring existing partnered programs from other companies. Fully-funded programs are those for which our partners pay all of the development and commercialization costs. For our internal programs, we generally plan to advance drug candidates through early-stage drug development or clinical proof-of-concept.
Our business model creates value for stockholders by providing a diversified portfolio of biotech and pharmaceutical product revenue streams that are supported by an efficient and low corporate cost structure. Our goal is to offer investors an opportunity to participate in the promise of the biotech industry in a profitable, diversified and lower-risk business than a typical biotech company. Our business model is based on doing what we do best: drug discovery, early-stage drug development, product reformulation and partnering. We partner with other pharmaceutical companies to leverage what they do best (late-stage development, regulatory management and commercialization) to ultimately generate our revenue. We believe that focusing on discovery and early-stage drug development while benefiting from our partners’ development and commercialization expertise will reduce our internal expenses and allow us to have a larger number of drug candidates progress to later stages of drug development.
Our revenue consists of three primary elements: royalties from commercialized products, license and milestone payments and sale of Captisol material. In addition to discovering and developing our own proprietary drugs, we selectively pursue acquisitions to bring in new assets, pipelines, and technologies to aid in generating additional potential new revenue streams.
2017 and Recent Major Business Highlights
Major Acquisitions
• | In October 2017, Ligand acquired Crystal Bioscience and its OmniChicken antibody discovery technology for $25 million in cash at closing, up to $10.5 million of success-based milestones and revenue sharing from existing licensees for a defined period. The acquisition initially added four Shots on Goal to Ligand’s portfolio, and the OmniChicken technology, with the potential be utilized by multiple current OmniAb partners as they seek to develop antibodies for difficult-to-address targets. |
Selected Late-Stage Clinical Developments
• | Sage Therapeutics announced positive top-line results from two Phase 3 trials of brexanolone in severe PPD and in moderate PPD. Sage plans to file an NDA with the FDA in 2018. |
• | Viking Therapeutics announced positive results from a 12-week, Phase 2 clinical trial of VK5211 in patients who recently suffered a hip fracture. Top-line data demonstrated statistically significant, dose-dependent increases in lean body mass ranging from 4.8% to 9.1% following treatment with VK5211. Viking intends to present additional results from the study at an upcoming scientific conference. |
• | Retrophin presented new data from the open-label extension portion of the Phase 2 DUET study of sparsentan for the treatment of FSGS at the American Society of Nephrology Kidney Week 2017. Retrophin also announced that it is |
2
conducting feasibility analyses and engaging regulatory agencies with the expectation of initiating a clinical trial for sparsentan in IgA nephropathy (IgAN), an immune-complex mediated glomerulonephritis, in 2018.
• | Merrimack announced that it had enrolled the last patient in the ongoing CARRIE study, a Phase 2, double-blind, placebo-controlled, randomized trial evaluating MM-141 (istiratumab) in combination with standard of care in previously untreated patients with metastatic pancreatic cancer. |
• | Marinus Pharmaceuticals announced that it had initiated a Phase 2 double-blind, placebo-controlled clinical trial to evaluate the safety, efficacy and pharmacokinetics of ganaxolone IV in women diagnosed with severe postpartum depression. |
• | Exelixis announced that Daiichi Sankyo reported positive top-line results from a Phase 3 pivotal trial of esaxerenone in patients with essential hypertension in Japan and that a Japanese regulatory application is expected to be submitted in 2018. |
• | Takeda Pharmaceuticals announced the Phase 3 initiation of pevonedistat plus Azacitidine versus single-agent azacitidine as first-line treatment for patients with higher-risk myelodysplastic syndromes, chronic myelomonocytic leukemia, or low-blast acute myelogenous leukemia. |
• | Aldeyra announced the following for reproxalap (ADX-102): |
◦ | The last patient had completed dosing in their multicenter, double-blind, randomized Phase 2b clinical trial of reproxalap (ADX-102) in allergic conjunctivitis; |
◦ | Enrollment of the first patient in a Phase 2b clinical trial of topical ocular reproxalap for the treatment of dry eye disease; |
◦ | Presentation of data from its Phase 2 clinical trial of reproxalap in noninfectious anterior uveitis at the American Uveitis Society Fall Meeting. |
• | Opthea announced the dosing of the first patient in the Phase 2b trial of OPT-302 for wet age-related macular degeneration (AMD) and the commencement a Phase 1b/2a trial evaluating the safety and efficacy of OPT-302 in patients with center-involved diabetic macular edema. |
• | Merck announced it stopped the Phase 2/3 EPOCH and Phase 3 APECS studies evaluating verubecestat in people with mild-to-moderate and prodromal Alzheimer’s disease due to the conclusion that the efficacy endpoint could not be achieved. |
Selected Regulatory Developments
• | Melinta Therapeutics announced that the FDA approved both IV and oral Baxdela™ (delafloxacin) for the treatment of adults with acute bacterial skin and skin structure infections (ABSSSI) caused by susceptible bacteria. As a result of the approval, Ligand earned a $1.5 million milestone payment and will earn a 2.5% royalty on Baxdela IV sales. Following approval, Melinta Therapeutics entered into a $90 million loan and securities financing agreement with Oberland Capital Management, LLC to fund commercialization activities and indication expansion of Baxdela. |
• | CASI Pharmaceuticals announced that China’s Food and Drug Administration granted priority review for CASI’s import drug registration clinical trial application for EVOMELA. |
• | Zydus Cadila announced that it received approval to market its bevacizumab biosimilar in India and subsequently launched the drug, which is marketed as Bryxta. |
• | CStone Pharmaceuticals announced that it received Clinical Trial Application approval from the China Food and Drug Administration to conduct clinical trials in China with CS1001, an OmniAb-derived full-length anti-PDL1 monoclonal antibody. |
• | Janssen filed an IND application for an antibody discovered using Ligand’s OmniAb technology. The IND filing resulted in a $1 million milestone payment to Ligand. Janssen has a royalty-free license to the OmniAb technology (entered into with OMT in October of 2013), but will potentially pay Ligand further development and commercial milestones upon clinical success and regulatory approval of any therapeutic developed using the OmniAb technology. |
• | Novartis announced that Promacta received Breakthrough Therapy designation for first-line use in SAA from the FDA. |
• | Amgen announced at ASH in December and published in the Journal of Clinical Oncology in January the positive overall survival results of the Kyprolis ASPIRE trial. Amgen has submitted the data to the FDA for inclusion in the label. |
• | Amgen announced that the overall survival data from the ENDEAVOR trial was added to the Kyprolis label. |
Disclosed Licensing Deals Entered into or Expanded
OmniAb Technology
• | Worldwide license agreements with Surface Oncology, xCella Biosciences, Ferring Pharmaceuticals and Glenmark Pharmaceuticals to use the OmniAb platform technologies to discover fully human antibodies. Ligand is eligible to |
3
receive annual access payments, milestone payments and royalties on future net sales of any antibodies discovered under these licenses.
• | Worldwide platform license agreement with bluebird bio, Inc. Under the license, bluebird will be able to use the OmniRat®, OmniMouse® and OmniFlic® platforms to discover fully human mono- and bispecific antibodies and antibody fragments. Ligand is eligible to receive annual platform access payments, development milestone payments and royalties for each product incorporating an OmniAb antibody. Ligand previously disclosed rights to a single-antibody partnership had been licensed to bluebird, but this new agreement gives bluebird full access to the OmniAb platform. |
• | Receipt of a $2 million payment from WuXi Biologics subsequent to their licensing of exclusive rights to the anti-PD-1 antibody GLS-010 to Arcus Biosciences in North America, Europe, Japan and certain other territories. Ligand is also entitled to future milestones and royalties from this antibody. |
Captisol Technology
• | Commercial license and supply agreement with Amgen granting rights to use Captisol in the formulation of AMG 330, an anti-CD33 x anti-CD3 (BiTE®) bispecific antibody construct. Ligand is eligible to receive milestone payments, royalties and revenue from Captisol material sales related to AMG 330. |
• | Commercial license and supply agreement with Marinus Pharmaceuticals granting rights to use Captisol in the formulation of IV ganaxolone. Ligand is entitled to milestone payments, royalties and revenue from Captisol material sales related to IV ganaxolone. |
• | Commercial license and supply agreement with Interventional AnalgesiX granting rights to use Captisol in the formulation of an undisclosed compound. Ligand is eligible to receive milestone payments, tiered royalties of 5%-10% and revenue from Captisol material sales. |
• | Commercial license and supply agreements with both Par Pharmaceuticals and Meridian Labs granting each rights to use Captisol in the formulation of separate undisclosed compounds. |
• | Captisol Clinical Use Agreements with Eisai, Syros Pharmaceuticals and Vaxxas Inc. |
New Chemical Entities
• | Expansion of Ligand’s license with Sermonix Pharmaceuticals to include worldwide rights to develop and commercialize oral lasofoxifene. Ligand originally licensed U.S. rights to oral lasofoxifene to Sermonix in February of 2015, and expanded the agreement to include the rest of the world. Ligand is entitled to commercial milestones and royalties on net sales ranging from 6-10% upon commercialization of oral lasofoxifene. |
Internal Pipeline Highlights
• | Ligand announced positive top-line results from its Phase 2 clinical study evaluating the efficacy and safety of LGD-6972, as an adjunct to diet and exercise, in subjects with T2DM inadequately controlled on metformin monotherapy. The study achieved statistical significance (p < 0.0001) in the primary endpoint of change from baseline in hemoglobin A1c (HbA1c) after 12 weeks of treatment at all doses tested, demonstrating a robust, dose-dependent reduction in HbA1c of 0.90%, 0.92% and 1.20% with 5 mg, 10 mg and 15 mg of LGD-6972, respectively, compared to a 0.15% reduction with placebo. LGD-6972 was safe and well tolerated, with no drug-related serious adverse events and no dose-dependent changes in lipids (including total cholesterol, LDL cholesterol, HDL cholesterol and triglycerides), body weight or blood pressure after 12 weeks of treatment. |
• | Ligand announced initiation of an internally-funded program to develop contrast agents with reduced renal toxicity for diagnostic imaging procedures through proof-of-concept, followed by sale or out-license for further development and commercialization. This development program will leverage Ligand’s Captisol technology, as well as intellectual property obtained through its acquisition of Verrow Pharmaceuticals for $2 million in cash plus earn outs. |
Technologies
A variety of technology platforms that enable elements of drug discovery or development form the basis of our portfolio of fully-funded Shots on Goal. Platform technologies or individual drugs discovered by Ligand are related to a broad estate of intellectual property that includes over 800 issued patents.
4
OmniAb Technologies
Our OmniAb technology includes our OmniRat, OmniMouse, OmniFlic and OmniChicken technology platforms for use in discovering fully human antibodies. These platforms consist of genetically-engineered transgenic rodents that produce a broadly diversified repertoire of antibodies and enable novel fully-human antibody drug discovery and development by our OmniAb partners. Fully-human OmniAb antibodies provide advantages to our partners in that fully-human antibodies have reduced immunogenicity, streamline development timelines and costs, and accelerate novel antibody discovery. The OmniChicken platform consists of genetically-engineered transgenic chickens which enable the generation of novel antibodies against targets that are not immunogenic in mammals like mice and rats, the core species of Ligand’s existing OmniAb platform. Currently, more than 30 partners are utilizing OmniAb animals in their drug discovery and development efforts. incoLigand acquired these technologies through the acquisition of OMT in January 2016 and Crystal in October 2017
Captisol Technology
Captisol is Ligand’s patented, uniquely-modified cyclodextrin that is specifically designed to maximize safety, while improving the solubility, stability and bioavailability of APIs. Captisol can enable faster and more efficient development paths for our partners, given its known regulatory acceptance. Ligand maintains both Type IV and Type V DMFs with the FDA. These DMFs contain manufacturing and safety information relating to Captisol that our licensees can reference when developing Captisol-enabled drugs. Ligand also filed a DMF in Japan in 2015. Captisol-enabled drugs are marketed in more than 60 countries, and over 45 partners have Captisol-enabled drugs in development.
LTP Technology Platform
The LTP Technology platform is a novel prodrug technology designed to selectively deliver a broad range of pharmaceutical agents to the liver. A prodrug is a biologically inactive compound that can be metabolized in the body to produce an active drug. The LTP Technology works by chemically modifying biologically active molecules into an inactive prodrug, which will be administered to a patient and later activated by specific enzymes in the liver. The technology can be used to improve the safety and/or activity of existing drugs, develop new agents to treat certain liver-related diseases, and treat diseases caused by imbalances of circulating molecules that are controlled by the liver. The technology is especially applicable to metabolic and cardiovascular indications, among others. Currently 3 partners are utilizing the LTP Technology or related platform(s).
SUREtechnology Platform (owned by Selexis)
Ligand acquired economic rights to over 30 SUREtechnology Platform programs from Selexis in two separate transactions in 2013 and 2015, granting Ligand rights to downstream economics on novel biologics and biosimilars programs. The SUREtechnology Platform, developed and owned by Selexis, is a novel technology that improves the way that cells are utilized in the development and manufacturing of recombinant proteins and drugs. The technology is based on novel DNA-based elements that control the dynamic organization of chromatin within mammalian cells and allow for higher and more stable expression of recombinant proteins. The technology creates advantages over traditional approaches including accelerated development and manufacturing times, high yields and increased compound stability.
5
Partners and Licensees
The following table lists our disclosed partners and licensees.
Big Pharma | Ticker | Generics | Ticker | Biotech, continued | Ticker | ||
Baxter | BAX | Alvogen | Private | Gilead Sciences | GILD | ||
BMS | BMY | Avion | Private | Hanall | 9420 | ||
Boehringer Ingelheim | Private | Beloteca | Private | Harbour | Private | ||
Daiichi Sankyo | DSKY | BioCad | Private | Interventional Analgesix | Private | ||
Eli Lilly | LLY | Coherus | CHRS | J-Pharma | Private | ||
GSK | GSK | Gedeon Richter | GEDSF | Marinus | MRNS | ||
Janssen | JNJ | IBC Generium | Private | MEI | MEIP | ||
Merck | MRK | Oncobiologics | ONS | Melinta | MLNT | ||
Merck KGaA | MRK.DE | Par Pharmaceuticals | PRX | Meridian Labs | Private | ||
Novartis | NVS | Zydus Cadila | CADILAHC | Millennium | 4502 | ||
Otsuka | 4768 | Merrimack | MACK | ||||
Pfizer | PFE | Biotech | Ticker | Nucorion | Private | ||
Takeda | 4502 | ABBA | Private | Opthea | OPT | ||
Teva | TEVA | Abbvie | ABBV | Precision Biologics | Private | ||
Achaogen | AKAO | Retrophin | RTRX | ||||
Specialty Pharma | Ticker | AiCuris | Private | Roivant | Private | ||
Aziyo | Private | Aldeyra | ALDX | SAGE | SAGE | ||
CorMatrix | Private | Alexo | Private | Seattle Genetics | SGEN | ||
Cuda | Private | Amgen | AMGN | Seelos | Private | ||
Eisai | 4523 | Arcus | Private | Surface Oncology | Private | ||
Glenmark | GLENMARK | ARMO | ARMO | Symphogen | Private | ||
Gloria | 002437 | Azure | Private | Syros | SYRS | ||
Hikma | HIK | bluebird bio | BLUE | Teneobio | Private | ||
Lundbeck | LUN | Celgene | CELG | Tetragenics | Private | ||
Ono | 4528 | Chiva | Private | TG Therapeutics | TGTX | ||
Sedor | Private | CSL | CSL | Tizona | Private | ||
Sermonix | Private | C-Stone | Private | Vaxxas | Private | ||
Shire | SHPG | CURx | Private | VentiRx | Private | ||
Spectrum | SPPI | Aptevo | APVO | Vertex | VRTX | ||
Vireo Health | Private | Exelixis | EXEL | Viking | VKTX | ||
Upsher-Smith | Private | Ferring | Private | xCella | Private | ||
Five Prime | FRPX | XTL Bio | XTLB | ||||
ForSight Vision | Private | WuXi | 2269 | ||||
F-Star | Private | ||||||
Genmab | GEN | ||||||
Genekey Biotech | Private | ||||||
6
Portfolio
We have a large portfolio of current and future potential revenue-generating programs, over 165 of which are fully-funded by our partners. In addition to the table below, we also have more than 48 undisclosed programs.
Approved | ||||||||
Blood Disorders | Cardiovascular | CNS | ||||||
Novartis | Promacta | Baxter | Nexterone | Lundbeck | Carnexiv | |||
Cancer | Medical Device/Cardiology | |||||||
Amgen | Kyprolis | Zydus Cadila | Vivitra | Aziyo Base Business | Aziyo | |||
Spectrum | Evomela | Zydus Cadila | Bryxta | Cangaroo Envelope | Aziyo | |||
Infectious Disease | Inflammatory/Metabolic | |||||||
Alvogen | Voriconazole | Melinta | Baxdela | Pfizer | Viviant/Conbriza | |||
Hikma | Voriconazole | Par Pharmaceuticals | Posaconazole | Pfizer | Duavee | |||
Merck | Noxafil-IV | Pfizer | Vfend-IV | Zydus Cadila | Exemptia | |||
Phase 3 or Regulatory Submission Stage | ||||||||
Blood Disorders | Cardiovascular | Inflammatory/Metabolic | ||||||
Biocad | BCD-066 | Exelixis/Daiichi-Sankyo | CS-3150 | Coherus | CHS-0214 | |||
Cancer | CNS | |||||||
Oncobiologics | ONS-3010 | Takeda | Pevonedistat | SAGE | Brexanolone | |||
Oncobiologics | ONS-1045 | Sedor | CE-Fosphenytoin | |||||
Phase 2 | ||||||||
Blood Disorders | Infectious Disease | Inflammatory/Metabolic | ||||||
Novartis | KLM465 | Gilead | GS-5734 | Coherus | CHS-0214 | |||
Cancer | ||||||||
VentiRx Pharma | VTX-2337 | Merrimack Pharma | MM-121 | Novartis | Lubricin | |||
Eli Lilly | Merestinib | |||||||
Eli Lilly | Prexasertib | Merrimack Pharma | MM-141 | Precision Biologics | Ensituximab | |||
Cardiovascular | Other / Undisclosed | CNS | ||||||
Cardioxyl / BMS | CXL-1427 | Aldeyra Therapeutics | Reproxalab | Marinus Pharma | Ganaxalone IV | |||
Retrophin | Sparsentan | Opthea Ltd | OPT-302 | Seelos | Aplindore | |||
XTL Bio | hCDR1 | |||||||
7
Phase 1 | ||||||||
Cancer | ||||||||
Amgen | AMG-330 | Gloria | PD-1 | Meridian | ML-061 | |||
Chiva Pharma | MB07133 | IBC Generium | Deplera | Novartis | Mekinist POS | |||
C-Stone | PDL-1 | J-Pharma | JPH-203 (Injection) | Upsher-Smith | CXCR4 | |||
F-Star | F-102 | Janssen | BCMAxCD3 | VentiRx Pharma | VTX-1463 | |||
Gedeon Richter | Trastuzumab | MEI Pharma | ME-344 | |||||
Infectious Disease | Cardiovascular | CNS | ||||||
Chiva Pharma | Pradefovir | IBC Generium | GNR-008 | Cuda Pharma | Cudafol | |||
Otsuka | OPC-108459 | CURx Pharma | IV Topiramate | |||||
Inflammatory/Metabolic | Blood Disorders | |||||||
Gedeon Richter | RGB-03 | Hanall | anti-FcRN | Novartis | KLM465 | |||
Genekey Biotech | PCSK-9 | Takeda | TAK-020 | |||||
Pre-Clinical | ||||||||
Other / Undisclosed | ||||||||
ABBA | OmniAb | Ferring | OmniAb | Pfizer | OmniAb | |||
AbbVie | OmniAb | Five Prime Therapeutics | OmniAb | Seattle Genetics | OmniAb | |||
Achaogen | OmniAb | F-Star | OmniAb | Surface Oncology | OmniAb | |||
Alexo | OmniAb | Genmab | OmniAb | Symphogen | OmniAb | |||
Amgen | OmniAb | Gilead | OmniAb | Teneobio | OmniAb | |||
Aptevo | OmniAb | Glenmark | OmniAb | Tetragenics | OmniAb | |||
ARMO Biosciences | OmniAb | Hanall Biopharma | OmniAb | Teva | OmniAb | |||
Avion | CE programs | Interventional Analgesix | CE-program | Tizona | OmniAb | |||
Bluebird | OmniAb | Janssen | OmniAb | WuXi | OmniAb | |||
Boehringer Ingelheim | OmniAb | Merck KGaA | OmniAb | xCella | OmniAb | |||
Celgene | OmniAb | Ono Pharmaceuticals | OmniAb | |||||
Inflammatory/Metabolic | ||||||||
Azure | Lasofoxifene | Roivant | anti-FcRN | Seelos | H3 Receptor Antagonist | |||
Harbour | anti-FcRN | Sedor | CE-Budesonide | Viking | DGAT-1 Inhibitor | |||
Omthera/AstraZeneca | LTP-O3FA | Seelos | CRTH2 Antagonist | Vireo Health | CE-Cannabinoids | |||
Infectious Disease | CNS | |||||||
AiCuris GmBH | Undisclosed | Beloteca | CE-Ziprasodone | SAGE | SAGE-689 | |||
Nucorion | NUC-101 | CURx Pharma | IV Lamotrigine | Seelos | CE-Acetaminophen | |||
Nucorion | NUC-202 | |||||||
Cancer | Blood Disorders | |||||||
Arcus | PD-1 | Viking | EPOR Agonist | |||||
Selected Commercial Programs
We have multiple programs under license with other companies that have products that are already being commercialized. The following programs represent components of our current portfolio of revenue-generating assets and potential for near-term growth in royalty and other revenue. For information about the royalties owed to Ligand for these programs, see “Royalties” later in this business section.
8
Promacta (Novartis)
We are party to a license agreement with Novartis related to Promacta, which is an oral medicine that increases the number of platelets in the blood. Platelets are one of the three components of blood and facilitate clotting in the blood. Individuals with low platelets can be at significant risk of bleeding or death. Because of the importance of having a sufficient number of platelets, Promacta has broad potential applicability to a number of medical situations where low platelets exist.
Promacta is currently approved for three indications: (1) the treatment of thrombocytopenia in adult and pediatric patients 1 year and older with ITP who have had an insufficient response to corticosteroids, immunoglobulins or splenectomy; (2) thrombocytopenia in patients with chronic hepatitis C to allow the initiation and maintenance of interferon-based therapy; and (3) patients with SAA who have had an insufficient response to immunosuppressive therapy. Promacta was initially approved in 2008, and the product has been generating royalty revenue for Ligand since 2009. Promacta is known as Revolade in the EU and other non-US markets.
Novartis has been and continues to pursue globalization of the brand and currently markets Promacta in multiple countries for the three approved indications. Specifically, ITP is currently approved in more than 100 countries, the Hepatitis C-related indication is currently approved in more than 50 countries, and the SAA indication is approved in more than 45 counties.
Beyond the currently-approved indications, Novartis is also performing or supporting development activities to expand the brand into new indications, including first-line use in SAA and oncology-related indications. As of February 2018, there are 24 open clinical trials related to Promacta (listed as recruiting or open, and not yet recruiting) on the clinicaltrials.gov website.
We are entitled to receive royalties related to Promacta during the life of the relevant patents or following patent expiry, at a reduced rate for ten years from the first commercial sale, whichever is longer, on a country-by-country basis. Novartis has listed a patent in the FDA’s, Orange Book for Promacta with an expiration date in 2029, and absent early termination for bankruptcy or material breach, the term of the agreement expires upon expiration of the obligation to pay royalties. There are no remaining milestones to be paid under the agreement.
Kyprolis (Amgen)
Ligand supplies Captisol to Amgen for use with carfilzomib, and granted Amgen an exclusive product-specific license under our patent rights with respect to Captisol. Kyprolis is formulated with Ligand’s Captisol technology and is approved in the U.S. for the following:
• | In combination with dexamethasone or with lenalidomide plus dexamethasone for the treatment of patients with relapsed or refractory multiple myeloma who have received one to three lines of therapy. |
• | As a single agent for the treatment of patients with relapsed or refractory multiple myeloma who have received one or more lines of therapy. |
Kyprolis is also approved in multiple countries outside the U.S. and Amgen continues to invest significantly in Kyprolis to further expand its label and geography. Amgen’s obligation to pay royalties does not expire until four years after the expiration of the last-to-expire patent covering Captisol. Our patents and applications relating to the Captisol component of Kyprolis are not expected to expire until 2033. Our agreement with Amgen may be terminated by either party in the event of material breach or bankruptcy, or unilaterally by Amgen with prior written notice, subject to certain surviving obligations. Absent early termination, the agreement will terminate upon expiration of the obligation to pay royalties. Under this agreement, we are entitled to receive remaining milestones of up to $2 million, revenue from clinical and commercial Captisol material sales and royalties on annual net sales of Kyprolis.
Evomela (Spectrum)
Ligand supplies Captisol to Spectrum for use with Evomela, which is a Captisol-enabled melphalan IV formulation. The FDA approved Evomela for use in two indications:
• | A high-dose conditioning treatment prior to ASCT in patients with multiple myeloma |
• | For the palliative treatment of patients with multiple myeloma for whom oral therapy is not appropriate |
9
Evomela has been granted Orphan Designation by the FDA for use as a high-dose conditioning regimen for patients with multiple myeloma undergoing ASCT. The Evomela formulation avoids the use of propylene glycol, which has been reported to cause renal and cardiac side-effects that limit the ability to deliver higher quantities of therapeutic compounds. The use of the Captisol technology to reformulate melphalan is anticipated to allow for longer administration durations and slower infusion rates, potentially enabling clinicians to safely achieve a higher dose intensity of pre-transplant chemotherapy.
Under the terms of the license agreement, we granted an exclusive license to Spectrum under our patent rights to Captisol relating to the product. We are eligible to receive over $50 million in potential milestone payments under this agreement and royalties on future net sales of the Captisol-enabled melphalan product. Spectrum’s obligation to pay royalties will expire at the end of the life of the relevant patents or when a competing product is launched, whichever is earlier, but in no event within ten years of the commercial launch. Our patents and applications relating to the Captisol component of melphalan are not expected to expire until 2033. Absent early termination, the agreement will terminate upon expiration of the obligation to pay royalties. The agreement may be terminated by either party for an uncured material breach or unilaterally by Spectrum by prior written notice.
Baxdela (Melinta)
Melinta’s Baxdela is a Captisol-enabled delafloxacin-IV that was approved by the FDA in June 2017 for the treatment of acute bacterial skin and skin structure infections. Delafloxacin is a novel hospital-focused fluoroquinolone antibiotic candidate with potency against a variety of disease-causing bacteria-gram-positives, gram-negatives, atypicals and anaerobes, including quinolone-resistant MRSA. Under the terms of the agreement, we may be entitled to regulatory milestones, as well as a royalty on potential future sales by Melinta, and revenue from Captisol material sales.
Nexterone (Baxter)
We have a license agreement with Baxter, related to Baxter's Nexterone, a Captisol-enabled formulation of amiodarone, which is marketed in the United States and Canada. We supply Captisol to Baxter for use in accordance with the terms of the license agreement under a separate supply agreement. Under the terms of the license agreement we will continue to earn milestone payments, royalties, and revenue from Captisol material sales. We are entitled to earn royalties on sales of Nexterone through early 2033.
Noxafil-IV (Merck)
We have a supply agreement with Merck related to Merck’s NOXAFIL-IV, a Captisol-enabled formulation of posaconazole for IV use. NOXAFIL-IV is marketed in the United States, EU and Canada. We receive our commercial compensation for this program through the sale of Captisol, and we do not receive a royalty on this program.
Carnexiv (Lundbeck)
Lundbeck's Carnexiv is a Captisol-enabled carbamazepine-IV that was approved by the FDA in October 2016. Carnexiv is indicated as replacement therapy for oral carbamazepine formulations, when oral administration is temporarily no feasible, in adults with certain seizure types. Under the terms of our agreement with Lundbeck, we may be entitled to development and regulatory milestones, royalties on potential future sales by Lundbeck and revenue from Captisol material sales. Lundbeck is responsible for all development costs related to the program.
Duavee or Duavive (bazedoxifene/conjugated estrogens) and Viviant/Conbriza (Pfizer)
Pfizer is marketing bazedoxifene under the brand names Viviant and Conbriza in various territories for the treatment of postmenopausal osteoporosis. Pfizer is responsible for the registration and worldwide marketing of bazedoxifene, a synthetic drug specifically designed to reduce the risk of osteoporotic fractures while also protecting uterine tissue. Pfizer has combined bazedoxifene with the active ingredient in Premarin to create a combination therapy for the treatment of post-menopausal symptoms in women. Pfizer is marketing the combination treatment under the brand names Duavee and Duavive in various territories. Net royalties on annual net sales of Viviant/Conbriza and Duavee/Duavive are each payable to us through the life of the relevant patents or ten years from the first commercial sale, whichever is longer, on a country by country basis.
10
Aziyo Portfolio (Aziyo)
Ligand receives a share of revenue from the currently marketed Aziyo portfolio of commercial pericardial repair and CanGaroo® Envelope extracellular matrix (ECM) products. In addition, Ligand has the potential to receive a share of revenue and potential milestones from the currently marketed CanGaroo® ECM Envelope for cardiac implantable electronic devices. Aziyo’s products are medical devices that are designed to permit the development and regrowth of human tissue.
Exemptia (Zydus Cadila)
Zydus Cadila’s Exemptia (adalimumab biosimilar) is marketed in India for autoimmune diseases. Zydus Cadila uses the Selexis technology platform for Exemptia. We are entitled to earn royalties on sales by Zydus Cadila for ten years following the first commercial sale.
Vivitra (Zydus Cadila)
Zydus Cadila’s Vivitra (trastuzumab biosimilar) is marketed in India for breast cancer. Zydus Cadila uses the Selexis technology platform for Vivitra. We are entitled to earn royalties on sales by Zydus Cadila for ten years following the first commercial sale.
Bryxta (Zydus Cadila)
Zydus Cadila’s Bryxta (bevacizumab biosimilar) is marketed in India for non-small cell lung cancer. Zydus Cadila uses the Selexis technology platform for Bryxta. We are entitled to earn royalties on sales by Zydus Cadila for ten years following the first commercial sale.
Summary of Selected Development-stage Programs
We have multiple fully-funded partnered programs that are either in or nearing the regulatory approval process, or given the area of research or value of the license terms we consider particularly noteworthy. We are eligible to receive milestone payments and royalties off of these programs. This list does not include all of our partnered programs. For information about the royalties owed to Ligand for these programs, see “Royalties” later in this business section. In the case of Captisol-related programs, we are also eligible to receive revenue for the sale of Captisol material supply.
Brexanolone-SAGE-547 (SAGE)
Our partner, SAGE, is developing novel medicines to treat life altering central nervous system disorders. In November 2017 SAGE announced positive top-line results from two Phase 3 clinical trials with its proprietary IV formulation of brexanolone (formerly SAGE-547); Study 202B in severe PPD and Study 202C in moderate PPD. SAGE believes these data will be sufficient to support submissions of regulatory applications seeking approval of brexanolone for PPD. SAGE has received Breakthrough Therapy Designation from the FDA and PRIority MEdicines (PRIME) designation by the EMA for SAGE-547 in PPD, which are intended to offer a potentially expedited development path and review for promising drug candidates. This includes increased interaction and guidance from the FDA and EMA. SAGE plans to file a NDA with the FDA in 2018. Ligand has the potential to receive milestone payments, royalties and revenue from Captisol material sales for Captisol-enabled programs. SAGE is responsible for all development costs related to the program.
Sparsentan (Retrophin)
Our partner, Retrophin, is developing sparsentan for orphan indications of severe kidney diseases, and has completed a Phase 2 clinical trial of sparsentan for the treatment of FSGS. Retrophin announced plans to initiate a single Phase 3 clinical trial to enable an NDA filing for sparsentan fo the treatment of FSGS. The trial will include an interim analysis of proteinura as a surrogate endpoint to serve as the basis for an NDA filing for Subpart H accelerated approval of sparsentan. Certain patient groups with severely compromised renal function, including those with FSGS, exhibit extreme proteinuria resulting in progression to dialysis and a high mortality rate. Sparsentan, with its unique dual blockade of angiotensin and endothelin receptors, is expected to provide meaningful clinical benefits in mitigating proteinuria in indications where there are no approved therapies.
Under our license agreement with Retrophin we are entitled to receive potential net milestones of over $75 million in the future and net royalties on future worldwide sales by Retrophin. The royalty term is expected to be 10 years following the first commercial sale. Retrophin is responsible for all development costs related to the program.
11
Prexasertib- LY2606368 (Eli Lilly)
Our partner, Eli Lilly is conducting Phase 2 clinical trials for Captisol-enabled LY2606368 (Chk 1/2 inhibitor) for solid tumors. Under the terms of the agreement, we may be entitled to regulatory milestones, royalties on potential future sales by Eli Lilly and revenue from Captisol material sales.
BMS986231 (BMS)
Our partner, BMS, is conducting Phase 2 clinical trials for Captisol-enabled CXL-1427 (nitroxyl donor prodrug) for ADHF. Under the terms of the agreement, we may be entitled to development and regulatory milestones, and royalties on potential future sales by BMS and revenue from Captisol material sales.
Lasofoxifene (Sermonix, and Azure Biotech)
Lasofoxifene is an estrogen partial agonist for osteoporosis treatment and other diseases, discovered through the research collaboration between us and Pfizer. Under the terms of the license agreement with Azure, we retained the rights to the oral formulation of lasofoxifene originally developed by Pfizer.
Our partner, Sermonix has a license for the development of oral lasofoxifene for the United States and additional territories. Under the terms of the agreement, we are entitled to receive up to $45 million in potential regulatory and commercial milestone payments as well as royalties on future net sales.
Our partner Azure is developing a novel formulation of lasofoxifene targeting an underserved market in women’s health. Under the terms of our agreement with Azure, we are entitled to receive up to $2.6 million in potential development and regulatory milestones as well as royalties on future net sales through the later of the life of the relevant patents (currently expected to be at least until 2027) or 10 years after regulatory approval. Azure may terminate the license agreement at any time upon six months’ prior notice.
TR-Beta - VK2809 (Viking)
Viking is developing VK2809, a novel selective TR-Beta agonist with potential in multiple indications, including hypercholesterolemia, dyslipidemia, NASH, and X-ALD. Viking initiated a Phase 2 trial for VK2809 in hypercholesterolemia and fatty liver disease in 2016 and expects primary outcome readout this year. Under the terms of the agreement with Viking, we may be entitled to up to $375 million of development, regulatory and commercial milestones and tiered royalties on potential future sales.
SARM - VK5211 (Viking)
Our partner, Viking, is developing VK5211, a novel, potentially best-in-class SARM for patients recovering from hip-fracture. SARMs retain the beneficial properties of androgens without undesired side-effects of steroids or other less selective androgens. Viking announced positive results from its Phase 2 trial in patients who suffered hip fracture in the fourth quarter of 2017. Under the terms of the agreement with Viking, we may be entitled to up to $270 million of development, regulatory and commercial milestones as well as tiered royalties on potential future sales.
Merestinib- LY2801653 (Eli Lilly)
Our partner, Eli Lilly is conducting Phase 2 clinical trials for Captisol-enabled merestinib (LY2801653, formerly known as c-Met inhibitor) for treatment of cancer. Under the terms of the agreement, we may be entitled to regulatory milestones, royalties on potential future sales by Eli Lilly and revenue from Captisol material sales.
Pevonedistat - MLN-4924 (Millennium/Takeda)
Our partner, Millennium/Takeda is currently conducting Phase 2 trials for the development of pevonedistat (MLN-4924) for the treatment of hematological malignancies and solid tumors. Pevonedistat is a Captisol-enabled Nedd8-Activating Enzyme Inhibitor. Under the terms of the clinical-stage agreement, we may be entitled to development milestones from Millennium/Takeda and revenue from Captisol material sales.
12
BCMAxCD3 (Janssen)
Our partner, Janssen, is developing a BCMAxCD3 antibody discovered with the OmniAb platform technology. Janssen is currently conducting a Phase I trial for cancer therapy. We are entitled to earn milestones based on the development of BCMAxCD3.
AM0001-PD-1 (ARMO Biosciences)
Our partner, ARMO Biosciences, is developing an anti-PD-1 antibody discovered with the OmniAb platform technology. AM0001+PD-1 is a therapeutic target for cancer therapy. We are entitled to earn regulatory milestones and royalties on future sales.
Seribantumab-MM-121 (Merrimack Pharmaceuticals)
Merrimack Pharmaceuticals is currently conducting a Phase 2 trial of seribantumab (MM-121) in patients with heregulin-positive, locally advanced or metastatic non-small cell lung cancer whose disease has progressed following immunotherapy. The FDA has granted fast track designation to facilitate and expedite the development. Seribantumab is an antibody-drug that targets ErbB3 that was developed using the Selexis SUREtechnology Platform. Under the terms of the agreement, we may be entitled to development and commercial milestones, royalties on potential future sales.
CHS-0214 (Coherus Biosciences)
Coherus Biosciences has conducted Phase 3 / MAA-enabling clinical trials for CHS-0214 (etanercept biosimilar) for rheumatoid arthritis and psoriasis. Coherus uses the Selexis’ technology platform for CHS-0214. We are entitled to earn regulatory and sales milestones, and royalties on potential future sales through at least 2026.
Reproxalab (Aldeyra)
Our partner, Aldeyra, is conducting a Phase 2 study for ADX-102 for the treatment of ocular inflammation. ADX-102 is a Captisol-enabled ophthalmic solution for the treatment of allergic conjunctivitis that could be active in a broad array of inflammatory ocular diseases. Under the terms of our agreement with Aldeyra, we are entitled to receive regulatory milestones and royalties on future sales.
Esaxerenone (Exelixis)
Our partner, Exelixis, entered into a collaboration agreement with Daiichi Sankyo and is conducting a Phase 3 pivotal trial (ESAX-HTN) to evaluate esaxerenone (CS-3150) versus eplerenone for essential hypertension in Japanese patients. Under the terms of the agreement with Exelixis, we are entitled to receive a royalty on future sales.
AMG-330 (Amgen)
Our licensee, Amgen, is developing AMG 330 for use in humans for a wide variety of therapeutic indications. Under the terms of the agreement, we are entitled to milestones and royalties on future sales of AMG 330 formulated with Captisol.
Ganaxalone IV (Marinus)
Our partner, Marinus, is preparing to initiate clinical trials with Captisol-enabled ganaxolone IV in patients with postpartum depression (PPD) and status epilepticus (SE). Marinus has exclusive worldwide rights to Captisol-enabled ganaxolone for use in humans.
APVO436 (Aptevo)
Our partner, Aptevo, is developing APVO436 for the treatment of acute myeloid leukemia. There is a high unmet medical need for targeted immunotherapies such as APVO436, that can potentially treat patients with relapsed or refractory disease, or patients who cannot tolerate traditional chemotherapy. Under the terms of the agreement with Aptevo, we are entitled to milestones and royalties on future sales.
13
Royalties
We have multiple programs under license with other companies that have products that are already being commercialized. In addition to the table below, we have generally described a typical Captisol and OmniAb royalty arrangement as low- to mid-single digit royalties. The following table represents substantially all of the disclosed information about our royalty arrangements:
Royalty Table
Ligand Licenses With Tiered Royalties, Tiers Disclosed* | ||||||||||
Promacta (Novartis) | Kyprolis (Amgen) | Duavee (Pfizer) | Viviant/Conbriza (Pfizer) | |||||||
< $100 million | 4.7% | < $250 million | 1.5% | <$400 million | 0.5% | <$400 million | 0.5% | |||
$100 to $200 million | 6.6% | $250 to $500 million | 2.0% | $400 million to $1.0 billion | 1.5% | $400 million to $1.0 billion | 1.5% | |||
$200 to $400 million | 7.5% | $500 to $750 million | 2.5% | >$1.0 billion | 2.5% | >$1.0 billion | 2.5% | |||
$400 million to $1.5 billion | 9.4% | >$750 million | 3.0% | |||||||
>$1.5 billion | 9.3% | |||||||||
CE-Topiramate (CURx) | CE-Budesonide (Sedor) | CE-Meloxicam (Sedor) | |||||
< $50 million | 6.0% | < $25 million | 8.0% | < $25 million | 8.0% | ||
$50 to $100 million | 6.8% | > $25 million | 10.0% | > $25 million | 10.0% | ||
>$100 million | 7.5% | ||||||
Ligand Licenses With Tiered Royalties, Tiers Undisclosed* | ||
Program | Licensee | Royalty Rate |
IRAK4 | TG Therapeutics | 6.0% - 9.5% |
CE-Lamotrigine | CURx | 4.0% - 7.0% |
Lasofoxifene | Sermonix | 6.0% - 10.0% |
FBPase Inhibitor (VK0612) | Viking | 7.5% - 9.5% |
SARM (VK5211) | Viking | 7.25% - 9.25% |
TR Beta (VK2809 and VK0214) | Viking | 3.5% - 7.5% |
Oral EPO | Viking | 4.5% - 8.5% |
DGAT-1 | Viking | 3.0% - 7.0% |
Various | Nucorion | 4.0%-9.0% |
Various | Seelos | 4.0%-10.0% |
14
Ligand Licenses With Fixed Royalties* | ||
Program | Licensee | Royalty Rate |
Evomela | Spectrum Pharma | 20% |
Baxdela | Melinta | 2.5% |
Brexalalone (SAGE-547) | SAGE | 3% |
Sparsentan | Retrophin | 9% |
CE-Fosphenytoin | Sedor | 11% |
Pradefovir | Chiva Pharma | 9% |
MB07133 | Chiva Pharma | 6% |
KLM465 | Novartis | 14.5% (6.5% in year one) |
Topical lasofoxifene | Azure Biotech | 5% |
MM-121 | Merrimack Pharma | <1.0% |
MM-141 | Merrimack Pharma | <1.0% |
ME-143 | MEI Pharma | Low single digit royalty |
ME-344 | MEI Pharma | Low single digit royalty |
Reproxalab | Aldeyra Therapeutics | Low single digit royalty |
*Royalty rates are shown net of sublicense payments. Royalty tier references for specific rates notated in the table are for up to and including the dollar amount referenced. Higher tiers are only applicable for the dollar ranges specified in the table.
Primary Internal Development Program - Glucagon Receptor Antagonist Program
We are currently developing a small molecule glucagon receptor antagonist for the treatment of T2 DM. Compounds that block the action of glucagon may reduce the hyperglycemia that is characteristic of the disease. Glucagon stimulates the production of glucose by the liver and its release into the blood stream. In diabetic patients, glucagon secretion is abnormally elevated and contributes to hyperglycemia in these patients. We announced results in 2016 from two Phase 1 clinical trials which demonstrated favorable safety, tolerability and pharmacokinetics in normal healthy volunteers and in subjects with T2 DM. The trial results also demonstrate a robust, dose-dependent reduction of fasting plasma glucose. In September 2017, we presented positive top-line results from a Phase 2 clinical study evaluating the efficacy and safety of LGD-6972, as an adjunct to diet and exercise, in subjects with T2DM inadequately controlled on metformin monotherapy. LGD-6972 was safe and well tolerated, with no drug-related serious adverse events and no dose dependent changes in lipids, body weight or blood pressure after 12 weeks of treatment.
15
The following table represents other internal programs eligible for further development funding, either through Ligand or a partner:
Program | Development Stage | Indication | ||
CCR1 Antagonist | Preclinical | Oncology | ||
CCR5 Antagonist | Preclinical | Anti-infective | ||
CE-Busulfan | Preclinical | Oncology | ||
CE-Cetirizine Injection | Preclinical | Allergy | ||
CE-Clopidogrel | Phase 3 | Anti-coagulant | ||
CE-Sertraline, Oral Concentrate | Phase 1 | Depression | ||
CE-Silymarin for Topical Formulation | Preclinical | Sun damage | ||
CE-Iohexol | Preclinical | Injectable diagnostic contrast agent | ||
FLT3 Kinase Inhibitors | Preclinical | Oncology | ||
GCSF Receptor Agonist | Preclinical | Blood disorders | ||
Liver Specific Glucokinase Activator | Preclinical | Diabetes | ||
LTP-statin | Preclinical | Dyslipidemia | ||
Manufacturing
We contract with a third party manufacturer, Hovione, for Captisol production. Hovione is a global supplier with over 50 years of experience in the development and manufacture of APIs and Drug Product Intermediates. Hovione operates FDA-inspected sites in the United States, Macau, Ireland and Portugal. Manufacturing operations for Captisol are currently performed at two sites, in both of Hovione's Portugal and Ireland facilities with distribution operations also performed from Hovione's Portugal and Ireland sites. Additionally, we also store and distribute Captisol from a subterranean warehouse controlled by Ligand and located in Kansas. We believe we maintain adequate inventory of Captisol to meet our current and future partner needs.
In the event of a Captisol supply interruption, we are permitted to designate and, with Hovione’s assistance, qualify one or more alternate suppliers. If the supply interruption continues beyond a designated period, we may terminate the agreement. In addition, if Hovione cannot supply our requirements of Captisol due to an uncured force majeure event, we may also obtain Captisol from a third party and have previously identified such parties.
The current term of the agreement with Hovione is through December 2024. The agreement will automatically renew for successive two year renewal terms unless either party gives written notice of its intention to terminate the agreement no less than two years prior to the expiration of the initial term or renewal term. In addition, either party may terminate the agreement for the uncured material breach or bankruptcy of the other party or an extended force majeure event. We may terminate the agreement for extended supply interruption, regulatory action related to Captisol or other specified events. We have ongoing minimum purchase commitments under the agreement.
For further discussion of these items, see below under “Item 7. Management’s Discussion and Analysis of Financial Condition and Results of Operations.”
Competition
Some of the drugs we and our licensees and partners are developing may compete with existing therapies or other drugs in development by other companies. Furthermore, academic institutions, government agencies and other public and private organizations conducting research may seek patent protection with respect to potentially competing products or technologies and may establish collaborative arrangements with our competitors.
Our Captisol business may face competition from other suppliers of similar cyclodextrin excipients or other technologies that are aimed to increase solubility or stability of APIs. Our OmniAb antibody technology faces competition from suppliers of other transgenic animal systems that are also available for antibody drug discovery.
Our competitive position also depends upon our ability to obtain patent protection or otherwise develop proprietary products or processes. For a discussion of the risks associated with competition, see below under “Item 1A. Risk Factors.”
16
Government Regulation
The research and development, manufacturing and marketing of pharmaceutical products are subject to regulation by numerous governmental authorities in the United States and other countries. We and our partners, depending on specific activities performed, are subject to these regulations. In the United States, pharmaceuticals are subject to regulation by both federal and various state authorities, including the FDA. The Federal Food, Drug and Cosmetic Act and the Public Health Service Act govern the testing, manufacture, safety, efficacy, labeling, storage, record keeping, approval, advertising and promotion of pharmaceutical products and there are often comparable regulations that apply at the state level. There are similar regulations in other countries as well. For both currently marketed and products in development, failure to comply with applicable regulatory requirements can, among other things, result in delays, the suspension of regulatory approvals, as well as possible civil and criminal sanctions. In addition, changes in existing regulations could have a material adverse effect on us or our partners. For a discussion of the risks associated with government regulations, see below under “Item 1A. Risk Factors.”
Patents and Proprietary Rights
We believe that patents and other proprietary rights are important to our business. Our policy is to file patent applications to protect technology, inventions and improvements to our inventions that are considered important to the development of our business. We also rely upon trade secrets, know-how, continuing technological innovations and licensing opportunities to develop and maintain our competitive position.
Patents are issued or pending for the following key products or product families. The scope and type of patent protection provided by each patent family is defined by the claims in the various patents. The nominal patent expiration dates have been provided. The actual patent term may vary by jurisdiction and depend on a number of factors including potential patent term adjustments, patent term extensions, and terminal disclaimers. For each product or product family, the patents and/or applications referred to are in force in at least the United States, and for most products and product families, the patents and/or applications are also in force in European jurisdictions, Japan and other jurisdictions.
Promacta
Patents covering Promacta are owned by Novartis. The United States patent listed in the FDA’s Orange Book relating to Promacta with the latest expiration date is not expected to expire until 2027. Six months of additional exclusivity has been granted due to pediatric studies conducted by GSK. The type of patent protection (e.g., composition of matter or use) for each patent listed in the Orange Book and the expiration date for each patent listed in the Orange Book are provided in the following table. In addition, certain related patents in the commercially important jurisdictions of Europe and Japan are identified in the following table.
17
Promacta | |||||
United States | Corresponding Foreign | ||||
Type of Protection | U.S. Patent No. | U.S. Expiration Date | Jurisdiction | Patent Number | Expiration Date‡ |
CoM / Use | 6,280,959 | 10/30/2018 | N/A | ||
CoM / Use | 7,160,870 | 11/20/2022 | EU | 1,864,981 | 5/24/2021 |
EU | 1,294,378 | 5/24/2021 | |||
Japan | 3,813,875 | 5/24/2021 | |||
Use | 7,332,481 | 5/24/2021 | EU | 1,889,838 | 5/24/2021 |
Japan | 4,546,919 | 5/24/2021 | |||
CoM / Use | 7,452,874 | 5/24/2021 | EU | 1,889,838 | 5/24/2021 |
Japan | 4,546,919 | 5/24/2021 | |||
CoM / Use | 7,473,686 | 5/24/2021 | EU | 1,864,981 | 5/24/2021 |
EU | 1,294,378 | 5/24/2021 | |||
Japan | 3,813,875 | 5/24/2021 | |||
CoM / Use | 7,547,719 | 7/13/2025 | EU | 1,534,390 | 5/21/2023 |
Japan | 4,612,414 | 5/21/2023 | |||
Use | 7,790,704 | 5/24/2021 | N/A | ||
Use | 7,795,293 | 5/21/2023 | N/A | ||
CoM / Use | 8,052,993 | 8/1/2027 | EU | 2,152,237 | 8/1/2027 |
Japan | 5,419,866 | 8/1/2027 | |||
Japan | 5,735,078 | 8/1/2027 | |||
CoM / Use | 8,052,994 | 8/1/2027 | EU | 2,152,237 | 8/1/2027 |
Japan | 5,419,866 | 8/1/2027 | |||
Japan | 5,735,078 | 8/1/2027 | |||
CoM / Use | 8,052,995 | 8/1/2027 | EU | 2,152,237 | 8/1/2027 |
Japan | 5,419,866 | 8/1/2027 | |||
Japan | 5,735,078 | 8/1/2027 | |||
CoM / Use | 8,062,665 | 8/1/2027 | EU | 2,152,237 | 8/1/2027 |
Japan | 5,419,866 | 8/1/2027 | |||
Japan | 5,735,078 | 8/1/2027 | |||
CoM / Use | 8,071,129 | 8/1/2027 | EU | 2,152,237 | 8/1/2027 |
Japan | 5,419,866 | 8/1/2027 | |||
Japan | 5,735,078 | 8/1/2027 | |||
CoM / Use | 8,828,430 | 8/1/2027 | EU | 2,152,237 | 8/1/2027 |
Japan | 5,419,866 | 8/1/2027 | |||
Japan | 5,735,078 | 8/1/2027 | |||
‡Expiration dates of European and Japanese patents are calculated as 20 years from the earliest nonprovisional filing date to which priority is claimed, and do not take into account extensions that are or may be available in these jurisdictions.
Kyprolis
Patents protecting Kyprolis include those owned by Amgen and those owned by us. The United States patent listed in the Orange Book relating to Kyprolis with the latest expiration date is not expected to expire until 2029. Patents and applications owned by Ligand relating to the Captisol component of Kyprolis are not expected to expire until 2033. The type of patent protection (e.g., composition of matter or use) for each patent listed in the Orange Book and the expiration dates for each patent listed in the Orange Book are provided in the following table. In addition, certain related patents in the commercially important jurisdictions of Europe and Japan are identified in the following table.
18
Kyprolis | |||||
United States | Corresponding Foreign | ||||
Type of Protection | U.S. Patent No. | U.S. Expiration Date | Jurisdiction | Patent Number | Expiration Date‡ |
CoM | 7,232,818 | 4/14/2025 | EU | 1,745,064 | 4/14/2025 |
Japan | 5,394,423 | 4/14/2025 | |||
CoM | 7,417,042 | 7/20/2026 | EU | 1,781,688 | 8/8/2025 |
Japan | 4,743,720 | 8/8/2025 | |||
Use | 7,491,704 | 4/14/2025 | EU | 1,745,064 | 4/14/2025 |
Japan | 5,394,423 | 4/14/2025 | |||
CoM | 7,737,112 | 12/7/2027 | EU | 1,819,353 | 12/7/2025 |
EU | 2,260,835 | 12/7/2025 | |||
EU | 2,261,236 | 12/7/2025 | |||
Japan | 4,990,155 | 12/7/2025 | |||
Japan | 5,108,509 | 5/9/2025 | |||
Use | 8,129,346 | 4/14/2025 | EU | 1,745,064 | 4/14/2025 |
Japan | 5,394,423 | 4/14/2025 | |||
CoM | 8,207,125 | 4/14/2025 | EU | 1,781,688 | 8/8/2025 |
Japan | 4,743,720 | 8/8/2025 | |||
CoM / Use | 8,207,126 | 4/14/2025 | N/A | ||
Use | 8,207,127 | 4/14/2025 | N/A | ||
CoM / Use | 8,207,297 | 4/14/2025 | N/A | ||
Use | 9,511,109 | 10/21/2029 | Japan | 5,675,629 | 10/21/2029 |
‡Expiration dates of European and Japanese patents are calculated as 20 years from the earliest nonprovisional filing date to which priority is claimed, and do not take into account extensions that are or may be available in these jurisdictions.
Captisol
Patents and pending patent applications covering Captisol are owned by us. Other patents and pending patent applications covering methods of making Captisol are owned by Ligand or by Pfizer. The patents covering the Captisol product, if issued, with the latest expiration date would not be set to expire until 2033 (see, e.g., U.S. Patent No. 9,493,582 (expires Feb. 27, 2033)). We also own several patents and pending patent applications covering drug products containing Captisol as a component. The type of patent protection (e.g., composition of matter or use) and the expiration dates for several issued patents covering Captisol are provided in the following table. In addition, certain related patents and applications in the commercially important jurisdictions of Europe and Japan are listed in the following table.
19
Captisol | |||||
United States | Corresponding Foreign | ||||
Type of Protection | U.S. Patent No. | U.S. Expiration Date | Jurisdiction | Patent Number | Expiration Date‡ |
CoM | 8,114,438 | 3/19/2028 | EU | 2,708,225 | pending |
Japan | 2015-163634 | pending | |||
CoM | 7,629,331 | 10/26/2025 | EU | 1,945,228 | 10/26/2025 |
EU | 2,335,707 | 10/26/2025 | |||
EU | 2,581,078 | 10/26/2025 | |||
Use | 8,049,003 | 12/19/2026 | EU | 2,583,668 | 10/26/2025 |
CoM | 8,846,901 | 10/26/2025 | EU | 1,945,228 | 10/26/2025 |
EU | 2,335,707 | 10/26/2025 | |||
EU | 2,581,078 | 10/26/2025 | |||
CoM | 8,829,182 | 10/26/2025 | EU | 1,945,228 | 10/26/2025 |
EU | 2,335,707 | 10/26/2025 | |||
EU | 2,581,078 | 10/26/2025 | |||
CoM / Use | 7,635,773 | 3/13/2029 | EU | 2,268,269 | pending |
Japan | 4,923,144 | 4/28/2029 | |||
Japan | 6,039,721 | 4/28/2029 | |||
Japan | 2016-216021 | pending | |||
CoM | 8,410,077 | 3/13/2029 | EU | 2,268,269 | pending |
Japan | 4,923,144 | 4/28/2029 | |||
Japan | 6,039,721 | 4/28/2029 | |||
Japan | 2016-216021 | pending | |||
CoM | 9,200,088 | 3/13/2029 | EU | 2,268,269 | pending |
Japan | 4,923,144 | 4/28/2029 | |||
Japan | 6,039,721 | 4/28/2029 | |||
Japan | 2016-216021 | pending | |||
CoM | 9,493,582 | 2/27/2033 | EU | 2,748,205 | pending |
Japan | 2016-166368 | pending | |||
‡ Expiration date of European and Japanese patents are calculated as 20 years from the earliest nonprovisional filing date to which priority is claimed, and do not take into account extensions that are or may be available in these jurisdictions.
Subject to compliance with the terms of the respective agreements, our rights to receive royalty payments under our licenses with our exclusive licensors typically extend for the life of the patents covering such developments. For a discussion of the risks associated with patent and proprietary rights, see below under “Item 1A. Risk Factors.”
OmniAb & OmniChicken
Ligand has received patent protection in 27 countries, including the United States, multiple countries throughout Europe, Japan and China (see selected cases listed in the table below) and has 19 patent applications pending worldwide. The patents and applications owned by Ligand are expected to expire between 2028 and 2033 and partners are able to use the OMT patented technology to generate novel antibodies, which may be entitled to additional patent protection.
20
OmniAb | |||||
United States | Corresponding Foreign | ||||
Type of Protection | U.S. Patent No. | U.S. Expiration Date | Jurisdiction | Patent Number | Expiration Date‡ |
EU | 2,152,880 | 5/30/2028 | |||
EU | 2,336,329 | 5/30/2028 | |||
CoM | 8,703,485 | 10/10/2031 | Japan | 5,823,690 | 5/30/2028 |
9,388,233 | 5/30/2028 | N/A | |||
Use | 8,907,157 | 5/30/2028 | N/A | ||
CoM / Use | 9,475,859 | 4/15/2034 | N/A | ||
OmniChicken | |||||
United States | Corresponding Foreign | ||||
Type of Protection | U.S. Patent No. | U.S. Expiration Date | Jurisdiction | Patent Number | Expiration Date‡ |
CoM/Use | 8,030,095 | 12/23/2029 | Europe | 2,271,657 | 3/2/2029 |
MoM | 8,415,173 | 3/2/2029 | Japan | 5,737,707 | 3/2/2029 |
CoM | 8,592,644 | 8/30/2030 | Japan | 5,756,802 | 8/11/2030 |
CoM | 9,404,125 | 12/29/2030 | |||
Use | 9,549,538 | 8/11/2030 | |||
CoM/MoM/Use | 8,865,462 | 5/8/2032 | N/A | ||
Com/MoM/Use | 9,644,178 | 1/7/2031 | |||
CoM | 9,380,769 | 5/23/2032 | Europe | 2,713,712 | 5/23/2032 |
CoM | 9,809,642 | 5/23/2032 | |||
CoM/Use | 9,394,372 | 10/16/2032 | N/A | ||
‡ Expiration date of European and Japanese patents are calculated as 20 years from the earliest nonprovisional filing date to which priority is claimed, and do not take into account extensions that are or may be available in these jurisdictions.
LGD-6972 (Glucagon Receptor Antagonist)
Patents and pending patent applications covering LGD-6972 are owned by Ligand. Patents covering various forms of LGD-6972, if issued, with the latest expiration date would not be expected to expire until 2039. The type of patent protection (e.g., composition of matter or use) and the expiration dates for several issued patents covering LGD-6972 are provided in the following table. In addition, certain related patents and applications in the commercially important jurisdictions of Europe and Japan are listed in the following table.
21
LGD-6972 | |||||
United States | Corresponding Foreign | ||||
Type of Protection | U.S. Patent No. | U.S. Expiration Date | Jurisdiction | Patent Number | Expiration Date‡ |
CoM | 8,710,236 | 2/11/2028 | EU | 2,129,654 | 2/11/2028 |
EU | 2,786,985 | pending | |||
Japan | 5,322,951 | 2/11/2028 | |||
Japan | 2015-196171 | pending | |||
CoM | 9,169,201 | 2/11/2028 | EU | 2,129,654 | 2/11/2028 |
EU | 2,786,985 | pending | |||
Japan | 5,322,951 | 2/11/2028 | |||
Japan | 2015-196171 | pending | |||
Use | 9,701,626 | 2/11/2028 | EU | 2,129,654 | 2/11/2028 |
EU | 2,786,985 | pending | |||
Japan | 5,322,951 | 2/11/2028 | |||
CoM / Use | 8,907,103 | 1/2/2031 | EU | 2,326,618 | 8/13/2029 |
EU | 2,799,428 | 8/13/2029 | |||
EU | 3,153,501 | pending | |||
Japan | 5,684,126 | 8/13/2029 | |||
Japan | 2016-251460 | pending | |||
Japan | 2018-006976 | pending | |||
Com | 9,783,494 | 8/13/2029 | EU | 2,326,618 | 8/13/2029 |
EU | 2,799,428 | 8/13/2029 | |||
EU | 3,153,501 | pending | |||
Japan | 5,684,126 | 8/13/2029 | |||
‡ Expiration date of European and Japanese patents are calculated as 20 years from the earliest nonprovisional filing date to which priority is claimed, and do not take into account extensions that are or may be available in these jurisdictions.
Human Resources
As of February 16, 2018, we had 39 full-time employees, of whom 25 are involved directly in scientific research and development activities.
Investor Information
Financial and other information about us is available on our website at www.ligand.com. We make available on our website copies of our Annual Report on Form 10-K, Quarterly Reports on Form 10-Q, current reports on Form 8-K and amendments to those reports filed or furnished pursuant to Section 13(a) or 15(d) of the Exchange Act as soon as reasonably practicable after we electronically file such material with, or furnish it to, the U.S. Securities and Exchange Commission, or SEC. In addition, we have previously filed registration statements and other documents with the SEC. Any document we file may be inspected, at the SEC’s public reference room at 100 F Street NE, Washington, DC 20549, or at the SEC’s internet address at www.sec.gov. These website addresses are not intended to function as hyperlinks, and the information contained in our website and in the SEC’s website is not intended to be a part of this filing. Information related to the operation of the SEC’s public reference room may be obtained by calling the SEC at 800-SEC-0330.
ITEM 1A. | RISK FACTORS |
The following is a summary description of some of the many risks we face in our business. You should carefully review these risks in evaluating our business, including the businesses of our subsidiaries. You should also consider the other information described in this report. Additional risk no presently known to us or that we currently deem immaterial also may impair our business.
22
Future revenue based on Promacta, Kyprolis and Evomela, as well as sales of our other products, may be lower than expected.
Novartis is obligated to pay us royalties on its sales of Promacta, and we receive revenue from Amgen based on both sales of Kyprolis and purchases of Captisol material for clinical and commercial uses. These payments are expected to be a substantial portion of our ongoing revenues for some time. In addition, we receive revenues based on sales of Evomela and other products. Any setback that may occur with respect to any of our partners' products, and in particular Promacta or Kyprolis, could significantly impair our operating results and/or reduce our revenue and the market price of our stock. Setbacks for the products could include problems with shipping, distribution, manufacturing, product safety, marketing, government regulation or reimbursement, licenses and approvals, intellectual property rights, competition with existing or new products and physician or patient acceptance of the products, as well as higher than expected total rebates, returns, discounts, or unfavorable exchange rates. These products also are or may become subject to generic competition.
Future revenue from sales of Captisol material to our license partners may be lower than expected.
Revenues from sales of Captisol material to our collaborative partners represent a significant portion of our current revenues. Any setback that may occur with respect to Captisol could significantly impair our operating results and/or reduce the market price of our stock. Setbacks for Captisol could include problems with shipping, distribution, manufacturing, product safety, marketing, government regulation or reimbursement, licenses and approvals, intellectual property rights, competition with existing or new products and physician or patient acceptance of the products using Captisol.
If products or product candidates incorporating Captisol material were to cause any unexpected adverse events, the perception of Captisol safety could be seriously harmed. If this were to occur, we may not be able to sell Captisol unless and until we are able to demonstrate that the adverse event was unrelated to Captisol, which we may not be able to do. Further, the FDA could require us to submit additional information for regulatory review or approval, including data from extensive safety testing or clinical testing of products using Captisol. This would be expensive and it may delay the marketing of Captisol-enabled products and receipt of revenue related to those products, which could significantly impair our operating results and/or reduce the market price of our stock.
We obtain Captisol from a sole source supplier, and if this supplier were to cease to be able, for any reason, to supply Captisol to us in the amounts we require, or decline to supply Captisol to us, we would be required to seek an alternative source, which could potentially take a considerable length of time and impact our revenue and customer relationships. We maintain inventory of Captisol, which has a five year shelf life, at three geographically dispersed storage locations in the United States and Europe. If we were to encounter problems maintaining our inventory, such as natural disasters, at one or more of these locations, it could lead to supply interruptions. While we believe we maintain adequate inventory of Captisol to meet our current and expected future partner needs, our estimates and projections for Captisol demand may be wrong and any supply interruptions could materially adversely impact our operating results.
We currently depend on our arrangements with our partners and licensees to sell products using our Captisol technology. These agreements generally provide that our partners may terminate the agreements at will. If our partners discontinue sales of products using Captisol, fail to obtain regulatory approval for products using Captisol, fail to satisfy their obligations under their agreements with us, or choose to utilize a generic form of Captisol should it become available, or if we are unable to establish new licensing and marketing relationships, our financial results and growth prospects would be materially affected. Furthermore, we maintain significant accounts receivable balances with certain customers purchasing Captisol materials, which may result in the concentration of credit risk. We generally do not require any collateral from our customers to secure payment of these accounts receivable. If any of our major customers were to default in the payment of their obligations to us, our business, operating results and cash flows could be adversely affected.
Further, under most of our Captisol outlicenses, the amount of royalties we receive will be reduced or will cease when the relevant patent expires. Our low-chloride patents and foreign equivalents are not expected to expire until 2033, our high purity patents and foreign equivalents, are not expected to expire until 2029 and our morphology patents and foreign equivalents, are not expected to expire until 2025, but the initially filed patents relating to Captisol expired starting in 2010 in the United States and in 2016 in most countries outside the United States. If our other intellectual property rights are not sufficient to prevent a generic form of Captisol from coming to market and if in such case our partners choose to terminate their agreements with us, our Captisol revenue may decrease significantly.
23
Third party intellectual property may prevent us or our partners from developing our potential products; our and our partners’ intellectual property may not prevent competition; and any intellectual property issues may be expensive and time consuming to resolve.
The manufacture, use or sale of our potential products or our licensees' products or potential products may infringe the patent rights of others. If others obtain patents with conflicting claims, we may be required to obtain licenses to those patents or to develop or obtain alternative technology. We may not be able to obtain any such licenses on acceptable terms, or at all. Any failure to obtain such licenses could delay or prevent us from pursuing the development or commercialization of our potential products.
Generally, our success will depend on our ability and the ability of our partners to obtain and maintain patents and other intellectual property rights for our and their potential products. Our patent position is uncertain and involves complex legal and technical questions for which legal principles are unresolved. Even if we or our partners do obtain patents, such patents may not adequately protect the technology we own or have licensed.
We permit our partners to list our patents that cover their branded products in the Orange Book. If a third party files an NDA or ANDA for a generic drug product that relies in whole or in part on studies contained in our partner’s NDA for their branded product, the third party will have the option to certify to the FDA that, in the opinion of that third party, the patents listed in the Orange Book for our partner’s branded product are invalid, unenforceable, or will not be infringed by the manufacture, use or sale of the third party’s generic drug product. A third party certification that a new product will not infringe Orange Book-listed patents, or that such patents are invalid, is called a paragraph IV patent certification. If the third party submits a paragraph IV patent certification to the FDA, a notice of the paragraph IV patent certification must be sent to the NDA owner and the owner of the patents that are subject to the paragraph IV patent certification notice once the third-party’s NDA or ANDA is accepted for filing by the FDA. A lawsuit may then be initiated to defend the patents identified in the notice. The filing of a patent infringement lawsuit within 45 days of the receipt of notice of a paragraph IV patent certification automatically prevents the FDA from approving the generic NDA or ANDA until the earlier of the expiration of a 30-month period, the expiration of the patents, the entry of a settlement order stating that the patents are invalid or not infringed, a decision in the infringement case that is favorable to the NDA or ANDA applicant, or such shorter or longer period as the court may order. If a patent infringement lawsuit is not initiated within the required 45-day period, the third-party’s NDA or ANDA will not be subject to the 30-month stay.
Several third-parties have challenged, and additional third parties may challenge, the patents covering our partner’s branded products, including Kyprolis and Evomela, which could result in the invalidation or unenforceability of some or all of the relevant patent claims. We may from time to time become party to litigation or other proceedings as a result of Paragraph IV certifications. For example, in November 2017, CyDex, our wholly owned subsidiary, received a paragraph IV certification from Teva Pharmaceuticals USA, Inc., Teva Pharmaceutical Industries Ltd. and Actavis, LLC (collectively “Teva”) alleging that certain of our patents related to Captisol were invalid, unenforceable and/or will not be infringed by Teva’s ANDA related to Spectrum Pharmaceuticals’ NDA for Evomela. On December 20, 2017, CyDex filed a complaint against Teva in the U.S. District Court for the District of Delaware, asserting that Teva’fs ANDA would infringe our patents.
Litigation or other proceedings to enforce or defend intellectual property rights are often very complex in nature, may be very expensive and time-consuming, may divert our management’s attention from our core business, and may result in unfavorable results that could adversely impact our ability to prevent third parties from competing with our partner’s products. Any adverse outcome of such litigation could result in one or more or our patents being held invalid or unenforceable, which could adversely affect our ability to successfully execute our business strategy and negatively impact our financial condition and results of operations. However, given the unpredictability inherent in litigation, we cannot predict or guarantee the outcome of these matters or any other litigation. Regardless of how these matters are ultimately resolved, these matters may be costly, time-consuming and distracting to our management, which could have a material adverse effect on our business.
In addition, periodic maintenance fees, renewal fees, annuity fees and various other governmental fees on patents and or applications will be due to the U.S. and various foreign patent offices at various points over the lifetime of our and our licensees’ patents and/or applications. We have systems in place to remind us to pay these fees, and we rely on our outside patent annuity service to pay these fees when due. Additionally, the U.S. and various foreign patent offices require compliance with a number of procedural, documentary, fee payment and other similar provisions during the patent application process. We employ reputable law firms and other professionals to help us comply, and in many cases, an inadvertent lapse can be cured by payment of a late fee or by other means in accordance with rules applicable to the particular jurisdiction. However, there are situations in which noncompliance can result in abandonment or lapse of the patent or patent application, resulting in partial or
complete loss of patent rights in the relevant jurisdiction. If such an event were to occur, it could have a material adverse effect on our business.
24
Any conflicts with the patent rights of others could significantly reduce the coverage of our patents or limit our ability to obtain meaningful patent protection. For example, our European patent related to Agglomerated forms of Captisol was limited during an opposition proceeding, and the rejection of our European patent application related to High Purity Captisol is currently being appealed. In addition, any determination that our patent rights are invalid may result in early termination of our agreements with our license partners and could adversely affect our ability to enter into new license agreements. We also rely on unpatented trade secrets and know-how to protect and maintain our competitive position. We require our employees, consultants, licensees and others to sign confidentiality agreements when they begin their relationship with us. These agreements may be breached, and we may not have adequate remedies for any breach. In addition, our competitors may independently discover our trade secrets.
We may also need to initiate litigation, which could be time-consuming and expensive, to enforce our proprietary rights or to determine the scope and validity of others' rights. If this occurs, a court may find our patents or those of our licensors invalid or may find that we have infringed on a competitor's rights. In addition, if any of our competitors have filed patent applications in the United States which claim technology we also have invented, the United States Patent and Trademark Office may require us to participate in expensive interference proceedings to determine who has the right to a patent for the technology.
The occurrence of any of the foregoing problems could be time-consuming and expensive and could adversely affect our financial position, liquidity and results of operations.
We rely heavily on licensee relationships, and any disputes or litigation with our partners or termination or breach of any of the related agreements could reduce the financial resources available to us, including milestone payments and future royalty revenues.
Our existing collaborations may not continue or be successful, and we may be unable to enter into future collaborative arrangements to develop and commercialize our unpartnered assets. Generally, our current collaborative partners also have the right to terminate their collaborations at will or under specified circumstances. If any of our collaborative partners breach or terminate their agreements with us or otherwise fail to conduct their collaborative activities successfully (for example, by not making required payments when due, or at all), our product development under these agreements will be delayed or terminated. Disputes or litigation may also arise with our collaborators (with us and/or with one or more third parties), including those over ownership rights to intellectual property, know-how or technologies developed with our collaborators. For example, we are asserting our rights to receive payment against one of our collaborative partners which could harm our relationship with such partner. Such disputes or litigation could adversely affect our rights to one or more of our product candidates and could delay, interrupt or terminate the collaborative research, development and commercialization of certain potential products, create uncertainty as to ownership rights of intellectual property, or could result in litigation or arbitration. In addition, a significant downturn or deterioration in the business or financial condition of our collaborators or partners could result in a loss of expected revenue and our expected returns on investment. The occurrence of any of these problems could be time-consuming and expensive and could adversely affect our business.
Our product candidates, and the product candidates of our partners, face significant development and regulatory hurdles prior to partnering and/or marketing which could delay or prevent licensing, sales-based royalties and/or milestone revenue.
Before we or our partners obtain the approvals necessary to sell any of our unpartnered assets or partnered programs, we must show through preclinical studies and human testing that each potential product is safe and effective. We and/or our partners have a number of partnered programs and unpartnered assets moving toward or currently awaiting regulatory action. Failure to show any product's safety and effectiveness could delay or prevent regulatory approval of a product and could adversely affect our business. The drug development and clinical trials process is complex and uncertain. For example, the results of preclinical studies and initial clinical trials may not necessarily predict the results from later large-scale clinical trials. In addition, clinical trials may not demonstrate a product's safety and effectiveness to the satisfaction of the regulatory authorities. A number of companies have suffered significant setbacks in advanced clinical trials or in seeking regulatory approvals, despite promising results in earlier trials. The FDA may also require additional clinical trials after regulatory approvals are received. Such additional trials may be expensive and time-consuming, and failure to successfully conduct those trials could jeopardize continued commercialization of a product.
The speed at which we and our partners complete our scientific studies and clinical trials depends on many factors, including, but not limited to, the ability to obtain adequate supplies of the products to be tested and patient enrollment. Patient enrollment is a function of many factors, including the size of the patient population, the proximity of patients to clinical sites, the eligibility criteria for the trial and other potential drug candidates being studied. Delays in patient enrollment for our or our partners’ trials may result in increased costs and longer development times. In addition, our partners have rights to control
25
product development and clinical programs for products developed under our collaborations. As a result, these partners may conduct these programs more slowly or in a different manner than expected. Moreover, even if clinical trials are completed, we or our partners still may not apply for FDA or foreign regulatory approval in a timely manner or the FDA or foreign regulatory authority still may not grant approval.
Our drug discovery, early-stage drug development, and product reformulation programs may require substantial additional capital to complete successfully. Our partner's drug development programs may require substantial additional capital to complete successfully, arising from costs to: conduct research, preclinical testing and human studies; establish pilot scale and commercial scale manufacturing processes and facilities; and establish and develop quality control, regulatory, marketing, sales and administrative capabilities to support these programs. While we expect to fund our research and development activities from cash generated from operations to the extent possible, if we are unable to do so, we may need to complete additional equity or debt financings or seek other external means of financing. These financings could depress our stock price. If additional funds are required to support our operations and we are unable to obtain them on terms favorable to us, we may be required to cease or reduce further development or commercialization of our products, to sell some or all of our technology or assets or to merge with another entity.
Our OmniAb antibody platform faces specific risks, including the fact that no drug using antibodies from the platform has yet advanced to late stage clinical trials.
None of our collaboration partners using our OmniAb antibody platform have tested drugs based on the platform in clinical trials and, therefore, none of our OmniAb collaboration partners’ drugs have received FDA approval. If one of our OmniAb collaboration partners’ drug candidates fails during preclinical studies or clinical trials, our other OmniAb collaboration partners may decide to abandon drugs using antibodies generated from the OmniAb platform, whether or not attributable to the platform. All of our OmniAb collaboration partners may terminate their programs at any time without penalty. In addition, our OmniRat and OmniFlic platforms, which we consider the most promising, are covered by two patents within the U.S. and two patents in the European Union and are subject to the same risks as our patent portfolio discussed above, including the risk that our patents may infringe on third party patent rights or that our patents may be invalidated. Further, we face significant competition from other companies selling human antibody-generating rodents, especially mice which compete with our OmniMouse platform, including the VelocImmune mouse, the AlivaMab mouse, the Trianni mouse and the Kymouse. Many of our competitors have greater financial, technical and human resources than we do and may be better equipped to develop, manufacture and market competing antibody platforms.
If plaintiffs bring product liability lawsuits against us or our partners, we or our partners may incur substantial liabilities and may be required to limit commercialization of our approved products and product candidates.
As is common in our industry, our partners and we face an inherent risk of product liability as a result of the clinical testing of our product candidates in clinical trials and face an even greater risk for commercialized products. Although we are not currently a party to product liability litigation, if we are sued, we may be held liable if any product or product candidate we develop causes injury or is found otherwise unsuitable during product testing, manufacturing, marketing or sale. Regardless of merit or eventual outcome, liability claims may result in decreased demand for any product candidates, partnered products or products that we may develop, injury to our reputation, discontinuation of clinical trials, costs to defend litigation, substantial monetary awards to clinical trial participants or patients, loss of revenue and product recall or withdrawal from the market and the inability to commercialize any products that we develop. We have product liability insurance that covers our clinical trials up to a $10.0 million annual limit. Our insurance coverage may not be sufficent to cover all of our product liability related expenses or losses and may not cover us for any expenses or losses we may suffer. If we are sued for any injury caused by our product candidates, partnered products or any future products, our liability could exceed our total assets.
Market acceptance and sales of any approved product will depend significantly on the availability and adequacy of coverage and reimbursement from third-party payors and may be affected by existing and future healthcare reform measures.
Sales of the products we license to our collaboration partners and the royalties we receive will depend in large part on the extent to which coverage and reimbursement is available from government and health administration authorities, private health maintenance organizations and health insurers, and other healthcare payors. Significant uncertainty exists as to the reimbursement status of healthcare products. Healthcare payors, including Medicare, are challenging the prices charged for medical products and services. Government and other healthcare payors are increasingly attempting to contain healthcare costs by limiting both coverage and the level of reimbursement for medical products. Even if a product is approved by the FDA, insurance coverage may not be available, and reimbursement levels may be inadequate, to cover the costs associated with the research, development, marketing and sale of the product. If government and other healthcare payors do not provide adequate coverage and reimbursement levels for any product, market acceptance and any sales could be reduced.
26
From time to time, legislation is implemented to reign in rising healthcare expenditures. By way of example, in March 2010, the Patient Protection and Affordable Care Act, as amended by the Health Care and Education Reconciliation Act, or collectively, the ACA, was enacted, which included a number of provisions affecting the pharmaceutical industry, including, among other things, annual, non-deductible fees on any entity that manufactures or imports some types of branded prescription drugs and increases in Medicaid rebates owed by manufacturers under the Medicaid Drug Rebate Program. Since its enactment, there have been judicial and Congressional challenges to certain aspects of the ACA, and we expect there will be additional challenges and amendments to the ACA in the future.
Other legislative changes have been proposed and adopted since the ACA was enacted, including aggregate reductions of Medicare payments to providers of 2% per fiscal year and reduced payments to several types of Medicare providers. Moreover, there has recently been heightened governmental scrutiny over the manner in which manufacturers set prices for their marketed products, which has resulted in several Congressional inquiries and proposed bills designed to, among other things, bring more transparency to product pricing, review the relationship between pricing and manufacturer patient programs, and reform government program reimbursement methodologies for drug products. Individual states in the United States have also become increasingly active in implementing regulations designed to control pharmaceutical product pricing, including price or patient reimbursement constraints, discounts, restrictions on certain product access and marketing cost disclosure and transparency measures, and, in some cases, designed to encourage importation from other countries and bulk purchasing. We cannot predict whether other legislative changes will be adopted, if any, or how such changes would affect our operations or financial condition.
We and our collaboration partners may be subject to federal and state healthcare laws, including fraud and abuse, false claims, physician payment transparency and health information privacy and security laws. Our operations and those of our collaboration partners are subject to various federal and state fraud and abuse laws, including, without limitation, anti-kickback, false claims and physician payment transparency statutes. These laws may impact, among other things, financial arrangements with physicians, sales, marketing and education programs and the manner in any of those activities are implemented. In addition, we may be subject to federal and state patient privacy regulations. If our operations or those of our collaboration partners are found to be in violation of any of those laws or any other applicable governmental regulations, we or our collaboration partners may be subject to penalties, including civil and criminal penalties, damages, fines, imprisonment, exclusion from government healthcare programs or the curtailment or restructuring of operations, any of which could adversely affect our ability to operate our business and our financial condition.
Any difficulties from strategic acquisitions could adversely affect our stock price, operating results and results of operations.
We may acquire companies, businesses and products that complement or augment our existing business. We may not be able to integrate any acquired business successfully or operate any acquired business profitably. Integrating any newly acquired business could be expensive and time-consuming. Integration efforts often take a significant amount of time, place a significant strain on managerial, operational and financial resources and could prove to be more difficult or expensive than we predict. The diversion of our management's attention and any delay or difficulties encountered in connection with any future acquisitions we may consummate could result in the disruption of our on-going business or inconsistencies in standards and controls that could negatively affect our ability to maintain third-party relationships. Moreover, we may need to raise additional funds through public or private debt or equity financing, or issue additional shares, to acquire any businesses or products, which may result in dilution for stockholders or the incurrence of indebtedness.
As part of our efforts to acquire companies, business or product candidates or to enter into other significant transactions, we conduct business, legal and financial due diligence with the goal of identifying and evaluating material risks involved in the transaction. Despite our efforts, we ultimately may be unsuccessful in ascertaining or evaluating all such risks and, as a result, might not realize the intended advantages of the transaction. If we fail to realize the expected benefits from acquisitions we may consummate in the future or have consummated in the past, whether as a result of unidentified risks, integration difficulties, regulatory setbacks, litigation with current or former employees and other events, our business, results of operations and financial condition could be adversely affected. If we acquire product candidates, we will also need to make certain assumptions about, among other things, development costs, the likelihood of receiving regulatory approval and the market for such product candidates. Our assumptions may prove to be incorrect, which could cause us to fail to realize the anticipated benefits of these transactions.
In addition, we will likely experience significant charges to earnings in connection with our efforts, if any, to consummate acquisitions. For transactions that are ultimately not consummated, these charges may include fees and expenses for investment bankers, attorneys, accountants and other advisors in connection with our efforts. Even if our efforts are successful, we may incur, as part of a transaction, substantial charges for closure costs associated with elimination of duplicate
27
operations and facilities and acquired IPR&D charges. In either case, the incurrence of these charges could adversely affect our results of operations for particular quarterly or annual periods.
We have restated prior consolidated financial statements and we have previously identified material weaknesses in our internal control over financial reporting, which may lead to possible additional risks and uncertainties, including possible loss of investor confidence and/or additional material misstatements in our financial statements.
We have restated our consolidated financial statements as of and for the year ended December 31, 2015 (including the third quarter within that year) and for the first and second quarters of fiscal year 2016 in order to correct certain accounting errors. For a description of the material weaknesses in our internal control over financial reporting identified by management in connection with the Restatement and the result of management’s efforts to remediate those material weaknesses, see “Part II, Item 9A - Controls and Procedures.”
As a result of the Restatement, we have become subject to possible additional costs and risks, including (a) accounting and legal fees incurred in connection with the Restatement and (b) a possible loss of investor confidence. Further, we were subject to a shareholder lawsuit related to the Restatement. See "Item 3. Legal Proceedings."
As described in “Part II, Item 9A - Controls and Procedures,” management previoulsy identified control deficiencies that represent material weaknesses. A material weakness is a deficiency, or a combination of deficiencies, in internal control over financial reporting, such that there is a reasonable possibility that a material misstatement of our annual or interim financial statements will not be prevented or detected on a timely basis. As a result of the identified material weaknesses, management has concluded that we did not maintain effective internal control over financial reporting as of December 31, 2016. See “Part II, Item 9A - Controls and Procedures.”
We developed and implemented a remediation plan to address the material weaknesses, which we concluded was successful as of December 31, 2017. However, if additional material weaknesses in our internal control over financial reporting are discovered or occur in the future, our consolidated financial statements may contain material misstatements and we could be required to restate our financial results, which could materially and adversely affect our business, results of operations and financial condition, restrict our ability to access the capital markets, require us to expend significant resources to correct the material weakness, subject us to fines, penalties or judgments, harm our reputation or otherwise cause a decline in investor confidence.
Changes or modifications in financial accounting standards, including those related to revenue recognition, may harm our results of operations.
From time to time, the FASB either alone or jointly with other organizations, promulgates new accounting principles that could have an adverse impact on our results of operations. For example, in May 2014, FASB issued a new accounting standard for revenue recognition-Accounting Standards Codification Topic 606, Revenue from Contracts with Customers, or ASC 606-that supersedes most current revenue recognition guidance. The new guidance requires a company to recognize revenue upon transfer of goods or services to a customer at an amount that reflects the expected consideration to be received in exchange for those goods or services. The new guidance becomes effective in fiscal 2018.
We anticipate this standard will have a material impact on our consolidated financial statements by accelerating the timing of revenue recognition for revenues related to royalties, and potentially certain contingent milestone based payments. Our practice has been to book royalties one quarter after our partners report sales of the underlying product. Now, under ASC 606, Ligand will estimate and book royalties in the same quarter that our partners report the sale of the underlying product. As a result, we will book royalties one quarter earlier compared to our past practice. We will rely on our partners’ earning releases and other information from our partners to determine the sales of our partners’ products and to estimate the related royalty revenues. If our partners report incorrect sales, or if our partners delay reporting of their earnings release, our royalty estimates may need to be revised and/or our financial reporting may be delayed.
Any difficulties in implementing this guidance could cause us to fail to meet our financial reporting obligations, which could result in regulatory discipline and harm investors’ confidence in us. Finally, if we were to change our critical accounting estimates, including those related to the recognition of license revenue and other revenue sources, our operating results could be significantly affected.
Uncertainties in the interpretation and application of the 2017 Tax Cuts and Jobs Act could materially affect our tax obligations and effective tax rate.
28
The 2017 Tax Cuts and Jobs Act (the Tax Act) was enacted on December 22, 2017, and significantly affected U.S. tax law by changing how the U.S. imposes income tax on corporations, including by reducing the U.S. corporate income tax rate. The U.S. Department of Treasury has broad authority to issue regulations and interpretative guidance that may significantly impact how we will apply the law and impact our results of operations in the period issued.
The Tax Act requires certain complex computations not previously provided in U.S. tax law. As such, the application of accounting guidance for such items is currently uncertain. Further, compliance with the Tax Act and the accounting for such provisions require accumulation of certain information not previously required or regularly produced. As a result, we have provided a provisional estimate on the effect of the Tax Act in our financial statements. As additional regulatory guidance is issued by the applicable taxing authorities, as accounting treatment is clarified, as we perform additional analysis on the application of the law, and as we refine estimates in calculating the effect, our final analysis, which will be recorded in the period completed, may be different from our current provisional amounts, which could materially affect our tax obligations and effective tax rate.
Our ability to use our net operating loss carryforwards and certain other tax attributes to offset future taxable income may be subject to certain limitations.
As of December 31, 2017 we had U.S. federal and state net operating loss carryforwards (NOLs) of approximately $388 million and $127 million, respectively, which expire through 2036, if not utilized. As of December 31, 2017, we had federal and California research and development tax credit carryforwards of approximately $24 million and $21 million, respectively. The federal research and development tax credit carryforwards expire in various years through 2036, if not utilized. The California research and development credit will carry forward indefinitely. Under Sections 382 and 383 of Internal Revenue Code of 1986, as amended (Code) if a corporation undergoes an “ownership change,” the corporation’s ability to use its pre-change NOLs and other pre-change tax attributes, such as research tax credits, to offset its future post-change income and taxes may be limited. In general, an “ownership change” occurs if there is a cumulative change in our ownership by “5% shareholders” that exceeds 50 percentage points over a rolling three-year period. Similar rules may apply under state tax laws. We believe we have experienced certain ownership changes in the past and have reduced our deferred tax assets related to NOLs and research and development tax credit carryforwards accordingly. In the event that it is determined that we have in the past experienced additional ownership changes, or if we experience one or more ownership changes as a result future transactions in our stock, then we may be further limited in our ability to use our NOLs and other tax assets to reduce taxes owed on the net taxable income that we earn in the event that we attain profitability. Furthermore, under recently enacted U.S. tax legislation, although the treament of tax losses generated before December 31, 2017 has generally not changed, tax losses generated in calendar year 2018 and beyond may only offset 80% of our taxable income. This change may require us to pay federal income taxes in future years despite generating a loss for federal income tax purposes in prior years. Any such limitations on the ability to use our NOLs and other tax assets could adversely impact our business, financial condition and operating results.
We rely on information technology and any failure, inadequacy, interruption or security lapse of that technology, including any cyber security incidents, could harm our ability to operate our business effectively.
Our business is increasingly dependent on critical, complex and interdependent information technology systems, including internet-based systems, to support business processes as well as internal and external communications. Despite the implementation of security measures, our internal computer systems and those of our partners are vulnerable to damage from cyber-attacks, computer viruses, security breaches, unauthorized access, natural disasters, terrorism, war and telecommunication and electrical failures. System failures, accidents or security breaches could cause interruptions in our operations, could lead to the loss of trade secrets or other intellectual property, could lead to the public exposure of personal information of our employees and others, and could result in a material disruption of our clinical and commercialization activities and business operations, in addition to possibly requiring substantial expenditures to remedy. To the extent that any disruption or security breach were to result in a loss of, or damage to, our data or applications, or inappropriate disclosure of confidential or proprietary information, we could incur liability and our business and financial condition could be harmed.
29
The occurrence of a catastrophic disaster could damage our facilities beyond insurance limits or we could lose key data which could cause us to curtail or cease operations.
We are vulnerable to damage and/or loss of vital data from natural disasters, such as earthquakes, tornadoes, power loss, fire, floods and similar events, as well as from accidental loss or destruction. If any disaster were to occur, our ability to operate our business could be seriously impaired. We have property, liability, and business interruption insurance which may not be adequate to cover our losses resulting from disasters or other similar significant business interruptions, and we do not plan to purchase additional insurance to cover such losses due to the cost of obtaining such coverage. Any significant losses that are not recoverable under our insurance policies could seriously impair our business, financial condition and prospects.
We sold the 2019 Convertible Senior Notes, which may impact our financial results, result in the dilution of existing stockholders, create downward pressure on the price of our common stock, and restrict our ability to take advantage of future opportunities.
In August of 2014, we sold $245.0 million aggregate principal amount of 0.75% Convertible Senior Notes due 2019, or the 2019 Convertible Senior Notes. We will be required to pay interest on the 2019 Convertible Senior Notes until they come due or are converted, and the payment of that interest will reduce our net income. The sale of the 2019 Convertible Senior Notes may also affect our earnings per share figures, as accounting procedures require that we include in our calculation of earnings per share the number of shares of our common stock into which the 2019 Convertible Senior Notes are convertible. The 2019 Convertible Senior Notes may be converted, under the conditions and at the premium specified in the 2019 Convertible Senior Notes, into cash and shares of our common stock, if any (subject to our right to pay cash in lieu of all or a portion of such shares). If shares of our common stock are issued to the holders of the 2019 Convertible Senior Notes upon conversion, there will be dilution to our shareholders equity and the market price of our shares may decrease due to the additional selling pressure in the market. Any downward pressure on the price of our common stock caused by the sale or potential sale of shares issuable upon conversion of the 2019 Convertible Notes could also encourage short sales by third parties, creating additional selling pressure on our stock. Upon the occurrence of certain circumstances, holders of the 2019 Convertible Senior Notes may require us to purchase all or a portion of their notes for cash, which may require the use of a substantial amount of cash. If such cash is not available, we may be required to sell other assets or enter into alternate financing arrangements at terms that may or may not be desirable. The existence of the 2019 Convertible Senior Notes and the obligations that we incurred by issuing them may restrict our ability to take advantage of certain future opportunities, such as engaging in future debt or equity financing activities.
Impairment charges pertaining to goodwill, identifiable intangible assets or other long-lived assets from our mergers and acquisitions could have an adverse impact on our results of operations and the market value of our common stock.
The total purchase price pertaining to our acquisitions in recent years of CyDex, Metabasis, Pharmacopeia, Neurogen and OMT have been allocated to net tangible assets, identifiable intangible assets, in-process research and development and goodwill. To the extent the value of goodwill or identifiable intangible assets or other long-lived assets become impaired, we will be required to incur material charges relating to the impairment. Any impairment charges could have a material adverse impact on our results of operations and the market value of our common stock.
Our charter documents and concentration of ownership may hinder or prevent change of control transactions.
Provisions contained in our certificate of incorporation and bylaws may discourage transactions involving an actual or potential change in our ownership. In addition, our Board of Directors may issue shares of common or preferred stock without any further action by the stockholders. Our directors and certain of our institutional investors collectively beneficially own a significant portion of our outstanding common stock. Such provisions and issuances may have the effect of delaying or preventing a change in our ownership. If changes in our ownership are discouraged, delayed or prevented, it would be more difficult for our current Board of Directors to be removed and replaced, even if you or our other stockholders believe that such actions are in the best interests of us and our stockholders.
30
Our stock price has been volatile and could experience a sudden decline in value.
The market prices for securities of biotechnology and pharmaceutical companies have historically been highly volatile, and the market has recently experienced significant price and volume fluctuations that are unrelated to the operating performance of particular companies. Continued volatility in the overall capital markets could reduce the market price of our common stock in spite of our operating performance. Further, high stock price volatility could result in higher stock-based compensation expense.
Our common stock has experienced significant price and volume fluctuations and may continue to experience volatility in the future. Many factors may have a significant impact on the market price of our common stock, including, but not limited to, the following factors: results of or delays in our preclinical studies and clinical trials; the success of our collaboration agreements; publicity regarding actual or potential medical results relating to products under development by us or others; announcements of technological innovations or new commercial products by us or others; developments in patent or other proprietary rights by us or others; comments or opinions by securities analysts or major stockholders or changed securities analysts' reports or recommendations; future sales or shorting of our common stock by existing stockholders; regulatory developments or changes in regulatory guidance; litigation or threats of litigation; economic and other external factors or other disaster or crises; the departure of any of our officers, directors or key employees; period-to-period fluctuations in financial results; and price and volume fluctuations in the overall stock market.
Our results of operations and liquidity needs could be materially negatively affected by market fluctuations and economic downturn.
Our results of operations could be materially negatively affected by economic conditions generally, both in the United States and elsewhere around the world. Concerns over inflation, energy costs, geopolitical issues, the availability and cost of credit, and the U.S. financial markets have in the past contributed to, and may continue in the future contributed to, increased volatility and diminished expectations for the economy and the markets. Domestic and international equity markets periodically experience heightened volatility and turmoil. These events may have an adverse effect on us. In the event of a market downturn, our results of operations could be adversely affected by those factors in many ways, including making it more difficult for us to raise funds if necessary, and our stock price may further decline. We cannot provide assurance that our investments are not subject to adverse changes in market value. If our investments experience adverse changes in market value, we may have less capital to fund our operations.
Item 1B. | Unresolved Staff Comments |
None.
Item 2. | Properties |
We currently lease premises consisting of approximately 5,000 square feet of office space in San Diego which serves as our corporate headquarters. The lease expires in May 2023.
We lease approximately 1,500 square feet of laboratory space located at the Bioscience and Technology Business Center in Lawrence, Kansas, leased through December 2020.
We lease approximately 13,000 square feet of office and laboratory space located in Emeryville, California. The lease expires in August 2021.
Item 3. | Legal Proceedings |
From time to time we are subject to various lawsuits and claims with respect to matters arising out of the normal course of our business. Due to the uncertainty of the ultimate outcome of these matters, the impact on future financial results is not subject to reasonable estimates.
In November 2016, a putative shareholder class action lawsuit was filed in the United States District Court for the Southern District of California against the Company, its chief executive officer and chief financial officer. The complaint was voluntarily dismissed without prejudice on May 15, 2017.
In November 2017, CyDex, our wholly owned subsidiary, received a paragraph IV certification from Teva Pharmaceuticals USA, Inc., Teva Pharmaceutical Industries Ltd. and Actavis, LLC (collectively “Teva”) alleging that certain of our patents related to Captisol were invalid, unenforceable and/or will not be infringed by Teva’s ANDA related to Spectrum
31
Pharmaceuticals’ NDA for Evomela. On December 20, 2017, CyDex filed a complaint against Teva in the U.S. District Court for the District of Delaware, asserting that Teva’s ANDA would infringe our patents.
Item 4. | Mine Safety Disclosures |
Not applicable.
PART II
Item 5. | Market for Registrant’s Common Equity, Related Stockholder Matters, and Issuer Purchases of Equity Securities |
Market Information
Our common stock is traded on the Nasdaq Global Market under the symbol “LGND.”
The following table sets forth the high and low intraday sales prices for our common stock on the Nasdaq Global Market for the periods indicated:
Price Range | |||||||
Low | High | ||||||
Year Ended December 31, 2017: | |||||||
1st Quarter | $ | 100.38 | $ | 109.54 | |||
2nd Quarter | $ | 104.13 | $ | 123.87 | |||
3rd Quarter | $ | 116.75 | $ | 137.94 | |||
4th Quarter | $ | 128.36 | $ | 147.04 | |||
Year Ended December 31, 2016: | |||||||
1st Quarter | $ | 82.06 | $ | 108.79 | |||
2nd Quarter | $ | 95.05 | $ | 131.84 | |||
3rd Quarter | $ | 97.22 | $ | 139.79 | |||
4th Quarter | $ | 87.50 | $ | 110.83 | |||
As of February 15, 2018, the closing price of our common stock on the NASDAQ Global Market was $157.18
Holders
As of February 15, 2018, there were approximately 665 holders of record of the common stock.
Purchases of Equity Securities By the Issuer and Affiliated Purchasers
The following table presents information regarding repurchases by us of our common stock during the three months ended December 31, 2017 under the stock repurchase program approved by our board of directors in September 2015, under which we may acquire up to $200 million of our common stock in open market and negotiated purchases for a period of up to three years.
ISSUER PURCHASES OF EQUITY SECURITIES
Total Number of Shares Purchased | Average Price Paid Per Share | Total Number of Shares Purchased as Part of Publicly Announced Plans or Programs | Maximum Dollar Value of Shares that May Yet Be Purchased Under the Program (in thousands) | |||||||||||
October 1 - October 31, 2017 | — | $ | — | — | $ | 195,610 | ||||||||
November 1 - November 30, 2017 | 10,000 | $ | 142.47 | 10,000 | $ | 194,185 | ||||||||
December 1 - December 31, 2017 | 4,000 | $ | 135.32 | 4,000 | $ | 193,644 | ||||||||
Total | 14,000 | $ | 140.43 | 14,000 | $ | 193,644 | ||||||||
32
The graph below shows the five-year cumulative total stockholder return assuming the investment of $100 and is based on the returns of the component companies weighted monthly according to their market capitalizations. The graph compares total stockholder returns of our common stock, of all companies traded on the NASDAQ Stock market, as represented by the NASDAQ Composite® Index, and of the NASDAQ Biotechnology Stock Index, as prepared by The NASDAQ Stock Market Inc.
The stockholder return shown on the graph below is not necessarily indicative of future performance and we will not make or endorse any predictions as to future stockholder returns.
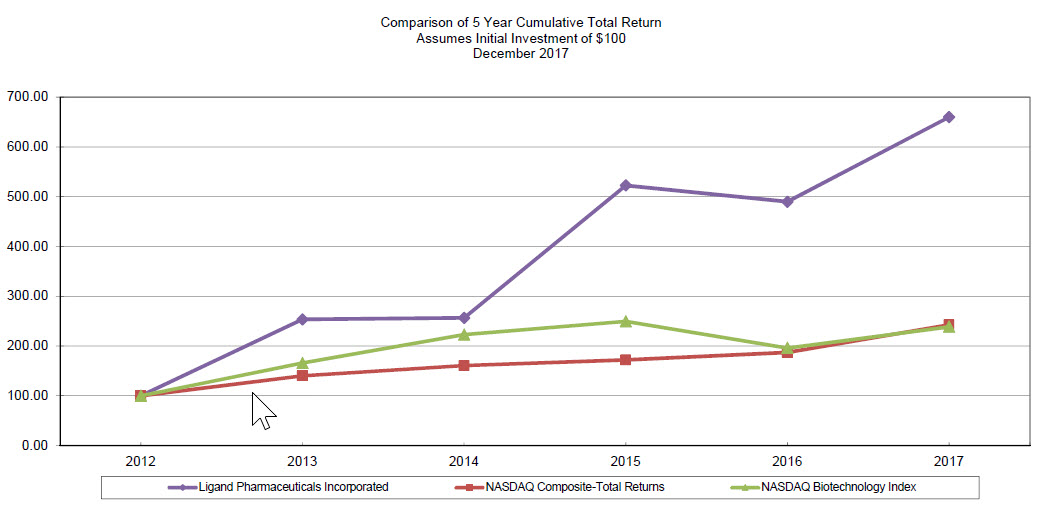
12/31/2013 | 12/31/2014 | 12/31/2015 | 12/31/2016 | 12/31/2017 | |||||||||||
Ligand | 154 | % | 1 | % | 104 | % | (6 | )% | 35 | % | |||||
NASDAQ Market (U.S. Companies) Index | 40 | % | 15 | % | 7 | % | 9 | % | 27 | % | |||||
NASDAQ Biotechnology Stocks | 66 | % | 34 | % | 12 | % | (21 | )% | 22 | % | |||||
33
Item 6. | Selected Consolidated Financial Data |
The following selected historical consolidated financial and other data are qualified by reference to, and should be read in conjunction with, our consolidated financial statements and the related notes thereto appearing elsewhere herein and “Management’s Discussion and Analysis of Financial Condition and Results of Operations.” Our selected statement of operations data set forth below for each of the years ended December 31, 2017, 2016, 2015, 2014, and 2013 and the balance sheet data as of December 31, 2017, 2016, 2015, 2014 and 2013 are derived from our consolidated financial statements.
Year Ended December 31, | |||||||||||||||||||
2017 | 2016 | 2015 | 2014 | 2013 | |||||||||||||||
Consolidated Statements of Operations Data: | (in thousands) | ||||||||||||||||||
Royalties | $ | 88,685 | $ | 59,423 | $ | 38,194 | $ | 29,994 | $ | 23,584 | |||||||||
Material sales | 22,070 | 22,502 | 27,662 | 28,488 | 19,072 | ||||||||||||||
License fees, milestones, and other revenues | 30,347 | 27,048 | 6,058 | 6,056 | 6,317 | ||||||||||||||
Total revenues | 141,102 | 108,973 | 71,914 | 64,538 | 48,973 | ||||||||||||||
Cost of sales | 5,366 | 5,571 | 5,807 | 9,136 | 3,357 | ||||||||||||||
Intangible Amortization | 12,120 | 10,643 | 2,375 | 2,375 | 2,375 | ||||||||||||||
Research and development expenses | 26,887 | 21,221 | 11,005 | 9,747 | 9,274 | ||||||||||||||
General and administrative expenses | 28,653 | 27,653 | 25,398 | 23,654 | 18,544 | ||||||||||||||
Write-off of acquired IPR&D | — | — | — | — | 480 | ||||||||||||||
Total operating costs and expenses | 73,026 | 65,088 | 44,585 | 44,912 | 34,030 | ||||||||||||||
Income from operations | 68,076 | 43,885 | 27,329 | 19,626 | 14,943 | ||||||||||||||
Income (loss) from continuing operations including noncontrolling interests | 12,556 | (2,367 | ) | 227,444 | 10,892 | 8,832 | |||||||||||||
Loss attributable to noncontrolling interests | — | — | (2,380 | ) | (1,132 | ) | — | ||||||||||||
Income (loss) from continuing operations | 12,556 | (2,367 | ) | 229,824 | 12,024 | 8,832 | |||||||||||||
Discontinued operations | — | 731 | — | — | 2,588 | ||||||||||||||
Net income (loss) | 12,556 | (1,636 | ) | 229,824 | 12,024 | 11,420 | |||||||||||||
Basic per share amounts: | |||||||||||||||||||
Income (loss) from continuing operations | $ | 0.60 | $ | (0.11 | ) | $ | 11.61 | $ | 0.59 | $ | 0.43 | ||||||||
Discontinued operations | — | 0.04 | — | — | 0.13 | ||||||||||||||
Net income (loss) | $ | 0.60 | $ | (0.08 | ) | $ | 11.61 | $ | 0.59 | $ | 0.56 | ||||||||
Weighted average number of common shares-basic | 21,032 | 20,831 | 19,790 | 20,419 | 20,312 | ||||||||||||||
Diluted per share amounts: | |||||||||||||||||||
Income (loss) from continuing operations | $ | 0.53 | $ | (0.11 | ) | $ | 10.83 | $ | 0.56 | $ | 0.43 | ||||||||
Discontinued operations | — | 0.04 | — | — | 0.12 | ||||||||||||||
Net income (loss) | $ | 0.53 | $ | (0.08 | ) | $ | 10.83 | $ | 0.56 | $ | 0.55 | ||||||||
Weighted average number of common shares-diluted | 23,481 | 20,831 | 21,228 | 21,433 | 20,745 | ||||||||||||||
34
December 31, | ||||||||||||||||||
2017 | 2016 | 2015 | 2014 | 2013 | ||||||||||||||
(in thousands) | ||||||||||||||||||
Consolidated Balance Sheet Data: | ||||||||||||||||||
Cash, cash equivalents, short-term investments, restricted cash and investments | $ | 208,099 | 149,393 | $ | 229,947 | $ | 168,597 | $ | 17,320 | |||||||||
Working capital (deficit) | (1,847 | ) | (64,076 | ) | (8,109 | ) | 162,379 | (4,058 | ) | |||||||||
Total assets | 671,021 | 601,585 | 503,061 | 258,029 | 104,713 | |||||||||||||
Long-term obligations (excludes long-term portions of deferred revenue, net and deferred gain) | 9,981 | 3,603 | 3,330 | 208,757 | 24,076 | |||||||||||||
Accumulated deficit | (400,924 | ) | (431,127 | ) | (429,491 | ) | (659,315 | ) | (671,339 | ) | ||||||||
Total stockholders’ equity | 399,788 | 341,290 | 237,282 | 26,318 | 49,613 | |||||||||||||
Item 7. | Management’s Discussion and Analysis of Financial Condition and Results of Operations |
Results of Operations
Revenue
(Dollars in thousands) | 2017 | 2016 | Change | % Change | 2015 | Change | % Change | ||||||||||||||||||
Royalty Revenue | $ | 88,685 | $ | 59,423 | $ | 29,262 | 49 | % | $ | 38,194 | $ | 21,229 | 56 | % | |||||||||||
Material Sales | 22,070 | 22,502 | (432 | ) | (2 | )% | 27,662 | (5,160 | ) | (19 | )% | ||||||||||||||
License fees, milestones and other revenue | 30,347 | 27,048 | 3,299 | 12 | % | 6,058 | 20,990 | 346 | % | ||||||||||||||||
Total revenue | $ | 141,102 | $ | 108,973 | $ | 32,129 | 29 | % | $ | 71,914 | $ | 37,059 | 52 | % | |||||||||||
Total revenue for 2017 increased $32.1 million or 29% compared with 2016 and for 2016 it increased $37.1 million or 52% compared with 2015.
Royalty revenue increased in each year presented primarily due to an increase in Promacta, Kyprolis and Evomela royalties. Increases in Promacta product sales of $197 million in 2017 and $151 million in 2016, and increases in the effective royalty rates due to our tiered royalty rate structure, drove the increase in Promacta royalty revenue. The effective royalty rate for Promacta was 8.0% in 2017, 7.3% in 2016 and 6.7% in 2015. Increases in Kyprolis product sales of $167 million in 2017 and $217 million in 2016 and increases in the effective royalty rates due to our tiered royalty rate structure, drove the increase in Kyprolis royalty revenue. The effective royalty rate for Kyprolis was 2.0% in 2017, 1.9% in 2016 and 1.7% in 2015. Evomela was launched in late 2016 and has a fixed royalty rate of 20%. Evomela royalties increased as a result of an increase in product sales of $29 million in 2017 and $7 million and in 2016.
Material sales decreased year over year in 2017 and 2016 due to timing of customer purchases of Captisol for use in clinical trials and in commercialized products. The increase in license fee, milestones and other revenues in 2017 compared to 2016 is primarily due to OmniAb license fees and milestone payments and the increase in 2016 compared to 2015 is primarily due to OmniAb license fees and a milestone payment received from Spectrum as a result of the FDA approval of Evomela.
The following table represents royalty revenue by program (in thousands):
Year ended December 31, | |||||||||||
2017 | 2016 | 2015 | |||||||||
Promacta / Revolade | $ | 62,918 | $ | 43,043 | $ | 29,295 | |||||
Kyprolis | 16,413 | 12,145 | 7,317 | ||||||||
Third Largest Royalty | 7,155 | 1,357 | 390 | ||||||||
Other Royalties | 2,199 | 2,878 | 1,192 | ||||||||
Total | $ | 88,685 | $ | 59,423 | $ | 38,194 | |||||
35
The following table represents material sales by clinical and commercial use (in thousands):
Year ended December 31, | |||||||||||
2017 | 2016 | 2015 | |||||||||
Clinical material sales | $ | 7,671 | $ | 9,325 | $ | 10,049 | |||||
Commercial material sales | 14,399 | 13,177 | 17,613 | ||||||||
Total | $ | 22,070 | $ | 22,502 | $ | 27,662 | |||||
Operating Costs and Expenses
(Dollars in thousands) | 2017 | 2016 | Change | % Change | 2015 | Change | % Change | ||||||||||||||||||
Cost of sales | $ | 5,366 | $ | 5,571 | $ | (205 | ) | (4 | )% | $ | 5,807 | $ | (236 | ) | (4 | )% | |||||||||
Amortization of intangibles | 12,120 | 10,643 | 1,477 | 14 | % | 2,375 | 8,268 | 348 | % | ||||||||||||||||
Research and development | 26,887 | 21,221 | 5,666 | 27 | % | 11,005 | 10,216 | 93 | % | ||||||||||||||||
General and administrative | 28,653 | 27,653 | 1,000 | 4 | % | 25,398 | 2,255 | 9 | % | ||||||||||||||||
Total operating costs and expenses | $ | 73,026 | $ | 65,088 | $ | 7,938 | 12 | % | $ | 44,585 | $ | 20,503 | 46 | % | |||||||||||
Total operating costs and expenses for 2017 increased $7.9 million or 12% compared with 2016. Cost of sales decreased year over year in 2017 and 2016 primarily due to lower material sales as a result of timing of customer purchases. Amortization of intangibles increased year over year in 2017 and 2016 due primarily to the acquisition of Crystal and OMT in October 2017 and January 2016, respectively. Research and development expenses and general and administrative expenses increased year over year in 2017 and 2016 due primarily to increased business development activities, timing of internal development costs and increased stock-based compensation expense and headcount related expenses associated with Crystal and OMT.
We do not provide forward-looking estimates of costs and time to complete our ongoing research and development projects as such estimates would involve a high degree of uncertainty. Uncertainties include our inability to predict the outcome of research and clinical studies, regulatory requirements placed upon us by regulatory authorities such as the FDA and EMA, our inability to predict the decisions of our partners, our ability to fund research and development programs, competition from other entities of which we may become aware in future periods, predictions of market potential for products that may be derived from our work, and our ability to recruit and retain personnel or third-party contractors with the necessary knowledge and skills to perform certain research. Refer to “Item 1A. Risk Factors” for additional discussion of the uncertainties surrounding our research and development initiatives.
Other (expense) income
(Dollars in thousands) | 2017 | 2016 | Change | % Change | 2015 | Change | % Change | ||||||||||||||||||
Interest expense, net | $ | (11,400 | ) | $ | (12,178 | ) | $ | 778 | (6 | )% | $ | (11,802 | ) | $ | (376 | ) | 3 | % | |||||||
Increase in contingent liabilities | (2,580 | ) | (3,334 | ) | 754 | (23 | )% | (5,013 | ) | 1,679 | (33 | )% | |||||||||||||
Gain on deconsolidation of Viking | — | — | — | — | % | 28,190 | (28,190 | ) | 100 | % | |||||||||||||||
Loss from Viking | (2,048 | ) | (23,132 | ) | 21,084 | (91 | )% | (5,143 | ) | (17,989 | ) | 350 | % | ||||||||||||
Other income, net | 5,183 | 2,719 | 2,464 | 91 | % | 1,768 | 951 | 54 | % | ||||||||||||||||
Total other (expense) income | $ | (10,845 | ) | $ | (35,925 | ) | $ | 25,080 | (70 | )% | $ | 8,000 | $ | (43,925 | ) | (549 | )% | ||||||||
The year over year decrease in Interest expense, net in 2017 is due to an increase in interest income offset by an increase in interest expense related to the 2019 Convertible Senior Notes. The year over year variance in Increase in contingent liabilities in 2017 and 2016 is due to the change in the fair value of CyDex, Metabasis and Crystal related contingent liabilities.
36
We recorded a gain on deconsolidation of Viking in 2015, primarily related to the equity milestone received from Viking upon the close of the Viking IPO.
We recorded a $4.7 million loss from Viking in 2017 for our proportionate share of Viking’s losses based on our ownership of Viking common stock and a $2.7 million gain on dilution resulting from Viking's financings.We recorded a $5.1 million loss from Viking in 2016 for our proportionate share of Viking’s losses based on our ownership of Viking common stock and $10.7 million for loss on dilution resulting from Viking's financing. We recorded an impairment charge in 2016 of $7.4 million relating to our investment in Viking.
The year over year increase in Other income, net in 2017 is primarily due to an increase in the fair value of the Viking note receivable and Viking warrants and gain on the sale of short-term investments. The year over year increase in Other income, net in 2016 is primarily due to the gain on the sale of short-term investments.
Income tax benefit (expense)
(Dollars in thousands) | 2017 | 2016 | Change | % Change | 2015 | Change | % Change | |||||||||||||||||
Income before income tax (benefit) expense | $ | 57,231 | $ | 7,960 | $ | 49,271 | 619 | % | $35,329 | $ | (27,369 | ) | (77 | )% | ||||||||||
Income tax benefit (expense) | (44,675 | ) | (10,327 | ) | (34,348 | ) | 333 | % | 192,115 | (202,442 | ) | (105 | )% | |||||||||||
Income from operations | $ | 12,556 | $ | (2,367 | ) | $ | 14,923 | (630 | )% | $227,444 | $ | (229,811 | ) | (101 | )% | |||||||||
Effective Tax Rate | 78 | % | 130 | % | (544 | )% | ||||||||||||||||||
Our effective tax rate for 2017, 2016 and 2015 was 78% , 130% , and (544)% , respectively. Our tax rate is affected by recurring items, such as the U.S. federal and state statutory tax rates and the relative amounts of income we earn in those jurisdictions, which we expect to be fairly consistent in the near term. It is also affected by discrete items that may occur in any given year, but are not consistent from year to year. In addition to state income taxes, the items below had the most significant impact on the difference between our statutory U.S. income tax rate and our effective tax rate.
2017
• | $32.4 million (55%) increase due to the provisional estimated impact of the Tax Act and primarily due to the impact of revaluing our U.S. deferred tax assets and liabilities based on the statutory rates at which they are expected to be recognized in the future, which for federal purposes was reduced from 35% to 21% |
• | $4.7 million (8%) decrease due to excess tax benefits from stock-based compensation which are recorded as a discrete item within the provision for income tax pursuant to ASU 2016-09, which was previously recognized in additional paid-in capital on the consolidated statement of stockholders' equity |
• | $4.2 million (7%) reduction due to decrease in valuation allowance primarily relating to our Viking deferred tax asset and change in corporate tax rates under the Tax Act |
• | $2.8 million (5%) reduction from R&D tax credits |
• | $1.3 million (2%) increase in uncertain tax positions |
• | $0.9 million (2%) increase from non-cash contingent liability charges that are nondeductible for tax purposes |
2016
• | $6.3 million (79%) increase in valuation allowance primarily relating to Viking deferred tax asset |
• | $1.4 million (18%) increase in uncertain tax positions |
• | $1.2 million (15%) increase from non-cash contingent liability charges that are nondeductible for tax purposes |
• | $1.5 million (19%) reduction from R&D credits |
2015
• | $231.4 million (655%) reduction from the valuation allowance release against a significant portion of our deferred tax assets. The tax benefit is primarily comprised of U.S. federal and state net operating loss carryforwards, R&D tax credits, and other temporary differences |
• | $5.8 million (16%) reduction from rate changes due to changes in state law |
37
• | $2.1 million (6%) reduction from adjustments relating to the discontinuation of the Avinza product line |
• | $27.2 million (77%) increase in uncertain tax positions |
• | $3.3 million (9%) increase in deferred tax assets from completion of 382 analysis |
• | $1.7 million (5%) increase from non-cash CVR and contingent liability charges that are nondeductible for tax purposes |
Discontinued operations
In 2006, we entered into a purchase agreement with Eisai pursuant to which Eisai agreed to acquire our Oncology product line which included four marketed oncology drugs: ONTAK, Targretin capsules, Targretin gel and Panretin gel. Certain liabilities were recorded associated with the disposal of the product line. During the year ended December 31, 2016 we recognized a $1.1 million gain due to subsequent changes in certain estimates and liabilities previously recorded. We recorded a provision for income taxes related to the gain of $0.4 million.
Liquidity and Capital Resources
We have financed our operations through offerings of our equity securities, borrowings from long-term debt, issuance of convertible notes, product sales and the subsequent sales of our commercial assets, royalties, license fees, milestones and other revenues, and capital and operating lease transactions.
We had net income of $12.6 million for the year ended December 31, 2017. At December 31, 2017, our accumulated deficit was $400.9 million and we had a working capital deficit of $1.8 million. We believe that our currently available funds, cash generated from operations as well as existing sources of and access to financing will be sufficient to fund our anticipated operating, capital requirements and debt service requirement. We expect to build cash in the future as we continue to generate significant cash flow from royalty, license and milestone revenue and Captisol material sales primarily driven by continued increases in Promacta, Kyprolis and Evomela sales, recent product approvals and regulatory developments, as well as revenue from anticipated new licenses and milestones. In addition, we anticipate that our liquidity needs can be met through other sources, including sales of marketable securities, borrowings through commercial paper and/or syndicated credit facilities and access to other domestic and foreign debt markets and equity markets.
Investments
We invest our excess cash principally in U.S. government debt securities, investment-grade corporate debt securities and certificates of deposit. We have established guidelines relative to diversification and maturities of our investments in order to provide both safety and liquidity. These guidelines are periodically reviewed and modified to take advantage of trends in yields and interest rates. Additionally, we own certain securities which are classified as short-term investments that we received as a result of a milestone and an upfront license payment as well as 6.3 million shares in Viking.
Borrowings and Other Liabilities
2019 Convertible Senior Notes
We have convertible debt outstanding as of December 31, 2017 related to our 2019 Convertible Senior Notes. In August 2014, we issued $245.0 million aggregate principal amount of convertible senior unsecured notes. The Notes are convertible into common stock upon satisfaction of certain conditions. Interest of 0.75% per year is payable semi-annually on August 15th and February 15th through the maturity of the notes in August 2019.
Upon the occurrence of certain circumstances, holders of the 2019 Convertible Senior Notes may redeem all or a portion of their notes, which may require the use of a substantial amount of cash. At December 31, 2017, we had a working capital deficit of $1.8 million, which includes the 2019 Convertible Senior notes that are currently redeemable as of December 31, 2016 but excludes another $18.9 million that is classified as mezzanine equity. As noted in Note 6, the debt may change from current to non-current period over period, primarily as a result of changes in the Company’s stock price. Management believes that it is remote that holders of the notes would choose to convert their notes early because the fair value of the security that a noteholder can currently realize in an active market is greater than the conversion value the noteholder would realize upon early conversion. In the unlikely event that all the debt was converted, we have 3 business days following a 50 trading day observation period from the convert date to pay the principal in cash. We have positive operating income and positive cash flow from operations for the three years ended December 31, 2017 and, accordingly, while there can be no
38
assurance, we believe we have the ability to raise additional capital through our active S-3, by liquidating assets, or via alternative financing arrangements such as convertible or high yield debt.
Repurchases of Common Stock
During the year ended December 31, 2017, we repurchased 14,000 common shares at a weighted average price of $140.43 per share, pursuant to the repurchase plan, or approximately $2.0 million of common shares.
Contingent Liabilities
Crystal
In connection with the acquisition of Crystal in October 2017, we may be required to pay up to an additional $10.5 million in purchase consideration upon achievement of certain commercial and development milestones to the Crystal shareholders. See footnote 7, Balance Sheet Account Details.
CyDex
In connection with the acquisition of CyDex in January 2011, we issued a series of CVRs and also assumed certain contingent liabilities. We may be required to make additional payments upon achievement of certain clinical and regulatory milestones to the CyDex shareholders and former license holders. See footnote 7, Balance Sheet Account Details.
Metabasis
In connection with the acquisition of Metabasis in January 2010, we entered into four CVR agreements with Metabasis shareholders. The CVRs entitle the holders to cash payments as frequently as every six months as proceeds are received by us upon the sale or licensing of any of the Metabasis drug development programs and upon the achievement of specified milestones. See footnote 7, Balance Sheet Account Details.
Leases and Off-Balance Sheet Arrangements
We lease our office facilities under operating lease arrangements with varying terms through April 2023. The agreements provide for increases in annual rents based on changes in the Consumer Price Index or fixed percentage increases of 3.0%. We had no off-balance sheet arrangements at December 31, 2017, 2016 and 2015.
Contractual Obligations
As of December 31, 2017, future minimum payments due under our contractual obligations are as follows (in thousands):
Payments Due by Period | |||||||||||||||||||
Total | Less than 1 year | 1-2 years | 3-4 years | Thereafter | |||||||||||||||
Purchase obligations (1) | $ | 9,310 | $ | 7,182 | $ | 2,128 | $ | — | $ | — | |||||||||
Contingent liabilities (2) | $ | 1,000 | $ | 1,000 | $ | — | $ | — | $ | — | |||||||||
Note and interest payment obligations | $ | 248,676 | $ | 1,838 | $ | 246,838 | $ | — | $ | — | |||||||||
Operating lease obligations (3) | $ | 3,745 | $ | 1,375 | $ | 1,701 | $ | 619 | $ | 50 | |||||||||
(1) | Purchase obligations represent our commitments under our supply agreement with Hovione for Captisol purchases. |
(2) | Contingent liabilities to former shareholders and license holders are subjective and affected by changes in inputs to the valuation model including management’s assumptions regarding revenue volatility, probability of commercialization of products, estimates of timing and probability of achievement of certain revenue thresholds and developmental and regulatory milestones and affect amounts owed to former license holders and CVR holders. As of December 31, 2017, only those liabilities for revenue sharing payments and milestones achieved as a result of 2017 activities are included in the table above. |
(3) | We lease an office and research facility, which we have fully vacated under operating lease arrangements expiring on June 2019. We sublet these facilities through the end of our lease. As of December 31, 2017, we expect to receive aggregate future minimum lease payments totaling $1.0 million (non-discounted) over the duration of the sublease agreement as follows and not included in the table above: less than a year $0.6 million and two to three years $0.4 million. |
39
Cash Flow Summary
(in thousands) | 2017 | 2016 | 2015 | |||||||||
Net cash provided by (used in): | ||||||||||||
Operating activities | $ | 93,568 | $ | 63,001 | $ | 41,727 | ||||||
Investing activities | (84,177 | ) | (143,192 | ) | (112,862 | ) | ||||||
Financing activities | (7,523 | ) | 1,515 | 8,360 | ||||||||
Net increase (decrease) in cash and cash equivalents | $ | 1,868 | $ | (78,676 | ) | $ | (62,775 | ) | ||||
In 2017, we generated cash from operations and from issuance of common stock under employee stock plans. During the same period we used cash for investing activities, including net purchases of short-term investments, payments made to acquire Crystal, payments to CVR holders and capital expenditures. We also used cash to pay taxes related to net share settlement of equity awards and to repurchase shares of our common stock.
In 2016, we generated cash from operations and from issuance of common stock under employee stock plans. During the same period we used cash for investing activities, including net purchases of short-term investments, payments made to acquire OMT, commercial license rights from Cormatrix, Viking common stock and shares of an equity method investee, payments to CVR holders and capital expenditures. We also used cash to pay taxes related to net share settlement of equity awards and to repurchase shares of our common stock.
In 2015, we generated cash from operations and from issuance of common stock under employee stock plans. During the same period we used cash for investing activities, including net purchases of short-term investments, payments made to acquire commercial license rights from Selexis and Viking common stock, payments to CVR holders and capital expenditures. We also used cash to repurchase share of our common stock.
Critical Accounting Policies
Certain of our policies require the application of management judgment in making estimates and assumptions that affect the amounts reported in the consolidated financial statements and disclosures made in the accompanying notes. Those estimates and assumptions are based on historical experience and various other factors deemed to be applicable and reasonable under the circumstances. The use of judgment in determining such estimates and assumptions is by nature, subject to a degree of uncertainty. Accordingly, actual results could differ materially from the estimates made. Our critical accounting policies are as follows:
Revenue Recognition
We recognize revenue when persuasive evidence of an arrangement exists, delivery has occurred or service has been provided, title has transferred or access has been given, the price is fixed or determinable, there are no remaining customer acceptance requirements, and collectability of the resulting receivable is reasonably assured.
Royalties on sales of products commercialized by our partners are recognized in the quarter reported by the respective partner. Generally, we receive royalty reports from our licensees approximately one quarter in arrears due to the fact that our agreements require partners to report product sales between 30-60 days after the end of the quarter. The Company recognizes royalty revenues when it can reliably estimate such amounts and collectability is reasonably assured. Under this accounting policy, the royalty revenues reported are not based upon estimates and such royalty revenues are typically reported to the Company by its partners in the same period in which payment is received.
Revenue from material sales of Captisol is recognized upon transfer of title, which normally passes upon shipment to the customer, provided all other revenue recognition criteria have been met. All product returns are subject to the Company's credit and exchange policy, approval by the Company and a 20% restocking fee. To date, product returns by customers have not been material to net material sales in any related period. The Company records revenue net of product returns, if any, and sales tax collected and remitted to government authorities during the period.
Many of the Company's revenue arrangements for Captisol involve a license agreement with the supply of manufactured Captisol product. Licenses may be granted to pharmaceutical companies for the use of Captisol product in the development of pharmaceutical compounds. The supply of the Captisol product may be for all phases of clinical trials and
40
through commercial availability of the host drug or may be limited to certain phases of the clinical trial process. The Company evaluates the deliverables in these agreements to determine whether they have stand-alone value to our customers and therefore meet the criteria to be accounted for as separate units of accounting or they should be combined with other deliverables and accounted for as a single unit of accounting. Management believes that the Company's licenses have stand-alone value at the outset of an arrangement because the customer obtains the right to use Captisol in its formulations without any additional input by the Company.
Other nonrefundable, upfront license fees are recognized as revenue upon delivery of the license, if the license is determined to have standalone value that is not dependent on any future performance by the Company under the applicable collaboration agreement. Nonrefundable contingent event-based payments are recognized as revenue when the contingent event is met, which is usually the earlier of when payments are received or collections are assured, provided that it does not require future performance by the Company. Sales-based contingent payments from partners are accounted for similarly to royalties, with revenue recognized upon achievement of the sales targets assuming all other revenue recognition criteria are met. The Company occasionally has sub-license obligations related to arrangements for which it receives license fees, milestones and royalties. The Company evaluates the determination of gross versus net reporting based on each individual agreement.
Revenue from development and regulatory milestones is recognized when earned, as evidenced by written acknowledgement from the collaborator, provided that (1) the milestone event is substantive, its achievability was not reasonably assured at the inception of the agreement, and the Company has no further performance obligations relating to that event, and (2) collectability is reasonably assured. If these criteria are not met, the milestone payment is recognized over the remaining period of the Company’s performance obligations under the arrangement.
Revenue from research funding under our collaboration agreements is earned and recognized on a percentage-of completion basis as research hours are incurred in accordance with the provisions of each agreement.
Intangible Assets and Other Long-Lived Assets — Impairment Assessments
We regularly perform reviews to determine if the carrying values of our long-lived assets are impaired. A review of identifiable intangible assets and other long-lived assets is performed when an event occurs indicating the potential for impairment. If indicators of impairment exist, we assess the recoverability of the affected long-lived assets and compare their fair values to the respective carrying amounts.
In order to estimate the fair value of identifiable intangible assets and other long-lived assets, we estimate the present value of future cash flows from those assets. The key assumptions that we use in our discounted cash flow model are the amount and timing of estimated future cash flows to be generated by the asset over an extended period of time and a rate of return that considers the relative risk of achieving the cash flows, the time value of money, and other factors that a willing market participant would consider. Significant judgment is required to estimate the amount and timing of future cash flows and the relative risk of achieving those cash flows.
Assumptions and estimates about future values and remaining useful lives are complex and often subjective. They can be affected by a variety of factors, including external factors such as industry and economic trends, and internal factors such as changes in our business strategy and our internal forecasts. For example, if our future operating results do not meet current forecasts or if we experience a sustained decline in our market capitalization that is determined to be indicative of a reduction in fair value of our reporting unit, we may be required to record future impairment charges for purchased intangible assets. Impairment charges could materially decrease our future net income and result in lower asset values on our balance sheet.
Contingent Liabilities
In October 2017, we acquired Crystal for total cash consideration of $26.8 million, plus contingent consideration of up to an additional $10.5 million over a five year period following the acquisition date based on certain research milestones and a portion of the payments that we receive from a specified part of the historical Crystal business. The contingent consideration is measured at fair value using an income approach valuation technique, specifically with probability weighted and discounted cash flows. The fair value of the liability is assessed at each reporting date and the change in fair value is recorded in our consolidated statements of operations. The carrying amount of the liability may fluctuate significantly and actual amounts paid may be materially different than the carrying amount of the liability. The fair value of the contingent consideration liability as of December 31, 2017 was $8.4 million.
In connection with our acquisition of CyDex in January 2011, we recorded contingent liabilities for amounts potentially due to holders of the CyDex CVRs and certain other contingency payments. The fair value of the liability is assessed at each reporting date using the income approach incorporating the estimated future cash flows from potential
41
milestones and revenue sharing. The change in fair value is recorded in our consolidated statements of operations. The carrying amount of the liability may fluctuate significantly and actual amounts paid may be materially different than the carrying amount of the liability.
In connection with our acquisition of Metabasis in January 2010, we issued Metabasis stockholders four tradable CVRs, one CVR from each of four respective series of CVR, for each Metabasis share. The CVRs entitle Metabasis stockholders to cash payments as proceeds are received by us from the sale or partnering of any of the Metabasis drug development programs. The fair values of the CVRs are remeasured at each reporting date through the term of the related agreement. Changes in the fair values are reported in the statement of operations as income (decreases) or expense (increases). The carrying amount of the liability may fluctuate significantly based upon quoted market prices and actual amounts paid under the agreements may be materially different than the carrying amount of the liability.
Income Taxes
Our provision for income taxes, deferred tax assets and liabilities, and reserves for unrecognized tax benefits reflect our best assessment of estimated future taxes to be paid. Significant judgments and estimates based on interpretations of existing tax laws or regulations in the United States are required in determining our provision for income taxes. Changes in tax laws, statutory tax rates, and estimates of our future taxable income could impact the deferred tax assets and liabilities provided for in the consolidated financial statements and would require an adjustment to the provision for income taxes.
In accordance with the Tax Act, we have recorded a provision for income taxes of $32.4 million. The impact of the Tax Act primarily represents the impact of revaluing our U.S. deferred tax assets and liabilities based on the rates at which they are expected to reverse in the future. For U.S. federal purposes the corporate statutory income tax rate was reduced from 35% to 21%, effective for our 2018 tax year. The provisional impact of the Tax Act is our current best estimate based on a preliminary review of the new law and is subject to revision based on our existing accounting for income taxes policy as further information is gathered, and interpretation and analysis of the tax legislation evolves. The Securities and Exchange Commission has issued rules allowing for a measurement period of up to one year after the enactment date of the Tax Act to finalize the recording of the related tax impacts. Any future changes to our provisional estimated impact of the Tax Act will be included as an adjustment to the provision for income taxes.
Deferred tax assets are regularly assessed to determine the likelihood they will be recovered from future taxable income. A valuation allowance is established when we believe it is more likely than not the future realization of all or some of a deferred tax asset will not be achieved. In evaluating our ability to recover deferred tax assets within the jurisdiction which they arise, we consider all available positive and negative evidence. Factors reviewed include the cumulative pre-tax book income for the past three years, scheduled reversals of deferred tax liabilities, our history of earnings and reliability of our forecasts, projections of pre-tax book income over the foreseeable future, and the impact of any feasible and prudent tax planning strategies.
We recognize the impact of a tax position in our financial statements only if that position is more likely than not of being sustained upon examination by taxing authorities, based on the technical merits of the position. Tax authorities regularly examine our returns in the jurisdictions in which we do business and we regularly assess the tax risk of our return filing positions. Due to the complexity of some of the uncertainties, the ultimate resolution may result in payments that are materially different from our current estimate of the tax liability. These differences, as well as any interest and penalties, will be reflected in the provision for income taxes in the period in which they are determined.
Recent Accounting Pronouncements
For the summary of recent accounting pronouncements applicable to our consolidated financial statements, see footnote 1, Basis of Presentation and Summary of Significant Accounting Policies.
Item 7A. | Quantitative and Qualitative Disclosures About Market Risk |
We are exposed to market risk from interest rates and equity prices which could affect our results of operations, financial condition and cash flows. We manage our exposure to these market risks through our regular operating and financing activities.
Investment Portfolio Risk
42
At December 31, 2017, our investment portfolio included investments in available-for-sale equity securities of $181.0 million. These securities are subject to market risk and may decline in value based on market conditions.
Equity Price Risk
Our 2019 Convertible Senior Notes include conversion and settlement provisions that are based on the price of our common stock at conversion or maturity of the notes, as applicable. The minimum amount of cash we may be required to pay is $245.0 million, but will ultimately be determined by the price of our common stock. The fair values of our 2019 Convertible Senior Notes are dependent on the price and volatility of our common stock and will generally increase or decrease as the market price of our common stock changes. In order to minimize the impact of potential dilution to our common stock upon the conversion of the 2019 Convertible Senior Notes, we entered into convertible bond hedges covering 3,264,643 shares of our common stock. Concurrently with entering into the convertible bond hedge transactions, we entered into warrant transactions whereby we sold warrants with an exercise price of approximately $125.08 per share, subject to adjustment. Throughout the term of the 2019 Convertible Senior Notes, the notes may have a dilutive effect on our earnings per share to the extent the stock price exceeds the conversion price of the notes. Additionally, the warrants may have a dilutive effect on our earnings per share to the extent the stock price exceeds the strike price of the warrants.
Foreign Currency Risk
Through our licensing and business operations, we are exposed to foreign currency risk. Foreign currency exposures arise from transactions denominated in a currency other than the functional currency and from foreign denominated revenues and profit translated into U.S. dollars. Our license partners sell our products worldwide in currencies other than the U.S. dollar. Because of this, our revenues from royalty payments are subject to risk from changes in exchange rates.
We purchase Captisol from Hovione, located in Lisbon, Portugal. Payments to Hovione are denominated and paid in U.S. dollars; however the unit price of Captisol contains an adjustment factor which is based on the sharing of foreign currency risk between the two parties. The effect of an immediate 10% change in foreign exchange rates would not have a material impact on our financial condition, results of operations or cash flows. We do not currently hedge our exposures to foreign currency fluctuations.
Interest Rate Risk
We are exposed to market risk involving rising interest rates. To the extent interest rates rise, our interest costs could increase. An increase in interest costs of 10% would not have a material impact on our financial condition, results of operations or cash flows.
43
Item 8. | Consolidated Financial Statements and Supplementary Data |
INDEX TO CONSOLIDATED FINANCIAL STATEMENTS
Page | |
44
REPORT OF INDEPENDENT REGISTERED PUBLIC ACCOUNTING FIRM
The Board of Directors and Stockholders of Ligand Pharmaceuticals Incorporated
Opinion on the Financial Statements
We have audited the accompanying consolidated balance sheets of Ligand Pharmaceuticals Incorporated (the Company) as of December 31, 2017 and 2016, the related consolidated statements of operations, comprehensive income (loss), stockholders‘ equity and cash flows for the years then ended, and the related notes (collectively referred to as the “consolidated financial statements”). In our opinion, the consolidated financial statements present fairly, in all material respects, the financial position of the Company as of December 31, 2017 and 2016, and the results of its operations and its cash flows for the years then ended, in conformity with US generally accepted accounting principles.
We also have audited, in accordance with the standards of the Public Company Accounting Oversight Board (United States) (PCAOB), the Company’s internal control over financial reporting as of December 31, 2017, based on criteria established in Internal Control-Integrated Framework issued by the Committee of Sponsoring Organizations of the Treadway Commission (2013 Framework), and our report dated March 1, 2018 expressed an unqualified opinion thereon.
Adoption of ASU No. 2016-09
As discussed in Note 1 to the consolidated financial statements, the Company changed its method of accounting for share-based payment transactions in 2017 due to the adoption of the amendments to the FASB Accounting Standards Codification resulting from Accounting Standards Update (ASU) No. 2016-09, Compensation - Stock Compensation (Topic 718): Improvements to Employee Share-Based Payment Accounting, effective January 1, 2017.
Basis for Opinion
These financial statements are the responsibility of the Company’s management. Our responsibility is to express an opinion on the Company‘s financial statements based on our audits. We are a public accounting firm registered with the PCAOB and are required to be independent with respect to the Company in accordance with the US federal securities laws and the applicable rules and regulations of the Securities and Exchange Commission and the PCAOB.
We conducted our audits in accordance with the standards of the PCAOB. Those standards require that we plan and perform the audit to obtain reasonable assurance about whether the financial statements are free of material misstatement, whether due to error or fraud. Our audits included performing procedures to assess the risks of material misstatement of the financial statements, whether due to error or fraud, and performing procedures that respond to those risks. Such procedures included examining, on a test basis, evidence regarding the amounts and disclosures in the financial statements. Our audits also included evaluating the accounting principles used and significant estimates made by management, as well as evaluating the overall presentation of the financial statements. We believe that our audits provide a reasonable basis for our opinion.
/s/ Ernst & Young LLP
We have served as the Company‘s auditor since 2016.
San Diego, California
March 1, 2018
45
Report of Independent Registered Public Accounting Firm
Board of Directors and Shareholders of Ligand Pharmaceuticals Incorporated
We have audited the accompanying consolidated balance sheet of Ligand Pharmaceuticals Incorporated (the “Company”) as of December 31, 2015 (not presented herein), and the related consolidated statements of operations, comprehensive income (loss), stockholders’ equity, and cash flows for the year ended December 31, 2015. These financial statements are the responsibility of the Company’s management. Our responsibility is to express an opinion on these financial statements based on our audit.
We conducted our audit in accordance with the standards of the Public Company Accounting Oversight Board (United States). Those standards require that we plan and perform the audit to obtain reasonable assurance about whether the financial statements are free of material misstatement. An audit includes examining, on a test basis, evidence supporting the amounts and disclosures in the financial statements. An audit also includes assessing the accounting principles used and significant estimates made by management, as well as evaluating the overall financial statement presentation. We believe that our audit provides a reasonable basis for our opinion.
In our opinion, the consolidated financial statements referred to above present fairly, in all material respects, the financial position of Ligand Pharmaceuticals Incorporated as of December 31, 2015, and the results of its operations and its cash flows for the year ended December 31, 2015 in conformity with accounting principles generally accepted in the United States of America.
/s/ GRANT THORNTON LLP
San Diego, California
February 26, 2016 (except for 2015 Restatement described in Note 1 in the previously filed 2015 financial statements, which is not presented herein and is as of November 14, 2016 and except for Condensed Statement of Operations table for Viking included in Note 2, which is as of March 1, 2018)
46
LIGAND PHARMACEUTICALS INCORPORATED
CONSOLIDATED BALANCE SHEETS
(in thousands, except share data)
December 31, | |||||||
2017 | 2016 | ||||||
ASSETS | |||||||
Current assets: | |||||||
Cash and cash equivalents | $ | 20,620 | $ | 18,752 | |||
Short-term investments | 181,041 | 122,296 | |||||
Accounts receivable, net | 25,596 | 14,700 | |||||
Note receivable from Viking | 3,877 | 3,207 | |||||
Inventory | 4,373 | 1,923 | |||||
Other current assets | 1,514 | 2,175 | |||||
Total current assets | 237,021 | 163,053 | |||||
Deferred income taxes | 84,422 | 123,891 | |||||
Investment in Viking | 6,438 | 8,345 | |||||
Intangible assets, net | 228,584 | 204,705 | |||||
Goodwill | 85,959 | 72,207 | |||||
Commercial license rights | 19,526 | 25,821 | |||||
Property and equipment, net | 4,212 | 1,819 | |||||
Other assets | 4,859 | 1,744 | |||||
Total assets | $ | 671,021 | $ | 601,585 | |||
LIABILITIES AND STOCKHOLDERS’ EQUITY | |||||||
Current liabilities: | |||||||
Accounts payable | $ | 2,259 | $ | 2,734 | |||
Accrued liabilities | 7,377 | 6,397 | |||||
Current contingent liabilities | 4,703 | 5,088 | |||||
2019 convertible senior notes, net | 224,529 | 212,910 | |||||
Total current liabilities | 238,868 | 227,129 | |||||
Long-term contingent liabilities | 9,258 | 2,916 | |||||
Long-term deferred revenue, net | 3,525 | — | |||||
Other long-term liabilities | 723 | 687 | |||||
Total liabilities | 252,374 | 230,732 | |||||
Commitments and contingencies | |||||||
Equity component of currently redeemable convertible notes (Note 6) | 18,859 | 29,563 | |||||
Stockholders’ equity: | |||||||
Common stock, $0.001 par value; 33,333,333 shares authorized; 21,148,665 and 20,909,301 shares issued and outstanding at December 31, 2017 and 2016, respectively | 21 | 21 | |||||
Additional paid-in capital | 798,205 | 769,653 | |||||
Accumulated other comprehensive income | 2,486 | 2,743 | |||||
Accumulated deficit | (400,924 | ) | (431,127 | ) | |||
Total stockholders’ equity | 399,788 | 341,290 | |||||
Total liabilities and stockholders’ equity | $ | 671,021 | $ | 601,585 | |||
47
LIGAND PHARMACEUTICALS INCORPORATED
CONSOLIDATED STATEMENTS OF OPERATIONS
(in thousands, except per share amounts)
Year Ended December 31, | |||||||||||
2017 | 2016 | 2015 | |||||||||
Revenues: | |||||||||||
Royalties | $ | 88,685 | $ | 59,423 | $ | 38,194 | |||||
Material sales | 22,070 | 22,502 | 27,662 | ||||||||
License fees, milestones and other revenues | 30,347 | 27,048 | 6,058 | ||||||||
Total revenues | 141,102 | 108,973 | 71,914 | ||||||||
Operating costs and expenses: | |||||||||||
Cost of sales(2) | 5,366 | 5,571 | 5,807 | ||||||||
Amortization of intangibles | 12,120 | 10,643 | 2,375 | ||||||||
Research and development | 26,887 | 21,221 | 11,005 | ||||||||
General and administrative | 28,653 | 27,653 | 25,398 | ||||||||
Total operating costs and expenses | 73,026 | 65,088 | 44,585 | ||||||||
Income from operations | 68,076 | 43,885 | 27,329 | ||||||||
Other (expense) income: | |||||||||||
Interest expense, net | (11,400 | ) | (12,178 | ) | (11,802 | ) | |||||
Increase in contingent liabilities | (2,580 | ) | (3,334 | ) | (5,013 | ) | |||||
Gain on deconsolidation of Viking | — | — | 28,190 | ||||||||
Loss from Viking | (2,048 | ) | (23,132 | ) | (5,143 | ) | |||||
Other income, net | 5,183 | 2,719 | 1,768 | ||||||||
Total other (expense) income, net | (10,845 | ) | (35,925 | ) | 8,000 | ||||||
Income before income tax benefit (expense) | 57,231 | 7,960 | 35,329 | ||||||||
Income tax benefit (expense) | (44,675 | ) | (10,327 | ) | 192,115 | ||||||
Income (loss) from operations | 12,556 | (2,367 | ) | 227,444 | |||||||
Discontinued operations: | |||||||||||
Gain on sale of Oncology Product Line before income taxes | — | 1,139 | — | ||||||||
Income tax expense on discontinued operations | — | (408 | ) | — | |||||||
Income from discontinued operations | — | 731 | — | ||||||||
Net income (loss) including noncontrolling interests: | 12,556 | (1,636 | ) | 227,444 | |||||||
Less: Net loss attributable to noncontrolling interests | — | — | (2,380 | ) | |||||||
Net income (loss) | $ | 12,556 | $ | (1,636 | ) | $ | 229,824 | ||||
Basic per share amounts(1): | |||||||||||
Income (loss) from continuing operations | $ | 0.60 | $ | (0.11 | ) | $ | 11.61 | ||||
Income from discontinued operations | — | 0.04 | — | ||||||||
Net income (loss) | $ | 0.60 | $ | (0.08 | ) | $ | 11.61 | ||||
Diluted per share amounts(1): | |||||||||||
Income (loss) from continuing operations | $ | 0.53 | $ | (0.11 | ) | $ | 10.83 | ||||
Income from discontinued operations | — | 0.04 | — | ||||||||
Net income (loss) | $ | 0.53 | $ | (0.08 | ) | $ | 10.83 | ||||
Shares used for computation (in thousands) | |||||||||||
Basic | 21,032 | 20,831 | 19,790 | ||||||||
Diluted | 23,481 | 20,831 | 21,228 | ||||||||
(1) The sum of net income per share amounts may not equal the total due to rounding
(2) Excludes amortization of intangibles
See accompanying notes to these consolidated financial statements.
48
LIGAND PHARMACEUTICALS INCORPORATED
CONSOLIDATED STATEMENTS OF COMPREHENSIVE INCOME (LOSS)
(in thousands)
Year Ended December 31, | |||||||||||
2017 | 2016 | 2015 | |||||||||
Net income (loss) | $ | 12,556 | $ | (1,636 | ) | $ | 229,824 | ||||
Unrealized net gain on available-for-sale securities, net of tax | 143 | 93 | 1,933 | ||||||||
Less:Reclassification of net realized gains included in net income, net of tax | $ | (400 | ) | $ | (2,253 | ) | $ | (1,965 | ) | ||
Comprehensive income (loss) | $ | 12,299 | $ | (3,796 | ) | $ | 229,792 | ||||
See accompanying notes to these consolidated financial statements.
49
LIGAND PHARMACEUTICALS INCORPORATED
CONSOLIDATED STATEMENT OF STOCKHOLDERS’ EQUITY
(in thousands, except share data)
Common Stock | Additional paid-in capital | Accumulated other comprehensive income (loss) | Accumulated deficit | Noncontrolling interest | Total stockholders’ equity | ||||||||||||||||||||||
Shares | Amount | ||||||||||||||||||||||||||
Balance at December 31, 2014 | 19,575,150 | $ | 20 | $ | 680,660 | $ | 4,953 | $ | (659,315 | ) | $ | (1,910 | ) | $ | 24,408 | ||||||||||||
Issuance of common stock under employee stock compensation plans, net | 379,982 | — | 8,849 | — | — | — | 8,849 | ||||||||||||||||||||
Reclassification of equity component of currently redeemable convertible notes | — | — | (39,628 | ) | — | — | — | (39,628 | ) | ||||||||||||||||||
Stock-based compensation | — | — | 12,458 | — | — | — | 12,458 | ||||||||||||||||||||
Repurchase of common stock | (6,120 | ) | — | (489 | ) | — | — | — | (489 | ) | |||||||||||||||||
Other comprehensive income | — | — | — | (50 | ) | — | — | (50 | ) | ||||||||||||||||||
Net income | — | — | — | — | 229,824 | — | 229,824 | ||||||||||||||||||||
Net loss in noncontrolling interests | — | — | — | — | — | (2,380 | ) | (2,380 | ) | ||||||||||||||||||
Deconsolidation of Viking | — | — | — | — | — | 4,290 | 4,290 | ||||||||||||||||||||
Balance at December 31, 2015 | 19,949,012 | $ | 20 | $ | 661,850 | $ | 4,903 | $ | (429,491 | ) | $ | — | $ | 237,282 | |||||||||||||
Issuance of common stock under employee stock compensation plans, net | 210,626 | — | 5,416 | — | — | — | 5,416 | ||||||||||||||||||||
Shares issued in OMT acquisition | 790,163 | 1 | 77,330 | — | — | — | 77,331 | ||||||||||||||||||||
Reclassification of equity component of currently redeemable convertible notes | — | — | 10,065 | — | — | — | 10,065 | ||||||||||||||||||||
Stock-based compensation | — | — | 18,893 | — | — | — | 18,893 | ||||||||||||||||||||
Repurchase of common stock | (40,500 | ) | — | (3,901 | ) | — | — | — | (3,901 | ) | |||||||||||||||||
Other comprehensive income | — | — | — | (2,160 | ) | — | — | (2,160 | ) | ||||||||||||||||||
Net income | — | — | — | — | (1,636 | ) | — | (1,636 | ) | ||||||||||||||||||
Balance at December 31, 2016 | 20,909,301 | $ | 21 | $ | 769,653 | $ | 2,743 | $ | (431,127 | ) | $ | — | $ | 341,290 | |||||||||||||
Issuance of common stock under employee stock compensation plans, net | 253,364 | — | (5,558 | ) | — | — | — | (5,558 | ) | ||||||||||||||||||
Reclassification of equity component of currently redeemable convertible notes | — | — | 10,704 | — | — | — | 10,704 | ||||||||||||||||||||
Stock-based compensation | — | — | 24,916 | — | — | — | 24,916 | ||||||||||||||||||||
Repurchase of common stock | (14,000 | ) | — | (1,966 | ) | — | — | — | (1,966 | ) | |||||||||||||||||
Other comprehensive income | — | — | (257 | ) | — | — | (257 | ) | |||||||||||||||||||
Cumulative-effect adjustment from adoption of ASU 2016-09 | — | — | 456 | — | 17,647 | — | — | 18,103 | |||||||||||||||||||
Net income | — | — | — | — | 12,556 | — | 12,556 | ||||||||||||||||||||
Balance at December 31, 2017 | 21,148,665 | $ | 21 | $ | 798,205 | $ | 2,486 | $ | (400,924 | ) | $ | — | $ | 399,788 | |||||||||||||
50
LIGAND PHARMACEUTICALS INCORPORATED
CONSOLIDATED STATEMENTS OF CASH FLOWS
(in thousands)
Year Ended December 31, | |||||||||||
2017 | 2016 | 2015 | |||||||||
Operating activities | |||||||||||
Net income (loss) | $ | 12,556 | $ | (1,636 | ) | $ | 227,444 | ||||
Less: gain from discontinued operations | — | 731 | — | ||||||||
Income (loss) from continuing operations | 12,556 | (2,367 | ) | 227,444 | |||||||
Adjustments to reconcile net income to net cash provided by operating activities: | |||||||||||
Change in estimated fair value of contingent liabilities | 2,580 | 3,334 | 5,013 | ||||||||
Realized gain on sale of short-term investment | (831 | ) | (2,352 | ) | (2,603 | ) | |||||
Depreciation and amortization | 11,714 | 11,290 | 2,627 | ||||||||
Gain on deconsolidation of Viking | — | — | (28,190 | ) | |||||||
Loss on equity investment in Viking | 2,048 | 23,132 | 5,143 | ||||||||
Change in fair value of the convertible debt receivable from Viking and warrants | (4,032 | ) | (462 | ) | 765 | ||||||
Amortization of premium (discount) on investments, net | (81 | ) | 348 | — | |||||||
Amortization of debt discount and issuance fees | 11,619 | 10,925 | 10,274 | ||||||||
Stock-based compensation | 24,915 | 18,893 | 12,458 | ||||||||
Deferred income taxes | 44,518 | 10,697 | (192,132 | ) | |||||||
Other | — | 183 | 107 | ||||||||
Changes in operating assets and liabilities, net of acquisition: | |||||||||||
Accounts receivable, net | (8,358 | ) | (8,525 | ) | 6,489 | ||||||
Inventory | (843 | ) | (244 | ) | (401 | ) | |||||
Other current assets | 402 | 526 | 987 | ||||||||
Accounts payable and accrued liabilities | (1,713 | ) | (2,369 | ) | (4,027 | ) | |||||
Deferred revenue | (926 | ) | (8 | ) | (2,227 | ) | |||||
Net cash provided by operating activities | 93,568 | 63,001 | 41,727 | ||||||||
Investing activities | |||||||||||
Purchase of commercial license rights | — | (17,695 | ) | (4,030 | ) | ||||||
Purchase of Viking common stock and warrant | — | (700 | ) | (9,000 | ) | ||||||
Reduction of cash due to deconsolidation of Viking | — | — | (247 | ) | |||||||
Purchase of common stock in equity method investment | — | (1,000 | ) | — | |||||||
Cash paid for acquisition, net of cash acquired | (26,653 | ) | (92,502 | ) | — | ||||||
Payments to CVR holders and other contingency payments | (4,998 | ) | (8,777 | ) | (6,740 | ) | |||||
Purchases of property and equipment | (2,156 | ) | (1,850 | ) | (93 | ) | |||||
Purchases of short-term investments | (254,258 | ) | (164,438 | ) | (166,025 | ) | |||||
Proceeds from sale of short-term investments | 86,985 | 24,596 | 16,039 | ||||||||
Proceeds from maturity of short-term investments | 109,649 | 118,874 | 57,234 | ||||||||
Proceeds from commercial license rights | 7,054 | — | — | ||||||||
Proceeds received from repayment of Viking note receivable | 200 | 300 | — | ||||||||
Net cash used in investing activities | (84,177 | ) | (143,192 | ) | (112,862 | ) | |||||
Financing activities | |||||||||||
Net proceeds from stock option exercises and ESPP | 4,517 | 6,415 | 8,849 | ||||||||
Taxes paid related to net share settlement of equity awards | (10,074 | ) | (999 | ) | — | ||||||
Share repurchases | (1,966 | ) | (3,901 | ) | (489 | ) | |||||
Net cash (used in) provided by financing activities | (7,523 | ) | 1,515 | 8,360 | |||||||
Net increase (decrease) in cash and cash equivalents | 1,868 | (78,676 | ) | (62,775 | ) | ||||||
Cash and cash equivalents at beginning of year | 18,752 | 97,428 | 160,203 | ||||||||
Cash and cash equivalents at end of year | $ | 20,620 | $ | 18,752 | $ | 97,428 | |||||
Supplemental disclosure of cash flow information | |||||||||||
Cash paid during the year: | |||||||||||
51
Interest paid | $ | 1,838 | $ | 1,838 | $ | 1,822 | |||||
Taxes paid | $ | 157 | $ | 38 | $ | 28 | |||||
Supplemental schedule of non-cash investing and financing activities | |||||||||||
Stock issued for acquisition, net of issuance cost | $ | — | $ | (77,331 | ) | $ | — | ||||
Stock and warrant received for repayment of Viking notes receivable | $ | — | $ | 1,200 | $ | — | |||||
Accrued inventory purchases | $ | 1,007 | $ | 646 | $ | 1,333 | |||||
Unrealized gain on AFS investments | $ | 144 | $ | (1,109 | ) | $ | 3,005 | ||||
See accompanying notes to these consolidated financial statements.
52
LIGAND PHARMACEUTICALS INCORPORATED AND SUBSIDIARIES
NOTES TO CONSOLIDATED FINANCIAL STATEMENTS
1. Basis of Presentation and Summary of Significant Accounting Policies
Business
Ligand is a biopharmaceutical company with a business model based on developing or acquiring assets which generate royalty, milestone or other passive revenue for the Company and using a lean corporate cost structure. We operate in one business segment: development and licensing of biopharmaceutical assets.
Principles of Consolidation
The accompanying consolidated financial statements include Ligand and its wholly-owned subsidiaries. All significant intercompany accounts and transactions have been eliminated in consolidation.
Basis of Presentation
The Company’s accompanying consolidated financial statements have been prepared in accordance with U.S. GAAP and include the accounts of the Company and its wholly-owned subsidiaries. All intercompany transactions and balances have been eliminated in consolidation.
Reclassifications
Certain reclassifications have been made to the previously issued statement of operations for comparability purposes. These reclassifications had no effect on the reported net income (loss), stockholders' equity and operating cash flows as previously reported.
Use of Estimates
The preparation of consolidated financial statements in conformity with U.S. GAAP requires the use of estimates and assumptions that affect the amounts reported in the condensed consolidated financial statements and the accompanying notes. Actual results may differ from those estimates
Concentrations of Business Risk
Financial instruments that potentially subject the Company to significant concentrations of credit risk consist primarily of cash equivalents and investments. The Company invests its excess cash principally in United States government debt securities, investment grade corporate debt securities and certificates of deposit. The Company has established guidelines relative to diversification and maturities that maintain safety and liquidity. These guidelines are periodically reviewed and modified to take advantage of trends in yields and interest rates.
A relatively small number of partners account for a significant percentage of our revenue. Revenue from significant partners, which is defined as 10% or more of our total revenue, was as follows:
December 31, | ||||||||
2017 | 2016 | 2015 | ||||||
Partner A | 46 | % | 41 | % | 27 | % | ||
Partner B | 19 | % | 14 | % | 23 | % | ||
Partner C | — | — | 18 | % | ||||
The Company obtains Captisol from two sites at a single supplier, Hovione. If this supplier were not able to supply the requested amounts of Captisol from each site, and if our safety stocks of material were depleted, the Company would be unable to continue to derive revenues from the sale of Captisol until it obtained material from an alternative source, which could take a considerable length of time.
53
Cash Equivalents & Short Term Investments
Cash equivalents consist of all investments with maturities of three months or less from the date of acquisition. Short-term investments primarily consist of investments in debt securities that have effective maturities greater than three months and less than twelve months from the date of acquisition. The Company classifies its short-term investments as "available-for-sale". Such investments are carried at fair value, with unrealized gains and losses included in the statement of comprehensive income (loss). The Company determines the cost of investments based on the specific identification method.
Accounts Receivable
Trade accounts receivable are recorded at the net invoice value and are not interest bearing. The Company considers receivables past due based on the contractual payment terms which range from 30 to 90 days. The Company reserves specific receivables if collectability is no longer reasonably assured. The Company re-evaluates such reserves on a regular basis and adjusts its reserves as needed. Once a receivable is deemed to be uncollectible, such balance is charged against the reserve.
Inventory
Inventory, which consists of finished goods, is stated at the lower of cost or market value. The Company determines cost using the first-in, first-out method. The Company analyzes its inventory levels periodically and writes down inventory to its net realizable value if it has become obsolete, has a cost basis in excess of its expected net realizable value or is in excess of expected requirements. There were no write downs related to obsolete inventory recorded for the years ended December 31, 2017 and 2016.
Property and Equipment
Property and equipment are stated at cost, subject to review for impairment, and depreciated over the estimated useful lives of the assets, which generally range from three to ten years, using the straight-line method. Amortization of leasehold improvements is recorded over the shorter of the lease term or estimated useful life of the related asset. Maintenance and repairs are charged to operations as incurred. When assets are sold, or otherwise disposed of, the cost and related accumulated depreciation are removed from the accounts and any gain or loss is included in operating expense.
Business Combinations
The acquisition method of accounting for business combinations requires us to use significant estimates and assumptions, including fair value estimates, as of the business combination date and to refine those estimates as necessary during the measurement period (defined as the period, not to exceed one year, in which we may adjust the provisional amounts recognized for a business combination).
Under the acquisition method of accounting we recognize separately from goodwill the identifiable assets acquired, the liabilities assumed, including contingent consideration and all contractual contingencies, generally at the acquisition date fair value. Contingent purchase consideration to be settled in cash are remeasured to estimated fair value at each reporting period with the change in fair value recorded in 'Increase in contingent liabilities'. Costs that we incur to complete the business combination such as investment banking, legal and other professional fees are not considered part of consideration and we charge them to general and administrative expense as they are incurred.
We measure goodwill as of the acquisition date as the excess of consideration transferred, which we also measure at fair value, over the net of the acquisition date amounts of the identifiable assets acquired and liabilities assumed. In addition, IPR&D is capitalized and assessed for impairment annually. IPR&D is amortized upon product commercialization or upon out-licensing the underlying intellectual property where we no have active involvement in the licensee's development activities. IPR&D is amortized over the estimated life of the commercial product or licensing arrangement.
Should the initial accounting for a business combination be incomplete by the end of a reporting period that falls within the measurement period, we report provisional amounts in our financial statements. During the measurement period, we adjust the provisional amounts recognized at the acquisition date to reflect new information obtained about facts and circumstances that existed as of the acquisition date that, if known, would have affected the measurement of the amounts recognized as of that date and we record those adjustments to our financial statements in the period of change, if any.
Under the acquisition method of accounting for business combinations, if we identify changes to acquired deferred tax asset valuation allowances or liabilities related to uncertain tax positions during the measurement period and they relate to new
54
information obtained about facts and circumstances that existed as of the acquisition date, those changes are considered a measurement period adjustment and we record the offset to goodwill. We record all other changes to deferred tax asset valuation allowances and liabilities related to uncertain tax positions in current period income tax expense.
Contingent Liabilities
In connection with the acquisition of Crystal in October 2017, we may be required to pay up to an additional $10.5 million in purchase consideration upon achievement of certain commercial and development milestones to the Crystal shareholders. See footnote 7, Balance Sheet Account Details.
In connection with the Company's acquisition of CyDex in January 2011, the Company recorded a contingent liability for amounts potentially due to holders of the CyDex CVRs and former license holders. See footnote 7, Other Balance Sheet Details. The liability is periodically assessed based on events and circumstances related to the underlying milestones, royalties and material sales. In connection with the Company’s acquisition of Metabasis in January 2010 January 2010, the Company issued Metabasis stockholders four tradable CVRs for each Metabasis share. The fair values of the CVRs are remeasured at each reporting date through the term of the related agreement.
Any change in fair value is recorded in the Company's consolidated statement of operations.
Goodwill, Intangible Assets and Other Long-Lived Assets
Goodwill, which has an indefinite useful life, represents the excess of cost over fair value of net assets acquired. The change in the carrying value of goodwill during the year ended December 31, 2017, was due to the acquisition of Crystal. Goodwill is reviewed for impairment at least annually during the fourth quarter, or more frequently if an event occurs indicating the potential for impairment. During the goodwill impairment review, we assess qualitative factors to determine whether it is more likely than not that the fair value of our reporting unit is less than the carrying amount, including goodwill. The qualitative factors include, but are not limited to, macroeconomic conditions, industry and market considerations, and the overall financial performance. If, after assessing the totality of these qualitative factors, we determine that it is not more likely than not that the fair value of our reporting unit is less than the carrying amount, then no additional assessment is deemed necessary. Otherwise, we proceed to perform the two-step test for goodwill impairment. The first step involves comparing the estimated fair value of the reporting unit with the carrying value, including goodwill. If the carrying amount of the reporting unit exceeds the fair value, the second step of the goodwill impairment test is performed to determine the amount of loss, which involves comparing the implied fair value of the goodwill to the carrying value of the goodwill. We may also elect to bypass the qualitative assessment in a period and elect to proceed to perform the first step of the goodwill impairment test. We performed the annual assessment for goodwill impairment in the fourth quarter of 2017, noting no impairment.
Our identifiable intangible assets are typically comprised of acquired core technologies, licensed technologies, customer relationships and trade names. The cost of identifiable intangible assets with finite lives is generally amortized on a straight-line basis over the assets’ respective estimated useful lives. We regularly perform reviews to determine if any event has occurred that may indicate that intangible assets with finite useful lives and other long-lived assets are potentially impaired. If indicators of impairment exist, an impairment test is performed to assess the recoverability of the affected assets by determining whether the carrying amount of such assets exceeds the undiscounted expected future cash flows. If the affected assets are not recoverable, we estimate the fair value of the assets and record an impairment loss if the carrying value of the assets exceeds the fair value. Factors that may indicate potential impairment include a significant decline in our stock price and market capitalization compared to the net book value, significant changes in the ability of a particular asset to generate positive cash flows, and the pattern of utilization of a particular asset.
Commercial license rights
Commercial license rights consist of the following (in thousands):
December 31, | December 31, | ||||||
2017 | 2016 | ||||||
Aziyo & CorMatrix | $ | 17,696 | $ | 17,696 | |||
Selexis | 8,602 | 8,602 | |||||
26,298 | 26,298 | ||||||
Less: accumulated amortization | (6,772 | ) | (477 | ) | |||
Total commercial rights, net | $ | 19,526 | $ | 25,821 | |||
55
Commercial license rights represent a portfolio of future milestone and royalty payment rights acquired from Selexis in April 2013 and April 2015 and CorMatrix in May 2016. Individual commercial license rights acquired are carried at allocated cost.
In May 2017, the Company entered into a Royalty Agreement with Aziyo pursuant to which the Company will receive royalties from certain marketed products that Aziyo acquired from CorMatrix. Pursuant to the Royalty Agreement, the Company received $10 million in 2017 from Aziyo to buydown the royalty rates on the products CorMatrix sold to Aziyo. The Royalty Agreement closed on May 31, 2017, in connection with the closing of the asset sale from CorMatrix to Aziyo (the “CorMatrix Asset Sale”). Pursuant to the Royalty Agreement, the Company will receive a 5% royalty on the products Aziyo acquired in the CorMatrix Asset Sale, reduced from the original 20% royalty from CorMatrix pursuant to the previously disclosed Interest Purchase Agreement, dated May 3, 2016 (the “Original Interest Purchase Agreement”) between CorMatrix and the Company. In addition, Aziyo has agreed to pay the Company up to $10 million of additional milestones tied to cumulative net sales of the products Aziyo acquired in the CorMatrix Asset Sale and to extend the term on these royalties by one year. The Royalty Agreement will terminate on May 31, 2027. In addition, in May 2017, the Company entered into an amended and restated interest purchase agreement (the “Amended Interest Purchase Agreement”) with CorMatrix, which supersedes in its entirety the Original Interest Purchase Agreement. Other than removing the commercial products sold to Aziyo in the CorMatrix Sale, the terms of the Amended Interest Purchase Agreement remain unchanged with respect to the CorMatrix developmental pipeline products, including the royalty rate of 5% on such pipeline products. The Amended Interest Purchase Agreement will terminate 10 years from the date of the first commercial sale of such products.
The Company accounts for the Aziyo commercial license right as a financial asset in accordance with ASC 310 and amortizes the commercial license right using the 'effective interest' method whereby the Company forecasts expected cash flows over the term of the arrangement to arrive at an annualized effective interest. The annual effective interest associated with the forecasted cash flows from the Royalty Agreement with Aziyo as of December 31, 2017 is 26%. Revenue is calculated by multiplying the carrying value of the commercial license right by the effective interest. The payments received in 2017 were accordingly allocated between revenue and the amortization of the commercial license rights.
We elected a prospective approach to account for changes in estimated cash flows and selected a method for determining when an impairment would be recognized and how to measure that impairment. In circumstances where our new estimate of expected cash flows is greater than previously expected, we will update our yield prospectively. While it has not occurred to date, in circumstances where our new estimate of expected cash flows is less than previously expected and below our original estimated yield we will record impairment. Impairment will be recognized by reducing the financial asset to an amount that represents the present value of our most recent estimate of expected cash flows discounted by the original effective interest rate. In circumstances where our new estimate of expected cash flows is less than previously expected, but not below our original estimated yield, we will update our yield prospectively.
The Company accounts for commercial license rights related to developmental pipeline products on a non-accrual basis. These developmental pipeline products are non-commercialized, non-approved products that require FDA or other regulatory approval, and thus have uncertain cash flows. The developmental pipeline products are on a non-accrual basis as the Company is not yet able to forecast future cash flows given their pre-commercial stages of development. The Company will prospectively update its yield model under the effective interest method once the underlying products are commercialized and the Company can reliably forecast expected cash flows. Income will be calculated by multiplying the carrying value of the commercial license right by the effective interest rate.
In 2017, the Company identified and corrected an immaterial error related to 2016. The adjustment related to the recognition of the income associated with this financial asset. The Company determined the 'effective interest' method should have been used to recognize income associated with the financial asset and that the method utilized previously was incorrect. The error had the impact of understating Commercial License Rights, revenue and net income in 2016. Management evaluated the effect of the adjustment on previously issued consolidated financial statements in accordance with SAB No. 99 and SAB No. 108 and concluded that it was qualitatively and quantitatively immaterial to the historical periods. Management also concluded that correcting the error in 2017 did not have a material impact on the 2017 financial results. As a result, in accordance with SAB No. 108, we corrected our Consolidated Balance Sheets as of June 30, 2017. The error resulted in an understatement of 2016 revenue of $1.3 million and net income of $0.8 million, or $0.04 per diluted share and overstatement of 2017 revenue of $1.3 million and net income of $0.8 million, or $0.04 per diluted share.
56
Revenue Recognition
We recognize revenue when persuasive evidence of an arrangement exists, delivery has occurred or service has been provided, title has transferred or access has been given, the price is fixed or determinable, there are no remaining customer acceptance requirements, and collectability of the resulting receivable is reasonably assured.
Royalties on sales of products commercialized by the Company’s partners are recognized in the quarter reported by the respective partner. Generally, the Company receives royalty reports from its licensees approximately one quarter in arrears due to the fact that its agreements require partners to report product sales between 30 and 60 days after the end of the quarter. The Company recognizes royalty revenues when it can reliably estimate such amounts and collectability is reasonably assured. Under this accounting policy, the royalty revenues reported are not based upon estimates and such royalty revenues are typically reported to the Company by its partners in the same period in which payment is received.
Revenue from material sales of Captisol is recognized upon transfer of title, which normally passes upon shipment to the customer, provided all other revenue recognition criteria have been met. All product returns are subject to the Company's credit and exchange policy, approval by the Company and a 20% restocking fee. To date, product returns have not been material to net material sales in any related period. The Company records revenue net of product returns, if any, and sales tax collected and remitted to government authorities during the period.
The Company analyzes its revenue arrangements and other agreements to determine whether there are multiple elements that should be separated and accounted for individually or as a single unit of accounting. For multiple element contracts, arrangement consideration is allocated at the inception of the arrangement to all deliverables on the basis of relative selling price, using a hierarchy to determine selling price. Management first considers VSOE, then TPE and if neither VSOE nor TPE exist, the Company uses its best estimate of selling price.
Many of the Company's revenue arrangements for Captisol involve a license agreement and the supply of manufactured Captisol product. Licenses may be granted to pharmaceutical companies for the use of Captisol product in the development of pharmaceutical compounds. The supply of the Captisol product may be for all phases of clinical trials and through commercial availability of the host drug or may be limited to certain phases of the clinical trial process. Management believes that the Company's licenses have stand-alone value at the outset of an arrangement because the customer obtains the right to use Captisol in its formulations without any additional input by the Company, and in a hypothetical stand-alone transaction, the customer would be able to procure inventory from another manufacturer in the absence of contractual provisions for exclusive supply by the Company.
Other nonrefundable, up-front license fees are recognized as revenue upon delivery of the license, if the license is determined to have standalone value that is not dependent on any future performance by the Company under the applicable collaboration agreement. Nonrefundable contingent event-based payments are recognized as revenue when the contingent event is met, which is usually the earlier of when payments are received or collections are assured, provided that it does not require future performance by the Company. The Company occasionally has sub-license obligations related to arrangements for which it receives license fees, milestones and royalties. Management evaluates the determination of gross versus net reporting based on each individual agreement.
Sales-based contingent payments from partners are accounted for similarly to royalties, with revenue recognized upon achievement of the sales targets assuming all other revenue recognition criteria for milestones are met. Revenue from development and regulatory milestones is recognized when earned, as evidenced by written acknowledgement from the collaborator, provided that (1) the milestone event is substantive, its achievability was not reasonably assured at the inception of the agreement, and the Company has no further performance obligations relating to that event, and (2) collectability is reasonably assured. If these criteria are not met, the milestone payment is recognized over the remaining period of the Company’s performance obligations under the arrangement.
57
Preclinical Study and Clinical Trial Accruals
Substantial portions of the Company’s preclinical studies and all of the Company’s clinical trials have been performed by third-party laboratories, CROs. The Company accounts for a significant portion of its clinical study costs according to the terms of its contracts with CROs. The terms of its CRO contracts may result in payment flows that do not match the periods over which services are provided to us under such contracts. The Company's objective is to reflect the appropriate preclinical and clinical trial expenses in its financial statements in the same period as the services occur. As part of the process of preparing its financial statements, the Company relies on cost information provided by its CROs. The Company is also required to estimate certain of its expenses resulting from its obligations under its CRO contracts. Accordingly, the Company's preclinical study and clinical trial accrual is dependent upon the timely and accurate reporting of CROs and other third-party vendors. The Company periodically evaluates its estimates to determine if adjustments are necessary or appropriate as more information becomes available concerning changing circumstances, and conditions or events that may affect such estimates. No material adjustments to preclinical study and clinical trial accrued expenses have been recognized to date.
Research and Development Expenses
Research and development expense consists of labor, material, equipment, and allocated facilities costs of the Company’s scientific staff who are working pursuant to the Company’s collaborative agreements and other research and development projects. Also included in research and development expenses are third-party costs incurred for the Company’s research programs including in-licensing costs, CRO costs and costs incurred by other research and development service vendors. We expense these costs as they are incurred. When we make payments for research and development services prior to the services being rendered, we record those amounts as prepaid assets on our consolidated balance sheet and we expense them as the services are provided
Stock-Based Compensation
The Company incurs share-based compensation expense related to restricted stock, its ESPP, and stock options
Restricted stock units (RSU) and performance stock units (PSU) are all considered restricted stock. The fair value of restricted stock is determined by the closing market price of the Company’s common stock on the date of grant. The Company recognizes share-based compensation expense based on the fair value on a straight-line basis over the requisite service periods of the awards, taking into consideration estimated forfeitures. PSU represents a right to receive a certain number of shares of common stock based on the achievement of corporate performance goals and continued employment during the vesting period. At each reporting period, the Company reassesses the probability of the achievement of such corporate performance goals and any expense change resulting from an adjustment in the estimated shares to be released are treated as a cumulative catch-up in the period of adjustment.
The Company uses the Black-Scholes-Merton option-pricing model to estimate the fair value of stock purchases under ESPP and stock options granted. The model assumptions include expected volatility, term, dividends, and the risk-free interest rate. The Company looks to historical volatility of the Company's stock to determine the expected volatility. The expected term of an award is based on historical forfeiture experience, exercise activity, and on the terms and conditions of the stock awards. The expected dividend yield is determined to be 0% given that the Company has never declared or paid regular cash dividends on its common stock and does not anticipate paying such cash dividends. The risk-free interest rate is based upon U.S. Treasury securities with remaining terms similar to the expected term of the share-based awards
The Company grants options and restricted stock awards to employees and non-employee directors. Non-employee directors are accounted for as employees. Options and restricted stock awards granted to certain non-employee directors vest one year from the date of grant. Options granted to employees vest 1/8 on the six month anniversary of the date of grant, and 1/48 each month thereafter for forty-two months. Restricted stock awards granted to employees vest over three years. All option awards generally expire ten years from the date of grant.
Stock-based compensation expense for awards to employees and non-employee directors is recognized on a straight-line basis over the vesting period until the last tranche vests.
Income Taxes
The provision for income taxes is computed using the asset and liability method, under which deferred tax assets and liabilities are recognized for the expected future tax consequences of temporary differences between the financial reporting and tax bases of assets and liabilities, and for the expected future tax benefit to be derived from tax loss and credit carryforwards. Deferred
58
tax assets and liabilities are determined using the enacted tax rates in effect for the years in which those tax assets are expected to be realized. The effect of a change in tax rates on deferred tax assets and liabilities is recognized in the provision for income taxes in the period that includes the enactment date.
Deferred tax assets are regularly assessed to determine the likelihood they will be recovered from future taxable income. A valuation allowance is established when the Company believes it is more likely than not the future realization of all or some of a deferred tax asset will not be achieved. In evaluating the ability to recover deferred tax assets within the jurisdiction which they arise the Company considers all available positive and negative evidence. Factors reviewed include the cumulative pre-tax book income for the past three years, scheduled reversals of deferred tax liabilities, history of earnings and reliable forecasting, projections of pre-tax book income over the foreseeable future, and the impact of any feasible and prudent tax planning strategies.
The Company recognizes the impact of a tax position in the financial statements only if that position is more likely than not of being sustained upon examination by taxing authorities, based on the technical merits of the position. Any interest and penalties related to uncertain tax positions will be reflected in income tax expense.
Discontinued Operations
In 2006, we entered into a purchase agreement with Eisai pursuant to which Eisai agreed to acquire our Oncology product line which included four marketed oncology drugs: ONTAK, Targretin capsules, Targretin gel and Panretin gel. Certain liabilities were recorded associated with the disposal of the product line. During the year ended December 31, 2016 we recognized a $1.1 million gain due to subsequent changes in certain estimates and liabilities previously recorded. We recorded a provision for income taxes related to the gain of $0.4 million.
Convertible Debt
In August 2014, the Company completed a $245.0 million offering of 2019 Convertible Senior Notes, which bear interest at 0.75%. The Company accounted for the 2019 Convertible Senior Notes by separating the liability and equity components of the instrument in a manner that reflects the Company's nonconvertible debt borrowing rate. As a result, the Company assigned a value to the debt component of the 2019 Convertible Senior Notes equal to the estimated fair value of similar debt instruments without the conversion feature, which resulted in the Company recording the debt instrument at a discount. The Company is amortizing the debt discount over the life of the 2019 Convertible Senior Notes as additional non-cash interest expense utilizing the effective interest method.
Upon the occurrence of certain circumstances, holders of the 2019 Convertible Senior Notes may redeem all or a portion of their notes, which may require the use of a substantial amount of cash. At December 31, 2017, we had a working capital deficit of $1.8 million, which includes the 2019 Convertible Senior notes that are currently redeemable as of December 31, 2017 but excludes another $18.9 million that is classified as mezzanine equity. As noted in Note 6, the debt may change from current to non-current period over period, primarily as a result of changes in the Company’s stock price. Management believes that it is remote that holders of the notes would choose to convert their notes early because the fair value of the security that a noteholder can currently realize in an active market is greater than the conversion value the noteholder would realize upon early conversion. In the unlikely event that all the debt was converted, we have three business days following a 50 trading day observation period from the convert date to pay the principal in cash. We have positive operating income and positive cash flow from operations since December 31, 2013 and, accordingly, while there can be no assurance, we believe we have the ability to raise additional capital through an S-3 registration or via alternative financing arrangements such as convertible or straight debt.
Income Per Share
Basic income (loss) per share is calculated by dividing net income by the weighted-average number of common shares outstanding during the period. Diluted income (loss) per share is computed based on the sum of the weighted average number of common shares and potentially dilutive common shares outstanding during the period
Potentially dilutive common shares consist of shares issuable under 2019 convertible senior notes, stock options and restricted stock. 2019 convertible senior notes have a dilutive impact when the average market price of the Company’s common stock exceeds the applicable conversion price of the respective notes. Potentially dilutive common shares from stock options and restricted stock are determined using the average share price for each period under the treasury stock method. In addition, the following amounts are assumed to be used to repurchase shares: proceeds from exercise of stock options; the average amount
59
of unrecognized compensation expense for restricted stock; and estimated tax benefits that will be recorded in additional paid-in capital when expenses related to equity awards become deductible. In loss periods, basic net loss per share and diluted net loss per share are identical since the effect of otherwise dilutive potential common shares is anti-dilutive and therefore excluded
The following table presents the calculation of weighted average shares used to calculate basic and diluted earnings per share (in thousands):
Year Ended December 31, | ||||||||
2017 | 2016 | 2015 | ||||||
Weighted average shares outstanding: | 21,032 | 20,831 | 19,790 | |||||
Dilutive potential common shares: | ||||||||
Restricted stock | 141 | — | 56 | |||||
Stock options | 1,000 | — | 882 | |||||
Warrants | 94 | — | — | |||||
2019 Convertible Senior Notes | 1,214 | — | 499 | |||||
Shares used to compute diluted income per share | 23,481 | 20,831 | 21,228 | |||||
Potentially dilutive shares excluded from calculation due to anti-dilutive effect | 335 | 3,544 | 3,333 | |||||
Comprehensive Income (Loss)
Comprehensive income (loss) represents net income (loss) adjusted for the change during the periods presented in unrealized gains and losses on available-for-sale securities less reclassification adjustments for realized gains or losses included in net income (loss). The unrealized gains or losses are reported on the Consolidated Statements of Comprehensive Income (Loss).
Accounting Standards Recently Adopted
Stock Compensation - In March 2016, the FASB issued ASU 2016-09, Compensation - Stock Compensation ("Topic 718"), which aims to simplify the accounting for share-based payment transactions, including accounting for income taxes, classification on the statement of cash flows, accounting for forfeitures, and classification of awards as either liabilities or equity. This ASU was effective for us beginning in the first quarter of 2017. This new standard increases the volatility of net income by requiring excess tax benefits from share-based payment arrangements to be classified as discrete items within the provision for income taxes, rather than recognizing excess tax benefits in additional paid-in capital. Upon adoption in the first quarter of 2017, the Company recorded $17.9 million, to retained earnings, primarily related to unrealized tax benefits associated with share-based compensation. During the year ended December 31, 2017, excess tax benefits of $4.7 million were reflected as a component of the provision for income taxes. Also, as a result of the adoption of this new standard, the Company made an accounting policy election to recognize forfeitures as they occur and will no longer estimate expected forfeitures.
In addition, excess income tax benefits from share-based compensation arrangements are classified as cash flows from operations, rather than cash flows from financing activities. We elected to apply the cash flows classification guidance prospectively and have not adjusted prior periods.
Accounting Standards Not Yet Adopted
Revenue Recognition - In May 2014, the FASB issued new guidance related to revenue recognition, ASU 2014-09, Revenue from Contracts with Customers (“ASC 606”), which outlines a comprehensive revenue recognition model and supersedes most current revenue recognition guidance. The new guidance requires a company to recognize revenue upon transfer of goods or services to a customer at an amount that reflects the expected consideration to be received in exchange for those goods or services. ASC 606 defines a five-step approach for recognizing revenue, which may require a company to use more judgment and make more estimates than under the current guidance. Two methods of adoption are permitted: (a) full retrospective adoption, meaning the standard is applied to all periods presented; or (b) modified retrospective adoption, meaning the cumulative effect of applying the new guidance is recognized at the date of initial application as an adjustment to the opening retained earnings balance. In addition, ASU 2014-09 adds a new Subtopic to the Codification, ASC 340-40, Other Assets and Deferred Costs: Contracts with Customers, to provide guidance on costs related to obtaining a contract with a customer and costs incurred in fulfilling a contract with a customer that are not in the scope of another ASC Topic.
We have substantially completed our assessment of the new standards and are finalizing the new required disclosures. The standard will have a material impact on our consolidated financial statements by accelerating the timing of recognition for
60
revenues related to royalties, and potentially certain contingent milestone based payments. We will adopt ASC 606 effective January 1, 2018, by recognizing the cumulative effect of initially applying the new standard as a decrease to the opening balance of accumulated deficit. Based on our analysis of open contracts as of December 31, 2017, we expect this amount to be approximately $33 million.
Financial Instruments - In January 2016, the FASB issued ASU 2016-01, Financial Instruments - Overall ("Subtopic 825-10"), which requires equity investments (other than those accounted for under the equity method or those that result in consolidation) to be measured at fair value, with changes in fair value recognized in net income. ASU 2016-01 will be effective for us beginning in the first quarter of 2018. We anticipate that the adoption of ASU 2016- 01 may increase the volatility of other income and expense.
In June 2016, the FASB issued ASU No. 2016-13, Financial Instruments - Credit Losses: Measurement of Credit Losses on Financial Instruments, which amends the impairment model by requiring entities to use a forward-looking approach based on expected losses to estimate credit losses on certain types of financial instruments, including trade receivables and available for sale debt securities. The ASU is effective for us beginning in the first quarter of 2020, with early adoption permitted. We are currently evaluating the impact of ASU 2016-13 on the consolidated financial statements.
Statement of Cash Flows - In August 2016 the FASB issued ASU No. 2016-15 Statement of Cash Flows (Topic 230), Classification of Certain Cash Receipts and Cash Payments. The guidance addresses the classification of cash flows related to (1) debt prepayment or extinguishment costs, (2) settlement of zero-coupon debt instruments or other debt instruments with coupon rates that are insignificant in relation to the effective interest rate of the borrowing, (3) contingent consideration payments made after a business combination, (4) proceeds from the settlement of insurance claims, (5) proceeds from the settlement of corporate-owned life insurance, including bank-owned life insurance, (6) distributions received from equity method investees and (7) beneficial interests in securitization transactions. The guidance also clarifies how the predominance principle should be applied when cash receipts and cash payments have aspects of more than one class of cash flows. The new guidance will be effective for fiscal year 2018 and early adoption is permitted. We are currently evaluating the effect that the updated standard will have on our consolidated financial statements. We expect contingent consideration payment presentation will change to conform to the standard.
Business Combinations - In January 2017 the FASB issued ASU 2017-01, Business Combinations (Topic 805): Clarifying the Definition of a Business. This new standard clarifies the definition of a business in order to allow for the evaluation of whether transactions should be accounted for as acquisitions or disposals of assets or businesses. The standard is effective for fiscal years beginning after December 15, 2017, including interim periods within those fiscal years, which means that it will be effective for us in the first quarter of 2018. We are currently evaluating the impact of our pending adoption of ASU 2017-01 on our consolidated financial statements.
Goodwill Impairment - In January 2017 the FASB issued ASU 2017-04, Intangibles—Goodwill and Other (Topic 350), Simplifying the Test for Goodwill Impairment. This new standard eliminates Step 2 from the goodwill impairment test. Instead, an entity should compare the fair value of a reporting unit with its carrying amount and recognize an impairment charge for the amount by which the carrying amount exceeds the reporting unit's fair value, not to exceed the total amount of goodwill allocated to the reporting unit. The standard is effective for fiscal years beginning after December 15, 2019, including interim periods within those fiscal years, which means that it will be effective for us in the first quarter of 2020. Early adoption is permitted. We are currently evaluating the impact of our pending adoption of ASU 2017-04 on our consolidated financial statements.
We do not believe that any other recently issued, but not yet effective accounting pronouncements, if adopted, would have a material impact on our consolidated financial statements or disclosures.
2. Investment in Viking
In 2014, the Company entered into a MLA with Viking to license the rights to five of the Company's programs to Viking. Under the terms of the MLA, no consideration was exchanged upon execution, but rather Viking agreed to issue shares of Viking common stock with an aggregate value of approximately $29.2 million upon consummation of Viking's IPO. As part of this transaction, the Company also extended a $2.5 million convertible loan to Viking under a LSA. As a result of these transactions, the Company determined it held a variable interest in Viking. The Company considered certain criteria in the accounting guidance for VIEs, and determined that Viking was a VIE and Ligand was the primary beneficiary of Viking. As a result, the Company consolidated Viking on its financial statements from May 2014 through May 2015, the effective date of Viking's IPO. The Company recorded 100% of the losses incurred as net loss attributable to noncontrolling interest because it was the primary beneficiary with no equity interest in the VIE.
In May 2015, Viking completed the Viking IPO and issued the Company approximately 3.7 million shares of Viking common stock with an aggregate value of $29.2 million based on the IPO price of $8.00 per share. In connection with the Viking IPO, the Company also purchased 1.1 million shares of Viking common stock for an aggregate price of $9.0 million at the initial public offering price. Upon completion of Viking’s IPO, the Company determined that Viking was no longer a VIE and the Company did not have any other element of control that would require consolidation of Viking. In May 2015, the Company deconsolidated Viking and began to account for its equity investment in Viking under the equity method and records its proportional share of Viking gains and losses in Loss from Viking Therapeutics in the Company's consolidated statements of operations. Viking is considered a related party as the Company maintains a seat on Viking's board of directors.
In January 2016 and May 2017, the Company entered into two amendments respectively to the LSA with Viking to, among other things, (i) extend the maturity of the convertible loan to May 21, 2018, (ii) reduce the interest rate from 5.0% to 2.5%, and (iii) extend the lock up period by one year such that the Company may not sell, transfer, or dispose of any Viking securities prior to January 23, 2017. Additionally, the amendments caused Viking to repay $1.5 million and $0.2 million of the Viking Note obligation to the Company in April 2016 and July 2017, respectively as further discussed below. Upon maturity or further payments, the Company may elect to receive equity of Viking common stock or cash equal to 200%of the principal amount plus accrued and unpaid interest. The Company has opted to account for the Viking convertible note receivable at fair value.
In April 2016, Viking closed an underwritten public offering of 7.5 million shares of common stock and warrants to purchase up to 7.5 million shares of its common stock at a price of $1.25 per share of its common stock and related warrants. The warrants have an exercise price of $1.50 per share, are immediately exercisable and will expire on April 13, 2021. As part of this public offering, the Company purchased 560,000 shares of Viking common stock and warrants to purchase 560,000 shares of Viking's common stock for a total purchase price of $0.7 million. The purchased shares of common stock and warrants are subject to the same terms as the shares issued in this offering. In addition, on April 13, 2016, pursuant to the terms of the first amendment to the LSA, Viking repaid $0.3 million of the convertible notes in cash, and issued the Company 960,000 shares of its common stock and warrants to purchase 960,000 shares of its common stock as repayment of $1.2 million of the convertible notes. The shares received as part of the repayment, like all Viking securities held by the Company, are subject to a lock-up period that ended on January 23, 2017 in accordance with the amended LSA. In July 2017, pursuant to the terms of the second amendment to the LSA, Viking paid $0.2 million of the convertible notes in cash, which reduced the accrued interest at the time. As of December 31, 2017, the aggregate fair value of the note receivable was $3.9 million. For the years ended December 31, 2017 and 2016, a gain of of $3.2 million and $0.3 million on the fair market value of the warrants was included within other income, respectively. See further discussion in Note 4 Fair Value Measurement.
61
The Company's ownership in Viking decreased to 32.7% after the public offering and the repayment of the convertible notes and further decreased to 17.6% and 30.3% as of December 31, 2017 and 2016, respectively. As a result Viking's public stock offerings, the Company recorded a dilution gain of $2.7 million and a dilution loss of $10.7 million for the years ended December 31, 2017 and 2016, respectively. These amounts were recognized in Loss from Viking in the Company's consolidated statement of operations.
The Company reviews its investment in Viking on a regular basis and assesses whether events, changes in circumstances or the passage of time, in management's judgment, indicate that a loss in the market value of the investment may be other than temporary. This might include, but would not necessarily be limited to, the period of time during which the carrying value of our investment is significantly above the observed market value, a deterioration in Viking's financial condition, or an adverse event relating to its lead clinical programs.
Based on a sustained low Viking common stock unit price during the year ended December 31, 2016, the Company determined that an other than temporary decrease in the value of its investment in Viking had occurred. The Company wrote down the value of its investment in Viking to its estimated fair value which resulted in impairment charges of $7.4 million for the year ended December 31, 2016.
The following table presents summarized financial information of Viking (in thousands):
Year ended December 31, | ||||||
(in thousands) | 2017 | 2016 | 2015 | |||
Condensed Statement of Operations: | ||||||
Total revenue | — | — | — | |||
Gross profit | — | — | — | |||
Loss from operations | $19,070 | $13,847 | $11,996 | |||
Net Loss | $20,578 | $14,732 | $23,404 | |||
As of December 31, | |||||||||
(in thousands) | 2017 | 2016 | |||||||
Condensed Balance Sheet: | |||||||||
Current assets | $ | 21,852 | $ | 13,975 | |||||
Noncurrent assets | 270 | 561 | |||||||
22,122 | 14,536 | ||||||||
Current liabilities | 8,657 | 6,477 | |||||||
Noncurrent liabilities | — | 16 | |||||||
Stockholders' equity | 13,465 | 8,043 | |||||||
3. Business Combinations
Acquisition of Crystal
On October 6, 2017, the Company acquired all of the assets and liabilities of Crystal. Crystal is a biotechnology company focused in avian genetics and the generation of fully-human therapeutic engineering of animals for the generation of fully-human therapeutic antibodies through its OmniChicken® technology. Under the terms of the agreement, Ligand was to pay Crystal shareholders $27.2 million in cash including $2.2 million working capital adjustment, and up to an additional $10.5 million of cash consideration based on Crystal’s achievement of certain research and business milestones prior to December 31, 2019. In addition, Crystal’s shareholders will receive 10% of revenues realized by Ligand above $15 million between the closing date and December 31, 2022 from existing collaboration agreements between Crystal and three of its collaborators, and Crystal’s shareholders will receive 20% of revenues above $1.5 million generated between the closing date and December 31, 2022 pursuant to a fourth existing collaboration agreement with a large pharmaceutical company. As of December 31, 2017, $0.3 million of the initial $27.2 million of cash consideration remained outstanding.
62
The transaction was accounted for as a business combination. At the closing of the acquisition, the Company recorded a $8.4 million contingent liability for amounts potentially due to Crystal shareholders. The initial fair value of the liability was determined using a probability weighted income approach incorporating the estimated future cash flows from potential milestones and revenue sharing. These cash flows were then discounted to present value using discount rates based on the Company’s estimated corporate credit rating, and averaged to approximately 4.6%. Refer to Note 4 Fair Value Measurement for further discussion. The liability will be periodically assessed based on events and circumstances related to the underlying milestones, and any change in fair value will be recorded in the Company’s consolidated statements of operations. The carrying amount of the liability may fluctuate significantly and actual amounts paid may be materially different than the carrying amount of the liability. There was no change in the fair value of the contingent liabilities from the initial valuation date to December 31, 2017.
The aggregate acquisition consideration was determined to be $35.7 million, consisting of (in thousands):
Cash paid to Crystal shareholders | $ | 26,877 | |
Cash payable to Crystal Shareholders | 336 | ||
Assumed liabilities | 129 | ||
Fair value of contingent consideration | 8,401 | ||
Total consideration | $ | 35,743 | |
The acquisition consideration was allocated to the acquisition date fair values of acquired assets and assumed liabilities as follows (in thousands):
Cash and cash equivalents | $ | 224 | |
Accounts receivable | 2,513 | ||
Prepaid expenses and other assets | 201 | ||
Property and equipment, net | 589 | ||
Current liabilities assumed | (354 | ) | |
Deferred revenue | (4,624 | ) | |
Deferred tax liabilities, net | (12,558 | ) | |
Intangible asset with finite life - core technology | 36,000 | ||
Goodwill | 13,752 | ||
Total consideration | $ | 35,743 | |
The estimated fair values of assets acquired and liabilities assumed, including deferred tax assets and liabilities, purchased intangibles and deferred revenue, as well as the estimated fair value of contingent consideration described above are provisional. The accounting for these amounts falls within the measurement period and therefore we may adjust these provisional amounts to reflect new information obtained about facts and circumstances that existed as of the acquisition date.
The fair value of the core technology, or OmniChicken technology, was based on the discounted cash flow method that estimated the present value of a hypothetical royalty stream derived from the licensing of the OmniChicken technology. These projected cash flows were discounted to present value using a discount rate of 10.8%. The fair value of the core technology is being amortized on a straight-line basis over the estimated useful life of 20 years.
The excess of the acquisition date consideration over the fair values assigned to the assets acquired and the liabilities assumed was $13.8 million and was recorded as goodwill, which is not deductible for tax purposes and is primarily attributable to Crystal’s potential revenue growth from combining the Crystal and Ligand businesses and workforce, as well as the benefits of access to different markets and customers.
Acquisition of OMT
On January 8, 2016, the Company acquired substantially all of the assets and liabilities of OMT. OMT is a biotechnology company engaged in the genetic engineering of animals for the generation of human therapeutic antibodies through its OmniAb® technology. The transaction was accounted for as a business combination and the aggregate acquisition consideration was $173.4 million, consisting of (in thousands, except per share amounts):
63
Cash consideration | $ | 96,006 | |
Total share consideration: | |||
Actual number of shares issued | 790 | ||
Multiplied by: Ligand closing share price on January 8, 2016 | 98 | ||
Total share consideration | $ | 77,373 | |
Total consideration | $ | 173,379 | |
The acquisition consideration was allocated to the acquisition date fair values of acquired assets and assumed liabilities as follows (in thousands):
Cash and cash equivalents | $ | 3,504 | |
Accounts receivable | 5 | ||
Income tax receivable | 136 | ||
Prepaid expenses and other current assets | 1 | ||
Deferred tax liabilities, net | (55,708 | ) | |
Intangible asset with finite life - core technology | 167,000 | ||
Liabilities assumed | (1,528 | ) | |
Goodwill | 59,969 | ||
Total consideration | $ | 173,379 | |
The fair value of the core technology, or OMT's OmniAb technology, was based on the discounted cash flow method that estimated the present value of a hypothetical royalty stream derived from the licensing of the OmniAb technology. These projected cash flows were discounted to present value using a discount rate of 15.5%. The fair value of the core technology is being amortized on a straight-line basis over the estimated useful life of 20 years.
The excess of the acquisition date consideration over the fair values assigned to the assets acquired and the liabilities assumed was $60.0 million and was recorded as goodwill, which is not deductible for tax purposes and is primarily attributable to OMT’s potential revenue growth from combining the OMT and Ligand businesses and workforce, as well as the benefits of access to different markets and customers.
The following table presents supplemental pro forma information for the three and twelve months ended December 31, 2016 and December 31, 2015, as if the acquisition of OMT had occurred on January 1, 2015 (in thousands except for income per share):
Three months ended | Twelve months ended | |||||||||||||
December 31, | December 31, | |||||||||||||
2016 | 2015 | 2016 | 2015 | |||||||||||
Revenue | $ | 38,185 | $ | 24,571 | $ | 111,449 | $ | 80,365 | ||||||
Net (loss) income | $ | (3,126 | ) | $ | 5,888 | $ | 632 | $ | 222,788 | |||||
Basic (loss) income per share: | $ | (0.15 | ) | $ | 0.30 | $ | 0.03 | $ | 11.26 | |||||
Diluted (loss) income per share: | $ | (0.15 | ) | $ | 0.27 | $ | 0.03 | $ | 10.50 | |||||
The unaudited pro forma consolidated results include pro forma adjustments that assume the acquisition occurred on January 1, 2015. The primary adjustments include: (i) the $0.3 million and $0.9 million for the three and twelve months ended December 31, 2015, respectively, for share based compensation expenses related to the stock awards issued to the retained OMT employees after the acquisition, (ii) additional intangible amortization expense of $2.1 million and $6.3 million was included in the three and twelve months ended December 31, 2015, respectively and (iii) a platform license fee of $3.0 million paid by OMT during the twelve months ended December 31, 2015. The license agreement was terminated upon acquisition by Ligand. The adjustments also include $2.5 million license revenue recognized by OMT from January 1, 2016 to the acquisition
64
date. The unaudited pro forma consolidated results are not necessarily indicative of what our consolidated results of operations actually would have been had we completed the acquisition on January 1, 2015. In addition, the unaudited pro forma consolidated results do not purport to project the future results of operations of the combined company nor do they reflect the expected realization of any cost savings associated with the acquisition.
4. Fair Value Measurement
The Company measures certain financial assets and liabilities at fair value on a recurring basis. Fair value is a market-based measurement that should be determined using assumptions that market participants would use in pricing an asset or liability. The Company establishes a three-level hierarchy to prioritize the inputs used in measuring fair value. The levels are described in the below with level 1 having the highest priority and level 3 having the lowest:
Level 1 - Observable inputs such as quoted prices in active markets
65
Level 2 - Inputs other than the quoted prices in active markets that are observable either directly or indirectly
Level 3 - Unobservable inputs in which there is little or no market data, which require the Company to develop its own assumptions
The following table provide a summary of the assets and liabilities that are measured at fair value on a recurring basis as of December 31, 2017 and 2016 (in thousands):
Fair Value Measurements at Reporting Date Using | |||||||||||||||
December 31, 2017 | Quoted Prices in Active Markets for Identical Assets | Significant Other Observable Inputs | Significant Unobservable Inputs | ||||||||||||
Total | (Level 1) | (Level 2) | (Level 3) | ||||||||||||
Assets: | |||||||||||||||
Short-term investments (1) | $ | 181,041 | $ | 1,896 | $ | 179,145 | $ | — | |||||||
Note receivable Viking (2) | 3,877 | — | — | 3,877 | |||||||||||
Investment in warrants (3) | 3,846 | 3,846 | — | — | |||||||||||
Total assets | $ | 188,764 | $ | 5,742 | $ | 179,145 | $ | 3,877 | |||||||
Liabilities: | |||||||||||||||
Current contingent liabilities - Crystal (7) | $ | 4,618 | $ | — | $ | — | $ | 4,618 | |||||||
Current contingent liabilities - Cydex (4) | 86 | — | — | 86 | |||||||||||
Long-term contingent liabilities - Metabasis (5) | 3,971 | — | 3,971 | — | |||||||||||
Long-term contingent liabilities - Crystal (7) | 3,783 | — | — | 3,783 | |||||||||||
Long-term contingent liabilities - CyDex (4) | 1,503 | — | — | 1,503 | |||||||||||
Liability for amounts owed to a former licensor (6) | 284 | 284 | — | — | |||||||||||
Total liabilities | $ | 14,245 | $ | 284 | $ | 3,971 | $ | 9,990 | |||||||
Fair Value Measurements at Reporting Date Using | |||||||||||||||
December 31, 2016 | Quoted Prices in Active Markets for Identical Assets | Significant Other Observable Inputs | Significant Unobservable Inputs | ||||||||||||
Total | (Level 1) | (Level 2) | (Level 3) | ||||||||||||
Assets: | |||||||||||||||
Short-term investments (1) | $ | 122,296 | $ | 3,054 | $ | 119,242 | $ | — | |||||||
Note receivable Viking (2) | 3,207 | — | — | 3,207 | |||||||||||
Investment in warrants (3) | 684 | 684 | — | — | |||||||||||
Total assets | $ | 126,187 | $ | 3,738 | $ | 119,242 | $ | 3,207 | |||||||
Liabilities: | |||||||||||||||
Current contingent liabilities - CyDex (4) | $ | 101 | $ | — | $ | — | $ | 101 | |||||||
Long-term contingent liabilities - Metabasis (5) | 1,413 | — | 1,413 | — | |||||||||||
Long-term contingent liabilities - CyDex (4) | 1,503 | — | — | 1,503 | |||||||||||
Liability for amounts owed to a former licensor (6) | 371 | 371 | — | — | |||||||||||
Total liabilities | $ | 3,388 | $ | 371 | $ | 1,413 | $ | 1,604 | |||||||
(1) Investments in equity securities, are classified as level 1 as the fair value is determined using quoted market prices in active markets for the same securities. Short-term investments in marketable securities with maturities greater than 90 days are classified as level 2 of the fair value hierarchy, as these investment securities are valued based upon quoted prices for identical or similar instruments in markets that are not active, and model-based valuation techniques for which all significant assumptions are observable in the market.
66
(2) The fair value of the convertible note receivable from Viking at December 31, 2017 approximates the book value since the contractual maturity date was within five months from the end of 2017, and there is no plan to extend the maturity date. The fair value at December 31, 2016 was determined using a probability weighted option pricing model. The fair value is subjective and is affected by certain significant input to the valuation model such as the estimated volatility of the common stock, which was estimated to be 75% at December 31, 2016. Changes in these assumptions may materially affect the fair value estimate. For the years ended December 31, 2017, December 31, 2016, and December 31, 2015, the Company reported an increase in the fair value of 0.9 million, a decrease in the fair value $0.2 million, and $0.8 million, respectively in "Other, net" of the consolidated statement of operations.
(3) Investment in warrants, which the Company received as a result of Viking’s partial repayment of the Viking note receivable and the Company’s purchase of Viking common stock and warrants in April 2016, is classified as level 1 as the fair value is determined using quoted market prices in active markets for the same securities.
(4) The fair value of CyDex contingent liabilities was determined based on the income approach using a Monte Carlo analysis. The fair value is subjective and is affected by changes in inputs to the valuation model including management’s assumptions regarding revenue volatility, probability of commercialization of products, estimates of timing and probability of achievement of certain developmental and regulatory milestones. Changes in these assumptions can materially affect the fair value.
The following table represents significant unobservable inputs used in determining the fair value of contingent liabilities assumed in the acquisition of CyDex:
December 31, | ||||
2017 | 2016 | |||
Revenue volatility | 25% | 25% | ||
Average of probability of commercialization | 12.5% | 12.5% | ||
Market price of risk | 2.9% | 3.2% | ||
(5) The liability for CVRs for Metabasis is determined using quoted market prices in a market that is not active for the underlying CVR.
(6) The liability for amounts owed to a former licensor is determined using quoted market prices in active markets for the underlying investment received from a partner, a portion of which is owed to a former licensor.
(7) The fair value of Crystal contingent liabilities was determined using a probability weighted income approach. Most of the contingent payments are based on development or regulatory milestones as defined in the merger agreement with Crystal. The fair value is subjective and is affected by changes in inputs to the valuation model including management’s estimates regarding the timing and probability of achievement of certain developmental and regulatory milestones. At December 31, 2017, most of the development and regulatory milestones were estimated to be highly probable of being achieved between 2018 and 2020. Changes in these estimates may materially affect the fair value.
A reconciliation of the level 3 financial instruments as of December 31, 2017 is as follows (in thousands):
Assets: | |||
Fair value of level 3 financial instruments as of December 31, 2016 | $ | 3,207 | |
Viking note receivable fair market value adjustment | 870 | ||
Cash payment received as partial repayment of note receivable | (200 | ) | |
Fair value of level 3 financial instrument assets as of December 31, 2017 | $ | 3,877 | |
Liabilities | |||
Fair value of level 3 financial instruments as of December 31, 2016 | $ | 1,604 | |
Fair value of Crystal contingent consideration | 8,401 | ||
Payments to CVR holders and other contingency payments | (25 | ) | |
Fair value adjustments to contingent liabilities | 10 | ||
Fair value of level 3 financial instruments as of December 31, 2017 | $ | 9,990 | |
Other Fair Value Measurements-2019 Convertible Senior Notes
In August 2014, the Company issued the 2019 Convertible Senior Notes. The Company uses a quoted market rate in an inactive market, which is classified as a Level 2 input, to estimate the current fair value of its 2019 Convertible Senior Notes. The estimated fair value of the 2019 Senior Convertible Notes was $446.4 million as of December 31, 2017. The carrying value of the notes does not reflect the market rate. See Note 7 Financing Arrangements for additional information.
Viking
67
The Company records its investment in Viking under the equity method of accounting. The investment is subsequently adjusted for the Company’s share of Viking's operating results, and if applicable, cash contributions and distributions. See Note 2 Investment in Viking for additional information. The market value of the Company's investment in Viking was $25.6 million as of December 31, 2017.
5. Lease Obligations
The Company leases office facilities in California and Kansas. These leases expire between 2018 and 2023. Total rent expense, net under all office leases for 2017, 2016 and 2015 was $0.3 million, $0.3 million and $0.4 million, respectively. The following table provides a summary of operating lease obligations and payments expected to be received from sublease agreements as of December 31, 2017 (in thousands):
Operating lease obligations: | Lease Termination Date | Less than 1 year | 1-2 years | 3-4 years | Thereafter | Total | ||||||||||||||||
Corporate headquarters-San Diego, CA | April 2023 | $ | 131 | $ | 275 | $ | 291 | $ | 50 | $ | 747 | |||||||||||
Office and research facility-La Jolla, CA | June 2019 | 737 | 373 | — | — | 1,110 | ||||||||||||||||
Bioscience and Technology Business Center-Lawrence, KS | December 2020 | 57 | 113 | — | — | 170 | ||||||||||||||||
Office - Emeryville, CA | August 2021 | 253 | 528 | 186 | — | 967 | ||||||||||||||||
Research Facility - Emeryville, CA | August 2021 | 197 | 412 | 142 | — | $ | 751 | |||||||||||||||
Total operating lease obligations | $ | 1,375 | $ | 1,701 | $ | 619 | $ | 50 | $ | 3,745 | ||||||||||||
Sublease payments expected to be received: | ||||||||||||||||||||||
Office and research facility-La Jolla, CA | June 2019 | 641 | 361 | — | — | 1,002 | ||||||||||||||||
Net operating lease obligations | $ | 734 | $ | 1,340 | $ | 619 | $ | 50 | $ | 2,743 | ||||||||||||
6. Financing Arrangements
2019 Convertible Senior Notes
In August 2014, the Company issued $245.0 million aggregate principal amount of its 2019 Convertible Senior Notes, resulting in net proceeds of $239.3 million. The 2019 Convertible Senior Notes are convertible into common stock at an initial conversion rate of 13.3251 shares per $1,000 principal amount of convertible notes, subject to adjustment upon certain events, which is equivalent to an initial conversion price of approximately $75.05 per share of common stock. The notes bear cash interest at a rate of 0.75% per year, payable semi-annually.
Holders of the 2019 Convertible Senior Notes may convert the notes at any time prior to the close of business on the business day immediately preceding May 15, 2019, under any of the following circumstances:
(1) during any fiscal quarter (and only during such fiscal quarter) commencing after December 31, 2014, if,
for at least 20 trading days (whether or not consecutive) during the 30 consecutive trading day period ending on the last trading day of the immediately preceding fiscal quarter, the last reported sale price of the Company's common stock on such trading day is greater than 130% of the conversion price on such trading day;
(2) during the five business day period immediately following any 10 consecutive trading day period, in which the trading price per $1,000 principal amount of notes was less than 98% of the product of the last reported sale price of the Company's common stock on such trading day and the conversion rate on each such trading day; or
(3) upon the occurrence of certain specified corporate events as specified in the indenture governing the notes.
68
As of December 31 2017 and 2016, the Company's last reported sale price exceeded the 130% threshold described above and accordingly the Convertible Notes have been classified as a current liability as of December 31, 2017 and 2016. As a result, the related unamortized discount of $18.9 million and $29.6 million, at December 31, 2017 and 2016, respectively, was classified as temporary equity component of currently redeemable convertible notes on our consolidated balance sheet. The determination of whether or not the Convertible Notes are convertible as described above is made each quarter until maturity, conversion or repurchase. It is possible that the Convertible Notes may not be convertible in future periods, in which case the Convertible Notes would be classified as long-term debt, and the unamortized discount would be classified as permanent equity unless one of the other conversion events described above were to occur.
On or after May 15, 2019 until the close of business on the second scheduled trading day immediately preceding August 15, 2019, holders of the notes may convert all or a portion of their notes at any time. Upon conversion, Ligand must deliver cash to settle the principal and may deliver cash or shares of common stock, at the option of the Company, to settle any premium due upon conversion.
The Company accounted for the debt and equity components of the 2019 Convertible Senior Notes by allocating the $245.0 million total proceeds between the debt component and the embedded conversion option, or equity component, due to Ligand's ability to settle the 2019 Convertible Senior Notes in cash for the principal portion and to settle any premium in cash or common stock, at the Company's election. The debt allocation was performed in a manner that reflected the Company's non-convertible borrowing rate for similar debt of 5.83% derived from independent valuation analysis. The initial debt value of $192.5 million accretes at 5.83% to reach $245.0 million at the maturity date. The equity component of the 2019 Convertible Senior Notes was recognized as a debt discount and represents the difference between the $245.0 million proceeds at issuance of the 2019 Convertible Senior Notes and the fair value of the debt allocation on their respective issuance dates. The debt discount is amortized to interest expense using the effective interest method over the expected life of a similar liability without an equity component. As of December 31, 2017, the “if-converted value” exceeded the principal amount of the 2019 Convertible Senior Notes by $202.0 million.
In connection with the issuance of the 2019 Convertible Senior Notes, the Company incurred $5.7 million of issuance costs, which primarily consisted of underwriting, legal and other professional fees. The portions of these costs allocated to the equity components totaling $1.2 million were recorded as a reduction to additional paid-in capital. The portions of these costs allocated to the liability components totaling $4.5 million were recorded as assets on the balance sheet at the time the debt was issued. Beginning in 2016, the unamortized issuance costs allocated to the liability components are recorded as part of debt discount on the consolidated balance sheet upon the Company's respective adoption of ASU 2015-03, Interest-Imputation of Interest: Simplifying the Presentation of Debt Issuance Costs. Issuance cost included in the unamortized debt discount was $1.6 million and $2.5 million as of December 31, 2017 and 2016, respectively.
The Company determined the expected life of the debt discount for the 2019 Convertible Senior Notes to be equal to the original five-year term of the notes. The carrying value of the equity component related to the 2019 Convertible Senior Notes as of December 31, 2017, net of issuance costs, was $51.3 million.
Convertible Bond Hedge and Warrant Transactions
In August 2014, to minimize the impact of potential dilution to the Company's common stock upon conversion of the 2019 Convertible Senior Notes, the Company entered into convertible bond hedges and sold warrants covering 3,264,643 shares of its common stock. The convertible bond hedges have an exercise price of $75.05 per share and are exercisable when and if the 2019 Convertible Senior Notes are converted. If upon conversion of the 2019 Convertible Senior Notes, the price of the Company's common stock is above the exercise price of the convertible bond hedges, the counterparties will deliver shares of common stock and/or cash with an aggregate value approximately equal to the difference between the price of common stock at the conversion date and the exercise price, multiplied by the number of shares of common stock related to the convertible bond hedge transaction being exercised. The convertible bond hedges and warrants described below are separate transactions entered into by the Company and are not part of the terms of the 2019 Convertible Senior Notes. Holders of the 2019 Convertible Senior Notes and warrants will not have any rights with respect to the convertible bond hedges. The Company paid $48.1 million for these convertible bond hedges and recorded the amount as a reduction to additional paid-in capital.
69
Concurrently with the convertible bond hedge transactions, the Company entered into warrant transactions whereby it sold warrants to acquire approximately 3,264,643 shares of common stock with an exercise price of approximately $125.08 per share, subject to certain adjustments. None of the warrants have been exercised as of December 31, 2017. The warrants have various expiration dates ranging from November 13, 2019 to April 22, 2020. The warrants will have a dilutive effect to the extent the market price per share of common stock exceeds the applicable exercise price of the warrants, as measured under the terms of the warrant transactions. The Company received $11.6 million for these warrants and recorded this amount to additional paid-in capital. The common stock issuable upon exercise of the warrants will be in unregistered shares, and the Company does not have the obligation and does not intend to file any registration statement with the Securities and Exchange Commission registering the issuance of the shares under the warrants.
The following table summarizes information about the liability components the Company's financing arrangement (dollars in thousands):
December 31, 2017 | December 31, 2016 | ||||||
2019 Convertible Senior Notes | |||||||
Principal amount outstanding | $ | 245,000 | $ | 245,000 | |||
Unamortized discount | (20,471 | ) | (32,090 | ) | |||
Total current portion of notes payable | $ | 224,529 | $ | 212,910 | |||
As of December 31, 2017, there were no events of default or violation of any covenants under the Company's financing obligations.
7. Balance Sheet Account Details
Short-term Investments
The following table summarizes the various investment categories at December 31, 2017 and 2016 (in thousands):
Cost | Gross unrealized gains | Gross unrealized losses | Estimated fair value | ||||||||||||
December 31, 2017 | |||||||||||||||
Short-term investments | |||||||||||||||
Bank deposits | $ | 80,095 | $ | 6 | $ | (42 | ) | $ | 80,059 | ||||||
Corporate bonds | 55,335 | — | (96 | ) | 55,239 | ||||||||||
Corporate equity securities | 207 | 1,689 | — | 1,896 | |||||||||||
Commercial paper | 27,933 | — | (20 | ) | 27,913 | ||||||||||
Agency bonds | 4,991 | — | (1 | ) | 4,990 | ||||||||||
U.S. Government bonds | 8,939 | — | (10 | ) | 8,929 | ||||||||||
Municipal bonds | 2,028 | — | (13 | ) | 2,015 | ||||||||||
$ | 179,528 | $ | 1,695 | $ | (182 | ) | $ | 181,041 | |||||||
December 31, 2016 | |||||||||||||||
Short-term investments | |||||||||||||||
Bank deposits | $ | 40,715 | $ | 19 | $ | — | $ | 40,734 | |||||||
Corporate bonds | 11,031 | — | (5 | ) | 11,026 | ||||||||||
Corporate equity securities | 1,512 | 1,542 | — | 3,054 | |||||||||||
Commercial paper | 33,074 | 2 | (9 | ) | 33,067 | ||||||||||
Agency bonds | 7,294 | 1 | — | 7,295 | |||||||||||
U.S. Government bonds | 7,508 | — | (1 | ) | 7,507 | ||||||||||
Municipal bonds | 19,624 | — | (11 | ) | 19,613 | ||||||||||
$ | 120,758 | $ | 1,564 | $ | (26 | ) | $ | 122,296 | |||||||
70
Other current assets consist of the following (in thousands):
December 31, | |||||||
2017 | 2016 | ||||||
Prepaid expenses | $ | 1,017 | $ | 1,864 | |||
Other receivables | 497 | 311 | |||||
$ | 1,514 | $ | 2,175 | ||||
Property and equipment is stated at cost and consists of the following (in thousands):
December 31, | |||||||
2017 | 2016 | ||||||
Lab and office equipment | $ | 3,460 | $ | 1,067 | |||
Leasehold improvements | 1,917 | 1,754 | |||||
Computer equipment and software | 697 | 569 | |||||
6,074 | 3,390 | ||||||
Less accumulated depreciation and amortization | (1,862 | ) | (1,571 | ) | |||
$ | 4,212 | $ | 1,819 | ||||
Depreciation of equipment is computed using the straight-line method over the estimated useful lives of the assets which range from three to ten years. Leasehold improvements are amortized using the straight-line method over their estimated useful lives or their related lease term, whichever is shorter. Depreciation expense of $0.4 million, $0.2 million, and $0.2 million was recognized for the years ended December 31, 2017, 2016, and 2015, respectively and is included in operating expenses.
Goodwill and identifiable intangible assets consist of the following (in thousands):
December 31, | |||||||
2017 | 2016 | ||||||
Indefinite lived intangible assets | |||||||
IPR&D | $ | 7,923 | $ | 12,246 | |||
Goodwill | 85,959 | 72,207 | |||||
Definite lived intangible assets | |||||||
Complete technology | 222,900 | 182,577 | |||||
Less: Accumulated amortization | (23,301 | ) | (12,792 | ) | |||
Trade name | 2,642 | 2,642 | |||||
Less: Accumulated amortization | (916 | ) | (784 | ) | |||
Customer relationships | 29,600 | 29,600 | |||||
Less: Accumulated amortization | (10,264 | ) | (8,784 | ) | |||
Total goodwill and other identifiable intangible assets, net | $ | 314,543 | $ | 276,912 | |||
Amortization of finite lived intangible assets is computed using the straight-line method over the estimated useful life of the asset of 20 years. Amortization expense of $11.3 million, $10.6 million, and $2.4 million was recognized for the years ended December 31, 2017 and 2016, and 2015. Estimated amortization expense for the years ending December 31, 2018 through 2022 is $12.8 million per year. For each of the years ended December 31, 2017, 2016, and 2015, there was no impairment of intangible assets with finite lives.
71
Accrued liabilities consist of the following (in thousands):
December 31, | |||||||
2017 | 2016 | ||||||
Compensation | $ | 4,085 | $ | 2,603 | |||
Legal | 430 | 829 | |||||
Amounts owed to former licensees | 396 | 899 | |||||
Royalties owed to third parties | 954 | 942 | |||||
Deferred revenue | 173 | — | |||||
Other | 1,339 | 1,124 | |||||
$ | 7,377 | $ | 6,397 | ||||
In connection with the acquisition of CyDex in January 2011, we issued a series of CVRs and also assumed certain contingent liabilities. We may be required to make additional payments upon achievement of certain clinical and regulatory milestones to the CyDex shareholders and former license holders. We paid CyDex shareholders, through 2016, 20% of all CyDex-related revenue, but only to the extent that, and beginning only when, CyDex-related revenue for the year exceeds $15.0 million; plus an additional 10% of all CyDex-related revenue recognized during such year, but only to the extent, and beginning only when aggregate CyDex-related revenue for such year exceeds $35.0 million.
In connection with the acquisition of Metabasis in January 2010, we entered into four CVR agreements with Metabasis shareholders. The CVRs entitle the holders to cash payments as frequently as every six months as proceeds are received by us upon the sale or licensing of any of the Metabasis drug development programs and upon the achievement of specified milestones.
Contingent liabilities consist of the following (in millions):
December 31, 2015 | Payments | Fair Value Adjustment | December 31, 2016 | Payments | Fair Value Adjustment | Additions | December 31, 2017 | |||||||||||||||||
Cydex | $ | 9.5 | $ | (6.2 | ) | $ | 3.3 | $ | 6.6 | (5.0 | ) | $ | — | $ | — | $ | 1.6 | |||||||
Metabasis | 4.0 | (2.6 | ) | 0.1 | 1.5 | — | 2.5 | — | 4.0 | |||||||||||||||
Crystal | — | — | — | — | — | — | 8.4 | 8.4 | ||||||||||||||||
Total | $ | 13.5 | $ | (8.8 | ) | $ | 3.4 | $ | 8.1 | $ | (5.0 | ) | $ | 2.5 | $ | 8.4 | $ | 14.0 | ||||||
Other long-term liabilities consist of the following (in thousands):
December 31, | |||||||
2017 | 2016 | ||||||
Deferred rent | $ | 321 | $ | 357 | |||
Deposits | 43 | 43 | |||||
Other | 359 | 287 | |||||
$ | 723 | $ | 687 | ||||
8. Stockholders’ Equity
Share-based Compensation Expense
The following table summarizes stock-based compensation expense (in thousands):
72
December 31, | |||||||||||
2017 | 2016 | 2015 | |||||||||
Stock-based compensation expense as a component of: | |||||||||||
Research and development expenses | $ | 14,235 | $ | 8,836 | $ | 4,080 | |||||
General and administrative expenses | 10,680 | 10,057 | 8,378 | ||||||||
$ | 24,915 | $ | 18,893 | $ | 12,458 | ||||||
Stock Plans
In May 2012 and May 2016, the Company’s stockholders approved an amendment and restatement of the Company’s 2002 Stock Incentive Plan to increase the number of shares available for issuance by 1.8 million and 0.9 million shares, respectively. As of December 31, 2017, there were 0.8 million shares available for future option grants or direct issuance under the Amended 2002 Plan.
Following is a summary of the Company’s stock option plan activity and related information:
Shares | Weighted Average Exercise Price | Weighted Average Remaining Contractual Term in Years | Aggregate Intrinsic Value (In thousands) | |||||||||
Balance at December 31, 2016 | 1,754,275 | $ | 42.12 | 6.19 | $ | 104,247 | ||||||
Granted | 273,353 | 112.58 | ||||||||||
Exercised | (148,252 | ) | 31.58 | |||||||||
Forfeited | (3,044 | ) | 79.74 | |||||||||
Balance at December 31, 2017 | 1,876,332 | 53.17 | 5.77 | 157,340 | ||||||||
Exercisable at December 31, 2017 | 1,431,245 | 40.08 | 4.95 | 138,616 | ||||||||
Options vested and expected to vest as of December 31, 2017 | 1,876,332 | $ | 53.17 | 5.77 | $ | 157,340 | ||||||
The weighted-average grant-date fair value of all stock options granted during 2017, 2016 and 2015 was $53.17, $46.53 and $35.39 per share, respectively. The total intrinsic value of all options exercised during 2017, 2016 and 2015 was approximately $13.3 million, $12.0 million and $20.7 million, respectively.
Cash received from options exercised, net of fees paid, in 2017, 2016 and 2015 was $4.7 million, $6.2 million and $8.7 million, respectively.
73
Following is a further breakdown of the options outstanding as of December 31, 2017:
Range of exercise prices | Options outstanding | Weighted average remaining life in years | Weighted average exercise price | Options exercisable | Weighted average exercise price | |||||||||||
$8.58 - $10.05 | 208,032 | 2.88 | $ | 9.97 | 208,032 | $ | 9.97 | |||||||||
$10.12 - $12.81 | 71,850 | 3.95 | 11.44 | 71,850 | 11.44 | |||||||||||
$14.47 - $14.47 | 285,879 | 4.11 | 14.47 | 271,879 | 14.47 | |||||||||||
$16.14 - $17.88 | 72,777 | 1.16 | 16.32 | 72,777 | 16.32 | |||||||||||
$21.92 - $21.92 | 207,004 | 5.13 | 21.92 | 207,004 | 21.92 | |||||||||||
$32.00 - $56.26 | 226,287 | 6.72 | 50.50 | 160,301 | 48.49 | |||||||||||
$63.58 - $68.62 | 25,757 | 6.50 | 67.17 | 23,726 | 67.34 | |||||||||||
$74.42 - $74.42 | 216,118 | 6.11 | 74.42 | 206,828 | 74.42 | |||||||||||
$85.79 - $97.92 | 238,675 | 6.99 | 88.93 | 138,712 | 90.54 | |||||||||||
$100.38 - $141.61 | 323,953 | 9.12 | 112.75 | 70,136 | 106.78 | |||||||||||
$8.58 – $141.61 | 1,876,332 | 5.77 | $ | 53.17 | — | 1,431,245 | $ | 40.08 | ||||||||
The assumptions used for the specified reporting periods and the resulting estimates of weighted-average grant date fair value per share of options granted:
Year Ended December 31, | ||||||
2017 | 2016 | 2015 | ||||
Risk-free interest rate | 2.0%-2.2% | 1.3%-1.9% | 1.7%-2.0% | |||
Expected volatility | 43%-47% | 48%-50% | 50%-58% | |||
Expected term | 6.5 to 6.8 years | 6.6 to 6.7 years | 6.5 years | |||
As of December 31, 2017, there was $19.4 million of total unrecognized compensation cost related to non-vested stock options. That cost is expected to be recognized over a weighted average period of 2.52 years.
Restricted Stock Activity
The following is a summary of the Company’s restricted stock activity and related information:
Shares | Weighted-Average Grant Date Fair Value | |||||
Outstanding at December 31, 2016 | 308,700 | $ | 86.61 | |||
Granted | 73,799 | 99.53 | ||||
Vested | (187,864 | ) | 84.50 | |||
Forfeited | (61,341 | ) | 97.78 | |||
Outstanding at December 31, 2017 | 133,294 | $ | 91.60 | |||
As of December 31, 2017, unrecognized compensation cost related to non-vested stock awards amounted to $6.5 million. That cost is expected to be recognized over a weighted average period of 1.34 years.
Employee Stock Purchase Plan
As of December 31, 2017, 67,394 shares of the Company's common stock are available for future issuance under it's Amended Employee Stock Purchase Plan, or ESPP. The ESPP permits eligible employees to purchase up to 1,250 shares of Ligand common stock per calendar year at a discount through payroll deductions. The price at which stock is purchased under the ESPP is equal to 85% of the fair market value of the common stock on the first of a six month offering period or purchase date, whichever is lower. There were 3,061, 1,961 and 3,374 shares issued under the ESPP in 2017, 2016 and 2015, respectively.
74
Share Repurchases
During the years ended December 31, 2017, 2016 and 2015 the Company repurchased 14,000 shares for $2.0 million, 40,500 shares for $3.9 million, 6,120 shares for $0.5 million, respectively.
In September 2015, the Company's Board of Directors authorized the Company to repurchase up to $200.0 million of its own stock in privately negotiated and open market transactions for a period of up to three years, subject to the Company's evaluation of market conditions. Authorization to repurchase up to an additional $193.6 million of its common stock remained as of December 31, 2017.
9. Litigation
The Company records an estimate of a loss when the loss is considered probable and estimable. Where a liability is probable and there is a range of estimated loss and no amount in the range is more likely than any other number in the range, The Company records the minimum estimated liability related to the claim in accordance with FASB ASC Topic 450 Contingencies. As additional information becomes available, the Company assesses the potential liability related to its pending litigation and revises its estimates. Revisions in the Company's estimates of potential liability could materially impact its results of operations.
In November 2016, a putative shareholder class action lawsuit was filed in the United States District Court for the Southern District of California against the Company, its chief executive officer and chief financial officer. The complaint was voluntarily dismissed without prejudice on May 15, 2017.
In November 2017, CyDex, our wholly owned subsidiary, received a paragraph IV certification from Teva Pharmaceuticals USA, Inc., Teva Pharmaceutical Industries Ltd. and Actavis, LLC (collectively “Teva”) alleging that certain of our patents related to Captisol were invalid, unenforceable and/or will not be infringed by Teva’s ANDA related to Spectrum Pharmaceuticals’ NDA for Evomela. On December 20, 2017, CyDex filed a complaint against Teva in the U.S. District Court for the District of Delaware, asserting that Teva’s ANDA would infringe our patents.
10. Income Taxes
The Tax Act was enacted on December 22, 2017 and includes a number of changes to existing tax laws that impact the Company, most notably it reduces the US federal corporate tax rate from 35% to 21%, effective January 1, 2018. At December 31, 2017, we have made a reasonable estimate of the effects on our existing deferred tax balances. In other cases, we have not been able to make a reasonable estimate and continue to account for those items based on our existing accounting under ASC 740, Income Taxes, and the provisions of the tax laws that were in effect immediately prior to enactment. For the items for which we were able to determine a reasonable estimate, we recognized a provisional amount of $32.4 million, which is included as a component of income tax expense from continuing operations.
In conjunction with the tax law changes, the SEC staff issued Staff Accounting Bulletin No. 118 ("SAB 118") to address the application of U.S. GAAP in situations when a registrant does not have the necessary information available, prepared, or analyzed (including computations) in reasonable detail to complete the accounting for certain income tax effects of the Tax Act. The ultimate impact may differ from these provisional amounts, possibly materially, due to, among other things, additional analysis, changes in interpretations and assumptions the Company has made, additional regulatory guidance that may be issued, and actions the Company may take as a result of the Tax Act.
The components of the income tax expense (benefit) for continuing operations are as follows (in thousands):
75
Year Ended December 31, | ||||||||||||
2017 | 2016 | 2015 | ||||||||||
Current expense (benefit): | ||||||||||||
Federal | $ | — | $ | 21 | $ | 11 | ||||||
State | 111 | 12 | 7 | |||||||||
Foreign | 261 | — | — | |||||||||
372 | 33 | 18 | ||||||||||
Deferred expense (benefit): | ||||||||||||
Federal | 44,075 | 10,534 | (167,413 | ) | ||||||||
State | 228 | (240 | ) | (24,720 | ) | |||||||
Foreign | — | — | — | |||||||||
$ | 44,675 | $ | 10,327 | $ | (192,115 | ) | ||||||
A reconciliation of income tax expense (benefit) from continuing operations to the amount computed by applying the statutory federal income tax rate to the net income (loss) from continuing operations is summarized as follows:
Year Ended December 31, | |||||||||||
2017 | 2016 | 2015 | |||||||||
Tax at federal statutory rate | $ | 20,031 | $ | 2,786 | $ | 13,198 | |||||
State, net of federal benefit | 622 | 175 | 386 | ||||||||
Contingent liabilities | 903 | 1,225 | 1,684 | ||||||||
Stock-based compensation | (4,019 | ) | 263 | 140 | |||||||
Research and development credits | (2,821 | ) | (1,525 | ) | 304 | ||||||
Change in uncertain tax positions | 1,308 | 1,423 | 27,188 | ||||||||
Rate change for changes in federal or state law | 32,429 | 25 | (5,756 | ) | |||||||
Change in valuation allowance | (4,169 | ) | 6,283 | (231,370 | ) | ||||||
Other | 391 | (328 | ) | 2,111 | |||||||
$ | 44,675 | $ | 10,327 | $ | (192,115 | ) | |||||
We remeasured certain deferred tax assets and liabilities based on the rates at which they are expected to reverse in the future, which is generally 21%. However, we are still analyzing certain aspects of the Tax Act and refining our calculations, which could potentially affect the measurement of these balances or potentially give rise to new deferred tax amounts. The provisional amount recorded related to the remeasurement of our deferred tax balance was $32.4 million.
Significant components of the Company’s deferred tax assets and liabilities as of December 31, 2017 and 2016 are shown below. The Company assesses the positive and negative evidence to determine if sufficient future taxable income will be generated to use the existing deferred tax assets. The Company's evaluation of evidence resulted in management concluding that the majority of the Company's deferred tax assets will be realized. However, the Company maintains a valuation allowance to offset certain net deferred tax assets as management believes realization of such assets are uncertain as of December 31, 2017, 2016 and 2015. The valuation allowance decreased $8.4 million in 2017, increased $6.3 million in 2016
76
and decreased $231.7 million in 2015.
December 31, | |||||||
2017 | 2016 | ||||||
(in thousands) | |||||||
Deferred assets: | |||||||
Net operating loss carryforwards | $ | 90,272 | $ | 150,226 | |||
Research credit carryforwards | 30,677 | 26,878 | |||||
Fixed assets and intangibles | 1,984 | 4,385 | |||||
Accrued expenses | 845 | 943 | |||||
Contingent liabilities | 354 | 578 | |||||
Deferred revenue | 17 | — | |||||
Present value of royalties | — | 591 | |||||
Deferred rent | 28 | 45 | |||||
Capital Loss Carryforward | 1,609 | 4,432 | |||||
Viking Equity Method Investment | 5,137 | 5,692 | |||||
Other | 12,117 | 19,312 | |||||
143,040 | 213,082 | ||||||
Valuation allowance for deferred tax assets | (6,987 | ) | (15,349 | ) | |||
Net deferred tax assets | $ | 136,053 | $ | 197,733 | |||
Deferred tax liabilities: | |||||||
Retrophin fair value adjustment | $ | (243 | ) | $ | (52 | ) | |
Convertible debt | (737 | ) | (1,196 | ) | |||
Identified intangibles | (48,237 | ) | (68,631 | ) | |||
Identified indefinite lived intangibles | (2,414 | ) | (3,963 | ) | |||
Total | $ | 84,422 | $ | 123,891 | |||
As of December 31, 2017, the Company had federal and state net operating loss carryforwards set to expire through 2036 of $387.9 million and $126.5 million of state net operating loss carryforwards. The Company also has $23.8 million of federal research and development credit carryforwards, which expire through 2036. The Company has $20.7 million of California research and development credit carryforwards that have no expiration date.
Pursuant to Section 382 and 383 of the Internal Revenue Code, utilization of the Company’s net operating losses and credits may be subject to annual limitations in the event of any significant future changes in its ownership structure. These annual limitations may result in the expiration of net operating losses and credits prior to utilization. The deferred tax assets as of December 31, 2017 are net of any previous limitations due to Section 382 and 383.
The Company accounts for income taxes by evaluating a probability threshold that a tax position must meet before a financial statement benefit is recognized. The minimum threshold is a tax position that is more likely than not to be sustained upon examination by the applicable taxing authority, including resolution of any related appeals or litigation processes, based on the technical merits of the position. The Company’s remaining liabilities for uncertain tax positions are presented net of the deferred tax asset balances on the accompanying consolidated balance sheet.
A reconciliation of the amount of unrecognized tax benefits at December 31, 2017, 2016 and 2015 is as follows (in thousands):
December 31, | |||||||||||
2017 | 2016 | 2015 | |||||||||
Balance at beginning of year | $ | 38,770 | $ | 36,452 | $ | 8,524 | |||||
Additions based on tax positions related to the current year | 1,067 | 70 | 154 | ||||||||
Additions for tax positions of prior years | 109 | 2,408 | 28,224 | ||||||||
Reductions for tax positions of prior years | (10,583 | ) | (160 | ) | (450 | ) | |||||
Balance at end of year | $ | 29,363 | $ | 38,770 | $ | 36,452 | |||||
77
Included in the balance of unrecognized tax benefits at December 31, 2017 is $26.8 million of tax benefits that, if recognized would impact the effective rate. There are no positions for which it is reasonably possible that the uncertain tax benefit will significantly increase or decrease within twelve months.
The Company recognizes interest and penalties related to uncertain tax positions in income tax expense. As of December 31, 2017 and December 31, 2016, the Company recognized an immaterial amount of interest and penalties. The Company files income tax returns in the United States and in various state jurisdictions with varying statutes of limitations. The federal statute of limitation remains open for the 2013 tax year to the present. The state income tax returns generally remain open for the 2012 tax year through the present. Net operating loss and research credit carryforwards arising prior to these years are also open to examination if and when utilized.
11. Summary of Unaudited Quarterly Financial Information
The following financial information reflects all normal recurring adjustments, which are, in the opinion of management, necessary for a fair statement of the results and cash flows of interim periods. Summarized quarterly data for 2017 and 2016 are as follows (in thousands, except per share amounts):
First Quarter | Second Quarter | Third Quarter | Fourth Quarter | ||||||||||||
2016 | |||||||||||||||
Total revenues | $ | 29,648 | $ | 19,521 | $ | 21,619 | $ | 38,185 | |||||||
Total operating costs and expenses | 14,552 | 15,552 | 16,153 | 18,831 | |||||||||||
Income tax (expense) benefit | (3,694 | ) | 3,881 | (160 | ) | (10,354 | ) | ||||||||
Net income (loss) | 6,608 | (6,170 | ) | 1,051 | (3,125 | ) | |||||||||
Basic per share amounts: | |||||||||||||||
Net income (loss) | $ | 0.32 | $ | (0.30 | ) | $ | 0.05 | $ | 0.15 | ||||||
Diluted per share amounts: | |||||||||||||||
Net income (loss) | $ | 0.30 | $ | (0.30 | ) | $ | 0.05 | $ | 0.15 | ||||||
Weighted average shares—basic | 20,708 | 20,832 | 20,887 | 20,898 | |||||||||||
Weighted average shares—diluted | 22,284 | 20,832 | 22,997 | 20,898 | |||||||||||
2017 | |||||||||||||||
Total revenues | $ | 29,267 | $ | 27,995 | $ | 33,375 | $ | 50,465 | |||||||
Total operating costs and expenses | 19,051 | 14,980 | 16,882 | 22,113 | |||||||||||
Income tax (expense) benefit | (1,114 | ) | (2,242 | ) | (3,645 | ) | (37,674 | ) | |||||||
Net Income (loss) | 5,079 | 6,058 | 8,426 | (7,007 | ) | ||||||||||
Basic per share amounts: | |||||||||||||||
Net income | $ | 0.24 | $ | 0.29 | $ | 0.40 | $ | (0.33 | ) | ||||||
Diluted per share amounts: | |||||||||||||||
Net income | $ | 0.22 | $ | 0.26 | $ | 0.36 | $ | (0.33 | ) | ||||||
Weighted average shares—basic | 20,938 | 21,013 | 21,071 | 21,109 | |||||||||||
Weighted average shares—diluted | 23,019 | 23,216 | 23,551 | 21,109 | |||||||||||
Item 9. | Changes in and Disagreements with Accountants on Accounting and Financial Disclosure |
None.
Item 9A. | Controls and Procedures |
78
(a) Evaluation of Disclosure Controls and Procedures
We are responsible for maintaining disclosure controls and procedures designed to provide reasonable assurance that information required to be disclosed in reports we file under the Exchange Act is recorded, processed, summarized and reported within the specified time periods and accumulated and communicated to management, including our Chief Executive Officer and Chief Financial Officer, as appropriate, to allow timely decisions regarding required disclosure. The design of any system of controls is based in part upon certain assumptions about the likelihood of future events, and there can be no assurance that any design will succeed in achieving its stated goals under all potential future conditions; over time, controls may become inadequate because of changes in conditions, or the degree of compliance with policies or procedures may deteriorate. Because of the inherent limitations in a cost-effective control system, misstatements due to error or fraud may occur and not be detected. As of the end of the period covered by this Annual Report on Form 10-K, we have carried out an evaluation, under the supervision and with the participation of our management, including our Chief Executive Officer and Chief Financial Officer, of the effectiveness of our disclosure controls and procedures, as defined in Rules 13a-15(e) and 15d-15(e) under the Exchange Act, and have concluded our disclosure controls and procedures were effective at a reasonable assurance level as of December 31, 2017.
Changes in Internal Control over Financial Reporting
As disclosed in Form 10-K for the year ended December 31, 2016, we have concluded the material weakness in the internal control over financial reporting as described below was not remediated at December 31, 2016:
During fiscal 2017, in response to the material weakness identified, management has evaluated the design and operating effectiveness of internal controls related to tax accounting for complex transactions that have a significant tax impact, and has taken the following steps including implementing additional controls and procedures to remediate the identified material weakness:
• | Conducted multiple enhanced trainings of accounting personnel responsible for the review of our income tax matters including complex transactions that have significance tax impact |
• | Implemented additional controls and procedures to enhance precision of the detailed quarterly analysis of the Company’s deferred tax assets and liabilities including the impact of complex tax transactions to assist senior management’s review of the quarterly tax provision prepared by 3rd party |
• | Implemented process improvements to enhance management oversight of the analysis documentation necessary for the accurate presentation of deferred income taxes related to complex transactions including but not limited to detailed review and inquiries to understand the information and assumptions used in the analysis, as well as alternative practice if applicable |
During fiscal 2017, management tested the remedial controls related to the material weakness described above for a sufficient period of time and management has concluded, through testing, that by the end of the fourth quarter of fiscal 2017, these controls were operating effectively. Therefore, we have concluded that the material weakness previously identified in the Company’s internal control over financial reporting has been remediated at December 31, 2017
During fiscal year 2017, we implemented internal controls to help ensure we adequately evaluated our customer contracts and properly assessed the impact of the new revenue recognition accounting standard to our consolidated financial statements in order to facilitate our adoption on January 1, 2018, We expect to continue to implement additional internal controls related to the adoption of this standard in the first quarter of 2018.
We also continue to evaluate the impact of the Tax Act on our internal controls over financial reporting, but do not currently expect this new legislation will require us to make significant changes to our existing internal controls related to income taxes.
Except for the changes mentioned above, there have been no changes in our internal control over financial reporting that occurred in our fourth fiscal quarter that materially affected, or are reasonably likely to materially affect, our internal control over financial reporting.
(b) Management’s Report on Internal Control over Financial Reporting
79
Management is responsible for establishing and maintaining adequate internal control over financial reporting for the Company. Internal control over financial reporting is a process to provide reasonable assurance regarding the reliability of our financial reporting for external purposes in accordance with accounting principles generally accepted in the United States of America. Internal control over financial reporting includes maintaining records that in reasonable detail accurately and fairly reflect our transactions; providing reasonable assurance that transactions are recorded as necessary for preparation of our financial statements in accordance with generally accepted accounting principles; providing reasonable assurance that receipts and expenditures are made in accordance with our management and directors; and providing reasonable assurance that
unauthorized acquisition, use or disposition of company assets that could have a material effect on our financial statements would be prevented or detected on a timely basis. Because of its inherent limitations, internal control over financial reporting is not intended to provide absolute assurance that a misstatement of our financial statements would be prevented or detected.
Under the supervision and with the participation of our management, including our Chief Executive Officer and Chief Financial Officer, we conducted an evaluation of the effectiveness of our internal control over financial reporting based on the framework established by the COSO as set forth in the 2013 Internal Control-Integrated Framework. Based on our evaluation under the 2013 framework in Internal Control - Integrated Framework, management concluded that our internal controls over financial reporting were effective as of December 31, 2017.
Ernst & Young LLP, an independent registered public accounting firm, has audited the Company’s consolidated financial statements included in this Annual Report on Form 10-K and has issued an attestation report, included herein, on the effectiveness of our internal control over financial reporting as of December 31, 2017.
80
Report of Independent Registered Public Accounting Firm
The Board of Directors and Stockholders of Ligand Pharmaceuticals Incorporated.
Opinion on Internal Control over Financial Reporting
We have audited Ligand Pharmaceuticals Incorporated’s internal control over financial reporting as of December 31, 2017, based on criteria established in Internal Control-Integrated Framework issued by the Committee of Sponsoring Organizations of the Treadway Commission (2013 framework) (the COSO criteria). In our opinion, Ligand Pharmaceuticals Incorporated (the Company) maintained, in all material respects, effective internal control over financial reporting as of December 31, 2017, based on the COSO criteria.
We also have audited, in accordance with the standards of the Public Company Accounting Oversight Board (United States) (PCAOB), the consolidated balance sheets of Ligand Pharmaceuticals Incorporated as of December 31, 2017 and 2016, the related consolidated statements of operations, comprehensive income (loss), stockholders’ equity and cash flows for the years then ended, and the related notes and our report dated March 1, 2018 expressed an unqualified opinion thereon.
Basis for Opinion
The Company’s management is responsible for maintaining effective internal control over financial reporting and for its assessment of the effectiveness of internal control over financial reporting included in the accompanying Management’s Report on Internal Control over Financial Reporting. Our responsibility is to express an opinion on the Company’s internal control over financial reporting based on our audit. We are a public accounting firm registered with the PCAOB and are required to be independent with respect to the Company in accordance with the U.S. federal securities laws and the applicable rules and regulations of the Securities and Exchange Commission and the PCAOB.
We conducted our audit in accordance with the standards of the PCAOB. Those standards require that we plan and perform the audit to obtain reasonable assurance about whether effective internal control over financial reporting was maintained in all material respects.
Our audit included obtaining an understanding of internal control over financial reporting, assessing the risk that a material weakness exists, testing and evaluating the design and operating effectiveness of internal control based on the assessed risk, and performing such other procedures as we considered necessary in the circumstances. We believe that our audit provides a reasonable basis for our opinion.
Definition and Limitations of Internal Control Over Financial Reporting
A company’s internal control over financial reporting is a process designed to provide reasonable assurance regarding the reliability of financial reporting and the preparation of financial statements for external purposes in accordance with generally accepted accounting principles. A company’s internal control over financial reporting includes those policies and procedures that (1) pertain to the maintenance of records that, in reasonable detail, accurately and fairly reflect the transactions and dispositions of the assets of the company; (2) provide reasonable assurance that transactions are recorded as necessary to permit preparation of financial statements in accordance with generally accepted accounting principles, and that receipts and expenditures of the company are being made only in accordance with authorizations of management and directors of the company; and (3) provide reasonable assurance regarding prevention or timely detection of unauthorized acquisition, use, or disposition of the company’s assets that could have a material effect on the financial statements.
Because of its inherent limitations, internal control over financial reporting may not prevent or detect misstatements. Also, projections of any evaluation of effectiveness to future periods are subject to the risk that controls may become inadequate because of changes in conditions, or that the degree of compliance with the policies or procedures may deteriorate.
/s/ Ernst & Young LLP
San Diego, California
March 1, 2018
81
Part III
Item 10. | Directors, Executive Officers and Corporate Governance |
Code of Conduct
The Board of Directors has adopted a Code of Conduct and Ethics Policy (“Code of Conduct”) that applies to all officers, directors and employees. The Company will promptly disclose (1) the nature of any amendment to the Code of Conduct that applies to our principal executive officer, principal financial officer, principal accounting officer or controller or persons performing similar functions and (2) the nature of any waiver, including an implicit waiver, from a provision of our Code of Conduct that is granted to one of these specified officers, the name of such person who is granted the waiver and the date of the waiver on our website in the future. The Code of Conduct can be accessed via our website (http://www.ligand.com), Corporate Overview page. You may also request a free copy by writing to: Investor Relations, Ligand Pharmaceuticals Incorporated, 3911 Sorrento Valley Blvd, Suite 110, San Diego, CA 92121.
The other information under Item 10 is hereby incorporated by reference to Ligand’s Definitive Proxy Statement to be filed with the SEC within 120 days of December 31, 2017.
Item 11. | Executive Compensation |
Item 11 is hereby incorporated by reference to Ligand’s Definitive Proxy Statement to be filed with the SEC within 120 days of December 31 2017.
Item 12. | Security Ownership of Certain Beneficial Owners and Management and Related Stockholder Matters |
Item 12 is hereby incorporated by reference to Ligand’s Definitive Proxy Statement to be filed with the SEC within 120 days of December 31, 2017.
Item 13. | Certain Relationships and Related Transactions, and Director Independence |
Item 13 is hereby incorporated by reference to Ligand’s Definitive Proxy Statement to be filed with the SEC within 120 days of December, 2017.
Item 14. | Principal Accountant Fees and Services |
Item 14 is hereby incorporated by reference to Ligand’s Definitive Proxy Statement to be filed with the SEC within 120 days of December 31, 2017.
82
PART IV
Item 15. | Exhibits and Financial Statement Schedule |
(a) The following documents are included as part of this Annual Report on Form 10-K.
(1) Financial statements
(2) Schedules not included herein have been omitted because they are not applicable or the required information is in the consolidated financial statements or notes thereto.
(3) The following exhibits are filed as part of this Form 10-K and this list includes the Exhibit Index.
Incorporated by Reference | ||||||
Exhibit Number | Description of Exhibit | Form | File Number | Date of Filing | Exhibit Number | Filed Herewith |
Agreement and Plan of Merger, dated January 14, 2011 by and among the Company, CyDex Pharmaceuticals, Inc., and Caymus Acquisition, Inc., | 8-K | 001-33093 | January 26, 2011 | 10.1 | ||
Agreement and Plan of Merger, dated as of December 17, 2015, by and among Ligand Pharmaceuticals Incorporated, Open Monoclonal Technology, Inc., OMT, LLC, Schrader 1 Acquisition, Inc., Schrader 2 Acquisition, Inc. and Fortis Advisors LLC | 8-K | 001-33093 | December 18, 2015 | 2.1 | ||
Amended and Restated Certificate of Incorporation of the Company. | S-4 | 333-58823 | July 9, 1998 | 3.1 | ||
Certificate of Amendment of the Amended and Restated Certificate of Incorporation of the Company, dated June 14, 2000 | 10-K | 0-20720 | March 29, 2001 | 3.5 | ||
Certificate of Amendment of the Amended and Restated Certificate of Incorporation of the Company, dated June 30, 2004 | 10-Q | 0-20720 | August 5, 2004 | 3.6 | ||
Certificate of Amendment of the Amended and Restated Certificate of Incorporation of the Company, dated November 17, 2010 | 8-K | 001-33093 | November 19, 2010 | 3.1 | ||
Amended Certificate of Designation of Rights, Preferences and Privileges of Series A Participating Preferred Stock of the Company | 10-Q | 0-20720 | May 14, 1999 | 3.3 | ||
Third Amended and Restated Bylaws of the Company | 8-K | 001-33093 | September 10, 2015 | 3.1 | ||
Specimen stock certificate for shares of the common stock of the Company | S-1 | 33-47257 | April 16, 1992 | |||
2006 Preferred Shares Rights Agreement, by and between the Company and Mellon Investor Services LLC, dated October 13, 2006 | 8-K | 000-20720 | October 17, 2006 | 4.1 | ||
First Amendment to 2006 Preferred Shares Rights Agreement, by and between the Company and Computershare Shareowner Services LLC (f/k/a Mellon Investor Services LLC), dated June 19, 2013 | 8-K | 001-33093 | June 20, 2013 | 4.1 | ||
83
Indenture dated August 18, 2014 between the Company and Wilmington Trust, National Association | 8-K | 001-33093 | August 18, 2014 | 4.1 | ||
2002 Stock Incentive Plan (as amended and restated through May 23, 2016) | S-8 | 333-212775 | July 29, 2016 | 10.1 | ||
2002 Employee Stock Purchase Plan (as amended effective July 1, 2009) | S-8 | 333-160132 | June 22, 2009 | 10.2 | ||
Form of Stock Option Grant Notice and Stock Option Agreement under the Company’s 2002 Stock Incentive Plan | 10-K | 001-33093 | February 24, 2014 | 10.5 | ||
Form of Stock Issuance Agreement for non-employee directors under the Company’s 2002 Stock Incentive Plan | S-1 | 333-131029 | January 13, 2006 | 10.289 | ||
Form of Letter Agreement regarding Change of Control Severance Benefits between the Company and its officers | 10-K | 001-33093 | March 16, 2007 | 10.309 | ||
Form of Restricted Stock Unit Grant Notice and Restricted Stock Unit Agreement under the Company’s 2002 Stock Incentive Plan | X | |||||
Form of Restricted Stock Unit Grant Notice and Restricted Stock Unit Agreement under the Company’s 2002 Stock Incentive Plan - Performance-Based RSU Form | X | |||||
Form of Executive Officer Change in Control Severance Agreement | 8-K | 001-33093 | August 22, 2007 | 10.1 | ||
Amended and Restated Severance Plan, dated December 20, 2008 | 8-K | 001-33093 | December 24, 2008 | 10.2 | ||
Amended and Restated Director Compensation and Stock Ownership Policy, effective as of June 1, 2011 | 10-Q | 001-33093 | August 8, 2011 | 10.24 | ||
10.11† | Research, Development and License Agreement, dated December 29, 1994, between SmithKline Beecham Corporation and the Company . | S-1 S-3 | 33-87598 33-87600 | December 20, 1994 | ||
Amended and Restated Research, Development and License Agreement, dated December 1, 2005, between the Company and Wyeth (formerly American Home Products Corporation) | S-1 | 333-131029 | January 13, 2006 | 10.287 | ||
Lease, dated August 20, 2003, between Pharmacopeia, Inc. and Eastpark at 8A (Building 3000) | 10-K | 001-33093 | March 16, 2009 | 10.327 | ||
Collaboration and License Agreement, dated July 9, 2003 and effective August 8, 2003, between Pharmacopeia, Inc. and Schering-Plough Ltd | 10-K | 001-33093 | March 16, 2009 | 10.324 | ||
Collaboration and License Agreement, dated July 9, 2003 and effective August 8, 2003, between Pharmacopeia, Inc. and Schering Corporation | 10-K | 001-33093 | March 16, 2009 | 10.325 | ||
Amendment No. 1, dated July 27, 2006, to the Collaboration and License Agreements, effective as of July 9, 2003, between (i) Pharmacopeia, Inc. and Schering Corporation and (ii) Pharmacopeia, Inc. and Schering-Plough Ltd. | 8-K | 000-50523 | August 2, 2006 | 10.1 | ||
Settlement Agreement and Mutual Release, by and between the Company and The Rockefeller University, dated February 11, 2009 | 10-Q | 001-33093 | May 11, 2009 | 10.318 | ||
TR Beta Contingent Value Rights Agreement, dated January 27, 2010, among the Company, Metabasis Therapeutics, Inc., David F. Hale and Mellon Investor Services LLC | 8-K | 001-33093 | January 28, 2010 | 10.2 | ||
Glucagon Contingent Value Rights Agreement, dated January 27, 2010, among the Company, Metabasis Therapeutics, Inc., David F. Hale and Mellon Investor Services LLC | 8-K | 001-33093 | January 28, 2010 | 10.3 | ||
General Contingent Value Rights Agreement, dated January 27, 2010, among the Company, Metabasis Therapeutics, Inc., David F. Hale and Mellon Investor Services LLC | 8-K | 001-33093 | January 28, 2010 | 10.4 | ||
84
Amendment of General Contingent Value Rights Agreement, dated January 26, 2011, among the Company, Metabasis Therapeutics, Inc., David F. Hale and Mellon Investor Services LLC | 8-K | 001-33093 | January 31, 2011 | 10.1 | ||
Captisol® Supply Agreement, dated December 20, 2002, among CyDex, Inc., Hovione LLC, Hovione FarmaCiencia S.A., Hovione Pharmascience Limited and Hovione International Limited | 10-K | 001-33093 | March 3, 2011 | 10.100 | ||
1st Amendment to Captisol® Supply Agreement, dated July 29, 2005, among CyDex, Inc., Hovione LLC, Hovione FarmaCiencia S.A., Hovione Pharmascience Limited and Hovione International Limited | 10-K | 001-33093 | March 3, 2011 | 10.101 | ||
2nd Amendment to Captisol® Supply Agreement, dated March 1, 2007, among CyDex, Inc., Hovione LLC, Hovione FarmaCiencia S.A., Hovione Pharmascience Limited, and Hovione International Limited | 10-K | 001-33093 | March 3, 2011 | 10.102 | ||
3rd Amendment to Captisol® Supply Agreement, dated January 25, 2008, among CyDex, Inc., Hovione LLC, Hovione FarmaCiencia S.A., Hovione Pharmascience Limited, and Hovione International Limited | 10-K | 001-33093 | March 3, 2011 | 10.103 | ||
4th Amendment to Captisol® Supply Agreement, dated September 28, 2009, among CyDex Pharmaceuticals, Inc., Hovione LLC, Hovione FarmaCiencia S.A., Hovione Pharmascience Limited and Hovione International Limited | 10-K | 001-33093 | March 3, 2011 | 10.104 | ||
License Agreement, dated September 3, 1993, between CyDex L.C. and The University of Kansas | 10-K | 001-33093 | March 3, 2011 | 10.105 | ||
Second Amendment to License Agreement, dated August 4, 2004, between CyDex, Inc. and The University of Kansas | 10-K | 001-33093 | March 3, 2011 | 10.107 | ||
Acknowledgement Agreement, dated February 22, 2008, between CyDex, Inc. and The University of Kansas | 10-K | 001-33093 | March 3, 2011 | 10.111 | ||
Exclusive License Agreement, dated June 4, 1996, between Pfizer, Inc. and The University of Kansas | 10-K | 001-33093 | March 3, 2011 | 10.108 | ||
Addendum to Nonexclusive License Agreement, dated December 11, 2001, between CyDex, Inc. and Pfizer, Inc. | 10-K | 001-33093 | March 3, 2011 | 10.110 | ||
License Agreement, dated January 4, 2006, between CyDex, Inc. and Prism Pharmaceuticals, Inc. | 10-K | 001-33093 | March 3, 2011 | 10.112 | ||
Amendment to License Agreement, dated May 12, 2006, between CyDex, Inc. and Prism Pharmaceuticals, Inc. | 10-K | 001-33093 | March 3, 2011 | 10.113 | ||
Supply Agreement, dated March 5, 2007, between CyDex, Inc. and Prism Pharmaceuticals, Inc. | 10-K | 001-33093 | March 3, 2011 | 10.114 | ||
License and Supply Agreement, dated October 12, 2005, between CyDex Pharmaceuticals, Inc. and Proteolix, Inc. | 10-K | 000-28298 | February 23, 2010 | 10.22 | ||
Supply Agreement, dated June 13, 2011 by and between CyDex Pharmaceuticals, Inc. and Merck Sharp & Dohme Corporation | 10-Q/A | 001-33093 | November 2, 2017 | 10.26 | ||
License Agreement, by and between CyDex Pharmaceuticals, Inc. and Spectrum Pharmaceuticals, Inc., dated as of March 8, 2013 | 10-Q | 001-33093 | May 8, 2013 | 10.2 | ||
Supply Agreement, by and between CyDex Pharmaceuticals, Inc. and Spectrum Pharmaceuticals, Inc., dated as of March 8, 2013 | 10-Q | 001-33093 | May 8, 2013 | 10.3 | ||
Royalty Stream and Milestone Payments Purchase Agreement, dated April 29, 2013, between the Company and Selexis S.A. | 10-Q | 001-33093 | August 1, 2013 | 10.2 | ||
Amendment of “General” Contingent Value Rights Agreement dated May 20, 2014 among the Company, Metabasis Therapeutics, Inc., David F. Hale and Computershare Inc. | 8-K | 001-33093 | May 22, 2014 | 10.1 | ||
85
Amendment of “TR Beta” Contingent Value Rights Agreement dated May 20, 2014 among the Company, Metabasis Therapeutics, Inc., David F. Hale and Computershare, Inc. | 8-K | 001-33093 | May 22, 2014 | 10.2 | ||
Loan and Security Agreement dated May 21, 2014 between the Company and Viking Therapeutics, Inc. | 10-Q | 001-33093 | August 5, 2014 | 10.1 | ||
Master License Agreement dated May 21, 2014 among the Company, Metabasis Therapeutics, Inc. and Viking Therapeutics, Inc. | 10-Q | 001-33093 | August 5, 2014 | 10.2 | ||
Letter Agreement, dated as of August 12, 2014, between Bank of America, N.A. and the Company regarding the Base Convertible Note Hedge Transaction | 8-K | 001-33093 | August 18, 2014 | 10.1 | ||
Letter Agreement, dated as of August 12, 2014, between Bank of America, N.A. and the Company regarding the Base Issuer Warrant Transaction | 8-K | 001-33093 | August 18, 2014 | 10.2 | ||
Letter Agreement, dated as of August 12, 2014, between Deutsche Bank AG, London Branch and the Company regarding the Base Convertible Bond Hedge Transaction | 8-K | 001-33093 | August 18, 2014 | 10.3 | ||
Letter Agreement, dated as of August 12, 2014, between Deutsche Bank AG, London Branch and the Company regarding the Base Issuer Warrant Transaction | 8-K | 001-33093 | August 18, 2014 | 10.4 | ||
Letter Agreement, dated as of August 14, 2014, between Bank of America, N.A. and the Company regarding the Additional Convertible Bond Hedge Transaction | 8-K | 001-33093 | August 18, 2014 | 10.5 | ||
Letter Agreement, dated as of August 14, 2014, between Bank of America, N.A. and the Company regarding the Additional Issuer Warrant Transaction | 8-K | 001-33093 | August 18, 2014 | 10.6 | ||
Letter Agreement, dated as of August 14, 2014, between Deutsche Bank AG, London Branch and the Company regarding the Additional Convertible Bond Hedge Transaction | 8-K | 001-33093 | August 18, 2014 | 10.7 | ||
Letter Agreement, dated as of August 14, 2014, between Deutsche Bank AG, London Branch and the Company regarding the Additional Issuer Warrant Transaction | 8-K | 001-33093 | August 18, 2014 | 10.8 | ||
First Amendment to Master License Agreement dated September 6, 2014 among the Company, Metabasis Therapeutics, Inc. and Viking Therapeutics, Inc. | 10-Q | 001-33093 | October 31, 2014 | 10.9 | ||
Second Amendment to Master License Agreement, dated April 8, 2015, among the Company, Metabasis Therapeutics, Inc. and Viking Therapeutics, Inc. | 10-Q | 001-33093 | August 5, 2015 | 10.1 | ||
First Amendment to Loan and Security Agreement, dated April 8, 2015, among the Company, Metabasis Therapeutics, Inc. and Viking Therapeutics, Inc. | 10-Q | 001-33093 | August 5, 2015 | 10.2 | ||
Amendment No. 4 to Sublicense Agreement, dated September 17, 2015, among the Company, Pharmacopeia, LLC and Retrophin, Inc. | 10-Q/A | 001-33093 | December 23, 2015 | 10.1 | ||
Lease, dated November 3, 2015, between the Company and 3911/3931 SVB, LLC | 8-K | 001-33093 | November 10, 2015 | 10.1 | ||
Amended and Restated Director Compensation and Stock Ownership Policy, effective as of March 2014 | 10-Q | 001-33093 | November 14, 2016 | 10.1 | ||
Interest Purchase Agreement, dated May 3, 2016, between the Company and CorMatrix Cardiovascular, Inc. | 8-K/A | 001-33093 | May 9, 2016 | 10.1 | ||
Second Amendment to Loan and Security Agreement, dated January 22, 2016, between the Company and Viking Therapeutics, Inc. | 10-Q/A | 001-33093 | November 14, 2016 | 10.1 | ||
86
Form of Indemnification Agreement between the Company and each of its directors | X | |||||
Form of Indemnification Agreement between the Company and each of its officers | X | |||||
Subsidiaries of the Company | X | |||||
Consent of independent registered public accounting firm-Ernst & Young LLP | X | |||||
Consent of independent registered public accounting firm-Grant Thornton LLP | X | |||||
Certification by Principal Executive Officer, Pursuant to Rules 13a-14(a) and 15d-14(a), as adopted pursuant to Section 302 of the Sarbanes-Oxley Act of 2002. | X | |||||
Certification by Principal Financial Officer, Pursuant to Rules 13a-14(a) and 15d-14(a), as adopted pursuant to Section 302 of the Sarbanes-Oxley Act of 2002. | X | |||||
Certifications by Principal Executive Officer and Principal Financial Officer, Pursuant to 18 U.S.C. Section 1350, as adopted pursuant to Section 906 of the Sarbanes-Oxley Act of 2002. | X | |||||
101.INS | XBRL Instance Document. | |||||
101.SCH | XBRL Taxonomy Extension Schema Document. | |||||
101.CAL | XBRL Taxonomy Extension Calculation Linkbase Document. | |||||
101.DEF | XBRL Taxonomy Extension Definition Linkbase Document. | |||||
101.LAB | XBRL Taxonomy Extension Label Linkbase Document | |||||
101.PRE | XBRL Taxonomy Extension Presentation Linkbase Document. | |||||
† | Confidential treatment has been requested for portions of this exhibit. These portions have been omitted and submitted separately to the Securities and Exchange Commission. |
# | Indicates management contract or compensatory plan. |
87
SIGNATURES
Pursuant to the requirements of Section 13 or 15(d) of the Securities Exchange Act of 1934, the registrant has duly caused this report to be signed on its behalf by the undersigned, thereunto duly authorized.
LIGAND PHARMACEUTICALS INCORPORATED | |
By: | /S/ JOHN L. HIGGINS |
John L. Higgins, | |
Chief Executive Officer | |
Date: March 1, 2018
Pursuant to the requirements of the Securities Exchange Act of 1934, this report has been signed below by the following persons on behalf of the registrant and in the capacities and on the dates indicated.
Signature | Title | Date | ||
/s/ JOHN L. HIGGINS | Chief Executive Officer and Director (Principal Executive Officer) | March 1, 2018 | ||
John L. Higgins | ||||
/s/ MATTHEW KORENBERG | Executive Vice President, Finance and Chief Financial Officer (Principal Financial and Accounting Officer) | March 1, 2018 | ||
Matthew Korenberg | ||||
/s/ TODD C. DAVIS | Director | March 1, 2018 | ||
Todd C. Davis | ||||
/s/ SUNIL PATEL | Director | March 1, 2018 | ||
Sunil Patel | ||||
/s/ STEPHEN L. SABBA | Director | March 1, 2018 | ||
Stephen L. Sabba | ||||
/s/ JOHN W. KOZARICH | Director | March 1, 2018 | ||
John W. Kozarich | ||||
/s/ JOHN L. LAMATTINA | Director | March 1, 2018 | ||
John L. Lamattina | ||||
/s/ JASON M. ARYEH | Director | March 1, 2018 | ||
Jason M. Aryeh | ||||
/s/ NANCY R. GRAY | Director | March 1, 2018 | ||
Nancy R. Gray | ||||
88