Attached files
| file | filename |
|---|---|
| EX-32.2 - EXHIBIT 32.2 - Kinsale Capital Group, Inc. | knslexhibit32212312017.htm |
| EX-32.1 - EXHIBIT 32.1 - Kinsale Capital Group, Inc. | knslexhibit32112312017.htm |
| EX-31.2 - EXHIBIT 31.2 - Kinsale Capital Group, Inc. | knslexhibit31212312017.htm |
| EX-31.1 - EXHIBIT 31.1 - Kinsale Capital Group, Inc. | knslexhibit31112312017.htm |
| EX-23.1 - EXHIBIT 23.1 - Kinsale Capital Group, Inc. | knslexhibit23112312017.htm |
| EX-21.1 - EXHIBIT 21.1 - Kinsale Capital Group, Inc. | knslexhibit21112312017.htm |
| EX-10.4 - EXHIBIT 10.4 - Kinsale Capital Group, Inc. | exhibit41formofrestricteds.htm |
UNITED STATES
SECURITIES AND EXCHANGE COMMISSION
WASHINGTON, D.C. 20549
FORM 10-K
(Mark One)
☒ ANNUAL REPORT PURSUANT TO SECTION 13 OR 15(d) OF THE SECURITIES EXCHANGE ACT OF 1934
For the Fiscal Year Ended December 31, 2017
or
☐ | TRANSITION REPORT PURSUANT TO SECTION 13 OR 15(d) OF THE SECURITIES EXCHANGE ACT OF 1934 |
For the transition period from _____ to _____
Commission file number 001-37848
KINSALE CAPITAL GROUP, INC. (Exact name of registrant as specified in its charter) | ||
Delaware (State or other jurisdiction of incorporation or organization) | 98-0664337 (I.R.S. Employer Identification Number) | |
2221 Edward Holland Drive Suite 600 Richmond, Virginia (Address of principal executive offices) | 23230 (Zip Code) | |
Registrant’s telephone number, including area code: (804) 289-1300 | ||
Securities registered pursuant to Section 12(b) of the Act: Common Stock, par value $0.01 per share (Title of each class) | ||
Nasdaq Global Select Market (Name of each exchange on which registered) | ||
Securities registered pursuant to Section 12(g) of the Act: None | ||
Indicate by check mark if the registrant is a well-known seasoned issuer, as defined in Rule 405 of the Securities Act. Yes ☐ No ☒
Indicate by check mark if the registrant is not required to file reports pursuant to Section 13 or 15(d) of the Securities Act. Yes ☐ No ☒
Indicate by check mark whether the registrant (1) has filed all reports required to be filed by Section 13 or 15(d) of the Securities Exchange Act of 1934 during the preceding 12 months (or for such shorter period that the registrant was required to file such reports) and (2) has been subject to such filing requirements for the past 90 days. Yes ☒ No ☐
Indicate by check mark whether the registrant has submitted electronically and posted on its corporate Web site, if any, every Interactive Data File required to be submitted and posted pursuant to Rule 405 of Regulation S-T during the preceding 12 months (or for such shorter period that the registrant was required to submit and post such files). Yes ☒ No ☐
Indicate by check mark if disclosure of delinquent filers pursuant to Item 405 of Regulation S-K is not contained herein, and will not be contained, to the best of registrant’s knowledge, in definitive proxy or information statements incorporated by reference in Part III of this Form 10-K or any amendment to this Form 10-K. ☐
Indicate by check mark whether the registrant is a large accelerated filer, an accelerated filer, a non-accelerated filer, or a smaller reporting company. See the definitions of "large accelerated filer," "accelerated filer" and "smaller reporting company" in Rule 12b-2 of the Securities Exchange Act of 1934.
Large accelerated filer ☒ | Accelerated filer ☐ | Non-accelerated filer ☐ (Do not check if a smaller reporting company) |
Smaller reporting company ☐ | Emerging growth company ☐ | |
If an emerging growth company, indicate by check mark if the registrant has elected not to use the extended transition period for complying with any new or revised financial accounting standards provided pursuant to Section 13(a) of the Exchange Act. ☐
Indicate by check mark whether the registrant is a shell company (as defined in Rule 12b-2 of the Exchange Act). Yes ☐ No ☒
The aggregate market value of the shares of the registrant's common stock held by non-affiliates as of June 30, 2017 was approximately $706,063,693.
The number of the registrant’s common shares outstanding was 21,047,452 as of February 23, 2018.
DOCUMENTS INCORPORATED BY REFERENCE:
Portions of the registrant’s definitive proxy statement relating to its 2018 annual meeting of stockholders (the "2018 Proxy Statement") are incorporated by reference into Part III of this Annual Report on Form 10-K. The 2018 Proxy Statement will be filed with the Securities and Exchange Commission within 120 days after the end of the fiscal year covered by this Annual Report on Form 10-K.
Table of Contents
Page | ||
PART I | ||
Item 1. | ||
Item 1A. | ||
Item 1B. | ||
Item 2. | ||
Item 3. | ||
Item 4. | ||
PART II | ||
Item 5. | ||
Item 6. | ||
Item 7. | ||
Item 7A. | ||
Item 8. | ||
Item 9. | ||
Item 9A. | ||
Item 9B. | ||
PART III | ||
Item 10. | ||
Item 11. | ||
Item 12. | ||
Item 13. | ||
Item 14. | ||
PART IV | ||
Item 15. | ||
Item 16. | ||
i
Forward-Looking Statements
This Annual Report on Form 10-K contains forward-looking statements, within the meaning of the Private Securities Litigation Reform Act of 1995. Forward-looking statements include any statement that does not directly relate to historical or current fact. These statements may discuss, among others, our future financial performance, our business prospects and strategy, our anticipated financial position, liquidity and capital, dividends and general market and industry conditions. You can identify forward-looking statements by words such as "anticipates," "estimates," "expects," "intends," "plans," "predicts," "projects," "believes," "seeks," "outlook," "future," "will," "would," "should," "could," "may," "can have" and similar terms. Forward-looking statements are based on management’s current expectations and assumptions about future events, which are subject to uncertainties, risks and changes in circumstances that are difficult to predict. These statements are only predictions and are not guarantees of future performance. Actual results may differ materially from those contemplated by a forward-looking statement. Factors that may cause such differences include, without limitation:
• | the possibility that our loss reserves may be inadequate to cover our actual losses, which could have a material adverse effect on our financial condition, results of operations and cash flows; |
• | the inherent uncertainty of models resulting in actual losses that are materially different than our estimates; |
• | adverse economic factors, including recession, inflation, periods of high unemployment or lower economic activity resulting in the sale of fewer policies than expected or an increase in frequency or severity of claims and premium defaults or both, affecting our growth and profitability; |
• | a decline in our financial strength rating adversely affecting the amount of business we write; |
• | the potential loss of one or more key executives or an inability to attract and retain qualified personnel adversely affecting our results of operations; |
• | our reliance on a select group of brokers; |
• | the failure of any of the loss limitations or exclusions we employ, or change in other claims or coverage issues, having a material adverse effect on our financial condition or results of operations; |
• | the performance of our investment portfolio adversely affecting our financial results; |
• | the changing market conditions of our excess and surplus lines ("E&S") insurance operations, as well as the cyclical nature of our business, affecting our financial performance; |
• | extensive regulation adversely affecting our ability to achieve our business objectives or the failure to comply with these regulations adversely affecting our financial condition and results of operations; |
• | the ability to pay dividends being dependent on our ability to obtain cash dividends or other permitted payments from our insurance subsidiary; |
• | being forced to sell investments to meet our liquidity requirements; |
• | the inability to obtain reinsurance coverage at reasonable prices and on terms that adequately protect us; |
• | our employees taking excessive risks; |
• | the possibility that severe weather conditions and other catastrophes may result in an increase in the number and amount of claims filed against us; |
• | the inability to manage our growth effectively; |
ii
• | the intense competition for business in our industry; |
• | the effects of litigation having an adverse effect on our business; |
• | the failure to maintain effective internal controls in accordance with the Sarbanes-Oxley of 2002 (the "Sarbanes-Oxley Act"); and |
• | the other risks and uncertainties discussed in Part I, Item 1A of this Annual Report on Form 10-K. |
Forward-looking statements speak only as of the date on which they are made. Except as expressly required under federal securities laws or the rules and regulations of the Securities and Exchange Commission ("SEC"), we do not assume any obligation to update or revise any forward-looking statement, whether as a result of new information, future events or otherwise. You should not place undue reliance on forward-looking statements. All forward-looking statements attributable to us are expressly qualified by these cautionary statements.
iii
PART I
Unless the context requires otherwise, the words "Kinsale," the "Company," "we," "us" and "our'" in this Annual Report on Form 10-K refer to Kinsale Capital Group, Inc. and its subsidiaries.
Item 1. Business
Kinsale focuses exclusively on the excess and surplus lines ("E&S") market in the U.S., where we can use our underwriting expertise to write coverages for hard-to-place small business risks and personal lines risks. We market and sell these insurance products in all 50 states, the District of Columbia, the Commonwealth of Puerto Rico and the U.S. Virgin Islands primarily through a network of independent insurance brokers. Our experienced and cohesive management team has an average of over 25 years of experience in the E&S market. Many of our employees and members of our management team have also worked together for decades at other E&S insurance companies.
Our goal is to deliver long-term value for our stockholders by growing our business and generating attractive returns. We seek to accomplish this by generating consistent and attractive underwriting profits while managing our capital prudently. Using our proprietary technology platform and leveraging the expertise of our highly experienced employees in our daily operations, we have built a company that is entrepreneurial and highly efficient. We believe our systems and technology are at the digital forefront of the insurance industry and allow us to quickly collect and analyze data, thereby improving our ability to manage our business and reduce our response times for our customers. We believe that we have differentiated ourselves from our competitors by effectively leveraging technology, vigilantly controlling expenses and maintaining control over our underwriting and claims operations.
We have significantly grown our business and have generated attractive returns. Excluding the impact of the $72.8 million of net proceeds from our initial public offering ("IPO") during the third quarter of 2016, we have organically grown our stockholders’ equity at a compound annual growth rate ("CAGR") of 21.2% as of December 31, 2017 from December 31, 2013. We have grown our gross written premiums from $125.3 million for the year ended December 31, 2013 to $223.2 million for the year ended December 31, 2017, a CAGR of 15.5%. Our return on equity and combined ratios were 11.1% and 84.0%, respectively, for the year ended December 31, 2017. We believe that we are well positioned to continue to capitalize on attractive opportunities in our target market and to prudently grow our business.
History
Kinsale Capital Group, Inc., a Delaware domiciled insurance holding company, was formed on June 3, 2009 for the purpose of acquiring and managing insurance entities. Prior to September 5, 2014, the Company was a Bermuda registered holding company, formerly known as Kinsale Capital Group, Ltd. ("KCGL"). Effective September 5, 2014, KCGL was re-domesticated from Bermuda to Delaware. A wholly-owned subsidiary of KCGL, Kinsale Capital Group, Inc., which was formed on June 4, 2009 as a U.S. holding company, was immediately merged into the re-domesticated entity and Kinsale Capital Group, Ltd. changed its name to Kinsale Capital Group, Inc.
On June 4, 2009, we incorporated Kinsale Management, Inc. ("Kinsale Management") as a wholly-owned subsidiary domiciled in Delaware, in order to provide management services to all of our U.S.-based subsidiaries.
On February 5, 2010, we acquired American Healthcare Specialty Insurance Company and changed its name to Kinsale Insurance Company ("Kinsale Insurance"). Kinsale Insurance is an Arkansas-domiciled insurance company and is eligible to operate on an excess and surplus lines basis in 50 states, the District of Columbia, the Commonwealth of Puerto Rico and the U.S. Virgin Islands.
On August 21, 2013, we established Aspera Insurance Services, Inc. ("Aspera"), an insurance broker. Aspera is domiciled in Virginia and is authorized to conduct business in Virginia, Alabama, California, Connecticut, Delaware, Florida, Georgia, Louisiana, Maine, Maryland, Massachusetts, Mississippi, New Hampshire, New Jersey, New York, North Carolina, Pennsylvania, Rhode Island, South Carolina and Texas.
1
Our Products
We write a broad array of insurance coverages for risks that are unique or hard-to-place in the standard insurance market. Typical E&S risks include newly established companies or industries, high-risk operations, insureds in litigious venues, or companies with poor loss histories. We target classes of business where our underwriters have extensive experience allowing us to compete effectively and earn attractive risk-adjusted returns. Our underwriters specialize in individual lines of business which allow them to develop in-depth knowledge and experience of the risks they underwrite. Our core client focus is small to medium-sized accounts, which we believe tend to be subject to less competition and have better pricing. The average premium on a policy written by us in 2017 was approximately $8,200. We believe that our strategy, experience and expertise allow us to compete effectively in the E&S market and will enable us to generate attractive long-term stockholder value.
In 2017, the percentage breakdown of our gross written premiums was 93.4% casualty and 6.6% property. Our commercial lines offerings include construction, small business, energy, excess casualty, general casualty, product liability, professional liability, life sciences, allied health, health care, commercial property, management liability, environmental, public entity, inland marine and commercial insurance. We also write a small amount of homeowners insurance in the personal lines market, which in aggregate represented 3.9% of our gross written premiums in 2017.
Our Competitive Strengths
We believe that our competitive strengths include:
Exclusive focus on the E&S market. The E&S, or non-admitted, market has historically operated at lower loss ratios and higher margins, and has grown direct premiums written more quickly than the admitted market. From 2001 to 2016, A.M. Best Company's ("A.M. Best") domestic professional surplus lines composite produced an average net loss and loss adjustment expense ratio of 69.0% and grew direct premiums written by 6.9% annually, versus 73.9% and 3.5% respectively for the property and casualty ("P&C") industry.
Underwriting expertise across a broad spectrum of hard-to-place risks. We have a broad appetite to underwrite a diverse set of risks across the E&S market. Our underwriting team is highly experienced, and individually underwrites each risk to appropriately price and structure solutions. We balance our broad risk appetite by maintaining a diversified book of smaller accounts with strong pricing and well defined coverages. Unlike many of our competitors, we do not extend underwriting authority to brokers, agents or other third parties. For the year ended December 31, 2017, our loss ratio was 58.9%.
Technology is a core competency. As an insurance company that was founded in 2009, we have the benefit of having built a proprietary technology platform that reflects the best practices our management team has learned from its extensive prior experience. We operate on a single digital platform with a data warehouse that collects a vast array of statistical data. Our platform provides a high degree of efficiency, accuracy and speed across all of our processes. We are able to use the data that we collect to quickly analyze trends across all functions in our business. Our customized proprietary system helps us to reduce the risk of administrative errors in our policy forms and include all of the necessary exclusions for the specified risk, and provides for the efficient and accurate handling of claims. Additionally, our systems enable us to rapidly respond to brokers, allowing our underwriters to reply to the majority of submissions within 24 hours, a significant benefit to our brokers. We believe that our technology platform will provide us with an enduring competitive advantage as it allows us to quickly respond to market opportunities, and will continue to scale as our business grows.
Significantly lower expense ratio than our competitors. Expense management is ingrained in our business culture. We believe that our proprietary technology platform coupled with our low-cost operation allow us to process policy quotes, underwrite policies and operate at a lower cost than our direct competitors. In particular, our efficient platform allows us to provide a higher level of service to our brokers and to target smaller accounts which we believe are generally subject to less competition. For the year ended December 31, 2017 our expense ratio was 25.1%.
Fully integrated claims management. We believe that actively managing our claims is an important aspect of keeping losses low, while accurately setting reserves. We manage all of our claims in-house and do not delegate claims management authority to third parties. We promptly and thoroughly investigate all claims, generally through direct contact with the insured, and leverage both our systems and our underwriters to gather the relevant facts. When we believe claims
2
are without merit, we vigorously contest payment. We currently average 134 open claims per claims adjuster (111 open claims per claims adjuster excluding catastrophe claims), which we believe is significantly lower than industry average. As of December 31, 2017, our reserves for claims incurred but not reported were approximately 81.1% of our total net loss reserves. Of the total open claims as of December 31, 2017, only 31.2% were open for accident years 2015 and prior.
Entrepreneurial management team with a track record of success. Our management team is highly experienced with an average of over 25 years of relevant experience, bringing together a full suite of underwriting, claims, technology and operating skills that we believe will drive our long-term success. The majority of our management team has a proven track record of successfully building high performing specialty insurance companies. We are led by Michael Kehoe who, prior to founding Kinsale, was the president and chief executive officer of James River Insurance Company from 2002 until 2008. Prior to James River Insurance Company, Mr. Kehoe held several senior positions at Colony Insurance Company. Many of our other employees and members of our management team worked with Mr. Kehoe at James River Insurance Company and have decades of experience at other E&S insurance companies. As meaningful owners of Kinsale, we believe our management team has closely aligned interests with our stockholders.
Our Board of Directors has deep insurance and financial services industry experience. Our Board of Directors is comprised of accomplished industry veterans. Collectively, our board members bring decades of experience from their prior roles operating and working in insurance and other financial services companies.
Our Strategy
We believe that our approach to our business will allow us to achieve our goals of both growing our business and generating attractive returns. Our approach involves:
Expand our presence in the E&S market. According to A.M. Best, the total E&S market was approximately $42.4 billion of direct written premiums in 2016. Based on our 2017 gross written premiums of $223.2 million, our current market share is approximately 0.5%. We believe that our exclusive focus on the E&S market and our high levels of service, including our ability to quote, underwrite and bind insurance policies in a timely manner given our efficient systems, allow us to better serve our brokers and positions us to profitably increase our market share.
Generate underwriting profits. We will continue to focus on underwriting profitability regardless of market cycles. Our strategy is to concentrate on hard-to-place risks and to maintain adequate rate levels for the risks that we underwrite. We maintain control over our underwriting process to ensure consistent quality of work. We underwrite each account individually and never delegate authority to any outside agents or brokers.
Maintain a contrarian risk appetite. Our flexibility as an E&S insurer enables us to write business at attractive returns while offering competitive policies to our brokers and insureds. We believe we distinguish ourselves in the market with our contrarian risk appetite and our willingness to offer terms on risks requiring more extensive underwriting that some of our competitors may decline to consider. Such accounts frequently offer us a better risk-adjusted return than those preferred by our competitors due to reduced competition.
Leverage investment in technology to drive efficiencies. We use a proprietary technology platform to drive a high level of efficiency, accuracy and speed in our underwriting and quoting process. We have organized our workflows, designed our systems and aligned our staff to provide superior service levels to brokers while achieving a level of efficiency that we believe provides us with a competitive advantage and helps contribute to our low expense ratio. We believe that automation also reduces human error in our underwriting, policy processing, accounting, collections, and claims adjusting processes. Additionally, we are able to track quotes, monitor historical loss experience and reserve development, and measure other relevant metrics at a granular level of detail. We believe that our technology is scalable and will allow us to maintain a low expense ratio as we continue to organically grow our business.
Maintain a strong balance sheet. In order to maintain the confidence of policyholders, brokers, reinsurers, investors, regulators and rating agencies, we seek to establish and maintain a conservative balance sheet. We have a robust process for setting our loss reserves and regularly reviewing our estimates. In addition, we maintain a conservative investment portfolio. Our strong balance sheet allows us to maintain the confidence of our investors and other constituencies, and thereby position ourselves to better achieve our goals.
3
Our Structure
The chart below displays our corporate structure:
Kinsale Capital Group, Inc. (Delaware corporation) | ||||||||
Kinsale Management, Inc. (Delaware corporation; management services company) | Kinsale Insurance Company (Arkansas domiciled corporation; stock insurance company) | Aspera Insurance Services, Inc. (Virginia corporation; insurance broker) | ||||||
Products
We write a broad array of coverages with a focus on smaller commercial buyers. Our average premium in 2017 was approximately $8,200. In 2017, the percentage breakdown of our gross written premiums was 93.4% casualty and 6.6% property. Our commercial lines product offerings include construction, small business, professional liability, excess casualty, general casualty, energy, life sciences, allied health, product liability, health care, commercial property, management liability, inland marine, environmental, public entity and commercial insurance. We also write a small amount of homeowners insurance in the personal lines market, which in aggregate represented 3.9% of our gross written premiums in 2017. Our business is primarily distributed through independent brokers.
4
The following table shows our gross written premiums by underwriting division for the years ended December 31, 2017, 2016 and 2015.
Year Ended December 31, | ||||||||||||
2017 | 2016 | 2015 | ||||||||||
($ in thousands) | ||||||||||||
Gross written premium by division: | ||||||||||||
Commercial: | ||||||||||||
Construction | $ | 48,587 | $ | 42,234 | $ | 36,932 | ||||||
Small business | 34,896 | 27,333 | 21,468 | |||||||||
Energy | 22,898 | 16,157 | 19,022 | |||||||||
Excess casualty | 20,260 | 17,799 | 16,194 | |||||||||
General casualty | 15,865 | 16,162 | 20,511 | |||||||||
Products liability | 14,288 | 10,140 | 9,480 | |||||||||
Professional liability | 12,956 | 14,212 | 14,636 | |||||||||
Life sciences | 12,408 | 10,897 | 11,935 | |||||||||
Allied health | 10,645 | 9,344 | 8,644 | |||||||||
Healthcare | 6,235 | 6,594 | 6,579 | |||||||||
Commercial property | 5,609 | 4,835 | 6,181 | |||||||||
Management liability | 4,123 | 2,244 | 420 | |||||||||
Environmental | 2,692 | 1,931 | 1,005 | |||||||||
Public entity | 1,265 | 875 | — | |||||||||
Inland marine | 967 | 910 | 195 | |||||||||
Commercial insurance | 816 | 459 | — | |||||||||
Total commercial | 214,510 | 182,126 | 173,202 | |||||||||
Personal: | ||||||||||||
Personal insurance | 8,681 | 6,352 | 3,807 | |||||||||
Total personal | 8,681 | 6,352 | 3,807 | |||||||||
Total | $ | 223,191 | $ | 188,478 | $ | 177,009 | ||||||
Construction underwrites commercial general liability coverage on contractors focusing on new residential construction, residential remodeling and renovation and commercial construction. Policy limits offered are generally $1 million per occurrence.
Small business underwrites commercial general liability on smaller risks with an emphasis on artisan contractors and premises related exposures. The majority of policies written in this division are for limits of $1 million per occurrence.
Energy underwrites commercial general liability, pollution liability, professional liability and excess liability on enterprises engaged in the business of energy production or distribution or mining including drillers, lease operators, contractors and product manufacturers. The policy limits offered range from $1 million to $10 million.
Excess casualty underwrites excess liability over risks that would fit within the general casualty, construction, products liability and small business divisions above. Coverage is written over our primary liability policies as well as those of other insurers. This division also writes excess liability over primary commercial auto liability policies written by other carriers. We typically provide between $1 million and $10 million per occurrence limits above a $1 million attachment point.
General casualty underwrites general liability and liquor liability on hospitality, habitational and retail risks, among others, with similar premises liability loss exposures. Policy limits generally equal $1 million.
5
Products liability underwrites commercial general liability on manufacturers, distributors and importers of a wide array of consumer, commercial and industrial products. We generally write $1 million per occurrence limits.
Professional liability underwrites small-to-medium sized non-medical professional liability risks. The classes of risks we cover include accountants, architects and engineers, financial planners, insurance agents, lawyers, realtors, and certain other professions. Policy limits offered are generally $1 million.
Life sciences underwrites general liability, products liability and professional liability coverage for manufacturers, distributors and developers of dietary supplements, medical devices, pharmaceuticals, biologics, health and beauty products, durable medical equipment and clinical trials. Typical policy limits are offered between $1 million and $10 million.
Allied health underwrites commercial general liability, professional liability and excess liability on allied health and social service risks including assisted living facilities, home health care agencies and outpatient medical facilities. Policy limits offered are between $1 million to $10 million.
Health care underwrites medical professional liability for physicians, surgeons, dentists, chiropractors and podiatrists. Policies cover both individuals and small practice groups. We generally write $1 million per occurrence in limits.
Commercial property underwrites catastrophe-exposed risks including manufacturing facilities, government and municipal buildings, professional buildings, offices and general commercial properties, vacant properties, as well as entertainment and retail facilities. Policy limits offered are generally $10 million or less per occurrence.
Management liability underwrites directors and officers liability, employment practices liability and fiduciary liability coverage on a variety of commercial and government risks. Policy limits offered are $1 million to $5 million.
Environmental underwrites commercial general liability, pollution liability and professional liability on a wide range of commercial risks where environmental exposures exist that are operational in nature or related to the premises. Policy limits offered in this coverage are up to $10 million per occurrence.
Public entity underwrites law enforcement professional liability and school board liability. Policy limits offered are generally $1 million.
Inland marine underwrites a variety of inland marine coverages including builders risk, contractors' equipment, transportation risks and mobile equipment. Policy limits offered in this coverage are typically $2 million per occurrence or less.
Commercial insurance underwrites commercial general liability on small accounts, through our wholly-owned broker, Aspera.
Personal insurance writes homeowners coverage on manufactured homes with a catastrophe exposure due to coastal location. Limits are typically below $200,000.
6
We sell policies in all 50 states, the District of Columbia, the Commonwealth of Puerto Rico and the U.S. Virgin Islands. The following tables show our gross written premiums by state for the years ended December 31, 2017, 2016 and 2015.
Year Ended December 31, | |||||||||||||||||||||
2017 | % of Total | 2016 | % of Total | 2015 | % of Total | ||||||||||||||||
($ in thousands) | |||||||||||||||||||||
Gross written premiums by state: | |||||||||||||||||||||
California | $ | 60,632 | 27.2 | % | $ | 51,619 | 27.4 | % | $ | 43,473 | 24.6 | % | |||||||||
Texas | 31,732 | 14.2 | % | 26,060 | 13.8 | % | 26,607 | 15.0 | % | ||||||||||||
Florida | 24,964 | 11.2 | % | 19,873 | 10.5 | % | 16,199 | 9.2 | % | ||||||||||||
Washington | 11,454 | 5.1 | % | 8,892 | 4.7 | % | 7,199 | 4.1 | % | ||||||||||||
New York | 10,378 | 4.6 | % | 9,680 | 5.2 | % | 11,549 | 6.6 | % | ||||||||||||
New Jersey | 7,208 | 3.2 | % | 6,801 | 3.6 | % | 7,119 | 4.0 | % | ||||||||||||
Nevada | 4,871 | 2.2 | % | 4,894 | 2.6 | % | 3,673 | 2.1 | % | ||||||||||||
Arizona | 4,587 | 2.1 | % | 4,093 | 2.2 | % | 3,788 | 2.1 | % | ||||||||||||
Illinois | 4,404 | 2.0 | % | 3,438 | 1.8 | % | 3,062 | 1.7 | % | ||||||||||||
Pennsylvania | 4,383 | 2.0 | % | 4,016 | 2.1 | % | 3,960 | 2.2 | % | ||||||||||||
All other states | 58,578 | 26.2 | % | 49,112 | 26.1 | % | 50,380 | 28.4 | % | ||||||||||||
$ | 223,191 | 100.0 | % | $ | 188,478 | 100.0 | % | $ | 177,009 | 100.0 | % | ||||||||||
Marketing and Distribution
We market our products through a broad group of independent insurance brokers that we believe can consistently produce reasonable volumes of quality business for us. We also sell policies through our wholly-owned broker, Aspera. Aspera distributes 4.3% of Kinsale’s premiums, primarily personal lines, through independent brokers. Kinsale does not grant its brokers any underwriting or claims authority.
We select our brokers based on management's review of the experience, knowledge and business plan of each broker. While many of our brokers have more than one office, we evaluate each office as if it were a separate brokerage and may appoint some but not all offices owned by a broker for specialized lines of business. We seek brokers with business plans that are consistent with our strategy and underwriting objectives. Brokers must be able to demonstrate an ability to competently produce both the quality and quantity of business that we seek. For our more specialized divisions, we seek to appoint brokers that have a similar focus and demonstrated experience in the particular line of business. Brokers who produce unacceptably low volumes of business may be terminated. Our underwriters regularly visit with brokers in their offices in order to market to these brokers and discuss the products we offer.
For the year ended December 31, 2017, our largest brokers were AmWINS Group, LLC, which produced $26.4 million, or 11.8%, of our gross written premiums, CRC Insurance Services Inc., which produced $24.4 million, or 10.9%, of our gross written premiums, and R-T Specialty, LLC, which produced $23.1 million, or 10.4%, of our gross written premiums. No other broker accounted for more than 10% of our gross written premiums in the year ended December 31, 2017.
It is important to us that we maintain excellent relationships with the group of brokers who present business to us. Commissions are an important part of that relationship, but brokers will also typically consider the ultimate price to the insured, and the service and expertise offered by the carrier when determining where to place their business. In 2017, we paid an average commission to our brokers of 14.8% of gross written premiums. We believe this is slightly lower than the average commission paid by our competitors. We believe that our specialization in hard-to-place risks, combined with our high degree of service, including our rapid speed-to-quote, permits us to manage our commission expense as part of our overall management of the underwriting process. Additionally, we do not contract out our underwriting to program managers or general agents which typically requires a higher commission level to compensate the third party for its work on behalf of the carrier.
7
Underwriting
Our underwriting department consisted of 89 employees as of December 31, 2017. We use our proprietary technology platform to drive a high level of efficiency, accuracy and speed in our underwriting and quoting process. We believe our internal business processing systems allow us to maintain a high ratio of underwriters to total employees, as we do not require a significant number of administrative personnel to facilitate our underwriting process. We also believe that our digital environment allows us to engage fewer employees in policy administration.
We are very selective in the policies we choose to bind, with approximately one in every 9 submissions bound. If our underwriters cannot reasonably expect to bind coverage at the combination of premium and coverage that meets our standards, they are encouraged to quickly move on to another prospective opportunity. For the year ended December 31, 2017, we received approximately 226,000 new business submissions, issued approximately 116,000 new quotes and bound 14,000 new policies for a policy to new submission ratio of 6.2%. We are careful to establish terms that are suited to the risk and the pricing of our policies. As an E&S company, we use our freedom of rate and form assertively in order to appropriately underwrite risks that have already been rejected by licensed carriers based on approved forms and filed rates.
Beyond simply selecting risks, we attempt to craft policies that offer affordable protection to insureds by tailoring coverages in ways that make potential losses more predictable and reduce claims costs. For example, our "defense inside the limits" clause, which we applied to more than 98% of our Professional Liability premiums written in 2017, means that funds we expend defending an insured against a claim are counted against the total policy limit. We believe we do not have any material exposure to claims from asbestos, lead paint, silica, mold or nuclear, biological or chemical terrorism.
Claims
Our claims department consisted of 18 claims professionals who had an average of 10 years of claims experience in the P&C industry as of December 31, 2017. Our Chief Claims Officer has over 30 years of claims experience in large commercial and specialty insurance claims departments. Our claims department is fully integrated with our other functional departments. We manage all of our claims in-house and do not delegate claims management authority to third parties.
We focus on the effective management of the claims adjusting process. This process is achieved by extending low reserve and settlement authority levels to our front line claim examiners; keeping the adjuster-to-supervisor ratios low to allow for greater supervision over the adjusting process; and monitoring the number of claims handled by each claims examiner. This method ensures that two or more members of the department participate in the decision-making process when appropriate; our claim examiners recognize and address key issues; and reserves are adjusted to the appropriate amount as necessary. We seek to manage the number of claims per claims examiner to allow our claim examiners sufficient time to review and investigate claims submitted. Moreover, prior to any scheduled mediation or trial, claims personnel conduct further peer review to ensure that issues and exposures have been adequately analyzed. In addition, our claim examiners work closely with members of the underwriting staff to keep them apprised of claim trends. Vendor management is also important and our claim examiners work closely with our vendors to manage expenses and costs.
Information Technology
Our information technology department consisted of 21 employees as of December 31, 2017. Our Chief Information Officer has over 30 years of experience in the technology field. Our information technology utilizes an agile methodology to develop best-in-class software solutions and to attract and retain quality staff.
We have built a proprietary technology platform that reflects the best practices our management team has learned from its extensive prior experiences. Our proprietary technology platform is comprised of 14 modules linked together in a common system. All of the modules currently in use were developed in-house. We designed the architecture for our information systems in a fashion that would allow us to reduce our administrative costs and quickly provide us with useful information. Our insurance company subsidiary operates in a digital environment, which eliminates the costs of printing, storing and handling thousands of documents each week. Moreover, by maintaining electronic files on each account, we
8
have been able to facilitate clear communication among personnel responsible for handling matters related to underwriting, servicing and claims as each has access to full information regarding the account.
We use a browser-based platform approach to processing business. When a broker makes a submission, the information is transferred into our browser-based underwriting system. This eliminates costly data-entry steps in our underwriting process and permits the underwriter to focus on underwriting the account accurately and rapidly.
Since inception, we have been intent on capturing and analyzing our data and building, over time, a robust repository of information that we can use to improve our decision making. We refer to this repository as our data warehouse. The design of our data warehouse permits us to capture a vast array of statistical data, collected by the policy management systems at Kinsale. The data warehouse is easily searchable, collects and labels information in a consistent format and contains most of the underwriting and claims information we collect at every level. The data warehouse permits us flexibility with regard to analyzing our business by segment or in the aggregate. We believe the proprietary technology platform, which includes the data warehouse, is a competitive advantage for us.
Reinsurance
We enter into various reinsurance contracts to limit our exposure to potential losses arising from large risks and to provide additional capacity for growth. Reinsurance involves an insurance company transferring ("ceding") a portion of its exposure on a risk to another insurer, the reinsurer. The reinsurer assumes the exposure in return for a portion of the premium. The ceding of liability to a reinsurer does not legally discharge the primary insurer from its liability for the full amount of the policies on which it obtains reinsurance. The primary insurer remains liable for the entire loss if the reinsurer fails to meet its obligations under the reinsurance agreement.
We use treaty reinsurance and, on a limited basis, facultative reinsurance coverage. Treaty coverage refers to a reinsurance contract that is applied to a group or class of business where all the risks written meet the criteria for that class. Facultative coverage refers to a reinsurance contract on individual risks as opposed to a group or class of business. It is used for a variety of reasons, including supplementing the limits provided by the treaty coverage or covering risks or perils excluded from treaty reinsurance.
Historically, we ceded risks through our MLQS. The MLQS transferred a portion of the risk related to certain lines of business written by us to reinsurers in exchange for a proportion of the gross written premiums on that business. Transferring risk to the reinsurers also reduced the amount of capital required to support our insurance operations. Under the terms of the MLQS contract covering the 2016 calendar year ("2016 MLQS"), we received a provisional ceding commission equal to 41% of ceded written premiums and paid a reinsurance margin equal to 4% of ceded written premium. The MLQS included a sliding scale commission provision that reduced the ceding commission to 25% or increased the ceding commission to 41% based on the loss experience of the business ceded. Additionally, we were entitled to an additional contingent profit commission up to an amount equal to all of the reinsurers’ profits above the margin based on the underwriting results of the business ceded, upon commutation of the contract. The contract had a loss ratio cap of 110%, which means that we could not cede any losses in excess of a 110% loss ratio to the reinsurers. As a result of the successful completion of our IPO in August 2016, we terminated and commuted the 2016 MLQS contract on October 1, 2016. Effective January 1, 2017, we commuted the remaining outstanding MLQS contract, which covered the period January 1, 2015 through December 31, 2015. For a discussion regarding the effects of the MLQS contract on our results, see "Management's Discussion and Analysis of Financial Condition and Results of Operations — Overview."
9
The following is a summary of our significant reinsurance programs as of December 31, 2017:
Line of Business Covered | Company Policy Limit | Reinsurance Coverage | Company Retention | |||
Property - per risk | Up to $10.0 million per occurrence | $9.0 million excess of $1.0 million | $1.0 million per occurrence | |||
Property - catastrophe (1) | N/A | $45.0 million excess of $5.0 million | $5.0 million per catastrophe | |||
Primary casualty (2) | Up to $10.0 million per occurrence | $9.0 million excess of $1.0 million | $1.0 million per occurrence | |||
Excess casualty (3) | Up to $10.0 million per occurrence | Variable quota share | $1.5 million per occurrence except as described in note (3) below | |||
(1) | Our property catastrophe reinsurance reduces the financial impact of a catastrophe event involving multiple claims and policyholders. Our property catastrophe reinsurance includes a reinstatement provision which requires us to pay reinstatement premiums after a loss has occurred in order to preserve coverage. Including the reinstatement provision, the maximum aggregate loss recovery limit is $90 million and is in addition to the per-occurrence coverage provided by our facultative and other treaty coverages. |
(2) | Reinsurance is not applicable to any individual policy with a per occurrence limit of $1.0 million or less. |
(3) | For policies with a per occurrence limit higher than $1.0 million, the quota share ceding percentage varies such that the retention is always $1.5 million or less. For example, for a $2.0 million limit excess policy, our retention would be 75%, whereas for a $10.0 million limit excess policy, our retention would be 15%. For policies for which we also write an underlying primary limit, the retention on the primary and excess policy combined would not exceed $1.5 million. |
At each renewal, we consider any plans to change the underlying insurance coverage we offer, as well as updated loss activity, the level of our capital and surplus, changes in our risk appetite and the cost and availability of reinsurance treaties. In the last renewal cycle, we maintained similar retentions on most lines of business.
Reinsurance contracts do not relieve us from our obligations to policyholders. Failure of the reinsurer to honor its obligation could result in losses to us, and therefore, we establish allowances for amounts considered uncollectible. In formulating our reinsurance programs, we are selective in our choice of reinsurers and we consider numerous factors, the most important of which are the financial stability of the reinsurer, its history of responding to claims and its overall reputation. In an effort to minimize our exposure to the insolvency of our reinsurers, we review the financial condition of each reinsurer annually. In addition, we continually monitor for rating downgrades involving any of our reinsurers. At December 31, 2017, all reinsurance contracts that our insurance subsidiary was party to were either with companies with A.M. Best ratings of "A" (Excellent) or better. As of December 31, 2017, we have never had a loss for uncollectible reinsurance.
10
We had reinsurance recoverables on unpaid losses of $48.2 million at December 31, 2017, and recoverables on paid losses of $1.4 million at December 31, 2017. The following table provides a summary of our top five reinsurers, based on the net amount recoverable, at December 31, 2017:
Reinsurers | A.M. Best Rating | Reinsurance Recoverable | ||||||
($ in thousands) | ||||||||
Swiss Reinsurance America Corp. | A+ | $ | 22,104 | |||||
Munich Reinsurance America, Inc. | A+ | 9,776 | ||||||
SCOR Reinsurance Co. | A | 6,384 | ||||||
Arch Reinsurance Co. | A+ | 4,516 | ||||||
Odyssey America Reinsurance Corp. | A | 3,452 | ||||||
Total for Top Five | 46,232 | |||||||
All others | 3,361 | |||||||
Total | $ | 49,593 | ||||||
We did not have reinsurance recoverables greater than $0.9 million at December 31, 2017 from any individual reinsurer other than the five listed above.
To reduce credit exposure to reinsurance recoverable balances, we obtain letters of credit from certain reinsurers that are not authorized as reinsurers under U.S. state insurance regulations. In addition, under the terms of our reinsurance contracts discussed above, we may retain funds due from reinsurers as security for those recoverable balances. We had funds held by the Company under the MLQS contract of $36.5 million at December 31, 2016. Effective January 1, 2017, the Company commuted the MLQS covering the 2015 calendar year ("2015 MLQS"). The commutation reduced funds held for reinsurers by $36.5 million with a corresponding reduction to reinsurance recoverables on unpaid losses of $27.9 million and receivables from reinsurers of $8.6 million.
Catastrophe Risk Management
In addition to the reinsurance protection noted above, we use other techniques to carefully manage our exposure to catastrophe losses. We use computer models to analyze the risk of severe losses from natural catastrophes. We measure exposure to these losses in terms of probable maximum loss ("PML"), which is an estimate of the amount of loss we would expect to meet or exceed once in a given number of years (referred to as the return period). When managing our catastrophe exposure, we focus on the 100 year and the 250 year return periods. Our main catastrophe risk arises from hurricanes and earthquakes. We manage this exposure through careful and disciplined underwriting, extensive reinsurance protection purchased from financially strong counterparties and monthly catastrophe modeling of the portfolio. Additionally, we limit the concentration of property business by geographic area to reduce loss exposure from extreme events.
Reserve Development
We maintain reserves for specific claims incurred and reported, reserves for claims incurred but not reported and reserves for uncollectible reinsurance when appropriate. Our ultimate liability may be greater or less than current reserves. In the insurance industry, there is always the risk that reserves may prove inadequate. We continually monitor reserves using new information on reported claims and a variety of statistical techniques. Anticipated inflation is reflected implicitly in the reserving process through analysis of cost trends and the review of historical development. We do not discount our reserves for unpaid losses and loss adjustment expenses to reflect estimated present value.
See Note 7 of the notes to consolidated financial statements and "Critical Accounting Estimates" for a discussion of estimates and assumptions related to the reserves for unpaid losses and loss adjustment expenses.
11
Investments
Investment income is an important component of our earnings. We collect premiums from our insureds and invest a portion of these funds until claims are paid. We seek to maximize investment returns using investment guidelines that stress prudent allocation among cash and cash equivalents, fixed-maturity securities and, to a lesser extent, equity securities.
Our cash and invested assets generally consist of fixed maturity securities, short-term investments, cash and cash equivalents, exchange traded funds and preferred stock (classified as equity securities on the balance sheet). Our fixed maturity securities and equity securities are classified as "available-for-sale" and are carried at fair value with unrealized gains and losses on these securities reported, net of tax, as a separate component of accumulated other comprehensive income (loss). Fair value generally represents quoted market value prices for securities traded in the public market or prices analytically determined using bid or closing prices for securities not traded in the public marketplace. Short-term investments are reported at cost and include investments that are both readily convertible to known amounts of cash and have maturities of 12 months or less upon acquisition by us.
Our cash and invested assets totaled $561.1 million at December 31, 2017 and $480.3 million at December 31, 2016, and is summarized as follows:
December 31, 2017 | December 31, 2016 | |||||||||||||
Fair Value | % of Portfolio | Fair Value | % of Portfolio | |||||||||||
($ in thousands) | ||||||||||||||
Fixed maturities: | ||||||||||||||
U.S. Treasury securities and obligations of U.S. government agencies | $ | 9,098 | 1.6 | % | $ | 12,098 | 2.5 | % | ||||||
Obligations of states, municipalities and political subdivisions | 164,326 | 29.3 | % | 123,238 | 25.7 | % | ||||||||
Corporate and other securities | 71,631 | 12.8 | % | 118,790 | 24.7 | % | ||||||||
Asset-backed securities | 95,360 | 17.0 | % | 73,294 | 15.3 | % | ||||||||
Residential mortgage-backed securities | 84,776 | 15.1 | % | 83,803 | 17.4 | % | ||||||||
Total fixed maturities | 425,191 | 75.8 | % | 411,223 | 85.6 | % | ||||||||
Equity securities: | ||||||||||||||
Exchange traded funds | 34,380 | 6.1 | % | 18,374 | 3.8 | % | ||||||||
Nonredeemable preferred stock | 19,752 | 3.5 | % | — | — | |||||||||
Total equity securities | 54,132 | 9.6 | % | 18,374 | 3.8 | % | ||||||||
Cash and cash equivalents | 81,747 | 14.6 | % | 50,752 | 10.6 | % | ||||||||
Total | $ | 561,070 | 100.0 | % | $ | 480,349 | 100.0 | % | ||||||
Our policy is to invest primarily in high quality fixed maturity securities with a focus on preservation of capital and a secondary focus on maximizing our risk adjusted investment returns. Investment policy is set by the Investment Committee of the Board of Directors, subject to the limits of applicable regulations. Our investment policy is designed to comply with the regulatory investment requirements and restrictions to which our insurance subsidiary is subject. Our investment portfolio is managed by an outside investment advisory firm, New England Asset Management, Inc., which operates under guidelines approved by our Investment Committee. Our Investment Committee meets periodically and reports to our Board of Directors.
Our investment policy also imposes strict requirements for credit quality, with a minimum average credit quality of the portfolio being rated "AA-" or higher by Standard & Poor's or the equivalent rating from another nationally recognized rating agency. Our investment policy also imposes restrictions on concentrations of securities by class and issuer. As of
12
December 31, 2017, our fixed maturity portfolio, including cash and cash equivalents, had an average duration of 3.9 years and had an average rating of "AA."
The following table sets forth the composition of our portfolio of fixed maturity securities by rating as of December 31, 2017:
AAA | AA | A | BBB | Below BBB | Total | |||||||||||||||||||
($ in thousands) | ||||||||||||||||||||||||
U.S. Treasury securities and obligations of U.S. government agencies | $ | — | $ | 9,098 | $ | — | $ | — | $ | — | $ | 9,098 | ||||||||||||
Obligations of states, municipalities and political subdivisions | 10,972 | 94,272 | 58,976 | 106 | — | 164,326 | ||||||||||||||||||
Corporate and other securities | — | 6,733 | 42,120 | 15,722 | 7,056 | 71,631 | ||||||||||||||||||
Asset-backed securities | 70,717 | 8,264 | 11,033 | 5,346 | — | 95,360 | ||||||||||||||||||
Residential mortgage-backed securities | 3,510 | 71,677 | — | 7,541 | 2,048 | 84,776 | ||||||||||||||||||
Total fixed maturities | $ | 85,199 | $ | 190,044 | $ | 112,129 | $ | 28,715 | $ | 9,104 | $ | 425,191 | ||||||||||||
The fair value of our investments in fixed maturity securities at December 31, 2017, summarized by stated maturities follows:
December 31, 2017 | |||||||
Estimated | % of | ||||||
Fair Value | Fair Value | ||||||
($ in thousands) | |||||||
Due in one year or less | $ | 49,973 | 11.8 | % | |||
Due after one year through five years | 29,299 | 6.9 | % | ||||
Due after five years through ten years | 29,800 | 7.0 | % | ||||
Due after ten years | 135,983 | 32.0 | % | ||||
Asset-backed securities | 95,360 | 22.4 | % | ||||
Residential mortgage-backed securities | 84,776 | 19.9 | % | ||||
Total fixed maturities | $ | 425,191 | 100.0 | % | |||
Actual maturities may differ for some securities because borrowers have the right to call or prepay obligations with or without penalties. As of December 31, 2017, our fixed maturity security portfolio contained $84.8 million (19.9%) of residential mortgage-backed securities. Residential mortgage-backed securities ("RMBSs"), including collateralized mortgage obligations, are subject to prepayment risks that vary with, among other things, interest rates. During periods of declining interest rates, RMBSs generally prepay faster as the underlying mortgages are prepaid and refinanced by the borrowers in order to take advantage of the lower rates. As a result, during periods of falling interest rates, proceeds from such prepayments generally must be reinvested at lower prevailing yields. In addition, RMBSs that have an amortized cost that is greater than par (i.e., purchased at a premium) may incur a reduction in yield or a loss as a result of such prepayments. Conversely, during periods of rising interest rates, the rate of prepayments generally slows. RMBSs that have an amortized value that is less than par (i.e., purchased at a discount) may incur a decrease in yield as a result of a slower rate of prepayments. Changes in estimated cash flows due to changes in prepayment assumptions from the original purchase assumptions are revised based on current interest rates and the economic environment. Our investment policy does not permit us to own any interest only, principal only or residual tranches of RMBSs.
13
At December 31, 2017, our portfolio of fixed maturity securities contained corporate bonds with a fair value of $71.6 million. A summary of these securities by industry segment is shown below as of December 31, 2017:
December 31, 2017 | |||||||
Industry | Fair Value | % of Total | |||||
($ in thousands) | |||||||
Industrials and other | $ | 47,950 | 66.9 | % | |||
Financial | 20,015 | 28.0 | % | ||||
Utilities | 3,666 | 5.1 | % | ||||
Total | $ | 71,631 | 100.0 | % | |||
Approximately 6% of our total cash and investments were invested in Vanguard exchange traded funds ("ETFs"), which provide low-cost diversification. At December 31, 2017, our ETF balance was comprised of the following funds:
December 31, 2017 | |||||||
Fund | Fair Value | % of Total | |||||
($ in thousands) | |||||||
Domestic stock market fund | $ | 16,088 | 46.8 | % | |||
Foreign stock market fund | 9,297 | 27.0 | % | ||||
Dividend yield equity fund | 8,010 | 23.3 | % | ||||
Intermediate-term corporate bond fund | 985 | 2.9 | % | ||||
Total | $ | 34,380 | 100.0 | % | |||
Approximately 4% of our total cash and investments were invested in nonredeemable preferred stock. A summary of these securities by industry segment is shown below as of December 31, 2017:
December 31, 2017 | |||||||
Industry | Fair Value | % of Total | |||||
($ in thousands) | |||||||
Financial | $ | 15,859 | 80.3 | % | |||
Utilities | 2,120 | 10.7 | % | ||||
Industrials and other | 1,773 | 9.0 | % | ||||
Total | $ | 19,752 | 100.0 | % | |||
Competition
The P&C insurance industry is highly competitive. We compete with domestic and international insurers, some of which have greater financial, marketing and management resources and experience than we do. We may also compete with new market entrants in the future. Competition is based on many factors, including the perceived market strength of the insurer, pricing and other terms and conditions, services provided, the speed of claims payment, the reputation and experience of the insurer and ratings assigned by independent rating organizations such as A.M. Best. We currently have a rating from A.M. Best of "A-" (Excellent). Ratings for an insurance company are based on its ability to pay policyholder obligations and are not directed toward the protection of investors.
Today, our primary competitors in the E&S sector include Alleghany Corporation, Argo Group International Holdings, Ltd., James River Group Holdings, Ltd., Markel Corporation, Navigators Group Inc., RLI Corp. and W. R. Berkley Corporation.
14
Regulation
Insurance regulation
We are regulated by insurance regulatory authorities in the states in which we operate. State insurance laws and regulations generally are designed to protect the interests of policyholders, consumers and claimants rather than stockholders or other investors. The nature and extent of state regulation varies by jurisdiction, and state insurance regulators generally have broad administrative power relating to, among other matters, setting capital and surplus requirements, licensing of insurers and agents, establishing standards for reserve adequacy, prescribing statutory accounting methods and the form and content of statutory financial reports, regulating certain transactions with affiliates and prescribing types and amounts of investments.
Regulation of insurance companies constantly changes as governmental agencies and legislatures react to real or perceived issues. In recent years, the state insurance regulatory framework has come under increased federal scrutiny, and some state legislatures have considered or enacted laws that alter and, in many cases, increase, state authority to regulate insurance companies and insurance holding company systems. Further, the National Association of Insurance Commissioners ("NAIC") and some state insurance regulators are re-examining existing laws and regulations specifically focusing on issues relating to the solvency of insurance companies, interpretations of existing laws and the development of new laws. Although the federal government does not directly regulate the business of insurance, federal initiatives often affect the insurance industry in a variety of ways. In addition, the Federal Insurance Office (the "FIO") was established within the U.S. Department of the Treasury by the Dodd-Frank Wall Street Reform and Consumer Protection Act (the "Dodd-Frank Act") in July 2010 to monitor all aspects of the insurance industry, including identifying issues or gaps in the regulation of insurers that could contribute to a systemic crisis in the insurance industry or the U.S. financial system. See "—Federal and state legislative and regulatory changes" below.
Among the various legislative changes that state legislatures have considered and adopted is deregulation of commercial lines insurance. In some states, the deregulation of commercial lines generally enables admitted insurers to underwrite certain commercial P&C risks without the necessity of obtaining prior approval for rates and forms, although the content of policy forms is still regulated. In other states, the terms and conditions of commercial insurance policy forms have been deregulated. The deregulation of commercial lines may permit risks that would not otherwise be considered attractive by standard market carriers to be underwritten by such carriers using forms and rates that are attractive to them. In such states, competition in the E&S markets could increase.
Required licensing
Kinsale Insurance is organized and domiciled in the State of Arkansas and is authorized (licensed) in the State of Arkansas to transact certain lines of P&C insurance. This license is in good standing, and, pursuant to applicable Arkansas laws and regulations, will continue in force unless suspended, revoked or otherwise terminated, subject to certain conditions, including the payment by Kinsale Insurance of annual continuation fees, the filing of annual statutory financial statements and the filing of an annual registration statement with the Arkansas Insurance Department.
Kinsale Insurance currently operates on an excess and surplus lines basis in all 50 states, the District of Columbia, the Commonwealth of Puerto Rico and the U.S. Virgin Islands. While Kinsale Insurance does not have to apply for and maintain a license in those states (with the exception of Arkansas, its domiciliary state), it is subject to maintaining suitability standards under each particular state’s surplus lines laws to be included as an eligible surplus lines carrier (as discussed below, the Dodd-Frank Act has brought uniformity to these standards (see "—Federal and state legislative and regulatory changes")). In states in which it operates on a surplus line basis, Kinsale Insurance has freedom of rate and form on the majority of its business. This means that Kinsale Insurance can implement a change in policy form, underwriting guidelines, or rates for a product without regulatory approval.
Almost all insurance is written through licensed agents and brokers. In states in which we operate on a non-admitted basis, general agents and their retail insurance brokers generally are required to certify that a certain number of licensed admitted insurers had been offered and declined to write a particular risk prior to placing that risk with us.
15
Insurance holding company regulation
We operate as an insurance holding company system and are subject to the insurance holding company laws of the State of Arkansas, the state in which Kinsale Insurance is organized and domiciled. These statutes require that each insurance company in the system register with the insurance department of its state of domicile and furnish information concerning the operations of companies within the holding company system that may materially affect the operations, management or financial condition of the insurers within the system and domiciled in that state. These statutes also provide that all transactions among members of a holding company system must be fair and reasonable. Transactions between insurance subsidiaries and their parents and affiliates generally must be disclosed to the state regulators, and notice to or prior approval of the applicable state insurance regulator generally is required for any material or extraordinary transaction.
Changes of control
Before a person can acquire control of a U.S. domestic insurer, prior written approval must be obtained from the insurance commissioner of the state where the insurer is domiciled, or the acquiror must make a disclaimer of control filing with the insurance department of such state and obtain approval thereon. Prior to granting approval of an application to acquire control of a domestic insurer, the domiciliary state insurance commissioner will consider a number of factors, which include the financial strength of the proposed acquiror, the acquiror’s plans for the future operations of the domestic insurer and any anti-competitive results that may arise from the consummation of the acquisition of control.
Generally, state insurance statutes provide that control over a domestic insurer is presumed to exist if any person, directly or indirectly, owns, controls, holds with the power to vote, or holds proxies representing, ten percent or more of the voting securities of the domestic insurer. This statutory presumption of control may be rebutted by a showing that control does not exist in fact. The state regulators, however, may find that "control" exists in circumstances in which a person owns or controls less than ten percent of the voting securities of the domestic insurer.
As Kinsale Insurance is domiciled in Arkansas, the insurance laws and regulations of that state would be applicable to any proposed acquisition of control of Kinsale Insurance. Under applicable Arkansas insurance laws and regulations, no person may acquire control of a domestic insurer until written approval is obtained from the state insurance commissioner following a public hearing on the proposed acquisition. Such approval would be contingent upon the state insurance commissioner’s consideration of a number of factors, including among others, the financial strength of the proposed acquiror, the integrity and management of the acquiror’s board of directors and executive officers, the acquiror’s plans for the future operations of the domestic insurer and any anti-competitive results that may arise from the consummation of the acquisition of control. Arkansas insurance laws and regulations pertaining to changes of control apply to both the direct and indirect acquisition of ten percent or more of the voting stock of an Arkansas-domiciled insurer. Accordingly, the acquisition of ten percent or more of our common stock would be considered an indirect change of control of Kinsale Insurance and would trigger the applicable change of control filing requirements under Arkansas insurance laws and regulations, absent a disclaimer of control filing and its acceptance by the Arkansas Insurance Department. These requirements may discourage potential acquisition proposals and may delay, deter or prevent a change of control of us, including through transactions that some or all of our stockholders might consider to be desirable.
Restrictions on paying dividends
We are a holding company with no business operations of our own. Consequently, our ability to pay dividends to stockholders and meet our debt payment obligations is largely dependent on dividends and other distributions from our insurance subsidiary. State insurance laws restrict the ability of our insurance subsidiary to declare stockholder dividends. State insurance regulators require insurance companies to maintain specified levels of statutory capital and surplus. The maximum dividend distribution absent the approval or non-disapproval of the insurance regulatory authority in Arkansas is limited by Arkansas law to the greater of 10% of policyholder surplus as of December 31 of the previous year or net income, not including realized capital gains, for the previous calendar year. Dividend payments are further limited to that part of available policyholder surplus which is derived from net profits on an insurer’s business. The maximum amount of dividends Kinsale Insurance can pay us during 2018 without regulatory approval is $23.7 million. Insurance regulators have broad powers to prevent reduction of statutory surplus to inadequate levels, and there is no assurance that dividends of the maximum amounts calculated under any applicable formula would be permitted. State insurance regulatory
16
authorities that have jurisdiction over the payment of dividends by our insurance subsidiary may in the future adopt statutory provisions more restrictive than those currently in effect.
Investment regulation
Kinsale Insurance is subject to state laws which require diversification of our investment portfolios and limits on the amount of our investments in certain categories. Failure to comply with these laws and regulations would cause non-conforming investments to be treated as non-admitted assets in the states in which we are licensed to sell insurance policies for purposes of measuring statutory surplus and, in some instances, would require us to sell those investments.
Restrictions on cancellation, non-renewal or withdrawal
Many states have laws and regulations that limit the ability of an insurance company licensed by that state to exit a market. Some states prohibit an insurer from withdrawing from one or more lines of business in the state except pursuant to a plan approved by the state insurance regulator, which may disapprove a plan that may lead to market disruption. Some state statutes may explicitly or by interpretation apply these restrictions to insurers operating on a surplus lines basis.
Licensing of our employees and adjusters
In certain states in which we operate, insurance claims adjusters are required to be licensed and some must fulfill annual continuing education requirements. In most instances, our employees who are negotiating coverage terms are underwriters and employees of the Company and are not required to be licensed agents. As of December 31, 2017, 17 of our employees were required to maintain and did maintain requisite licenses for these activities in most states in which we operate.
Enterprise risk and other new developments
The NAIC, as part of its solvency modernization initiative, has engaged in a concerted effort to strengthen the ability of U.S. state insurance regulators to monitor U.S. insurance holding company groups. The NAIC’s solvency modernization initiative, among other things, aims to expand the authority and focus of state insurance regulators to encompass U.S. insurance holding company systems at the group level. The holding company reform efforts at the NAIC culminated in December 2010 in the adoption of significant amendments to the NAIC’s Insurance Holding Company System Regulatory Act (the "Model Holding Company Act") and its Insurance Holding Company System Model Regulation (the "Model Holding Company Regulation"). Among other things, the revised Model Holding Company Act and Model Holding Company Regulation explicitly address "enterprise" risk - the risk that an activity, circumstance, event or series of events involving one or more affiliates of an insurer will, if not remedied promptly, be likely to have a material adverse effect upon the financial condition or liquidity of the insurer or its insurance holding company system as a whole - and require annual reporting of potential enterprise risk as well as access to information to allow the state insurance regulator to assess such risk. In addition, the Model Holding Company Act amendments include a requirement to the effect that any person divesting control over an insurer must provide 30 days’ notice to the regulator and the insurer (with an exception for cases where a Form A is being filed). The amendments direct the domestic state insurance regulator to determine those instances in which a divesting person will be required to file for and obtain approval of the transaction.
Some form of the 2010 amendments to the Model Holding Company Act has been adopted in all states, including Arkansas. In April 2015, Arkansas adopted the principal components of the amended Model Holding Company Act. Under the Arkansas amendments, the ultimate controlling person of insurers subject to registration is required to file an annual enterprise risk report with the lead state commissioner, when applicable, of the insurance holding company system as determined by the procedures within the Financial Analysis Handbook adopted by the NAIC.
In December 2014, the NAIC adopted additional revisions to the Model Holding Company Act, updating the model to clarify the group-wide supervisor for a defined class of internationally active insurance groups. The revisions also outline the process for determining the lead state for domestic insurance groups, outline the activities the commissioner may engage in as group-wide supervisor and extend confidentiality protections to cover information received in the course of group-wide supervision. The 2014 revisions to the Model Holding Company Act have been adopted in Arkansas.
In 2012, the NAIC adopted the Risk Management and Own Risk and Solvency Assessment ("ORSA") Model Act, which requires domestic insurers to maintain a risk management framework and establishes a legal requirement for domestic
17
insurers to conduct an ORSA in accordance with the NAIC’s ORSA Guidance Manual. The ORSA Model Act provides that domestic insurers, or their insurance group, must regularly conduct an ORSA consistent with a process comparable to the ORSA Guidance Manual process. The ORSA Model Act also provides that, no more than once a year, an insurer’s domiciliary regulator may request that an insurer submit an ORSA summary report, or any combination of reports that together contain the information described in the ORSA Guidance Manual, with respect to the insurer and the insurance group of which it is a member. If and when the ORSA Model Act is adopted by a particular state, the ORSA Model Act would impose more extensive filing requirements on parents and other affiliates of domestic insurers. Effective July 2015, Arkansas adopted its version of the ORSA Model Act. Our subsidiary, Kinsale Insurance, will be subject to the requirements of the ORSA Model Act adopted in Arkansas when its direct written premiums and unaffiliated assumed premiums, if any, exceed $500 million (Kinsale Insurance is currently exempt from such requirements based on the amount of its direct written premiums and unaffiliated assumed premiums).
Additionally, in response to the growing threat of cyber-attacks in the insurance industry, certain jurisdictions have begun to consider new cybersecurity measures, including the adoption of cybersecurity regulations which, among other things, would require insurance companies to establish and maintain a cybersecurity program and implement and maintain cybersecurity policies and procedures. On October 24, 2017, the NAIC adopted its Insurance Data Security Model Law, intended to serve as model legislation for states to enact in order to govern cybersecurity and data protection practices of insurers, insurance agents, and other licensed entities registered under state insurance laws. The New York Department of Financial Services (DFS) issued new regulations governing cybersecurity requirements for financial services companies, which became effective on March 1, 2017. The regulations require insurance companies, among others, licensed in New York to assess their specific cyber risk profiles and design cyber security programs to address such risks. We have filed with the DFS, on behalf of our licensees in New York, our program compliance certification pertaining to the DFS cybersecurity requirements for 2017. We are currently monitoring whether the other states in which we conduct business adopt the NAIC’s Insurance Data Security Model Law.
Federal and state legislative and regulatory changes
From time to time, various regulatory and legislative changes have been proposed in the insurance industry. Among the proposals that have in the past been or are at present being considered are the possible introduction of federal regulation in addition to, or in lieu of, the current system of state regulation of insurers and proposals in various state legislatures (some of which have been enacted) to conform portions of their insurance laws and regulations to various model acts adopted by the NAIC. As discussed above, the NAIC has undertaken a solvency modernization initiative focused on updating the U.S. insurance solvency regulation framework, including capital requirements, governance and risk management, group supervision, accounting and financial reporting and reinsurance. The 2010 and 2014 revisions to the Model Holding Company Act (discussed above), as well as the ORSA Model Act, are a result of these efforts.
The U.S. federal government’s oversight of the insurance industry was expanded under the Dodd-Frank Act. Prior to the enactment of the Dodd-Frank Act in July 2010, the U.S. federal government’s regulation of the insurance industry was essentially limited to certain insurance products, such as flood insurance, multi-peril crop insurance and reinsurance of losses from terrorism. As part of the overall federal financial regulatory reform package contained in the Dodd-Frank Act, Congress has legislated reforms in the reinsurance and surplus lines sectors (as discussed below).
Under reinsurance credit rules established under the Dodd-Frank Act, a U.S. ceding insurer need not satisfy the reinsurance credit rules of any nondomestic state if the following two conditions are met: (1) the ceding insurer’s domestic state is NAIC-accredited or has financial solvency requirements substantially similar to the requirements necessary for NAIC accreditation, and (2) the ceding insurer’s domestic state recognizes credit for reinsurance for its ceded risk.
The Dodd-Frank Act also incorporates the Nonadmitted and Reinsurance Reform Act of 2010 ("NRRA"), which became effective on July 21, 2011. Among other things, the NRRA establishes national uniform standards on how states may regulate and tax surplus lines insurance and sets national standards concerning the regulation of reinsurance. In particular, the NRRA gives regulators in the home state of an insured exclusive authority to regulate and tax surplus lines insurance transactions, and regulators in a ceding insurer’s state of domicile the sole responsibility for regulating the balance sheet credit that the ceding insurer may take for reinsurance recoverables.
18
The Dodd-Frank Act also established the FIO in the U.S. Department of the Treasury and vested the FIO with the authority to monitor all aspects of the insurance sector, monitor the extent to which traditionally underserved communities and consumers have access to affordable non-health insurance products, and to represent the United States on prudential aspects of international insurance matters, including at the International Association of Insurance Supervisors (the "IAIS"). In addition, the FIO serves as an advisory member of the Financial Stability Oversight Council, assists the secretary of the U.S. Department of the Treasury with administration of the Terrorism Risk Insurance Program, and advises the secretary of the U.S. Department of the Treasury on important national and international insurance matters. In addition, the FIO has the ability to recommend to the Financial Stability Oversight Council the designation of an insurer as "systemically significant" and therefore subject to regulation by the Federal Reserve as a bank holding company.
In limited circumstances, the FIO can declare a state insurance law or regulation "preempted," but this can be done only after extensive consultation with state insurance regulators, the Office of the U.S. Trade Representative and key insurance industry players (in trade associations representing insurers and intermediaries). Additionally, the FIO must publish a notice regarding the basis for the preemption in the Federal Register, allowing a reasonable opportunity for comments. The FIO cannot preempt state antitrust laws governing rate making, underwriting, sales practices or coverage requirements. No later than September 30th of each year, the FIO must submit an annual report to Congress explaining any use of the preemption authority during the prior year.
In addition, a number of federal laws affect and apply to the insurance industry, including various privacy laws and the economic and trade sanctions implemented by the Office of Foreign Assets Control ("OFAC") of the U.S. Department of the Treasury. OFAC maintains and enforces economic sanctions against certain foreign countries and groups and prohibits U.S. persons from engaging in certain transactions with certain persons or entities. OFAC has imposed civil penalties on persons, including insurance and reinsurance companies, arising from violations of its economic sanctions program.
On December 12, 2013, the FIO submitted a report to Congress as required under the Dodd-Frank Act on improving U.S. insurance regulation (the "Modernization Report"). The Modernization Report concludes that the federal government should continue its involvement in insurance regulation, emphasizing the need for improved uniformity and efficiency in the U.S. insurance regulatory system, but that the current "hybrid" state and federal regulatory system should remain in place. The Modernization Report also recommends certain steps that should be taken to modernize and improve the U.S. insurance regulatory system through a combination of actions to be taken by the state and federal governments. Many of the recommendations in the Modernization Report are subject to NAIC initiatives. As the FIO does not have regulatory authority, the recommendations in its report could be viewed as advisory in nature. Most suggestions for U.S. federal standards and involvement in insurance regulation would require U.S. Congressional action. Whether many of the recommendations will be implemented, altered considerably, or delayed for an extended period is still uncertain. In its 2017 Annual Report on the Insurance Industry released on September 22, 2017, the FIO continued to highlight perceived shortcomings in the state-based insurance regulatory system, particularly concerns regarding the cyber insurance market, and advocate for improved uniformity across a number of insurance regulatory issues; however, the U.S. Department of Treasury also endorsed the state-based regulatory model for the U.S. insurance industry and recommended narrowing the scope of federal involvement in publications issued in 2017 (including the report issued on October 26, 2017, pursuant to an executive order of President Trump, examining the regulatory framework for asset management and insurance industries).
On November 20, 2015, the FIO and the Office of the U.S. Trade Representative announced their intention to exercise their authority under the Dodd-Frank Act to negotiate a “covered agreement” with the European Union (the “Covered Agreement”). After a number of private negotiating sessions, on January 13, 2017, the U.S. Department of Treasury and the Office of the U.S. Trade Representative notified Congress that they had completed negotiations with the European Union for the Covered Agreement, which addressed reinsurance, insurance group supervision and the exchange of information between insurance supervisors. The Covered Agreement was formally entered into on September 22, 2017.
With respect to reinsurance, under the Covered Agreement, both the U.S. and the European Union agreed that their supervisory authorities will not impose reinsurance collateral requirements or "local presence" requirements on a reinsurer domiciled in (or with a head office in) the other’s territory that are less favorable than collateral or local presence requirements applied to a domestic reinsurer. However, the collateral or local presence provisions apply only if the insurer or reinsurer satisfies certain conditions and standards, including among others, minimum capital and risk-based capital,
19
confirmation of financial condition by the reinsurer’s domestic regulator and claims payment standards. U.S. states have five years from execution of the Covered Agreement to adopt reinsurance reforms removing collateral requirements for European Union reinsurers that meet the prescribed conditions in the Covered Agreement. If the FIO determines that state laws are inconsistent with the Covered Agreement (the process of making potential preemption determinations will begin 42 months following execution of the Covered Agreement), such states laws may be preempted.
Trade practices
The manner in which insurance companies and insurance agents and brokers conduct the business of insurance is regulated by state statutes in an effort to prohibit practices that constitute unfair methods of competition or unfair or deceptive acts or practices. Prohibited practices include, but are not limited to, disseminating false information or advertising, unfair discrimination, rebating and false statements. We set business conduct policies and provide training to make our employee-agents and other sales personnel aware of these prohibitions, and we require them to conduct their activities in compliance with these statutes.
Unfair claims practices
Generally, insurance companies, adjusting companies and individual claims adjusters are prohibited by state statutes from engaging in unfair claims practices on a flagrant basis or with such frequency to indicate a general business practice. Unfair claims practices include, but are not limited to, misrepresenting pertinent facts or insurance policy provisions; failing to acknowledge and act reasonably promptly upon communications with respect to claims arising under insurance policies; and attempting to settle a claim for less than the amount to which a reasonable person would have believed such person was entitled. We set business conduct policies and conduct training to make our employee-adjusters and other claims personnel aware of these prohibitions, and we require them to conduct their activities in compliance with these statutes.
Credit for reinsurance
State insurance laws permit U.S. insurance companies, as ceding insurers, to take financial statement credit for reinsurance that is ceded, so long as the assuming reinsurer satisfies the state’s credit for reinsurance laws. The NRRA contained in the Dodd-Frank Act provides that if the state of domicile of a ceding insurer is an NAIC accredited state, or has financial solvency requirements substantially similar to the requirements necessary for NAIC accreditation, and recognizes credit for reinsurance for the insurer’s ceded risk, then no other state may deny such credit for reinsurance. Because all states are currently accredited by the NAIC, the Dodd-Frank Act prohibits a state in which a U.S. ceding insurer is licensed but not domiciled from denying credit for reinsurance for the insurer’s ceded risk if the cedant’s domestic state regulator recognizes credit for reinsurance. The ceding company in this instance is permitted to reflect in its statutory financial statements a credit in an aggregate amount equal to the ceding company’s liability for unearned premium (which are that portion of written premiums which applies to the unexpired portion of the policy period), loss reserves and loss expense reserves to the extent ceded to the reinsurer.
Periodic financial and market conduct examinations
The insurance regulatory authority in the State of Arkansas, our insurance subsidiary’s state of domicile, conducts on-site visits and examinations of the affairs of our insurance subsidiary, including its financial condition, its relationships and transactions with affiliates and its dealings with policyholders, every three to five years, and may conduct special or targeted examinations to address particular concerns or issues at any time. Insurance regulators of other states in which we do business also may conduct examinations. The results of these examinations can give rise to regulatory orders requiring remedial, injunctive or other corrective action. Insurance regulatory authorities have broad administrative powers to regulate trade practices and in that connection to restrict or rescind licenses to transact business and to levy fines and monetary penalties against insurers and insurance agents and brokers found to be in violation of applicable laws and regulations.
Risk-based capital
Risk-based capital ("RBC") laws are designed to assess the minimum amount of capital that an insurance company needs to support its overall business operations and to ensure that it has an acceptably low expectation of becoming financially
20
impaired. State insurance regulators use RBC to set capital requirements, considering the size and degree of risk taken by the insurer and taking into account various risk factors including asset risk, credit risk, underwriting risk and interest rate risk. As the ratio of an insurer’s total adjusted capital and surplus decreases relative to its risk-based capital, the RBC laws provide for increasing levels of regulatory intervention culminating with mandatory control of the operations of the insurer by the domiciliary insurance department at the so-called mandatory control level.
The Arkansas Insurance Department has largely adopted the model legislation promulgated by the NAIC pertaining to RBC, and requires annual reporting by Arkansas-domiciled insurers to confirm that the minimum amount of RBC necessary for an insurer to support its overall business operations has been met. Arkansas-domiciled insurers falling below a calculated threshold may be subject to varying degrees of regulatory action, including supervision, rehabilitation or liquidation by the Arkansas Insurance Department. Failure to maintain our risk-based capital at the required levels could adversely affect the ability of Kinsale Insurance to maintain the regulatory authority necessary to conduct our business. However, as of December 31, 2017, Kinsale Insurance maintained RBC levels significantly in excess of amounts that would require any corrective actions.
IRIS ratios
The NAIC Insurance Regulatory Information System, or IRIS, is part of a collection of analytical tools designed to provide state insurance regulators with an integrated approach to screening and analyzing the financial condition of insurance companies operating in their respective states. IRIS is intended to assist state insurance regulators in targeting resources to those insurers in greatest need of regulatory attention. IRIS consists of two phases: statistical and analytical. In the statistical phase, the NAIC database generates key financial ratio results based on financial information obtained from insurers’ annual statutory statements. The analytical phase is a review of the annual statements, financial ratios and other automated solvency tools. The primary goal of the analytical phase is to identify companies that appear to require immediate regulatory attention. A ratio result falling outside the usual range of IRIS ratios is not considered a failing result; rather, unusual values are viewed as part of the regulatory early monitoring system. Furthermore, in some years, it may not be unusual for financially sound companies to have several ratios with results outside the usual ranges. An insurance company may fall out of the usual range for one or more ratios because of specific transactions that are in themselves immaterial.
Ratings
A.M. Best, which rates insurance companies based on factors of concern to policyholders, rates our insurance subsidiary. Our insurance subsidiary, Kinsale Insurance, has a rating of "A-" (Excellent) from A.M. Best. A.M. Best currently assigns 16 ratings to insurance companies, which currently range from "A++" (Superior) to "S" (Rating Suspended). "A-" (Excellent) is the fourth highest rating. In evaluating a company's financial and operating performance, A.M. Best reviews the company's profitability, leverage and liquidity, as well as its book of business, the adequacy and soundness of its reinsurance, the quality and estimated market value of its assets, the adequacy of its loss and loss expense reserves, the adequacy of its surplus, its capital structure, the experience and competence of its management and its market presence. A.M. Best's ratings reflect its opinion of an insurance company's financial strength, operating performance and ability to meet its obligations to policyholders. These evaluations are not directed to purchasers of an insurance company's securities.
Employees
As of February 23, 2018, we had 164 employees, all of whom were employed by us through arrangements with Kinsale Management, Inc. Our employees are not subject to any collective bargaining agreements, and we are not aware of any current efforts to implement such an agreement.
Available Information
We file annual reports on Form 10-K, quarterly reports on Form 10-Q, current reports on Form 8-K, and other information with the SEC. Members of the public may read and copy materials that we file with the SEC at the SEC’s Public Reference Room at 100 F Street, N.E., Washington, D.C. 20549. Members of the public may also obtain information on the Public Reference Room by calling the SEC at 1-800-732-0330. The SEC also maintains an Internet web site that
21
contains reports, proxy and information statements and other information regarding issuers, including us, that file electronically with the SEC. The address of that site is http://www.sec.gov. Our annual reports on Form 10-K, quarterly reports on Form 10-Q and current reports on Form 8-K and other information filed by us with the SEC are available, without charge, on our Internet web site, http://www.kinsalecapitalgroup.com, as soon as reasonably practicable after they are filed electronically with the SEC. Copies are also available, without charge, by writing to us at Kinsale Capital Group, Inc., 2221 Edward Holland Drive, Suite 600, Richmond, VA 23230. The information on our website is not a part of this Annual Report.
22
Item 1A. Risk Factors
You should carefully consider the risks and uncertainties described below, together with all of the other information in this Annual Report on Form 10-K. The risks and uncertainties described below are not the only ones facing us. There may be additional risks and uncertainties of which we currently are unaware or currently believe to be immaterial. The occurrence of any of these risks could materially and adversely affect our business, financial condition, liquidity, results of operations and prospects.
Risks Related to Our Business and Our Industry
Our loss reserves may be inadequate to cover our actual losses, which could have a material adverse effect on our financial condition, results of operations and cash flows.
Our success depends on our ability to accurately assess the risks related to the businesses and people that we insure. We establish loss and loss adjustment expense reserves for the ultimate payment of all claims that have been incurred, and the related costs of adjusting those claims, as of the date of our financial statements. Reserves do not represent an exact calculation of liability. Rather, reserves represent an estimate of what we expect the ultimate settlement and administration of claims will cost us, and our ultimate liability may be greater or less than our estimate.
As part of the reserving process, we review historical data and consider the impact of such factors as:
• | claims inflation, which is the sustained increase in cost of raw materials, labor, medical services and other components of claims cost; |
• | claims development patterns by line of business and by "claims made" versus "occurrence" policies; |
• | legislative activity; |
• | social and economic patterns; and |
• | litigation, judicial and regulatory trends. |
These variables are affected by both internal and external events that could increase our exposure to losses, and we continually monitor our reserves using new information on reported claims and a variety of statistical techniques. This process assumes that past experience, adjusted for the effects of current developments and anticipated trends, is an appropriate basis for predicting future events. There is, however, no precise method for evaluating the impact of any specific factor on the adequacy of reserves, and actual results may deviate, perhaps substantially, from our reserve estimates. For instance, the following uncertainties may have an impact on the adequacy of our resources:
• | When we write "occurrence" policies, we are obligated to pay covered claims, up to the contractually agreed amount, for any covered loss that occurs while the policy is in force. Accordingly, claims may arise many years after a policy has lapsed. Approximately 81.2% of our net casualty loss reserves were associated with "occurrence" policies as of December 31, 2017. |
• | Even when a claim is received (irrespective of whether the policy is a "claims made" or "occurrence" basis form), it may take considerable time to fully appreciate the extent of the covered loss suffered by the insured and, consequently, estimates of loss associated with specific claims can increase over time. |
• | New theories of liability are enforced retroactively from time to time by courts. See also "—The failure of any of the loss limitations or exclusions we employ, or changes in other claims or coverage issues, could have a material adverse effect on our financial condition or results of operations." |
• | Volatility in the financial markets, economic events and other external factors may result in an increase in the number of claims and/or severity of the claims reported. In addition, elevated inflationary conditions would, among other things, cause loss costs to increase. See also "—Adverse economic factors, including recession, inflation, periods of high unemployment or lower economic activity could result in the sale of fewer policies than expected or an increase in frequency or severity of claims and premium defaults or both, which, in turn, could affect our growth and profitability." |
23
• | If claims were to become more frequent, even if we had no liability for those claims, the cost of evaluating such potential claims could escalate beyond the amount of the reserves we have established. As we enter new lines of business, or as a result of new theories of claims, we may encounter an increase in claims frequency and greater claims handling costs than we had anticipated. |
In addition, there may be significant reporting lags between the occurrence of the insured event and the time it is actually reported to us and additional lags between the time of reporting and final settlement of any claims. Consequently, estimates of loss associated with specified claims can increase as new information emerges, which could cause the reserves for the claim to become inadequate.
If any of our reserves should prove to be inadequate, we will be required to increase our reserves resulting in a reduction in our net income and stockholders’ equity in the period in which the deficiency is identified. Future loss experience substantially in excess of established reserves could also have a material adverse effect on our future earnings and liquidity and our financial rating.
For further discussion of our reserve experience, please see "Management’s Discussion and Analysis of Financial Condition and Results of Operations — Critical Accounting Estimates — Reserves for Unpaid Losses and Loss Adjustment Expenses."
Given the inherent uncertainty of models, the usefulness of such models as a tool to evaluate risk is subject to a high degree of uncertainty that could result in actual losses that are materially different than our estimates, including PMLs. A deviation from our loss estimates may adversely impact, perhaps significantly, our financial results.
Our approach to risk management relies on subjective variables that entail significant uncertainties. For example, we rely heavily on estimates of PMLs for certain events that are generated by computer-run models. In addition, we rely on historical data and scenarios in managing credit and interest rate risks in our investment portfolio. These estimates, models, data and scenarios may not produce accurate predictions and consequently, we could incur losses both in the risks we underwrite and to the value of our investment portfolio.
We use third-party vendor analytic and modeling capabilities to provide us with objective risk assessment relating to other risks in our reinsurance portfolio. We use these models to help us control risk accumulation, inform management and other stakeholders of capital requirements and to improve the risk/return profile or minimize the amount of capital required to cover the risks in each of our reinsurance contracts. However, given the inherent uncertainty of modeling techniques and the application of such techniques, these models and databases may not accurately address a variety of matters which might impact certain of our coverages.
Small changes in assumptions, which depend heavily on our judgment and foresight, can have a significant impact on the modeled outputs. For example, catastrophe models that simulate loss estimates based on a set of assumptions are important tools used by us to estimate our PMLs. These assumptions address a number of factors that impact loss potential including, but not limited to, the characteristics of a given natural catastrophe event; the increase in claim costs resulting from limited supply of labor and materials needed for repairs following a catastrophe event (demand surge); the types, function, location and characteristics of exposed risks; susceptibility of exposed risks to damage from an event with specific characteristics; and the financial and contractual provisions of the (re)insurance contracts that cover losses arising from an event. We run many model simulations in order to understand the impact of these assumptions on a catastrophe’s loss potential. Furthermore, there are risks associated with catastrophe events, which are either poorly represented or not represented at all by catastrophe models. Each modeling assumption or un-modeled risk introduces uncertainty into PML estimates that management must consider. These uncertainties can include, but are not limited to, the following:
• | The models do not address all the possible hazard characteristics of a catastrophe peril (e.g. the precise path and wind speed of a hurricane); |
• | The models may not accurately reflect the true frequency of events; |
• | The models may not accurately reflect a risk's vulnerability or susceptibility to damage for a given event characteristic; |
• | The models may not accurately represent loss potential to insurance or reinsurance contract coverage limits, terms |
24
and conditions; and
• | The models may not accurately reflect the impact on the economy of the area affected or the financial, judicial, political, or regulatory impact on insurance claim payments during or following a catastrophe event. |
Our PMLs are reviewed by management after the assessment of outputs from multiple third party vendor models and other qualitative and quantitative assessments, including exposures not typically modeled in vendor models. Our methodology for estimating PMLs may differ from methods used by other companies and external parties given the various assumptions and judgments required to estimate a PML.
As a result of these factors and contingencies, our reliance on assumptions and data used to evaluate our entire reinsurance portfolio and specifically to estimate a PML is subject to a high degree of uncertainty that could result in actual losses that are materially different from our PML estimates and our financial results could be adversely affected.
Adverse economic factors, including recession, inflation, periods of high unemployment or lower economic activity could result in the sale of fewer policies than expected or an increase in frequency or severity of claims and premium defaults or both, which, in turn, could affect our growth and profitability.
Factors, such as business revenue, economic conditions, the volatility and strength of the capital markets and inflation can affect the business and economic environment. These same factors affect our ability to generate revenue and profits. In an economic downturn that is characterized by higher unemployment, declining spending and reduced corporate revenues, the demand for insurance products is generally adversely affected, which directly affects our premium levels and profitability. Negative economic factors may also affect our ability to receive the appropriate rate for the risk we insure with our policyholders and may adversely affect the number of policies we can write, including with respect to our opportunities to underwrite profitable business. In an economic downturn, our customers may have less need for insurance coverage, cancel existing insurance policies, modify their coverage or not renew the policies they hold with us. Existing policyholders may exaggerate or even falsify claims to obtain higher claims payments. These outcomes would reduce our underwriting profit to the extent these factors are not reflected in the rates we charge.
We underwrite a significant portion of our insurance in California, Texas and Florida. Any economic downturn in any such state could have an adverse effect on our financial condition and results of operations.
A decline in our financial strength rating may adversely affect the amount of business we write.
Participants in the insurance industry use ratings from independent ratings agencies, such as A.M. Best, as an important means of assessing the financial strength and quality of insurers. In setting its ratings, A.M. Best uses a quantitative and qualitative analysis of a company’s balance sheet strength, operating performance and business profile. This analysis includes comparisons to peers and industry standards as well as assessments of operating plans, philosophy and management. A.M. Best financial strength ratings range from "A++" (Superior) to "F" for insurance companies that have been publicly placed in liquidation. As of the date of this Annual Report on Form 10-K, A.M. Best has assigned a financial strength rating of "A-" (Excellent) to our operating subsidiary, Kinsale Insurance. A.M. Best assigns ratings that are intended to provide an independent opinion of an insurance company’s ability to meet its obligations to policyholders and such ratings are not evaluations directed to investors and are not a recommendation to buy, sell or hold our common stock or any other securities we may issue. A.M. Best periodically reviews our financial strength rating and may revise it downward or revoke it at its sole discretion based primarily on its analysis of our balance sheet strength (including capital adequacy and loss adjustment expense reserve adequacy), operating performance and business profile. Factors that could affect such analysis include but are not limited to:
• | if we change our business practices from our organizational business plan in a manner that no longer supports A.M. Best’s rating; |
• | if unfavorable financial, regulatory or market trends affect us, including excess market capacity; |
• | if our losses exceed our loss reserves; |
• | if we have unresolved issues with government regulators; |
25
• | if we are unable to retain our senior management or other key personnel; |
• | if our investment portfolio incurs significant losses; or |
• | if A.M. Best alters its capital adequacy assessment methodology in a manner that would adversely affect our rating. |
These and other factors could result in a downgrade of our financial strength rating. A downgrade or withdrawal of our rating could result in any of the following consequences, among others:
• | causing our current and future brokers and insureds to choose other, more highly-rated competitors; |
• | increasing the cost or reducing the availability of reinsurance to us; or |
• | severely limiting or preventing us from writing new and renewal insurance contracts. |
In addition, in view of the earnings and capital pressures recently experienced by many financial institutions, including insurance companies, it is possible that rating organizations will heighten the level of scrutiny that they apply to such institutions, will increase the frequency and scope of their credit reviews, will request additional information from the companies that they rate or will increase the capital and other requirements employed in the rating organizations’ models for maintenance of certain ratings levels. We can offer no assurance that our rating will remain at its current level. It is possible that such reviews of us may result in adverse ratings consequences, which could have a material adverse effect on our financial condition and results of operations.
We could be adversely affected by the loss of one or more key executives or by an inability to attract and retain qualified personnel.
We depend on our ability to attract and retain experienced personnel and seasoned key executives who are knowledgeable about our business. The pool of talent from which we actively recruit is limited and may fluctuate based on market dynamics specific to our industry and independent of overall economic conditions. As such, higher demand for employees having the desired skills and expertise could lead to increased compensation expectations for existing and prospective personnel, making it difficult for us to retain and recruit key personnel and maintain labor costs at desired levels. Only our Chief Executive Officer has an employment agreement with us and is subject to a non-compete agreement. Should any of our key executives terminate their employment with us, or if we are unable to retain and attract talented personnel, we may be unable to maintain our current competitive position in the specialized markets in which we operate, which could adversely affect our results of operations.
We rely on a select group of brokers, and such relationships may not continue.
We distribute the majority of our products through a select group of brokers. Of our 2017 gross written premiums, 46.3%, or $103.3 million, were distributed through five of our approximately 153 brokers, three of which accounting for 33.1%, or $73.9 million, of our 2017 gross written premiums.
Our relationship with any of these brokers may be discontinued at any time. Even if the relationships do continue, they may not be on terms that are profitable for us. The termination of a relationship with one or more significant brokers could result in lower gross written premiums and could have a material adverse effect on our results of operations or business prospects.
The failure of any of the loss limitations or exclusions we employ, or changes in other claims or coverage issues, could have a material adverse effect on our financial condition or results of operations.
Although we seek to mitigate our loss exposure through a variety of methods, the future is inherently unpredictable. It is difficult to predict the timing, frequency and severity of losses with statistical certainty. It is not possible to completely eliminate our exposure to unforecasted or unpredictable events and, to the extent that losses from such risks occur, our financial condition and results of operations could be materially adversely affected.
For instance, various provisions of our policies, such as limitations or exclusions from coverage or choice of forum, which have been negotiated to limit our risks, may not be enforceable in the manner we intend. At the present time, we employ a
26
variety of endorsements to our policies that limit exposure to known risks. As industry practices and legal, judicial, social and other conditions change, unexpected and unintended issues related to claims and coverage may emerge.
In addition, we design our policy terms to manage our exposure to expanding theories of legal liability like those which have given rise to claims for lead paint, asbestos, mold, construction defects and environmental matters. Many of the policies we issue also include conditions requiring the prompt reporting of claims to us and entitle us to decline coverage in the event of a violation of those conditions. Also, many of our policies limit the period during which a policyholder may bring a claim under the policy, which in many cases is shorter than the statutory period under which such claims can be brought against our policyholders. While these exclusions and limitations help us assess and reduce our loss exposure and help eliminate known exposures to certain risks, it is possible that a court or regulatory authority could nullify or void an exclusion or legislation could be enacted modifying or barring the use of such endorsements and limitations. These types of governmental actions could result in higher than anticipated losses and loss adjustment expenses, which could have a material adverse effect on our financial condition or results of operations.
As industry practices and legal, judicial, social and other environmental conditions change, unexpected and unintended issues related to claims and coverage may emerge. Three examples of unanticipated risks that have adversely affected the insurance industry are:
• | Asbestos liability applied to manufacturers of products and contractors who installed those products. |
• | Apportionment of liability arising from subsidence claims assigned to subcontractors who may have been involved in mundane tasks (such as installing sheetrock in a home). |
• | Court decisions, such as the 1995 Montrose decision in California, that read policy exclusions narrowly so as to expand coverage, thereby requiring insurers to create and write new exclusions. |
These issues may adversely affect our business by either broadening coverage beyond our underwriting intent or by increasing the number or size of claims. In some instances, these changes may not become apparent until sometime after we have issued insurance contracts that are affected by the changes. As a result, the full extent of liability under our insurance contracts may not be known for many years after a contract is issued.
Performance of our investment portfolio is subject to a variety of investment risks that may adversely affect our financial results.
Our results of operations depend, in part, on the performance of our investment portfolio. We seek to hold a high-quality, diversified portfolio of investments that is managed by professional investment advisory management firms in accordance with our investment policy and routinely reviewed by our Investment Committee. However, our investments are subject to general economic conditions and market risks as well as risks inherent to particular securities.
Our primary market risk exposures are to changes in interest rates and equity prices. See "Management's Discussion and Analysis of Financial Condition and Results of Operation — Quantitative and Qualitative Disclosures About Market Risk." In recent years, interest rates have been at or near historic lows. A protracted low interest rate environment would continue to place pressure on our net investment income, particularly as it relates to fixed income securities and short-term investments, which, in turn, may adversely affect our operating results. Future increases in interest rates could cause the values of our fixed income securities portfolios to decline, with the magnitude of the decline depending on the duration of securities included in our portfolio and the amount by which interest rates increase. Some fixed income securities have call or prepayment options, which create possible reinvestment risk in declining rate environments. Other fixed income securities, such as mortgage-backed and asset-backed securities, carry prepayment risk or, in a rising interest rate environment, may not prepay as quickly as expected.
The value of our investment portfolio is subject to the risk that certain investments may default or become impaired due to deterioration in the financial condition of one or more issuers of the securities we hold, or due to deterioration in the financial condition of an insurer that guarantees an issuer’s payments on such investments. Downgrades in the credit ratings of fixed maturities also have a significant negative effect on the market valuation of such securities.
Such factors could reduce our net investment income and result in realized investment losses. Our investment portfolio is subject to increased valuation uncertainties when investment markets are illiquid. The valuation of investments is more
27
subjective when markets are illiquid, thereby increasing the risk that the estimated fair value (i.e., the carrying amount) of the securities we hold in our portfolio does not reflect prices at which actual transactions would occur.
We also invest in marketable equity securities. These securities are carried on the balance sheet at fair value and are subject to potential losses and declines in value, which may never recover. Our equity invested assets totaled $54.1 million as of December 31, 2017.
Risks for all types of securities are managed through the application of our investment policy, which establishes investment parameters that include but are not limited to, maximum percentages of investment in certain types of securities and minimum levels of credit quality, which we believe are within applicable guidelines established by the NAIC and the Arkansas State Insurance Department.
Although we seek to preserve our capital, we cannot be certain that our investment objectives will be achieved, and results may vary substantially over time. In addition, although we seek to employ investment strategies that are not correlated with our insurance and reinsurance exposures, losses in our investment portfolio may occur at the same time as underwriting losses and, therefore, exacerbate the adverse effect of the losses on us.
Our E&S insurance operations are subject to increased risk from changing market conditions and our business is cyclical in nature, which may affect our financial performance.
E&S insurance covers risks that are typically more complex and unusual than standard risks and require a high degree of specialized underwriting. As a result, E&S risks do not often fit the underwriting criteria of standard insurance carriers, and are generally considered higher risk than those covered in the standard market. If our underwriting staff inadequately judges and prices the risks associated with the business underwritten in the E&S market, our financial results could be adversely impacted.
Historically, the financial performance of the P&C insurance industry has tended to fluctuate in cyclical periods of price competition and excess capacity (known as a soft market) followed by periods of high premium rates and shortages of underwriting capacity (known as a hard market). Soft markets occur when the supply of insurance capital in a given market or territory is greater than the amount of insurance coverage demanded by all potential insureds in that market. When this occurs, insurance prices tend to decline and policy terms and conditions become more favorable to the insureds. Conversely, hard markets occur when there is not enough insurance capital capacity in the market to meet the needs of potential insureds, causing insurance prices to generally rise and policy terms and conditions to become more favorable to the insurers.
Although an individual insurance company's financial performance depends on its own specific business characteristics, the profitability of most P&C insurance companies tends to follow this cyclical market pattern. Further, this cyclical market pattern can be more pronounced in the E&S market than in the standard insurance market. When the standard insurance market hardens, the E&S market hardens, and growth in the E&S market can be significantly more rapid than growth in the standard insurance market. Similarly, when conditions begin to soften, many customers that were previously driven into the E&S market may return to the admitted market, exacerbating the effects of rate decreases. We cannot predict the timing or duration of changes in the market cycle because the cyclicality is due in large part to the actions of our competitors and general economic factors. These cyclical patterns cause our revenues and net income to fluctuate, which may cause the price of our common stock to be volatile.
We are subject to extensive regulation, which may adversely affect our ability to achieve our business objectives. In addition, if we fail to comply with these regulations, we may be subject to penalties, including fines and suspensions, which may adversely affect our financial condition and results of operations.
Our insurance subsidiary, Kinsale Insurance, is subject to extensive regulation in Arkansas, its state of domicile, and to a lesser degree, the other states in which it operates. Most insurance regulations are designed to protect the interests of insurance policyholders, as opposed to the interests of investors or stockholders. These regulations generally are administered by a department of insurance in each state and relate to, among other things, authorizations to write E&S lines of business, capital and surplus requirements, investment and underwriting limitations, affiliate transactions, dividend limitations, changes in control, solvency and a variety of other financial and non-financial aspects of our business. Significant changes in these laws and regulations could further limit our discretion or make it more expensive to
28
conduct our business. State insurance regulators also conduct periodic examinations of the affairs of insurance companies and require the filing of annual and other reports relating to financial condition, holding company issues and other matters. These regulatory requirements may impose timing and expense constraints that could adversely affect our ability to achieve some or all of our business objectives.
In addition, state insurance regulators have broad discretion to deny or revoke licenses for various reasons, including the violation of regulations. In some instances, where there is uncertainty as to applicability, we follow practices based on our interpretations of regulations or practices that we believe generally to be followed by the industry. These practices may turn out to be different from the interpretations of regulatory authorities. If we do not have the requisite licenses and approvals or do not comply with applicable regulatory requirements, state insurance regulators could preclude or temporarily suspend us from carrying on some or all of our activities or could otherwise penalize us. This could adversely affect our ability to operate our business. Further, changes in the level of regulation of the insurance industry or changes in laws or regulations themselves or interpretations by regulatory authorities could interfere with our operations and require us to bear additional costs of compliance, which could adversely affect our ability to operate our business.
The NAIC has adopted a system to test the adequacy of statutory capital of insurance companies, known as "risk-based capital." This system establishes the minimum amount of risk-based capital necessary for a company to support its overall business operations. It identifies P&C insurers that may be inadequately capitalized by looking at certain inherent risks of each insurer's assets and liabilities and its mix of net written premiums. Insurers falling below a calculated threshold may be subject to varying degrees of regulatory action, including supervision, rehabilitation or liquidation. Failure to maintain our risk-based capital at the required levels could adversely affect the ability of our insurance subsidiary to maintain regulatory authority to conduct our business. See also "Regulation — Required licensing."
Because we are a holding company and substantially all of our operations are conducted by our insurance subsidiary, our ability to pay dividends depends on our ability to obtain cash dividends or other permitted payments from our insurance subsidiary.
Because we are a holding company with no business operations of our own, our ability to pay dividends to stockholders largely depends on dividends and other distributions from our insurance subsidiary, Kinsale Insurance. State insurance laws, including the laws of Arkansas, restrict the ability of Kinsale Insurance to declare stockholder dividends. State insurance regulators require insurance companies to maintain specified levels of statutory capital and surplus. Consequently, the maximum dividend distribution is limited by Arkansas law to the greater of 10% of policyholder surplus as of December 31 of the previous year or net income, not including realized capital gains, for the previous calendar year. Dividend payments are further limited to that part of available policyholder surplus which is derived from net profits on our business. The maximum amount of dividends Kinsale Insurance could pay us during 2018 without regulatory approval is $23.7 million. State insurance regulators have broad powers to prevent the reduction of statutory surplus to inadequate levels, and there is no assurance that dividends up to the maximum amounts calculated under any applicable formula would be permitted. Moreover, state insurance regulators that have jurisdiction over the payment of dividends by our insurance subsidiary may in the future adopt statutory provisions more restrictive than those currently in effect.
The declaration and payment of future dividends to holders of our common stock will be at the discretion of our Board of Directors and will depend on many factors. See "Dividend Policy."
We could be forced to sell investments to meet our liquidity requirements.
We invest the premiums we receive from our insureds until they are needed to pay policyholder claims. Consequently, we seek to manage the duration of our investment portfolio based on the duration of our loss and loss adjustment expense reserves to ensure sufficient liquidity and avoid having to liquidate investments to fund claims. Risks such as inadequate loss and loss adjustment reserves or unfavorable trends in litigation could potentially result in the need to sell investments to fund these liabilities. We may not be able to sell our investments at favorable prices or at all. Sales could result in significant realized losses depending on the conditions of the general market, interest rates and credit issues with individual securities.
29
We may be unable to obtain reinsurance coverage at reasonable prices or on terms that adequately protect us.
We use reinsurance to help manage our exposure to insurance risks. Reinsurance is a practice whereby one insurer, called the reinsurer, agrees to indemnify another insurer, called the ceding insurer, for all or part of the potential liability arising from one or more insurance policies issued by the ceding insurer. The availability and cost of reinsurance are subject to prevailing market conditions, both in terms of price and available capacity, which can affect our business volume and profitability. In addition, reinsurance programs are generally subject to renewal on an annual basis. We may not be able to obtain reinsurance on acceptable terms or from entities with satisfactory creditworthiness. If we are unable to obtain new reinsurance facilities or to renew expiring facilities, our net exposures would increase. In such event, if we are unwilling to bear an increase in our net exposure, we would have to reduce the level of our underwriting commitments, which would reduce our revenues.
Many reinsurance companies have begun to exclude certain coverages from, or alter terms in, the reinsurance contracts we enter into with them. Some exclusions are with respect to risks that we cannot exclude in policies we write due to business or regulatory constraints. In addition, reinsurers are imposing terms, such as lower per occurrence and aggregate limits, on direct insurers that do not wholly cover the risks written by these direct insurers. As a result, we, like other direct insurance companies, write insurance policies which to some extent do not have the benefit of reinsurance protection. These gaps in reinsurance protection expose us to greater risk and greater potential losses. For example, certain reinsurers have excluded coverage for terrorist acts or priced such coverage at rates higher than the underlying risk. Many direct insurers, including us, have written policies without terrorist act exclusions and in many cases we cannot exclude terrorist acts because of regulatory constraints. We may, therefore, be exposed to potential losses as a result of terrorist acts. See also "Business — Reinsurance."
Our employees could take excessive risks, which could negatively affect our financial condition and business.
As an insurance enterprise, we are in the business of binding certain risks. The employees who conduct our business, including executive officers and other members of management, underwriters, product managers and other employees, do so in part by making decisions and choices that involve exposing us to risk. These include decisions such as setting underwriting guidelines and standards, product design and pricing, determining which business opportunities to pursue and other decisions. We endeavor, in the design and implementation of our compensation programs and practices, to avoid giving our employees incentives to take excessive risks. Employees may, however, take such risks regardless of the structure of our compensation programs and practices. Similarly, although we employ controls and procedures designed to monitor employees’ business decisions and prevent them from taking excessive risks, these controls and procedures may not be effective. If our employees take excessive risks, the impact of those risks could have a material adverse effect on our financial condition and business operations.
Severe weather conditions and other catastrophes may result in an increase in the number and amount of claims filed against us.
Our business is exposed to the risk of severe weather conditions and other catastrophes. Catastrophes can be caused by various events, including natural events such as severe winter weather, tornadoes, windstorms, earthquakes, hailstorms, severe thunderstorms and fires, and other events such as explosions, terrorist attacks and riots. The incidence and severity of catastrophes and severe weather conditions are inherently unpredictable. The extent of losses from catastrophes is a function of the total amount of losses incurred, the number of insureds affected, the frequency and severity of the events, the effectiveness of our catastrophe risk management program and the adequacy of our reinsurance coverage. Insurance companies are not permitted to reserve for a catastrophe until it has occurred. Severe weather conditions and catastrophes can cause losses in our property lines and generally result in both an increase in the number of claims incurred and an increase in the dollar amount of each claim asserted, which might require us to increase our reserves, causing our liquidity and financial condition to deteriorate. In addition, our inability to obtain reinsurance coverage at reasonable rates and in amounts adequate to mitigate the risks associated with severe weather conditions and other catastrophes could have a material adverse effect on our business and results of operation.
30
We may not be able to manage our growth effectively.
We intend to grow our business in the future, which could require additional capital, systems development and skilled personnel. However, we must be able to meet our capital needs, expand our systems and our internal controls effectively, allocate our human resources optimally, identify and hire qualified employees or effectively incorporate the components of any businesses we may acquire in our effort to achieve growth. The failure to manage our growth effectively could have a material adverse effect on our business, financial condition and results of operations.
Competition for business in our industry is intense.
We face competition from other specialty insurance companies, standard insurance companies and underwriting agencies, as well as from diversified financial services companies that are larger than we are and that have greater financial, marketing and other resources than we do. Some of these competitors also have longer experience and more market recognition than we do in certain lines of business. In addition, it may be difficult or prohibitively expensive for us to implement technology systems and processes that are competitive with the systems and processes of these larger companies.
In particular, competition in the insurance industry is based on many factors, including price of coverage, the general reputation and perceived financial strength of the company, relationships with brokers, terms and conditions of products offered, ratings assigned by independent rating agencies, speed of claims payment and reputation, and the experience and reputation of the members of our underwriting team in the particular lines of insurance and reinsurance we seek to underwrite. See "Business — Competition." In recent years, the insurance industry has undergone increasing consolidation, which may further increase competition.
A number of new, proposed or potential legislative or industry developments could further increase competition in our industry. These developments include:
• | An increase in capital-raising by companies in our lines of business, which could result in new entrants to our markets and an excess of capital in the industry; |
• | The deregulation of commercial insurance lines in certain states and the possibility of federal regulatory reform of the insurance industry, which could increase competition from standard carriers; and |
• | Changing practices caused by the internet, including shifts in the way in which E&S insurance is purchased. We currently depend largely on the wholesale distribution model. If the wholesale distribution model were to be significantly altered by changes in the way E&S insurance were marketed, including, without limitation, through use of the Internet, it could have a material adverse effect on our premiums, underwriting results and profits. |
We may not be able to continue to compete successfully in the insurance markets. Increased competition in these markets could result in a change in the supply and demand for insurance, affect our ability to price our products at risk-adequate rates and retain existing business, or underwrite new business on favorable terms. If this increased competition so limits our ability to transact business, our operating results could be adversely affected.
The effects of litigation on our business are uncertain and could have an adverse effect on our business.
As is typical in our industry, we continually face risks associated with litigation of various types, including disputes relating to insurance claims under our policies as well as other general commercial and corporate litigation. Although we are not currently involved in any material litigation with our customers, other members of the insurance industry are the target of class action lawsuits and other types of litigation, some of which involve claims for substantial or indeterminate amounts, and the outcomes of which are unpredictable. This litigation is based on a variety of issues, including insurance and claim settlement practices. We cannot predict with any certainty whether we will be involved in such litigation in the future or what impact such litigation would have on our business.
We may be unable to maintain effective internal control over financial reporting in accordance with the Sarbanes-Oxley Act.
As a public company, we are required to maintain internal control over financial reporting and to report any material weaknesses in such internal controls. In addition, we are required to furnish with each annual report on Form 10-K, a
31
report by management on the effectiveness of our internal control over financial reporting and our independent registered public accountants are required to attest to the effectiveness of our internal control over financial reporting, in each case pursuant to Section 404 of the Sarbanes-Oxley Act.
Any failure to maintain or develop effective controls, or any difficulties encountered in their implementation or improvement, could harm our operating results or impede our ability to file timely and accurate reports with the SEC. Any of the above could cause investors to lose confidence in the accuracy and completeness of our financial statements, which could cause the price of our common stock to decline. In addition, we may become subject to sanctions or investigation by regulatory authorities, such as the SEC or Nasdaq.
Because our business depends on insurance brokers, we are exposed to certain risks arising out of our reliance on these distribution channels that could adversely affect our results.
Certain premiums from policyholders, where the business is produced by brokers, are collected directly by the brokers and forwarded to our insurance subsidiary. In certain jurisdictions, when the insured pays its policy premium to its broker for payment on behalf of our insurance subsidiary, the premium might be considered to have been paid under applicable insurance laws and regulations. Accordingly, the insured would no longer be liable to us for those amounts, whether or not we have actually received the premium from that broker. Consequently, we assume a degree of credit risk associated with the brokers with whom we work. Where necessary, we review the financial condition of potential new brokers before we agree to transact business with them. Although the failure by any of our brokers to remit premiums to us has not been material to date, there may be instances where our brokers collect premiums but do not remit them to us and we may be required under applicable law to provide the coverage set forth in the policy despite the absence of related premiums being paid to us.
Because the possibility of these events occurring depends in large part upon the financial condition and internal operations of our brokers, we monitor broker behavior and review financial information on an as-needed basis. If we are unable to collect premiums from our brokers in the future, our underwriting profits may decline and our financial condition and results of operations could be materially and adversely affected.
We may become subject to additional government or market regulation which may have a material adverse impact on our business.
Our business could be adversely affected by changes in state laws, including those relating to asset and reserve valuation requirements, surplus requirements, limitations on investments and dividends, enterprise risk and risk-based capital requirements and, at the federal level, by laws and regulations that may affect certain aspects of the insurance industry, including proposals for preemptive federal regulation. The U.S. federal government generally has not directly regulated the insurance industry except for certain areas of the market, such as insurance for flood, nuclear and terrorism risks. However, the federal government has undertaken initiatives or considered legislation in several areas that may affect the insurance industry, including tort reform, corporate governance and the taxation of reinsurance companies.
The Dodd-Frank Act also established the FIO and vested the FIO with the authority to monitor all aspects of the insurance sector, including to monitor the extent to which traditionally underserved communities and consumers have access to affordable non-health insurance products. In addition, the FIO has the ability to recommend to the Financial Stability Oversight Council the designation of an insurer as "systemically significant" and therefore subject to regulation by the Federal Reserve as a bank holding company. In December 2013, the FIO issued a report on alternatives to modernize and improve the system of insurance regulation in the United States (the "Modernization Report"), including increasing national uniformity through either a federal charter or effective action by the states. Any additional regulations established as a result of the Dodd-Frank Act or actions in response to the Modernization Report could increase our costs of compliance or lead to disciplinary action. In addition, legislation has been introduced from time to time that, if enacted, could result in the federal government assuming a more direct role in the regulation of the insurance industry, including federal licensing in addition to or in lieu of state licensing and requiring reinsurance for natural catastrophes. We are unable to predict whether any legislation will be enacted or any regulations will be adopted, or the effect any such developments could have on our business, financial condition or results of operations.
32
Our operating results have in the past varied from quarter to quarter and may not be indicative of our long-term prospects.
Our operating results are subject to fluctuation and have historically varied from quarter to quarter. We expect our quarterly results to continue to fluctuate in the future due to a number of factors, including the general economic conditions in the markets where we operate, the frequency of occurrence or severity of catastrophic or other insured events, fluctuating interest rates, claims exceeding our loss reserves, competition in our industry, deviations from expected renewal rates of our existing policies and contracts, adverse investment performance and the cost of reinsurance coverage.
In particular, we seek to underwrite products and make investments to achieve favorable returns on tangible stockholders' equity over the long term. In addition, our opportunistic nature and focus on long-term growth in tangible equity may result in fluctuations in gross written premiums from period to period as we concentrate on underwriting contracts that we believe will generate better long-term, rather than short-term, results. Accordingly, our short-term results of operations may not be indicative of our long-term prospects.
We are subject to reinsurance counterparty credit risk.
Although reinsurance makes the reinsurer liable to us to the extent the risk is transferred or ceded to the reinsurer, it does not relieve us (the ceding insurer) of our primary liability to our policyholders. Our reinsurers may not pay claims made by us on a timely basis, or they may not pay some or all of these claims. For example, reinsurers may default in their financial obligations to us as the result of insolvency, lack of liquidity, operational failure, fraud, asserted defenses based on agreement wordings or the principle of utmost good faith, asserted deficiencies in the documentation of agreements or other reasons. Any disputes with reinsurers regarding coverage under reinsurance contracts could be time consuming, costly and uncertain of success. We evaluate each reinsurance claim based on the facts of the case, historical experience with the reinsurer on similar claims and existing case law and include any amounts deemed uncollectible from the reinsurer in our reserve for uncollectible reinsurance. As of December 31, 2017, we had $63.5 million of aggregate reinsurance balances on paid and unpaid losses and ceded unearned premiums. These risks could cause us to incur increased net losses, and, therefore, adversely affect our financial condition.
We may act based on inaccurate or incomplete information regarding the accounts we underwrite.
We rely on information provided by insureds or their representatives when underwriting insurance policies. While we may make inquiries to validate or supplement the information provided, we may make underwriting decisions based on incorrect or incomplete information. It is possible that we will misunderstand the nature or extent of the activities or facilities and the corresponding extent of the risks that we insure because of our reliance on inadequate or inaccurate information.
We may require additional capital in the future, which may not be available or may only be available on unfavorable terms.
Our future capital requirements depend on many factors, including our ability to write new business successfully and to establish premium rates and reserves at levels sufficient to cover losses. To the extent that the funds generated by this offering are insufficient to fund future operating requirements and cover claim losses, we may need to raise additional funds through financings or curtail our growth. Many factors will affect the amount and timing of our capital needs, including our growth rate and profitability, our claims experience, and the availability of reinsurance, market disruptions and other unforeseeable developments. If we need to raise additional capital, equity or debt financing may not be available at all or may be available only on terms that are not favorable to us. In the case of equity financings, dilution to our stockholders could result. In the case of debt financings, we may be subject to covenants that restrict our ability to freely operate our business. In any case, such securities may have rights, preferences and privileges that are senior to those of the shares of common stock currently outstanding. If we cannot obtain adequate capital on favorable terms or at all, we may not have sufficient funds to implement our operating plans and our business, financial condition or results of operations could be materially adversely affected.
33
The failure of our information technology and telecommunications systems could adversely affect our business.
Our business is highly dependent upon our information technology and telecommunications systems, including our browser-based underwriting system. Among other things, we rely on these systems to interact with brokers and insureds, to underwrite business, to prepare policies and process premiums, to perform actuarial and other modeling functions, to process claims and make claims payments and to prepare internal and external financial statements and information. In addition, some of these systems may include or rely on third-party systems not located on our premises or under our control. Events such as natural catastrophes, terrorist attacks, industrial accidents or computer viruses may cause our systems to fail or be inaccessible for extended periods of time. While we have implemented business contingency plans and other reasonable plans to protect our systems, sustained or repeated system failures or service denials could severely limit our ability to write and process new and renewal business, provide customer service, pay claims in a timely manner or otherwise operate in the ordinary course of business.
Our operations depend on the reliable and secure processing, storage and transmission of confidential and other data and information in our computer systems and networks. Computer viruses, hackers, employee misconduct and other external hazards could expose our systems to security breaches, cyber-attacks or other disruptions. In addition, we routinely transmit and receive personal, confidential and proprietary data and information by electronic means and are subject to numerous data privacy laws and regulations enacted in the jurisdictions in which we do business.
While we have implemented security measures designed to protect against breaches of security and other interference with our systems and networks, our systems and networks may be subject to breaches or interference. Any such event may result in operational disruptions as well as unauthorized access to or the disclosure or loss of our proprietary information or our customers’ data and information, which in turn may result in legal claims, regulatory scrutiny and liability, reputational damage, the incurrence of costs to eliminate or mitigate further exposure, the loss of customers or affiliated advisors, reputational harm or other damage to our business. In addition, the trend toward general public notification of such incidents could exacerbate the harm to our business, financial condition and results of operations. Even if we successfully protect our technology infrastructure and the confidentiality of sensitive data, we could suffer harm to our business and reputation if attempted security breaches are publicized. We cannot be certain that advances in criminal capabilities, discovery of new vulnerabilities, attempts to exploit vulnerabilities in our systems, data thefts, physical system or network break-ins or inappropriate access, or other developments will not compromise or breach the technology or other security measures protecting the networks and systems used in connection with our business.
Any failure to protect our intellectual property rights could impair our ability to protect our intellectual property, proprietary technology platform and brand, or we may be sued by third parties for alleged infringement of their proprietary rights.
Our success and ability to compete depend in part on our intellectual property, which includes our rights in our proprietary technology platform and our brand. We primarily rely on copyright, trade secret and trademark laws, and confidentiality or license agreements with our employees, customers, service providers, partners and others to protect our intellectual property rights. However, the steps we take to protect our intellectual property may be inadequate. Litigation brought to protect and enforce our intellectual property rights could be costly, time-consuming and distracting to management and could result in the impairment or loss of portions of our intellectual property. Additionally, our efforts to enforce our intellectual property rights may be met with defenses, counterclaims and countersuits attacking the validity and enforceability and scope of our intellectual property rights. Our failure to secure, protect and enforce our intellectual property rights could adversely affect our brand and adversely impact our business.
Our success depends also in part on our not infringing on the intellectual property rights of others. Our competitors, as well as a number of other entities and individuals, may own or claim to own intellectual property relating to our industry. In the future, third parties may claim that we are infringing on their intellectual property rights, and we may be found to be infringing on such rights. Any claims or litigation could cause us to incur significant expenses and, if successfully asserted against us, could require that we pay substantial damages or ongoing royalty payments, prevent us from offering our services, or require that we comply with other unfavorable terms. Even if we were to prevail in such a dispute, any litigation could be costly and time-consuming and divert the attention of our management and key personnel from our business operations.
34
We employ third-party and open source licensed software for use in our business, and the inability to maintain these licenses, errors in the software we license or the terms of open source licenses could result in increased costs, or reduced service levels, which would adversely affect our business.
Our business relies on certain third-party software obtained under licenses from other companies. We anticipate that we will continue to rely on such third-party software in the future. Although we believe that there are commercially reasonable alternatives to the third-party software we currently license, this may not always be the case, or it may be difficult or costly to replace. In addition, integration of new third-party software may require significant work and require substantial investment of our time and resources. Our use of additional or alternative third-party software would require us to enter into license agreements with third parties, which may not be available on commercially reasonable terms or at all. Many of the risks associated with the use of third-party software cannot be eliminated, and these risks could negatively affect our business.
Additionally, the software powering our technology systems incorporates software covered by open source licenses. The terms of many open source licenses have not been interpreted by U.S. courts and there is a risk that the licenses could be construed in a manner that imposes unanticipated conditions or restrictions on our ability to operate our systems. In the event that portions of our proprietary software are determined to be subject to an open source license, we could be required to publicly release the affected portions of our source code or re-engineer all or a portion of our technology systems, each of which could reduce or eliminate the value of our technology systems. Such risk could be difficult or impossible to eliminate and could adversely affect our business, financial condition and results of operations.
If we are unable to underwrite risks accurately and charge competitive yet profitable rates to our policyholders, our business, financial condition and results of operations will be adversely affected.
In general, the premiums for our insurance policies are established at the time a policy is issued and, therefore, before all of our underlying costs are known. Like other insurance companies, we rely on estimates and assumptions in setting our premium rates. Establishing adequate premium rates is necessary, together with investment income, to generate sufficient revenue to offset losses, loss adjustment expenses and other underwriting costs and to earn a profit. If we do not accurately assess the risks that we assume, we may not charge adequate premiums to cover our losses and expenses, which would adversely affect our results of operations and our profitability. Alternatively, we could set our premiums too high, which could reduce our competitiveness and lead to lower revenues. Pricing involves the acquisition and analysis of historical loss data and the projection of future trends, loss costs and expenses, and inflation trends, among other factors, for each of our products in multiple risk tiers and many different markets. In order to accurately price our policies, we must:
• | collect and properly analyze a substantial volume of data from our insureds; |
• | develop, test and apply appropriate actuarial projections and ratings formulas; |
• | closely monitor and timely recognize changes in trends; and |
• | project both frequency and severity of our insureds’ losses with reasonable accuracy. |
We seek to implement our pricing accurately in accordance with our assumptions. Our ability to undertake these efforts successfully and, as a result, accurately price our policies, is subject to a number of risks and uncertainties, including:
• | insufficient or unreliable data; |
• | incorrect or incomplete analysis of available data; |
• | uncertainties generally inherent in estimates and assumptions; |
• | our failure to implement appropriate actuarial projections and ratings formulas or other pricing methodologies; |
• | regulatory constraints on rate increases; |
• | our failure to accurately estimate investment yields and the duration of our liability for loss and loss adjustment expenses; and |
• | unanticipated court decisions, legislation or regulatory action. |
35
If actual renewals of our existing contracts do not meet expectations, our written premiums in future years and our future results of operations could be materially adversely affected.
Many of our contracts are written for a one-year term. In our financial forecasting process, we make assumptions about the rates of renewal of our prior year’s contracts. The insurance and reinsurance industries have historically been cyclical businesses with intense competition, often based on price. If actual renewals do not meet expectations or if we choose not to write a renewal because of pricing conditions, our written premiums in future years and our future operations would be materially adversely affected.
We may change our underwriting guidelines or our strategy without stockholder approval.
Our management has the authority to change our underwriting guidelines or our strategy without notice to our stockholders and without stockholder approval. As a result, we may make fundamental changes to our operations without stockholder approval, which could result in our pursuing a strategy or implementing underwriting guidelines that may be materially different from the strategy or underwriting guidelines described in the section titled "Business" or elsewhere in this Annual Report on Form 10-K.
Changes in accounting practices and future pronouncements may materially affect our reported financial results.
Developments in accounting practices may require us to incur considerable additional expenses to comply, particularly if we are required to prepare information relating to prior periods for comparative purposes or to apply the new requirements retroactively. The impact of changes in current accounting practices and future pronouncements cannot be predicted but may affect the calculation of net income, stockholders’ equity and other relevant financial statement line items.
Our insurance subsidiary, Kinsale Insurance, is required to comply with statutory accounting principles ("SAP"). SAP and various components of SAP are subject to constant review by the NAIC and its task forces and committees, as well as state insurance departments, in an effort to address emerging issues and otherwise improve financial reporting. Various proposals are pending before committees and task forces of the NAIC, some of which, if enacted, could have negative effects on insurance industry participants. The NAIC continuously examines existing laws and regulations. We cannot predict whether or in what form such reforms will be enacted and, if so, whether the enacted reforms will positively or negatively affect us.
Our failure to accurately and timely pay claims could materially and adversely affect our business, financial condition, results of operations and prospects.
We must accurately and timely evaluate and pay claims that are made under our policies. Many factors affect our ability to pay claims accurately and timely, including the training and experience of our claims representatives, our claims organization’s culture and the effectiveness of our management, our ability to develop or select and implement appropriate procedures and systems to support our claims functions and other factors. Our failure to pay claims accurately and timely could lead to regulatory and administrative actions or material litigation, undermine our reputation in the marketplace and materially and adversely affect our business, financial condition, results of operations and prospects.
In addition, if we do not train new claims employees effectively or if we lose a significant number of experienced claims employees, our claims department’s ability to handle an increasing workload could be adversely affected. In addition to potentially requiring that growth be slowed in the affected markets, our business could suffer from decreased quality of claims work which, in turn, could adversely affect our operating margins.
Global climate change may have an adverse effect on our financial results.
Although uncertainty remains as to the nature and effect of future efforts to curb greenhouse gas emissions and thereby mitigate their potential long-term effects on the climate, a broad spectrum of scientific evidence suggests that manmade production of greenhouse gas has had an adverse effect on the global climate. Our insurance policies are generally written for one year and repriced annually to reflect changing exposures. However, assessing the risk of loss and damage associated with the adverse effects of climate change and the range of approaches to address loss and damage associated with the adverse effects of climate change, including impacts related to extreme weather events and slow onset events, remains a challenge and might adversely impact our business, results of operations and financial condition.
36
Item 1B. Unresolved Staff Comments
None.
Item 2. Properties
Our executive offices and insurance operations are located in Richmond, Virginia, which occupy approximately 42,000 square feet of office space for annual rent of approximately $0.5 million. The lease for this space expires in 2020.
We do not own any real property. We believe that our facilities are adequate for our current needs.
Item 3. Legal Proceedings
We are subject to legal proceedings in the normal course of operating our insurance business. We are not involved in any legal proceedings which reasonably could be expected to have a material adverse effect on our business, results of operations or financial condition.
Item 4. Mine Safety Disclosures
Not applicable.
37
PART II
Item 5. Market for Registrant’s Common Equity, Related Stockholder Matters and Issuer Purchases of Equity Securities
Market Price for Common Stock
Our common stock began trading on the Nasdaq Global Select Market ("Nasdaq") under the symbol "KNSL" on July 28, 2016. Before then, there was no public market for our common stock. As of February 23, 2018, we had 96 stockholders of record of our common stock.
The following table sets forth, for the periods indicated, the high and low sales prices of our common stock as reported by Nasdaq:
2016 Period | High | Low | ||||||
Third Quarter (beginning July 28, 2016) | $ | 22.65 | $ | 18.00 | ||||
Fourth Quarter | $ | 34.91 | $ | 20.81 | ||||
2017 Period | High | Low | ||||||
First Quarter | $ | 35.08 | $ | 27.19 | ||||
Second Quarter | $ | 38.32 | $ | 30.78 | ||||
Third Quarter | $ | 47.78 | $ | 34.70 | ||||
Fourth Quarter | $ | 46.19 | $ | 39.38 | ||||
Dividend Policy
We paid dividends of $0.06 per share in each quarter of 2017. We paid dividends of $0.05 per share during the third quarter of 2016, and $0.05 per share during the fourth quarter of 2016.
On February 12, 2018, the Company’s Board of Directors declared a cash dividend of $0.07 per share of common stock. This dividend is payable on March 15, 2018 to all stockholders of record on February 28, 2018.
The declaration, payment and amount of future dividends will be subject to the discretion of our Board of Directors. Our Board of Directors will give consideration to various risks and uncertainties, including those discussed under the headings "Risk Factors" and "Management’s Discussion and Analysis of Financial Condition and Results of Operations" and elsewhere in this Annual Report on Form 10-K when determining whether to declare and pay dividends, as well as the amount thereof. Our Board of Directors may take into account a variety of factors when determining whether to declare any dividends, including (1) our financial condition, liquidity, results of operations (including our ability to generate cash flow in excess of expenses and our expected or actual net income), retained earnings and capital requirements, (2) general business conditions, (3) legal, tax and regulatory limitations, (4) contractual prohibitions and other restrictions, (5) the effect of a dividend or dividends on our financial strength ratings and (6) any other factors that our Board of Directors deem relevant.
Our status as a holding company and a legal entity separate and distinct from our subsidiaries affects our ability to pay dividends and make other payments. As a holding company without significant operations of our own, the principal sources of our funds are dividends and other payments from our subsidiaries. The ability of our insurance subsidiary to pay dividends to us is subject to limits under insurance laws of the state in which our insurance subsidiary is domiciled. See "Risk Factors – Risks Related to Our Business and Our Industry – Because we are a holding company and substantially all of our operations are conducted by our insurance subsidiary, our ability to pay dividends and service our debt obligations depends on our ability to obtain cash dividends or other permitted
38
payments from our insurance subsidiary" and "Management’s Discussion and Analysis of Financial Condition and Results of Operations — Liquidity and Capital Resources" and "Regulation."
Recent Sales of Unregistered Securities
Since January 1, 2017, the registrant has not sold any equity securities that were not registered under the Securities Act.
Performance Graph
The following performance graph compares the cumulative total shareholder return of an investment in (1) our common stock, (2) the cumulative total returns to the Nasdaq Composite Index and (3) the cumulative total returns to the Nasdaq Insurance Index, for the period from July 28, 2016 (the date our common stock began trading on Nasdaq) through December 31, 2017.
The graph assumes an initial investment of $100 and the reinvestment of dividends, if any. Such returns are based on historical results and are not indicative of future performance.
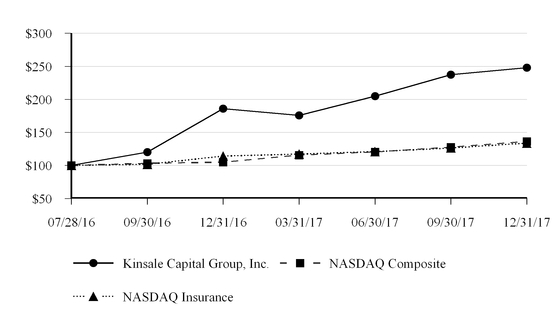
July 28, 2016 | December 31, 2017 | |||||||
Kinsale Capital Group, Inc. | $ | 100.00 | $ | 247.91 | ||||
Nasdaq Composite Index | $ | 100.00 | $ | 136.14 | ||||
Nasdaq Insurance Index | $ | 100.00 | $ | 133.66 | ||||
39
Item 6. Selected Consolidated Financial and Other Data
The following tables present our selected consolidated financial and other data, at the dates and for the periods indicated. The selected consolidated financial and other data set forth below as of December 31, 2017, 2016, 2015 and 2014 and for the years ended December 31, 2017, 2016, 2015, 2014 and 2013 have been derived from our audited consolidated financial statements for those years.
These historical results are not necessarily indicative of the results that may be expected for any future period. The following information is only a summary and should be read in conjunction with the section entitled "Management’s Discussion and Analysis of Financial Condition and Results of Operations" and our consolidated financial statements and the accompanying notes included elsewhere in this Annual Report on Form 10-K.
Year Ended December 31, | ||||||||||||||||||||
2017 | 2016 | 2015 | 2014 | 2013 | ||||||||||||||||
($ in thousands, except for per share data) | ||||||||||||||||||||
Revenues: | ||||||||||||||||||||
Gross written premiums | $ | 223,191 | $ | 188,478 | $ | 177,009 | $ | 158,523 | $ | 125,267 | ||||||||||
Ceded written premiums | (33,719 | ) | (21,214 | ) | (92,991 | ) | (97,012 | ) | (80,870 | ) | ||||||||||
Net written premiums | $ | 189,472 | $ | 167,264 | $ | 84,018 | $ | 61,511 | $ | 44,397 | ||||||||||
Net earned premiums | $ | 176,053 | $ | 133,816 | $ | 74,322 | $ | 58,996 | $ | 45,122 | ||||||||||
Net investment income | 10,569 | 7,487 | 5,643 | 4,070 | 3,344 | |||||||||||||||
Net investment gains | 151 | 176 | 59 | 201 | 8 | |||||||||||||||
Other income | 3 | 136 | 572 | 409 | 10 | |||||||||||||||
Total revenues | 186,776 | 141,615 | 80,596 | 63,676 | 48,484 | |||||||||||||||
Expenses: | ||||||||||||||||||||
Losses and loss adjustment expenses | 103,680 | 70,961 | 42,238 | 41,108 | 28,890 | |||||||||||||||
Underwriting, acquisition and insurance expenses | 44,146 | 28,551 | 2,809 | 1,451 | 6,894 | |||||||||||||||
Other expenses | 429 | 2,567 | 1,992 | 1,644 | 597 | |||||||||||||||
Total expenses | 148,255 | 102,079 | 47,039 | 44,203 | 36,381 | |||||||||||||||
Income before income taxes | 38,521 | 39,536 | 33,557 | 19,473 | 12,103 | |||||||||||||||
Income tax expense (benefit) | 13,620 | 13,369 | 11,284 | 6,500 | (164 | ) | ||||||||||||||
Net income | $ | 24,901 | $ | 26,167 | $ | 22,273 | $ | 12,973 | $ | 12,267 | ||||||||||
Underwriting income (1) | $ | 28,227 | $ | 34,304 | $ | 29,275 | $ | 16,437 | $ | 9,338 | ||||||||||
Per common share data: | ||||||||||||||||||||
Basic earnings per share: | ||||||||||||||||||||
Common stock | $ | 1.19 | $ | 0.57 | $ | — | $ | — | $ | — | ||||||||||
Class A common stock | — | 0.98 | 1.53 | 0.94 | 0.89 | |||||||||||||||
Class B common stock | — | 0.48 | 0.84 | — | — | |||||||||||||||
Diluted earnings per share: | ||||||||||||||||||||
Common stock | $ | 1.16 | $ | 0.56 | $ | — | $ | — | $ | — | ||||||||||
Class A common stock | — | 0.98 | 1.53 | 0.94 | 0.89 | |||||||||||||||
Class B common stock | — | 0.46 | 0.81 | — | — | |||||||||||||||
Cash dividends declared and paid | 0.24 | 0.10 | — | — | — | |||||||||||||||
40
At December 31, | ||||||||||||||||
2017 | 2016 | 2015 | 2014 | |||||||||||||
($ in thousands) | ||||||||||||||||
Balance sheet data: | ||||||||||||||||
Cash and invested assets | $ | 561,070 | $ | 480,349 | $ | 368,685 | $ | 292,285 | ||||||||
Premiums receivable, net | 19,787 | 16,984 | 15,550 | 14,226 | ||||||||||||
Reinsurance recoverables | 49,593 | 70,317 | 95,670 | 70,348 | ||||||||||||
Ceded unearned premiums | 13,858 | 13,512 | 39,329 | 42,565 | ||||||||||||
Intangible assets | 3,538 | 3,538 | 3,538 | 3,538 | ||||||||||||
Total assets | 667,849 | 614,389 | 545,278 | 437,604 | ||||||||||||
Reserves for unpaid losses and loss adjustment expenses | 315,717 | 264,801 | 219,629 | 162,210 | ||||||||||||
Unearned premiums | 103,110 | 89,344 | 81,713 | 75,253 | ||||||||||||
Funds held for reinsurers | — | 36,497 | 87,206 | 63,932 | ||||||||||||
Note payable | — | — | 29,603 | 27,484 | ||||||||||||
Total liabilities | 429,660 | 404,175 | 431,827 | 345,018 | ||||||||||||
Total stockholders' equity | 238,189 | 210,214 | 113,451 | 92,586 | ||||||||||||
Other data: | ||||||||||||||||
Tangible stockholders' equity (2) | $ | 235,394 | $ | 207,914 | $ | 111,151 | $ | 90,286 | ||||||||
Debt to total capitalization ratio (3) | — | % | — | % | 20.8 | % | 23.1 | % | ||||||||
Statutory capital and surplus (4) | $ | 213,833 | $ | 193,387 | $ | 127,675 | $ | 104,101 | ||||||||
Year Ended December 31, | |||||||||||||||
2017 | 2016 | 2015 | 2014 | 2013 | |||||||||||
Underwriting and other ratios: | |||||||||||||||
Loss ratio (5) | 58.9 | % | 53.0 | % | 56.8 | % | 69.7 | % | 64.0 | % | |||||
Expense ratio (6) | 25.1 | % | 21.3 | % | 3.8 | % | 2.4 | % | 15.3 | % | |||||
Combined ratio (7) | 84.0 | % | 74.3 | % | 60.6 | % | 72.1 | % | 79.3 | % | |||||
Adjusted loss ratio (8) | 58.9 | % | 50.0 | % | 51.5 | % | 59.4 | % | 58.5 | % | |||||
Adjusted expense ratio (8) | 25.1 | % | 26.8 | % | 26.0 | % | 24.7 | % | 26.9 | % | |||||
Adjusted combined ratio (8) | 84.0 | % | 76.8 | % | 77.5 | % | 84.1 | % | 85.4 | % | |||||
Return on equity (9) | 11.1 | % | 16.2 | % | 21.6 | % | 15.3 | % | 17.0 | % | |||||
(1) | Underwriting income is a non-GAAP financial measure. See "Management’s Discussion and Analysis of Financial Condition and Results of Operations — Reconciliation of Non-GAAP Financial Measures" for a reconciliation of net income to underwriting income in accordance with GAAP. |
(2) | Tangible stockholders’ equity is a non-GAAP financial measure. See "Management’s Discussion and Analysis of Financial Condition and Results of Operations — Liquidity and Capital Resources — Financial Condition" for a reconciliation of stockholders’ equity to tangible stockholders’ equity. |
41
(3) | The ratio, expressed as a percentage, of total indebtedness for borrowed money, including capitalized lease obligations, to the sum of total indebtedness for borrowed money, including capitalized lease obligations, and stockholders’ equity. |
(4) | For our insurance subsidiary, the excess of assets over liabilities as determined in accordance with statutory accounting principles as determined by the NAIC. |
(5) | The loss ratio is the ratio, expressed as a percentage, of losses and loss adjustment expenses to net earned premiums, net of the effects of reinsurance. |
(6) | The expense ratio is the ratio, expressed as a percentage, of underwriting, acquisition and insurance expenses to net earned premiums. |
(7) | The combined ratio is the sum of the loss ratio and the expense ratio. A combined ratio under 100% generally indicates an underwriting profit. A combined ratio over 100% generally indicates an underwriting loss. |
(8) | The adjusted loss ratio, adjusted expense ratio and adjusted combined ratio are non-GAAP financial measures. See "Management’s Discussion and Analysis of Financial Condition and Results of Operations — Factors Affecting Our Results of Operations — The MLQS." |
(9) | Return on equity represents net income expressed on an annualized basis as a percentage of average beginning and ending stockholders’ equity during the period. |
42
Item 7. Management's Discussion and Analysis of Financial Condition and Results of Operations
The following discussion and analysis of our financial condition and results of operations should be read in conjunction with our consolidated financial statements and the accompanying notes included elsewhere in this Annual Report. The discussion and analysis below include certain forward-looking statements that are subject to risks, uncertainties and other factors described in "Risk Factors" that could cause actual results to differ materially from those expressed in, or implied by, those forward-looking statements. See "Forward-Looking Statements."
Overview
Founded in 2009, we are an established and growing specialty insurance company. We focus exclusively on the E&S market in the U.S., where we can use our underwriting expertise to write coverages for hard-to-place small business risks and personal lines risks. We market and sell these insurance products in all 50 states, the District of Columbia, the Commonwealth of Puerto Rico and the U.S. Virgin Islands primarily through a network of independent insurance brokers. We have an experienced and cohesive management team, that has an average of over 25 years of relevant experience. Many of our employees and members of our management team have also worked together for decades at other E&S insurance companies.
We have one reportable segment, our Excess and Surplus Lines Insurance segment, which offers P&C insurance products through the E&S market. In 2017, the percentage breakdown of our gross written premiums was 93.4% casualty and 6.6% property. Our commercial lines offerings include construction, small business, excess casualty, energy, general casualty, professional liability, life sciences, product liability, allied health, health care, commercial property, management liability, environmental, inland marine, public entity and commercial insurance. We also write a small amount of homeowners insurance in the personal lines market, which in aggregate represented 3.9% of our gross written premiums in 2017.
Our goal is to deliver long-term value for our stockholders by growing our business and generating attractive returns. We seek to accomplish this by generating consistent and attractive underwriting profits while managing our capital prudently. We have built a company that is entrepreneurial and highly efficient, using our proprietary technology platform and leveraging the expertise of our highly experienced employees in our daily operations. We believe our systems and technology are at the digital forefront of the insurance industry, allowing us to quickly collect and analyze data, thereby improving our ability to manage our business and reducing response times for our customers. We believe that we have differentiated ourselves from our competitors by effectively leveraging technology, vigilantly controlling expenses and maintaining control over our underwriting and claims management.
Factors Affecting Our Results of Operations
The MLQS
Prior to our IPO in 2016, a significant amount of our business had been reinsured through our MLQS with third-party reinsurers. This agreement allowed us to cede a portion of the risk related to certain lines of business that we underwrite in exchange for a portion of our direct written premiums on that business, less a ceding commission. The MLQS was subject to annual renewal; however, we retained the right to adjust the amount of business we ceded on a quarterly basis in accordance with the terms of the MLQS. We monitored the ceding percentage under the MLQS and adjusted this percentage based on our projected direct written premiums and future business conditions in our industry. Generally, we increased the ceding percentage when gross written premiums were growing more strongly relative to the growth rate of Kinsale Insurance’s capital position, and decreased the ceding percentage when Kinsale Insurance’s capital position was growing more strongly relative to the growth rate of gross written premiums. In periods of high premium rates and shortages of underwriting
43
capacity (known as a hard market), the E&S market may grow significantly more rapidly than the standard insurance market as business may shift from the standard market to the E&S market dramatically.
We entered into the MLQS in the middle of 2012. Effective January 1, 2013, the MLQS had a ceding percentage of 45% and a provisional ceding commission rate of 35%. On January 1, 2014, we increased the ceding percentage under the MLQS from 45% to 50% and the provisional ceding commission rate from 35% to 40%. Effective December 31, 2014, 45% of the contract covering the period July 1, 2012 to December 31, 2013 (the "2012 MLQS") was commuted, and the remaining 55% of this contract was commuted effective January 1, 2015. Effective January 1, 2015, the ceding percentage under the MLQS was 50% and the provisional ceding commission rate was 41%. The ceding percentage remained at 50% until October 1, 2015, at which time we decreased the percentage to 40%, while the provisional ceding commission rate remained at 41%. A lower ceding percentage generally results in higher net earned premiums and a reduction in ceding commissions in future periods.
Effective January 1, 2016, we further reduced the ceding percentage from 40% to 15% while maintaining the provisional ceding commission rate at 41%, and we commuted the MLQS covering the 2014 calendar year. We reduced the ceding percentage due to Kinsale Insurance’s capital position growing more strongly as a result of the profitability of the business relative to the growth rate of gross written premiums. As a result of the successful completion of our IPO in August 2016, we terminated and commuted the MLQS contract on October 1, 2016, which covered the period January 1, 2016 through September 30, 2016, and the MLQS was not renewed for the 2017 calendar year. Effective January 1, 2017, the remaining MLQS was commuted covering the 2015 calendar year, and there are no remaining MLQS contracts outstanding.
The effect of the MLQS on our results of operations is primarily reflected in our ceded written premiums, losses and loss adjustment expenses, as well as our underwriting, acquisition and insurance expenses. The following tables summarize the effect of the MLQS on our underwriting income for the years ended December 31, 2017, 2016 and 2015:
Year Ended December 31, 2017 | Year Ended December 31, 2016 | Year Ended December 31, 2015 | ||||||||||||||||||||||||||||||||||
($ in thousands) | Including Quota Share | Effect of Quota Share | Excluding Quota Share | Including Quota Share | Effect of Quota Share | Excluding Quota Share | Including Quota Share | Effect of Quota Share | Excluding Quota Share | |||||||||||||||||||||||||||
Gross written premiums | $ | 223,191 | $ | — | $ | 223,191 | $ | 188,478 | $ | — | $ | 188,478 | $ | 177,009 | $ | — | $ | 177,009 | ||||||||||||||||||
Ceded written premiums | (33,719 | ) | — | (33,719 | ) | (21,214 | ) | 10,269 | (31,483 | ) | (92,991 | ) | (63,991 | ) | (29,000 | ) | ||||||||||||||||||||
Net written premiums | $ | 189,472 | $ | — | $ | 189,472 | $ | 167,264 | $ | 10,269 | $ | 156,995 | $ | 84,018 | $ | (63,991 | ) | $ | 148,009 | |||||||||||||||||
Net retention (1) | 84.9 | % | 84.9 | % | 88.7 | % | 83.3 | % | 47.5 | % | 83.6 | % | ||||||||||||||||||||||||
Net earned premiums | $ | 176,053 | $ | — | $ | 176,053 | $ | 133,816 | $ | (16,996 | ) | $ | 150,812 | $ | 74,322 | $ | (67,950 | ) | $ | 142,272 | ||||||||||||||||
Losses and loss adjustment expenses | (103,680 | ) | — | (103,680 | ) | (70,961 | ) | 4,380 | (75,341 | ) | (42,238 | ) | 30,978 | (73,216 | ) | |||||||||||||||||||||
Underwriting, acquisition and insurance expenses | (44,146 | ) | — | (44,146 | ) | (28,551 | ) | 11,936 | (40,487 | ) | (2,809 | ) | 34,254 | (37,063 | ) | |||||||||||||||||||||
Underwriting income (2) | $ | 28,227 | $ | — | $ | 28,227 | $ | 34,304 | $ | (680 | ) | $ | 34,984 | $ | 29,275 | $ | (2,718 | ) | $ | 31,993 | ||||||||||||||||
Loss ratio | 58.9 | % | — | % | — | 53.0 | % | 25.8 | % | — | 56.8 | % | 45.6 | % | — | |||||||||||||||||||||
Expense ratio | 25.1 | % | — | % | — | 21.3 | % | 70.2 | % | — | 3.8 | % | 50.4 | % | — | |||||||||||||||||||||
Combined ratio | 84.0 | % | — | % | — | 74.3 | % | 96.0 | % | — | 60.6 | % | 96.0 | % | — | |||||||||||||||||||||
Adjusted loss ratio (3) | — | — | 58.9 | % | — | — | 50.0 | % | — | — | 51.5 | % | ||||||||||||||||||||||||
Adjusted expense ratio (3) | — | — | 25.1 | % | — | — | 26.8 | % | — | — | 26.0 | % | ||||||||||||||||||||||||
Adjusted combined ratio (3) | — | — | 84.0 | % | — | — | 76.8 | % | — | — | 77.5 | % | ||||||||||||||||||||||||
(1) The ratio of net written premiums to gross written premiums.
(2) Underwriting income is a non-GAAP financial measure. See "— Reconciliation of Non-GAAP Financial Measures" for a reconciliation of net income to underwriting income in accordance with GAAP.
44
(3) Our adjusted loss ratio, adjusted expense ratio and adjusted combined ratio are non-GAAP financial measures. We define our adjusted loss ratio, adjusted expense ratio and adjusted combined ratio as each of our loss ratio, expense ratio and combined ratio, respectively, excluding the effects of the MLQS. We use these adjusted ratios as an internal performance measure in the management of our operations because we believe they give our management and other users of our financial information useful insight into our results of operations and our underlying business performance. Our adjusted loss ratio, adjusted expense ratio and adjusted combined ratio should not be viewed as substitutes for our loss ratio, expense ratio and combined ratio, respectively, which are presented in accordance with GAAP.
Our results of operations may be difficult to compare from year to year as we made periodic adjustments to the amount of business we ceded under the terms of the MLQS, may have changed the negotiated terms of the MLQS upon renewal, and may have increased or decreased the ceding commission under the MLQS based on the loss experience of the business ceded. In light of the impact of the MLQS on our results of operations, we internally evaluated our financial performance both including and excluding the effects of the MLQS.
Components of our results of operations
Gross written premiums
Gross written premiums are the amounts received or to be received for insurance policies written or assumed by us during a specific period of time without reduction for policy acquisition costs, reinsurance costs or other deductions. The volume of our gross written premiums in any given period is generally influenced by:
• | New business submissions; |
• | Binding of new business submissions into policies; |
• | Renewals of existing policies; and |
• | Average size and premium rate of bound policies. |
We earn insurance premiums on a pro rata basis over the term of the policy. Our insurance policies generally have a term of one year. Net earned premiums represent the earned portion of our gross written premiums, less that portion of our gross written premiums that is ceded to third-party reinsurers under our reinsurance agreements.
Ceded written premiums
Ceded written premiums are the amount of gross written premiums ceded to reinsurers. We enter into reinsurance contracts to limit our exposure to potential large losses as well as to provide additional capacity for growth. Ceded written premiums are earned over the reinsurance contract period in proportion to the period of risk covered. The volume of our ceded written premiums is impacted by the level of our gross written premiums and any decision we make to increase or decrease retention levels.
Net investment income
Net investment income is an important component of our results of operations. We earn investment income on our portfolio of cash and invested assets. Our cash and invested assets are primarily comprised of fixed maturity securities, and may also include cash and cash equivalents, equity securities and short-term investments. The principal factors that influence net investment income are the size of our investment portfolio and the yield on that portfolio. As measured by amortized cost (which excludes changes in fair value, such as changes in interest rates), the size of our investment portfolio is mainly a function of our invested equity capital along with premiums we receive from our insureds less payments on policyholder claims.
Net investment gains
Net investment gains are a function of the difference between the amount received by us on the sale of a security and the security's amortized cost, as well as any "other-than-temporary" impairments recognized in earnings.
45
Losses and loss adjustment expenses
Losses and loss adjustment expenses are a function of the amount and type of insurance contracts we write and the loss experience associated with the underlying coverage. In general, our losses and loss adjustment expenses are affected by:
• | Frequency of claims associated with the particular types of insurance contracts that we write; |
• | Trends in the average size of losses incurred on a particular type of business; |
• | Mix of business written by us; |
• | Changes in the legal or regulatory environment related to the business we write; |
• | Trends in legal defense costs; |
• | Wage inflation; and |
• | Inflation in medical costs. |
Losses and loss adjustment expenses are based on an actuarial analysis of the estimated losses, including losses incurred during the period and changes in estimates from prior periods. Losses and loss adjustment expenses may be paid out over a period of years.
Underwriting, acquisition and insurance expenses
Underwriting, acquisition and insurance expenses include policy acquisition costs and other underwriting expenses. Policy acquisition costs are principally comprised of the commissions we pay our brokers, net of ceding commissions we receive on business ceded under certain reinsurance contracts. Policy acquisition costs that are directly related to the successful acquisition of those policies are deferred. The amortization of such policy acquisition costs is charged to expense in proportion to premium earned over the policy life. Other underwriting expenses represent the general and administrative expenses of our insurance business including employment costs, telecommunication and technology costs, the costs of our lease, and legal and auditing fees. We reduced the ceding percentage under the MLQS from 40% to 15% effective January 1, 2016, and subsequently terminated and commuted the MLQS effective October 1, 2016.
Income tax expense
Currently all of our income tax expense relates to federal income taxes. Kinsale Insurance is generally not subject to income taxes in the states in which it operates; however, our non-insurance subsidiaries are subject to state income taxes. The amount of income tax expense or benefit recorded in future periods will depend on the jurisdictions in which we operate and the tax laws and regulations in effect. Among other things, the Tax Cuts and Jobs Act of 2017 ("TCJA") enacted on December 22, 2017 lowers the federal corporate tax rate from 35% to 21% starting January 1, 2018. Our income tax expense for periods beginning in 2018 will be based on the federal corporate income tax rate in the TCJA, and as a result, we expect our 2018 annual effective tax rate to be significantly lower than our current year effective tax rate.
Key metrics
We discuss certain key metrics, described below, which provide useful information about our business and the operational factors underlying our financial performance.
Underwriting income is a non-GAAP financial measure. We define underwriting income as net income, excluding net investment income, net investment gains and losses, and other income and expenses. See "—Reconciliation of Non-GAAP Financial Measures" for a reconciliation of net income to underwriting income in accordance with GAAP.
Loss ratio, expressed as a percentage, is the ratio of losses and loss adjustment expenses to net earned premiums, net of the effects of reinsurance.
Expense ratio, expressed as a percentage, is the ratio of underwriting, acquisition and insurance expenses to net earned premiums.
Combined ratio is the sum of the loss ratio and the expense ratio. A combined ratio under 100% generally indicates an underwriting profit. A combined ratio over 100% generally indicates an underwriting loss.
46
Adjusted loss ratio is a non-GAAP financial measure. We define adjusted loss ratio as the loss ratio, excluding the effects of the MLQS. For additional detail on the impact of the MLQS on our results of operations, see "—Factors Affecting Our Results of Operations — The MLQS."
Adjusted expense ratio is a non-GAAP financial measure. We define adjusted expense ratio as the expense ratio, excluding the effects of the MLQS. For additional detail on the impact of the MLQS on our results of operations, see "—Factors Affecting Our Results of Operations — The MLQS."
Adjusted combined ratio is a non-GAAP financial measure. We define adjusted combined ratio as the loss ratio, excluding the effects of the MLQS. For additional detail on the impact of the MLQS on our results of operations, see "—Factors Affecting Our Results of Operations — The MLQS."
Return on equity is net income expressed on an annualized basis as a percentage of average beginning and ending stockholders’ equity during the period. Our overall financial goal is to produce a return on equity in the mid-teens over the long-term.
Net retention ratio is the ratio of net written premiums to gross written premiums.
Results of Operations
Year ended December 31, 2017 compared to year ended December 31, 2016
The following table summarizes our results of operations for the years ended December 31, 2017 and 2016:
Year Ended December 31, | |||||||||||||||
($ in thousands) | 2017 | 2016 | Change | Percent | |||||||||||
Gross written premiums | $ | 223,191 | $ | 188,478 | $ | 34,713 | 18.4 | % | |||||||
Ceded written premiums | (33,719 | ) | (21,214 | ) | (12,505 | ) | 58.9 | % | |||||||
Net written premiums | $ | 189,472 | $ | 167,264 | $ | 22,208 | 13.3 | % | |||||||
Net earned premiums | $ | 176,053 | $ | 133,816 | $ | 42,237 | 31.6 | % | |||||||
Losses and loss adjustment expenses | 103,680 | 70,961 | 32,719 | 46.1 | % | ||||||||||
Underwriting, acquisition and insurance expenses | 44,146 | 28,551 | 15,595 | 54.6 | % | ||||||||||
Underwriting income (1) | 28,227 | 34,304 | (6,077 | ) | (17.7 | )% | |||||||||
Other expenses, net | (426 | ) | (2,431 | ) | 2,005 | (82.5 | )% | ||||||||
Net investment income | 10,569 | 7,487 | 3,082 | 41.2 | % | ||||||||||
Net investment gains | 151 | 176 | (25 | ) | (14.2 | )% | |||||||||
Income before taxes | 38,521 | 39,536 | (1,015 | ) | (2.6 | )% | |||||||||
Income tax expense | 13,620 | 13,369 | 251 | 1.9 | % | ||||||||||
Net income | $ | 24,901 | $ | 26,167 | $ | (1,266 | ) | (4.8 | )% | ||||||
Return on equity | 11.1 | % | 16.2 | % | |||||||||||
Loss ratio | 58.9 | % | 53.0 | % | |||||||||||
Expense ratio | 25.1 | % | 21.3 | % | |||||||||||
Combined ratio | 84.0 | % | 74.3 | % | |||||||||||
(1) Underwriting income is a non-GAAP financial measure. See "—Reconciliation of Non-GAAP Financial Measures" for a reconciliation of net income to underwriting income in accordance with GAAP.
47
Net income was $24.9 million for the year ended December 31, 2017 compared to $26.2 million for the year ended December 31, 2016, a decrease of $1.3 million, or 4.8%. Our underwriting income was $28.2 million for the year ended December 31, 2017, compared to $34.3 million for the year ended December 31, 2016, a decrease of $6.1 million, or 17.7%. The corresponding combined ratio was 84.0% for the year ended December 31, 2017 compared to 74.3% for the year ended December 31, 2016. As previously discussed, the MLQS was not renewed for the 2017 calendar year. Excluding the effect of the 2016 MLQS, underwriting income was $35.0 million and the corresponding adjusted combined ratio was 76.8% for the year ended December 31, 2016. The decrease in our underwriting income, excluding the effect of the 2016 MLQS, was attributable to higher losses incurred from catastrophes and lower favorable development of reserves from prior accident years, offset in part by an increase in net earned premiums in 2017.
Premiums
Gross written premiums were $223.2 million for the year ended December 31, 2017 compared to $188.5 million for the year ended December 31, 2016, an increase of $34.7 million, or 18.4%. Premium growth in 2017 was due to an increase in the number of policies written, offset in part by a decrease in the average premium per policy. The average premium on a policy written by us was $8,200 in 2017 compared to $8,800 in 2016. The changes in gross written premiums were most notable in the following lines of business:
• | Small business, which represented approximately 15.6% of our gross written premiums in 2017, increased by $7.6 million, or 27.7%, for the year ended December 31, 2017 over the prior year; |
• | Energy, which represented approximately 10.3% of our gross written premiums in 2017, increased by $6.7 million, or 41.7%, for the year ended December 31, 2017 over the prior year; |
• | Construction, which represented approximately 21.8% of our gross written premiums in 2017, increased by $6.4 million, or 15.0%, for the year ended December 31, 2017 over the prior year, and |
• | Products liability, which represented approximately 6.4% of our gross written premiums in 2017, increased by $4.1 million, or 40.9%, for the year ended December 31, 2017 over the prior year. |
Net written premiums increased by $22.2 million, or 13.3%, to $189.5 million for the year ended December 31, 2017 from $167.3 million for the year ended December 31, 2016. This increase in net written premiums was primarily due to higher gross written premiums in 2017, offset in part by the termination and commutation of the MLQS. As a result of the successful completion of our IPO in August 2016, we terminated and commuted the 2016 MLQS on October 1, 2016. Our net retention ratio was 84.9% for the year ended December 31, 2017 compared to 88.7% for the year ended December 31, 2016. Excluding the effects of the MLQS, our net retention ratio was 83.3% for the year ended December 31, 2016.
Net earned premiums were $176.1 million for the year ended December 31, 2017 compared to $133.8 million for the year ended December 31, 2016, an increase of $42.2 million, or 31.6%. The increase was due to higher written premiums in 2017 compared to 2016 and from the non-renewal of the MLQS in 2017. Excluding the effects of the MLQS, net earned premiums were $150.8 million for the year ended December 31, 2016, a year-over-year increase of $25.2 million, or 16.7%.
Loss ratio
Our loss ratio was 58.9% for the year ended December 31, 2017 compared to 53.0% for the year ended December 31, 2016. Excluding the effects of the MLQS, our adjusted loss ratio was 50.0% for the year ended December 31, 2016. The increase in the loss ratio for the year ended December 31, 2017 was due to higher catastrophe losses, net of reinsurance, of $9.0 million, primarily from Hurricanes Harvey and Irma and lower favorable development of reserves from prior accident years.
48
The following tables summarize the effect of the factors indicated above on the loss ratios and adjusted loss ratios for the years ended December 31, 2017 and 2016:
Year Ended December 31, | ||||||||||||||
2017 | 2016 | |||||||||||||
($ in thousands) | Losses and Loss Adjustment Expenses | % of Earned Premiums | Losses and Loss Adjustment Expenses | % of Earned Premiums | ||||||||||
Loss ratio: | ||||||||||||||
Current accident year | $ | 105,958 | 60.2 | % | $ | 82,576 | 61.7 | % | ||||||
Current accident year - catastrophe losses | 9,002 | 5.1 | % | 1,099 | 0.8 | % | ||||||||
Effect of prior year development | (11,280 | ) | (6.4 | )% | (12,714 | ) | (9.5 | )% | ||||||
Total | $ | 103,680 | 58.9 | % | $ | 70,961 | 53.0 | % | ||||||
Year Ended December 31, | ||||||||||||||
2017 | 2016 | |||||||||||||
($ in thousands) | Losses and Loss Adjustment Expenses | % of Earned Premiums | Losses and Loss Adjustment Expenses | % of Earned Premiums | ||||||||||
Adjusted loss ratio: | ||||||||||||||
Current accident year | $ | 105,958 | 60.2 | % | $ | 91,915 | 61.0 | % | ||||||
Current accident year - catastrophe losses | 9,002 | 5.1 | % | 1,099 | 0.7 | % | ||||||||
Effect of prior year development | (11,280 | ) | (6.4 | )% | (17,673 | ) | (11.7 | )% | ||||||
Total | $ | 103,680 | 58.9 | % | $ | 75,341 | 50.0 | % | ||||||
Expense ratio
The following table summarizes the components of the expense ratio for the years ended December 31, 2017 and 2016:
Year Ended December 31, | ||||||||||||||
2017 | 2016 | |||||||||||||
($ in thousands) | Underwriting Expenses | % of Earned Premiums | Underwriting Expenses | % of Earned Premiums | ||||||||||
Commissions incurred: | ||||||||||||||
Direct | $ | 31,001 | 17.6 | % | $ | 26,715 | 20.0 | % | ||||||
Ceding - MLQS | — | — | % | (11,936 | ) | (8.9 | )% | |||||||
Ceding - other | (9,799 | ) | (5.5 | )% | (8,632 | ) | (6.5 | )% | ||||||
Net commissions incurred | 21,202 | 12.1 | % | 6,147 | 4.6 | % | ||||||||
Other underwriting expenses | 22,944 | 13.0 | % | 22,404 | 16.7 | % | ||||||||
Underwriting, acquisition, and insurance expenses | $ | 44,146 | 25.1 | % | $ | 28,551 | 21.3 | % | ||||||
Our expense ratio was 25.1% for the year ended December 31, 2017 compared to 21.3% for the year ended December 31, 2016. The expense ratio was lower for the year ended December 31, 2016 due to the ceding commissions earned under the MLQS. As previously discussed, the MLQS was not renewed for the 2017 calendar
49
year. Excluding the effects of the MLQS, the adjusted expense ratio was 26.8% for the year ended December 31, 2016. The decrease in the expense ratio for the year ended December 31, 2017 compared to the adjusted expense ratio for the year ended December 31, 2016 was attributable to lower variable compensation costs primarily due to higher catastrophe losses, as well as higher net earned premiums without a proportional increase in the amount of other underwriting expenses resulting from management's focus on controlling costs. Direct commissions paid as a percent of gross written premiums was 14.8% for each of the years ended December 31, 2017 and 2016.
Combined ratio
Our combined ratio was 84.0% for the year ended December 31, 2017 compared to 74.3% for the year ended December 31, 2016. Excluding the effects of the MLQS, the adjusted combined ratio was 76.8% for the year ended December 31, 2016.
Investing results
Our net investment income increased by 41.2% to $10.6 million for the year ended December 31, 2017 from $7.5 million for the year ended December 31, 2016, primarily due to the increase in our investment portfolio from proceeds received from the IPO in the latter half of 2016 and additional premiums collected in 2017.
The following table summarizes the components of net investment income and net investment gains for the years ended December 31, 2017 and 2016:
Year Ended December 31, | ||||||||||||
($ in thousands) | 2017 | 2016 | Change | |||||||||
Interest from fixed-maturity securities | $ | 9,852 | $ | 7,839 | $ | 2,013 | ||||||
Dividends on equity securities | 1,041 | 442 | 599 | |||||||||
Other | 678 | 93 | 585 | |||||||||
Gross investment income | 11,571 | 8,374 | 3,197 | |||||||||
Investment expenses | (1,002 | ) | (887 | ) | (115 | ) | ||||||
Net investment income | 10,569 | 7,487 | 3,082 | |||||||||
Net capital gains | 151 | 452 | (301 | ) | ||||||||
Other-than-temporary losses | — | (276 | ) | 276 | ||||||||
Net investment gains | 151 | 176 | (25 | ) | ||||||||
Total | $ | 10,720 | $ | 7,663 | $ | 3,057 | ||||||
The weighted average duration of our fixed income portfolio, including cash equivalents, was 3.9 years at December 31, 2017 and 3.7 years at December 31, 2016. Our investment portfolio had a gross return of 2.4% as of December 31, 2017, compared to 2.2% as of December 31, 2016.
We perform quarterly reviews of all securities within our investment portfolio to determine whether any other-than-temporary impairment has occurred. Management concluded that there were no other-than-temporary impairments from fixed maturity securities or equity securities with unrealized losses for the year ended December 31, 2017. We recognized an impairment loss of $0.3 million on our foreign market ETF for the year ended December 31, 2016, based on our assessment of the security's prospect of recovery in the near term. Management concluded that none of the fixed maturity securities with an unrealized loss at December 31, 2016 experienced an other-than-temporary impairment.
50
Other expenses
For the year ended December 31, 2017, other expenses were comprised primarily of costs related to the Company's secondary common stock offering, which occurred during the second quarter of 2017. For the year ended December 31, 2016, other expenses were comprised primarily of interest expense related to a note payable that was repaid in the fourth quarter of 2016 and costs from the Company's initial and secondary common stock offerings, which occurred during the latter half of 2016.
Income tax expense
Our effective tax rate for the year ended December 31, 2017 was approximately 35.4% compared to 33.8% for the year ended December 31, 2016. In 2017, our effective tax rate differed from the statutory tax rate of 35% due to the charge related to the TCJA enacted on December 22, 2017. Among other things, the TCJA lowered the federal corporate tax rate from 35% to 21% starting January 1, 2018. As a result of the TCJA enactment in the fourth quarter of 2017, we re-measured our deferred tax balances to reflect the lower rate as required by applicable accounting standards. The re-measurement resulted in an increase to our tax expense of $1.9 million for the year ended December 31, 2017. In addition, the effective tax rate for the year ended December 31, 2017 reflected tax benefits related to tax-exempt interest income from municipal bonds and the recognition of tax benefits from share-based compensation. Our income tax expense for periods beginning in 2018 will be based on the new rate, and we expect our 2018 annual effective tax rate to be significantly lower than our current year effective tax rate, as a result of the reduction of the federal corporate income tax rate in the TCJA.
In 2016, our effective tax rate differed from the statutory tax rate of 35% primarily as a result favorable tax treatment on certain municipal bond interest income and dividends received from our equity investments.
Return on equity
Our return on equity was 11.1% for the year ended December 31, 2017 compared to 16.2% for the year ended December 31, 2016. The decrease is primarily the result of higher average equity attributable to the additional equity raised in the IPO and lower net income.
51
Year ended December 31, 2016 compared to year ended December 31, 2015
The following table summarizes our results of operations for the years ended December 31, 2016 and 2015:
Year Ended December 31, | |||||||||||||||
($ in thousands) | 2016 | 2015 | Change | Percent | |||||||||||
Gross written premiums | $ | 188,478 | $ | 177,009 | $ | 11,469 | 6.5 | % | |||||||
Ceded written premiums | (21,214 | ) | (92,991 | ) | 71,777 | (77.2 | )% | ||||||||
Net written premiums | $ | 167,264 | $ | 84,018 | $ | 83,246 | 99.1 | % | |||||||
Net earned premiums | $ | 133,816 | $ | 74,322 | $ | 59,494 | 80.0 | % | |||||||
Losses and loss adjustment expenses | 70,961 | 42,238 | 28,723 | 68.0 | % | ||||||||||
Underwriting, acquisition, and insurance expenses | 28,551 | 2,809 | 25,742 | 916.4 | % | ||||||||||
Underwriting income (1) | 34,304 | 29,275 | 5,029 | 17.2 | % | ||||||||||
Other expenses, net | (2,431 | ) | (1,420 | ) | (1,011 | ) | 71.2 | % | |||||||
Net investment income | 7,487 | 5,643 | 1,844 | 32.7 | % | ||||||||||
Net investment gains | 176 | 59 | 117 | 198.3 | % | ||||||||||
Income before taxes | 39,536 | 33,557 | 5,979 | 17.8 | % | ||||||||||
Income tax expense | 13,369 | 11,284 | 2,085 | 18.5 | % | ||||||||||
Net income | $ | 26,167 | $ | 22,273 | $ | 3,894 | 17.5 | % | |||||||
Return on equity | 16.2 | % | 21.6 | % | |||||||||||
Loss ratio | 53.0 | % | 56.8 | % | |||||||||||
Expense ratio | 21.3 | % | 3.8 | % | |||||||||||
Combined ratio | 74.3 | % | 60.6 | % | |||||||||||
(1) Underwriting income is a non-GAAP financial measure. See "—Reconciliation of Non-GAAP Financial Measures" for a reconciliation of net income to underwriting income in accordance with GAAP.
Our net income was $26.2 million for the year ended December 31, 2016 compared to $22.3 million for the year ended December 31, 2015, an increase of $3.9 million, or 17.5%. Our underwriting income increased by $5.0 million, or 17.2%, to $34.3 million for the year ended December 31, 2016 compared to $29.3 million for the year ended December 31, 2015. The increase in our underwriting income reflected an increase in number of policies written and higher favorable prior year loss development during 2016 compared to 2015.
Underwriting income excluding the effects of the MLQS, was $35.0 million for the year ended December 31, 2016 compared to $32.0 million for the year ended December 31, 2015, an increase of $3.0 million, or 9.3%. The corresponding adjusted combined ratio was 76.8% for the year ended December 31, 2016 compared to 77.5% for the year ended December 31, 2015. The decrease in the adjusted combined ratio was attributable to improvement in the adjusted loss ratio of 50.0% in 2016 compared to 51.5% in 2015, primarily from favorable prior year loss development. The adjusted expense ratio was 26.8% in 2016 compared to 26.0% in 2015, which reflected higher employee compensation and public company costs for 2016 compared to 2015.
52
Premiums
Gross written premiums were $188.5 million for the year ended December 31, 2016 compared to $177.0 million for the year ended December 31, 2015, an increase of $11.5 million, or 6.5%. Premium growth in 2016 was due to an increase in the number of policies written, offset in part by a decrease in the average premium per policy. The average premium on a policy written by us was $8,800 in 2016 compared to $10,400 in 2015. The changes in gross written premiums were most notable in the following lines of business:
• | Small business, which represented approximately 14.5% of our gross written premiums in 2016, increased by $5.9 million, or 27.3%, for the year ended December 31, 2016 over the prior year; |
• | Construction, which represented approximately 22.4% of our gross written premiums in 2016, increased by $5.3 million, or 14.4%, for the year ended December 31, 2016 over the prior year, and |
• | General casualty, which represented approximately 8.6% of our gross written premiums in 2016, decreased by $4.3 million, or 21.2%, for the year ended December 31, 2016 over the prior year. |
Net written premiums increased by $83.2 million, or 99.1%, to $167.3 million for the year ended December 31, 2016 from $84.0 million for the year ended December 31, 2015. This increase in net written premiums was primarily due to higher retention resulting from changes in the ceding percentages under the MLQS and higher gross written premiums in 2016. Effective January 1, 2016, the ceding percentage was 15%. As a result of the successful completion of our IPO in August 2016, we terminated and commuted the 2016 MLQS contract on October 1, 2016, which resulted in a net retention ratio of 88.7% for the year ending December 31, 2016. Effective January 1, 2015, the ceding percentage on the MLQS was 50%. On October 1, 2015, we decreased the ceding percentage on the MLQS to 40%, which resulted in a net retention ratio of 47.5% for the year ending December 31, 2015. Excluding the effects of the MLQS, our net retention ratio was 83.3% for the year ended December 31, 2016 compared to 83.6% for the year ended December 31, 2015.
Net earned premiums increased by $59.5 million, or 80.0%, to $133.8 million for the year ended December 31, 2016 from $74.3 million for the year ended December 31, 2015 due to changes in the ceding percentages under the MLQS and higher written premiums in 2016 compared to 2015. Excluding the effects of the MLQS, net earned premiums increased by $8.5 million, or 6.0%, to $150.8 million for the year ended December 31, 2016 from $142.3 million for the year ended December 31, 2015.
Loss ratio
Our loss ratio was 53.0% for the year ended December 31, 2016 compared to 56.8% for the year ended December 31, 2015. Our adjusted loss ratio was 50.0% for the year ended December 31, 2016 compared to 51.5% for the year ended December 31, 2015. The decrease in the loss ratio for 2016 was primarily due to higher favorable development across most of the statutory lines of business for the 2015 and 2014 accident years.
53
The following tables summarize the effect of the factors indicated above on the loss ratios and adjusted loss ratios for the years ended December 31, 2016 and 2015:
Year Ended December 31, | ||||||||||||||
2016 | 2015 | |||||||||||||
($ in thousands) | Losses and Loss Adjustment Expenses | % of Earned Premiums | Losses and Loss Adjustment Expenses | % of Earned Premiums | ||||||||||
Loss ratio: | ||||||||||||||
Current accident year | $ | 83,675 | 62.5 | % | $ | 51,434 | 69.2 | % | ||||||
Effect of prior year development | (12,714 | ) | (9.5 | )% | (9,196 | ) | (12.4 | )% | ||||||
$ | 70,961 | 53.0 | % | $ | 42,238 | 56.8 | % | |||||||
Year Ended December 31, | ||||||||||||||
2016 | 2015 | |||||||||||||
($ in thousands) | Losses and Loss Adjustment Expenses | % of Earned Premiums | Losses and Loss Adjustment Expenses | % of Earned Premiums | ||||||||||
Adjusted loss ratio: | ||||||||||||||
Current accident year | $ | 93,014 | 61.7 | % | $ | 88,229 | 62.0 | % | ||||||
Effect of prior year development | (17,673 | ) | (11.7 | )% | (15,013 | ) | (10.5 | )% | ||||||
$ | 75,341 | 50.0 | % | $ | 73,216 | 51.5 | % | |||||||
Expense ratio
Our expense ratio was 21.3% for the year ended December 31, 2016 compared to 3.8% for the year ended December 31, 2015. As a result of the MLQS, our expense ratio for the year ended December 31, 2015 was low due to the ceding commissions earned under the MLQS.
54
The following table summarizes the effect of the factors indicated above on the expense ratio for the years ended December 31, 2016 and 2015:
Year Ended December 31, | ||||||||||||||
2016 | 2015 | |||||||||||||
($ in thousands) | Underwriting Expenses | % of Earned Premiums | Underwriting Expenses | % of Earned Premiums | ||||||||||
Commissions incurred: | ||||||||||||||
Direct | $ | 26,715 | 20.0 | % | $ | 25,241 | 34.0 | % | ||||||
Ceding - MLQS | (11,936 | ) | (8.9 | )% | (34,254 | ) | (46.1 | )% | ||||||
Ceding - other | (8,632 | ) | (6.5 | )% | (7,827 | ) | (10.5 | )% | ||||||
Net commissions incurred | 6,147 | 4.6 | % | (16,840 | ) | (22.6 | )% | |||||||
Other underwriting expenses | 22,404 | 16.7 | % | 19,649 | 26.4 | % | ||||||||
Underwriting, acquisition, and insurance expenses | $ | 28,551 | 21.3 | % | $ | 2,809 | 3.8 | % | ||||||
The increase in the expense ratio in 2016 was due primarily to the change in the ceding percentage under the MLQS for the year ended December 31, 2016 compared to December 31, 2015. Other underwriting expenses were $22.4 million for the year ended December 31, 2016 compared to $19.6 million for the year ended December 31, 2015, an increase of $2.8 million, or 14.0%. This increase was primarily due to higher employee compensation and public company costs for 2016 compared to 2015. Direct commissions paid as a percent of gross written premiums was 14.8% for each of the years ended December 31, 2016 and 2015.
Excluding the effects of the MLQS, the adjusted expense ratio was 26.8% for the year ended December 31, 2016 compared to 26.0% for the year ended December 31, 2015.
Combined ratio
Our combined ratio was 74.3% for the year ended December 31, 2016 compared to 60.6% for the year ended December 31, 2015. Excluding the effects of the MLQS, the adjusted combined ratio was 76.8% for the year ended December 31, 2016 compared to 77.5% for the year ended December 31, 2015.
Investing results
Our net investment income increased by 32.7% to $7.5 million for the year ended December 31, 2016 from $5.6 million for the year ended December 31, 2015, primarily due to the increase in our investment portfolio from proceeds received from the IPO and additional premiums collected in 2016.
55
The following table summarizes the components of net investment income and net investment gains for the years ended December 31, 2016 and 2015:
Year Ended December 31, | ||||||||||||
($ in thousands) | 2016 | 2015 | Change | |||||||||
Interest from fixed-maturity securities | $ | 7,839 | $ | 6,023 | $ | 1,816 | ||||||
Dividends on equity securities | 442 | 372 | 70 | |||||||||
Other | 93 | 9 | 84 | |||||||||
Gross investment income | 8,374 | 6,404 | 1,970 | |||||||||
Investment expenses | (887 | ) | (761 | ) | (126 | ) | ||||||
Net investment income | 7,487 | 5,643 | 1,844 | |||||||||
Net capital gains | 452 | 59 | 393 | |||||||||
Other-than temporary losses | (276 | ) | — | (276 | ) | |||||||
Net investment gains | 176 | 59 | 117 | |||||||||
Total | $ | 7,663 | $ | 5,702 | $ | 1,961 | ||||||
The weighted average duration of our fixed income portfolio, including cash equivalents, was 3.7 years at December 31, 2016 and 3.2 years at December 31, 2015. Our investment portfolio had a gross return of 2.2% as of December 31, 2016, compared to 2.1% as of December 31, 2015.
We perform quarterly reviews of all securities within our investment portfolio to determine whether any other-than-temporary impairment has occurred. In connection with that review, we recognized an impairment loss of $0.3 million on our foreign market ETF for the year ended December 31, 2016. The impairment was based on our assessment of the security's prospect of recovery in the near term. Management concluded that none of the fixed maturity securities with an unrealized loss at December 31, 2016 experienced an other-than-temporary impairment.
Other expenses
Our other expenses increased by $0.6 million to $2.6 million for the year ended December 31, 2016 compared to $2.0 million for the year ended December 31, 2015 and the increase was due to costs related to our IPO and secondary offering.
Income tax expense
Our effective tax rate for the year ended December 31, 2016 was approximately 33.8% compared to 33.6% for the year ended December 31, 2015. Our effective tax rate differed from the statutory tax rate in 2016 and 2015 primarily as a result favorable tax treatment on certain municipal bond interest income and dividends received from our equity investments.
Return on equity
Our return on equity was 16.2% for the year ended December 31, 2016 compared to 21.6% for the year ended December 31, 2015 and reflects the increase in our stockholders' equity from the net proceeds received from the IPO during 2016.
56
Liquidity and Capital Resources
Sources and uses of funds
We are organized as a Delaware holding company with our operations primarily conducted by our wholly-owned insurance subsidiary, Kinsale Insurance, which is domiciled in Arkansas. Accordingly, Kinsale may receive cash through (1) loans from banks, (2) issuance of equity and debt securities, (3) corporate service fees from our insurance subsidiary, (4) payments from our subsidiaries pursuant to our consolidated tax allocation agreement and other transactions and (5) dividends from our insurance subsidiary. We may use the proceeds from these sources to contribute funds to Kinsale Insurance in order to support premium growth, reduce our reliance on reinsurance, pay dividends and taxes and for other business purposes.
We receive corporate service fees from Kinsale Insurance to reimburse us for most of the operating expenses that we incur. Reimbursement of expenses through corporate service fees is based on the actual costs that we expect to incur with no mark-up above our expected costs.
We file a consolidated federal income tax return with our subsidiaries, and under our corporate tax allocation agreement, each participant is charged or refunded taxes according to the amount that the participant would have paid or received had it filed on a separate return basis with the Internal Revenue Service.
State insurance laws restrict the ability of Kinsale Insurance to declare stockholder dividends without prior regulatory approval. State insurance regulators require insurance companies to maintain specified levels of statutory capital and surplus. The maximum dividend distribution Kinsale Insurance may make absent the approval or non-disapproval of the insurance regulatory authority in Arkansas is limited by Arkansas law to the greater of (1) 10% of policyholder surplus as of December 31 of the previous year, or (2) net income, not including realized capital gains, for the previous calendar year. The Arkansas statute also requires that dividends and other distributions be paid out of positive unassigned surplus without prior approval. The maximum amount of dividends Kinsale Insurance can pay us during 2018 without regulatory approval is $23.7 million. Insurance regulators have broad powers to ensure that statutory surplus remains at adequate levels, and there is no assurance that dividends of the maximum amount calculated under any applicable formula would be permitted. In the future, state insurance regulatory authorities that have jurisdiction over the payment of dividends by Kinsale Insurance may adopt statutory provisions more restrictive than those currently in effect. Kinsale Insurance paid $4.5 million of dividends to us during 2017. See also "Risk Factors — Risks Related to Our Business and Our Industry — Because we are a holding company and substantially all of our operations are conducted by our insurance subsidiary, our ability to pay dividends depends on our ability to obtain cash dividends or other permitted payments from our insurance subsidiary."
As of December 31, 2017, our holding company had $1.5 million in cash and investments, compared to $1.9 million as of December 31, 2016.
Management believes that the Company has sufficient liquidity available both in Kinsale and in its insurance subsidiary, Kinsale Insurance, as well as in its other operating subsidiaries, to meet its operating cash needs and obligations and committed capital expenditures for the next 12 months.
Cash flows
Our most significant source of cash is from premiums received from our insureds, which, for most policies, we receive at the beginning of the coverage period. Our most significant cash outflow is for claims that arise when a policyholder incurs an insured loss. Because the payment of claims occurs after the receipt of the premium, often years later, we invest the cash in various investment securities that earn interest and dividends. We also use cash to pay commissions to brokers, as well as to pay for ongoing operating expenses such as salaries, rent and taxes. As described under "—Reinsurance" below, we use reinsurance to manage the risk that we take on our policies. We
57
cede, or pay out, part of the premiums we receive to our reinsurers and collect cash back when losses subject to our reinsurance coverage are paid.
The timing of our cash flows from operating activities can vary among periods due to the timing by which payments are made or received. Some of our payments and receipts, including loss settlements and subsequent reinsurance receipts, can be significant, so their timing can influence cash flows from operating activities in any given period. Management believes that cash receipts from premiums, proceeds from investment sales and redemptions and investment income are sufficient to cover cash outflows in the foreseeable future.
Our cash flows for the years ended December 31, 2017, 2016 and 2015 were:
Year Ended December 31, | ||||||||||||
2017 | 2016 | 2015 | ||||||||||
(in thousands) | ||||||||||||
Cash and cash equivalents provided by (used in): | ||||||||||||
Operating activities | $ | 77,398 | $ | 73,741 | $ | 78,702 | ||||||
Investing activities | (42,432 | ) | (88,144 | ) | (80,047 | ) | ||||||
Financing activities | (3,971 | ) | 40,611 | 1,931 | ||||||||
Change in cash and cash equivalents | $ | 30,995 | $ | 26,208 | $ | 586 | ||||||
We have posted positive operating cash flow in each of the last three years. The fluctuation of cash provided by operating activities in 2017, 2016 and 2015 was due primarily to the timing of premium received, claim payments and reinsurance balances. Cash flows from operations in each of the past three years were used to fund investing activities and to pay dividends in 2017 and 2016.
Net cash used in investing activities decreased by $45.7 million in 2017 from 2016. Net cash used in investing activities during for the year ended December 31, 2017 reflected lower purchases of fixed maturity securities. During 2017, we were selective in our purchases of fixed income securities given current bond valuations, and held a significant portion of excess funds in cash equivalents. This was offset in part by higher purchases of equity securities during 2017, including $19.9 million of preferred stock. Net cash used by investing activities increased by $8.1 million in 2016 from 2015 primarily due to higher net purchases of fixed maturity investments of $6.0 million and equity securities of $2.1 million.
For the year ended December 31, 2017, net cash used in financing activities was $4.0 million and reflected dividends paid of $0.24 per common share, or $5.0 million in the aggregate. During 2017 we received proceeds of $1.1 million from the exercise of vested stock options. For the year ended December 31, 2016, net cash provided by financing activities was $40.6 million and included proceeds from the IPO of $72.8 million, of which $40 million was contributed to our insurance subsidiary, Kinsale Insurance, and $30 million was used to paydown our debt facility. In addition, we paid dividends of $0.10 per common share, or $2.1 million in the aggregate. For the year ended December 31, 2015, cash provided by financing activities included proceeds from the drawdown of our debt facility of $2.0 million.
Credit agreement
The Company had a loan and security agreement (the "Credit Agreement") with the PrivateBank and Trust Company ("PrivateBank") with a five-year secured term loan in the amount of $30.0 million. Pursuant to the terms of the Credit Agreement, the applicable interest rate on the term loan accrued daily at a rate equal to the 3-month LIBOR plus a margin, and was payable on the last day of each calendar quarter. The term loan had a maturity of December
58
4, 2020. Our wholly-owned subsidiaries, Kinsale Management and Aspera, were guarantors of the term loan. The assets of Kinsale Management and the stock of Kinsale Insurance were pledged as collateral to PrivateBank.
On December 8, 2016, we made a voluntary prepayment to PrivateBank of $27.7 million, the total amount outstanding under the Credit Agreement. As a result of the prepayment, the Credit Agreement, which would have otherwise terminated in December 2020, was terminated early in accordance with its terms.
There were no credit agreements outstanding at December 31, 2017.
Reinsurance
We enter into reinsurance contracts to limit our exposure to potential large losses as well as to provide additional capacity for growth. Our reinsurance is primarily contracted under quota-share reinsurance contracts and excess of loss contracts. In quota share reinsurance, the reinsurer agrees to assume a specified percentage of the ceding company's losses arising out of a defined class of business in exchange for a corresponding percentage of premiums, net of a ceding commission. In excess of loss reinsurance, the reinsurer agrees to assume all or a portion of the ceding company's losses, in excess of a specified amount. In excess of loss reinsurance, the premium payable to the reinsurer is negotiated by the parties based on their assessment of the amount of risk being ceded to the reinsurer because the reinsurer does not share proportionately in the ceding company's losses.
For the year ended December 31, 2017, property insurance represented 6.6% of our gross written premiums. When we do write property insurance, we buy reinsurance to significantly mitigate our risk. We use computer models to analyze the risk of severe losses from weather-related events and earthquakes. We measure exposure to these catastrophe losses in terms of PML, which is an estimate of what level of loss we would expect to experience in a windstorm or earthquake event occurring once in every 100 or 250 years. We manage this PML by purchasing catastrophe reinsurance coverage. Effective June 1, 2017, we purchased catastrophe reinsurance coverage of $45 million per event in excess of our $5 million per event retention.
Reinsurance contracts do not relieve us from our obligations to policyholders. Failure of the reinsurer to honor its obligations could result in losses to us, and therefore, we establish allowances for amounts considered uncollectible. At December 31, 2017, there was no allowance for uncollectible reinsurance. As of December 31, 2017, Kinsale Insurance has only contracted with reinsurers with A.M. Best financial strength ratings of "A" (Excellent) or better. At December 31, 2017, the net reinsurance receivable, defined as the sum of paid and unpaid reinsurance recoverables, ceded unearned premiums less reinsurance payables, from five reinsurers represented 92.4% of the total balance.
Ratings
Kinsale Insurance has a financial strength rating of "A-" (Excellent) from A.M. Best. A.M. Best assigns 16 ratings to insurance companies, which currently range from "A++" (Superior) to "F" (In Liquidation). "A-" (Excellent) is the fourth highest rating issued by A.M. Best. The "A-" (Excellent) rating is assigned to insurers that have, in A.M. Best's opinion, an excellent ability to meet their ongoing obligations to policyholders. This rating is intended to provide an independent opinion of an insurer's ability to meet its obligation to policyholders and is not an evaluation directed at investors. See also "Risk Factors — Risks Related to Our Business and Our Industry — A decline in our financial strength rating may adversely affect the amount of business we write."
The financial strength ratings assigned by A.M. Best have an impact on the ability of the insurance companies to attract and retain agents and brokers and on the risk profiles of the submissions for insurance that the insurance companies receive. The "A-" (Excellent) rating obtained by Kinsale Insurance is consistent with our business plan and allows us to actively pursue relationships with the agents and brokers identified in our marketing plan.
59
Contractual obligations and commitments
The following table illustrates our contractual obligations and commercial commitments by due date as of December 31, 2017:
Payments Due by Period | ||||||||||||||||||||
Total | Less Than One Year | One Year to Less Than Three Years | Three Years to Less Than Five Years | More Than Five Years | ||||||||||||||||
(in thousands) | ||||||||||||||||||||
Reserves for losses and loss adjustment expenses | $ | 315,717 | $ | 64,706 | $ | 108,534 | $ | 60,343 | $ | 82,134 | ||||||||||
Operating lease obligations | 1,304 | 529 | 775 | — | — | |||||||||||||||
Total | $ | 317,021 | $ | 65,235 | $ | 109,309 | $ | 60,343 | $ | 82,134 | ||||||||||
Reserves for losses and loss adjustment expenses represent our best estimate of the ultimate cost of settling reported and unreported claims and related expenses. As discussed previously, the estimation of loss and loss expense reserves is based on various complex and subjective judgments. Actual losses and settlement expenses paid may deviate, perhaps substantially, from the reserve estimates reflected in our financial statements. Similarly, the timing for payment of our estimated losses is not fixed and is not determinable on an individual or aggregate basis. The assumptions used in estimating the payments due by period are based on industry and peer-group claims payment experience. Due to the uncertainty inherent in the process of estimating the timing of such payments, there is a risk that the amounts paid in any period can be significantly different than the amounts disclosed above. Amounts disclosed above are gross of anticipated amounts recoverable from reinsurers. Reinsurance balances recoverable on reserves for losses and loss adjustment expenses are reported separately as assets, instead of being netted with the related liabilities, since reinsurance does not discharge us of our liability to policyholders. Reinsurance balances recoverable on reserves for paid and unpaid losses and loss adjustment expenses totaled $49.6 million at December 31, 2017 and $70.3 million at December 31, 2016. Effective January 1, 2017, the Company commuted the 2015 MLQS, which reduced reinsurance recoverables on unpaid losses by approximately $27.9 million.
Financial condition
Stockholders' equity
At December 31, 2017, total stockholders' equity was $238.2 million and tangible stockholders' equity was $235.4 million, compared to total stockholders' equity of $210.2 million and tangible stockholders' equity of $207.9 million at December 31, 2016. The increase in both total and tangible stockholders' equity was primarily due to net income earned for the year ended December 31, 2017 and the increase in unrealized gains related to available-for-sale securities, net of taxes. The increase was offset in part by dividends paid during the year. At December 31, 2015, our total stockholders' equity was $113.5 million and tangible stockholders' equity was $111.2 million. The increase in both total and tangible stockholders' equity at December 31, 2016 compared to December 31, 2015 was primarily due to the net proceeds we received from our IPO and from net income earned for the year ended December 31, 2016.
Tangible stockholders’ equity is a non-GAAP financial measure. We define tangible stockholders’ equity as stockholders’ equity less intangible assets, net of deferred taxes. Our definition of tangible stockholders’ equity may not be comparable to that of other companies, and it should not be viewed as a substitute for stockholders’ equity
60
calculated in accordance with GAAP. We use tangible stockholders' equity internally to evaluate the strength of our balance sheet and to compare returns relative to this measure.
Stockholders' equity at December 31, 2017, 2016 and 2015, reconciles to tangible stockholders' equity as follows:
December 31, | ||||||||||||
2017 | 2016 | 2015 | ||||||||||
| | (in thousands) | ||||||||||
Stockholders' equity | $ | 238,189 | $ | 210,214 | $ | 113,451 | ||||||
Less: Intangible assets, net of deferred taxes | 2,795 | 2,300 | 2,300 | |||||||||
Tangible stockholders' equity | $ | 235,394 | $ | 207,914 | $ | 111,151 | ||||||
Amendment of certificate of incorporation and reclassification of common stock
As of January 1, 2016, we were authorized to issue 18,333,333 shares of Common Stock, $0.0001 par value per share, of which 15,000,000 shares were designated as Class A Common Stock and 3,333,333 were designated as Class B Common Stock. On July 28, 2016, in connection with the IPO, we amended and restated our certificate of incorporation to recapitalize our authorized capital stock to consist of 400,000,000 shares of common stock, par value $0.01 per share, and 100,000,000 shares of preferred stock, par value $0.01 per share.
In addition, the amended and restated certificate of incorporation provided for automatic reclassification of our Class A Common Stock and Class B Common Stock into a single class of common stock. All shares of Class A Common Stock were reclassified into 14,682,671 shares of common stock, which were equal to the sum of:
• | the number of shares of common stock equal to the amount of accrued and unpaid dividends based on a reclassification date of July 28, 2016, or $90.3 million, divided by the IPO price of $16.00 per share, plus |
• | the number of shares of common stock equal to a conversion ratio of 0.65485975, calculated based on the IPO price of $16.00 per share. |
On July 28, 2016, we had outstanding grants of 1,783,858 restricted shares of Class B Common Stock. At that date, all restricted shares of Class B Common Stock were reclassified into 1,286,036 shares of common stock equal to a conversion ratio of 0.72095061. The conversion ratio was calculated based on the IPO price of $16.00 per share.
All fractional shares resulting from the reclassification of Class A Common Stock and Class B Common Stock into a single class of common stock were settled in cash.
Initial public offering and secondary offerings
On August 2, 2016, we completed our IPO of 7,590,000 shares of common stock at a price to the public of $16.00 per share. We issued 5,000,000 shares of common stock and the selling stockholders sold 2,590,000 shares of common stock, which included 990,000 shares sold to the underwriters pursuant to the underwriters’ option to purchase additional shares. After underwriting discounts and commissions and offering expenses, we received net proceeds from the offering of approximately $72.8 million. We did not receive any net proceeds from the sale of shares of common stock by the selling stockholders. The net proceeds from the shares were sold in the IPO are being used to make contributions to the capital of our insurance subsidiary and for other general corporate purposes.
On December 6, 2016, the Company completed a follow-on offering of 3,864,000 shares of common stock at a price of $27.50 per share, which included 504,000 shares sold to the underwriters pursuant to their over-allotment option. All of the shares in the offering were offered by the selling stockholders. The Company did not receive any proceeds from the offering.
61
On May 17, 2017, the Company completed a second follow-on offering of 4,557,774 shares of common stock at a price of $33.00 per share, which included 594,492 shares sold to the underwriters pursuant to their over-allotment option. All of the shares in the offering were offered by the selling stockholders. The Company did not receive any proceeds from the offering.
Equity-based compensation
On July 27, 2016, the Kinsale Capital Group, Inc. 2016 Omnibus Incentive Plan (the "2016 Incentive Plan"), became effective. The 2016 Incentive Plan provides for grants of stock options, stock appreciation rights, restricted stock, other stock-based awards and other cash-based awards to directors, officers and other employees, as well as independent contractors or consultants providing consulting or advisory services to the Company. The number of shares of common stock available for issuance under the 2016 Incentive Plan may not exceed 2,073,832. On July 27, 2016, the Board of Directors approved, and we granted, 1,036,916 stock options with an exercise price equal to the IPO price of $16.00 per share. The stock options have a maximum contractual term of 10 years, and will vest in 4 equal annual installments following the date of the grant.
On January 1, 2018, the Board of Directors granted 6,666 shares of restricted stock under the 2016 Incentive Plan to the Company’s directors. The restricted stock had a fair value on the date of grant of $45.00 per share and will vest over a 1 year period.
Dividend declarations
On February 1, 2017, the Company’s Board of Directors declared a cash dividend of $0.06 per share of common stock. This dividend was paid on March 15, 2017 to all stockholders of record on February 15, 2017.
On May 25, 2017, the Company’s Board of Directors declared a cash dividend of $0.06 per share of common stock. This dividend was paid on June 15, 2017 to all stockholders of record on June 5, 2017.
On August 10, 2017, the Company’s Board of Directors declared a cash dividend of $0.06 per share of common stock. This dividend was paid on September 15, 2017 to all stockholders of record on August 31, 2017.
On November 8, 2017, the Company’s Board of Directors declared a cash dividend of $0.06 per share of common stock. This dividend was paid on December 15, 2017 to all stockholders of record on November 30, 2017.
On February 12, 2018, the Company’s Board of Directors declared a cash dividend of $0.07 per share of common stock. This dividend is payable on March 15, 2018 to all stockholders of record on February 28, 2018.
Investment portfolio
Our cash and invested assets consist of fixed maturity securities, cash and cash equivalents, equity securities and short-term investments. At December 31, 2017, $81.7 million represented the cash and cash equivalents portion of our total cash and invested assets of $561.1 million. The majority of the portfolio, or $425.2 million, was comprised of fixed maturity securities that are classified as available-for-sale and carried at fair value with unrealized gains and losses on these securities, net of applicable taxes, reported as a separate component of accumulated other comprehensive income. Also included in our investments were $54.1 million of equity securities classified as available-for-sale. Our fixed maturity securities, including cash equivalents, had a weighted average duration of 3.9 years and an average rating of "AA" at December 31, 2017. Our investment portfolio had a gross return of 2.4% as of December 31, 2017, compared to 2.2% as of December 31, 2016.
62
At December 31, 2017, the amortized cost and fair value on available-for-sale securities were as follows:
December 31, 2017 | |||||||||||
Amortized Cost | Estimated Fair Value | % of Total Fair Value | |||||||||
($ in thousands) | |||||||||||
Fixed maturities: | |||||||||||
U.S. Treasury securities and obligations of U.S. government agencies | $ | 9,108 | $ | 9,098 | 1.9 | % | |||||
Obligations of states, municipalities and political subdivisions | 161,012 | 164,326 | 34.3 | % | |||||||
Corporate and other securities | 71,224 | 71,631 | 14.9 | % | |||||||
Asset-backed securities | 95,223 | 95,360 | 19.9 | % | |||||||
Residential mortgage-backed securities | 85,688 | 84,776 | 17.7 | % | |||||||
Total fixed maturities | 422,255 | 425,191 | 88.7 | % | |||||||
Equity securities: | |||||||||||
Exchange traded funds | 26,041 | 34,380 | 7.2 | % | |||||||
Nonredeemable preferred stock | 19,875 | 19,752 | 4.1 | % | |||||||
Total equity securities | 45,916 | 54,132 | 11.3 | % | |||||||
Total investments available for sale | $ | 468,171 | $ | 479,323 | 100.0 | % | |||||
The table below summarizes the credit quality of our fixed-maturity securities as of December 31, 2017, as rated by Standard & Poor’s Financial Services, LLC ("Standard & Poor's"):
December 31, 2017 | |||||||
Standard & Poor’s or Equivalent Designation | Estimated Fair Value | % of Total | |||||
| | ($ in thousands) | |||||
AAA | $ | 85,199 | 20.0 | % | |||
AA | 190,044 | 44.7 | % | ||||
A | 112,129 | 26.4 | % | ||||
BBB | 28,715 | 6.8 | % | ||||
Below BBB | 9,104 | 2.1 | % | ||||
Total | $ | 425,191 | 100.0 | % | |||
63
The amortized cost and fair value of our available-for-sale investments in fixed maturity securities summarized by contractual maturity as of December 31, 2017, were as follows:
December 31, 2017 | |||||||||||
Amortized Cost | Estimated Fair Value | % of Fair Value | |||||||||
($ in thousands) | |||||||||||
Due in one year or less | $ | 50,020 | $ | 49,973 | 11.8 | % | |||||
Due after one year through five years | 28,979 | 29,299 | 6.9 | % | |||||||
Due after five years through ten years | 28,733 | 29,800 | 7.0 | % | |||||||
Due after ten years | 133,612 | 135,983 | 32.0 | % | |||||||
Asset-backed securities | 95,223 | 95,360 | 22.4 | % | |||||||
Residential mortgage-backed securities | 85,688 | 84,776 | 19.9 | % | |||||||
Total fixed maturities | $ | 422,255 | $ | 425,191 | 100.0 | % | |||||
Expected maturities may differ from contractual maturities because borrowers may have the right to call or prepay obligations with or without call or prepayment penalties, and the lenders may have the right to put the securities back to the borrower.
Restricted investments
In order to conduct business in certain states, we are required to maintain letters of credit or assets on deposit to support state-mandated insurance regulatory requirements and to comply with certain third-party agreements. Assets held on deposit or in trust accounts are primarily in the form of cash or certain high-grade securities. The fair value of our restricted assets was $7.1 million at December 31, 2017 compared to $7.0 million at December 31, 2016.
Off-balance sheet arrangements
We do not have any material off-balance sheet arrangements as of December 31, 2017.
64
Reconciliation of Non-GAAP Financial Measures
Reconciliation of underwriting income
Underwriting income is a non-GAAP financial measure that we believe is useful in evaluating our underwriting performance without regard to investment income. Underwriting income represents the pre-tax profitability of our insurance operations and is derived by subtracting losses and loss adjustment expenses and underwriting, acquisition and insurance expenses from net earned premiums. We use underwriting income as an internal performance measure in the management of our operations because we believe it gives us and users of our financial information useful insight into our results of operations and our underlying business performance. Underwriting income should not be viewed as a substitute for net income calculated in accordance with GAAP, and other companies may define underwriting income differently.
Net income for the years ended December 31, 2017, 2016 and 2015, reconciles to underwriting income as follows:
Year Ended December 31, | ||||||||||||
($ in thousands) | 2017 | 2016 | 2015 | |||||||||
Net income | $ | 24,901 | $ | 26,167 | $ | 22,273 | ||||||
Income tax expense | 13,620 | 13,369 | 11,284 | |||||||||
Income before taxes | 38,521 | 39,536 | 33,557 | |||||||||
Other expenses | 429 | 2,567 | 1,992 | |||||||||
Net investment income | (10,569 | ) | (7,487 | ) | (5,643 | ) | ||||||
Net investment gains | (151 | ) | (176 | ) | (59 | ) | ||||||
Other income | (3 | ) | (136 | ) | (572 | ) | ||||||
Underwriting income | $ | 28,227 | $ | 34,304 | $ | 29,275 | ||||||
Critical Accounting Estimates
We identified the accounting estimates which are critical to the understanding of our financial position and results of operations. Critical accounting estimates are defined as those estimates that are both important to the portrayal of our financial condition and results of operations and require us to exercise significant judgment. We use significant judgment concerning future results and developments in applying these critical accounting estimates and in preparing our consolidated financial statements. These judgments and estimates affect our reported amounts of assets, liabilities, revenues and expenses and the disclosure of our material contingent assets and liabilities. Actual results may differ materially from the estimates and assumptions used in preparing the consolidated financial statements. We evaluate our estimates regularly using information that we believe to be relevant. For a detailed discussion of our accounting policies, see the "Notes to Consolidated Financial Statements" included in this Annual Report on Form 10-K.
Reserves for unpaid losses and loss adjustment expenses
The reserves for unpaid losses and loss adjustment expenses are the largest and most complex estimate in our consolidated balance sheet. The reserves for unpaid losses and loss adjustment expenses represent our estimated ultimate cost of all unreported and reported but unpaid insured claims and the cost to adjust these losses that have occurred as of or before the balance sheet date. As a relatively new company, our historical loss experience is limited. We estimate the reserves using individual case-basis valuations of reported claims and statistical analyses. Those estimates are based on our historical information, industry information and our estimates of future trends in variable factors such as loss severity, loss frequency and other factors such as inflation. We regularly review our estimates and adjust them as necessary as
65
experience develops or as new information becomes known to us. Such adjustments are included in current operations. Additionally, during the loss settlement period, it often becomes necessary to refine and adjust the estimates of liability on a claim either upward or downward. Even after such adjustments, ultimate liability may exceed or be less than the revised estimates. Accordingly, the ultimate settlement of losses and the related loss adjustment expenses may vary significantly from the estimate included in our consolidated financial statements.
We categorize our reserves for unpaid losses and loss adjustment expenses into two types: case reserves and reserves for incurred but not yet reported losses ("IBNR"). Our gross reserves for losses and loss adjustment expenses at December 31, 2017 were $315.7 million, and of this amount, 81.2% related to IBNR. Our net reserves for losses and loss adjustment expenses at December 31, 2017 were $267.5 million, and of this amount, 81.1% related to IBNR. A 5% change in net IBNR reserves at December 31, 2017 would equate to an $10.8 million change in the reserve for losses and loss adjustment expenses at such date, as well as $7.0 million change in net income, a 3.0% change in stockholders' equity and a 3.0% change in tangible equity, in each case at or for the year ended December 31, 2017.
The following tables summarize our gross and net reserves for unpaid losses and loss adjustment expenses at December 31, 2017 and 2016:
December 31, 2017 | ||||||||||||||
Gross | % of Total | Net | % of Total | |||||||||||
($ in thousands) | ||||||||||||||
Case reserves | $ | 59,246 | 18.8 | % | $ | 50,664 | 18.9 | % | ||||||
IBNR | 256,471 | 81.2 | 216,827 | 81.1 | ||||||||||
Total | $ | 315,717 | 100.0 | % | $ | 267,491 | 100.0 | % | ||||||
December 31, 2016 | ||||||||||||||
Gross | % of Total | Net | % of Total | |||||||||||
($ in thousands) | ||||||||||||||
Case reserves | $ | 48,826 | 18.4 | % | $ | 35,751 | 18.4 | % | ||||||
IBNR | 215,975 | 81.6 | 158,851 | 81.6 | ||||||||||
Total | $ | 264,801 | 100.0 | % | $ | 194,602 | 100.0 | % | ||||||
Case reserves are established for individual claims that have been reported to us. We are notified of losses by our insureds or their brokers. Based on the information provided, we establish case reserves by estimating the ultimate losses from the claim, including defense costs associated with the ultimate settlement of the claim. Our claims department personnel use their knowledge of the specific claim along with advice from internal and external experts, including underwriters and legal counsel, to estimate the expected ultimate losses.
IBNR reserves are determined using actuarial methods to estimate losses that have occurred but have not yet been reported to us. We principally use the incurred Bornhuetter-Ferguson actuarial method ("BF method") to arrive at our loss reserve estimates for each line of business. This method estimates the reserves based on our initial expected loss ratio and expected reporting patterns for losses. Because we have a limited number of years of loss experience compared to the period over which we expect losses to be reported, we use industry and peer-group data, in addition to our own data, as a basis for selecting our expected reporting patterns. Since the incurred BF method does not directly use reported losses in the estimation of IBNR, it is less sensitive to our level of reported losses than other actuarial methods. This method avoids some of the distortions that could result from a large loss development factor being applied to a small base of reported losses to calculate ultimate losses. However, this method will react more slowly than some other loss development methods if reported loss experience deviates significantly from our expected losses.
Our Reserve Committee consists of our Chief Actuary, Chief Executive Officer, Chief Operating Officer and Chief Financial Officer. The Reserve Committee meets quarterly to review the actuarial recommendations made by the Chief Actuary. In establishing the actuarial recommendation for the reserves for losses and loss adjustment expenses, our actuary estimates an initial expected ultimate loss ratio for our statutory lines of business by accident year. Input from our
66
underwriting and claims departments, including premium pricing assumptions and historical experience, is considered by our actuary in estimating the initial expected loss ratios. Our reserving methodology uses a loss reserving model that calculates a point estimate for our ultimate losses. Although we believe that our assumptions and methodology are reasonable, our ultimate payments may vary, potentially materially, from the estimates we have made.
In addition, we retain an independent external actuary annually to assist us in determining if the reserve levels are reasonable. The independent actuary is not involved in the establishment and recording of our loss reserve. The actuarial consulting firm prepares its own estimate of our reserves for loss and loss adjustment expenses, and we compare their estimate to the reserves for losses and loss adjustment expenses reviewed and approved by the Reserve Committee in order to gain additional comfort on the adequacy of those reserves.
The table below quantifies the impact of potential reserve deviations from our carried reserve at December 31, 2017. We applied sensitivity factors to incurred losses for the three most recent accident years and to the carried reserve for all prior accident years combined. We believe that potential changes such as these would not have a material impact on our liquidity.
December 31, 2017 | Potential Impact on 2017 | ||||||||||||||||||||
Sensitivity | Accident Year | Net Ultimate Loss and LAE Sensitivity Factor | Net Ultimate Incurred Losses and LAE | Net Loss and LAE Reserve | Pre-tax income | Stockholders' Equity | |||||||||||||||
($ in thousands) | |||||||||||||||||||||
Sample increases | 2017 | 10.0 | % | $ | 114,960 | $ | 101,168 | $ | (11,496 | ) | $ | (7,472 | ) | ||||||||
2016 | 5.0 | % | 74,246 | 68,697 | (3,712 | ) | (2,413 | ) | |||||||||||||
2015 | 2.5 | % | 41,142 | 48,754 | (1,029 | ) | (669 | ) | |||||||||||||
Prior | 2.5 | % | 48,873 | (1,222 | ) | (794 | ) | ||||||||||||||
Sample decreases | 2017 | (10.0 | )% | 114,960 | 101,168 | 11,496 | 7,472 | ||||||||||||||
2016 | (5.0 | )% | 74,246 | 68,697 | 3,712 | 2,413 | |||||||||||||||
2015 | (2.5 | )% | 41,142 | 48,754 | 1,029 | 669 | |||||||||||||||
Prior | (2.5 | )% | 48,873 | 1,222 | 794 | ||||||||||||||||
Reserve development
The amount by which estimated losses differ from those originally reported for a period is known as "development." Development is unfavorable when the losses ultimately settle for more than the amount reserved or subsequent estimates indicate a basis for reserve increases on unresolved claims. Development is favorable when losses ultimately settle for less than the amount reserved or subsequent estimates indicate a basis for reducing loss reserves on unresolved claims. We reflect favorable or unfavorable development of loss reserves in the results of operations in the period the estimates are changed.
During the year ended December 31, 2017, our net incurred losses for accident years 2016 and prior developed favorably by $11.3 million. This favorable development included $9.4 million for the 2016 accident year, $4.2 million for the 2015 accident year and $1.8 million for accident year 2014. This favorable development was primarily due to reported losses emerging at a lower level than expected, across most lines of business. The favorable development was offset in part by adverse development of $2.1 million for the 2013 accident year, $1.3 million for the 2012 accident year and $0.7 million for the 2011 accident year. The unfavorable development was primarily attributable to claims on the other liability occurrence line of business.
During the year ended December 31, 2016, our net incurred losses for accident years 2015 and prior developed favorably by $12.7 million. This favorable development included $6.1 million for the 2015 accident year and $6.6 million of favorable development for accident years 2014 and prior. The favorable development was primarily due to reported losses emerging at a lower level than expected, across most lines of business.
67
During the year ended December 31, 2015, our net incurred losses for accident years 2014 and prior developed favorably by $9.2 million. This favorable development included $6.5 million for the 2014 accident year and $2.7 million of favorable development for accident years 2013 and prior. The favorable development was primarily due to reported losses emerging at a lower level than expected, particularly on the medical malpractice and professional liability lines of business.
Investments
Fair value measurements
Our investments in fixed maturities and equity securities are classified as available-for-sale and are reported at fair value. Under current accounting guidance, changes in the fair value of investments classified as available-for-sale are not recognized as income during the period, but rather are recognized as a separate component of stockholders’ equity until realized. Like other accounting estimates, fair value measurements may be based on subjective information and generally involve uncertainty and judgment. Fair value is defined as the price that would be received to sell an asset or paid to transfer a liability in an orderly transaction between market participants at the measurement date. Market participants are assumed to be independent, knowledgeable, able and willing to transact an exchange and not acting under duress. Fair value hierarchy disclosures are based on the quality of inputs used to measure fair value. The hierarchy gives the highest priority to unadjusted quoted prices in active markets for identical assets or liabilities (Level 1 measurements) and the lowest priority to unobservable inputs (Level 3 measurements). Adjustments to transaction prices or quoted market prices may be required in illiquid or disorderly markets in order to estimate fair value. The three levels of the fair value hierarchy are described below:
Level 1 - Inputs to the valuation methodology are quoted prices (unadjusted) for identical assets or liabilities traded in active markets.
Level 2 - Inputs to the valuation methodology include quoted prices for similar assets or liabilities in active markets, quoted prices for identical or similar assets or liabilities in markets that are not active, inputs other than quoted prices that are observable for the asset or liability and market-corroborated inputs.
Level 3 - Inputs to the valuation methodology are unobservable for the asset or liability and are significant to the fair value measurement.
When the inputs used to measure fair value fall within different levels of the hierarchy, the level within which the fair value measurement is categorized is based on the lowest level input that is significant to the fair value measurement in its entirety. Thus, a Level 3 fair value measurement may include inputs that are observable (Level 1 and 2) and unobservable (Level 3). The use of valuation methodologies may require a significant amount of judgment. During periods of financial market disruption, including periods of rapidly widening credit spreads or illiquidity, it may be difficult to value certain of our securities if trading becomes less frequent or market data becomes less observable. We review the fair value hierarchy classifications on a quarterly basis. Changes in the observability of valuation inputs may result in a reclassification for certain financial assets and liabilities.
Fair values of our investment portfolio are estimated using unadjusted prices obtained by our investment manager from nationally recognized third-party pricing services, where available. For securities where we are unable to obtain fair values from a pricing service or broker, fair values are estimated using information obtained from our investment manager. We perform several procedures to ascertain the reasonableness of investment values included in the consolidated financial statements at December 31, 2017, including (1) obtaining and reviewing the internal control report from our investment manager that obtain fair values from third party pricing services, (2) discussing with our investment manager their process for reviewing and validating pricing obtained from outside pricing services and (3) reviewing the security pricing received from our investment manager and monitoring changes in unrealized gains and losses at the individual security level.
Investment securities are subject to fluctuations in fair value due to changes in issuer-specific circumstances, such as credit rating, and changes in industry-specific circumstances, such as movements in credit spreads based on the market’s perception of industry risks. In addition, fixed maturities are subject to fluctuations in fair value due to changes in interest rates. As a result of these potential fluctuations, it is possible to have significant unrealized gains or losses on a security.
68
Impairment
We review all securities with unrealized losses on a quarterly basis to assess whether the decline in the securities’ fair value is deemed to be other-than-temporary. The determination that an investment has incurred an other-than-temporary loss in value requires judgment, and we consider a number factors in completing our impairment review, including the length of time and the extent to which fair value has been below cost and the financial condition and near-term prospects of the issuer. For fixed maturities, we consider whether we intend to sell the security, or if it is more likely than not that we will be required to sell the security before recovery, or have the ability to recover all amounts outstanding when contractually due. For equity securities, we evaluate the near-term prospects of these investments in relation to the severity and duration of the impairment and, we consider our ability and intent to hold the security for a period of time sufficient to allow for anticipated recovery.
For fixed maturities where we intend to sell the security or it is more likely than not that we will be required to sell the security before recovery of its amortized cost, a decline in fair value is considered to be other-than-temporary and is recognized in net loss based on the fair value of the security at the time of assessment, resulting in a new cost basis for the security. If the decline in fair value of a fixed maturity security below its amortized cost is considered to be other-than-temporary based upon other considerations, we compare the estimated present value of the cash flows expected to be collected to the amortized cost of the security. The extent to which the estimated present value of the cash flows expected to be collected is less than the amortized cost of the security represents the credit-related portion of the other-than-temporary impairment and is recognized in net loss, resulting in a new cost basis for the security. Any remaining decline in fair value represents the noncredit portion of the other-than-temporary impairment and is recognized in other comprehensive loss. For equity securities, a decline in fair value that is considered to be other-than-temporary is recognized in net loss based on the fair value of the security at the time of assessment, resulting in a new cost basis for the security.
When assessing whether we intend to sell a fixed maturity security, or if it is more likely than not that we will be required to sell a fixed maturity security before recovery of its amortized cost, we evaluate facts and circumstances including, but not limited to, decisions to reposition the investment portfolio and potential sales of investments to meet cash flow needs. The day-to-day management of our investment portfolio is outsourced to a third-party investment manager. For securities with unrealized losses, our investment manager may believe that the preferred course of action is to hold those securities until such losses are recovered. However, the dynamic nature of the portfolio management may result in a subsequent decision to sell the security and realize the loss based upon a change in the market and other factors described above. Our investment manager notifies us of rating agency downgrades of securities in their portfolios as well as any potential investment valuation issues at the end of each quarter. Our investment manager is also required to notify us of, and receive approval for, any other-than-temporary impairments it has identified. For the year ended December 31, 2017, there were no other-than-temporary impairments recognized. For the year ended December 31, 2016, we recorded an other-than-temporary impairment of $0.3 million related to our foreign market ETF. See Note 2 of the notes to the consolidated financial statements for further discussion regarding our investments.
Deferred income taxes
We record deferred income taxes as assets or liabilities on our balance sheet to reflect the net tax effect of the temporary differences between the carrying amount of assets and liabilities for financial reporting purposes and their respective tax bases. Deferred tax assets and liabilities are measured by applying enacted tax rates in effect for the years in which such differences are expected to reverse. Our deferred tax assets result from temporary differences primarily attributable to loss reserves and unearned premium reserves. Our deferred tax liabilities result primarily from unrealized gains in the investment portfolio and deferred acquisition costs. We review the need for a valuation allowance related to our deferred tax assets each quarter. We reduce our deferred tax assets by a valuation allowance when we determine that it is more likely than not that some portion or all of the deferred tax assets will not be realized. The assessment of whether or not a valuation allowance is needed requires us to use significant judgment. See Note 6 of the notes to the consolidated financial statements for further discussion regarding our deferred tax assets and liabilities.
On December 22, 2017, the President of the United States signed into law the TCJA. The legislation significantly changes U.S. tax law by, among other things, lowering corporate income tax rates from 35% to 21%, effective January 1, 2018. U.S. GAAP requires companies to recognize the effect of tax law changes in the period of enactment. The SEC staff
69
issued Staff Accounting Bulletin No. 118 (“SAB 118”) to address the application of U.S. GAAP in situations when a registrant does not have the necessary information available, prepared, or analyzed (including computations) in reasonable detail to complete the accounting for certain income tax effects of the TCJA. The TCJA did not specify the application of certain elements of the legislation and the U.S. Treasury has yet to issue interpretive guidance to specify the loss payment patterns and the corporate bond yield curve under the new law for 2018. The Company has recognized the provisional tax impacts of $3.5 million related to the transition adjustment for loss discounting which has been included in its components of deferred tax assets and liabilities as part of its consolidated financial statements for the year ended December 31, 2017. The ultimate impact may differ from these provisional amounts due to, among other things, additional analysis, changes in interpretations and assumptions the Company has made, additional regulatory guidance that may be issued, and actions the Company may take as a result of the TCJA. The accounting is expected to be complete when the U.S. Treasury issues further guidance.
Reinsurance
We enter into reinsurance contracts to limit our exposure to potential large losses and to provide additional capacity for growth. Reinsurance refers to an arrangement in which a company called a reinsurer agrees in a contract (often referred to as a treaty) to assume specified risks written by an insurance company (known as a ceding company) by paying the insurance company all or a portion of the insurance company's losses arising under specified classes of insurance policies in return for a share in premiums.
Reinsurance recoverables recorded on insurance losses ceded under reinsurance contracts are subject to judgments and uncertainties similar to those involved in estimating gross loss reserves. In addition to these uncertainties, our reinsurance recoverables may prove uncollectible if the reinsurers are unable or unwilling to perform under the reinsurance contracts. In establishing our reinsurance allowance for amounts deemed uncollectible, we evaluate the financial condition of our reinsurers and monitor concentration of credit risk arising from our exposure to individual reinsurers. To determine if an allowance is necessary, we consider, among other factors, published financial information, reports from rating agencies, payment history, collateral held and our legal right to offset balances recoverable against balances we may owe. Our reinsurance allowance for doubtful accounts is subject to uncertainty and volatility due to the time lag involved in collecting amounts recoverable from reinsurers. Over the period of time that losses occur, reinsurers are billed and amounts are ultimately collected, economic conditions, as well as the operational and financial performance of particular reinsurers may change and these changes may affect the reinsurers’ willingness and ability to meet their contractual obligations to us. It is difficult to fully evaluate the impact of major catastrophic events on the financial stability of reinsurers, as well as the access to capital that reinsurers may have when such events occur. The ceding of insurance does not legally discharge us from our primary liability for the full amount of the policies, and we will be required to pay the loss and bear the collection risk if any reinsurer fails to meet its obligations under the reinsurance contracts. We target reinsurers with A.M. Best financial strength ratings of "A" (Excellent) or better. Based on our evaluation of the factors discussed above, we believe all of our recoverables are collectible and, therefore, no allowance for uncollectible reinsurance was provided for at December 31, 2017.
70
Recent Accounting Pronouncements
ASU 2016-01, Financial Instruments - Overall: Recognition and Measurement of Financial Assets and Financial Liabilities
In January 2016, FASB issued ASU 2016-01, "Financial Instruments – Overall: Recognition and Measurement of Financial Assets and Financial Liabilities," which requires equity investments to be measured at fair value with changes in fair value recognized in net income, requires public business entities to use the exit price notion when measuring the fair value of financial instruments for disclosure purposes, requires separate presentation of financial assets and financial liabilities by measurement category and form of financial asset, and eliminates the requirement for public business entities to disclose the method(s) and significant assumptions used to estimate the fair value that is required to be disclosed for financial instruments measured at amortized cost. The amendments in this ASU are effective for public companies for annual reporting periods beginning after December 15, 2017, including interim periods within those fiscal years. Upon adoption, a cumulative-effect adjustment to the balance sheet will be made as of the beginning of the fiscal year of adoption. For the year ended December 31, 2017, accumulated other comprehensive income included $6.5 million of net unrealized gains on equity securities, net of taxes. Adoption of this ASU is not expected to have a material impact on our financial position or cash flows, but may have a material impact on our results of operations in the future as changes in the fair value of equity instruments will be presented in net income rather than other comprehensive income.
ASU 2016-02, Leases (Topic 842)
In February 2016, the FASB issued ASU 2016-02, "Leases (Topic 842)" to improve the financial reporting of leasing transactions. Under this ASU, lessees will recognize a right-of-use asset and corresponding liability on the balance sheet for all leases, except for leases covering a period of fewer than 12 months. The liability is to be measured as the present value of the future minimum lease payments taking into account renewal options if applicable plus initial incremental direct costs such as commissions. The minimum payments are discounted using the rate implicit in the lease or, if not known, the lessee’s incremental borrowing rate. The lessee’s income statement treatment for leases will vary depending on the nature of what is being leased. A financing type lease is present when, among other matters, the asset is being leased for a substantial portion of its economic life or has an end-of-term title transfer or a bargain purchase option as in today’s practice. The payment of the liability set up for such leases will be apportioned between interest and principal; the right-of use asset will be generally amortized on a straight-line basis. If the lease does not qualify as a financing type lease, it will be accounted for on the income statement as rent on a straight-line basis. This ASU is effective for annual and interim reporting periods beginning after December 15, 2018. Early adoption is permitted. We are currently evaluating the impact of the adoption on our consolidated financial statements.
ASU 2016-13, Financial Instruments – Credit Losses (Topic 326)
On June 16, 2016, the FASB issued ASU 2016-13, "Financial Instruments – Credit Losses (Topic 326)" to provide more useful information about the expected credit losses on financial instruments. Current GAAP delays the recognition of credit losses until it is probable a loss has been incurred. The update will require a financial asset measured at amortized cost to be presented at the net amount expected to be collected by means of an allowance for credit losses that runs through net income. Credit losses relating to available-for-sale debt securities will also be recorded through an allowance for credit losses. However, the amendments would limit the amount of the allowance to the amount by which fair value is below amortized cost. The measurement of credit losses on available-for-sale securities is similar under current GAAP, but the update requires the use of the allowance account through which amounts can be reversed, rather than through an irreversible write-down.
This ASU is effective for annual and interim reporting periods beginning after December 15, 2019. Early adoption is permitted beginning after December 15, 2018. Upon adoption, the update will be applied using the modified-
71
retrospective approach, by which a cumulative-effect adjustment will be made to retained earnings as of the beginning of the first reporting period presented. We are currently evaluating the impact of the adoption on our consolidated financial statements.
ASU 2017-08, Premium Amortization on Purchased Callable Debt Securities
On March 30, 2017, the FASB issued ASU 2017-08, "Premium Amortization on Purchased Callable Debt Securities," which shortens the amortization period of the premium for certain callable debt securities, from the contractual maturity date to the earliest call date. This ASU is effective in fiscal years beginning after December 15, 2018, including interim periods within those fiscal years. Early adoption is permitted, including in an interim period. Upon adoption, the update will be applied on a modified retrospective basis, with a cumulative-effect adjustment to retained earnings as of the beginning of the first reporting period presented. We are currently evaluating the impact of the adoption on our consolidated financial statements.
To our knowledge, there are no other prospective accounting standards which, upon their effective date, would have a material impact on our consolidated financial statements.
72
Item 7A. Quantitative and Qualitative Disclosures About Market Risk
Market risk is the risk of economic losses due to adverse changes in the estimated fair value of a financial instrument as the result of changes in interest rates, equity prices, foreign currency exchange rates and commodity prices. The primary components of market risk affecting us are credit risk, interest rate risk, and equity rate risk. We do not have significant exposure to foreign currency exchange rate risk or commodity risk.
Credit risk
Credit risk is the potential loss resulting from adverse changes in an issuer's ability to repay its debt obligations. We have exposure to credit risk as a holder of fixed maturity investments. Our risk management strategy and investment policy is to primarily invest in debt instruments of high credit quality issuers and to limit the amount of credit exposure with respect to particular ratings categories and any one issuer. At December 31, 2017, our fixed maturity portfolio had an average rating of "AA," with approximately 91.1% of securities in that portfolio rated "A-" or better by at least one nationally recognized rating organization. Our policy is to invest in investment grade securities and to minimize investments in fixed maturities that are unrated or rated below investment grade. At December 31, 2017, approximately 2.1% of our fixed maturity portfolio was unrated or rated below investment grade. We monitor the financial condition of all of the issuers of fixed maturity securities in our portfolio.
In addition, we are subject to credit risk with respect to our third-party reinsurers. Although our third-party reinsurers are obligated to reimburse us to the extent we cede risk to them, we are ultimately liable to our policyholders on all risks we have ceded. As a result, reinsurance contracts do not limit our ultimate obligations to pay claims covered under the insurance policies we issue and we might not collect amounts recoverable from our reinsurers. We address this credit risk by selecting reinsurers that have an A.M. Best rating of "A" (Excellent) or better at the time we enter into the agreement and by performing, along with our reinsurance broker, periodic credit reviews of our reinsurers. If one of our reinsurers suffers a credit downgrade, we may consider various options to lessen the risk of asset impairment, including commutation, novation and letters of credit.
Interest rate risk
Interest rate risk is the risk that we will incur economic losses due to adverse changes in interest rates. The primary market risk to the investment portfolio is interest rate risk associated with investments in fixed maturity securities. Fluctuations in interest rates have a direct effect on the market valuation of these securities. When market interest rates rise, the fair value of our fixed maturity securities decreases. Conversely, as interest rates fall, the fair value of our fixed maturity securities increases. We manage this interest rate risk by investing in securities with varied maturity dates and by managing the duration of our investment portfolio to the duration of our reserves. Expressed in years, duration is the weighted average payment period of cash flows, where the weighting is based on the present value of the cash flows. We set duration targets for our fixed income investment portfolios after consideration of the estimated duration of our liabilities and other factors. The effective weighted average duration of the portfolio, including cash equivalents, was 3.9 years as of December 31, 2017.
73
We had fixed maturity securities with a fair value of $425.2 million at December 31, 2017 and $411.2 million at December 31, 2016 that were subject to interest rate risk. The table below illustrates the sensitivity of the fair value of our fixed maturity securities to selected hypothetical changes in interest rates as of December 31, 2017 and 2016.
December 31, 2017 | December 31, 2016 | |||||||||||||||||||||
Estimated Fair Value | Estimated Change in Fair Value | Estimated % Increase (Decrease) in Fair Value | Estimated Fair Value | Estimated Change in Fair Value | Estimated % Increase (Decrease) in Fair Value | |||||||||||||||||
($ in thousands) | ||||||||||||||||||||||
200 basis points increase | $ | 387,646 | $ | (37,545 | ) | (8.8 | )% | $ | 379,236 | $ | (31,987 | ) | (7.8 | )% | ||||||||
100 basis points increase | $ | 406,036 | $ | (19,155 | ) | (4.5 | )% | $ | 394,824 | $ | (16,399 | ) | (4.0 | )% | ||||||||
No change | $ | 425,191 | $ | — | — | % | $ | 411,223 | $ | — | — | % | ||||||||||
100 basis points decrease | $ | 443,836 | $ | 18,645 | 4.4 | % | $ | 427,145 | $ | 15,922 | 3.9 | % | ||||||||||
200 basis points decrease | $ | 460,394 | $ | 35,203 | 8.3 | % | $ | 438,775 | $ | 27,552 | 6.7 | % | ||||||||||
Changes in interest rates will have an immediate effect on comprehensive income and stockholders’ equity but will not ordinarily have an immediate effect on net income. Actual results may differ from the hypothetical change in market rates assumed in this disclosure. This sensitivity analysis does not reflect the results of any action that we may take to mitigate such hypothetical losses in fair value.
Equity risk
Equity risk represents the potential economic losses due to adverse changes in equity security prices. A portion of our portfolio is invested in equity securities, which have historically produced higher long-term returns relative to fixed maturities. As of December 31, 2017, approximately 9.6% of the fair value of our investment portfolio (including cash and cash equivalents) was invested in equity securities. Our equity securities are comprised of exchange traded funds and nonredeemable preferred stock. We manage equity price risk of our equity portfolio primarily through asset allocation techniques.
74
Item 8. Financial Statements and Supplementary Data
INDEX TO FINANCIAL STATEMENTS
Page | ||
Audited Consolidated Financial Statements | ||
Management's Report on Internal Control Over Financial Reporting | ||
Report of Independent Registered Public Accounting Firm | ||
Consolidated Balance Sheets as of December 31, 2017 and 2016 | ||
Consolidated Statements of Income and Comprehensive Income for the Years Ended December 31, 2017, 2016 and 2015 | ||
Consolidated Statements of Changes in Stockholders' Equity for the Years Ended December 31, 2017, 2016 and 2015 | ||
Consolidated Statements of Cash Flows for the Years Ended December 31, 2017, 2016 and 2015 | ||
Notes to Consolidated Financial Statements | ||
Schedule II - Condensed Financial Information of Registrant - Parent Company Only | ||
Schedule V - Valuation and Qualifying Accounts | ||
Schedules other than those listed are omitted for the reason that they are not required, are not applicable or that equivalent information has been included in the financial statements or notes thereto or elsewhere herein.
75
Management's Report on Internal Control Over Financial Reporting:
Management is responsible for establishing and maintaining adequate internal control over financial reporting, as defined in Rule 13a-15(f) under the Securities Exchange Act of 1934. Our internal control over financial reporting is a process designed to provide reasonable assurance regarding the reliability of financial reporting and the preparation of financial statements for external purposes in accordance with generally accepted accounting principles.
Management does not expect that its internal control over financial reporting will prevent all errors and all fraud. A control system, no matter how well conceived and operated, can provide only reasonable, not absolute, assurance that the objectives of the control system are met. Internal control over financial reporting is a process that involves human diligence and compliance and is subject to lapses in judgment and breakdowns resulting from human failures. Because of the inherent limitations in all control systems, no evaluation of controls can provide absolute assurance that all control issues and instances of fraud, if any, have been detected. The design of any system of internal control over financial reporting also is based in part upon certain assumptions about the likelihood of future events, and there can be no assurance that any design will succeed in achieving its stated goals under all potential future conditions.
Management evaluated the effectiveness of our internal control over financial reporting as of December 31, 2017, based on criteria established in Internal Control-Integrated Framework (2013) issued by the Committee of Sponsoring Organizations of the Treadway Commission. Management reviewed the results of its assessment with the Audit Committee of our Board of Directors. Based on our evaluation, we have concluded that we maintained effective internal control over financial reporting as of December 31, 2017.
KPMG LLP, our independent registered public accounting firm, has issued an opinion on the effectiveness of the Company's internal control over financial reporting, as stated in their report which is included herein.
Report of Independent Registered Public Accounting Firm
To the stockholders and board of directors
Kinsale Capital Group, Inc.:
Opinions on the Consolidated Financial Statements and Internal Control Over Financial Reporting
We have audited the accompanying consolidated balance sheets of Kinsale Capital Group, Inc. and subsidiaries (the “Company”) as of December 31, 2017 and 2016, the related consolidated statements of income and comprehensive income, changes in stockholders’ equity, and cash flows for each of the years in the three-year period ended December 31, 2017, and the related notes and financial statement schedules II and V (collectively, the “consolidated financial statements”). We also have audited the Company’s internal control over financial reporting as of December 31, 2017, based on criteria established in Internal Control - Integrated Framework (2013) issued by the Committee of Sponsoring Organizations of the Treadway Commission.
In our opinion, the consolidated financial statements referred to above present fairly, in all material respects, the financial position of the Company as of December 31, 2017 and 2016, and the results of its operations and its cash flows for each of the years in the three-year period ended December 31, 2017, in conformity with U.S. generally accepted accounting principles. Also in our opinion, the Company maintained, in all material respects, effective internal control over financial reporting as of December 31, 2017, based on criteria established in Internal Control - Integrated Framework (2013) issued by the Committee of Sponsoring Organizations of the Treadway Commission.
76
Basis for Opinion
The Company’s management is responsible for these consolidated financial statements, for maintaining effective internal control over financial reporting, and for its assessment of the effectiveness of internal control over financial reporting, included in the accompanying Management’s Report on Internal Control over Financial Reporting. Our responsibility is to express an opinion on the Company’s consolidated financial statements and an opinion on the Company’s internal control over financial reporting based on our audits. We are a public accounting firm registered with the Public Company Accounting Oversight Board (United States) (“PCAOB”) and are required to be independent with respect to the Company in accordance with the U.S. federal securities laws and the applicable rules and regulations of the Securities and Exchange Commission and the PCAOB.
We conducted our audits in accordance with the standards of the PCAOB. Those standards require that we plan and perform the audits to obtain reasonable assurance about whether the consolidated financial statements are free of material misstatement, whether due to error or fraud, and whether effective internal control over financial reporting was maintained in all material respects.
Our audits of the consolidated financial statements included performing procedures to assess the risks of material misstatement of the consolidated financial statements, whether due to error or fraud, and performing procedures that respond to those risks. Such procedures included examining, on a test basis, evidence regarding the amounts and disclosures in the consolidated financial statements. Our audits also included evaluating the accounting principles used and significant estimates made by management, as well as evaluating the overall presentation of the consolidated financial statements. Our audit of internal control over financial reporting included obtaining an understanding of internal control over financial reporting, assessing the risk that a material weakness exists, and testing and evaluating the design and operating effectiveness of internal control based on the assessed risk. Our audits also included performing such other procedures as we considered necessary in the circumstances. We believe that our audits provide a reasonable basis for our opinions.
Definition and Limitations of Internal Control Over Financial Reporting
A company’s internal control over financial reporting is a process designed to provide reasonable assurance regarding the reliability of financial reporting and the preparation of financial statements for external purposes in accordance with generally accepted accounting principles. A company’s internal control over financial reporting includes those policies and procedures that (1) pertain to the maintenance of records that, in reasonable detail, accurately and fairly reflect the transactions and dispositions of the assets of the company; (2) provide reasonable assurance that transactions are recorded as necessary to permit preparation of financial statements in accordance with generally accepted accounting principles, and that receipts and expenditures of the company are being made only in accordance with authorizations of management and directors of the company; and (3) provide reasonable assurance regarding prevention or timely detection of unauthorized acquisition, use, or disposition of the company’s assets that could have a material effect on the financial statements.
Because of its inherent limitations, internal control over financial reporting may not prevent or detect misstatements. Also, projections of any evaluation of effectiveness to future periods are subject to the risk that controls may become inadequate because of changes in conditions, or that the degree of compliance with the policies or procedures may deteriorate.
/s/ KPMG LLP
We have served as the Company’s auditor since 2009.
Richmond, Virginia
March 1, 2018
77
KINSALE CAPITAL GROUP, INC. AND SUBSIDIARIES
Consolidated Balance Sheets
December 31, | ||||||||
2017 | 2016 | |||||||
(in thousands, except share amounts) | ||||||||
Assets | ||||||||
Fixed maturity securities available-for-sale, at fair value (amortized cost: $422,255 in 2017; $413,526 in 2016) | $ | 425,191 | $ | 411,223 | ||||
Equity securities available-for-sale, at fair value (cost: $45,916 in 2017; $14,350 in 2016) | 54,132 | 18,374 | ||||||
Total investments | 479,323 | 429,597 | ||||||
Cash and cash equivalents | 81,747 | 50,752 | ||||||
Investment income due and accrued | 3,077 | 2,293 | ||||||
Premiums receivable, net | 19,787 | 16,984 | ||||||
Receivable from reinsurers | — | 8,567 | ||||||
Reinsurance recoverables | 49,593 | 70,317 | ||||||
Ceded unearned premiums | 13,858 | 13,512 | ||||||
Deferred policy acquisition costs, net of ceding commissions | 11,775 | 10,150 | ||||||
Intangible assets | 3,538 | 3,538 | ||||||
Deferred income tax asset, net | 2,492 | 6,605 | ||||||
Other assets | 2,659 | 2,074 | ||||||
Total assets | $ | 667,849 | $ | 614,389 | ||||
Liabilities and Stockholders' Equity | ||||||||
Reserves for unpaid losses and loss adjustment expenses | $ | 315,717 | $ | 264,801 | ||||
Unearned premiums | 103,110 | 89,344 | ||||||
Payable to reinsurers | 3,226 | 4,090 | ||||||
Funds held for reinsurers | — | 36,497 | ||||||
Accounts payable and accrued expenses | 6,519 | 8,752 | ||||||
Other liabilities | 1,088 | 691 | ||||||
Total liabilities | 429,660 | 404,175 | ||||||
Commitments and contingencies | ||||||||
Stockholders’ equity: | ||||||||
Common stock, $0.01 par value, 400,000,000 shares authorized, 21,036,087 shares issued and outstanding as of December 31, 2017; 20,968,707 shares issued and outstanding as of December 31, 2016 | 210 | 210 | ||||||
Additional paid-in capital | 155,082 | 153,353 | ||||||
Retained earnings | 73,502 | 53,640 | ||||||
Accumulated other comprehensive income | 9,395 | 3,011 | ||||||
Stockholders’ equity | 238,189 | 210,214 | ||||||
Total liabilities and stockholders’ equity | $ | 667,849 | $ | 614,389 | ||||
See accompanying notes to consolidated financial statements.
78
KINSALE CAPITAL GROUP, INC. AND SUBSIDIARIES
Consolidated Statements of Income and Comprehensive Income
Year Ended December 31, | ||||||||||||
2017 | 2016 | 2015 | ||||||||||
(in thousands, except per share data) | ||||||||||||
Revenues: | ||||||||||||
Gross written premiums | $ | 223,191 | $ | 188,478 | $ | 177,009 | ||||||
Ceded written premiums | (33,719 | ) | (21,214 | ) | (92,991 | ) | ||||||
Net written premiums | 189,472 | 167,264 | 84,018 | |||||||||
Change in unearned premiums | (13,419 | ) | (33,448 | ) | (9,696 | ) | ||||||
Net earned premiums | 176,053 | 133,816 | 74,322 | |||||||||
Net investment income | 10,569 | 7,487 | 5,643 | |||||||||
Net investment gains (losses): | ||||||||||||
Net realized investment gains, excluding other-than-temporary impairment losses | 151 | 452 | 59 | |||||||||
Other-than-temporary impairment losses | — | (276 | ) | — | ||||||||
Net investment gains | 151 | 176 | 59 | |||||||||
Other income | 3 | 136 | 572 | |||||||||
Total revenues | 186,776 | 141,615 | 80,596 | |||||||||
Expenses: | ||||||||||||
Losses and loss adjustment expenses | 103,680 | 70,961 | 42,238 | |||||||||
Underwriting, acquisition and insurance expenses | 44,146 | 28,551 | 2,809 | |||||||||
Other expenses | 429 | 2,567 | 1,992 | |||||||||
Total expenses | 148,255 | 102,079 | 47,039 | |||||||||
Income before income taxes | 38,521 | 39,536 | 33,557 | |||||||||
Income tax expense | 13,620 | 13,369 | 11,284 | |||||||||
Net income | 24,901 | 26,167 | 22,273 | |||||||||
Other comprehensive income (loss): | ||||||||||||
Unrealized gains (losses), net of taxes of $3,047 in 2017, $(344) in 2016, and $(841) in 2015 | 6,384 | (640 | ) | (1,563 | ) | |||||||
Total comprehensive income | $ | 31,285 | $ | 25,527 | $ | 20,710 | ||||||
Earnings per share - Basic: | ||||||||||||
Common stock | $ | 1.19 | $ | 0.57 | $ | — | ||||||
Class A common stock | $ | — | $ | 0.98 | $ | 1.53 | ||||||
Class B common stock | $ | — | $ | 0.48 | $ | 0.84 | ||||||
Earnings per share - Diluted: | ||||||||||||
Common stock | $ | 1.16 | $ | 0.56 | $ | — | ||||||
Class A common stock | $ | — | $ | 0.98 | $ | 1.53 | ||||||
Class B common stock | $ | — | $ | 0.46 | $ | 0.81 | ||||||
Weighted-average common shares outstanding - Basic: | ||||||||||||
Common stock | 20,992 | 20,841 | — | |||||||||
Class A common stock | — | 13,844 | 13,796 | |||||||||
Class B common stock | — | 1,574 | 1,413 | |||||||||
Weighted-average common shares outstanding - Diluted: | ||||||||||||
Common stock | 21,498 | 21,073 | — | |||||||||
Class A common stock | — | 13,844 | 13,796 | |||||||||
Class B common stock | — | 1,644 | 1,452 | |||||||||
79
KINSALE CAPITAL GROUP, INC. AND SUBSIDIARIES
Consolidated Statements of Changes in Stockholders' Equity
Class A Common Stock (1) | Class B Common Stock (1) | Common Stock (1) | Additional Paid-in Capital | Retained Earnings | Accumulated Other Comprehensive Income | Total Stockholders' Equity | ||||||||||||||||||||||
(in thousands) | ||||||||||||||||||||||||||||
Balance at December 31, 2014 | $ | 1 | $ | — | $ | — | $ | 80,074 | $ | 7,297 | $ | 5,214 | $ | 92,586 | ||||||||||||||
Class A shares issued | — | — | — | 90 | — | — | 90 | |||||||||||||||||||||
Stock-based compensation | — | — | — | 65 | — | — | 65 | |||||||||||||||||||||
Other comprehensive loss, net of income taxes | — | — | — | — | — | (1,563 | ) | (1,563 | ) | |||||||||||||||||||
Net income | — | — | — | — | 22,273 | — | 22,273 | |||||||||||||||||||||
Balance at December 31, 2015 | 1 | — | — | 80,229 | 29,570 | 3,651 | 113,451 | |||||||||||||||||||||
Reclassification of capital structure | (1 | ) | — | 160 | (159 | ) | — | — | — | |||||||||||||||||||
Common stock issuance, net of transaction costs | — | — | 50 | 72,791 | — | — | 72,841 | |||||||||||||||||||||
Stock-based compensation | — | — | — | 492 | — | — | 492 | |||||||||||||||||||||
Dividends declared and paid | — | — | — | — | (2,097 | ) | — | (2,097 | ) | |||||||||||||||||||
Other comprehensive loss, net of income taxes | — | — | — | — | — | (640 | ) | (640 | ) | |||||||||||||||||||
Net income | — | — | — | — | 26,167 | — | 26,167 | |||||||||||||||||||||
Balance at December 31, 2016 | — | — | 210 | 153,353 | 53,640 | 3,011 | 210,214 | |||||||||||||||||||||
Issuance of common stock under stock-based compensation plan | — | — | — | 1,077 | — | — | 1,077 | |||||||||||||||||||||
Stock-based compensation | — | — | — | 652 | — | — | 652 | |||||||||||||||||||||
Dividends declared and paid | — | — | — | — | (5,039 | ) | — | (5,039 | ) | |||||||||||||||||||
Other comprehensive income, net of income taxes | — | — | — | — | — | 6,384 | 6,384 | |||||||||||||||||||||
Net income | — | — | — | — | 24,901 | — | 24,901 | |||||||||||||||||||||
Balance at December 31, 2017 | $ | — | $ | — | $ | 210 | $ | 155,082 | $ | 73,502 | $ | 9,395 | $ | 238,189 | ||||||||||||||
(1) - See Note 9, "Stockholders' equity," for the schedule of changes in shares of common stock and the related discussion.
See accompanying notes to consolidated financial statements.
80
KINSALE CAPITAL GROUP, INC. AND SUBSIDIARIES
Consolidated Statements of Cash Flows
Year Ended December 31, | ||||||||||||
2017 | 2016 | 2015 | ||||||||||
(in thousands) | ||||||||||||
Operating activities: | ||||||||||||
Net income | $ | 24,901 | $ | 26,167 | $ | 22,273 | ||||||
Adjustments to reconcile net income to net cash provided by operating activities: | ||||||||||||
Net investment gains | (151 | ) | (176 | ) | (59 | ) | ||||||
Deferred tax expense (benefit) | 1,065 | 561 | (879 | ) | ||||||||
Depreciation and amortization | 515 | 636 | 642 | |||||||||
Stock compensation expense | 652 | 492 | 65 | |||||||||
Change in operating assets and liabilities: | ||||||||||||
Investment income due and accrued | (784 | ) | (449 | ) | (447 | ) | ||||||
Premiums receivable, net | (2,803 | ) | (1,434 | ) | (1,324 | ) | ||||||
Reserves for unpaid loss and loss adjustment expenses | 50,916 | 45,172 | 57,418 | |||||||||
Unearned premiums | 13,766 | 7,631 | 6,460 | |||||||||
Reinsurance balances, net | 28,081 | 54,788 | (29,501 | ) | ||||||||
Funds held for reinsurers | (36,497 | ) | (50,709 | ) | 23,274 | |||||||
Deferred policy acquisition costs | (1,625 | ) | (11,846 | ) | (2,067 | ) | ||||||
Income taxes payable | (922 | ) | (482 | ) | (1,393 | ) | ||||||
Accounts payable and accrued expenses | (2,299 | ) | 1,342 | 2,506 | ||||||||
Other | 2,583 | 2,048 | 1,734 | |||||||||
Net cash provided by operating activities | 77,398 | 73,741 | 78,702 | |||||||||
Investing activities: | ||||||||||||
Purchase of property and equipment | (179 | ) | (565 | ) | (231 | ) | ||||||
Change in short-term investments, net | — | 2,299 | 1,957 | |||||||||
Securities available-for-sale: | ||||||||||||
Purchases – fixed maturity securities | (111,580 | ) | (149,572 | ) | (128,204 | ) | ||||||
Purchases – equity securities | (31,608 | ) | (2,442 | ) | (372 | ) | ||||||
Sales – fixed maturity securities | 12,040 | 13,541 | 14,328 | |||||||||
Maturities and calls – fixed maturity securities | 88,895 | 48,595 | 32,475 | |||||||||
Net cash used in investing activities | (42,432 | ) | (88,144 | ) | (80,047 | ) | ||||||
Financing activities: | ||||||||||||
Common stock issued, net of transaction costs | — | 72,841 | — | |||||||||
Common stock issued, stock options exercised | 1,077 | — | — | |||||||||
Class A common shares issued | — | — | 90 | |||||||||
Proceeds from note payable | — | — | 2,000 | |||||||||
Repayment of note payable | — | (30,000 | ) | — | ||||||||
Debt issuance costs | — | — | (30 | ) | ||||||||
Dividends paid | (5,039 | ) | (2,097 | ) | — | |||||||
Payments on capital lease | (9 | ) | (133 | ) | (129 | ) | ||||||
Net cash (used in) provided by financing activities | (3,971 | ) | 40,611 | 1,931 | ||||||||
Net change in cash and cash equivalents | 30,995 | 26,208 | 586 | |||||||||
Cash and cash equivalents at beginning of year | 50,752 | 24,544 | 23,958 | |||||||||
Cash and cash equivalents at end of year | $ | 81,747 | $ | 50,752 | $ | 24,544 | ||||||
See accompanying notes to consolidated financial statements.
81
Kinsale Capital Group, Inc. and subsidiaries
Notes to consolidated financial statements
Description of business
Kinsale Capital Group, Inc., an insurance holding company, is a Delaware corporation that was formed in 2009 and conducts its operations through its wholly-owned subsidiaries. Kinsale Capital Group Inc. writes excess and surplus lines insurance on a non-admitted basis principally through its insurance subsidiary, Kinsale Insurance Company ("Kinsale Insurance"), which is authorized to write business in 50 states, the District of Columbia, the Commonwealth of Puerto Rico and the U.S. Virgin Islands. Kinsale Capital Group, Inc. also markets certain products through its subsidiary, Aspera Insurance Services, Inc. ("Aspera"), an insurance broker. Aspera is authorized to conduct business in Alabama, California, Connecticut, Delaware, Florida, Georgia, Louisiana, Maine, Maryland, Massachusetts, Mississippi, New Hampshire, New Jersey, New York, North Carolina, Pennsylvania, Rhode Island, South Carolina, Texas and Virginia.
1. | Summary of significant accounting policies |
Principles of consolidation
The accompanying consolidated financial statements include the accounts of Kinsale Capital Group, Inc. and its wholly-owned subsidiaries (referred to as "Kinsale" or, with its subsidiaries, the "Company"). All significant intercompany balances and transactions have been eliminated in consolidation.
Use of estimates
The preparation of consolidated financial statements in conformity with U.S. generally accepted accounting principles ("U.S. GAAP") requires management to make estimates and assumptions that affect the reported amounts of assets and liabilities and disclosure of contingent assets and liabilities at the date of the consolidated financial statements and the reported amounts of revenues and expenses during the reporting period. Actual results could differ from those estimates. Management periodically reviews its estimates and assumptions. These reviews include evaluating the adequacy of reserves for unpaid losses and loss adjustment expenses, allowance for doubtful accounts and uncollectible reinsurance, fair value of investments, as well as evaluating the investment portfolio for other-than-temporary declines in fair value.
Cash and cash equivalents
The Company considers all highly liquid investments with an original maturity of three months or less to be cash equivalents.
Short-term investments
Short-term investments are carried at cost, which approximates fair value. Short-term investments have maturities greater than three months but less than one year at the date of purchase. There were no short-term investments at December 31, 2017 or December 31, 2016.
Fixed maturity and equity securities
Fixed maturity securities and equity securities are classified as available-for-sale and reported at fair value. Unrealized gains and losses on these securities are excluded from net earnings but are recorded as a separate component of comprehensive income (loss) and stockholders’ equity, net of deferred income taxes.
82
The Company regularly evaluates its fixed maturity securities and equity securities using both quantitative and qualitative criteria to determine impairment losses for other-than-temporary declines in the fair value of the investments. See Note 2 for further discussion of other-than-temporary impairments ("OTTI").
Interest on fixed maturity securities is credited to earnings as it accrues. Premiums and discounts are amortized or accreted over the lives of the related fixed maturities. Dividends on equity securities are included in earnings on the ex-dividend date. Realized gains and losses on disposition of investments are based on specific identification of the investments sold on the trade date.
Reinsurance
Reinsurance premiums, commissions, and ceded unearned premiums on reinsured business are accounted for on a basis consistent with that used in accounting for the original policies issued and the terms of the reinsurance contracts. The Company receives ceding commissions in connection with certain ceded reinsurance. The ceding commissions are capitalized and amortized as a reduction of underwriting, acquisition and insurance expenses.
Reinsurance recoverables represent paid losses and loss adjustment expenses and reserves for unpaid losses and loss adjustment expenses ceded to reinsurers that are subject to reimbursement under reinsurance treaties. The method for determining reinsurance recoverables for unpaid losses and loss adjustment expenses involves reviewing actuarial estimates of gross unpaid losses and loss adjustment expenses to determine the Company's ability to cede unpaid losses and loss adjustment expenses under the Company's existing reinsurance contracts. This method is continually reviewed and updated and any resulting adjustments are reflected in earnings in the period identified. See Note 8 for a further discussion of the Company's reinsurance program.
Premiums receivable, net
Premiums receivable balances are carried at face value, net of any allowance for doubtful accounts. The allowance for doubtful accounts represents an estimate of amounts considered uncollectible based on the Company’s assessment of the collectability of receivables that are past due. The Company recorded an allowance for doubtful accounts of $2.1 million and $2.0 million at December 31, 2017 and 2016, respectively, and believes that all other amounts due are collectible.
Deferred policy acquisition costs, net of ceding commissions
The Company defers commissions, net of ceding commissions, and certain other costs that are directly related to the successful acquisition of insurance contracts. All eligible costs are capitalized and charged to expense in proportion to premium earned over the estimated policy life. To the extent that unearned premiums on existing policies are not adequate to cover the related costs and expenses, deferred policy acquisition costs are charged to earnings. The Company considers anticipated investment income in determining whether a premium deficiency exists.
Property and equipment, net
Property and equipment are stated at cost less accumulated depreciation. Depreciation of property and equipment is calculated using the straight-line method over the estimated useful lives of the assets. The estimated useful lives range from seven to ten years for furniture and equipment, three to seven years for electronic data processing hardware and software, and from two to six years for leasehold improvements, which is the shorter of the estimated useful life or the lease term. Property and equipment is included in "other assets" in the accompanying consolidated balance sheets.
Intangible assets
Intangible assets are recorded at fair value at the date of acquisition. The Company's intangible assets are comprised solely of indefinite-lived intangible assets, which arise from regulatory approvals granted by the various state insurance departments to write insurance business in the respective states on a non-admitted basis. In accordance with U.S. GAAP, amortization of indefinite-lived intangible assets is not permitted. Indefinite-lived intangible assets are tested for impairment during the fourth quarter on an annual basis, or earlier if there is reason to suspect that their values may have been diminished or impaired. There were no impairments recognized in 2017, 2016, or 2015. In addition, as of December 31, 2017, no triggering events occurred that suggested an updated review was necessary.
83
Reserves for unpaid losses and loss adjustment expenses
Reserves for unpaid losses and loss adjustment expenses represent management's best estimate of ultimate unpaid cost of all reported and unreported losses and loss adjustment expenses incurred prior to the financial statement date. The estimates are based on an actuarial method that uses management’s initial expected loss ratio, expected reporting patterns for losses based on industry data and the Company’s actual reported losses and loss adjustment expenses. All estimates are regularly reviewed and, as experience develops and new information becomes known, the reserves for unpaid losses and loss adjustment expenses are adjusted as necessary. Such adjustments are reflected in the results of operations in the period in which they are determined. Although management believes that the reserves for losses and loss adjustment expenses are reasonable, due to the inherent uncertainty in estimating reserves for unpaid losses and loss adjustment expenses, it is possible that the Company’s actual incurred losses and loss adjustment expenses will not develop in a manner consistent with the assumptions inherent in the determination of these reserves. If actual liabilities do exceed recorded amounts, there will be an adverse effect. Furthermore, we may determine that recorded reserves are more than adequate to cover expected losses which will result in a reduction to the reserves. The Company believes that the reserves for unpaid losses and loss adjustment expenses at December 31, 2017 are adequate and represent a reasonable estimate of the Company's future obligations. See Note 7 for a further discussion of reserves for unpaid losses and loss adjustment expenses.
Revenue recognition
Premiums are recognized as revenue ratably over the term of the insurance contracts, net of ceded reinsurance. Unearned premiums are calculated on a daily pro rata basis.
Income taxes
Deferred income tax assets and liabilities are determined based on the difference between the financial statement and the tax bases of assets and liabilities, using enacted tax rates expected to be in effect during the year in which the basis differences reverse. The effect on deferred taxes of a change in tax rates is recognized in income in the period that includes the enactment date. Valuation allowances are recorded when it is more likely than not that some portion, or all, of the deferred tax assets will not be realizable. Management evaluates the realizability of the deferred tax assets and assesses the need for any valuation allowance adjustment. Valuation allowances on deferred tax assets are estimated based on the Company's assessment of the realizability of such amounts.
The Company provides for uncertain tax positions, and the related interest and penalties, based upon management’s assessment of whether a tax benefit is more likely than not to be sustained upon examination by tax authorities. To the extent that the anticipated tax outcome of these uncertain tax positions changes, such changes in estimate will impact the income tax provision in the period in which such determination is made. The Company recognizes accrued interest and penalties related to uncertain tax positions as a component of income tax expense.
Commitments and contingencies
Liabilities for loss contingencies, arising from noninsurance policy claims, assessments, litigation, fines, and penalties and other sources, are recorded when it is probable that a liability has been incurred and the amount of the assessment and/or remediation can be reasonably estimated. Legal costs incurred in connection with loss contingencies are expensed as incurred.
Fair value of financial instruments
The fair values of certain financial instruments are determined based on the fair value hierarchy. U.S. GAAP guidance requires an entity to maximize the use of observable inputs and minimize the use of unobservable inputs when measuring fair value. The guidance also describes three levels of inputs that may be used to measure fair value.
The following was considered in the estimation of fair value for each class of financial instruments for which it was practicable to estimate that value. The Company’s investment manager uses independent pricing vendors to estimate the fair value of fixed maturity securities and the Company’s management reviews these prices for reasonableness. U.S. Treasury Securities that have quoted prices in active markets are included in the amounts disclosed as Level 1. For
84
other fixed maturity securities, the pricing vendors use a pricing methodology involving the market approach, including pricing models which use prices and relevant market information regarding a particular security or securities with similar characteristics to establish a valuation. The estimates of fair value of these fixed maturity investments are included in the amounts disclosed as Level 2. For those bonds where significant inputs are unobservable, Level 3 inputs, the Company's investment manager obtains valuations from pricing vendors using the market approach and income approach valuation techniques.
For equity securities, the Company’s investment manager uses prices from independent pricing vendors to estimate fair value. The fair value estimates of exchange traded funds are based on quoted prices in an active market and are disclosed as Level 1.The fair value estimates of preferred stock are based on observable market data and, as a result, are disclosed as Level 2.
Fair value disclosures for investments are included in Notes 2 and 3.
Stock-based compensation
Stock-based compensation is expensed based upon the estimated fair value of employee stock awards. Compensation cost for awards of equity instruments to employees is measured based on the grant-date fair value of those awards and compensation expense is recognized over the service period that the awards vest. Forfeitures of stock-based compensation awards are recognized as they occur.
See Note 9 for further discussion and related disclosures regarding stock-based compensation.
Prospective accounting pronouncements
ASU 2016-01, Financial Instruments - Overall: Recognition and Measurement of Financial Assets and Financial Liabilities
In January 2016, the FASB issued ASU 2016-01, "Financial Instruments – Overall: Recognition and Measurement of Financial Assets and Financial Liabilities," which requires equity investments to be measured at fair value with changes in fair value recognized in net income, requires public business entities to use the exit price notion when measuring the fair value of financial instruments for disclosure purposes, requires separate presentation of financial assets and financial liabilities by measurement category and form of financial asset, and eliminates the requirement for public business entities to disclose the method(s) and significant assumptions used to estimate the fair value that is required to be disclosed for financial instruments measured at amortized cost. The amendments in this ASU are effective for public companies for annual reporting periods beginning after December 15, 2017, including interim periods within those fiscal years. Upon adoption, a cumulative-effect adjustment to the balance sheet will be made as of the beginning of the fiscal year of adoption. For the year ended December 31, 2017, accumulated other comprehensive income included $6.5 million of net unrealized gains on equity securities, net of taxes. Adoption of this ASU is not expected to have a material impact on the Company's financial position or cash flows, but may have a material impact on the Company's results of operations in the future as changes in the fair value of equity instruments will be presented in net income rather than other comprehensive income.
ASU 2016-02, Leases (Topic 842)
In February 2016, the FASB issued ASU 2016-02, "Leases (Topic 842)" to improve the financial reporting of leasing transactions. Under this ASU, lessees will recognize a right-of-use asset and corresponding liability on the balance sheet for all leases, except for leases covering a period of fewer than 12 months. The liability is to be measured as the present value of the future minimum lease payments taking into account renewal options if applicable plus initial incremental direct costs such as commissions. The minimum payments are discounted using the rate implicit in the lease or, if not known, the lessee’s incremental borrowing rate. The lessee’s income statement treatment for leases will vary depending on the nature of what is being leased. A financing type lease is present when, among other matters, the asset is being leased for a substantial portion of its economic life or has an end-of-term title transfer or a bargain purchase option as in today’s practice. The payment of the liability set up for such leases will be apportioned between interest and principal; the right-of use asset will be generally amortized on a straight-line basis. If the lease does not qualify as a financing type lease, it will be accounted for on the income statement as rent on a straight-line basis. This ASU is effective for annual
85
and interim reporting periods beginning after December 15, 2018. Early adoption is permitted. The Company is currently evaluating the impact of the adoption on its consolidated financial statements.
ASU 2016-13, Financial Instruments – Credit Losses (Topic 326)
On June 16, 2016, the FASB issued ASU 2016-13, "Financial Instruments – Credit Losses (Topic 326)" to provide more useful information about the expected credit losses on financial instruments. Current GAAP delays the recognition of credit losses until it is probable a loss has been incurred. The update will require a financial asset measured at amortized cost to be presented at the net amount expected to be collected by means of an allowance for credit losses that runs through net income. Credit losses relating to available-for-sale debt securities will also be recorded through an allowance for credit losses. However, the amendments would limit the amount of the allowance to the amount by which fair value is below amortized cost. The measurement of credit losses on available-for-sale securities is similar under current GAAP, but the update requires the use of the allowance account through which amounts can be reversed, rather than through an irreversible write-down.
This ASU is effective for annual and interim reporting periods beginning after December 15, 2019. Early adoption is permitted beginning after December 15, 2018. Upon adoption, the update will be applied using the modified-retrospective approach, by which a cumulative-effect adjustment will be made to retained earnings as of the beginning of the first reporting period presented. The Company is currently evaluating the impact of the adoption on its consolidated financial statements.
ASU 2017-08, Premium Amortization on Purchased Callable Debt Securities
On March 30, 2017, the FASB issued ASU 2017-08, "Premium Amortization on Purchased Callable Debt Securities," which shortens the amortization period of the premium for certain callable debt securities, from the contractual maturity date to the earliest call date. This ASU is effective in fiscal years beginning after December 15, 2018, including interim periods within those fiscal years. Early adoption is permitted, including in an interim period. Upon adoption, the update will be applied on a modified retrospective basis, with a cumulative-effect adjustment to retained earnings as of the beginning of the first reporting period presented. The Company is currently evaluating the impact of the adoption on its consolidated financial statements.
There are no other prospective accounting standards which, upon their effective date, would have a material impact on the Company's consolidated financial statements.
86
2. Investments
Available-for-sale investments
The following tables summarize the Company’s available-for-sale investments:
December 31, 2017 | ||||||||||||||||
Amortized Cost | Gross Unrealized Holding Gains | Gross Unrealized Holding Losses | Estimated Fair Value | |||||||||||||
(in thousands) | ||||||||||||||||
Fixed maturities: | ||||||||||||||||
U.S. Treasury securities and obligations of U.S. government agencies | $ | 9,108 | $ | 4 | $ | (14 | ) | $ | 9,098 | |||||||
Obligations of states, municipalities and political subdivisions | 161,012 | 3,726 | (412 | ) | 164,326 | |||||||||||
Corporate and other securities | 71,224 | 579 | (172 | ) | 71,631 | |||||||||||
Asset-backed securities | 95,223 | 405 | (268 | ) | 95,360 | |||||||||||
Residential mortgage-backed securities | 85,688 | 466 | (1,378 | ) | 84,776 | |||||||||||
Total fixed maturities | 422,255 | 5,180 | (2,244 | ) | 425,191 | |||||||||||
Equity securities: | ||||||||||||||||
Exchange traded funds | 26,041 | 8,339 | — | 34,380 | ||||||||||||
Nonredeemable preferred stock | 19,875 | 108 | (231 | ) | 19,752 | |||||||||||
Total equity securities | 45,916 | 8,447 | (231 | ) | 54,132 | |||||||||||
Total available-for-sale investments | $ | 468,171 | $ | 13,627 | $ | (2,475 | ) | $ | 479,323 | |||||||
December 31, 2016 | ||||||||||||||||
Amortized Cost | Gross Unrealized Holding Gains | Gross Unrealized Holding Losses | Estimated Fair Value | |||||||||||||
(in thousands) | ||||||||||||||||
Fixed maturities: | ||||||||||||||||
U.S. Treasury securities and obligations of U.S. government agencies | $ | 12,106 | $ | 8 | $ | (16 | ) | $ | 12,098 | |||||||
Obligations of states, municipalities and political subdivisions | 124,728 | 1,470 | (2,960 | ) | 123,238 | |||||||||||
Corporate and other securities | 118,473 | 550 | (233 | ) | 118,790 | |||||||||||
Asset-backed securities | 73,317 | 241 | (264 | ) | 73,294 | |||||||||||
Residential mortgage-backed securities | 84,902 | 585 | (1,684 | ) | 83,803 | |||||||||||
Total fixed maturities | 413,526 | 2,854 | (5,157 | ) | 411,223 | |||||||||||
Equity securities: | ||||||||||||||||
Exchange traded funds | 14,350 | 4,026 | (2 | ) | 18,374 | |||||||||||
Total available-for-sale investments | $ | 427,876 | $ | 6,880 | $ | (5,159 | ) | $ | 429,597 | |||||||
Available-for-sale securities in a loss position
The Company regularly reviews all securities with unrealized losses to assess whether the decline in the securities’ fair value is deemed to be an OTTI. The Company considers a number of factors in completing its OTTI review, including the length of time and the extent to which fair value has been below cost and the financial condition of an issuer. In addition to specific issuer information, the Company also evaluates the current market and interest rate environment.
87
Generally, a change in a security’s value caused by a change in the market or interest rate environment does not constitute an OTTI, but rather a temporary decline in fair value.
For fixed maturities, the Company considers whether it intends to sell the security or if it is more likely than not that it will be required to sell the security before recovery, the credit quality of the issuer and the ability to recover all amounts outstanding when contractually due. When assessing whether it intends to sell a fixed maturity security or if it is likely to be required to sell a fixed maturity security before recovery of its amortized cost, the Company evaluates facts and circumstances including, but not limited to, decisions to reposition the investment portfolio, potential sales of investments to meet cash flow needs and potential sales of investments to capitalize on favorable pricing. For equity securities, the Company considers the near-term prospects of an issuer and its ability and intent to hold the security for a period of time sufficient to allow for anticipated recovery.
For fixed maturities where a decline in fair value is considered to be other-than-temporary and the Company intends to sell the security, or it is more likely than not that the Company will be required to sell the security before recovery of its amortized cost, an impairment is recognized in net income based on the fair value of the security at the time of assessment, resulting in a new cost basis for the security. If the decline in fair value of a fixed maturity security below its amortized cost is considered to be other-than-temporary based upon other considerations, the Company compares the estimated present value of the cash flows expected to be collected to the amortized cost of the security. The extent to which the estimated present value of the cash flows expected to be collected is less than the amortized cost of the security represents the credit-related portion of the OTTI, which is recognized in net income, resulting in a new cost basis for the security. Any remaining decline in fair value represents the noncredit portion of the OTTI, which is recognized in other comprehensive income. For equity securities, a decline in fair value that is considered to be other-than-temporary is recognized in net income based on the fair value of the security at the time of assessment, resulting in a new cost basis for the security.
The following tables summarize gross unrealized losses and fair value for available-for-sale securities by length of time that the securities have continuously been in an unrealized loss position:
December 31, 2017 | ||||||||||||||||||||||||
Less than 12 Months | 12 Months or Longer | Total | ||||||||||||||||||||||
Estimated Fair Value | Gross Unrealized Holding Losses | Estimated Fair Value | Gross Unrealized Holding Losses | Estimated Fair Value | Gross Unrealized Holding Losses | |||||||||||||||||||
(in thousands) | ||||||||||||||||||||||||
Fixed maturities: | ||||||||||||||||||||||||
U.S. Treasury securities and obligations of U.S. government agencies | $ | 3,497 | $ | (2 | ) | $ | 5,488 | $ | (12 | ) | $ | 8,985 | $ | (14 | ) | |||||||||
Obligations of states, municipalities and political subdivisions | 7,258 | (36 | ) | 38,143 | (376 | ) | 45,401 | (412 | ) | |||||||||||||||
Corporate and other securities | 30,944 | (98 | ) | 13,444 | (74 | ) | 44,388 | (172 | ) | |||||||||||||||
Asset-backed securities | 27,609 | (108 | ) | 10,706 | (160 | ) | 38,315 | (268 | ) | |||||||||||||||
Residential mortgage-backed securities | 9,081 | (83 | ) | 57,262 | (1,295 | ) | 66,343 | (1,378 | ) | |||||||||||||||
Total fixed maturities | 78,389 | (327 | ) | 125,043 | (1,917 | ) | 203,432 | (2,244 | ) | |||||||||||||||
Equity securities: | ||||||||||||||||||||||||
Exchange traded funds | 130 | — | — | — | 130 | — | ||||||||||||||||||
Nonredeemable preferred stock | 10,649 | (231 | ) | — | — | 10,649 | (231 | ) | ||||||||||||||||
Total equity securities | 10,779 | (231 | ) | — | — | 10,779 | (231 | ) | ||||||||||||||||
Total available-for-sale securities | $ | 89,168 | $ | (558 | ) | $ | 125,043 | $ | (1,917 | ) | $ | 214,211 | $ | (2,475 | ) | |||||||||
88
At December 31, 2017, the Company held 195 fixed maturity securities with a total estimated fair value of $203.4 million and gross unrealized losses of $2.2 million. Of those securities, 126 were in a continuous unrealized loss position for greater than one year. Unrealized losses were caused by interest rate changes or other market factors and were not credit specific issues. At December 31, 2017, 91.1% of the Company’s fixed maturity securities were rated "A-" or better and all of Company's fixed-maturity securities made expected coupon payments under the contractual terms of the securities. At December 31, 2017, the Company held 13 securities in its equity portfolio with a total estimated fair value of $10.8 million and gross unrealized losses of $0.2 million. None of these securities were in a continuous unrealized loss position for greater than one year. Based on its review, the Company concluded that there were no other-than-temporary impairments from fixed maturity or equity securities with unrealized losses for the year ended December 31, 2017.
December 31, 2016 | ||||||||||||||||||||||||
Less than 12 Months | 12 Months or Longer | Total | ||||||||||||||||||||||
Estimated Fair Value | Gross Unrealized Holding Losses | Estimated Fair Value | Gross Unrealized Holding Losses | Estimated Fair Value | Gross Unrealized Holding Losses | |||||||||||||||||||
(in thousands) | ||||||||||||||||||||||||
Fixed maturities: | ||||||||||||||||||||||||
U.S. Treasury securities and obligations of U.S. government agencies | $ | 8,980 | $ | (16 | ) | $ | — | $ | — | $ | 8,980 | $ | (16 | ) | ||||||||||
Obligations of states, municipalities and political subdivisions | 70,727 | (2,960 | ) | — | — | 70,727 | (2,960 | ) | ||||||||||||||||
Corporate and other securities | 50,274 | (145 | ) | 12,375 | (88 | ) | 62,649 | (233 | ) | |||||||||||||||
Asset-backed securities | 14,750 | (232 | ) | 9,961 | (32 | ) | 24,711 | (264 | ) | |||||||||||||||
Residential mortgage-backed securities | 65,439 | (1,403 | ) | 7,186 | (281 | ) | 72,625 | (1,684 | ) | |||||||||||||||
Total fixed maturities | 210,170 | (4,756 | ) | 29,522 | (401 | ) | 239,692 | (5,157 | ) | |||||||||||||||
Equity securities: | ||||||||||||||||||||||||
Exchange traded funds | 388 | (2 | ) | — | — | 388 | (2 | ) | ||||||||||||||||
Total available-for-sale securities | $ | 210,558 | $ | (4,758 | ) | $ | 29,522 | $ | (401 | ) | $ | 240,080 | $ | (5,159 | ) | |||||||||
At December 31, 2016, the Company held 231 fixed maturity securities with a total estimated fair value of $239.7 million and gross unrealized losses of $5.2 million. Of these securities, 24 were in a continuous unrealized loss position for greater than one year. Unrealized losses were caused by interest rate changes or other market factors and were not credit specific issues. At December 31, 2016, 92.6% of the Company’s fixed maturity securities were rated "A-" or better and all of Company's fixed-maturity securities made expected coupon payments under the contractual terms of the securities. Based on its review, the Company concluded that none of the fixed maturity securities with an unrealized loss at December 31, 2016 experienced an other-than-temporary impairment.
Within its equity security portfolio, the Company holds an ETF with exposure across developed and emerging non-U.S. equity markets around the world. This ETF had been in an unrealized loss position for greater than one year and, management concluded based upon its review, it was other-than-temporarily impaired. The Company recognized an impairment loss of $0.3 million on this fund for the year ended December 31, 2016.
89
Contractual maturities of available-for-sale fixed maturity securities
The amortized cost and estimated fair value of available-for-sale fixed maturity securities at December 31, 2017 are summarized, by contractual maturity, as follows:
Amortized | Estimated | |||||||
Cost | Fair Value | |||||||
(in thousands) | ||||||||
Due in one year or less | $ | 50,020 | $ | 49,973 | ||||
Due after one year through five years | 28,979 | 29,299 | ||||||
Due after five years through ten years | 28,733 | 29,800 | ||||||
Due after ten years | 133,612 | 135,983 | ||||||
Asset-backed securities | 95,223 | 95,360 | ||||||
Residential mortgage-backed securities | 85,688 | 84,776 | ||||||
Total fixed maturities | $ | 422,255 | $ | 425,191 | ||||
Expected maturities may differ from contractual maturities because borrowers may have the right to call or prepay obligations with or without call or prepayment penalties, and the lenders may have the right to put the securities back to the borrower.
Net investment income
The following table presents the components of net investment income:
Year Ended December 31, | ||||||||||||
2017 | 2016 | 2015 | ||||||||||
(in thousands) | ||||||||||||
Interest: | ||||||||||||
Taxable bonds | $ | 6,233 | $ | 6,031 | $ | 4,509 | ||||||
Municipal bonds (tax exempt) | 3,619 | 1,808 | 1,514 | |||||||||
Dividends on equity securities | 1,041 | 442 | 372 | |||||||||
Cash equivalents and short-term investments | 678 | 93 | 9 | |||||||||
Gross investment income | 11,571 | 8,374 | 6,404 | |||||||||
Investment expenses | (1,002 | ) | (887 | ) | (761 | ) | ||||||
Net investment income | $ | 10,569 | $ | 7,487 | $ | 5,643 | ||||||
90
Net investment gains and losses
The following table presents net investment gains on investments:
Year Ended December 31, | ||||||||||||
2017 | 2016 | 2015 | ||||||||||
(in thousands) | ||||||||||||
Realized gains: | ||||||||||||
Sales of fixed maturities | $ | 220 | $ | 479 | $ | 63 | ||||||
Sales of short-term and other | — | 2 | 6 | |||||||||
Total realized gains | 220 | 481 | 69 | |||||||||
Realized losses: | ||||||||||||
Sales of fixed maturities | (69 | ) | (29 | ) | (10 | ) | ||||||
Other-than-temporary impairments | — | (276 | ) | — | ||||||||
Total realized losses | (69 | ) | (305 | ) | (10 | ) | ||||||
Net investment gains | $ | 151 | $ | 176 | $ | 59 | ||||||
Change in unrealized gains (losses) of investments
The following table presents the change in available-for-sale gross unrealized gains or losses by investment type:
Year Ended December 31, | ||||||||||||
2017 | 2016 | 2015 | ||||||||||
(in thousands) | ||||||||||||
Change in net unrealized gains (losses): | ||||||||||||
Fixed maturities | $ | 5,239 | $ | (2,952 | ) | $ | (1,937 | ) | ||||
Equity securities | 4,192 | 1,968 | (468 | ) | ||||||||
Net increase (decrease) | $ | 9,431 | $ | (984 | ) | $ | (2,405 | ) | ||||
Insurance – statutory deposits
The Company had invested assets with a carrying value of $7.1 million and $7.0 million on deposit with state regulatory authorities at December 31, 2017 and 2016, respectively.
Payable for investments purchased
The Company recorded a payable for investments purchased, not yet settled, of $1.0 million at December 31, 2017 and $0.6 million at December 31, 2016. These payable were included in the "other liabilities" line item of the balance sheet and were treated as a non-cash transaction for purposes of cash flow presentation.
3. Fair value measurements
Fair value was estimated for each class of financial instrument for which it was practical to estimate fair value. Fair value is defined as the price in the principal market that would be received for an asset to facilitate an orderly transaction between market participants on the measurement date. Market participants are assumed to be independent, knowledgeable, able and willing to transact an exchange and not acting under duress. Fair value hierarchy disclosures are based on the quality of inputs used to measure fair value. The hierarchy gives the highest priority to unadjusted quoted prices in active markets for identical assets or liabilities (Level 1 measurements) and the lowest priority to unobservable inputs (Level 3 measurements). Adjustments to transaction prices or quoted market prices may be required in illiquid or disorderly markets in order to estimate fair value.
91
The three levels of the fair value hierarchy are defined as follows:
Level 1 - Inputs to the valuation methodology are quoted prices (unadjusted) for identical assets or liabilities traded in active markets.
Level 2 - Inputs to the valuation methodology include quoted prices for similar assets or liabilities in active markets, quoted prices for identical or similar assets or liabilities in markets that are not active, inputs other than quoted prices that are observable for the asset or liability and market-corroborated inputs.
Level 3 - Inputs to the valuation methodology are unobservable for the asset or liability and are significant to the fair value measurement.
Fair values of the Company's investment portfolio are estimated using unadjusted prices obtained by its investment manager from nationally recognized third party pricing services, where available. For securities where the Company is unable to obtain fair values from a pricing service or broker, fair values are estimated using information obtained from the Company's investment manager. Management performs several procedures to ascertain the reasonableness of investment values included in the consolidated financial statements at December 31, 2017, including 1) obtaining and reviewing internal control reports from the Company's investment manager that assess fair values from third party pricing services, 2) discussing with the Company's investment manager its process for reviewing and validating pricing obtained from third party pricing services and 3) reviewing the security pricing received from the Company's investment manager and monitoring changes in unrealized gains and losses at the individual security level. The Company has evaluated the various types of securities in its investment portfolio to determine an appropriate fair value hierarchy level based upon trading activity and the observability of market inputs.
The following tables present the balances of assets measured at fair value on a recurring basis as of December 31, 2017 and 2016, by level within the fair value hierarchy.
December 31, 2017 | ||||||||||||||||
Level 1 | Level 2 | Level 3 | Total | |||||||||||||
(in thousands) | ||||||||||||||||
Assets | ||||||||||||||||
Fixed maturities: | ||||||||||||||||
U.S. Treasury securities and obligations of U.S. government agencies | $ | 9,098 | $ | — | $ | — | $ | 9,098 | ||||||||
Obligations of states, municipalities and political subdivisions | — | 164,326 | — | 164,326 | ||||||||||||
Corporate and other securities | — | 71,631 | — | 71,631 | ||||||||||||
Asset-backed securities | — | 95,360 | — | 95,360 | ||||||||||||
Residential mortgage-backed securities | — | 84,776 | — | 84,776 | ||||||||||||
Total fixed maturities | 9,098 | 416,093 | — | 425,191 | ||||||||||||
Equity securities: | ||||||||||||||||
Exchange traded funds | 34,380 | — | — | 34,380 | ||||||||||||
Nonredeemable preferred stock | — | 19,752 | — | 19,752 | ||||||||||||
Total equity securities | 34,380 | 19,752 | — | 54,132 | ||||||||||||
Total | $ | 43,478 | $ | 435,845 | $ | — | $ | 479,323 | ||||||||
92
December 31, 2016 | ||||||||||||||||
Level 1 | Level 2 | Level 3 | Total | |||||||||||||
(in thousands) | ||||||||||||||||
Assets | ||||||||||||||||
Fixed maturities: | ||||||||||||||||
U.S. Treasury securities and obligations of U.S. government agencies | $ | 12,098 | $ | — | $ | — | $ | 12,098 | ||||||||
Obligations of states, municipalities and political subdivisions | — | 123,238 | — | 123,238 | ||||||||||||
Corporate and other securities | — | 118,790 | — | 118,790 | ||||||||||||
Asset-backed securities | — | 73,294 | — | 73,294 | ||||||||||||
Residential mortgage-backed securities | — | 83,803 | — | 83,803 | ||||||||||||
Total fixed maturities | 12,098 | 399,125 | — | 411,223 | ||||||||||||
Equity securities: | ||||||||||||||||
Exchange traded funds | 18,374 | — | — | 18,374 | ||||||||||||
Total | $ | 30,472 | $ | 399,125 | $ | — | $ | 429,597 | ||||||||
There were no transfers into or out of Level 1 and Level 2 during the years ended December 31, 2017 or 2016. There were no assets or liabilities measured at fair value on a nonrecurring basis as of December 31, 2017 or 2016.
Due to the relatively short-term nature of cash, cash equivalents, receivables and payables, their carrying amounts are reasonable estimates of fair value.
4. Deferred policy acquisition costs
The following table presents the amounts of policy acquisition costs deferred and amortized for the years ended:
Year Ended December 31, | ||||||||||||
2017 | 2016 | 2015 | ||||||||||
(in thousands) | ||||||||||||
Balance, beginning of year | $ | 10,150 | $ | (1,696 | ) | $ | (3,763 | ) | ||||
Policy acquisition costs deferred: | ||||||||||||
Direct commissions | 32,927 | 28,027 | 26,142 | |||||||||
Ceding commissions | (9,984 | ) | (9,213 | ) | (34,478 | ) | ||||||
Other underwriting and policy acquisition costs | 2,827 | 2,999 | 3,013 | |||||||||
Policy acquisition costs deferred | 25,770 | 21,813 | (5,323 | ) | ||||||||
Amortization of net policy acquisition costs | (24,145 | ) | (9,967 | ) | 7,390 | |||||||
Balance, end of year | $ | 11,775 | $ | 10,150 | $ | (1,696 | ) | |||||
For the year ended December 31, 2016, the decrease in the deferred ceding commissions and the change in the amortization of net policy acquisition costs were the result of the commutation of the MLQS effective October 1, 2016. The MLQS was not renewed for calendar year 2017. The negative, or liability, balances at December 31, 2015 and 2014 were also due to the effect of the deferred ceding commissions related to the MLQS. See Note 8 for further details regarding the MLQS.
93
5. Underwriting, acquisition and insurance expenses
Underwriting, acquisition and insurance expenses consist of the following:
Year Ended December 31, | ||||||||||||
2017 | 2016 | 2015 | ||||||||||
(in thousands) | ||||||||||||
Underwriting, acquisition and insurance expenses incurred: | ||||||||||||
Direct commissions | $ | 31,001 | $ | 26,715 | $ | 25,241 | ||||||
Ceding commissions | (9,799 | ) | (20,568 | ) | (42,081 | ) | ||||||
Other operating expenses | 22,944 | 22,404 | 19,649 | |||||||||
Total | $ | 44,146 | $ | 28,551 | $ | 2,809 | ||||||
Other operating expenses within underwriting, acquisition and insurance expenses included salaries, employee benefits and bonus expense of $17.7 million, $18.7 million and $15.5 million, for the years ended December 31, 2017, 2016 and 2015, respectively.
6. Income taxes
The Company’s subsidiaries file a consolidated U.S. federal income tax return. Under a tax sharing agreement, KCGI collects from or refunds to its subsidiaries the amount of taxes determined as if KCGI and the subsidiaries filed separate returns. The Company is no longer subject to income tax examination by tax authorities for the years ended before January 1, 2014.
Income tax expense includes the following components for the years ending December 31, 2017, 2016 and 2015:
Year Ended December 31, | ||||||||||||
2017 | 2016 | 2015 | ||||||||||
(in thousands) | ||||||||||||
Current federal income tax expense | $ | 12,555 | $ | 12,808 | $ | 12,163 | ||||||
Deferred federal income tax expense (benefit) | 1,065 | 561 | (879 | ) | ||||||||
Income tax expense | $ | 13,620 | $ | 13,369 | $ | 11,284 | ||||||
The Company paid $13.5 million, $13.3 million and $13.6 million in federal income taxes during the years ended December 31, 2017, 2016 and 2015, respectively. Current income taxes receivable was $0.8 million at December 31, 2017 and income taxes payable was $0.1 million at December 31, 2016, and were included in "other assets" and "other liabilities" in the accompanying consolidated balance sheets.
On December 22, 2017, the President of the United States signed into law the Tax Cuts and Jobs Act of 2017 (the "TCJA"). The legislation significantly changes U.S. tax law by, among other things, lowering corporate income tax rates from 35% to 21%, effective January 1, 2018, and modifying the manner in which property and casualty insurance loss reserves are computed for federal income tax purposes. In computing its taxable income, the Company records a deduction for unpaid losses and loss adjustment expenses. The deduction is discounted using interest rates and loss payment patterns prescribed by the U.S. Treasury. The TCJA changes the prescribed interest rates, which are now based on corporate bond yield curves, and extends the applicable time periods for the loss payment pattern period for long-tailed lines of business. The changes are effective for tax years beginning after 2017
94
with a transition rule that spreads adjustments related to pre-effective-date losses and loss adjustment expenses over the next eight years beginning in 2018.
The Company measures deferred tax assets and liabilities using enacted tax rates that will apply in the years in which the temporary differences are expected to be recovered or paid. Accordingly, the Company’s deferred tax assets and liabilities were remeasured to reflect the reduction in the U.S. corporate income tax rate from 35% to 21%, resulting in a $1.9 million increase in income tax expense and a corresponding decrease in net deferred tax assets as of the enactment date.
U.S. GAAP requires companies to recognize the effect of tax law changes in the period of enactment. The SEC staff issued Staff Accounting Bulletin No. 118 (“SAB 118”) to address the application of U.S. GAAP in situations when a registrant does not have the necessary information available, prepared, or analyzed (including computations) in reasonable detail to complete the accounting for certain income tax effects of the TCJA. The TCJA did not specify the application of certain elements of the legislation and the U.S. Treasury has yet to issue interpretive guidance to specify the loss payment patterns and the corporate bond yield curve under the new law for 2018. The Company has recognized the provisional tax impacts of $3.5 million related to the transition adjustment for loss discounting which has been included in its components of deferred tax assets and liabilities as part of its consolidated financial statements for the year ended December 31, 2017. The ultimate impact may differ from these provisional amounts due to, among other things, additional analysis, changes in interpretations and assumptions the Company has made, additional regulatory guidance that may be issued, and actions the Company may take as a result of the TCJA. The accounting is expected to be complete when the U.S. Treasury issues further guidance.
The Company’s effective income tax rate on income before income taxes differs from the prevailing federal income tax rate and is summarized as follows:
Year ended December 31, | ||||||||||||
2017 | 2016 | 2015 | ||||||||||
(in thousands) | ||||||||||||
Income tax expense at federal income tax rate of 35% | $ | 13,482 | $ | 13,837 | $ | 11,745 | ||||||
Tax-exempt investment income | (1,064 | ) | (528 | ) | (436 | ) | ||||||
Stock options exercised | (471 | ) | — | — | ||||||||
Effect of tax rate change | 1,915 | — | — | |||||||||
Other | (242 | ) | 60 | (25 | ) | |||||||
Total | $ | 13,620 | $ | 13,369 | $ | 11,284 | ||||||
95
The significant components of the net deferred tax asset are summarized as follows:
December 31, | ||||||||
2017 | 2016 | |||||||
(in thousands) | ||||||||
Deferred tax assets: | ||||||||
Unpaid losses and loss adjustment expenses | $ | 7,001 | $ | 4,528 | ||||
Unearned premiums | 3,748 | 5,308 | ||||||
Organizational costs | 230 | 1,513 | ||||||
State operating loss carryforwards | 645 | 476 | ||||||
Allowance for doubtful accounts | 449 | 693 | ||||||
Other | 431 | 438 | ||||||
Deferred tax assets before allowance | 12,504 | 12,956 | ||||||
Less: valuation allowance | (690 | ) | (623 | ) | ||||
Total deferred tax assets | 11,814 | 12,333 | ||||||
Deferred tax liabilities: | ||||||||
Unrealized gain on investments | 2,375 | 620 | ||||||
Deferred policy acquisition costs, net of ceding commissions | 2,473 | 3,553 | ||||||
Intangible assets | 743 | 1,238 | ||||||
Transition adjustment for loss reserve discount | 3,524 | — | ||||||
Other | 207 | 317 | ||||||
Total deferred tax liabilities | 9,322 | 5,728 | ||||||
Net deferred tax asset | $ | 2,492 | $ | 6,605 | ||||
At December 31, 2017 and 2016, the Company had state net operating loss carryforwards ("NOLS") of $13.6 million and $12.2 million, respectively. The state NOLs are available to offset future taxable income or reduce taxes payable and begin expiring in 2029.
Management evaluates the need for a valuation allowance related to its deferred tax assets. At December 31, 2017 and 2016, the Company recorded a tax valuation allowance equal to the state NOLs and the deferred tax assets, net of existing deferred tax liabilities that were expected to reverse in future periods, related to certain state jurisdictions. No other valuation allowances were established against the Company’s deferred tax assets at December 31, 2017 and 2016, as the Company believes that it is more likely than not that the remaining deferred tax assets will be realized given the carry back availability, reversal of existing temporary differences and future taxable income.
96
A reconciliation of the beginning and ending amounts of unrecognized tax benefits for 2017 and 2016 was as follows:
December 31, | ||||||||
2017 | 2016 | |||||||
(in thousands) | ||||||||
Balance at beginning of year | $ | 1,003 | $ | 1,125 | ||||
Deductions for tax positions taken during prior years | (1,003 | ) | (122 | ) | ||||
Balance at end of year | $ | — | $ | 1,003 | ||||
The Company recognized the entire remaining uncertain tax position (UTP) of $1.0 million in the third quarter of 2017 due to lapse of the statute of limitations. The recognition of the UTP had no impact on the effective tax rate as it resulted in a decrease of current taxes and an offsetting increase to deferred taxes.
7. Reserves for unpaid losses and loss adjustment expenses
The reserves for unpaid losses and loss adjustment expenses represent the Company's estimated ultimate cost of all unreported and reported but unpaid insured claims and the cost to adjust these losses that have occurred as of or before the balance sheet date. Reserves are estimated using individual case-basis valuations of reported claims and statistical analyses. Case reserves are established for individual claims that have been reported to the Company, typically by the Company's insureds or their brokers. Based on the information provided, case reserves are established by estimating the ultimate losses from the claim, including defense costs associated with the ultimate settlement of the claim. Incurred-but-not-reported ("IBNR") reserves are determined using actuarial methods to estimate losses that have occurred but have not yet been reported to the Company. The incurred Bornhuetter-Ferguson actuarial method ("BF method") is used to arrive at the Company's loss reserve estimates for each line of business. This method estimates the reserves based on the initial expected loss ratio and expected reporting patterns for losses. Because the Company has a limited number of years of loss experience compared to the period over which losses are expected to be reported, the Company uses industry and peer-group data as a basis for selecting its expected reporting patterns.
As part of the reserving process, the Company reviews historical data and considers the effect of various factors on claims development patterns including polices written on a "claims made" versus "occurrence" basis. Policies written on a claims made basis provide coverage to the insured only for losses incurred during the coverage period, and only if the claim was reported during a specified reporting period. Policies written on an occurrence basis provide coverage to the insured for liabilities arising from events occurring during the term of the policy, regardless of when a claim is actually made. Accordingly, claims related to policies written on an occurrence basis may arise many years after a policy has lapsed. Property losses, while written on an occurrence basis, are generally reported within a short time from the date of loss, and in most instances, property claims are settled and paid within a relatively short period of time.
97
The following table presents a reconciliation of consolidated beginning and ending reserves for unpaid losses and loss adjustment expenses:
December 31, | ||||||||||||
2017 | 2016 | 2015 | ||||||||||
(in thousands) | ||||||||||||
Net reserves for unpaid losses and loss adjustment expenses, beginning of year | $ | 194,602 | $ | 124,126 | $ | 91,970 | ||||||
Commutation of MLQS: | ||||||||||||
2016 MLQS | — | 9,109 | — | |||||||||
2015 MLQS | 27,929 | — | — | |||||||||
2014 MLQS | — | 24,296 | — | |||||||||
2012 MLQS | — | — | 8,587 | |||||||||
27,929 | 33,405 | 8,587 | ||||||||||
Adjusted net reserves for losses and loss adjustment expenses | 222,531 | 157,531 | 100,557 | |||||||||
Incurred losses and loss adjustment expenses: | ||||||||||||
Current year | 114,960 | 83,675 | 51,434 | |||||||||
Prior year | (11,280 | ) | (12,714 | ) | (9,196 | ) | ||||||
Total net losses and loss adjustment expenses incurred | 103,680 | 70,961 | 42,238 | |||||||||
Payments: | ||||||||||||
Current year | 13,792 | 5,494 | 2,226 | |||||||||
Prior year | 44,926 | 28,396 | 16,443 | |||||||||
Total payments | 58,718 | 33,890 | 18,669 | |||||||||
Net reserves for unpaid losses and loss adjustment expenses, end of year | 267,493 | 194,602 | 124,126 | |||||||||
Reinsurance recoverable on unpaid losses | 48,224 | 70,199 | 95,503 | |||||||||
Gross reserves for unpaid losses and loss adjustment expenses, end of year | $ | 315,717 | $ | 264,801 | $ | 219,629 | ||||||
During the year ended December 31, 2017, our net incurred losses for accident years 2016 and prior developed favorably by $11.3 million. This favorable development included $9.4 million for the 2016 accident year, $4.2 million for the 2015 accident year and $1.8 million for accident year 2014. This favorable development was primarily due to reported losses emerging at a lower level than expected, across most lines of business. The favorable development was offset in part by adverse development of $2.1 million for the 2013 accident year, $1.3 million for the 2012 accident year and $0.7 million for the 2011 accident year. The unfavorable development was primarily attributable to claims on the other liability occurrence line of business.
During the year ended December 31, 2016, our net incurred losses for accident years 2015 and prior developed favorably by $12.7 million. This favorable development included $6.1 million for the 2015 accident year and $6.6 million of favorable development for accident years 2014 and prior. The favorable development was primarily due to reported losses emerging at a lower level than expected, across most lines of business.
During the year ended December 31, 2015, our net incurred losses for accident years 2014 and prior developed favorably by $9.2 million. This favorable development included $6.5 million for the 2014 accident year and $2.7 million of favorable development for accident years 2013 and prior. The favorable development was primarily due to reported losses emerging at a lower level than expected, particularly on the medical malpractice and professional liability lines of business.
Incurred and Paid Claims Development
The following is information about incurred and paid claims development as of December 31, 2017, net of reinsurance, as well as cumulative claim frequency and the total of IBNR liabilities plus expected development on reported claims included within the net incurred claims amounts. The development and claims duration tables below exclude the commuted MLQS contracts,
98
which would distort development patterns related to those transactions. See Note 8 for further details regarding the commutation of the MLQS. Cumulative number of reported claims is reported on a per claim basis.
The information about incurred and paid claims development for the years ended December 31, 2016 to December 31, 2010, is presented as unaudited supplementary information.
Property
Incurred Claims and Claim Adjustment Expenses, Net of Reinsurance | |||||||||||||||||||||||||||
For the Years Ended December 31, | As of December 31, 2017 | ||||||||||||||||||||||||||
Accident Year | 2013 Unaudited | 2014 Unaudited | 2015 Unaudited | 2016 Unaudited | 2017 | Total of IBNR Liabilities Plus Expected Development on Reported Claims | Cumulative Number of Reported Claims | ||||||||||||||||||||
($ in thousands) | |||||||||||||||||||||||||||
2013 | $ | 417 | $ | 205 | $ | 103 | $ | 88 | $ | 81 | $ | — | 7 | ||||||||||||||
2014 | 1,561 | 1,344 | 1,240 | 1,222 | 5 | 28 | |||||||||||||||||||||
2015 | 1,394 | 880 | 857 | 26 | 63 | ||||||||||||||||||||||
2016 | 4,177 | 3,392 | 85 | 282 | |||||||||||||||||||||||
2017 | 12,473 | 624 | 998 | ||||||||||||||||||||||||
Total | $ | 18,025 | |||||||||||||||||||||||||
Cumulative Paid Claims and Allocated Claim Adjustment Expenses, Net of Reinsurance | ||||||||||||||||||||
For the Years Ended December 31, | ||||||||||||||||||||
Accident Year | 2013 Unaudited | 2014 Unaudited | 2015 Unaudited | 2016 Unaudited | 2017 | |||||||||||||||
($ in thousands) | ||||||||||||||||||||
2013 | $ | 99 | $ | 81 | $ | 81 | $ | 81 | $ | 81 | ||||||||||
2014 | 169 | 1,217 | 1,217 | 1,217 | ||||||||||||||||
2015 | 584 | 706 | 832 | |||||||||||||||||
2016 | 1,867 | 3,257 | ||||||||||||||||||
2017 | 9,938 | |||||||||||||||||||
Total | 15,325 | |||||||||||||||||||
All outstanding liabilities before 2013, net of reinsurance | — | |||||||||||||||||||
Liabilities for claims and claim adjustment expenses, net of reinsurance | $ | 2,700 | ||||||||||||||||||
Historical Claims Duration
The following is supplementary information about average historical claims duration as of December 31, 2017:
Average Annual Percentage Payout of Incurred Claims by Age, Net of Reinsurance | |||||||||||||||
Years | 1 | 2 | 3 | 4 | 5 | ||||||||||
Property | 67.9 | % | 29.6 | % | 4.9 | % | — | % | — | % | |||||
99
Casualty - Claims Made
Incurred Claims and Claim Adjustment Expenses, Net of Reinsurance | |||||||||||||||||||||||||||||||||||||||
For the Years Ended December 31, | As of December 31, 2017 | ||||||||||||||||||||||||||||||||||||||
Accident Year | 2010 Unaudited | 2011 Unaudited | 2012 Unaudited | 2013 Unaudited | 2014 Unaudited | 2015 Unaudited | 2016 Unaudited | 2017 | Total of IBNR Liabilities Plus Expected Development on Reported Claims | Cumulative Number of Reported Claims | |||||||||||||||||||||||||||||
($ in thousands) | |||||||||||||||||||||||||||||||||||||||
2010 | $ | 778 | $ | 805 | $ | 679 | $ | 737 | $ | 946 | $ | 916 | $ | 894 | $ | 883 | $ | 24 | 14 | ||||||||||||||||||||
2011 | 4,246 | 3,844 | 3,646 | 3,609 | 3,560 | 3,374 | 3,261 | 199 | 76 | ||||||||||||||||||||||||||||||
2012 | 7,913 | 5,749 | 4,205 | 3,102 | 2,845 | 2,477 | 576 | 138 | |||||||||||||||||||||||||||||||
2013 | 15,238 | 11,639 | 9,113 | 7,917 | 7,002 | 1,519 | 226 | ||||||||||||||||||||||||||||||||
2014 | 18,847 | 14,289 | 11,748 | 11,217 | 3,247 | 271 | |||||||||||||||||||||||||||||||||
2015 | 18,883 | 16,777 | 14,896 | 5,412 | 252 | ||||||||||||||||||||||||||||||||||
2016 | 19,170 | 14,694 | 9,162 | 303 | |||||||||||||||||||||||||||||||||||
2017 | 18,116 | 15,373 | 335 | ||||||||||||||||||||||||||||||||||||
Total | $ | 72,546 | |||||||||||||||||||||||||||||||||||||
Cumulative Paid Claims and Allocated Claim Adjustment Expenses, Net of Reinsurance | ||||||||||||||||||||||||||||||||
For the Years Ended December 31, | ||||||||||||||||||||||||||||||||
Accident Year | 2010 Unaudited | 2011 Unaudited | 2012 Unaudited | 2013 Unaudited | 2014 Unaudited | 2015 Unaudited | 2016 Unaudited | 2017 | ||||||||||||||||||||||||
($ in thousands) | ||||||||||||||||||||||||||||||||
2010 | $ | — | $ | 79 | $ | 368 | $ | 393 | $ | 862 | $ | 859 | $ | 859 | $ | 859 | ||||||||||||||||
2011 | 139 | 1,037 | 1,392 | 2,116 | 3,044 | 3,042 | 3,042 | |||||||||||||||||||||||||
2012 | 153 | 475 | 877 | 1,024 | 1,090 | 1,882 | ||||||||||||||||||||||||||
2013 | 499 | 1,915 | 4,436 | 5,070 | 5,320 | |||||||||||||||||||||||||||
2014 | 435 | 1,865 | 5,039 | 6,384 | ||||||||||||||||||||||||||||
2015 | 217 | 4,496 | 7,562 | |||||||||||||||||||||||||||||
2016 | 1,158 | 3,015 | ||||||||||||||||||||||||||||||
2017 | 340 | |||||||||||||||||||||||||||||||
Total | 28,404 | |||||||||||||||||||||||||||||||
Liabilities for claims and claim adjustment expenses, net of reinsurance | $ | 44,142 | ||||||||||||||||||||||||||||||
Casualty - Occurrence
Incurred Claims and Claim Adjustment Expenses, Net of Reinsurance | |||||||||||||||||||||||||||||||||||||||
For the Years Ended December 31, | As of December 31, 2017 | ||||||||||||||||||||||||||||||||||||||
Accident Year | 2010 Unaudited | 2011 Unaudited | 2012 Unaudited | 2013 Unaudited | 2014 Unaudited | 2015 Unaudited | 2016 Unaudited | 2017 | Total of IBNR Liabilities Plus Expected Development on Reported Claims | Cumulative Number of Reported Claims | |||||||||||||||||||||||||||||
($ in thousands) | |||||||||||||||||||||||||||||||||||||||
2010 | $ | 843 | $ | 771 | $ | 531 | $ | 460 | $ | 458 | $ | 404 | $ | 406 | $ | 429 | $ | 76 | 47 | ||||||||||||||||||||
2011 | 5,839 | 5,940 | 5,757 | 7,340 | 7,613 | 8,142 | 8,375 | 641 | 214 | ||||||||||||||||||||||||||||||
2012 | 16,977 | 17,436 | 18,803 | 20,401 | 20,579 | 22,001 | 2,416 | 554 | |||||||||||||||||||||||||||||||
2013 | 30,616 | 28,771 | 28,037 | 29,039 | 31,731 | 6,371 | 784 | ||||||||||||||||||||||||||||||||
2014 | 47,805 | 40,668 | 38,049 | 36,678 | 13,822 | 1,059 | |||||||||||||||||||||||||||||||||
2015 | 59,717 | 51,739 | 49,122 | 25,959 | 1,130 | ||||||||||||||||||||||||||||||||||
2016 | 61,440 | 55,680 | 39,527 | 938 | |||||||||||||||||||||||||||||||||||
2017 | 71,126 | 63,393 | 712 | ||||||||||||||||||||||||||||||||||||
Total | $ | 275,142 | |||||||||||||||||||||||||||||||||||||
100
Cumulative Paid Claims and Allocated Claim Adjustment Expenses, Net of Reinsurance | ||||||||||||||||||||||||||||||||
For the Years Ended December 31, | ||||||||||||||||||||||||||||||||
Accident Year | 2010 Unaudited | 2011 Unaudited | 2012 Unaudited | 2013 Unaudited | 2014 Unaudited | 2015 Unaudited | 2016 Unaudited | 2017 | ||||||||||||||||||||||||
($ in thousands) | ||||||||||||||||||||||||||||||||
2010 | $ | 4 | $ | 37 | $ | 59 | $ | 113 | $ | 263 | $ | 261 | $ | 273 | $ | 309 | ||||||||||||||||
2011 | 207 | 1,596 | 2,519 | 3,788 | 4,575 | 6,363 | 6,868 | |||||||||||||||||||||||||
2012 | 757 | 4,441 | 7,850 | 11,238 | 14,382 | 16,474 | ||||||||||||||||||||||||||
2013 | 1,099 | 4,469 | 7,957 | 14,890 | 21,348 | |||||||||||||||||||||||||||
2014 | 698 | 3,081 | 8,489 | 17,576 | ||||||||||||||||||||||||||||
2015 | 941 | 3,161 | 12,685 | |||||||||||||||||||||||||||||
2016 | 1,099 | 6,015 | ||||||||||||||||||||||||||||||
2017 | 1,581 | |||||||||||||||||||||||||||||||
Total | 82,856 | |||||||||||||||||||||||||||||||
Liabilities for claims and claim adjustment expenses, net of reinsurance | $ | 192,286 | ||||||||||||||||||||||||||||||
Historical Claims Duration
The following is supplementary information about average historical claims duration as of December 31, 2017:
Average Annual Percentage Payout of Incurred Claims by Age, Net of Reinsurance | ||||||||||||||||||||||||
Years | 1 | 2 | 3 | 4 | 5 | 6 | 7 | 8 | ||||||||||||||||
Casualty - claims made | 4.1 | % | 17.7 | % | 24.1 | % | 10.4 | % | 21.9 | % | 10.5 | % | — | % | — | % | ||||||||
Casualty - occurrence | 2.3 | % | 10.2 | % | 12.8 | % | 18.0 | % | 19.8 | % | 10.1 | % | 4.4 | % | 8.5 | % | ||||||||
Reconciliation of Incurred and Paid Claims Development to the Liability for Unpaid Claims and Claim Adjustment Expenses
The reconciliation of the net incurred and paid claims development tables to the liability for claims and claim adjustment expenses in the consolidated statement of financial position is as follows:
(in thousands) | December 31, 2017 | |||
Net outstanding liabilities | ||||
Property | $ | 2,700 | ||
Casualty - claims made | 44,142 | |||
Casualty - occurrence | 192,286 | |||
Liabilities for unpaid claims and claim adjustment expenses, net of reinsurance | 239,128 | |||
Reinsurance recoverable on unpaid claims | ||||
Property | 2,018 | |||
Casualty - claims made | 7,092 | |||
Casualty - occurrence | 39,114 | |||
Total reinsurance recoverable on unpaid claims | 48,224 | |||
Unallocated claims adjustment expenses | 28,365 | |||
Gross liability for unpaid claims and claim adjustment expense | $ | 315,717 | ||
101
8. Reinsurance
The Company purchases reinsurance from other insurance companies ("reinsurers") in order to limit its exposure to large losses and enable it to underwrite policies with sufficient limits to meet policyholder needs. In a reinsurance transaction, an insurance company transfers, or cedes, part or all of its exposure to the reinsurer that receives a portion of the premium. The ceding of insurance does not legally discharge the Company from its primary liability for the full amount of the policy coverage, and therefore the Company will be required to pay the loss and bear collection risk if the reinsurer fails to meet its obligations under the reinsurance agreement.
The following table summarizes the effect of reinsurance on premiums written and earned:
Year Ended December 31, | ||||||||||||
2017 | 2016 | 2015 | ||||||||||
(in thousands) | ||||||||||||
Written: | ||||||||||||
Direct | $ | 223,191 | $ | 188,440 | $ | 176,865 | ||||||
Assumed | — | 38 | 144 | |||||||||
Ceded | (33,719 | ) | (21,214 | ) | (92,991 | ) | ||||||
Net written | $ | 189,472 | $ | 167,264 | $ | 84,018 | ||||||
Earned: | ||||||||||||
Direct | $ | 209,426 | $ | 180,794 | $ | 170,401 | ||||||
Assumed | — | 53 | 148 | |||||||||
Ceded | (33,373 | ) | (47,031 | ) | (96,227 | ) | ||||||
Net earned | $ | 176,053 | $ | 133,816 | $ | 74,322 | ||||||
Incurred losses and loss adjustment expenses were net of reinsurance recoverables (ceded incurred losses and loss adjustment expenses) of $12.2 million, $13.7 million and $41.2 million for the years ended December 31, 2017, 2016 and 2015, respectively.
Multi-line quota share reinsurance
The Company participated in a MLQS treaty that transferred a proportion of the risk related to certain lines of business written by its subsidiary, Kinsale Insurance, to reinsurers that received a proportion of the direct written premiums on that business. The Company's MLQS contract also reduced the amount of capital required to support the insurance operations of Kinsale Insurance. Under the terms of the MLQS contract, the Company received a provisional ceding commission and paid a reinsurance margin, as long as the reinsurers were not in a loss position on the contract. The MLQS contract included a sliding scale commission provision that reduced or increased the ceding commission based on the loss experience of the business ceded. Under the contract, the Company was entitled to an additional contingent profit commission up to an amount equal to all of the reinsurers’ profits above the margin based on the underwriting results of the business ceded, upon commutation of the contract. The contracts had a loss ratio cap of 110%, which restricted the Company from ceding any losses in excess of 110% of ceded earned premiums to the reinsurers. As a result of the initial public offering, the Company did not renew the MLQS treaty for calendar year 2017.
Under the terms of the MLQS covering the period January 1, 2015 to December 31, 2015 (the "2015 MLQS"), the Company received a provisional ceding commission equal to 41% of ceded written premiums and paid a reinsurance margin equal to 4.00% of ceded written premium. The 2015 MLQS contract included a sliding scale commission
102
provision that can adjust the ceding commissions within a range of 25% to 41% based on the loss experience of the business ceded. The 2015 MLQS ceding percentage was 50% until October 1, 2015, at which time the Company decreased the percentage to 40%. The change in the ceding percentage reduced ceded written premiums by $6.8 million at October 1, 2015, with a corresponding reduction to ceded unearned premiums.
The terms of the MLQS covering the period January 1, 2016 to December 31, 2016 (the "2016 MLQS") were largely consistent with the 2015 MLQS. However, effective January 1, 2016, the Company further reduced the ceding percentage from 40% to 15%. The change in the ceding percentage reduced ceded written premiums by $17.0 million at January 1, 2016, with a corresponding reduction to ceded unearned premiums.
The following table summarizes the amounts related to the MLQS contracts:
Years Ended December 31, | ||||||||
2016 | 2015 | |||||||
(in thousands) | ||||||||
Ceded earned premiums | $ | 16,996 | $ | 67,950 | ||||
Ceded losses and loss adjustment expenses | 4,380 | 30,978 | ||||||
Ceding commissions earned | 11,936 | 34,254 | ||||||
Reinsurers' margin incurred | $ | 680 | $ | 2,718 | ||||
Commutations of the MLQS
Effective December 31, 2014, 45% of the contract covering the period July 1, 2012 to December 31, 2013 (the "2012 MLQS") was commuted, and the remaining 55% of this contract was commuted effective January 1, 2015. The commutation reduced reinsurance recoverables on unpaid losses and receivable from reinsurers by $9.7 million at December 31, 2014 and $11.9 million at January 1, 2015, with a corresponding reduction to funds held for reinsurers, respectively.
Effective January 1, 2016, the Company commuted the 2014 MLQS, which reduced reinsurance recoverables on unpaid losses and receivable from reinsurers by $34.2 million, with a corresponding reduction to funds held for reinsurers. Effective October 1, 2016, the Company terminated and commuted the 2016 MLQS. The commutation reduced reinsurance recoverables on unpaid losses and receivable from reinsurers by approximately $15.5 million with a corresponding reduction to funds held for reinsurers.
Effective January 1, 2017, the Company commuted the 2015 MLQS. The commutation reduced reinsurance recoverables on unpaid losses and receivable from reinsurers by approximately $36.5 million, with a corresponding reduction to funds held for reinsurers. There are no remaining MLQS contracts outstanding as of January 1, 2017.
Funds-Held Account
The Company maintained a funds-held account for the reinsurers who were a party to the MLQS contracts, which was credited with interest at a rate equal to the 10 year U.S. Treasury rate plus a spread (150 basis points), subject to a 4% minimum. The funds-held account represented the excess of the ceded written premium and interest credited over ceded paid losses and LAE, the Company’s ceding commission and the reinsurers’ margin. Assets supporting the funds-held liability were not segregated or restricted. The funds-held account, shown as a liability on the accompanying consolidated balance sheets, was $36.5 million at December 31, 2016.
103
Reinsurance balances
Credit risk exists with reinsurance ceded to the extent that any reinsurer is unable to meet the obligations assumed under the reinsurance agreements. Reinsurance recoverables for unpaid losses were $48.2 million and $70.2 million, at December 31, 2017 and 2016, respectively. Reinsurance recoverables for paid losses were $1.4 million at December 31, 2017. There were no significant reinsurance recoverables for paid losses at December 31, 2016. Ceded unearned premiums related to reinsurance were $13.9 million and $13.5 million, at December 31, 2017 and 2016, respectively. Allowances are established for amounts deemed uncollectible. The Company evaluates the financial condition of its reinsurers and monitors concentration of credit risk arising from its exposure to individual reinsurers. All reinsurance receivables are from companies with A.M. Best ratings of "A" (Excellent) or better. To further reduce credit exposure to reinsurance recoverable balances, the Company has received letters of credit from certain reinsurers that are not authorized as reinsurers under U.S. state insurance regulations. The Company has not recorded an allowance for doubtful accounts related to its reinsurance balances at December 31, 2017 and 2016 and believes this to be appropriate after consideration of all currently available information; however, the deterioration in the credit quality of existing reinsurers or disputes over reinsurance agreements could result in future charges.
At December 31, 2017, the net reinsurance receivable, defined as the sum of paid and unpaid reinsurance recoverables and ceded unearned premiums less reinsurance payables, from five reinsurers represented 92.4% of the total balance.
9. Stockholders’ equity
Amendment of Certificate of Incorporation and Reclassification of Common Stock
At January 1, 2016, the Company was authorized to issue 18,333,333 shares of Common Stock, $0.0001 par value per share ("Common Stock"), of which 15,000,000 shares were designated as Class A Common Voting Shares ("Class A Common Stock") and 3,333,333 were designated as Class B Common Non-Voting Shares ("Class B Common Stock"). On July 28, 2016, in connection with the IPO as discussed below, the Company amended and restated its certificate of incorporation to recapitalize the Company’s authorized capital stock to consist of 400,000,000 shares of common stock, par value $0.01 per share, and 100,000,000 shares of preferred stock, par value $0.01 per share. There were no shares of preferred stock issued or outstanding at December 31, 2017 or December 31, 2016.
In addition, the amended and restated certificate of incorporation provided for automatic reclassification of the Company’s Class A Common Stock and Class B Common Stock into a single class of common stock. All shares of Class A Common Stock were equal to the sum of:
• | the number of shares of common stock equal to the amount of accrued and unpaid dividends based on a reclassification date of July 28, 2016, or $90.3 million, divided by the IPO price of $16.00 per share, plus |
• | the number of shares of common stock equal to a conversion ratio of 0.65485975, calculated based on the IPO price of $16.00 per share. |
On July 28, 2016, the Company had outstanding grants of 1,783,858 restricted shares of Class B Common Stock. At that date, all restricted shares of Class B Common Stock were reclassified into 1,286,036 shares of common stock equal to a conversion ratio of 0.72095061. The conversion ratio was calculated based on the IPO price of $16.00 per share.
All fractional shares resulting from the reclassification of Class A Common Stock and Class B Common Stock into a single class of common stock were settled in cash.
104
Initial Public Offering
On August 2, 2016, the Company completed its IPO of 7,590,000 shares of common stock at a price to the public of $16.00 per share. The Company issued 5,000,000 shares of common stock and the selling stockholders sold 2,590,000 shares of common stock, which included 990,000 shares sold to the underwriters pursuant to the underwriter’s option to purchase additional shares. After underwriter discounts and commissions and offering expenses, the Company received net proceeds from the offering of approximately $72.8 million. The Company did not receive any net proceeds from the sale of shares of common stock by the selling stockholders. The issuance of common stock by the Company and the related net proceeds were recorded in the consolidated financial statements on the closing date of the IPO.
On December 6, 2016, the Company completed a follow-on offering of 3,864,000 shares of common stock at a price of $27.50 per share, which included 504,000 shares sold to the underwriters pursuant to their over-allotment option. All of the shares in the offering were offered by the selling stockholders. The Company did not receive any proceeds from the offering.
On May 17, 2017, the Company completed a second follow-on offering of 4,557,774 shares of common stock at a price of $33.00 per share, which included 594,492 shares sold to the underwriters pursuant to their over-allotment option. All of the shares in the offering were offered by the selling stockholders. The Company did not receive any proceeds from the offering.
Changes in the shares of outstanding common stock were as follows:
Year Ended December 31, | |||||||||
2017 | 2016 | 2015 | |||||||
Common Shares Outstanding: | |||||||||
Balance at beginning of year | 20,968,707 | — | — | ||||||
Shares issued from equity-based compensation | 67,380 | — | — | ||||||
Reclassification | — | 15,968,707 | — | ||||||
Shares issued | — | 5,000,000 | — | ||||||
Balance at end of year | 21,036,087 | 20,968,707 | — | ||||||
Class A Common Stock Outstanding: | |||||||||
Shares outstanding at beginning of year | — | 13,803,183 | 13,795,530 | ||||||
Share dividend | — | 8,617,963 | — | ||||||
Reclassification | — | (22,421,146 | ) | — | |||||
Other | — | — | 7,653 | ||||||
Shares outstanding at end of year | — | — | 13,803,183 | ||||||
Class B Common Stock Outstanding: | |||||||||
Shares outstanding at beginning of year | — | 1,513,592 | 1,287,696 | ||||||
Restricted stock grants vested | — | 270,266 | 225,896 | ||||||
Reclassification | — | (1,783,858 | ) | — | |||||
Shares outstanding at end of year | — | — | 1,513,592 | ||||||
105
Dividend Declaration
On February 1, 2017, the Company’s Board of Directors declared a cash dividend of $0.06 per share of common stock. This dividend was paid on March 15, 2017 to all stockholders of record on February 15, 2017.
On May 25, 2017, the Company’s Board of Directors declared a cash dividend of $0.06 per share of common stock. This dividend was paid on June 15, 2017 to all stockholders of record on June 5, 2017.
On August 10, 2017, the Company’s Board of Directors declared a cash dividend of $0.06 per share of common stock. This dividend was paid on September 15, 2017 to all stockholders of record on August 31, 2017.
On November 8, 2017, the Company’s Board of Directors declared a cash dividend of $0.06 per share of common stock. This dividend was paid on December 15, 2017 to all stockholders of record on November 30, 2017.
On February 12, 2018, the Company’s Board of Directors declared a cash dividend of $0.07 per share of common stock. This dividend is payable on March 15, 2018 to all stockholders of record on February 28, 2018.
Equity-based Compensation
Stock Options
On July 27, 2016, the Kinsale Capital Group, Inc. 2016 Omnibus Incentive Plan (the "2016 Incentive Plan") became effective. The 2016 Incentive Plan provides for grants of stock options, stock appreciation rights, restricted stock, other stock-based awards and other cash-based awards to directors, officers and other employees, as well as independent contractors or consultants providing consulting or advisory services to the Company. The number of shares of common stock available for issuance under the 2016 Incentive Plan may not exceed 2,073,832. On July 27, 2016, the Board of Directors approved, and the Company granted, 1,036,916 stock options with an exercise price equal to the IPO price of $16.00 per share. The options have a maximum contractual term of 10 years and will vest in 4 equal annual installments following the date of the grant.
The value of the options granted was estimated at the date of grant using the Black-Scholes pricing model using the following assumptions:
Risk-free rate of return | 1.26 | % | |
Dividend yield | 1.25 | % | |
Expected share price volatility(1) | 18.50 | % | |
Expected life in years(2) | 6.3 years | ||
(1) | Expected volatility was based on the Company’s competitors within the industry. |
(2) | Expected life was calculated using the simplified method, which was an average of the contractual term of the option and its ordinary vesting period, as the Company did not have sufficient historical data for determining the expected term of our stock option awards. |
106
A summary of option activity under the employee share option plan as of December 31, 2017, and changes during the year then ended is presented below:
Number of Shares | Weighted-average exercise price | Weighted-average remaining years of contractual life | Aggregate intrinsic value (in thousands) | ||||||||||
Outstanding at January 1, 2017 | 1,018,942 | $ | 16.00 | ||||||||||
Granted | — | — | |||||||||||
Forfeited | (21,122 | ) | 16.00 | ||||||||||
Exercised | (67,380 | ) | 16.00 | ||||||||||
Outstanding at December 31, 2017 | 930,440 | $ | 16.00 | 8.5 years | $ | 26,983 | |||||||
Exercisable at December 31, 2017 | 219,063 | $ | 16.00 | 8.5 years | $ | 6,353 | |||||||
The weighted average grant date fair value of options granted during 2016 was $2.71 per share. The total intrinsic value of options exercised during the year ended December 31, 2017 was $1.5 million. There were no options exercised during 2016.
The following table summarizes nonvested share-based awards under the 2016 Incentive Plan as of December 31, 2017:
December 31, 2017 | |||||||
Number of Awards | Weighted Average Grant-Date Fair Value | ||||||
Nonvested awards, beginning of year | 970,942 | $ | 16.00 | ||||
Granted | — | — | |||||
Vested | (239,043 | ) | 16.00 | ||||
Forfeited | (21,122 | ) | 16.00 | ||||
Nonvested awards, end of year | 710,777 | $ | 16.00 | ||||
As of December 31, 2017, the Company had $1.7 million of unrecognized share-based compensation expense expected to be charged to earnings over a weighted-average period of 2.5 years. The total fair value of shares vested during the years ended December 31, 2017 and 2016 was $6.9 million and $0.9 million, respectively.
Restricted Stock Grants
Prior to the IPO, under the Kinsale Capital Group, Inc. 2010 Incentive Plan (the "2010 Incentive Plan"), the Company granted shares of restricted Class B Common Stock to certain directors, executive officers, and employees. In connection with the reclassification on July 28, 2016, all unvested shares of Class B Common Stock were immediately vested and reclassified into a single class of common stock. The 2010 Incentive Plan was then terminated upon the completion of the IPO.
In 2015, pursuant to the 2010 Incentive Plan, the Compensation Committee awarded restricted stock grants of 33,500 to certain directors, executive officers, and employees, which had a total grant-date fair value of $40 in 2015. The fair value of the Company’s share-based awards that vested was $0.1 million in each of the years ended December 31, 2016 and 2015. The fair value of the Company’s restricted stock grants was determined based on a valuation of Class B Common Stock on the grant date using a binomial lattice option pricing model. The model the Company used to value the Class B Common Stock, like any option pricing model for a nonpublic security, required
107
the input of highly subjective assumptions including the underlying security price, strike price, risk-free rate of return, expected term and expected stock price volatility. The underlying security price was based on the Company’s book value of equity and the application of a multiple of tangible equity. The strike price was based on the liquidation preference of the Company’s Class A Common Stock at the grant date. The risk-free interest rate was based on the U.S. Treasury rate at the date of the grant. The expected term was based on an equal chance for a liquidity event at any time between 0 years and 0.50 years from the grant date. The expected stock volatility was based on stock price volatility using a set of comparable publicly traded companies.
The Company recognized total equity-based compensation expense of $0.7 million, $0.5 million and $0.1 million for the years ended December 31, 2017, 2016 and 2015, respectively.
Subsequent Event
The Board of Directors granted 6,666 shares of restricted stock on January 1, 2018 under the 2016 Incentive Plan to the Company’s non-employee directors. The restricted stock had a fair value on the date of grant of $45.00 per share and will vest over a 1 year period.
108
10. Earnings per share
The following table represents a reconciliation of the numerator and denominator of the basic and diluted earnings per share computations contained in the consolidated financial statements:
Year ended December 31, | ||||||||||||
2017 | 2016 | 2015 | ||||||||||
(in thousands, except per share data) | ||||||||||||
Earnings allocable to Common stockholders | $ | 24,901 | $ | 11,782 | $ | — | ||||||
Earnings allocable to Class A stockholders | $ | — | $ | 13,625 | $ | 21,092 | ||||||
Earnings allocable to Class B stockholders | $ | — | $ | 760 | $ | 1,181 | ||||||
Basic earnings per share: | ||||||||||||
Common stock | $ | 1.19 | $ | 0.57 | $ | — | ||||||
Class A common stock | $ | — | $ | 0.98 | $ | 1.53 | ||||||
Class B common stock | $ | — | $ | 0.48 | $ | 0.84 | ||||||
Diluted earnings per share: | ||||||||||||
Common stock | $ | 1.16 | $ | 0.56 | $ | — | ||||||
Class A common stock | $ | — | $ | 0.98 | $ | 1.53 | ||||||
Class B common stock | $ | — | $ | 0.46 | $ | 0.81 | ||||||
Basic weighted average shares outstanding: | ||||||||||||
Common stock | 20,992 | 20,841 | — | |||||||||
Class A common stock | — | 13,844 | 13,796 | |||||||||
Class B common stock | — | 1,574 | 1,413 | |||||||||
Dilutive effect of shares issued under stock compensation arrangements: | ||||||||||||
Common stock - stock options | 506 | 232 | — | |||||||||
Class B common stock - unvested restricted stock grants | — | 70 | 39 | |||||||||
Diluted weighted average shares outstanding: | ||||||||||||
Common stock | 21,498 | 21,073 | — | |||||||||
Class A common stock | — | 13,844 | 13,796 | |||||||||
Class B common stock | — | 1,644 | 1,452 | |||||||||
Prior to the reclassification of common stock on July 28, 2016, all of the earnings of the Company were allocated to Class A and Class B common stock and earnings per share was calculated using the two-class method. Under the two-class method, earnings attributable to Class A and Class B common stockholders were determined by allocating undistributed earnings to each class of stock. The undistributed earnings attributable to common stockholders were allocated based on the contractual participation rights of the Class A common stock and Class B common stock as if those earnings for the period had been distributed. Earnings attributable to Class A common stockholders equaled the sum of dividends at the rate per annum of 12% compounding annually during the period ("Accruing Dividends") plus seventy-five percent of any remaining assets of the Company available for distribution to its stockholders in the event of a liquidation, dissolution, winding up or sale of the Company after payment of the Accruing Dividends ("Residual Proceeds"). Earnings attributable to Class B common stockholders equaled twenty-five percent of the Residual Proceeds. After the reclassification of common stock on July 28, 2016, all of the earnings of the Company were attributable to the single class of common stock.
109
Basic earnings per share for each class of common stock was computed by dividing the earnings attributable to the common stockholders by the weighted average number of shares of each respective class of common stock outstanding during the period. Diluted earnings per share attributable to each class of common stock was computed by dividing earnings attributable to common stockholders by the weighted average shares outstanding for each respective class of common stock outstanding during the period, including potentially dilutive shares of common stock for the period determined using the treasury stock method. There were no potentially dilutive shares attributable to Class A common stockholders. For purposes of the diluted earnings per share attributable to Class B common stockholders calculation, unvested restricted grants of common stock were considered to be potentially dilutive shares of common stock. There were no material anti-dilutive Class B shares for the years ended December 31, 2016 and 2015. See Note 9, "Stockholders' Equity," for details regarding changes to the Company’s capital structure on July 28, 2016.
There were no anti-dilutive stock options for the years ended December 31, 2017 and 2016.
11. Credit agreement
In June 2013, KCGI entered into a loan and security agreement (as amended, the "Credit Agreement") with The PrivateBank and Trust Company ("PrivateBank") to obtain a five-year secured term loan in the amount of $17.5 million. Pursuant to the terms of the Credit Agreement, the applicable interest rate was 3-month LIBOR plus a margin. The term loan had initial maturity of June 30, 2018. KCGI's wholly-owned subsidiaries, KMI and Aspera, were guarantors of the term loan. The assets of KMI and the stock of Kinsale Insurance were pledged as collateral to PrivateBank.
On March 10, 2014 and September 29, 2014, the Company amended the Credit Agreement with PrivateBank to increase the term loan commitment to $25.0 million and $28.0 million, respectively. On December 4, 2015, the Company amended the Credit Agreement to increase the term loan commitment to $30.0 million and extended the term loan maturity to December 4, 2020.
On September 30, 2016, the Company repaid $2.5 million of the term loan and, on December 8, 2016, repaid the total remaining amount outstanding of $27.5 million plus accrued interest of $0.2 million. In connection with the repayment of the term loan, the Company wrote off $0.3 million of debt issue costs, which was included in interest expense for the year ended December 31, 2016.
There were no credit agreements outstanding at December 31, 2017.
Interest on the term loan accrued daily at a rate equal to the 3-month LIBOR plus a margin. The margin was 2.75% as of December 31, 2016 and 2015. Total interest expense on the Credit Agreement was $1.3 million for the year ended December 31, 2016 and $1.2 million for the year ended December 31, 2015. Interest expense was included in "other expenses" on the accompanying statements of income and comprehensive income. Interest paid was $1.0 million for the year ending December 31, 2016, and $1.1 million for the year ending December 31, 2015.
110
12. Commitments and contingencies
The Company has an operating lease for office space, which expires in 2020. In addition, the Company had a capital lease related to a software license that expired in 2017. Expenses associated with these leases totaled $0.3 million in 2017, $0.4 million in 2016, and $0.5 million in 2015.
Minimum future rental payments, excluding taxes, insurance and other operating expenses, under the noncancelable operating leases in effect at December 31, 2017 are as follows (in thousands):
Year ending December 31: | ||||
2018 | $ | 529 | ||
2019 | 545 | |||
2020 | 230 | |||
Total minimum rental payments | $ | 1,304 | ||
Contingencies arise in the normal conduct of the Company’s operations and are not expected to have a material effect on the Company’s financial condition or results of operations. However, adverse outcomes are possible and could negatively affect the Company’s financial condition and results of operations.
13. Employee benefit plan
The Company has established a defined contribution employee retirement plan ("Plan") in accordance with Section 401(k) of the Internal Revenue Code. Expenses related to the Plan were $1.0 million, $0.9 million and $0.8 million in 2017, 2016 and 2015, respectively.
111
14. Other comprehensive income (loss)
The following table summarizes the components of other comprehensive income (loss):
Year Ending December 31, | ||||||||||||
2017 | 2016 | 2015 | ||||||||||
(in thousands) | ||||||||||||
Unrealized gains (losses) arising during the period, before income taxes | $ | 9,563 | $ | (830 | ) | $ | (2,347 | ) | ||||
Income taxes | (3,094 | ) | 290 | 821 | ||||||||
Unrealized gains (losses) arising during the period, net of income taxes | 6,469 | (540 | ) | (1,526 | ) | |||||||
Less reclassification adjustment: | ||||||||||||
Net realized investment gains | 132 | 154 | 57 | |||||||||
Income taxes | (47 | ) | (54 | ) | (20 | ) | ||||||
Reclassification adjustment included in net income | 85 | 100 | 37 | |||||||||
Other comprehensive income (loss) | $ | 6,384 | $ | (640 | ) | $ | (1,563 | ) | ||||
The sale of an available-for-sale security results in amounts being reclassified from accumulated other comprehensive income to realized gains or losses in current period earnings. The related tax effect of the reclassification adjustment is recorded in income tax expense in current period earnings. See Note 2 for additional information.
112
15. Underwriting information
The Company has one reportable segment, the Excess and Surplus Lines Insurance segment, which primarily offers commercial excess and surplus lines liability and property insurance products through its underwriting divisions. Gross written premiums by underwriting division are presented below:
Year Ended December 31, | ||||||||||||
2017 | 2016 | 2015 | ||||||||||
(in thousands) | ||||||||||||
Commercial: | ||||||||||||
Construction | $ | 48,587 | $ | 42,234 | $ | 36,932 | ||||||
Small business | 34,896 | 27,333 | 21,468 | |||||||||
Energy | 22,898 | 16,157 | 19,022 | |||||||||
Excess casualty | 20,260 | 17,799 | 16,194 | |||||||||
General casualty | 15,865 | 16,162 | 20,511 | |||||||||
Product liability | 14,288 | 10,140 | 9,480 | |||||||||
Professional liability | 12,956 | 14,212 | 14,636 | |||||||||
Life sciences | 12,408 | 10,897 | 11,935 | |||||||||
Allied health | 10,645 | 9,344 | 8,644 | |||||||||
Health care | 6,235 | 6,594 | 6,579 | |||||||||
Commercial property | 5,609 | 4,835 | 6,181 | |||||||||
Management liability | 4,123 | 2,244 | 420 | |||||||||
Environmental | 2,692 | 1,931 | 1,005 | |||||||||
Public entity | 1,265 | 875 | — | |||||||||
Inland marine | 967 | 910 | 195 | |||||||||
Commercial insurance | 816 | 459 | — | |||||||||
Total commercial | 214,510 | 182,126 | 173,202 | |||||||||
Personal: | ||||||||||||
Personal insurance | 8,681 | 6,352 | 3,807 | |||||||||
Total personal | 8,681 | 6,352 | 3,807 | |||||||||
Total | $ | 223,191 | $ | 188,478 | $ | 177,009 | ||||||
The Company does business with three unaffiliated insurance brokers that generated $26.4 million, $24.4 million and $23.1 million of gross written premiums for the year ended December 31, 2017, representing 11.8%, 10.9% and 10.4% of gross written premiums, respectively. No other broker generated 10.0% or more of the gross written premiums for the year ended December 31, 2017.
16. Statutory financial information
Kinsale Insurance maintains its accounts in conformity with accounting practices prescribed or permitted by state regulatory authorities that vary in certain respects from GAAP. In converting from statutory accounting principles to GAAP, typical adjustments include deferral of policy acquisition costs, the inclusion of statutory nonadmitted assets
113
and the inclusion of net unrealized gains or losses relating to fixed maturities in stockholders’ equity. The Company does not use any permitted practices that are different from prescribed statutory accounting practices.
Statutory net income and statutory capital and surplus for Kinsale Insurance as of December 31, 2017, 2016, and 2015 and for the years then ended are summarized as follows:
Year ended December 31, | ||||||||||||
2017 | 2016 | 2015 | ||||||||||
(in thousands) | ||||||||||||
Statutory net income | $ | 23,841 | $ | 22,850 | $ | 21,972 | ||||||
Statutory capital and surplus | 213,833 | 193,387 | 127,675 | |||||||||
Kinsale Insurance is subject to risk-based capital ("RBC") requirements. RBC is a method developed by the NAIC to determine the minimum amount of statutory capital appropriate for an insurance company to support its overall business operations in consideration of its size and risk profile. The formula for determining the amount of RBC is calculated using various factors, weighted based on the perceived degree of risk, which are applied to certain financial balances and financial activity. The adequacy of a company’s actual capital is evaluated by a comparison to the RBC results, as determined by the formula. Companies that do not maintain statutory capital and surplus at a level in excess of the company action level RBC are required to take specified actions. At December 31, 2017 and 2016, actual statutory capital and surplus for Kinsale Insurance substantially exceeded the regulatory requirements.
Dividend payments to Kinsale from Kinsale Insurance are restricted by state insurance laws as to the amount that may be paid without prior approval of the regulatory authorities of Arkansas. The maximum dividend distribution is limited by Arkansas law to the greater of 10% of policyholder surplus as of December 31 of the previous year or net income, not including realized capital gains, for the previous calendar year. Dividend payments are further limited to that part of available policyholder surplus which is derived from net profits on its business. The maximum dividend distribution that can be paid by Kinsale Insurance during 2018 without prior approval is $23.7 million.
17. Unaudited selected quarterly financial data
The following is a summary of the unaudited quarterly results of operations:
| 2017 Quarter | |||||||||||||||
(in thousands, except per share data) | First | Second | | Third | Fourth | |||||||||||
Gross written premiums | $ | 52,862 | $ | 57,753 | | $ | 55,633 | $ | 56,943 | |||||||
Total revenues | 42,687 | 45,508 | | 47,839 | 50,742 | |||||||||||
Net income | 6,281 | 8,495 | | 4,201 | 5,924 | |||||||||||
Comprehensive income | 7,354 | 10,669 | | 5,840 | 7,422 | |||||||||||
Earnings per share - basic | $ | 0.30 | $ | 0.41 | $ | 0.20 | $ | 0.28 | ||||||||
Earnings per share - diluted | $ | 0.29 | $ | 0.40 | $ | 0.20 | $ | 0.27 | ||||||||
114
| 2016 Quarter | |||||||||||||||
(in thousands, except per share data) | First | Second | | Third | Fourth | |||||||||||
Gross written premiums | $ | 43,082 | $ | 50,107 | | $ | 47,823 | $ | 47,466 | |||||||
Total revenues | 32,718 | 33,676 | | 34,868 | 40,353 | |||||||||||
Net income | 5,257 | 6,057 | | 7,982 | 6,871 | |||||||||||
Comprehensive income | 7,383 | 8,947 | | 7,981 | 1,216 | |||||||||||
Earnings per share - basic: | | | | |||||||||||||
Common stock | $ | — | $ | — | $ | 0.24 | $ | 0.33 | ||||||||
Class A common stock | 0.37 | 0.42 | 0.19 | — | ||||||||||||
Class B common stock | 0.07 | 0.19 | 0.21 | — | ||||||||||||
Earnings per share - diluted: | | | | |||||||||||||
Common stock | $ | — | $ | — | $ | 0.24 | $ | 0.32 | ||||||||
Class A common stock | 0.37 | 0.42 | 0.19 | — | ||||||||||||
Class B common stock | 0.07 | 0.18 | 0.20 | — | ||||||||||||
Due to differences in weighted average common shares outstanding, quarterly earnings per share may not add up to the totals reported for the full year.
115
Schedule II
KINSALE CAPITAL GROUP, INC. AND SUBSIDIARIES
Condensed Financial Information of Registrant
Balance Sheets
December 31, | ||||||||
2017 | 2016 | |||||||
(in thousands) | ||||||||
Assets | ||||||||
Cash and cash equivalents | $ | 1,502 | $ | 1,868 | ||||
Due from subsidiaries | 665 | 218 | ||||||
Investment in subsidiaries | 235,091 | 207,905 | ||||||
Deferred tax assets | 198 | 627 | ||||||
Income taxes recoverable | 805 | — | ||||||
Other assets | 164 | 141 | ||||||
Total assets | $ | 238,425 | $ | 210,759 | ||||
Liabilities and Stockholders' Equity | ||||||||
Liabilities: | ||||||||
Accounts payable and accrued expenses | $ | 236 | $ | 428 | ||||
Income taxes payable | — | 117 | ||||||
Total liabilities | 236 | 545 | ||||||
Stockholders’ equity: | ||||||||
Common stock | 210 | 210 | ||||||
Additional paid-in capital | 155,082 | 153,353 | ||||||
Retained earnings | 73,502 | 53,640 | ||||||
Accumulated other comprehensive income | 9,395 | 3,011 | ||||||
Stockholders’ equity | 238,189 | 210,214 | ||||||
Total liabilities and stockholders’ equity | $ | 238,425 | $ | 210,759 | ||||
See accompanying notes.
See accompanying Report of Independent Registered Public Accounting Firm.
116
Schedule II
KINSALE CAPITAL GROUP, INC. AND SUBSIDIARIES
Condensed Financial Information of Registrant
Statements of Income and Comprehensive Income (Loss)
Years Ended December 31, | ||||||||||||
2017 | 2016 | 2015 | ||||||||||
(in thousands) | ||||||||||||
Revenues: | ||||||||||||
Management fees from subsidiaries | $ | 2,037 | $ | 1,815 | $ | 636 | ||||||
Total revenues | 2,037 | 1,815 | 636 | |||||||||
Expenses: | ||||||||||||
Other operating expenses | 2,526 | 2,395 | 640 | |||||||||
Other expenses | 652 | 492 | 66 | |||||||||
Interest expense | — | 1,339 | 1,230 | |||||||||
Total expenses | 3,178 | 4,226 | 1,936 | |||||||||
Loss before income taxes | (1,141 | ) | (2,411 | ) | (1,300 | ) | ||||||
Income tax benefit | (739 | ) | (844 | ) | (432 | ) | ||||||
Loss before equity in net income of subsidiaries | (402 | ) | (1,567 | ) | (868 | ) | ||||||
Equity in net income of subsidiaries | 25,303 | 27,734 | 23,141 | |||||||||
Net income | 24,901 | 26,167 | 22,273 | |||||||||
Other comprehensive income (loss): | ||||||||||||
Equity in other comprehensive earnings (losses) of subsidiaries | 6,384 | (640 | ) | (1,563 | ) | |||||||
Total comprehensive income | $ | 31,285 | $ | 25,527 | $ | 20,710 | ||||||
See accompanying notes.
See accompanying Report of Independent Registered Public Accounting Firm.
117
Schedule II
KINSALE CAPITAL GROUP, INC. AND SUBSIDIARIES
Condensed Financial Information of Registrant
Statements of Cash Flows
Years Ended December 31, | ||||||||||||
2017 | 2016 | 2015 | ||||||||||
(in thousands) | ||||||||||||
Operating activities | ||||||||||||
Net income | $ | 24,901 | $ | 26,167 | $ | 22,273 | ||||||
Adjustments to reconcile net income to net cash used in operating activities: | ||||||||||||
Deferred tax expense (benefit) | 429 | (65 | ) | 61 | ||||||||
Stock compensation expense | 652 | 492 | 65 | |||||||||
Equity in undistributed earnings of subsidiaries | (25,303 | ) | (27,734 | ) | (23,141 | ) | ||||||
Changes in operating assets and liabilities | (1,583 | ) | 520 | (286 | ) | |||||||
Net cash used in operating activities | (904 | ) | (620 | ) | (1,028 | ) | ||||||
Investing activities | ||||||||||||
Dividends paid from subsidiary | 4,500 | — | — | |||||||||
Contributions to subsidiary | — | (40,000 | ) | (2,000 | ) | |||||||
Net cash provided by (used in) investing activities | 4,500 | (40,000 | ) | (2,000 | ) | |||||||
Financing activities | ||||||||||||
Common stock issued, net of transaction costs | — | 72,841 | — | |||||||||
Common stock issued, stock options exercised | 1,077 | — | — | |||||||||
Class A common stock issued | — | — | 90 | |||||||||
Dividends paid | (5,039 | ) | (2,097 | ) | — | |||||||
Proceeds from note payable | — | — | 2,000 | |||||||||
Repayment of note payable | — | (30,000 | ) | — | ||||||||
Debt issuance costs | — | — | (30 | ) | ||||||||
Net cash (used in) provided by financing activities | (3,962 | ) | 40,744 | 2,060 | ||||||||
Net change in cash and cash equivalents | (366 | ) | 124 | (968 | ) | |||||||
Cash and cash equivalents at beginning of year | 1,868 | 1,744 | 2,712 | |||||||||
Cash and cash equivalents at end of year | $ | 1,502 | $ | 1,868 | $ | 1,744 | ||||||
See accompanying notes.
See accompanying Report of Independent Registered Public Accounting Firm.
118
KINSALE CAPITAL GROUP, INC.
Condensed Financial Information of Registrant
Notes to Condensed Financial Information
1. Accounting policies
Organization
Kinsale Capital Group, Inc., a Delaware domiciled insurance holding company, was formed on June 3, 2009 for the purpose of acquiring and managing insurance entities.
Basis of presentation
The accompanying condensed financial statements have been prepared using the equity method. Under the equity method, the investment in consolidated subsidiaries is stated at cost plus equity in undistributed earnings of consolidated subsidiaries since the date of acquisition. These condensed financial statements should be read in conjunction with the Company’s consolidated financial statements. Certain prior year amounts have been reclassified to conform to the current year's presentation.
Estimates and assumptions
Preparation of the condensed financial statements in conformity with GAAP requires management to make estimates and assumptions that affect the amounts reported in the condensed financial statements and accompanying disclosures. Those estimates are inherently subject to change, and actual results may ultimately differ from those estimates.
Dividends from subsidiaries
On June 9, 2017, cash dividends of $4.5 million were paid to Kinsale Capital Group, Inc. by its wholly-owned subsidiary, Kinsale Insurance Company.
119
Schedule V
KINSALE CAPITAL GROUP, INC. AND SUBSIDIARIES
Valuation and Qualifying Accounts
Additions | Deductions | |||||||||||||||
(in thousands) | Balance at Beginning of Period | Amounts Charged to Expense | Amounts Written Off or Disposals | Balance at End of Period | ||||||||||||
Year Ended December 31, 2017: | ||||||||||||||||
Allowance for premiums receivable | $ | 1,977 | $ | 488 | $ | 353 | $ | 2,112 | ||||||||
Valuation allowance for deferred tax assets | 623 | 68 | — | 691 | ||||||||||||
Year Ended December 31, 2016: | ||||||||||||||||
Allowance for premiums receivable | 2,088 | 276 | 387 | 1,977 | ||||||||||||
Valuation allowance for deferred tax assets | 529 | 94 | — | 623 | ||||||||||||
Year Ended December 31, 2015: | ||||||||||||||||
Allowance for premiums receivable | 595 | 1,493 | — | 2,088 | ||||||||||||
Valuation allowance for deferred tax assets | 489 | 40 | — | 529 | ||||||||||||
See accompanying Report of Independent Registered Public Accounting Firm.
120
Item 9. Changes in and Disagreements with Accountants on Accounting and Financial Disclosure
Not applicable.
Item 9A. Controls and Procedures
Evaluation of Disclosure Controls and Procedures
We maintain disclosure controls and procedures that are designed to ensure that information required to be disclosed in the Company’s reports under the Exchange Act is recorded, processed, summarized and reported within the time periods specified in the SEC’s rules and forms, and that such information is accumulated and communicated to the Company’s management, including the Company’s President and Chief Executive Officer and the Company’s Senior Vice President, Chief Financial Officer and Treasurer, to allow timely decisions regarding required disclosures. Any controls and procedures, no matter how well designed and operated, can provide only reasonable assurance of achieving the desired control objectives. The Company’s management, with the participation of the Company's President and Chief Executive Officer and the Company’s Senior Vice President, Chief Financial Officer and Treasurer, has evaluated the effectiveness of the design and operation of the Company’s disclosure controls and procedures as of the end of the period covered by this Annual Report on Form 10-K. Based upon that evaluation, the Company’s President and Chief Executive Officer and the Company’s Senior Vice President, Chief Financial Officer and Treasurer concluded that, as of December 31, 2017, the Company’s disclosure controls and procedures were effective to accomplish their objectives at the reasonable assurance level.
Management’s Report on Internal Control over Financial Reporting
Pursuant to Section 404 of the Sarbanes-Oxley Act of 2002, Management has evaluated the effectiveness of our internal control over financial reporting as of December 31, 2017. Management’s Report on Internal Control Over Financial Reporting and the report of the Company’s independent registered public accounting firm on the effectiveness of internal control over financial reporting as of December 31, 2017 are included in Part II, Item 8 of this Annual Report on Form 10-K.
Changes in Internal Control over Financial Reporting
There was no change in our internal control over financial reporting during the fourth quarter of 2017 that has materially affected, or is reasonably likely to materially affect, the Company’s internal control over financial reporting.
Item 9B. Other Information
Not applicable.
121
PART III
Item 10. Directors, Executive Officers and Corporate Governance
The information required by Item 10 is incorporated by reference to the definitive Kinsale Capital Group, Inc. Proxy Statement to be filed with the SEC not later than 120 days after the end of the fiscal year covered by this Annual Report on Form 10-K.
Item 11. Executive Compensation
The information required by Item 11 is incorporated by reference to the definitive Kinsale Capital Group, Inc. Proxy Statement to be filed with the SEC not later than 120 days after the end of the fiscal year covered by this Annual Report on Form 10-K.
Item 12. Security Ownership of Certain Beneficial Owners and Management and Related Stockholder Matters
The information required by Item 12 is incorporated by reference to the definitive Kinsale Capital Group, Inc. Proxy Statement to be filed with the SEC not later than 120 days after the end of the fiscal year covered by this Annual Report on Form 10-K.
Item 13. Certain Relationships and Related Transactions, and Director Independence
The information required by Item 13 is incorporated by reference to the definitive Kinsale Capital Group, Inc. Proxy Statement to be filed with the SEC not later than 120 days after the end of the fiscal year covered by this Annual Report on Form 10-K.
122
Item 14. Principal Accounting Fees and Services
The information required by Item 14 is incorporated by reference to the definitive Kinsale Capital Group, Inc. Proxy Statement to be filed with the SEC not later than 120 days after the end of the fiscal year covered by this Annual Report on Form 10-K.
PART IV
Item 15. Exhibits and Financial Statement Schedules
The following consolidated financial statements of Kinsale Capital Group, Inc. and subsidiaries are filed as part of this report under Item 8 — Financial Statements and Supplementary Data:
Page | ||
1. Audited Consolidated Financial Statements | ||
Management's Report on Internal Control Over Financial Reporting | ||
Report of Independent Registered Public Accounting Firm | ||
Consolidated Balance Sheets as of December 31, 2017 and 2016 | ||
Consolidated Statements of Income and Comprehensive Income for the Years Ended December 31, 2017, 2016 and 2015 | ||
Consolidated Statements of Changes in Stockholders' Equity for the Years Ended December 31, 2017, 2016 and 2015 | ||
Consolidated Statements of Cash Flows for the Years Ended December 31, 2017, 2016 and 2015 | ||
Notes to Consolidated Financial Statements | ||
2. Financial Statement Schedules | ||
Schedule II - Condensed Financial Information of Registrant - Parent Company Only | ||
Schedule V - Valuation and Qualifying Accounts | ||
All other financial schedules are not required under the related instructions, or are inapplicable and therefore have been omitted.
Item 16. Form 10-K Summary
None.
123
Exhibit Index
Exhibit Number | Description | |
3.1 | ||
3.2 | ||
10.1 | . | |
10.2+ | ||
10.3a+ | ||
10.3b+ | ||
10.4+ | ||
10.5+ | ||
10.6 | ||
21.1 | ||
23.1 | ||
31.1 | ||
31.2 | ||
32.1* | ||
32.2* | ||
101.INS** | XBRL Instance Document | |
101.SCH** | XBRL Taxonomy Extension Schema Document | |
101.CAL** | XBRL Taxonomy Extension Calculation Linkbase Document | |
101.DEF** | XBRL Taxonomy Extension Definition Linkbase Document | |
101.LAB** | XBRL Taxonomy Extension Label Linkbase Document | |
101.PRE** | XBRL Taxonomy Extension Presentation Linkbase Document | |
* | This certification is deemed not filed for purposes of section 18 of the Exchange Act, or otherwise subject to the liability of that section, nor shall it be deemed incorporated by reference into any filing under the Securities Act or the Exchange Act. |
** | Furnished with this Annual Report. Pursuant to Rule 406T of Regulation S-T, these interactive data files are deemed not filed or part of a registration statement or prospectus for purposes of sections 11 or 12 of the Securities Act of 1933 and are deemed not filed for purposes of section 18 of the Exchange Act. |
+ | Compensatory plan or arrangement |
124
Signatures
Pursuant to the requirements of Section 13 or 15(d) of the Securities Exchange Act of 1934, the registrant has duly caused this report to be signed on its behalf by the undersigned, thereunto duly authorized on March 1, 2018.
KINSALE CAPITAL GROUP, INC. | |
By: /s/ Michael P. Kehoe Michael P. Kehoe President and Chief Executive Officer | |
Pursuant to the requirements of the Securities Exchange Act of 1934, this report has been signed below by the following persons on behalf of the registrant and in the capacities and on the dates indicated.
Signature | Title | Date | ||
/s/ Michael P. Kehoe | ||||
Michael P. Kehoe | President, Chief Executive Officer and Director | March 1, 2018 | ||
(Principal Executive Officer) | ||||
/s/ Bryan P. Petrucelli | ||||
Bryan P. Petrucelli | Senior Vice President, Chief Financial Officer and Treasurer | March 1, 2018 | ||
(Principal Financial and Accounting Officer) | ||||
/s/ Steven J. Bensinger | ||||
Steven J. Bensinger | Director | March 1, 2018 | ||
/s/ Anne C. Kronenberg | ||||
Anne C. Kronenberg | Director | March 1, 2018 | ||
/s/ Robert Lippincott III | ||||
Robert Lippincott III | Director | March 1, 2018 | ||
/s/ James J. Ritchie | ||||
James J. Ritchie | Director | March 1, 2018 | ||
/s/ Frederick L. Russell, Jr. | ||||
Frederick L. Russell, Jr. | Director | March 1, 2018 | ||
/s/ Gregory M. Share | ||||
Gregory M. Share | Director | March 1, 2018 | ||
125