Attached files
| file | filename |
|---|---|
| EX-32.2 - EXHIBIT 32.2 - GTT Communications, Inc. | q42017ex-322.htm |
| EX-32.1 - EXHIBIT 32.1 - GTT Communications, Inc. | q42017ex-321.htm |
| EX-31.2 - EXHIBIT 31.2 - GTT Communications, Inc. | q42017ex-312.htm |
| EX-31.1 - EXHIBIT 31.1 - GTT Communications, Inc. | q42017ex-311.htm |
| EX-23.1 - EXHIBIT 23.1 - GTT Communications, Inc. | q42017ex-231.htm |
| EX-21.1 - EXHIBIT 21.1 - GTT Communications, Inc. | q42017ex-211.htm |
UNITED STATES SECURITIES AND EXCHANGE COMMISSION
Washington, D.C. 20549
FORM 10-K
ANNUAL REPORT PURSUANT TO SECTION 13 OR 15(d)
OF THE SECURITIES EXCHANGE ACT OF 1934
For the Fiscal year ended December 31, 2017
Commission File Number 000-51211
GTT Communications, Inc.
(Exact Name of Registrant as Specified in Its Charter)
Delaware | 20-2096338 | |
(State or Other Jurisdiction of | (I.R.S. Employer Identification No.) | |
Incorporation or Organization) | ||
7900 Tysons One Place
Suite 1450
McLean, Virginia 22102
(703) 442-5500
(Address including zip code, and telephone number, including area
code, of principal executive offices)
Securities registered pursuant to Section 12(b) of the Act:
Title of each class | Name of each exchange on which registered |
Common stock, par value $.0001 per share | NYSE |
Securities registered pursuant to Section 12(g) of the Act: | |
None | |
Indicate by check mark whether the registrant is a well-known seasoned issuer, as defined in Rule 405 of the Securities Act.
Yes þ No ¨
Indicate by check mark whether the registrant is not required to file reports pursuant to Section 13 or Section 15(d) of the Act.
Yes ¨ No þ
Indicate by check mark whether the registrant (1) has filed all reports required to be filed by Section 13 or 15 (d) of the Securities Exchange Act of 1934 during the preceding 12 months (or for such shorter period that the registrant was required to file such reports), and (2) has been subject to such filing requirements for the past 90 days. Yes þ No ¨
Indicate by check mark whether the registrant has submitted electronically and posted on its corporate Web site, if any, every Interactive Data File required to be submitted and posted pursuant to Rule 405 of Regulation S-T (§232.405 of this chapter) during the preceding 12 months (or for such shorter period that the registrant was required to submit and post such files). Yes þ No ¨
Indicate by check mark if disclosure of delinquent filers pursuant to Item 405 of Regulation S-K is not contained herein, and will not be contained, to the best of registrant’s knowledge, in definitive proxy or information statements incorporated by reference in Part III of this Form 10-K or any amendment to this Form 10-K. þ
Indicate by check mark whether the registrant is a large accelerated filer, an accelerated filer, a non-accelerated filer, smaller reporting company, or an emerging growth company. See the definitions of "large accelerated filer," "accelerated filer," "smaller reporting company," and "emerging growth company" in Rule 12b-2 of the Exchange Act. (Check one):
Large Accelerated Filer | þ | Accelerated Filer | ¨ | |
Non-Accelerated Filer | ¨ | (Do not check if a smaller reporting company) | Smaller reporting company | ¨ |
Emerging growth company | ¨ | |||
Indicate by check mark whether the registrant is a shell company (as defined in Rule 12b-2 of the Exchange Act). Yes ¨ No þ
The aggregate market value of the common stock held by non-affiliates of the registrant (31,109,655 shares) based on the $31.65 closing price of the registrant’s common stock as reported on the NYSE on June 30, 2017, was $984,620,581. For purposes of this computation, all officers, directors and 10% beneficial owners of the registrant are deemed to be affiliates. Such determination should not be deemed to be an admission that such officers, directors or 10% beneficial owners are, in fact, affiliates of the registrant.
As of February 27, 2018, 44,825,118 shares of common stock, par value $.0001 per share, of the registrant were outstanding.
Documents Incorporated by Reference
Portions of our definitive proxy statement for the 2018 Annual Meeting of Stockholders, to be filed within 120 days after the end of the fiscal year covered by this Form 10-K, are incorporated by reference into Part III hereof.
Page | ||
Item 1. | Business | |
Item 1A. | Risk Factors | |
Item 1B. | Unresolved Staff Comments | |
Item 2. | Properties | |
Item 3. | Legal Proceedings | |
Item 4. | Mine Safety Disclosures | |
PART II | ||
Item 5. | Market for Registrant’s Common Equity, Related Stockholder Matters and Issuer Purchases of Equity Securities | |
Item 6. | Selected Financial Data | |
Item 7. | Management’s Discussion and Analysis of Financial Condition and Results of Operations | |
Item 7A. | Quantitative and Qualitative Disclosures About Market Risk | |
Item 8. | Financial Statements and Supplementary Data | |
Item 9. | Changes In and Disagreements with Accountants on Accounting and Financial Disclosure | |
Item 9A. | Controls and Procedures | |
Item 9B. | Other Information | |
PART III | ||
Item 10. | Directors, Executive Officers and Corporate Governance | |
Item 11. | Executive Compensation | |
Item 12. | Security Ownership of Certain Beneficial Owners and Management and Related Stockholder Matters | |
Item 13. | Certain Relationships and Related Transactions, and Director Independence | |
Item 14. | Principal Accounting Fees and Services | |
PART IV | ||
Item 15. | Exhibits, Financial Statement Schedules | |
Item 16. | Form 10-K Summary | |
Signatures | ||
i
CAUTIONARY NOTES REGARDING FORWARD-LOOKING STATEMENTS
Certain statements contained or incorporated by reference in this Form 10-K ("Annual Report") may constitute "forward-looking statements" within the meaning of Section 27A of the Securities Act and Section 21E of the Securities Act of 1934, as amended (the "Exchange Act"). Any statements included or incorporated by reference in this Annual Report about our expectations, beliefs, plans, objectives, assumptions or future events or performance are not historical facts and are forward-looking statements. Should one or more of these risks or uncertainties materialize, or should underlying assumptions prove incorrect, actual results may differ from those anticipated, estimated or expected. You can identify these forward-looking statements by the use of words or phrases such as "may," "likely," "potentially," "will," "expect," "intend," "anticipate," "projects," "believe," "estimate," "plan," "could," "should," "opportunity," and "continue" or similar words, whether in the negative or the affirmative. Forward-looking statements include information concerning our business strategy, plans, and goals and objectives, as well as information concerning the expected timing, consummation and financial benefits of certain transactions.
Forward-looking statements are based on our beliefs, assumptions and expectations of our future performance, taking into account information currently available to us. These forward-looking statements are subject to known and unknown risks, uncertainties and factors or events that may cause our actual results, performance or achievements expressed or implied by such forward-looking statements, many of which are beyond our control. These statements include, among others, statements concerning:
•our business and our strategy for continuing to pursue our business;
• | our integration of the operations from recent and anticipated acquisitions, and realization of anticipated benefits and synergies in connection with the acquisitions; |
• | anticipated growth of our industry; |
• | expectations as to our future revenue, margins, expenses, cash flows, profitability and capital requirements; and |
• | other statements of expectations, beliefs, future plans and strategies, anticipated developments and other matters that are not historical facts. |
These statements are subject to risks and uncertainties, including financial, regulatory, environmental, and industry projections, that could cause actual events or results to differ materially from those expressed or implied by the statements. Factors, contingencies, and risks that could cause our actual results to differ materially from these forward-looking statements include, but are not limited to, the effects on our business and customers of general economic and financial market conditions, as well as the following:
• | our ability to achieve the expected benefits of certain transactions; |
• | our ability to develop and market new products and services that meet customer demands and generate acceptable margins; |
• | our reliance on several large customers; |
• | our ability to negotiate and enter into acceptable contract terms with our suppliers; |
• | our ability to attract and retain qualified management and other personnel; |
• | competition in the industry in which we do business; |
• | failure of the third-party communications networks on which we depend; |
• | legislation or regulatory environments, requirements or changes adversely affecting the businesses in which we are engaged; |
• | our ability to maintain our databases, management systems and other intellectual property; |
• | our ability to prevent process and system failures or security breaches that significantly disrupt the availability and quality of the services that we provide; |
• | our ability to maintain adequate liquidity and produce sufficient cash flow to fund acquisitions and capital expenditures; |
• | our ability to meet all the terms and conditions of our debt obligations; |
• | our ability to obtain capital to grow our business; |
• | our ability to utilize our net operating losses; |
• | expectations regarding the trading price of our common stock; |
• | our ability to complete acquisitions or divestitures and effectively integrate any business or operation acquired; |
• | fluctuations in our effective tax rate; and |
ii
• | the impact of the Tax Cuts and Jobs Act (the "Tax Act"). |
Among the factors that could cause actual results to differ materially from those indicated in the forward-looking statements are risks and uncertainties inherent in our business. Such risks and uncertainties include, among others, factors discussed under the section entitled "Risk Factors" in this Annual Report. Any such risks and uncertainties could materially and adversely affect our results of operations, our profitability and our cash flows, which could, in turn, have a material adverse impact on our ability to make payments on our debt.
You should not place undue reliance on any forward-looking statements. Forward-looking statements speak only as of the date of which statements were made. We expressly disclaim any obligation to update our forward-looking statements, whether as a result of new information, future events or circumstances, or otherwise, except as required by law.
You should understand that our actual future results may be materially different from what we expect. We qualify all of the forward-looking statements included or incorporated by reference in this Annual Report by these cautionary statements. Although we believe that our plans, intentions, expectations, strategies and prospects as reflected in our forward-looking statements are reasonable, we cannot guarantee future results, events, levels of activity, performance or achievement. You should carefully consider the risk factors contained herein, in addition to the other information included or incorporated by reference.
iii
PART I
ITEM 1. BUSINESS
Overview
GTT Communications, Inc. ("GTT," the "Company," "we," or "us") provides cloud networking services to multinational clients. We operate a Tier 1 global IP backbone, ranked among the top five in the industry, and we own the lowest latency, transatlantic fiber network. Our comprehensive portfolio of services includes: private networking; internet; optical transport; SD-WAN; managed services; voice and unified communications; video transport; and access services.
Our global network connects people across organizations and around the world. We provide cloud networking services to leading multinational enterprise, carrier, and government clients in over 100 countries. We differentiate ourselves from our competition by delivering service to our customers with simplicity, speed and agility.
We are a Delaware corporation founded in 2005. As of December 31, 2017, we had 1,257 full-time equivalent employees.
Strategy
Multinational organizations are shifting greater amounts of traffic to cloud-based applications and outsourcing IT infrastructure services, which creates significant opportunities for GTT. Our global networking services are designed to capitalize on these growing market demands, most notably our private networking, internet, optical transport, SD-WAN, and managed services offerings. We believe our broad network reach and differentiated service capabilities uniquely position GTT to serve the changing networking requirements of multinational clients.
Our strategy is focused on three key elements:
Expanding cloud networking services to multinational clients. Our network assets and services are built to serve the requirements of large, global clients. These organizations have increasing demands for scalable and flexible network connectivity due to the rapid adoption of cloud-based applications and increasing data usage across locations driven by increasing file sizes, voice, video and real-time collaboration tools. In addition, enterprise CIOs and technology executives are increasingly using third-party management of their network and IT infrastructure so their teams can focus on application development and performance. We are one of the few non-incumbent providers with the product breadth, global scope and operating experience to meet the sophisticated networking needs and managed service requirements of the world’s most demanding multinational clients, and we will continue to look for ways to expand our portfolio of services to meet our clients’ needs.
Extending secure network connectivity to any location in the world and any application in the cloud. We operate one of the five largest IP networks in the world, and our global access footprint is one of the broadest in the industry. Network connectivity is a fundamental requirement for clients to realize the full benefits of cloud computing, and they are increasingly demanding dedicated, secure and high-bandwidth connectivity between their various office locations and leading cloud service providers for mission-critical applications and services. We can connect any client location in the world to our global network through our core network infrastructure and relationships with approximately 2,000 regional suppliers. We will continue to seek opportunities to expand our global footprint to enable our clients to connect to the cloud more efficiently and cost-effectively.
Delivering outstanding client experience by living our core values of Simplicity, Speed and Agility. We strive to be easy to work with, fast and responsive, and to say "yes" to our clients. We are committed to delivering high-quality, reliable and secure services that will continue to attract new clients and create additional opportunities with existing clients. We believe that by operating all areas of our business with simplicity, speed and agility, we offer customers a better service experience than larger incumbent providers.
We execute on this strategy both through rep-driven growth and through strategic acquisitions. Our 165 quota bearing reps are focused on designing and delivering world-class global network solutions that connect any office location in the world, to any application in the cloud. We continue to expand our sales force through external hiring and through acquisitions. We have completed many acquisitions throughout our history, and we believe we have consistently demonstrated an ability to acquire and effectively integrate companies and realize cost synergies. Acquisitions have the ability to increase the scale of our operations, which in turn affords us the ability to expand our operating leverage, extend our network reach, augment our product set, and broaden our customer base. We believe our ability to realize significant cost synergies through acquisitions provides us with a competitive advantage in future consolidation opportunities within our industry. We will continue to evaluate these opportunities and are regularly involved
1
in acquisition discussions. We will evaluate these opportunities based on a number of criteria, including the strategic fit within our existing businesses, the ability to integrate people, systems and networks quickly, and the opportunity to create value through the realization of cost synergies.
Global Network
Our global network assets are deployed in North America, South America, Europe, the Middle East, Asia, and Australia. Our Tier 1 IP network consists of over 600 points of presence ("PoPs") in top data centers around the world, connected with resilient and redundant transport. Based on industry data, our IP backbone is consistently ranked as a top five network in terms of internet routes. We own and operate three trans-Atlantic subsea cables connecting North America and Europe, including our industry leading lowest latency Express transatlantic subsea cable system.
Our private, long-haul optical network provides the foundation for a multiprotocol label switching ("MPLS") mesh between core backbone routers in each market. We engineer our network to provide high levels of capacity and performance, even when utilizing enhanced services such as traffic analysis and filtering. We route network traffic to ensure customer applications take the shortest path possible through the network, delivering low latency performance, reliability and security.
We employ a "capex light" model, which leverages the sophisticated routing and switching infrastructure in our core global network, then integrates network access leased from last mile carriers. This business model benefits us and our customers. We are able to quickly add capacity as needed, minimize infrastructure deployment, maintenance and replacement costs, and focus solely on designing the best network solutions for our clients' specific needs.
Service Offerings
We deliver the following eight primary service offerings to our customers:
Private Networking
We provide Layer 2 (Ethernet) and Layer 3 (IP VPN) private networking solutions to meet the growing needs of multinational enterprises, carriers, service providers, and content delivery networks regardless of location. We design and implement custom private, public, and hybrid cloud network solutions for our customers, offering bandwidth speeds from 10 Mbps to 100 Gbps per port with burstable and aggregate bandwidth capabilities. All services are available on a protected basis with the ability to specify pre-configured alternate routes to minimize the impact of any network disruption.
Through GTT's private networking services, clients can securely connect to cloud service providers in data centers and exchanges around the world. Our Cloud Connect feature provides private, secure, pre-established connectivity to leading cloud service providers. Using GTT's global network, clients can connect any office location in the world to any application in the cloud.
Internet
We offer clients scalable, high-bandwidth global internet connectivity and IP transit with guaranteed availability and packet delivery. Our Internet services offer flexible connectivity with multiple port interfaces including Fast Ethernet, Gigabit Ethernet, 10 Gigabit Ethernet, and 100 Gigabit Ethernet. We also offer a wide range of broadband and wireless access services. We support a dual stack of IPv4 and IPv6 protocols, enabling the delivery of seamless IPv6 services alongside existing IPv4 services.
Optical Transport
We provide a full suite of optical transport services over a core fiber network, enabling cloud-based applications and the transport of high volume data between data centers, large enterprise office locations, and media hubs. Our native wavelength product is designed to deliver scalable high performance optical connectivity over a state-of-the-art dense wave division multiplexing ("DWDM") platform. Our service is differentiated based on unique network diversity and low latency connections between major financial and commercial centers in North America and Europe. Our clients for these services include internet-based technology companies and over-the-top companies ("OTTs"), large banks, and other service providers requiring network infrastructure.
Additionally, we provide ultra-low latency services between the major financial centers and exchanges, tailored to meet the requirements of proprietary trading firms for the fastest connections. Our service provides the industry leading lowest latency performance of the Express transatlantic subsea cable connecting North America and Europe, which is wholly owned and operated by GTT.
2
Software Defined Wide Area Networking ("SD-WAN")
SD-WAN is a new enterprise networking technology in the early stages of market adoption with high growth potential. SD-WAN provides enterprises with improved agility to manage changing network traffic patterns resulting from cloud applications. The software-based network intelligence in SD-WAN enables more efficient load-balancing of traffic across a mix of access types, accelerates the speed of deployments, and improves application visibility.
• | GTT’s SD-WAN delivers cost-effective, managed global connectivity, enhanced application performance and control, and secure access to cloud-based services and applications that enterprises require. Our service leverages GTT’s global, Tier 1 IP backbone, securely connecting client locations to any destination on the internet or to any cloud service provider. We offer the widest range of access options with bundled network security, making it simple and cost-effective to integrate new locations and add network bandwidth as needed. |
Managed Services
We offer fully managed network services, including managed equipment, and security, enabling customers to focus on their core business. These end-to-end services cover the design, procurement, implementation, monitoring, and maintenance of a customer’s network.
• | Managed Equipment. Managed Equipment provides a turnkey solution for the end-to-end management of customer premise equipment, from device through the core network. This includes the design, procurement, implementation, monitoring, and maintenance of equipment including routers, switches, servers, and Wi-Fi access points. |
• | Security. Our cloud-based and premise-based security services provide a comprehensive, multi-layered security solution that protects the network while meeting the most stringent security standards. Our Unified Threat Management ("UTM") services include advanced firewall, intrusion detection, anti-virus, web filtering, and anti-spam. |
Voice and Unified Communication
Our SIP Trunking service integrates voice, video, and chat onto a single IP connection, driving efficiency and productivity organization-wide. Our Enterprise PBX service allows clients to eliminate traditional voice infrastructure with communication services delivered through the cloud. This unified communication service offering includes fully hosted and hybrid models for maximum flexibility.
Video Transport
We provide a suite of fully-managed video transport services. Our services are designed to support our clients' requirements for stringent broadcast quality, providing 100% quality of service for transmission of live events, sports entertainment, and news. Our service options include Dedicated, Occasional Use, and IP Video. We manage individual services, multicast distribution, and entire client networks, supporting all forms of signal management required for media workflow. GTT's video transport services are based on the core principle of "any signal, any format, anywhere." Our clients include many of the world's top broadcasters and cable programming providers.
Access Services
Within North America, GTT operates an access infrastructure composed of approximately 1,750 central offices ("COs"), which includes 835 COs that are Ethernet over Copper ("EoC") enabled. GTT Access Services include EoC and Digital Subscriber Line ("DSL") services, which are designed to provide reliable and affordable network access utilizing traditional copper wire infrastructure. EoC is available in both asymmetric and symmetric configurations. Our symmetric service offers guaranteed bandwidth, with available speeds from 2Mbps to 45Mbps.
3
Operations
Supplier Management
We have strong, long-standing relationships with a diverse group of approximately 2,000 suppliers from which we source our global network connectivity, last-mile bandwidth capacity and other services. We maintain multiple supplier agreements covering diverse routes throughout our network to ensure service continuity, competitive pricing, bandwidth capacity and improved carrier responsiveness.
For our core global network, supplier agreements are typically one-year commitments with an option to renew, which enables us to (i) maintain significant flexibility regarding the amount of bandwidth purchased and (ii) consistently benefit from the latest competitive pricing. For last-mile connections, we typically structure the term to match the term of the underlying customer contract.
Our supplier management team continually monitors supplier performance, network information and pricing to provide greater choice, flexibility and cost savings for our customers.
Network Operations
Our network is supported by global Network Operations Centers ("NOCs") located in Austin, Texas; Belfast, Northern Ireland; Dublin, Ireland; Denver, Colorado; Lemont Furnace, Pennsylvania; Pune, India; and Seattle, Washington. The NOCs provide active monitoring, prioritization and resolution of network-related events 24 hours per day, 365 days per year. Our NOCs also respond to customer network inquiries, and coordinate and notify customers of maintenance activities.
IT Systems
We provide customers with advanced routing control and visibility into their network performance. Our proprietary online client portal provides customers with online access to monitor their network performance and track real-time statistics.
We have developed a comprehensive Client Management Database ("CMD") that manages our network, customer and supplier contracts, sales quoting, service provisioning, and customer invoicing. CMD also supports our financial reporting and other operational processes as well as our integration of acquired companies. Our CMD system has been in operation since our inception, and its capabilities and processes are continually enhanced and automated. The CMD system provides our management team with visibility into all areas of our operations and allows us to operate with simplicity, speed and agility.
Sales and Marketing
We market our products and services through a global direct sales force and indirect sales channels. We have sales representatives throughout North America, Europe, South America, the Middle East, and Asia. Our sales activities are specifically focused on building relationships with new clients and driving expansion within existing client accounts. Because we typically sell to large, global clients and our markets are highly competitive, we believe that personal relationships and quality of service delivery remain important in winning new and repeat customer business. We supplement our direct sales approach with a trusted community of agents and integrators who already have personal relationships with many leading multinational clients.
GTT's marketing activities aim to generate broad awareness and promote our value proposition to multinational clients, applying both traditional and digital marketing methods that target key client decision makers.
Customers
Our customer base consists of enterprise, carrier, and government clients around the world. Our multinational enterprise client base includes leading organizations in financial services, healthcare, technology, manufacturing, retail, media and entertainment, and business services. Carrier customers include some of the largest telecommunications firms in the world, who rely on our global network to extend their reach.
Our customer contracts for network services range from one to three years or more for the initial term. Following the initial term, these agreements typically provide for automatic renewal for specified periods ranging from one month to one year. Our prices are fixed for the duration of the contract, and we typically bill monthly in advance for such services. If a customer terminates its agreement, the terms of our customer contracts typically require full recovery of any amounts due for the remainder of the term or, at a minimum, our liability to any underlying suppliers.
4
Competition
We operate in a highly competitive industry. Our competitors include incumbent local exchange carriers, competitive local exchange carriers, internet service providers, cable companies, and other facilities-based operators. Many of these competitors are large, well-capitalized, and have strong market presence, brand recognition, and existing customer relationships. We also face competition from smaller providers who offer network services and managed enterprise solutions similar to ours. Specific competitors vary based on geography, product offering, and vertical market.
Regulatory Matters
We are subject to federal, state, and foreign regulations. In the United States, the Federal Communications Commission ("FCC") has jurisdiction over interstate telecommunications and international telecommunications that originate or terminate in the United States. State Public Utilities Commissions ("PUCs") have similar powers with respect to intrastate telecommunications. Foreign country laws and regulations typically apply to telecommunications that originate or terminate in, or in some instances traverse, that country. The regulation of the telecommunications industry is constantly evolving, and varies from state to state and from country to country.
Where certification, licensing or authorization is required, carriers are required to comply with certain ongoing responsibilities. For example, we are required to submit periodic reports to various telecommunications regulatory authorities relating to the provision of services within relevant jurisdictions. In addition, we are responsible for the payment of certain regulatory fees and the collection and remittance of certain surcharges and fees associated with the provision of telecommunications services depending upon the jurisdiction, the type of service and the type of customer.
Intellectual Property
We do not own any material patent registrations, applications, or licenses.
Available Information
We make available, through our website, www.gtt.net, our annual reports on Form 10-K, quarterly reports on Form 10-Q, current reports on Form 8-K, and exhibits and amendments to those reports filed or furnished pursuant to Section 13(a) or 15(d) of the Securities Exchange Act of 1934, promptly after they are electronically filed with the Securities and Exchange Commission (the "SEC"). We caution you that the information on our website is not part of this or any other report we file with, or furnish to, the SEC.
In addition to our website, you may read and copy any materials we file with the SEC at www.sec.gov.
ITEM 1A. RISK FACTORS
We operate in a rapidly changing environment that involves a number of risks, some of which are beyond our control. Below are the risks and uncertainties we believe are most important for you to consider. Additional risks and uncertainties not presently known to us, which we currently deem immaterial or which are similar to those faced by other companies in our industry or telecommunications and/or technology companies in general, may also impair our business operations. If any of these risks or uncertainties actually occurs, our business, financial condition and operating results could be materially adversely affected.
Risks Related to Our Business and Operations
Our business could suffer delays and problems due to the actions of network providers on whom we are partially dependent.
Most of our customers are connected to our network by means of communications lines that are provided as services by local telephone companies and others. We may experience problems with the installation, maintenance, and pricing of these lines and other communications links, which could adversely affect our results of operations and our plans to add additional customers to our network using such services. We attempt to mitigate this risk by using many different providers so that we have alternatives for linking a customer to our network. Competition among the providers tends to improve installation intervals, maintenance, and pricing.
Our network may be the target of potential cyber-attacks and other security breaches that could have significant negative consequences.
5
Our business depends on our ability to limit and mitigate interruptions or degradation to our network availability. Our network, including our routers, may be vulnerable to unauthorized access, computer viruses, cyber-attacks, distributed denial of service ("DDOS"), and other security breaches. Cyber-attacks have increased in frequency, scope, and potential harm in recent years. An attack on or security breach of our network could result in interruption or cessation of services, our inability to meet our service level commitments, and potentially compromise customer data transmitted over our network. If cyber-thieves gain improper access to our network, they may be able to access, steal, publish, delete, misappropriate, or modify confidential customer data, and additional harm to customers could be perpetrated by third parties who are given access to such confidential customer data. We cannot guarantee that our security measures will not be circumvented, thereby resulting in compromised customer data or network failures or interruptions that could impact our network availability and have a material adverse effect on our business, financial condition, and operational results. We may be required to expend significant resources to protect against such threats, and may experience a reduction in revenues, litigation, and a diminution in goodwill, caused by a breach. Although our customer contracts limit our liability, affected customers and third parties may seek to recover damages from us under various legal theories.
We are required to maintain, repair, upgrade and replace our network and facilities and our network could suffer serious disruption if certain locations experience serious damage.
Our business requires that we maintain, upgrade, repair, and periodically replace parts of our network facilities. This requires, and will continue to require, management time and the expenditure of capital on a regular basis. In the event that we fail to maintain, upgrade, or replace essential portions of our network facilities, it could lead to a material degradation in the level of service that we provide, which would adversely affect our business.
There are certain locations through which a large amount of our Internet traffic passes. Examples are facilities in which we exchange traffic with other carriers, the facilities through which our transatlantic traffic passes, and certain of our network hub sites. If any of these facilities were destroyed or seriously damaged, a significant amount of our network traffic could be disrupted. Because of the large volume of traffic passing through these facilities, our ability (and the ability of carriers with whom we exchange traffic) to quickly restore service would be challenged. Our transatlantic subsea cables may require repairs for damage caused by natural disasters, fishing vessels, or intentional damage by activist groups. These repairs may take significant time and our ability to re-route traffic to other cable systems or procure services on competitors transatlantic subsea cables may affect our ability to service these customers.
In the event of such damage to any of our owned infrastructure, we will be required to incur expenses to repair such damage. There could be parts of our network or the networks of other carriers that could not be quickly restored or that would experience substantially reduced service for a significant time. If such a disruption occurs, our reputation could be negatively impacted, which may cause us to lose customers and adversely affect our ability to attract new customers, resulting in an adverse effect on our business, operating results, and cash flows.
We may have difficulty and experience disruptions as we add features and upgrade our network.
We are constantly upgrading our network and implementing new features and services. This process involves reconfiguring our network and making changes to our operating systems. In doing so we may experience disruptions that affect our customers, our revenue, and our ability to grow. We may require additional resources to accomplish this work in a timely manner. That could cause us to incur unexpected expenses or delay portions of this effort to the detriment of our ability to provide service to our customers.
We may make purchase commitments to vendors for longer terms or in excess of the volumes committed by our underlying customers, or we may occasionally have certain sales commitments to customers that extend beyond our commitments from our underlying suppliers.
We attempt to match our purchase of network capacity from our suppliers and service commitments from our customers. However, from time to time, we may contract for obligations to our suppliers that exceed the duration of the related customer contracts or that are for capacity in excess of the amount for which we have customer commitments. This could arise:
• | based upon the terms and conditions available from our suppliers; |
• | from an expectation that we will be able to utilize the excess capacity; |
• | as a result of a breach of a customer’s commitment to us; and |
• | to support fixed elements of our network. |
Under any of these circumstances, we may incur the cost of the network capacity from our supplier without having corresponding revenue from customers, which could result in a material and adverse impact on our operating results.
6
Conversely, from time to time, our customer may contract for services that extend beyond the duration of the underlying vendor commitment. This may cause us to seek a renewal of services or a shorter period than we typically seek, or a shortened service period at higher prices. Our financial results could be adversely affected if we are unable to purchase extended service from a supplier at a cost sufficiently low to maintain margins for the remaining term of our commitment to a customer. While we have not historically encountered material price increases from suppliers with respect to continuation or renewal of services after expiration of initial contract terms, we cannot be certain that we would be able to obtain similar terms and conditions from suppliers going forward.
Our connections to the Internet require us to establish and maintain peering relationships with other providers, which we may not be able to maintain.
The Internet is composed of various network providers who operate their own networks that interconnect at public and private interconnection points. Our network is one such network. In order to obtain Internet connectivity for our network, we must establish and maintain relationships with other providers, including many providers that are customers, and incur the necessary capital costs to locate our equipment and connect our network at these various interconnection points.
By entering into what are known as settlement-free peering arrangements, providers agree to exchange traffic between their respective networks without charging each other. Our ability to avoid the higher costs of acquiring paid dedicated network capacity (transit or paid peering) and to maintain high network performance is dependent upon our ability to establish and maintain peering relationships and to increase the capacity of these peering connections. The terms and conditions of our peering relationships may also be subject to adverse changes, which we may not be able to control. If we are not able to maintain or increase our peering relationships in all of our markets on favorable terms, we may not be able to provide our customers with high performance or affordable or reliable services, which could cause us to lose existing and potential customers, damage our reputation and have a material adverse effect on our business.
Our core network infrastructure equipment is provided by a single vendor.
We purchase from Juniper Networks, Inc. ("Juniper") the majority of the routers and transmission equipment used in our core IP network. If Juniper fails to provide equipment on a timely basis or fails to meet our performance expectations, including in the event that Juniper fails to enhance, maintain, upgrade or improve its products, hardware or software we purchase from them when and how we need, we may be delayed or unable to provide services as and when requested by our customers. We also may be unable to upgrade our network and face greater difficulty maintaining and expanding our network. Transitioning from Juniper to another vendor would be disruptive because of the time and expense required to learn to install, maintain, and operate the new vendor's equipment and to operate a multi-vendor network. Any such disruption could increase our costs, decrease our operating efficiencies, and have an adverse effect on our business, results of operations, and financial condition.
Juniper may also be subject to litigation with respect to the technology on which we depend, including litigation involving claims of patent infringement. Such claims have been growing rapidly in the communications industry. Regardless of the merit of these claims, they can result in the diversion of technical and management personnel, or require us to obtain non-infringing technology or enter into license agreements for the technology on which we depend. There can be no assurance that such non-infringing technology or licenses will be available on acceptable terms and conditions, if at all.
If the information systems that we depend on to support our customers, network operations, sales, billing, and financial reporting do not perform as expected, our operations and our financial results may be adversely affected.
We rely on complex information systems to operate our network and support our other business functions. Our ability to track sales leads, close sales opportunities, provision services, bill our customers for our services, and prepare our financial statements depends upon the effective integration of our various information systems. If our information systems, individually or collectively, fail or do not perform as expected, our ability to process and provision orders, to make timely payments to vendors, to ensure that we collect amounts owed to us and prepare our financial statements would be adversely affected. Such failures or delays could result in increased capital expenditures, customer and vendor dissatisfaction, loss of business or the inability to add new customers or additional services, and the inability to prepare accurate and timely financial statements, all of which would adversely affect our business and results of operations.
Our business depends on agreements with carrier neutral data center operators, which we could fail to obtain or maintain.
Our business depends upon access to customers in carrier neutral data centers, which are facilities in which many large users of the Internet house the computer servers that deliver content and applications to users by means of the Internet and provide access
7
to multiple Internet access networks. Most carrier neutral data centers allow any carrier to operate within the facility (for a standard fee). We expect to enter into additional agreements with carrier neutral data center operators as part of our growth plan. Current government regulations do not require carrier neutral data center operators to allow all carriers access on terms that are reasonable or nondiscriminatory. We have been successful in obtaining agreements with these operators in the past and have generally found that the operators want to have us located in their facilities because we offer low-cost, high-capacity Internet service to their customers. Any deterioration in our existing relationships with these operators could harm our sales and marketing efforts and could substantially reduce our potential customer base.
We may be liable for the material that content providers distribute over our network.
Although we believe our liability for third-party information stored on or transmitted through our networks is limited, the liability of private network operators is impacted both by changing technology and evolving legal principles. As a private network provider, we could be exposed to legal claims relating to third-party content stored or transmitted on our networks. Such claims could involve, among others, allegations of defamation, invasion of privacy, copyright infringement, or aiding and abetting restricted activities such as online gambling or pornography. If we decide to implement additional measures to reduce our exposure to these risks or if we are required to defend ourselves against these kinds of claims, our operating results and financial condition could be negatively affected.
Historically, we have generated net losses and used more cash than we have generated from operations, and we may continue to do so.
We have historically generated net losses and such losses may continue in the future. These net losses primarily have been driven by acquisition-related expenses, depreciation, amortization, interest expense, and share-based compensation. We cannot assure you that we will generate net income in the future.
We have also consistently consumed our entire positive cash flow generated from operating activities with our investing activities. Our investing activities have consisted principally of the acquisition of businesses and customer contracts as well as additions to property and equipment. We have funded the excess of cash used in investing activities over cash provided by operating activities with proceeds from equity and debt issuances.
We intend to continue to invest in expanding our business and pursuing acquisitions that we believe provide an attractive return on our capital. These investments may continue to exceed the amount of cash flow available from operations after debt service requirements. To the extent that our investments exceed our cash flow from operations, we plan to rely on potential future debt or equity issuances, which could increase interest expense or dilute the interest of stockholders, as well as cash on hand and borrowings under our revolving credit facility. We cannot assure you, however, that we will be able to obtain or continue to have access to sufficient capital on reasonable terms, or at all, to successfully grow our business.
Our revenue is relatively concentrated among a small number of customers, and the loss of any of these customers could significantly harm our business, financial condition, results of operations, and cash flows.
Revenues from our top five customers accounted for approximately 10% of our revenue for the year ended December 31, 2017. We currently depend, and expect to continue to depend, upon a relatively small number of customers for a significant percentage of our revenue. Many of these customers are also competitors for some or all of our service offerings. Our customer contracts typically have terms of one to three years. Our customers may elect not to renew these contracts. Furthermore, our customer contracts are terminable for cause if we breach a material provision of the contract. We may face increased competition and pricing pressure as our customer contracts become subject to renewal. Our customers may negotiate renewal of their contracts at lower rates, for fewer services or for shorter terms. Many of our customers are in the telecommunications industry, which is undergoing consolidation. To the extent that two or more of our customers combine, they may be able to use their greater size to negotiate lower prices from us and may purchase fewer services from us, especially if their networks overlap. If we are unable to successfully renew our customer contracts on commercially acceptable terms, or if our customer contracts are terminated, our business could suffer.
We are also subject to credit risk associated with the concentration of our accounts receivable from our key customers. If one or more of these customers were to become bankrupt, insolvent or otherwise were unable to pay for the services provided by us, we may incur significant write-offs of accounts receivable or incur impairment charges.
Future acquisitions are a component of our strategic plan, and will include integration and other risks that could harm our business.
8
We have grown rapidly and intend to continue to acquire complementary businesses and assets. This exposes us to the risk that when we evaluate a potential acquisition target we over-estimate the target’s value and, as a result, pay too much for it. We also cannot be certain that we will be able to successfully integrate acquired assets or the operations of the acquired entity with our existing operations. Businesses and assets that we have acquired or may acquire in the future may be subject to unknown or contingent liabilities for which we may have limited or no recourse against the sellers. While we usually require the sellers to indemnify us with respect to breaches of representations and warranties that survive, such indemnification is often limited and subject to various claim expiration periods, materiality thresholds, a significant deductible or an aggregate cap on losses. As a result, there is no guarantee that we will recover any amounts with respect to losses due to breaches by the sellers of their representations and warranties. In addition, the total amount of costs and expenses that we may incur with respect to liabilities associated with acquired properties and entities may exceed our expectations, which may adversely affect our operating results and financial condition.
Difficulties with integration could cause material customer disruption and dissatisfaction, which could in turn increase churn and reduce new sales. Additionally, we may not be able to integrate acquired businesses in a manner that permits us to realize the cost synergies we anticipate. Our actual cost synergies, cost savings, growth opportunities, and efficiency and operational benefits resulting from any acquisition may be lower and may take longer to realize than we currently expect.
We may incur additional debt or issue additional equity to assist in the funding of these potential transactions, which may increase our leverage and/or dilute the interest of stockholders. Further, additional transactions could cause disruption of our ongoing business and divert management’s attention from the management of daily operations to the closing and integration of the acquired business. Acquisitions also involve other operational and financial risks such as:
• | increased demand on our existing employees and management related to the increase in the size of the business and the possible distraction from our existing business due to the acquisition; |
• | loss of key employees and salespeople of the acquired business; |
• | liabilities of the acquired business, both unknown and known at the time of the consummation of the acquisition; |
• | discovery that the financial statements we relied on to buy a business were incorrect; |
• | expenses associated with the integration of the operations of the acquired business; |
• | the possibility of future impairment, write-downs of goodwill and other intangibles associated with the acquired business; |
• | finding that the services and operations of the acquired business do not meet the level of quality of those of our existing services and operations; and |
• | determining that the internal controls of the acquired business were inadequate. |
We are growing rapidly and may not maintain or efficiently manage our growth.
We have rapidly grown our company through acquisitions of companies and assets and the acquisition of new customers through our own sales efforts. In order to become consistently profitable and consistently cash flow positive, we need to both retain existing customers and continue to add a large number of new customers. While no single customer accounted for more than 10% of our 2017 revenue, the loss of or reduced purchases from several significant customers could impair our growth, cash flow, and profitability. Customers can be reluctant to switch providers of bandwidth services because it can involve substantial expense and technical difficulty. That can make it harder for us to acquire new customers through our own sales efforts. Our expansion may place strains on our management and our operational and financial infrastructure. Our ability to manage our growth will be particularly dependent upon our ability to:
• | expand, develop, and retain an effective sales force and other qualified personnel; |
• | maintain the quality of our operations and our service offerings; |
• | attract customers to switch from their current providers to us in spite of the costs associated with switching providers; |
• | maintain and enhance our system of internal controls to ensure timely and accurate reporting; and |
• | expand our operational information systems in order to support our growth, including integrating new customers without disruption. |
We expect that economies of scale will allow us to increase revenue while incurring incremental costs that are proportionately lower than those applicable to our existing businesses. If the increased costs required to support our revenue growth turn out to be greater than anticipated, we may be unable to improve our profitability and/or cash flows even if our revenue growth goals are achieved.
We are highly dependent on our management team and other key employees.
We expect that our continued success will largely depend upon the efforts and abilities of members of our management team and other key employees. Our success also depends upon our ability to identify, attract, develop, and retain qualified employees.
9
If we lose members of our management team or other key employees, or if we are unable to recruit qualified employees in the future, it would likely have a material adverse effect on our business and our cash flows.
The international operations of our business expose us to risks that could materially and adversely affect the business.
We have operations and investments outside of the United States, as well as rights to subsea cable capacity extending to other countries, that expose us to risks inherent in international operations. These include:
• | general economic, social, and political conditions; |
• | the difficulty of enforcing agreements and collecting receivables through certain foreign legal systems; |
• | tax rates in some foreign countries may exceed those in the U.S.; |
• | foreign currency exchange rates may fluctuate, which could adversely affect our results of operations and the value of our international assets and investments; |
• | foreign earnings may be subject to withholding requirements or the imposition of tariffs, exchange controls, or other restrictions; |
• | difficulties and costs of compliance with foreign laws and regulations that impose restrictions on our investments and operations, with penalties for noncompliance, including loss of licenses and monetary fines; |
• | difficulties in obtaining licenses or interconnection arrangements on acceptable terms, if at all; and |
• | changes in U.S. laws and regulations relating to foreign trade and investment. |
We may as part of our expansion strategy increase our exposure to international investments and operations.
Some of our customer agreements contain service level obligations that could subject us to liability or the loss of revenue.
Some of our contracts with customers contain service level guarantees (including network availability) and service delivery date targets, which, if not met, enable customers to claim credits and, under certain conditions, terminate their agreements. Our failure to meet our service level guarantees could adversely affect our business, financial condition, and results of operations. Lost revenue from failure to meet service level guarantees was de minimis for the years ended December 31, 2016 and 2017. While we typically have carve-outs for force majeure events, many events, such as fiber cuts, equipment failure, and third-party vendors being unable to meet their underlying commitments with us, could impact our ability to meet our service level agreements, which could adversely affect our financial conditions and operations.
Our international operations expose us to currency risk.
We conduct a portion of our business using foreign currencies, predominately the British Pound Sterling and the Euro. Fluctuation of the U.S. Dollar could adversely affect our consolidated revenue. Since we tend to incur costs in the same currency in which those operations realize revenue, the effect on operating income and operating cash flow is largely mitigated. However, if the U.S. Dollar continues to fluctuate significantly, future revenues, operating income, and operating cash flows could be adversely affected.
Our future tax liabilities are not predictable or controllable. If we become subject to increased levels of taxation, our financial condition and operations could be negatively impacted.
We provide telecommunication and other services in multiple jurisdictions across the United States and Europe and are, therefore, subject to multiple sets of complex and varying tax laws and rules. We cannot predict the amount of future tax liabilities to which we may become subject. Any increase in the amount of taxation incurred as a result of our operations or due to legislative or regulatory changes would be adverse to us. In addition, we may become subject to income tax audits by many tax jurisdictions throughout the world. It is possible that certain tax positions taken by us could result in tax liabilities for us. While we believe that our current provisions for taxes are reasonable and appropriate, we cannot assure you that these items would be settled for the amounts accrued or that we will not identify additional exposures in the future.
We cannot assure you whether, when or in what amounts we will be able to use our net operating losses, or when they will be depleted.
At December 31, 2017, we had $163.4 million of U.S. federal net operating loss carryforwards ("NOLs") net of limitations under Section 382. Under certain circumstances, these NOLs can be used to offset our future federal and certain state taxable income. If we experience an "ownership change," as defined in Section 382 of the Internal Revenue Code and related Treasury regulations, our ability to use the NOLs could be substantially limited. This limit could impact the timing of the usage of the NOLs, thus accelerating cash tax payments or causing NOLs to expire prior to their use, which could affect the ultimate realization of the NOLs.
10
Furthermore, transactions that we enter into, as well as transactions by existing or future 5% stockholders that we do not participate in, could cause us to incur an "ownership change," which could prevent us from fully utilizing our NOLs to reduce our federal income taxes. These limitations could cause us not to pursue otherwise favorable acquisitions and other transactions involving our capital stock, or could reduce the net benefits to be realized from any such transactions.
We issue projected results and estimates for future periods from time to time, and such projections and estimates are subject to inherent uncertainties and may prove to be inaccurate.
Financial information, results of operations and other projections that we may issue from time to time are based upon our assumptions and estimates. While we believe these assumptions and estimates to be reasonable when they are developed, they are inherently subject to significant business, economic, and competitive uncertainties and contingencies, many of which are beyond our control. You should understand that certain unpredictable factors could cause our actual results to differ from our expectations and those differences may be material. No independent expert participates in the preparation of these estimates. These estimates should not be regarded as a representation by us as to our results of operations during such periods as there can be no assurance that any of these estimates will be realized. In light of the foregoing, we caution you not to place undue reliance on these estimates. These estimates constitute forward-looking statements.
If we do not comply with laws regarding corruption and bribery, we may become subject to monetary or criminal penalties.
The United States Foreign Corrupt Practices Act generally prohibits companies and their intermediaries from bribing foreign officials for the purpose of obtaining or keeping business. Other countries have similar laws to which we are subject. We currently take precautions to comply with these laws. However, these precautions may not protect us against liability, particularly as a result of actions that may be taken in the future by agents and other intermediaries through whom we have exposure under these laws even though we may have limited or no ability to control such persons. Our competitors include foreign entities that are not subject to the United States Foreign Corrupt Practices Act or laws of similar stringency, and hence we may be at a competitive disadvantage.
Risks Related to Our Industry
Consolidation among companies in the telecommunications industry could further strengthen our competitors and adversely impact our business.
The telecommunications industry is very competitive and continues to undergo significant consolidation. There are many reasons for consolidation in our industry, including the desire for companies to acquire customers or assets in regions where they currently have no or insufficient presence. The consolidation within the industry may cause customers to disconnect services to move them to their own networks, or consolidate buying with other providers. Additionally, consolidation in the industry could further strengthen our competitors, give them greater financial resources and geographic reach, and allow them to put additional pressure on prices for our services. Furthermore, consolidation can reduce the number of suppliers available to contract with, resulting in decreased flexibility and cost savings opportunity.
The sector in which we operate is highly competitive, and we may not be able to compete effectively.
We face significant competition from incumbent carriers, Internet service providers, and facilities-based network operators. Relative to us, many of these providers have significantly greater financial, technological, and personnel resources, more well-established brand names, superior marketing capabilities, greater network reach, larger customer bases, and more diverse strategic plans and service offerings. Most of these competitors are also our customers and suppliers. Intense competition from these traditional and new communications companies has led to declining prices and margins for many communications services, and we expect this trend to continue as competition intensifies in the future. Our competitors may also introduce new technologies or services that could make our services less attractive to potential customers.
Certain of our services are subject to regulation that could change or otherwise impact us in an adverse manner.
Communications services are subject to domestic and international regulation at the federal, state, and local levels. These regulations affect our business and our existing and potential competitors. Our communications services and communications networks in Europe and elsewhere are subject to regulatory oversight by national communications regulators, such as the United Kingdom’s Office of Communications ("Ofcom"). In addition, in April 2016, the European Commission adopted the General Data Protection Regulation ("GDPR"), which will be in effect as of May 2018. The GDPR extends the scope of European privacy laws to any entity which processes personal data about E.U. residents in connection with the offer of goods or services or the monitoring of behavior. Complying with the GDPR and other emerging and changing privacy requirements may cause us to incur substantial
11
costs or require us to change our business practices. Noncompliance could result in penalties or significant legal liability, and could affect our ability to retain and attract customers. In the United States, both the Federal Communications Commission ("FCC") and the state public utility commissions or similar regulatory authorities (the "State PUCs") typically require us to file periodic reports, pay various regulatory fees and assessments, and to comply with their regulations. Such compliance can be costly and burdensome and may affect the way we conduct our business. Delays in receiving required regulatory approvals (including approvals relating to acquisitions or financing activities or for interconnection agreements with other carriers), the enactment of new and adverse international or domestic legislation or regulations (including those pertaining to broadband initiatives and net-neutrality), or the denial, modification, or termination by a regulator of any approval or authorization, could have a material adverse effect on our business. Local governments also exercise legal authority that may have an adverse effect on our business because of our need to obtain rights-of-way for certain portions of our network. While local governments may not prohibit persons from providing telecommunications services nor treat telecommunications service providers in a discriminatory manner, they can affect the timing and costs associated with our use of public rights-of-way. Further, the current regulatory landscape is subject to change through judicial review of current legislation and rulemaking by the FCC, Ofcom, and other domestic, foreign, and international rulemaking bodies. These rulemaking bodies regularly consider changes to their regulatory framework and fee obligations. Changes in current regulation may make it more difficult to obtain the approvals necessary to operate our business, significantly increase the regulatory fees to which we are subject, or have other adverse effects on our future operations in the United States and Europe.
We are subject to various forms of regulation from the Federal Communications Commission and state regulatory commissions in the states in which we operate, which limit our pricing flexibility and cost structure for regulated voice and high-speed Internet products.
As of December 31, 2017 we had operating authority from each of the 48 states and the District of Columbia in which we conducted operations, and we are subject to various forms of regulation from the regulatory commissions in each of these areas as well as from the FCC. The FCC has primary jurisdiction over interstate services including the rates that we pay other telecommunications companies to use their network and other issues related to interstate service. Future revenues, costs, and capital investment in our acquired Global Capacity business could be adversely affected by material changes to or decisions regarding applicability of government requirements. Federal and state communications laws and regulations may be amended in the future, and other laws and regulations may affect our business. In addition, certain laws and regulations applicable to us and our competitors may be, and have been, challenged in the courts and could be changed at any time. We cannot predict future developments or changes to the regulatory environment or the impact such developments or changes would have. In addition, these regulations could create significant compliance costs for us.
Our growth and financial health are subject to a number of economic risks.
A downturn in the world economy, especially the economies of North America and Europe, would negatively impact our growth. We would be particularly impacted by a decline in the development of new applications and businesses that make use of the Internet, which depend on numerous factors beyond our control. Our revenue growth is predicated on growing use of the Internet that makes up for the declining prices of Internet service. An economic downturn could impact the Internet business more significantly than other businesses that are less dependent on new applications and growth in the use of those applications because of the retrenchment by consumers and businesses that typically occur in an economic downturn.
Unfavorable general global economic conditions could negatively impact our operating results and financial condition.
Unfavorable general global economic conditions could negatively affect our business. Although it is difficult to predict the impact of general economic conditions on our business, these conditions could adversely affect the affordability of, and customer demand for, our services, and could cause customers to delay or forgo purchases of our services. One or more of these circumstances could cause our revenue to decline. Also, our customers may not be able to obtain adequate access to credit, which could affect their ability to purchase our services or make timely payments to us. The current economic conditions, including federal fiscal and monetary policy actions, may lead to inflationary conditions in our cost base, particularly in our lease and personnel related expenses. This could harm our margins and profitability if we are unable to increase prices or reduce costs sufficiently to offset the effects of inflation in our cost base. For these reasons, among others, if challenging economic conditions persist or worsen, our operating results and financial condition could be adversely affected.
Terrorist activity throughout the world, military action to counter terrorism, or natural disasters could adversely impact our business.
The continued threat of terrorist activity and other acts of war or hostility have had, and may continue to have, an adverse effect on business, financial, and general economic conditions internationally. Effects from these events and any future terrorist activity, including cyber terrorism, may, in turn, increase our costs due to the need to provide enhanced security, which would adversely
12
affect our business and results of operations. These circumstances may also damage or destroy our Internet infrastructure and may adversely affect our ability to attract and retain customers, our ability to raise capital and the operation and maintenance of our network access points. We are also susceptible to other catastrophic events such as major natural disasters, extreme weather, fire, or similar events that could affect our headquarters, other offices, our network, infrastructure or equipment, which could adversely affect our business.
Risk Factors Related to Our Indebtedness
Our substantial level of indebtedness could adversely affect our financial condition and prevent us from fulfilling our obligations under our debt agreements.
We have substantial indebtedness. Our substantial debt may have important consequences. For instance, it could:
• | make it more difficult for us to satisfy our financial obligations, including those relating to our debt; |
• | require us to dedicate a substantial portion of any cash flow from operations to the payment of interest and principal due under our debt, which will reduce funds available for other business purposes, including the growth of our operations, capital expenditures, and acquisitions; |
• | place us at a competitive disadvantage compared with some of our competitors that may have less debt and better access to capital resources; and |
• | limit our ability to obtain additional financing required to fund working capital and capital expenditures, for strategic acquisitions, and for other general corporate purposes. |
Our ability to satisfy our obligations, including our debt, depends on our future operating performance and on economic, financial, competitive, and other factors, many of which are beyond our control. Our business may not generate sufficient cash flow, and future financings may not be available to provide sufficient net proceeds, to meet these obligations or to successfully execute our business strategy.
Despite our leverage, we may still be able to incur more debt. This could further exacerbate the risks that we and our subsidiaries face.
We and our subsidiaries may incur additional indebtedness, including additional secured indebtedness, in the future. The terms of our debt facilities restrict, but do not completely prohibit, us from doing so. If new debt or other liabilities are added to our current debt levels, the related risks that we and our subsidiaries now face could intensify.
We may be subject to interest rate risk, and increasing interest rates may increase our interest expense.
Borrowings under the credit agreement bear, and our future indebtedness may bear, interest at variable rates and expose us to interest rate risk. If interest rates increase, our debt service obligations on the variable rate indebtedness would increase even though the amount borrowed remained the same, and our net income and cash available for servicing our indebtedness would decrease.
The agreements governing our debt obligations impose restrictions on our business and could adversely affect our ability to undertake certain corporate actions.
The agreements governing our various debt obligations include covenants imposing significant restrictions on our business. These restrictions may affect our ability to operate our business and may limit our ability to take advantage of potential business opportunities as they arise. These covenants place restrictions on our ability to, among other things:
• | incur additional debt; |
• | create liens; |
• | make certain investments; |
• | consummate acquisitions; |
• | enter into certain transactions with affiliates; |
• | declare or pay dividends, redeem stock or make other distributions to stockholders; and |
• | consolidate, merge or transfer or sell all or substantially all of our assets. |
Our ability to comply with these agreements may be affected by events beyond our control, including prevailing economic, financial, and industry conditions. These covenants could have an adverse effect on our business by limiting our ability to take advantage of financing, merger and acquisition, or other corporate opportunities.
13
In addition, the credit agreement requires us to comply with specified financial ratios, including ratios regarding secured leverage. Our ability to comply with these ratios may be affected by events beyond our control. These restrictions limit our ability to plan for or react to market conditions, meet capital needs, or otherwise constrain our activities or business plans. They also may adversely affect our ability to finance our operations, enter into acquisitions, or engage in other business activities that would be in our interest.
A breach of any of the covenants contained in our credit agreement or any future agreements related to indebtedness or our inability to comply with the financial ratios could result in an event of default, which would allow the lenders to declare all borrowings outstanding to be due and payable or to terminate the ability to borrow under the Revolver. If the amounts outstanding under the credit agreement or other future indebtedness were to be accelerated, we cannot assure that our assets would be sufficient to repay in full the money owed. In such a situation, we could be forced to file for bankruptcy or seek other protections from creditors.
To service our indebtedness, we will require a significant amount of cash. However, our ability to generate cash depends on many factors, many of which are beyond our control.
Our ability to make payments on and to refinance our indebtedness and to fund planned capital expenditures will depend on our ability to generate cash in the future, which, in turn, is subject to general economic, financial, competitive, regulatory, and other factors, many of which are beyond our control.
Our business may not generate sufficient cash flow from operations and we may not have available to us future borrowings in an amount sufficient to enable us to pay our indebtedness or to fund our other liquidity needs. In these circumstances, we may need to refinance all or a portion of our indebtedness on or before maturity. We may not be able to refinance any of our indebtedness on commercially reasonable terms or at all. Without this financing, we could be forced to sell assets or secure additional financing to make up for any shortfall in our payment obligations under unfavorable circumstances. However, we may not be able to secure additional financing on terms favorable to us or at all and, in addition, the terms of the indentures governing our notes limit our ability to sell assets and also restrict the use of proceeds from such a sale. We may not be able to sell assets quickly enough or for sufficient amounts to enable us to meet our obligations, including our obligations under our notes.
If we are unable to meet our debt service obligations, we would be in default under the terms of our credit agreement, permitting acceleration of the amounts due under the credit agreement and eliminating our ability to draw on the Revolver. If the amounts outstanding under the credit facilities or future indebtedness were to be accelerated, we could be forced to file for bankruptcy.
Risks Related to Our Common Stock and the Securities Markets
Because we do not currently intend to pay dividends on our common stock, stockholders will benefit from an investment in our common stock only if it appreciates in value.
We do not currently anticipate paying any dividends on shares of our common stock. Any determination to pay dividends in the future will be made by our Board of Directors and will depend upon results of operations, financial conditions, contractual restrictions, restrictions imposed by applicable law, and other factors our Board of Directors deems relevant. Accordingly, realization of a gain on stockholders’ investments will depend on the appreciation of the price of our common stock. There is no guarantee that our common stock will appreciate in value or even maintain the price at which stockholders purchased their shares.
The concentration of our capital stock ownership may limit a stockholder’s ability to influence corporate matters, and could discourage a takeover that stockholders may consider favorable and make it more difficult for a stockholder to elect directors of its choosing.
H. Brian Thompson, the Company’s Executive Chairman of the Board of Directors, and Universal Telecommunications, Inc., Mr. Thompson’s private equity investment and advisory firm, owned 6,807,575 shares of our common stock at February 27, 2018. Based on the number of shares of our common stock outstanding on February 27, 2018, Mr. Thompson and Universal Telecommunications, Inc. beneficially own approximately 15% of our common stock. In addition, as of February 27, 2018, our executive officers, directors, and affiliated entities, excluding Mr. Thompson and Universal Telecommunications, Inc., together beneficially owned common stock representing approximately 8% of our common stock. As a result, these stockholders have the ability to exert significant control over matters that require approval by our stockholders, including the election of directors and approval of significant corporate transactions. The interests of these stockholders might conflict with your interests as a holder of our securities, and it may cause us to pursue transactions that, in their judgment, could enhance their equity investments, even though such transactions may involve significant risks to you as a security holder. The large concentration of ownership in a small group of stockholders might also have the effect of delaying or preventing a change of control that other stockholders may view as beneficial.
14
We might require additional capital to support business growth, and this capital might not be available on favorable terms, or at all.
Our operations or expansion efforts may require substantial additional financial, operational, and managerial resources. While we believe we have sufficient liquidity as of December 31, 2017 to fund our working capital and other operating requirements, we may raise additional funds for acquisitions or to expand our operations. If we obtain additional funding in the future, we may seek debt financing or obtain additional equity capital. Additional capital may not be available to us, or may only be available on terms that adversely affect our existing stockholders, or that restrict our operations. For example, if we raise additional funds through issuances of equity or convertible debt securities, our existing stockholders could suffer dilution, and any new equity securities we issue could have rights, preferences, and privileges superior to those of holders of our common stock.
Disruptions in the financial markets could affect our ability to obtain debt or equity financing or to refinance our existing indebtedness on reasonable terms or at all.
Disruptions in the financial markets could impact our ability to obtain debt or equity financing, or lines of credit, in the future as well as impact our ability to refinance our existing indebtedness on reasonable terms or at all, which could affect our strategic operations and our financial performance and force modifications to our operations.
ITEM 1B. UNRESOLVED STAFF COMMENTS
None.
ITEM 2. PROPERTIES
As of December 31, 2017, we lease approximately 275,000 square feet of space for offices, data centers, colocation facilities, and PoPs throughout North America, Europe, Asia, the Middle East, and South America. Additionally, as of December 31, 2017, we owned eight cable landing stations in North America and Europe comprising approximately 88,000 square feet.
Our corporate headquarters facility consists of approximately 19,000 square feet, located in McLean, Virginia.
We believe our properties, taken as a whole, are in good operating condition and are adequate for our business needs.
ITEM 3. LEGAL PROCEEDINGS
From time to time, we are party to legal proceedings arising in the normal course of business. We do not believe that we are party to any current or pending legal action that could reasonably be expected to have a material adverse effect on our financial condition or results of operations.
ITEM 4. MINE SAFETY DISCLOSURES
Not applicable.
15
PART II
ITEM 5. MARKET FOR REGISTRANT’S COMMON EQUITY, RELATED STOCKHOLDER MATTERS AND ISSUER PURCHASES OF EQUITY SECURITIES
Market for Equity Securities
Our common stock trades on the NYSE under the symbol "GTT" and has traded on the NYSE since November 28, 2014. Prior to November 28, 2014, our common stock traded on the NYSE MKT.
As of February 27, 2018, there were 137 holders of record of our common stock, par value $.0001 per share. The following table sets forth, for the calendar quarters indicated, the quarterly high and low sales information of our common stock as reported on the NYSE.
Common Stock | |||||||
High | Low | ||||||
2016 | |||||||
First Quarter | $ | 18.70 | $ | 12.31 | |||
Second Quarter | $ | 18.88 | $ | 14.96 | |||
Third Quarter | $ | 24.20 | $ | 17.55 | |||
Fourth Quarter | $ | 29.75 | $ | 20.80 | |||
2017 | |||||||
First Quarter | $ | 29.70 | $ | 22.95 | |||
Second Quarter | $ | 34.20 | $ | 23.10 | |||
Third Quarter | $ | 32.60 | $ | 28.30 | |||
Fourth Quarter | $ | 47.75 | $ | 31.51 | |||
Dividends
We have not paid any dividends on our common stock to date, and do not anticipate paying any dividends in the foreseeable future. Moreover, restrictive covenants existing from the credit agreement that we have entered into preclude us from paying dividends until certain conditions are met.
Performance Graph
The following performance graph compares the relative changes in the cumulative total return of our common stock for the period from December 31, 2012 to December 31, 2017, against the cumulative total return for the same period of (1) The Standard & Poor's 500 (S&P 500) Index, (2) The Standard & Poor's (S&P) Telecom Select Industry Index, and (3) NASDAQ Telecommunication Index. The comparison below assumes $100 was invested on December 31, 2012, in our common stock, the S&P 500 Index, the S&P Telecom Select Industry Index, and NASDAQ Telecommunication Index.
16
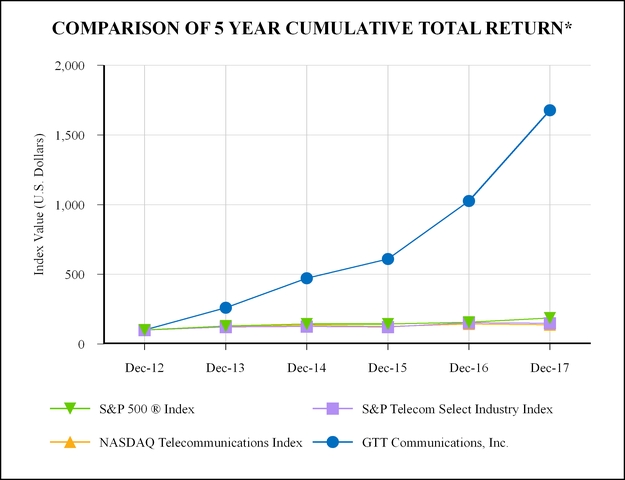
* $100 invested on December 31, 2012 in stock or index. Fiscal year ending December 31.
Copyright © 2018, S&P Dow Jones Indices LLC, a division of S&P Global. All rights reserved
Dec-12 | Dec-13 | Dec-14 | Dec-15 | Dec-16 | Dec-17 | ||||||||||||||||||
GTT Communications, Inc. | $ | 100.00 | $ | 260.71 | $ | 472.50 | $ | 609.29 | $ | 1,026.79 | $ | 1,676.79 | |||||||||||
S&P 500 ® Index | 100.00 | 129.60 | 144.36 | 143.31 | 156.98 | 187.47 | |||||||||||||||||
S&P Telecom Select Industry Index | 100.00 | 122.04 | 126.25 | 122.42 | 151.73 | 149.36 | |||||||||||||||||
NASDAQ Telecommunications Index | 100.00 | 124.02 | 135.07 | 124.94 | 143.52 | 138.31 | |||||||||||||||||
The stock price performance included in this graph is not necessarily indicative of future stock price performance.
Equity Compensation Plan Information
The information required by this Item 5 regarding Securities Authorized for Issuance Under Equity Compensation Plans is incorporated in this report by reference to the information set forth under the caption "Equity Plan Information" in our 2018 Proxy Statement.
ITEM 6. SELECTED FINANCIAL DATA
The annual financial information set forth below has been summarized from our audited consolidated financial statements for GTT Communications, Inc. and its wholly-owned subsidiaries, for the periods and as of the dates indicated. The information should be read in connection with, and is qualified in its entirety by reference to, Item 7. "Management's Discussion and Analysis of Financial
17
Condition and Results of Operations", the consolidated financial statements and notes included elsewhere in this report and in our SEC filings. These historical results are not necessarily indicative of the results to be expected in the future.
Year Ended December 31, | |||||||||||||||||||
2017 | 2016 | 2015 | 2014 | 2013 | |||||||||||||||
(Amounts in millions, except for share and per share data) | |||||||||||||||||||
Consolidated Statement of Operations Data: | |||||||||||||||||||
Telecommunications services | $ | 827.9 | $ | 527.3 | $ | 372.5 | $ | 209.0 | $ | 158.9 | |||||||||
Operating expenses: | |||||||||||||||||||
Cost of telecommunications services | 432.1 | 279.6 | 207.7 | 129.7 | 104.3 | ||||||||||||||
Selling, general and administrative expenses | 215.4 | 143.2 | 101.7 | 45.7 | 31.7 | ||||||||||||||
Severance, restructuring and other exit costs | 22.4 | 0.9 | 12.7 | 9.4 | 7.7 | ||||||||||||||
Depreciation and amortization | 132.6 | 62.8 | 46.7 | 24.9 | 17.2 | ||||||||||||||
Total operating expenses | 802.5 | 486.5 | 368.8 | 209.7 | 160.9 | ||||||||||||||
Operating income (loss) | 25.4 | 40.8 | 3.7 | (0.7 | ) | (2.0 | ) | ||||||||||||
Interest expense, net | (71.2 | ) | (29.4 | ) | (13.9 | ) | (8.5 | ) | (8.4 | ) | |||||||||
Loss on debt extinguishment | (8.6 | ) | (1.6 | ) | (3.4 | ) | (3.1 | ) | (0.7 | ) | |||||||||
Other income (expense), net | 0.2 | (0.6 | ) | (1.2 | ) | (8.6 | ) | (11.7 | ) | ||||||||||
(Loss) income before income taxes | (54.2 | ) | 9.2 | (14.8 | ) | (20.9 | ) | (22.8 | ) | ||||||||||
Provision for (benefit from) income taxes | 17.3 | 3.9 | (34.1 | ) | 2.1 | (2.0 | ) | ||||||||||||
Net (loss) income | $ | (71.5 | ) | $ | 5.3 | $ | 19.3 | $ | (23.0 | ) | $ | (20.8 | ) | ||||||
Net (loss) earnings per common share - basic | $ | (1.71 | ) | $ | 0.14 | $ | 0.55 | $ | (0.85 | ) | $ | (0.95 | ) | ||||||
Net (loss) earnings per common share - diluted | $ | (1.71 | ) | $ | 0.14 | $ | 0.54 | $ | (0.85 | ) | $ | (0.95 | ) | ||||||
Weighted average common shares - basic | 41,912,952 | 37,055,663 | 34,973,284 | 27,011,381 | 21,985,241 | ||||||||||||||
Weighted average common shares - diluted | 41,912,952 | 37,568,915 | 35,801,395 | 27,011,381 | 21,985,241 | ||||||||||||||
Consolidated Balance Sheet Data: | |||||||||||||||||||
Cash and cash equivalents | $ | 101.2 | $ | 29.7 | $ | 14.6 | $ | 49.3 | $ | 5.8 | |||||||||
Restricted cash and cash equivalents | — | 304.3 | — | — | — | ||||||||||||||
Property and equipment, net | 499.3 | 43.4 | 38.8 | 25.2 | 20.5 | ||||||||||||||
Total assets | 1,798.2 | 953.3 | 596.5 | 266.5 | 171.8 | ||||||||||||||
Long-term debt, including current portion | 1,243.5 | 729.5 | 386.2 | 120.8 | 92.5 | ||||||||||||||
Total stockholders’ equity | 231.4 | 127.8 | 110.5 | 77.6 | 9.5 | ||||||||||||||
18
ITEM 7. MANAGEMENT’S DISCUSSION AND ANALYSIS OF FINANCIAL CONDITION AND RESULTS OF OPERATIONS
This Management's Discussion and Analysis of Financial Condition and Results of Operations ("MD&A") contains certain forward-looking statements within the meaning of Section 21E of the Securities Exchange Act of 1934, as amended. Historical results may not indicate future performance. Our forward-looking statements reflect our current views about future events, are based on assumptions, and are subject to known and unknown risks and uncertainties that could cause actual results to differ materially from those contemplated by these statements. Factors that may cause differences between actual results and those contemplated by forward-looking statements include, but are not limited to, those discussed in "Risk Factors" in Part I, Item 1A, of this Annual Report. We undertake no obligation to publicly update or revise any forward-looking statements, including any changes that might result from any facts, events, or circumstances after the date hereof that may bear upon forward-looking statements. Furthermore, we cannot guarantee future results, events, levels of activity, performance, or achievements.
This MD&A is intended to assist in understanding and assessing the trends and significant changes in our results of operations and financial condition. As used in this MD&A, the words, "we", "our", and "us" refer to GTT Communications, Inc. and its consolidated subsidiaries. This MD&A should be read in conjunction with our consolidated financial statements and related notes included elsewhere in this Annual Report.
Company Overview
GTT Communications, Inc. provides cloud networking services to multinational clients. We operate a Tier 1 global IP backbone, ranked among the top five in the industry, and own the lowest latency, transatlantic fiber network. Our comprehensive portfolio of services includes: private networking; internet; optical transport; SD-WAN; managed services; voice and unified communications; video transport; and access services.
Our global network connects people across organizations and around the world. We provide cloud networking services to leading multinational enterprise, carrier, and government clients in more than 100 countries. We differentiate ourselves from our competition by delivering service to our clients with simplicity, speed, and agility.
We deliver the following eight primary service offerings to our customers:
Private Networking
We provide Layer 2 (Ethernet) and Layer 3 (IP VPN) private networking solutions to meet the growing needs of multinational enterprises, carriers, service providers, and content delivery networks regardless of location. We design and implement custom private, public, and hybrid cloud network solutions for our customers, offering bandwidth speeds from 10 Mbps to 100 Gbps per port with burstable and aggregate bandwidth capabilities. All services are available on a protected basis with the ability to specify pre-configured alternate routes to minimize the impact of any network disruption.
Through GTT's private networking services, clients can securely connect to cloud service providers in data centers and exchanges around the world. Our Cloud Connect feature provides private, secure, pre-established connectivity to leading cloud service providers. Using GTT's global network, clients can connect any office location in world to any application in the cloud.
Internet
We offer clients scalable, high-bandwidth global internet connectivity and IP transit with guaranteed availability and packet delivery. Our Internet services offer flexible connectivity with multiple port interfaces including Fast Ethernet, Gigabit Ethernet, 10 Gigabit Ethernet, and 100 Gigabit Ethernet. We also offer a wide range of broadband and wireless access services. We support a dual stack of IPv4 and IPv6 protocols, enabling the delivery of seamless IPv6 services alongside existing IPv4 services.
Optical Transport
We provide a full suite of optical transport services over a core fiber network, enabling cloud-based applications and the transport of high volume data between data centers, large enterprise office locations, and media hubs. Our native wavelength product is designed to deliver scalable high performance optical connectivity over a state-of-the-art dense wave division multiplexing platform. Our service is differentiated based on unique network diversity and low latency connections between major financial and commercial centers in North America and Europe. Our clients for these services include internet-based technology companies and OTTs, large banks, and other service providers requiring network infrastructure.
19
Additionally, we provide ultra-low latency services between the major financial centers and exchanges, tailored to meet the requirements of proprietary trading firms for the fastest connections. Our service provides the industry leading lowest latency performance of the Express transatlantic subsea cable connecting North America and Europe, which is wholly owned and operated by GTT.
Software Defined Wide Area Networking
SD-WAN is a new enterprise networking technology in the early stages of market adoption with high growth potential. SD-WAN provides enterprises with improved agility to manage changing network traffic patterns resulting from cloud applications. The software-based network intelligence in SD-WAN enables more efficient load-balancing of traffic across a mix of access types, accelerates the speed of deployments, and improves application visibility.
• | GTT’s SD-WAN delivers cost-effective, managed global connectivity, enhanced application performance and control, and secure access to cloud-based services and applications that enterprises require. Our service leverages GTT’s global, Tier 1 IP backbone, securely connecting client locations to any destination on the internet or to any cloud service provider. We offer the widest range of access options with bundled network security, making it simple and cost-effective to integrate new locations and add network bandwidth as needed. |
Managed Services
We offer fully managed network services, including managed equipment, and security, enabling customers to focus on their core business. These end-to-end services cover the design, procurement, implementation, monitoring, and maintenance of a customer’s network.
• | Managed Equipment. Managed Equipment provides a turnkey solution for the end-to-end management of customer premise equipment, from device through the core network. This includes the design, procurement, implementation, monitoring, and maintenance of equipment including routers, switches, servers, and Wi-Fi access points. |
• | Security. Our cloud-based and premise-based security services provide a comprehensive, multi-layered security solution that protects the network while meeting the most stringent security standards. Our Unified Threat Management services include advanced firewall, intrusion detection, anti-virus, web filtering, and anti-spam. |
Voice and Unified Communication
Our SIP Trunking service integrates voice, video, and chat onto a single IP connection, driving efficiency and productivity organization-wide. Our Enterprise PBX service allows clients to eliminate traditional voice infrastructure with communication services delivered through the cloud. This unified communication service offering includes fully hosted and hybrid models for maximum flexibility.
Video Transport
We provide a suite of fully-managed video transport services. Our services are designed to support our clients' requirements for stringent broadcast quality, providing 100% quality of service for transmission of live events, sports entertainment, and news. Our service options include Dedicated, Occasional Use, and IP Video. We manage individual services, multicast distribution, and entire client networks, supporting all forms of signal management required for media workflow. GTT's video transport services are based on the core principle of "any signal, any format, anywhere." Our clients include many of the world's top broadcasters and cable programming providers.
Access Services
Within North America, GTT operates an access infrastructure composed of approximately 1,750 central offices, which includes 835 COs that are Ethernet over Copper enabled. GTT Access Services include EoC and DSL services, which are designed to provide reliable and affordable network access utilizing traditional copper wire infrastructure. EoC is available in both asymmetric and symmetric configurations. Our symmetric service offers guaranteed bandwidth, with available speeds from 2Mbps to 45Mbps.
Customer and Network Contracts
20
Our customer contracts generally range from three to five years or more for the initial term. Following the initial term, these agreements typically provide for automatic renewal for specified periods ranging from one month to one year. Our prices are fixed for the duration of the contract, and we typically bill monthly in advance for such services. If a customer terminates its agreement, the terms of our customer contracts typically require full recovery of any amounts due for the remainder of the term or, at a minimum, our liability to any underlying suppliers.
Our revenue is composed of three primary categories: recurring revenue, non-recurring revenue, and usage revenue. Recurring revenue relates to contracted ongoing service that is generally fixed in price and paid by the customer on a monthly basis for the contracted term. For the year ended December 31, 2017, recurring revenue was approximately 94% of our total revenue. Non-recurring revenue primarily includes installation and equipment charges to customers, and one-time termination charges for customers who cancel their services prior to the contract termination date. Usage revenue represents variable revenue based on whether a customer exceeds its committed usage threshold as specified in the contract.
Our network supplier contracts do not have any market related net settlement provisions. We have not entered into, and do not plan to enter into, any supplier contracts which involve financial or derivative instruments. The supplier contracts are entered into solely for the direct purchase of telecommunications capacity, which is resold by us in the normal course of business.
Other than cost of telecommunication services provided, our most significant operating expenses are employment costs. As of December 31, 2017, we had 1,257 full-time equivalent employees. For the year ended December 31, 2017, the total employee cash compensation and benefits represented approximately 12% of total revenue.
Recent Developments Affecting Our Results
Business Acquisitions
Since our formation, we have consummated a number of transactions accounted for as business combinations as part of our strategy of expanding through acquisitions. These acquisitions, which are in addition to our periodic purchases of customer contracts, have allowed us to increase the scale at which we operate, which in turn affords us the ability to increase our operating leverage, extend our network, and broaden our customer base. The accompanying consolidated financial statements include the operations of the acquired entities from their respective acquisition dates.
Custom Connect
In December 2017, we acquired Custom Connect International B.V. ("Custom Connect"). We paid $28.9 million in cash consideration, of which $0.6 million was net cash acquired, and 49,941 unregistered shares of our common stock valued at $2.2 million at closing. $3.2 million of the initial cash consideration is held in escrow for one year, subject to reduction for any indemnification claims made by us prior to such date. The results of Custom Connect have been included from December 31, 2017. The acquisition was considered a stock purchase for tax purposes.
Transbeam
In October 2017, we acquired Transbeam, Inc. ("Transbeam"). We paid $26.4 million, of which $0.8 million was net cash acquired, and $2.0 million was deferred as holdback consideration for a 12-month period, subject to reduction for any indemnification claims made by us prior to such date. The results of Transbeam have been included from October 1, 2017. The acquisition was considered a stock purchase for tax purposes.
Global Capacity
In September 2017, we acquired Global Capacity for $104.0 million in cash consideration, of which $4.0 million was net cash acquired, and 1,850,000 unregistered shares of our common stock valued at $53.6 million at closing. $10.0 million of the initial cash consideration is held in escrow for one year, subject to reduction for any indemnification claims made by us prior to such date. The results of Global Capacity have been included from September 15, 2017. The acquisition was considered an asset purchase for tax purposes.
Perseus
In June 2017, we acquired Perseus Telecom ("Perseus"). We paid $37.5 million in cash consideration, of which $0.1 million was net cash acquired, and assumed $1.9 million in capital leases. $4.0 million of the initial cash consideration is held in escrow
21
for one year, subject to reduction for any indemnification claims made by us prior to such date. The results of Perseus have been included from June 1, 2017. The acquisition was considered a stock purchase for tax purposes.
Hibernia
In January 2017, we acquired Hibernia Networks ("Hibernia") for $529.6 million in cash consideration, of which $14.6 million was net cash acquired, and 3,329,872 unregistered shares of our common stock, initially valued at $75.0 million on the date of announcement, and ultimately valued at $86.1 million at closing. $15.0 million of the initial cash consideration is held in escrow for one year, subject to reduction for any indemnification claims made by us prior to such date. The results of Hibernia have been included from January 1, 2017. The acquisition was considered an asset purchase for tax purposes.
Telnes
In February 2016, we completed the acquisition of Telnes Broadband ("Telnes"). We paid $15.5 million in cash and issued 178,202 unregistered shares of our common stock valued at $2.0 million. $1.8 million of the cash consideration was deferred for one year subject to reduction for any indemnification claims made by us prior to such date. The acquisition was considered an asset purchase for tax purposes.
One Source
In October 2015, we completed the acquisition of One Source Networks Inc. ("One Source"). We paid $169.3 million in cash and issued 185,946 unregistered shares of our common stock valued at $2.3 million. We also issued 289,055 unregistered shares of our common stock to certain One Source employees as compensation for continuous employment valued at $3.6 million. The net working capital was finalized in 2016 for additional consideration of $0.4 million. The acquisition was considered a stock purchase for tax purposes.
MegaPath
In April 2015, we acquired MegaPath Corporation ("MegaPath"). We paid $141.4 million in cash consideration, assumed approximately $3.4 million in capital leases, and issued 610,843 unregistered shares of our common stock valued at $7.5 million. In April 2016, we also settled a dispute related to closing date working capital with MegaPath in 2016, resulting in an increase to total consideration and goodwill of $4.1 million. $10.0 million of the initial cash consideration was deferred for one year, subject to reduction for any indemnification claims made by us prior to such date. The acquisition was considered an asset purchase for tax purposes.
The acquisition of Custom Connect, Transbeam, Global Capacity, Perseus, and Hibernia are collectively referred to as "2017 Acquisitions," the acquisition of Telnes is referred to as the "2016 Acquisition," and the acquisition of One Source and MegaPath are collectively referred to as "2015 Acquisitions" for purposes of explaining our results of operations.
Asset Purchases
Periodically we acquire customer contracts that we account for as an asset purchase and record a corresponding intangible asset that is amortized over its assumed useful life.
During 2017, we acquired customer contracts for an aggregate purchase price of $37.4 million, of which $14.9 million was paid in 2017 on the respective closing dates. Of the remaining $22.5 million, $4.5 million was subsequently paid during the year ended December 31, 2017. The remaining $18.0 million is expected to be paid in 2018, subject to any indemnification claims made through the final payment date.
During 2016, we acquired customer contracts for an aggregate purchase price of $41.3 million, of which $20.0 million was paid in 2016 on the respective closing dates. The remaining $21.3 million was paid during the year ended December 31, 2017.
We did not have any asset purchases in 2015.
Indebtedness
The following summarizes our long-term debt at December 31, 2017 and 2016 (amounts in millions):
22
December 31, 2017 | December 31, 2016 | ||||||
Term loan | $ | 693.0 | $ | 425.8 | |||
7.875% Senior unsecured notes | 575.0 | 300.0 | |||||
Revolving line of credit | — | 20.0 | |||||
Total debt obligations | 1,268.0 | 745.8 | |||||
Unamortized debt issuance costs | (33.8 | ) | (9.3 | ) | |||
Unamortized original issuance premium (discount), net | 9.3 | (7.0 | ) | ||||
Carrying value of debt | 1,243.5 | 729.5 | |||||
Less current portion | (7.0 | ) | (4.3 | ) | |||
Long-term debt less current portion | $ | 1,236.5 | $ | 725.2 | |||
2017 Credit Agreement
In January 2017, we entered into a credit agreement (the "2017 Credit Agreement") that provides a $700.0 million term loan facility and a $75.0 million revolving line of credit facility (which includes a $25.0 million letter of credit facility). In addition, we may request incremental term loan and/or incremental revolving loan commitments in an aggregate amount not to exceed the sum of $150.0 million and an unlimited amount that is subject to pro forma compliance with certain net secured leverage ratio tests provided, however, that incremental revolving loan commitments may not exceed $25.0 million.
The maturity date of the term loan facility is January 2024 and the maturity date of the revolving loan facility is January 2022. The principal amount of the term loan facility is payable in equal quarterly installments of $1.8 million, commencing on March 31, 2017 and continuing thereafter until the maturity date, when the remaining balance of outstanding principal amount is payable in full. In addition to scheduled mandatory repayments, we are also required to repay an amount of up to 50% of Excess Cash Flow (as defined in the 2017 Credit Agreement). No such excess cash payments were made during the year ended December 31, 2017.
We may prepay loans under the 2017 Credit Agreement at any time, subject to certain notice requirements and LIBOR breakage costs.
At our election, the loans under the 2017 Credit Agreement may be made as either Base Rate Loans or Eurodollar Loans. The Eurodollar Loans are subject to a floor of 1.00%.
In July 2017, we entered into Amendment No. 1 (the "Repricing Amendment") to the 2017 Credit Agreement. The Repricing Amendment, among other things, reduced the applicable margin on Tranche B Term Loans from 3.00% to 2.25% for Base Rate Loans and from 4.00% to 3.25% for Eurodollar Loans, and reduced the applicable margin on Revolving Loans from 2.50% to 2.00% for Base Rate Loans and from 3.50% to 3.00% for Eurodollar Loans. The amendment also established a soft call protection of 1.0% through January 10, 2018 for certain prepayments, refinancings, and amendments.
In October 2017, we entered into an Incremental Revolving Credit Assumption Agreement to increase our revolving line of credit facility from $75.0 million to $100.0 million.
The 2017 Credit Agreement does not contain a financial covenant for the term loan facility, but includes a maximum consolidated net secured leverage ratio applicable to the revolving credit facility in the event that utilization exceeds 30% of the revolving loan facility commitment.
Previous Credit Agreement
In October 2015, we entered into a credit agreement (the "October 2015 Credit Agreement"), which provided for a $400.0 million term loan facility and a $50.0 million revolving line of credit facility (which included a $15.0 million letter of credit facility and a $10.0 million swingline facility). In May 2016, we entered into an incremental term loan agreement that increased outstanding term loans by $30.0 million. As of December 31, 2016, we had drawn $20.0 million under the revolving line of credit and had $29.5 million of available borrowing capacity. Amounts outstanding under the October 2015 Credit Agreement were repaid in full in connection with the 2017 Credit Agreement. The previous term loan was issued at an OID of $8.0 million.
7.875% Senior Unsecured Notes
23
In December 2016, we completed a private offering of $300.0 million aggregate principal amount of 7.875% senior unsecured notes due in 2024 (the "Original Notes"). The proceeds of the Original Notes were deposited into escrow, where the funds remained until the closing of the acquisition of Hibernia in January 2017. We recognized the proceeds from the private offering as restricted cash and cash equivalents in our consolidated financial statements as of December 31, 2016, which were subsequently released with the closing of Hibernia. In connection with the offering, we incurred debt issuance costs of $9.7 million, of which $0.5 million was incurred in 2016 and the remainder was incurred in 2017.
In June 2017, we completed a private offering of $150.0 million aggregate principal amount of 7.875% senior unsecured notes due in 2024 (the "June 2017 Notes"). The June 2017 Notes will be treated as a single series of debt securities with the Company's Original Notes (together with the Original Notes, the "Existing Notes"). The June 2017 Notes have identical terms as the Original Notes, other than the issue date and offering price. The June 2017 Notes were issued at a premium of $9.0 million. In connection with the offering, we incurred debt issuance costs of $2.9 million.
In October 2017, we completed a private offering of $125.0 million aggregate principal amount of 7.875% senior unsecured notes due in 2024 (the "October 2017 Notes"). The October 2017 Notes will be treated as a single series of debt securities with the Existing Notes. The October 2017 Notes have identical terms as the Existing Notes, other than the issue date and offering price. The October 2017 Notes were issued at a premium of $7.5 million. In connection with the offering, we incurred debt issuance costs of $3.2 million.
Subsequent Events
On February 23, 2018, we entered into an Agreement for the Sale and Purchase of Interoute Communications Holdings S.A., a Luxembourg public limited liability company. The purchase price of approximately €1.9 billion will be paid in cash at closing. We received committed equity financing for the transaction of $250 million from two institutional investors and committed debt financing from a group of financial institutions for the remainder. We expect the transaction to close in three to six months, subject to customary regulatory approvals.
Results of Operations of the Company
Year Ended December 31, 2017 Compared to Years Ended December 31, 2016 and 2015
Overview. The information presented in the tables below is comprised of the consolidated financial information for the years ended December 31, 2017, 2016, and 2015 (amounts in millions):
24
Year Ended December 31, | Year-over-Year | ||||||||||||||||
2017 | 2016 | 2015 | 2017 to 2016 | 2016 to 2015 | |||||||||||||
Revenue: | |||||||||||||||||
Telecommunications services | $ | 827.9 | $ | 527.3 | $ | 372.5 | 57.0 | % | 41.6 | % | |||||||
Operating expenses: | |||||||||||||||||
Cost of telecommunications services | 432.1 | 279.6 | 207.7 | 54.5 | % | 34.7 | % | ||||||||||
Selling, general and administrative expenses | 215.4 | 143.2 | 101.7 | 50.4 | % | 40.8 | % | ||||||||||
Severance, restructuring and other exit costs | 22.4 | 0.9 | 12.7 | 2,474.7 | % | (93.1 | )% | ||||||||||
Depreciation and amortization | 132.6 | 62.8 | 46.7 | 111.2 | % | 34.4 | % | ||||||||||
Total operating expenses | 802.5 | 486.5 | 368.8 | 65.0 | % | 31.9 | % | ||||||||||
Operating income | 25.4 | 40.8 | 3.7 | (37.8 | )% | 1,018.5 | % | ||||||||||
Other expense: | |||||||||||||||||
Interest expense, net | (71.2 | ) | (29.4 | ) | (13.9 | ) | 141.9 | % | 111.1 | % | |||||||
Loss on debt extinguishment | (8.6 | ) | (1.6 | ) | (3.4 | ) | 427.0 | % | (52.3 | )% | |||||||
Other income (expense), net | 0.2 | (0.6 | ) | (1.2 | ) | (134.7 | )% | (50.6 | )% | ||||||||
Total other expense | (79.6 | ) | (31.6 | ) | (18.5 | ) | 151.6 | % | 70.7 | % | |||||||
(Loss) income before income taxes | (54.2 | ) | 9.2 | (14.8 | ) | (689.9 | )% | (162.0 | )% | ||||||||
Provision for (benefit from) income taxes | 17.3 | 3.9 | (34.1 | ) | * | * | |||||||||||
Net (loss) income | $ | (71.5 | ) | $ | 5.3 | $ | 19.3 | (1,459.3 | )% | (72.8 | )% | ||||||
* Not meaningful
Year Ended December 31, 2017 Compared to Year Ended December 31, 2016
Revenue
Our revenue increased by $300.6 million, or 57.0%, from $527.3 million for the year ended December 31, 2016 to $827.9 million for the year ended December 31, 2017. The increase was primarily due to 2017 Acquisitions and the purchase of certain customer contracts.
On a constant currency basis using the average exchange rates in effect during the year ended December 31, 2016, revenue would have been higher by $3.5 million for the year ended December 31, 2017.
Cost of Telecommunications Services Provided
Cost of telecommunications services provided increased by $152.5 million, or 54.5%, from $279.6 million for the year ended December 31, 2016 to $432.1 million for the year ended December 31, 2017. Consistent with our increase in revenue, the increase in cost of telecommunications services provided was principally driven by 2017 Acquisitions and the purchase of certain customer contracts.
On a constant currency basis using the average exchange rates in effect during the year ended December 31, 2016, cost of telecommunications services provided would have been higher by $1.0 million for the year ended December 31, 2017.
Operating Expenses
Selling, General and Administrative Expenses. Selling, general and administrative expenses increased by $72.2 million, or 50.4%, from $143.2 million for the year ended December 31, 2016 to $215.4 million for the year ended December 31, 2017. The
25
following table summarizes the major categories of selling, general and administrative expenses for the years ended December 31, 2017 and 2016 (amounts in millions):
Year Ended December 31, | ||||||||||||||
2017 | 2016 | $ Variance | % Change | |||||||||||
Employee related compensation (excluding share-based compensation) | $ | 97.3 | $ | 83.1 | $ | 14.2 | 17.1 | % | ||||||
Share-based compensation | 22.2 | 15.8 | 6.4 | 40.7 | % | |||||||||
Transaction and integration expense | 19.1 | 4.8 | 14.3 | 299.6 | % | |||||||||
Other SG&A(1) | 76.8 | 39.5 | 37.3 | 94.2 | % | |||||||||
Total | $ | 215.4 | $ | 143.2 | $ | 72.2 | 50.4 | % | ||||||
(1) Includes bad debt expense, professional fees, marketing costs, facilities, and other general support costs.
Employee related compensation increased primarily due to the Hibernia acquisition. Share-based compensation expense increases were driven by the recognition of share-based compensation for performance awards and an increase in the aggregate value of employee equity awards. Transaction and integration costs increases were driven by 2017 Acquisitions. Other SG&A expense increases were principally driven by the acquisition of Hibernia.
On a constant currency basis using the average exchange rates in effect during the year ended December 31, 2016, selling, general and administrative expenses would have been higher by $0.3 million for the year ended December 31, 2017.
Severance, Restructuring and Other Exit Costs. For the year ended December 31, 2017, we incurred restructuring charges of $22.4 million relating to 2017 Acquisitions. We incurred restructuring charges of $0.9 million for the year ended December 31, 2016 related to the acquisition of Telnes.
Depreciation and Amortization. Amortization of intangible assets increased $28.3 million or 69.7%, from $40.7 million for the year ended December 31, 2016 to $69.0 million for the year ended December 31, 2017, primarily due to the additional definite-lived intangible assets recorded in the Hibernia acquisition. Depreciation expense increased $41.5 million, or 187.3% from $22.1 million to $63.6 million for the year ended December 31, 2017, primarily due to the assets acquired from the Hibernia acquisition.
Other Expense. Other expense increased by $48.0 million, or 151.6% from $31.6 million for the year ended December 31, 2016 to $79.6 million for the year ended December 31, 2017. This is primarily attributed to higher interest expense related to increased debt levels to fund the 2017 Acquisitions as well as a loss on debt extinguishment of $8.6 million incurred in connection with the 2017 Credit Agreement and Repricing Amendment.
Provision for income taxes. Our provision for income taxes for the year ended December 31, 2017 was $17.3 million. This included $11.8 million of provisional tax expense related to the reduction of the U.S. corporate income tax rate from 35% to 21% under the Tax Act, $5.5 million of tax expense for the one-time transition on deemed repatriation under the Tax Act, and $29.0 million of tax expense related to the recording of a valuation allowance against net U.S. deferred tax assets, partially offset by $19.0 million of tax benefit for the current year tax loss at the statutory rate and $9.3 million of tax benefit related to foreign tax rate differential.
Year Ended December 31, 2016 Compared to Year Ended December 31, 2015
Revenue
Our revenue increased by $154.8 million, or 41.6%, from $372.5 million for the year ended December 31, 2015 to $527.3 million for the year ended December 31, 2016. The increase was primarily due to the 2016 Acquisition and having the full year impact of 2015 Acquisitions, as well as rep-driven growth and the purchase of certain customer contracts.
On a constant currency basis using the average exchange rates in effect during the year ended December 31, 2015, revenue would have been higher by $2.8 million for the year ended December 31, 2016.
Cost of Telecommunications Services Provided
Cost of telecommunications services provided increased by $71.9 million, or 34.7%, from $207.7 million for the year ended December 31, 2015 to $279.6 million for the year ended December 31, 2016. Consistent with our increase in revenue, the increase
26
in cost of telecommunications services provided was principally driven by the 2016 Acquisition and having the full year impact of 2015 Acquisitions, as well as rep-driven growth and the purchase of certain customer contracts.
On a constant currency basis using the average exchange rates in effect during the year ended December 31, 2015, cost of telecommunications services provided would have been higher by $1.0 million for the year ended December 31, 2016.
Operating Expenses
Selling, General and Administrative Expenses. Selling, general and administrative expenses increased by $41.5 million, or 40.8%, from $101.7 million for the year ended December 31, 2015 to $143.2 million for the year ended December 31, 2016. The following table summarizes the major category of selling, general and administrative expenses for the year ended December 31, 2016 and 2015 (amounts in millions):
Year Ended December 31, | ||||||||||||||
2016 | 2015 | $ Variance | % Change | |||||||||||
Employee related compensation (excluding share-based compensation) | $ | 83.1 | $ | 59.7 | $ | 23.4 | 39.2 | % | ||||||
Share-based compensation | 15.8 | 7.9 | 7.9 | 100.3 | % | |||||||||
Transaction and integration expense | 4.8 | 6.1 | (1.3 | ) | (21.4 | )% | ||||||||
Other SG&A(1) | 39.5 | 28.0 | 11.5 | 41.0 | % | |||||||||
Total | $ | 143.2 | $ | 101.7 | $ | 41.5 | 40.8 | % | ||||||
(1) Includes bad debt expense, professional fees, marketing costs, facilities, and other general support costs.
Employee related compensation increased primarily due to the 2016 Acquisition and having the full year impact of 2015 Acquisitions. Share-based compensation expense increases were driven by (i) the recognition of share-based compensation for performance awards where the performance criteria were met, (ii) certain shares issued to former employees of One Source, which were accounted for as compensation, and (iii) an overall increase in the quantity of employee equity awards. Transaction and integration expense decreases were driven by higher transaction costs associated with the 2015 Acquisitions in 2015. Other SG&A expense increased primarily as a result of the acquisitions.
Severance, Restructuring and Other Exit Costs. Restructuring costs decreased by $11.8 million, or 93.1% from $12.7 million for the year ended December 31, 2015 to $0.9 million for year ended December 31, 2016. The decrease was due to the fact that we closed two large acquisitions in 2015 (One Source and MegaPath), compared to one small acquisition in 2016 (Telnes).
Depreciation and Amortization. Amortization of intangible assets increased $14.7 million, or 56.5%, from $26.0 million for the year ended December 31, 2015 to $40.7 million for the year ended December 31, 2016, due to the addition of definite-lived intangible assets from the Telnes and having the full year impact of the amortization of definite-lived intangible assets from the One Source and MegaPath acquisitions in 2015. Similarly, depreciation expense increased $1.4 million, or 6.8%, from $20.7 million for the year ended December 31, 2015 to $22.1 million for the year ended December 31, 2016, primarily due to having the full year impact of depreciation from the addition of property and equipment from the MegaPath acquisition in 2015.
Other Expense. Other expense increased by $13.1 million, or 70.7%, from $18.5 million for the year ended December 31, 2015 to $31.6 million for the year ended December 31, 2016. This is primarily attributable to higher interest expense related to increased debt levels to support acquisition activities.
On a constant currency basis using the average exchange rates in effect during the year ended December 31, 2015, selling, general and administrative expenses would have been higher by $0.6 million for the year ended December 31, 2016.
Liquidity and Capital Resources
Our primary sources of liquidity have been cash provided by operations, equity offerings, and debt financing. Our principal uses of cash have been for acquisitions, working capital, capital expenditures, and debt service requirements. We anticipate that our principal uses of cash in the future will be for acquisitions, capital expenditures, working capital, and debt service.
Management monitors cash flow and liquidity requirements on a regular basis, including an analysis of the anticipated working capital requirements for the next 12 months. This analysis assumes our ability to manage expenses, capital expenditures, indebtedness, and the anticipated growth of revenue. If our operating performance differs significantly from our forecasts, we may
27
be required to reduce our operating expenses and curtail capital spending, and we may not remain in compliance with our debt covenants. In addition, if we are unable to fully fund our cash requirements through operations and current cash on hand, we may need to obtain additional financing through a combination of equity and debt financings and/or renegotiation of terms of our existing debt. If any such activities become necessary, there can be no assurance that we would be successful in obtaining additional financing or modifying our existing debt terms.
Our capital expenditures increased by $17.8 million, or 73.6%, from $24.2 million (4.6% of revenue) for the year ended December 31, 2016 to $42.0 million (5.1% of revenue) for the year ended December 31, 2017. The increase in capital expenditures was due to our growth and the acquisition of Hibernia. We anticipate that we will incur capital expenditures in the range of 5% to 6% of revenue for 2018. We continue to expect that our capital expenditures will be primarily success-based, i.e., in support of specific revenue opportunities.
We believe that our cash flows from operating activities, in addition to cash on-hand, will be sufficient to fund our operating activities and capital expenditures for the foreseeable future, and in any event for at least the next 12 to 18 months. However, no assurance can be given that this will be the case.
Cashflows
The following table summarizes the components of our cash flows for the years ended December 31, 2017, 2016, and 2015.
Consolidated Statements of Cash Flows Data | Year Ended December 31, | ||||||||||
(amounts in millions) | 2017 | 2016 | 2015 | ||||||||
Net cash provided by operating activities | $ | 63.4 | $ | 60.4 | $ | 24.6 | |||||
Net cash used in investing activities | (460.4 | ) | (362.6 | ) | (314.8 | ) | |||||
Net cash provided by financing activities | 469.7 | 318.6 | 253.6 | ||||||||
Cash Provided by Operating Activities
Our largest source of cash provided by operating activities is monthly recurring revenue from our customers. Our primary uses of cash are payments to network suppliers, compensation related costs, and payments to third-party vendors such as agents, contractors, and professional service providers.
Net cash flows provided by operating activities increased by $3.0 million, from $60.4 million for the year ended December 31, 2016 to $63.4 million for the year ended December 31, 2017. This increase was primarily due to 2017 Acquisitions and the purchase of certain customer contracts partially offset by non-recurring cash payments for severance and exit costs and for transaction and integration costs.
Net cash flows provided by operating activities increased by $35.8 million, from $24.6 million for the year ended December 31, 2015 to $60.4 million for the year ended December 31, 2016. This increase was primarily due to 2016 and 2015 Acquisitions as well as rep-driven growth and the purchase of certain customer contracts.
Cash provided by operating activities during the year ended December 31, 2017 included $15.9 million cash paid for severance and exit costs, $19.1 million cash paid for transaction and integration costs, and a working capital use of $14.2 million.
Cash provided by operating activities during the year ended December 31, 2016 included $4.5 million cash paid for severance and exit costs, $4.8 million cash paid for transaction and integration costs, and a working capital use of $25.6 million.
Cash provided by operating activities during the year ended December 31, 2015 included $8.0 million cash paid for severance and exit costs, $6.1 million cash paid for transaction and integration costs, and a working capital use of $21.2 million.
Cash Used in Investing Activities
Our primary uses of cash include acquisitions, purchase of customer contracts, and capital expenditures.
Net cash flows used in investing activities increased by $97.8 million, from $362.6 million for the year ended December 31, 2016 to $460.4 million for the year ended December 31, 2017. Net cash flows from investing activities increased by $47.8 million, from $314.8 million for the year ended December 31, 2015 to $362.6 million for the year ended December 31, 2016.
28
Cash used in investing activities for the year ended December 31, 2017 primarily consisted of $706.3 million for the 2017 Acquisitions, as well as the purchase of certain customer contracts for which we paid $14.9 million, and capital expenditures of approximately $42.0 million.
.
Cash used in investing activities for the year ended December 31, 2016 primarily consisted of $304.3 million for restricted cash that was deposited into escrow in anticipation of the Hibernia Networks acquisition that closed on January 9, 2017, $14.1 million for the 2016 Acquisition, as well as the purchase of certain customer contracts for which we paid $20.0 million, and capital expenditures of approximately $24.2 million.
Cash used in investing activities for the year ended December 31, 2015 primarily consisted of $300.7 million of cash used for the 2015 Acquisitions, in addition to capital expenditures of approximately $14.1 million.
Cash Provided by Financing Activities
Our primary source of cash for financing activities is debt financing proceeds. Our primary use of cash for financing activities is the refinancing of our debt and repayment of principal pursuant to the debt agreements.
Net cash flows provided by financing activities increased by $151.1 million, from $318.6 million for the year ended December 31, 2016 to $469.7 million for the year ended December 31, 2017. Net cash flows from financing activities increased by $65.0 million, from $253.6 million for the year ended December 31, 2015 to $318.6 million for the year ended December 31, 2016.
Net cash flows provided by financing activities for the year ended December 31, 2017 was $469.7 million, consisting primarily of net proceeds from the term loan and issuance of senior notes to fund the 2017 Acquisitions.
Net cash provided by financing activities for the year ended December 31, 2016 was $318.6 million consisting primarily of $300.0 million in proceeds from the issuance of senior notes to fund the Hibernia Networks acquisition.
Net cash provided by financing activities for the year ended December 31, 2015 was $253.6 million, which primarily consisted of net proceeds from the October 2015 Credit Agreement used to fund the acquisition of One Source.
Supplemental cash flows
During the years ended December 31, 2017, 2016 and 2015, we made cash payments for interest totaling $47.2 million, $26.3 million, and $13.1 million, respectively. The increase in interest payments is a result of the incremental debt associated with acquisitions, as discussed further in Note 8 - Debt of the notes to the consolidated financial statements (Part II, Item 8 of this Form 10-K). The cash payments for interest expense are directly correlated to our outstanding indebtedness.
Off-Balance Sheet Arrangements, Contractual Obligations and Commitments
The following table summarizes our significant contractual obligations as of December 31, 2017 (amounts in millions):
Total | Less than 1 year | 1-3 years | 3-5 years | More than 5 years | |||||||||||||||
Term loan | $ | 693.0 | $ | 7.0 | $ | 14.0 | $ | 14.0 | $ | 658.0 | |||||||||
7.875% Senior Note | 575.0 | — | — | — | 575.0 | ||||||||||||||
Operating leases | 42.0 | 6.3 | 12.1 | 9.4 | 14.2 | ||||||||||||||
Capital leases | 1.8 | 1.5 | 0.3 | — | — | ||||||||||||||
Network supplier agreements (1) | 308.6 | 144.1 | 111.8 | 13.7 | 39.0 | ||||||||||||||
Other (2) | 15.1 | 8.4 | 5.4 | 1.3 | — | ||||||||||||||
$ | 1,635.5 | $ | 167.3 | $ | 143.6 | $ | 38.4 | $ | 1,286.2 | ||||||||||
(1)Excludes contracts where the initial term has expired and we are currently in month-to-month status.
(2) "Other" consists of vendor contracts associated with network monitoring and maintenance services.
As of December 31, 2017, we did not have any off-balance sheet arrangements.
29
Non-GAAP Financial Measures
In addition to financial measures prepared in accordance with GAAP, from time to time we may use or publicly disclose certain "non-GAAP financial measures" in the course of our financial presentations, earnings releases, earnings conference calls, and otherwise. For these purposes, the SEC defines a "non-GAAP financial measure" as a numerical measure of historical or future financial performance, financial positions, or cash flows that (i) exclude amounts, or is subject to adjustments that effectively exclude amounts, included in the most directly comparable measure calculated and presented in accordance with GAAP in financial statements, and (ii) include amounts, or is subject to adjustments that effectively include amounts, that are excluded from the most directly comparable measure so calculated and presented.
Non-GAAP financial measures are provided as additional information to investors to provide an alternative method for assessing our financial condition and operating results. We believe that these non-GAAP measures, when taken together with our GAAP financial measures, allow us and our investors to better evaluate our performance and profitability. These measures are not in accordance with, or a substitute for, GAAP, and may be different from or inconsistent with non-GAAP financial measures used by other companies. These measures should be used in addition to and in conjunction with results presented in accordance with GAAP, and should not be relied upon to the exclusion of GAAP financial measures.
Pursuant to the requirements of Regulation G, whenever we refer to a non-GAAP financial measure, we will also present the most directly comparable financial measure calculated and presented in accordance with GAAP, along with a reconciliation of the differences between the non-GAAP financial measure we reference with such comparable GAAP financial measure.
Adjusted Earnings before Interest, Taxes, Depreciation and Amortization ("Adjusted EBITDA")
Adjusted EBITDA is defined as net income/(loss) before interest, income taxes, depreciation and amortization ("EBITDA") adjusted to exclude severance, restructuring and other exit costs, acquisition-related transaction and integration costs, losses on extinguishment of debt, share-based compensation, and from time to time, other non-cash or non-recurring items.
We use Adjusted EBITDA to evaluate operating performance, and this financial measure is among the primary measures we use for planning and forecasting future periods. We further believe that the presentation of Adjusted EBITDA is relevant and useful for investors because it allows investors to view results in a manner similar to the method used by management and makes it easier to compare our results with the results of other companies that have different financing and capital structures. In addition, we have debt covenants that are based on a leverage ratio that utilizes a modified EBITDA calculation, as defined in our credit agreement. The modified EBITDA calculation is similar to our definition of Adjusted EBITDA; however it includes the pro forma Adjusted EBITDA of and expected cost synergies from the companies acquired by us during the applicable reporting period. Finally, Adjusted EBITDA results, along with other quantitative and qualitative information, are utilized by management and our compensation committee for purposes of determining bonus payouts to our employees.
Adjusted EBITDA Less Capital Expenditures
Adjusted EBITDA less purchases of property and equipment, which we also refer to as capital expenditures or capex, is a performance measure that we use to evaluate the appropriate level of capital expenditures needed to support our expected revenue, and to provide a comparable view of our performance relative to other telecommunications companies who may utilize different strategies for providing access to fiber-based services and related infrastructure. We use a "capex light" strategy, which means we purchase last-mile services and select core IP network services from other providers on an as-needed basis, pursuant to our customers' requirements. Many other telecommunications companies spend significant amounts of capital expenditures to construct their own fiber networks and data centers, and attempt to purchase as little as possible from other providers. As a result of our strategy, we typically have lower Adjusted EBITDA margins compared to other providers, but also spend much less on capital expenditures relative to our revenue. We believe it is important to take both of these factors into account when evaluating our performance.
The following is a reconciliation of Adjusted EBITDA and Adjusted EBITDA less capital expenditures from Net Income (Loss):
30
Year Ended December 31, | |||||||||||
(Amounts in millions) | 2017 | 2016 | 2015 | ||||||||
(Unaudited) | |||||||||||
Adjusted EBITDA | |||||||||||
Net (loss) income | $ | (71.5 | ) | $ | 5.3 | $ | 19.3 | ||||
(Benefit from) provision for income taxes | 17.3 | 3.9 | (34.1 | ) | |||||||
Interest and other expense, net | 71.0 | 30.0 | 15.1 | ||||||||
Loss on debt extinguishment | 8.6 | 1.6 | 3.4 | ||||||||
Depreciation and amortization | 132.6 | 62.8 | 46.7 | ||||||||
Severance, restructuring and other exit costs | 22.4 | 0.9 | 12.7 | ||||||||
Transaction and integration costs | 19.1 | 4.8 | 6.1 | ||||||||
Share-based compensation | 22.2 | 15.8 | 7.9 | ||||||||
Adjusted EBITDA | 221.7 | 125.1 | 77.1 | ||||||||
Purchases of property and equipment | (42.0 | ) | (24.2 | ) | (14.1 | ) | |||||
Adjusted EBITDA less capital expenditures | $ | 179.7 | $ | 100.9 | $ | 63.0 | |||||
Critical Accounting Policies and Estimates
The discussion of our financial condition and results of operations is based upon our consolidated financial statements, which have been prepared in accordance with accounting principles generally accepted in the United States ("GAAP"). In the preparation of our consolidated financial statements, we are required to make estimates and assumptions that affect the reported amounts of assets, liabilities, revenues and expenses, as well as the related disclosures of contingent assets and liabilities. We base our estimates on historical experience and on various other assumptions that we believe to be reasonable under the circumstances. The results of our analysis form the basis for making assumptions about the carrying values of assets and liabilities that are not readily apparent from other sources. Actual results may differ from these estimates under different assumptions or conditions, and the impact of such differences may be material to our consolidated financial statements. Our critical accounting policies have been discussed with the Audit Committee of our Board of Directors. We believe that the following critical accounting policies affect the more significant judgments and estimates used in the preparation of our consolidated financial statements, and believe that an understanding of these policies is important to a proper evaluation of the reported consolidated financial results. Our significant accounting policies are described in Note 2 – Significant Accounting Policies of the notes to the consolidated financial statements (Part II, Item 8 of this Form 10-K).
Certain prior year amounts have been reclassified for consistency with the current year presentation. These reclassifications had no effect on reported results of operations.
Segment Reporting
We report operating results and financial data in one operating and reporting segment. Our Chief Executive Officer is the chief operating decision maker and manages our business as a single profit center in order to promote collaboration, provide comprehensive service offerings across our entire customer base, and provide incentives to employees based on the success of the organization as a whole. Although certain information regarding selected products or services is discussed for purposes of promoting an understanding of our complex business, the chief operating decision maker manages our business and allocates resources at the consolidated level.
Revenue Recognition
We deliver eight primary services to our customers — private networking; internet; optical transport; SD-WAN; managed services; voice and unified communications; video transport; and access services. Certain of our current commercial activities have features that may be considered multiple elements, specifically, when we sell connectivity services in addition to Customer Premise Equipment ("CPE"). We believe that there is sufficient evidence to determine each element’s fair value and, as a result, in those arrangements where there are multiple elements, the service revenue is recorded ratably over the term of the agreement and the equipment is accounted for as a sale, at the time of sale, as long as collectability is reasonably assured.
31
Our services are provided under contracts that typically provide for an installation charge along with payments of recurring charges on a monthly basis for use of the services over a committed term. Our contracts with customers specify the terms and conditions for providing such services, including installation date, recurring and non-recurring fees, payment terms, and length of term. These contracts call for us to provide the service in question (e.g., data transmission between point A and point Z), to manage the activation process, and to provide ongoing support (in the form of service maintenance and trouble-shooting) during the service term. The contracts do not typically provide the customer any rights to use specifically identifiable assets. Furthermore, the contracts generally provide us with discretion to engineer (or re-engineer) a particular network solution to satisfy each customer’s data transmission requirement, and typically prohibit physical access by the customer to the network infrastructure used by us and our suppliers to deliver the services.
We recognize revenue as follows:
Recurring Revenue. Recurring revenue represents the substantial majority of our revenue, and consists of fees we charge for ongoing services that are generally fixed in price and billed on a recurring monthly basis (one month in advance) for a specified term. At the end of the term, most contracts provide for a continuation of services on the same terms, either for a specified renewal period (e.g., one year) or on a month-to-month basis. We record recurring revenue based on the fees agreed to in each contract, as long as the contract is in effect, for the period the service is provided.
Usage Revenue. Usage revenue represents variable charges for certain services, based on specific usage of those services, or usage above a fixed threshold, billed monthly in arrears. We record usage revenue based on actual usage charges billed using the rates and/or thresholds specified in each contract.
Non-recurring Revenue. Non-recurring revenue consists of charges for installation in connection with the delivery of recurring communications services, late payments, cancellation fees, early termination fees, and equipment sales. Fees billed for installation services are initially recorded as deferred revenue then recognized ratably over the contractual term of the recurring service. Fees charged for late payments, cancellation (pre-installation) or early termination (post-installation) are typically fixed or determinable per the terms of the respective contract, and are recognized as revenue when billed. In addition, from time to time we sell communications and/or networking equipment to our customers in connection with our data networking services. We recognize revenue from the sale of equipment at the contracted selling price when title to the equipment passes to the customer (generally F.O.B. origin).
Prepaid Capacity Sales and Indefeasible Right to Use. From time to time we sell capacity on a long-term basis, where a certain portion of the contracted revenue is prepaid upon acceptance of the service by the customer. This prepaid amount is initially recorded as deferred revenue and amortized ratably over the term of the contract. Certain of these prepaid capacity sales are in the form of Indefeasible Rights to Use ("IRUs"), where the customer has the right to use the capacity for the life of the fiber optic cable. We record revenues from these prepaid leases of fiber optic cable IRUs over the term that the customer is given exclusive access to the assets, generally 20 years, consistent with our assumed useful life of the associated fiber optic cable.
Universal Service Fund (USF), Gross Receipts Taxes and Other Surcharges. We are liable in certain cases for collecting regulatory fees and/or certain sales taxes from our customers and remitting the fees and taxes to the applicable governing authorities. We record certain excise taxes and surcharges on a gross basis and include them in our telecommunications services revenue and costs of telecommunications services.
We record revenue only when collectability is reasonably assured, irrespective of the type of revenue.
Share-Based Compensation
We issue three types of grants under our share-based compensation plan: time-based restricted stock, time-based stock options, and performance-based restricted stock. The time-based restricted stock and stock options generally vest over a four-year period, contingent upon meeting the requisite service period requirement. Performance awards typically vest over a shorter period, e.g., one to two years, starting when the performance criteria established in the grant have been met and maintained.
The share price of our common stock as reported on the NYSE on the date of grant is used as the fair value for all restricted stock. We use the Black-Scholes option-pricing model to determine the estimated fair value for stock options. Critical inputs into the Black-Scholes option-pricing model include the following: option exercise price, fair value of the stock price, expected life of the option, annualized volatility of the stock, annual rate of quarterly dividends on the stock, and risk-free interest rate.
32
Implied volatility is calculated as of each grant date based on our historical stock price volatility along with an assessment of a peer group. Other than the expected life of the option, volatility is the most sensitive input to our option grants. The risk-free interest rate used in the Black-Scholes option-pricing model is determined by referencing the U.S. Treasury yield curve rates with the remaining term equal to the expected life assumed at the date of grant. Forfeitures are estimated based on our historical analysis of attrition levels. Forfeiture estimates are updated quarterly for actual forfeitures.
The expense is recognized on a straight-line basis over the vesting period. We recognize share-based compensation expense for performance awards when we consider the achievement of the performance criteria to be probable.
Income Taxes
Income taxes are accounted for under the asset and liability method pursuant to GAAP. Under this method, deferred tax assets and liabilities are recognized for the expected future consequences attributable to the differences between the financial statement carrying amounts and the tax basis of assets and liabilities. The effect of a change in tax rates on deferred tax assets and liabilities is recognized in the period of the change. Further, deferred tax assets are recognized for the expected realization of available net operating loss and tax credit carryforwards. A valuation allowance is recorded on gross deferred tax assets when it is "more likely than not" that such asset will not be realized. When evaluating the realizability of deferred tax assets, all evidence, both positive and negative, is evaluated. Items considered in this analysis include the ability to carry back losses, the reversal of temporary differences, tax planning strategies, and expectations of future earnings. We review our deferred tax assets on a quarterly basis to determine if a valuation allowance is required based upon these factors. Changes in our assessment of the need for a valuation allowance could give rise to a change in such allowance, potentially resulting in additional expense or benefit in the period of change.
Our income tax provision includes U.S. federal, state, local, and foreign income taxes and is based on pre-tax income or loss. In determining the annual effective income tax rate, we analyzed various factors, including our annual earnings and taxing jurisdictions in which the earnings were generated, the impact of state and local income taxes and our ability to use tax credits and net operating loss carryforwards.
Under GAAP, the amount of tax benefit to be recognized is the amount of benefit that is "more likely than not" to be sustained upon examination. We analyze our tax filing positions in all of the U.S. federal, state, local, and foreign tax jurisdictions where we are required to file income tax returns, as well as for all open tax years in these jurisdictions. If, based on this analysis, we determine that uncertainties in tax positions exist, a liability is established in the consolidated financial statements. We recognize accrued interest and penalties related to unrecognized tax positions in the provision for income taxes.
Estimating Allowances and Accrued Liabilities
Allowance for Doubtful Accounts
We establish an allowance for bad debts for accounts receivable amounts that may not be collectible. We state our accounts receivable balances at amounts due from the customer net of an allowance for doubtful accounts. We determine this allowance by considering a number of factors, including the length of time receivables are past due, the customer's payment history and current ability to pay its obligation to the Company, and the condition of the general economy. The allowance for doubtful accounts was $5.1 million and $2.7 million as of December 31, 2017 and 2016, respectively.
Allowance for Vendor Disputes
In the normal course of business, we identify errors by suppliers with respect to the billing of services. We perform bill verification procedures to ensure that errors in our suppliers’ billed invoices are identified and resolved. If we conclude that a vendor has billed us inaccurately, we will record a liability only for the amount that we believe is owed. As of December 31, 2017 and 2016, we had $5.3 million and $5.8 million, respectively, in disputed billings from suppliers that were not accrued because we do not believe we owe them.
Deferred Costs
Installation costs related to provisioning of recurring communications services that we incur from third-party suppliers, directly attributable and necessary to fulfill a particular service contract, and which costs would not have been incurred but for the occurrence of that service contract, are recorded as deferred costs and expensed ratably over the contractual term of service in the same manner as the deferred revenue arising from that contract. Based on historical experience, we believe the initial contractual term is the best
33
estimate for the period of earnings. If any installation costs exceed the amount of corresponding deferred revenue, the excess cost is recognized in the current period.
Goodwill and Intangible Assets
Goodwill represents the excess of the purchase price over the fair value of the net identifiable assets acquired in a business combination. Goodwill is reviewed for impairment at least annually, in October, or more frequently if a triggering event occurs between impairment testing dates. We operate as a single operating segment and as a single reporting unit for the purpose of evaluating goodwill impairment. Our impairment assessment begins with a qualitative assessment to determine whether it is more likely than not that the fair value of the reporting unit is less than its carrying value. The qualitative assessment includes comparing our overall financial performance against the planned results used in the last quantitative goodwill impairment test. Additionally, we assess the fair value in light of certain events and circumstances, including macroeconomic conditions, industry and market considerations, cost factors, and other relevant entity and Company specific events. The selection and assessment of qualitative factors used to determine whether it is more likely than not that the fair value of a reporting unit exceeds the carrying value involves significant judgments and estimates. If it is determined under the qualitative assessment that it is more likely than not that the fair value of a reporting unit is less than its carrying value, then a two-step quantitative impairment test is performed. Under the first step, the estimated fair value of the Company would be compared with our carrying value (including goodwill). If the fair value of the Company exceeds the carrying value, step two does not need to be performed. If the estimated fair value of the Company is less than the carrying value, an indication of goodwill impairments exists and we would need to perform step two of the impairment test. Under step two, an impairment loss would be recognized for any excess of the carrying amount of our goodwill over the implied fair value of that goodwill. The fair value under the two-step assessment is determined using a combination of both income and market-based approaches. There were no goodwill impairments identified for the years ended December 31, 2017, 2016, and 2015.
Intangible assets arising from business combinations, such as acquired customer contracts and relationships, (collectively "customer relationships"), trade names, intellectual property or know-how, are initially recorded at fair value. We amortize these intangible assets over the determined useful life, which generally ranges from three to eight years. We review the intangible assets for impairment whenever events or circumstances indicate that the carrying amount of an asset may not be fully recoverable. If the total of the expected undiscounted future cash flows is less than the carrying amount of the asset, an impairment loss is recognized for the difference between fair value and the carrying value of the asset. There were no intangible asset impairments recognized for the years ended December 31, 2017, 2016, and 2015.
Further information is available in Note 4 – Goodwill and Intangible Assets of the notes to the consolidated financial statements (Part II, Item 8 of this Form 10-K).
Business Combinations and Asset Purchases
We allocate the fair value of purchase consideration to the tangible assets acquired, liabilities assumed, and intangible assets acquired based on their estimated acquisition date fair values. The excess of the fair value of the purchase consideration over the fair values of the identifiable assets acquired and liabilities assumed is recorded as goodwill. When determining the fair values of assets acquired and liabilities assumed, we make significant estimates and assumptions, especially with respect to intangible assets.
We recognize the purchase of assets and the assumption of liabilities as an asset purchase if the transaction does not constitute a business combination. The excess of the fair value of the purchase consideration is allocated on a relative fair value basis to the identifiable assets acquired and liabilities assumed. No goodwill is recorded in an asset purchase.
Critical estimates in valuing certain intangible assets include but are not limited to future expected cash flows from customer relationships and developed technology, discount rates, and terminal values. Our estimate of fair value is based upon assumptions believed to be reasonable, but actual results may differ from estimates.
Other estimates associated with the accounting for acquisitions may change as additional information becomes available regarding the assets acquired and liabilities assumed, as more fully discussed in Note 3 – Business Acquisitions of the notes to the consolidated financial statements (Part II, Item 8 of this Form 10-K).
Recent Accounting Pronouncements
Refer to Note 2 – Significant Accounting Policies of the notes to the consolidated financial statements (Part II, Item 8 of this Form 10-K) for further discussion.
34
ITEM 7A. QUANTITATIVE AND QUALITATIVE DISCLOSURES ABOUT MARKET RISK
We are exposed to certain market risks. These risks, which include interest rate risk and foreign currency exchange risk, arise in the normal course of business rather than from trading activities.
Interest Rate Sensitivity
Our exposure to market risk for changes in interest rates is primarily related to our outstanding term loans and revolving loans. The interest expense associated with our term loans and any loans under our revolving credit facility will vary with market rates.
For purposes of the following hypothetical calculations, we have used the 2017 Credit Agreement, which carries an interest rate equal to either Base Rate Loans with applicable margin at 2.25% or Eurodollar Loans at 3.25%, subject to a floor of 1.0%. Based on rates, a hypothetical 100 basis point increase in the Eurodollar rate would increase annual interest expense by approximately $6.9 million as of December 31, 2017, which would decrease our income and cash flows by the same amount. A hypothetical increase of the Eurodollar rate to 4%, the average historical three-month rate, would increase annual interest expense by approximately $18.2 million, which would decrease our income and cash flows by the same amount.
We do not currently use derivative financial instruments and have not entered into any interest rate hedging transactions, but we may do so in the future.
Exchange Rate Sensitivity
Our exposure to market risk for changes in foreign currency rate relates to our global operations. Our consolidated financial statements are denominated in U.S. Dollars, but a portion of our revenue, cost of telecommunication services provided, and selling, general and administrative expenses are generated in the local currency of our foreign subsidiaries. Accordingly, changes in exchange rates between the applicable foreign currency and the U.S. Dollar will affect the translation of each foreign subsidiary’s financial results into U.S. Dollars for purposes of reporting consolidated financial results.
Approximately 12% of our revenues for the three months ended December 31, 2017 was generated by non-US entities, of which approximately 9% was recorded in GBP, approximately 2% was recorded in Euros, and the remainder was recorded predominantly in Canadian dollars. Approximately 14% of our cost of telecommunications services provided and approximately 12% of our selling, general and administrative expenses for the three months ended December 31, 2017 were generated by the same non-US entities. Therefore, it is highly unlikely that changes in exchange rates would have a material impact on our financial condition or results of operations.
We do not currently use derivative financial instruments and have not entered into any foreign currency hedging transactions, but we may do so in the future.
ITEM 8. FINANCIAL STATEMENTS AND SUPPLEMENTARY DATA
Reference is made to the consolidated financial statements, the notes thereto, and the report thereon, commencing on page F-1 of this Annual Report, which consolidated financial statements, notes, and report are incorporated herein by reference.
ITEM 9. CHANGES IN AND DISAGREEMENTS WITH ACCOUNTANTS ON ACCOUNTING AND FINANCIAL DISCLOSURE
None.
ITEM 9A. CONTROLS AND PROCEDURES
Evaluation of Disclosure Controls and Procedures
Our management, with the participation of our chief executive officer (CEO) and chief financial officer (CFO), has evaluated the effectiveness of our disclosure controls and procedures (as defined in Rules 13a-15(e) and 15d-15(e) under the Securities Exchange Act of 1934, as amended (Exchange Act)), as of the end of the period covered by this Annual Report on Form 10-K. Based on such evaluation, our CEO and CFO have concluded that as of December 31, 2017, our disclosure controls and procedures are designed at a reasonable assurance level and are effective to provide reasonable assurance that information we are required to disclose in reports that we file or submit under the Exchange Act is recorded, processed, summarized, and reported within the time periods
35
specified in the rules and forms of the SEC, and that such information is accumulated and communicated to our management, including our CEO and CFO, as appropriate, to allow timely decisions regarding required disclosure.
In accordance with guidance issued by the SEC, companies are allowed to exclude acquisitions from their first assessment of internal control over financial reporting during the first year subsequent to the date of acquisition while integrating the acquired operations. Our assessment of the effectiveness of internal control over financial reporting excluded Global Capacity, which was acquired in September 2017. Approximately 4% of total assets and 7% of total revenue are associated with the Global Capacity acquisition and are included in the consolidated financial statements of the Company as of and for the year ended December 31, 2017.
Management’s Report on Internal Control over Financial Reporting and Attestation Report of the Registered Public Accounting Firm
Our management is responsible for establishing and maintaining adequate internal control over financial reporting (as defined in Rule 13a-15(f) under the Exchange Act). Management conducted an assessment of the effectiveness of our internal control over financial reporting based on the criteria set forth in Internal Control - Integrated Framework issued by the Committee of Sponsoring Organizations of the Treadway Commission (2013 framework). Based on the assessment, management has concluded that its internal control over financial reporting was effective as of December 31, 2017, to provide reasonable assurance regarding the reliability of financial reporting and the preparation of financial statements in accordance with U.S. GAAP. The effectiveness of our internal control over financial reporting as of December 31, 2017, has been audited by CohnReznick LLP, an independent registered public accounting firm, as stated in their report, which appears herein.
Changes in Internal Control Over Financial Reporting
Except for the implementation of certain internal controls related to the adoption of the new revenue recognition standard (Topic 606), there were no changes in our internal control over financial reporting (as defined in Rules 13a-15(f) and 15d-15(f) under the Exchange Act) during the year ended December 31, 2017, that materially affected, or are reasonably likely to materially affect, our internal control over financial reporting. The Company implemented new controls as part of its effort to adopt Topic 606. The adoption of Topic 606 required the implementation of new accounting processes, which changed the Company's internal controls over revenue recognition and financial reporting. We implemented these internal controls to ensure we adequately evaluated our contracts and properly assessed the impact of Topic 606 on our financial statements to facilitate its adoption in 2018.
36
REPORT OF INDEPENDENT REGISTERED PUBLIC ACCOUNTING FIRM
The Shareholders and Board of Directors of GTT Communications, Inc.
Opinion on Internal Control over Financial Reporting
We have audited internal control over financial reporting of GTT Communications, Inc. and subsidiaries (the “Company”) as of December 31, 2017, based on criteria established in Internal Control-Integrated Framework (2013) issued by the Committee of Sponsoring Organizations of the Treadway Commission (“COSO”). As described in Management’s Report on Internal Control Over Financial Reporting, management excluded from its assessment the internal control over financial reporting at Global Capacity, which was acquired on September 15, 2017 and whose financial statements constitute 4% of total assets and 7% of total revenues of the consolidated financial statement amounts as of and for the year ended December 31, 2017. Accordingly, our audit did not include the internal control over financial reporting at Global Capacity. In our opinion, the Company maintained, in all material respects, effective internal control over financial reporting as of December 31, 2017, based on criteria established in Internal Control - Integrated Framework (2013) issued by COSO.
We have also audited, in accordance with the standards of the Public Company Accounting Oversight Board (United States) (the “PCAOB”), the consolidated balance sheets of GTT Communications, Inc. and subsidiaries as of December 31, 2017 and 2016, and the related consolidated statements of operations, comprehensive (loss) income, stockholders’ equity, and cash flows for each of the three years in the period ended December 31, 2017, and the related notes and the schedule listed in the index at 15(a), and our report dated March 1, 2018 expressed an unqualified opinion on those financial statements and schedules.
Basis for Opinion
The Company’s management is responsible for maintaining effective internal control over financial reporting, and for its assessment of the effectiveness of internal control over financial reporting included in the accompanying Management’s Report on Internal Control over Financial Reporting. Our responsibility is to express an opinion on the Company’s internal control over financial reporting based on our audit. We are a public accounting firm registered with the PCAOB and are required to be independent with respect to the Company in accordance with the U.S. federal securities laws and the applicable rules and regulations of the Securities and Exchange Commission and the PCAOB.
We conducted our audit in accordance with the standards of the PCAOB. Those standards require that we plan and perform the audit to obtain reasonable assurance about whether effective internal control over financial reporting was maintained in all material respects. Our audit included obtaining an understanding of internal control over financial reporting, assessing the risk that a material weakness exists, testing and evaluating the design and operating effectiveness of internal control based on the assessed risk, and performing such other procedures as we considered necessary in the circumstances. We believe that our audit provides a reasonable basis for our opinion.
Definition and Limitations of Internal Control over Financial Reporting
A company’s internal control over financial reporting is a process designed to provide reasonable assurance regarding the reliability of financial reporting and the preparation of financial statements for external purposes in accordance with accounting principles generally accepted in the United States of America. A company’s internal control over financial reporting includes those policies and procedures that (1) pertain to the maintenance of records that, in reasonable detail, accurately and fairly reflect the transactions and dispositions of the assets of the company; (2) provide reasonable assurance that transactions are recorded as necessary to permit preparation of financial statements in accordance with accounting principles generally accepted in the United States of America, and that receipts and expenditures of the company are being made only in accordance with authorizations of management and directors of the company; and (3) provide reasonable assurance regarding prevention or timely detection of unauthorized acquisition, use, or disposition of the company’s assets that could have a material effect on the financial statements.
37
Because of its inherent limitations, internal control over financial reporting may not prevent or detect misstatements. Also, projections of any evaluation of effectiveness to future periods are subject to the risk that controls may become inadequate because of changes in conditions, or that the degree of compliance with the policies or procedures may deteriorate.
/s/ CohnReznick LLP
Tysons, Virginia
March 1, 2018
38
ITEM 9B. OTHER INFORMATION
Not applicable.
PART III
ITEM 10. DIRECTORS, EXECUTIVE OFFICERS AND CORPORATE GOVERNANCE
The information required by this Item is incorporated herein by reference to the definitive Proxy Statement to be filed pursuant to Regulation 14A of the Exchange Act for our 2018 Annual Meeting of Stockholders.
ITEM 11. EXECUTIVE COMPENSATION
The information required by this Item is incorporated herein by reference to the definitive Proxy Statement to be filed pursuant to Regulation 14A of the Exchange Act for our 2018 Annual Meeting of Stockholders.
ITEM 12. SECURITY OWNERSHIP OF CERTAIN BENEFICIAL OWNERS AND MANAGEMENT AND RELATED STOCKHOLDER MATTERS
The information required by this Item is incorporated herein by reference to the definitive Proxy Statement to be filed pursuant to Regulation 14A of the Exchange Act for our 2018 Annual Meeting of Stockholders.
ITEM 13. CERTAIN RELATIONSHIPS AND RELATED TRANSACTIONS, AND DIRECTOR INDEPENDENCE
The information required by this Item is incorporated herein by reference to the definitive Proxy Statement to be filed pursuant to Regulation 14A of the Exchange Act for our 2018 Annual Meeting of Stockholders.
ITEM 14. PRINCIPAL ACCOUNTING FEES AND SERVICES
The information required by this Item is incorporated herein by reference to the definitive Proxy Statement to be filed pursuant to Regulation 14A of the Exchange Act for our 2018 Annual Meeting of Stockholders.
39
PART IV
ITEM 15. EXHIBITS, FINANCIAL STATEMENT SCHEDULES
(a) Financial Statements
1. | Financial Statements are listed in the Index to Financial Statements on page F-1 of this annual report. |
2. | Financial Statement Schedules. The Financial Statement Schedule described below is filed as part of this report. |
Description
Schedule II - Valuation and Qualifying Accounts.
All other financial statement schedules are not required under the relevant instructions or are inapplicable and therefore have been omitted.
(b) Exhibits
The following exhibits, which are numbered in accordance with Item 601 of Regulation S-K, are filed herewith or, as noted, incorporated by reference herein:
40
41
42
101.INS** | XBRL Instance Document |
101.SCH** | XBRL Taxonomy Extension Schema Document |
101.CAL** | XBRL Taxonomy Extension Calculation Linkbase Document |
101.DEF** | XBRL Taxonomy Extension Definition Linkbase Document |
101.LAB** | XBRL Taxonomy Extension Label Linkbase Document |
101.PRE** | XBRL Taxonomy Extension Presentation Linkbase Document |
101.INS** | XBRL Instance Document |
* | Filed herewith |
** | Pursuant to Rule 406T of Regulation S-T, these interactive data files are deemed not filed or part of a registration statement or prospectus for purposes of Sections 11 or 12 of the Securities Act of 1933 or Section 18 of the Securities Exchange Act of 1934 and otherwise are not subject to liability. |
+ | Denotes a management or compensatory plan or arrangement. |
ITEM 16. FORM 10-K SUMMARY
43
Not applicable.
SIGNATURES
Pursuant to the requirements of Section 13 or 15(d) of the Securities Exchange Act of 1934, the registrant has duly caused this report to be signed on its behalf by the undersigned, thereunto duly authorized.
GTT COMMUNICATIONS, INC. | |||
By: | /s/ Richard D. Calder, Jr. | ||
Richard D. Calder, Jr. | |||
President and Chief Executive Officer | |||
Date: March 1, 2018
POWER OF ATTORNEY
KNOW ALL PERSONS BY THESE PRESENTS, that each person whose signature appears below constitutes and appoints Richard D. Calder, Jr. and Michael T. Sicoli, jointly and severally, his attorney-in-fact, each with the full power of substitution, for such person, in any and all capacities, to sign any and all amendments to this Annual Report on Form 10-K, and to file the same, with all exhibits thereto and other documents in connection therewith, with the Securities and Exchange Commission, granting unto said attorney-in-fact and agent full power and authority to do and perform each and every act and thing requisite and necessary to be done in connection therewith, as fully to all intents and purposes as he might do or could do in person hereby ratifying and confirming all that each of said attorneys-in-fact and agents, or his substitute, may do or cause to be done by virtue hereof.
Pursuant to the requirements of the Securities Exchange Act of 1934, this report has been signed on or before March 1, 2018 by the following persons on behalf of the registrant and in the capacities indicated.
44
Signature | Title | |
/s/ Richard D. Calder, Jr. | President, Chief Executive Officer and | |
Richard D. Calder, Jr. | Director (Principal Executive Officer) | |
/s/ Michael T. Sicoli | Chief Financial Officer | |
Michael T. Sicoli | (Principal Financial Officer) | |
/s/ Daniel M. Fraser | Vice President and Controller | |
Daniel M. Fraser | (Principal Accounting Officer) | |
/s/ H. Brian Thompson | Chairman of the Board and Executive | |
H. Brian Thompson | Chairman | |
/s/ Nicola A. Adamo | Director | |
Nicola A. Adamo | ||
/s/ S. Joseph Bruno | Director | |
S. Joseph Bruno | ||
/s/ Julius Erving | Director | |
Julius Erving | ||
/s/ Rhodric C. Hackman | Director | |
Rhodric C. Hackman | ||
/s/ Howard Janzen | Director | |
Howard Janzen | ||
/s/ Elizabeth Satin | Director | |
Elizabeth Satin | ||
/s/ Theodore B. Smith, III | Director | |
Theodore B. Smith, III | ||
45
INDEX TO FINANCIAL STATEMENTS
GTT Communications, Inc. | |
Report of Independent Registered Public Accounting Firm | F - 2 |
Consolidated Balance Sheets as of December 31, 2017 and 2016 | F - 3 |
Consolidated Statements of Operations for the Years Ended December 31, 2017, 2016, and 2015 | F - 4 |
Consolidated Statements of Comprehensive (Loss) Income for the Years Ended December 31, 2017, 2016, and 2015 | F - 5 |
Consolidated Statements of Stockholders’ Equity for the Years Ended December 31, 2017, 2016, and 2015 | F - 6 |
Consolidated Statements of Cash Flows for the Years Ended December 31, 2017, 2016, and 2015 | F - 7 |
Notes to Consolidated Financial Statements | F - 8 |
F - 1
REPORT OF INDEPENDENT REGISTERED PUBLIC ACCOUNTING FIRM
To the Shareholders and Board of Directors of GTT Communications, Inc.
Opinion on the Financial Statements
We have audited the accompanying consolidated balance sheets of GTT Communications, Inc. and subsidiaries (the “Company”) as of December 31, 2017 and 2016, and the related consolidated statements of operations, comprehensive (loss) income, stockholders’ equity, and cash flows for each of the three years in the period ended December 31, 2017, and the related notes and the schedule listed in the index at 15(a) (collectively referred to as the “financial statements”). In our opinion, the financial statements present fairly, in all material respects, the financial position of the Company as of December 31, 2017 and 2016, and the results of its operations and its cash flows for each of the three years in the period ended December 31, 2017, in conformity with accounting principles generally accepted in the United States of America.
We also have audited, in accordance with the standards of the Public Company Accounting Oversight Board (United States) (the “PCAOB”), the Company’s internal control over financial reporting as of December 31, 2017, based on criteria established in Internal Control-Integrated Framework (2013) issued by the Committee of Sponsoring Organizations of the Treadway Commission and our report dated March 1, 2018, expressed an unqualified opinion on the Company’s internal control over financial reporting.
Basis for Opinion
These financial statements are the responsibility of the Company’s management. Our responsibility is to express an opinion on the Company’s financial statements based on our audits. We are a public accounting firm registered with the PCAOB and are required to be independent with respect to the Company in accordance with the U.S. federal securities laws and the applicable rules and regulations of the Securities and Exchange Commission and the PCAOB.
We conducted our audits in accordance with the standards of the PCAOB. Those standards require that we plan and perform the audit to obtain reasonable assurance about whether the financial statements are free of material misstatement, whether due to error or fraud. Our audits included performing procedures to assess the risks of material misstatement of the financial statements, whether due to error or fraud, and performing procedures that respond to those risks. Such procedures included examining, on a test basis, evidence regarding the amounts and disclosures in the financial statements. Our audits also included evaluating the accounting principles used and significant estimates made by management, as well as evaluating the overall financial statement presentation. We believe that our audits provide a reasonable basis for our opinion.
/s/ CohnReznick LLP
We have served as the Company's auditor since 2005.
Tysons, Virginia
March 1, 2018
F - 2
GTT Communications, Inc.
Consolidated Balance Sheets
(Amounts in millions, except for share and per share data)
December 31, 2017 | December 31, 2016 | ||||||
ASSETS | |||||||
Current assets: | |||||||
Cash and cash equivalents | $ | 101.2 | $ | 29.7 | |||
Accounts receivable, net of allowances of $5.1 and $2.7, respectively | 102.8 | 76.3 | |||||
Deferred costs | 2.1 | 3.4 | |||||
Prepaid expenses | 10.4 | 5.8 | |||||
Other assets | 11.6 | 3.6 | |||||
Total current assets | 228.1 | 118.8 | |||||
Restricted cash and cash equivalents | — | 304.3 | |||||
Property and equipment, net | 499.3 | 43.4 | |||||
Intangible assets, net | 417.1 | 193.9 | |||||
Goodwill | 644.5 | 280.6 | |||||
Other long-term assets | 9.2 | 12.3 | |||||
Total assets | $ | 1,798.2 | $ | 953.3 | |||
LIABILITIES AND STOCKHOLDERS’ EQUITY | |||||||
Current liabilities: | |||||||
Accounts payable | $ | 22.5 | $ | 11.3 | |||
Accrued expenses and other current liabilities | 89.0 | 36.9 | |||||
Acquisition earn-outs and holdbacks | 14.0 | 24.4 | |||||
Current portion of capital lease obligations | 1.5 | 1.0 | |||||
Current portion of long-term debt | 7.0 | 4.3 | |||||
Deferred revenue | 53.7 | 17.9 | |||||
Total current liabilities | 187.7 | 95.8 | |||||
Capital lease obligations, long-term portion | 0.3 | 0.1 | |||||
Long-term debt | 1,236.5 | 725.2 | |||||
Deferred revenue, long-term portion | 108.0 | 3.4 | |||||
Deferred tax liability | 26.3 | — | |||||
Other long-term liabilities | 8.0 | 1.0 | |||||
Total liabilities | 1,566.8 | 825.5 | |||||
Commitments and contingencies | |||||||
Stockholders’ equity: | |||||||
Common stock, par value $.0001 per share, 80,000,000 shares authorized, 44,531,905 and 37,228,144 shares issued and outstanding as of December 31, 2017 and 2016, respectively | — | — | |||||
Additional paid-in capital | 360.2 | 197.3 | |||||
Accumulated deficit | (124.9 | ) | (64.6 | ) | |||
Accumulated other comprehensive loss | (3.9 | ) | (4.9 | ) | |||
Total stockholders’ equity | 231.4 | 127.8 | |||||
Total liabilities and stockholders’ equity | $ | 1,798.2 | $ | 953.3 | |||
The accompanying notes are an integral part of these consolidated financial statements.
F - 3
GTT Communications, Inc.
Consolidated Statements of Operations
(Amounts in millions, except for share and per share data)
Year Ended December 31, | |||||||||||
2017 | 2016 | 2015 | |||||||||
Revenue: | |||||||||||
Telecommunications services | $ | 827.9 | $ | 527.3 | $ | 372.5 | |||||
Operating expenses: | |||||||||||
Cost of telecommunications services | 432.1 | 279.6 | 207.7 | ||||||||
Selling, general and administrative expenses | 215.4 | 143.2 | 101.7 | ||||||||
Severance, restructuring and other exit costs | 22.4 | 0.9 | 12.7 | ||||||||
Depreciation and amortization | 132.6 | 62.8 | 46.7 | ||||||||
Total operating expenses | 802.5 | 486.5 | 368.8 | ||||||||
Operating income | 25.4 | 40.8 | 3.7 | ||||||||
Other expense: | |||||||||||
Interest expense, net | (71.2 | ) | (29.4 | ) | (13.9 | ) | |||||
Loss on debt extinguishment | (8.6 | ) | (1.6 | ) | (3.4 | ) | |||||
Other income (expense), net | 0.2 | (0.6 | ) | (1.2 | ) | ||||||
Total other expense | (79.6 | ) | (31.6 | ) | (18.5 | ) | |||||
(Loss) income before income taxes | (54.2 | ) | 9.2 | (14.8 | ) | ||||||
Provision for (benefit from) income taxes | 17.3 | 3.9 | (34.1 | ) | |||||||
Net (loss) income | $ | (71.5 | ) | $ | 5.3 | $ | 19.3 | ||||
(Loss) earnings per share: | |||||||||||
Basic | $ | (1.71 | ) | $ | 0.14 | $ | 0.55 | ||||
Diluted | $ | (1.71 | ) | $ | 0.14 | $ | 0.54 | ||||
Weighted average shares: | |||||||||||
Basic | 41,912,952 | 37,055,663 | 34,973,284 | ||||||||
Diluted | 41,912,952 | 37,568,915 | 35,801,395 | ||||||||
The accompanying notes are an integral part of these consolidated financial statements.
F - 4
GTT Communications, Inc.
Consolidated Statements of Comprehensive (Loss) Income
(Amounts in millions)
Year Ended December 31, | |||||||||||
2017 | 2016 | 2015 | |||||||||
Net (loss) income | $ | (71.5 | ) | $ | 5.3 | $ | 19.3 | ||||
Other comprehensive income (loss): | |||||||||||
Foreign currency translation adjustment | 1.0 | (2.5 | ) | (1.5 | ) | ||||||
Comprehensive (loss) income | $ | (70.5 | ) | $ | 2.8 | $ | 17.8 | ||||
The accompanying notes are an integral part of these consolidated financial statements.
F - 5
GTT Communications, Inc.
Consolidated Statements of Stockholders’ Equity
(Amounts in millions, except for share data)
Common Stock | Additional Paid-In Capital | Accumulated Deficit | Accumulated Other Comprehensive Loss | Total | ||||||||||||||||||
Shares | Amount | |||||||||||||||||||||
Balance, December 31, 2014 | 33,848,543 | $ | — | $ | 167.7 | $ | (89.2 | ) | $ | (0.9 | ) | $ | 77.6 | |||||||||
Share-based compensation for options issued | — | — | 1.6 | — | — | 1.6 | ||||||||||||||||
Share-based compensation for restricted stock issued | 1,536,043 | — | 6.3 | — | — | 6.3 | ||||||||||||||||
Tax withholding related to the vesting of restricted stock units | (195,917 | ) | — | (3.5 | ) | — | — | (3.5 | ) | |||||||||||||
Shares issued in connection with acquisitions | 1,085,844 | — | 9.8 | — | — | 9.8 | ||||||||||||||||
Stock options exercised | 259,121 | — | 0.9 | — | — | 0.9 | ||||||||||||||||
Net income | — | — | — | 19.3 | — | 19.3 | ||||||||||||||||
Foreign currency translation | — | — | — | — | (1.5 | ) | (1.5 | ) | ||||||||||||||
Balance, December 31, 2015 | 36,533,634 | $ | — | $ | 182.8 | $ | (69.9 | ) | $ | (2.4 | ) | $ | 110.5 | |||||||||
Share-based compensation for options issued | — | — | 1.8 | — | — | 1.8 | ||||||||||||||||
Share-based compensation for restricted stock issued | 408,108 | — | 14.0 | — | — | 14.0 | ||||||||||||||||
Tax withholding related to the vesting of restricted stock units | (276,365 | ) | — | (5.7 | ) | — | — | (5.7 | ) | |||||||||||||
Shares issued in connection with employee stock purchase plan | 77,279 | — | 1.2 | — | — | 1.2 | ||||||||||||||||
Shares issued in connection with acquisition | 178,202 | — | 2.0 | — | — | 2.0 | ||||||||||||||||
Stock options exercised | 307,286 | — | 1.2 | — | — | 1.2 | ||||||||||||||||
Net income | — | — | — | 5.3 | — | 5.3 | ||||||||||||||||
Foreign currency translation | — | — | — | — | (2.5 | ) | (2.5 | ) | ||||||||||||||
Balance, December 31, 2016 | 37,228,144 | $ | — | $ | 197.3 | $ | (64.6 | ) | $ | (4.9 | ) | $ | 127.8 | |||||||||
Share-based compensation for options issued | — | — | 1.4 | — | — | 1.4 | ||||||||||||||||
Share-based compensation for restricted stock issued | 1,864,265 | — | 20.6 | — | — | 20.6 | ||||||||||||||||
Tax withholding related to the vesting of restricted stock units | (257,613 | ) | — | (4.0 | ) | — | — | (4.0 | ) | |||||||||||||
Stock issued in connection with employee stock purchase plan | 28,958 | — | 0.9 | — | — | 0.9 | ||||||||||||||||
Stock issued in connection with acquisition | 5,229,813 | — | 141.9 | — | — | 141.9 | ||||||||||||||||
Stock options exercised | 438,338 | — | 2.1 | — | — | 2.1 | ||||||||||||||||
Cumulative effect of adjustment for unrecognized windfall benefits | — | — | — | 11.2 | — | 11.2 | ||||||||||||||||
Net loss | — | — | — | (71.5 | ) | — | (71.5 | ) | ||||||||||||||
Foreign currency translation | — | — | — | — | 1.0 | 1.0 | ||||||||||||||||
Balance, December 31, 2017 | 44,531,905 | $ | — | $ | 360.2 | $ | (124.9 | ) | $ | (3.9 | ) | $ | 231.4 | |||||||||
The accompanying notes are an integral part of these consolidated financial statements.
F - 6
GTT Communications, Inc.
Consolidated Statements of Cash Flows
(Amounts in millions)
Year Ended December 31, | |||||||||||
2017 | 2016 | 2015 | |||||||||
Cash flows from operating activities: | |||||||||||
Net (loss) income | $ | (71.5 | ) | $ | 5.3 | $ | 19.3 | ||||
Adjustments to reconcile net (loss) income to net cash provided by operating activities: | |||||||||||
Depreciation and amortization | 132.6 | 62.8 | 46.7 | ||||||||
Share-based compensation | 22.2 | 15.8 | 7.9 | ||||||||
Debt discount amortization | 0.4 | 0.9 | 0.2 | ||||||||
Loss on debt extinguishment | 8.6 | 1.6 | 3.4 | ||||||||
Amortization of debt issuance costs | 3.8 | 1.5 | 1.0 | ||||||||
Excess tax benefit from share-based compensation | (6.2 | ) | — | — | |||||||
Deferred income taxes | 16.5 | 2.2 | (30.5 | ) | |||||||
Non-cash deferred revenue | (33.4 | ) | (6.9 | ) | (5.6 | ) | |||||
Non-cash deferred costs | 4.6 | 2.8 | 2.5 | ||||||||
Change in fair value of acquisition earn-out | — | — | 0.9 | ||||||||
Changes in operating assets and liabilities, net of acquisitions: | |||||||||||
Accounts receivable, net | 14.2 | (14.9 | ) | (7.9 | ) | ||||||
Prepaid expenses | 4.7 | 4.7 | (8.1 | ) | |||||||
Deferred costs and other assets | (2.1 | ) | (6.2 | ) | (11.5 | ) | |||||
Accounts payable | (22.7 | ) | (12.3 | ) | (8.7 | ) | |||||
Accrued expenses and other current liabilities | 7.7 | (7.1 | ) | 1.8 | |||||||
Deferred revenue and other liabilities | (16.0 | ) | 10.2 | 13.2 | |||||||
Net cash provided by operating activities | 63.4 | 60.4 | 24.6 | ||||||||
Cash flows from investing activities: | |||||||||||
Acquisition of businesses, net of cash acquired | (706.3 | ) | (14.1 | ) | (300.7 | ) | |||||
Purchase of customer contracts | (14.9 | ) | (20.0 | ) | — | ||||||
Change in restricted cash and cash equivalents | 304.3 | (304.3 | ) | — | |||||||
Purchases of property and equipment | (42.0 | ) | (24.2 | ) | (14.1 | ) | |||||
Purchases of intangible assets | (1.5 | ) | — | — | |||||||
Net cash used in investing activities | (460.4 | ) | (362.6 | ) | (314.8 | ) | |||||
Cash flows from financing activities: | |||||||||||
Proceeds from revolving line of credit | 50.0 | 47.0 | 5.0 | ||||||||
Repayment of revolving line of credit | (70.0 | ) | (32.0 | ) | — | ||||||
Proceeds from term loan | 696.5 | 29.9 | 622.0 | ||||||||
Repayment of term loan | (432.8 | ) | (4.2 | ) | (353.6 | ) | |||||
Proceeds from senior note | 291.5 | 300.0 | — | ||||||||
Payment of earn-out and holdbacks | (28.7 | ) | (15.6 | ) | (3.7 | ) | |||||
Debt issuance costs | (34.0 | ) | (1.4 | ) | (12.6 | ) | |||||
Repayment of capital leases | (1.6 | ) | (1.8 | ) | (0.9 | ) | |||||
Proceeds from issuance of common stock under employee stock purchase plan | 0.7 | 1.2 | — | ||||||||
Tax withholding related to the vesting of restricted stock units | (4.0 | ) | (5.7 | ) | (3.5 | ) | |||||
Exercise of stock options | 2.1 | 1.2 | 0.9 | ||||||||
Net cash provided by financing activities | 469.7 | 318.6 | 253.6 | ||||||||
Effect of exchange rate changes on cash | (1.2 | ) | (1.4 | ) | 2.0 | ||||||
Net increase (decrease) in cash and cash equivalents | 71.5 | 15.0 | (34.6 | ) | |||||||
Cash and cash equivalents at beginning of year | 29.7 | 14.7 | 49.3 | ||||||||
Cash and cash equivalents at end of year | $ | 101.2 | $ | 29.7 | $ | 14.7 | |||||
Supplemental disclosure of cash flow information: | |||||||||||
Cash paid for interest | $ | 47.2 | $ | 26.3 | $ | 13.1 | |||||
Cash paid for income taxes, net of refunds | $ | 1.7 | $ | 1.0 | $ | 0.4 | |||||
Supplemental disclosure of non-cash investing and financing activities: | |||||||||||
Fair value of current assets acquired | $ | 76.8 | $ | 0.9 | $ | 26.1 | |||||
Fair value of non-current assets acquired* | $ | 772.0 | $ | 53.4 | $ | 171.8 | |||||
Fair value of current liabilities assumed | $ | 87.7 | $ | 0.6 | $ | 26.1 | |||||
Fair value of non-current liabilities assumed | $ | 215.5 | $ | — | $ | 1.9 | |||||
Shares issued in connection with acquisition | $ | 141.9 | $ | 2.0 | $ | 9.8 | |||||
* Excludes goodwill
The accompanying notes are an integral part of these consolidated financial statements.
F - 7
GTT Communications, Inc.
Notes to Consolidated Financial Statements
NOTE 1 — ORGANIZATION AND BUSINESS
Organization and Business
GTT Communications, Inc. ("GTT" or the "Company") provides cloud networking services to multinational clients. The Company offers a comprehensive portfolio of services including: private networking; internet; optical transport; SD-WAN; managed services; voice and unified communications; video transport; and access services.
GTT's global network connects people across organizations and around the world. The Company provides cloud networking services to leading multinational enterprise, carrier, and government clients in over 100 countries. GTT differentiates itself from its competition by delivering service to its clients with simplicity, speed and agility.
NOTE 2 — SIGNIFICANT ACCOUNTING POLICIES
Basis of Presentation of Consolidated Financial Statements and Use of Estimates
The consolidated financial statements include the accounts of the Company and its wholly owned subsidiaries. All significant intercompany transactions and balances have been eliminated in consolidation.
The preparation of consolidated financial statements in conformity with accounting principles generally accepted in the United States of America ("GAAP") requires management to make estimates and assumptions that affect certain reported amounts of assets and liabilities and disclosure of contingent assets and liabilities at the date of the financial statements and the reported amounts of revenue and expenses during the reporting period. Significant estimates are used when establishing allowances for doubtful accounts, accruals for billing disputes and exit activities, determining useful lives for depreciation and amortization, assessing the need for impairment charges (including those related to intangible assets and goodwill), determining the fair values of assets acquired and liabilities assumed in business combinations, accounting for income taxes and related valuation allowances against deferred tax assets, and estimating the grant date fair values used to compute the share-based compensation expense. Management evaluates these estimates and judgments on an ongoing basis and makes estimates based on historical experience, current conditions, and various other assumptions that are believed to be reasonable under the circumstances. The results of these estimates form the basis for making judgments about the carrying values of assets and liabilities as well as identifying and assessing the accounting treatment with respect to commitments and contingencies. Actual results may differ from these estimates under different assumptions or conditions.
Changes in Basis of Presentation and Accounting
Revenue recognition standards include guidance relating to taxes or surcharges assessed by a governmental authority that are directly imposed on a revenue-producing transaction between a seller and a customer and may include, but are not limited to, certain excise taxes and surcharges. Such charges may be presented gross (included in revenue and expense) or net (excluded from revenue and expense) based upon the Company’s accounting policy election. In 2017, the Company changed its presentation of excise taxes and surcharges from the net method to the gross method. The presentation was changed to the gross method for internal and external consistency. Historical periods have been reclassified for consistency with the current year presentation.
As a result of policy alignments related to acquired businesses, certain prior period amounts in the consolidated statements of cash flows, have been reclassified to conform with the current period presentation to better reflect the nature of these activities. The Company has reclassified $6.9 million and $5.6 million from the "Deferred revenue and other liabilities" line to the "Non-cash deferred revenue" line and $2.8 million and $2.5 million from the "Deferred costs and other assets" line to the "Non-cash deferred costs" line for the years ended December 31, 2016 and 2015, respectively. These reclassifications had no impact on the net change in cash and cash equivalents or cash flows from operating, investing and financing activities for any periods presented.
Segment Reporting
The Company reports operating results and financial data in one operating and reportable segment. The Company's Chief Executive Officer is the chief operating decision maker and manages the Company as a single profit center in order to promote collaboration, provide comprehensive service offerings across its entire customer base, and provide incentives to employees based on the success of the organization as a whole. Although certain information regarding selected products or services is discussed for
F - 8
purposes of promoting an understanding of the Company's complex business, the chief operating decision maker manages the Company and allocates resources at the consolidated level.
Revenue Recognition
The Company delivers eight primary services to its customers — private networking; internet; optical transport; SD-WAN; managed services; voice and unified communications; video transport services; and access services. Certain of its current commercial activities have features that may be considered multiple elements, specifically when the Company sells its connectivity services in addition to customer premise equipment ("CPE"). The Company believes that there is sufficient evidence to determine each element’s fair value and, as a result, in those arrangements where there are multiple elements, the service revenue is recorded ratably over the term of the agreement and the equipment is accounted for as a sale, at the time of sale as long as collectability is reasonably assured.
The Company's services are provided under contracts that typically include an installation charge along with payments of recurring charges on a monthly basis for use of the services over a committed term. Its contracts with customers specify the terms and conditions for providing such services, including installation date, recurring and non-recurring fees, payment terms, and length of term. These contracts call for the Company to provide the service in question (e.g., data transmission between point A and point Z), to manage the activation process, and to provide ongoing support (in the form of service maintenance and trouble-shooting) during the service term. The contracts do not typically provide the customer any rights to use specifically identifiable assets. Furthermore, the contracts generally provide the Company with discretion to engineer (or re-engineer) a particular network solution to satisfy each customer’s data transmission requirement, and typically prohibit physical access by the customer to the network infrastructure used by the Company and its suppliers to deliver the services.
The Company recognizes revenue as follows:
Recurring Revenue. Recurring revenue represents the substantial majority of the Company's revenue, and consists of fees charged for ongoing services that are generally fixed in price and billed on a recurring monthly basis (one month in advance) for a specified term. At the end of the term, most contracts provide for a continuation of services on the same terms, either for a specified renewal period (e.g., one year) or on a month-to-month basis. The Company records recurring revenue based on the fees agreed to in each contract, as long as the contract is in effect, for the period the service is provided.
Usage Revenue. Usage revenue represents variable charges for certain services, based on specific usage of those services, or usage above a fixed threshold, billed monthly in arrears. The Company records usage revenue based on actual usage charges billed using the rates and/or thresholds specified in each contract.
Non-recurring Revenue. Non-recurring revenue consists of charges for installation in connection with the delivery of recurring communications services, late payments, cancellation fees, early termination fees, and equipment sales. Fees billed for installation services are initially recorded as deferred revenue and then recognized ratably over the contractual term of the recurring service. Fees charged for late payments, cancellation (pre-installation) or early termination (post-installation) are typically fixed or determinable per the terms of the respective contract, and are recognized as revenue when billed. In addition, from time to time the Company sells communications and/or networking equipment to its customers in connection with its data networking services. The Company recognizes revenue from the sale of equipment at the contracted selling price when title to the equipment passes to the customer (generally F.O.B. origin).
Prepaid Capacity Sales and Indefeasible Right to Use. From time to time the Company sells capacity on a long-term basis, where a certain portion of the contracted revenue is prepaid upon acceptance of the service by the customer. This prepaid amount is initially recorded as deferred revenue and amortized ratably over the term of the contract. Certain of these prepaid capacity sales are in the form of Indefeasible Rights to Use ("IRUs"), where the customer has the right to use the capacity for the life of the fiber optic cable. The Company records revenues from these prepaid leases of fiber optic cable IRUs over the term that the customer is given exclusive access to the assets, generally 20 years, consistent with our assumed useful life of the associated fiber optic cable.
Universal Service Fund (USF), Gross Receipts Taxes and Other Surcharges. The Company is liable in certain cases for collecting regulatory fees and/or certain sales taxes from its customers and remitting the fees and taxes to the applicable governing authorities. The Company records certain excise taxes and surcharges on a gross basis and includes them in its telecommunications services revenue and costs of telecommunications services. Excise taxes and surcharges billed to customers and recorded on a gross basis (as service telecommunications services revenue and cost of telecommunications services) were $17.5 million, $5.6 million, and $3.2 million for the years ended December 31, 2017, 2016 and 2015, respectively.
The Company records revenue only when collectability is reasonably assured, irrespective of the type of revenue.
F - 9
Cost of Telecommunications Services
Cost of telecommunications services includes direct costs incurred in accessing other telecommunications providers’ networks in order to maintain the Company's global Tier 1 IP network and provide telecommunications services to the Company's customers including access, co-location, usage-based charges, and certain excise taxes and surcharges recorded on a gross basis.
Marketing and Advertising Costs
Costs related to marketing and advertising are expensed as incurred and included in selling, general and administrative expenses in our consolidated statements of operations. Our marketing and advertising expense was $3.3 million, $2.2 million, and $1.3 million for the years ended December 31, 2017, 2016, and 2015, respectively.
Share-Based Compensation
The Company issues three types of equity grants under its share-based compensation plan: time-based restricted stock, time-based stock options, and performance-based restricted stock. The time-based restricted stock and stock options generally vest over a four-year period, contingent upon meeting the requisite service period requirement. Performance awards typically vest over a shorter period, e.g. one to two years, starting when the performance criteria established in the grant have been met and maintained.
The share price of our common stock as reported on the NYSE on the date of grant is used as the fair value for all restricted stock. The Company uses the Black-Scholes option-pricing model to determine the estimated fair value for stock options. Critical inputs into the Black-Scholes option-pricing model include the following: option exercise price, fair value of the stock price, expected life of the option, annualized volatility of the stock, annual rate of quarterly dividends on the stock, and risk-free interest rate.
Implied volatility is calculated as of each grant date based on our historical stock price volatility along with an assessment of a peer group. Other than the expected life of the option, volatility is the most sensitive input to our option grants. The risk-free interest rate used in the Black-Scholes option-pricing model is determined by referencing the U.S. Treasury yield curve rates with the remaining term equal to the expected life assumed at the date of grant. Forfeitures are estimated based on our historical analysis of attrition levels. Forfeiture estimates are updated quarterly for actual forfeitures.
The expense is recognized on a straight-line basis over the vesting period. The Company recognizes share-based compensation expense for performance awards when the achievement of the performance criteria is considered probable.
Income Taxes
Income taxes are accounted for under the asset and liability method pursuant to GAAP. Under this method, deferred tax assets and liabilities are recognized for the expected future consequences attributable to the differences between the financial statement carrying amounts and the tax basis of assets and liabilities. The effect of a change in tax rates on deferred tax assets and liabilities is recognized in the period of the change. Further, deferred tax assets are recognized for the expected realization of available net operating loss and tax credit carryforwards. A valuation allowance is recorded on gross deferred tax assets when it is "more likely than not" that such asset will not be realized. When evaluating the realizability of deferred tax assets, all evidence, both positive and negative, is evaluated. Items considered in this analysis include the ability to carry back losses, the reversal of temporary differences, tax planning strategies and expectations of future earnings. The Company reviews its deferred tax assets on a quarterly basis to determine if a valuation allowance is required based upon these factors. Changes in the Company's assessment of the need for a valuation allowance could give rise to a change in such allowance, potentially resulting in additional expense or benefit in the period of change.
The Company's income tax provision includes U.S. federal, state, local, and foreign income taxes and is based on pre-tax income or loss. In determining the annual effective income tax rate, the Company analyzed various factors, including its annual earnings and taxing jurisdictions in which the earnings were generated, the impact of state and local income taxes and its ability to use tax credits and net operating loss carryforwards.
Under GAAP, the amount of tax benefit to be recognized is the amount of benefit that is "more likely than not" to be sustained upon examination. The Company analyzes its tax filing positions in all of the U.S. federal, state, local, and foreign tax jurisdictions where it is required to file income tax returns, as well as for all open tax years in these jurisdictions. If, based on this analysis, the Company determines that uncertainties in tax positions exist, a liability is established in the consolidated financial statements. The Company recognizes accrued interest and penalties related to unrecognized tax positions in the provision for income taxes.
F - 10
Comprehensive (Loss) Income
In addition to net (loss) income, comprehensive (loss) income includes charges or credits to equity occurring other than as a result of transactions with stockholders. For the Company, this consists of foreign currency translation adjustments.
(Loss) Earnings Per Share
Basic (loss) earnings per share is computed by dividing net (loss) income available to common stockholders by the weighted average number of common shares outstanding. Diluted (loss) earnings per share reflect, in periods with earnings and in which they have a dilutive effect, the effect of common shares issuable upon exercise of stock options and warrants.
The table below details the calculations of earnings (loss) per share (in millions, except for share and per share amounts):
Year Ended December 31, | |||||||||||
2017 | 2016 | 2015 | |||||||||
Numerator for basic and diluted EPS – (loss) income available to common stockholders | $ | (71.5 | ) | $ | 5.3 | $ | 19.3 | ||||
Denominator for basic EPS – weighted average shares | 41,912,952 | 37,055,663 | 34,973,284 | ||||||||
Effect of dilutive securities | — | 513,252 | 828,111 | ||||||||
Denominator for diluted EPS – weighted average shares | 41,912,952 | 37,568,915 | 35,801,395 | ||||||||
Earnings (loss) per share: basic | $ | (1.71 | ) | $ | 0.14 | $ | 0.55 | ||||
Earnings (loss) per share: diluted | $ | (1.71 | ) | $ | 0.14 | $ | 0.54 | ||||
All of the stock options were anti-dilutive as of December 31, 2017 due to the net loss incurred during the period. There were approximately 0 and 256,000 anti-dilutive common shares that were excluded from the computation of earnings per share as of December 31, 2016 and 2015, respectively.
Cash and Cash Equivalents
Cash and cash equivalents may include deposits with financial institutions as well as short-term money market instruments, certificates of deposit and debt instruments with maturities of three months or less when purchased.
The Company invests its cash and cash equivalents and short-term investments in accordance with the terms and conditions of its Credit Agreement, which seeks to ensure both liquidity and safety of principal. The Company’s policy limits investments to instruments issued by the U.S. government and commercial institutions with strong investment grade credit ratings, and places restrictions on the length of maturity. As of December 31, 2017, the Company held no direct investments in auction rate securities, collateralized debt obligations, structured investment vehicles or non-government guaranteed mortgage-backed securities.
Restricted Cash and Cash Equivalents
Cash and cash equivalents that are contractually restricted from operating use are classified as restricted cash and cash equivalents. In December 2016, the Company completed a private offering of $300.0 million aggregate principal amount of 7.875% senior unsecured notes due in 2024. The proceeds of the private offering plus 60 days of prepaid interest were deposited into escrow, where the funds remained until all the escrow release conditions were satisfied, specifically the closing of the acquisition of Hibernia Networks ("Hibernia") that occurred in January 2017. The proceeds were released from escrow at closing to fund the Hibernia acquisition.
Accounts Receivable, Net
Accounts receivable balances are stated at amounts due from the customer net of an allowance for doubtful accounts. Credit extended is based on an evaluation of the customer’s financial condition and is granted to qualified customers on an unsecured basis.
The Company, pursuant to its standard service contracts, is entitled to impose a finance charge of a certain percentage per month with respect to all amounts that are past due. The Company’s standard terms require payment within 30 days of the date of
F - 11
the invoice. The Company treats invoices as past due when they remain unpaid, in whole or in part, beyond the payment date set forth in the applicable service contract.
The Company determines its allowance for doubtful accounts by considering a number of factors, including the length of time trade receivables are past due, the customer’s payment history and current ability to pay its obligation to the Company, and the condition of the general economy. Specific reserves are also established on a case-by-case basis by management. Credit losses have historically been within management’s expectations. Actual bad debts, when determined, reduce the allowance, the adequacy of which management then reassesses. The Company writes off accounts after a determination by management that the amounts at issue are no longer likely to be collected, following the exercise of reasonable collection efforts, and upon management’s determination that the costs of pursuing collection outweigh the likelihood of recovery. The allowance for doubtful accounts was $5.1 million and $2.7 million as of December 31, 2017 and 2016, respectively.
Deferred Costs
Installation costs related to provisioning of communications services that the Company incurs from third-party suppliers, directly attributable and necessary to fulfill particular service contract, and which costs would not have been incurred but for the occurrence of that service contract, are recorded as deferred contract costs and expensed ratably over the contractual term of service in the same manner as the deferred revenue arising from that contract. Based on historical experience, the Company believes the initial contractual term is the best estimate for the period of earnings. If any installation costs exceed the amount of corresponding deferred revenue, the excess cost is recognized in the current period.
Property and Equipment
Property and equipment are stated at cost, net of accumulated depreciation. Depreciation on these assets is computed on a straight-line basis over the estimated useful lives of the assets. Assets are recorded at acquired cost plus any internal labor to prepare the asset for installation to become functional. Assets and liabilities under capital leases are recorded at the lesser of the present value of the aggregate future minimum lease payments or the fair value of the assets under lease. Leasehold improvements and assets under capital leases are amortized over the shorter of the term of the lease, excluding optional extensions, or the useful life. Expenditures for maintenance and repairs are expensed as incurred. Depreciable lives used by the Company for its classes of assets are as follows:
Buildings | 30 years |
Furniture and Fixtures | 7 years |
Fiber Optic Cable | 20 years |
Fiber Optic Network Equipment | 3 - 15 years |
Leasehold Improvements | up to 10 years |
Computer Hardware and Software | 3-5 years |
The Company reviews long-lived assets for impairment whenever events or changes in circumstances indicate that the carrying amount of the assets may not be recoverable. If the carrying amount of an asset were to exceed its estimated future undiscounted cash flows, the asset would be considered to be impaired. Impairment losses would then be measured as the amount by which the carrying amount of the asset exceeds the fair value of the asset. Assets to be disposed of, if any, are reported at the lower of the carrying amount or fair value less costs to sell.
Software Capitalization
Software development costs include costs to develop software to be used solely to meet the Company's internal needs. The Company capitalizes development costs related to these software applications once the preliminary project stage is complete and it is probable that the project will be completed. Subsequent additions, modifications, or upgrades to internal-use software are capitalized only to the extent that they allow the software to perform a function it previously did not perform. Software maintenance, data conversion, and training costs are expensed in the period in which they are incurred. The Company capitalized software costs of $2.1 million, $1.5 million, and $1.1 million for the years ended December 31, 2017, 2016, and 2015, respectively.
Goodwill and Intangible Assets
Goodwill represents the excess of the purchase price over the fair value of the net identifiable assets acquired in a business combination. Goodwill is reviewed for impairment at least annually, in October, or more frequently if a triggering event occurs
F - 12
between impairment testing dates. The Company operates as a single operating segment and as a single reporting unit for the purpose of evaluating goodwill impairment. The Company's impairment assessment begins with a qualitative assessment to determine whether it is more like than not that fair value of the reporting unit is less than its carrying value. The qualitative assessment includes comparing the overall financial performance of the Company against the planned results used in the last quantitative goodwill impairment test. Additionally, the Company's fair value is assessed in light of certain events and circumstances, including macroeconomic conditions, industry and market considerations, cost factors, and other relevant entity and Company specific events. The selection and assessment of qualitative factors used to determine whether it is more likely than not that the fair value of a reporting unit exceeds the carrying value involves significant judgment and estimates. If it is determined under the qualitative assessment that it is more likely than not that the fair value of a reporting unit is less than its carrying value, then a two-step quantitative impairment test is performed. Under the first step, the estimated fair value of the Company would be compared with its carrying value (including goodwill). If the fair value of the Company exceeds its carrying value, step two does not need to be performed. If the estimated fair value of the Company is less than its carrying value, an indication of goodwill impairment exists for the Company and it would need to perform step two of the impairment test. Under step two, an impairment loss would be recognized for any excess of the carrying amount of the Company's goodwill over the implied fair value of that goodwill. Fair value of the Company under the two-step assessment is determined using a combination of both income and market-based approaches. There were no goodwill impairments identified for the years ended December 31, 2017, 2016, and 2015.
Intangible assets arising from business combinations, such as acquired customer contracts and relationships, (collectively "customer relationships"), trade names, intellectual property or know-how are initially recorded at fair value. The Company amortizes these intangible assets over the determined useful life, which ranges from three to eight years. The Company reviews its intangible assets for impairment whenever events or circumstances indicate that the carrying amount of an asset may not be fully recoverable. If the total of the expected undiscounted future cash flows is less than the carrying amount of the asset, an impairment loss is recognized for the difference between fair value and the carrying value of the asset. There were no intangible asset impairments recognized for the years ended December 31, 2017, 2016, and 2015.
Business Combinations
The Company includes the results of operations of the businesses that it acquires as of the respective dates of acquisition. The Company allocates the fair value of the purchase price of its acquisitions to the assets acquired and liabilities assumed based on their estimated fair values. The excess of the fair value of the purchase price over the fair values of these identifiable assets and liabilities is recorded as goodwill.
Asset Purchases
Periodically we acquire customer contracts that we account for as an asset purchase and record a corresponding intangible asset that is amortized over its assumed useful life. Any excess of the fair value of the purchase price over the fair value of the identifiable assets and liabilities is allocated on a relative fair value basis. No goodwill is recorded in an asset acquisition.
During 2017, the Company acquired customer contracts for an aggregate purchase price of $37.4 million, of which $14.9 million was paid in 2017 on the respective closing dates. Of the remaining $22.5 million, $4.5 million was subsequently paid during the year ended December 31, 2017. The remaining $18.0 million is expected to be paid in 2018, subject to any indemnification claims made through the final payment date.
During 2016, the Company acquired customer contracts for an aggregate purchase price of $41.3 million, of which $20.0 million was paid in 2016 on the respective closing dates. The remaining $21.3 million was paid during the year ended December 31, 2017.
We did not have any asset purchases in 2015.
Accrued Supplier Expenses
The Company accrues estimated charges owed to its suppliers for services. The Company bases this accrual on the supplier contract, the individual service order executed with the supplier for that service, and the length of time the service has been active.
Disputed Supplier Expenses
In the normal course of business, the Company identifies errors by suppliers with respect to the billing of services. The Company performs bill verification procedures to ensure that errors in the Company's suppliers' billed invoices are identified and resolved. If the Company concludes that a vendor has billed inaccurately, the Company will record a liability only for the amount that it
F - 13
believes is owed. As of December 31, 2017 and 2016, the Company had open disputes not accrued for of $5.3 million and $5.8 million, respectively.
Acquisition Earn-outs and Holdbacks
Acquisition earn-outs and holdbacks represent either contingent consideration subject to fair value measurements, or fixed deferred consideration to be paid out at some point in the future, typically on the one-year anniversary of an acquisition. Contingent consideration is remeasured to fair value at each reporting period. The portion of the deferred consideration due within one year is recorded as a current liability until paid, and any consideration due beyond one year is recorded in other long-term liabilities.
As of December 31, 2017 and 2016, there was no contingent consideration subject to re-measurement outstanding.
Debt Issuance Costs
Debt issuance costs represent costs that qualify for deferral associated with the issuance of new debt or the modification of existing debt facilities. The unamortized balance of debt issuance costs is presented as a reduction to the carrying value of long-term debt. Debt issuance costs are amortized and recognized on the consolidated statements of operations as interest expense. The unamortized debt issuance costs were $33.8 million and $9.3 million as of December 31, 2017 and 2016, respectively.
Original Issuance Discounts and Premiums
Original issuance discounts and premiums ("OID") is the difference between the face value of debt and the amount of principal received when the loan was originated. When the debt reaches maturity, the face value of the debt is payable. The Company recognizes OID by accretion of the discount or premium as interest expense, net over the term of the debt. The unamortized portion of the OID was a $9.3 million net premium and a $7.0 million discount as of December 31, 2017 and 2016, respectively.
Translation of Foreign Currencies
For non-U.S. subsidiaries, the local currency is the functional currency for financial reporting purposes. These consolidated financial statements have been reported in U.S. Dollars by translating asset and liability amounts of foreign subsidiaries at the closing currency exchange rate, equity amounts at historical rates, and the results of operations and cash flow at the average currency exchange rate prevailing during the periods reported. The net effect of such translation gains and losses are reflected in accumulated other comprehensive loss in the stockholders' equity section of the consolidated balance sheets.
Transactions denominated in foreign currencies other than a subsidiary's functional currency are recorded at the rates of exchange prevailing at the time of the transaction. Monetary assets and liabilities denominated in foreign currencies are translated at the rate of exchange prevailing at the balance sheet date. Exchange differences arising upon settlement of a transaction are reported in the consolidated statements of operations in other expense, net.
Fair Value Measurements
Fair value is defined as the price that would be received to sell an asset or transfer a liability in an orderly transaction between market participants at the measurement date. The Company classifies certain assets and liabilities based on the following hierarchy of fair value:
Level 1: | Quoted prices for identical assets or liabilities in active markets that can be assessed at the measurement date. |
Level 2: | Inputs other than quoted prices included in Level 1, such as quoted prices for similar assets and liabilities in active markets; quoted prices for identical or similar assets and liabilities in markets that are not active; or other inputs that are observable or can be corroborated by observable market data. |
Level 3: | Inputs reflect management's best estimate of what market participants would use in pricing the asset or liability at the measurement date. The inputs are unobservable in the market and significant to the instrument's valuation. |
When determining the fair value measurements for assets and liabilities required to be recorded at fair value, management considers the principal or most advantageous market in which it would transact and considers risks, restrictions, or other assumptions that market participants would use when pricing the asset or liability.
F - 14
Concentrations of Credit Risk
Financial instruments potentially subject to concentration of credit risk consist primarily of cash and cash equivalents, restricted cash and cash equivalents, and trade accounts receivable. At times during the periods presented, the Company had funds in excess of $250,000 insured by the U.S. Federal Deposit Insurance Corporation, or in excess of similar Deposit Insurance programs outside of the United States, on deposit at various financial institutions. Management believes the Company is not exposed to significant credit risk due to the financial position of the depository institutions in which those deposits are held.
The Company's trade accounts receivable are unsecured and geographically dispersed. No single customer's trade accounts receivable balance as of December 31, 2017 and 2016, exceeded 10% of the Company's consolidated accounts receivable, net. No single customer accounted for more than 10% of revenue for the years ended December 31, 2017, 2016, and 2015.
Newly Adopted Accounting Principles
In March 2016, the Financial Accounting Standards Board ("FASB") issued Accounting Standards Update ("ASU") No. 2016-09, Improvements to Employee Share-Based Payment Accounting, which is intended to improve the accounting for share-based payment transactions. The ASU changes five aspects of the accounting for share-based payment award transactions: (1) accounting for income taxes; (2) classification of excess tax benefits on the statement of cash flows; (3) forfeitures; (4) minimum statutory tax withholding requirements; and (5) classification of employee taxes paid on the statement of cash flows when an employer withholds shares for taxes. The Company adopted ASU 2016-09 effective January 1, 2017. Excess tax benefits for share-based payments are now recognized against income tax expense rather than additional paid-in capital and are included in operating cash flows rather than financing cash flows. The recognition of excess tax benefits has been applied on a modified retrospective basis through a cumulative-effect adjustment to the opening balance of retained earnings. As of January 1, 2017, the cumulative effect of adopting ASU 2016-09 was an increase in deferred tax assets of $11.2 million and a decrease in accumulated deficit of $11.2 million as a result of recognizing $27.8 million previously unrecognized excess tax benefits from share-based compensation. The Company will continue to account for forfeitures as they occur. Cash paid by the Company when directly withholding shares for tax withholding purposes will continue to be classified as a financing activity rather than an operating activity. Additionally, the Company has applied the provisions of ASU 2016-09 on a prospective basis in the consolidated statements of cash flows and prior periods have not been adjusted.
In January 2017, the FASB issued ASU 2017-01, Business Combinations (Topic 805): Clarifying the Definition of a Business, which clarifies the definition of a business to assist entities with evaluating whether transactions should be accounted for as acquisitions or disposals of assets or businesses. The standard introduces a screen for determining when assets acquired are not a business and clarifies that a business must include, at a minimum, an input and a substantive process that contribute to an output to be considered a business. This standard is effective for fiscal years beginning after December 15, 2017, including interim periods within that reporting period. Early adoption of the standard is allowed for transactions that have not been reported in financial statements issued prior to the new standards issuance date. The Company adopted the guidance as of January 1, 2017. Certain immaterial asset purchases during 2017 were accounted for as acquisitions of assets as a result of applying the new guidance.
Recently Issued Accounting Pronouncements
In May 2014, the FASB issued ASU No. 2014-09, Revenue from Contracts with Customers (Topic 606), which amends the existing accounting standards for revenue recognition. In August 2015, the FASB issued ASU No. 2015-14, Revenue from Contracts with Customers (Topic 606): Deferral of the Effective Date, which delays the effective date of ASU 2014-09 by one year. The FASB also agreed to allow entities to choose to adopt the standard as of the original effective date. During 2016, the FASB also issued ASU No. 2016-08, Principal versus Agent Considerations (Reporting Revenue Gross versus Net); ASU No. 2016-10, Identifying Performance Obligations and Licensing; ASU No. 2016-12, Narrow-Scope Improvements and Practical Expedients; and ASU No. 2016-20, Technical Corrections and Improvements to Topic 606, Revenue from Contracts with Customers which amend ASU No. 2014-09. These amendments include clarification of principal versus agent guidance in situations in which a revenue transaction involves a third party in providing goods or services to a customer. The amendments also clarify, in terms of identifying performance obligations, how entities would determine whether promised goods or services are separately identifiable from other promises in a contract and, therefore, would be accounted for separately. The guidance allows entities to disregard goods or services that are immaterial in the context of a contract. The new revenue recognition standard will be effective for the Company in the first quarter of 2018. The new standard also permits two methods of adoption: retrospectively to each prior reporting period presented (full retrospective method), or retrospectively with the cumulative effect of initially applying the guidance recognized at the date of initial application (the modified retrospective method). The Company will adopt this new standard as of January 1, 2018 using the modified retrospective method applied to those contracts that were not completed as of that date. The Company has completed a detailed review of contracts and policies in order to evaluate any required changes to its existing accounting policies and to quantify the impact of Topic 606. For most revenue arrangements there are no impacts as they generally consist of a single performance
F - 15
obligation to transfer promised goods or services and they were not previously accounted for under any industry-specific guidance that will be superseded by Topic 606. In these arrangements, any promised installation services are generally considered to be immaterial in the context of the contract and will therefore be included in the single performance obligation. In addition, most revenue arrangements contain substantive termination provisions such that the contract term will be unaffected by Topic 606. As part of the detailed analysis, the Company further analyzed its initial assessment related to the usage based contracts, price concessions, and sales commissions, and based upon the nature and extent of these activities, has concluded there are no material impacts. Certain of the Company’s contracts with customers are in the form of IRUs, which will generally fall outside the scope of Topic 606 and will be recognized in accordance with ASC 840, Leases or ASC 842, Leases, upon its adoption. While the Company will provide expanded disclosures, the adoption of Topic 606 will not have a material impact on its consolidated statements of operations.
In February 2016, the FASB issued ASU 2016-02, Leases, which requires most leases (with the exception of leases with terms of less than one year) to be recognized on the balance sheet as an asset and a lease liability. Leases will be classified as an operating lease or a financing lease. Operating leases are expensed using the straight-line method, whereas financing leases will be treated similarly to a capital lease under the current standard. The new standard will be effective for annual and interim periods, within those fiscal years, beginning after December 15, 2018, but early adoption is permitted. The new standard must be presented using the modified retrospective method beginning with the earliest comparative period presented. The Company is currently evaluating the effect of the new standard on its consolidated financial statements and related disclosures.
In August 2016, the FASB issued ASU 2016-15, Classification of Certain Cash Receipts and Cash Payments, which is intended to reduce diversity in practice of how certain transactions are classified and presented in the statement of cash flows in accordance with ASC 230. The ASU amends or clarifies guidance on eight specific cash flow issues, some of which include classification on debt prepayment or debt extinguishment costs, contingent consideration payments made after a business combination, and separately identifiable cash flows and application of the predominance principle. The standard is effective for financial statements issued for fiscal years beginning after December 15, 2017, and interim periods within those periods. Early adoption is permitted, provided that all of the amendments are adopted in the same period. The guidance requires application using a retrospective transition method. The Company is currently evaluating the effect of the new standard on its consolidated financial statements and related disclosures, but the Company does not expect the new guidance to have a material impact.
In November 2016, the FASB issued ASU No. 2016-18, Statement of Cash Flows (Topic 230): Restricted Cash, which clarifies the presentation requirements of restricted cash within the statement of cash flows. The changes in restricted cash and restricted cash equivalents during the period should be included in the beginning and ending cash and cash equivalents balance reconciliation on the statement of cash flows. When cash, cash equivalents, restricted cash or restricted cash equivalents are presented in more than one line item within the statement of financial position, an entity shall calculate a total cash amount in a narrative or tabular format that agrees to the amount shown on the statement of cash flows. Details on the nature and amounts of restricted cash should also be disclosed. This guidance will be effective in the first quarter of 2018, and early adoption is permitted. The guidance requires application using a retrospective approach. The Company is assessing whether the new standard will have a material effect on its consolidated financial statements and related disclosures.
In March 2017, the FASB issued ASU 2017-04, Intangibles-Goodwill and Other (Topic 350): Simplifying the Test for Goodwill Impairment, which simplifies the accounting for goodwill impairment by eliminating the requirement to calculate the implied fair value of goodwill (Step 2) to measure a goodwill impairment charge. Instead, entities will record an impairment charge based on the excess of a reporting unit's carrying amount over its fair value (as determined in Step 1). The guidance is effective prospectively for public business entities for fiscal years beginning after December 15, 2019. Early adoption is permitted for interim or annual goodwill impairment tests performed on testing dates after January 1, 2017. The Company does not expect the new guidance to have a material impact on its consolidated financial statements.
In May 2017, the FASB issued ASU 2017-09, Compensation - Stock Compensation (Topic 718): Scope of Modification Accounting, which clarifies when changes to the terms or conditions of share-based equity awards must be accounted for as modifications. Entities will apply the modification accounting guidance if the value, vesting conditions or classification of the award are not the same immediately before and after the modification. The guidance is effective prospectively for public business entities for fiscal years beginning after December 15, 2017, including interim periods within that reporting period. The Company does not expect this new guidance to have a material impact on its consolidated financial statements.
Other recent accounting pronouncements issued by the FASB during 2017 and through the filing date did not and are not believed by management to have a material impact on the Company's present or historical consolidated financial statements.
NOTE 3 — BUSINESS ACQUISITIONS
F - 16
Since its formation, the Company has consummated a number of transactions accounted for as business combinations as part of its growth strategy. The acquisitions of these businesses, which are in addition to periodic purchases of customer contracts, have allowed the Company to increase the scale at which it operates, which in turn affords the Company the ability to increase its operating leverage, extend its network, and broaden its customer base.
The accompanying consolidated financial statements include the operations of the acquired entities from their respective acquisition dates. All of the acquisitions noted below have been accounted for as a business combination. Accordingly, consideration paid by the Company to complete the acquisitions is initially allocated to the respective assets and liabilities based upon their estimated acquisition date fair values. The recorded amounts for assets acquired and liabilities assumed are provisional and subject to change during the measurement period, which is up to 12 months from the date of acquisition.
The following is a list of material business combinations the Company completed during 2017, 2016, and 2015, respectively.
2017 Acquisitions
Custom Connect International B.V.
In December 2017, the Company acquired Custom Connect International B.V. ("Custom Connect"). The Company paid $28.9 million in cash consideration, of which $0.6 million was net cash acquired, and 49,941 unregistered shares of the Company's common stock valued at $2.2 million at closing. $3.2 million of the initial cash consideration is held in escrow for one year, subject to reduction for any indemnification claims made by the Company prior to such date. The results of Custom Connect have been included from December 31, 2017. The acquisition was considered a stock purchase for tax purposes.
Transbeam, Inc.
In October 2017, the Company acquired Transbeam, Inc. ("Transbeam"). The Company paid $26.4 million in cash consideration at closing, of which $0.8 million was net cash acquired, and $2.0 million was deferred as holdback consideration for a 12-month period, subject to reduction for any indemnification claims made by the Company prior to such date. The results of Transbeam have been included from October 1, 2017. The acquisition was considered a stock purchase for tax purposes.
Global Capacity
In September 2017, the Company acquired Global Capacity. The Company paid $104.0 million in cash consideration, of which $4.0 million was net cash acquired, and 1,850,000 unregistered shares of the Company's common stock valued at $53.6 million at closing. $10.0 million of the initial cash consideration is held in escrow for one year, subject to reduction for any indemnification claims made by the Company prior to such date. The results of Global Capacity have been included from September 15, 2017. The acquisition was considered an asset purchase for tax purposes.
Perseus Telecom
In June 2017, the Company acquired Perseus Telecom ("Perseus"). The Company paid $37.5 million in cash consideration, of which $0.1 million was net cash acquired, and assumed $1.9 million in capital leases. $4.0 million of the initial cash consideration is held in escrow for one year, subject to reduction for any indemnification claims made by the Company prior to such date. The results of Perseus have been included from June 1, 2017. The acquisition was considered a stock purchase for tax purposes.
Hibernia
In January 2017, the Company acquired Hibernia. The Company paid $529.6 million in cash consideration, of which $14.6 million was net cash acquired, and 3,329,872 unregistered shares of the Company's common stock, initially valued at $75.0 million on the date of announcement, and ultimately valued at $86.1 million at closing. $15.0 million of the initial cash consideration is held in escrow for one year, subject to reduction for any indemnification claims made by the Company prior to such date. The results of Hibernia have been included from January 1, 2017. The acquisition was considered an asset purchase for tax purposes.
2016 Acquisitions
Telnes Broadband
In February 2016, the Company completed the acquisition of Telnes Broadband ("Telnes"). The Company paid $17.5 million, composed of $15.5 million in cash and 178,202 unregistered shares of the Company's common stock valued at $2.0 million. $1.8
F - 17
million of the cash consideration was deferred for one year subject to reduction for any indemnification claims made by the Company prior to such date. The acquisition was considered an asset purchase for tax purposes.
2015 Acquisitions
One Source Networks Inc.
In October 2015, the Company acquired One Source Networks Inc. ("One Source"). The Company paid $169.3 million of cash and issued 185,946 unregistered shares of the Company's common stock valued at $2.3 million. The Company also issued 289,055 unregistered shares of its common stock to certain One Source employees as compensation for continuous employment. Share-based compensation of $3.6 million has been amortized ratably over an 18 month service period. The net working capital was finalized in 2016 for additional consideration of $0.4 million. The acquisition was considered a stock purchase for tax purposes.
MegaPath Corporation
In April 2015, the Company acquired MegaPath Corporation ("MegaPath"). The Company paid $141.4 million in cash (exclusive of the assumption of $3.4 million in capital leases) and issued 610,843 unregistered shares of the Company’s common stock valued at $7.5 million. In April 2016, the Company also settled a dispute related to closing date working capital with MegaPath in 2016, resulting in an increase to total consideration and goodwill of $4.1 million. $10.0 million of the initial cash consideration was deferred for one year, subject to reduction for any indemnification claims made by the Company prior to such date. The acquisition was considered an asset purchase for tax purposes.
Purchase Price Allocation
The table below reflects the Company's estimates of the acquisition date fair values of the purchase consideration, assets acquired, and liabilities assumed for its 2017 acquisitions (amounts in millions):
F - 18
Hibernia | Global Capacity | Other 2017 Acquisitions | |||||||||
Purchase Price | |||||||||||
Cash paid at closing, including working capital estimate | $ | 529.6 | $ | 104.0 | $ | 92.8 | |||||
Deferred cash consideration | — | — | 2.0 | ||||||||
Common stock (1) | 86.1 | 53.6 | 2.2 | ||||||||
Purchase consideration | $ | 615.7 | $ | 157.6 | $ | 97.0 | |||||
Purchase Price Allocation | |||||||||||
Assets acquired: | |||||||||||
Current assets | $ | 42.6 | $ | 25.7 | $ | 8.5 | |||||
Property and equipment | 432.5 | 34.4 | 9.8 | ||||||||
Other assets | 0.1 | 2.5 | 0.5 | ||||||||
Intangible assets - customer lists | 166.7 | 41.2 | 39.8 | ||||||||
Intangible assets - tradename | 0.7 | — | 0.1 | ||||||||
Intangible assets - other | — | 4.6 | 0.2 | ||||||||
Deferred tax asset | — | — | — | ||||||||
Goodwill | 201.1 | 88.8 | 73.7 | ||||||||
Total assets acquired | 843.7 | 197.2 | 132.6 | ||||||||
Liabilities assumed: | |||||||||||
Current liabilities | (40.6 | ) | (24.1 | ) | (23.0 | ) | |||||
Capital leases, long-term portion | — | — | (2.3 | ) | |||||||
Deferred revenue | (163.3 | ) | (15.5 | ) | (1.4 | ) | |||||
Deferred tax liability | (24.1 | ) | — | (8.7 | ) | ||||||
Other long-term liabilities | — | — | (0.2 | ) | |||||||
Total liabilities assumed | (228.0 | ) | (39.6 | ) | (35.6 | ) | |||||
Net assets acquired | $ | 615.7 | $ | 157.6 | $ | 97.0 | |||||
(1) Common stock fair value for Hibernia equals the closing share price of $27.80 less a discount for lack of marketability. Common stock fair value for Global Capacity equals the closing share price of $30.85 less a discount for lack of marketability.
The table below reflects the weighted average amortization period for intangible assets acquired in 2017 (amounts in years):
Hibernia | Global Capacity | Other 2017 Acquisitions | ||||||
Intangible assets - customer lists | 10.0 | 9.0 | 8.0 | |||||
Intangible assets - tradename | 2.0 | — | 0.5 | |||||
Intangible assets - other | — | 2.2 | 5.0 | |||||
Weighted average | 10.0 | 8.3 | 8.0 | |||||
Amortization expense related to intangible assets created as a result of the 2017 acquisitions of $21.1 million has been recorded for the year ended December 31, 2017. Estimated amortization expense related to the 2017 acquisitions for each of the years subsequent to December 31, 2017 is as follows (amounts in millions):
F - 19
2018 | $ | 30.5 | |
2019 | 26.9 | ||
2020 | 26.9 | ||
2021 | 26.9 | ||
2022 | 26.9 | ||
2023 and beyond | 94.1 | ||
Total | $ | 232.2 | |
Goodwill is calculated as the excess of the consideration transferred over the net assets recognized and represents the estimated future economic benefits arising from other assets acquired that could not be individually identified and separately recognized. The goodwill is not expected to be deductible for tax purposes. Goodwill will not be amortized but instead will be tested for impairment at least annually and more frequently if certain indicators of impairment are present.
Acquisition Method Accounting Estimates
The Company initially recognizes the assets and liabilities acquired from the aforementioned acquisitions based on its preliminary estimates of their acquisition date fair values. As additional information becomes known regarding the acquired assets and assumed liabilities, management may make adjustments to the opening balance sheet of the acquired company up to the end of the measurement period, which is a one-year period following the acquisition date. The determination of the fair values of the acquired assets and liabilities assumed (and the related determination of estimated lives of depreciable tangible and identifiable intangible assets) requires significant judgment.
Transaction Costs
Transaction costs describe the broad category of costs the Company incurs in connection with signed and/or closed acquisitions. There are two types of costs that the Company accounts for:
•Severance, restructuring and other exit costs
•Transaction and integration costs
Severance, restructuring and other exit costs include severance and other one-time benefits for terminated employees, termination charges for leases and supplier contracts, and other costs incurred associated with an exit activity. These costs are reported separately in the consolidated statements of operations. Refer to Note 11 - Severance, Restructuring, and Other Exit Costs of these consolidated financial statements for further information on severance, restructuring and other exit costs.
Transaction and integration costs include expenses associated with legal, accounting, regulatory, and other transition services rendered in connection with acquisitions, travel expense, and other non-recurring direct expenses associated with acquisitions. Transaction and integration costs are expensed as incurred in support of the integration. The Company incurred transaction and integration costs of $19.1 million, $4.8 million, and $6.1 million for the years ended December 31, 2017, 2016, and 2015, respectively. Transaction and integration costs have been included in selling, general and administrative expenses in the consolidated statements of operations and in cash flows from operating activities in the consolidated statements of cash flows during the years then ended.
Pro forma Financial Information (Unaudited)
The pro forma results presented below include the effects of the Company’s acquisitions during 2017 and 2016 as if the acquisitions occurred on January 1, 2016. The pro forma net income (loss) for the years ended December 31, 2017 and 2016 includes adjustments to revenue and cost of telecommunications services to eliminate inter-company activity and adjustments to deferred revenue and deferred cost from the acquired companies. The pro forma adjustments are based on historically reported transactions by the acquired companies. The pro forma results do not include any anticipated synergies or other expected benefits of the acquisitions. The unaudited pro forma financial information below is not necessarily indicative of either future results of operations or results that might have been achieved had the acquisitions been consummated as of January 1, 2016.
F - 20
Year Ended December 31, | |||||||
2017 | 2016 | ||||||
(Amounts in millions, except per share and share data) | |||||||
Revenue | $ | 977.4 | $ | 912.9 | |||
Net (loss) income | $ | (81.2 | ) | $ | (19.4 | ) | |
(Loss) earnings per share: | |||||||
Basic | $ | (1.94 | ) | $ | (0.46 | ) | |
Diluted | $ | (1.94 | ) | $ | (0.46 | ) | |
Denominator for basic EPS – weighted average shares | 41,912,952 | 42,235,535 | |||||
Denominator for diluted EPS – weighted average shares | 41,912,952 | 42,235,535 | |||||
NOTE 4 — GOODWILL AND INTANGIBLE ASSETS
The goodwill balance was $644.5 million and $280.6 million as of December 31, 2017 and 2016, respectively. Additionally, the Company's intangible asset balance was $417.1 million and $193.9 million as of December 31, 2017 and 2016, respectively. The additions to both goodwill and intangible assets during the year ended December 31, 2017 relate to the 2017 Acquisitions (see to Note 3 - Business Acquisitions). The additions to intangible assets during the year ended December 31, 2017 also include the purchase of customer contracts.
The changes in the carrying amount of goodwill for the years ended December 31, 2017 and 2016 were as follows (amounts in millions):
Goodwill - January 1, 2016 | $ | 271.0 | |
Initial goodwill associated with 2016 business combinations | 5.1 | ||
Adjustments to prior year business combinations | 4.5 | ||
Goodwill - December 31, 2016 | 280.6 | ||
Initial goodwill associated with 2017 business combinations | 334.7 | ||
Adjustments to current year business combinations | 28.9 | ||
Adjustments to prior year business combinations | 0.3 | ||
Goodwill - December 31, 2017 | $ | 644.5 | |
The following tables summarize the Company’s intangible assets (amounts in millions):
December 31, 2017 | December 31, 2016 | ||||||||||||||||||||||||
Amortization Period | Gross Asset Cost | Accumulated Amortization | Net Book Value | Gross Asset Cost | Accumulated Amortization | Net Book Value | |||||||||||||||||||
Customer lists | 3-10 years | $ | 552.8 | $ | 155.1 | $ | 397.7 | $ | 267.7 | $ | 91.1 | $ | 176.6 | ||||||||||||
Non-compete agreements | 3-5 years | 4.6 | 4.5 | 0.1 | 4.6 | 4.4 | 0.2 | ||||||||||||||||||
Point-to-point FCC license fees | 3 years | 1.7 | 1.7 | — | 1.7 | 1.3 | 0.4 | ||||||||||||||||||
Intellectual property | 10 years | 23.7 | 5.2 | 18.5 | 17.4 | 2.1 | 15.3 | ||||||||||||||||||
Tradename | 3 years | 3.9 | 3.1 | 0.8 | 3.1 | 1.7 | 1.4 | ||||||||||||||||||
$ | 586.7 | $ | 169.6 | $ | 417.1 | $ | 294.5 | $ | 100.6 | $ | 193.9 | ||||||||||||||
Amortization expense was $69.0 million, $40.7 million and $26.0 million for the years ended December 31, 2017, 2016, and 2015, respectively.
F - 21
Estimated amortization expense related to intangible assets subject to amortization at December 31, 2017 in each of the years subsequent to December 31, 2017 is as follows (amounts in millions):
2018 | $ | 73.8 | |
2019 | 65.4 | ||
2020 | 62.3 | ||
2021 | 60.8 | ||
2022 | 47.7 | ||
2023 and beyond | 107.1 | ||
Total | $ | 417.1 | |
NOTE 5 — PROPERTY AND EQUIPMENT
The following table summarizes the Company’s property and equipment (amounts in millions):
December 31, | |||||||
2017 | 2016 | ||||||
Land and Buildings | $ | 14.2 | $ | — | |||
Furniture and Fixtures | 1.9 | 1.0 | |||||
Fiber Optic Cable | 411.0 | — | |||||
Fiber Optic Network Equipment | 199.8 | 116.2 | |||||
Leasehold Improvements | 5.0 | 4.4 | |||||
Computer Hardware and Software | 25.9 | 15.6 | |||||
Property and equipment, gross | 657.8 | 137.2 | |||||
Less accumulated depreciation | (158.5 | ) | (93.8 | ) | |||
Property and equipment, net | $ | 499.3 | $ | 43.4 | |||
Depreciation expense associated with property and equipment was $63.6 million, $22.1 million and $20.7 million for the years ended December 31, 2017, 2016, and 2015, respectively.
NOTE 6 — ACCRUED EXPENSES AND OTHER CURRENT LIABILITIES
The following table summarizes the Company’s accrued expenses and other current liabilities (amounts in millions):
December 31, | |||||||
2017 | 2016 | ||||||
Compensation and benefits | $ | 13.3 | $ | 10.0 | |||
Selling, general and administrative | 2.1 | 4.5 | |||||
Carrier costs | 13.8 | 13.5 | |||||
Restructuring | 9.7 | 3.2 | |||||
Interest | 22.9 | 0.7 | |||||
Fiber pair repurchase | 10.0 | — | |||||
Accrued taxes | 9.6 | 1.8 | |||||
Other | 7.6 | 3.2 | |||||
$ | 89.0 | $ | 36.9 | ||||
NOTE 7 — DEFERRED REVENUE
The total deferred revenue as of December 31, 2017 was $161.7 million, consisting of unamortized prepaid capacity sales, IRUs, deferred non-recurring revenue, and unearned revenue for amounts billed in advance to customers. The total deferred revenue as of December 31, 2016 was $21.3 million, consisting of deferred non-recurring revenue and unearned revenue for amounts billed in advance to customers. Deferred revenue is recognized as current and noncurrent deferred revenue on the consolidated balance sheets.
F - 22
Prepaid capacity sales and IRUs represent $122.1 million of the total deferred revenue balance as of December 31, 2017, and remaining amortization at December 31, 2017 and in each of the years subsequent to December 31, 2017 is as follows (amounts in millions):
Capacity Sales and IRUs | |||
2018 | $ | 15.8 | |
2019 | 11.3 | ||
2020 | 11.0 | ||
2021 | 10.1 | ||
2022 | 10.1 | ||
2023 and beyond | 63.8 | ||
$ | 122.1 | ||
NOTE 8 — DEBT
Long-term debt is summarized as follows (amounts in millions):
December 31, 2017 | December 31, 2016 | ||||||
Term loan | $ | 693.0 | $ | 425.8 | |||
7.875% Senior unsecured notes | 575.0 | 300.0 | |||||
Revolving line of credit | — | 20.0 | |||||
Total debt obligations | 1,268.0 | 745.8 | |||||
Unamortized debt issuance costs | (33.8 | ) | (9.3 | ) | |||
Unamortized original issuance premium (discount), net | 9.3 | (7.0 | ) | ||||
Carrying value of debt | 1,243.5 | 729.5 | |||||
Less current portion | (7.0 | ) | (4.3 | ) | |||
$ | 1,236.5 | $ | 725.2 | ||||
2017 Credit Agreement
On January 9, 2017, the Company entered into a credit agreement (the "2017 Credit Agreement") that provides a $700.0 million term loan facility and a $75.0 million revolving line of credit facility (which includes a $25.0 million letter of credit facility). In addition, the Company may request incremental term loan and/or incremental revolving loan commitments in an aggregate amount not to exceed the sum of $150.0 million and an unlimited amount that is subject to pro forma compliance with certain net secured leverage ratio tests provided, however, that incremental revolving loan commitments may not exceed $25.0 million. The term loan facility was issued at an original issuance discount of $3.5 million.
The maturity date of the term loan facility is January 9, 2024, and the maturity date of the revolving line of credit facility is January 9, 2022. The principal amount of the term loan facility is payable in equal quarterly installments of $1.8 million commencing on March 31, 2017 and continuing thereafter until the maturity date when the remaining balance of outstanding principal amount is payable in full. In addition to scheduled mandatory repayments, the Company is also required to repay an amount of up to 50% of Excess Cash Flow (as defined in the Credit Agreement). No such excess cash payments were made during the year ended December 31, 2017.
The Company may prepay loans under the 2017 Credit Agreement at any time, subject to certain notice requirements and LIBOR breakage costs.
F - 23
At the Company's election, the loans under the 2017 Credit Agreement may be made as either Base Rate Loans or Eurodollar Loans. The Eurodollar Loans are subject to a floor of 1.00%.
On July 10, 2017, the Company entered into Amendment No. 1 (the "Repricing Amendment") to the 2017 Credit Agreement. The Repricing Amendment, among other things, reduced the applicable margin on Tranche B Term Loans from 3.00% to 2.25% for Base Rate Loans and from 4.00% to 3.25% for Eurodollar Loans, and reduced the applicable margin on revolving loans from 2.50% to 2.00% for Base Rate Loans and from 3.50% to 3.00% for Eurodollar Loans. The amendment also established a soft call protection of 1.0% through January 10, 2018 for certain prepayments, refinancings, and amendments.
On October 12, 2017, the Company entered into an Incremental Revolving Credit Assumption Agreement to increase its revolving line of credit facility from $75.0 million to $100.0 million.
The effective interest rate on the term loan at December 31, 2017 and 2016 was 4.5% and 5.8%, respectively.
The obligations under the 2017 Credit Agreement are secured by the substantial majority of the tangible and intangible assets of the Company and the guarantors.
The 2017 Credit Agreement does not contain a financial covenant for the term loan facility, but includes a maximum consolidated net secured leverage ratio applicable to the revolving credit facility in the event that utilization exceeds 30% of the revolving loan facility commitment.
The unused and available amount of the revolving line of credit facility at December 31, 2017 was as follows (amounts in millions):
Committed capacity | $ | 100.0 | |
Borrowings outstanding | — | ||
Letters of credit issued | (4.6 | ) | |
Unused and available | $ | 95.4 | |
7.875% Senior Unsecured Notes
In December 2016, the Company completed a private offering of $300.0 million aggregate principal amount of its 7.875% senior unsecured notes due in 2024 (the "Original Notes"). The proceeds from the Original Notes were deposited into escrow, where the funds remained until the closing of the acquisition of Hibernia in January 2017. The Company recognized the proceeds from the private offering as restricted cash and cash equivalents in its consolidated financial statements as of December 31, 2016. The funds were subsequently released with the closing of Hibernia. In connection with the offering, the Company incurred debt issuance costs of $11.2 million, of which $0.5 million was incurred in 2016 and the remainder was incurred in 2017.
In June 2017, the Company completed a private offering of $150.0 million aggregate principal amount of its 7.875% senior unsecured notes due in 2024 (the "June 2017 Notes"). The June 2017 Notes will be treated as a single series of debt securities with the Company's Original Notes (together with the June 2017 Notes, the "Existing Notes"). The June 2017 Notes have identical terms as the Original Notes, other than the issue date and offering price. The June 2017 Notes were issued at a premium of $9.0 million. In connection with the offering, the Company incurred debt issuance costs of $2.9 million.
In October 2017, the Company completed a private offering of $125.0 million aggregate principal amount of its 7.875% senior unsecured notes due in 2024 (the "October 2017 Notes"). The October 2017 Notes will be treated as a single series of debt securities with the Existing Notes. The October 2017 Notes have identical terms as the Existing Notes, other than the issue date and offering price. The October 2017 Notes were issued at a premium of $7.5 million. In connection with the offering, the Company incurred debt issuance costs of $3.2 million.
Term Loan and 7.875% Senior Unsecured Notes Contractual Maturities
The aggregate contractual maturities of long-term debt (excluding unamortized debt issuance costs and unamortized OID) were as follows as of December 31, 2017 (amounts in millions):
F - 24
Total debt | |||
2018 | $ | 7.0 | |
2019 | 7.0 | ||
2020 | 7.0 | ||
2021 | 7.0 | ||
2022 | 7.0 | ||
2023 and beyond | 1,233.0 | ||
$ | 1,268.0 | ||
Debt Issuance Costs and Original Issuance Discounts and Premiums
The following table summarizes the debt issuance costs activity for the years ended December 31, 2017 and 2016 (amounts in millions):
Term Loan | 7.875% Senior Unsecured Notes | Revolving Line of Credit | Total | ||||||||||||
Balance, December 31, 2015 | $ | (9.8 | ) | $ | — | $ | (1.2 | ) | $ | (11.0 | ) | ||||
Debt issuance costs incurred | (0.9 | ) | (0.5 | ) | — | (1.4 | ) | ||||||||
Amortization | 1.3 | — | 0.2 | 1.5 | |||||||||||
Loss on debt extinguishment | 1.6 | — | — | 1.6 | |||||||||||
Balance, December 31, 2016 | (7.8 | ) | (0.5 | ) | (1.0 | ) | (9.3 | ) | |||||||
Debt issuance costs incurred | (14.5 | ) | (16.8 | ) | (2.7 | ) | (34.0 | ) | |||||||
Amortization | 2.2 | 1.2 | 0.4 | 3.8 | |||||||||||
Loss on debt extinguishment | 5.4 | — | 0.3 | 5.7 | |||||||||||
Balance, December 31, 2017 | $ | (14.7 | ) | $ | (16.1 | ) | $ | (3.0 | ) | $ | (33.8 | ) | |||
Debt issuance costs are presented in the consolidated balance sheets as a reduction to "Long-term debt." Interest expense associated with the amortization of debt issuance costs was $3.8 million, $1.5 million and $1.0 million for the years ended December 31, 2017, 2016, and 2015, respectively.
The following table summarizes the original issuance discount and premium activity for the year ended December 31, 2017 (amounts in millions):
Term Loan | 7.875% Senior Unsecured Notes | Total | |||||||||
Balance, December 31, 2015 | $ | (7.9 | ) | $ | — | $ | (7.9 | ) | |||
New Original Issuance (Discount)/Premium | — | — | — | ||||||||
Amortization | 0.9 | — | 0.9 | ||||||||
Loss on debt extinguishment | — | — | — | ||||||||
Balance, December 31, 2016 | (7.0 | ) | — | (7.0 | ) | ||||||
New Original Issuance (Discount)/Premium | (3.5 | ) | 16.5 | 13.0 | |||||||
Amortization | 1.1 | (0.7 | ) | 0.4 | |||||||
Loss on debt extinguishment | 2.9 | — | 2.9 | ||||||||
Balance, December 31, 2017 | $ | (6.5 | ) | $ | 15.8 | $ | 9.3 | ||||
OID is presented in the consolidated balance sheets as a reduction to "Long-term debt." Interest expense, net associated with the amortization of OID was $0.4 million, $0.9 million and $0.2 million for the years ended December 31, 2017, 2016, and 2015, respectively.
F - 25
The Company expensed an aggregate of $8.6 million, $1.6 million, and $3.4 million of debt issuance costs and OID that did not qualify for deferral as a "Loss on debt extinguishment" in the consolidated statements of operations for the years ended December 31, 2017, 2016, and 2015, respectively.
Previous Debt Agreement - October 2015 Credit Agreement
On October 22, 2015, the Company entered into a credit agreement (the "October 2015 Credit Agreement") that provided for a $400.0 million term loan facility and a $50.0 million revolving line of credit (which included a $15.0 million letter of credit facility and a $10.0 million swingline facility). As of December 31, 2016, the Company had drawn $20.0 million under the revolving line of credit and had $29.5 million of borrowing capacity available. Amounts outstanding under the October 2015 Credit agreement were paid in full at the closing of the 2017 Credit Agreement. The previous term loan was issued at an OID of $8.0 million.
NOTE 9 — FAIR VALUE MEASUREMENTS
As of December 31, 2017 and 2016, the carrying amounts reflected in the accompanying consolidated balance sheets for cash and cash equivalents, accounts receivable, accounts payable, accrued expenses and other current liabilities, and acquisition earn-outs and holdbacks approximated fair value due to the short-term nature of these instruments.
The table below presents the fair values for the Company's long-term debt as well as the input level used to determine these fair values. The carrying amounts exclude any debt issuance costs or original issuance discount:
Fair Value Measurement Using | ||||||||||||||||
Total Carrying Value in Consolidated Balance Sheet | Unadjusted Quoted Prices in Active Markets for Identical Assets or Liabilities (1) (Level 1) | |||||||||||||||
(amounts in millions) | December 31, 2017 | December 31, 2016 | December 31, 2017 | December 31, 2016 | ||||||||||||
Liabilities not recorded at fair value in the Financial Statements: | ||||||||||||||||
Long-term debt, including the current portion: | ||||||||||||||||
Term loan | $ | 693.0 | $ | 425.8 | $ | 697.3 | $ | 425.8 | ||||||||
7.875% Senior unsecured notes | 575.0 | 300.0 | 608.1 | 300.0 | ||||||||||||
Total long-term debt, including current portion | $ | 1,268.0 | $ | 725.8 | $ | 1,305.4 | $ | 725.8 | ||||||||
(1) Fair value based on the bid quoted price.
Assets and liabilities measured at fair value on a non-recurring basis include goodwill, tangible assets, and intangible assets. Such assets are reviewed quarterly for impairment indicators. If a triggering event has occurred, the assets are remeasured when the estimated fair value of the corresponding asset group is less than the carrying value. The fair value measurements, in such instances, are based on significant unobservable inputs (Level 3). There were no goodwill or intangible asset impairments recorded during the years ended December 31, 2017, 2016, and 2015.
NOTE 10 — INCOME TAXES
The components of (loss) income before income taxes are as follows (amounts in millions):
Year Ended December 31, | |||||||||||
2017 | 2016 | 2015 | |||||||||
Domestic | $ | (87.1 | ) | $ | 11.5 | $ | (12.3 | ) | |||
Foreign | 32.9 | (2.3 | ) | (2.5 | ) | ||||||
Total | $ | (54.2 | ) | $ | 9.2 | $ | (14.8 | ) | |||
The components of the provision for (benefit from) income taxes are as follows (amounts in millions):
F - 26
Year Ended December 31, | |||||||||||
2017 | 2016 | 2015 | |||||||||
Current: | |||||||||||
Federal | $ | (0.5 | ) | $ | 0.4 | $ | 0.1 | ||||
State | — | — | — | ||||||||
Foreign | 7.3 | 1.3 | (3.7 | ) | |||||||
Total current | 6.8 | 1.7 | (3.6 | ) | |||||||
Federal | 8.0 | 2.4 | (25.3 | ) | |||||||
State | 0.4 | 0.7 | (3.8 | ) | |||||||
Foreign | 2.1 | (0.9 | ) | (1.4 | ) | ||||||
Total deferred | 10.5 | 2.2 | (30.5 | ) | |||||||
Income tax expense (benefit) | $ | 17.3 | $ | 3.9 | $ | (34.1 | ) | ||||
The following is a reconciliation of the U.S. federal statutory income taxes to the amounts reported in the financial statements (amounts in millions):
Year Ended December 31, | |||||||||||
2017 | 2016 | 2015 | |||||||||
U.S. federal statutory income tax | $ | (19.0 | ) | $ | 3.2 | $ | (5.2 | ) | |||
Permanent items | 1.2 | (0.2 | ) | 0.7 | |||||||
State taxes, net of federal benefit | (3.0 | ) | 0.4 | (0.5 | ) | ||||||
Foreign tax rate differential | (9.3 | ) | — | — | |||||||
Compensation related items | (5.1 | ) | — | — | |||||||
Change in valuation allowance | 29.0 | — | (23.4 | ) | |||||||
Unrecognized tax positions | 2.8 | — | (2.2 | ) | |||||||
Tax Cuts and Jobs Act | 17.3 | — | — | ||||||||
Other | 3.4 | 0.5 | (3.5 | ) | |||||||
Total income tax expense (benefit) | $ | 17.3 | $ | 3.9 | $ | (34.1 | ) | ||||
The components of the Company's deferred tax assets and liabilities are as follows (amounts in millions):
December 31, | |||||||
2017 | 2016 | ||||||
Deferred tax assets: | |||||||
Tax loss and credit carryforwards | $ | 56.5 | $ | 21.3 | |||
Reserves and allowances | 1.2 | 0.7 | |||||
Share-based compensation | 4.2 | 3.7 | |||||
Other | (0.2 | ) | 2.2 | ||||
Total deferred tax assets before valuation allowance | 61.7 | 27.9 | |||||
Less: Valuation allowance | (39.2 | ) | (0.3 | ) | |||
Total deferred tax assets | 22.5 | 27.6 | |||||
Deferred tax liabilities: | |||||||
Intangible assets and goodwill | (30.0 | ) | (17.7 | ) | |||
Property and equipment | (12.1 | ) | (4.2 | ) | |||
Other | (6.7 | ) | (0.6 | ) | |||
Total deferred tax liabilities | (48.8 | ) | (22.5 | ) | |||
Net deferred tax (liabilities) assets(1) | $ | (26.3 | ) | $ | 5.1 | ||
(1) The 2016 Net deferred tax assets are included as a component of Other long-term assets on the consolidated balance sheet.
F - 27
As of December 31, 2017, the Company had $163.4 million of U.S. federal net operating loss ("NOL") carryforwards net of limitations under Section 382. The Company's U.S. federal NOL carryforwards, if not utilized to reduce taxable income in future years, will expire between 2020 and 2037.
As of December 31, 2017, the Company had tax-effected state NOL carryforwards of approximately $6.7 million, which are subject to limitations and have various expirations through 2037.
As of December 31, 2017, the Company had NOL carryforwards in the U.K. of $89.5 million, the majority of which have no expiration date.
As of December 31, 2017, the Company recorded a valuation allowance of $29.0 million against its net U.S. deferred tax assets under the criteria of ASC 740. The amount of U.S. deferred tax asset considered realizable, could be adjusted if objective negative evidence in the form of cumulative losses is no longer present or additional weight given to subjective evidence of future forecasts, which are subject to variation due the effects of acquisitions. Additionally, based on its assessment as of December 31, 2017, the Company maintained a valuation allowance on $10.0 million of foreign NOLs that the Company determined would not be realized in the future, and will continue to evaluate the need for a valuation allowance in the other foreign jurisdictions.
The Tax Act was enacted in December 2017. The Tax Act significantly changes U.S. tax law by, among other things, lowering U.S. corporate income tax rates, implementing a territorial tax system, and imposing a one-time transition tax on deemed repatriated earnings of foreign subsidiaries. The Tax Act reduces the U.S. corporate income tax rate from 35% to 21%, effective January 1, 2018.
Deferred tax assets and liabilities are measured using enacted tax rates expected to apply to taxable income in the years in which those temporary differences are expected to reverse. As a result of the reduction in the U.S. corporate income tax rate from 35% to 21% under the Tax Act, we revalued our ending net deferred tax assets at December 31, 2017 and recognized provisional tax expense of $11.8 million.
The Tax Act provided for a one-time transition tax on the deemed repatriation of post-1986 undistributed foreign subsidiary earnings and profits ("E&P"). We have recognized a provisional $5.5 million of income tax expense related to the transition tax.
While the Tax Act provides for a modified territorial tax system, beginning in 2018, global intangible low-taxed income ("GILTI") provisions will be applied providing an incremental tax on low taxed foreign income. The GILTI provisions require us to include in our U.S. income tax return foreign subsidiary earnings in excess of an allowable return on the foreign subsidiary's tangible assets. Under U.S. GAAP, we are required to make an accounting policy election to either (1) treat taxes due related to GILTI as a current-period expense when incurred (the "period cost method") or (2) factor such amounts into our measurement of our deferred taxes (the "deferred method"). We are continuing to evaluate the GILTI tax rules and have not yet adopted our policy to account for the related impacts.
The SEC staff issued Staff Accounting Bulletin No. 118 ("SAB 118") to address the application of U.S. GAAP in situations when a registrant does not have the necessary information available, prepared, or analyzed (including computations) in reasonable detail to complete the accounting for certain income tax effects of the Tax Act and allows the registrant to record provisional amounts during a measurement period not to extend beyond one year from the enactment date. The ultimate impact may materially differ from the provisional amounts recorded as of December 31, 2017 due to, among other things, additional analysis, changes in interpretations and assumptions we have made, additional regulatory guidance that may be issued, and actions we may take as a result of the Tax Act. We expect to complete our analysis within the measurement period in accordance with SAB 118.
Due to the one-time transition tax on the deemed repatriation of post-1986 undistributed foreign subsidiary earnings and profits, all previously unremitted earnings for which no U.S. deferred tax liability had been accrued have now been subjected to U.S. federal income tax. To the extent we repatriate earnings to the U.S., we estimate we will not incur significant additional tax expense related to such amounts; however, our estimates are provisional and subject to further analysis.
Accounting for Uncertainty in Income Taxes
The Company had unrecognized tax benefits of $1.5 million as of December 31, 2017. The unrecognized tax benefit was not material as of December 31, 2016 and 2015. The Company recognizes interest and penalties related to uncertain tax positions in income tax expense. Changes in unrecognized tax benefits are set forth below (amounts in millions):
F - 28
2017 | 2016 | 2015 | |||||||||
Balance, January 1 | $ | — | $ | — | $ | 2.1 | |||||
Changes for tax positions of prior years | 2.8 | — | (1.8 | ) | |||||||
Increases for tax positions related to the current year | — | — | — | ||||||||
Settlements and lapsing of statutes of limitations | (1.3 | ) | — | (0.3 | ) | ||||||
Balance, December 31 | $ | 1.5 | $ | — | $ | — | |||||
The Company files income tax returns in U.S. federal, state, and foreign jurisdictions. The Company is no longer subject to U.S. federal and state income tax examinations for years prior to 2014 with the exception of the federal and state tax returns of certain acquired entities for which net operating losses are available for utilization.
NOTE 11 — SEVERANCE, RESTRUCTURING, AND OTHER EXIT COSTS
The Company incurred severance, restructuring and other exit costs associated with the various acquisitions. These costs include employee severance costs, termination costs associated with facility leases and network agreements, and other exit costs related to the transactions. Transaction and integration costs are not included in exit costs, but are recorded as a component of selling, general and administrative expense.
The exit costs recorded and paid relating to the 2017 Acquisitions are summarized as follows for the year ended December 31, 2017 (amounts in millions):
Balance, December 31, 2016 | Charges and Adjustments | Payments | Balance, December 31, 2017 | ||||||||||||
Employee Termination Benefits | $ | — | $ | 16.6 | $ | (11.1 | ) | $ | 5.5 | ||||||
Contract Terminations: | |||||||||||||||
Lease terminations | 0.9 | 3.5 | (2.0 | ) | 2.4 | ||||||||||
Other contract terminations | 2.3 | 2.3 | (2.8 | ) | 1.8 | ||||||||||
$ | 3.2 | $ | 22.4 | $ | (15.9 | ) | $ | 9.7 | |||||||
The exit costs recorded and paid related to the 2016 Acquisition are summarized as follows for the year ended December 31, 2016 (amounts in millions):
Balance, December 31, 2015 | Charges and Adjustments | Payments | Balance, December 31, 2016 | ||||||||||||
Employee Termination Benefits | $ | 1.9 | $ | 1.0 | $ | (2.9 | ) | $ | — | ||||||
Contract Terminations: | |||||||||||||||
Lease terminations | 1.5 | — | (0.6 | ) | 0.9 | ||||||||||
Other contract terminations | 3.4 | (0.1 | ) | (1.0 | ) | 2.3 | |||||||||
$ | 6.8 | $ | 0.9 | $ | (4.5 | ) | $ | 3.2 | |||||||
The exit costs recorded and paid related to the 2015 Acquisitions are summarized as follows for the year ended December 31, 2015 (amounts in millions):
Balance, December 31, 2014 | Charges and Adjustments | Payments | Balance, December 31, 2015 | ||||||||||||
Employee Termination Benefits | $ | 0.8 | $ | 7.2 | $ | (6.1 | ) | $ | 1.9 | ||||||
Contract Terminations: | |||||||||||||||
Lease terminations | 0.2 | 1.8 | (0.5 | ) | 1.5 | ||||||||||
Other contract terminations | 1.1 | 3.7 | (1.4 | ) | 3.4 | ||||||||||
$ | 2.1 | $ | 12.7 | $ | (8.0 | ) | $ | 6.8 | |||||||
F - 29
NOTE 12 — SHARE-BASED COMPENSATION
Share-Based Compensation Plan
The Company grants share-based equity awards, including stock options and restricted stock, under the GTT Stock Plan. The GTT Stock Plan is limited to an aggregate 9,500,000 shares of which 9,126,787 have been issued and are outstanding as of December 31, 2017.
The GTT Stock Plan permits the granting of time-based stock options, time-based restricted stock, and performance-based restricted stock to employees and consultants of the Company, and non-employee directors of the Company.
Time-based options granted under the GTT Stock Plan have an exercise price of at least 100% of the fair market value of the underlying stock on the grant date and expire no later than 10 years from the grant date. The Company uses the Black-Scholes option-pricing model to determine the fair value of its stock option awards at the time of grant. The stock options generally vest over four years with 25% of the options becoming exercisable one year from the date of grant and the remaining vesting 75% annually or quarterly over the following three years.
Time-based restricted stock granted under the GTT Stock Plan is valued at the share price of our common stock as reported on the NYSE on the date of grant. Time-based restricted stock generally vests over four years with 25% of the shares becoming unrestricted one year from the date of grant and the remaining vesting 75% annually or quarterly over the following three years.
Performance-based restricted stock is granted under the GTT Stock Plan subject to the achievement of certain performance measures. Once achievement of these performance measures becomes probable, the Company starts to expense the fair value of the grant over the vesting period. The performance-based restricted stock is valued at the share price of our common stock as reported on the NYSE on the date of grant. The performance grant vests quarterly over the vesting period once achievement of the performance measure has been met and approved by the Compensation Committee.
The Compensation Committee of the Board of Directors, as administrator of the GTT Stock Plan, has the discretion to authorize a different vesting schedule for any awards.
Share-Based Compensation Expense
The following table summarizes the share-based compensation expense recognized as a selling, general and administrative expense in the consolidated statements of operations (amounts in millions):
Year Ended December 31, | |||||||||||
2017 | 2016 | 2015 | |||||||||
Time-based stock options | $ | 1.4 | $ | 1.8 | $ | 1.6 | |||||
Restricted stock (1) | 20.6 | 13.7 | 6.3 | ||||||||
ESPP | 0.2 | 0.3 | — | ||||||||
Total | $ | 22.2 | $ | 15.8 | $ | 7.9 | |||||
(1) Includes $0.7 million, $2.2 million, and $0.7 million for the years ended December 31, 2017, 2016, and 2015, respectively, related to the shares issued to the former employees of One Source for continued employment.
The following table summarizes the unrecognized compensation cost and the weighted average period over which the cost is expected to be amortized (amounts in millions):
F - 30
December 31, 2017 | |||||
Unrecognized Compensation Cost | Weighted Average Remaining Period to be Recognized (Years) | ||||
Time-based stock options | $ | 1.8 | 1.53 | ||
Time-based restricted stock | 33.0 | 2.38 | |||
Performance-based restricted stock (1) | 9.3 | 1.15 | |||
Total | $ | 44.1 | 2.09 | ||
(1) Excludes $32.2 million of unrecognized compensation cost related to the 2017 Performance Awards as achievement of the performance criteria was not probable as of December 31, 2017.
Time-Based Stock Options
The Company uses the Black-Scholes option-pricing model method to calculate the fair value of the time-based stock options as of the grant date. The use of option valuation models requires the input by management of certain assumptions, including the expected stock price volatility, the expected life of the option term, and the forfeiture rate. These assumptions are utilized by the Company in determining the estimated fair value of the time-based stock options. There were no time-based stock options granted during the year ended December 31, 2017. Assumptions used in the calculation of the fair value of the time-based stock options granted for the years ended December 31, 2016 and 2015 were as follows:
2016 | 2015 | ||||
Expected volatility | 42.5% - 48.8% | 44.3% - 64.6% | |||
Risk free interest rate | 1.0% - 1.9% | 1.3% - 1.9% | |||
Expected term (in years) | 6.11 | 6.25 | |||
Dividend yield | 0.0 | % | 0.0 | % | |
Forfeiture rate | 4.0 | % | 4.0 | % | |
The following table summarizes our time-based stock option activity:
Options | Weighted Average Exercise Price | Weighted Average Fair Value | Weighted Average Remaining Contractual Life (Years) | Aggregate Intrinsic Value | |||||||||||||
Balance, December 31, 2014 | 1,363,460 | $ | 5.41 | $ | 3.17 | ||||||||||||
Granted | 344,117 | 17.91 | 8.64 | ||||||||||||||
Exercised | (259,121 | ) | 2.35 | 1.40 | |||||||||||||
Forfeited or canceled | (72,079 | ) | 6.50 | 2.75 | |||||||||||||
Balance, December 31, 2015 | 1,376,377 | 9.05 | 4.89 | ||||||||||||||
Granted | 158,958 | 13.76 | 6.10 | ||||||||||||||
Exercised | (307,286 | ) | 3.83 | 2.29 | |||||||||||||
Forfeited or canceled | (64,141 | ) | 13.31 | 6.47 | |||||||||||||
Balance, December 31, 2016 | 1,163,908 | 10.84 | 5.66 | ||||||||||||||
Granted | — | — | — | ||||||||||||||
Exercised | (438,338 | ) | 7.89 | 3.45 | |||||||||||||
Forfeited or canceled | (37,607 | ) | 16.44 | 7.82 | |||||||||||||
Balance, December 31, 2017 | 687,963 | $ | 12.40 | $ | 6.85 | 6.60 | $ | 23,762,296 | |||||||||
Exercisable | 472,759 | $ | 10.96 | $ | 5.94 | 6.17 | $ | 17,014,104 | |||||||||
The aggregate intrinsic value in the table above represents the total pre-tax intrinsic value (the difference between the Company's closing stock price on the last day of the year and the exercise price, multiplied by the number of in-the-money options) that would have been received by the option holders had all option holders exercised their options on December 31, 2017. The amount of aggregate intrinsic value will change based on the fair market value of the Company's stock.
F - 31
As of December 31, 2017, the total vested portion of share-based compensation expense for time-based stock options was $7.5 million.
Time-Based Restricted Stock
The following table summarizes our time-based restricted stock activity:
Shares | Weighted Average Fair Value | |||||
Unvested balance, December 31, 2014 | 679,075 | $ | 11.65 | |||
Granted | 550,027 | 18.46 | ||||
Forfeited | (18,220 | ) | 10.96 | |||
Vested | (331,250 | ) | 19.20 | |||
Unvested balance, December 31, 2015 | 879,632 | 13.08 | ||||
Granted | 638,362 | 14.66 | ||||
Forfeited | (83,293 | ) | 16.85 | |||
Vested | (385,731 | ) | 18.93 | |||
Unvested balance, December 31, 2016 | 1,048,970 | 11.59 | ||||
Granted | 1,035,496 | 30.19 | ||||
Forfeited | (112,887 | ) | 22.27 | |||
Vested | (728,228 | ) | 31.61 | |||
Unvested balance, December 31, 2017 | 1,243,351 | $ | 14.39 | |||
The fair value of time-based restricted stock awarded totaled $31.3 million, $9.4 million and $10.9 million for the years ended December 31, 2017, 2016, and 2015, respectively.
Performance-Based Restricted Stock
The following table summarizes our performance-based restricted stock activity:
Shares | Weighted Average Fair Value | |||||
Unvested balance, December 31, 2014 | 766,500 | $ | 11.11 | |||
Granted | 935,000 | 19.18 | ||||
Forfeited | — | — | ||||
Vested | (303,373 | ) | 20.03 | |||
Unvested balance, December 31, 2015 | 1,398,127 | 14.57 | ||||
Granted | — | — | ||||
Forfeited | (19,687 | ) | 17.69 | |||
Vested | (450,004 | ) | 18.36 | |||
Unvested balance, December 31, 2016 | 928,436 | 12.66 | ||||
Granted | 930,000 | 35.15 | ||||
Forfeited | — | — | ||||
Vested | (48,436 | ) | 28.74 | |||
Unvested balance, December 31, 2017 | 1,810,000 | $ | 23.79 | |||
The Company granted $8.5 million of restricted stock during 2014 and early 2015 contingent upon the achievement of certain performance criteria (the "2014 Performance Awards"). The fair value of the 2014 Performance Awards was calculated using the value of GTT common stock on the grant date. The Company started recognizing share-based compensation expense for these grants when the achievement of the performance criteria became probable, which was in the third quarter of 2015. The 2014
F - 32
Performance Awards started vesting in the fourth quarter of 2015 when the performance criteria were met and they will continue to vest ratably through the third quarter of 2017. As of December 31, 2017, the 2014 Performance Awards were fully vested.
The Company granted $17.4 million of restricted stock during 2015 and 2017 contingent upon the achievement of certain performance criteria (the "2015 Performance Awards"). The fair value of the 2015 Performance Awards was calculated using the value of GTT common stock on the respective grant dates. Upon announcement of the Hibernia acquisition in November 2016, the achievement of two of the four performance criteria became probable and the Company started recognizing share-based compensation expense for these grants. Expense recognition will continue through the first quarter of 2019. Additionally, upon announcement of the Global Capacity acquisition in June 2017, the achievement of the final two performance criteria became probable and the Company started recognizing share-based compensation expense for these grants. Expense recognition will continue through the fourth quarter of 2019. The Company recognized share-based compensation expense related to the 2015 Performance Awards of $6.3 million and $1.1 million for the years ended December 31, 2017 and 2016, respectively. As of December 31, 2017, unamortized compensation cost related to the unvested 2015 Performance Awards was $9.3 million.
The Company granted $32.2 million of restricted stock during 2017 contingent upon the achievement of certain performance criteria (the "2017 Performance Awards"). The fair value of the 2017 Performance Awards was calculated using the value of GTT common stock on the grant date. As of December 31, 2017, achievement of the performance criteria was not probable. Accordingly, the Company recognized no share-based compensation expense related to the 2017 Performance Awards for the year ended December 31, 2017. As of December 31, 2017, unamortized compensation cost related to the unvested 2017 Performance Awards was $32.2 million.
Employee Stock Purchase Plan
The Company has an Employee Stock Purchase Plan ("ESPP") that permits eligible employees to purchase common stock through payroll deductions at the lesser of the opening stock price or 85% of the closing stock price of the Company's common stock during each of the three-month offering periods. The offering periods generally commence on the first day and the last day of each quarter. At December 31, 2017, 439,370 shares were available for issuance under the ESPP.
Shares Issued in Acquisition
In conjunction with the acquisition of One Source, the Company issued $3.6 million, or 289,055 unregistered shares, of common stock to the selling shareholders of One Source subject to a continuing employment period of 18 months. The fair value of this issuance was calculated using the value of GTT common stock on the acquisition date less a discount for lack of marketability. The $3.6 million was expensed ratably over the service period of 18 months. As of December 31, 2017, the related compensation expense was fully recognized.
NOTE 13 — DEFINED CONTRIBUTION PLAN
The Company has a defined contribution retirement plan under Section 401(k) of the Internal Revenue Code ("IRC") that covers substantially all U.S. based employees. The plan allows eligible employees to contribute from 1% to 100% of their pre-tax eligible earnings, subject to defined limits. The Company matches 50% of an employee's voluntary contributions per pay period up to the annual maximum as defined by the IRS. Employer's matching contributions under the Company's plan vest at a rate of 25% for each year of employment and are fully vested after four years of employment for all current and future contributions. During the years ended December 31, 2017, 2016, and 2015, the Company incurred 401(k) matching expense of $1.7 million, $0.9 million, and $0.6 million, respectively.
NOTE 14 — COMMITMENTS AND CONTINGENCIES
Estimated annual commitments under contractual obligations are as follows at December 31, 2017 (amounts in millions):
F - 33
Network Supply | Office Space | Capital Leases | Other(1) | ||||||||||||
2018 | $ | 144.1 | $ | 6.3 | $ | 1.5 | $ | 8.4 | |||||||
2019 | 81.0 | 6.5 | 0.3 | 2.8 | |||||||||||
2020 | 30.8 | 5.6 | — | 2.6 | |||||||||||
2021 | 8.0 | 5.1 | — | 1.3 | |||||||||||
2022 | 5.7 | 4.3 | — | — | |||||||||||
2023 and beyond | 39.0 | 14.2 | — | — | |||||||||||
$ | 308.6 | $ | 42.0 | $ | 1.8 | $ | 15.1 | ||||||||
(1) Primarily consists of vendor contracts associated with network monitoring and maintenance services.
Network Supply Agreements
As of December 31, 2017, the Company had purchase obligations of $308.6 million associated with the telecommunications services that the Company has contracted to purchase from its suppliers. The Company’s supplier agreements fall into two key categories, the Company's core IP backbone and customer specific locations (also referred to as 'last mile' locations). Supplier agreements associated with the Company's core IP backbone are typically contracted on a one-year term and do not relate to any specific underlying customer commitments. The short-term duration allows the Company to take advantage of favorable pricing trends.
Supplier agreements associated with the Company's customer specific locations, which represent the substantial majority of the Company's network spending, are typically contracted so the terms and conditions in both the vendor and customer contracts are substantially the same in terms of duration and capacity. The back-to-back nature of the Company’s contracts means that its network supplier obligations are generally mirrored by its customers' commitments to purchase the services associated with those obligations.
Office Space and Leases
The Company is currently headquartered in McLean, Virginia and has twenty other offices throughout North America, nine offices in Europe, two offices in Asia, one office in the Middle East, and one office in Brazil. The Company records rent expense using the straight-line method over the term of the lease agreement. Office facility rent expense was $7.2 million, $5.5 million and $4.5 million for the years ended December 31, 2017, 2016, and 2015, respectively.
Legal Proceedings
From time to time, the Company is a party to legal proceedings arising in the normal course of its business. The Company does not believe that it is a party to any current or pending legal action that could reasonably be expected to have a material adverse effect on its financial condition or results of operations and cash flow.
NOTE 15 — FOREIGN OPERATIONS
The Company’s operations are located primarily in the United States and Europe. The Company’s financial data recognized by legal entities as follows (amounts in millions):
F - 34
UK | IRELAND | CANADA | ITALY | OTHER | FOREIGN COUNTRY TOTAL | US | TOTAL | ||||||||||||||||||||||||
2017 | |||||||||||||||||||||||||||||||
Revenues by geographic area | $ | 83.7 | $ | 18.0 | $ | 12.8 | $ | 0.9 | $ | 6.4 | $ | 121.8 | $ | 706.1 | $ | 827.9 | |||||||||||||||
Long-lived assets at December 31 | 76.1 | 61.4 | 38.3 | 18.8 | 4.1 | 198.7 | 1,362.2 | 1,560.9 | |||||||||||||||||||||||
2016 | |||||||||||||||||||||||||||||||
Revenues by geographic area | $ | 31.0 | $ | — | $ | — | $ | 37.7 | $ | 1.6 | $ | 70.3 | $ | 457.0 | $ | 527.3 | |||||||||||||||
Long-lived assets at December 31 | 8.1 | — | — | 24.1 | 0.6 | 32.8 | 485.1 | 517.9 | |||||||||||||||||||||||
2015 | |||||||||||||||||||||||||||||||
Revenues by geographic area | $ | 25.6 | $ | — | $ | — | $ | 46.6 | $ | 3.5 | $ | 75.7 | $ | 296.8 | $ | 372.5 | |||||||||||||||
Long-lived assets at December 31 | 9.3 | — | — | 30.0 | 1.2 | 40.5 | 451.4 | 491.9 | |||||||||||||||||||||||
NOTE 16 — SUBSEQUENT EVENTS
On February 23, 2018, the Company entered into an Agreement for the Sale and Purchase of Interoute Communications Holdings S.A., a Luxembourg public limited liability company. The purchase price of approximately €1.9 billion will be paid in cash at closing. The Company received committed equity financing for the transaction of $250 million from two institutional investors and committed debt financing from a group of financial institutions for the remainder. The Company expects the transaction to close in three to six months, subject to customary regulatory approvals.
NOTE 17 — QUARTERLY RESULTS OF OPERATIONS (UNAUDITED)
The following tables are unaudited consolidated quarterly results of operations for the years ended December 31, 2017 and 2016. The financial information presented should be read in conjunction with other information included in the Company's consolidated financial statements.
Quarters Ended | |||||||||||||||
March 31, 2017 | June 30, 2017 | September 30, 2017 | December 31, 2017 | ||||||||||||
Revenue: | (In millions) | ||||||||||||||
Telecommunications services | $ | 186.0 | $ | 190.1 | $ | 202.6 | $ | 249.2 | |||||||
Operating expenses: | |||||||||||||||
Cost of telecommunications services | 95.0 | 97.3 | 103.8 | 136.0 | |||||||||||
Operating (loss) income | (3.0 | ) | 14.6 | 2.9 | 10.9 | ||||||||||
Net (loss) income | (13.1 | ) | 0.6 | (9.5 | ) | (49.5 | ) | ||||||||
(Loss) earnings per share: | |||||||||||||||
Basic | $ | (0.32 | ) | $ | 0.02 | $ | (0.23 | ) | $ | (1.12 | ) | ||||
Diluted | $ | (0.32 | ) | $ | 0.02 | $ | (0.23 | ) | $ | (1.12 | ) | ||||
Weighted average shares: | |||||||||||||||
Basic | 40,410,554 | 41,244,595 | 41,762,693 | 44,135,789 | |||||||||||
Diluted | 40,410,554 | 41,819,377 | 41,762,693 | 44,135,789 | |||||||||||
F - 35
Quarters Ended | |||||||||||||||
March 31, 2016 | June 30, 2016 | September 30, 2016 | December 31, 2016 | ||||||||||||
Revenue: | (In millions) | ||||||||||||||
Telecommunications services | $ | 125.8 | $ | 130.3 | $ | 133.3 | $ | 137.9 | |||||||
Operating expenses: | |||||||||||||||
Cost of telecommunications services | 67.5 | 69.7 | 69.7 | 72.7 | |||||||||||
Operating income | 9.0 | 9.0 | 12.2 | 10.6 | |||||||||||
Net income (loss) | 0.9 | 0.1 | 5.1 | (0.8 | ) | ||||||||||
Earnings (loss) per share: | |||||||||||||||
Basic | $ | 0.03 | $ | — | $ | 0.14 | $ | (0.02 | ) | ||||||
Diluted | $ | 0.03 | $ | — | $ | 0.14 | $ | (0.02 | ) | ||||||
Weighted average shares: | |||||||||||||||
Basic | 36,854,219 | 37,065,651 | 37,152,063 | 37,221,037 | |||||||||||
Diluted | 37,455,379 | 37,678,120 | 37,785,921 | 37,221,037 | |||||||||||
Reclassifications
As discussed in Note 2 - Significant Accounting Policies, in 2017 the Company changed its presentation of certain excise taxes and surcharges from the net method to the gross method. The previously reported telecommunications revenue and cost of telecommunications services included within the Consolidated Statements of Operations for the quarterly periods in the years ended December 31, 2017 and 2016 as presented in the Company's quarterly reports on Form 10-Q have been reclassified for consistency with current year presentation. See Note 2 - Significant Accounting Policies for further discussion of the nature of such reclassifications.
SCHEDULE II
GTT COMMUNICATIONS INC.
VALUATION AND QUALIFYING ACCOUNTS
(IN MILLIONS)
Allowance for Doubtful Accounts Receivable | ||||||||||||||||||||
Year | Balance at Beginning of Year | Charged to Cost and Expenses | Deductions | Other | Balance at End of Year | |||||||||||||||
2015 | $ | 0.9 | $ | 3.2 | $ | (3.2 | ) | $ | 0.1 | $ | 1.0 | |||||||||
2016 | $ | 1.0 | $ | 6.0 | $ | (4.3 | ) | $ | — | $ | 2.7 | |||||||||
2017 | $ | 2.7 | $ | 15.1 | $ | (12.8 | ) | $ | 0.1 | $ | 5.1 | |||||||||
F - 36
Deferred Tax Asset Valuation Allowance | ||||||||||||||||||||
Year | Balance at Beginning of Year | Charged to Cost and Expenses | Deductions | Other | Balance at End of Year | |||||||||||||||
2015 | $ | 23.8 | $ | — | $ | (23.5 | ) | $ | — | $ | 0.3 | |||||||||
2016 | $ | 0.3 | $ | — | $ | — | $ | — | $ | 0.3 | ||||||||||
2017 | $ | 0.3 | $ | 29.0 | $ | — | $ | 9.9 | $ | 39.2 | ||||||||||
F - 37